Exhibit 99.2

Management’s Discussion and Analysis (“MD&A”) Quarterly Report on the First Quarter of 2023
This portion of the Quarterly Report provides management’s discussion and analysis (“MD&A”) of the financial condition and results of operations, to enable a reader to assess material changes in financial condition and results of operations as at, and for the three month period ended March 31, 2023, in comparison to the corresponding prior-year periods. The MD&A is intended to help the reader understand Barrick Gold Corporation (“Barrick”, “we”, “our”, the “Company” or the “Group”), our operations, financial performance as well as our present and future business environment. This MD&A, which has been prepared as of May 2, 2023, is intended to supplement and complement the condensed unaudited interim consolidated financial statements and notes thereto, prepared in accordance with International Financial Reporting Standards (“IFRS”) as issued by the International Accounting Standards Board (“IASB”), including International Accounting Standard 34 Interim Financial Reporting (“IAS 34”), for the three month period ended March 31, 2023 (collectively, the “Financial Statements”), which are included in this Quarterly Report on pages 74 to 87. You are encouraged to review the Financial Statements in conjunction with your review of this MD&A. This MD&A should be read in conjunction with both the annual audited consolidated financial statements for the two
years ended December 31, 2022, the related annual MD&A included in the 2022 Annual Report, and the most recent Form 40–F/Annual Information Form on file with the U.S. Securities and Exchange Commission (“SEC”) and Canadian provincial securities regulatory authorities. These documents and additional information relating to the Company are available on SEDAR at www.sedar.com and EDGAR at www.sec.gov. Certain notes to the Financial Statements are specifically referred to in this MD&A and such notes are incorporated by reference herein. All dollar amounts in this MD&A are in millions of United States dollars (“$” or “US$”), unless otherwise specified.
For the purposes of preparing our MD&A, we consider the materiality of information. Information is considered material if: (i) such information results in, or would reasonably be expected to result in, a significant change in the market price or value of our shares; (ii) there is a substantial likelihood that a reasonable investor would consider it important in making an investment decision; or (iii) it would significantly alter the total mix of information available to investors. We evaluate materiality with reference to all relevant circumstances, including potential market sensitivity.
Abbreviations
| BAP | Biodiversity Action Plans | |
| BLM | Bureau of Land Management | |
| BMSZ | Bambadji Main Shear Zone | |
| BNL | Barrick Niugini Limited | |
| CDCs | Community Development Committees | |
| CHUG | Cortez Hills Underground | |
| CIL | Carbon-in-leach | |
| Commencement Agreement | Detailed Porgera Project Commencement Agreement between PNG and BNL | |
| DRC | Democratic Republic of Congo | |
| DOI | Department of the Interior | |
| E&S Committee | Environmental and Social Oversight Committee | |
| ESG | Environmental, Social and Governance | |
| ESG & Nominating Committee | Environmental, Social, Governance & Nominating Committee | |
| ESIA | Environmental and Social Impact Assessment | |
| FEIS | Final Environmental Impact Statement | |
| GHG | Greenhouse Gas | |
| GISTM | Global Industry Standard for Tailings Management | |
| GoT | Government of Tanzania | |
| IASB | International Accounting Standards Board | |
| ICMM | International Council on Mining and Metals | |
| IFRS | International Financial Reporting Standards | |
| KCD | Karagba, Chauffeur and Durba | |
| Kumul Minerals | Kumul Minerals Holdings Limited | |
| LTI | Lost Time Injury | |
| LTIFR | Lost Time Injury Frequency Rate | |
| MRE | Mineral Resources Enga Limited | |
| MVA | Megavolt-amperes | |
| MW | Megawatt | |
| NOA | Notice of Availability | |
| NGM | Nevada Gold Mines | |
| NSR | Net Smelter Return | |
| OECD | Organisation for Economic Co-operation and Development | |
| PNG | Papua New Guinea | |
| Randgold | Randgold Resources Limited | |
| RC | Reverse Circulation | |
| RIL | Resin-in-leach | |
| ROD | Record of Decision | |
| Roundtable | Environmental, Social and Governance Raters Roundtable | |
| SDG | Sustainable Development Goals | |
| SML | Special Mining Lease | |
| TCFD | Task Force for Climate-related Financial Disclosures | |
| TRIFR | Total Recordable Injury Frequency Rate | |
| TSF | Tailings Storage Facilities | |
| TW | True Width | |
| WGC | World Gold Council | |
| WTI | West Texas Intermediate | |
| BARRICK FIRST QUARTER 2023 | 1 | MANAGEMENT’S DISCUSSION AND ANALYSIS |
Cautionary Statement on Forward-Looking Information
Certain information contained or incorporated by reference in this MD&A, including any information as to our strategy, projects, plans or future financial or operating performance, constitutes “forward-looking statements”. All statements, other than statements of historical fact, are forward-looking statements. The words “believe”, “expect”, “anticipated”, “vision”, “aim”, “strategy”, “target”, “plan”, “opportunities”, “guidance”, “forecast”, “outlook”, “objective”, “intend”, “project”, “pursue”, “continue”, “committed”, “budget”, “estimate”, “potential”, “prospective”, “future”, “focus”, “during”, “ongoing”, “following”, “subject to”, “scheduled”, “may”, “will”, “can”, “could”, “would”, “should” and similar expressions identify forward-looking statements. In particular, this MD&A contains forward-looking statements including, without limitation, with respect to: Barrick’s forward-looking production guidance; estimates of future cost of sales per ounce for gold and per pound for copper, total cash costs per ounce and C1 cash costs per pound, and all-in-sustaining costs per ounce/pound; cash flow forecasts; projected capital, operating and exploration expenditures; the share buyback program and performance dividend policy, including the criteria for dividend payments; mine life and production rates; projected capital estimates and anticipated permitting timelines related to the Goldrush Project; our plans and expected completion and benefits of our growth and capital projects, including the Goldrush Project, Pueblo Viejo plant expansion and mine life extension project, including approval of the final location of the additional tailings storage facility for Pueblo Viejo following submission of the ESIA in the Dominican Republic and changes to the estimated capital cost of that facility following the completion of pre-feasibility engineering, Veladero Phase 7 leach pad project, the Reko Diq project, solar power projects at NGM and Loulo-Gounkoto, the Jabal Sayid Lode 1 project and new mobile equipment fleet at Lumwana; the planned updating of the historical Reko Diq feasibility study and targeted first production; the potential for Lumwana to reach Tier One status through the development of a potential Super Pit; capital expenditures related to upgrades and ongoing management initiatives; Barrick’s global exploration strategy and planned exploration activities; the timeline for execution and effectiveness of definitive agreements to implement the Commencement Agreement between PNG and BNL; the duration of the temporary suspension of operations at Porgera, the conditions for the reopening of the mine and the timeline to recommence operations; our pipeline of high confidence projects at or near existing operations; potential mineralization and metal or mineral recoveries; our ability to convert resources into reserves; asset sales, joint ventures and partnerships; Barrick’s strategy, plans and targets in respect of environmental and social governance issues, including climate change, GHG emissions reduction targets (including with respect to our Scope 3 emissions), safety performance, responsible water use, TSF management, biodiversity and human rights initiatives; and expectations regarding future price assumptions, financial performance and other outlook or guidance.
Forward-looking statements are necessarily based upon a number of estimates and assumptions including material estimates and assumptions related to the factors set forth below that, while considered reasonable by the Company as at the date of this MD&A in light of management’s experience and perception of current conditions and expected developments, are inherently subject to significant business, economic and competitive uncertainties and contingencies. Known and unknown factors could cause actual results to differ materially from
those projected in the forward-looking statements and undue reliance should not be placed on such statements and information. Such factors include, but are not limited to: fluctuations in the spot and forward price of gold, copper or certain other commodities (such as silver, diesel fuel, natural gas and electricity); risks associated with projects in the early stages of evaluation and for which additional engineering and other analysis is required; risks related to the possibility that future exploration results will not be consistent with the Company’s expectations, that quantities or grades of reserves will be diminished, and that resources may not be converted to reserves; risks associated with the fact that certain of the initiatives described in this MD&A are still in the early stages and may not materialize; changes in mineral production performance, exploitation and exploration successes; risks that exploration data may be incomplete and considerable additional work may be required to complete further evaluation, including but not limited to drilling, engineering and socioeconomic studies and investment; the speculative nature of mineral exploration and development; lack of certainty with respect to foreign legal systems, corruption and other factors that are inconsistent with the rule of law; changes in national and local government legislation, taxation, controls or regulations and/or changes in the administration of laws, policies and practices; the potential impact of proposed changes to Chilean law on the status of value added tax refunds received in Chile in connection with the development of the Pascua-Lama project; expropriation or nationalization of property and political or economic developments in Canada, the United States or other countries in which Barrick does or may carry on business in the future; risks relating to political instability in certain of the jurisdictions in which Barrick operates; timing of receipt of, or failure to comply with, necessary permits and approvals, including the issuance of a ROD for the Goldrush Project and/or whether the Goldrush Project will be permitted to advance as currently designed under its Feasibility Study, approval of the final location of the additional tailings storage facility for Pueblo Viejo following submission of the ESIA in the Dominican Republic, and permitting activities required to optimize Long Canyon’s life of mine; non-renewal of key licenses by governmental authorities, including the new SML for Porgera; failure to comply with environmental and health and safety laws and regulations; increased costs and physical and transition risks related to climate change, including extreme weather events, resource shortages, emerging policies and increased regulations relating to related to greenhouse gas emission levels, energy efficiency and reporting of risks; contests over title to properties, particularly title to undeveloped properties, or over access to water, power and other required infrastructure; the liability associated with risks and hazards in the mining industry, and the ability to maintain insurance to cover such losses; damage to the Company’s reputation due to the actual or perceived occurrence of any number of events, including negative publicity with respect to the Company’s handling of environmental matters or dealings with community groups, whether true or not; risks related to operations near communities that may regard Barrick’s operations as being detrimental to them; litigation and legal and administrative proceedings; operating or technical difficulties in connection with mining or development activities, including geotechnical challenges, tailings dam and storage facilities failures, and disruptions in the maintenance or provision of required infrastructure and information technology systems; increased costs, delays, suspensions and technical
| BARRICK FIRST QUARTER 2023 | 2 | MANAGEMENT’S DISCUSSION AND ANALYSIS |
challenges associated with the construction of capital projects; risks associated with working with partners in jointly controlled assets; risks related to disruption of supply routes which may cause delays in construction and mining activities, including disruptions in the supply of key mining inputs due to the invasion of Ukraine by Russia; risk of loss due to acts of war, terrorism, sabotage and civil disturbances; risks associated with artisanal and illegal mining; risks associated with Barrick’s infrastructure, information technology systems and the implementation of Barrick’s technological initiatives; the impact of global liquidity and credit availability on the timing of cash flows and the values of assets and liabilities based on projected future cash flows; the impact of inflation, including global inflationary pressures driven by supply chain disruptions caused by the ongoing Covid-19 pandemic, global energy cost increases following the invasion of Ukraine by Russia and country-specific political and economic factors in Argentina; adverse changes in our credit ratings; fluctuations in the currency markets; changes in U.S. dollar interest rates; risks arising from holding derivative instruments (such as credit risk, market liquidity risk and mark-to-market risk); risks related to the demands placed on the Company’s management, the ability of management to implement its business strategy and enhanced political risk in certain jurisdictions; uncertainty whether some or all of Barrick’s targeted investments and projects will meet the Company’s capital allocation objectives and internal hurdle rate; whether benefits expected from recent transactions are realized; business opportunities that may be presented to, or pursued by, the Company; our ability to successfully integrate acquisitions or complete divestitures; risks related to competition in the mining industry; employee relations including loss of key employees; availability and increased costs associated with mining inputs and labor; risks
associated with diseases, epidemics and pandemics, including the effects and potential effects of the global Covid-19 pandemic; risks related to the failure of internal controls; and risks related to the impairment of the Company’s goodwill and assets. Barrick also cautions that its 2023 guidance may be impacted by the ongoing business and social disruption caused by the spread of Covid-19.
In addition, there are risks and hazards associated with the business of mineral exploration, development and mining, including environmental hazards, industrial accidents, unusual or unexpected formations, pressures, cave-ins, flooding and gold bullion, copper cathode or gold or copper concentrate losses (and the risk of inadequate insurance, or inability to obtain insurance, to cover these risks).
Many of these uncertainties and contingencies can affect our actual results and could cause actual results to differ materially from those expressed or implied in any forward-looking statements made by, or on behalf of, us. Readers are cautioned that forward-looking statements are not guarantees of future performance. All of the forward-looking statements made in this MD&A are qualified by these cautionary statements. Specific reference is made to the most recent Form 40-F/Annual Information Form on file with the SEC and Canadian provincial securities regulatory authorities for a more detailed discussion of some of the factors underlying forward-looking statements and the risks that may affect Barrick’s ability to achieve the expectations set forth in the forward-looking statements contained in this MD&A. We disclaim any intention or obligation to update or revise any forward-looking statements whether as a result of new information, future events or otherwise, except as required by applicable law.
| BARRICK FIRST QUARTER 2023 | 3 | MANAGEMENT’S DISCUSSION AND ANALYSIS |
Use of Non-GAAP Financial Measures
We use the following non-GAAP financial measures in our MD&A:
| ∎ | “adjusted net earnings” |
| ∎ | “free cash flow” |
| ∎ | “EBITDA” |
| ∎ | “adjusted EBITDA” |
| ∎ | “minesite sustaining capital expenditures” |
| ∎ | “project capital expenditures” |
| ∎ | “total cash costs per ounce” |
| ∎ | “C1 cash costs per pound” |
| ∎ | “all-in sustaining costs per ounce/pound” |
| ∎ | “all-in costs per ounce” and |
| ∎ | “realized price” |
For a detailed description of each of the non-GAAP financial measures used in this MD&A and a detailed reconciliation to the most directly comparable measure under IFRS, please refer to the Non-GAAP Financial Measures section of this MD&A on pages 54 to 67. Each non-GAAP financial measure has been annotated with a reference to an endnote on page 68. The non-GAAP financial measures set out in this MD&A are intended to provide additional information to investors and do not have any standardized meaning under IFRS, and therefore may not be comparable to other issuers, and should not be considered in isolation or as a substitute for measures of performance prepared in accordance with IFRS.
Index
| 5 | Overview | |||
| 5 | Financial and Operating Highlights | |||
| 8 | Key Business Developments | |||
| 9 | Environmental, Social and Governance | |||
| 12 | Outlook | |||
| 14 | Production and Cost Summary | |||
| 16 | Operating Performance | |||
| 17 | Nevada Gold Mines | |||
| 18 | Carlin | |||
| 20 | Cortez | |||
| 22 | Turquoise Ridge | |||
| 24 | Other Mines - Nevada Gold Mines | |||
| 25 | Pueblo Viejo | |||
| 27 | Loulo-Gounkoto | |||
| 29 | Kibali | |||
| 31 | North Mara | |||
| 33 | Bulyanhulu | |||
| 35 | Other Mines - Gold | |||
| 37 | Lumwana | |||
| 38 | Other Mines - Copper | |||
| 39 | Growth Projects | |||
| 41 | Exploration and Mineral Resource Management | |||
| 45 | Review of Financial Results | |||
| 45 | Revenue | |||
| 46 | Production Costs | |||
| 47 | Capital Expenditures | |||
| 48 | General and Administrative Expenses | |||
| 48 | Exploration, Evaluation and Project Expenses | |||
| 48 | Finance Costs, Net | |||
| 48 | Additional Significant Statement of Income Items | |||
| 49 | Income Tax Expense | |||
| 50 | Financial Condition Review | |||
| 50 | Balance Sheet Review | |||
| 50 | Shareholders’ Equity | |||
| 50 | Financial Position and Liquidity | |||
| 51 | Summary of Cash Inflow (Outflow) | |||
| 52 | Commitments and Contingencies | |||
| 53 | Review of Quarterly Results | |||
| 53 | Internal Control over Financial Reporting and Disclosure Controls and Procedures | |||
| 54 | IFRS Critical Accounting Policies and Accounting Estimates | |||
| 54 | Non-GAAP Financial Measures | |||
| 68 | Technical Information | |||
| 68 | Endnotes | |||
| 74 | Financial Statements | |||
| 79 | Notes to Consolidated Financial Statements | |||
| BARRICK FIRST QUARTER 2023 | 4 | MANAGEMENT’S DISCUSSION AND ANALYSIS |
| OVERVIEW | OPERATING PERFORMANCE | GROWTH PROJECTS & EXPLORATION | REVIEW OF FINANCIAL RESULTS |
OTHER INFORMATION & NON-GAAP RECONCILIATIONS
| FINANCIAL STATEMENTS |
Overview
Financial and Operating Highlights
| For the three months ended | ||||||||||||||||||||
| 3/31/23 | 12/31/22 | % Change | 3/31/22 | % Change | ||||||||||||||||
Financial Results ($ millions) | ||||||||||||||||||||
Revenues | 2,643 | 2,774 | (5)% | 2,853 | (7)% | |||||||||||||||
Cost of sales | 1,941 | 2,093 | (7)% | 1,739 | 12 % | |||||||||||||||
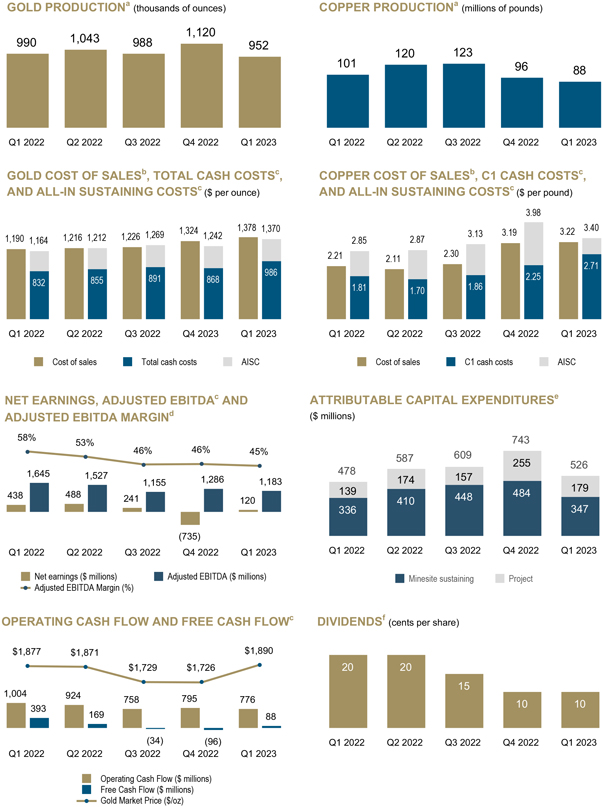
Net earningsa | 120 | (735) | 116 % | 438 | (73)% | |||||||||||||||
Adjusted net earningsb | 247 | 220 | 12 % | 463 | (47)% | |||||||||||||||
Adjusted EBITDAb | 1,183 | 1,286 | (8)% | 1,645 | (28)% | |||||||||||||||
Adjusted EBITDA marginc | 45 % | 46 % | (2)% | 58 % | (22)% | |||||||||||||||
Minesite sustaining capital expendituresb,d | 454 | 557 | (18)% | 420 | 8 % | |||||||||||||||
Project capital expendituresb,d | 226 | 324 | (30)% | 186 | 22 % | |||||||||||||||
Total consolidated capital expendituresd,e | 688 | 891 | (23)% | 611 | 13 % | |||||||||||||||
Net cash provided by operating activities | 776 | 795 | (2)% | 1,004 | (23)% | |||||||||||||||
Net cash provided by operating activities marginf | 29 % | 29 % | 0 % | 35 % | (17)% | |||||||||||||||
Free cash flowb | 88 | (96) | 192 % | 393 | (78)% | |||||||||||||||
Net earnings per share (basic and diluted) | 0.07 | (0.42) | 117 % | 0.25 | (72)% | |||||||||||||||
Adjusted net earnings (basic)b per share | 0.14 | 0.13 | 8 % | 0.26 | (46)% | |||||||||||||||
Weighted average diluted common shares (millions of shares) | 1,755 | 1,759 | 0 % | 1,779 | (1)% | |||||||||||||||
Operating Results | ||||||||||||||||||||
Gold production (thousands of ounces)g | 952 | 1,120 | (15)% | 990 | (4)% | |||||||||||||||
Gold sold (thousands of ounces)g | 954 | 1,111 | (14)% | 993 | (4)% | |||||||||||||||
Market gold price ($/oz) | 1,890 | 1,726 | 10 % | 1,877 | 1 % | |||||||||||||||
Realized gold priceb,g ($/oz) | 1,902 | 1,728 | 10 % | 1,876 | 1 % | |||||||||||||||
Gold cost of sales (Barrick’s share)g,h ($/oz) | 1,378 | 1,324 | 4 % | 1,190 | 16 % | |||||||||||||||
Gold total cash costsb,g ($/oz) | 986 | 868 | 14 % | 832 | 19 % | |||||||||||||||
Gold all-in sustaining costsb,g ($/oz) | 1,370 | 1,242 | 10 % | 1,164 | 18 % | |||||||||||||||
Copper production (millions of pounds)g | 88 | 96 | (8)% | 101 | (13)% | |||||||||||||||
Copper sold (millions of pounds)g | 89 | 99 | (10)% | 113 | (21)% | |||||||||||||||
Market copper price ($/lb) | 4.05 | 3.63 | 12 % | 4.53 | (11)% | |||||||||||||||
Realized copper priceb,g ($/lb) | 4.20 | 3.81 | 10 % | 4.68 | (10)% | |||||||||||||||
Copper cost of sales (Barrick’s share)g,i ($/lb) | 3.22 | 3.19 | 1 % | 2.21 | 46 % | |||||||||||||||
Copper C1 cash costsb,g ($/lb) | 2.71 | 2.25 | 20 % | 1.81 | 50 % | |||||||||||||||
Copper all-in sustaining costsb,g ($/lb) | 3.40 | 3.98 | (15)% | 2.85 | 19 % | |||||||||||||||
As at 3/31/23 | As at 12/31/22 | % Change | As at 3/31/22 | % Change | ||||||||||||||||
Financial Position ($ millions) | ||||||||||||||||||||
Debt (current and long-term) | 4,777 | 4,782 | 0 % | 5,144 | (7)% | |||||||||||||||
Cash and equivalents | 4,377 | 4,440 | (1)% | 5,887 | (26)% | |||||||||||||||
Debt, net of cash | 400 | 342 | 17 % | (743) | 154 % | |||||||||||||||
| a. | Net earnings represents net earnings attributable to the equity holders of the Company. |
| b. | Further information on these non-GAAP financial measures, including detailed reconciliations, is included on pages 54 to 67 of this MD&A. |
| c. | Represents adjusted EBITDA divided by revenue. |
| d. | Amounts presented on a consolidated cash basis. Project capital expenditures are included in our calculation of all-in costs, but not included in our calculation of all-in sustaining costs. |
| e. | Total consolidated capital expenditures also includes capitalized interest of $8 million for the three month period ended March 31, 2023 (December 31, 2022: $10 million and March 31, 2022: $5 million). |
| f. | Represents net cash provided by operating activities divided by revenue. |
| g. | On an attributable basis. |
| h. | Gold cost of sales per ounce is calculated as cost of sales across our gold operations (excluding sites in closure or care and maintenance) divided by ounces sold (both on an attributable basis using Barrick’s ownership share). |
| i. | Copper cost of sales per pound is calculated as cost of sales across our copper operations divided by pounds sold (both on an attributable basis using Barrick’s ownership share). |
| BARRICK FIRST QUARTER 2023 | 5 | MANAGEMENT’S DISCUSSION AND ANALYSIS |
| OVERVIEW | OPERATING PERFORMANCE | GROWTH PROJECTS & EXPLORATION | REVIEW OF FINANCIAL RESULTS |
OTHER INFORMATION & NON-GAAP RECONCILIATIONS
| FINANCIAL STATEMENTS |
| a. | On an attributable basis. |
| b. | Gold cost of sales per ounce is calculated as cost of sales across our gold operations (excluding sites in closure or care and maintenance) divided by ounces sold (both on an attributable basis using Barrick’s ownership share). Copper cost of sales per pound is calculated as cost of sales across our copper operations divided by pounds sold (both on an attributable basis using Barrick’s ownership share). |
| c. | Further information on these non-GAAP financial measures, including detailed reconciliations, is included on pages 54 to 67 of this MD&A. |
| d. | Represents adjusted EBITDA divided by revenue. |
| e. | Total attributable capital expenditures also includes capitalized interest. Minesite sustaining and project capital expenditures are non-GAAP financial measures. Further information on non-GAAP financial measures, including detailed reconciliations, is included on pages 54 to 67 of this MD&A. |
| f. | Dividend per share declared in respect of the stated period, inclusive of the performance dividend. |
| BARRICK FIRST QUARTER 2023 | 6 | MANAGEMENT’S DISCUSSION AND ANALYSIS |
| OVERVIEW | OPERATING PERFORMANCE | GROWTH PROJECTS & EXPLORATION | REVIEW OF FINANCIAL RESULTS |
OTHER INFORMATION & NON-GAAP RECONCILIATIONS
| FINANCIAL STATEMENTS |
Factors affecting net earnings and adjusted net earnings1 - three months ended March 31, 2023 versus December 31, 2022
Net earnings attributable to equity holders of Barrick (“net earnings”) for the three months ended March 31, 2023 were $120 million compared to a loss of $735 million in the prior quarter. The increase was primarily due to following items:
| ∎ | a goodwill impairment of $950 million (net of non-controlling interests) related to Loulo-Gounkoto, a non-current asset impairment of $318 million (net of tax) and a net realizable value impairment of leach pad inventory of $27 million (net of tax) at Veladero, and a non-current asset impairment of $42 million (net of tax and non-controlling interests) at Long Canyon occurring in the prior quarter; partially offset by |
| ∎ | an impairment reversal of $120 million and a gain of $300 million following the completion of the transaction allowing for the reconstitution of the Reko Diq project occurring in the prior quarter. |
After adjusting for items that are not indicative of future operating earnings, adjusted net earnings1 of $247 million for the three months ended March 31, 2023 was $27 million higher than the prior quarter. The increase was primarily due to higher realized gold and copper prices1. The realized gold and copper prices1 were $1,902 per ounce and $4.20 per pound, respectively, in the three months ended March 31, 2023, compared to $1,728 per ounce and $3.81 per pound, respectively, in the prior quarter. This was partially offset by lower gold sales volumes, primarily at Carlin due to annual roaster maintenance resulting in lower throughput at Goldstrike, the conversion of the Goldstrike autoclave to a conventional carbon-in-leach process and a harsh winter in northern Nevada impacting operations. This was combined with lower grades at Kibali due to mine sequencing. Adjusted net earnings1 was further impacted by higher gold cost of sales per ounce2, mainly due to the impact of lower sales volumes.
Factors affecting net earnings and adjusted net earnings1 - three months ended March 31, 2023 versus March 31, 2022
Net earnings for the first quarter of 2023 were $120 million compared to $438 million in the same prior year period. The decrease was primarily due to higher gold and copper cost of sales per ounce2, a lower realized copper price1, lower gold and copper sales volumes, partially offset by a higher realized gold price1, as further discussed below.
After adjusting for items that are not indicative of future operating earnings, adjusted net earnings1 of $247 million in the first quarter of 2023 were $216 million lower than the same prior year period. The decrease was primarily due to lower gold and copper sales volumes. The decrease in gold sales volume was primarily at Carlin, mainly due to the annual roaster maintenance resulting in lower throughput at Goldstrike, the conversion of the Goldstrike autoclave to a conventional CIL process and a harsh winter in northern Nevada impacting operations. This was partially offset by higher production at Cortez, driven by higher oxide mill and heap leach production from the Crossroads open pit and higher underground production. The lower copper sales volumes was primarily at Lumwana due to lower grades processed, in line with the mine plan.
These impacts were combined with higher gold cost of sales per ounce2, mainly due to lower sales volumes, combined with higher input costs driven by energy and consumables prices; and higher copper cost of sales per ounce2, primarily due to lower grades processed and lower capitalized stripping at Lumwana. Adjusted net earnings1 were further impacted by a higher realized gold price1, partially offset by a lower realized copper price1. The realized gold and copper prices1 were $1,902 per ounce and $4.20 per pound, respectively, in the three months ended March 31, 2023 compared to $1,876 per ounce and $4.68 per pound, respectively, in the same prior year period.
The significant adjusting items in the three months ended March 31, 2023 were:
| ∎ | $57 million ($63 million before tax and non-controlling interests) in other expense adjustments primarily related to the $30 million commitment made towards the expansion of education infrastructure in Tanzania per our community investment obligations under the Twiga partnership, changes in our closed mine rehabilitation as a result of lower discount rate assumptions, and care and maintenance expenses at Porgera; |
| ∎ | $48 million in significant tax adjustments, mainly related to foreign currency translation gains and losses on tax balances, changes in the discount rate assumptions on our closed mine rehabilitation provision, foreign exchange losses and the remeasurement of deferred tax balances; and |
| ∎ | $29 million ($38 million before tax and non-controlling interests) in a loss on currency translation, primarily due to the devaluation of the Zambian kwacha. |
Refer to page 54 for a full list of reconciling items between net earnings and adjusted net earnings1 for the current and previous periods.
Factors affecting Operating Cash Flow and Free Cash Flow1 - three months ended March 31, 2023 versus December 31, 2022
In the three months ended March 31, 2023, we generated $776 million in operating cash flow, compared to $795 million in the prior quarter. The decrease of $19 million was primarily due to an unfavorable movement in working capital, mainly in accounts payable, partially offset by a favorable movement in accounts receivable. This was partially offset by a decrease in interest paid as a result of the timing of semi-annual interest payments on our bonds, which primarily occur in Q2 and Q4. Operating cash flow was further impacted by an increase in realized gold and copper prices1, partially offset by lower gold and copper sales volumes and higher total cash costs/C1 cash costs per ounce/pound1.
For the three months ended March 31, 2023, we recorded positive free cash flow1 of $88 million, compared to negative free cash flow1 of $96 million in the prior quarter, mainly reflecting lower capital expenditures. In the first quarter of 2023, capital expenditures on a cash basis were $688 million compared to $891 million in the prior quarter, due to a decrease in both minesite sustaining capital expenditures1 and project capital expenditures1. Minesite sustaining capital expenditures1 decreased mainly at Lumwana due to lower capitalized stripping in the current
Numerical annotations throughout the text of this document refer to the endnotes found starting on page 68.
| BARRICK FIRST QUARTER 2023 | 7 | MANAGEMENT’S DISCUSSION AND ANALYSIS |
| OVERVIEW | OPERATING PERFORMANCE | GROWTH PROJECTS & EXPLORATION | REVIEW OF FINANCIAL RESULTS |
OTHER INFORMATION & NON-GAAP RECONCILIATIONS
| FINANCIAL STATEMENTS |
quarter and as down payments for replacement mobile equipment occurred in the prior quarter, combined with the timing of mobile equipment deliveries at the end of 2022 at Carlin. The decrease in project capital expenditures1 was primarily driven by lower expenditures from the plant expansion and mine life extension project at Pueblo Viejo, and following advanced payments made on the new owner mining fleet in the prior quarter at Lumwana.
Factors affecting Operating Cash Flow and Free Cash Flow1 - three months ended March 31, 2023 versus March 31, 2022
In the first quarter of 2023, we generated $776 million in operating cash flow, compared to $1,004 million in the same prior year period. The decrease of $228 million was primarily due to higher gold and copper total cash costs/C1 cash costs per ounce/pound1, a lower realized copper price1, lower gold and copper sales volumes, partially offset by a higher realized gold price1 and lower cash taxes paid.
In the first quarter of 2023, we generated free cash flow1 of $88 million compared to $393 million in the same prior year period. The decrease primarily reflects lower operating cash flows and higher capital expenditures. In the first quarter of 2023, capital expenditures on a cash basis were $688 million compared to $611 million in the first quarter of 2022. The increase in capital expenditures of $77 million was due to an increase in both project capital expenditures1 and minesite sustaining capital expenditures1. The increase in project capital expenditures1 is primarily due to investment in the new owner mining fleet at Lumwana, combined with higher expenditures from the solar plant expansion at Loulo-Gounkoto. Minesite sustaining capital expenditures1 increased compared to the same prior year period, mainly due to increased capitalized stripping at both North Mara and Loulo-Gounkoto.
Key Business Developments
Share Buyback Program
At the February 14, 2023 meeting, the Board of Directors authorized a new share buyback program for the purchase of up to $1 billion of Barrick’s outstanding shares over the next 12 months. As at March 31, 2023, we had not purchased any shares under this program in 2023.
The actual number of common shares that may be purchased, and the timing of any such purchases, will be determined by Barrick based on a number of factors, including the Company’s financial performance, the availability of cash flows, and the consideration of other uses of cash, including capital investment opportunities, returns to shareholders, and debt reduction.
The repurchase program does not obligate the Company to acquire any particular number of common shares, and the repurchase program may be suspended or discontinued at any time at the Company’s discretion.
Porgera Special Mining Lease
On April 9, 2021, BNL signed a binding Framework Agreement with the Independent State of PNG and Kumul Minerals, a state-owned mining company, setting out the terms and conditions for the reopening of the Porgera mine. On February 3, 2022, the Framework Agreement was replaced by the Commencement Agreement. The Commencement Agreement was signed by PNG, Kumul Minerals, BNL and its affiliate Porgera (Jersey) Limited on
October 15, 2021, and it became effective on February 3, 2022, following signature by MRE, the holder of the remaining 5% of the original Porgera joint venture. The Commencement Agreement reflects the commercial terms previously agreed to under the Framework Agreement, namely that PNG stakeholders will receive a 51% equity stake in the Porgera mine, with the remaining 49% to be held by BNL or an affiliate. BNL is jointly owned on a 50/50 basis by Barrick and Zijin Mining Group. Accordingly, following the implementation of the Commencement Agreement, Barrick’s current 47.5% interest in the Porgera mine is expected to be reduced to a 24.5% interest as reflected in Barrick’s reserve and resource estimates for Porgera. BNL will retain operatorship of the mine. The Commencement Agreement also provides that PNG stakeholders and BNL and its affiliates will share the economic benefits derived from the reopened Porgera mine on a 53% and 47% basis over the remaining life of mine, respectively, and that the Government of PNG will retain the option to acquire BNL’s or its affiliate’s 49% equity participation at fair market value after 10 years.
On April 21, 2022, the PNG National Parliament passed legislation to provide, among other things, certain agreed tax exemptions and tax stability for the new Porgera joint venture. This legislation was certified on May 30, 2022. Six out of the seven pieces of legislation took effect as of April 11 and 14, 2023, respectively, when they were published in the National Gazette, as required under PNG Law. One individual act awaits publication to take effect.
On September 13, 2022, the Shareholders’ Agreement for the new Porgera joint venture company was executed by Porgera (Jersey) Limited, which is an affiliate of BNL, the state-owned Kumul Minerals (Porgera) Limited and MRE (a previous version of the Shareholders’ Agreement had been signed by the BNL and Kumul parties in April 2022 but was not signed by MRE and therefore did not take effect). New Porgera Limited, the new Porgera joint venture company, was incorporated on September 22, 2022, and this entity will next apply for a new SML, the receipt of which is a condition of the reopening of the Porgera mine under the Commencement Agreement.
On March 31, 2023, BNL, the Independent State of PNG and New Porgera Limited signed the New Porgera Progress Agreement whereby the parties reiterated their commitment to reopening the Porgera mine in line with the terms of the Commencement Agreement and the Shareholders’ Agreement. The provisions of the Commencement Agreement will be fully implemented, and work to recommence full mine operations at Porgera will begin, following the execution of the remaining definitive agreements and satisfaction of a number of conditions. These include an Operatorship Agreement pursuant to which BNL will operate the Porgera mine, as well as a Mine Development Contract to accompany the new SML that the new Porgera joint venture company will apply for. Under the terms of the Commencement Agreement, BNL will remain in possession of the site and maintain the mine on care and maintenance.
Porgera was excluded from our 2023 guidance. We expect to update our guidance following both the execution of all of the definitive agreements to implement the binding Commencement Agreement and the finalization of a timeline for the resumption of full mine operations. Refer to notes 12 and 16 to the Financial Statements for more information.
| BARRICK FIRST QUARTER 2023 | 8 | MANAGEMENT’S DISCUSSION AND ANALYSIS |
| OVERVIEW | OPERATING PERFORMANCE | GROWTH PROJECTS & EXPLORATION | REVIEW OF FINANCIAL RESULTS |
OTHER INFORMATION & NON-GAAP RECONCILIATIONS
| FINANCIAL STATEMENTS |
Environmental, Social and Governance (“ESG”)
Sustainability is entrenched in our DNA: our sustainability strategy is our business plan.
Barrick’s approach to sustainability is integrated and holistic; sustainability aspects and impacts do not occur in silos, but rather overlap and interlink, and must be tackled in conjunction with, and reference to, each other. We call this approach Holistic and Integrated Sustainability Management. Although we integrate our sustainability management, we discuss our sustainability strategy within four overarching pillars: (1) respecting human rights; (2) protecting the health and safety of our people and local communities; (3) sharing the benefits of our operations; and (4) managing our impacts on the environment.
We implement this strategy by blending top-down accountability with bottom-up responsibility. This means we place the day-to-day ownership of sustainability, and the associated risks and opportunities, in the hands of individual sites. In the same way that each site must manage its geological, operational and technical capabilities to meet business objectives, it must also manage and identify programs, metrics, and targets that measure progress and deliver real value for the business and our stakeholders, including our host countries and local communities. The Group Sustainability Executive, supported by regional sustainability leads, provides oversight and direction over this site-level ownership, to ensure alignment with the strategic priorities of the overall business.
Governance
The bedrock of our sustainability strategy is strong governance. Our most senior management-level body dedicated to sustainability is the E&S Committee, which connects site-level ownership of our sustainability strategy with the leadership of the Group. It is chaired by the President and Chief Executive Officer and includes: (1) regional Chief Operating Officers; (2) minesite General Managers; (3) Health, Safety, Environment and Closure Leads; (4) the Group Sustainability Executive; (5) in-house legal counsel; and (6) an independent sustainability consultant in an advisory role. The E&S Committee meets on a quarterly basis to review our performance across a range of key performance indicators, and to provide independent oversight and review of sustainability management.
The President and Chief Executive Officer reviews the reports of the E&S Committee at every quarterly meeting of the Board’s ESG & Nominating Committee. The reports are reviewed to ensure the implementation of our sustainability policies and to drive performance of our environmental, health and safety, corporate social responsibility, and human rights programs.
This is supplemented by weekly meetings, at a minimum, between the Regional Sustainability Leads and the Group Sustainability Executive. These meetings examine the sustainability-related risks and opportunities facing the business in real time, as well as the progress and issues integrated into weekly Executive Committee review meetings.
Our industry-first Sustainability Scorecard accounts for 25% of the long-term incentive awards for senior leaders as part of the Barrick Partnership Plan. As we strive for ongoing strong performance, the Sustainability Scorecard targets and metrics are updated annually. The
results of the 2022 Sustainability Scorecard, and updated metrics and targets for 2023, were disclosed in our 2022 Sustainability Report, published in April 2023. The E&S Committee tracks our progress against all metrics.
Human rights
Our commitment to respect human rights is codified in our standalone Human Rights Policy and informed by the expectations of the United Nations Guiding Principles on Business and Human Rights, the Voluntary Principles on Security and Human Rights and the OECD Guidelines for Multinational Enterprises. This commitment is fulfilled on the ground via our Human Rights Program, the fundamental principles of which include: monitoring and reporting, due diligence, training, as well as disciplinary action and remedy.
We continue to assess and manage security and human rights risks at all our operations and provide security and human rights training to security forces across our sites.
Safety
We are committed to the safety, health and well-being of our people, their families and the communities in which we operate. Our safety vision is “Everyone to go home safe and healthy every day.”
As mentioned in the fourth quarter of 2022, our safety performance over the past 12 months has not met our high standards. Regrettably, two incidents occurred in January 2023 that resulted in tragic fatalities: one at Jabal Sayid, which resulted in the fatalities of two mining contractors; and one at Carlin that resulted in the fatality of an employee. Group-wide Safety Intervention and Shift Change Interventions continued to be implemented to reinforce our safety procedures and communicate our core safety messages and expectations.
A safety workshop was held in January 2023 with leadership across the group and across technical expertise to review and reset our approach to safety. We have rebranded our “Journey to Zero Harm” initiative to “Journey to Zero” as zero harm must start with zero fatalities. This initiative has commenced with a phase of honest reflection, review of our global safety standards, and alignment of our fatal risks and controls. The Journey to Zero continued to be focused on engagement with our workforce through Visible Felt Leadership, and by aligning and improving our standards across the Group, ensuring accountability to our safety commitments, and ensuring our employees are fit for duty.
We report our safety performance quarterly as part of both our E&S Committee meetings and to the ESG & Nominating Committee. Our safety performance is a regular standing agenda item on our weekly Executive Committee review meeting.
In terms of other key performance indicators, for the first quarter of 2023, our LTIFR3 was 0.21, in line with the fourth quarter of 2022, and our TRIFR3 was 1.65, an increase from 0.93 in the fourth quarter of 2022.
Social
We regard our host communities and countries as important partners in our business. Our sustainability policies commit us to transparency in our relationships with host communities, government authorities, the public and other key stakeholders. Through these policies, we commit to
| BARRICK FIRST QUARTER 2023 | 9 | MANAGEMENT’S DISCUSSION AND ANALYSIS |
| OVERVIEW | OPERATING PERFORMANCE | GROWTH PROJECTS & EXPLORATION | REVIEW OF FINANCIAL RESULTS |
OTHER INFORMATION & NON-GAAP RECONCILIATIONS
| FINANCIAL STATEMENTS |
conducting our business with integrity and with absolute opposition to corruption. We require our suppliers to operate ethically and responsibly as a condition of doing business with us.
Community and economic development
Our commitment to social and economic development is set out in our overarching Sustainable Development and Social Performance policies. Mining has been identified as vital for the achievement of the United Nations SDGs, not only for its role in providing the minerals needed to enable the transition to a lower carbon intensive economy, but also because of its ability to drive socio-economic development and build resilience. Creating long-term value and sharing economic benefits is at the heart of our approach to sustainability, as well as community development. This approach is encapsulated in three concepts:
The primacy of partnership: this means that we invest in real partnerships with mutual responsibility. Partnerships include local communities, suppliers, government, and organizations, and this approach is epitomized through our CDCs with development initiatives and investments.
Sharing the benefits: We hire and buy local wherever possible as this injects money into and keeps it in our local communities and host countries. By doing this, we build capacity, community resilience and create opportunity. We also invest in community development through our CDCs. Sharing the benefits also means paying our fair share of taxes, royalties and dividends and doing so transparently, primarily through the reporting mechanism of the Canadian Extractive Sector Transparency Measures Act. In April 2023, we published our second annual Tax Contribution Report which sets out, in detail, our economic contributions to host governments. We will continue to disclose such contributions on an annual basis.
Engaging and listening to stakeholders: We develop tailored stakeholder engagement plans for every operation and the business as a whole. These plans guide and document how often we engage with various stakeholder groups and allow us to proactively deal with issues before they escalate into significant risks.
We continued our community development initiatives through our CDCs during the first quarter of 2023. Notably, we established our first CDC for the Reko Diq project in Balochistan, Pakistan. This CDC, named Par-e-Koh CDC, is comprised of members from the four closest communities to the project and the CDC is currently compiling a baseline and needs prioritization.
The first quarter is traditionally when we plan community investments for the year ahead and consequently, our spend during this period is lower than the remaining quarters. In the first quarter of 2023, we invested more than $5.8 million in local community development projects.
Environment
We know the environment in which we work and our host communities are inextricably linked, and we apply a holistic and integrated approach to sustainability management. Being responsible stewards of the environment by applying the highest standards of environmental management, using natural resources and energy efficiently, recycling and reducing waste as well as working to protect biodiversity, we can deliver significant cost savings to our business,
reduce future liabilities and help build stronger stakeholder relationships. Environmental matters such as how we use water, prevent incidents, manage tailings, respond to changing climate, and protect biodiversity are key areas of focus.
We maintained our strong track record of stewardship and did not record any Class 14 environmental incidents during the first quarter of 2023.
Climate Change
The ESG & Nominating Committee is responsible for overseeing Barrick’s policies, programs and performance relating to sustainability and the environment, including climate change. The Audit & Risk Committee assists the Board in overseeing the Group’s management of enterprise risks as well as the implementation of policies and standards for monitoring and mitigating such risks. Climate change is built into our formal risk management process, outputs of which are regularly reviewed by the Audit & Risk Committee.
Barrick’s climate change strategy has three pillars: (1) identify, understand and mitigate the risks associated with climate change; (2) measure and reduce our GHG emissions across our operations and value chain; and (3) improve our disclosure on climate change. The three pillars of our climate change strategy do not focus solely on the development of emissions reduction targets, rather, we integrate and consider aspects of biodiversity protection, water management and community resilience in our approach.
We are acutely aware of the impacts that climate change has on our host communities and countries, particularly developing nations which are often the most vulnerable. As the world economy transitions to renewable power, it is imperative that developing nations are not left behind. As a responsible business, we have focused our efforts on building resilience in our host communities and countries, just as we do for our business. Our climate disclosure is based on the recommendations of the TCFD.
Identify, understand and mitigate the risks associated with climate change
We identify and manage risks, build resilience to climate change, as well as position ourselves for new opportunities. Climate change-related factors continue to be incorporated into our formal risk assessment process. We have identified several climate-related risks and opportunities for our business including: physical impacts of climate change; an increase in regulations that seek to address climate change; and an increase in global investment in innovation and low-carbon technologies.
The risk assessment process includes scenario analysis, which is being rolled out to all sites with an initial focus on our Tier One Gold Assets5, to assess site-specific climate related risks and opportunities. The key findings and summary of this asset-level physical and transitional risk assessment at Loulo-Gounkoto and Kibali is outlined in our 2022 Sustainability Report.
Measure and reduce the Group’s impact on climate change
Mining is an energy-intensive business, and we understand the important link between energy use and GHG emissions. By measuring and effectively managing our energy use, we can reduce our GHG emissions, achieve more efficient production, and reduce our costs.
| BARRICK FIRST QUARTER 2023 | 10 | MANAGEMENT’S DISCUSSION AND ANALYSIS |
| OVERVIEW | OPERATING PERFORMANCE | GROWTH PROJECTS & EXPLORATION | REVIEW OF FINANCIAL RESULTS |
OTHER INFORMATION & NON-GAAP RECONCILIATIONS
| FINANCIAL STATEMENTS |
We have climate champions at each site who are tasked with identifying roadmaps and assessing feasibility for our GHG emissions reductions and carbon offsets for hard-to-abate emissions. Any carbon offsets that we pursue must have appropriate socio-economic and/or biodiversity benefits. We have published an achievable emissions reduction roadmap and continue to assess further reduction opportunities across our operations. The detailed roadmap was first published in our 2021 Sustainability Report and includes committed-capital projects and projects under investigation that rely on technological advances, with a progress summary contained in the 2022 Sustainability Report.
We continue to progress our extensive work across our value chain in understanding our Scope 3 (indirect value chain) emissions and implementing our engagement roadmap to enable our key suppliers to set meaningful and measurable reduction targets, in line with the commitments made through the ICMM Climate Position Paper.
Improve our disclosure on climate change
As part of our commitment to improve our disclosure on climate change, including in our Sustainability Report and on our website, is developed in line with the TCFD recommendations. Barrick continues to monitor the various regulatory climate disclosure standards being developed around the world. In addition, we complete the annual CDP (formerly known as the Carbon Disclosure Project) Climate Change and Water Security questionnaires. This ensures our investor-relevant water use, emissions and climate data is widely available.
Emissions
Barrick’s interim GHG emissions reduction target is for a minimum 30% reduction by 2030 against our 2018 baseline, while maintaining a steady production profile. The basis of this reduction is against a 2018 baseline of 7,541 kt CO2-e.
Our GHG emissions reduction target is grounded in climate science and has a detailed pathway for achievement. Our target is not static and will be updated as we continue to identify and implement new GHG reduction opportunities.
Ultimately, our vision is net zero GHG emissions by 2050, achieved primarily through GHG reductions, with some offsets for hard-to-abate emissions. Site-level plans to improve energy efficiency, integrate clean and renewable energy sources and reduce GHG emissions will also be strengthened. We plan to supplement our corporate emissions reduction target with context-based site-specific emissions reduction targets.
During the first quarter of 2023, the Group’s total Scope 1 and 2 (location-based) GHG emissions were 1,552 kt CO2-e, approximately 1% less than the GHG emissions for the same period in 2022.
Water
Water is a vital and increasingly scarce global resource. Managing and using water responsibly is one of the most critical parts of our sustainability strategy. Our commitment to responsible water use is codified in our Environmental Policy. Steady, reliable access to water is critical to the effective operation of our mines. Access to water is also a fundamental human right.
Understanding the water stress in the regions we operate enables us to better understand the risks and manage our water resources through site-specific water balances, based on the ICMM Water Accounting Framework, aimed at minimizing our water withdrawal and maximizing water reuse and recycling within our operations.
We include each mine’s water risks in its operational risk register. These risks are then aggregated and incorporated into the corporate risk register. Our identified water-related risks include: (1) managing excess water in regions with high rainfall; (2) maintaining access to water in arid areas and regions prone to water scarcity; and (3) regulatory risks related to permitting limits as well as municipal and national regulations for water use.
We set an annual water recycling and reuse target of 80%. Our water recycling and reuse rate for the first quarter of 2023 was approximately 82%, in line with our performance in the first quarter of 2022.
Tailings
We are committed to having our TSFs meet global best practices for safety. Our TSFs are carefully engineered and regularly inspected, particularly those in regions with high rainfall and seismic events.
We continue to progress with our conformance to the GISTM. We have completed the consequence classification for a majority of our sites and the self-assessment for selected sites using the Conformance Protocols developed by the ICMM. A summary of our progress is expected to be made public in the third quarter of 2023.
Biodiversity
Biodiversity underpins many of the ecosystem services on which our mines and their surrounding communities depend. If improperly managed, mining and exploration activities have the potential to negatively affect biodiversity and ecosystem services. Protecting biodiversity and preventing nature loss is also critical and inextricably linked to the fight against climate change. We work to proactively manage our impact on biodiversity and strive to protect the ecosystems in which we operate. Wherever possible, we aim to achieve a net neutral biodiversity impact, particularly for ecologically sensitive environments.
We continue to work to implement our BAPs. The BAPs outline our strategy to achieve net-neutral impacts for all key biodiversity features and their associated management plans.
| BARRICK FIRST QUARTER 2023 | 11 | MANAGEMENT’S DISCUSSION AND ANALYSIS |
| OVERVIEW | OPERATING PERFORMANCE | GROWTH PROJECTS & EXPLORATION | REVIEW OF FINANCIAL RESULTS |
OTHER INFORMATION & NON-GAAP RECONCILIATIONS
| FINANCIAL STATEMENTS |
Full Year 2023 Outlook
We continue to expect 2023 gold production to be in the range of 4.2 to 4.6 million ounces. We expect stronger year-over-year performance from Cortez, Pueblo Viejo and Turquoise Ridge, together with consistent delivery across the remaining Tier One Gold Assets5 as detailed further below. Notably at Turquoise Ridge, the commissioning of the Third Shaft in the fourth quarter of 2022, combined with increased availability and reliability of the Sage autoclave, is expected to deliver stronger production in 2023 relative to the prior year.
As previously guided, the Company’s gold production is expected to be the lowest in the first quarter of 2023. This is mainly due to lower grades at Kibali due to mine sequencing, the commissioning and ramp up of the plant expansion at Pueblo Viejo, as well as roaster maintenance and the completion of the autoclave carbon-in-leach conversion at Goldstrike. Separately, major maintenance for the Gold Quarry roaster at Carlin occurred in April 2023, as planned, and additional planned maintenance on the Sage autoclave at Turquoise Ridge is scheduled for the second quarter. As a result, we expect the Company’s gold production in the second half of 2023 to be stronger than the first half driven by the steady ramp-up of throughput at Pueblo Viejo, the completion of major roaster maintenance at NGM, as well as higher grades from Kibali and Crossroads (Phase 5) at Cortez due to mine sequencing.
Our 2023 gold guidance continues to exclude Porgera. We expect to update our guidance to include Porgera following both the execution of all of the definitive agreements to implement the Commencement Agreement and the finalization of a timeline for the resumption of full mine operations.
Our 2023 gold cost guidance remains unchanged, including cost of sales of $1,170 to $1,250 per ounce2, total cash costs of $820 to $880 per ounce1 and all-in sustaining costs of $1,170 to $1,250 per ounce1. These ranges were based on a gold price assumption of $1,650 per ounce and a WTI oil price assumption of $90 per barrel. We have previously disclosed a sensitivity of approximately $5 per ounce on our 2023 gold cost guidance metrics for every $100 per ounce change in the gold price.
We continue to expect 2023 copper production to be in the range of 420 to 470 million pounds. Production in the second half of 2023 is expected to be stronger than the first half, mainly due to steadily increasing throughput at Lumwana as we execute on our owner-miner strategy and commission new mining fleet equipment. Separately, major maintenance at Zaldívar is scheduled in the third quarter of 2023 as reported by the operator, Antofagasta. Our copper cost guidance metrics for 2023 remain unchanged, which are based on a copper price assumption of $3.50 per pound.
Taking into account the risks and sensitivities as discussed above, 2023 Company guidance is detailed below, inclusive of the key assumptions that were used as the basis for this guidance as released on February 15, 2023.
Company Guidance ($ millions, except per ounce/pound data) | 2023 Estimate | |||
Gold production (millions of ounces) | 4.20 - 4.60 | |||
Gold cost metrics | ||||
Cost of sales - gold ($/oz) | 1,170 - 1,250 | |||
Total cash costs ($/oz)a | 820 - 880 | |||
Depreciation ($/oz) | 320 - 350 | |||
All-in sustaining costs ($/oz)a | 1,170 - 1,250 | |||
Copper production (millions of pounds) | 420 - 470 | |||
Copper cost metrics | ||||
Cost of sales - copper ($/lb) | 2.60 - 2.90 | |||
C1 cash costs ($/lb)a | 2.05 - 2.25 | |||
Depreciation ($/lb) | 0.80 - 0.90 | |||
All-in sustaining costs ($/lb)a | 2.95 - 3.25 | |||
Exploration and project expenses | 400 - 440 | |||
Exploration and evaluation | 180 - 200 | |||
Project expenses | 220 - 240 | |||
General and administrative expenses | ~180 | |||
Corporate administration | ~130 | |||
Share-based compensationb | ~50 | |||
Other expense | 70 - 90 | |||
Finance costs, net | 280 - 320 | |||
Attributable capital expenditures: | ||||
Attributable minesite sustaininga | 1,450 - 1,700 | |||
Attributable projecta | 750 - 900 | |||
Total attributable capital expenditures | 2,200 - 2,600 | |||
Effective income tax ratec | 27% - 32% | |||
Key assumptions (used for guidance) | ||||
Gold Price ($/oz) | 1,650 | |||
Copper Price ($/lb) | 3.50 | |||
Oil Price (WTI) ($/barrel) | 90 | |||
AUD Exchange Rate (AUD:USD) | 0.75 | |||
ARS Exchange Rate (USD:ARS) | 170 | |||
CAD Exchange Rate (USD:CAD) | 1.30 | |||
CLP Exchange Rate (USD:CLP) | 900 | |||
EUR Exchange Rate (EUR:USD) | 1.20 | |||
| a. | Further information on these non-GAAP financial measures, including detailed reconciliations, is included on pages 54 to 67 of this MD&A. |
| b. | Based on a one-month trailing average ending December 31, 2022 of US$17.04 per share. |
| c. | Based on key assumptions included in this table. |
| BARRICK FIRST QUARTER 2023 | 12 | MANAGEMENT’S DISCUSSION AND ANALYSIS |
| OVERVIEW | OPERATING PERFORMANCE | GROWTH PROJECTS & EXPLORATION | REVIEW OF FINANCIAL RESULTS |
OTHER INFORMATION & NON-GAAP RECONCILIATIONS
| FINANCIAL STATEMENTS |
Operating Division Guidance
Our 2023 forecast gold and copper production, cost of salesa, total cash costsb, all-in sustaining costsb, and C1 cash costsb ranges by operating division are as follows:
| Operating Division | 2023 forecast attributable production (000s ozs) | 2023 forecast cost of salesa ($/oz) | 2023 forecast total cash costsb ($/oz) | 2023 forecast all-in sustaining costsb ($/oz) | ||||||||||||
Gold | ||||||||||||||||
Carlin (61.5%) | 910 - 1,000 | 1,030 - 1,110 | 820 - 880 | 1,250 - 1,330 | ||||||||||||
Cortez (61.5%)c | 580 - 650 | 1,080 - 1,160 | 680 - 740 | 930 - 1,010 | ||||||||||||
Turquoise Ridge (61.5%) | 300 - 340 | 1,290 - 1,370 | 900 - 960 | 1,170 - 1,250 | ||||||||||||
Phoenix (61.5%) | 100 - 120 | 1,860 - 1,940 | 880 - 940 | 1,110 - 1,190 | ||||||||||||
Long Canyon (61.5%) | 0 - 10 | 2,120 - 2,200 | 730 - 790 | 1,080 - 1,160 | ||||||||||||
Nevada Gold Mines (61.5%) | 1,900 - 2,100 | 1,140 - 1,220 | 790 - 850 | 1,140 - 1,220 | ||||||||||||
Hemlo | 150 - 170 | 1,400 - 1,480 | 1,210 - 1,270 | 1,590 - 1,670 | ||||||||||||
North America | 2,100 - 2,300 | 1,160 - 1,240 | 820 - 880 | 1,170 - 1,250 | ||||||||||||
Pueblo Viejo (60%) | 470 - 520 | 1,130 - 1,210 | 710 - 770 | 960 - 1,040 | ||||||||||||
Veladero (50%) | 160 - 180 | 1,630 - 1,710 | 1,060 - 1,120 | 1,550 - 1,630 | ||||||||||||
Porgera (47.5%)d | — | — | — | — | ||||||||||||
Latin America & Asia Pacific | 630 - 700 | 1,260 - 1,340 | 800 - 860 | 1,110 - 1,190 | ||||||||||||
Loulo-Gounkoto (80%) | 510 - 560 | 1,100 - 1,180 | 750 - 810 | 1,070 - 1,150 | ||||||||||||
Kibali (45%) | 320 - 360 | 1,080 - 1,160 | 710 - 770 | 880 - 960 | ||||||||||||
North Mara (84%) | 230 - 260 | 1,120 - 1,200 | 900 - 960 | 1,240 - 1,320 | ||||||||||||
Bulyanhulu (84%) | 160 - 190 | 1,230 - 1,310 | 880 - 940 | 1,160 - 1,240 | ||||||||||||
Tongon (89.7%) | 180 - 210 | 1,260 - 1,340 | 1,070 - 1,130 | 1,240 - 1,320 | ||||||||||||
Africa & Middle East | 1,450 - 1,600 | 1,130 - 1,210 | 820 - 880 | 1,080 - 1,160 | ||||||||||||
Total Attributable to Barricke,f,g | 4,200 - 4,600 | 1,170 - 1,250 | 820 - 880 | 1,170 - 1,250 | ||||||||||||
| 2023 forecast attributable production (M lbs) | 2023 forecast cost of salesa ($/lb) | 2023 forecast C1 cash costsb ($/lb) | 2023 forecast all-in sustaining costsb ($/lb) | |||||||||||||
Copper | ||||||||||||||||
Lumwana | 260 - 290 | 2.45 - 2.75 | 2.00 - 2.20 | 3.20 - 3.50 | ||||||||||||
Zaldívar (50%) | 100 - 110 | 3.40 - 3.70 | 2.60 - 2.80 | 2.90 - 3.20 | ||||||||||||
Jabal Sayid (50%) | 65 - 75 | 1.80 - 2.10 | 1.50 - 1.70 | 1.60 - 1.90 | ||||||||||||
Total Copperg | 420 - 470 | 2.60 - 2.90 | 2.05 - 2.25 | 2.95 - 3.25 | ||||||||||||
| a. | Gold cost of sales per ounce is calculated as cost of sales across our gold operations (excluding sites in closure or care and maintenance) divided by ounces sold (both on an attributable basis using Barrick’s ownership share). Copper cost of sales per pound is calculated as cost of sales across our copper operations divided by pounds sold (both on an attributable basis using Barrick’s ownership share). |
| b. | Further information on these non-GAAP financial measures, including detailed reconciliations, is included on pages 54 to 67 of this MD&A. |
| c. | Includes Goldrush. |
| d. | Porgera was placed on temporary care and maintenance on April 25, 2020 and remains excluded from our 2023 guidance. We expect to update our guidance to include Porgera following both the execution of definitive agreements to implement the Commencement Agreement and the finalization of a timeline for the resumption of full mine operations. Refer to page 8 for further details. |
| e. | Total cash costs and all-in sustaining costs per ounce include costs allocated to non-operating sites. |
| f. | Operating division guidance ranges reflect expectations at each individual operating division and may not add up to the company-wide guidance range total. Guidance ranges exclude Pierina which is producing incidental ounces while in closure. |
| g. | Includes corporate administration costs. |
| BARRICK FIRST QUARTER 2023 | 13 | MANAGEMENT’S DISCUSSION AND ANALYSIS |
| OVERVIEW | OPERATING PERFORMANCE | GROWTH PROJECTS & EXPLORATION | REVIEW OF FINANCIAL RESULTS |
OTHER INFORMATION & NON-GAAP RECONCILIATIONS
| FINANCIAL STATEMENTS |
Production and Cost Summary - Gold
| For the three months ended | ||||||||||||||||||||
| 3/31/23 | 12/31/22 | % Change | 3/31/22 | % Change | ||||||||||||||||
Nevada Gold Mines LLC (61.5%)a | ||||||||||||||||||||
Gold produced (000s oz) | 416 | 516 | (19)% | 459 | (9)% | |||||||||||||||
Cost of sales ($/oz) | 1,461 | 1,257 | 16 % | 1,169 | 25 % | |||||||||||||||
Total cash costs ($/oz)b | 1,074 | 906 | 19 % | 820 | 31 % | |||||||||||||||
All-in sustaining costs ($/oz)b | 1,436 | 1,179 | 22 % | 1,118 | 28 % | |||||||||||||||
Carlin (61.5%) | ||||||||||||||||||||
Gold produced (000s oz) | 166 | 265 | (37)% | 229 | (28)% | |||||||||||||||
Cost of sales ($/oz) | 1,449 | 1,081 | 34 % | 1,015 | 43 % | |||||||||||||||
Total cash costs ($/oz)b | 1,215 | 878 | 38 % | 829 | 47 % | |||||||||||||||
All-in sustaining costs ($/oz)b | 1,689 | 1,217 | 39 % | 1,139 | 48 % | |||||||||||||||
Cortez (61.5%)c | ||||||||||||||||||||
Gold produced (000s oz) | 140 | 140 | 0 % | 115 | 22 % | |||||||||||||||
Cost of sales ($/oz) | 1,324 | 1,284 | 3 % | 1,113 | 19 % | |||||||||||||||
Total cash costs ($/oz)b | 913 | 848 | 8 % | 784 | 16 % | |||||||||||||||
All-in sustaining costs ($/oz)b | 1,233 | 1,037 | 19 % | 1,150 | 7 % | |||||||||||||||
Turquoise Ridge (61.5%) | ||||||||||||||||||||
Gold produced (000s oz) | 81 | 78 | 4 % | 67 | 21 % | |||||||||||||||
Cost of sales ($/oz) | 1,412 | 1,518 | (7)% | 1,436 | (2)% | |||||||||||||||
Total cash costs ($/oz)b | 1,034 | 1,089 | (5)% | 1,030 | 0 % | |||||||||||||||
All-in sustaining costs ($/oz)b | 1,271 | 1,304 | (3)% | 1,281 | (1)% | |||||||||||||||
Phoenix (61.5%) | ||||||||||||||||||||
Gold produced (000s oz) | 27 | 30 | (10)% | 23 | 17 % | |||||||||||||||
Cost of sales ($/oz) | 2,380 | 1,901 | 25 % | 2,253 | 6 % | |||||||||||||||
Total cash costs ($/oz)b | 1,198 | 946 | 27 % | 835 | 43 % | |||||||||||||||
All-in sustaining costs ($/oz)b | 1,365 | 1,037 | 32 % | 1,027 | 33 % | |||||||||||||||
Long Canyon (61.5%) | ||||||||||||||||||||
Gold produced (000s oz) | 2 | 3 | (33)% | 25 | (92)% | |||||||||||||||
Cost of sales ($/oz) | 1,621 | 1,812 | (11)% | 1,093 | 48 % | |||||||||||||||
Total cash costs ($/oz)b | 579 | 616 | (6)% | 342 | 69 % | |||||||||||||||
All-in sustaining costs ($/oz)b | 629 | 664 | (5)% | 366 | 72 % | |||||||||||||||
Pueblo Viejo (60%) | ||||||||||||||||||||
Gold produced (000s oz) | 89 | 98 | (9)% | 104 | (14)% | |||||||||||||||
Cost of sales ($/oz) | 1,241 | 1,215 | 2 % | 1,077 | 15 % | |||||||||||||||
Total cash costs ($/oz)b | 714 | 764 | (7)% | 682 | 5 % | |||||||||||||||
All-in sustaining costs ($/oz)b | 1,073 | 1,065 | 1 % | 948 | 13 % | |||||||||||||||
Loulo-Gounkoto (80%) | ||||||||||||||||||||
Gold produced (000s oz) | 137 | 139 | (1)% | 138 | (1)% | |||||||||||||||
Cost of sales ($/oz) | 1,275 | 1,216 | 5 % | 1,088 | 17 % | |||||||||||||||
Total cash costs ($/oz)b | 855 | 822 | 4 % | 721 | 19 % | |||||||||||||||
All-in sustaining costs ($/oz)b | 1,190 | 1,102 | 8 % | 982 | 21 % | |||||||||||||||
Kibali (45%) | ||||||||||||||||||||
Gold produced (000s oz) | 64 | 97 | (34)% | 76 | (16)% | |||||||||||||||
Cost of sales ($/oz) | 1,367 | 1,570 | (13)% | 1,137 | 20 % | |||||||||||||||
Total cash costs ($/oz)b | 987 | 617 | 60 % | 744 | 33 % | |||||||||||||||
All-in sustaining costs ($/oz)b | 1,177 | 981 | 20 % | 996 | 18 % | |||||||||||||||
Veladero (50%) | ||||||||||||||||||||
Gold produced (000s oz) | 43 | 50 | (14)% | 46 | (7)% | |||||||||||||||
Cost of sales ($/oz) | 1,587 | 2,309 | (31)% | 1,348 | 18 % | |||||||||||||||
Total cash costs ($/oz)b | 1,035 | 954 | 8 % | 847 | 22 % | |||||||||||||||
All-in sustaining costs ($/oz)b | 1,761 | 1,526 | 15 % | 1,588 | 11 % | |||||||||||||||
Porgera (47.5%)d | ||||||||||||||||||||
Gold produced (000s oz) | — | — | — % | — | — % | |||||||||||||||
Cost of sales ($/oz) | — | — | — % | — | — % | |||||||||||||||
Total cash costs ($/oz)b | — | — | — % | — | — % | |||||||||||||||
All-in sustaining costs ($/oz)b | — | — | — % | — | — % | |||||||||||||||
| BARRICK FIRST QUARTER 2023 | 14 | MANAGEMENT’S DISCUSSION AND ANALYSIS |
| OVERVIEW | OPERATING PERFORMANCE | GROWTH PROJECTS & EXPLORATION | REVIEW OF FINANCIAL RESULTS |
OTHER INFORMATION & NON-GAAP RECONCILIATIONS
| FINANCIAL STATEMENTS |
Production and Cost Summary - Gold (continued)
| For the three months ended | ||||||||||||||||||||
| 3/31/23 | 12/31/22 | % Change | 3/31/22 | % Change | ||||||||||||||||
Tongon (89.7%) | ||||||||||||||||||||
Gold produced (000s oz) | 50 | 63 | (21)% | 35 | 43 % | |||||||||||||||
Cost of sales ($/oz) | 1,453 | 1,381 | 5 % | 2,036 | (29)% | |||||||||||||||
Total cash costs ($/oz)b | 1,182 | 1,070 | 10 % | 1,667 | (29)% | |||||||||||||||
All-in sustaining costs ($/oz)b | 1,284 | 1,404 | (9)% | 1,803 | (29)% | |||||||||||||||
Hemlo | ||||||||||||||||||||
Gold produced (000s oz) | 41 | 38 | 8 % | 31 | 32 % | |||||||||||||||
Cost of sales ($/oz) | 1,486 | 1,451 | 2 % | 1,727 | (14)% | |||||||||||||||
Total cash costs ($/oz)b | 1,291 | 1,227 | 5 % | 1,503 | (14)% | |||||||||||||||
All-in sustaining costs ($/oz)b | 1,609 | 1,557 | 3 % | 1,982 | (19)% | |||||||||||||||
North Mara (84%) | ||||||||||||||||||||
Gold produced (000s oz) | 68 | 70 | (3)% | 56 | 21 % | |||||||||||||||
Cost of sales ($/oz) | 987 | 1,030 | (4)% | 852 | 16 % | |||||||||||||||
Total cash costs ($/oz)b | 759 | 758 | 0 % | 709 | 7 % | |||||||||||||||
All-in sustaining costs ($/oz)b | 1,137 | 1,301 | (13)% | 874 | 30 % | |||||||||||||||
Bulyanhulu (84%) | ||||||||||||||||||||
Gold produced (000s oz) | 44 | 49 | (10)% | 45 | (2)% | |||||||||||||||
Cost of sales ($/oz) | 1,358 | 1,237 | 10 % | 1,216 | 12 % | |||||||||||||||
Total cash costs ($/oz)b | 982 | 896 | 10 % | 847 | 16 % | |||||||||||||||
All-in sustaining costs ($/oz)b | 1,332 | 1,401 | (5)% | 984 | 35 % | |||||||||||||||
Total Attributable to Barricke | ||||||||||||||||||||
Gold produced (000s oz) | 952 | 1,120 | (15)% | 990 | (4)% | |||||||||||||||
Cost of sales ($/oz)f | 1,378 | 1,324 | 4 % | 1,190 | 16 % | |||||||||||||||
Total cash costs ($/oz)b | 986 | 868 | 14 % | 832 | 19 % | |||||||||||||||
All-in sustaining costs ($/oz)b | 1,370 | 1,242 | 10 % | 1,164 | 18 % | |||||||||||||||
| a. | These results represent our 61.5% interest in Carlin, Cortez, Turquoise Ridge, Phoenix and Long Canyon. |
| b. | Further information on these non-GAAP financial measures, including detailed reconciliations, is included on pages 54 to 67 of this MD&A. |
| c. | Includes Goldrush. |
| d. | As Porgera was placed on care and maintenance on April 25, 2020, no operating data or per ounce data is provided. |
| e. | Excludes Pierina, which is producing incidental ounces while in closure. |
| f. | Gold cost of sales per ounce is calculated as cost of sales across our gold operations (excluding sites in closure or care and maintenance) divided by ounces sold (both on an attributable basis using Barrick’s ownership share). |
| BARRICK FIRST QUARTER 2023 | 15 | MANAGEMENT’S DISCUSSION AND ANALYSIS |
| OVERVIEW | OPERATING PERFORMANCE | GROWTH PROJECTS & EXPLORATION | REVIEW OF FINANCIAL RESULTS |
OTHER INFORMATION & NON-GAAP RECONCILIATIONS
| FINANCIAL STATEMENTS |
Production and Cost Summary - Copper
| For the three months ended | ||||||||||||||||||||
| 3/31/23 | 12/31/22 | % Change | 3/31/22 | % Change | ||||||||||||||||
Lumwana | ||||||||||||||||||||
Copper production (millions lbs) | 48 | 53 | (9)% | 57 | (16)% | |||||||||||||||
Cost of sales ($/lb) | 3.56 | 3.56 | 0 % | 2.20 | 62 % | |||||||||||||||
C1 cash costs ($/lb)a | 3.09 | 2.34 | 32 % | 1.86 | 66 % | |||||||||||||||
All-in sustaining costs ($/lb)a | 3.98 | 4.86 | (18)% | 3.16 | 26 % | |||||||||||||||
Zaldívar (50%) | ||||||||||||||||||||
Copper production (millions lbs) | 22 | 25 | (12)% | 25 | (12)% | |||||||||||||||
Cost of sales ($/lb) | 3.73 | 3.55 | 5 % | 2.85 | 31 % | |||||||||||||||
C1 cash costs ($/lb)a | 2.86 | 2.69 | 6 % | 2.15 | 33 % | |||||||||||||||
All-in sustaining costs ($/lb)a | 3.22 | 3.60 | (11)% | 2.64 | 22 % | |||||||||||||||
Jabal Sayid (50%) | ||||||||||||||||||||
Copper production (millions lbs) | 18 | 18 | 0 % | 19 | (5)% | |||||||||||||||
Cost of sales ($/lb) | 1.53 | 1.72 | (11)% | 1.30 | 18 % | |||||||||||||||
C1 cash costs ($/lb)a | 1.39 | 1.42 | (2)% | 1.10 | 26 % | |||||||||||||||
All-in sustaining costs ($/lb)a | 1.61 | 1.54 | 5 % | 1.17 | 38 % | |||||||||||||||
Total Copper | ||||||||||||||||||||
Copper production (millions lbs) | 88 | 96 | (8)% | 101 | (13)% | |||||||||||||||
Cost of sales ($/lb)b | 3.22 | 3.19 | 1 % | 2.21 | 46 % | |||||||||||||||
C1 cash costs ($/lb)a | 2.71 | 2.25 | 20 % | 1.81 | 50 % | |||||||||||||||
All-in sustaining costs ($/lb)a | 3.40 | 3.98 | (15)% | 2.85 | 19 % | |||||||||||||||
| a. | Further information on these non-GAAP financial measures, including detailed reconciliations, is included on pages 54 to 67 of this MD&A. |
| b. | Copper cost of sales per pound is calculated as cost of sales across our copper operations divided by pounds sold (both on an attributable basis using Barrick’s ownership share). |
Operating Performance
In the first quarter of 2023, we re-evaluated our reportable operating segments and will start detailed reporting on our interest in Lumwana and no longer provide detailed reporting on our interest in Veladero. As a result, our presentation of reportable operating segments consists of eight gold mines (Carlin, Cortez, Turquoise Ridge, Pueblo Viejo, Loulo-Gounkoto, Kibali, North Mara and Bulyanhulu) and one copper mine (Lumwana). The remaining operating
segments, including our remaining gold and copper mines, have been grouped into an “Other Mines” category and will not be reported on individually. Segment performance is evaluated based on a number of measures including operating income before tax, production levels and unit production costs. Certain costs are managed on a consolidated basis and are therefore not reflected in segment income.
| BARRICK FIRST QUARTER 2023 | 16 | MANAGEMENT’S DISCUSSION AND ANALYSIS |
| OVERVIEW | OPERATING PERFORMANCE | GROWTH PROJECTS & EXPLORATION | REVIEW OF FINANCIAL RESULTS |
OTHER INFORMATION & NON-GAAP RECONCILIATIONS
| FINANCIAL STATEMENTS |
Nevada Gold Mines (61.5% basis)a, Nevada, USA
Summary of Operating and Financial Data
| For the three months ended | ||||||||||||||||||||
| 3/31/23 | 12/31/22 | % Change | 3/31/22 | % Change | ||||||||||||||||
Total tonnes mined (000s) | 36,501 | 36,209 | 1 % | 45,431 | (20)% | |||||||||||||||
Open pit ore | 5,682 | 8,250 | (31)% | 6,106 | (7)% | |||||||||||||||
Open pit waste | 29,572 | 26,572 | 11 % | 38,000 | (22)% | |||||||||||||||
Underground | 1,247 | 1,387 | (10)% | 1,325 | (6)% | |||||||||||||||
Average grade (grams/tonne) | ||||||||||||||||||||
Open pit mined | 1.16 | 1.55 | (25)% | 0.75 | 55 % | |||||||||||||||
Underground mined | 8.57 | 9.24 | (7)% | 8.79 | (2)% | |||||||||||||||
Processed | 2.37 | 2.53 | (6)% | 1.98 | 20 % | |||||||||||||||
Ore tonnes processed (000s) | 7,367 | 10,052 | (27)% | 9,075 | (19)% | |||||||||||||||
Oxide mill | 2,725 | 2,946 | (8)% | 2,954 | (8)% | |||||||||||||||
Roaster | 1,005 | 1,365 | (26)% | 1,394 | (28)% | |||||||||||||||
Autoclave | 716 | 995 | (28)% | 986 | (27)% | |||||||||||||||
Heap leach | 2,921 | 4,746 | (38)% | 3,741 | (22)% | |||||||||||||||
Recovery rateb | 82 % | 80 % | 2 % | 77 % | 6 % | |||||||||||||||
Oxide Millb | 76 % | 76 % | 0 % | 71 % | 7 % | |||||||||||||||
Roaster | 85 % | 86 % | (1)% | 85 % | 0 % | |||||||||||||||
Autoclave | 81 % | 72 % | 13 % | 65 % | 25 % | |||||||||||||||
Gold produced (000s oz) | 416 | 516 | (19)% | 459 | (9)% | |||||||||||||||
Oxide mill | 103 | 127 | (19)% | 70 | 47 % | |||||||||||||||
Roaster | 182 | 265 | (31)% | 232 | (22)% | |||||||||||||||
Autoclave | 82 | 94 | (13)% | 87 | (6)% | |||||||||||||||
Heap leach | 49 | 30 | 63 % | 70 | (30)% | |||||||||||||||
Gold sold (000s oz) | 411 | 511 | (20)% | 458 | (10)% | |||||||||||||||
Revenue ($ millions) | 807 | 918 | (12)% | 888 | (9)% | |||||||||||||||
Cost of sales ($ millions) | 606 | 645 | (6)% | 535 | 13 % | |||||||||||||||
Income ($ millions) | 189 | 264 | (28)% | 363 | (48)% | |||||||||||||||
EBITDA ($ millions)c | 329 | 426 | (23)% | 502 | (34)% | |||||||||||||||
EBITDA margind | 41 % | 46 % | (11)% | 57 % | (28)% | |||||||||||||||
Capital expenditures ($ millions) | 169 | 169 | 0 % | 160 | 6 % | |||||||||||||||
Minesite sustainingc | 137 | 128 | 7 % | 130 | 5 % | |||||||||||||||
Projectc | 32 | 41 | (22)% | 30 | 7 % | |||||||||||||||
Cost of sales ($/oz) | 1,461 | 1,257 | 16 % | 1,169 | 25 % | |||||||||||||||
Total cash costs ($/oz)c | 1,074 | 906 | 19 % | 820 | 31 % | |||||||||||||||
All-in sustaining costs ($/oz)c | 1,436 | 1,179 | 22 % | 1,118 | 28 % | |||||||||||||||
All-in costs ($/oz)c | 1,514 | 1,260 | 20 % | 1,184 | 28 % | |||||||||||||||
| a. | Barrick is the operator of NGM and owns 61.5%, with Newmont Corporation owning the remaining 38.5%. NGM is accounted for as a subsidiary with a 38.5% non-controlling interest. These results represent our 61.5% interest in Carlin, Cortez, Turquoise Ridge, Phoenix and Long Canyon. |
| b. | Excludes the Gold Quarry (Mill 5) concentrator. |
| c. | Further information on these non-GAAP financial measures, including detailed reconciliations, is included on pages 54 to 67 of this MD&A. |
| d. | Represents EBITDA divided by revenue. |
NGM includes Carlin, Cortez, Turquoise Ridge, Phoenix and Long Canyon. Barrick is the operator of the joint venture and owns 61.5%, with Newmont owning the remaining 38.5%. Refer to the following pages for a detailed discussion of each minesite’s results.
| BARRICK FIRST QUARTER 2023 | 17 | MANAGEMENT’S DISCUSSION AND ANALYSIS |
| OVERVIEW | OPERATING PERFORMANCE | GROWTH PROJECTS & EXPLORATION | REVIEW OF FINANCIAL RESULTS |
OTHER INFORMATION & NON-GAAP RECONCILIATIONS
| FINANCIAL STATEMENTS |
Carlin (61.5% basis), Nevada, USA
Summary of Operating and Financial Data
| For the three months ended | ||||||||||||||||||||
| 3/31/23 | 12/31/22 | % Change | 3/31/22 | % Change | ||||||||||||||||
Total tonnes mined (000s) | 14,357 | 11,846 | 21 % | 18,634 | (23)% | |||||||||||||||
Open pit ore | 1,087 | 1,686 | (36)% | 957 | 14 % | |||||||||||||||
Open pit waste | 12,554 | 9,367 | 34 % | 16,841 | (25)% | |||||||||||||||
Underground | 716 | 793 | (10)% | 836 | (14)% | |||||||||||||||
Average grade (grams/tonne) | ||||||||||||||||||||
Open pit mined | 2.47 | 2.99 | (17)% | 0.97 | 155 % | |||||||||||||||
Underground mined | 7.73 | 7.88 | (2)% | 7.87 | (2)% | |||||||||||||||
Processed | 4.12 | 4.29 | (4)% | 3.39 | 22 % | |||||||||||||||
Ore tonnes processed (000s) | 1,637 | 2,497 | (34)% | 2,973 | (45)% | |||||||||||||||
Oxide mill | 377 | 617 | (39)% | 593 | (36)% | |||||||||||||||
Roasters | 852 | 1,126 | (24)% | 1,122 | (24)% | |||||||||||||||
Autoclave | 88 | 503 | (83)% | 540 | (84)% | |||||||||||||||
Heap leach | 320 | 251 | 27 % | 718 | (55)% | |||||||||||||||
Recovery ratea | 84 % | 81 % | 4 % | 77 % | 9 % | |||||||||||||||
Roasters | 85 % | 86 % | (1)% | 85 % | 0 % | |||||||||||||||
Autoclave | 72 % | 46 % | 57 % | 46 % | 57 % | |||||||||||||||
Gold produced (000s oz) | 166 | 265 | (37)% | 229 | (28)% | |||||||||||||||
Oxide mill | 4 | 16 | (75)% | 9 | (56)% | |||||||||||||||
Roasters | 151 | 221 | (32)% | 183 | (17)% | |||||||||||||||
Autoclave | 5 | 19 | (74)% | 25 | (80)% | |||||||||||||||
Heap leach | 6 | 9 | (33)% | 12 | (50)% | |||||||||||||||
Gold sold (000s oz) | 164 | 266 | (38)% | 230 | (29)% | |||||||||||||||
Revenue ($ millions) | 314 | 467 | (33)% | 435 | (28)% | |||||||||||||||
Cost of sales ($ millions) | 242 | 291 | (17)% | 232 | 4 % | |||||||||||||||
Income ($ millions) | 66 | 171 | (61)% | 215 | (69)% | |||||||||||||||
EBITDA ($ millions)b | 105 | 226 | (54)% | 257 | (59)% | |||||||||||||||
EBITDA marginc | 33 % | 48 % | (31)% | 59 % | (44)% | |||||||||||||||
Capital expenditures ($ millions) | 72 | 85 | (15)% | 69 | 4 % | |||||||||||||||
Minesite sustainingb | 72 | 85 | (15)% | 69 | 4 % | |||||||||||||||
Projectb | 0 | 0 | 0 % | 0 | 0 % | |||||||||||||||
Cost of sales ($/oz) | 1,449 | 1,081 | 34 % | 1,015 | 43 % | |||||||||||||||
Total cash costs ($/oz)b | 1,215 | 878 | 38 % | 829 | 47 % | |||||||||||||||
All-in sustaining costs ($/oz)b | 1,689 | 1,217 | 39 % | 1,139 | 48 % | |||||||||||||||
All-in costs ($/oz)b | 1,689 | 1,217 | 39 % | 1,139 | 48 % | |||||||||||||||
| a. | Excludes the Gold Quarry (Mill 5) concentrator. |
| b. | Further information on these non-GAAP financial measures, including detailed reconciliations, is included on pages 54 to 67 of this MD&A. |
| c. | Represents EBITDA divided by revenue. |
Safety and Environment
| For the three months ended | ||||||||
| 3/31/23 | 12/31/22 | |||||||
LTI | 4 | 0 | ||||||
LTIFR3 | 1.75 | 0.00 | ||||||
TRIFR3 | 3.07 | 2.27 | ||||||
Class 14 environmental incidents | 0 | 0 | ||||||
On January 23, 2023, an unfortunate incident occurred at Carlin, which resulted in the tragic fatality of an employee. Please refer to page 9 for further details.
Financial Results
Q1 2023 compared to Q4 2022
Carlin’s income for the first quarter of 2023 was 61% lower than the prior quarter due to lower sales volumes and a higher cost of sales per ounce2, partially offset by a higher realized gold price1.
Gold production in the first quarter of 2023 was 37% lower compared to the prior quarter primarily due to an 18-day planned major maintenance at the Goldstrike roaster in March 2023, completion of the Goldstrike autoclave RIL to CIL conversion project with the facility down for the majority of the current quarter, the planned closure of the Gold Quarry concentrator, the impact of record levels of snow on ore handling, as well as lower processed grades. The RIL to CIL conversion at the Goldstrike autoclave allows for the earlier processing of
| BARRICK FIRST QUARTER 2023 | 18 | MANAGEMENT’S DISCUSSION AND ANALYSIS |
| OVERVIEW | OPERATING PERFORMANCE | GROWTH PROJECTS & EXPLORATION | REVIEW OF FINANCIAL RESULTS |
OTHER INFORMATION & NON-GAAP RECONCILIATIONS
| FINANCIAL STATEMENTS |
open pit material from Carlin South that would have otherwise been scheduled towards the end of life for the roasters.
Total tonnes mined were 21% higher compared to the prior quarter, primarily driven by open pit sequencing per the mine plan partially offset by the impact of record snow levels during the winter. Open pit waste tonnes increased from Goldstar, Gold Quarry and the next phase of South Arturo. Open pit ore tonnes and grade mined were 36% and 17% lower, respectively, compared to the prior quarter, driven by a decrease from the Goldstrike 5th NW layback where mining of ore was completed in January 2023. This was slightly offset by higher ore tonnes mined at Goldstar, though at a lower grade versus Goldstrike. Underground tonnes mined and average grade were 10% and 2% lower, respectively, than the prior quarter due to mine sequencing across Carlin’s underground operations.
Cost of sales per ounce2 and total cash costs per ounce1 in the first quarter of 2023 were 34% and 38% higher, respectively, than the prior quarter largely reflecting lower sales volumes combined with lower grades processed. These impacts were partially offset by a higher proportion of relatively lower cost underground ounces in the sales mix and a reduction in energy costs. In the first quarter of 2023, all-in sustaining costs per ounce1 were 39% higher than the prior quarter due to higher total cash costs per ounce1 combined with higher minesite sustaining capital expenditures1 on a per ounce basis.
Capital expenditures in the first quarter of 2023 decreased by 15% compared to prior quarter, primarily due to timing of mobile equipment deliveries at the end of 2022 across Carlin’s mining operations.
Q1 2023 compared to Q1 2022
Carlin’s income for the three month period ended March 31, 2023 was 69% lower than the same prior year period due to lower sales volumes and a higher cost of sales per ounce2, partially offset by a higher realized gold price1.
Gold production for the three month period ended March 31, 2023 was 28% lower than the same prior year period as a result of an 18-day planned major maintenance at the Goldstrike roaster completed in March 2023, completion of the Goldstrike autoclave RIL to CIL conversion project with the facility down for the majority of
the current quarter, the closure of the Gold Quarry concentrator, the impact of record levels of snow on ore handling, as well as lower underground ore tonnes and grade per the mine plans.
Total tonnes mined were 23% lower than the same prior year period, primarily driven by the impact of record snow levels during the winter, as well as open pit sequencing per the mine plan. This was mainly due to reduced waste stripping in the open pits, partially offset by higher ore tonnes mined. Mining at the Goldstrike 5th NW was mainly focused on ore in the current quarter, compared to a full quarter of waste stripping in the same prior year period. At Goldstar, lower tonnes were mined compared to the same prior year period with the current phases scheduled for completion in mid-2023. Offsetting this, mining activity at Gold Quarry was significantly higher in the current quarter to meet planned ore delivery requirements in the second half of 2023, while initial waste stripping commenced at the next phase of South Arturo compared to zero mining in the same prior year period. Average open pit mined grade increased by 155% compared to the same prior year period, primarily due to the mining of a lower proportion of heap leach ore. Underground tonnes and grade mined were 14% and 2% lower, respectively, compared to the same prior year period, driven by a change in the mix of ore sources across the different underground operations, as per the mine plan.
Cost of sales per ounce2 and total cash costs per ounce1 for the three month period ended March 31, 2023 were 43% and 47% higher, respectively, than the same prior year period, primarily due to lower sales volumes, combined with higher energy prices. For the three month period ended March 31, 2023, all-in sustaining costs per ounce1 increased by 48% compared to the same prior year period, mainly due to higher total cash costs per ounce1 combined with higher minesite sustaining capital expenditures1.
Capital expenditures in the first quarter of 2023 were 4% higher compared with the same prior year period, due to projects related to processing facilities, including completion of the Goldstrike autoclave RIL to CIL conversion project in March 2023.
| BARRICK FIRST QUARTER 2023 | 19 | MANAGEMENT’S DISCUSSION AND ANALYSIS |
| OVERVIEW | OPERATING PERFORMANCE | GROWTH PROJECTS & EXPLORATION | REVIEW OF FINANCIAL RESULTS |
OTHER INFORMATION & NON-GAAP RECONCILIATIONS
| FINANCIAL STATEMENTS |
Cortez (61.5% basis)a, Nevada, USA
Summary of Operating and Financial Data
| For the three months ended | ||||||||||||||||||||
| 3/31/23 | 12/31/22 | % Change | 3/31/22 | % Change | ||||||||||||||||
Total tonnes mined (000s) | 15,326 | 17,427 | (12)% | 17,895 | (14)% | |||||||||||||||
Open pit ore | 2,172 | 3,849 | (44)% | 1,623 | 34 % | |||||||||||||||
Open pit waste | 12,856 | 13,238 | (3)% | 15,994 | (20)% | |||||||||||||||
Underground | 298 | 340 | (12)% | 278 | 7 % | |||||||||||||||
Average grade (grams/tonne) | ||||||||||||||||||||
Open pit mined | 0.82 | 1.33 | (38)% | 1.01 | (19)% | |||||||||||||||
Underground mined | 9.34 | 10.20 | (8)% | 9.17 | 2 % | |||||||||||||||
Processed | 1.77 | 1.82 | (3)% | 1.76 | 1 % | |||||||||||||||
Ore tonnes processed (000s) | 2,537 | 4,170 | (39)% | 2,014 | 26 % | |||||||||||||||
Oxide mill | 564 | 611 | (8)% | 664 | (15)% | |||||||||||||||
Roasters | 153 | 239 | (36)% | 272 | (44)% | |||||||||||||||
Heap leach | 1,820 | 3,320 | (45)% | 1,078 | 69 % | |||||||||||||||
Recovery rate | 83 % | 80 % | 4 % | 80 % | 4 % | |||||||||||||||
Oxide Mill | 82 % | 77 % | 6 % | 72 % | 14 % | |||||||||||||||
Roasters | 87 % | 84 % | 4 % | 87 % | 0 % | |||||||||||||||
Gold produced (000s oz) | 140 | 140 | 0 % | 115 | 22 % | |||||||||||||||
Oxide Mill | 69 | 78 | (12)% | 35 | 97 % | |||||||||||||||
Roasters | 31 | 44 | (30)% | 49 | (37)% | |||||||||||||||
Heap leach | 40 | 18 | 122 % | 31 | 29 % | |||||||||||||||
Gold sold (000s oz) | 137 | 137 | 0 % | 118 | 16 % | |||||||||||||||
Revenue ($ millions) | 262 | 241 | 9 % | 224 | 17 % | |||||||||||||||
Cost of sales ($ millions) | 182 | 175 | 4 % | 131 | 39 % | |||||||||||||||
Income ($ millions) | 78 | 63 | 24 % | 92 | (15)% | |||||||||||||||
EBITDA ($ millions)b | 134 | 122 | 10 % | 130 | 3 % | |||||||||||||||
EBITDA marginc | 51 % | 51 % | 0 % | 58 % | (12)% | |||||||||||||||
Capital expenditures ($ millions) | 56 | 42 | 33 % | 53 | 6 % | |||||||||||||||
Minesite sustainingb | 41 | 22 | 86 % | 41 | 0 % | |||||||||||||||
Projectb | 15 | 20 | (25)% | 12 | 25 % | |||||||||||||||
Cost of sales ($/oz) | 1,324 | 1,284 | 3 % | 1,113 | 19 % | |||||||||||||||
Total cash costs ($/oz)b | 913 | 848 | 8 % | 784 | 16 % | |||||||||||||||
All-in sustaining costs ($/oz)b | 1,233 | 1,037 | 19 % | 1,150 | 7 % | |||||||||||||||
All-in costs ($/oz)b | 1,340 | 1,175 | 14 % | 1,257 | 7 % | |||||||||||||||
| a. | Includes Goldrush. |
| b. | Further information on these non-GAAP financial measures, including detailed reconciliations, is included on pages 54 to 67 of this MD&A. |
| c. | Represents EBITDA divided by revenue. |
Safety and Environment
| For the three months ended | ||||||||
| 3/31/23 | 12/31/22 | |||||||
LTI | 0 | 1 | ||||||
LTIFR3 | 0 | 0.95 | ||||||
TRIFR3 | 1.89 | 3.78 | ||||||
Class 14 environmental incidents | 0 | 0 | ||||||
Financial Results
Q1 2023 compared to Q4 2022
Cortez’s income for the first quarter of 2023 was 24% higher than the prior quarter due to a higher realized gold price1, partially offset by slightly higher cost of sales per ounce2 while sales volumes were in line with the prior quarter.
Gold production in the first quarter of 2023 was in line with the prior quarter. Higher heap leach production from the Crossroads open pit was offset by lower open pit refractory stockpiles hauled to the Carlin roasters, as well as lower Cortez Hills underground production.
Total tonnes mined were 12% lower compared to the prior quarter primarily driven by the open pits. Open pit ore tonnes and grade mined were 44% and 38% lower, respectively, compared to the prior quarter, mainly due to mine sequencing at Crossroads and the impact of record snow levels during the winter. This was slightly offset by
| BARRICK FIRST QUARTER 2023 | 20 | MANAGEMENT’S DISCUSSION AND ANALYSIS |
| OVERVIEW | OPERATING PERFORMANCE | GROWTH PROJECTS & EXPLORATION | REVIEW OF FINANCIAL RESULTS |
OTHER INFORMATION & NON-GAAP RECONCILIATIONS
| FINANCIAL STATEMENTS |
higher tonnes mined from Cortez Pits. Waste stripping was largely in line with the prior quarter. Underground tonnes and grade mined were 12% and 8% lower, respectively, compared to the prior quarter driven by the mine sequence and planned major maintenance performed on the Cortez Hills Range Front Decline conveyor system, which is expected to be completed in the second quarter of 2023.
Cost of sales per ounce2 and total cash costs per ounce1 in the first quarter of 2023 were 3% and 8% higher, respectively, than the prior quarter due to the impact of a lower proportion of relatively lower cost underground production in the sales mix, partially offset by lower energy prices. In the first quarter of 2023, all-in sustaining costs per ounce1 were 19% higher than the prior quarter, driven by higher total cash costs per ounce1 combined with increased minesite sustaining capital expenditures1.
Capital expenditures in the first quarter of 2023 were 33% higher than the prior quarter, mainly due to higher minesite sustaining capital expenditures1. Minesite sustaining capital expenditures1 were 86% higher compared to the prior quarter mainly due to down payments related to the replacement of the open pit haulage fleet. Project capital expenditures were 25% lower than the prior quarter as Goldrush equipment deliveries and power infrastructure projects were completed in the prior quarter.
Q1 2023 compared to Q1 2022
Cortez’s income for the three month period ended March 31, 2023 was 15% lower than the same prior year period, primarily due to a higher cost of sales per ounce2, partially offset by higher sales volume and a higher realized gold price1.
Gold production for the three month period ended March 31, 2023 was 22% higher than the same prior year period, primarily driven by higher oxide mill and heap leach
production from the Crossroads open pit and higher underground production, slightly offset by lower refractory production from the Pipeline open pit.
Total tonnes mined were 14% lower compared to the same prior year period, driven by lower open pit tonnes mined mainly due to the impact of record snow levels during the winter and lower haul truck availability, slightly offset by improved underground performance. Open pit ore tonnes and grade mined were 34% higher and 19% lower, respectively, compared to the same prior year period driven by mine plan sequencing at Crossroads and the development of Cortez Pits, offset slightly by the completion of high grade Pipeline Phase 10 ore mined in the first half of 2022. Underground tonnes mined increased by 7% over the same prior year period, primarily driven by Cortez Hills and increased development activity at Goldrush underground.
Cost of sales per ounce2 and total cash costs per ounce1 for the three month period ended March 31, 2023 were 19% and 16% higher than the same prior year period, respectively, impacted by higher input costs driven by energy and consumables prices, which more than offset the impact of higher sales volumes. For the three month period ended March 31, 2023, all-in sustaining costs per ounce1 increased by 7% compared to the same prior year period, driven by higher total cash costs per ounce1, partially offset by a decrease in minesite sustaining capital expenditures1 on a per ounce basis.
Capital expenditures for the three month period ended March 31, 2023 increased by 6% from the same prior year period, due to higher project capital expenditures1, while minesite sustaining capital expenditures remained consistent with the prior year period. Project capital expenditures1 were 25% higher than the same prior year period due to increased capital development at Goldrush underground.
| BARRICK FIRST QUARTER 2023 | 21 | MANAGEMENT’S DISCUSSION AND ANALYSIS |
| OVERVIEW | OPERATING PERFORMANCE | GROWTH PROJECTS & EXPLORATION | REVIEW OF FINANCIAL RESULTS |
OTHER INFORMATION & NON-GAAP RECONCILIATIONS
| FINANCIAL STATEMENTS |
Turquoise Ridge (61.5%), Nevada, USA
Summary of Operating and Financial Data
| For the three months ended | ||||||||||||||||||||
| 3/31/23 | 12/31/22 | % Change | 3/31/22 | % Change | ||||||||||||||||
Total tonnes mined (000s) | 233 | 366 | (36)% | 211 | 10 % | |||||||||||||||
Open pit ore | 0 | 107 | (100)% | 0 | 0 % | |||||||||||||||
Open pit waste | 0 | 4 | (100)% | 0 | 0 % | |||||||||||||||
Underground | 233 | 255 | (9)% | 211 | 10 % | |||||||||||||||
Average grade (grams/tonne) | ||||||||||||||||||||
Open pit mined | n/a | 1.04 | n/a | n/a | n/a | |||||||||||||||
Underground mined | 10.08 | 11.90 | (15)% | 11.87 | (15)% | |||||||||||||||
Processed | 3.84 | 4.89 | (21)% | 4.65 | (17)% | |||||||||||||||
Ore tonnes processed (000s) | 729 | 602 | 21 % | 539 | 35 % | |||||||||||||||
Oxide Mill | 101 | 64 | 58 % | 93 | 9 % | |||||||||||||||
Autoclave | 628 | 492 | 28 % | 446 | 41 % | |||||||||||||||
Heap leach | 0 | 46 | (100)% | 0 | 0 % | |||||||||||||||
Recovery rate | 83 % | 84 % | (1)% | 79 % | 5 % | |||||||||||||||
Oxide Mill | 87 % | 88 % | (1)% | 79 % | 10 % | |||||||||||||||
Autoclave | 82 % | 84 % | (2)% | 79 % | 4 % | |||||||||||||||
Gold produced (000s oz) | 81 | 78 | 4 % | 67 | 21 % | |||||||||||||||
Oxide Mill | 3 | 3 | 0 % | 3 | 0 % | |||||||||||||||
Autoclave | 77 | 75 | 3 % | 62 | 24 % | |||||||||||||||
Heap leach | 1 | 0 | 100 % | 2 | (50)% | |||||||||||||||
Gold sold (000s oz) | 82 | 74 | 11 % | 64 | 28 % | |||||||||||||||
Revenue ($ millions) | 156 | 130 | 20 % | 120 | 30 % | |||||||||||||||
Cost of sales ($ millions) | 116 | 112 | 4 % | 92 | 26 % | |||||||||||||||
Income ($ millions) | 40 | 17 | 135 % | 28 | 43 % | |||||||||||||||
EBITDA ($ millions)a | 71 | 49 | 45 % | 54 | 31 % | |||||||||||||||
EBITDA marginb | 46 % | 38 % | 21 % | 45 % | 2 % | |||||||||||||||
Capital expenditures ($ millions) | 21 | 23 | (9)% | 22 | (5)% | |||||||||||||||
Minesite sustaininga | 18 | 15 | 20 % | 16 | 13 % | |||||||||||||||
Projecta | 3 | 8 | (63)% | 6 | (50)% | |||||||||||||||
Cost of sales ($/oz) | 1,412 | 1,518 | (7)% | 1,436 | (2)% | |||||||||||||||
Total cash costs ($/oz)a | 1,034 | 1,089 | (5)% | 1,030 | 0 % | |||||||||||||||
All-in sustaining costs ($/oz)a | 1,271 | 1,304 | (3)% | 1,281 | (1)% | |||||||||||||||
All-in costs ($/oz)a | 1,306 | 1,424 | (8)% | 1,376 | (5)% | |||||||||||||||
| a. | Further information on these non-GAAP financial measures, including detailed reconciliations, is included on pages 54 to 67 of this MD&A. |
| b. | Represents EBITDA divided by revenue. |
Safety and Environment
| For the three months ended | ||||||||
| 3/31/23 | 12/31/22 | |||||||
LTI | 1 | 1 | ||||||
LTIFR3 | 1.62 | 1.39 | ||||||
TRIFR3 | 4.87 | 5.56 | ||||||
Class 14 environmental incidents | 0 | 0 | ||||||
Financial Results
Q1 2023 compared to Q4 2022
Turquoise Ridge’s income for the first quarter of 2023 was 135% higher than the prior quarter due to higher sales volume, a lower cost of sales per ounce2 and a higher realized gold price1.
Gold production in the first quarter of 2023 was 4% higher than the prior quarter, mainly due to improved performance of the Sage autoclave, partially offset by a reduction in ore tonnes mined as per the mine plan. Gold
sales in the first quarter of 2023 benefited from a drawdown in finished gold inventory produced in the prior quarter.
Total tonnes mined were 36% lower than the prior quarter as mining of remnant ore from the Vista open pit was completed in the prior quarter, combined with lower tonnes mined from Vista underground in the current quarter. Underground tonnes and grade mined decreased 9% and 15%, respectively, compared to the prior quarter as per the mine sequence, combined with mining delays at Vista underground related to water management.
Cost of sales per ounce2 and total cash costs per ounce1 in the first quarter of 2023 were 7% and 5% lower, respectively, than the prior quarter, primarily due to higher sales volumes combined with lower energy and autoclave maintenance costs. All-in sustaining costs per ounce1 were 3% lower than the prior quarter, primarily reflecting lower total cash costs per ounce1, largely offset by higher minesite sustaining capital expenditures1.
Capital expenditures in the first quarter of 2023 were 9% lower than the prior quarter. Project capital
| BARRICK FIRST QUARTER 2023 | 22 | MANAGEMENT’S DISCUSSION AND ANALYSIS |
| OVERVIEW | OPERATING PERFORMANCE | GROWTH PROJECTS & EXPLORATION | REVIEW OF FINANCIAL RESULTS |
OTHER INFORMATION & NON-GAAP RECONCILIATIONS
| FINANCIAL STATEMENTS |
expenditures1 at the Third Shaft were 63% lower due to the commissioning of this shaft in the prior quarter whereas in the current quarter, activity focused mainly on the construction of surface infrastructure. Minesite sustaining capital expenditures1 were 20% higher than the prior quarter due to increased underground development per the mine plan.
Q1 2023 compared to Q1 2022
Turquoise Ridge’s income for the first quarter of 2023 was 43% higher than the same prior year period due to higher sales volumes, a lower cost of sales per ounce2, and a higher realized gold price1.
Gold production for the three month period ended March 31, 2023 was 21% higher than the same prior year period, primarily due to higher throughput and efficiency improvements at the Sage autoclave. In addition, Turquoise Ridge underground tonnes mined improved significantly following the commissioning of the Third Shaft in the fourth quarter of 2022.
Total tonnes mined were 10% higher relative to the same prior year period driven by the commissioning of the Third Shaft, which improved ventilation and hoisting capacity at Turquoise Ridge underground, partially offset by lower Vista underground tonnes as mining was delayed related to water management. Underground grades mined decreased 15% compared to the prior quarter as per the mine plan.
Cost of sales per ounce2 and total cash costs per ounce1 for the three month period ended March 31, 2023 were in line with the same prior year period with the benefit of higher sales volumes largely offset by higher input costs driven primarily by energy and consumables prices. All-in sustaining costs per ounce1 were also in line with the same prior year period.
Capital expenditures for the three month period ended March 31, 2023 were in line with the same prior year period, with lower project capital largely offset by slightly higher underground development as per the mine plan.
| BARRICK FIRST QUARTER 2023 | 23 | MANAGEMENT’S DISCUSSION AND ANALYSIS |
| OVERVIEW | OPERATING PERFORMANCE | GROWTH PROJECTS & EXPLORATION | REVIEW OF FINANCIAL RESULTS |
OTHER INFORMATION & NON-GAAP RECONCILIATIONS
| FINANCIAL STATEMENTS |
Other Mines - Nevada Gold Mines
Summary of Operating and Financial Data
| For the three months ended | ||||||||||||||||||||||||||||||||||||||||
| 3/31/23 | 12/31/22 | |||||||||||||||||||||||||||||||||||||||
| Gold produced (000s oz) | Cost of sales ($/oz) | Total cash ($/oz)a | All-in oz)a | Capital Expend- ituresb | Gold produced (000s oz) | Cost of sales ($/oz) | Total cash ($/oz)a | All-in ($/oz)a | Capital Expend- ituresb | |||||||||||||||||||||||||||||||
Phoenix (61.5%) | 27 | 2,380 | 1,198 | 1,365 | 3 | 30 | 1,901 | 946 | 1,037 | 2 | ||||||||||||||||||||||||||||||
Long Canyon (61.5%) | 2 | 1,621 | 579 | 629 | 0 | 3 | 1,812 | 616 | 664 | 0 | ||||||||||||||||||||||||||||||
| a. | Further information on these non-GAAP financial measures, including detailed reconciliations, is included on pages 54 to 67 of this MD&A. |
| b. | Includes both minesite sustaining and project capital expenditures1. |
Phoenix (61.5%)
Gold production for Phoenix in the first quarter of 2023 was 10% lower compared to the prior quarter, mainly driven by lower grades and recovery related to ore chemistry. Recovery is expected to improve through the remainder of 2023.
Cost of sales per ounce2 and total cash costs per ounce1 in the first quarter of 2023 were 25% and 27% higher, respectively, than the prior quarter mainly due to the impact of lower sales volumes, partially offset by a reduction in energy prices. In the first quarter of 2023, all-in sustaining costs per ounce1 increased by 32% compared to the prior quarter due to higher minesite sustaining capital expenditures1 combined with higher total cash costs per ounce1.
Capital expenditures for the three month period ended March 31, 2023 were 50% higher compared to the prior quarter due to increased capitalized drilling.
Long Canyon (61.5%)
Mining of Phase 1 was completed in May 2022 and residual leaching commenced thereafter. We continue to work on optimizing the asset’s mine life extension, including permitting activities.
| BARRICK FIRST QUARTER 2023 | 24 | MANAGEMENT’S DISCUSSION AND ANALYSIS |
| OVERVIEW | OPERATING PERFORMANCE | GROWTH PROJECTS & EXPLORATION | REVIEW OF FINANCIAL RESULTS |
OTHER INFORMATION & NON-GAAP RECONCILIATIONS
| FINANCIAL STATEMENTS |
Pueblo Viejo (60% basis)a, Dominican Republic
Summary of Operating and Financial Data
| For the three months ended | ||||||||||||||||||||
| 3/31/23 | 12/31/22 | % Change | 3/31/22 | % Change | ||||||||||||||||
Open pit tonnes mined (000s) | 5,651 | 5,235 | 8 % | 4,318 | 31 % | |||||||||||||||
Open pit ore | 2,342 | 2,427 | (4)% | 1,199 | 95 % | |||||||||||||||
Open pit waste | 3,309 | 2,808 | 18 % | 3,119 | 6 % | |||||||||||||||
Average grade (grams/tonne) | ||||||||||||||||||||
Open pit mined | 1.85 | 1.82 | 2 % | 2.46 | (25)% | |||||||||||||||
Processed | 2.22 | 2.43 | (9)% | 2.47 | (10)% | |||||||||||||||
Autoclave ore tonnes processed (000s) | 1,377 | 1,353 | 2 % | 1,511 | (9)% | |||||||||||||||
Recovery rate | 89 % | 92 % | (3)% | 87 % | 2 % | |||||||||||||||
Gold produced (000s oz) | 89 | 98 | (9)% | 104 | (14)% | |||||||||||||||
Gold sold (000s oz) | 90 | 96 | (6)% | 104 | (13)% | |||||||||||||||
Revenue ($ millions) | 175 | 173 | 1 % | 203 | (14)% | |||||||||||||||
Cost of sales ($ millions) | 112 | 116 | (3)% | 112 | 0 % | |||||||||||||||
Income ($ millions) | 61 | 47 | 30 % | 89 | (31)% | |||||||||||||||
EBITDA ($ millions)b | 100 | 83 | 20 % | 124 | (19)% | |||||||||||||||
EBITDA marginc | 57 % | 48 % | 19 % | 61 % | (7)% | |||||||||||||||
Capital expenditures ($ millions) | 68 | 95 | (28)% | 73 | (7)% | |||||||||||||||
Minesite sustainingb | 31 | 28 | 11 % | 26 | 19 % | |||||||||||||||
Projectb | 37 | 67 | (45)% | 47 | (21)% | |||||||||||||||
Cost of sales ($/oz) | 1,241 | 1,215 | 2 % | 1,077 | 15 % | |||||||||||||||
Total cash costs ($/oz)b | 714 | 764 | (7)% | 682 | 5 % | |||||||||||||||
All-in sustaining costs ($/oz)b | 1,073 | 1,065 | 1 % | 948 | 13 % | |||||||||||||||
All-in costs ($/oz)b | 1,481 | 1,757 | (16)% | 1,401 | 6 % | |||||||||||||||
| a. | Barrick is the operator of Pueblo Viejo and owns 60%, with Newmont Corporation owning the remaining 40%. Pueblo Viejo is accounted for as a subsidiary with a 40% non-controlling interest. The results in the table and the discussion that follows are based on our 60% share only. |
| b. | Further information on these non-GAAP financial measures, including detailed reconciliations, is included on pages 54 to 67 of this MD&A. |
| c. | Represents EBITDA divided by revenue. |
Safety and Environment
| For the three months ended | ||||||||
| 3/31/23 | 12/31/22 | |||||||
LTI | 0 | 0 | ||||||
LTIFR3 | 0.00 | 0.00 | ||||||
TRIFR3 | 0.96 | 0.50 | ||||||
Class 14 environmental incidents | 0 | 0 | ||||||
Financial Results
Q1 2023 compared to Q4 2022
Pueblo Viejo’s income for the first quarter of 2023 was 30% higher than the prior quarter, mainly due to a higher realized gold price1, partially offset by a higher cost of sales per ounce2 and lower sales volumes.
Gold production in the first quarter of 2023 was 9% lower than the prior quarter, mainly due to lower grades processed, and lower recovery.
Cost of sales per ounce2 for the first quarter of 2023 was 2% higher compared to the prior quarter. This was driven by higher depreciation expense, partially offset by lower total cash costs per ounce1. Total cash costs per ounce1 was 7% lower compared to the prior quarter as a result of lower natural gas prices and higher margins achieved from third-party energy sales at the Quisqueya power plant. For the first quarter of 2023, all-in sustaining costs per ounce1 were 1% higher than the prior quarter, mainly due to higher minesite sustaining capital expenditures1, partially offset by lower total cash costs per ounce1.
Capital expenditures for the first quarter of 2023 decreased by 28% compared to the prior quarter, primarily due to lower project capital expenditures1 from the plant expansion driven by timing of spend. This was partially offset by higher minesite sustaining capital expenditures1 due to the purchase of new mining equipment and mobile equipment components.
Q1 2023 compared to Q1 2022
Pueblo Viejo’s income for the first quarter of 2023 was 31% lower than the same prior year period, driven by a higher costs of sales per ounce2 and lower sales volumes.
Gold production for the three month period ended March 31, 2023 was 14% lower than the same prior year period due to lower grades processed, in line with the mine plan, as well as lower throughput. These impacts were partially offset by higher recovery.
Cost of sales per ounce2 and total cash costs per ounce1 for the three month period ended March 31, 2023 were 15% and 5% higher, respectively, than the same prior year period. This was mainly due to higher input costs driven by higher blasting expense, the impact of lower grades processed, as well as higher mobile equipment maintenance expense. Cost of sales per ounce2 was also impacted by higher depreciation expense. For the three month period ended March 31, 2023, all-in sustaining costs per ounce1 were 13% higher than the same prior year period due to higher minesite sustaining capital expenditures1 and higher total cash costs per ounce1.
| BARRICK FIRST QUARTER 2023 | 25 | MANAGEMENT’S DISCUSSION AND ANALYSIS |
| OVERVIEW | OPERATING PERFORMANCE | GROWTH PROJECTS & EXPLORATION | REVIEW OF FINANCIAL RESULTS |
OTHER INFORMATION & NON-GAAP RECONCILIATIONS
| FINANCIAL STATEMENTS |
Capital expenditures for the three month period ended March 31, 2023 decreased by 7% compared to the same prior year period, primarily due to lower project capital expenditures1 incurred on the plant expansion driven by timing of spend. This was partially offset by higher minesite sustaining capital expenditures1 driven by the Llagal TSF and the purchase of new mining equipment.
| BARRICK FIRST QUARTER 2023 | 26 | MANAGEMENT’S DISCUSSION AND ANALYSIS |
| OVERVIEW | OPERATING PERFORMANCE | GROWTH PROJECTS & EXPLORATION | REVIEW OF FINANCIAL RESULTS |
OTHER INFORMATION & NON-GAAP RECONCILIATIONS
| FINANCIAL STATEMENTS |
Loulo-Gounkoto (80% basis)a, Mali
Summary of Operating and Financial Data
| For the three months ended | ||||||||||||||||||||
| 3/31/23 | 12/31/22 | % Change | 3/31/22 | % Change | ||||||||||||||||
Total tonnes mined (000s) | 8,370 | 6,417 | 30 % | 9,325 | (10)% | |||||||||||||||
Open pit ore | 125 | 927 | (87)% | 735 | (83)% | |||||||||||||||
Open pit waste | 7,399 | 4,653 | 59 % | 7,797 | (5)% | |||||||||||||||
Underground | 846 | 837 | 1 % | 793 | 7 % | |||||||||||||||
Average grade (grams/tonne) | ||||||||||||||||||||
Open pit mined | 2.22 | 2.68 | (17)% | 1.73 | 28 % | |||||||||||||||
Underground mined | 5.62 | 4.56 | 23 % | 4.91 | 14 % | |||||||||||||||
Processed | 4.69 | 4.58 | 2 % | 4.74 | (1)% | |||||||||||||||
Ore tonnes processed (000s) | 1,006 | 1,041 | (3)% | 995 | 1 % | |||||||||||||||
Recovery rate | 91 % | 91 % | 0 % | 91 % | 0 % | |||||||||||||||
Gold produced (000s oz) | 137 | 139 | (1)% | 138 | (1)% | |||||||||||||||
Gold sold (000s oz) | 134 | 141 | (5)% | 137 | (2)% | |||||||||||||||
Revenue ($ millions) | 257 | 245 | 5 % | 258 | 0 % | |||||||||||||||
Cost of sales ($ millions) | 171 | 170 | 1 % | 149 | 15 % | |||||||||||||||
Income ($ millions) | 85 | 70 | 21 % | 106 | (20)% | |||||||||||||||
EBITDA ($ millions)b | 141 | 125 | 13 % | 156 | (10)% | |||||||||||||||
EBITDA marginc | 55 % | 51 % | 8 % | 60 % | (8)% | |||||||||||||||
Capital expenditures ($ millions) | 83 | 76 | 9 % | 51 | 63 % | |||||||||||||||
Minesite sustainingb | 43 | 36 | 19 % | 33 | 30 % | |||||||||||||||
Projectb | 40 | 40 | 0 % | 18 | 122 % | |||||||||||||||
Cost of sales ($/oz) | 1,275 | 1,216 | 5 % | 1,088 | 17 % | |||||||||||||||
Total cash costs ($/oz)b | 855 | 822 | 4 % | 721 | 19 % | |||||||||||||||
All-in sustaining costs ($/oz)b | 1,190 | 1,102 | 8 % | 982 | 21 % | |||||||||||||||
All-in costs ($/oz)b | 1,485 | 1,386 | 7 % | 1,110 | 34 % | |||||||||||||||
| a. | Barrick owns 80% of Société des Mines de Loulo SA and Société des Mines de Gounkoto with the Republic of Mali owning 20%. Loulo-Gounkoto is accounted for as a subsidiary with a 20% non-controlling interest on the basis that Barrick controls the asset. The results in the table and the discussion that follows are based on our 80% share, inclusive of the impact of the purchase price allocation resulting from the merger with Randgold. |
| b. | Further information on these non-GAAP financial measures, including detailed reconciliations, is included on pages 54 to 67 of this MD&A. |
| c. | Represents EBITDA divided by revenue. |
Safety and Environment
| For the three months ended | ||||||||
| 3/31/23 | 12/31/22 | |||||||
LTI | 0 | 1 | ||||||
LTIFR3 | 0.00 | 0.22 | ||||||
TRIFR3 | 0.52 | 0.65 | ||||||
Class 14 environmental incidents | 0 | 0 | ||||||
Financial Results
Q1 2023 compared to Q4 2022
Loulo-Gounkoto’s income for the first quarter of 2023 was 21% higher than the prior quarter mainly due to a higher realized gold price1, partially offset by lower sales volumes and a higher cost of sales per ounce2.
Gold production for the first quarter of 2023 was 1% lower than the prior quarter mainly due to lower tonnes processed, partially offset by slightly higher grades, in line with the mine plan.
Cost of sales per ounce2 and total cash costs per ounce1 for the first quarter of 2023 were 5% and 4% higher, respectively, than the prior quarter, mainly due to a higher strip ratio and increased development in the underground. For the first quarter of 2023, all-in sustaining costs per ounce1 were 8% higher than the prior quarter, mainly due to
higher total cash costs per ounce1, combined with increased minesite sustaining capital expenditures1.
Capital expenditures for the first quarter of 2023 increased by 9% compared to the prior quarter, mainly driven by higher minesite sustaining capital expenditures1, while project capital expenditures1 were in line with the prior quarter. The increase in minesite sustaining capital expenditures1 was due to higher capitalized stripping at the Gounkoto and Gara West open pits.
Q1 2023 compared to Q1 2022
Loulo-Gounkoto’s income for the first quarter of 2023 was 20% lower than the same prior year period, primarily due to a higher cost of sales per ounce2 and lower sales volumes, partially offset by a higher realized gold price1.
Gold production for the three month period ended March 31, 2023 was 1% lower compared to the same prior year period, mainly due to slightly lower grades processed, in line with the mine plan.
Cost of sales per ounce2 and total cash costs per ounce1 for the first quarter of 2023 were 17% and 19% higher, respectively, than the same prior year period mainly due to the impact of higher input costs driven primarily by energy and consumable prices. For the first quarter of 2023, all-in sustaining costs per ounce1 increased by 21% compared to the same prior year period, reflecting the
| BARRICK FIRST QUARTER 2023 | 27 | MANAGEMENT’S DISCUSSION AND ANALYSIS |
| OVERVIEW | OPERATING PERFORMANCE | GROWTH PROJECTS & EXPLORATION | REVIEW OF FINANCIAL RESULTS |
OTHER INFORMATION & NON-GAAP RECONCILIATIONS
| FINANCIAL STATEMENTS |
increase in total cash costs per ounce1 and higher minesite sustaining capital expenditures1.
Capital expenditures for the three month period ended March 31, 2023 increased by 63% compared to the same prior year period, driven by both higher project capital expenditures1 and minesite sustaining capital expenditures1. The increase in project capital expenditures1 was driven by the Loulo-Gounkoto solar plant expansion project. Higher minesite sustaining capital expenditures1 was a result of increased capitalized stripping at the Gounkoto and Gara West open pits.
In August 2022, the Government of Mali announced that it would conduct an audit of the Malian gold mining industry, including the Loulo-Gounkoto complex. Since that time, Barrick has engaged with the government-appointed auditors and hosted the auditors at Loulo-Gounkoto for a site visit in November 2022. On April 20, 2023, Barrick received a report containing the auditors’ preliminary findings. Barrick is currently reviewing that report and will respond to the auditors in due course.
| BARRICK FIRST QUARTER 2023 | 28 | MANAGEMENT’S DISCUSSION AND ANALYSIS |
| OVERVIEW | OPERATING PERFORMANCE | GROWTH PROJECTS & EXPLORATION | REVIEW OF FINANCIAL RESULTS |
OTHER INFORMATION & NON-GAAP RECONCILIATIONS
| FINANCIAL STATEMENTS |
Kibali (45% basis)a, Democratic Republic of Congo
Summary of Operating and Financial Data
| For the three months ended | ||||||||||||||||||||
| 3/31/23 | 12/31/22 | % Change | 3/31/22 | % Change | ||||||||||||||||
Total tonnes mined (000s) | 4,902 | 4,820 | 2 % | 3,806 | 29 % | |||||||||||||||
Open pit ore | 640 | 1,028 | (38)% | 376 | 70 % | |||||||||||||||
Open pit waste | 3,882 | 3,367 | 15 % | 3,079 | 26 % | |||||||||||||||
Underground | 380 | 425 | (11)% | 351 | 8 % | |||||||||||||||
Average grade (grams/tonne) | ||||||||||||||||||||
Open pit mined | 1.42 | 1.67 | (15)% | 1.43 | (1)% | |||||||||||||||
Underground mined | 4.35 | 5.70 | (24)% | 5.88 | (26)% | |||||||||||||||
Processed | 2.55 | 3.56 | (28)% | 3.37 | (24)% | |||||||||||||||
Ore tonnes processed (000s) | 880 | 954 | (8)% | 781 | 13 % | |||||||||||||||
Recovery rate | 88 % | 89 % | (1)% | 89 % | (1)% | |||||||||||||||
Gold produced (000s oz) | 64 | 97 | (34)% | 76 | (16)% | |||||||||||||||
Gold sold (000s oz) | 67 | 94 | (29)% | 73 | (8)% | |||||||||||||||
Revenue ($ millions) | 127 | 164 | (23)% | 137 | (7)% | |||||||||||||||
Cost of sales ($ millions) | 91 | 149 | (39)% | 83 | 10 % | |||||||||||||||
Income ($ millions) | 33 | 7 | 371 % | 41 | (20)% | |||||||||||||||
EBITDA ($ millions)b | 58 | 97 | (40)% | 69 | (16)% | |||||||||||||||
EBITDA marginc | 46 % | 59 % | (22)% | 50 % | (8)% | |||||||||||||||
Capital expenditures ($ millions) | 19 | 35 | (46)% | 19 | 0 % | |||||||||||||||
Minesite sustainingb | 12 | 28 | (57)% | 15 | (20)% | |||||||||||||||
Projectb | 7 | 7 | 0 % | 4 | 75 % | |||||||||||||||
Cost of sales ($/oz) | 1,367 | 1,570 | (13)% | 1,137 | 20 % | |||||||||||||||
Total cash costs ($/oz)b | 987 | 617 | 60 % | 744 | 33 % | |||||||||||||||
All-in sustaining costs ($/oz)b | 1,177 | 981 | 20 % | 996 | 18 % | |||||||||||||||
All-in costs ($/oz)b | 1,289 | 1,044 | 23 % | 1,045 | 23 % | |||||||||||||||
| a. | Barrick owns 45% of Kibali Goldmines SA with the DRC and our joint venture partner, AngloGold Ashanti, owning 10% and 45%, respectively. The figures presented in this table and the discussion that follows are based on our 45% effective interest in Kibali Goldmines SA held through our 50% interest in Kibali (Jersey) Limited and its other subsidiaries (collectively “Kibali”), inclusive of the impact of the purchase price allocation resulting from the merger with Randgold. Kibali is accounted for as an equity method investment on the basis that the joint venture partners that have joint control have rights to the net assets of the joint venture. |
| b. | Further information on these non-GAAP financial measures, including detailed reconciliations, is included on pages 54 to 67 of this MD&A. |
| c. | Represents EBITDA divided by revenue. |
Safety and Environment
| For the three months ended | ||||||||
| 3/31/23 | 12/31/22 | |||||||
LTI | 0 | 0 | ||||||
LTIFR3 | 0 | 0 | ||||||
TRIFR3 | 2.10 | 0.47 | ||||||
Class 14 environmental incidents | 0 | 0 | ||||||
Financial Results
Q1 2023 compared to Q4 2022
Kibali’s income for the first quarter of 2023 was 371% higher than the prior quarter due to a higher realized gold price1 and lower cost of sales ounce2, partially offset by lower sales volumes.
Gold production in the first quarter of 2023 was 34% lower than the prior quarter, mainly due to lower grades processed following a transition in underground mining fronts and the latest pushback of the Tete Bakangwe pit, as well as lower throughput following a planned mill shutdown. Kibali’s near-term focus remains on advancing development to increase underground flexibility to improve grades starting in the second quarter of 2023.
Cost of sales per ounce2 for the first quarter of 2023 was 13% lower due to a decrease in depreciation
expense, partially offset by higher total cash costs per ounce1. Total cash costs per ounce1 was 60% higher mainly due to the impact of lower grades, higher maintenance expense related to both a planned mill shutdown and the underground, partially offset by lower energy costs. For the first quarter of 2023, all-in sustaining costs per ounce1 was 20% higher compared to the prior quarter, mainly due to higher total cash costs per ounce2, partially offset by lower minesite sustaining capital expenditures1.
Capital expenditures for the three month period ended March 31, 2023 were 46% lower compared to the prior quarter, mainly due to lower minesite sustaining capital expenditures1 following the initial deposits on the replacement of the underground mining fleet in the prior quarter.
Q1 2023 compared to Q1 2022
Kibali’s income for the three month period ended March 31, 2023 was 20% lower than the same prior year period, driven by lower sales volumes and a higher cost of sales per ounce2, partially offset by a higher realized gold price1.
Gold production for the three month period ended March 31, 2023 was 16% lower than the same prior year quarter, mainly due to lower grades processed following a
| BARRICK FIRST QUARTER 2023 | 29 | MANAGEMENT’S DISCUSSION AND ANALYSIS |
| OVERVIEW | OPERATING PERFORMANCE | GROWTH PROJECTS & EXPLORATION | REVIEW OF FINANCIAL RESULTS |
OTHER INFORMATION & NON-GAAP RECONCILIATIONS
| FINANCIAL STATEMENTS |
transition in underground mining fronts and the latest pushback of the Tete Bakangwe pit, partially offset by higher tonnes processed.
Cost of sales per ounce2 and total cash costs per ounce1 for the three month period ended March 31, 2023 were 20% and 33% higher, respectively, than the same prior year period, mainly due to lower grades processed. Cost of sales per ounce2 was also impacted by lower depreciation expense in the current period. For the three month period ended March 31, 2023, all-in sustaining costs per ounce1 were 18% higher than the same prior year period, driven by higher total cash costs per ounce1, partially offset by lower minesite sustaining capital expenditures1.
Capital expenditures for the three month period ended March 31, 2023 were in line with the same prior year period, mainly due to lower minesite sustaining capital expenditures1 due to the timing of equipment orders and deliveries. This was partially offset by an increase in project capital expenditures1 related to a successful exploration drilling campaign which commenced in early 2023, as well as our investments in the Kalimva/Ikamva and Pamao open pit projects.
| BARRICK FIRST QUARTER 2023 | 30 | MANAGEMENT’S DISCUSSION AND ANALYSIS |
| OVERVIEW | OPERATING PERFORMANCE | GROWTH PROJECTS & EXPLORATION | REVIEW OF FINANCIAL RESULTS |
OTHER INFORMATION & NON-GAAP RECONCILIATIONS
| FINANCIAL STATEMENTS |
North Mara (84% basis)a, Tanzania
Summary of Operating and Financial Data
| For the three months ended | ||||||||||||||||||||
| 3/31/23 | 12/31/22 | % Change | 3/31/22 | % Change | ||||||||||||||||
Total tonnes mined (000s) | 3,525 | 3,493 | 1 % | 1,412 | 150 % | |||||||||||||||
Open pit ore | 469 | 1,117 | (58)% | 709 | (34)% | |||||||||||||||
Open pit waste | 2,691 | 1,992 | 35 % | 379 | 610 % | |||||||||||||||
Underground | 365 | 384 | (5)% | 324 | 13 % | |||||||||||||||
Average grade (grams/tonne) | ||||||||||||||||||||
Open pit mined | 2.07 | 2.00 | 3 % | 2.13 | (3)% | |||||||||||||||
Underground mined | 3.40 | 3.54 | (4)% | 5.84 | (42)% | |||||||||||||||
Processed | 3.25 | 3.37 | (4)% | 3.31 | (2)% | |||||||||||||||
Ore tonnes processed (000s) | 716 | 717 | 0 % | 598 | 20 % | |||||||||||||||
Recovery rate | 92 % | 92 % | 0 % | 88 % | 5 % | |||||||||||||||
Gold produced (000s oz) | 68 | 70 | (3)% | 56 | 22 % | |||||||||||||||
Gold sold (000s oz) | 70 | 70 | 0 % | 58 | 21 % | |||||||||||||||
Revenue ($ millions) | 133 | 123 | 8 % | 110 | 21 % | |||||||||||||||
Cost of sales ($ millions) | 70 | 72 | (3)% | 50 | 40 % | |||||||||||||||
Income ($ millions) | 47 | 25 | 88 % | 58 | (19)% | |||||||||||||||
EBITDA ($ millions)b | 63 | 43 | 47 % | 66 | (5)% | |||||||||||||||
EBITDA marginc | 47 % | 35 % | 34 % | 60 % | (22)% | |||||||||||||||
Capital expenditures ($ millions) | 35 | 51 | (31)% | 18 | 94 % | |||||||||||||||
Minesite sustainingb | 25 | 36 | (31)% | 7 | 257 % | |||||||||||||||
Projectb | 10 | 15 | (33)% | 11 | (9)% | |||||||||||||||
Cost of sales ($/oz) | 987 | 1,030 | (4)% | 852 | 16 % | |||||||||||||||
Total cash costs ($/oz)b | 759 | 758 | 0 % | 709 | 7 % | |||||||||||||||
All-in sustaining costs ($/oz)b | 1,137 | 1,301 | (13)% | 874 | 30 % | |||||||||||||||
All-in costs ($/oz)b | 1,278 | 1,519 | (16)% | 1,057 | 21 % | |||||||||||||||
| a. | Barrick owns 84% of North Mara, with the GoT owning 16%. North Mara is accounted for as a subsidiary with a 16% non-controlling interest on the basis that Barrick controls the asset. The results in the table and the discussion that follows are based on our 84% share. |
| b. | Further information on these non-GAAP financial measures, including detailed reconciliations, is included on pages 54 to 67 of this MD&A. |
| c. | Represents EBITDA divided by revenue. |
Safety and Environment
| For the three months ended | ||||||||
| 3/31/23 | 12/31/22 | |||||||
LTI | 1 | 0 | ||||||
LTIFR3 | 0.42 | 0 | ||||||
TRIFR3 | 0.83 | 0.85 | ||||||
Class 14 environmental incidents | 0 | 0 | ||||||
Financial Results
Q1 2023 compared to Q4 2022
North Mara’s income for the first quarter of 2023 was 88% higher than the prior quarter mainly due to a higher realized gold price1 and lower cost of sales per ounce2. North Mara’s income was partially offset by the $30 million commitment we made (shared equally between North Mara and Bulyanhulu) towards the expansion of education infrastructure in Tanzania, per our community investment obligations under the Twiga partnership.
In the first quarter of 2023, production was 3% lower than the prior quarter. This was mainly due to slightly lower grade processed as we transitioned to open pit ore from Gena, in line with the mine plan. Gold sold was in line with the prior quarter.
Cost of sales per ounce2 was 4% lower than the prior quarter due to lower depreciation expense. Total cash costs per ounce1 was in line with the prior quarter as the
impact of lower grades processed was offset by higher capitalized stripping associated with the ongoing ramp up of open pit mining at Gena. All-in sustaining costs per ounce1 in the first quarter of 2023 was 13% lower than the prior quarter, mainly due to lower minesite sustaining capital expenditures1.
Capital expenditures in the first quarter of 2023 were 31% lower than the prior quarter due to both lower minesite sustaining capital expenditures1 and project capital expenditures1. Lower minesite capital expenditures1 were mainly due to the procurement of key underground mining equipment occurring in the prior quarter. The decrease in project capital expenditures1 was mainly driven by the timeline related to the ramp-up of open pit operations and land acquisitions, which is expected to increase over the next two quarters.
Q1 2023 compared to Q1 2022
North Mara’s income for the three month period ending March 31, 2023 was 19% lower than the same prior year period, mainly due to the $30 million commitment we made (shared equally between North Mara and Bulyanhulu) towards the expansion of education infrastructure in Tanzania, per our community investment obligations under the Twiga partnership. This was further impacted by higher cost of sales per ounce2, partially offset by higher sales volumes and a higher realized gold price1.
| BARRICK FIRST QUARTER 2023 | 31 | MANAGEMENT’S DISCUSSION AND ANALYSIS |
| OVERVIEW | OPERATING PERFORMANCE | GROWTH PROJECTS & EXPLORATION | REVIEW OF FINANCIAL RESULTS |
OTHER INFORMATION & NON-GAAP RECONCILIATIONS
| FINANCIAL STATEMENTS |
Gold production for the three month period ended March 31, 2023 was 22% higher than the same prior year period. This was mainly due to higher throughput driven by improved mill availability and higher recovery. The average grade processed was slightly lower compared to the same prior year period.
Cost of sales per ounce2 and total cash costs per ounce1 were 16% and 7% higher, respectively, compared to the same prior year period due to the sales mix between open pit and underground operations as we transitioned to open pit mining at Gena, combined with the blending of higher-cost underground stockpiles, in line with the mine plan. Cost of sales per ounce2 was further impacted by
higher depreciation expense. All-in sustaining costs per ounce1 in the first quarter of 2023 was 30% higher than the same prior year period, mainly due to higher minesite sustaining capital expenditures1, combined with the higher total cash cost per ounce1 as described above.
For the three month period ending March 31, 2023, capital expenditures increased by 94% compared to the same prior year period, mainly due to higher minesite sustaining capital expenditures1 related to capitalized stripping at Gena and the underground fleet, while project capital expenditures1 remained relatively consistent with the same prior year period.
| BARRICK FIRST QUARTER 2023 | 32 | MANAGEMENT’S DISCUSSION AND ANALYSIS |
| OVERVIEW | OPERATING PERFORMANCE | GROWTH PROJECTS & EXPLORATION | REVIEW OF FINANCIAL RESULTS |
OTHER INFORMATION & NON-GAAP RECONCILIATIONS
| FINANCIAL STATEMENTS |
Bulyanhulu (84% basis)a, Tanzania
Summary of Operating and Financial Data
| For the three months ended | ||||||||||||||||||||
| 3/31/23 | 12/31/22 | % Change | 3/31/22 | % Change | ||||||||||||||||
Underground tonnes mined (000s) | 285 | �� | 290 | (2)% | 231 | 23 % | ||||||||||||||
Average grade (grams/tonne) | ||||||||||||||||||||
Underground mined | 6.97 | 7.07 | (1)% | 8.25 | (15)% | |||||||||||||||
Processed | 7.39 | 7.19 | 3 % | 7.76 | (5)% | |||||||||||||||
Ore tonnes processed (000s) | 195 | 223 | (13)% | 193 | 1 % | |||||||||||||||
Recovery rate | 95 % | 94 % | 1 % | 92 % | 3 % | |||||||||||||||
Gold produced (000s oz) | 44 | 49 | (10)% | 45 | (2)% | |||||||||||||||
Gold sold (000s oz) | 46 | 49 | (6)% | 55 | (16)% | |||||||||||||||
Revenue ($ millions) | 93 | 91 | 2 % | 110 | (15)% | |||||||||||||||
Cost of sales ($ millions) | 62 | 60 | 3 % | 66 | (6)% | |||||||||||||||
Income ($ millions) | 17 | 13 | 31 % | 43 | (60)% | |||||||||||||||
EBITDA ($ millions)b | 30 | 25 | 20 % | 57 | (47)% | |||||||||||||||
EBITDA marginc | 32 % | 27 % | 19 % | 52 % | (38)% | |||||||||||||||
Capital expenditures ($ millions) | 20 | 29 | (31)% | 11 | 82 % | |||||||||||||||
Minesite sustainingb | 16 | 23 | (30)% | 7 | 129 % | |||||||||||||||
Projectb | 4 | 6 | (33)% | 4 | 0 % | |||||||||||||||
Cost of sales ($/oz) | 1,358 | 1,237 | 10 % | 1,216 | 12 % | |||||||||||||||
Total cash costs ($/oz)b | 982 | 896 | 10 % | 847 | 16 % | |||||||||||||||
All-in sustaining costs ($/oz)b | 1,332 | 1,401 | (5)% | 984 | 35 % | |||||||||||||||
All-in costs ($/oz)b | 1,423 | 1,536 | (7)% | 1,052 | 35 % | |||||||||||||||
| a. | Barrick owns 84% of Bulyanhulu, with the GoT owning 16%. Bulyanhulu is accounted for as a subsidiary with a 16% non-controlling interest on the basis that Barrick controls the asset. The results in the table and the discussion that follows are based on our 84% share. |
| b. | Further information on these non-GAAP financial measures, including detailed reconciliations, is included on pages 54 to 67 of this MD&A. |
| c. | Represents EBITDA divided by revenue. |
Safety and Environment
| For the three months ended | ||||||||
| 3/31/23 | 12/31/22 | |||||||
LTI | 0 | 2 | ||||||
LTIFR3 | 0.00 | 1.20 | ||||||
TRIFR3 | 3.77 | 1.20 | ||||||
Class 14 environmental incidents | 0 | 0 | ||||||
Financial Results
Q1 2023 compared to Q4 2022
Bulyanhulu’s income for the first quarter of 2023 was 31% higher than the prior quarter, mainly due to a higher realized gold price1, partially offset by a higher cost of sales per ounce2 and lower sales volumes. This was further impacted by the $30 million commitment we made (shared equally between North Mara and Bulyanhulu) towards the expansion of education infrastructure in Tanzania, per our community investment obligations under the Twiga partnership.
In the first quarter of 2023, production was 10% lower than the prior quarter, primarily due to lower tonnes processed, as development activity and increased stripping to secure access to future mining fronts was a focus in the current quarter, in line with the mine plan.
Cost of sales per ounce2 and total cash costs per ounce1 in the first quarter of 2023 were both 10% higher than the prior quarter, driven by the lower tonnes processed as described above. This was partially offset by improvement in both grades processed and recovery. All-in sustaining costs per ounce1 in the first quarter of 2023 were
5% lower than the prior quarter, mainly due to lower minesite sustaining capital expenditures1, partially offset by higher total cash costs per ounce1.
Capital expenditures in the first quarter of 2023 were 31% lower than the prior quarter, mainly due to a decrease in minesite sustaining capital expenditures1 as the prior quarter included a higher spend on additional underground mining fleet.
Q1 2023 compared to Q1 2022
Bulyanhulu’s income for the three month period ending March 31, 2023 was 60% lower than the same prior year period, mainly due to lower sales volumes, higher cost of sales per ounce2, partially offset by a higher realized gold price1. This was further impacted by the $30 million commitment we made (shared equally between North Mara and Bulyanhulu) towards the expansion of education infrastructure in Tanzania, per our community investment obligations under the Twiga partnership.
For the three month period ended March 31, 2023, production was 2% lower than the same prior year period driven by lower grades processed, in line with the mine sequence. This was partially offset by higher recovery.
Cost of sales per ounce2 and total cash costs1 per ounce for the three month period ending March 31, 2023 were 12% and 16% higher, respectively, than the same prior year period. This was mainly due to lower grades processed and higher development activity, combined with lower copper by-product credits. These impacts were partially offset by cost efficiencies from improved mining rates and stronger recoveries. All-in sustaining costs per
| BARRICK FIRST QUARTER 2023 | 33 | MANAGEMENT’S DISCUSSION AND ANALYSIS |
| OVERVIEW | OPERATING PERFORMANCE | GROWTH PROJECTS & EXPLORATION | REVIEW OF FINANCIAL RESULTS |
OTHER INFORMATION & NON-GAAP RECONCILIATIONS
| FINANCIAL STATEMENTS |
ounce1 in the first quarter of 2023 was 35% higher than the same prior year period, mainly due to higher minesite sustaining capital expenditures1 and higher total cash costs per ounce1.
For the three month period ending March 31, 2023, capital expenditures were 82% higher than the same prior year period, mainly due to higher minesite sustaining capital expenditures1 related to the investment in new underground fleet as well as the automation of operations to support an increase in mining development rates.
| BARRICK FIRST QUARTER 2023 | 34 | MANAGEMENT’S DISCUSSION AND ANALYSIS |
| OVERVIEW | OPERATING PERFORMANCE | GROWTH PROJECTS & EXPLORATION | REVIEW OF FINANCIAL RESULTS |
OTHER INFORMATION & NON-GAAP RECONCILIATIONS
| FINANCIAL STATEMENTS |
Other Mines - Gold
Summary of Operating and Financial Data
| For the three months ended | ||||||||||||||||||||||||||||||||||||||||
| 3/31/23 | 12/31/22 | |||||||||||||||||||||||||||||||||||||||
Gold produced (000s oz) | Cost of sales ($/oz) | Total cash costs ($/oz)a | All-in sustaining costs ($/oz)a | Capital Expend- ituresb | Gold produced (000s oz) | Cost of ($/oz) | Total cash costs ($/oz)a | All-in sustaining costs ($/oz)a | Capital Expend- ituresb | |||||||||||||||||||||||||||||||
Veladero (50%) | 43 | 1,587 | 1,035 | 1,761 | 36 | 50 | 2,309 | 954 | 1,526 | 39 | ||||||||||||||||||||||||||||||
Tongon (89.7%) | 50 | 1,453 | 1,182 | 1,284 | 4 | 63 | 1,381 | 1,070 | 1,404 | 18 | ||||||||||||||||||||||||||||||
Hemlo | 41 | 1,486 | 1,291 | 1,609 | 12 | 38 | 1,451 | 1,227 | 1,557 | 12 | ||||||||||||||||||||||||||||||
Porgerac (47.5%) | — | — | — | — | — | — | — | — | — | — | ||||||||||||||||||||||||||||||
| a. | Further information on these non-GAAP financial measures, including detailed reconciliations, is included on pages 54 to 67 of this MD&A. |
| b. | Includes both minesite sustaining and project capital expenditures1. |
| c. | As Porgera was placed on care and maintenance on April 25, 2020, no operating data or per ounce data is provided. |
Veladero (50% basis), Argentina
Gold production for Veladero in the first quarter of 2023 was 14% lower than the prior quarter mainly due to lower grades and tonnes processed, in line with the mine plan. Cost of sales per ounce2 in the first quarter of 2023 decreased by 31% compared to the prior quarter following a net realizable value impairment of leach pad inventory in the fourth quarter of 2022. Total cash costs per ounce1 were 8% higher than the prior quarter, primarily driven by lower ounces produced and sold. All-in sustaining costs per ounce1 in the first quarter of 2023 increased by 15%, reflecting the increase in total cash costs per ounce1 and higher minesite sustaining capital expenditures1 due to increased capitalized drilling.
Tongon (89.7% basis), Côte d’Ivoire
Gold production for Tongon in the first quarter of 2023 was 21% lower than the prior quarter mainly due to lower grades and tonnes processed, in line with the mine plan. Cost of sales per ounce2 and total cash costs per ounce1 in the first quarter of 2023 were 5% and 10% higher, respectively, than the prior quarter, primarily driven by the impact of lower grades, combined with increased stripping. All-in sustaining costs per ounce1 in the first quarter of 2023 decreased by 9%, reflecting lower minesite sustaining capital expenditures1, partially offset by higher total cash costs per ounce1.
Hemlo, Ontario, Canada
Gold production in the first quarter of 2023 was 8% higher than the prior quarter due to improved underground productivity resulting in higher ore tonnes mined and processed, combined with higher grades processed. Cost of sales per ounce2 and total cash costs per ounce1 in the first quarter of 2023 increased by 2% and 5% compared to the prior quarter, respectively, primarily due to higher royalties from mining in underground zones that incur a higher royalty burden. In the first quarter of 2023, all-in sustaining costs per ounce1 increased by 3% compared to the prior quarter, primarily reflecting higher total cash costs per ounce1.
Porgera (47.5% basis), Papua New Guinea
On April 9, 2021, BNL signed a binding Framework Agreement with the Independent State of PNG and Kumul Minerals, a state-owned mining company, setting out the terms and conditions for the reopening of the Porgera mine. On February 3, 2022, the Framework Agreement was replaced by the Commencement Agreement. The Commencement Agreement was signed by PNG, Kumul
Minerals, BNL and its affiliate Porgera (Jersey) Limited on October 15, 2021, and it became effective on February 3, 2022, following signature by MRE, the holder of the remaining 5% of the original Porgera joint venture. The Commencement Agreement reflects the commercial terms previously agreed to under the Framework Agreement, namely that PNG stakeholders will receive a 51% equity stake in the Porgera mine, with the remaining 49% to be held by BNL or an affiliate. BNL is jointly owned on a 50/50 basis by Barrick and Zijin Mining Group. Accordingly, following the implementation of the Commencement Agreement, Barrick’s current 47.5% interest in the Porgera mine is expected to be reduced to a 24.5% interest as reflected in Barrick’s reserve and resource estimates for Porgera. BNL will retain operatorship of the mine. The Commencement Agreement also provides that PNG stakeholders and BNL and its affiliates will share the economic benefits derived from the reopened Porgera mine on a 53% and 47% basis over the remaining life of mine, respectively, and that the Government of PNG will retain the option to acquire BNL’s or its affiliate’s 49% equity participation at fair market value after 10 years.
On April 21, 2022, the PNG National Parliament passed legislation to provide, among other things, certain agreed tax exemptions and tax stability for the new Porgera joint venture. This legislation was certified on May 30, 2022. Six out of the seven pieces of legislation took effect as of April 11 and 14, 2023, respectively, when they were published in the National Gazette, as required under PNG Law. One individual act awaits publication to take effect.
On September 13, 2022, the Shareholders’ Agreement for the new Porgera joint venture company was executed by Porgera (Jersey) Limited, which is an affiliate of BNL, the state-owned Kumul Minerals (Porgera) Limited and MRE (a previous version of the Shareholders’ Agreement had been signed by the BNL and Kumul parties in April 2022 but was not signed by MRE and therefore did not take effect). New Porgera Limited, the new Porgera joint venture company, was incorporated on September 22, 2022, and this entity will next apply for a new SML, the receipt of which is a condition of the reopening of the Porgera mine under the Commencement Agreement.
On March 31, 2023, BNL, the Independent State of PNG and New Porgera Limited signed the New Porgera Progress Agreement whereby the parties reiterated their commitment to reopening the Porgera mine in line with the terms of the Commencement Agreement and the Shareholders’ Agreement. The provisions of the Commencement Agreement will be fully implemented, and work to recommence full mine operations at Porgera will
| BARRICK FIRST QUARTER 2023 | 35 | MANAGEMENT’S DISCUSSION AND ANALYSIS |
| OVERVIEW | OPERATING PERFORMANCE | GROWTH PROJECTS & EXPLORATION | REVIEW OF FINANCIAL RESULTS |
OTHER INFORMATION & NON-GAAP RECONCILIATIONS
| FINANCIAL STATEMENTS |
begin, following the execution of the remaining definitive agreements and satisfaction of a number of conditions. These include an Operatorship Agreement pursuant to which BNL will operate the Porgera mine, as well as a Mine Development Contract to accompany the new SML that the new Porgera joint venture company will apply for. Under the terms of the Commencement Agreement, BNL will remain in possession of the site and maintain the mine on care and maintenance.
Porgera was excluded from our 2023 guidance. We expect to update our guidance following both the execution of all of the definitive agreements to implement the binding Commencement Agreement and the finalization of a timeline for the resumption of full mine operations. Refer to notes 12 and 16 to the Financial Statements for more information.
| BARRICK FIRST QUARTER 2023 | 36 | MANAGEMENT’S DISCUSSION AND ANALYSIS |
| OVERVIEW | OPERATING PERFORMANCE | GROWTH PROJECTS & EXPLORATION | REVIEW OF FINANCIAL RESULTS |
OTHER INFORMATION & NON-GAAP RECONCILIATIONS
| FINANCIAL STATEMENTS |
Lumwana, Zambia
Summary of Operating and Financial Data
| For the three months ended | ||||||||||||||||||||
| 3/31/23 | 12/31/22 | % Change | 3/31/22 | % Change | ||||||||||||||||
Open pit tonnes mined (000s) | 17,178 | 24,048 | (29)% | 18,645 | (8)% | |||||||||||||||
Open pit ore | 4,568 | 3,868 | 18 % | 4,566 | 0 % | |||||||||||||||
Open pit waste | 12,610 | 20,180 | (38)% | 14,079 | (10)% | |||||||||||||||
Average grade | ||||||||||||||||||||
Open pit mined | 0.38 % | 0.53 % | (28)% | 0.53 % | (28)% | |||||||||||||||
Processed | 0.38 % | 0.43 % | (12)% | 0.48 % | (21)% | |||||||||||||||
Tonnes processed (000s) | 6,523 | 6,162 | 6 % | 5,785 | 13 % | |||||||||||||||
Recovery rate | 87 % | 90 % | (3)% | 94 % | (7)% | |||||||||||||||
Copper produced (millions of pounds) | 48 | 53 | (9)% | 57 | (15)% | |||||||||||||||
Copper sold (millions of pounds) | 49 | 55 | (11)% | 70 | (30)% | |||||||||||||||
Revenue ($ millions) | 171 | 170 | 1 % | 287 | (40)% | |||||||||||||||
Cost of sales ($ millions) | 174 | 197 | (12)% | 154 | 13 % | |||||||||||||||
Income (loss) ($ millions) | (12) | (35) | (66)% | 133 | (109)% | |||||||||||||||
EBITDA ($ millions)a | 32 | 57 | (44)% | 171 | (81)% | |||||||||||||||
EBITDA marginb | 19 % | 34 % | (44)% | 60 % | (68)% | |||||||||||||||
Capital expenditures ($ millions) | 52 | 163 | (68)% | 57 | (9)% | |||||||||||||||
Minesite sustaininga | 26 | 118 | (78)% | 57 | (54)% | |||||||||||||||
Projecta | 26 | 45 | (42)% | 0 | 100 % | |||||||||||||||
Cost of sales ($/lb) | 3.56 | 3.56 | 0 % | 2.20 | 62 % | |||||||||||||||
C1 cash costs ($/lb)a | 3.09 | 2.34 | 32 % | 1.86 | 66 % | |||||||||||||||
All-in sustaining costs ($/lb)a | 3.98 | 4.86 | (18)% | 3.16 | 26 % | |||||||||||||||
All-in costs ($/lb)a | 4.51 | 5.67 | (20)% | 3.16 | 43 % | |||||||||||||||
| a. | Further information on these non-GAAP financial measures, including detailed reconciliations, is included on pages 54 to 67 of this MD&A. |
| b. | Represents EBITDA divided by revenue. |
Safety and Environment
| For the three months ended | ||||||||
| 3/31/23 | 12/31/22 | |||||||
LTI | 0 | 0 | ||||||
LTIFR3 | 0.00 | 0.00 | ||||||
TRIFR3 | 0.00 | 0.34 | ||||||
Class 14 environmental incidents | 0 | 0 | ||||||
Financial Results
Q1 2023 compared to Q4 2022
Lumwana incurred a loss for the first quarter of 2023 of $12 million which compares to a loss of $35 million in the prior quarter. This was primarily due to a higher realized copper price1, partially offset by lower sales volumes. Cost of sales per pound2 was consistent with the prior quarter.
Copper production in the first quarter of 2023 was 9% lower than the prior quarter mainly due to lower grades processed, in line with the mine plan. This was driven by lower mining rates as the new fleet continued to ramp up, with lower grade benches sequenced for the first quarter of 2023. This was partially offset by higher tonnes processed.
Cost of sales per pound2 was in line with the prior quarter, as higher C1 cash costs per pound1 was offset by lower depreciation expense. C1 cash costs per pound1 in the first quarter of 2023 increased by 32% compared to the prior quarter, mainly driven by lower grades processed and lower capitalized stripping following the decision to move towards owner mining at the end of the fourth quarter of 2022. In the first quarter of 2023, all-in sustaining costs per
pound1 decreased by 18% compared to the prior quarter, primarily driven by lower minesite sustaining capital expenditures1, partially offset by an increase in C1 cash costs per pound1.
Capital expenditures were 68% lower compared to the prior quarter due to a decrease in both minesite sustaining1 and project capital expenditures1. Lower minesite sustaining capital expenditures1 of 78% were mainly due to lower capitalized stripping in the current quarter, and as down payments to secure construction assembly slots for replacement mobile equipment occurred in the prior quarter. Similarly, project capital expenditures1 decreased by 42% due to down payments made on the new owner mining fleet, as well as from capital on required infrastructure and conversion drilling to commence the Super Pit pre-feasibility study, which all occurred in the prior quarter.
Q1 2023 compared to Q1 2022
Lumwana’s income for the three month period ended March 31, 2023 was 109% lower compared to the same prior year period, driven by a lower realized copper price1, lower sales volumes and a higher cost of sales per pound2.
Copper production for the three month period ended March 31, 2023 was 15% lower than the same prior year period, mainly due to lower grades processed, in line with the mine plan. This was driven by lower mining rates as the new fleet continued to ramp up, with lower grade benches sequenced for the first quarter of 2023. This was
| BARRICK FIRST QUARTER 2023 | 37 | MANAGEMENT’S DISCUSSION AND ANALYSIS |
| OVERVIEW | OPERATING PERFORMANCE | GROWTH PROJECTS & EXPLORATION | REVIEW OF FINANCIAL RESULTS |
OTHER INFORMATION & NON-GAAP RECONCILIATIONS
| FINANCIAL STATEMENTS |
further impacted by lower recovery, partially offset by higher throughput.
Cost of sales per pound2 and C1 cash costs per pound1 for the three month period ended March 31, 2023 were 62% and 66% higher, respectively, compared to the same prior year period, mainly due to lower grades processed and lower capitalized stripping. For the three month period ended March 31, 2023, all-in sustaining costs per pound1 was 26% higher than the same prior year period as higher C1 cash costs per pound1 were offset by lower minesite sustaining capital expenditures2.
Capital expenditures for the three month period ended March 31, 2023 were 9% lower than the same prior year period, mainly due to lower minesite capital expenditures1 resulting from decreased capitalized stripping. This was partially offset by an increase in project capital expenditures1 relating to the investment in the new mining fleet.
Other Mines - Copper
Summary of Operating and Financial Data
| For the three months ended | ||||||||||||||||||||||||||||||||||||||||
| 3/31/23 | 12/31/22 | |||||||||||||||||||||||||||||||||||||||
Copper production (millions of pounds) | Cost of sales ($/lb) | C1 cash costs ($/lb)a | All-in sustaining costs ($/lb)a | Capital Expend- ituresb | Copper production (millions of pounds) | Cost of sales ($/lb) | C1 cash costs ($/lb)a | All-in sustaining costs ($/lb)a | Capital Expend- ituresb | |||||||||||||||||||||||||||||||
Zaldívar (50%) | 22 | 3.73 | 2.86 | 3.22 | 5 | 25 | 3.55 | 2.69 | 3.60 | 22 | ||||||||||||||||||||||||||||||
Jabal Sayid (50%) |
| 18 |
|
| 1.53 |
|
| 1.39 |
|
| 1.61 |
| 4 |
| 18 |
|
| 1.72 |
|
| 1.42 |
|
| 1.54 |
|
| 7 |
| ||||||||||||
| a. | Further information on these non-GAAP financial measures, including detailed reconciliations, is included on pages 54 to 67 of this MD&A. |
| b. | Includes both minesite sustaining and project capital expenditures1. |
Zaldívar (50% basis), Chile
Copper production for Zaldívar in the first quarter of 2023 was 12% lower compared to the prior quarter, primarily due to lower throughput. Cost of sales per pound2 and C1 cash costs per pound1 were 5% and 6% higher, respectively, than the prior quarter, mainly due to lower production and scheduled maintenance. All-in sustaining costs per pound1 in the first quarter of 2023 was 11% lower compared to the prior quarter, mainly due to lower minesite sustaining capital expenditure1 as several equipment and process facility projects were completed last year, partially offset by higher C1 cash costs per pound1.
Jabal Sayid (50% basis), Saudi Arabia
Jabal Sayid’s copper production in the first quarter of 2023 was in line with the prior quarter. Cost of sales per pound2 for the first quarter of 2023 decreased by 11% compared to the prior quarter, mainly due to lower depreciation expense. C1 cash costs per pound1 was largely in line with the prior quarter. All-in sustaining costs per pound1 in the first quarter of 2023 increased by 5% compared to the prior quarter, mainly due to higher lease payments for power generation on a per pound basis.
| BARRICK FIRST QUARTER 2023 | 38 | MANAGEMENT’S DISCUSSION AND ANALYSIS |
| OVERVIEW | OPERATING PERFORMANCE | GROWTH PROJECTS & EXPLORATION | REVIEW OF FINANCIAL RESULTS |
OTHER INFORMATION & NON-GAAP RECONCILIATIONS
| FINANCIAL STATEMENTS |
Growth Project Updates
Goldrush Project, Nevada, USA
The NOA briefing package on the Goldrush FEIS is currently under review by the BLM Regional Solicitor. After the Regional Solicitor’s review is complete, the NOA briefing package will then progress to the Federal BLM/DOI for review, ultimately leading to the NOA being published in the Federal Register. This milestone will commence the public comment period for the FEIS. As the timeline for the review of the NOA briefing package has been extended, we now expect the ROD to be issued in the second half of 2023. At this time, we do not expect any significant impact on our 2023 outlook. The potential impact, if any, on our outlook from 2024 onwards is currently being reviewed.
Mine development and test stoping has continued in the Redhill zone, where dewatering of the orebody is not required. Development also continues on exploration drifts above the Goldrush orebody to facilitate future underground drilling platforms. A minor modification to the Horse Canyon/Cortez Unified Exploration Project Plan of Operations has been approved to allow for an additional 635 thousand tonnes of Goldrush waste rock to be placed within the existing Horse Canyon Waste Rock Storage Facility. At this time, this additional allowance is sufficient to allow underground development to continue until the ROD on the Goldrush Plan of Operations is received.
The headcount at Goldrush has continued its gradual ramp-up with recruitment of experienced underground miners and mechanics remaining a key focus.
As at March 31, 2023, project spend was $349 million on a 100% basis (including $8 million in the first quarter of 2023) on the Goldrush project, inclusive of the exploration declines. This capital spent to date, together with the remaining expected pre-production capital (with planned commercial production commencing in 2026), is anticipated to be within the approximate $1 billion initial capital estimate for the Goldrush project (on a 100% basis).
NGM Solar Project, Nevada, USA
The TS Solar project is a 200 MW photovoltaic solar farm located adjacent to NGM’s TS Power Plant and interconnected with the existing plant transmission infrastructure. Upon completion, the project will supply renewable energy to NGM’s operations and is expected to reduce 254kt of CO2 equivalent emissions per annum, equating to an 8% reduction from NGM’s 2018 baseline.
In the first quarter of 2023, structural and civil detailed designs were finalized and electrical design progressed to 90% completion. Site civil preparations continued with array bulk earthworks, finished grading for priority array blocks, substation concrete foundation construction, and perimeter security fence installation. Improved roadways and material stockpile areas were established throughout the array to combat inclement weather challenges. Mechanical and electrical contractors were mobilized and began receiving foundation pile, tracker, and cable material deliveries. The generator step-up transformer was received on site and set at its final substation location. Survey layout is ongoing in preparation for foundation pile driving.
In the second quarter of 2023, project resources will continue to increase as civil earthworks and mechanical installation reach peak production. Module manufacturing
and delivery will begin in the second quarter and continue throughout the third quarter of 2023.
As at March 31, 2023, project spend was $89 million (including $25 million in the first quarter of 2023) out of an estimated capital cost of $290-310 million (100% basis).
Pueblo Viejo Expansion, Dominican Republic6
The Pueblo Viejo plant expansion and mine life extension project is designed to increase throughput to 14 million tonnes per annum, allowing the operation to maintain minimum average annual gold production of approximately 800,000 ounces after 2022 (100% basis).
Construction for the plant expansion is now 93% complete (up from 84% as at December 31, 2022). Steelwork and mechanical installation were 99% and 90% complete, respectively, at the end of the first quarter of 2023. Completion of piping and electrical installation progressed to 80% and 60%, respectively. Commissioning activities commenced in January 2023 and continue to progress as additional systems are completed. The new primary crusher and three of four Geho pumps are now operational and first ore has been processed through the crusher. During the second quarter of 2023, we expect to substantially complete the commissioning of the new plant infrastructure and commence the ramp-up phase.
The technical and social studies for additional tailings storage capacity continued to advance. Following the completion and submission of an ESIA on one of the site alternatives, Naranjo, in the fourth quarter of 2022, we continue to expect the Government of the Dominican Republic’s decision on the ESIA during the first half of 2023.
Geotechnical drilling and site investigation are ongoing and continue to support the feasibility study, due for completion in the second quarter of 2024. The pre-feasibility study was completed during the fourth quarter of 2022. This allowed us to add 6.5 million ounces of attributable proven and probable reserves, net of depletion, and extend the mine life beyond 20406,7.
As at March 31, 2023, total project spend was $889 million (including $61 million in the first quarter of 2023) on a 100% basis. As previously disclosed, the estimated capital cost of the plant expansion and mine life extension project is approximately $2.1 billion (on a 100% basis), which reflects the selected TSF site submitted under the ESIA.
Veladero Phase 7 Leach Pad, Argentina
In November 2021, the Board of Minera Andina del Sol approved the Phase 7A leach pad construction project with Phase 7B subsequently approved in the third quarter of 2022. Construction on both phases includes sub-drainage and monitoring, leak collection and recirculation, impermeabilization, as well as pregnant leaching solution collection. Additionally, the north channel will be extended along the leach pad facility.
Construction of Phase 7A was completed on budget at a cost of $81 million (100% basis). As previously disclosed, we have deferred Phase 7B construction, since we are ahead on the construction timeline and have sufficient stacking capacity for 2023 and into the second half of 2024. At this time, construction of Phase 7B is
| BARRICK FIRST QUARTER 2023 | 39 | MANAGEMENT’S DISCUSSION AND ANALYSIS |
| OVERVIEW | OPERATING PERFORMANCE | GROWTH PROJECTS & EXPLORATION | REVIEW OF FINANCIAL RESULTS |
OTHER INFORMATION & NON-GAAP RECONCILIATIONS
| FINANCIAL STATEMENTS |
planned to re-start in the fourth quarter of 2023 for completion in 2024.
Overall for Phase 7, as of March 31, 2023, project spend was $100 million (including $11 million in the first quarter of 2023) out of an estimated capital cost of $159 million (100% basis).
Reko Diq Project
On December 15, 2022, Barrick completed the reconstitution of the Reko Diq project in Pakistan’s Balochistan province. The completion of this transaction involved, among other things, the execution of all of the definitive agreements including the mineral agreement stabilizing the fiscal regime applicable to the project, as well as the grant of mining leases, an exploration license, and surface rights. This completed the process that began earlier in 2022 following the conclusion of a framework agreement among the Governments of Pakistan and Balochistan province, Barrick and Antofagasta plc, which provided a path for the development of the project under a reconstituted structure. The project, which was suspended in 2011 due to a dispute over the legality of its licensing process, hosts one of the world’s largest undeveloped open pit copper-gold porphyry deposits.
The reconstituted project is held 50% by Barrick and 50% by Pakistani stakeholders, comprising a 10% free-carried, non-contributing share held by the Provincial Government of Balochistan, an additional 15% held by a special purpose company owned by the Provincial Government of Balochistan and 25% owned by other federal state-owned enterprises. Barrick is the operator of the project. The key fiscal terms for Reko Diq are a 5% NSR payable to the Provincial Government of Balochistan, a 1% NSR final tax regime payable to the Government of Pakistan (subject to a 15-year exemption following commercial production), and a 0.5% NSR export processing zone surcharge.
Barrick has started a full update of the project’s 2010 feasibility and 2011 expansion pre-feasibility studies. The Reko Diq feasibility study update is expected to be completed by the end of 2024, with 2028 targeted for first production.
During the first quarter of 2023, the project team advanced the feasibility study update with progress on power, tailings and infrastructure assessments. Mobilization of personnel to site and the initial setup of site facilities commenced, with over 100 local jobs created during the period. The advanced social development commitments for the quarter were met with community programs being advanced at local communities. The Humai Primary School was re-started, taking 60 children into the first grade, 48% of which are female.
Loulo-Gounkoto Solar Project, Mali
The scope of this project is to design, supply and install a 40 MW (48 MW peak) photovoltaic solar farm with a 36 MVA battery energy storage system. Upon completion, we expect to realize a reduction of 23 million liters of fuel, which translates to a saving of approximately 63kt of CO2 equivalent emissions per annum. The project is designed to be implemented in two phases, each consisting of 20 MW (24 MW peak) and 22 MVA battery storage, with commissioning by the end of 2023 and end of 2024, respectively. Total project status is 62% complete (up from 47% as at December 31, 2022), with Phase 1 having
commissioned its first 10MW block. Piling work on Phase 2 is progressing ahead of schedule
As at March 31, 2023, project spend was $57 million (including $23 million in the first quarter of 2023) out of an expected capital cost of approximately $90 million (100% basis).
Jabal Sayid Lode 1, Saudi Arabia
The scope of this project is to develop and mine a new orebody, located less than a kilometer from the existing lode at Jabal Sayid, following the completion of a feasibility study that comfortably meets our investment criteria. The project design includes underground capital development as well as ventilation, paste plant and underground mining infrastructure upgrades with stoping to commence by mid 2023. The project is 67% complete (up from 49% as at December 31, 2022) with the raisebore development and equipping completed together with the cyclone cluster installation. Focus is on the expansion of the paste plant to accommodate higher volumes and continuous paste delivery through pumping. A reagent plant and additional flotation cells installation will provide flexibility in dealing with the higher zinc content from this sulfide orebody.
As at March 31, 2023, project spend was $33 million (including $6 million in the first quarter of 2023) out of an estimated capital cost of approximately $40 million (100% basis).
Lumwana New Mobile Equipment, Zambia
During the fourth quarter of 2022, we began a transition to an owner-miner fleet for waste stripping at Lumwana following a study which concluded that this option could result in a 20% cost reduction within the first five years versus contracted services. Separately, this strategy positions the operation well for future potential expansions including the Super Pit, which has the potential to extend Lumwana’s life into the 2060s.
With the transition, Lumwana will invest in a new fleet initially dedicated to waste stripping. During 2022, we placed the initial deposits on the new mining fleet to secure production assembly slots, with first deliveries received at the beginning of 2023. This owner-miner transition is being executed concurrently with the Super Pit pre-feasibility study, which commenced in the fourth quarter of 2022.
As at March 31, 2023, project spend was $58 million (including $26 million in the first quarter of 2023) out of an estimated capital cost of approximately $115 million.
| BARRICK FIRST QUARTER 2023 | 40 | MANAGEMENT’S DISCUSSION AND ANALYSIS |
| OVERVIEW | OPERATING PERFORMANCE | GROWTH PROJECTS & EXPLORATION | REVIEW OF FINANCIAL RESULTS |
OTHER INFORMATION & NON-GAAP RECONCILIATIONS
| FINANCIAL STATEMENTS |
Exploration and Mineral Resource Management
The foundation of our exploration strategy is a deep organizational understanding that discovery through exploration is a long-term investment and the main value driver for our business - not a process. Our exploration strategy has multiple elements that all need to be in balance to deliver on Barrick’s business plan for growth and long-term sustainability.
First, we seek to deliver projects of a short- to medium-term nature that will drive improvements in mine plans. Second, we seek to make new discoveries that add to Barrick’s Tier One Gold Asset5 portfolio. Third, we work to optimize the value of our major undeveloped projects and finally, we seek to identify emerging opportunities early in their value chain and secure them by an earn-in or outright acquisition, where appropriate.
The following section summarizes the exploration results from the first quarter of 2023.
North America
Carlin, Nevada, USA8,9,10
Drilling at Fallon (North Leeville) continues to expand the mineralization footprint to the south along the footwall of the Basin Bounding and Four Corners faults. Drilling in the first quarter of 2023 also extended high-grade mineralization east, along identified mineralized intersections of low angle thrusts and high angle upgrading structures. New results from NLX-22020A returning 30.6 meters TW at 7.75 g/t Au as well as 10.0 meters TW at 7.13 g/t increase confidence in continuity of mineralization hosted within the footwall of the prospective Veld fault. Along the same mineralized trend, drilling to the south at Miramar (North Turf) returned NTC-22003 (24.6 meters TW at 23.97 g/t Au), NTC-22044 (36.3 meters TW at 12.37 g/t Au), and NTC-22047A (28.5 meters TW at 12.49 g/t Au). Together, with the previously reported NTC-22025 (54.5 meters TW at 13.20 g/t Au), results have extended Veld mineralization for over 640 meters in strike length between Fallon and Miramar. Drilling also continues to highlight the eastern extents of the Miramar orebody, with results from NTC-22015 (32.4 meters TW at 9.22 g/t Au) confirming the continuity of grade in the footwall of the Merlin fault, which can be traced over 800 meters northwest to Fallon.
Further to the west in the Little Boulder Basin, follow up drilling at the Golden Egg target has intersected several hundred meters of brecciation and intense alteration of the full section of carbonate rocks, an encouraging indication of proximity to mineralized breccia. Assay results will be returned during the second quarter of 2023. Additional follow-up is in progress targeting a northeast trending antiform.
At Ren, the final results from the 2022 underground program are expected to add to the existing resource base and continue to increase our understanding of the low-angle controls on mineralization within the sheared package of the Devonian Rodeo Creek. Results include 12.7 meters TW at 34.94 g/t Au in MRC-22008, extending the resource south of the eastern JB Zone. The 2023 surface step-out exploration program aimed at extending the known mineralization in the Corona Corridor further to the north and northeast will start in the second quarter of 2023.
Cortez, Nevada, USA11
At the Hanson Footwall target, drilling has extended the mineralization to approximately 400 meters strike length with CMX-22023 (23.8 meters at 6.00 g/t Au), and CMX-22026 (6.6 meters at 12.71 g/t Au and 19.6 meters at 11.67 g/t Au). 2023 drilling has started to infill these framework results, as well as to extend the footprint of the mineralization, which is located just below the existing Cortez Hills underground infrastructure.
Following the maiden mineral reserve declaration at the end of 2022, drilling across Robertson in 2023 will focus on expanding the existing pit designs and infill drilling.
Fourmile, Nevada, USA
As reported for the end of 2022, exploration targeting of the Dorothy area, 800 meters north of the existing Fourmile resource, intersected the most continuous zones of high-grade mineralization to date at the emerging discovery. Follow up plans are well advanced, and will begin as field conditions allow during the second quarter of 2023. Open-ended, high-grade mineralization will be targeted along a newly recognized mineral controlling cross structure, the Palisade fault. Additional testing is planned to further delineate the limits of Dorothy along the Anna corridor south to Sophia, as well as extending the framework understanding further to the north, west and at depth.
Turquoise Ridge, Nevada, USA12
At Turquoise Ridge, drilling continues to confirm the upside potential along the Getchell fault corridor where the recent drill intercepts of 4.9 meters (3.9 meters TW) at 6.75 g/t and 17.8 meters (14.0 meters TW) at 12.05 g/t from TSM-22103 and, 1.4 meters at 18.00 g/t and 3.9 meters at 5.21 g/t from TSM-22115, together with the previously reported 2.2 meters (2.0 meters TW) at 15.66 g/t, 6.2 meters (5.6 meters TW) at 6.14 g/t and 3.0 meters (2.7 meters TW) at 10.82 g/t from TSM-22109 have extended the potential mineralization over a strike length of 500 meters.
At Fenceline, exploration continues within the poorly explored DZ fault corridor southwest of the Twin Creeks Mega Pit. As previously highlighted, RC drilling through cover has defined a 5 kilometer anomaly along the southwest projection of this significant gold-controlling structure at the Mega deposit of the legacy Twin Creeks property. Framework core drilling was initiated during the first quarter of 2023 to better understand the controls to the anomalism, the geometry of the host stratigraphy, as well as a test of the inferred DZ fault to the south. While assay results are still pending, the initial hole has encountered alteration and elevated geochemistry along the projected fault, within favorable host rocks.
Exploration within Mega Pit continues to highlight the potential for a high-grade, feeder-type target at depth below the deposit. Framework drilling along the deposit has confirmed the presence of feeder-like alteration and mineralization on the extensions of primary ore controlling structures and well below the elevation of historic drilling. At the targeted elevation, historic drilling is very limited and these widely spaced framework holes are providing critical insight to refining the geology and targeting at depth. Assays from the first quarter of 2023 are currently pending,
| BARRICK FIRST QUARTER 2023 | 41 | MANAGEMENT’S DISCUSSION AND ANALYSIS |
| OVERVIEW | OPERATING PERFORMANCE | GROWTH PROJECTS & EXPLORATION | REVIEW OF FINANCIAL RESULTS |
OTHER INFORMATION & NON-GAAP RECONCILIATIONS
| FINANCIAL STATEMENTS |
though a horizon of favorable alteration and host stratigraphy is consistent at depth across all deep drilling to date and will provide vectors for follow up drilling later in 2023.
Pearl String, Nevada, USA
The Pearl String property, located in the Walker Lane mineral belt of western Nevada, was acquired through an exploration agreement in the fourth quarter of 2022 with the opportunity to earn a 100% interest from the underlying claim holder. In addition to the acquired ground, Barrick staked a large claim block around the property encompassing approximately 80 square kilometers of prospective ground. The property consists of a volcanic-hosted high sulfidation epithermal system, outcropping to the east and mostly concealed under post-mineral pediment cover to the west. There are small windows of altered and gold-bearing volcanics exposed through this cover. Work to date on the property has included geologic mapping, rock and soil sampling and collection of gravity data to map the underlying basement rock. This data is being used to inform the initial phase of framework drilling on the project, expected to commence during the second quarter of 2023. The first phase of drilling aims to develop an understanding of the volcanic stratigraphy and identify the extents of alteration, and mineralization beneath post-mineral cover to help vector targeted drilling later in 2023.
Hemlo, Canada
Drilling continued to extend the down plunge extent of the mineralization at both C-Zone Deep and Lower C-Zone West confirming the updated targeting model where we expect to add to existing reserves.
At the Pic project to the west of Hemlo, 5,000 meters of historic core was relogged to guide modelling and targeting. At Wire Lake, evidence of multiple alteration and mineralization events are observed. Although known mineralization is discontinuous, a coherent arsenic-antimony-potassium footprint defines the zone and is open at depth and along strike. Preparation for a soil survey spanning the area between Wire Lake and Porphyry Lake and a till survey over the Beggs Lake area is ongoing, which planned to commence as the field season allows.
Abitibi Belt, Canada
A binding term sheet was signed with Midland Exploration Inc. in April 2023 to earn-in up to 75% of the Patris property in the Southern Abitibi. The property straddles the La Pause fault, a crossover structure linking the Larder Lake – Cadillac Break and Porcupine-Destor Break, two of the most significantly endowed structures in North America.
Latin America & Asia-Pacific
Pueblo Viejo, Dominican Republic
Drilling at the Main Gate target in the first quarter of 2023 intersected favorable, near-surface hydrothermal alteration. However, overall results were weak. A full integration of legacy data from the nearby ARD1 target, which contains high-grade mineralization, with Main Gate is ongoing to better define the geological framework and potential of the area.
Following the completion of three scout drillholes in the Arroyo del Rey area, an integration of all Arroyo del Rey data with that of the nearby Cumba deposit is ongoing, aiming to better define follow-up drill targets. In parallel, geological mapping to the northwest of Arroyo del Rey has
identified an area with favorable alteration and breccia bodies. Fieldwork is ongoing.
At Pueblo Grande Norte, located to the west of Pueblo Viejo, detailed geological mapping, sampling and ground geophysics defined a significant copper-gold porphyry target, which will be drill tested in the third quarter of 2023.
Regional Exploration, Dominican Republic
In our regional exploration around Pueblo Viejo, early field work identified several events of hydrothermal activity. A large area (1.2 x 0.5 kilometers) shows favorable lithologies, alteration and geochemical anomalies. Follow-up field work to define the geological framework is ongoing.
Veladero District, Argentina13
Twenty diamond drill holes were completed in the first quarter of 2023 at Morro Escondido. The limits of the mineralized system to the west and east are well defined, while to the north and south, it remains open. DDH-MES-12 confirmed significant mineralization intersecting 43.3 meters at 1.17 g/t Au (including 12.8 meters at 3.18 g/t Au) from 5.3 meters depth, and 114.8 meters at 0.61 g/t Au (including 24 meters at 1.02 g/t Au) from 110.2 meters depth. DDH-MES-08 extended the hydrothermal system to the north below post-mineral colluvial cover, intersecting 82 meters at 0.35 g/t Au from 147 meters depth. DDH-MES-14 extended the hydrothermal system to the south intersecting 20 meters at 0.32 g/t Au from 77 meters depth. DDH-MES-11 confirmed mineralization in the southwest intersecting 15.7 meters at 0.63 g/t Au from 48.8 meters depth (including 1.4 meters at 2.58 g/t Au from 57.1 meters). Drilling continues, focusing on defining the limits of the mineralized system and understanding the mineralization controls and economical potential of Morro Escondido. The selection of samples to perform bottle roll metallurgical tests is underway, with column leach and gold deportment studies to be performed during the second and third quarters of 2023 to confirm the potential to process the Morro Escondido ore at Veladero.
Within the large Veladero Sur target (located 15 kilometers south of Veladero), geological mapping, sampling and ground geophysics defined a drill-ready target at the Casper high-sulfidation hydrothermal system. Twenty-eight kilometers of Controlled Source Audio Magneto Telluric ground geophysics defined high resistivity anomalies, which are continuous between sections. A diamond drilling program is ongoing.
The small proof-of-concept drill program continued at the Antenas-Chispas high-sulfidation target that sits immediately south of the current Veladero valley leach facility, with early observations confirming the presence of appropriate alteration to support the target concept. Drilling was paused during the current quarter as the MRM team prioritized Veladero in-pit drilling. Follow-up drilling of the Antenas-Chispas target will resume in the second quarter of 2023.
Drilling of the Lama targets continued during the first quarter of 2023 with one drill rig testing mineralization concepts at the Penelope South and West targets. Results of the Porfiada target drilling did not support a target of interest, and to prioritize drilling in the region, the second Lama rig was transferred to Morro Escondido.
| BARRICK FIRST QUARTER 2023 | 42 | MANAGEMENT’S DISCUSSION AND ANALYSIS |
| OVERVIEW | OPERATING PERFORMANCE | GROWTH PROJECTS & EXPLORATION | REVIEW OF FINANCIAL RESULTS |
OTHER INFORMATION & NON-GAAP RECONCILIATIONS
| FINANCIAL STATEMENTS |
El Indio Camp, Chile
In the El Indio district, drilling was initiated on the Sancarron target in Chile, with the concept of testing a structural connection between two outcropping alteration systems, that was buried by a landslide. The five-hole program was nearing completion at the end of the first quarter of 2023, with preliminary results supporting the structural corridor connector, but expectations are the systems do not have sufficient alteration, volume or continuity to be of interest for follow-up programs.
Peru
At Austral, following detailed mapping, sampling and ground geophysical surveys, five drill-ready targets were defined which are expected to be permitted and drill-tested by the fourth quarter of 2023.
Geological mapping, sampling and ground geophysical surveys are planned in two other high-priority districts in Peru.
Porgera, Papua New Guinea
As discussed on page 8, Porgera is currently on temporary care and maintenance and consequently, all exploration activities have ceased.
Japan Gold Strategic Alliance, Japan
Drilling commenced at the beginning of March 2023 at the Mizobe project in Southern Kyushu. The Mizobe project is located in the Hokusatu region along the western margin of the Kagoshima Graben in a similar geological setting as the Hishikari gold mine, which is located 23 kilometers to the north.
This first phase of framework drilling consists of widely spaced drill holes testing below the abundant post-mineral cover. They also target the concealed extensions of the known outcropping geochemical anomalies and gold bearing veins and breccias. Two holes have been completed to date and a third hole is currently underway.
Asia Pacific
The exploration team is currently focussing on reviewing and evaluating new exploration opportunities across the Asia Pacific region.
Africa and Middle East
Senegal, Exploration
On the Bambadji joint venture, an update to the geological interpretation highlighted a 26 kilometer prospective structural corridor subsequently named the BMSZ, hosted within the gold endowed Kofi series and exhibiting a near continuous auger gold anomaly. This corridor displays the geological features indicative of the potential to host a large orebody and is sparsely tested with mainly shallow drilling completed to date. Drill programs have started on the prioritized targets along the BMSZ to test for the presence of mineralized systems with standalone orebody potential. To the west of the BMSZ, a large 3D induced polarization geophysical survey has been completed over the approximately six kilometer Kabewest corridor to support more effective targeting of larger mineralized zones within the wider Kabewest system. Data is being processed and new opportunities from this survey will be prioritized for drill testing in the second quarter of 2023.
Target delineation programs on the Bambadji South permit have identified various styles of alteration in a wide range of lithologies, which are associated with
mineralization in other parts of the district. Early-stage indications of prospectivity are encouraging with the first lithosamples returning high grade results. Only surface exploration has been conducted on the permit and the maiden drill program is planned to be conducted in the second quarter of 2023.
On the Dalema joint venture, scout RC drilling was performed on the first set of priority targets. Initial geological observations are encouraging with alteration and sulphides intersected within porphyritic intrusives. Assay results are pending. Additionally, a dedicated mapping and sampling campaign has been initiated to improve the regional geological understanding of the prospective Faleme Domain, to deliver the next generation of priority targets.
Loulo-Gounkoto, Mali14
At Gara West, relogging and sampling of drill holes located 1.2 kilometers to the south of the high-grade intersection in GWDH002 previously reported, and in the periphery of the plunging fold axis, have confirmed the extension of the alteration and mineralization system with drill intersections such as 3.05 metres at 5.06 g/t (L0CP311). Additionally, a reanalysis of the wider Gara West corridor has highlighted multiple sparsely tested opportunities along strike supported by indications of ‘Gara West style’ alteration, anomalous lithosample results and open ‘ore-grade’ legacy drill intercepts. Drilling is planned for the second quarter of 2023 to progress several of the high priority targets in the corridor, in addition to the main Gara West opportunity.
Furthermore, a district wide initiative to review key structural corridors is in progress with the aim to identify the next generation of high impact targets with the potential to deliver the next large discovery. To aid effective target generation, a footprint and vectoring study has been initiated at the Yalea deposit using multi-element and spectral analysis of drill core samples to identify the distal signatures of the orebody. The final outcome is expected in the third quarter of 2023 and aims to provide additional exploration tools to prioritize and assess the key prospective corridors.
At Gounkoto, a geological model update is in progress with initial analysis confirming footwall structures as a control on high grade mineralization in the deposit. Relogging of key areas is underway to update the exploration model for targeting along strike and at depth below the current resource model, which is untested below 700 meters vertical depth. The review is expected to be completed by the end of the second quarter of 2023.
Kibali, Democratic Republic of Congo15
Framework drilling is in progress to generate high-impact targets northwest of KCD and build the geological model in the sparsely tested area between the KCD and Gorumbwa orebodies. Encouraging preliminary observations support a folded corridor parallel to KCD as targeted, with KCD style alteration, supporting the potential to identify large-scale extensions or new lodes within the world-class KCD system. Drilling will continue into the second quarter of 2023.
At Oere, an update to the geological model has indicated the zones of plunging high-grade mineralization to be controlled by changes in dip of the host structure, particularly where hosted in the banded iron formation. The improved model supports the possibility for a larger, high grade, mineralized zone below the current drilling and a program has been designed to test the potential for a
| BARRICK FIRST QUARTER 2023 | 43 | MANAGEMENT’S DISCUSSION AND ANALYSIS |
| OVERVIEW | OPERATING PERFORMANCE | GROWTH PROJECTS & EXPLORATION | REVIEW OF FINANCIAL RESULTS |
OTHER INFORMATION & NON-GAAP RECONCILIATIONS
| FINANCIAL STATEMENTS |
satellite underground opportunity that will be a key focus for the second quarter of 2023.
Two diamond holes have been drilled at Mengu Hill, to test for the continuity of high-grade mineralization down plunge of the previously mined open pit. Located 400 meters from the last step-out fence, the holes intersected both the geological units and hydrothermal alteration associated with the Mengu Hill main mineralized system over 800 meters up-plunge. Observations are supporting the potential for an underground satellite project, pending the success of additional step-out drill holes.
Drilling continued at Gorumbwa to test the underground potential below the pit. Results are showing strong alteration and mineralization and are confirming the economic potential down plunge.
Drilling has recommenced at Agbarabo-Rhino, testing for the continuation of multiple high-grade lenses across the width of the corridor. Four holes were completed during the quarter, with assay results from drillhole ADD025 supporting the continuation of multiple mineralized lenses between 300-meter spaced sections demonstrated by the intersections: 22.8 meters at 3.19 g/t Au (including 2.94 meters at 16.65 g/t), 18.4 meters at 5.82 g/t Au (including 4.4 meters at 18.16 g/t Au). Down plunge and lateral continuity of the Agbarabo main and lower lenses have been demonstrated, as well as the extension of Rhino lenses to the northwest under the Agbarabo system. Interim observations are indicating a mineralized system with the potential for a satellite opportunity, four kilometers from the plant.
North Mara and Bulyanhulu, Tanzania
At North Mara, preliminary assay results from the Gokona West framework drilling suggest an additional gold bearing ‘Gokona-style’ system has been identified. A broad low-grade anomaly coincident with intense Gokona-type alteration in comparable host rocks to Gokona was intersected below more than 100 meters of post mineralization cover. The newly identified system is located two kilometers northwest of Gokona, which highlights the exploration potential of the sparsely explored Gokona corridor that extends more than 20 kilometers along strike. Additional framework drill programs and relogging initiatives are in progress along the corridor, with an aim to identify new high priority targets in the second quarter of 2023.
The Gokona Deeps drilling program has continued to confirm our geological understanding and intersected mineralization below the currently defined mineralization wireframes. The results of this program are being reviewed in combination with the findings of an ongoing PhD research project on Gokona, which will aid additional targeting.
At Bulyanhulu, a drill program testing targets developed along the northwest extension of the system commenced. Although assay results are pending, the first hole to test the Reef 2F structure geologically validated the controls of a nearby high-grade historic intersection, supporting the potential of a near-mine, underexplored portion of the Reef 2 system, which will be progressed in the second quarter of 2023.
An airborne geophysical survey has commenced over the regional permits in the Tanzanian portfolio, aiming to improve the geological interpretations and ultimately generate the first high-potential exploration targets in a prospective and underexplored setting concealed beneath extensive transported cover.
Egypt, Regional Exploration
In Egypt, exploration screening programs are underway on the Hamash-Sukari, Fatiri and Atalla licenses, aiming to identify indications of mineralized systems with Tier One Gold Asset5 potential. At Hamash-Sukari, the largest of the three licenses, initial observations from the first phase exploration program have identified features that are indicative of elevated prospectivity, including fertile intrusives and a major, multi-kilometer, structural corridor associated with extensive alteration along extensional flexures. The current work programs are designed to generate the first set of prioritized targets for drill testing later in 2023.
Lumwana16
After reporting a maiden mineral resource from Kamisengo (formerly Lubwe) at the end of 2022 in support of the potential Super Pit expansion, drilling in the first quarter of 2023 continued to define the extents of the mineralization, and increase geological confidence in extensions immediately adjacent to the reported mineral resource. As part of the pre-feasibility study, social and environmental baseline studies have been initiated across Kamisengo, as well as a study to identify a location for a new tailings storage facility.
Phase 1 exploration drilling at Kamalamba was completed during the first quarter of 2023, with results from the six holes headlined by 11 meters at 0.77% Cu in KAMDD004 and 11 meters at 0.54% Cu in KAMDD0011. These results highlight the potential of the mineralized system to provide alternative higher-grade mill feed to support the potential Super Pit expansion. The mineralization is open to the northeast with planned follow-up in the second quarter of 2023.
Jabal Sayid, Kingdom of Saudi Arabia
At Jabal Sayid, a review of the project scale geological architecture has highlighted a significant strike length of elevated prospectivity along the paleosurface associated with the known lodes, as well as two newly identified palaeosurfaces. Trenching and lithogeochemical analyses are in progress with the aim to further refine the interpretation to support target prioritization in the second quarter of 2023.
At the Janob target, located one kilometer southwest of Lode 1, feeder-style mineralization has been extended to a 300 meter strike length comparable in orientation and extent to the Lode 4 East feeder zone. Integration of the latest geological observations, results from alteration analysis, and a planned geophysics program, will be integrated to support a drill program in the second quarter of 2023 to advance this target.
The full Exploration License for Umm ad Damar was received in March 2023, located 20 kilometers southeast of Jabal Sayid. Initial field programs have commenced, including preparations for ground geophysics surveys planned to be completed in the second quarter of 2023. Preliminary observations have delineated more extensive prospective felsic volcanic stratigraphy than previously interpreted, as well as strong alteration footprints proximal to the known prospects, which are on palaeosurfaces interpreted to be the fault-offset continuity of the prospective stratigraphy from Jabal Sayid.
| BARRICK FIRST QUARTER 2023 | 44 | MANAGEMENT’S DISCUSSION AND ANALYSIS |
| OVERVIEW | OPERATING PERFORMANCE | GROWTH PROJECTS & EXPLORATION | REVIEW OF FINANCIAL RESULTS |
OTHER INFORMATION & NON-GAAP RECONCILIATIONS
| FINANCIAL STATEMENTS |
Review of Financial Results
Revenue
($ millions, except per ounce/pound data in dollars) | For the three months ended | |||||||||||
| 3/31/23 | 12/31/22 | 3/31/22 | ||||||||||
Gold | ||||||||||||
000s oz solda | 954 | 1,111 | 993 | |||||||||
000s oz produceda | 952 | 1,120 | 990 | |||||||||
Market price | 1,890 | 1,726 | 1,877 | |||||||||
Realized price | 1,902 | 1,728 | 1,876 | |||||||||
Revenue | 2,411 | 2,535 | 2,511 | |||||||||
Copper | ||||||||||||
millions lbs solda | 89 | 99 | 113 | |||||||||
millions lbs produceda | 88 | 96 | 101 | |||||||||
Market price | 4.05 | 3.63 | 4.53 | |||||||||
Realized price | 4.20 | 3.81 | 4.68 | |||||||||
Revenue | 171 | 170 | 287 | |||||||||
Other sales | 61 | 69 | 55 | |||||||||
Total revenue | 2,643 | 2,774 | 2,853 | |||||||||
| a. | On an attributable basis. |
| b. | Further information on these non-GAAP financial measures, including detailed reconciliations, is included on pages 54 to 67 of this MD&A. |
Q1 2023 compared to Q4 2022
In the first quarter of 2023, gold revenues decreased by 5% compared to the fourth quarter of 2022, primarily due to lower sales volumes, partially offset by a higher realized gold price1. The average market price for the three month period ended March 31, 2023 was $1,890 per ounce, a 10% increase versus the $1,726 per ounce average in the prior quarter. During the first quarter of 2023, the gold price ranged from $1,805 per ounce to $2,010 per ounce, and closed the quarter at $1,980 per ounce. Gold prices in the first quarter of 2023 continued to be volatile, impacted by economic and geopolitical concerns, global interest rate policies and outlooks, and a weakening trade-weighted US dollar.
In the first quarter of 2023, gold production on an attributable basis was 168 thousand ounces lower than the prior quarter, primarily at Carlin due to annual roaster maintenance resulting in lower throughput at Goldstrike, the conversion of the Goldstrike autoclave to a conventional carbon-in-leach process and a harsh winter in northern Nevada impacting operations. This was combined with lower grades at Kibali due to mine sequencing.
ATTRIBUTABLE GOLD PRODUCTION VARIANCE (000s oz)
Q1 2023 compared to Q4 2022
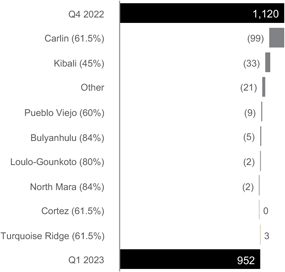
Copper revenues in the first quarter of 2023 were relatively consistent with the prior quarter as a higher realized copper price1 was offset by lower sales volumes. The average market price in the first quarter of 2023 was $4.05 per pound, representing a increase of 12% from the $3.63 per pound average in the prior quarter. The realized copper price1 in the first quarter of 2023 was higher than the market copper price due to the impact of positive provisional pricing adjustments, consistent with the prior quarter, which reflects the increase in the copper market price during the quarter. During the first quarter of 2023, the copper price traded in a range of $3.71 per pound to $4.33 per pound, and closed the quarter at $4.05 per pound. Copper prices in the first quarter of 2023 increased over the prior quarter due to a weakening trade-weighted US dollar, supply constraints, and increasing economic activity in China. Longer term, expectations for increases in copper demand from infrastructure spending and the transition to a low-carbon global economy should continue to have a positive impact on copper demand and consequently, expectations of future prices.
Attributable copper production in the first quarter of 2023 was 8 million pounds lower compared to the prior quarter driven by lower grades processed at Lumwana and lower throughput at Zaldívar.
Q1 2023 compared to Q1 2022
For the three month period ended March 31, 2023, gold revenues decreased by 4% compared to the same prior year period, primarily due to lower sales volumes, partially offset by a slightly higher realized gold price1. The average market price for the three month period ended March 31, 2023 was $1,890 per ounce versus $1,877 per ounce for the same prior year period.
| BARRICK FIRST QUARTER 2023 | 45 | MANAGEMENT’S DISCUSSION AND ANALYSIS |
| OVERVIEW | OPERATING PERFORMANCE | GROWTH PROJECTS & EXPLORATION | REVIEW OF FINANCIAL RESULTS |
OTHER INFORMATION & NON-GAAP RECONCILIATIONS
| FINANCIAL STATEMENTS |
ATTRIBUTABLE GOLD PRODUCTION VARIANCE (000s oz)
Q1 2023 compared to Q1 2022
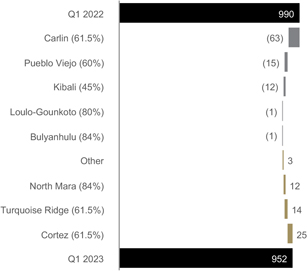
For the three month period ended March 31, 2023, attributable gold production was 38 thousand ounces lower than the same prior year period, primarily at Carlin, mainly due to the annual roaster maintenance resulting in lower throughput at Goldstrike, the conversion of the Goldstrike autoclave to a conventional CIL process and a harsh winter in northern Nevada impacting operations. This was partially offset by higher production at Cortez, driven by higher oxide mill and heap leach production from the Crossroads open pit and higher underground production.
Copper revenues for the three month period ended March 31, 2023 decreased by 40% compared to the same prior year period, due to lower sales volumes combined with a lower realized copper price1. In the first quarter of 2023, the realized copper price1 was higher than the market copper price due to the impact of positive provisional pricing adjustments, consistent with the same prior year period, which reflects the increase in the copper market price during each of those quarters.
Attributable copper production for the three month period ended March 31, 2023 decreased by 13 million pounds compared to the same prior year period, primarily at Lumwana due to lower grades processed, in line with the mine plan.
Production Costs
($ millions, except per ounce/pound data in dollars) | For the three months ended | |||||||||||
| 3/31/23 | 12/31/22 | 3/31/22 | ||||||||||
Gold | ||||||||||||
Site operating costs | 1,208 | 1,286 | 1,068 | |||||||||
Depreciation | 445 | 506 | 419 | |||||||||
Royalty expense | 101 | 85 | 88 | |||||||||
Community relations | 7 | 13 | 7 | |||||||||
Cost of sales | 1,761 | 1,890 | 1,582 | |||||||||
Cost of sales ($/oz)a |
| 1,378 |
|
| 1,324 |
|
| 1,190 |
| |||
Total cash costs ($/oz)b | 986 | 868 | 832 | |||||||||
All-in sustaining costs ($/oz)b | 1,370 | 1,242 | 1,164 | |||||||||
Copper | ||||||||||||
Site operating costs | 115 | 88 | 83 | |||||||||
Depreciation | 44 | 92 | 38 | |||||||||
Royalty expense | 15 | 16 | 32 | |||||||||
Community relations | 0 | 1 | 1 | |||||||||
Cost of sales | 174 | 197 | 154 | |||||||||
Cost of sales ($/lb)a |
| 3.22 |
|
| 3.19 |
|
| 2.21 |
| |||
C1 cash costs ($/lb)b |
| 2.71 |
|
| 2.25 |
|
| 1.81 |
| |||
All-in sustaining costs ($/lb)b | 3.40 | 3.98 | 2.85 | |||||||||
| a. | Gold cost of sales per ounce is calculated as cost of sales across our gold operations (excluding sites in closure or care and maintenance) divided by ounces sold (both on an attributable basis using Barrick’s ownership share). Copper cost of sales per pound is calculated as cost of sales across our copper operations divided by pounds sold (both on an attributable basis using Barrick’s ownership share). |
| b. | Further information on these non-GAAP financial measures, including detailed reconciliations, is included on pages 54 to 67 of this MD&A. |
Q1 2023 compared to Q4 2022
In the first quarter of 2023, gold cost of sales on a consolidated basis was 7% lower compared to the fourth quarter of 2022, mainly due to lower sales volume. Our 45% interest in Kibali is equity accounted, and therefore the mine’s cost of sales is excluded from our consolidated gold cost of sales. Our per ounce metrics, gold cost of sales2 and total cash costs1, includes our proportionate share of cost of sales at our equity method investees, and were 4% and 14% higher, respectively, than the prior quarter, mainly due to the impact of lower sales volumes.
In the first quarter of 2023, gold all-in sustaining costs per ounce1, which also includes our proportionate share of equity method investees, increased by 10% compared to the prior quarter. This was primarily due to higher total cash costs per ounce1, as described above.
In the first quarter of 2023, copper cost of sales on a consolidated basis was 12% lower compared to the prior quarter, mainly due to lower depreciation expense at Lumwana and the impact of lower sales volumes, partially offset by higher site operating costs. Our 50% interests in Zaldívar and Jabal Sayid are equity accounted and therefore, we do not include their cost of sales in our consolidated copper cost of sales. Our per pound metrics, copper cost of sales2 and C1 cash costs1, include our proportionate share of cost of sales at our equity method investees. Copper cost of sales per pound2 and C1 cash costs per pound1 were 1% and 20% higher, respectively, compared to the prior period, primarily due to lower mining rates as the new fleet at Lumwana continues to ramp up, as well as higher labor costs at Zaldívar. Cost of sales per
| BARRICK FIRST QUARTER 2023 | 46 | MANAGEMENT’S DISCUSSION AND ANALYSIS |
| OVERVIEW | OPERATING PERFORMANCE | GROWTH PROJECTS & EXPLORATION | REVIEW OF FINANCIAL RESULTS |
OTHER INFORMATION & NON-GAAP RECONCILIATIONS
| FINANCIAL STATEMENTS |
pound2 was partially offset by lower depreciation expense, mainly at Lumwana.
In the first quarter of 2023, copper all-in sustaining costs1 per pound, which also includes our proportionate share of equity method investees, was 15% lower than the prior quarter, primarily reflecting a decrease in minesite sustaining capital expenditures1 resulting from decreased capitalized stripping at Lumwana, partially offset by higher C1 cash costs per pound1, as discussed above.
Q1 2023 compared to Q1 2022
For the three month period ended March 31, 2023, gold cost of sales on a consolidated basis was 11% higher than the same prior year period, primarily due to higher site operating costs from increased energy and consumable prices, partially offset by lower sales volume. Our 45% interest in Kibali is equity accounted and therefore, the mine’s cost of sales is excluded from our consolidated gold cost of sales. Our per ounce metrics, gold cost of sales2 and total cash costs1, include our proportionate share of cost of sales at our equity method investees, and were 16% and 19% higher, respectively, compared to the same prior year period. This was mainly due to lower sales volumes, combined with higher input costs driven by energy and consumables prices.
For the three month period ended March 31, 2023, gold all-in sustaining costs per ounce1 increased by 18% compared to the same prior year period, primarily due to the increase in total cash costs per ounce1, combined with higher minesite sustaining capital expenditures1.
For the three month period ended March 31, 2023, copper cost of sales on a consolidated basis was 13% higher than the same prior year period, primarily due to higher site operating costs, partially offset by lower sales volumes. Our 50% interests in Zaldívar and Jabal Sayid are equity accounted and therefore, we do not include their cost of sales in our consolidated copper cost of sales. Our per pound metrics, copper cost of sales2 and C1 cash costs1, includes our proportionate share of cost of sales at our equity method investees. Copper cost of sales per pound2 and C1 cash costs1 were 46% and 50% higher, respectively, compared to the same prior year period, primarily due to lower grades processed and lower capitalized stripping at Lumwana.
For the three month period ended March 31, 2023, copper all-in sustaining costs per pound1 was 19% higher than the same prior year period, primarily reflecting higher C1 cash costs per pound1, as discussed above. This was partially offset by lower minesite sustaining capital expenditures1 resulting from decreased capitalized stripping at Lumwana.
Capital Expendituresa
| ($ millions) | For the three months ended | |||||||||||
| 3/31/23 | 12/31/22 | 3/31/22 | ||||||||||
Minesite sustainingb | 454 | 557 | 420 | |||||||||
Project capital expendituresb,c | 226 | 324 | 186 | |||||||||
Capitalized interest | 8 | 10 | 5 | |||||||||
Total consolidated capital expenditures | 688 | 891 | 611 | |||||||||
Attributable capital expendituresd | 526 | 743 | 478 | |||||||||
| a. | These amounts are presented on a cash basis. |
| b. | Further information on these non-GAAP financial measures, including detailed reconciliations, is included on pages 54 to 67 of this MD&A. |
| c. | Project capital expenditures1 are included in our calculation of all-in costs, but not included in our calculation of all-in sustaining costs. |
| d. | These amounts are presented on the same basis as our guidance. |
Q1 2023 compared to Q4 2022
In the first quarter of 2023, total consolidated capital expenditures on a cash basis were 23% lower than the fourth quarter of 2022 due to an decrease in both minesite sustaining capital expenditures1 and project capital expenditures1. Minesite sustaining capital expenditures1 decreased by 18% compared to the prior quarter, mainly at Lumwana due to lower capitalized stripping in the current quarter and as down payments for replacement mobile equipment occurred in the prior quarter, combined with the timing of mobile equipment deliveries at the end of 2022 at Carlin. The decrease in project capital expenditures1 of 30% was primarily driven by lower expenditures from the plant expansion and mine life extension project at Pueblo Viejo, and following advanced payments made on the new owner mining fleet in the prior quarter at Lumwana.
Q1 2023 compared to Q1 2022
For the three month period ended March 31, 2023, total consolidated capital expenditures on a cash basis increased by 13% compared to the same prior year period. This was due to an increase in both project capital expenditures1 and minesite sustaining capital expenditures1. Project capital expenditures1 increased by 22% compared to the same prior year period, primarily due to investment in the new owner mining fleet at Lumwana, combined with higher expenditures from the solar plant expansion at Loulo-Gounkoto. Minesite sustaining capital expenditures1 increased by 8% compared to the same prior year period mainly due to increased capitalized stripping at both North Mara and Loulo-Gounkoto.
| BARRICK FIRST QUARTER 2023 | 47 | MANAGEMENT’S DISCUSSION AND ANALYSIS |
| OVERVIEW | OPERATING PERFORMANCE | GROWTH PROJECTS & EXPLORATION | REVIEW OF FINANCIAL RESULTS |
OTHER INFORMATION & NON-GAAP RECONCILIATIONS
| FINANCIAL STATEMENTS |
General and Administrative Expenses
| ($ millions) | For the three months ended | |||||||||||
| 3/31/23 | 12/31/22 | 3/31/22 | ||||||||||
Corporate administration | 28 | 33 | 30 | |||||||||
Share-based compensationa | 11 | 16 | 24 | |||||||||
General & administrative expenses | 39 | 49 | 54 | |||||||||
| a. | Based on a US$18.27 share price as at March 31, 2023 (December 31, 2022: US$17.21 and March 31, 2022: US$24.53). |
Q1 2023 compared to Q4 2022
In the first quarter of 2023, general and administrative expenses decreased by $10 million compared to the fourth quarter of 2022, driven by lower share-based compensation expense due to a more modest increase in our share price during the current quarter as compared to the prior quarter. This was combined with lower corporate administration costs related to the timing of external services costs.
Q1 2023 compared to Q1 2022
For the three month period ended March 31, 2023, general and administrative expenses decreased by $15 million compared with the same prior year period. This was mainly due to lower share-based compensation expense attributed to a more modest increase in our share price in the current quarter as compared to the same prior year period.
Exploration, Evaluation and Project Expenses
| ($ millions) | For the three months ended | |||||||||||
| 3/31/23 | 12/31/22 | 3/31/22 | ||||||||||
Global exploration and evaluation | 27 | 38 | 27 | |||||||||
Project costs: | ||||||||||||
Pascua-Lama | 8 | 16 | 14 | |||||||||
Lumwana | 7 | 0 | 0 | |||||||||
Reko Diq | 5 | 9 | 0 | |||||||||
Pueblo Viejo | 1 | 5 | 2 | |||||||||
Other | 11 | 10 | 11 | |||||||||
Corporate development | 1 | 5 | 3 | |||||||||
Global exploration and evaluation and project expense | 60 | 83 | 57 | |||||||||
Minesite exploration and evaluation | 11 | 23 | 10 | |||||||||
Total exploration, evaluation and project expenses | 71 | 106 | 67 | |||||||||
Q1 2023 compared to Q4 2022
Exploration, evaluation and project expenses for the first quarter of 2023 decreased by $35 million compared to the fourth quarter of 2022. This was driven by lower minesite exploration and evaluation costs primarily related to projects in the Africa & Middle East region, combined with decreased global exploration and evaluation costs primarily in North America due to timing. This was further impacted by lower project costs both at Pascua-Lama as the Chilean side advances closure activities, and at Reko Diq due to timing, partially offset by higher costs at Lumwana related to the ongoing pre-feasibility study for the potential super pit.
Q1 2023 compared to Q1 2022
Exploration, evaluation and project expenses for the three month period ended March 31, 2023 were $4 million higher
than the same prior year period, driven by higher project costs at Lumwana related to the ongoing pre-feasibility study and at Reko Diq as the project was reconstituted, partially offset by lower costs at Pascua-Lama as the Chilean side advances closure activities.
Finance Costs, Net
| ($ millions) | For the three months ended | |||||||||||
| 3/31/23 | 12/31/22 | 3/31/22 | ||||||||||
Interest expensea | 105 | 89 | 91 | |||||||||
Accretion | 21 | 20 | 12 | |||||||||
Gain on debt extinguishment | 0 | (12 | ) | 0 | ||||||||
Interest capitalized | (7 | ) | (10 | ) | (5 | ) | ||||||
Other finance costs | 1 | 2 | 1 | |||||||||
Finance income | (62 | ) | (38 | ) | (11 | ) | ||||||
Finance costs, net | 58 | 51 | 88 | |||||||||
| a. | For the three months ended March 31, 2023, interest expense includes approximately $8 million of non-cash interest expense relating to the streaming agreements with Royal Gold, Inc. (December 31, 2022: $8 million and March 31, 2022: $8 million). |
Q1 2023 compared to Q4 2022
In the first quarter of 2023, finance costs, net were 14% higher than the prior quarter as there was a gain on debt extinguishment relating to the repurchase of $319 million (notional value) of our 5.250% Notes due in 2042 in the prior quarter. Higher finance income and higher interest expense are mainly due to the restricted cash and associated financial liability owed to Antofagasta plc following the reconstitution of the Reko Diq project which occurred on December 15, 2022.
Q1 2023 compared to Q1 2022
For the three month period ended March 31, 2023, finance costs, net decreased by 34% compared to the same prior year period, primarily due to higher finance income resulting from an increase in market interest rates. In addition to this, finance income and interest expense were also higher due to the restricted cash and associated financial liability owed to Antofagasta plc following the reconstitution of the Reko Diq project which occurred on December 15, 2022.
Additional Significant Statement of Income Items
| ($ millions) | For the three months ended | |||||||||||
| 3/31/23 | 12/31/22 | 3/31/22 | ||||||||||
Impairment charges (reversals) | 1 | 1,642 | 2 | |||||||||
Loss on currency translation | 38 | 4 | 3 | |||||||||
Closed mine rehabilitation | 22 | 44 | 3 | |||||||||
Other expense (income) | 52 | (250 | ) | (11 | ) | |||||||
Impairment Charges (Reversals)
Q1 2023 compared to Q4 2022
In the first quarter of 2023, net impairment charges were $1 million, compared to $1,642 million in the prior quarter. There were no significant impairment charges or reversals in the current quarter. The impairment charges in the prior quarter related to a goodwill impairment of $950 million (net of non-controlling interests) related to Loulo-Gounkoto, non-current asset impairments of $318 million (net of tax) at Veladero and of $42 million (net of tax and non-controlling interests) at Long Canyon, as we observed a decrease in the discounted cash flows of these mines. These impacts
| BARRICK FIRST QUARTER 2023 | 48 | MANAGEMENT’S DISCUSSION AND ANALYSIS |
| OVERVIEW | OPERATING PERFORMANCE | GROWTH PROJECTS & EXPLORATION | REVIEW OF FINANCIAL RESULTS |
OTHER INFORMATION & NON-GAAP RECONCILIATIONS
| FINANCIAL STATEMENTS |
were partially offset by an impairment reversal of $120 million (no tax or non-controlling interest impact) on our previously held 37.5% interest of Reko Diq as we completed the reconstitution of the Reko Diq project on December 15, 2022.
Q1 2023 compared to Q1 2022
For the three month period ended March 31, 2023, net impairment charges were $1 million, compared to $2 million in the same prior year period. There were no significant impairment charges or reversals in both the current and same prior year period.
Loss on Currency Translation
Q1 2023 compared to Q4 2022
Loss on currency translation in the first quarter of 2023 was $38 million compared to $4 million in the prior quarter. The increase mainly related to the devaluation of the Zambian kwacha in the current period. The weakness in the Zambian currency during the first quarter of 2023 was a result of high inflation levels in the country and concerns regarding ongoing negotiations related to the restructuring of the country’s debt. Subsequent to the end of the first quarter of 2023, the country made progress towards a debt restructuring deal which led to a significant reversal of the currency weakness that was experienced during the quarter. This currency fluctuation resulted in a revaluation of our local currency denominated value-added tax receivable balances, partially offset by a revaluation of our local currency denominated payable balances.
Q1 2023 compared to Q1 2022
Loss on currency translation in the first quarter of 2023 was $38 million compared to $3 million in the same prior year period. The increase mainly related to the devaluation of the Zambian kwacha in the current period as described above. This devaluation resulted in a revaluation of our local currency denominated value-added tax receivable balances.
Closed mine rehabilitation
Q1 2023 compared to Q4 2022
Closed mine rehabilitation expense in the first quarter of 2023 was $22 million compared to $44 million in the prior quarter. The decrease mainly related to increased cost estimates recorded in the prior quarter, slightly offset by a larger decrease in the market real risk-free rate used to discount the closure provision during the current period compared to the prior quarter.
Q1 2023 compared to Q1 2022
Closed mine rehabilitation expense in the first quarter of 2023 was $22 million compared to $3 million in the same prior year period. The increase mainly related to a decrease in the market real risk-free rate used to discount the closure provision in the current period.
Other Expense (Income)
Q1 2023 compared to Q4 2022
For the three months ended March 31, 2023, other expense was $52 million compared to other income of $250 million in the prior quarter. Other expense in the first quarter of 2023 mainly related to the $30 million commitment we made (shared equally between North Mara and Bulyanhulu) towards the expansion of education infrastructure in Tanzania, per our community investment obligations under the Twiga partnership, combined with care and
maintenance expenses at Porgera. Other income in the prior quarter mainly related to a gain of $300 million as Barrick’s interest in the Reko Diq project increased from 37.5% to 50% upon the completion of the reconstitution of the Reko Diq project, partially offset by supplies obsolescence at Bulyanhulu and North Mara.
Q1 2023 compared to Q1 2022
For the three months ended March 31, 2023, other expense was $52 million compared to other income of $11 million in the same prior year period. Other income in the first quarter of 2023 mainly related to the $30 million commitment we made (shared equally between North Mara and Bulyanhulu) towards the expansion of education infrastructure in Tanzania, per our community investment obligations under the Twiga partnership, combined with care and maintenance expenses at Porgera. Other income in the same prior year period mainly related to insurance proceeds received in relation to the claim for the mechanical mill failure at the Goldstrike roaster, partially offset by care and maintenance expenses at Porgera.
Income Tax Expense
Income tax expense was $205 million in the first quarter of 2023. The unadjusted effective income tax rate in the first quarter of 2023 was 43% of income before income taxes.
The underlying effective income tax rate on ordinary income in the first quarter of 2023 was 30% after adjusting for the impact of foreign currency translation losses on deferred tax balances; the impact of updates to the rehabilitation provision for our non-operating mines; the impact of non-deductible foreign exchange losses; the impact of the Porgera mine being placed on care and maintenance; the impact of our commitment towards the expansion of education infrastructure in Tanzania; and the impact of other expense adjustments.
We record deferred tax charges or credits if changes in facts or circumstances affect the estimated tax basis of assets and therefore, the expectations of our ability to realize deferred tax assets. The interpretation of tax regulations and legislation as well as their application to our business is complex and subject to change. We have significant amounts of deferred tax assets, including tax loss carry forwards, and also deferred tax liabilities. We also have significant amounts of unrecognized deferred tax assets (e.g. for tax losses in Canada). Potential changes in any of these amounts, as well as our ability to realize deferred tax assets, could significantly affect net income or cash flow in future periods. For further details on income tax expense, refer to note 9 of the Financial Statements.
Withholding Taxes
In the first quarter of 2023, we recorded $16 million of dividend withholding taxes related to the undistributed earnings of our subsidiaries in the United States.
Nevada Gold Mines
Nevada Gold Mines is a limited liability company treated as a flow through partnership for US tax purposes. The partnership is not subject to federal income tax directly, but each of its partners is liable for tax on its share of the profits of the partnership. As such, Barrick accounts for its current and deferred income tax associated with this investment (61.5% share) following the principles in IAS 12.
| BARRICK FIRST QUARTER 2023 | 49 | MANAGEMENT’S DISCUSSION AND ANALYSIS |
| OVERVIEW | OPERATING PERFORMANCE | GROWTH PROJECTS & EXPLORATION | REVIEW OF FINANCIAL RESULTS |
OTHER INFORMATION & NON-GAAP RECONCILIATIONS
| FINANCIAL STATEMENTS |
Financial Condition Review
Summary Balance Sheet and Key Financial Ratios
| ($ millions, except ratios and share amounts) | As at 3/31/23 | As at 12/31/22 | ||||||
Total cash and equivalents | 4,377 | 4,440 | ||||||
Current assets | 4,161 | 4,025 | ||||||
Non-current assets | 37,614 | 37,500 | ||||||
Total Assets | 46,152 | 45,965 | ||||||
Current liabilities excluding short-term debt | 3,194 | 3,107 | ||||||
Non-current liabilities excluding long-term debta | 6,863 | 6,787 | ||||||
Debt (current and long-term) | 4,777 | 4,782 | ||||||
Total Liabilities | 14,834 | 14,676 | ||||||
Total shareholders’ equity | 22,713 | 22,771 | ||||||
Non-controlling interests | 8,605 | 8,518 | ||||||
Total Equity | 31,318 | 31,289 | ||||||
Total common shares outstanding (millions of shares) | 1,755 | 1,755 | ||||||
Debt, net of cash | 400 | 342 | ||||||
Key Financial Ratios: | ||||||||
Current ratiob | 2.66:1 | 2.71:1 | ||||||
Debt-to-equityc | 0.15:1 | 0.15:1 | ||||||
| a. | Non-current financial liabilities as at March 31, 2023 were $5,340 million (December 31, 2022: $5,314 million). |
| b. | Represents current assets divided by current liabilities (including short-term debt) as at March 31, 2023 and December 31, 2022. |
| c. | Represents debt divided by total shareholders’ equity (including minority interest) as at March 31, 2023 and December 31, 2022. |
Balance Sheet Review
Total assets were $46.2 billion as at March 31, 2023, in line with total assets as at December 31, 2022.
Our asset base is primarily comprised of non-current assets such as property, plant and equipment and goodwill, reflecting the capital-intensive nature of the mining business and our history of growing through acquisitions. Other significant assets include production inventories, indirect taxes recoverable and receivable, concentrate sales receivable, other government and joint venture related receivables, as well as cash and equivalents.
Total liabilities at March 31, 2023 were $14.8 billion, in line with total liabilities at December 31, 2022. Our liabilities are primarily comprised of debt, other non-current liabilities (such as provisions and deferred income tax liabilities), and accounts payable.
Shareholders’ Equity
| 4/25/2023 | Number of shares | |||
Common shares | 1,755,407,560 | |||
Stock options | — | |||
Financial Position and Liquidity
We believe we have sufficient financial resources to meet our business requirements for the foreseeable future, including capital expenditures, working capital requirements, interest payments, environmental rehabilitation, securities buybacks and dividends. During the first quarter of 2023, our cash balance declined as capital expenditures and dividends exceeded the cash flow from operating activities and dividends from equity method investments.
Total cash and cash equivalents as at March 31, 2023 were $4.4 billion. Our capital structure comprises a mix of debt, non-controlling interest (primarily at NGM) and shareholders’ equity. As at March 31, 2023, our total debt
was $4.8 billion (debt, net of cash and equivalents was $400 million) and our debt-to-equity ratio was 0.15:1. This compares to total debt as at December 31, 2022 of $4.8 billion (debt, net of cash and equivalents was $342 million), and a debt-to-equity ratio of 0.15:1.
Uses of cash for the remainder of 2023 include capital commitments of $440 million and we expect to incur attributable minesite sustaining1 and project capital expenditures1 of approximately $1,700 to $2,100 million during the remainder of the year, based on the top of our guidance range on page 12. For the remainder of 2023, we have contractual obligations and commitments of $658 million for supplies and consumables. In addition, we have $271 million in interest payments and other amounts as detailed in the table on page 52. We expect to fund these commitments through operating cash flow, which is our primary source of liquidity, as well as our existing cash balances as necessary. As discussed on page 8, we have authorized a share buyback program, where we may purchase up to $1 billion of Barrick shares. As at March 31, 2023, we had not purchased any shares under this program in 2023.
We also have a performance dividend policy that will enhance the return to shareholders when the Company’s liquidity is strong. In addition to our base dividend, the amount of the performance dividend on a quarterly basis will be based on the amount of cash, net of debt, on our consolidated balance sheet at the end of each quarter as per the schedule below.
| BARRICK FIRST QUARTER 2023 | 50 | MANAGEMENT’S DISCUSSION AND ANALYSIS |
| OVERVIEW | OPERATING PERFORMANCE | GROWTH PROJECTS & EXPLORATION | REVIEW OF FINANCIAL RESULTS |
OTHER INFORMATION & NON-GAAP RECONCILIATIONS
| FINANCIAL STATEMENTS |
Performance Dividend Level | Threshold Level | Quarterly Base Dividend | Quarterly Performance Dividend | Quarterly Total Dividend | ||||
| Level I | Net cash <$0 | $0.10 per share | $0.00 per share | $0.10 per share | ||||
| Level II | Net cash >$0 and <$0.5B | $0.10 per share | $0.05 per share | $0.15 per share | ||||
| Level III | Net cash >$0.5B and <$1B | $0.10 per share | $0.10 per share | $0.20 per share | ||||
| Level IV | Net cash >$1B | $0.10 per share | $0.15 per share | $0.25 per share |
The declaration and payment of dividends is at the discretion of the Board of Directors, and will depend on the company’s financial results, cash requirements, future prospects, the number of outstanding common shares, and other factors deemed relevant by the Board.
Our operating cash flow is dependent on the ability of our operations to deliver projected future cash flows. The market price of gold and to a lesser extent, copper, are the primary drivers of our operating cash flow. Other options to enhance liquidity include further portfolio optimization and the creation of new joint ventures and partnerships; issuance of equity securities in the public markets or to private investors (Moody’s and S&P currently rate Barrick’s outstanding long-term debt as investment grade, with ratings of A3 and BBB+, respectively), which could be undertaken for liquidity enhancement and/or in connection with establishing a strategic partnership; issuance of long-term debt securities in the public markets or to private investors; and drawing on the $3.0 billion available under our undrawn Credit Facility (subject to compliance with covenants and the making of certain representations and warranties, this facility is available for drawdown as a source of financing). The revolving credit facility incorporates sustainability-linked metrics and are made up of annual environmental and social performance targets directly influenced by Barrick’s actions, rather than based on external ratings. The performance targets include Scope 1 and Scope 2 GHG emissions intensity, water use efficiency (reuse and recycling rates), and TRIFR3. Barrick may incur positive or negative pricing adjustments on drawn credit spreads and standby fees based on its sustainability performance versus the targets that have been set. The key financial covenant in our undrawn Credit Facility requires Barrick to maintain a net debt to total capitalization ratio of less than 0.60:1. Barrick’s net debt to total capitalization ratio was 0.01:1 as at March 31, 2023 (0.01:1 as at December 31, 2022).
Summary of Cash Inflow (Outflow)
| ($ millions) | For the three months ended | |||||||||||
| 3/31/23 | 12/31/22 | 3/31/22 | ||||||||||
Net cash provided by operating activities | 776 | 795 | 1,004 | |||||||||
Investing activities | ||||||||||||
Capital expenditures | (688 | ) | (891 | ) | (611 | ) | ||||||
Investment sales | 0 | (1 | ) | 260 | ||||||||
Dividends received from equity method investments | 67 | 99 | 359 | |||||||||
Other | 3 | 13 | 1 | |||||||||
Total investing outflows | (618 | ) | (780 | ) | 9 | |||||||
Net change in debta | (4 | ) | (323 | ) | (6 | ) | ||||||
Dividendsb | (175 | ) | (261 | ) | (178 | ) | ||||||
Net disbursements to non-controlling interests | (62 | ) | (172 | ) | (267 | ) | ||||||
Share buyback program | 0 | (110 | ) | 0 | ||||||||
Other | 20 | 51 | 45 | |||||||||
Total financing outflows | (221 | ) | (815 | ) | (406 | ) | ||||||
Effect of exchange rate | 0 | 0 | 0 | |||||||||
Decrease in cash and equivalents | (63 | ) | (800 | ) | 607 | |||||||
| a. | The difference between the net change in debt on a cash basis and the net change on the balance sheet is due to changes in non-cash charges, specifically the unwinding of discounts and amortization of debt issue costs. |
| b. | For the three months ended March 31, 2023, we declared and paid dividends per share in US dollars totaling $0.10 (December 31, 2022: declared and paid $0.15; March 31, 2022: declared and paid $0.10). |
Q1 2023 compared to Q4 2022
In the first quarter of 2023, we generated $776 million in operating cash flow, compared to $795 million in the prior quarter. The decrease of $19 million was primarily due to an unfavorable movement in working capital, mainly in accounts payable, partially offset by a favorable movement in accounts receivable. This was partially offset by a decrease in interest paid as a result of the timing of semi-annual interest payments on our bonds, which primarily occur in Q2 and Q4. Operating cash flow was further impacted by an increase in realized gold and copper prices1, partially offset by lower gold and copper sales volumes and higher total cash costs/C1 cash costs per ounce/pound1.
Cash outflows from investing activities in the first quarter of 2023 were $618 million, compared to $780 million in the prior quarter. The decrease of $162 million was primarily due to lower capital expenditures, mainly driven by Lumwana due to lower capitalized stripping and advanced payments made on the new owner mining fleet in the prior quarter, combined with lower expenditures from the plant expansion and mine life extension project at Pueblo Viejo. This was partially offset by a decrease in dividends received from equity method investments, in particular Kibali.
Net financing cash outflows for the first quarter of 2023 amounted to $221 million, compared to $815 million in the prior quarter. The decrease of $594 million is primarily due to the repurchase of $319 million (notional value) of our 5.250% Notes due in 2042 occurring in the prior quarter. This was combined with lower net disbursements paid to non-controlling interests, primarily to Newmont in relation to their interests in NGM and Pueblo Viejo, as well as lower share buybacks and dividends paid.
| BARRICK FIRST QUARTER 2023 | 51 | MANAGEMENT’S DISCUSSION AND ANALYSIS |
| OVERVIEW | OPERATING PERFORMANCE | GROWTH PROJECTS & EXPLORATION | REVIEW OF FINANCIAL RESULTS |
OTHER INFORMATION & NON-GAAP RECONCILIATIONS
| FINANCIAL STATEMENTS |
Q1 2023 compared to Q1 2022
In the first quarter of 2023, we generated $776 million in operating cash flow, compared to $1,004 million in the same prior year period. The decrease of $228 million was primarily due to higher gold and copper total cash costs/C1 cash costs per ounce/pound1, a lower realized copper price1, lower gold and copper sales volumes, partially offset by a higher realized gold price1 and lower cash taxes paid.
Cash outflows from investing activities in the first quarter of 2023 were $618 million compared to an inflow of $9 million in the same prior year period. The increased net outflow of $627 million was primarily due to lower dividends
received from equity method investments, in particular Kibali, combined with proceeds received from investment sales in the same prior year period, including the sale of shares of Skeena Resources Ltd and Endeavour Mining.
Net financing cash outflows for the first quarter of 2023 amounted to $221 million, compared to $406 million in the same prior year period. The decrease of $185 million is primarily due to lower net disbursements paid to non-controlling interests, primarily to Newmont in relation to their interest in NGM.
Commitments and Contingencies
Litigation and Claims
We are currently subject to various litigation proceedings as disclosed in note 16 to the Financial Statements, and we may be involved in disputes with other parties in the future that may result in litigation. If we are unable to resolve these disputes favorably, it may have a material adverse impact on our financial condition, cash flow and results of operations.
Contractual Obligations and Commitments
In the normal course of business, we enter into contracts that give rise to commitments for future minimum payments. The following table summarizes the remaining contractual maturities of our financial liabilities and operating and capital commitments shown on an undiscounted basis:
| ($ millions) | Payments due as at 3/31/23 | |||||||||||||||||||||||||||
| 2023 | 2024 | 2025 | 2026 | 2027 | 2028 and thereafter | Total | ||||||||||||||||||||||
Debta | ||||||||||||||||||||||||||||
Repayment of principal | 0 | 0 | 12 | 47 | 0 | 4,675 | 4,734 | |||||||||||||||||||||
Capital leases | 10 | 9 | 8 | 9 | 7 | 22 | 65 | |||||||||||||||||||||
Interest | 271 | 290 | 289 | 286 | 282 | 3,250 | 4,668 | |||||||||||||||||||||
Provisions for environmental rehabilitationb | 210 | 128 | 104 | 98 | 77 | 1,993 | 2,610 | |||||||||||||||||||||
Restricted share units | 6 | 10 | 1 | 0 | 0 | 0 | 17 | |||||||||||||||||||||
Pension benefits and other post-retirement benefits | 4 | 5 | 5 | 5 | 5 | 40 | 64 | |||||||||||||||||||||
Purchase obligations for supplies and consumablesc | 658 | 263 | 184 | 158 | 154 | 337 | 1,754 | |||||||||||||||||||||
Capital commitmentsd | 440 | 2 | 0 | 0 | 0 | 0 | 442 | |||||||||||||||||||||
Social development costse | 19 | 24 | 10 | 8 | 4 | 46 | 111 | |||||||||||||||||||||
Other obligationsf | 20 | 39 | 44 | 64 | 48 | 507 | 722 | |||||||||||||||||||||
Total | 1,638 | 770 | 657 | 675 | 577 | 10,870 | 15,187 | |||||||||||||||||||||
| a. | Debt and Interest: Our debt obligations do not include any subjective acceleration clauses or other clauses that enable the holder of the debt to call for early repayment, except in the event that we breach any of the terms and conditions of the debt or for other customary events of default. We are not required to post any collateral under any debt obligations. Projected interest payments on variable rate debt were based on interest rates in effect at March 31, 2023. Interest is calculated on our long-term debt obligations using both fixed and variable rates. |
| b. | Provisions for environmental rehabilitation: Amounts presented in the table represent the undiscounted uninflated future payments for the expected cost of environmental rehabilitation. |
| c. | Purchase obligations for supplies and consumables: Includes commitments related to new purchase obligations to secure a supply of acid, tires and cyanide for our production process. |
| d. | Capital commitments: Purchase obligations for capital expenditures include only those items where binding commitments have been entered into. |
| e. | Social development costs: Includes a commitment of $14 million in 2028 and thereafter, related to the funding of a power transmission line in Argentina. |
| f. | Other obligations includes the Pueblo Viejo joint venture partner shareholder loan, the deposit on the Pascua-Lama silver sale agreement with Wheaton Precious Metals Corp., and minimum royalty payments. |
| BARRICK FIRST QUARTER 2023 | 52 | MANAGEMENT’S DISCUSSION AND ANALYSIS |
| OVERVIEW | OPERATING PERFORMANCE | GROWTH PROJECTS & EXPLORATION | REVIEW OF FINANCIAL RESULTS |
OTHER INFORMATION & NON-GAAP RECONCILIATIONS
| FINANCIAL STATEMENTS |
Review of Quarterly Results
Quarterly Informationa
| ($ millions, except where indicated) | 2023 | 2022 | 2022 | 2022 | 2022 | 2021 | 2021 | 2021 | ||||||||||||||||||||||||
| Q1 | Q4 | Q3 | Q2 | Q1 | Q4 | Q3 | Q2 | |||||||||||||||||||||||||
Revenues | 2,643 | 2,774 | 2,527 | 2,859 | 2,853 | 3,310 | 2,826 | 2,893 | ||||||||||||||||||||||||
Realized price per ounce – goldb | 1,902 | 1,728 | 1,722 | 1,861 | 1,876 | 1,793 | 1,771 | 1,820 | ||||||||||||||||||||||||
Realized price per pound – copperb | 4.20 | 3.81 | 3.24 | 3.72 | 4.68 | 4.63 | 3.98 | 4.57 | ||||||||||||||||||||||||
Cost of sales | 1,941 | 2,093 | 1,815 | 1,850 | 1,739 | 1,905 | 1,768 | 1,704 | ||||||||||||||||||||||||
Net earnings | 120 | (735) | 241 | 488 | 438 | 726 | 347 | 411 | ||||||||||||||||||||||||
Per share (dollars)c | 0.07 | (0.42) | 0.14 | 0.27 | 0.25 | 0.41 | 0.20 | 0.23 | ||||||||||||||||||||||||
Adjusted net earningsb | 247 | 220 | 224 | 419 | 463 | 626 | 419 | 513 | ||||||||||||||||||||||||
Per share (dollars)b,c | 0.14 | 0.13 | 0.13 | 0.24 | 0.26 | 0.35 | 0.24 | 0.29 | ||||||||||||||||||||||||
Operating cash flow | 776 | 795 | 758 | 924 | 1,004 | 1,387 | 1,050 | 639 | ||||||||||||||||||||||||
Consolidated capital expendituresd | 688 | 891 | 792 | 755 | 611 | 669 | 569 | 658 | ||||||||||||||||||||||||
Free cash flowb | 88 | (96) | (34) | 169 | 393 | 718 | 481 | (19) | ||||||||||||||||||||||||
| a. | Sum of all the quarters may not add up to the annual total due to rounding. |
| b. | Further information on these non-GAAP financial measures, including detailed reconciliations, is included on pages 54 to 67 of this MD&A. |
| c. | Calculated using weighted average number of shares outstanding under the basic method of earnings per share. |
| d. | Amounts presented on a consolidated cash basis. |
Our recent financial results reflect our emphasis on cost discipline, an agile management structure that empowers our site based leadership teams and a portfolio of Tier One Gold Assets5. This, combined with a trend of historically elevated gold and copper prices, has resulted in strong operating cash flows over several quarters. The positive free cash flow1 generated, together with the proceeds from various divestitures, have allowed us to continue to reinvest in our business, strengthen our balance sheet and to increase returns to shareholders.
Net earnings has also been impacted by the following items in each quarter, which have been excluded from adjusted net earnings1. In the first quarter of 2023, we recorded a loss on currency translation of $38 million, mainly related to the devaluation of the Zambian kwacha, and a $30 million commitment towards the expansion of
education infrastructure in Tanzania per our community investment obligations under the Twiga partnership. In the fourth quarter of 2022, we recorded a goodwill impairment of $950 million (net of non-controlling interests) related to Loulo-Gounkoto, a non-current asset impairment of $318 million (net of tax) and a net realizable value impairment of leach pad inventory of $27 million (net of tax) at Veladero, and a non-current asset impairment of $42 million (net of tax and non-controlling interests) at Long Canyon. In addition, we recorded an impairment reversal of $120 million and a gain of $300 million following the completion of the transaction allowing for the reconstitution of the Reko Diq project. In the fourth quarter of 2021, we recorded a gain of $118 million (net of tax and non-controlling interest) related to the disposition of Lone Tree.
Internal Control Over Financial Reporting and Disclosure Controls and Procedures
Management is responsible for establishing and maintaining adequate internal control over financial reporting and disclosure controls and procedures as defined in our 2022 annual MD&A.
Together, the internal control frameworks provide internal control over financial reporting and disclosure. Due to its inherent limitations, internal control over financial reporting and disclosure may not prevent or detect all misstatements. Further, the effectiveness of internal control is subject to the risk that controls may become inadequate because of changes in conditions, or that the degree of compliance with policies or procedures may change.
There were no changes in our internal controls over financial reporting during the three months ended March 31, 2023 that have materially affected, or are reasonably likely to materially affect, our internal controls over financial reporting.
Under the supervision and with the participation of management, including the President and Chief Executive Officer and Senior Executive Vice-President and Chief Financial Officer, management will continue to monitor and evaluate the design and effectiveness of its internal control over financial reporting and disclosure controls and procedures, and may make modifications from time to time as considered necessary.
| BARRICK FIRST QUARTER 2023 | 53 | MANAGEMENT’S DISCUSSION AND ANALYSIS |
| OVERVIEW | OPERATING PERFORMANCE | GROWTH PROJECTS & EXPLORATION | REVIEW OF FINANCIAL RESULTS |
OTHER INFORMATION & NON-GAAP RECONCILIATIONS
| FINANCIAL STATEMENTS |
IFRS Critical Accounting Policies and Accounting Estimates
Management has discussed the development and selection of our critical accounting estimates with the Audit & Risk Committee of the Board of Directors, and the Audit & Risk Committee has reviewed the disclosure relating to such estimates in conjunction with its review of this MD&A. The accounting policies and methods we utilize determine how we report our financial condition and results of operations, and they may require management to make estimates or rely on assumptions about matters that are inherently uncertain. The consolidated financial statements have been prepared in accordance with IFRS as issued by the IASB under the historical cost convention, as modified by revaluation of certain financial assets, derivative contracts and post-retirement assets. Our significant accounting policies are disclosed in note 2 of the Financial Statements, including a summary of current and future changes in accounting policies.
Critical Accounting Estimates and Judgments
Certain accounting estimates have been identified as being “critical” to the presentation of our financial condition and results of operations because they require us to make subjective and/or complex judgments about matters that are inherently uncertain; or there is a reasonable likelihood that materially different amounts could be reported under different conditions or using different assumptions and estimates. Our significant accounting judgments, estimates and assumptions are disclosed in note 3 of the accompanying Financial Statements.
Non-GAAP Financial Measures
Adjusted Net Earnings and Adjusted Net Earnings per Share
Adjusted net earnings is a non-GAAP financial measure which excludes the following from net earnings:
| ∎ | Impairment charges (reversals) related to intangibles, goodwill, property, plant and equipment, and investments; |
| ∎ | Acquisition/disposition gains/losses; |
| ∎ | Foreign currency translation gains/losses; |
| ∎ | Significant tax adjustments; |
| ∎ | Other items that are not indicative of the underlying operating performance of our core mining business; and |
| ∎ | Tax effect and non-controlling interest of the above items. |
Management uses this measure internally to evaluate our underlying operating performance for the reporting periods presented and to assist with the planning and forecasting of future operating results. Management believes that adjusted net earnings is a useful measure of our performance because impairment charges, acquisition/disposition gains/losses and significant tax adjustments do not reflect the underlying operating performance of our core mining business and are not necessarily indicative of future operating results. Furthermore, foreign currency translation gains/losses are not necessarily reflective of the underlying operating results for the reporting periods presented. The tax effect and non-controlling interest of the adjusting items are also excluded to reconcile the amounts to Barrick’s share on a post-tax basis, consistent with net earnings.
As noted, we use this measure for internal purposes. Management’s internal budgets and forecasts and public guidance do not reflect the types of items we adjust for. Consequently, the presentation of adjusted net earnings enables investors and analysts to better understand the underlying operating performance of our core mining business through the eyes of management. Management periodically evaluates the components of adjusted net earnings based on an internal assessment of performance measures that are useful for evaluating the operating performance of our business segments and a review of the non-GAAP financial measures used by mining industry analysts and other mining companies.
Adjusted net earnings is intended to provide additional information only and does not have any standardized definition under IFRS and should not be considered in isolation or as a substitute for measures of performance prepared in accordance with IFRS. The measures are not necessarily indicative of operating profit or cash flow from operations as determined under IFRS. Other companies may calculate these measures differently. The following table reconciles these non-GAAP financial measures to the most directly comparable IFRS measure.
| BARRICK FIRST QUARTER 2023 | 54 | MANAGEMENT’S DISCUSSION AND ANALYSIS |
| OVERVIEW | OPERATING PERFORMANCE | GROWTH PROJECTS & EXPLORATION | REVIEW OF FINANCIAL RESULTS |
OTHER INFORMATION & NON-GAAP RECONCILIATIONS
| FINANCIAL STATEMENTS |
Reconciliation of Net Earnings to Net Earnings per Share, Adjusted Net Earnings and Adjusted Net Earnings per Share
| ($ millions, except per share amounts in dollars) | For the three months ended | |||||||||||
| 3/31/23 | 12/31/22 | 3/31/22 | ||||||||||
Net earnings attributable to equity holders of the Company | 120 | (735 | ) | 438 | ||||||||
Impairment charges (reversals) related to intangibles, goodwill, property, plant and equipment, and investmentsa | 1 | 1,642 | 2 | |||||||||
Acquisition/disposition gainsb | (3 | ) | (319 | ) | (2 | ) | ||||||
Loss on currency translation | 38 | 4 | 3 | |||||||||
Significant tax adjustmentsc | 48 | (4 | ) | 17 | ||||||||
Other expense (income) adjustmentsd | 63 | 126 | 13 | |||||||||
Non-controlling intereste | (6 | ) | (271 | ) | 0 | |||||||
Tax effecte | (14 | ) | (223 | ) | (8 | ) | ||||||
Adjusted net earnings | 247 | 220 | 463 | |||||||||
Net earnings per sharef | 0.07 | (0.42 | ) | 0.25 | ||||||||
Adjusted net earnings per sharef | 0.14 | 0.13 | 0.26 | |||||||||
| a. | For the three month period ended December 31, 2022, net impairment charges mainly relate to a goodwill impairment at Loulo-Gounkoto, and non-current asset impairments at Veladero and Long Canyon, partially offset by an impairment reversal at Reko Diq. |
| b. | For the three month period ended December 31, 2022, acquisition/disposition gains primarily relate to a gain as Barrick’s interest in the Reko Diq project increased from 37.5% to 50%. |
| c. | For the three month period ended March 31, 2023, significant tax adjustments mainly relate to foreign currency translation gains and losses on tax balances, changes in the discount rate assumptions on our closed mine rehabilitation provision, foreign exchange losses and the remeasurement of deferred tax balances. |
| d. | For the three month period ended March 31, 2023, other expense (income) adjustments mainly relate to the $30 million commitment we made towards the expansion of education infrastructure in Tanzania, per our community investment obligations under the Twiga partnership. For the three month period ended December 31, 2022, other expense (income) adjustments mainly relate to a net realizable value impairment of leach pad inventory at Veladero and supplies obsolescence write-off at Bulyanhulu and North Mara. Other expense (income) adjustments for all periods were also impacted by changes in the discount rate assumptions on our closed mine rehabilitation provision and care and maintenance expenses at Porgera. |
| e. | Non-controlling interest and tax effect for the three month period ended December 31, 2022 primarily relates to impairment charges (reversals) related to non-current assets. |
| f. | Calculated using weighted average number of shares outstanding under the basic method of earnings per share. |
Free Cash Flow
Free cash flow is a non-GAAP financial measure that deducts capital expenditures from net cash provided by operating activities. Management believes this to be a useful indicator of our ability to operate without reliance on additional borrowing or usage of existing cash.
Free cash flow is intended to provide additional information only and does not have any standardized definition under IFRS and should not be considered in
isolation or as a substitute for measures of performance prepared in accordance with IFRS. The measure is not necessarily indicative of operating profit or cash flow from operations as determined under IFRS. Other companies may calculate this measure differently. The following table reconciles this non-GAAP financial measure to the most directly comparable IFRS measure.
Reconciliation of Net Cash Provided by Operating Activities to Free Cash Flow
| ($ millions) | For the three months ended | |||||||||||
| 3/31/23 | 12/31/22 | 3/31/22 | ||||||||||
Net cash provided by operating activities | 776 | 795 | 1,004 | |||||||||
Capital expenditures | (688 | ) | (891 | ) | (611 | ) | ||||||
Free cash flow | 88 | (96 | ) | 393 | ||||||||
Capital Expenditures
Capital expenditures are classified into minesite sustaining capital expenditures or project capital expenditures depending on the nature of the expenditure. Minesite sustaining capital expenditures is the capital spending required to support current production levels. Project capital expenditures represent the capital spending at new projects and major, discrete projects at existing operations intended to increase net present value through higher production or longer mine life. Management believes this to be a useful indicator of the purpose of capital expenditures
and this distinction is an input into the calculation of all-in sustaining costs per ounce and all-in costs per ounce.
Classifying capital expenditures is intended to provide additional information only and does not have any standardized definition under IFRS, and should not be considered in isolation or as a substitute for measures of performance prepared in accordance with IFRS. Other companies may calculate these measures differently. The following table reconciles these non-GAAP financial measures to the most directly comparable IFRS measure.
| BARRICK FIRST QUARTER 2023 | 55 | MANAGEMENT’S DISCUSSION AND ANALYSIS |
| OVERVIEW | OPERATING PERFORMANCE | GROWTH PROJECTS & EXPLORATION | REVIEW OF FINANCIAL RESULTS |
OTHER INFORMATION & NON-GAAP RECONCILIATIONS
| FINANCIAL STATEMENTS |
Reconciliation of the Classification of Capital Expenditures
| ($ millions) | For the three months ended | |||||||||||
| 3/31/23 | 12/31/22 | 3/31/22 | ||||||||||
Minesite sustaining capital expenditures | 454 | 557 | 420 | |||||||||
Project capital expenditures | 226 | 324 | 186 | |||||||||
Capitalized interest | 8 | 10 | 5 | |||||||||
Total consolidated capital expenditures | 688 | 891 | 611 | |||||||||
Total cash costs per ounce, All-in sustaining costs per ounce, All-in costs per ounce, C1 cash costs per pound and All-in sustaining costs per pound
Total cash costs per ounce, all-in sustaining costs per ounce and all-in costs per ounce are non-GAAP financial measures which are calculated based on the definition published by the WGC (a market development organization for the gold industry comprised of and funded by gold mining companies from around the world, including Barrick, the WGC. The WGC is not a regulatory organization. Management uses these measures to monitor the performance of our gold mining operations and its ability to generate positive cash flow, both on an individual site basis and an overall company basis.
Total cash costs start with our cost of sales related to gold production and removes depreciation, the non-controlling interest of cost of sales and includes by-product credits. All-in sustaining costs start with total cash costs and includes sustaining capital expenditures, sustaining leases, general and administrative costs, minesite exploration and evaluation costs and reclamation cost accretion and amortization. These additional costs reflect the expenditures made to maintain current production levels.
All-in costs starts with all-in sustaining costs and adds additional costs that reflect the varying costs of producing gold over the life-cycle of a mine, including: project capital expenditures (capital spending at new projects and major, discrete projects at existing operations intended to increase net present value through higher production or longer mine life) and other non-sustaining costs (primarily non-sustaining leases, exploration and evaluation costs, community relations costs and general and administrative costs that are not associated with current operations). These definitions recognize that there are different costs associated with the life-cycle of a mine, and that it is therefore appropriate to distinguish between sustaining and non-sustaining costs.
We believe that our use of total cash costs, all-in sustaining costs and all-in costs will assist analysts, investors and other stakeholders of Barrick in understanding the costs associated with producing gold, understanding the economics of gold mining, assessing our operating performance and also our ability to generate free cash flow from current operations and to generate free cash flow on an overall company basis. Due to the capital-intensive nature of the industry and the long useful lives over which these items are depreciated, there can be a significant timing difference between net earnings calculated in accordance with IFRS and the amount of free
cash flow that is being generated by a mine and therefore we believe these measures are useful non-GAAP operating metrics and supplement our IFRS disclosures. These measures are not representative of all of our cash expenditures as they do not include income tax payments, interest costs or dividend payments. These measures do not include depreciation or amortization.
Total cash costs per ounce, all-in sustaining costs and all-in costs are intended to provide additional information only and do not have standardized definitions under IFRS and should not be considered in isolation or as a substitute for measures of performance prepared in accordance with IFRS. These measures are not equivalent to net income or cash flow from operations as determined under IFRS. Although the WGC has published a standardized definition, other companies may calculate these measures differently.
In addition to presenting these metrics on a by-product basis, we have calculated these metrics on a co-product basis. Our co-product metrics remove the impact of other metal sales that are produced as a by-product of our gold production from cost per ounce calculations but does not reflect a reduction in costs for costs associated with other metal sales.
C1 cash costs per pound and all-in sustaining costs per pound are non-GAAP financial measures related to our copper mine operations. We believe that C1 cash costs per pound enables investors to better understand the performance of our copper operations in comparison to other copper producers who present results on a similar basis. C1 cash costs per pound excludes royalties and production taxes and non-routine charges as they are not direct production costs. All-in sustaining costs per pound is similar to the gold all-in sustaining costs metric and management uses this to better evaluate the costs of copper production. We believe this measure enables investors to better understand the operating performance of our copper mines as this measure reflects all of the sustaining expenditures incurred in order to produce copper. All-in sustaining costs per pound includes C1 cash costs, sustaining capital expenditures, sustaining leases, general and administrative costs, minesite exploration and evaluation costs, royalties and production taxes, reclamation cost accretion and amortization and write-downs taken on inventory to net realizable value.
| BARRICK FIRST QUARTER 2023 | 56 | MANAGEMENT’S DISCUSSION AND ANALYSIS |
| OVERVIEW | OPERATING PERFORMANCE | GROWTH PROJECTS & EXPLORATION | REVIEW OF FINANCIAL RESULTS |
OTHER INFORMATION & NON-GAAP RECONCILIATIONS
| FINANCIAL STATEMENTS |
Reconciliation of Gold Cost of Sales to Total cash costs, All-in sustaining costs and All-in costs, including on a per ounce basis
| ($ millions, except per ounce information in dollars) | For the three months ended | |||||||||||||||
| Footnote | 3/31/23 | 12/31/22 | 3/31/22 | |||||||||||||
Cost of sales applicable to gold production | 1,761 | 1,890 | 1,582 | |||||||||||||
Depreciation | (445 | ) | (506 | ) | (419 | ) | ||||||||||
Cash cost of sales applicable to equity method investments | 63 | 56 | 51 | |||||||||||||
By-product credits | (61 | ) | (69 | ) | (55 | ) | ||||||||||
Non-recurring items | a | 0 | (23 | ) | 0 | |||||||||||
Other | b | 0 | 7 | (1 | ) | |||||||||||
Non-controlling interests | c | (378 | ) | (393 | ) | (331 | ) | |||||||||
Total cash costs | 940 | 962 | 827 | |||||||||||||
General & administrative costs | 39 | 49 | 54 | |||||||||||||
Minesite exploration and evaluation costs | d | 11 | 23 | 10 | ||||||||||||
Minesite sustaining capital expenditures | e | 454 | 557 | 420 | ||||||||||||
Sustaining leases | 7 | 11 | 9 | |||||||||||||
Rehabilitation - accretion and amortization (operating sites) | f | 14 | 14 | 11 | ||||||||||||
Non-controlling interest, copper operations and other | g | (159 | ) | (239 | ) | (176 | ) | |||||||||
All-in sustaining costs | 1,306 | 1,377 | 1,155 | |||||||||||||
Global exploration and evaluation and project expense | d | 60 | 83 | 57 | ||||||||||||
Community relations costs not related to current operations | 0 | 0 | 0 | |||||||||||||
Project capital expenditures | e | 226 | 324 | 186 | ||||||||||||
Non-sustaining leases | 0 | 0 | 0 | |||||||||||||
Rehabilitation - accretion and amortization (non-operating sites) | f | 6 | 6 | 3 | ||||||||||||
Non-controlling interest and copper operations and other | g | (88 | ) | (130 | ) | (58 | ) | |||||||||
All-in costs | 1,510 | 1,660 | 1,343 | |||||||||||||
Ounces sold - equity basis (000s ounces) | h | 954 | 1,111 | 993 | ||||||||||||
Cost of sales per ounce | i,j | 1,378 | 1,324 | 1,190 | ||||||||||||
Total cash costs per ounce | j | 986 | 868 | 832 | ||||||||||||
Total cash costs per ounce (on a co-product basis) | j,k | 1,030 | 908 | 869 | ||||||||||||
All-in sustaining costs per ounce | j | 1,370 | 1,242 | 1,164 | ||||||||||||
All-in sustaining costs per ounce (on a co-product basis) | j,k | 1,414 | 1,282 | 1,201 | ||||||||||||
All-in costs per ounce | j | 1,583 | 1,496 | 1,353 | ||||||||||||
All-in costs per ounce (on a co-product basis) | j,k | 1,627 | 1,536 | 1,390 | ||||||||||||
| a. | Non-recurring items |
These costs are not indicative of our cost of production and have been excluded from the calculation of total cash costs. Non-recurring items for the three months ended December 31, 2022 relate to a net realizable value impairment of leach pad inventory at Veladero. |
| b. | Other |
Other adjustments for the three month period ended March 31, 2023 include the removal of total cash costs and by-product credits associated with Pierina, Golden Sunlight, and Buzwagi, which all are producing incidental ounces, of $3 million (December 31, 2022: $7 million; March 31, 2022: $3 million). |
| c. | Non-controlling interests |
Non-controlling interests include non-controlling interests related to gold production of $529 million for the three month period ended March 31, 2023 (December 31, 2022: $560 million and March 31, 2022: $476 million). Non-controlling interests include NGM, Pueblo Viejo, Loulo-Gounkoto, Tongon, North Mara and Bulyanhulu. Refer to Note 5 to the Financial Statements for further information. |
| d. | Exploration and evaluation costs |
Exploration, evaluation and project expenses are presented as minesite sustaining if it supports current mine operations and project if it relates to future projects. Refer to page 48 of this MD&A. |
| e. | Capital expenditures |
Capital expenditures are related to our gold sites only and are split between minesite sustaining and project capital expenditures. Project capital expenditures are capital spending at new projects and major, discrete projects at existing operations intended to increase net present value through higher production or longer mine life. Significant projects in the current year are the plant expansion project at Pueblo Viejo, the solar projects at NGM and Loulo-Gounkoto, and the Veladero Phase 7 leach pad expansion. Refer to page 47 of this MD&A. |
| f. | Rehabilitation—accretion and amortization |
Includes depreciation on the assets related to rehabilitation provisions of our gold operations and accretion on the rehabilitation provision of our gold operations, split between operating and non-operating sites. |
| g. | Non-controlling interest and copper operations |
Removes general & administrative costs related to non-controlling interests and copper based on a percentage allocation of revenue. Also removes exploration, evaluation and project expenses, rehabilitation costs and capital expenditures incurred by our copper sites and the non-controlling interest of NGM, Pueblo Viejo, Loulo-Gounkoto, Tongon, North Mara and Bulyanhulu operating segments. It also includes capital expenditures applicable to our equity method investment in Kibali. Figures remove the impact of Pierina, Golden Sunlight, and Buzwagi. The impact is summarized as the following: |
| BARRICK FIRST QUARTER 2023 | 57 | MANAGEMENT’S DISCUSSION AND ANALYSIS |
| OVERVIEW | OPERATING PERFORMANCE | GROWTH PROJECTS & EXPLORATION | REVIEW OF FINANCIAL RESULTS |
OTHER INFORMATION & NON-GAAP RECONCILIATIONS
| FINANCIAL STATEMENTS |
| ($ millions) | For the three months ended | |||||||||||
| Non-controlling interest, copper operations and other | 3/31/23 | 12/31/22 | 3/31/22 | |||||||||
General & administrative costs | (6 | ) | (8 | ) | (13 | ) | ||||||
Minesite exploration and evaluation expenses | (4 | ) | (8 | ) | (3 | ) | ||||||
Rehabilitation - accretion and amortization (operating sites) | (5 | ) | (6 | ) | (3 | ) | ||||||
Minesite sustaining capital expenditures | (144 | ) | (217 | ) | (157 | ) | ||||||
All-in sustaining costs total | (159 | ) | (239 | ) | (176 | ) | ||||||
Global exploration and evaluation and project expense | (12 | ) | (8 | ) | (4 | ) | ||||||
Project capital expenditures | (76 | ) | (122 | ) | (54 | ) | ||||||
All-in costs total | (88 | ) | (130 | ) | (58 | ) | ||||||
| h. | Ounces sold - equity basis |
Figures remove the impact of: Pierina and Buzwagi. Some of these assets are producing incidental ounces while in closure or care and maintenance. |
| i. | Cost of sales per ounce |
Figures remove the cost of sales impact of: Pierina of $3 million for the three month period ended March 31, 2023 (December 31, 2022: $7 million and March 31, 2022: $3 million); Golden Sunlight of $nil and $nil, respectively, for the three month period ended March 31, 2023 (December 31, 2022: $nil and March 31, 2022: $nil); Buzwagi of $nil for the three month period ended March 31, 2023 (December 31, 2022: $nil and March 31, 2022: $nil), which are producing incidental ounces. Gold cost of sales per ounce is calculated as cost of sales across our gold operations (excluding sites in closure or care and maintenance) divided by ounces sold (both on an attributable basis using Barrick’s ownership share). |
| j. | Per ounce figures |
Cost of sales per ounce, total cash costs per ounce, all-in sustaining costs per ounce and all-in costs per ounce may not calculate based on amounts presented in this table due to rounding. |
| k. | Co-product costs per ounce |
Total cash costs per ounce, all-in sustaining costs per ounce and all-in costs per ounce presented on a co-product basis removes the impact of by-product credits of our gold production (net of non-controlling interest) calculated as: |
| ($ millions) | For the three months ended | |||||||||||
| 3/31/23 | 12/31/22 | 3/31/22 | ||||||||||
By-product credits | 61 | 69 | 55 | |||||||||
Non-controlling interest | (19 | ) | (25 | ) | (19 | ) | ||||||
By-product credits (net of non-controlling interest) | 42 | 44 | 36 | |||||||||
| BARRICK FIRST QUARTER 2023 | 58 | MANAGEMENT’S DISCUSSION AND ANALYSIS |
| OVERVIEW | OPERATING PERFORMANCE | GROWTH PROJECTS & EXPLORATION | REVIEW OF FINANCIAL RESULTS |
OTHER INFORMATION & NON-GAAP RECONCILIATIONS
| FINANCIAL STATEMENTS |
Reconciliation of Gold Cost of Sales to Total cash costs, All-in sustaining costs and All-in costs, including on a per ounce basis, by operating segment
| ($ millions, except per ounce information in dollars) | For the three months ended 3/31/23 | |||||||||||||||||||||||||||||||||||
| Footnote | Carlin | Corteza | Turquoise Ridge | Long Canyon | Phoenix | Nevada Gold Minesb | Hemlo | North America | ||||||||||||||||||||||||||||
Cost of sales applicable to gold production | 393 | 295 | 189 | 6 | 99 | 982 | 59 | 1,041 | ||||||||||||||||||||||||||||
Depreciation | (63 | ) | (91 | ) | (50 | ) | (4 | ) | (19 | ) | (227 | ) | (8 | ) | (235 | ) | ||||||||||||||||||||
By-product credits | (1 | ) | (1 | ) | (1 | ) | 0 | (38 | ) | (41 | ) | 0 | (41 | ) | ||||||||||||||||||||||
Non-recurring items | c | 0 | 0 | 0 | 0 | 0 | 0 | 0 | 0 | |||||||||||||||||||||||||||
Other | d | (5 | ) | 0 | 0 | 0 | 7 | 2 | 0 | 2 | ||||||||||||||||||||||||||
Non-controlling interests | (125 | ) | (78 | ) | (53 | ) | (1 | ) | (18 | ) | (275 | ) | 0 | (275 | ) | |||||||||||||||||||||
Total cash costs | 199 | 125 | 85 | 1 | 31 | 441 | 51 | 492 | ||||||||||||||||||||||||||||
General & administrative costs | 0 | 0 | 0 | 0 | 0 | 0 | 0 | 0 | ||||||||||||||||||||||||||||
Minesite exploration and evaluation costs | e | 8 | 0 | 1 | 0 | 0 | 10 | 0 | 10 | |||||||||||||||||||||||||||
Minesite sustaining capital expenditures | f | 116 | 67 | 30 | 0 | 6 | 224 | 12 | 236 | |||||||||||||||||||||||||||
Sustaining capital leases | 0 | 0 | 0 | 0 | 0 | 0 | 1 | 1 | ||||||||||||||||||||||||||||
Rehabilitation - accretion and amortization (operating sites) | g | 3 | 4 | 1 | 0 | 1 | 9 | 0 | 9 | |||||||||||||||||||||||||||
Non-controlling interests | (49 | ) | (27 | ) | (13 | ) | 0 | (3 | ) | (94 | ) | 0 | (94 | ) | ||||||||||||||||||||||
All-in sustaining costs | 277 | 169 | 104 | 1 | 35 | 590 | 64 | 654 | ||||||||||||||||||||||||||||
Global exploration and evaluation and project expense | e | 0 | 0 | 0 | 0 | 0 | 0 | 0 | 0 | |||||||||||||||||||||||||||
Project capital expenditures | f | 0 | 24 | 5 | 0 | 0 | 53 | 0 | 53 | |||||||||||||||||||||||||||
Non-controlling interests | 0 | (9 | ) | (2 | ) | 0 | 0 | (20 | ) | 0 | (20 | ) | ||||||||||||||||||||||||
All-in costs | 277 | 184 | 107 | 1 | 35 | 623 | 64 | 687 | ||||||||||||||||||||||||||||
Ounces sold - equity basis (000s ounces) | 164 | 137 | 82 | 2 | 26 | 411 | 40 | 451 | ||||||||||||||||||||||||||||
Cost of sales per ounce | h,i | 1,449 | 1,324 | 1,412 | 1,621 | 2,380 | 1,461 | 1,486 | 1,463 | |||||||||||||||||||||||||||
Total cash costs per ounce | i | 1,215 | 913 | 1,034 | 579 | 1,198 | 1,074 | 1,291 | 1,093 | |||||||||||||||||||||||||||
Total cash costs per ounce (on a co-product basis) | i,j | 1,218 | 916 | 1,041 | 579 | 1,930 | 1,124 | 1,296 | 1,139 | |||||||||||||||||||||||||||
All-in sustaining costs per ounce | i | 1,689 | 1,233 | 1,271 | 629 | 1,365 | 1,436 | 1,609 | 1,451 | |||||||||||||||||||||||||||
All-in sustaining costs per ounce (on a co-product basis) | i,j | 1,692 | 1,236 | 1,278 | 629 | 2,097 | 1,486 | 1,614 | 1,497 | |||||||||||||||||||||||||||
All-in costs per ounce | i | 1,689 | 1,340 | 1,306 | 629 | 1,365 | 1,514 | 1,610 | 1,522 | |||||||||||||||||||||||||||
All-in costs per ounce (on a co-product basis) | i,j | 1,692 | 1,343 | 1,313 | 629 | 2,097 | 1,564 | 1,615 | 1,568 | |||||||||||||||||||||||||||
| ($ millions, except per ounce information in dollars) | For the three months ended 3/31/23 | |||||||||||||||||||||||||||||||||||
| Footnote | Pueblo Viejo | Veladero | Latin America & Asia Pacific | |||||||||||||||||||||||||||||||||
Cost of sales applicable to gold production | 184 | 70 | 254 | |||||||||||||||||||||||||||||||||
Depreciation | (64 | ) | (22 | ) | (86 | ) | ||||||||||||||||||||||||||||||
By-product credits | (12 | ) | (2 | ) | (14 | ) | ||||||||||||||||||||||||||||||
Non-recurring items | c | 0 | 0 | 0 | ||||||||||||||||||||||||||||||||
Other | d | 0 | 0 | 0 | ||||||||||||||||||||||||||||||||
Non-controlling interests | (44 | ) | 0 | (44 | ) | |||||||||||||||||||||||||||||||
Total cash costs | 64 | 46 | 110 | |||||||||||||||||||||||||||||||||
General & administrative costs | 0 | 0 | 0 | |||||||||||||||||||||||||||||||||
Minesite exploration and evaluation costs | e | 0 | 1 | 1 | ||||||||||||||||||||||||||||||||
Minesite sustaining capital expenditures | f | 52 | 30 | 82 | ||||||||||||||||||||||||||||||||
Sustaining capital leases | 0 | 1 | 1 | |||||||||||||||||||||||||||||||||
Rehabilitation - accretion and amortization (operating sites) | g | 1 | 0 | 1 | ||||||||||||||||||||||||||||||||
Non-controlling interests | (21 | ) | 0 | (21 | ) | |||||||||||||||||||||||||||||||
All-in sustaining costs | 96 | 78 | 174 | |||||||||||||||||||||||||||||||||
Global exploration and evaluation and project expense | e | 0 | 0 | 0 | ||||||||||||||||||||||||||||||||
Project capital expenditures | f | 61 | 6 | 67 | ||||||||||||||||||||||||||||||||
Non-controlling interests | (24 | ) | 0 | (24 | ) | |||||||||||||||||||||||||||||||
All-in costs | 133 | 84 | 217 | |||||||||||||||||||||||||||||||||
Ounces sold - equity basis (000s ounces) | 90 | 44 | 134 | |||||||||||||||||||||||||||||||||
Cost of sales per ounce | h,i | 1,241 | 1,587 | 1,377 | ||||||||||||||||||||||||||||||||
Total cash costs per ounce | i | 714 | 1,035 | 819 | ||||||||||||||||||||||||||||||||
Total cash costs per ounce (on a co-product basis) | i,j | 808 | 1,074 | 895 | ||||||||||||||||||||||||||||||||
All-in sustaining costs per ounce | i | 1,073 | 1,761 | 1,304 | ||||||||||||||||||||||||||||||||
All-in sustaining costs per ounce (on a co-product basis) | i,j | 1,167 | 1,800 | 1,380 | ||||||||||||||||||||||||||||||||
All-in costs per ounce | i | 1,481 | 1,910 | 1,661 | ||||||||||||||||||||||||||||||||
All-in costs per ounce (on a co-product basis) | i,j | 1,575 | 1,949 | 1,737 | ||||||||||||||||||||||||||||||||
| BARRICK FIRST QUARTER 2023 | 59 | MANAGEMENT’S DISCUSSION AND ANALYSIS |
| OVERVIEW | OPERATING PERFORMANCE | GROWTH PROJECTS & EXPLORATION | REVIEW OF FINANCIAL RESULTS |
OTHER INFORMATION & NON-GAAP RECONCILIATIONS
| FINANCIAL STATEMENTS |
| ($ millions, except per ounce information in dollars) | For the three months ended 3/31/23 | |||||||||||||||||||||||||
| Footnote | Loulo- Gounkoto | Kibali | North Mara | Tongon | Bulyanhulu | Africa & Middle East | ||||||||||||||||||||
Cost of sales applicable to gold production | 215 | 91 | 83 | 83 | 74 | 546 | ||||||||||||||||||||
Depreciation | (71 | ) | (25 | ) | (19 | ) | (15 | ) | (16 | ) | (146 | ) | ||||||||||||||
By-product credits | 0 | 0 | (1 | ) | 0 | (5 | ) | (6 | ) | |||||||||||||||||
Non-recurring items | c | 0 | 0 | 0 | 0 | 0 | 0 | |||||||||||||||||||
Other | d | 0 | 0 | 0 | 0 | 0 | 0 | |||||||||||||||||||
Non-controlling interests | (29 | ) | 0 | (10 | ) | (7 | ) | (8 | ) | (54 | ) | |||||||||||||||
Total cash costs | 115 | 66 | 53 | 61 | 45 | 340 | ||||||||||||||||||||
General & administrative costs | 0 | 0 | 0 | 0 | 0 | 0 | ||||||||||||||||||||
Minesite exploration and evaluation costs | e | 0 | 0 | 0 | 0 | 0 | 0 | |||||||||||||||||||
Minesite sustaining capital expenditures | f | 55 | 12 | 30 | 4 | 19 | 120 | |||||||||||||||||||
Sustaining capital leases | 1 | 0 | 0 | 0 | 0 | 1 | ||||||||||||||||||||
Rehabilitation - accretion and amortization (operating sites) | g | 0 | 0 | 1 | 1 | 0 | 2 | |||||||||||||||||||
Non-controlling interests | (11 | ) | 0 | (5 | ) | 0 | (3 | ) | (19 | ) | ||||||||||||||||
All-in sustaining costs | 160 | 78 | 79 | 66 | 61 | 444 | ||||||||||||||||||||
Global exploration and evaluation and project expense | e | 0 | 0 | 0 | 0 | 0 | 0 | |||||||||||||||||||
Project capital expenditures | f | 49 | 7 | 12 | 0 | 5 | 73 | |||||||||||||||||||
Non-controlling interests | (10 | ) | 0 | (2 | ) | 0 | (1 | ) | (13 | ) | ||||||||||||||||
All-in costs | 199 | 85 | 89 | 66 | 65 | 504 | ||||||||||||||||||||
Ounces sold - equity basis (000s ounces) | 134 | 67 | 70 | 52 | 46 | 369 | ||||||||||||||||||||
Cost of sales per ounce | h,i | 1,275 | 1,367 | 987 | 1,453 | 1,358 | 1,272 | |||||||||||||||||||
Total cash costs per ounce | i | 855 | 987 | 759 | 1,182 | 982 | 922 | |||||||||||||||||||
Total cash costs per ounce (on a co-product basis) | i,j | 855 | 993 | 765 | 1,185 | 1,070 | 936 | |||||||||||||||||||
All-in sustaining costs per ounce | i | 1,190 | 1,177 | 1,137 | 1,284 | 1,332 | 1,208 | |||||||||||||||||||
All-in sustaining costs per ounce (on a co-product basis) | i,j | 1,190 | 1,183 | 1,143 | 1,287 | 1,420 | 1,222 | |||||||||||||||||||
All-in costs per ounce | i | 1,485 | 1,289 | 1,278 | 1,284 | 1,423 | 1,374 | |||||||||||||||||||
All-in costs per ounce (on a co-product basis) | i,j | 1,485 | 1,295 | 1,284 | 1,287 | 1,511 | 1,388 | |||||||||||||||||||
| ($ millions, except per ounce information in dollars) | For the three months ended 12/31/22 | |||||||||||||||||||||||||||||||||
| Footnote | Carlin | Corteza | Turquoise Ridge | Long Canyon | Phoenix | Nevada Gold Minesb | Hemlo | North America | ||||||||||||||||||||||||||
Cost of sales applicable to gold production | 473 | 287 | 182 | 9 | 97 | 1,054 | 55 | 1,109 | ||||||||||||||||||||||||||
Depreciation | (89 | ) | (97 | ) | (51 | ) | (6 | ) | (18 | ) | (262 | ) | (8 | ) | (270 | ) | ||||||||||||||||||
By-product credits | (1 | ) | 0 | 0 | 0 | (44 | ) | (45 | ) | (1 | ) | (46 | ) | |||||||||||||||||||||
Non-recurring items | c | 0 | 0 | 0 | 0 | 0 | 0 | 0 | 0 | |||||||||||||||||||||||||
Other | d | (6 | ) | 0 | 0 | 0 | 14 | 8 | 0 | 8 | ||||||||||||||||||||||||
Non-controlling interests | (145 | ) | (73 | ) | (51 | ) | (1 | ) | (19 | ) | (291 | ) | 0 | (291 | ) | |||||||||||||||||||
Total cash costs | 232 | 117 | 80 | 2 | 30 | 464 | 46 | 510 | ||||||||||||||||||||||||||
General & administrative costs | 0 | 0 | 0 | 0 | 0 | 0 | 0 | 0 | ||||||||||||||||||||||||||
Minesite exploration and evaluation costs | e | 6 | 1 | 2 | 1 | 0 | 10 | 1 | 11 | |||||||||||||||||||||||||
Minesite sustaining capital expenditures | f | 138 | 37 | 24 | 0 | 3 | 208 | 11 | 219 | |||||||||||||||||||||||||
Sustaining capital leases | 0 | 0 | 0 | 0 | 1 | 2 | 0 | 2 | ||||||||||||||||||||||||||
Rehabilitation - accretion and amortization (operating sites) | g | 2 | 4 | 1 | 0 | 0 | 7 | 1 | 8 | |||||||||||||||||||||||||
Non-controlling interests | (56 | ) | (17 | ) | (10 | ) | (1 | ) | (2 | ) | (91 | ) | 0 | (91 | ) | |||||||||||||||||||
All-in sustaining costs | 322 | 142 | 97 | 2 | 32 | 600 | 59 | 659 | ||||||||||||||||||||||||||
Global exploration and evaluation and project expense | e | 0 | 0 | 0 | 0 | 0 | 0 | 0 | 0 | |||||||||||||||||||||||||
Project capital expenditures | f | 0 | 32 | 15 | 0 | 0 | 68 | 0 | 68 | |||||||||||||||||||||||||
Non-controlling interests | 0 | (12 | ) | (7 | ) | 0 | 0 | (27 | ) | 0 | (27 | ) | ||||||||||||||||||||||
All-in costs | 322 | 162 | 105 | 2 | 32 | 641 | 59 | 700 | ||||||||||||||||||||||||||
Ounces sold - equity basis (000s ounces) | 266 | 137 | 74 | 3 | 31 | 511 | 38 | 549 | ||||||||||||||||||||||||||
Cost of sales per ounce | h,i | 1,081 | 1,284 | 1,518 | 1,812 | 1,901 | 1,257 | 1,451 | 1,271 | |||||||||||||||||||||||||
Total cash costs per ounce | i | 878 | 848 | 1,089 | 616 | 946 | 906 | 1,227 | 928 | |||||||||||||||||||||||||
Total cash costs per ounce (on a co-product basis) | i,j | 879 | 850 | 1,092 | 616 | 1,533 | 943 | 1,233 | 963 | |||||||||||||||||||||||||
All-in sustaining costs per ounce | i | 1,217 | 1,037 | 1,304 | 664 | 1,037 | 1,179 | 1,557 | 1,205 | |||||||||||||||||||||||||
All-in sustaining costs per ounce (on a co-product basis) | i,j | 1,218 | 1,039 | 1,307 | 664 | 1,624 | 1,216 | 1,563 | 1,240 | |||||||||||||||||||||||||
All-in costs per ounce | i | 1,217 | 1,175 | 1,424 | 664 | 1,037 | 1,260 | 1,558 | 1,280 | |||||||||||||||||||||||||
All-in costs per ounce (on a co-product basis) | i,j | 1,218 | 1,177 | 1,427 | 664 | 1,624 | 1,297 | 1,564 | 1,315 | |||||||||||||||||||||||||
| BARRICK FIRST QUARTER 2023 | 60 | MANAGEMENT’S DISCUSSION AND ANALYSIS |
| OVERVIEW | OPERATING PERFORMANCE | GROWTH PROJECTS & EXPLORATION | REVIEW OF FINANCIAL RESULTS |
OTHER INFORMATION & NON-GAAP RECONCILIATIONS
| FINANCIAL STATEMENTS |
| ($ millions, except per ounce information in dollars) | For the three months ended 12/31/22 | |||||||||||||
| Footnote | Pueblo Viejo | Veladero | Latin America & Asia Pacific | |||||||||||
Cost of sales applicable to gold production | 193 | 122 | 315 | |||||||||||
Depreciation | (60 | ) | (47 | ) | (107 | ) | ||||||||
By-product credits | (12 | ) | (1 | ) | (13 | ) | ||||||||
Non-recurring items | c | 0 | (23 | ) | (23 | ) | ||||||||
Other | d | 0 | 0 | 0 | ||||||||||
Non-controlling interests | (48 | ) | 0 | (48 | ) | |||||||||
Total cash costs | 73 | 51 | 124 | |||||||||||
General & administrative costs | 0 | 0 | 0 | |||||||||||
Minesite exploration and evaluation costs | e | 1 | 1 | 2 | ||||||||||
Minesite sustaining capital expenditures | f | 47 | 29 | 76 | ||||||||||
Sustaining capital leases | 0 | 0 | 0 | |||||||||||
Rehabilitation - accretion and amortization (operating sites) | g | 0 | 0 | 0 | ||||||||||
Non-controlling interests | (19 | ) | 0 | (19 | ) | |||||||||
All-in sustaining costs | 102 | 81 | 183 | |||||||||||
Global exploration and evaluation and project expense | e | 1 | 0 | 1 | ||||||||||
Project capital expenditures | f | 110 | 10 | 120 | ||||||||||
Non-controlling interests | (45 | ) | 0 | (45 | ) | |||||||||
All-in costs | 168 | 91 | 259 | |||||||||||
Ounces sold - equity basis (000s ounces) | 96 | 53 | 149 | |||||||||||
Cost of sales per ounce | h,i | 1,215 | 2,309 | 1,614 | ||||||||||
Total cash costs per ounce | i | 764 | 954 | 829 | ||||||||||
Total cash costs per ounce (on a co-product basis) | i,j | 835 | 990 | 888 | ||||||||||
All-in sustaining costs per ounce | i | 1,065 | 1,526 | 1,231 | ||||||||||
All-in sustaining costs per ounce (on a co-product basis) | i,j | 1,136 | 1,562 | 1,290 | ||||||||||
All-in costs per ounce | i | 1,757 | 1,731 | 1,821 | ||||||||||
All-in costs per ounce (on a co-product basis) | i,j | 1,828 | 1,767 | 1,880 | ||||||||||
| ($ millions, except per ounce information in dollars) | For the three months ended 12/31/22 | |||||||||||||||||||||||||
| Footnote | Loulo- Gounkoto | Kibali | North Mara | Tongon | Bulyanhulu | Africa & Middle East | ||||||||||||||||||||
Cost of sales applicable to gold production | 215 | 149 | 86 | 92 | 71 | 613 | ||||||||||||||||||||
Depreciation | (70 | ) | (90 | ) | (22 | ) | (20 | ) | (14 | ) | (216 | ) | ||||||||||||||
By-product credits | 0 | 0 | (1 | ) | (1 | ) | (6 | ) | (8 | ) | ||||||||||||||||
Non-recurring items | c | 0 | 0 | 0 | 0 | 0 | 0 | |||||||||||||||||||
Other | d | 0 | 0 | 0 | 0 | 0 | 0 | |||||||||||||||||||
Non-controlling interests | (29 | ) | 0 | (10 | ) | (7 | ) | (8 | ) | (54 | ) | |||||||||||||||
Total cash costs | 116 | 59 | 53 | 64 | 43 | 335 | ||||||||||||||||||||
General & administrative costs | 0 | 0 | 0 | 0 | 0 | 0 | ||||||||||||||||||||
Minesite exploration and evaluation costs | e | 3 | 1 | 1 | 1 | 3 | 9 | |||||||||||||||||||
Minesite sustaining capital expenditures | f | 45 | 28 | 43 | 20 | 26 | 162 | |||||||||||||||||||
Sustaining capital leases | 1 | 2 | 0 | 0 | 0 | 3 | ||||||||||||||||||||
Rehabilitation - accretion and amortization (operating sites) | g | 0 | 1 | 2 | 0 | 0 | 3 | |||||||||||||||||||
Non-controlling interests | (9 | ) | 0 | (7 | ) | (2 | ) | (4 | ) | (22 | ) | |||||||||||||||
All-in sustaining costs | 156 | 91 | 92 | 83 | 68 | 490 | ||||||||||||||||||||
Global exploration and evaluation and project expense | e | 0 | 0 | 0 | 0 | 0 | 0 | |||||||||||||||||||
Project capital expenditures | f | 50 | 7 | 18 | 0 | 8 | 83 | |||||||||||||||||||
Non-controlling interests | (10 | ) | 0 | (3 | ) | 0 | (2 | ) | (15 | ) | ||||||||||||||||
All-in costs | 196 | 98 | 107 | 83 | 74 | 558 | ||||||||||||||||||||
Ounces sold - equity basis (000s ounces) | 141 | 94 | 70 | 59 | 49 | 413 | ||||||||||||||||||||
Cost of sales per ounce | h,i | 1,216 | 1,570 | 1,030 | 1,381 | 1,237 | 1,291 | |||||||||||||||||||
Total cash costs per ounce | i | 822 | 617 | 758 | 1,070 | 896 | 808 | |||||||||||||||||||
Total cash costs per ounce (on a co-product basis) | i,j | 822 | 621 | 764 | 1,073 | 993 | 822 | |||||||||||||||||||
All-in sustaining costs per ounce | i | 1,102 | 981 | 1,301 | 1,404 | 1,401 | 1,186 | |||||||||||||||||||
All-in sustaining costs per ounce (on a co-product basis) | i,j | 1,102 | 985 | 1,307 | 1,407 | 1,498 | 1,200 | |||||||||||||||||||
All-in costs per ounce | i | 1,386 | 1,044 | 1,519 | 1,404 | 1,536 | 1,351 | |||||||||||||||||||
All-in costs per ounce (on a co-product basis) | i,j | 1,386 | 1,048 | 1,525 | 1,407 | 1,633 | 1,365 | |||||||||||||||||||
| BARRICK FIRST QUARTER 2023 | 61 | MANAGEMENT’S DISCUSSION AND ANALYSIS |
| OVERVIEW | OPERATING PERFORMANCE | GROWTH PROJECTS & EXPLORATION | REVIEW OF FINANCIAL RESULTS |
OTHER INFORMATION & NON-GAAP RECONCILIATIONS
| FINANCIAL STATEMENTS |
| ($ millions, except per ounce information in dollars) | For the three months ended 3/31/22 | |||||||||||||||||||||||||||||||||
| Footnote | Carlin | Corteza | Turquoise Ridge | Long Canyon | Phoenix | Nevada Gold Minesb | Hemlo | North America | ||||||||||||||||||||||||||
Cost of sales applicable to gold production | 379 | 214 | 149 | 45 | 79 | 866 | 54 | 920 | ||||||||||||||||||||||||||
Depreciation | (69 | ) | (62 | ) | (42 | ) | (31 | ) | (18 | ) | (222 | ) | (7 | ) | (229 | ) | ||||||||||||||||||
By-product credits | 0 | (1 | ) | 0 | 0 | (34 | ) | (35 | ) | 0 | (35 | ) | ||||||||||||||||||||||
Non-recurring items | c | 0 | 0 | 0 | 0 | 0 | 0 | 0 | 0 | |||||||||||||||||||||||||
Other | d | 0 | 0 | 0 | 0 | 2 | 2 | 0 | 2 | |||||||||||||||||||||||||
Non-controlling interests | (119 | ) | (58 | ) | (41 | ) | (5 | ) | (11 | ) | (234 | ) | 0 | (234 | ) | |||||||||||||||||||
Total cash costs | 191 | 93 | 66 | 9 | 18 | 377 | 47 | 424 | ||||||||||||||||||||||||||
General & administrative costs | 0 | 0 | 0 | 0 | 0 | 0 | 0 | 0 | ||||||||||||||||||||||||||
Minesite exploration and evaluation costs | e | 2 | 3 | 0 | 0 | 0 | 5 | 1 | 6 | |||||||||||||||||||||||||
Minesite sustaining capital expenditures | f | 111 | 66 | 26 | 0 | 5 | 209 | 13 | 222 | |||||||||||||||||||||||||
Sustaining capital leases | 0 | 0 | 0 | 0 | 1 | 2 | 1 | 3 | ||||||||||||||||||||||||||
Rehabilitation - accretion and amortization (operating sites) | g | 2 | 2 | 0 | 0 | 1 | 5 | 0 | 5 | |||||||||||||||||||||||||
Non-controlling interests | (45 | ) | (28 | ) | (10 | ) | 0 | (3 | ) | (87 | ) | 0 | (87 | ) | ||||||||||||||||||||
All-in sustaining costs | 261 | 136 | 82 | 9 | 22 | 511 | 62 | 573 | ||||||||||||||||||||||||||
Global exploration and evaluation and project expense | e | 0 | 0 | 0 | 0 | 0 | 0 | 0 | 0 | |||||||||||||||||||||||||
Project capital expenditures | f | 0 | 20 | 10 | 0 | 0 | 49 | 0 | 49 | |||||||||||||||||||||||||
Non-controlling interests | 0 | (8 | ) | (4 | ) | 0 | 0 | (19 | ) | 0 | (19 | ) | ||||||||||||||||||||||
All-in costs | 261 | 148 | 88 | 9 | 22 | 541 | 62 | 603 | ||||||||||||||||||||||||||
Ounces sold - equity basis (000s ounces) | 230 | 118 | 64 | 25 | 21 | 458 | 31 | 489 | ||||||||||||||||||||||||||
Cost of sales per ounce | h,i | 1,015 | 1,113 | 1,436 | 1,093 | 2,253 | 1,169 | 1,727 | 1,205 | |||||||||||||||||||||||||
Total cash costs per ounce | i | 829 | 784 | 1,030 | 342 | 835 | 820 | 1,503 | 863 | |||||||||||||||||||||||||
Total cash costs per ounce (on a co-product basis) | i,j | 830 | 790 | 1,035 | 343 | 1,730 | 865 | 1,512 | 905 | |||||||||||||||||||||||||
All-in sustaining costs per ounce | i | 1,139 | 1,150 | 1,281 | 366 | 1,027 | 1,118 | 1,982 | 1,173 | |||||||||||||||||||||||||
All-in sustaining costs per ounce (on a co-product basis) | i,j | 1,140 | 1,156 | 1,286 | 367 | 1,922 | 1,163 | 1,991 | 1,215 | |||||||||||||||||||||||||
All-in costs per ounce | i | 1,139 | 1,257 | 1,376 | 366 | 1,027 | 1,184 | 1,983 | 1,235 | |||||||||||||||||||||||||
All-in costs per ounce (on a co-product basis) | i,j | 1,140 | 1,263 | 1,381 | 367 | 1,922 | 1,229 | 1,992 | 1,277 | |||||||||||||||||||||||||
| ($ millions, except per ounce information in dollars) | For the three months ended 3/31/22 | |||||||||||||
| Footnote | Pueblo Viejo | Veladero | Latin America & Asia Pacific | |||||||||||
Cost of sales applicable to gold production | 187 | 54 | 241 | |||||||||||
Depreciation | (58 | ) | (19 | ) | (77 | ) | ||||||||
By-product credits | (11 | ) | (1 | ) | (12 | ) | ||||||||
Non-recurring items | c | 0 | 0 | 0 | ||||||||||
Other | d | 0 | 0 | 0 | ||||||||||
Non-controlling interests | (47 | ) | 0 | (47 | ) | |||||||||
Total cash costs | 71 | 34 | 105 | |||||||||||
General & administrative costs | 0 | 0 | 0 | |||||||||||
Minesite exploration and evaluation costs | e | 0 | 0 | 0 | ||||||||||
Minesite sustaining capital expenditures | f | 44 | 28 | 72 | ||||||||||
Sustaining capital leases | 0 | 1 | 1 | |||||||||||
Rehabilitation - accretion and amortization (operating sites) | g | 2 | 1 | 3 | ||||||||||
Non-controlling interests | (18 | ) | 0 | (18 | ) | |||||||||
All-in sustaining costs | 99 | 64 | 163 | |||||||||||
Global exploration and evaluation and project expense | e | 0 | 0 | 0 | ||||||||||
Project capital expenditures | f | 79 | 8 | 87 | ||||||||||
Non-controlling interests | (32 | ) | 0 | (32 | ) | |||||||||
All-in costs | 146 | 72 | 218 | |||||||||||
Ounces sold - equity basis (000s ounces) | 104 | 39 | 143 | |||||||||||
Cost of sales per ounce | h,i | 1,077 | 1,348 | 1,176 | ||||||||||
Total cash costs per ounce | i | 682 | 847 | 728 | ||||||||||
Total cash costs per ounce (on a co-product basis) | i,j | 744 | 867 | 778 | ||||||||||
All-in sustaining costs per ounce | i | 948 | 1,588 | 1,133 | ||||||||||
All-in sustaining costs per ounce (on a co-product basis) | i,j | 1,010 | 1,608 | 1,183 | ||||||||||
All-in costs per ounce | i | 1,401 | 1,794 | 1,520 | ||||||||||
All-in costs per ounce (on a co-product basis) | i,j | 1,463 | 1,814 | 1,570 | ||||||||||
| BARRICK FIRST QUARTER 2023 | 62 | MANAGEMENT’S DISCUSSION AND ANALYSIS |
| OVERVIEW | OPERATING PERFORMANCE | GROWTH PROJECTS & EXPLORATION | REVIEW OF FINANCIAL RESULTS |
OTHER INFORMATION & NON-GAAP RECONCILIATIONS
| FINANCIAL STATEMENTS |
| ($ millions, except per ounce information in dollars) | For the three months ended 3/31/22 | |||||||||||||||||||||||||
| Footnote | Loulo- Gounkoto | Kibali | North Mara | Tongon | Bulyanhulu | Africa & Middle East | ||||||||||||||||||||
Cost of sales applicable to gold production | 186 | 83 | 60 | 85 | 79 | 493 | ||||||||||||||||||||
Depreciation | (63 | ) | (28 | ) | (10 | ) | (15 | ) | (17 | ) | (133 | ) | ||||||||||||||
By-product credits | 0 | 0 | 0 | 0 | (7 | ) | (7 | ) | ||||||||||||||||||
Non-recurring items | c | 0 | 0 | 0 | 0 | 0 | 0 | |||||||||||||||||||
Other | d | 0 | 0 | 0 | 0 | 0 | 0 | |||||||||||||||||||
Non-controlling interests | (25 | ) | 0 | (8 | ) | (7 | ) | (9 | ) | (49 | ) | |||||||||||||||
Total cash costs | 98 | 55 | 42 | 63 | 46 | 304 | ||||||||||||||||||||
General & administrative costs | 0 | 0 | 0 | 0 | 0 | 0 | ||||||||||||||||||||
Minesite exploration and evaluation costs | e | 2 | 3 | 1 | 1 | 0 | 7 | |||||||||||||||||||
Minesite sustaining capital expenditures | f | 42 | 15 | 9 | 4 | 9 | 79 | |||||||||||||||||||
Sustaining capital leases | 0 | 0 | 0 | 0 | 0 | 0 | ||||||||||||||||||||
Rehabilitation - accretion and amortization (operating sites) | g | 1 | 0 | 1 | 0 | 0 | 2 | |||||||||||||||||||
Non-controlling interests | (9 | ) | 0 | (2 | ) | (1 | ) | (2 | ) | (14 | ) | |||||||||||||||
All-in sustaining costs | 134 | 73 | 51 | 67 | 53 | 378 | ||||||||||||||||||||
Global exploration and evaluation and project expense | e | 0 | 0 | 0 | 0 | 0 | 0 | |||||||||||||||||||
Project capital expenditures | f | 22 | 4 | 13 | 0 | 4 | 43 | |||||||||||||||||||
Non-controlling interests | (4 | ) | 0 | (2 | ) | 0 | 0 | (6 | ) | |||||||||||||||||
All-in costs | 152 | 77 | 62 | 67 | 57 | 415 | ||||||||||||||||||||
Ounces sold - equity basis (000s ounces) | 137 | 73 | 58 | 38 | 55 | 361 | ||||||||||||||||||||
Cost of sales per ounce | h,i | 1,088 | 1,137 | 852 | 2,036 | 1,216 | 1,178 | |||||||||||||||||||
Total cash costs per ounce | i | 721 | 744 | 709 | 1,667 | 847 | 842 | |||||||||||||||||||
Total cash costs per ounce (on a co-product basis) | i,j | 721 | 749 | 715 | 1,670 | 956 | 861 | |||||||||||||||||||
All-in sustaining costs per ounce | i | 982 | 996 | 874 | 1,803 | 984 | 1,053 | |||||||||||||||||||
All-in sustaining costs per ounce (on a co-product basis) | i,j | 982 | 1,001 | 880 | 1,806 | 1,093 | 1,072 | |||||||||||||||||||
All-in costs per ounce | i | 1,110 | 1,045 | 1,057 | 1,803 | 1,052 | 1,152 | |||||||||||||||||||
All-in costs per ounce (on a co-product basis) | i,j | 1,110 | 1,050 | 1,063 | 1,806 | 1,161 | 1,171 | |||||||||||||||||||
| a. | Includes Goldrush. |
| b. | These results represent our 61.5% interest in Carlin, Cortez, Turquoise Ridge, Phoenix and Long Canyon. |
| c. | Non-recurring items |
These costs are not indicative of our cost of production and have been excluded from the calculation of total cash costs. Non-recurring items at Veladero for the three months ended December 31, 2022 relate to a net realizable value impairment of leach pad inventory. |
| d. | Other |
Other adjustments for the three month period ended March 31, 2023 at Carlin include the removal of total cash costs and by-product credits associated with Emigrant starting the second quarter of 2022, which is producing incidental ounces. |
| e. | Exploration and evaluation costs |
Exploration, evaluation and project expenses are presented as minesite sustaining if it supports current mine operations and project if it relates to future projects. Refer to page 48 of this MD&A. |
| f. | Capital expenditures |
Capital expenditures are related to our gold sites only and are split between minesite sustaining and project capital expenditures. Project capital expenditures are capital spending at new projects and major, discrete projects at existing operations intended to increase net present value through higher production or longer mine life. Significant projects in the current year are the plant expansion project at Pueblo Viejo, the solar projects at NGM and Loulo-Gounkoto, and the Veladero Phase 7 leach pad expansion. Refer to page 47 of this MD&A. |
| g. | Rehabilitation - accretion and amortization |
Includes depreciation on the assets related to rehabilitation provisions of our gold operations and accretion on the rehabilitation provision of our gold operations, split between operating and non-operating sites. |
| h. | Cost of sales per ounce |
Gold cost of sales per ounce is calculated as cost of sales across our gold operations (excluding sites in closure or care and maintenance) divided by ounces sold (both on an attributable basis using Barrick’s ownership share). |
| i. | Per ounce figures |
Cost of sales per ounce, total cash costs per ounce, all-in sustaining costs per ounce and all-in costs per ounce may not calculate based on amounts presented in this table due to rounding. |
| j. | Co-product costs per ounce |
Total cash costs per ounce, all-in sustaining costs per ounce and all-in costs per ounce presented on a co-product basis removes the impact of by-product credits of our gold production (net of non-controlling interest) calculated as: |
| BARRICK FIRST QUARTER 2023 | 63 | MANAGEMENT’S DISCUSSION AND ANALYSIS |
| OVERVIEW | OPERATING PERFORMANCE | GROWTH PROJECTS & EXPLORATION | REVIEW OF FINANCIAL RESULTS |
OTHER INFORMATION & NON-GAAP RECONCILIATIONS
| FINANCIAL STATEMENTS |
| ($ millions) | For the three months ended 3/31/23 | |||||||||||||||||||||||||||
| Carlin | Corteza | Turquoise Ridge | Long Canyon | Phoenix | Nevada Gold Minesb | Hemlo | ||||||||||||||||||||||
By-product credits | 1 | 1 | 1 | 0 | 38 | 41 | 0 | |||||||||||||||||||||
Non-controlling interest | 0 | 0 | 0 | 0 | (14 | ) | (14 | ) | 0 | |||||||||||||||||||
By-product credits (net of non-controlling interest) | 1 | 1 | 1 | 0 | 24 | 27 | 0 | |||||||||||||||||||||
| ($ millions) | For the three months ended 3/31/23 | |||||||||||||||||||||||||||
| Pueblo Viejo | Veladero | Loulo- Gounkoto | Kibali | North Mara | Tongon | Bulyanhulu | ||||||||||||||||||||||
By-product credits | 12 | 2 | 0 | 0 | 1 | 0 | 5 | |||||||||||||||||||||
Non-controlling interest | (4 | ) | 0 | 0 | 0 | 0 | 0 | (1 | ) | |||||||||||||||||||
By-product credits (net of non-controlling interest) | 8 | 2 | 0 | 0 | 1 | 0 | 4 | |||||||||||||||||||||
| ($ millions) | For the three months ended 12/31/22 | |||||||||||||||||||||||||||
| Carlin | Corteza | Turquoise Ridge | Long Canyon | Phoenix | Nevada Gold Minesb | Hemlo | ||||||||||||||||||||||
By-product credits | 1 | 0 | 0 | 0 | 44 | 45 | 1 | |||||||||||||||||||||
Non-controlling interest | 0 | 0 | 0 | 0 | (17 | ) | (17 | ) | 0 | |||||||||||||||||||
By-product credits (net of non-controlling interest) | 1 | 0 | 0 | 0 | 27 | 28 | 1 | |||||||||||||||||||||
| ($ millions) | For the three months ended 12/31/22 | |||||||||||||||||||||||||||
| Pueblo Viejo | Veladero | Loulo- Gounkoto | Kibali | North Mara | Tongon | Bulyanhulu | ||||||||||||||||||||||
By-product credits | 12 | 1 | 0 | 0 | 1 | 1 | 6 | |||||||||||||||||||||
Non-controlling interest | (5 | ) | 0 | 0 | 0 | 0 | 0 | (1 | ) | |||||||||||||||||||
By-product credits (net of non-controlling interest) | 7 | 1 | 0 | 0 | 1 | 1 | 5 | |||||||||||||||||||||
| ($ millions) | For the three months ended 3/31/22 | |||||||||||||||||||||||||||
| Carlin | Corteza | Turquoise Ridge | Long Canyon | Phoenix | Nevada Gold Minesb | Hemlo | ||||||||||||||||||||||
By-product credits | 0 | 1 | 0 | 0 | 34 | 35 | 0 | |||||||||||||||||||||
Non-controlling interest | 0 | 0 | 0 | 0 | (13 | ) | (13 | ) | 0 | |||||||||||||||||||
By-product credits (net of non-controlling interest) | 0 | 1 | 0 | 0 | 21 | 22 | 0 | |||||||||||||||||||||
| ($ millions) | For the three months ended 3/31/22 | |||||||||||||||||||||||||||
| Pueblo Viejo | Veladero | Loulo- Gounkoto | Kibali | North Mara | Tongon | Bulyanhulu | ||||||||||||||||||||||
By-product credits | 11 | 1 | 0 | 0 | 0 | 0 | 7 | |||||||||||||||||||||
Non-controlling interest | (4 | ) | 0 | 0 | 0 | 0 | 0 | (1 | ) | |||||||||||||||||||
By-product credits (net of non-controlling interest) | 7 | 1 | 0 | 0 | 0 | 0 | 6 | |||||||||||||||||||||
| BARRICK FIRST QUARTER 2023 | 64 | MANAGEMENT’S DISCUSSION AND ANALYSIS |
| OVERVIEW | OPERATING PERFORMANCE | GROWTH PROJECTS & EXPLORATION | REVIEW OF FINANCIAL RESULTS |
OTHER INFORMATION & NON-GAAP RECONCILIATIONS
| FINANCIAL STATEMENTS |
Reconciliation of Copper Cost of Sales to C1 cash costs and All-in sustaining costs, including on a per pound basis
| ($ millions, except per pound information in dollars) | For the three months ended | |||||||||||
| 3/31/23 | 12/31/22 | 3/31/22 | ||||||||||
Cost of sales | 174 | 197 | 154 | |||||||||
Depreciation/amortization | (44 | ) | (92 | ) | (38 | ) | ||||||
Treatment and refinement charges | 43 | 47 | 51 | |||||||||
Cash cost of sales applicable to equity method investments | 87 | 90 | 72 | |||||||||
Less: royalties | (15 | ) | (16 | ) | (32 | ) | ||||||
By-product credits | (4 | ) | (3 | ) | (3 | ) | ||||||
Other | 0 | 0 | 0 | |||||||||
C1 cash costs | 241 | 223 | 204 | |||||||||
General & administrative costs | 6 | 8 | 12 | |||||||||
Rehabilitation - accretion and amortization | 2 | 2 | 1 | |||||||||
Royalties | 15 | 16 | 32 | |||||||||
Minesite exploration and evaluation costs | 2 | 6 | 3 | |||||||||
Minesite sustaining capital expenditures | 33 | 139 | 67 | |||||||||
Sustaining leases | 3 | 2 | 1 | |||||||||
All-in sustaining costs | 302 | 396 | 320 | |||||||||
Pounds sold - consolidated basis (millions pounds) | 89 | 99 | 113 | |||||||||
Cost of sales per pounda,b | 3.22 | 3.19 | 2.21 | |||||||||
C1 cash costs per pounda | 2.71 | 2.25 | 1.81 | |||||||||
All-in sustaining costs per pounda | 3.40 | 3.98 | 2.85 | |||||||||
| a. | Cost of sales per pound, C1 cash costs per pound and all-in sustaining costs per pound may not calculate based on amounts presented in this table due to rounding. |
| b. | Copper cost of sales per pound is calculated as cost of sales across our copper operations divided by pounds sold (both on an attributable basis using Barrick’s ownership share). |
Reconciliation of Copper Cost of Sales to C1 cash costs and All-in sustaining costs, including on a per pound basis, by operating segment
| ($ millions, except per pound information in dollars) | For the three months ended | |||||||||||||||||||||||||||||||||||
| 3/31/23 | 12/31/22 | 3/31/22 | ||||||||||||||||||||||||||||||||||
| Zaldívar | Lumwana | Jabal Sayid | Zaldívar | Lumwana | Jabal Sayid | Zaldívar | Lumwana | Jabal Sayid | ||||||||||||||||||||||||||||
Cost of sales | 87 | 174 | 26 | 86 | 197 | �� | 34 | 73 | 154 | 22 | ||||||||||||||||||||||||||
Depreciation/amortization | (20 | ) | (44 | ) | (6 | ) | (21 | ) | (92 | ) | (9 | ) | (18 | ) | (38 | ) | (5 | ) | ||||||||||||||||||
Treatment and refinement charges | 0 | 36 | 7 | 0 | 40 | 7 | 0 | 46 | 5 | |||||||||||||||||||||||||||
Less: royalties | 0 | (15 | ) | 0 | 0 | (16 | ) | 0 | 0 | (32 | ) | 0 | ||||||||||||||||||||||||
By-product credits | 0 | 0 | (4 | ) | 0 | 0 | (3 | ) | 0 | 0 | (3 | ) | ||||||||||||||||||||||||
Other | 0 | 0 | 0 | 0 | 0 | 0 | 0 | 0 | 0 | |||||||||||||||||||||||||||
C1 cash costs | 67 | 151 | 23 | 65 | 129 | 29 | 55 | 130 | 19 | |||||||||||||||||||||||||||
Rehabilitation - accretion and amortization | 0 | 2 | 0 | 0 | 1 | 1 | 0 | 1 | 0 | |||||||||||||||||||||||||||
Royalties | 0 | 15 | 0 | 0 | 16 | 0 | 0 | 32 | 0 | |||||||||||||||||||||||||||
Minesite exploration and evaluation costs | 2 | 0 | 0 | 2 | 4 | 0 | 3 | 0 | 0 | |||||||||||||||||||||||||||
Minesite sustaining capital expenditures | 5 | 26 | 2 | 19 | 118 | 2 | 9 | 57 | 1 | |||||||||||||||||||||||||||
Sustaining leases | 0 | 1 | 2 | 1 | 1 | 0 | 0 | 1 | 0 | |||||||||||||||||||||||||||
All-in sustaining costs | 74 | 195 | 27 | 87 | 269 | 32 | 67 | 221 | 20 | |||||||||||||||||||||||||||
Pounds sold - consolidated basis (millions pounds) | 23 | 49 | 17 | 24 | 55 | 20 | 26 | 70 | 17 | |||||||||||||||||||||||||||
Cost of sales per pounda,b | 3.73 | 3.56 | 1.53 | 3.55 | 3.56 | 1.72 | 2.85 | 2.20 | 1.30 | |||||||||||||||||||||||||||
C1 cash costs per pounda | 2.86 | 3.09 | 1.39 | 2.69 | 2.34 | 1.42 | 2.15 | 1.86 | 1.10 | |||||||||||||||||||||||||||
All-in sustaining costs per pounda | 3.22 | 3.98 | 1.61 | 3.60 | 4.86 | 1.54 | 2.64 | 3.16 | 1.17 | |||||||||||||||||||||||||||
| a. | Cost of sales per pound, C1 cash costs per pound and all-in sustaining costs per pound may not calculate based on amounts presented in this table due to rounding. |
| b. | Copper cost of sales per pound is calculated as cost of sales across our copper operations divided by pounds sold (both on an attributable basis using Barrick’s ownership share). |
EBITDA and Adjusted EBITDA
EBITDA is a non-GAAP financial measure, which excludes the following from net earnings:
| ∎ | Income tax expense; |
| ∎ | Finance costs; |
| ∎ | Finance income; and |
| ∎ | Depreciation. |
Management believes that EBITDA is a valuable indicator of our ability to generate liquidity by producing operating cash flow to fund working capital needs, service debt obligations, and fund capital expenditures. Management uses EBITDA for this purpose. EBITDA is also frequently
| BARRICK FIRST QUARTER 2023 | 65 | MANAGEMENT’S DISCUSSION AND ANALYSIS |
| OVERVIEW | OPERATING PERFORMANCE | GROWTH PROJECTS & EXPLORATION | REVIEW OF FINANCIAL RESULTS |
OTHER INFORMATION & NON-GAAP RECONCILIATIONS
| FINANCIAL STATEMENTS |
used by investors and analysts for valuation purposes whereby EBITDA is multiplied by a factor or “EBITDA multiple” that is based on an observed or inferred relationship between EBITDA and market values to determine the approximate total enterprise value of a company.
Adjusted EBITDA removes the effect of impairment charges; acquisition/disposition gains/losses; foreign currency translation gains/losses; and other expense adjustments. We also remove the impact of income tax expense, finance costs, finance income and depreciation incurred in our equity method accounted investments. We believe these items provide a greater level of consistency with the adjusting items included in our adjusted net earnings reconciliation, with the exception that these amounts are adjusted to remove any impact on finance costs/income, income tax expense and/or depreciation as they do not affect EBITDA. We believe this additional information will assist analysts, investors and
other stakeholders of Barrick in better understanding our ability to generate liquidity from our full business, including equity method investments, by excluding these amounts from the calculation as they are not indicative of the performance of our core mining business and do not necessarily reflect the underlying operating results for the periods presented.
EBITDA and adjusted EBITDA are intended to provide additional information to investors and analysts and do not have any standardized definition under IFRS, and should not be considered in isolation or as a substitute for measures of performance prepared in accordance with IFRS. EBITDA and adjusted EBITDA exclude the impact of cash costs of financing activities and taxes, and the effects of changes in operating working capital balances, and therefore are not necessarily indicative of operating profit or cash flow from operations as determined under IFRS. Other companies may calculate EBITDA and adjusted EBITDA differently.
Reconciliation of Net Earnings to EBITDA and Adjusted EBITDA
| ($ millions) | For the three months ended | |||||||||||
| 3/31/23 | 12/31/22 | 3/31/22 | ||||||||||
Net earnings (loss) | 269 | (816 | ) | 706 | ||||||||
Income tax expense | 205 | (131 | ) | 301 | ||||||||
Finance costs, neta | 37 | 31 | 76 | |||||||||
Depreciation | 495 | 604 | 460 | |||||||||
EBITDA | 1,006 | (312 | ) | 1,543 | ||||||||
Impairment charges (reversals) of non-current assetsb | 1 | 1,642 | 2 | |||||||||
Acquisition/disposition gainsc | (3 | ) | (319 | ) | (2 | ) | ||||||
Loss on currency translation | 38 | 4 | 3 | |||||||||
Other expense (income) adjustmentsd | 63 | 126 | 13 | |||||||||
Income tax expense, net finance costsa, and depreciation from equity investees | 78 | 145 | 86 | |||||||||
Adjusted EBITDA | 1,183 | 1,286 | 1,645 | |||||||||
| a. | Finance costs exclude accretion. |
| b. | For the three month period ended December 31, 2022, net impairment charges mainly relate to a goodwill impairment at Loulo-Gounkoto, and non-current asset impairments at Veladero and Long Canyon, partially offset by an impairment reversal at Reko Diq. |
| c. | For the three month period ended December 31, 2022, acquisition/disposition gains primarily relate to a gain as Barrick’s interest in the Reko Diq project increased from 37.5% to 50%. |
| d. | For the three month period ended March 31, 2023, other expense (income) adjustments mainly relate to the $30 million commitment we made towards the expansion of education infrastructure in Tanzania, per our community investment obligations under the Twiga partnership. For the three month period ended December 31, 2022, other expense (income) adjustments mainly relate to a net realizable value impairment of leach pad inventory at Veladero and supplies obsolescence write-off at Bulyanhulu and North Mara. Other expense (income) adjustments for all periods were also impacted by changes in the discount rate assumptions on our closed mine rehabilitation provision and care and maintenance expenses at Porgera. |
Reconciliation of Income to EBITDA by operating site
| ($ millions) | For the three months ended 3/31/23 | |||||||||||||||||||||||||||||||||||||||
| Carlin (61.5%) | Corteza (61.5%) | Turquoise Ridge (61.5%) | Nevada Gold Minesb (61.5%) | Pueblo Viejo (60%) | Loulo- Gounkoto (80%) | Kibali (45%) | North Mara (84%) | Bulyanhulu (84%) | Lumwana (100%) | |||||||||||||||||||||||||||||||
Income (loss) | 66 | 78 | 40 | 189 | 61 | 85 | 33 | 47 | 17 | (12 | ) | |||||||||||||||||||||||||||||
Depreciation | 39 | 56 | 31 | 140 | 39 | 56 | 25 | 16 | 13 | 44 | ||||||||||||||||||||||||||||||
EBITDA | 105 | 134 | 71 | 329 | 100 | 141 | 58 | 63 | 30 | 32 | ||||||||||||||||||||||||||||||
| For the three months ended 12/31/22 | ||||||||||||||||||||||||||||||||||||||||
| Carlin (61.5%) | Corteza (61.5%) | Turquoise Ridge (61.5%) | Nevada Gold Minesb (61.5%) | Pueblo Viejo (60%) | Loulo- Gounkoto (80%) | Kibali (45%) | North Mara (84%) | Bulyanhulu (84%) | Lumwana (100%) | |||||||||||||||||||||||||||||||
Income (loss) | 171 | 63 | 17 | 264 | 47 | 70 | 7 | 25 | 13 | (35 | ) | |||||||||||||||||||||||||||||
Depreciation | 55 | 59 | 32 | 162 | 36 | 55 | 90 | 18 | 12 | 92 | ||||||||||||||||||||||||||||||
EBITDA | 226 | 122 | 49 | 426 | 83 | 125 | 97 | 43 | 25 | 57 | ||||||||||||||||||||||||||||||
| BARRICK FIRST QUARTER 2023 | 66 | MANAGEMENT’S DISCUSSION AND ANALYSIS |
| OVERVIEW | OPERATING PERFORMANCE | GROWTH PROJECTS & EXPLORATION | REVIEW OF FINANCIAL RESULTS |
OTHER INFORMATION & NON-GAAP RECONCILIATIONS
| FINANCIAL STATEMENTS |
| For the three months ended 3/31/22 | ||||||||||||||||||||||||||||||||||||||||
| Carlin (61.5%) | Corteza (61.5%) | Turquoise Ridge (61.5%) | Nevada Gold Minesb (61.5%) | Pueblo Viejo (60%) | Loulo- Gounkoto (80%) | Kibali (45%) | North Mara (84%) | Bulyanhulu (84%) | Lumwana (100%) | |||||||||||||||||||||||||||||||
Income | 215 | 92 | 28 | 363 | 89 | 106 | 41 | 58 | 43 | 133 | ||||||||||||||||||||||||||||||
Depreciation | 42 | 38 | 26 | 139 | 35 | 50 | 28 | 8 | 14 | 38 | ||||||||||||||||||||||||||||||
EBITDA | 257 | 130 | 54 | 502 | 124 | 156 | 69 | 66 | 57 | 171 | ||||||||||||||||||||||||||||||
| a. | Includes Goldrush. |
| b. | These results represent our 61.5% interest in Carlin, Cortez, Turquoise Ridge, Phoenix and Long Canyon. |
Realized Price
Realized price is a non-GAAP financial measure which excludes from sales:
| ∎ | Treatment and refining charges; and |
| ∎ | Cumulative catch-up adjustment to revenue relating to our streaming arrangements. |
We believe this provides investors and analysts with a more accurate measure with which to compare to market gold prices and to assess our gold sales performance. For those reasons, management believes that this measure provides a more accurate reflection of our Company’s past performance and is a better indicator of its expected performance in future periods.
The realized price measure is intended to provide additional information, and does not have any standardized definition under IFRS and should not be considered in isolation or as a substitute for measures of performance prepared in accordance with IFRS. The measure is not necessarily indicative of sales as determined under IFRS. Other companies may calculate this measure differently. The following table reconciles realized prices to the most directly comparable IFRS measure.
Reconciliation of Sales to Realized Price per ounce/pound
| ($ millions, except per ounce/pound information in dollars) | Gold | Copper | ||||||||||||||||||||||
| For the three months ended | ||||||||||||||||||||||||
| 3/31/23 | 12/31/22 | 3/31/22 | 3/31/23 | 12/31/22 | 3/31/22 | |||||||||||||||||||
Sales | 2,411 | 2,535 | 2,511 | 171 | 170 | 287 | ||||||||||||||||||
Sales applicable to non-controlling interests | (723 | ) | (785 | ) | (787 | ) | 0 | 0 | 0 | |||||||||||||||
Sales applicable to equity method investmentsa,b | 126 | 164 | 136 | 160 | 160 | 188 | ||||||||||||||||||
Sales applicable to sites in closure or care and maintenancec | (7 | ) | (11 | ) | 0 | 0 | 0 | 0 | ||||||||||||||||
Treatment and refinement charges | 7 | 15 | 3 | 43 | 47 | 51 | ||||||||||||||||||
Revenues – as adjusted | 1,814 | 1,918 | 1,863 | 374 | 377 | 526 | ||||||||||||||||||
Ounces/pounds sold (000s ounces/millions pounds)c | 954 | 1,111 | 993 | 89 | 99 | 113 | ||||||||||||||||||
Realized gold/copper price per ounce/poundd | 1,902 | 1,728 | 1,876 | 4.20 | 3.81 | 4.68 | ||||||||||||||||||
| a. | Represents sales of $126 million for the three month period ended March 31, 2023 (December 31, 2022: $164 million and March 31, 2022: $137 million) applicable to our 45% equity method investment in Kibali for gold. Represents sales of $98 million for the three months ended March 31, 2023 (December 31, 2022: $91 million and March 31, 2022: $118 million) applicable to our 50% equity method investment in Zaldívar and $69 million (December 31, 2022: $74 million and March 31, 2022: $75 million) applicable to our 50% equity method investment in Jabal Sayid for copper. |
| b. | Sales applicable to equity method investments are net of treatment and refinement charges. |
| c. | Excludes Pierina, which is producing incidental ounces while in closure. |
| d. | Realized price per ounce/pound may not calculate based on amounts presented in this table due to rounding. |
| BARRICK FIRST QUARTER 2023 | 67 | MANAGEMENT’S DISCUSSION AND ANALYSIS |
| OVERVIEW | OPERATING PERFORMANCE | GROWTH PROJECTS & EXPLORATION | REVIEW OF FINANCIAL RESULTS |
OTHER INFORMATION & NON-GAAP RECONCILIATIONS
| FINANCIAL STATEMENTS |
Technical Information
The scientific and technical information contained in this MD&A has been reviewed and approved by Craig Fiddes, SME-RM, Lead, Resource Modeling, Nevada Gold Mines; Chad Yuhasz, P.Geo, Mineral Resource Manager, Latin America & Asia Pacific; Richard Peattie, MPhil, FAusIMM, Mineral Resources Manager: Africa and Middle East; Simon Bottoms, CGeol, MGeol, FGS, FAusIMM, Mineral Resource Management and Evaluation Executive; John Steele, CIM, Metallurgy, Engineering and Capital Projects Executive; and Rob Krcmarov, FAusIMM, Technical Advisor to Barrick – each a “Qualified Person” as defined in National Instrument 43-101 – Standards of Disclosure for Mineral Projects.
All mineral reserve and mineral resource estimates are estimated in accordance with National Instrument 43-101 – Standards of Disclosure for Mineral Projects. Unless otherwise noted, such mineral reserve and mineral resource estimates are as of December 31, 2022.
Endnotes
| 1 | Further information on these non-GAAP financial measures, including detailed reconciliations, is included on pages 54 to 67 of this MD&A. |
| 2 | Gold cost of sales per ounce is calculated as cost of sales across our gold operations (excluding sites in closure or care and maintenance) divided by ounces sold (both on an attributable basis using Barrick’s ownership share). Copper cost of sales per pound is calculated as cost of sales across our copper operations divided by pounds sold (both on an attributable basis using Barrick’s ownership share). References to attributable basis means our 100% share of Hemlo and Lumwana, our 61.5% share of NGM, our 60% share of Pueblo Viejo, our 80% share of Loulo-Gounkoto, our 89.7% share of Tongon, our 84% share of North Mara, and Bulyanhulu, our 50% share of Veladero, Zaldívar and Jabal Sayid, our 47.5% share of Porgera and our 45% share of Kibali. |
| 3 | Total reportable incident frequency rate (“TRIFR”) is a ratio calculated as follows: number of reportable injuries x 1,000,000 hours divided by the total number of hours worked. Reportable injuries include fatalities, lost time injuries, restricted duty injuries, and medically treated injuries. Lost time injury frequency rate (“LTIFR”) is a ratio calculated as follows: number of lost time injuries x 1,000,000 hours divided by the total number of hours worked. |
| 4 | Class 1 - High Significance is defined as an incident that causes significant negative impacts on human health or the environment or an incident that extends onto publicly accessible land and has the potential to cause significant adverse impact to surrounding communities, livestock or wildlife. |
| 5 | A Tier One Gold Asset is an asset with a reserve potential to deliver a minimum 10-year life, annual production of at least 500,000 ounces of gold and total cash costs per ounce over the mine life that are in the lower half of the industry cost curve. A Tier One Copper Asset is an asset with a reserve potential of greater than five million tonnes of contained copper and C1 cash costs per pound over the mine life that are in the lower half of the industry cost curve. |
| 6 | See the Technical Report on the Pueblo Viejo mine, Dominican Republic, dated March 17, 2023, and filed on SEDAR at www.sedar.com and EDGAR at www.sec.gov on March 17, 2023. |
| 7 | Estimated in accordance with National Instrument 43-101 - Standards of Disclosure for Mineral Projects as required by Canadian securities regulatory authorities. Estimates are as of December 31, 2022, unless otherwise noted. Pueblo Viejo proven reserves of 35 million tonnes grading 2.29 g/t, representing 2.6 million ounces of gold; probable reserves of 140 million tonnes grading 2.16 g/t, representing 9.7 million ounces of gold; measured resources of 46 million tonnes grading 2.08 g/t, representing 3.1 million ounces of gold; indicated resources of 190 million tonnes grading 1.99 g/t, representing 12 million ounces of gold; and inferred resources of 4.6 million tonnes grading 1.8 g/t, representing 0.26 million ounces of gold. Complete mineral reserve and mineral resource data for all mines and projects referenced in this MD&A, including tonnes, grades, and ounces, can be found on pages 37 to 46 of Barrick’s 2022 Annual Information Form and Form 40-F filed on SEDAR at www.sedar.com and on EDGAR at www.sec.gov. |
| 8 | Fallon (North Leeville) Significant Interceptsa |
| Drill Results from Q1 2023 | ||||||||||||
| Drill Holeb | Azimuth | Dip | Interval (m) | Width (m)c | True Width (m)c | Ag (g/t) | ||||||
NLX-22016 | 255 | (80) | 793.4 - 801.6 | 8.2 | 8.2 | 24.89 | ||||||
| 791.0 - 797.5 | 6.6 | 6.5 | 4.80 | |||||||||
| 803.5 - 806.8 | 3.4 | 3.3 | 5.21 | |||||||||
| 897.6 - 902.2 | 4.6 | 4.5 | 7.34 | |||||||||
| 923.2 - 926.6 | 3.4 | 3.3 | 5.90 | |||||||||
NLX-22019 | 265 | (73) | 934.5 - 938.0 | 3.5 | 3.5 | 5.07 | ||||||
| 848.9 - 880.6 | 31.7 | 30.6 | 7.75 | |||||||||
| 883.0 - 893.4 | 10.4 | 10.0 | 7.13 | |||||||||
NLX-22020A | 90 | (45) | 894.9 - 898.9 | 4.0 | 3.8 | 9.33 | ||||||
| BARRICK FIRST QUARTER 2023 | 68 | MANAGEMENT’S DISCUSSION AND ANALYSIS |
| OVERVIEW | OPERATING PERFORMANCE | GROWTH PROJECTS & EXPLORATION | REVIEW OF FINANCIAL RESULTS |
OTHER INFORMATION & NON-GAAP RECONCILIATIONS
| FINANCIAL STATEMENTS |
NLX-22013B | 306 | (79) | 811.7 - 839.1 | 27.4 | 26.3 | 19.57 | ||||||
NLX-22015 | 115 | (79) | 787 .0 - 806.8 | 19.8 | 19.7 | 15.59 | ||||||
| a. | All intercepts calculated using a 3.4 g/t Au cutoff and are uncapped; minimum downhole intercept width is 3.0 meters; internal dilution is less than 20% total width. |
| b. | Carlin Trend drill hole nomenclature: Project (NLX - North Leeville Exploration) followed by the year (22 for 2022) then hole number. |
| c. | True width for NLX drillholes has been estimated based on the latest geological and ore controls model and it is subject to refinement as additional data becomes available. |
The drilling results for Leeville contained in this MD&A have been prepared in accordance with National Instrument 43-101 –Standards of Disclosure for Mineral Projects. All drill hole assay information has been manually reviewed and approved by staff geologists and re-checked by the project manager. Sample preparation and analyses are conducted by an independent laboratory, ALS Minerals. Procedures are employed to ensure security of samples during their delivery from the drill rig to the laboratory. The quality assurance procedures, data verification and assay protocols used in connection with drilling and sampling on the Carlin Trend conform to industry accepted quality control methods.
| 9 | Miramar (North Turf) Significant Interceptsa |
| Drill Results from Q1 2023 | ||||||||||||
| Drill Holeb | Azimuth | Dip | Interval (m) | Width (m)c | True Width (m)c | Au (g/t) | ||||||
| 151-.5 - 155.4 | 4.0 | 2.0 | 5.01 | |||||||||
NTC-22028 | 41 | (24) | 158.5 - 170.1 | 11.6 | 5.8 | 5.25 | ||||||
| 96.0 - 101.2 | 5.2 | 5.1 | 7.68 | |||||||||
| 107.6 - 144.5 | 36.9 | 36.3 | 12.37 | |||||||||
NTC-22044 | 265 | (42) | 168.2 - 172.2 | 4.0 | 3.9 | 24.27 | ||||||
| 70.7 - 76.8 | 6.1 | 2.6 | 15.74 | |||||||||
NTC-22046 | 69 | (35) | 286.2 - 289.9 | 3.7 | 2.8 | 5.14 | ||||||
NTC-22048 | 53 | (70) | 128.0 - 135.6 | 7.6 | 7.6 | 3.45 | ||||||
| 115.8 - 140.8 | 25.0 | 24.6 | 23.97 | |||||||||
| 146.0 - 153.0 | 7.0 | 6.9 | 25.06 | |||||||||
| 160.0 - 163.1 | 3.0 | 3.0 | 8.19 | |||||||||
NTC-22003 | 288 | (35) | 227.7 - 230.4 | 2.7 | 1.2 | 22.56 | ||||||
| 107.0 - 113.4 | 6.4 | 4.9 | 7.16 | |||||||||
NTC-22047A | 300 | (43) | 118.0 - 155.1 | 37.2 | 28.5 | 12.49 | ||||||
| 16.2 - 21.6 | 5.5 | 4.2 | 9.09 | |||||||||
| 132.6 - 142.3 | 9.8 | 5.6 | 4.36 | |||||||||
| 155.3 - 177.7 | 22.4 | 22.1 | 20.07 | |||||||||
NTC-22052 | 87 | (27) | 183.8 - 201.2 | 17.4 | 16.3 | 13.99 | ||||||
| 149.4 - 154.8 | 5.5 | 2.3 | 11.48 | |||||||||
| 169.2 - 173.4 | 4.3 | 1.8 | 3.87 | |||||||||
| 191.7 - 196.6 | 4.9 | 2.1 | 10.10 | |||||||||
| 199.6 - 202.4 | 2.7 | 1.2 | 13.99 | |||||||||
| 208.8 - 211.5 | 2.7 | 1.2 | 8.49 | |||||||||
| 213.1 - 217.6 | 4.6 | 1.9 | 4.74 | |||||||||
NTC-22057 | 108 | (12) | 220.4 - 224.0 | 3.7 | 1.5 | 5.92 | ||||||
| 74.4 - 81.7 | 7.3 | 4.9 | 14.17 | |||||||||
NTC-22025 | 265 | (42) | 96.6 - 178.0 | 81.4 | 54.5 | 13.20 | ||||||
| 142.6 - 176.2 | 33.5 | 32.4 | 9.22 | |||||||||
| 198.1 - 204.2 | 6.1 | 5.9 | 7.82 | |||||||||
| 214.0 - 217.3 | 3.4 | 3.2 | 5.58 | |||||||||
NTC-22015 | 85 | (28) | 259.1 - 267.9 | 8.8 | 8.3 | 8.36 | ||||||
NTC-22036 | 90 | (66) | 126.2 - 150.0 | 23.8 | 23.7 | 5.99 | ||||||
| 91.3 - 126.2 | 34.9 | 34.4 | 9.21 | |||||||||
| 136.9 - 143.0 | 6.1 | 6.0 | 7.02 | |||||||||
NTC-22037 | 90 | (55) | 146.0 - 153.6 | 7.6 | 7.5 | 6.31 | ||||||
| 75.4 - 87.5 | 12.0 | 11.9 | 4.01 | |||||||||
| 92.4 - 103.3 | 11.0 | 10.8 | 5.93 | |||||||||
NTC-22039 | 245 | (73) | 105.5 - 114 | 8.5 | 8.4 | 6.79 | ||||||
NTC-22041 | 93 | (47) | 133.2 - 137.9 | 4.7 | 4.7 | 5.31 | ||||||
| a. | All intercepts calculated using a 3.4 g/t Au cutoff and are uncapped; minimum intercept width is 3.0 meters; internal dilution is less than 20% total width. |
| b. | Carlin Trend drill hole nomenclature: Project area (NTC – North Turf Core) followed by the year (22 for 2022) then hole number. |
| c. | True width (TW) for NTC drillholes has been estimated based on the latest geological and ore controls model and it is subject to refinement as additional data becomes available. |
| BARRICK FIRST QUARTER 2023 | 69 | MANAGEMENT’S DISCUSSION AND ANALYSIS |
| OVERVIEW | OPERATING PERFORMANCE | GROWTH PROJECTS & EXPLORATION | REVIEW OF FINANCIAL RESULTS |
OTHER INFORMATION & NON-GAAP RECONCILIATIONS
| FINANCIAL STATEMENTS |
The drilling results for Leeville contained in this MD&A have been prepared in accordance with National Instrument 43-101 –Standards of Disclosure for Mineral Projects. All drill hole assay information has been manually reviewed and approved by staff geologists and re-checked by the project manager. Sample preparation and analyses are conducted by an independent laboratory, ALS Minerals. Procedures are employed to ensure security of samples during their delivery from the drill rig to the laboratory. The quality assurance procedures, data verification and assay protocols used in connection with drilling and sampling on the Carlin Trend conform to industry accepted quality control methods.
| 10 | Ren Significant Interceptsa |
| Drill Results from Q1 2023 | ||||||||||||
| Drill Holeb | Azimuth | Dip | Interval (m) | Width (m)c | True Width (m)c | Au (g/t) | ||||||
MRC-22006 | 86 | (28) | 224.6 - 227.7 | 3.0 | 3.0 | 7.34 | ||||||
| 94.5 - 114 | 19.5 | 12.7 | 34.94 | |||||||||
| 129.5 - 133.2 | 3.7 | 3.0 | 12.17 | |||||||||
MRC-22008 | 123 | (25) | 136.2 - 139.3 | 3.0 | 3.0 | 15.81 | ||||||
| 309.4 - 315.5 | 6.1 | 4.6 | 6.99 | |||||||||
| 322.5 - 348.4 | 25.9 | 10.7 | 6.72 | |||||||||
| 353.4 - 362.1 | 8.7 | 7.6 | 5.62 | |||||||||
MRC-22013 | 276 | (9) | 367.9 - 378.6 | 10.7 | 7.6 | 5.86 | ||||||
| a. | All intercepts calculated using a 3.4 g/t Au cutoff and are uncapped; minimum downhole intercept width is 3.0 meters; internal dilution is less than 20% total width. |
| b. | Carlin Trend drill hole nomenclature: Project area (MRC - Ren Underground) followed by the year (22 for 2022) then hole number. |
| c. | True width for these MRC drillholes are uncertain at this stage. |
The drilling results for Ren contained in this MD&A have been prepared in accordance with National Instrument 43-101 – Standards of Disclosure for Mineral Projects. All drill hole assay information has been manually reviewed and approved by staff geologists and re-checked by the project manager. Sample preparation and analyses are conducted by an independent laboratory, ALS Minerals. Procedures are employed to ensure security of samples during their delivery from the drill rig to the laboratory. The quality assurance procedures, data verification and assay protocols used in connection with drilling and sampling on the Carlin Trend conform to industry accepted quality control methods.
| 11 | CHUG Hanson Significant Interceptsa |
| Drill Results from Q1 2023 | ||||||||||
| Drill Holeb | Azimuth | Dip | Interval (m) | Width (m)c | Au (g/t) | |||||
| 346.8 - 350.8 | 4 | 4.75 | ||||||||
| 358.1 - 359.8 | 1.7 | 17.21 | ||||||||
| 381.6 - 387.1 | 5.5 | 5.86 | ||||||||
CMX-22013 | 233 | (44) | 415.3 - 417 | 1.7 | 4.90 | |||||
| 460 - 461.4 | 1.4 | 6.51 | ||||||||
| 488.6 - 498.8 | 10.2 | 5.03 | ||||||||
| 514.3 - 516.3 | 2 | 6.75 | ||||||||
CMX-22014 | 244 | (44) | 523 - 525.4 | 2.4 | 8.96 | |||||
CMX-22015 | 257 | (39) | 466.3 - 467.8 | 1.5 | 8.61 | |||||
| 479.4 - 480.6 | 2 | 11.78 | ||||||||
| 519 - 521.9 | 2.9 | 5.13 | ||||||||
| 568.4 - 593.1 | 24.7 | 6.67 | ||||||||
| 596.8 - 599.5 | 2.7 | 5.75 | ||||||||
CMX-22016 | 216 | (42) | 601 - 602.4 | 1.4 | 3.55 | |||||
CMX-22017 | 204 | (42) | 515.7 - 527.9 | 12.2 | 7.60 | |||||
| 381.4 - 384.3 | 2.9 | 11.23 | ||||||||
CMX-22018 | 220 | (49) | 385.9 - 387.4 | 1.5 | 3.46 | |||||
| 607.5 - 609.1 | 1.6 | 4.53 | ||||||||
| 610.3 - 611.7 | 1.4 | 4.97 | ||||||||
CMX-22019 | 219 | (45) | 616.3 - 636.4 | 20.1 | 9.64 | |||||
| 447.8 - 449.4 | 1.5 | 6.48 | ||||||||
| 488.1 - 489.9 | 1.8 | 4.94 | ||||||||
CMX-22020 | 197 | (44) | 643.7 - 645.2 | 1.5 | 4.96 | |||||
| 392 - 414.2 | 23.8 | 6.00 | ||||||||
| 529 - 531.9 | 2.9 | 11.24 | ||||||||
CMX-22023 | 273 | (74) | 536.2 - 538.5 | 2.3 | 4.82 | |||||
CMX-22025 | 250 | (54) | 483.4 - 484.8 | 1.4 | 12.38 | |||||
| 437.2 - 443.8 | 6.6 | 12.71 | ||||||||
| BARRICK FIRST QUARTER 2023 | 70 | MANAGEMENT’S DISCUSSION AND ANALYSIS |
| OVERVIEW | OPERATING PERFORMANCE | GROWTH PROJECTS & EXPLORATION | REVIEW OF FINANCIAL RESULTS |
OTHER INFORMATION & NON-GAAP RECONCILIATIONS
| FINANCIAL STATEMENTS |
| 478.5 - 481.5 | 3 | 7.64 | ||||||||
CMX-22026 | 191 | (65) | 502.3 - 521.9 | 19.6 | 11.67 | |||||
| a. | All intercepts calculated using a 3.42 g/t Au cutoff and are uncapped; minimum intercept width is 1.4 meters; internal dilution is less than 20% total width. |
| b. | Cortez drill hole nomenclature: Project (CMX - CHUG Minex) followed by the year (22 for 2022) then hole number. |
| c. | True width of intercepts are uncertain at this stage. |
The drilling results for Cortez contained in this MD&A have been prepared in accordance with National Instrument 43-101 – Standards of Disclosure for Mineral Projects. All drill hole assay information has been manually reviewed and approved by staff geologists and re-checked by the project manager. Sample preparation and analyses are conducted by an independent laboratory, ALS Minerals. Procedures are employed to ensure security of samples during their delivery from the drill rig to the laboratory. The quality assurance procedures, data verification and assay protocols used in connection with drilling and sampling at Cortez conform to industry accepted quality control methods.
| 12 | Turquoise Ridge Significant Interceptsa |
| Drill Results from Q1 2023 | ||||||||||||
| Drill Holeb | Azimuth | Dip | Interval (m) | Width (m)c | True Width (m)c | Au (g/t) | ||||||
| 404.4 - 409.3 | 4.9 | 3.9 | 6.75 | |||||||||
TSM-22013 | 179 | (83) | 419.2 - 437.0 | 17.8 | 14.0 | 12.05 | ||||||
TSM-22107 | 180 | (65) | 531.3 - 536.0 | 4.7 | 4.3 | 29.54 | ||||||
| 461.7 - 469.2 | 7.5 | 7.0 | 5.85 | |||||||||
| 475.8 - 480.0 | 4.2 | 3.9 | 25.44 | |||||||||
TSM-22108 | 180 | (80) | 493.6 - 497.6 | 4.0 | 3.8 | 11.52 | ||||||
| 457.0 - 459.2 | 2.2 | 2.0 | 15.66 | |||||||||
| 465.2 - 471.3 | 6.2 | 5.6 | 6.14 | |||||||||
TSM-22109 | 180 | (75) | 486.0 - 489.0 | 3.0 | 2.7 | 10.82 | ||||||
| 424.1 - 425.9 | 1.8 | 1.4 | 18.00 | |||||||||
TSM-22115 | 179 | (83) | 512.5 - 517.4 | 4.9 | 3.9 | 5.21 | ||||||
TSM-22001 | 179 | (72) | 487.8 - 495.1 | 7.3 | 6.8 | 4.03 | ||||||
| 486.9 - 497.7 | 10.9 | 9.9 | 19.06 | |||||||||
TSM-22003A | 179 | (83) | 540.4 - 543.3 | 2.9 | 2.6 | 6.56 | ||||||
| 474.3 - 491.9 | 17.5 | 14.0 | 10.39 | |||||||||
| 530.8 - 533.3 | 2.5 | 2.0 | 28.54 | |||||||||
TSM-22004 | 179 | (90) | 541.6 - 545.1 | 3.5 | 2.8 | 7.79 | ||||||
| 202.4 - 215.6 | 13.2 | 12.9 | 7.60 | |||||||||
| 221.8 - 230.8 | 9.0 | 8.8 | 6.56 | |||||||||
TUM-22225 | 185 | (74) | 237.5 - 245.3 | 7.8 | 7.6 | 6.35 | ||||||
| 21.7 - 26.8 | 5.1 | 2.7 | 12.64 | |||||||||
TUM-22816 | 222 | (30) | 55.8 - 65.9 | 10.1 | 3.8 | 20.77 | ||||||
TUM-22807 | 170 | (36) | 27.4 - 37.8 | 10.4 | 7.3 | 7.62 | ||||||
| 49.5 - 54.9 | 5.4 | 4.4 | 7.99 | |||||||||
| 59.5 - 70.1 | 10.7 | 5.2 | 10.35 | |||||||||
TUM-22808 | 170 | (22) | 74.7 - 83.8 | 9.1 | 6.8 | 5.50 | ||||||
| 137.5 - 155.8 | 18.3 | 8.5 | 21.03 | |||||||||
TUM-22703A | 292 | (31) | 219.1 - 238.1 | 19.0 | 13.1 | 9.83 | ||||||
| a. | All intercepts calculated using a 3.4 g/t Au cutoff and are uncapped; minimum intercept width is 1.0 meter; internal dilution is less than 20% total width. |
| b. | Turquoise Ridge drill hole nomenclature: Project (TSM - Turquoise Surface Minex, TUM - Turquoise Underground Minex). First two numbers indicate year drilled. |
| c. | True width of intercepts have been estimated based on the current geological model. |
The drilling results for Turquoise Ridge contained in this MD&A have been prepared in accordance with National Instrument 43-101 – Standards of Disclosure for Mineral Projects. All drill hole assay information has been manually reviewed and approved by staff geologists and re-checked by the project manager. Sample preparation and analyses are conducted by an independent laboratory, ALS Minerals. Procedures are employed to ensure security of samples during their delivery from the drill rig to the laboratory. The quality assurance procedures, data verification and assay protocols used in connection with drilling and sampling on Turquoise Ridge conform to industry accepted quality control methods.
| BARRICK FIRST QUARTER 2023 | 71 | MANAGEMENT’S DISCUSSION AND ANALYSIS |
| OVERVIEW | OPERATING PERFORMANCE | GROWTH PROJECTS & EXPLORATION | REVIEW OF FINANCIAL RESULTS |
OTHER INFORMATION & NON-GAAP RECONCILIATIONS
| FINANCIAL STATEMENTS |
| 13 | Morro Escondido - Veladero District Significant Interceptsa |
| Drill Results from Q1 2023 | ||||||||||||||||
| Drill Holeb | Azimuth | Dip | Interval (m) | Width (m)c | Au (g/t) | Interval (m) | Including Width (m)c | Au (g/t) | ||||||||
| 113.2 - 135.7 | 22.5 | 0.51 | 124.0 - 125.0 | 1 | 4.3 | |||||||||||
| 169.3 - 189.2 | 19.9 | 0.49 | 177.2 - 178.2 | 1.05 | 1.23 | |||||||||||
DDH-MES-05 | 250 | (65) | 187.2 - 188.2 | 1 | 1.1 | |||||||||||
DDH-MES-08 | 305 | (65) | 147.0 - 229.0 | 82.0 | 0.35 | 184.0 - 186.0 | 2 | 1.94 | ||||||||
DDH-MES-11 | 265 | (60) | 48.8 - 64.5 | 15.7 | 0.63 | 57.1 - 58.5 | 1.4 | 2.58 | ||||||||
| 5.3 - 48.6 | 43.3 | 1.17 | 5.3 - 18.1 | 12.8 | 3.18 | |||||||||||
| 110.2 - 225.0 | 114.8 | 0.61 | 126.4 - 134.0 | 7.55 | 1.29 | |||||||||||
| 140.0 - 164.0 | 24 | 1.02 | ||||||||||||||
DDH-MES-12 | 45 | (65) | 244.3 - 260.5 | 16.2 | 0.95 | 257.0 - 260.5 | 3.5 | 2.99 | ||||||||
DDH-MES-14 | 30 | (65) | 77.0 - 97.0 | 20.0 | 0.32 | |||||||||||
| a. | All intercepts calculated using a 0.25 g/t Au cutoff and are uncapped; minimum intercept width is 15 meters; maximum internal dilution of 15 meters below 0.25 g/t Au. |
| b. | Morro Escondido drill hole nomenclature: Drill system Diamond Drill Hole (DDH), Project Name (Morro Escondido - MES) followed by hole number. |
| c. | True width of intercepts are estimated using the core axis and are uncertain at this stage. |
| d. | Drill method is diamond drilling. |
The drilling results for Morro Escondido contained in this MD&A have been prepared in accordance with National Instrument 43-101 – Standards of Disclosure for Mineral Projects. All drill hole assay information has been manually reviewed and approved by staff geologists and re-checked by the project manager. Sample preparation and analyses are conducted by Veladero laboratory. Procedures are employed to ensure security of samples during their delivery from the drill rig to the laboratory. The quality assurance procedures, data verification and assay protocols used in connection with drilling and sampling at Morro Escondido conform to industry accepted quality control methods.
| 14 | Loulo-Gounkoto Significant Interceptsa |
| Drill Results from Q1 2023 | ||||||||||
| Drill Holeb | Azimuth | Dip | Interval (m) | Width (m)c | Au (g/t) | |||||
L0CP302 | 104.05 | (67.49) | 610.2 - 613.25 | 3.05 | 0.94 | |||||
| 591 - 594.85 | 3.85 | 1.84 | ||||||||
| 603.65 - 606.15 | 2.5 | 2.21 | ||||||||
| 637.8 - 643.5 | 5.7 | 0.84 | ||||||||
L0CP303 | 118.02 | (63.98) | 653.8 - 656.2 | 2.4 | 2.48 | |||||
| 606.35 - 609.4 | 3.05 | 5.06 | ||||||||
L0CP311 | 68 | (63) | 642.4 - 647.1 | 4.7 | 2.02 | |||||
| 145.4 - 148.7 | 3.3 | 1.82 | ||||||||
| 153.2 - 160.2 | 7 | 0.95 | ||||||||
| 163.8 - 166.2 | 2.4 | 3.56 | ||||||||
P129DH015 | 102 | (45) | 206.95 - 211.35 | 4.4 | 5 | |||||
| 147.7 - 152.85 | 5.15 | 1.15 | ||||||||
P129DH016 | 100.92 | (46.42) | 155.05 - 161 | 5.95 | 0.68 | |||||
| 112 - 115 | 3 | 3.03 | ||||||||
P129RC106 | 100 | (45) | 201 - 203 | 2 | 20.53 | |||||
P129RC107 | 100 | (45) | 37 - 43 | 6 | 0.69 | |||||
| 117 - 120 | 3 | 0.72 | ||||||||
| 123 - 129 | 6 | 0.56 | ||||||||
| 172 - 175 | 3 | 0.9 | ||||||||
| 280 - 282 | 2 | 1.29 | ||||||||
P129RC113 | 135 | (45) | 293 - 296 | 3 | 1.16 | |||||
| 61 - 65 | 4 | 1.28 | ||||||||
P129RC114 | 100 | (45) | 142 - 147 | 5 | 0.51 | |||||
| a. | All intercepts calculated using a 0.5 g/t Au cutoff and are uncapped; minimum intercept width is 2 meters; internal dilution is equal to or less than 2 meters total width. |
| b. | Loulo-Gounkoto drill hole nomenclature: prospect initial L0CP (Loulo 0 ; old name of Gara), P129 (Point 129), followed by type of drilling AC (Air Core), RC (Reverse Circulation), DH (Diamond Drilling), RCDH (Reverse Circulation with Diamond tail) |
| c. | True widths uncertain at this stage. |
| d. | All intercepts calculated using a 3.0 g/t Au cutoff and are uncapped; minimum intercept width is 2 meters; internal dilution is equal to or less than 2 meters total width. |
The drilling results for the Loulo-Gounkoto property contained in this MD&A have been prepared in accordance with National Instrument 43-101 – Standards of Disclosure for Mineral Projects. All drill hole assay information has been manually reviewed
| BARRICK FIRST QUARTER 2023 | 72 | MANAGEMENT’S DISCUSSION AND ANALYSIS |
| OVERVIEW | OPERATING PERFORMANCE | GROWTH PROJECTS & EXPLORATION | REVIEW OF FINANCIAL RESULTS |
OTHER INFORMATION & NON-GAAP RECONCILIATIONS
| FINANCIAL STATEMENTS |
and approved by staff geologists and re-checked by the project manager. Sample preparation and analyses are conducted by SGS Laboratories, an independent laboratory. Industry accepted best practices for preparation and fire assaying procedures are utilized to determine gold content. Procedures are employed to ensure security of samples during their delivery from the drill rig to the laboratory. The quality assurance procedures, data verification and assay protocols used in connection with drilling and sampling on the Loulo property conform to industry accepted quality control methods.
| 15 | Kibali Significant Interceptsa |
| Drill Results from Q1 2023 | ||||||||||||||||
| Drill Holeb | Azimuth | Dip | Interval (m) | Width (m)c | Au (g/t) | Interval (m) | Includingd Width (m)c | Au (g/t) | ||||||||
| 150.26 - 153.47 | 3.21 | 1.20 | ||||||||||||||
| 156.67 - 158.70 | 2.03 | 2.36 | ||||||||||||||
| 165.00 - 170.00 | 5 | 2.26 | ||||||||||||||
| 181.60 - 183.80 | 2.2 | 0.80 | ||||||||||||||
| 191.20 - 214.00 | 22.8 | 3.19 | 200.00 - 203.00 | 3 | 3.40 | |||||||||||
| 209.00 - 211.94 | 2.94 | 16.65 | ||||||||||||||
| 241.00 - 259.40 | 18.4 | 5.82 | 241.70 - 245.00 | 3.3 | 5.65 | |||||||||||
| 255.00 - 259.40 | 4.4 | 18.16 | ||||||||||||||
| 275.00 - 279.70 | 4.7 | 0.91 | ||||||||||||||
| 328.00 - 334.00 | 6 | 6.04 | 328.00 - 329.00 | 1 | 27.56 | |||||||||||
ADD025 | 138 | (59) | 332.00 - 333.00 | 1 | 5.17 | |||||||||||
| 536.00 - 540.50 | 4.5 | 1.55 | ||||||||||||||
MDD082 | 303 | (68) | 574.44 - 580.80 | 6.36 | 1.32 | 578.80 - 579.80 | 1 | 3.95 | ||||||||
| 29.00 - 34.00 | 5 | 1.49 | 29.00 - 31.00 | 2 | 2.73 | |||||||||||
ZBRC0022 | 280 | (50) | 128.00 - 139.00 | 11 | 1.34 | 129.00 - 131.00 | 2 | 3.24 | ||||||||
ZBRC0024 | 280 | (50) | 78.00 - 80.00 | 2 | 0.80 | |||||||||||
| a. | All intercepts calculated using a 0.5 g/t Au cutoff and are uncapped; minimum intercept width is 2 meters; internal dilution is equal to or less than 25% total width. |
| b. | Kibali drill hole nomenclature: prospect initial (A=Agbarabo; M=Mengu; ZB=Zambula) followed by the type of drilling (RC=Reverse Circulation, DD=Diamond) with no designation of the year. |
| c. | True widths of intercepts are uncertain at this stage. |
| d. | Weighted average is calculated by fence using significant intercepts, over the strike length. |
| e. | All including intercepts, calculated using a 0.5 g/t Au cutoff and are uncapped; minimum intercept width is 1 meter; no internal dilution, with grade significantly above (> 40%) the overall intercept grade. |
The drilling results for the Kibali property contained in this MD&A have been prepared in accordance with National Instrument 43-101 – Standards of Disclosure for Mineral Projects. All drill hole assay information has been manually reviewed and approved by staff geologists and re-checked by the project manager. Sample preparation and analyses are conducted by SGS Laboratories, an independent laboratory. Industry accepted best practices for preparation and fire assaying procedures are utilized to determine gold content. Procedures are employed to ensure security of samples during their delivery from the drill rig to the laboratory. The quality assurance procedures, data verification and assay protocols used in connection with drilling and sampling on the Kibali property conform to industry accepted quality control methods.
| 16 | Lumwana Significant Interceptsa |
| Drill Results from Q1 2023 | ||||||||||||||||
| Drill Holeb | Azimuth | Dip | Interval (m) | Width (m)c | Cu (%) | Interval (m) | Includingd Width (m)c | Cu (%) | ||||||||
KAMDD004 | 135 | (60) | 181 - 192 | 11 | 0.77 | 182 - 191 | 9 | 0.82 | ||||||||
| 108 - 118 | 10 | 0.49 | 109 - 115 | 6 | 0.60 | |||||||||||
| 127 - 135 | 8 | 0.31 | ||||||||||||||
KAMDD011 | 135 | (70) | 141 - 152 | 11 | 0.54 | 145 - 152 | 7 | 0.70 | ||||||||
| a. | All intercepts calculated using a 0.16% Cu cutoff and are uncapped; minimum intercept width is 8 meters. |
| b. | Lumwana drill hole nomenclature: prospect initial (KAM = Kamalamba) followed by the type of drilling (DD = Diamond). |
| c. | True widths uncertain at this stage. |
| d. | Weighted average is calculated by fence using significant intercepts, over the strike length. |
The drilling results for Lumwana contained in this MD&A have been prepared in accordance with National Instrument 43-101 – Standards of Disclosure for Mineral Projects. All drill hole assay information has been manually reviewed and approved by staff geologists and re-checked by the project manager. Sample preparation and analyses are conducted by SGS Laboratories, an independent laboratory. Procedures are employed to ensure security of samples during their delivery from the drill rig to the laboratory. The quality assurance procedures, data verification and assay protocols used in connection with drilling and sampling on Lumwana conform to industry accepted quality control methods.
| BARRICK FIRST QUARTER 2023 | 73 | MANAGEMENT’S DISCUSSION AND ANALYSIS |
| OVERVIEW | OPERATING PERFORMANCE | GROWTH PROJECTS & EXPLORATION | REVIEW OF FINANCIAL RESULTS |
OTHER INFORMATION & NON-GAAP RECONCILIATIONS
| FINANCIAL STATEMENTS |
Consolidated Statements of Income
Barrick Gold Corporation (in millions of United States dollars, except per share data) (Unaudited) | Three months ended March 31, | |||||||
| 2023 | 2022 | |||||||
Revenue (notes 4 and 5) | $2,643 | $2,853 | ||||||
Costs and expenses (income) | ||||||||
Cost of sales (notes 4 and 6) | 1,941 | 1,739 | ||||||
General and administrative expenses | 39 | 54 | ||||||
Exploration, evaluation and project expenses | 71 | 67 | ||||||
Impairment charges (notes 8b and 12) | 1 | 2 | ||||||
Loss on currency translation | 38 | 3 | ||||||
Closed mine rehabilitation | 22 | 3 | ||||||
Income from equity investees (note 11) | (53 | ) | (99 | ) | ||||
Other expense (income) (note 8a) | 52 | (11 | ) | |||||
Income before finance costs and income taxes | $532 | $1,095 | ||||||
Finance costs, net | (58 | ) | (88 | ) | ||||
Income before income taxes | $474 | $1,007 | ||||||
Income tax expense (note 9) | (205 | ) | (301 | ) | ||||
Net income | $269 | $706 | ||||||
Attributable to: | ||||||||
Equity holders of Barrick Gold Corporation | $120 | $438 | ||||||
Non-controlling interests (note 15) | $149 | $268 | ||||||
| ||||||||
Earnings per share data attributable to the equity holders of Barrick Gold Corporation (note 7) | ||||||||
Net income | ||||||||
Basic | $0.07 | $0.25 | ||||||
Diluted | $0.07 | $0.25 | ||||||
The accompanying notes are an integral part of these condensed interim consolidated financial statements.
| BARRICK FIRST QUARTER 2023 | 74 | FINANCIAL STATEMENTS (UNAUDITED) |
| OVERVIEW | OPERATING PERFORMANCE | GROWTH PROJECTS & EXPLORATION | REVIEW OF FINANCIAL RESULTS |
OTHER INFORMATION & NON-GAAP RECONCILIATIONS
| FINANCIAL STATEMENTS |
Consolidated Statements
of Comprehensive Income
Barrick Gold Corporation (in millions of United States dollars) (Unaudited) | Three months ended March 31, | |||||||
| 2023 | 2022 | |||||||
Net income | $269 | $706 | ||||||
Other comprehensive income (loss), net of taxes | ||||||||
Items that may be reclassified subsequently to profit or loss: | ||||||||
Currency translation adjustments, net of tax $nil and $nil | (3 | ) | — | |||||
Items that will not be reclassified to profit or loss: | ||||||||
Net change on equity investments, net of tax $nil and $(8) | — | 58 | ||||||
Total other comprehensive (loss) income | (3 | ) | 58 | |||||
Total comprehensive income | $266 | $764 | ||||||
Attributable to: | ||||||||
Equity holders of Barrick Gold Corporation | $117 | $496 | ||||||
Non-controlling interests | $149 | $268 | ||||||
The accompanying notes are an integral part of these condensed interim consolidated financial statements.
| BARRICK FIRST QUARTER 2023 | 75 | FINANCIAL STATEMENTS (UNAUDITED) |
| OVERVIEW | OPERATING PERFORMANCE | GROWTH PROJECTS & EXPLORATION | REVIEW OF FINANCIAL RESULTS |
OTHER INFORMATION & NON-GAAP RECONCILIATIONS
| FINANCIAL STATEMENTS |
Consolidated Statements of Cash Flow
Barrick Gold Corporation (in millions of United States dollars) (Unaudited) | Three months ended March 31, | |||||||
| 2023 | 2022 | |||||||
OPERATING ACTIVITIES | ||||||||
Net income | $269 | $706 | ||||||
Adjustments for the following items: | ||||||||
Depreciation | 495 | 460 | ||||||
Finance costs, net1 | 58 | 88 | ||||||
Impairment charges (notes 8b and 12) | 1 | 2 | ||||||
Income tax expense (note 9) | 205 | 301 | ||||||
Income from equity investees (note 11) | (53 | ) | (99 | ) | ||||
Gain on sale of non-current assets | (3 | ) | (2 | ) | ||||
Loss on currency translation | 38 | 3 | ||||||
Change in working capital (note 10) | (206 | ) | (131 | ) | ||||
Other operating activities (note 10) | 52 | (77 | ) | |||||
Operating cash flows before interest and income taxes | 856 | 1,251 | ||||||
Interest paid | (23 | ) | (23 | ) | ||||
Interest received1 | 49 | 10 | ||||||
Income taxes paid2 | (106 | ) | (234 | ) | ||||
Net cash provided by operating activities | 776 | 1,004 | ||||||
INVESTING ACTIVITIES | ||||||||
Property, plant and equipment | ||||||||
Capital expenditures (note 4) | (688 | ) | (611 | ) | ||||
Sales proceeds | 3 | 1 | ||||||
Investment sales | — | 260 | ||||||
Dividends received from equity method investments (note 11) | 67 | 359 | ||||||
Net cash provided by (used in) investing activities | (618 | ) | 9 | |||||
FINANCING ACTIVITIES | ||||||||
Lease repayments | (4 | ) | (6 | ) | ||||
Dividends | (175 | ) | (178 | ) | ||||
Disbursements to non-controlling interests (note 15) | (62 | ) | (267 | ) | ||||
Pueblo Viejo JV partner shareholder loan | 20 | 45 | ||||||
Net cash used in financing activities | (221 | ) | (406 | ) | ||||
Effect of exchange rate changes on cash and equivalents | — | — | ||||||
Net increase (decrease) in cash and equivalents | (63 | ) | 607 | |||||
Cash and equivalents at the beginning of period | 4,440 | 5,280 | ||||||
Cash and equivalents at the end of period | $4,377 | $5,887 | ||||||
| 1 | 2022 figures have been restated to reflect the change in presentation to present interest received ($10 million) separately from finance costs. |
| 2 | Income taxes paid excludes $28 million (2022: $26 million) for the three months ended March 31, 2023 of income taxes payable that were settled against offsetting VAT receivables. |
The accompanying notes are an integral part of these condensed interim consolidated financial statements.
| BARRICK FIRST QUARTER 2023 | 76 | FINANCIAL STATEMENTS (UNAUDITED) |
| OVERVIEW | OPERATING PERFORMANCE | GROWTH PROJECTS & EXPLORATION | REVIEW OF FINANCIAL RESULTS |
OTHER INFORMATION & NON-GAAP RECONCILIATIONS
| FINANCIAL STATEMENTS |
Consolidated Balance Sheets
Barrick Gold Corporation (in millions of United States dollars) (Unaudited) | As at March 31, 2023 | As at December 31, 2022 | ||||||
ASSETS | ||||||||
Current assets | ||||||||
Cash and equivalents | $4,377 | $4,440 | ||||||
Accounts receivable | 557 | 554 | ||||||
Inventories | 1,913 | 1,781 | ||||||
Other current assets | 1,691 | 1,690 | ||||||
Total current assets | $8,538 | $8,465 | ||||||
Non-current assets | ||||||||
Equity in investees (note 11) | 3,969 | 3,983 | ||||||
Property, plant and equipment | 26,084 | 25,821 | ||||||
Goodwill | 3,581 | 3,581 | ||||||
Intangible assets | 149 | 149 | ||||||
Deferred income tax assets | 19 | 19 | ||||||
Non-current portion of inventory | 2,705 | 2,819 | ||||||
Other assets | 1,107 | 1,128 | ||||||
Total assets | $46,152 | $45,965 | ||||||
LIABILITIES AND EQUITY | ||||||||
Current liabilities | ||||||||
Accounts payable | $1,504 | $1,556 | ||||||
Debt | 12 | 13 | ||||||
Current income tax liabilities | 310 | 163 | ||||||
Other current liabilities | 1,380 | 1,388 | ||||||
Total current liabilities | $3,206 | $3,120 | ||||||
Non-current liabilities | ||||||||
Debt | 4,765 | 4,769 | ||||||
Provisions | 2,244 | 2,211 | ||||||
Deferred income tax liabilities | 3,270 | 3,247 | ||||||
Other liabilities | 1,349 | 1,329 | ||||||
Total liabilities | $14,834 | $14,676 | ||||||
Equity | ||||||||
Capital stock (note 14) | $28,115 | $28,114 | ||||||
Deficit | (7,338 | ) | (7,282 | ) | ||||
Accumulated other comprehensive income (loss) | 23 | 26 | ||||||
Other | 1,913 | 1,913 | ||||||
Total equity attributable to Barrick Gold Corporation shareholders | $22,713 | $22,771 | ||||||
Non-controlling interests (note 15) | 8,605 | 8,518 | ||||||
Total equity | $31,318 | $31,289 | ||||||
Contingencies and commitments (notes 4 and 16) | ||||||||
Total liabilities and equity | $46,152 | $45,965 | ||||||
The accompanying notes are an integral part of these condensed interim consolidated financial statements.
| BARRICK FIRST QUARTER 2023 | 77 | FINANCIAL STATEMENTS (UNAUDITED) |
| OVERVIEW | OPERATING PERFORMANCE | GROWTH PROJECTS & EXPLORATION | REVIEW OF FINANCIAL RESULTS |
OTHER INFORMATION & NON-GAAP RECONCILIATIONS
| FINANCIAL STATEMENTS |
Consolidated Statements of Changes in Equity
| Barrick Gold Corporation | Attributable to equity holders of the company | |||||||||||||||||||||||||||||||
(in millions of United States dollars) (Unaudited) | Common Shares (in thousands) | Capital stock | Retained earnings (deficit) | Accumulated other comprehensive income (loss)1 | Other2 | Total equity attributable to shareholders | Non- controlling interests | Total equity | ||||||||||||||||||||||||
At January 1, 2023 | 1,755,350 | $28,114 | ($7,282 | ) | $26 | $1,913 | $22,771 | $8,518 | $31,289 | |||||||||||||||||||||||
Net income | — | — | 120 | — | — | 120 | 149 | 269 | ||||||||||||||||||||||||
Total other comprehensive loss | — | — | — | (3 | ) | — | (3 | ) | — | (3 | ) | |||||||||||||||||||||
Total comprehensive income (loss) | — | — | 120 | (3 | ) | — | 117 | 149 | 266 | |||||||||||||||||||||||
Transactions with owners | ||||||||||||||||||||||||||||||||
Dividends | — | — | (175 | ) | — | — | (175 | ) | — | (175 | ) | |||||||||||||||||||||
Disbursements to non-controlling interests (note 15) | — | — | — | — | — | — | (62 | ) | (62 | ) | ||||||||||||||||||||||
Dividend reinvestment plan (note 14) | 58 | 1 | (1 | ) | — | — | — | — | — | |||||||||||||||||||||||
Total transactions with owners | 58 | 1 | (176 | ) | — | — | (175 | ) | (62 | ) | (237 | ) | ||||||||||||||||||||
At March 31, 2023 | 1,755,408 | $28,115 | ($7,338 | ) | $23 | $1,913 | $22,713 | $8,605 | $31,318 | |||||||||||||||||||||||
| ||||||||||||||||||||||||||||||||
At January 1, 2022 | 1,779,331 | $28,497 | ($6,566 | ) | ($23 | ) | $1,949 | $23,857 | $8,450 | $32,307 | ||||||||||||||||||||||
Net income | — | — | 438 | — | — | 438 | 268 | 706 | ||||||||||||||||||||||||
Total other comprehensive income | — | — | — | 58 | — | 58 | — | 58 | ||||||||||||||||||||||||
Total comprehensive income | — | — | 438 | 58 | — | 496 | 268 | 764 | ||||||||||||||||||||||||
Transactions with owners | ||||||||||||||||||||||||||||||||
Dividends | — | — | (178 | ) | — | — | (178 | ) | — | (178 | ) | |||||||||||||||||||||
Disbursements to non-controlling interests | — | — | — | — | — | — | (267 | ) | (267 | ) | ||||||||||||||||||||||
Dividend reinvestment plan | 25 | — | — | — | — | — | — | — | ||||||||||||||||||||||||
Total transactions with owners | 25 | — | (178 | ) | — | — | (178 | ) | (267 | ) | (445 | ) | ||||||||||||||||||||
At March 31, 2022 | 1,779,356 | $28,497 | ($6,306 | ) | $35 | $1,949 | $24,175 | $8,451 | $32,626 | |||||||||||||||||||||||
| 1 | Includes cumulative translation losses at March 31, 2023: $95 million (December 31, 2022: $93 million; March 31, 2022: $94 million). |
| 2 | Includes additional paid-in capital as at March 31, 2023: $1,875 million (December 31, 2022: $1,875 million; March 31, 2022: $1,911 million). |
The accompanying notes are an integral part of these condensed interim consolidated financial statements.
| BARRICK FIRST QUARTER 2023 | 78 | FINANCIAL STATEMENTS (UNAUDITED) |
| OVERVIEW | OPERATING PERFORMANCE | GROWTH PROJECTS & EXPLORATION | REVIEW OF FINANCIAL RESULTS |
OTHER INFORMATION & NON-GAAP RECONCILIATIONS
| FINANCIAL STATEMENTS |
Notes to Consolidated Financial Statements
Barrick Gold Corporation. Tabular dollar amounts in millions of United States dollars, unless otherwise shown.
1 ∎ Corporate Information
Barrick Gold Corporation (“Barrick”, “we” or the “Company”) is a corporation governed by the Business Corporations Act (British Columbia). The Company’s corporate office is located at Brookfield Place, TD Canada Trust Tower, 161 Bay Street, Suite 3700, Toronto, Ontario, M5J 2S1. The Company’s registered office is 925 West Georgia Street, Suite 1600, Vancouver, British Columbia, V6C 3L2. Barrick shares trade on the New York Stock Exchange under the symbol GOLD and the Toronto Stock Exchange under the symbol ABX. We are principally engaged in the production and sale of gold and copper, as well as related activities such as exploration and mine development. We sell our gold and copper into the world market.
We have ownership interests in producing gold mines that are located in Argentina, Canada, Côte d’Ivoire, the Democratic Republic of the Congo, the Dominican Republic, Mali, Tanzania and the United States. Our mine in Papua New Guinea was placed on care and maintenance in April 2020. We have ownership interests in producing copper mines in Chile, Saudi Arabia and Zambia. We also have various projects located throughout the Americas, Asia and Africa.
2 ∎ Material Accounting Policy Information
a) Statement of Compliance
These condensed interim consolidated financial statements have been prepared in accordance with International Accounting Standard 34 Interim Financial Reporting (“IAS 34”) as issued by the International Accounting Standards Board (“IASB”). These interim financial statements should be read in conjunction with Barrick’s most recently issued Annual Report, which includes information necessary or useful to understanding the Company’s business and financial statement presentation. In particular, the Company’s significant accounting policies were presented in Note 2 of the Annual Consolidated Financial Statements for the year ended December 31, 2022 (“2022 Annual Financial Statements”), and have been consistently applied in the preparation of these interim financial statements, except as otherwise noted in Note 2b. These condensed interim consolidated financial statements were authorized for issuance by the Board of Directors on May 2, 2023.
b) New Accounting Standards Issued But Not Yet Effective
Certain new accounting standards and interpretations have been published that are not mandatory for the current period and have not been early adopted. These standards are not expected to have a material impact on Barrick in the current or future reporting periods.
3 ∎ Critical Judgements, Estimates, Assumptions and Risks
The judgments, estimates, assumptions and risks discussed here reflect updates from the 2022 Annual Financial Statements. For judgments, estimates, assumptions and risks related to other areas not discussed
in these interim consolidated financial statements, please refer to Notes 3 and 28 of the 2022 Annual Financial Statements.
a) Provision for Environmental Rehabilitation (“PER”)
Provisions are updated each reporting period for changes to expected cash flows and for the effect of changes in the discount rate and foreign exchange rates. The change in estimate is added or deducted from the related asset and depreciated over the expected economic life of the operation to which it relates. In the case of closed sites, changes in estimates and assumptions are recognized immediately in the consolidated statements of income. We recorded a net increase of $38 million (2022: $26 million net decrease) for the three months ended March 31, 2023 primarily due to a decrease in the discount rate.
Adjustments to the estimated amount and timing of future closure and rehabilitation cash flows are a normal occurrence in light of the significant judgments and estimates involved. Rehabilitation provisions are adjusted as a result of changes in estimates and assumptions and are accounted for prospectively. In the fourth quarter of each year, our life of mine plans are updated and that typically results in an update to the rehabilitation provision.
b) Pascua-Lama
The Pascua-Lama project received $505 million as at March 31, 2023 (December 31, 2022: $457 million) in value added tax (“VAT”) refunds in Chile relating to the development of the Chilean side of the project. Under the current arrangement, this amount must be repaid if the project does not evidence exports for an amount of $3,538 million within a term that expires on December 31, 2026, unless extended. In 2022, the Chilean government proposed changes to Chilean law on VAT refunds that may affect the timeframe and amount of these refunds. The proposed changes were rejected in a vote by the Lower House of Congress on March 8, 2023, and Barrick will continue to monitor the status of these proposals in the event that they are reintroduced by the Chilean government.
In addition, we have recorded $27 million in VAT recoverable in Argentina as at March 31, 2023 (December 31, 2022: $31 million) relating to the development of the Argentinean side of the project. These amounts may not be fully recoverable if the project does not enter into production and are subject to foreign currency risk as the amounts are recoverable in Argentine pesos.
c) Contingencies
Contingencies can be either possible assets or possible liabilities arising from past events which, by their nature, will be resolved only when one or more future events, not wholly within our control, occur or fail to occur. The assessment of such contingencies inherently involves the exercise of significant judgment and estimates of the outcome of future events. Refer to Note 16 for further details on contingencies.
| BARRICK FIRST QUARTER 2023 | 79 | NOTES TO FINANCIAL STATEMENTS (UNAUDITED) |
| OVERVIEW | OPERATING PERFORMANCE | GROWTH PROJECTS & EXPLORATION | REVIEW OF FINANCIAL RESULTS |
OTHER INFORMATION & NON-GAAP RECONCILIATIONS
| FINANCIAL STATEMENTS |
4 ∎ Segment Information
Barrick’s business is organized into eighteen minesites. Barrick’s Chief Operating Decision Maker (“CODM”) (Mark Bristow, President and Chief Executive Officer) reviews the operating results, assesses performance and makes capital allocation decisions at the minesite level. In the first quarter of 2023, we re-evaluated our reportable operating segments. Lumwana has been presented as a reportable segment for the current and prior periods. Veladero is no longer a reportable segment. As a result, our presentation of our reportable operating segments consists of eight gold mines (Carlin, Cortez, Turquoise Ridge, Pueblo Viejo, Loulo-Gounkoto, Kibali, North Mara and Bulyanhulu) and one copper mine (Lumwana). The remaining operating segments, including our remaining gold mines, have been grouped into an “Other Mines” category and will not be reported on individually. Prior period figures have been restated to reflect this change and 2022 and 2021 annual information for Lumwana is provided below. Segment performance is evaluated based on a number of measures including operating income before tax, production levels and unit production costs. Certain costs are managed on a consolidated basis and are therefore not reflected in segment income.
Consolidated Statement of Income Information
| Cost of Sales | ||||||||||||||||||||||||
For the three months ended March 31, 2023 | Revenue | | Site operating costs, royalties and community relations |
| Depreciation | | Exploration, evaluation and project expenses |
| | Other expenses (income)1 |
| | Segment income (loss) |
| ||||||||||
Carlin2 | $511 | $330 | $63 | $8 | $2 | $108 | ||||||||||||||||||
Cortez2 | 425 | 204 | 91 | 2 | 2 | 126 | ||||||||||||||||||
Turquoise Ridge2 | 254 | 139 | 50 | 1 | — | 64 | ||||||||||||||||||
Pueblo Viejo2 | 291 | 120 | 64 | 1 | 1 | 105 | ||||||||||||||||||
Loulo-Gounkoto2 | 321 | 144 | 71 | — | 1 | 105 | ||||||||||||||||||
Kibali | 127 | 66 | 25 | — | 3 | 33 | ||||||||||||||||||
Lumwana | 171 | 130 | 44 | 7 | 2 | (12 | ) | |||||||||||||||||
North Mara2 | 158 | 64 | 19 | — | 19 | 56 | ||||||||||||||||||
Bulyanhulu2 | 111 | 58 | 16 | — | 16 | 21 | ||||||||||||||||||
Other Mines2 | 394 | 251 | 71 | 2 | 20 | 50 | ||||||||||||||||||
Reportable segment total | $2,763 | $1,506 | $514 | $21 | $66 | $656 | ||||||||||||||||||
Share of equity investees | (127 | ) | (66 | ) | (25 | ) | — | (3 | ) | (33 | ) | |||||||||||||
Segment total | $2,636 | $1,440 | $489 | $21 | $63 | $623 | ||||||||||||||||||
| Consolidated Statement of Income Information |
| |||||||||||||||||||||||
| Cost of Sales | ||||||||||||||||||||||||
For the three months ended March 31, 2022 | Revenue | | Site operating costs, royalties and community relations |
| Depreciation | | Exploration, evaluation and project expenses |
| | Other expenses (income)1 |
| | Segment income (loss) |
| ||||||||||
Carlin2 | $707 | $310 | $69 | $2 | ($21 | ) | $347 | |||||||||||||||||
Cortez2 | 364 | 152 | 62 | 2 | — | 148 | ||||||||||||||||||
Turquoise Ridge2 | 195 | 107 | 42 | — | 1 | 45 | ||||||||||||||||||
Pueblo Viejo2 | 338 | 129 | 58 | 2 | 1 | 148 | ||||||||||||||||||
Loulo-Gounkoto2 | 322 | 123 | 63 | 2 | 2 | 132 | ||||||||||||||||||
Kibali | 137 | 55 | 28 | 3 | 10 | 41 | ||||||||||||||||||
Lumwana | 287 | 116 | 38 | — | — | 133 | ||||||||||||||||||
North Mara2 | 131 | 50 | 10 | 1 | 1 | 69 | ||||||||||||||||||
Bulyanhulu2 | 131 | 62 | 17 | — | 1 | 51 | ||||||||||||||||||
Other Mines2 | 393 | 227 | 94 | 3 | 18 | 51 | ||||||||||||||||||
Reportable segment total | $3,005 | $1,331 | $481 | $15 | $13 | $1,165 | ||||||||||||||||||
Share of equity investees | (137 | ) | (55 | ) | (28 | ) | (3 | ) | (10 | ) | (41 | ) | ||||||||||||
Segment total | $2,868 | $1,276 | $453 | $12 | $3 | $1,124 | ||||||||||||||||||
| 1 | Includes accretion expense, which is included within finance costs in the consolidated statement of income. For the three months ended March 31, 2023, accretion expense was $12 million (2022: $7 million). |
| 2 | Includes non-controlling interest portion of revenues, cost of sales and segment income for the three months ended March 31, 2023 for Nevada Gold Mines $505 million, $379 million, $120 million (2022: $556 million, $333 million, $228 million), Pueblo Viejo $116 million, $73 million, $42 million (2022: $135 million, $75 million, $59 million), Loulo-Gounkoto $64 million, $43 million, $22 million (2022: $64 million, $37 million, $27 million), North Mara, Bulyanhulu and Buzwagi $43 million, $25 million, $12 million (2022: $42 million, $22 million, $19 million) and Tongon $11 million, $9 million, $3 million (2022: $8 million, $9 million, $(1) million), respectively. |
| BARRICK FIRST QUARTER 2023 | 80 | NOTES TO FINANCIAL STATEMENTS (UNAUDITED) |
| OVERVIEW | OPERATING PERFORMANCE | GROWTH PROJECTS & EXPLORATION | REVIEW OF FINANCIAL RESULTS |
OTHER INFORMATION & NON-GAAP RECONCILIATIONS
| FINANCIAL STATEMENTS |
Reconciliation of Segment Income to Income Before Income Taxes
For the three months ended March 31 | ||||||||
| 2023 | 2022 | |||||||
Segment income | $623 | $1,124 | ||||||
Other revenue | 7 | (15 | ) | |||||
Other cost of sales/amortization | (12 | ) | (10 | ) | ||||
Exploration, evaluation and project expenses not attributable to segments | (50 | ) | (55 | ) | ||||
General and administrative expenses | (39 | ) | (54 | ) | ||||
Other income (loss) not attributable to segments | (2 | ) | — | |||||
Impairment charges | (1 | ) | (2 | ) | ||||
Loss on currency translation | (38 | ) | (3 | ) | ||||
Closed mine rehabilitation | (22 | ) | (3 | ) | ||||
Income from equity investees | 53 | 99 | ||||||
Finance costs, net (includes non-segment accretion) | (46 | ) | (81 | ) | ||||
Gain on non-hedge derivatives | 1 | 7 | ||||||
Income before income taxes | $474 | $1,007 | ||||||
Capital Expenditures Information | | Segment capital expenditures1 |
| |||||
| For the three months ended March 31 | ||||||||
| 2023 | 2022 | |||||||
Carlin | $120 | $117 | ||||||
Cortez | 86 | 93 | ||||||
Turquoise Ridge | 27 | 42 | ||||||
Pueblo Viejo | 127 | 144 | ||||||
Loulo-Gounkoto | 104 | 62 | ||||||
Kibali | 19 | 17 | ||||||
Lumwana | 52 | 57 | ||||||
North Mara | 40 | 22 | ||||||
Bulyanhulu | 20 | 12 | ||||||
Other Mines | 61 | 58 | ||||||
Reportable segment total | $656 | $624 | ||||||
Other items not allocated to segments | 41 | 34 | ||||||
Total | $697 | $658 | ||||||
Share of equity investees | (19 | ) | (17 | ) | ||||
Total | $678 | $641 | ||||||
| 1 | Segment capital expenditures are presented for internal management reporting purposes on an accrual basis. Capital expenditures in the Consolidated Statements of Cash Flow are presented on a cash basis. For the three months ended March 31, 2023, cash expenditures were $688 million (2022: $611 million) and the decrease in accrued expenditures was $10 million (2022: $30 million increase). |
| Lumwana | Cost of Sales | |||||||||||||||||||||||||||
For the year ended | Revenue | | Site operating costs, royalties and community relations |
| Depreciation | | Exploration, evaluation and project expenses |
| | Other expenses (income)1 |
| | Segment income (loss) |
| | Capital Expenditures |
| |||||||||||
December 31, 2022 | $868 | $443 | $223 | $11 | $11 | $180 | $380 | |||||||||||||||||||||
December 31, 2021 | $962 | $373 | $197 | $— | $1 | $391 | $222 | |||||||||||||||||||||
Purchase Commitments
At March 31, 2023, we had purchase obligations for supplies and consumables of $1,754 million (December 31, 2022: $1,753 million).
Capital Commitments
In addition to entering into various operational commitments in the normal course of business, we had capital commitments of $442 million at March 31, 2023 (December 31, 2022: $399 million).
| BARRICK FIRST QUARTER 2023 | 81 | NOTES TO FINANCIAL STATEMENTS (UNAUDITED) |
| OVERVIEW | OPERATING PERFORMANCE | GROWTH PROJECTS & EXPLORATION | REVIEW OF FINANCIAL RESULTS |
OTHER INFORMATION & NON-GAAP RECONCILIATIONS
| FINANCIAL STATEMENTS |
5 ∎ Revenue
For the three months ended March 31 | ||||||||
| 2023 | 2022 | |||||||
Gold sales | ||||||||
Spot market sales | $2,326 | $2,426 | ||||||
Concentrate sales | 77 | 81 | ||||||
Provisional pricing adjustments | 8 | 4 | ||||||
| $2,411 | $2,511 | |||||||
Copper sales | ||||||||
Concentrate sales | $159 | $271 | ||||||
Provisional pricing adjustments | 12 | 16 | ||||||
| $171 | $287 | |||||||
Other sales1 | 61 | 55 | ||||||
Total | $2,643 | $2,853 | ||||||
| 1 | Revenues include the sale of by-products for our gold and copper mines. |
6 ∎ Cost of Sales
| Gold | Copper | Other3 | Total | |||||||||||||||||||||||||||||
| For the three months ended March 31 | 2023 | 2022 | 2023 | 2022 | 2023 | 2022 | 2023 | 2022 | ||||||||||||||||||||||||
Site operating costs1,2 | $1,208 | $1,068 | $115 | $83 | $— | $— | $1,323 | $1,151 | ||||||||||||||||||||||||
Depreciation1 | 445 | 419 | 44 | 38 | 6 | 3 | 495 | 460 | ||||||||||||||||||||||||
Royalty expense | 101 | 88 | 15 | 32 | — | — | 116 | 120 | ||||||||||||||||||||||||
Community relations | 7 | 7 | — | 1 | — | — | 7 | 8 | ||||||||||||||||||||||||
| $1,761 | $1,582 | $174 | $154 | $6 | $3 | $1,941 | $1,739 | |||||||||||||||||||||||||
| 1 | Site operating costs and depreciation include charges to reduce the cost of inventory to net realizable value as follows: $13 million for the three months ended March 31, 2023 (2022: $nil). |
| 2 | Site operating costs includes the costs of extracting by-products. |
| 3 | Other includes corporate amortization. |
7 ∎ Earnings Per Share
| For the three months ended March 31 | ||||||||||||||||
| 2023 | 2022 | |||||||||||||||
| Basic | Diluted | Basic | Diluted | |||||||||||||
Net income | $269 | $269 | $706 | $706 | ||||||||||||
Net income attributable to non-controlling interests | (149 | ) | (149 | ) | (268 | ) | (268 | ) | ||||||||
Net income attributable to equity holders of Barrick Gold Corporation | $120 | $120 | $438 | $438 | ||||||||||||
Weighted average shares outstanding | 1,755 | 1,755 | 1,779 | 1,779 | ||||||||||||
Basic and diluted earnings per share data attributable to the equity holders of Barrick Gold Corporation | $0.07 | $0.07 | $0.25 | $0.25 | ||||||||||||
| BARRICK FIRST QUARTER 2023 | 82 | NOTES TO FINANCIAL STATEMENTS (UNAUDITED) |
| OVERVIEW | OPERATING PERFORMANCE | GROWTH PROJECTS & EXPLORATION | REVIEW OF FINANCIAL RESULTS |
OTHER INFORMATION & NON-GAAP RECONCILIATIONS
| FINANCIAL STATEMENTS |
8 ∎ Other Expense
a) Other Expense (Income)
For the three months ended March 31 | ||||||||
| 2023 | 2022 | |||||||
Other expense: | ||||||||
Bank charges | $1 | $2 | ||||||
Litigation | 5 | 4 | ||||||
Loss (gain) on warrant investments at fair value through profit or loss (“FVPL”) | 2 | (2 | ) | |||||
Porgera care and maintenance costs | 17 | 13 | ||||||
Buzwagi supplies obsolescence | — | 2 | ||||||
Tanzania education program | 30 | — | ||||||
Other | 6 | 8 | ||||||
Total other expense | $61 | $27 | ||||||
Other income: | ||||||||
Gain on sale of non-current assets | ($3 | ) | ($2 | ) | ||||
Gain on non-hedge derivatives | (1 | ) | (7 | ) | ||||
Insurance proceeds related to NGM | — | (22 | ) | |||||
Interest income on other assets | (5 | ) | (4 | ) | ||||
Other | — | (3 | ) | |||||
Total other income | ($9 | ) | ($38 | ) | ||||
Total | $52 | ($11 | ) | |||||
b) Impairment Charges
For the three months ended March 31 | ||||||||
| 2023 | 2022 | |||||||
Impairment charges of non-current assets1 | $1 | $2 | ||||||
Total | $1 | $2 | ||||||
| 1 | Refer to note 12 for further details. |
9 ∎ Income Tax Expense
For the three months ended March 31 | ||||||||
| 2023 | 2022 | |||||||
Current | $182 | $277 | ||||||
Deferred | 23 | 24 | ||||||
Total | $205 | $301 | ||||||
Income tax expense was $205 million for the three months ended March 31, 2023 (2022: $301 million). The unadjusted effective income tax rate for the three months ended March 31, 2023 was 43% of income before income taxes.
The underlying effective income tax rate on ordinary income for the three months ended March 31, 2023 was 30% after adjusting for the impact of foreign currency translation losses on deferred tax balances; the impact of updates to the rehabilitation provision for our non-operating mines; the impact of non-deductible foreign
exchange losses; the impact of the Porgera mine being placed on care and maintenance; the impact of our commitment towards the expansion of education infrastructure in Tanzania; and the impact of other expense adjustments.
Currency Translation
Current and deferred tax balances are subject to remeasurement for changes in foreign currency exchange rates each period. This is required in countries where tax is paid in local currency and the subsidiary has a different functional currency (e.g. US dollars). The most significant balances relate to Argentine and Malian tax liabilities.
In the three months ended March 31, 2023, a tax expense of $4 million (2022: $16 million tax expense) arose primarily from translation losses and gains on tax balances in Argentina and Mali due to the weakening of the Argentine peso and strengthening of the West African CFA franc, respectively, against the US dollar. These net translation losses are included within income tax expense.
Withholding Taxes
For the three months ended March 31, 2023, we have recorded $16 million (2022: $20 million related to Argentina and the United States) of dividend withholding taxes related to the undistributed earnings of our subsidiaries in the United States.
United States Tax Reform
In August 2022, President Joe Biden signed the Inflation Reduction Act (“the Act”) into law. The Act includes a 15% corporate alternative minimum tax (“CAMT”) that is imposed on applicable financial statement income (“AFSI”) and therefore would be considered in scope for IAS 12 given it is a tax on profits. The CAMT is effective for tax years beginning after December 31, 2022 and CAMT credit carryforwards have an indefinite life. Barrick is subject to CAMT because the Company meets the applicable income thresholds for a foreign-parented multi-national group.
On December 27, 2022, the US Treasury Department and the US Internal Revenue Service issued initial guidance regarding the application of the CAMT. This was followed by a 60-day consultation period, and we have provided comments. We are awaiting the final US Treasury Regulations detailing the application of CAMT.
For the three months ended March 31, 2023, the deferred tax asset arising from the CAMT credit carryforward has been recognized on the basis that we estimate that future regular tax will exceed tentative minimum tax on a probable basis.
Nevada Gold Mines
Nevada Gold Mines is a limited liability company treated as a flow through partnership for US tax purposes. The partnership is not subject to federal income tax directly, but each of its partners is liable for tax on its share of the profits of the partnership. As such, Barrick accounts for its current and deferred income tax associated with this investment (61.5% share) following the principles in IAS 12.
| BARRICK FIRST QUARTER 2023 | 83 | NOTES TO FINANCIAL STATEMENTS (UNAUDITED) |
| OVERVIEW | OPERATING PERFORMANCE | GROWTH PROJECTS & EXPLORATION | REVIEW OF FINANCIAL RESULTS |
OTHER INFORMATION & NON-GAAP RECONCILIATIONS
| FINANCIAL STATEMENTS |
10 ∎ Cash Flow - Other Items
| Operating Cash Flows – Other Items | For the three months ended March 31 | |||||||
| 2023 | 2022 | |||||||
Adjustments for non-cash income statement items: | ||||||||
Gain on non-hedge derivatives | ($1 | ) | ($7 | ) | ||||
Loss (gain) on warrant investments at FVPL | 2 | (2 | ) | |||||
Tanzania education program | 30 | — | ||||||
Share-based compensation expense | 19 | 35 | ||||||
Change in estimate of rehabilitation costs at closed mines | 22 | 3 | ||||||
Insurance proceeds related to NGM | — | (22 | ) | |||||
Net inventory impairment charges | 9 | — | ||||||
Change in other assets and liabilities | 38 | (15 | ) | |||||
Settlement of share-based compensation | (29 | ) | (45 | ) | ||||
Settlement of rehabilitation obligations | (38 | ) | (24 | ) | ||||
Other operating activities | $52 | ($77 | ) | |||||
Cash flow arising from changes in: | ||||||||
Accounts receivable | $6 | $27 | ||||||
Inventory | (72 | ) | (40 | ) | ||||
Other current assets | (4 | ) | (104 | ) | ||||
Accounts payable | (119 | ) | (25 | ) | ||||
Other current liabilities | (17 | ) | 11 | |||||
Change in working capital | ($206 | ) | ($131 | ) | ||||
11 ∎ Equity Accounting Method Investment Continuity
| Kibali | Jabal Sayid | Zaldívar | Other | Total | ||||||||||||||||
At January 1, 2022 | $3,267 | $382 | $893 | $52 | $4,594 | |||||||||||||||
Equity pick-up from equity investees | 86 | 124 | 47 | 1 | 258 | |||||||||||||||
Dividends received from equity investees | (694 | ) | (124 | ) | (50 | ) | (1 | ) | (869 | ) | ||||||||||
At December 31, 2022 | $2,659 | $382 | $890 | $52 | $3,983 | |||||||||||||||
Equity pick-up from equity investees | 22 | 28 | 3 | — | 53 | |||||||||||||||
Dividends received from equity investees | (37 | ) | (30 | ) | — | — | (67 | ) | ||||||||||||
At March 31, 2023 | $2,644 | $380 | $893 | $52 | $3,969 | |||||||||||||||
| BARRICK FIRST QUARTER 2023 | 84 | NOTES TO FINANCIAL STATEMENTS (UNAUDITED) |
| OVERVIEW | OPERATING PERFORMANCE | GROWTH PROJECTS & EXPLORATION | REVIEW OF FINANCIAL RESULTS |
OTHER INFORMATION & NON-GAAP RECONCILIATIONS
| FINANCIAL STATEMENTS |
12 ∎ Impairment of Goodwill and Other Assets
In accordance with our accounting policy, goodwill is tested for impairment in the fourth quarter and also when there is an indicator of impairment. Non-current assets are tested for impairment or impairment reversals when events or changes in circumstances suggest that the carrying amount may not be recoverable or is understated. Refer to Note 21 of the 2022 Annual Financial Statements for further information.
For the three months ended March 31, 2023, we recorded net impairment charges of $1 million (2022: $2 million net impairment charges) for non-current assets.
Indicators of impairment and reversals
2023
Porgera
On April 9, 2021, the Papua New Guinea (“PNG”) government and Barrick Niugini Limited (“BNL”, the 95% owner and operator of the Porgera joint venture) agreed on a partnership for the future ownership and operation of the Porgera mine. Porgera has been on care and maintenance since April 2020, when the government declined to renew its special mining lease (“SML”). The financial impact will be determined once all definitive agreements, which are currently being negotiated, have been signed. We have determined that as at March 31, 2023, there is no impairment loss to recognize. The ultimate resolution of this dispute may differ from this determination and there is no certainty that the carrying value will remain recoverable. Refer to Note 16 for more information.
13 ∎ Fair Value Measurements
a) Assets and Liabilities Measured at Fair Value on a Recurring Basis
As at March 31, 2023 | | Quoted prices in active markets for identical assets
(Level 1) |
| | Significant other observable inputs
(Level 2) |
| | Significant unobservable inputs
(Level 3) |
| | Aggregate fair value
|
| ||||
Other investments1 | $109 | $— | $— | $109 | ||||||||||||
Derivatives | — | 15 | — | 15 | ||||||||||||
Receivables from provisional copper and gold sales | — | 196 | — | 196 | ||||||||||||
| $109 | $211 | $— | $320 | |||||||||||||
| 1 | Includes equity investments in other mining companies. |
b) Fair Values of Financial Assets and Liabilities
| As at March 31, 2023 | As at December 31, 2022 | |||||||||||||||
| Carrying amount | Estimated fair value | Carrying amount | Estimated fair value | |||||||||||||
Financial assets | ||||||||||||||||
Other assets1, 5 | $1,376 | $1,376 | $1,358 | $1,358 | ||||||||||||
Other investments2 | 109 | 109 | 112 | 112 | ||||||||||||
Derivative assets3 | 15 | 15 | 59 | 59 | ||||||||||||
| $1,500 | $1,500 | $1,529 | $1,529 | |||||||||||||
Financial liabilities | ||||||||||||||||
Debt4 | $4,777 | $5,105 | $4,782 | $4,922 | ||||||||||||
Other liabilities5 | 1,605 | 1,605 | 1,562 | 1,562 | ||||||||||||
| $6,382 | $6,710 | $6,344 | $6,484 | |||||||||||||
| 1 | Includes restricted cash and amounts due from our partners. |
| 2 | Includes equity investments in other mining companies. Recorded at fair value. Quoted market prices are used to determine fair value. |
| 3 | 2023 primarily consists of contingent consideration received as part of the sale of Lagunas Norte. During the first quarter of 2023, the final settlement of $46.25 million was received relating to the Massawa contingent consideration. |
| 4 | Debt is generally recorded at amortized cost. The fair value of debt is primarily determined using quoted market prices. Balance includes both current and long-term portions of debt. |
| 5 | Other assets include a restricted cash balance and other liabilities include a liability to Antofagasta plc. The restricted cash will fund Antofagasta plc’s exit from the Reko Diq project, following its reconstitution in the fourth quarter of 2022. |
The Company’s valuation techniques were presented in Note 26 of the 2022 Annual Financial Statements and have been consistently applied in these interim financial statements.
| BARRICK FIRST QUARTER 2023 | 85 | NOTES TO FINANCIAL STATEMENTS (UNAUDITED) |
| OVERVIEW | OPERATING PERFORMANCE | GROWTH PROJECTS & EXPLORATION | REVIEW OF FINANCIAL RESULTS |
OTHER INFORMATION & NON-GAAP RECONCILIATIONS
| FINANCIAL STATEMENTS |
14 ∎ Capital Stock
a) Authorized Capital Stock
Our authorized capital stock is composed of an unlimited number of common shares (issued 1,755,407,560 common shares as at March 31, 2023). Our common shares have no par value.
b) Dividends
The Company’s practice has been to declare dividends after a quarter as part of the announcement of the results for the quarter. Dividends declared are paid in the same quarter.
The Company’s dividend reinvestment plan resulted in 57,899 common shares issued to shareholders for the three months ended March 31, 2023.
c) Share Buyback Program
At the February 14, 2023 meeting, the Board of Directors authorized a new share buyback program for the repurchase of up to $1.0 billion of the Company’s outstanding common shares over the next 12 months. During the three months ended March 31, 2023, Barrick did not purchase any shares under this program.
The actual number of common shares that may be purchased, and the timing of any such purchases, will be determined by Barrick based on a number of factors, including the Company’s financial performance, the availability of cash flows, and the consideration of other uses of cash, including capital investment opportunities, returns to shareholders, and debt reduction.
The repurchase program does not obligate the Company to acquire any particular number of common shares, and the repurchase program may be suspended or discontinued at any time at the Company’s discretion.
15 ∎ Non-controlling Interests Continuity
Nevada Gold Mines | Pueblo Viejo | Tanzania Mines1 | Loulo- Gounkoto | Tongon | Reko Diq | Other | Total | |||||||||||||||||||||||||
NCI in subsidiary at March 31, 2023 | 38.5 | % | 40 | % | 16 | % | 20 | % | 10.3 | % | 50 | % | Various | |||||||||||||||||||
At January 1, 2022 | $6,061 | $1,189 | $298 | $953 | $29 | $— | ($80 | ) | $8,450 | |||||||||||||||||||||||
Acquisitions | — | — | — | — | — | 329 | �� | — | 329 | |||||||||||||||||||||||
Share of income | 633 | 96 | 35 | (179 | ) | — | — | — | 585 | |||||||||||||||||||||||
Disbursements | (626 | ) | (157 | ) | (12 | ) | (35 | ) | (16 | ) | — | — | (846 | ) | ||||||||||||||||||
At December 31, 2022 | $6,068 | $1,128 | $321 | $739 | $13 | $329 | ($80 | ) | $8,518 | |||||||||||||||||||||||
Share of income | 105 | 20 | 6 | 16 | 2 | — | — | 149 | ||||||||||||||||||||||||
Disbursements | (50 | ) | — | — | (12 | ) | — | — | — | (62 | ) | |||||||||||||||||||||
At March 31, 2023 | $6,123 | $1,148 | $327 | $743 | $15 | $329 | ($80 | ) | $8,605 | |||||||||||||||||||||||
| 1 | Tanzania mines consist of the two operating mines, North Mara and Bulyanhulu. |
16 ∎ Contingencies
Certain conditions may exist as of the date the financial statements are issued that may result in a loss to the Company, but which will only be resolved when one or more future events occur or fail to occur. The impact of any resulting loss from such matters affecting these financial statements and noted below may be material.
Except as noted below, no material changes have occurred with respect to the matters disclosed in Note 35 “Contingencies” to the 2022 Annual Financial Statements, and no new contingencies have occurred that are material to the Company since the issuance of the 2022 Annual Financial Statements.
The description set out below should be read in conjunction with Note 35 “Contingencies” to the 2022 Annual Financial Statements.
Litigation and Claims Update
Proposed Canadian Securities Class Actions (Pascua-Lama)
In the Quebec proceeding, neither Barrick nor the proposed representative Plaintiff sought leave to appeal from the decision issued by the Quebec Court of Appeal on December 19, 2022. As a result, the matter has been returned to the Superior Court of Quebec. On March 20, 2023, the Superior Court issued an Order suspending
certain deadlines for a period of three months on consent of the parties.
In the Ontario proceeding, the Plaintiffs filed their appeal from the dismissal of certain statutory secondary market claims on April 17, 2023. The hearing of the appeal has yet to be scheduled.
Writ of Kalikasan
On February 14, 2023, the Court granted an additional 60-day extension of the suspension of the proceedings to allow for court-annexed mediation to continue. The parties jointly requested another 60-day extension, which was granted by the Court on March 31, 2023.
Porgera Special Mining Lease
On March 31, 2023, the State of PNG, BNL and New Porgera Limited, the new Porgera joint venture company, entered into the New Porgera Progress Agreement, which confirmed that all parties are committed to reopening the mine in line with the terms of the Commencement Agreement and the Shareholders’ Agreement, both of which were concluded in 2022. The new Porgera project team will now move forward with progressing the filings for a new SML and the other conditions set out in the Commencement Agreement for the reopening of the mine.
| BARRICK FIRST QUARTER 2023 | 86 | NOTES TO FINANCIAL STATEMENTS (UNAUDITED) |
| OVERVIEW | OPERATING PERFORMANCE | GROWTH PROJECTS & EXPLORATION | REVIEW OF FINANCIAL RESULTS |
OTHER INFORMATION & NON-GAAP RECONCILIATIONS
| FINANCIAL STATEMENTS |
Porgera Tax Audits
On February 5, 2023, the PNG Government appointed an Independent Panel to review the tax dispute between BNL and the Internal Revenue Commission. The process is ongoing and non-binding.
Kibali Customs Dispute
The Company is continuing to engage in discussions with the Customs Authority and Ministry of Finance regarding the customs claims and in this regard on March 26, 2023, the parties agreed to settle one of the Customs Authority claims concerning historic export duties. Discussions to resolve the remaining customs claims are ongoing. A formal reassessment notice has not yet been issued by the Customs Authority with respect to these claims.
Zaldívar Water Claims
On April 6, 2023, the Environmental Court of Antofagasta agreed to stay the proceedings for an additional 30-day period, and the current stay will remain in effect through May 6, 2023.
| BARRICK FIRST QUARTER 2023 | 87 | NOTES TO FINANCIAL STATEMENTS (UNAUDITED) |
Corporate Office
Barrick Gold Corporation
161 Bay Street, Suite 3700
Toronto, Ontario M5J 2S1
Canada
Telephone: +1 416 861-9911
Email: investor@barrick.com
Website: www.barrick.com
Shares Listed
GOLD The New York Stock Exchange
ABX The Toronto Stock Exchange
Transfer Agents and Registrars
TSX Trust Company
301 – 100 Adelaide Street West
Toronto, Ontario M5H 4H1
or
American Stock Transfer & Trust Company, LLC
6201 – 15 Avenue
Brooklyn, New York 11219
Telephone: 1-800-387-0825
Fax: 1-888-249-6189
Email: shareholderinquiries@tmx.com
Website: www.tsxtrust.com
Enquiries
President and Chief Executive Officer
Mark Bristow
+1 647 205 7694
+44 788 071 1386
Senior Executive Vice-President and
Chief Financial Officer
Graham Shuttleworth
+1 647 262 2095
+44 779 771 1338
Investor and Media Relations
Kathy du Plessis
+44 20 7557 7738
Email: barrick@dpapr.com
Cautionary Statement on Forward-Looking Information
Certain information contained or incorporated by reference in this press release, including any information as to our strategy, projects, plans or future financial or operating performance, constitutes “forward-looking statements”. All statements, other than statements of historical fact, are forward-looking statements. The words “believe”, “expect”, “strategy”, “target”, “plan”, “scheduled”, “commitment” “opportunities”, “guidance”, “project”, “continue”, “on track”, “estimate”, “growth”, “potential”, “future”, “extend”, “planned”, “will”, “could”, “would”, “should”, “may” and similar expressions identify forward-looking statements. In particular, this press release contains forward-looking statements including, without limitation, with respect to: Barrick’s forward-looking production guidance, including our ten-year production profile for gold and copper and expected production in the second half of 2023; estimates of future cost of sales per ounce for gold and per pound for copper, total cash costs per ounce and C1 cash costs per pound, and all-in-sustaining costs per ounce/pound; projected capital, operating and exploration expenditures; our ability to convert resources into reserves and replace reserves net of depletion from production; mine life and production rates; projects at Carlin expected to deliver increased throughput; Barrick’s global exploration strategy and planned exploration activities, including growth potential in North America, South America, Africa and the Middle East; Barrick’s copper strategy; our plans and expected completion and benefits of our growth projects, including the Pueblo Viejo process plant expansion and mine
life extension project and new Naranjo tailings storage facility and solar and battery energy storage projects at Nevada Gold Mines, Loulo-Gounkoto and Kibali; potential mineralization and metal or mineral recoveries; targeted first production for the Reko Diq project; the timeline for execution and effectiveness of definitive agreements to implement the Commencement Agreement between Papua New Guinea and Barrick Niugini Limited; the duration of the temporary suspension of operations at Porgera, the conditions for the reopening of the mine, the timeline to recommence operations and expected production; our pipeline of high confidence projects at or near existing operations; Barrick’s partnership with the Government of Tanzania under the framework agreement; Lumwana’s potential for future growth and ability to further extend the life of mine, including through the development of a Super Pit; Barrick’s strategy, plans, targets and goals in respect of environmental and social governance issues, including local community relations, economic contributions and education and employment initiatives, climate change and greenhouse gas emissions reduction targets and biodiversity initiatives; Barrick’s talent management strategy; Barrick’s performance dividend policy and share buyback program; and expectations regarding future price assumptions, financial performance and other outlook or guidance.
Forward-looking statements are necessarily based upon a number of estimates and assumptions including material
estimates and assumptions related to the factors set forth below that, while considered reasonable by the Company as at the date of this press release in light of management’s experience and perception of current conditions and expected developments, are inherently subject to significant business, economic and competitive uncertainties and contingencies. Known and unknown factors could cause actual results to differ materially from those projected in the forward-looking statements and undue reliance should not be placed on such statements and information. Such factors include, but are not limited to: fluctuations in the spot and forward price of gold, copper or certain other commodities (such as silver, diesel fuel, natural gas and electricity); risks associated with projects in the early stages of evaluation and for which additional engineering and other analysis is required; risks related to the possibility that future exploration results will not be consistent with the Company’s expectations, that quantities or grades of reserves will be diminished, and that resources may not be converted to reserves; risks associated with the fact that certain of the initiatives described in this press release are still in the early stages and may not materialize; changes in mineral production performance, exploitation and exploration successes; risks that exploration data may be incomplete and considerable additional work may be required to complete further evaluation, including but not limited to drilling, engineering and socioeconomic studies and investment; the speculative nature of mineral exploration and development; lack of certainty with respect to foreign legal systems, corruption and other factors that are inconsistent with the rule of law; changes in national and local government legislation, taxation, controls or regulations and/or changes in the administration of laws, policies and practices; the potential impact of proposed changes to Chilean law on the status of value added tax refunds received in Chile in connection with the development of the Pascua-Lama project; expropriation or nationalization of property and political or economic developments in Canada, the United States or other countries in which Barrick does or may carry on business in the future; risks relating to political instability in certain of the jurisdictions in which Barrick operates; timing of receipt of, or failure to comply with, necessary permits and approvals, including the issuance of a Record of Decision for the Goldrush Project and/or whether the Goldrush Project will be permitted to advance as currently designed under its Feasibility Study, approval of the final location of the additional tailings storage facility for Pueblo Viejo following submission of the Environmental and Social Impact Assessment in the Dominican Republic, and permitting activities required to optimize Long Canyon’s life of mine; non-renewal of key licenses by governmental authorities, including the new Special Mining Lease for Porgera; failure to comply with environmental and health and safety laws and regulations; increased costs and physical and transition risks related to climate change, including extreme weather events, resource shortages, emerging policies and increased regulations relating to greenhouse gas emission levels, energy efficiency and reporting of risks; contests over title to properties, particularly title to undeveloped properties, or over access to water, power and other required infrastructure; the liability associated with risks and hazards in the mining industry, and the ability to maintain insurance to cover such losses; damage to the Company’s reputation due to the actual or perceived occurrence of any number of events, including negative publicity with respect to the Company’s handling of environmental matters or dealings with community groups, whether true or not; risks related to operations near communities that may regard Barrick’s operations as being detrimental to them; litigation and legal and administrative proceedings; operating or technical difficulties in connection with mining or development activities, including geotechnical challenges, tailings dam and storage facilities failures, and disruptions in the maintenance or provision of required infrastructure and information technology systems; increased
costs, delays, suspensions and technical challenges associated with the construction of capital projects; risks associated with working with partners in jointly controlled assets; risks related to disruption of supply routes which may cause delays in construction and mining activities, including disruptions in the supply of key mining inputs due to the invasion of Ukraine by Russia; risk of loss due to acts of war, terrorism, sabotage and civil disturbances; risks associated with artisanal and illegal mining; risks associated with Barrick’s infrastructure, information technology systems and the implementation of Barrick’s technological initiatives; the impact of global liquidity and credit availability on the timing of cash flows and the values of assets and liabilities based on projected future cash flows; the impact of inflation, including global inflationary pressures driven by supply chain disruptions caused by the ongoing Covid-19 pandemic, global energy cost increases following the invasion of Ukraine by Russia and country-specific political and economic factors in Argentina; adverse changes in our credit ratings; fluctuations in the currency markets; changes in U.S. dollar interest rates; risks arising from holding derivative instruments (such as credit risk, market liquidity risk and mark-to-market risk); risks related to the demands placed on the Company’s management, the ability of management to implement its business strategy and enhanced political risk in certain jurisdictions; uncertainty whether some or all of Barrick’s targeted investments and projects will meet the Company’s capital allocation objectives and internal hurdle rate; whether benefits expected from recent transactions are realized; business opportunities that may be presented to, or pursued by, the Company; our ability to successfully integrate acquisitions or complete divestitures; risks related to competition in the mining industry; employee relations including loss of key employees; availability and increased costs associated with mining inputs and labor; risks associated with diseases, epidemics and pandemics, including the effects and potential effects of the global Covid-19 pandemic; risks related to the failure of internal controls; and risks related to the impairment of the Company’s goodwill and assets. Barrick also cautions that its 2023 guidance, as well as its ten-year production profile for gold and copper, may be impacted by the ongoing business and social disruption caused by the spread of Covid-19.
In addition, there are risks and hazards associated with the business of mineral exploration, development and mining, including environmental hazards, industrial accidents, unusual or unexpected formations, pressures, cave-ins, flooding and gold bullion, copper cathode or gold or copper concentrate losses (and the risk of inadequate insurance, or inability to obtain insurance, to cover these risks).
Many of these uncertainties and contingencies can affect our actual results and could cause actual results to differ materially from those expressed or implied in any forward-looking statements made by, or on behalf of, us. Readers are cautioned that forward-looking statements are not guarantees of future performance. All of the forward-looking statements made in this press release are qualified by these cautionary statements. Specific reference is made to the most recent Form 40-F/Annual Information Form on file with the SEC and Canadian provincial securities regulatory authorities for a more detailed discussion of some of the factors underlying forward-looking statements and the risks that may affect Barrick’s ability to achieve the expectations set forth in the forward-looking statements contained in this press release. We disclaim any intention or obligation to update or revise any forward-looking statements whether as a result of new information, future events or otherwise, except as required by applicable law.