Exhibit 99.2
 USG Corporation Third Quarter 2013 Earnings Conference Call and Webcast October 24, 2013 Third Quarter 2013 Earnings Call and Webcast
 Forward-Looking Statements This presentation contains forward-looking statements within the meaning of the Private Securities Litigation Reform Act of 1995 related to management’s expectations about future conditions. Actual business, market or other conditions may differ materially from management’s expectations and, accordingly, may affect our sales and profitability or other results and liquidity. Actual results may differ materially due to various other factors, including: economic conditions, such as the levels of new home and other construction activity, employment levels, the availability of mortgage, construction and other financing, mortgage and other interest rates, housing affordability and supply, the levels of foreclosures and home resales, currency exchange rates and consumer confidence; capital markets conditions and the availability of borrowings under our credit agreement or other financings; our substantial indebtedness and our ability to incur substantial additional indebtedness; competitive conditions, such as price, service and product competition; shortages in raw materials; changes in raw material and energy costs; volatility in the assumptions used to determine the funded status of our pension plans; the loss of one or more major customers and our customers’ ability to meet their financial obligations to us; capacity utilization rates for us and the industry; our ability to expand into new geographic markets and the stability of such markets; our ability to successfully enter into and operate the joint venture with Boral Limited, including risks that our joint venture partner, Boral Limited, may not fulfill its obligations as an investor or may take actions that are inconsistent with our objectives; our ability to protect our intellectual property and other proprietary rights; changes in laws or regulations, including environmental and safety regulations; the satisfactory performance of certain business functions by third party service providers; our ability to achieve anticipated savings from cost reduction programs; the outcome in contested litigation matters; the effects of acts of terrorism or war upon domestic and international economies and financial markets; and acts of God. We assume no obligation to update any forward-looking information contained in this presentation. Additional information concerning these and other factors may be found in our filings with the Securities and Exchange Commission, including the “Risk Factors” in our most recent Annual Report on Form 10-K. Third Quarter 2013 Earnings Call and Webcast
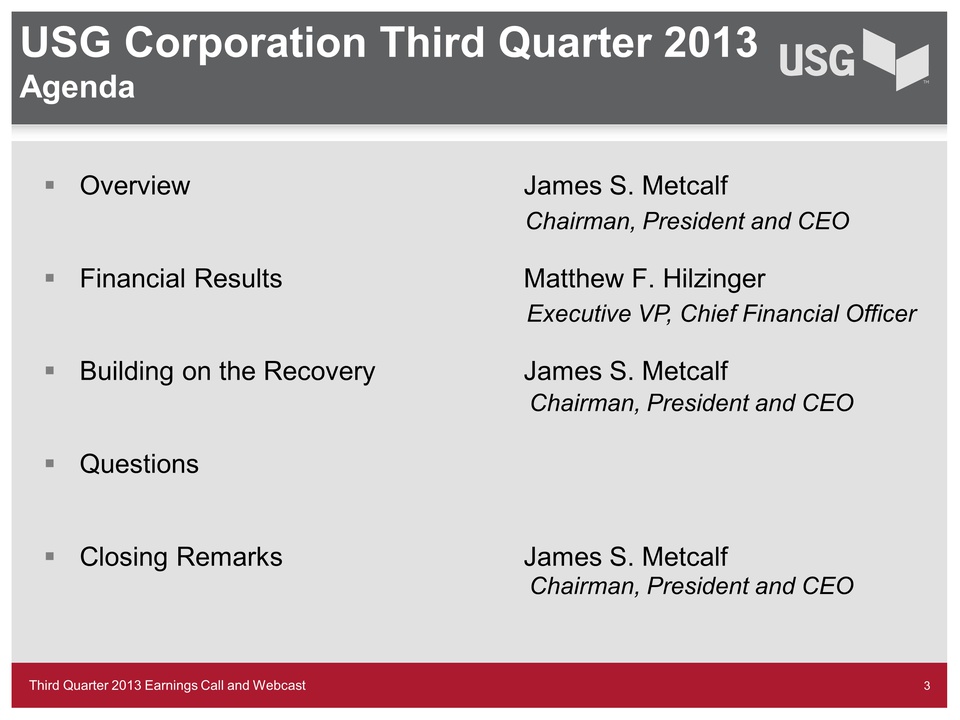 USG Corporation Third Quarter 2013 Agenda Overview James S. Metcalf Financial Results Matthew F. Hilzinger Building on the Recovery James S. Metcalf Questions Closing Remarks James S. Metcalf Chairman, President and CEO Executive VP, Chief Financial Officer Chairman, President and CEO Chairman, President and CEO
 James S. Metcalf Chairman, President and CEO
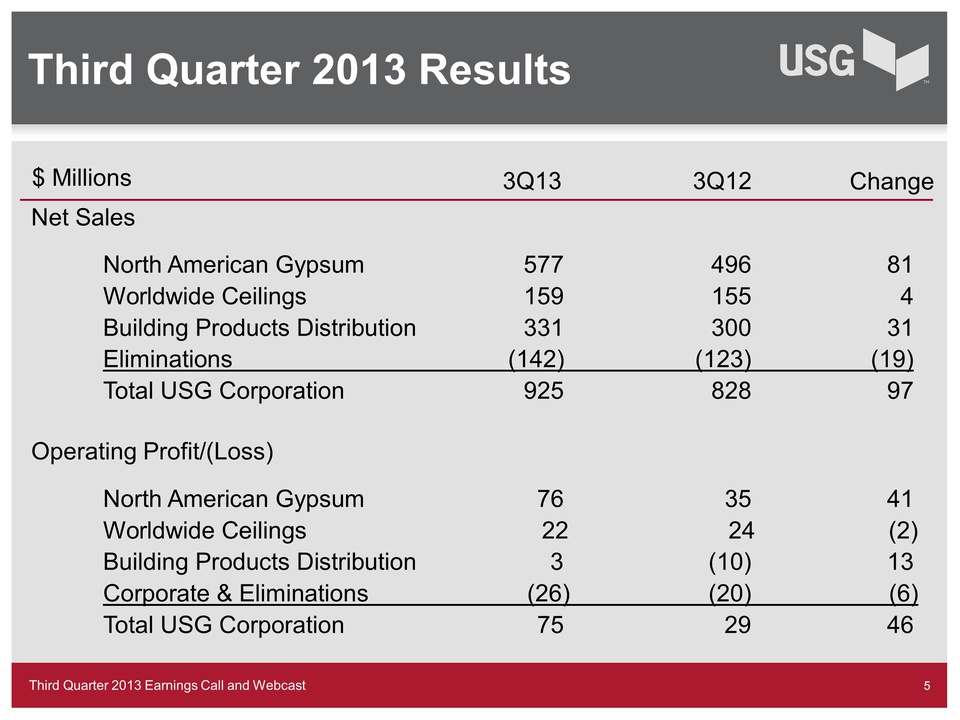 Third Quarter 2013 Earnings Call and Webcast 5 Third Quarter 2013 Results Net Sales North American Gypsum 577 496 81 Worldwide Ceilings 159 155 4 Building Products Distribution 331 300 31 Eliminations (142) (123) (19) Total USG Corporation 925 828 97 Operating Profit/(Loss) North American Gypsum 76 35 41 Worldwide Ceilings 22 24 (2) Building Products Distribution 3 (10) 13 Corporate & Eliminations (26) (20) (6) Total USG Corporation 75 29 46 $ Millions 3Q12 3Q13 Change
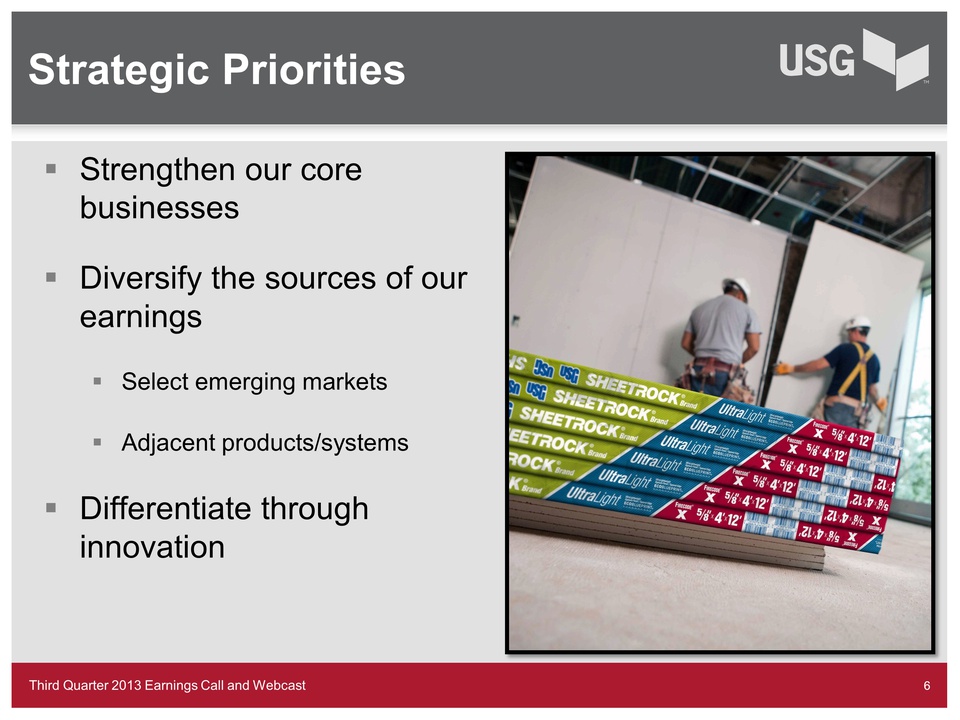 Strategic Priorities Strengthen our core businesses Diversify the sources of our earnings Select emerging markets Adjacent products/systems Differentiate through innovation Third Quarter 2013 Earnings Call and Webcast
 Matthew F. Hilzinger Executive VP, Chief Financial Officer
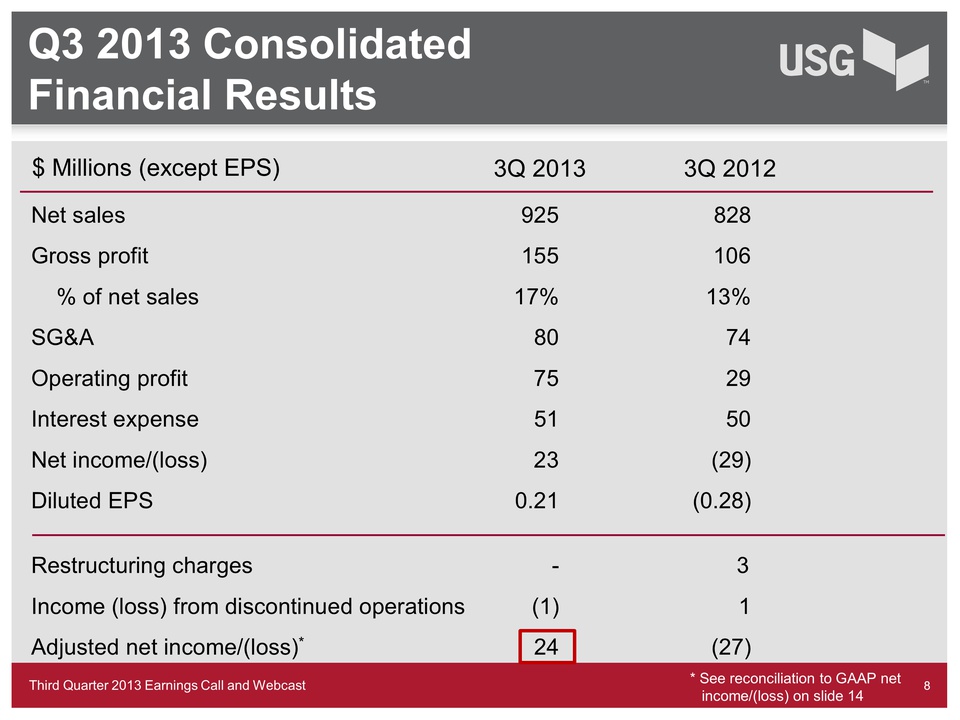 Q3 2013 Consolidated Financial Results Net sales 925 828 Gross profit 155 106 % of net sales 17% 13% SG&A 80 74 Operating profit 75 29 Interest expense 51 50 Net income/(loss) 23 (29) Diluted EPS 0.21 (0.28) Restructuring charges - 3 Income (loss) from discontinued operations (1) 1 Adjusted net income/(loss)* 24 (27) $ Millions (except EPS) 3Q 2012 3Q 2013 * See reconciliation to GAAP net income/(loss) on slide 14 Third Quarter 2013 Earnings Call and Webcast
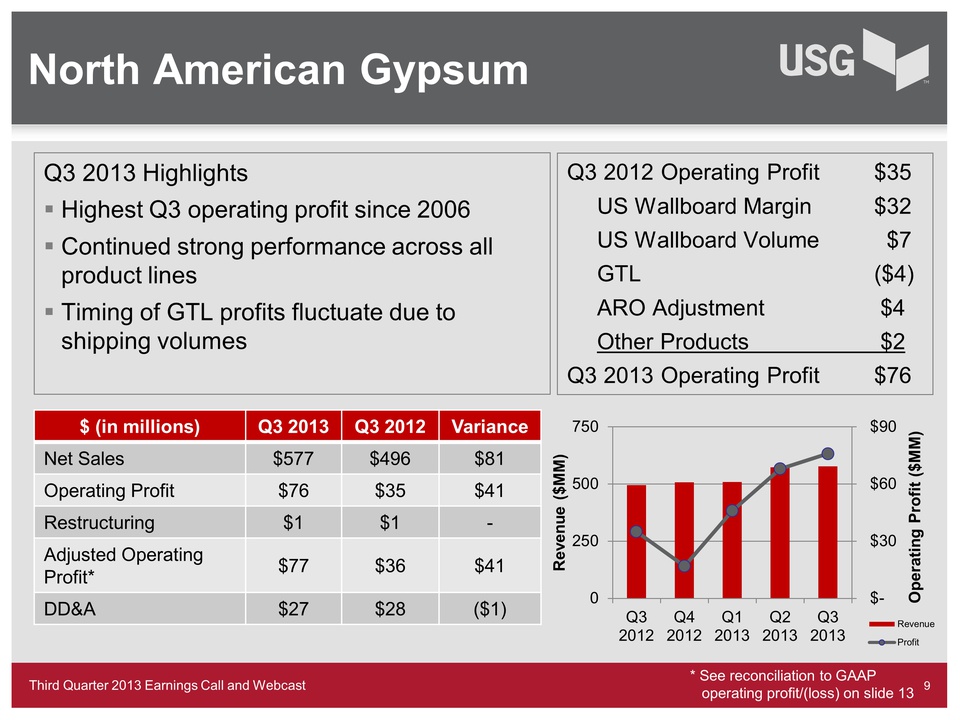 Third Quarter 2013 Earnings Call and Webcast North American Gypsum Q3 2013 Highlights Highest Q3 operating profit since 2006 Continued strong performance across all product lines Timing of GTL profits fluctuate due to shipping volumes 9 $ (in millions) Q3 2013 Q3 2012 Variance Net Sales $577 $496 $81 Operating Profit $76 $35 $41 Restructuring $1 $1 - Adjusted Operating Profit* $77 $36 $41 DD&A $27 $28 ($1) $- $30 $60 $900250500750Q32012Q42012Q12013Q22013Q32013Operating Profit ($MM) Revenue ($MM) RevenueProfitQ3 2012 Operating Profit $35 US Wallboard Margin $32 US Wallboard Volume $7 GTL ($4) ARO Adjustment $4 Other Products $2 Q3 2013 Operating Profit $76 * See reconciliation to GAAP operating profit/(loss) on slide 13
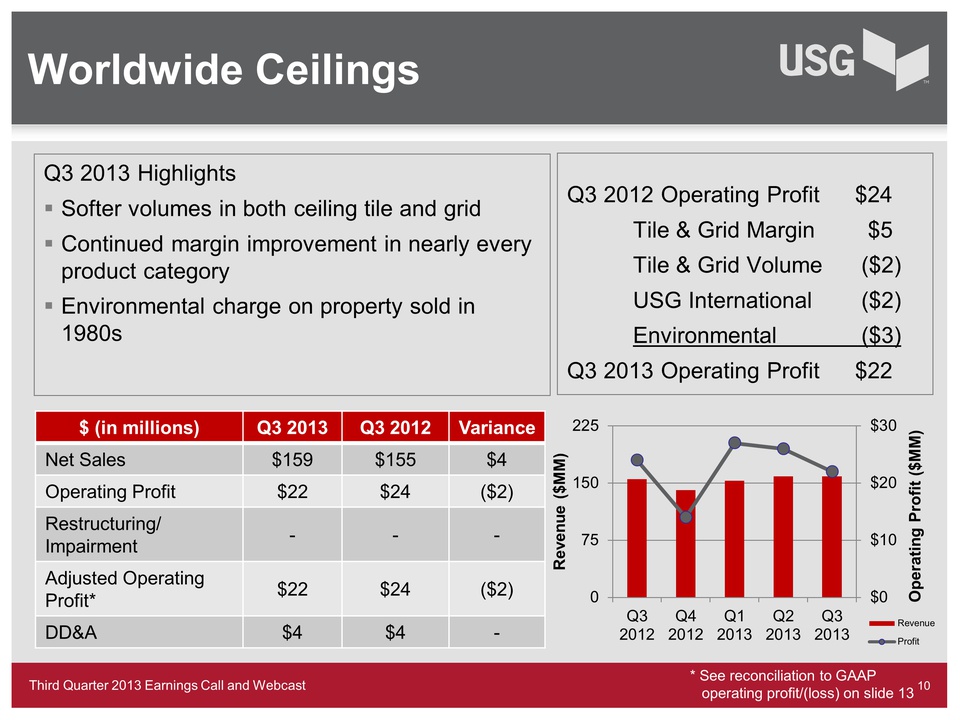 Third Quarter 2013 Earnings Call and Webcast Worldwide Ceilings $0$10$20$30075150225Q32012Q42012Q12013Q22013Q32013Operating Profit ($MM) Revenue ($MM) Revenue Profit $ (in millions) Q3 2013 Q3 2012 Variance Net Sales $159 $155 $4 Operating Profit $22 $24 ($2) Restructuring/ Impairment - - - Adjusted Operating Profit* $22 $24 ($2) DD&A $4 $4 - Q3 2013 Highlights Softer volumes in both ceiling tile and grid Continued margin improvement in nearly every product category Environmental charge on property sold in 1980s Q3 2012 Operating Profit $24 Tile & Grid Margin $5 Tile & Grid Volume ($2) USG International ($2) Environmental ($3) Q3 2013 Operating Profit $22 * See reconciliation to GAAP operating profit/(loss) on slide 13
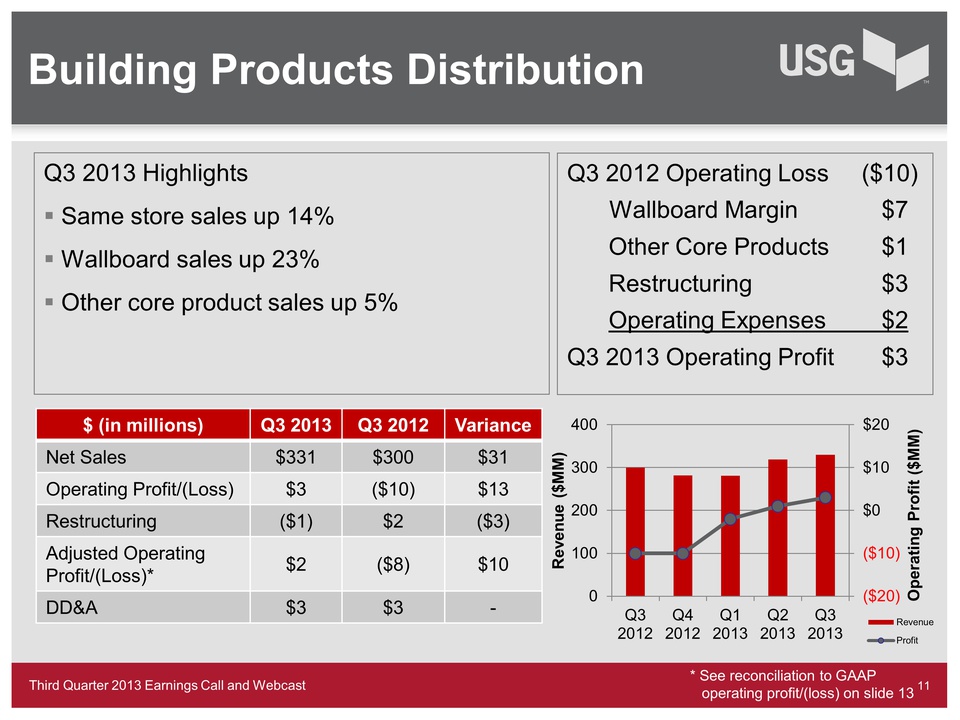 Third Quarter 2013 Earnings Call and Webcast Building Products Distribution ($20)($10)$0$10$200100200300400Q32012Q42012Q12013Q22013Q32013Operating Profit ($MM) Revenue ($MM) Revenue Profit $ (in millions) Q3 2013 Q3 2012 Variance Net Sales $331 $300 $31 Operating Profit/(Loss) $3 ($10) $13 Restructuring ($1) $2 ($3) Adjusted Operating Profit/(Loss)* $2 ($8) $10 DD&A $3 $3 - Q3 2013 Highlights Same store sales up 14% Wallboard sales up 23% Other core product sales up 5% Q3 2012 Operating Loss ($10) Wallboard Margin $7 Other Core Products $1 Restructuring $3 Operating Expenses $2 Q3 2013 Operating Profit $3 * See reconciliation to GAAP operating profit/(loss) on slide 13
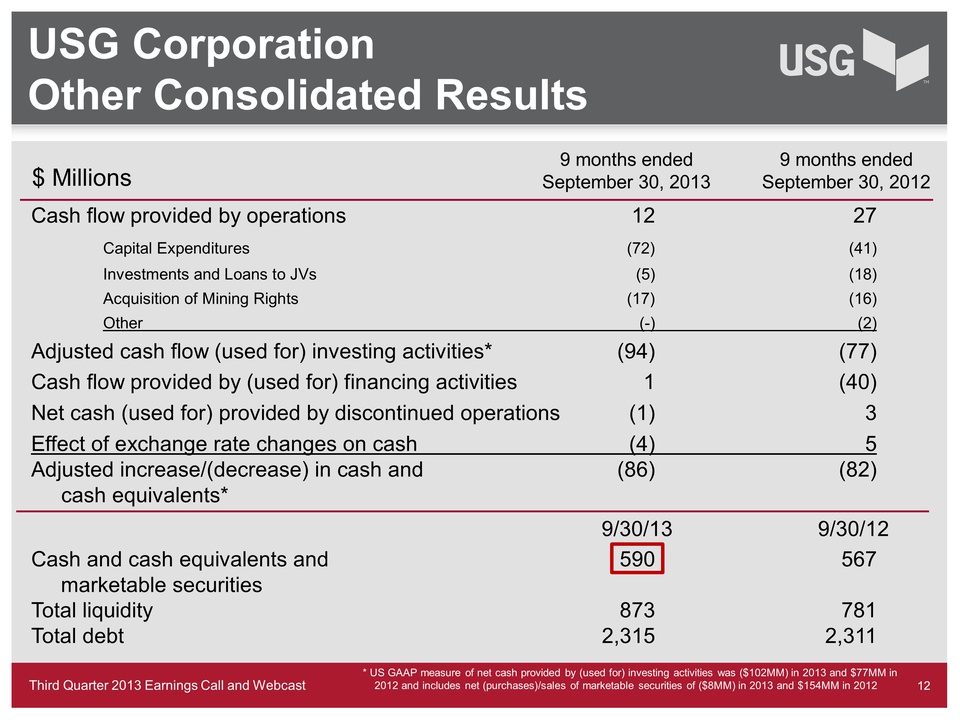 Third Quarter 2013 Earnings Call and Webcast Cash flow provided by operations 12 27 Capital Expenditures (72) (41) Investments and Loans to JVs (5) (18) Acquisition of Mining Rights (17) (16) Other (-) (2) Adjusted cash flow (used for) investing activities* (94) (77) Cash flow provided by (used for) financing activities 1 (40) Net cash (used for) provided by discontinued operations (1) 3 Effect of exchange rate changes on cash (4) 5 Adjusted increase/(decrease) in cash and (86) (82) cash equivalents* 9/30/13 9/30/12 Cash and cash equivalents and 590 567 marketable securities Total liquidity 873 781 Total debt 2,315 2,311 USG Corporation Other Consolidated Results $ Millions 9 months ended September 30, 2012 9 months ended September 30, 2013 * US GAAP measure of net cash provided by (used for) investing activities was ($102MM) in 2013 and $77MM in 2012 and includes net (purchases)/sales of marketable securities of ($8MM) in 2013 and $154MM in 2012
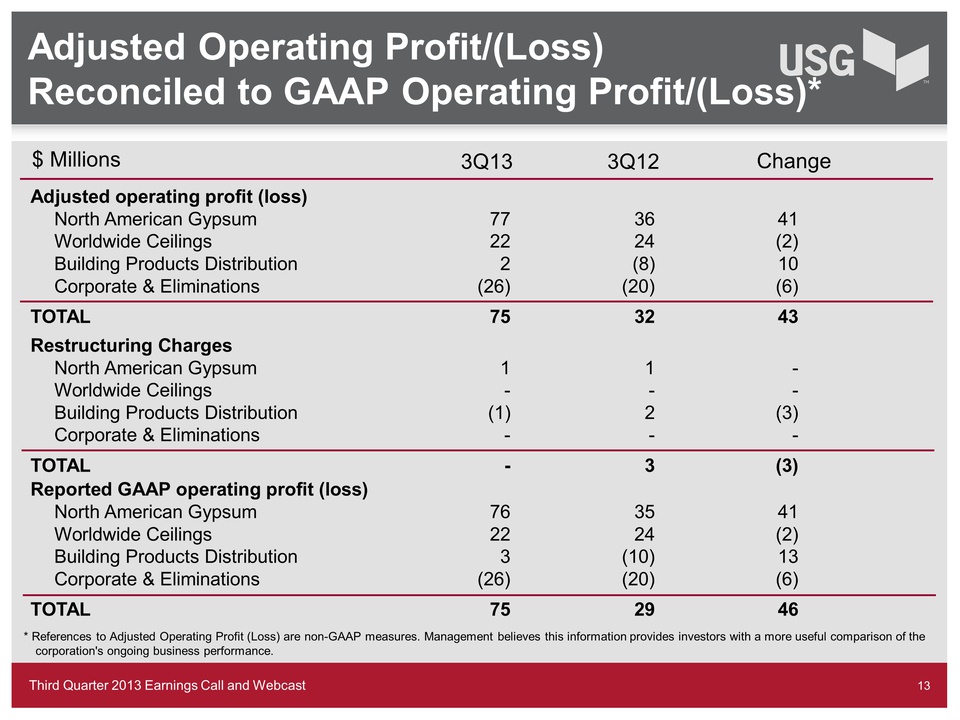 Third Quarter 2013 Earnings Call and Webcast Adjusted Operating Profit/(Loss) Reconciled to GAAP Operating Profit/(Loss)* 3Q12 3Q13 Adjusted operating profit (loss) North American Gypsum 77 36 41 Worldwide Ceilings 22 24 (2) Building Products Distribution 2 (8) 10 Corporate & Eliminations (26) (20) (6) TOTAL 75 32 43 Restructuring Charges North American Gypsum 1 1 - Worldwide Ceilings - - - Building Products Distribution (1) 2 (3) Corporate & Eliminations - - - TOTAL - 3 (3) Reported GAAP operating profit (loss) North American Gypsum 76 35 41 Worldwide Ceilings 22 24 (2) Building Products Distribution 3 (10) 13 Corporate & Eliminations (26) (20) (6) TOTAL 75 29 46 Change $ Millions * References to Adjusted Operating Profit (Loss) are non-GAAP measures. Management believes this information provides investors with a more useful comparison of the corporation's ongoing business performance.
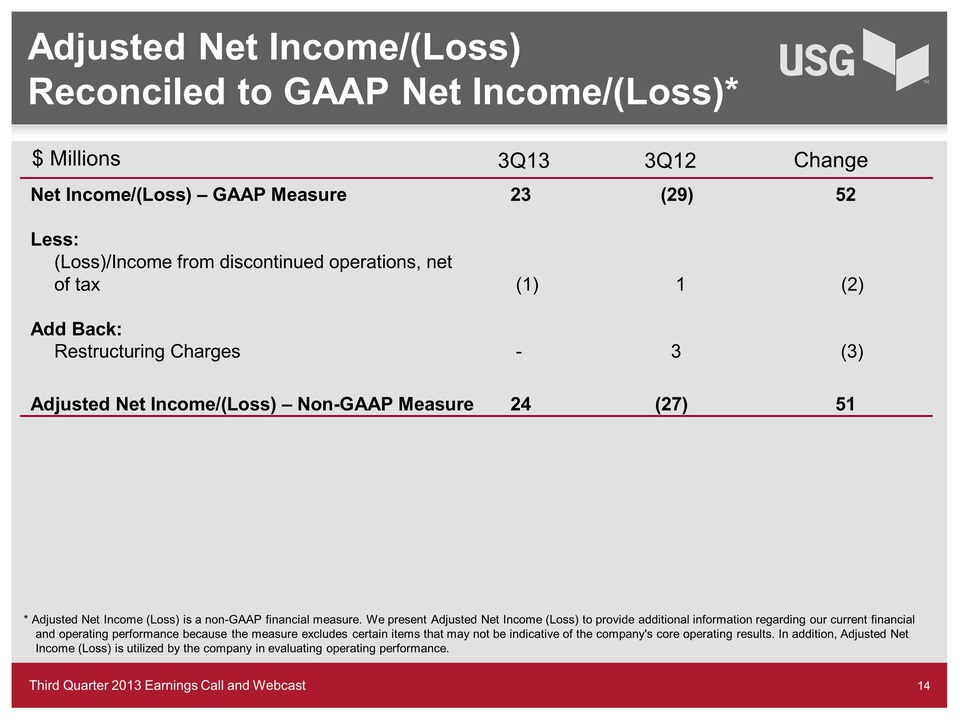 Third Quarter 2013 Earnings Call and Webcast Adjusted Net Income/(Loss) Reconciled to GAAP Net Income/(Loss)* 13Q12 3Q13 Net Income/(Loss) – GAAP Measure 23 (29) 52 Less: (Loss)/Income from discontinued operations, net of tax (1) 1 (2) Add Back: Restructuring Charges - 3 (3) Adjusted Net Income/(Loss) – Non-GAAP Measure 24 (27) 51 Change $ Millions * Adjusted Net Income (Loss) is a non-GAAP financial measure. We present Adjusted Net Income (Loss) to provide additional information regarding our current financial and operating performance because the measure excludes certain items that may not be indicative of the company's core operating results. In addition, Adjusted Net Income (Loss) is utilized by the company in evaluating operating performance.
 James S. Metcalf Chairman, President and CEO
 Third Quarter 2013 Earnings Call and Webcast Building on the Recovery Residential faces short-term headwinds from rising interest rates and the US government shutdown, but long-term macro trends point towards a real recovery. Expected growth in 2013 repair and remodel is in the mid to upper single-digit range. USG well positioned to capitalize due to relationships with large, national retailers. Commercial remains choppy, but green shoots exist and future indicators are positive.
 Questions?
 James S. Metcalf Chairman, President and CEO