Exhibit 99.2
USG Corporation Fourth Quarter 2013 Earnings Conference Call and Webcast February 6, 2014
This presentation contains forward-looking statements within the meaning of the Private Securities Litigation Reform Act of 1995 related to management’s expectations about future conditions. Actual business, market or other conditions may differ materially from management’s expectations and, accordingly, may affect our sales and profitability or other results and liquidity. Actual results may differ materially due to various other factors, including: economic conditions, such as the levels of new home and other construction activity, employment levels, the availability of mortgage, construction and other financing, mortgage and other interest rates, housing affordability and supply, the levels of foreclosures and home resales, currency exchange rates and consumer confidence; capital markets conditions and the availability of borrowings under our credit agreement or other financings; our substantial indebtedness and our ability to incur substantial additional indebtedness; competitive conditions, such as price, service and product competition; shortages in raw materials; changes in raw material and energy costs; volatility in the assumptions used to determine the funded status of our pension plans; the loss of one or more major customers and our customers’ ability to meet their financial obligations to us; capacity utilization rates for us and the industry; our ability to expand into new geographic markets and the stability of such markets; our ability to successfully enter into and operate the joint venture with Boral Limited, including risks that our joint venture partner, Boral Limited, may not fulfill its obligations as an investor or may take actions that are inconsistent with our objectives; our ability to protect our intellectual property and other proprietary rights; changes in laws or regulations, including environmental and safety regulations; the satisfactory performance of certain business functions by third party service providers; our ability to achieve anticipated savings from cost reduction programs; the outcome in contested litigation matters; the effects of acts of terrorism or war upon domestic and international economies and financial markets; and acts of God. We assume no obligation to update any forward-looking information contained in this presentation. Additional information concerning these and other factors may be found in our filings with the Securities and Exchange Commission, including the “Risk Factors” in our most recent Annual Report on Form 10-K and Quarterly Report on Form 10-Q.
Fourth Quarter 2013 Earnings Call and Webcast 3 USG Corporation Fourth Quarter 2013 Agenda Overview James S. Metcalf Financial Results Matthew F. Hilzinger Building on the Recovery James S. Metcalf Questions Closing Remarks James S. Metcalf Chairman, President and CEO Executive VP, Chief Financial Officer Chairman, President and CEO Chairman, President and CEO James S. Metcalf Chairman, President and CEO
James S. Metcalf Chairman, President and CEO
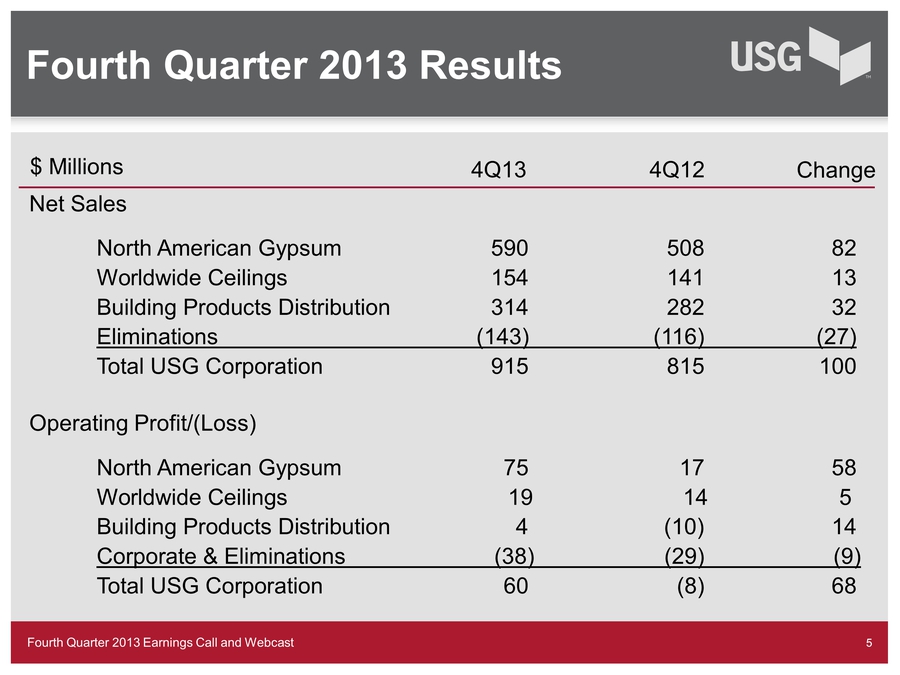
Fourth Quarter 2013 Earnings Call and Webcast 5 Fourth Quarter 2013 Results Net Sales North American Gypsum 590 508 82 Worldwide Ceilings 154 141 13 Building Products Distribution 314 282 32 Eliminations (143) (116) (27) Total USG Corporation 915 815 100 Operating Profit/(Loss) North American Gypsum 75 17 58 Worldwide Ceilings 19 14 5 Building Products Distribution 4 (10) 14 Corporate & Eliminations (38) (29) (9) Total USG Corporation 60 (8) 68 $ Millions 4Q13 4Q12
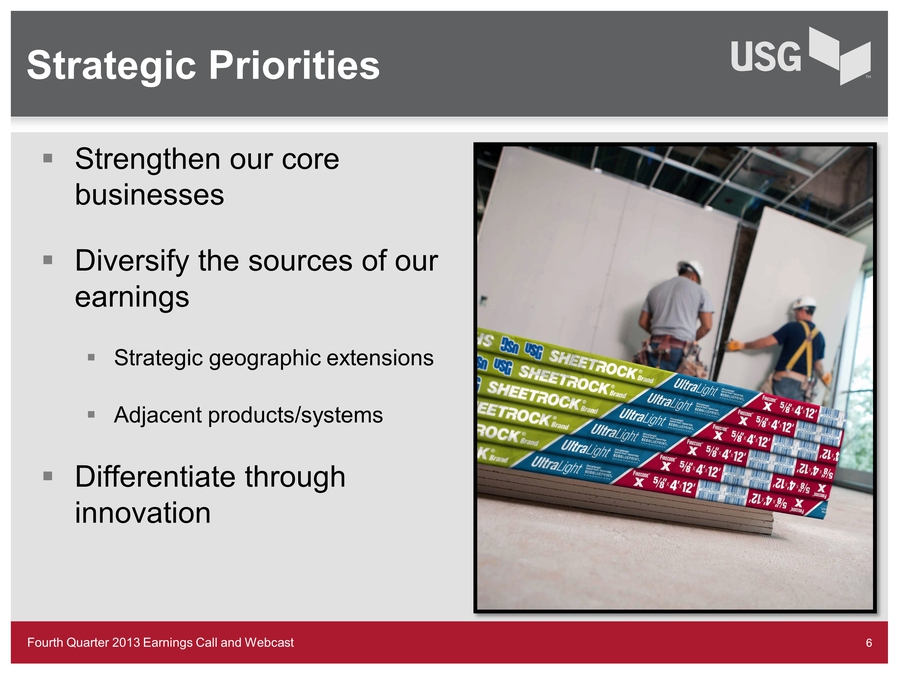
Strategic Fourth Quarter 2013 Earnings Call and Webcast 6 Strategic Priorities Strengthen our core businesses Diversify the sources of our earnings Strategic geographic extensions Adjacent products/systems Differentiate through Innovation
Matthew F. Hilzinger Executive VP, Chief Financial Officer
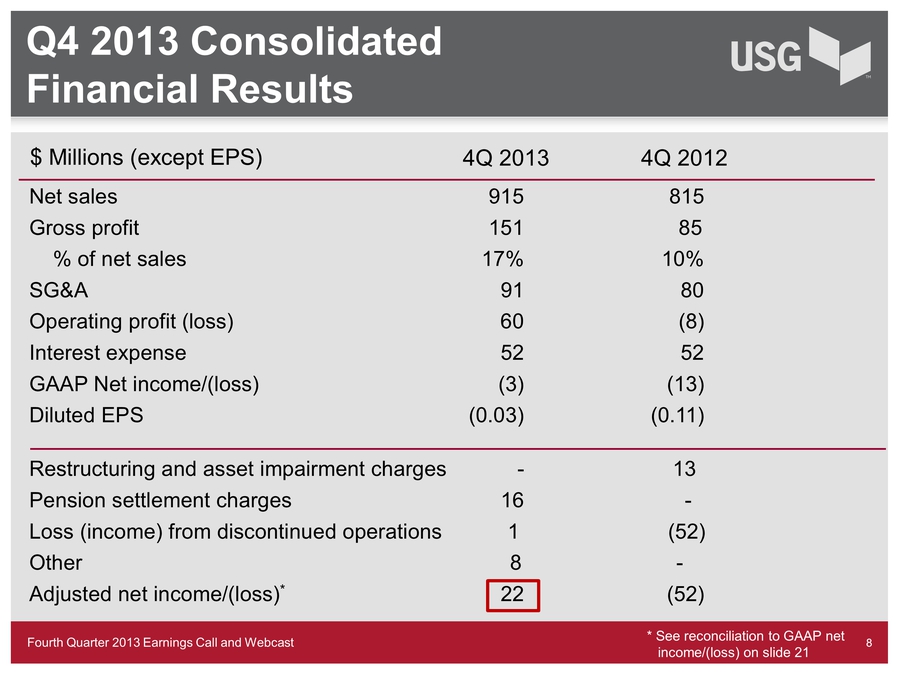
Fourth Quarter 2013 Earnings Call and Webcast 8 Q4 2013 Consolidated Financial Results Net sales 915 815 Gross profit 151 85 % of net sales 17% 10% SG&A 91 80 Operating profit (loss) 60 (8) Interest expense 52 52 GAAP Net income/(loss) (3) (13) Diluted EPS (0.03) (0.11) Restructuring and asset impairment charges – 13 Pension settlement charges 16 - Loss (income) from discontinued operations 1 (52)Other 8 - Adjusted net income/(loss)* 22 (52)$ Millions (except EPS) 4Q 2013 4Q 2012
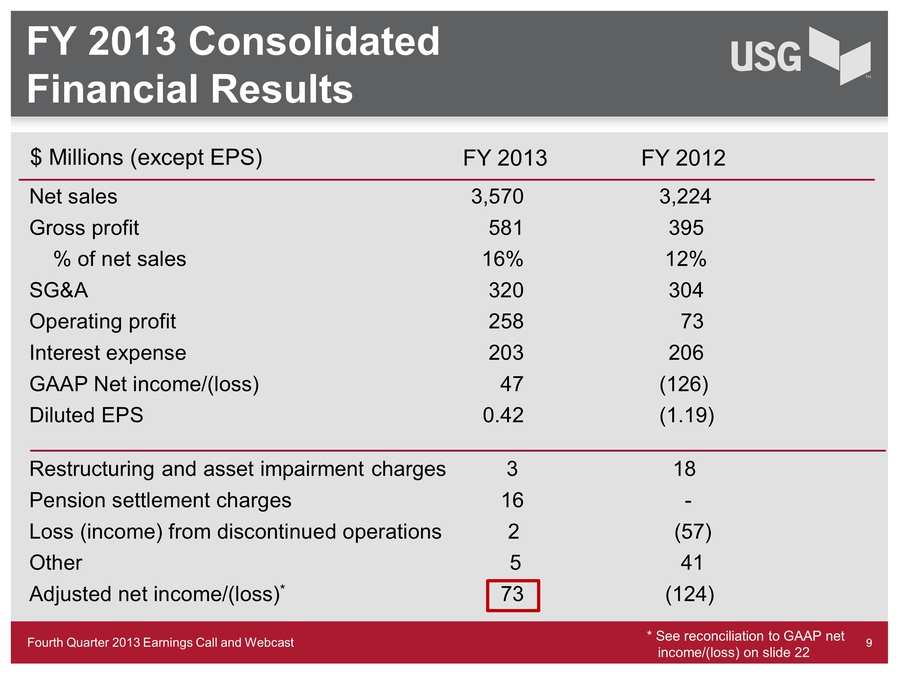
Fourth Quarter 2013 Earnings Call and Webcast 9 FY 2013 Consolidated Financial Results Net sales 3,570 3,224 Gross profit 581 395 % of net sales 16% 12% SG&A 320 304 Operating profit 258 73 Interest expense 203 206 GAAP Net income/(loss) 47 (126) Diluted EPS 0.42 (1.19) Restructuring and asset impairment charges 3 18 Pension settlement charges 16 - Loss (income) from discontinued operations 2 (57) Other 5 41 Adjusted net income/(loss)* 73 (124) $ Millions (except EPS) FY 2013 FY 2012
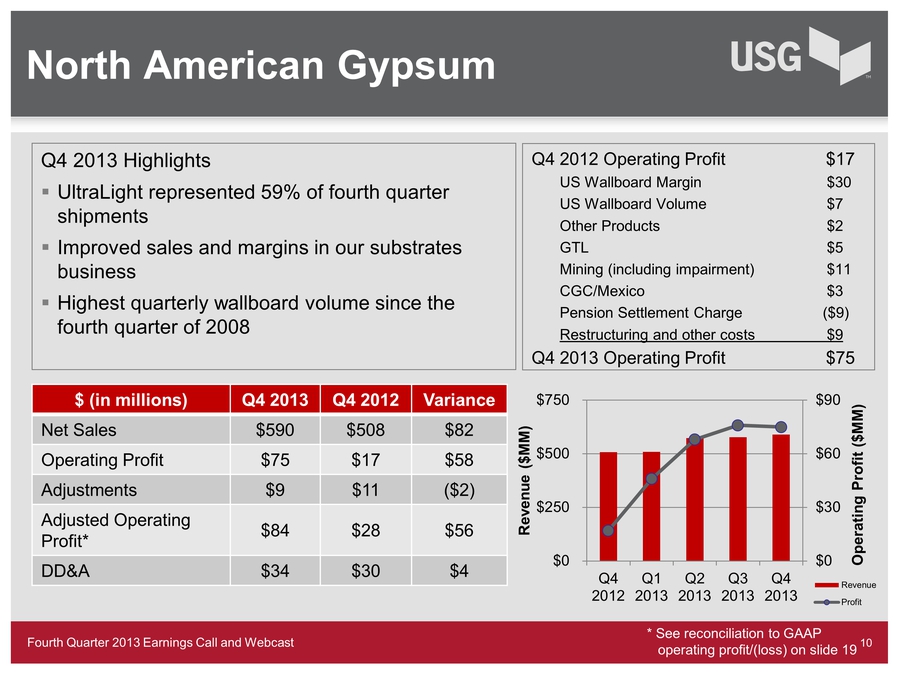
Fourth Quarter 2013 Earnings Call and Webcast 19 North American Gypsum Q4 2013 Highlights UltraLight represented 59% of fourth quarter shipments Improved sales and margins in our substrates business Highest quarterly wallboard volume since the fourth quarter of 2008 10 $ (in millions) Q4 2013 Q4 2012 Variance Net Sales $590 $508 $82 Operating Profit $75 $17 $58 Adjustments $9 $11 ($2) Adjusted Operating Profit* $84 $28 $56 DD&A $34 $30 $4 $0 $30 $60 $90 $0 $250 $500 $750 Q4 2012 Q1 2013 Q2 2013 Q3 2013 Q4 2013 Operating Profit ($MM) Revenue ($MM) Revenue Profit Q4 2012 Operating Profit $17 US Wallboard Margin $30 US Wallboard Volume $7 Other Products $2 GTL $5 Mining (including impairment) $11 CGC/Mexico $3 Pension Settlement Charge ($9) Restructuring and other costs $9 Q4 2013 Operating Profit $75
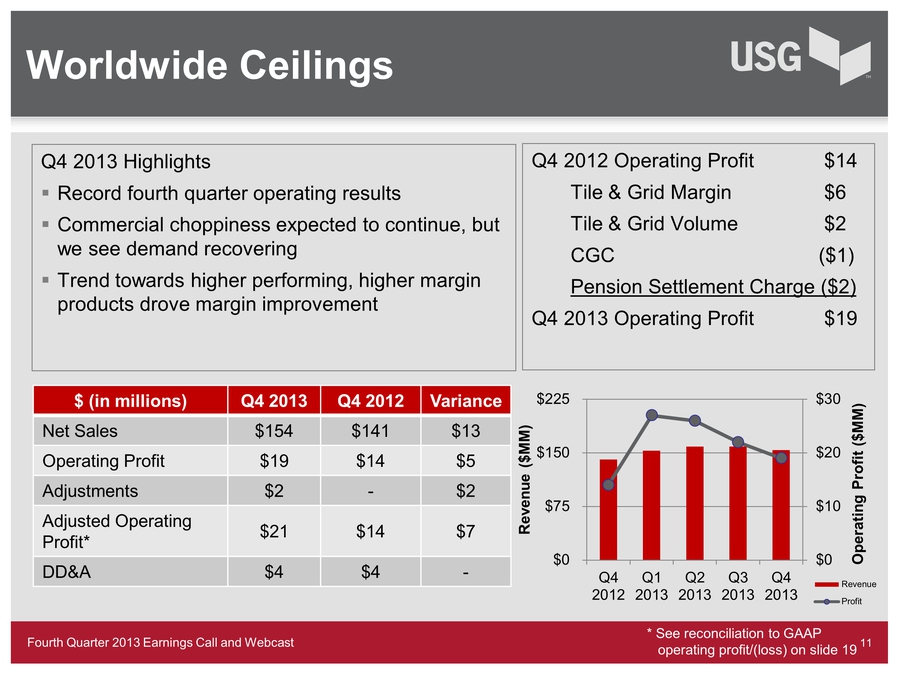
Fourth Quarter 2013 Earnings Call and Webcast Worldwide Ceilings 11 11 $0 $10 $20 $30 $0 $75 $150 $225 Q4 2012 Q1 2013 Q2 2013 Q3 2013 Q4 2013 Operating Profit ($MM) Revenue ($MM) Revenue Profit $ (in millions) Q4 2013 Q4 2012 Variance Net Sales $154 $141 $13 Operating Profit $19 $14 $5 Adjustments $2 - $2 Adjusted Operating Profit* $21 $14 $7 DD&A $4 $4 - Q4 2013 Highlights Record fourth quarter operating results Commercial choppiness expected to continue, but we see demand recovering Trend towards higher performing, higher margin products drove margin improvement Q4 2012 Operating Profit $14 Tile & Grid Margin $6 Tile & Grid Volume $2 CGC ($1) Pension Settlement Charge ($2) Q4 2013 Operating Profit $19
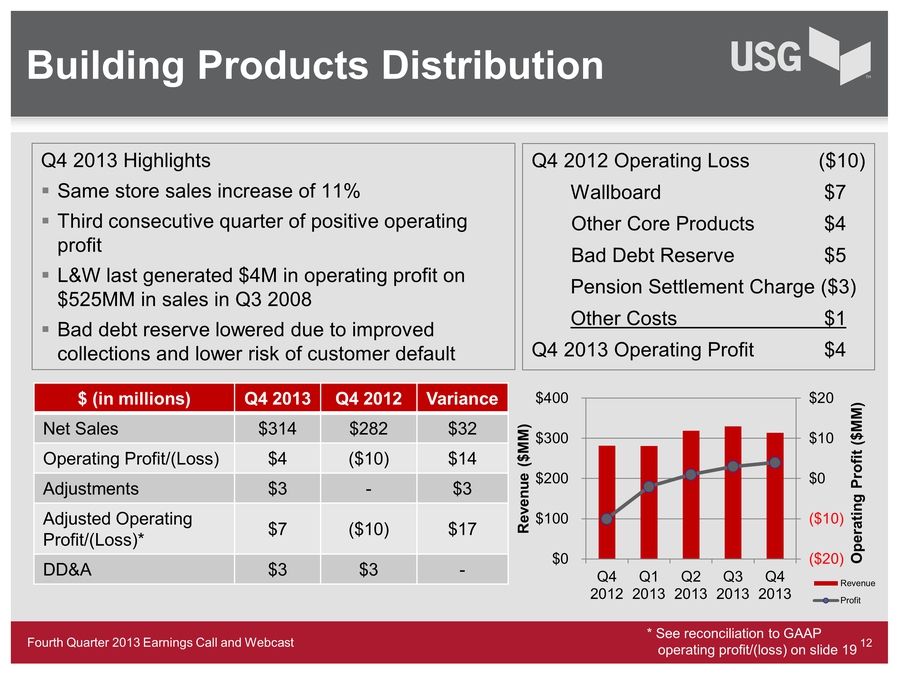
Fourth Quarter 2013 Earnings Call and Webcast Building Products Distribution 12 ($20) ($10) $0 $10 $20 $0 $100 $200 $300 $400 Q4 2012 Q1 2013 Q2 2013 Q3 2013 Q4 2013 Operating Profit ($MM) Revenue ($MM) Revenue Profit $ (in millions) Q4 2013 Q4 2012 Variance Net Sales $314 $282 $32 Operating Profit/(Loss) $4 ($10) $14 Adjustments $3 - $3 Adjusted Operating Profit/(Loss)* $7 ($10) $17 DD&A $3 $3 -Q4 2013 Highlights Same store sales increase of 11% Third consecutive quarter of positive operating profit L&W last generated $4M in operating profit on $525MM in sales in Q3 2008 Bad debt reserve lowered due to improved collections and lower risk of customer defaultQ4 2012 Operating Loss ($10) Wallboard $7 Other Core Products $4 Bad Debt Reserve $5 Pension Settlement Charge ($3) Other Costs $1 Q4 2013 Operating Profit $4* See reconciliation to GAAP operating profit/(loss) on slide 19
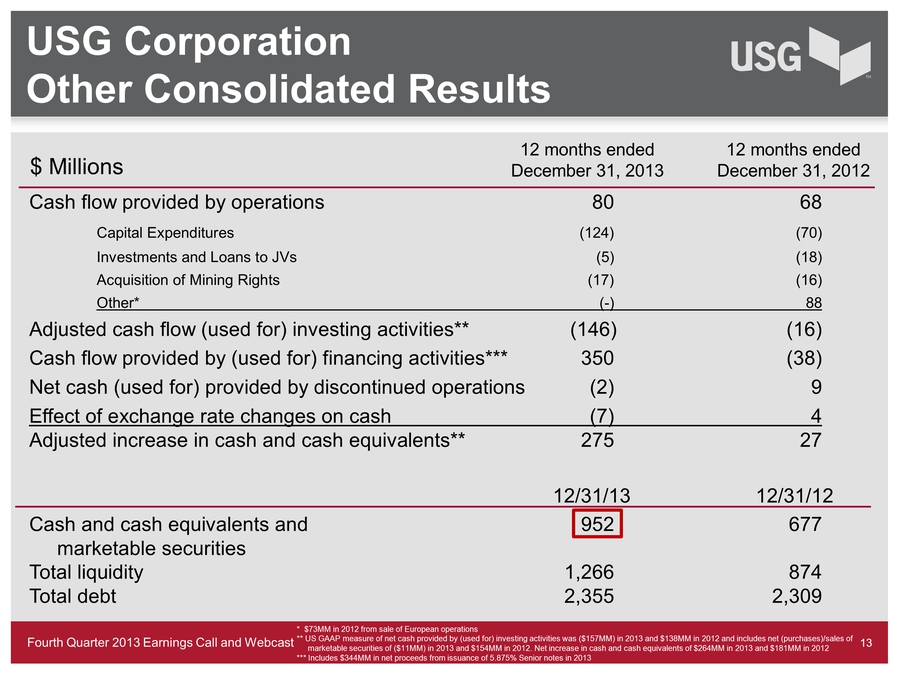
Fourth Quarter 2013 Earnings Call and Webcast 13 Cash flow provided by operations 80 68 Capital Expenditures (124) (70) Investments and Loans to JVs (5) (18) Acquisition of Mining Rights (17) (16) Other* (-) 88 Adjusted cash flow (used for) investing activities** (146) (16) Cash flow provided by (used for) financing activities*** 350 (38) Net cash (used for) provided by discontinued operations (2) 9 Effect of exchange rate changes on cash (7) 4 Adjusted increase in cash and cash equivalents** 275 27 12/31/13 12/31/12 Cash and cash equivalents and 952 677 marketable securities Total liquidity 1,266 874 Total debt 2,355 2,309 USG Corporation Other Consolidated Results $ Millions 12 months ended December 31, 2012 12 months ended December 31, 2013 * $73MM in 2012 from sale of European operations** US GAAP measure of net cash provided by (used for) investing activities was ($157MM) in 2013 and $138MM in 2012 and includes net (purchases)/sales of marketable securities of ($11MM) in 2013 and $154MM in 2012. Net increase in cash and cash equivalents of $264MM in 2013 and $181MM in 2012 *** Includes $344MM in net proceeds from issuance of 5.875% Senior notes in 2013

James S. Metcalf Chairman, President and CEO
Fourth Quarter 2013 Earnings Call and Webcast 2014 Economic Outlook The residential recovery is underway and will continue to improve in 2014. Commercial remains choppy, but green shoots exist and future indicators are mostly positive. Repair and remodel is expected to be a major driver of our business. We have the right customer partners and the macro-factors indicate a sustainable demand environment. 15
Questions?

James S. Metcalf Chairman, President and CEO
Fourth Quarter 2013 Earnings Call and Webcast Appendix: Non-GAAP Financial Measures 18 In this presentation, the corporation presents the non-GAAP financial measures adjusted operating profit (loss) and adjusted net income (loss), which exclude certain charges. These results are included as a complement to results provided in accordance with GAAP because management believes these non-GAAP financial measures help investors’ ability to analyze underlying trends in the corporation’s business, evaluate its performance relative to other companies in its industry and provide useful information to both management and investors by excluding certain items that may not be indicative of the corporation’s core operating results. In addition, the corporation uses adjusted operating profit and adjusted net income as a component of the measurement of incentive compensation.
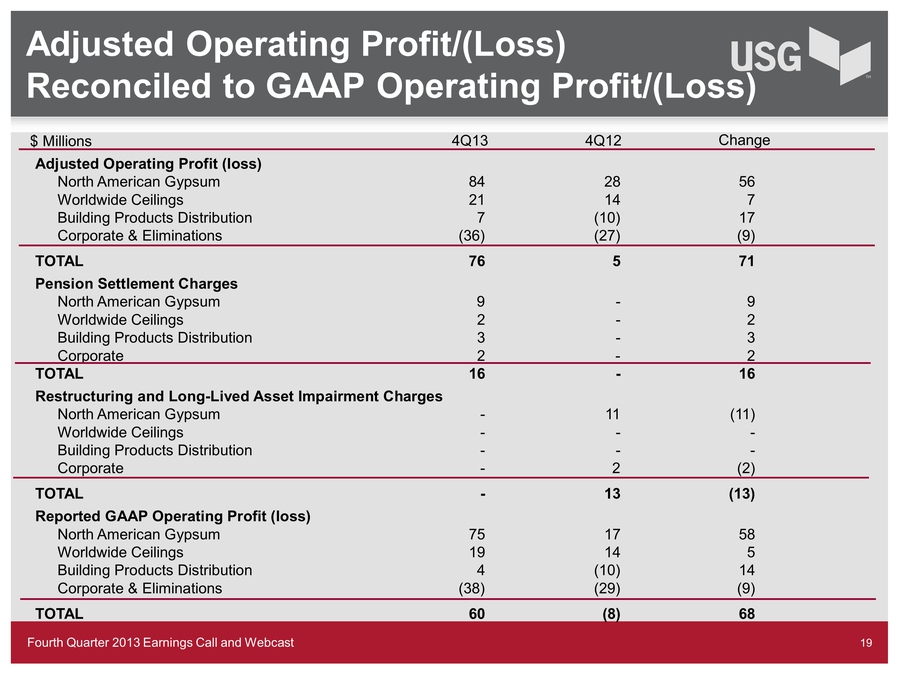
Fourth Quarter 2013 Earnings Call and Webcast Adjusted Operating Profit/(Loss) Reconciled to GAAP Operating Profit/(Loss) 19 4Q13 4Q12 Adjusted Operating Profit (loss) North American Gypsum 84 28 56 Worldwide Ceilings 21 14 7 Building Products Distribution 7 (10) 17 Corporate & Eliminations (36) (27) (9) TOTAL 76 5 71 Pension Settlement Charges North American Gypsum 9 – 9 Worldwide Ceilings 2 – 2 Building Products Distribution 3 – 3 Corporate 2 – 2 TOTAL 16 – 16 Restructuring and Long-Lived Asset Impairment Charges North American Gypsum - 11 (11) Worldwide Ceilings - - - Building Products Distribution - - - Corporate - 2 (2) TOTAL - 13 (13) Reported GAAP Operating Profit (loss) North American Gypsum 75 17 58 Worldwide Ceilings 19 14 5 Building Products Distribution 4 (10) 14 Corporate & Eliminations (38) (29) (9) TOTAL 60 (8) 68 $ Millions Change

Fourth Quarter 2013 Earnings Call and Webcast Adjusted Operating Profit/(Loss) Reconciled to GAAP Operating Profit/(Loss) 20 FY 2013 FY 2012 Adjusted Operating Profit (loss) North American Gypsum 276 130 146 Worldwide Ceilings 96 84 12 Building Products Distribution 8 (33) 41 Corporate & Eliminations (103) (90) (13) TOTAL 277 91 186 Pension Settlement Charges North American Gypsum 9 – 9 Worldwide Ceilings 2 – 2 Building Products Distribution 3 – 3 Corporate 2 – 2 TOTAL 16 – 16 Restructuring and Long-Lived Asset Impairment Charges North American Gypsum 3 15 (12) Worldwide Ceilings - 1 (1) Building Products Distribution (1) - (1) Corporate 1 2 (1) TOTAL 3 18 (15) Reported GAAP Operating Profit (loss) North American Gypsum 264 115 149 Worldwide Ceilings 94 83 11 Building Products Distribution 6 (33) 39 Corporate & Eliminations (106) (92) (14) TOTAL 258 73 185 $ Millions Change
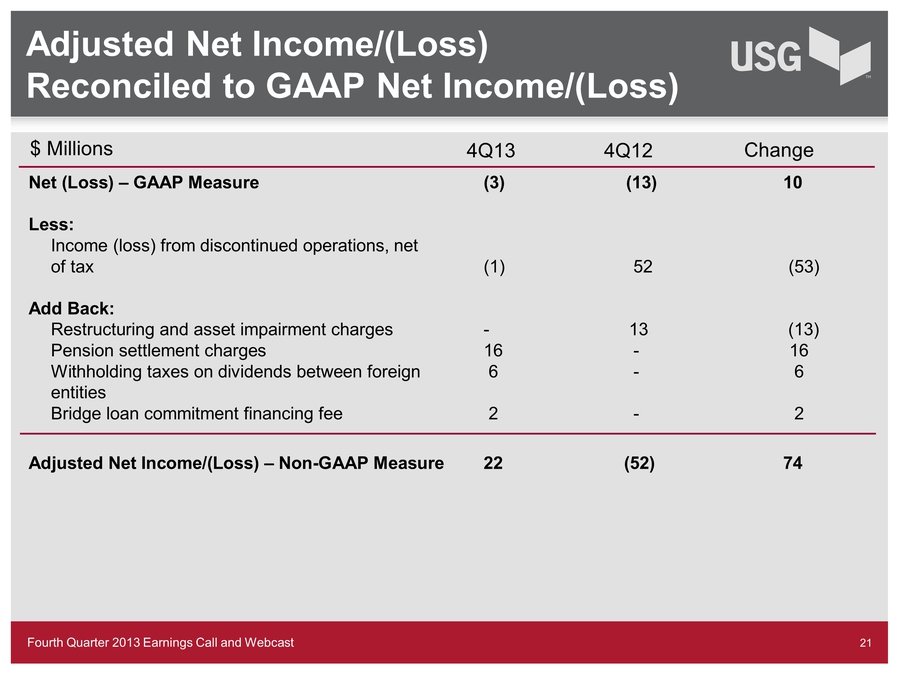
Fourth Quarter 2013 Earnings Call and Webcast Adjusted Net Income/(Loss) Reconciled to GAAP Net Income/(Loss) 21 4Q13 4Q12 Net (Loss) – GAAP Measure (3) (13) 10 Less: Income (loss) from discontinued operations, net of tax (1) 52 (53) Add Back: Restructuring and asset impairment charges - 13 (13) Pension settlement charges 16 – 16 Withholding taxes on dividends between foreign 6 – 6 entities Bridge loan commitment financing fee 2 – 2 Adjusted Net Income/(Loss) – Non-GAAP Measure 22 (52) 74 $ Millions Change
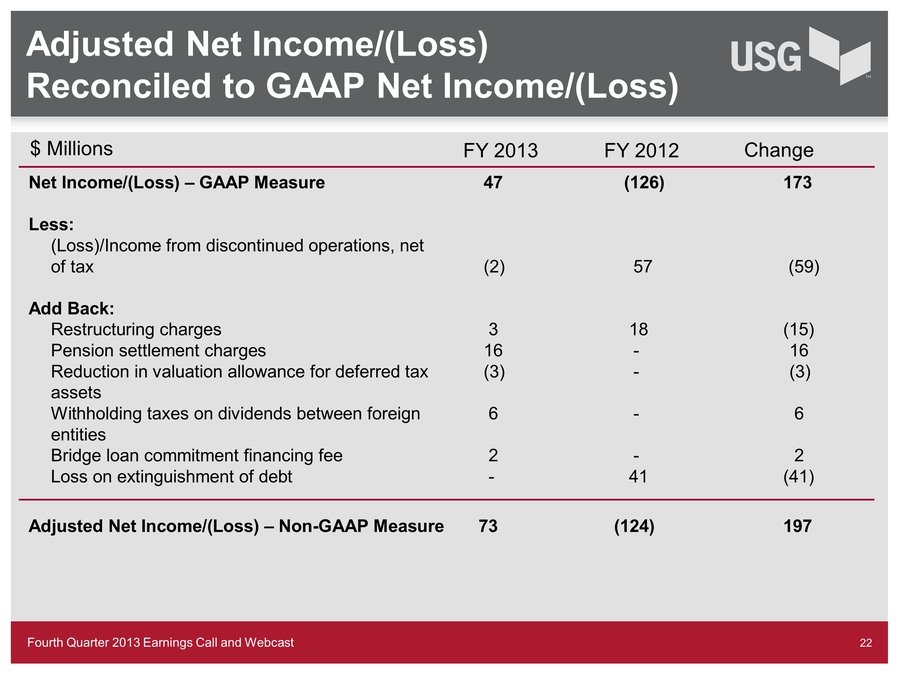
Fourth Quarter 2013 Earnings Call and Webcast Adjusted Net Income/(Loss) Reconciled to GAAP Net Income/(Loss) 22 FY 2013 FY 2012 Net Income/(Loss) – GAAP Measure 47 (126) 173 Less: (Loss)/Income from discontinued operations, net of tax (2) 57 (59) Add Back: Restructuring charges 3 18 (15) Pension settlement charges 16 – 16 Reduction in valuation allowance for deferred tax (3) - (3) assets Withholding taxes on dividends between foreign 6 – 6 entities Bridge loan commitment financing fee 2 – 2 Loss on extinguishment of debt - 41 (41) Adjusted Net Income/(Loss) – Non-GAAP Measure 73 (124) 197 $ Millions Change