Exhibit 99.2 |
February 5, 2016 USG Corporation Fourth Quarter and Full Year 2015 Earnings Conference Call and Webcast
This presentation contains forward-looking statements within the meaning of the Private Securities Litigation Reform Act of 1995 related to management’s expectations about future conditions, including but not limited to, management’s outlook for 2016. Actual business, market or other conditions may differ materially from management’s expectations and, accordingly, may affect our sales and profitability or other results and liquidity. Any forward-looking statements represent our views only as of today and should not be relied upon as representing our views as of any subsequent date. Actual results may differ materially due to various other factors, including: economic conditions, such as the levels of new home and other construction activity, employment levels, the availability of mortgage, construction and other financing, mortgage and other interest rates, housing affordability and supply, the levels of foreclosures and home resales, currency exchange rates and consumer confidence; our ability to maintain or achieve price increases; our substantial indebtedness and our ability to incur substantial additional indebtedness; capital markets conditions and the availability of borrowings under our credit agreement or other financings; competitive conditions, such as price, service and product competition; certain of our customers having significant buying power; the loss of one or more major customers and our customers’ ability to meet their financial obligations to us; shortages in raw materials or changes in raw material and energy costs; our ability to successfully operate the joint venture with Boral Limited, including risks that our joint venture partner, Boral Limited, may not fulfill its obligations as an investor or may take actions that are inconsistent with our objectives; volatility in the assumptions used to determine the funded status of our pension plans; our ability to protect our intellectual property and other proprietary rights; a security breach of company information; changes in laws or regulations, including environmental and safety regulations; the outcome in legal and governmental proceedings; the occurrence of an “ownership change” within the meaning of the Internal Revenue Code; the effects of acts of terrorism or war upon domestic and international economies and financial markets; and acts of God. We assume no obligation to update any forward-looking information contained in this presentation. Additional information concerning these and other factors may be found in our filings with the Securities and Exchange Commission, including the “Risk Factors” in our most recent Annual Report on Form 10-K and Quarterly Report on Form 10-Q for the quarter ended June 30, 2015. CAUTIONARY STATEMENTS 2
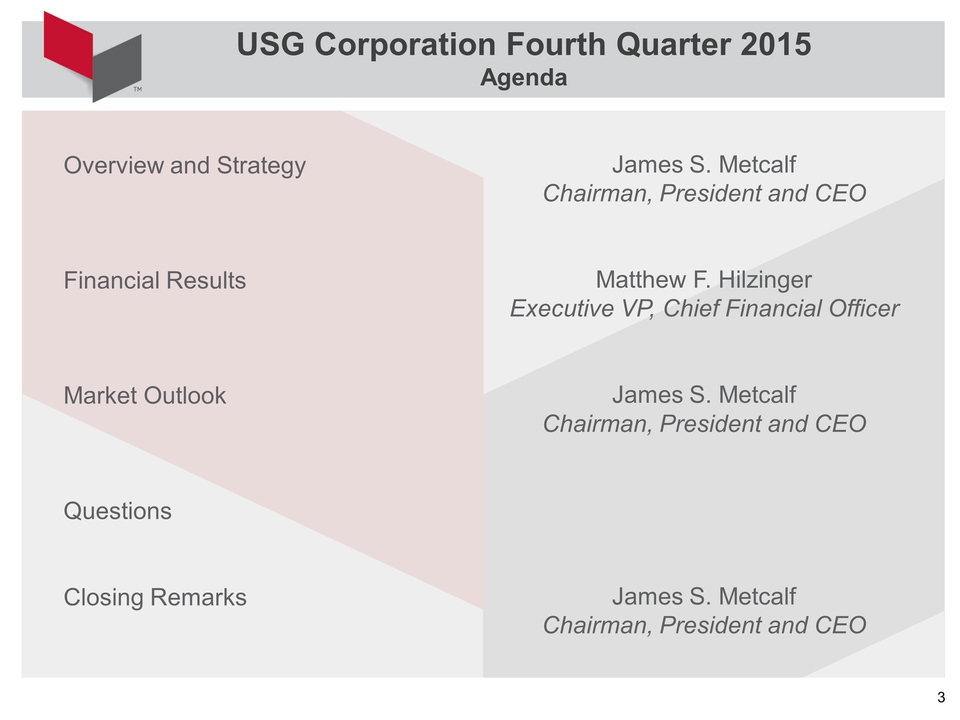
USG Corporation Fourth Quarter 2015 Agenda Overview and Strategy Financial Results Market Outlook Questions Closing Remarks James S. Metcalf Chairman, President and CEO Matthew F. Hilzinger Executive VP, Chief Financial Officer James S. Metcalf Chairman, President and CEO James S. Metcalf Chairman, President and CEO 3
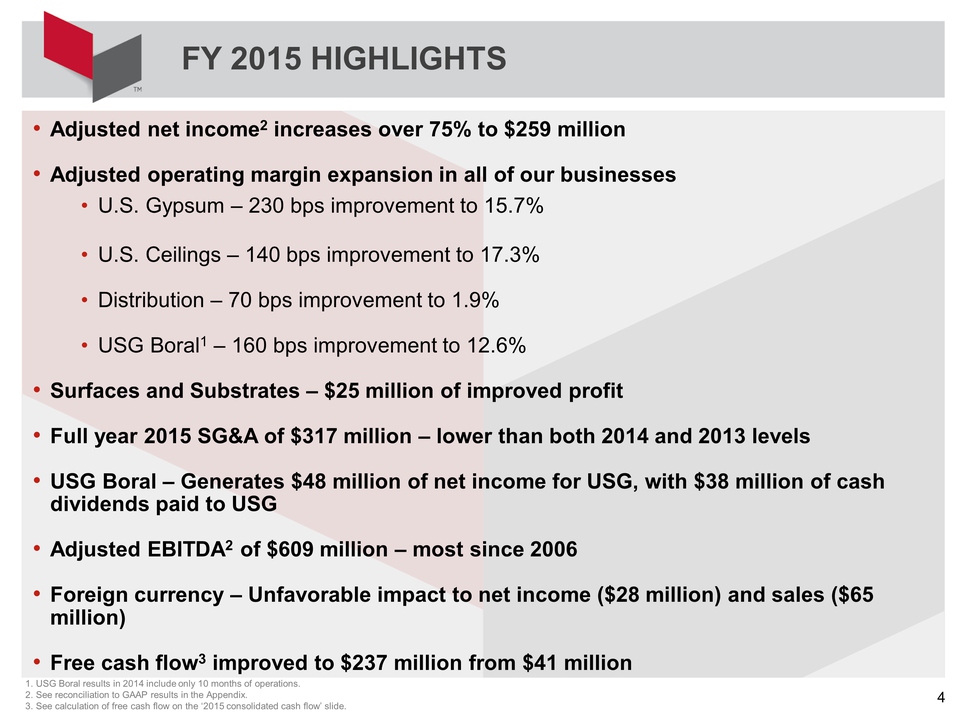
FY 2015 HIGHLIGHTS Adjusted net income2 increases over 75% to $259 million Adjusted operating margin expansion in all of our businesses U.S. Gypsum – 230 bps improvement to 15.7% U.S. Ceilings – 140 bps improvement to 17.3% Distribution – 70 bps improvement to 1.9% USG Boral1 – 160 bps improvement to 12.6% Surfaces and Substrates – $25 million of improved profit Full year 2015 SG&A of $317 million – lower than both 2014 and 2013 levels USG Boral – Generates $48 million of net income for USG, with $38 million of cash dividends paid to USG Adjusted EBITDA2 of $609 million – most since 2006 Foreign currency – Unfavorable impact to net income ($28 million) and sales ($65 million) Free cash flow3 improved to $237 million from $41 million 4 1. USG Boral results in 2014 include only 10 months of operations. 2. See reconciliation to GAAP results in the Appendix. 3. See calculation of free cash flow on the ‘2015 consolidated cash flow’ slide. 4
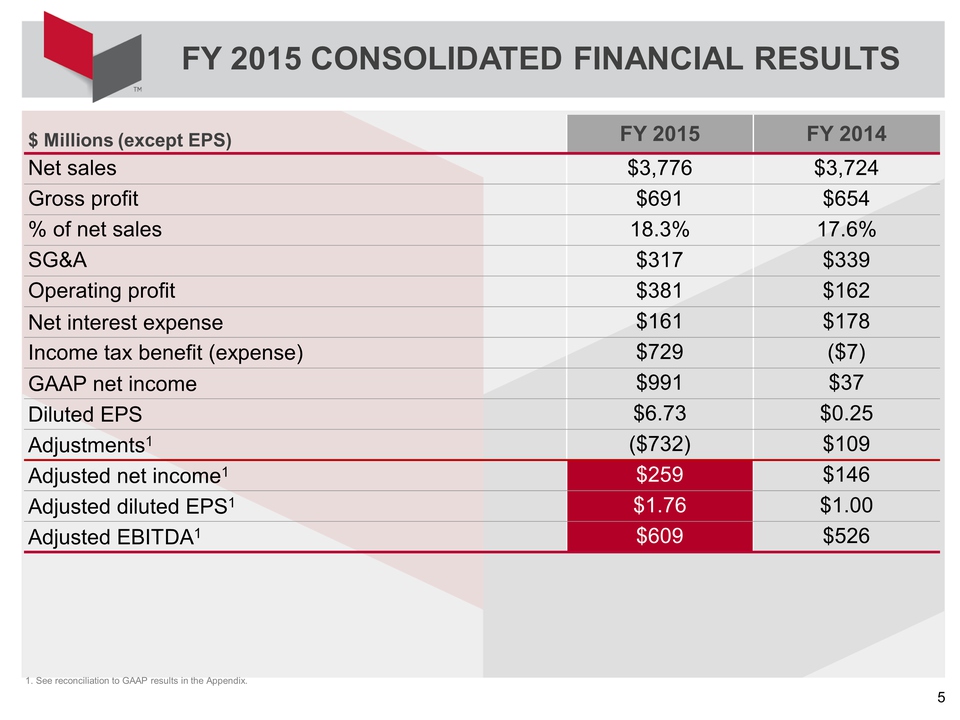
$ Millions (except EPS) FY 2015 FY 2014 Net sales$3,776$3,724 Gross profit$691$654% of net sales18.3%17.6% SG&A$317$339 Operating profit$381$162 Net interest expense $161$178 Income tax benefit (expense) $729($7) GAAP net income$991$37 Diluted EPS$6.73$0.25 Adjustments1($732) $109 Adjusted net income1$259 $146 Adjusted diluted EPS1$1.76$1.00 Adjusted EBITDA1$609 5
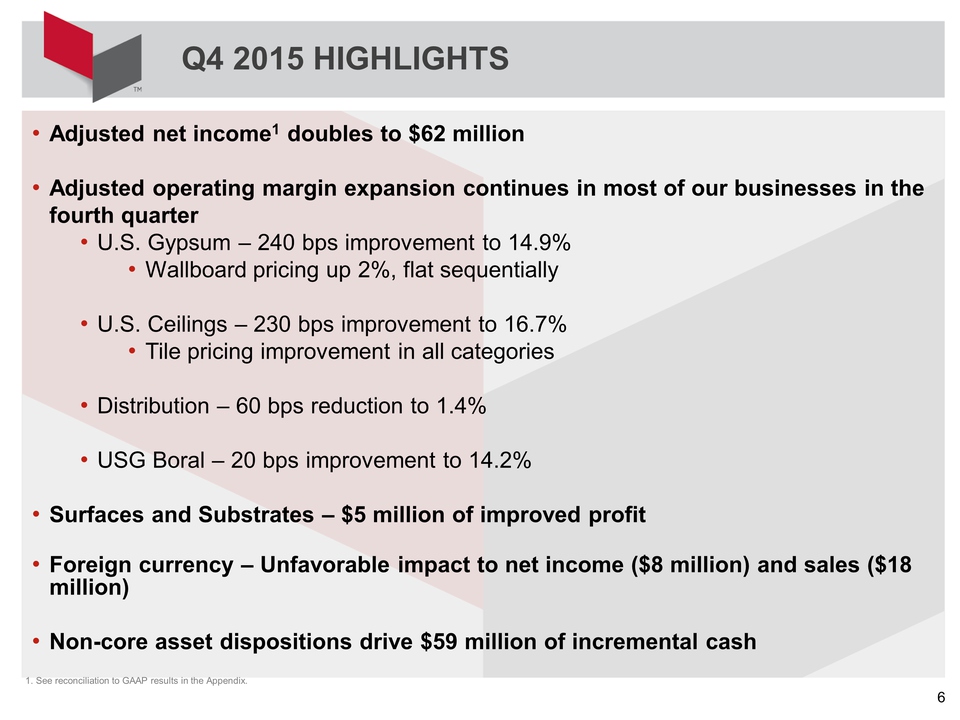
Q4 2015 HIGHLIGHTS Adjusted net income1 doubles to $62 million Adjusted operating margin expansion continues in most of our businesses in the fourth quarter U.S. Gypsum – 240 bps improvement to 14.9% Wallboard pricing up 2%, flat sequentially U.S. Ceilings – 230 bps improvement to 16.7% Tile pricing improvement in all categories Distribution – 60 bps reduction to 1.4% USG Boral – 20 bps improvement to 14.2% Surfaces and Substrates – $5 million of improved profit Foreign currency – Unfavorable impact to net income ($8 million) and sales ($18 million) Non-core asset dispositions drive $59 million of incremental cash 6 1. See reconciliation to GAAP results in the Appendix. 6
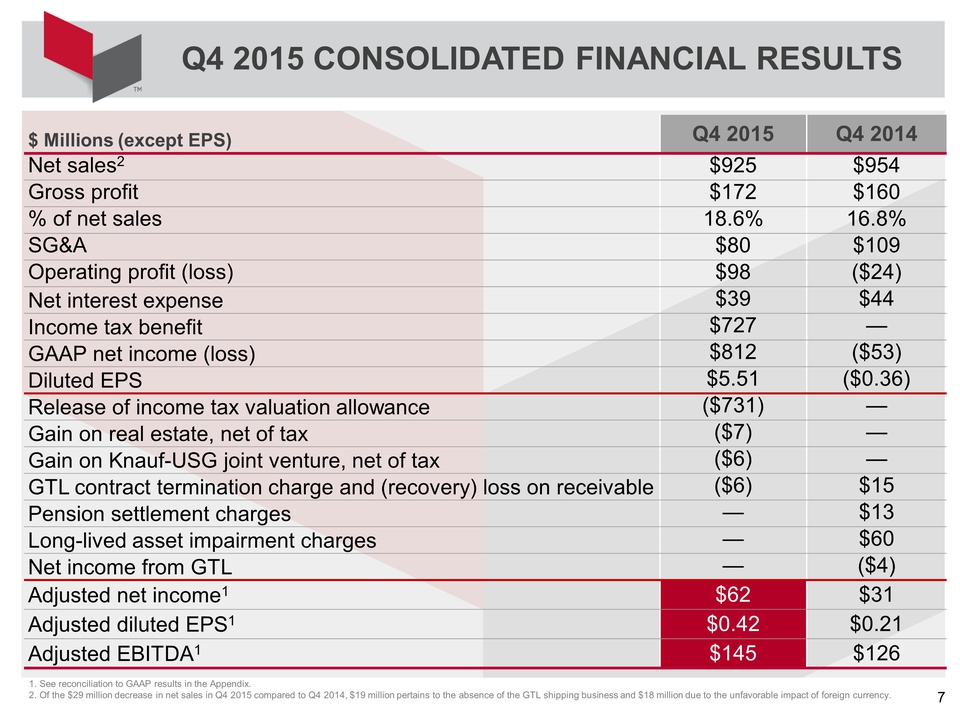
$ Millions (except EPS) Q4 2015 Q4 2014 Net sales2 $925 $954 Gross profit $172 $160 % of net sales 18.6% 16.8% SG&A $80 $109 Operating profit (loss) $98 ($24) Net interest expense $39 $44 Income tax benefit $727 — GAAP net income (loss) $812 ($53) Diluted EPS $5.51 ($0.36) Release of income tax valuation allowance ($731) — Gain on real estate, net of tax ($7) — Gain on Knauf-USG joint venture, net of tax ($6) — GTL contract termination charge and (recovery) loss on receivable ($6) $15 Pension settlement charges — $13 Long-lived asset impairment charges — $60 Net income from GTL — ($4) Adjusted net income1 $62 $31 Adjusted diluted EPS1 $0.42 $0.21 Adjusted EBITDA1 $145 $126 7
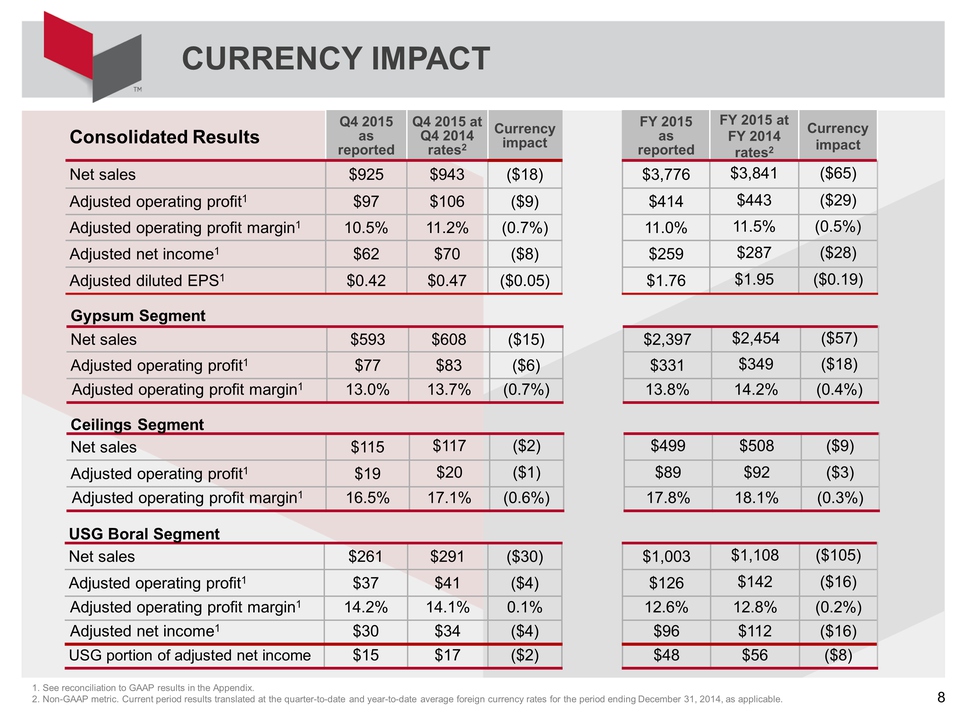
CURRENCY IMPACT Consolidated Results Q4 2015 as reported Q4 2015 at Q4 2014 rates2 Currency impact FY 2015 as reported FY 2015 at FY 2014 rates2 Currency impact Net sales $925 $943 ($18) $3,776 $3,841 ($65) Adjusted operating profit1 $97 $106 ($9) $414 $443 ($29) Adjusted operating profit margin1 10.5% 11.2% (0.7%) 11.0% 11.5% (0.5%) Adjusted net income1 $62 $70 ($8) $259 $287 ($28) Adjusted diluted EPS1 $0.42 $0.47 ($0.05) $1.76 $1.95 ($0.19) 8
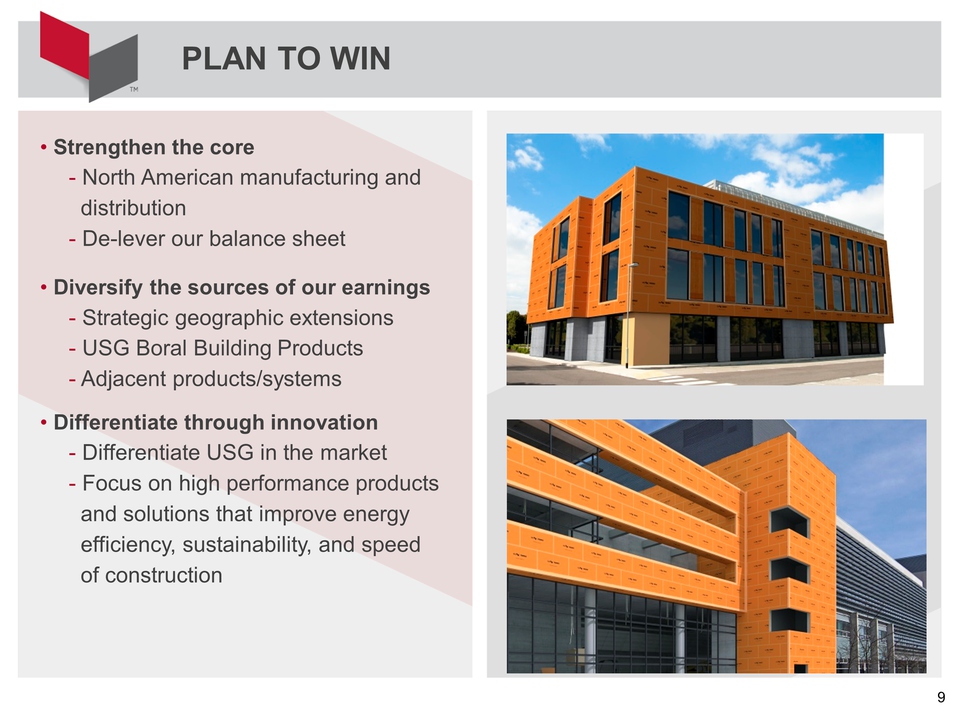
PLAN TO WIN Strengthen the core - North American manufacturing and distribution - De-lever our balance sheet Diversify the sources of our earnings - Strategic geographic extensions - USG Boral Building Products - Adjacent products/systems Differentiate through innovation - Differentiate USG in the market - Focus on high performance products and solutions that improve energy efficiency, sustainability, and speed of construction 9

Q4 2015 Highlights Adjusted operating margin improves 180 bps to 13.0% U.S. Gypsum adjusted operating margin improvement of 240 bps to 14.9% Wallboard pricing up 2% year-over-year; flat sequentially Cost tailwinds driven by gas and lean six sigma efforts offset inflation in paper, synthetic gypsum, and labor Volumes down 3.5% on shift in pre-buy U.S. Surfaces & Substrates: $5 million of profit improvement led by joint treatment and roofing products Lower costs drive improved profit in Canada and Mexico; offset by $6 million FX headwind Sale of excess property in Mexico yields $7 million gain and $15 million in cash – excluded from adjusted results GYPSUM 1. See reconciliation to GAAP results in the Appendix. 2. Excludes sales of $19 million from Q4 2014 from our shipping operation, GTL, that we have exited. Q4 2014 Adjusted Operating Profit1 $68 U.S. Wallboard Price $4 U.S. Wallboard Cost $2 U.S. Wallboard Volume ($5) U.S. Surfaces & Substrates $5 U.S. SG&A $6 Canada and Mexico $3 Foreign Currency ($6) Q4 2015 Adjusted Operating Profit1 $77adjusted Operating Profit Margin 13.0%, 11.2%, 1.8% 10
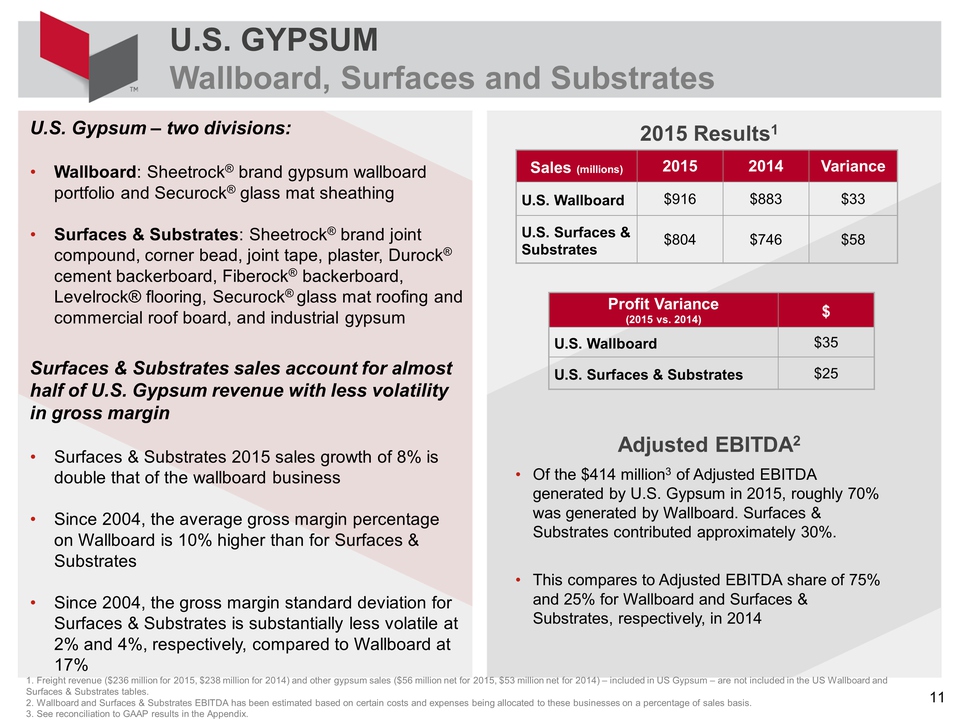
U.S. GYPSUM Wallboard, Surfaces and Substrates 1. Freight revenue ($236 million for 2015, $238 million for 2014) and other gypsum sales ($56 million net for 2015, $53 million net for 2014) – included in US Gypsum – are not included in the US Wallboard and Surfaces & Substrates tables. 2. Wallboard and Surfaces & Substrates EBITDA has been estimated based on certain costs and expenses being allocated to these businesses on a percentage of sales basis. 3. See reconciliation to GAAP results in the Appendix. U.S. Gypsum – two divisions: Wallboard: Sheetrock® brand gypsum wallboard portfolio and Securock® glass mat sheathing Surfaces & Substrates: Sheetrock® brand joint compound, corner bead, joint tape, plaster, Durock® cement backerboard, Fiberock® backerboard, Levelrock® flooring, Securock® glass mat roofing and commercial roof board, and industrial gypsum Surfaces & Substrates sales account for almost half of U.S. Gypsum revenue with less volatility in gross margin Surfaces & Substrates 2015 sales growth of 8% is double that of the wallboard business Since 2004, the average gross margin percentage on Wallboard is 10% higher than for Surfaces & Substrates Since 2004, the gross margin standard deviation for Surfaces & Substrates is substantially less volatile at 2% and 4%, respectively, compared to Wallboard at 17% Sales (millions) 2015 2014 Variance U.S. Wallboard $916 $883 $33 U.S. Surfaces & Substrates $804 $746 $58 11
Q4 2015 Highlights Adjusted operating margin2 improves 160 bps to 16.5% U.S. Ceilings adjusted operating margin2 improvement of 230 bps to 16.7% Record fourth quarter operating margin performance Improved pricing in all ceiling tile categories Continued mix shift towards high-end ceilings tiles Improved mix in ceiling grid Costs tailwinds due to lower natural gas, steel costs, operational efficiencies Low single digit volume decrease in grid and tile products Q4 2014 Adjusted Operating Profit1 $18 U.S. Tile & Grid Price $2 U.S. Tile & Grid Cost $1 U.S. Tile & Grid Volume ($1) Foreign Currency ($1) Q4 2015 Adjusted Operating Profit1 $19 12
Operating margin contracts 60 bps to 1.4% Same store sales increased 3% Wallboard volumes improved by 3% Working capital levels improve and wallboard spread increases Operational improvement initiatives continue to progress: Truck utilization Inventory management Shared service efficiencies Cost management Q4 2014 Adjusted Operating Profit1 $7 Wallboard Margin and Volume $1 SG&A ($1) Delivery Costs ($2) Q4 2015 Adjusted Operating Profit1 $5 13
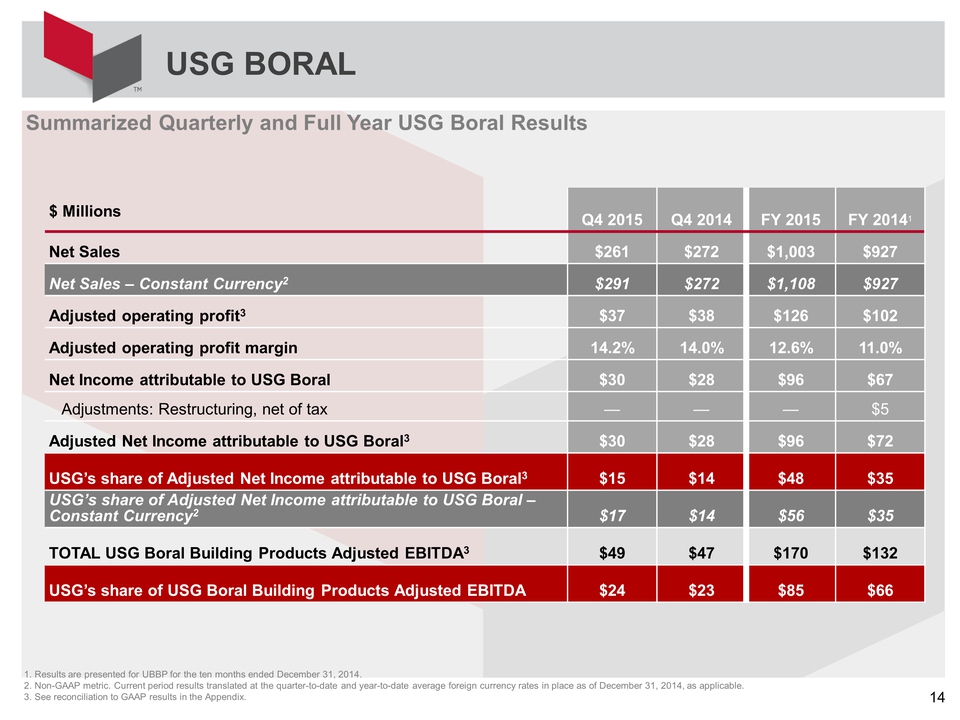
USG BORAL 14 $ Millions Q4 2015 Q4 2014 FY 2015 FY 20141 Net Sales $261 $272 $1,003 $927 Net Sales – Constant Currency2 $291 $272 $1,108 $927 Adjusted operating profit3 $37 $38 $126 $102 Adjusted operating profit margin 14.2% 14.0% 12.6% 11.0% Net Income attributable to USG Boral $30 $28 $96 $67 Adjustments: Restructuring, net of tax — — — $5 Adjusted Net Income attributable to USG Boral3 $30 $28 $96 $72 USG’s share of Adjusted Net Income attributable to USG Boral3 $15 $14 $48 $35 USG’s share of Adjusted Net Income attributable to USG Boral – Constant Currency2 $17 $14 $56 $35 TOTAL USG Boral Building Products Adjusted EBITDA3 $49 $47 $170 $132 USG’s share of USG Boral Building Products Adjusted EBITDA $24 $23 $85 $66 14
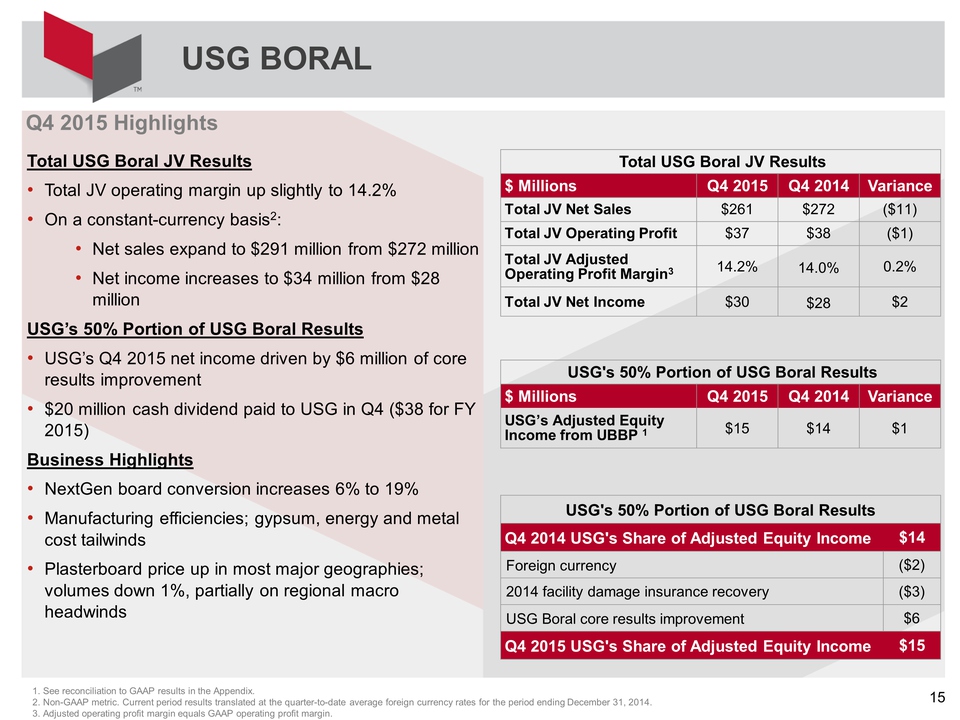
Q4 2015 Highlights Total USG Boral JV Results Total JV operating margin up slightly to 14.2% On a constant-currency basis2: Net sales expand to $291 million from $272 million Net income increases to $34 million from $28 million USG’s 50% Portion of USG Boral Results USG’s Q4 2015 net income driven by $6 million of core results improvement $20 million cash dividend paid to USG in Q4 ($38 for FY 2015) Business Highlights NextGen board conversion increases 6% to 19% Manufacturing efficiencies; gypsum, energy and metal cost tailwinds Plasterboard price up in most major geographies; volumes down 1%, partially on regional macro headwinds USG BORAL Total USG Boral JV Results $ Millions Q4 2015 Q4 2014 Variance Total JV Net Sales $261 $272 ($11) Total JV Operating Profit $37 $38 ($1) Total JV Adjusted Operating Profit Margin3 14.2% 14.0% 0.2% Total JV Net Income $30 $28 $2 15
2016 OUTLOOK Volumes and End-Market Expect overall demand to increase around 5% New residential to 1.2 million starts; expect commercial and R&R volumes to increase 2 to 3% Input Costs Overall inflation in input costs of 1 to 2% Inflation in labor, synthetic gypsum, paper, and transportation; deflation in natural gas All-in natural gas expected to be down 10 to 15 percent; 75% of anticipated volumes hedged for 2016 SG&A Expect 2016 SG&A to come in below 2015 levels (under $317 million) Income Taxes Book taxes expected to be between 30 to 33 percent of pre-tax profits No cash income taxes in US; foreign taxes at ~$2 million per quarter Foreign Currency Roughly $25 million total headwind for Canada, Mexico, and USG Boral1 USG Boral Wallboard shipments expected to increase by 5%; USG’s portion of adjusted net income in 2015 ($48 million) expected to increase by at least 10% in 2016, inclusive of foreign currency headwinds Capital Spending Around $100 million - half maintenance of business, half new investments Debt and Pension Total interest expense of $155 million absent debt retirement or refinancing Pension contributions of $65 million 16 1. Constant currency terms using applicable quarter to date or year to date average rates vs. the US Dollar for the period ending December 31, 2015. Note – Slide contains Management’s expectations and beliefs for 2016. 16
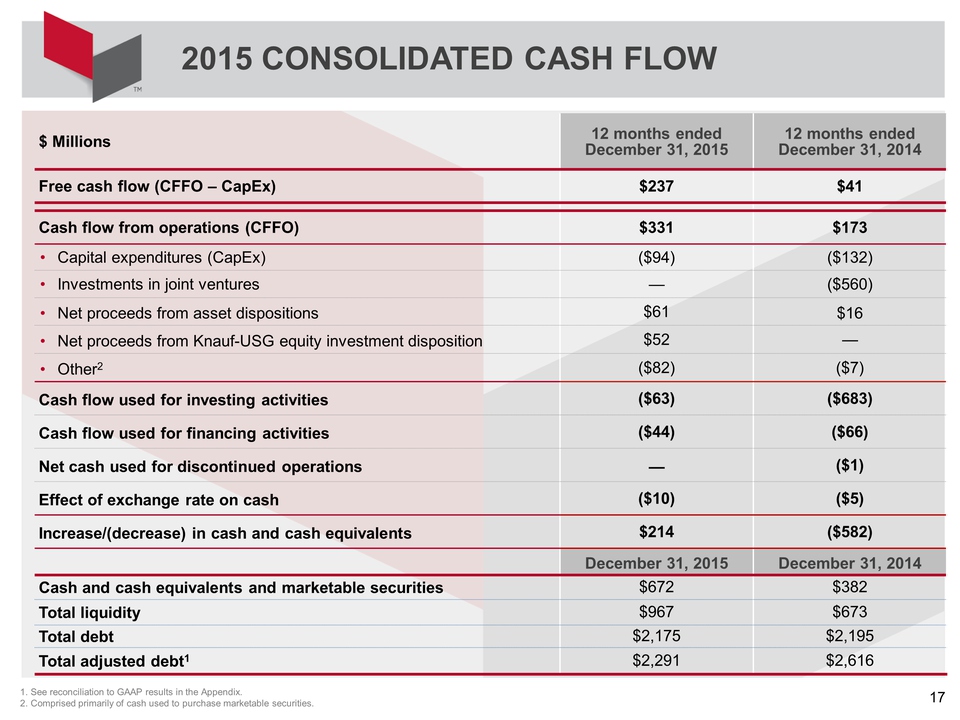
2015 CONSOLIDATED CASH FLOW 17 $ Millions 12 months ended December 31, 2015 12 months ended December 31, 2014 Free cash flow (CFFO – CapEx) $237 $41 Cash flow from operations (CFFO) $331 $173 Capital expenditures (CapEx) ($94) ($132) Investments in joint ventures — ($560) Net proceeds from asset dispositions $61 $16 Net proceeds from Knauf-USG equity investment disposition $52 — Other2 ($82) ($7) Cash flow used for investing activities ($63) ($683) Cash flow used for financing activities ($44) ($66) Net cash used for discontinued operations — ($1) Effect of exchange rate on cash ($10) ($5) Increase/(decrease) in cash and cash equivalents $214 ($582) December 31, 2015 December 31, 2014 Cash and cash equivalents and marketable securities $672 $382 Total liquidity $967 $673 Total debt $2,175 $2,195 Total adjusted debt1 $2,291 $2,616 17
APPENDIX 18
In this presentation, the corporation’s financial results are provided both in accordance with accounting principles generally accepted in the United States of America (GAAP) and using certain non-GAAP financial measures. In particular, the corporation presents the non-GAAP financial measures adjusted EBITDA, adjusted operating profit, adjusted net income, adjusted equity income of USG Boral Building Products, or UBBP, the currency impact of various financial metrics described on page 8, adjusted debt, USG Boral revenues, sales and adjusted operating profit on a constant currency basis, adjusted EBITDA per fully diluted share, adjusted net sales and adjusted diluted earnings per share, which exclude certain items. In addition, adjusted operating profit on a consolidated basis includes the corporation’s equity method income from UBBP and USG’s other equity method investments, and adjusted EBITDA on a consolidated basis includes the corporation’s share of UBBP’s adjusted EBITDA and excludes GTL's EBITDA. Further, management believes it is appropriate to exclude the indicated items from UBBP equity income because the resulting UBBP adjusted equity income can be used to evaluate the financial performance of UBBP. The non-GAAP financial measures are included as a complement to results provided in accordance with GAAP because management believes these non-GAAP financial measures help investors’ ability to analyze underlying trends in the corporation’s business, evaluate its performance relative to other companies in its industry and provide useful information to both management and investors by excluding certain items that may not be indicative of the corporation’s core operating results. Adjusted operating profit includes the adjusted equity method income from UBBP and USG’s income from other equity investments and adjusted EBITDA includes the corporation’s share of UBBP’s adjusted EBITDA because management views UBBP and its other equity investments as important businesses. Management excludes GTL's EBITDA because we exited the shipping operation in April 2015. In addition, the corporation uses adjusted operating profit and adjusted net income as components in the measurement of incentive compensation. The non-GAAP measures should not be considered a substitute for or superior to GAAP results and may vary from others in the industry. For further information related to the corporation’s use of non-GAAP financial measures, and the reconciliations to the nearest GAAP measures, see the schedules attached hereto. NON-GAAP FINANCIAL MEASURES 19
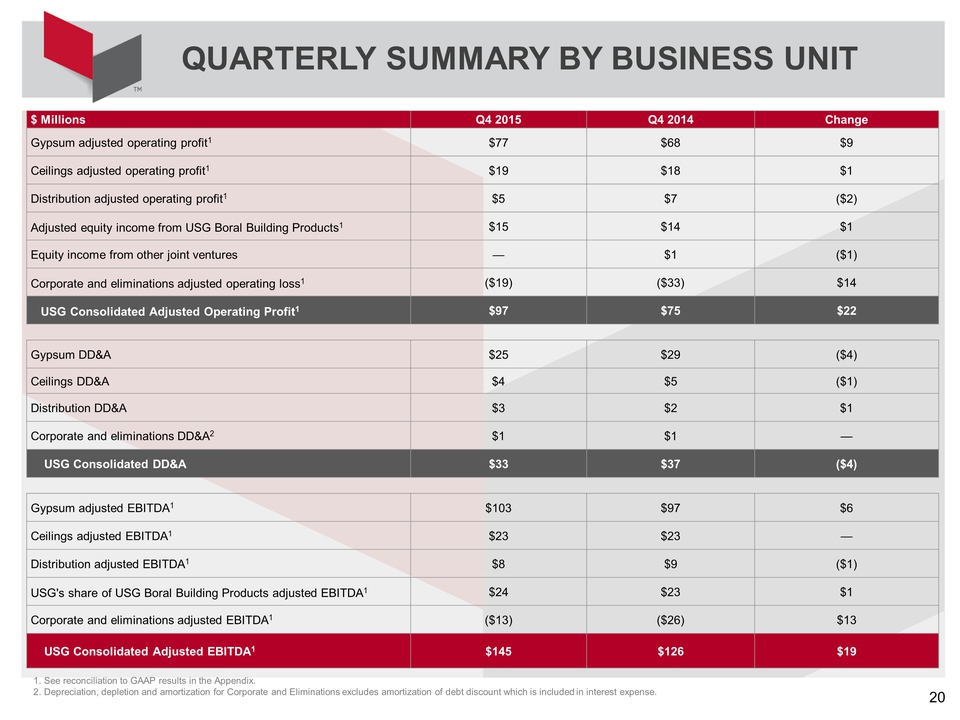
$ Millions Q4 2015 Q4 2014 Change Gypsum adjusted operating profit1 $77 $68 $9 Ceilings adjusted operating profit1 $19 $18 $1 Distribution adjusted operating profit1 $5 $7 ($2) Adjusted equity income from USG Boral Building Products1 $15 $14 $1 Equity income from other joint ventures — $1 ($1) Corporate and eliminations adjusted operating loss1 ($19) ($33) $14 USG Consolidated Adjusted Operating Profit1 $97 $75 $22 Gypsum DD&A $25 $29 ($4) Ceilings DD&A $4 $5 ($1) Distribution DD&A $3 $2 $1 Corporate and eliminations DD&A2 $1 $1 — USG Consolidated DD&A $33 $37 ($4) Gypsum adjusted EBITDA1 $103 $97 $6 Ceilings adjusted EBITDA1 $23 $23 — Distribution adjusted EBITDA1 $8 $9 ($1) USG's share of USG Boral Building Products adjusted EBITDA1 $24 $23 $1 Corporate and eliminations adjusted EBITDA1 ($13) ($26) $13 USG Consolidated Adjusted EBITDA1 $145 $126 $19 20
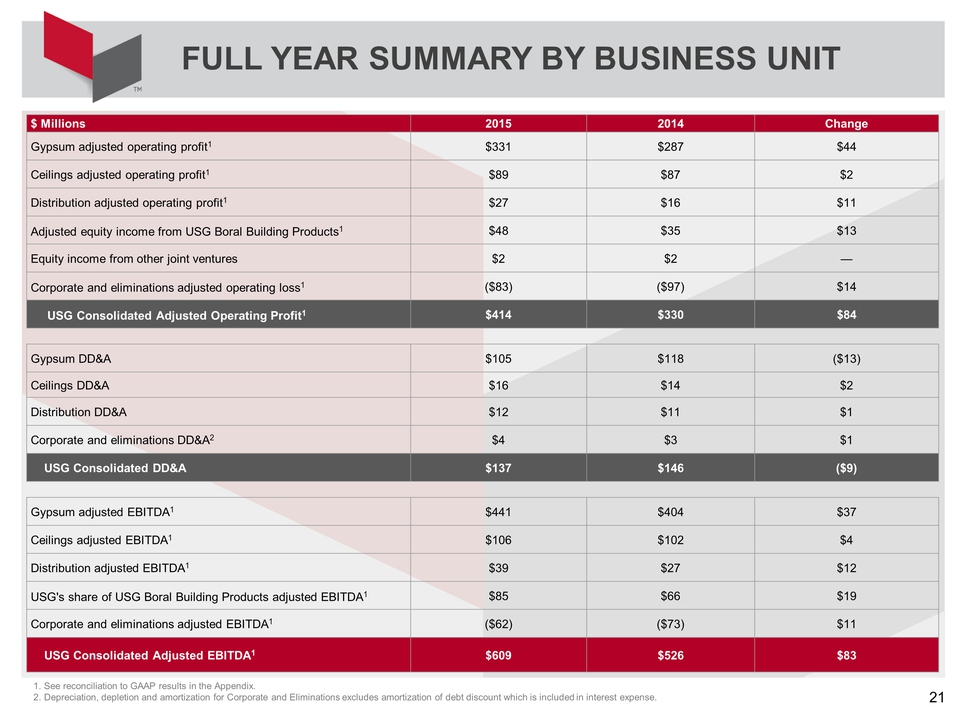
$ Millions 2015 2014 Change Gypsum adjusted operating profit1 $331 $287 $44 Ceilings adjusted operating profit1 $89 $87 $2 Distribution adjusted operating profit1 $27 $16 $11 Adjusted equity income from USG Boral Building Products1 $48 $35 $13 Equity income from other joint ventures $2 $2 — Corporate and eliminations adjusted operating loss1 ($83) ($97) $14 USG Consolidated Adjusted Operating Profit1 $414 $330 $84 Gypsum DD&A $105 $118 ($13) Ceilings DD&A $16 $14 $2 Distribution DD&A $12 $11 $1 Corporate and eliminations DD&A2 $4 $3 $1 USG Consolidated DD&A $137 $146 ($9) Gypsum adjusted EBITDA1 $441 $404 $37 Ceilings adjusted EBITDA1 $106 $102 $4 Distribution adjusted EBITDA1 $39 $27 $12 USG's share of USG Boral Building Products adjusted EBITDA1 $85 $66 $19 Corporate and eliminations adjusted EBITDA1 ($62) ($73) $11 USG Consolidated Adjusted EBITDA1 $609 $526 $83 21
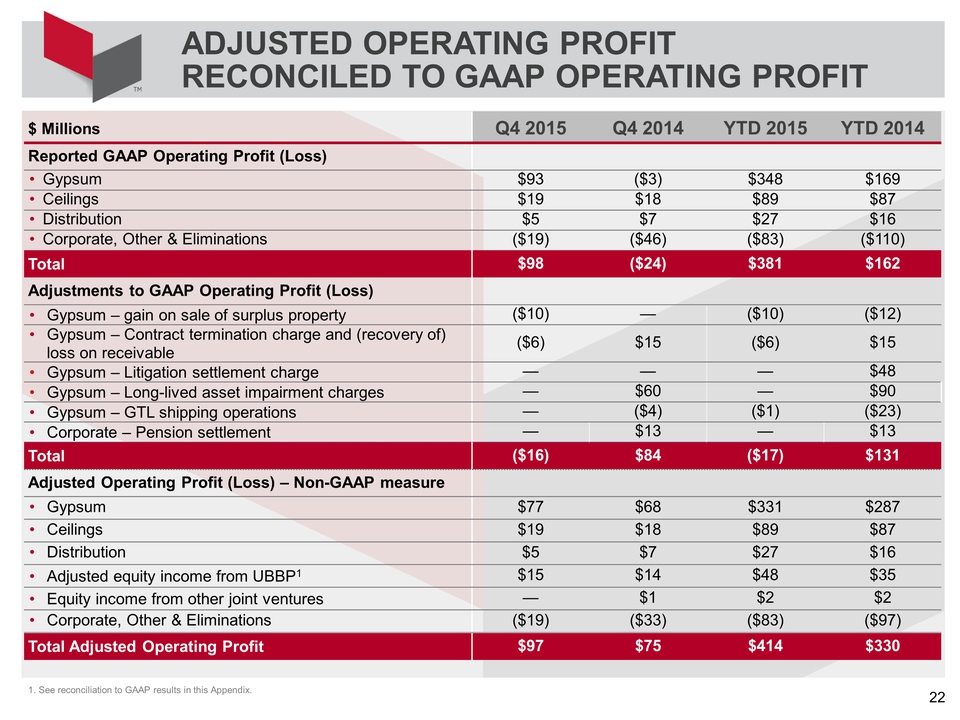
ADJUSTED OPERATING PROFIT RECONCILED TO GAAP OPERATING PROFIT $ Millions Q4 2015 Q4 2014 YTD 2015 YTD 2014 Reported GAAP Operating Profit (Loss) Gypsum $93 ($3) $348 $169 Ceilings $19 $18 $89 $87 Distribution $5 $7 $27 $16 Corporate, Other & Eliminations ($19) ($46) ($83) ($110) Total $98 ($24) $381 $162 Adjustments to GAAP Operating Profit (Loss) Gypsum – gain on sale of surplus property ($10) — ($10) ($12) Gypsum – Contract termination charge and (recovery of) loss on receivable ($6) $15 ($6) $15 Gypsum – Litigation settlement charge — — — $48 Gypsum – Long-lived asset impairment charges — $60 — $90 Gypsum – GTL shipping operations — ($4) ($1) ($23) Corporate – Pension settlement — $13 — $13 Total ($16) $84 ($17) $131 Adjusted Operating Profit (Loss) – Non-GAAP measure Gypsum $77 $68 $331 $287 Ceilings $19 $18 $89 $87 Distribution $5 $7 $27 $16 Adjusted equity income from UBBP1 $15 $14 $48 $35 Equity income from other joint ventures — $1 $2 $2 Corporate, Other & Eliminations ($19) ($33) ($83) ($97) Total Adjusted Operating Profit $97 $75 $414 $330 22
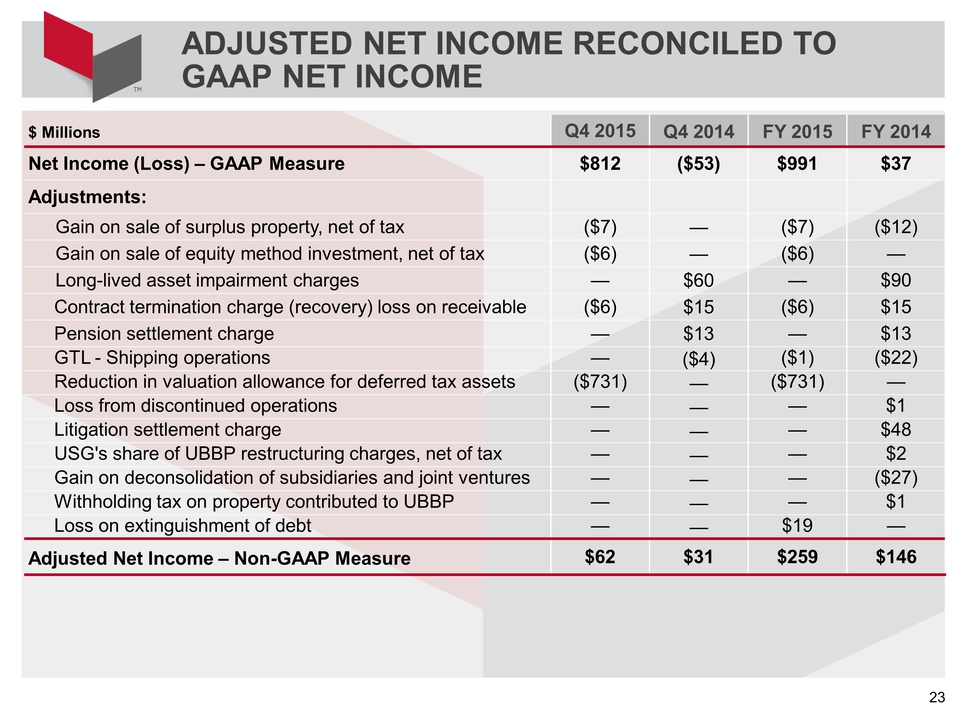
ADJUSTED NET INCOME RECONCILED TO GAAP NET INCOME $ Millions Q4 2015 Q4 2014 FY 2015 FY 2014 Net Income (Loss) – GAAP Measure $812 ($53) $991 $37 Adjustments: Gain on sale of surplus property, net of tax ($7) — ($7) ($12) Gain on sale of equity method investment, net of tax ($6) — ($6) — Long-lived asset impairment charges — $60 — $90 Contract termination charge (recovery) loss on receivable ($6) $15 ($6) $15 Pension settlement charge — $13 — $13 GTL - Shipping operations — ($4) ($1) ($22) Reduction in valuation allowance for deferred tax assets ($731) — ($731) — Loss from discontinued operations — — — $1 Litigation settlement charge — — — $48 USG's share of UBBP restructuring charges, net of tax — — — $2 Gain on deconsolidation of subsidiaries and joint ventures — — — ($27) Withholding tax on property contributed to UBBP — — — $1 Loss on extinguishment of debt — — $19 — Adjusted Net Income – Non-GAAP Measure $62 $31 $259 $146 23
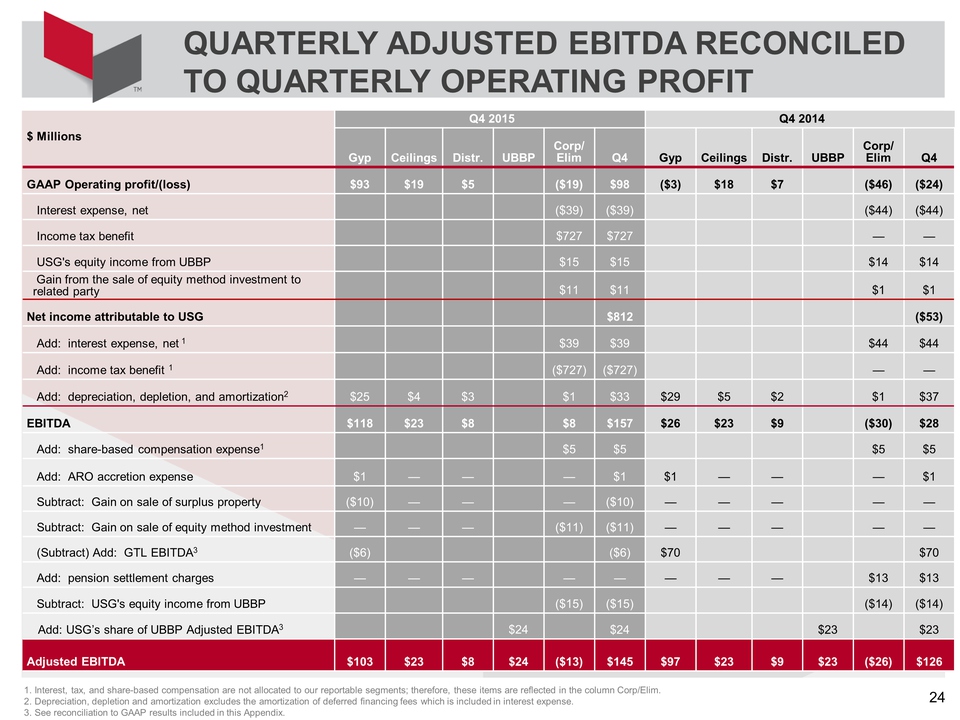
QUARTERLY ADJUSTED EBITDA RECONCILED TO QUARTERLY OPERATING PROFIT 24 Q4 2015 Q4 2014 $ Millions Gyp Ceilings Distr. UBBP Corp/ Elim Q4 Gyp Ceilings Distr. UBBP Corp/ Elim Q4 GAAP Operating profit/(loss) $93 $19 $5 ($19) $98 ($3) $18 $7 ($46) ($24) Interest expense, net ($39) ($39) ($44) ($44) Income tax benefit $727 $727 — — USG's equity income from UBBP $15 $15 $14 $14 Gain from the sale of equity method investment to related party $11 $11 $1 $1 Net income attributable to USG $812 ($53) Add: interest expense, net 1 $39 $39 $44 $44 Add: income tax benefit 1 ($727) ($727) — — Add: depreciation, depletion, and amortization2 $25 $4 $3 $1 $33 $29 $5 $2 $1 $37 EBITDA $118 $23 $8 $8 $157 $26 $23 $9 ($30) $28 Add: share-based compensation expense1 $5 $5 $5 $5 Add: ARO accretion expense $1 — — — $1 $1 — — — $1 Subtract: Gain on sale of surplus property ($10) — — — ($10) — — — — — Subtract: Gain on sale of equity method investment — — — ($11) ($11) — — — — — (Subtract) Add: GTL EBITDA3 ($6) ($6) $70 $70 Add: pension settlement charges — — — — — — — — $13 $13 Subtract: USG's equity income from UBBP ($15) ($15) ($14) ($14) Add: USG’s share of UBBP Adjusted EBITDA3 $24 $24 $23 $23 Adjusted EBITDA $103 $23 $8 $24 ($13) $145 $97 $23 $9 $23 ($26) $126 24

FULL YEAR ADJUSTED EBITDA RECONCILED TO FULL YEAR OPERATING PROFIT 25 FY 2015 FY 2014 $ Millions Gyp Ceilings Distr. UBBP Corp/ Elim YTD 2015 Gyp Ceilings Distr. UBBP Corp/ Elim YTD 2014 GAAP Operating profit/(loss) $348 $89 $27 ($83) $381 $169 $87 $16 ($110) $162 Interest expense, net ($161) ($161) ($178) ($178) Income tax benefit (expense) $729 $729 ($7) ($7) USG's equity income from UBBP4 $48 $48 $33 $33 Income and gain from the sale of equity method investment to related party $13 $13 $2 $2 Gain on deconsolidation of subsidiaries — — $27 $27 Loss on extinguishment of debt ($19) ($19) — — Loss from discontinued operations, net of tax — — ($1) ($1) Net income attributable to non-controlling interest — — ($1) ($1) Net income attributable to USG $991 $37 Add: interest expense, net 1 $161 $161 $178 $178 Add: income tax (benefit) expense 1 ($729) ($729) $7 $7 Add: depreciation, depletion, and amortization2 $105 $16 $12 $4 $137 $118 $14 $11 $3 $146 EBITDA $453 $105 $39 ($37) $560 $287 $101 $27 ($47) $368 Add: share-based compensation expense1 $15 $15 $21 $21 Add: ARO accretion expense $6 $1 — — $7 $6 $1 — — $7 Add: loss on extinguishment of debt $19 $19 — — — — — Add: litigation settlement charge — — — — — $48 — — — $48 Add: long-lived asset impairment charges — — — — — $30 — — — $30 Subtract: gain on sale of equity method investment — — — ($11) ($11) — — — — — Subtract: gain on sale of surplus property ($10) — — — ($10) ($12) — — — ($12) (Subtract) Add: GTL EBITDA3 ($8) ($8) $45 $45 Add: pension settlement charges — — — — — — — — $13 $13 Subtract: USG's equity income from UBBP4 ($48) ($48) ($60) ($60) Add: USG’s share of UBBP Adjusted EBITDA3 $85 $85 $66 $66 Adjusted EBITDA $441 $106 $39 $85 ($62) $609 $404 $102 $27 $66 ($73) $526 25
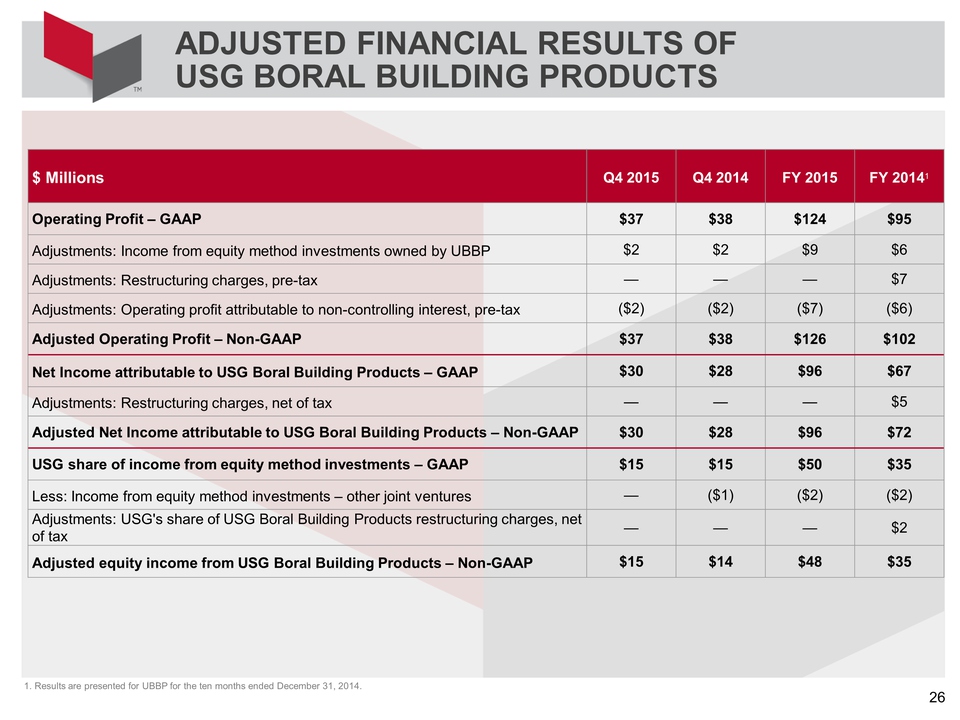
ADJUSTED FINANCIAL RESULTS OF USG BORAL BUILDING PRODUCTS 26 $ Millions Q4 2015 Q4 2014 FY 2015 FY 20141 Operating Profit – GAAP $37 $38 $124 $95 Adjustments: Income from equity method investments owned by UBBP $2 $2 $9 $6 Adjustments: Restructuring charges, pre-tax — — — $7 Adjustments: Operating profit attributable to non-controlling interest, pre-tax ($2) ($2) ($7) ($6) Adjusted Operating Profit – Non-GAAP $37 $38 $126 $102 Net Income attributable to USG Boral Building Products – GAAP $30 $28 $96 $67 Adjustments: Restructuring charges, net of tax — — — $5 Adjusted Net Income attributable to USG Boral Building Products – Non-GAAP $30 $28 $96 $72 USG share of income from equity method investments – GAAP $15 $15 $50 $35 Less: Income from equity method investments – other joint ventures — ($1) ($2) ($2) Adjustments: USG's share of USG Boral Building Products restructuring charges, net of tax — — — $2 Adjusted equity income from USG Boral Building Products – Non-GAAP $15 $14 $48 $35 26
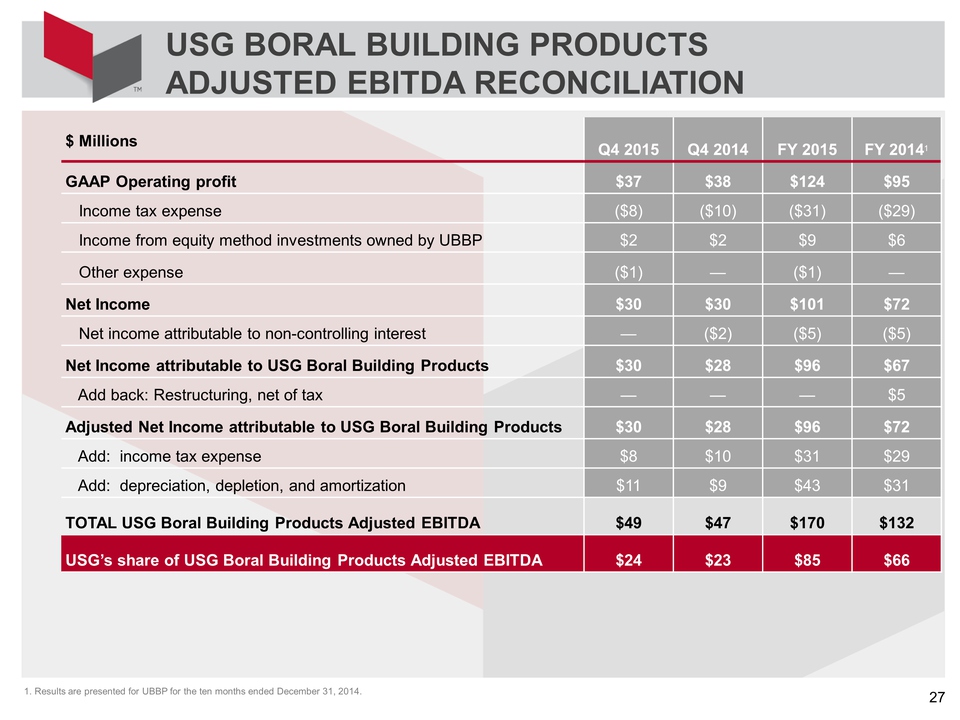
USG BORAL BUILDING PRODUCTS ADJUSTED EBITDA RECONCILIATION 27 $ Millions Q4 2015 Q4 2014 FY 2015 FY 20141 GAAP Operating profit $37 $38 $124 $95 Income tax expense ($8) ($10) ($31) ($29) Income from equity method investments owned by UBBP $2 $2 $9 $6 Other expense ($1) — ($1) — Net Income $30 $30 $101 $72 Net income attributable to non-controlling interest — ($2) ($5) ($5) Net Income attributable to USG Boral Building Products $30 $28 $96 $67 Add back: Restructuring, net of tax — — — $5 Adjusted Net Income attributable to USG Boral Building Products $30 $28 $96 $72 Add: income tax expense $8 $10 $31 $29 Add: depreciation, depletion, and amortization $11 $9 $43 $31 TOTAL USG Boral Building Products Adjusted EBITDA $49 $47 $170 $132 USG’s share of USG Boral Building Products Adjusted EBITDA $24 $23 $85 $66 27
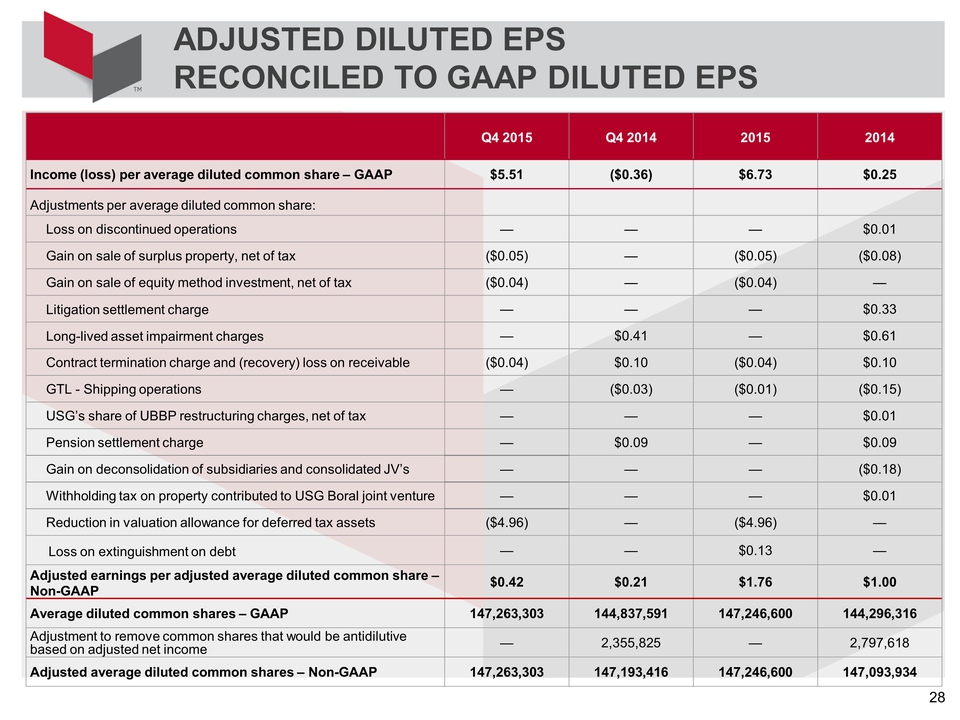
ADJUSTED DILUTED EPS RECONCILED TO GAAP DILUTED EPS Q4 2015 Q4 2014 2015 2014 Income (loss) per average diluted common share – GAAP $5.51 ($0.36) $6.73 $0.25 Adjustments per average diluted common share: Loss on discontinued operations — — — $0.01 Gain on sale of surplus property, net of tax ($0.05) — ($0.05) ($0.08) Gain on sale of equity method investment, net of tax ($0.04) — ($0.04) — Litigation settlement charge — — — $0.33 Long-lived asset impairment charges — $0.41 — $0.61 Contract termination charge and (recovery) loss on receivable ($0.04) $0.10 ($0.04) $0.10 GTL - Shipping operations — ($0.03) ($0.01) ($0.15) USG’s share of UBBP restructuring charges, net of tax — — — $0.01 Pension settlement charge — $0.09 — $0.09 Gain on deconsolidation of subsidiaries and consolidated JV’s — — — ($0.18) Withholding tax on property contributed to USG Boral joint venture — — — $0.01 Reduction in valuation allowance for deferred tax assets ($4.96) — ($4.96) — Loss on extinguishment on debt — — $0.13 — Adjusted earnings per adjusted average diluted common share – Non-GAAP $0.42 $0.21 $1.76 $1.00 Average diluted common shares – GAAP 147,263,303 144,837,591 147,246,600 144,296,316 Adjustment to remove common shares that would be antidilutive based on adjusted net income — 2,355,825 — 2,797,618 Adjusted average diluted common shares – Non-GAAP 147,263,303 147,193,416 147,246,600 147,093,934 28
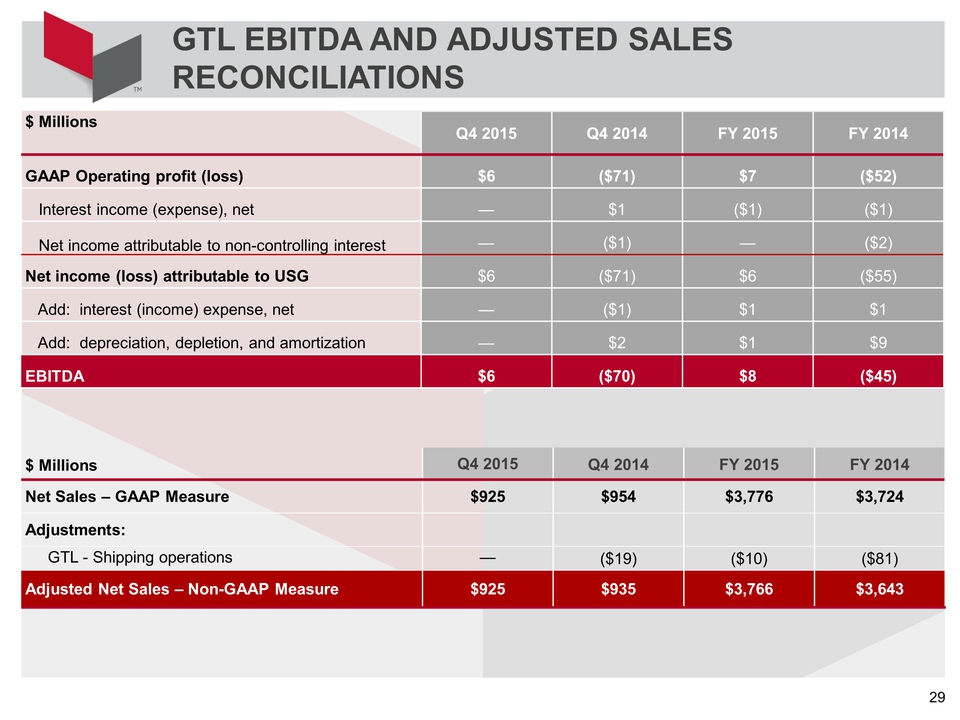
GTL EBITDA AND ADJUSTED SALES RECONCILIATIONS $ Millions Q4 2015 Q4 2014 FY 2015 FY 2014 GAAP Operating profit (loss) $6 ($71) $7 ($52) Interest income (expense), net — $1 ($1) ($1) Net income attributable to non-controlling interest — ($1) — ($2) Net income (loss) attributable to USG $6 ($71) $6 ($55) Add: interest (income) expense, net — ($1) $1 $1 Add: depreciation, depletion, and amortization — $2 $1 $9 EBITDA $6 ($70) $8 ($45)
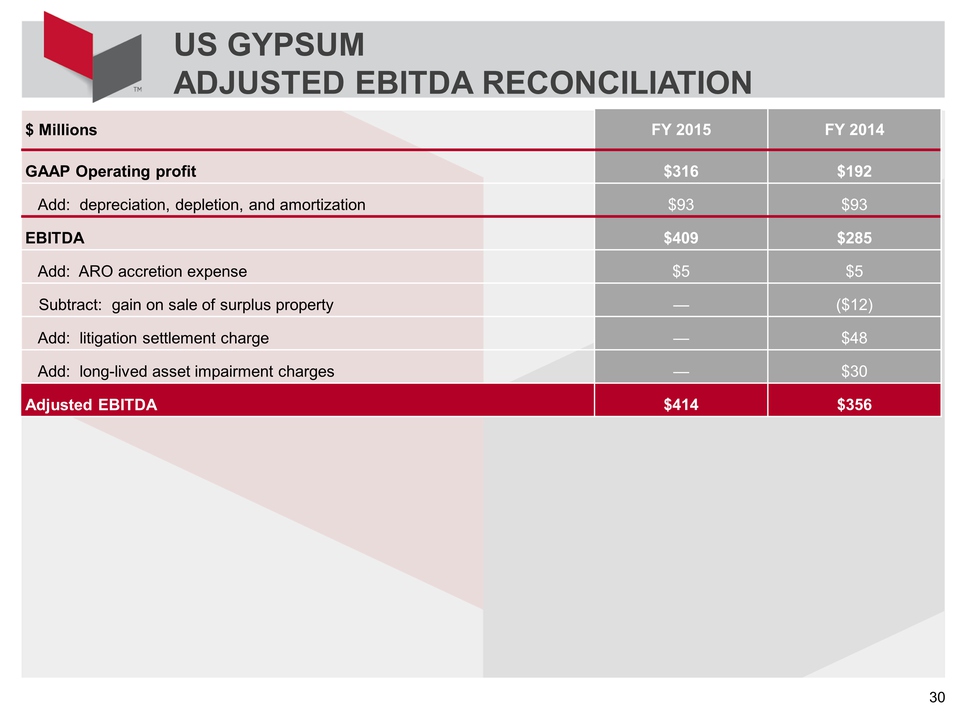
US GYPSUM ADJUSTED EBITDA RECONCILIATION $ Millions FY 2015 FY 2014 GAAP Operating profit $316 $192 Add: depreciation, depletion, and amortization $93 $93 EBITDA $409 $285 Add: ARO accretion expense $5 $5 Subtract: gain on sale of surplus property — ($12) Add: litigation settlement charge — $48 Add: long-lived asset impairment charges — $30 Adjusted EBITDA $414 $356

ADJUSTED DEBT RECONCILED TO GAAP DEBT $ Millions December 31, 2015 December 31, 2014 Total short-term and long-term Debt – GAAP $2,175 $2,195 Operating leases $217 $237 Postretirement benefit obligations $265 $333 Asset retirement obligations $77 $80 Accrued interest not included in reported debt $45 $44 Workers compensation/self insurance $16 $14 Excess cash ($504) ($287) Total adjustments1 $116 $421 Adjusted Debt $2,291 $2,616
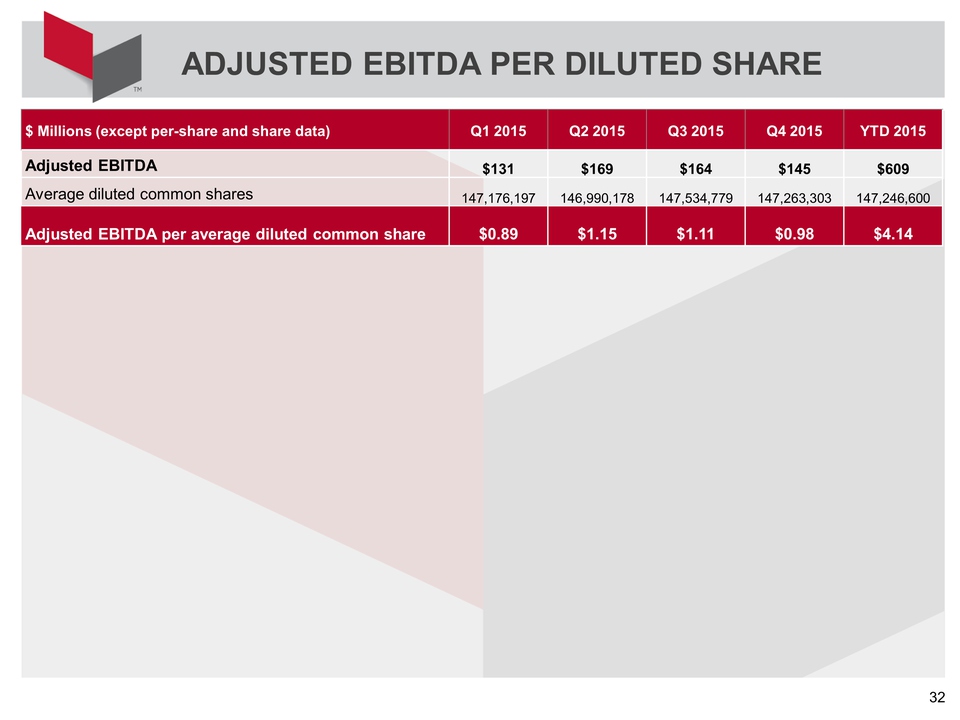
ADJUSTED EBITDA PER DILUTED SHARE $ Millions (except per-share and share data) Q1 2015 Q2 2015 Q3 2015 Q4 2015 YTD 2015 Adjusted EBITDA $131 $169 $164 $145 $609 Average diluted common shares 147,176,197 146,990,178 147,534,779 147,263,303 147,246,600 Adjusted EBITDA per average diluted common share $0.89 $1.15 $1.11 $0.98 $4.14
USG’s Stockholder Rights Plan and Protective Amendment restricts beneficial ownership in excess of 4.9% We have a stockholder rights plan, or the Rights Plan, established under the terms of a rights agreement dated December 21, 2006, as amended, with Computershare Trust Company N.A., as Rights Agent, or the Rights Agreement. The Rights Plan was initially intended to protect our stockholders from coercive takeover practices or takeover bids that are inconsistent with their best interests. However, in 2013 and 2015, the Board adopted amendments to the Rights Agreement, discussed below, intended to protect our substantial NOL carryforwards and related tax benefits. The Board also recommended, and on May 9, 2013 our stockholders approved, an amendment to our Restated Certificate of Incorporation, or the Protective Amendment, also intended to protect our NOL carryforwards and related tax benefits. On March 22, 2013, our board of directors approved an amendment to the Rights Agreement in an effort to protect our NOL carryforwards and related tax benefits. Our ability to use our NOLs could be substantially reduced if we experience an “ownership change,” as defined under Section 382 of the Internal Revenue Code of 1986, as amended (the "Code"), and the Rights Agreement has been designed to prevent such an “ownership change.” “Ownership changes” generally relate to the cumulative change in ownership among stockholders with an ownership interest of 5% or more (as determined under the Code’s rules) over a rolling three-year period. Our stockholders ratified, on an advisory basis, the March 22, 2013 amendment to our Rights Agreement at our 2013 annual meeting of stockholders. The Rights Agreement, as amended, provides that if any person becomes the beneficial owner of 4.9% or more of our common stock, stockholders other than the 4.9% triggering stockholder will have the right to purchase additional shares of our common stock at half the market price, thereby diluting the triggering stockholder; provided that stockholders whose beneficial ownership, as defined in Section 383 of the Code, exceeded 4.9% of our common stock outstanding on February 11, 2015 will not be deemed to have triggered the Rights Agreement, as amended, so long as they do not thereafter acquire additional common stock other than in certain specified exempt transactions. The Board approved an amendment to the Rights Agreement in February 2015 to align the definition of “Beneficial Owner” and “Beneficially Own” with Section 382 of the Code. The NOL protective provisions in the Rights Agreement adopted in 2013 were scheduled to expire on March 22, 2016 and the Rights Agreement was scheduled to expire on January 2, 2017. In connection with a required triennial review of the Rights Agreement, the Board approved, and on November 16, 2015 the Company entered into, another amendment to the Rights Agreement to extend the term of the Rights Agreement, as well as the NOL protective provisions adopted in 2013, to May 31, 2019, subject to other earlier termination events as described therein. Accordingly, the 4.9% threshold described above is now effective until the earlier of (i) May 31, 2019, (ii) the date on which our Board determines that the amendment is no longer necessary for the provision of certain tax benefits because of the repeal of Section 382 of the Code, (iii) the first day of a taxable year as to which our Board determines that no tax benefits may be carried forward, or (iv) such other date as our Board determines that the amendment is no longer necessary for the preservation of tax benefits. The rights issued pursuant to the Rights Agreement will expire on May 31, 2019. However, our Board has the power to accelerate or extend the expiration date of the rights. In addition, a board committee composed solely of independent directors reviews the Rights Agreement at least once every three years to determine whether to modify the Rights Plan in light of all relevant factors. This review was most recently conducted in November 2015. The next review is required by the end of 2018. On May 9, 2013, we filed an amendment to our Restated Certificate of Incorporation, or the Protective Amendment, that restricts certain transfers of our common stock. The Protective Amendment is intended to protect the tax benefits of our NOL carryforwards. Subject to certain limited exceptions, the Protective Amendment's transfer restrictions restrict any person from transferring our common stock (or any interest in our common stock) if the transfer would result in a stockholder (or several stockholders, in the aggregate, who hold their stock as a “group” under Section 382 of the Code) owning 4.9% or more of our common stock. Any direct or indirect transfer attempted in violation of the Protective Amendment would be void as of the date of the prohibited transfer as to the purported transferee, and the purported transferee would not be recognized as the owner of the shares attempted to be owned in violation of the Protective Amendment for any purpose, including for purposes of voting and receiving dividends or other distributions in respect of that common stock, or in the case of options, receiving our common stock in respect of their exercise. The Protective Amendment is effective until the earlier of (i) May 9, 2016, (ii) the repeal of Section 382 of the Code if our board of directors determines that the Protective Amendment is no longer necessary for the preservation of tax benefits, (iii) the first day of a taxable year as to which our board of directors determines that no tax benefits may be carried forward, or (iv) such other date as determined by our board of directors pursuant to the Protective Amendment. On November 12, 2015, our board of directors also recommended that stockholders vote to extend the Protective Amendment until May 31, 2019 (subject to other earlier termination events as described in the Protective Amendment). Pursuant to a Shareholder's Agreement reached in 2006, Berkshire Hathaway and certain of its affiliates may acquire beneficial ownership of up to 50% of our voting stock on a fully-diluted basis without triggering the ownership thresholds in the Protective Amendment or Rights Agreement, and may acquire beneficial ownership of more than 50% of our voting stock on a fully-diluted basis without triggering the ownership thresholds in the Protective Amendment or Rights Agreement through an offer to purchase all of our common stock that remains open for at least 60 days, in each case subject to specified exceptions. STOCKHOLDER RIGHTS PLAN AND PROTECTIVE AMENDMENT 33