UNITED STATES
SECURITIES AND EXCHANGE COMMISSION
Washington, D.C. 20549
FORM N-CSR
CERTIFIED SHAREHOLDER REPORT OF REGISTERED
MANAGEMENT INVESTMENT COMPANIES
| Investment Company Act file number | 811-04165 | |||||
| AMERICAN CENTURY TARGET MATURITIES TRUST | ||||||
| (Exact name of registrant as specified in charter) | ||||||
| 4500 MAIN STREET, KANSAS CITY, MISSOURI | 64111 | |||||
| (Address of principal executive offices) | (Zip Code) | |||||
CHARLES A. ETHERINGTON 4500 MAIN STREET, KANSAS CITY, MISSOURI 64111 | ||||||
| (Name and address of agent for service) | ||||||
| Registrant’s telephone number, including area code: | 816-531-5575 | |||||
| Date of fiscal year end: | 09-30 | |||||
| Date of reporting period: | 09-30-2018 | |||||
ITEM 1. REPORTS TO STOCKHOLDERS.

| Annual Report | |
| September 30, 2018 | |
| Zero Coupon 2020 Fund | |
| Investor Class (BTTTX) | |
| Advisor Class (ACTEX) | |
| Table of Contents |
| President’s Letter | 2 | |
| Performance | 3 | |
| Portfolio Commentary | ||
| Fund Characteristics | ||
| Shareholder Fee Example | ||
| Schedule of Investments | ||
| Statement of Assets and Liabilities | ||
| Statement of Operations | ||
| Statement of Changes in Net Assets | ||
| Notes to Financial Statements | ||
| Financial Highlights | ||
| Report of Independent Registered Public Accounting Firm | ||
| Management | ||
| Approval of Management Agreement | ||
| Additional Information | ||
Any opinions expressed in this report reflect those of the author as of the date of the report, and do not necessarily represent the opinions of American Century Investments® or any other person in the American Century Investments organization. Any such opinions are subject to change at any time based upon market or other conditions and American Century Investments disclaims any responsibility to update such opinions. These opinions may not be relied upon as investment advice and, because investment decisions made by American Century Investments funds are based on numerous factors, may not be relied upon as an indication of trading intent on behalf of any American Century Investments fund. Security examples are used for representational purposes only and are not intended as recommendations to purchase or sell securities. Performance information for comparative indices and securities is provided to American Century Investments by third party vendors. To the best of American Century Investments’ knowledge, such information is accurate at the time of printing.
| President’s Letter |
 Jonathan Thomas
Dear Investor:
Thank you for reviewing this annual report for the 12 months ended September 30, 2018. Annual reports help convey important information about fund returns, including market factors that affected performance during the reporting period. For additional, updated investment and market insights, we encourage you to visit our website, americancentury.com.
Treasury Yields Climbed to Multiyear Highs on Economic Strength
U.S. Treasury investors faced an increasingly challenging backdrop as the 12-month period unfolded. Early on, Treasury yields moved slightly higher amid modest economic gains and the Federal Reserve’s (Fed’s) continued approach to gradually normalizing short-term interest rates.
In early 2018, the landscape turned dramatically different. Volatility, a force that remained relatively dormant during 2017, re-emerged with a vengeance. A batch of better-than-expected economic data triggered expectations for rising inflation, higher interest rates, and a more-hawkish Fed. On the political front, President Trump’s administration announced a series of tariffs that fueled fears of a global trade war and contributed to broad global market unrest. In response to the improving economic data, U.S. Treasury yields rocketed to their highest levels in several years. Meanwhile, upbeat growth, employment, and inflation data prompted the Fed to boost its rate-hike outlook for 2018 from three hikes to potentially four.
After reaching multiyear highs in May, Treasury yields eased somewhat and generally stabilized. Concerns about tariffs and other geopolitical issues sparked a flight to quality, causing Treasury yields to retreat from their earlier highs. At the same time, core inflation held steady near the Fed’s target level of 2%. But, as economic data continued to gather momentum, Treasury yields spiked again in September. Additionally, the Fed implemented its third rate hike of the year and appeared likely to repeat that move in December. The benchmark 10-year Treasury yield climbed back to its May high, closing the period at 3.06%.
Looking ahead, fixed-income investors may continue to face a backdrop of solid economic growth and higher interest rates. We believe this scenario warrants a disciplined, diversified, and risk-aware approach, using professionally managed portfolios in pursuit of investment goals. We appreciate your continued trust and confidence in us.
Sincerely,

Jonathan Thomas
President and Chief Executive Officer
American Century Investments
2
| Performance |
| Total Returns as of September 30, 2018 | |||||
| Average Annual Returns | |||||
Ticker Symbol | 1 year | 5 years | 10 years | Inception Date | |
| Investor Class | BTTTX | -1.04% | 1.59% | 4.48% | 12/29/89 |
| 11/15/2020 STRIPS Issue | — | -0.85% | 1.81% | 5.04% | — |
| ICE BofAML 10+ Year U.S. Treasury Index | — | -3.57% | 4.31% | 5.36% | — |
| Advisor Class | ACTEX | -1.29% | 1.34% | 4.22% | 10/19/98 |
| Growth of $10,000 Over 10 Years |
| $10,000 investment made September 30, 2008 |
| Performance for other share classes will vary due to differences in fee structure. |
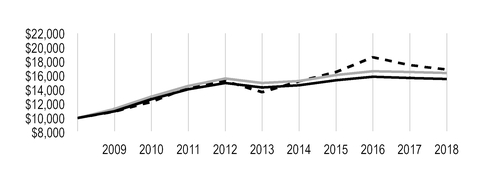
| Value on September 30, 2018 | |
| Investor Class — $15,509 | |
| 11/15/2020 STRIPS Issue — $16,357 | |
| ICE BofAML 10+ Year U.S. Treasury Index — $16,863 | |
| Total Annual Fund Operating Expenses | |
| Investor Class | Advisor Class |
| 0.55% | 0.80% |
The total annual fund operating expenses shown is as stated in the fund’s prospectus current as of the date of this report. The prospectus may vary from the expense ratio shown elsewhere in this report because it is based on a different time period, includes acquired fund fees and expenses, and, if applicable, does not include fee waivers or expense reimbursements.
Data presented reflect past performance. Past performance is no guarantee of future results. Current performance may be higher or lower than the performance shown. Total returns for periods less than one year are not annualized. Investment return and principal value will fluctuate, and redemption value may be more or less than original cost. Data assumes reinvestment of dividends and capital gains, and none of the charts reflect the deduction of taxes that a shareholder would pay on fund distributions or the redemption of fund shares. To obtain performance data current to the most recent month end, please call 1-800-345-2021 or visit americancentury.com. For additional information about the fund, please consult the prospectus.
3
| Portfolio Commentary |
Portfolio Managers: Brian Howell, Jim Platz, Bob Gahagan, and Miguel Castillo
Performance Summary
Zero Coupon 2020 declined -1.04%* for the 12 months ended September 30, 2018. The portfolio’s benchmark, a coupon-based Treasury STRIPS issue maturing on November 15, 2020, declined -0.85%.
U.S. Treasury yields increased for the 12-month period, which primarily accounted for the negative absolute performance of the portfolio and the Treasury STRIPS issue. From a relative performance perspective, operating expenses reduce portfolio returns; operating expenses do not apply to benchmark returns.
In the rising-rate environment, short-maturity government securities generally outperformed those with longer maturities. Overall, modest spread tightening (a decrease in yield differences) between Treasury STRIPS and non-Treasury zero-coupon bonds (zeros) aided portfolio performance.
Market Backdrop
Against a backdrop of Federal Reserve (Fed) tightening, improving economic growth, and modest inflation, U.S. Treasury yields headed higher across the yield curve. The upward march gained momentum in early 2018, as investors reacted to better-than-expected economic data. Specifically, in February, U.S. wage growth accelerated to a nearly nine-year high. Investors feared rising wages, combined with the anticipated growth effects of recently enacted federal tax reform, would trigger higher inflation and rising interest rates. This caused Treasury yields to increase sharply.
As the period progressed, the U.S. economy continued to exhibit solid growth. Annualized gross domestic product jumped from 2.2% in the first quarter of 2018 to 4.2% in the second quarter, its strongest pace in four years. Core inflation edged higher and finally reached the Fed’s 2% target. In addition, the U.S. unemployment rate continued to trend lower, while wages continued to edge higher. In May, the 10-year Treasury yield surged above 3% for the first time in more than four years. In June, after raising the federal funds rate target for the second time in 2018 (the first time was in March), the Fed took a more-hawkish tone. The central bank stated that economic conditions could warrant a total of four rate hikes in 2018, one more than it previously forecasted.
After topping 3% in May, longer-maturity Treasury yields eased and generally stabilized through the summer. But another upward spike occurred in September. Economic growth remained robust, and the Fed raised rates again and maintained its fairly hawkish outlook. By the end of the month, the yield on the 10-year Treasury note climbed back to its May high of 3.06%, compared with 2.33% at the end of September 2017. Meanwhile, Fed tightening and expectations for future rate hikes helped drive the yield on the two-year Treasury note to 2.82%, compared with 1.49% a year earlier. In terms of total return, the broad U.S. Treasury market declined -1.62% for the 12-month period. The two-year Treasury note returned -0.21%, while the 10-year Treasury note returned -3.97%.
* All fund returns referenced in this commentary are for Investor Class shares. Performance for other share classes will vary due to differences in fee structures; when Investor Class performance exceeds that of the fund’s benchmark, other share classes may not. Please see page 3 for returns for all share classes.
4
Portfolio Strategy
We continued to look for what we believed were attractive relative values among Treasury STRIPS, Treasury-equivalent zeros, and, to a lesser degree, government agency zeros. These securities
are “stripped” and packaged into their component parts, including the series of coupon payments
and the ultimate principal repayment.
We seek to take advantage of spread movements between Treasury STRIPS and non-Treasury zeros. Spreads began the reporting period at relatively tight levels, leaving room for only slight narrowing during the period, driven largely by investor demand for Treasury-equivalent securities. Against this backdrop, our positions in Treasury-equivalent zeros (primarily Resolution Funding Corporation, or REFCORP, STRIPS) and government agency zeros appreciated modestly and aided relative performance.
We continue to believe our non-Treasury zeros offer attractive return potential, and we expect these securities will have a favorable impact on the portfolio’s Anticipated Value at Maturity (AVM). Our allocation to Treasury STRIPS, REFCORP STRIPS, and other Treasury equivalents represented approximately 89% of the portfolio at the end of the reporting period, compared with 90% a year earlier. By prospectus mandate, we also may invest up to 20% of the portfolio’s assets in government agency zero-coupon bonds. Our allocation to government agency zeros at the end of September 2018 was approximately 11%, compared with 9% at the end of September 2017.
Outlook
We believe the Fed will continue to normalize monetary policy, which will continue to put upward rate pressure on the short-maturity end of the Treasury yield curve. On the longer-maturity end of the curve, we believe interest rates are likely to slowly climb higher amid a climate of solid, above-trend economic growth.
We believe demand for high-credit-quality spread securities will remain firm, which likely will keep spreads tight. With the fund managed to mature in 2020, we expect to gradually increase liquidity in the portfolio by boosting our position in Treasury STRIPS.
Zero Coupon 2020 is not an asset allocation retirement fund. The date refers to when the bonds will mature. The principal value of the fund is not guaranteed at any time, including at the target date. The fund’s AVM (see next page), though not guaranteed, provides what we believe is an appropriate estimate of the fund’s value at the target date.
5
| Fund Characteristics |
| SEPTEMBER 30, 2018 | |
| Portfolio at a Glance | |
| Anticipated Annual Growth Rate (Investor Class) | 2.35% |
| Weighted Average Maturity Date | 10/9/20 |
Anticipated Value at Maturity (AVM) (Investor Class)(1) | $108.13 |
| (1) See graph below. | |
| Past performance is no guarantee of future results. Even if class shares are held to maturity, there is no guarantee that the class’s share price will reach its AVM. There is also no guarantee that the AVM will fluctuate as little in the future as it has in the past. For more information, please consult the prospectus. | |
| Types of Investments in Portfolio | % of net assets |
| Treasury STRIPS | 45.4% |
| REFCORP STRIPS | 42.6% |
| Other Treasuries | 0.8% |
| Total Treasuries and Equivalents | 88.8% |
| Government Agency STRIPS | 6.1% |
| Other Government Agencies | 4.9% |
| Temporary Cash Investments | 0.3% |
| Other Assets and Liabilities | (0.1)% |
| Share Price vs. Anticipated Value at Maturity (Investor Class) | |
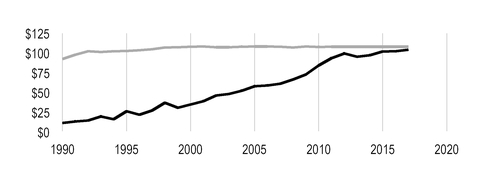
| Actual Share Price (Historical) — $103.11 | |
| Anticipated Value at Maturity (Estimated Share Price) — $108.13 | |
The top line in the graph represents the class’s AVM, which fluctuates from day to day based on the fund’s weighted average maturity date. The bottom line represents the class’s historical share price, which is managed to grow over time to reach the class’s AVM. The AVM for other share classes will vary due to differences in fee structure. While this graph demonstrates the class’s expected long-term growth pattern, please keep in mind that the fund may experience significant share-price volatility over the short term. Even if shares are held to maturity, there is no guarantee that the class’s share price will reach its AVM. There is also no guarantee that the AVM will fluctuate as little in the future as it has in the past.
6
| Shareholder Fee Example |
Fund shareholders may incur two types of costs: (1) transaction costs, including sales charges (loads) on purchase payments and redemption/exchange fees; and (2) ongoing costs, including management fees; distribution and service (12b-1) fees; and other fund expenses. This example is intended to help you understand your ongoing costs (in dollars) of investing in your fund and to compare these costs with the ongoing cost of investing in other mutual funds.
The example is based on an investment of $1,000 made at the beginning of the period and held for the entire period from April 1, 2018 to September 30, 2018.
Actual Expenses
The table provides information about actual account values and actual expenses for each class. You may use the information, together with the amount you invested, to estimate the expenses that you paid over the period. First, identify the share class you own. Then simply divide your account value by $1,000 (for example, an $8,600 account value divided by $1,000 = 8.6), then multiply the result by the number under the heading “Expenses Paid During Period” to estimate the expenses you paid on your account during this period.
If you hold Investor Class shares of any American Century Investments fund, or I Class shares of the American Century Diversified Bond Fund, in an American Century Investments account (i.e., not a financial intermediary or retirement plan account), American Century Investments may charge you a $12.50 semiannual account maintenance fee if the value of those shares is less than $10,000. We will redeem shares automatically in one of your accounts to pay the $12.50 fee. In determining your total eligible investment amount, we will include your investments in all personal accounts (including American Century Investments Brokerage accounts) registered under your Social Security number. Personal accounts include individual accounts, joint accounts, UGMA/UTMA accounts, personal trusts, Coverdell Education Savings Accounts and IRAs (including traditional, Roth, Rollover, SEP-, SARSEP- and SIMPLE-IRAs), and certain other retirement accounts. If you have only business, business retirement, employer-sponsored or American Century Investments Brokerage accounts, you are currently not subject to this fee. If you are subject to the Account Maintenance Fee, your account value could be reduced by the fee amount.
Hypothetical Example for Comparison Purposes
The table also provides information about hypothetical account values and hypothetical expenses based on the actual expense ratio of each class of your fund and an assumed rate of return of 5% per year before expenses, which is not the actual return of a fund’s share class. The hypothetical account values and expenses may not be used to estimate the actual ending account balance or expenses you paid for the period. You may use this information to compare the ongoing costs of investing in your fund and other funds. To do so, compare this 5% hypothetical example with the 5% hypothetical examples that appear in the shareholder reports of the other funds.
Please note that the expenses shown in the table are meant to highlight your ongoing costs only and do not reflect any transactional costs, such as sales charges (loads) or redemption/exchange fees. Therefore, the table is useful in comparing ongoing costs only, and will not help you determine the relative total costs of owning different funds. In addition, if these transactional costs were included, your costs would have been higher.
7
| Beginning Account Value 4/1/18 | Ending Account Value 9/30/18 | Expenses Paid During Period(1) 4/1/18 - 9/30/18 | Annualized Expense Ratio(1) | |
| Actual | ||||
| Investor Class | $1,000 | $1,000.20 | $2.76 | 0.55% |
| Advisor Class | $1,000 | $999.00 | $4.01 | 0.80% |
| Hypothetical | ||||
| Investor Class | $1,000 | $1,022.31 | $2.79 | 0.55% |
| Advisor Class | $1,000 | $1,021.06 | $4.05 | 0.80% |
| (1) | Expenses are equal to the class's annualized expense ratio listed in the table above, multiplied by the average account value over the period, multiplied by 183, the number of days in the most recent fiscal half-year, divided by 365, to reflect the one-half year period. Annualized expense ratio reflects actual expenses, including any applicable fee waivers or expense reimbursements and excluding any acquired fund fees and expenses. |
8
| Schedule of Investments |
SEPTEMBER 30, 2018
Principal Amount /Shares | Value | |||||
ZERO-COUPON U.S. TREASURY SECURITIES AND EQUIVALENTS(1) — 88.8% | ||||||
| Federal Judiciary, 0.00%, 2/15/19 | $ | 306,000 | $ | 302,955 | ||
| Federal Judiciary, 0.00%, 8/15/19 | 339,000 | 330,585 | ||||
| REFCORP STRIPS - PRINCIPAL, 0.00%, 10/15/19 | 6,788,000 | 6,598,291 | ||||
| AID (Israel), 0.00%, 5/15/20 | 396,000 | 377,585 | ||||
| REFCORP STRIPS - COUPON, 0.00%, 7/15/20 | 12,348,000 | 11,737,318 | ||||
| REFCORP STRIPS - PRINCIPAL, 0.00%, 7/15/20 | 26,144,000 | 24,849,583 | ||||
| Federal Judiciary, 0.00%, 8/15/20 | 115,000 | 108,796 | ||||
| STRIPS - PRINCIPAL, 0.00%, 8/15/20 | 5,200,000 | 4,934,436 | ||||
| REFCORP STRIPS - PRINCIPAL, 0.00%, 10/15/20 | 11,000,000 | 10,364,235 | ||||
| STRIPS - COUPON, 0.00%, 11/15/20 | 58,000,000 | 54,572,467 | ||||
| REFCORP STRIPS - PRINCIPAL, 0.00%, 1/15/21 | 9,000,000 | 8,424,621 | ||||
| Federal Judiciary, 0.00%, 2/15/21 | 110,000 | 102,329 | ||||
| STRIPS - COUPON, 0.00%, 2/15/21 | 5,100,000 | 4,766,112 | ||||
| STRIPS - PRINCIPAL, 0.00%, 2/15/21 | 500,000 | 467,565 | ||||
| STRIPS - COUPON, 0.00%, 5/15/21 | 1,500,000 | 1,390,508 | ||||
TOTAL ZERO-COUPON U.S. TREASURY SECURITIES AND EQUIVALENTS (Cost $124,925,547) | 129,327,386 | |||||
ZERO-COUPON U.S. GOVERNMENT AGENCY SECURITIES(1) — 11.0% | ||||||
| TVA STRIPS - COUPON, 0.00%, 5/1/19 | 11,000 | 10,817 | ||||
| TVA STRIPS - COUPON, 0.00%, 11/1/19 | 9,000 | 8,719 | ||||
| FNMA STRIPS - COUPON, 0.00%, 7/15/20 | 3,911,000 | 3,714,811 | ||||
| Government Trust Certificate, 0.00%, 4/1/21 | 7,683,000 | 7,124,462 | ||||
| FHLMC STRIPS - COUPON, 0.00%, 9/15/21 | 5,595,000 | 5,111,512 | ||||
TOTAL ZERO-COUPON U.S. GOVERNMENT AGENCY SECURITIES (Cost $15,044,462) | 15,970,321 | |||||
| TEMPORARY CASH INVESTMENTS — 0.3% | ||||||
Federal Home Loan Bank Discount Notes, 2.04%, 10/1/18(2) | 417,000 | 417,000 | ||||
| State Street Institutional U.S. Government Money Market Fund, Premier Class | 411 | 411 | ||||
TOTAL TEMPORARY CASH INVESTMENTS (Cost $417,411) | 417,411 | |||||
TOTAL INVESTMENT SECURITIES — 100.1% (Cost $140,387,420) | 145,715,118 | |||||
| OTHER ASSETS AND LIABILITIES — (0.1)% | (146,907 | ) | ||||
| TOTAL NET ASSETS — 100.0% | $ | 145,568,211 | ||||
9
| NOTES TO SCHEDULE OF INVESTMENTS | ||
| AID | - | Agency for International Development |
| Equivalent | - | Security whose payments are secured by the U.S. Treasury |
| FHLMC | - | Federal Home Loan Mortgage Corporation |
| FNMA | - | Federal National Mortgage Association |
| REFCORP | - | Resolution Funding Corporation |
| STRIPS | - | Separate Trading of Registered Interest and Principal of Securities |
| TVA | - | Tennessee Valley Authority |
| (1) | Security is a zero-coupon bond. Zero-coupon securities are issued at a substantial discount from their value at maturity. |
| (2) | The rate indicated is the yield to maturity at purchase. |
See Notes to Financial Statements.
10
| Statement of Assets and Liabilities |
| SEPTEMBER 30, 2018 | |||
| Assets | |||
| Investment securities, at value (cost of $140,387,420) | $ | 145,715,118 | |
| Receivable for capital shares sold | 4,095 | ||
| 145,719,213 | |||
| Liabilities | |||
| Payable for capital shares redeemed | 85,505 | ||
| Accrued management fees | 65,014 | ||
| Distribution and service fees payable | 483 | ||
| 151,002 | |||
| Net Assets | $ | 145,568,211 | |
| Net Assets Consist of: | |||
| Capital paid in | $ | 136,348,547 | |
| Distributable earnings | 9,219,664 | ||
| $ | 145,568,211 | ||
| Net Assets | Shares Outstanding | Net Asset Value Per Share | ||||||
| Investor Class | $143,213,770 | 1,388,937 | $103.11 | |||||
| Advisor Class | $2,354,441 | 23,981 | $98.18 | |||||
See Notes to Financial Statements.
11
| Statement of Operations |
| YEAR ENDED SEPTEMBER 30, 2018 | |||
| Investment Income (Loss) | |||
| Income: | |||
| Interest | $ | 6,784,398 | |
| Expenses: | |||
| Management fees | 857,254 | ||
| Distribution and service fees - Advisor Class | 6,926 | ||
| Trustees' fees and expenses | 9,876 | ||
| Other expenses | 165 | ||
| 874,221 | |||
| Net investment income (loss) | 5,910,177 | ||
| Realized and Unrealized Gain (Loss) | |||
| Net realized gain (loss) on investment transactions | (215,060 | ) | |
| Change in net unrealized appreciation (depreciation) on investments | (7,461,493 | ) | |
| Net realized and unrealized gain (loss) | (7,676,553 | ) | |
| Net Increase (Decrease) in Net Assets Resulting from Operations | $ | (1,766,376 | ) |
See Notes to Financial Statements.
12
| Statement of Changes in Net Assets |
| YEARS ENDED SEPTEMBER 30, 2018 AND SEPTEMBER 30, 2017 | ||||||
| Increase (Decrease) in Net Assets | September 30, 2018 | September 30, 2017 | ||||
| Operations | ||||||
| Net investment income (loss) | $ | 5,910,177 | $ | 5,944,744 | ||
| Net realized gain (loss) | (215,060) | 716,003 | ||||
| Change in net unrealized appreciation (depreciation) | (7,461,493) | (8,903,539) | ||||
| Net increase (decrease) in net assets resulting from operations | (1,766,376) | (2,242,792) | ||||
| Distributions to Shareholders | ||||||
From earnings:(1) | ||||||
| Investor Class | (6,216,231) | (10,780,510) | ||||
| Advisor Class | (109,214) | (384,341) | ||||
| Decrease in net assets from distributions | (6,325,445) | (11,164,851) | ||||
| Capital Share Transactions | ||||||
| Net increase (decrease) in net assets from capital share transactions (Note 5) | (20,015,429 | ) | (8,677,966 | ) | ||
| Net increase (decrease) in net assets | (28,107,250) | (22,085,609) | ||||
| Net Assets | ||||||
| Beginning of period | 173,675,461 | 195,761,070 | ||||
| End of period | $ | 145,568,211 | $ | 173,675,461 | ||
| (1) | Prior period presentation has been updated to reflect the current period combination of distributions to shareholders from net investment income and net realized gains. Distributions from net investment income were $(5,374,843) and $(183,456) for Investor Class and Advisor Class, respectively. Distributions from net realized gains were $(5,405,667) and $(200,885) for Investor Class and Advisor Class, respectively. |
See Notes to Financial Statements.
13
| Notes to Financial Statements |
SEPTEMBER 30, 2018
1. Organization
American Century Target Maturities Trust (the trust) is registered under the Investment Company Act of 1940, as amended (the 1940 Act), as an open-end management investment company and is organized as a Massachusetts business trust. Zero Coupon 2020 Fund (the fund) is one fund in a series issued by the trust. The fund’s investment objective is to seek the highest return consistent with investment in U.S. Treasury securities. The fund is managed to mature in the year identified in its name and will be liquidated near the end of its maturity year. The fund offers the Investor Class and Advisor Class.
2. Significant Accounting Policies
The following is a summary of significant accounting policies consistently followed by the fund in preparation of its financial statements. The fund is an investment company and follows accounting and reporting guidance in accordance with accounting principles generally accepted in the United States of America. This may require management to make certain estimates and assumptions at the date of the financial statements. Actual results could differ from these estimates. Management evaluated the impact of events or transactions occurring through the date the financial statements were issued that would merit recognition or disclosure.
Investment Valuations — The fund determines the fair value of its investments and computes its net asset value per share at the close of regular trading (usually 4 p.m. Eastern time) on the New York Stock Exchange (NYSE) on each day the NYSE is open. The Board of Trustees has adopted valuation policies and procedures to guide the investment advisor in the fund’s investment valuation process and to provide methodologies for the oversight of the fund’s pricing function.
Fixed income securities are valued at the evaluated bid as provided by independent pricing services or at the most recent bid as provided by investment dealers. U.S. Treasury and Government Agency securities are valued using market models that consider trade data, quotations from dealers and active market makers, relevant yield curve and spread data, creditworthiness, trade data or market information on comparable securities, and other relevant security specific information.
Open-end management investment companies are valued at the reported net asset value per share.
If the fund determines that the market price for an investment is not readily available or the valuation methods mentioned above do not reflect an investment’s fair value, such investment is valued as determined in good faith by the Board of Trustees or its delegate, in accordance with policies and procedures adopted by the Board of Trustees. In its determination of fair value, the fund may review several factors including, but not limited to, market information regarding the specific investment or comparable investments and correlation with other investment types, futures indices or general market indicators. Circumstances that may cause the fund to use these procedures to value an investment include, but are not limited to: an investment has been declared in default or is distressed; trading in a security has been suspended during the trading day or a security is not actively trading on its principal exchange; prices received from a regular pricing source are deemed unreliable; or there is a foreign market holiday and no trading occurred.
The fund monitors for significant events occurring after the close of an investment’s primary exchange but before the fund’s net asset value per share is determined. Significant events may include, but are not limited to: corporate announcements and transactions; governmental action and political unrest that could impact a specific investment or an investment sector; or armed conflicts, natural disasters and similar events that could affect investments in a specific country or region.
Security Transactions — Security transactions are accounted for as of the trade date. Net realized gains and losses are determined on the identified cost basis, which is also used for federal income tax purposes.
Investment Income — Interest income is recorded on the accrual basis and includes accretion of discounts.
Income Tax Status — It is the fund’s policy to distribute substantially all net investment income and net realized gains to shareholders and to otherwise qualify as a regulated investment company under provisions of the Internal Revenue Code. Accordingly, no provision has been made for income taxes. The fund files U.S.
14
federal, state, local and non-U.S. tax returns as applicable. The fund's tax returns are subject to examination by the relevant taxing authority until expiration of the applicable statute of limitations, which is generally three years from the date of filing but can be longer in certain jurisdictions. At this time, management believes there are no uncertain tax positions which, based on their technical merit, would not be sustained upon examination and for which it is reasonably possible that the total amounts of unrecognized tax benefits will significantly change in the next twelve months.
Multiple Class — All shares of the fund represent an equal pro rata interest in the net assets of the class to which such shares belong, and have identical voting, dividend, liquidation and other rights and the same terms and conditions, except for class specific expenses and exclusive rights to vote on matters affecting only individual classes. Income, non-class specific expenses, and realized and unrealized capital gains and losses of the fund are allocated to each class of shares based on their relative net assets.
Distributions to Shareholders — Distributions from net investment income and net realized gains, if any, are generally declared and paid annually.
Reverse Share Splits — When the fund pays a distribution, the trustees declare a reverse share split that exactly offsets the per-share amount of the distribution. After taking into account the reverse share split, a shareholder reinvesting dividends and capital gain distributions will hold exactly the same number of shares owned prior to the distribution and reverse share split. A shareholder electing to receive dividends in cash will own fewer shares.
Indemnifications — Under the trust’s organizational documents, its officers and trustees are indemnified against certain liabilities arising out of the performance of their duties to the fund. In addition, in the normal course of business, the fund enters into contracts that provide general indemnifications. The maximum exposure under these arrangements is unknown as this would involve future claims that may be made against a fund. The risk of material loss from such claims is considered by management to be remote.
3. Fees and Transactions with Related Parties
Certain officers and trustees of the trust are also officers and/or directors of American Century Companies, Inc. (ACC). The trust’s investment advisor, American Century Investment Management, Inc. (ACIM), the trust’s distributor, American Century Investment Services, Inc. (ACIS), and the trust’s transfer agent, American Century Services, LLC, are wholly owned, directly or indirectly, by ACC.
Management Fees — The trust has entered into a management agreement with ACIM, under which ACIM provides the fund with investment advisory and management services in exchange for a single, unified management fee (the fee) per class. The agreement provides that all expenses of managing and operating the fund, except distribution and service fees, brokerage expenses, taxes, interest, fees and expenses of the independent trustees (including legal counsel fees), and extraordinary expenses, will be paid by ACIM. The fee is computed and accrued daily based on each class's daily net assets and paid monthly in arrears. The fee consists of (1) an Investment Category Fee based on the daily net assets of the fund and certain other accounts managed by the investment advisor that are in the same broad investment category as the fund and (2) a Complex Fee based on the assets of all the funds in the American Century Investments family of funds. The rates for the Investment Category Fee range from 0.2425% to 0.3600% and the rates for the Complex Fee range from 0.2500% to 0.3100%. The effective annual management fee for each class for the period ended September 30, 2018 was 0.54%.
Distribution and Service Fees — The Board of Trustees has adopted a separate Master Distribution and Individual Shareholder Services Plan for the Advisor Class (the plan), pursuant to Rule 12b-1 of the 1940 Act. The plan provides that the Advisor Class will pay ACIS an annual distribution and service fee of 0.25%. The fees are computed and accrued daily based on the Advisor Class’s daily net assets and paid monthly in arrears. The fees are used to pay financial intermediaries for distribution and individual shareholder services. Fees incurred under the plan during the period ended September 30, 2018 are detailed in the Statement of Operations.
Trustees’ Fees and Expenses — The Board of Trustees is responsible for overseeing the investment advisor’s management and operations of the fund. The trustees receive detailed information about the fund and its investment advisor regularly throughout the year, and meet at least quarterly with management of the investment advisor to review reports about fund operations. The fund’s officers do not receive compensation from the fund.
15
Interfund Transactions — The fund may enter into security transactions with other American Century Investments funds and other client accounts of the investment advisor, in accordance with the 1940 Act rules and procedures adopted by the Board of Trustees. The rules and procedures require, among other things, that these transactions be effected at the independent current market price of the security. There were no interfund transactions during the period.
4. Investment Transactions
Purchases and sales of investment securities, excluding short-term investments, for the period ended September 30, 2018 were $7,606,303 and $34,441,035, respectively, all of which are U.S. Treasury and Government Agency obligations.
5. Capital Share Transactions
Transactions in shares of the fund were as follows (unlimited number of shares authorized):
| Year ended September 30, 2018 | Year ended September 30, 2017 | |||||||||
| Shares | Amount | Shares | Amount | |||||||
| Investor Class | ||||||||||
| Sold | 209,613 | $ | 21,665,790 | 332,056 | $ | 34,541,328 | ||||
| Issued in reinvestment of distributions | 57,380 | 5,735,178 | 107,171 | 10,351,652 | ||||||
| Redeemed | (450,381 | ) | (46,532,609 | ) | (496,371 | ) | (51,334,780 | ) | ||
| Reverse share split | (62,019 | ) | — | (111,382 | ) | — | ||||
| (245,407 | ) | (19,131,641 | ) | (168,526 | ) | (6,441,800 | ) | |||
| Advisor Class | ||||||||||
| Sold | 6,690 | 657,674 | 19,465 | 1,915,783 | ||||||
| Issued in reinvestment of distributions | 1,133 | 108,113 | 4,128 | 381,318 | ||||||
| Redeemed | (16,758 | ) | (1,649,575 | ) | (45,903 | ) | (4,533,267 | ) | ||
| Reverse share split | (1,144 | ) | — | (4,159 | ) | — | ||||
| (10,079 | ) | (883,788 | ) | (26,469 | ) | (2,236,166 | ) | |||
| Net increase (decrease) | (255,486 | ) | $ | (20,015,429 | ) | (194,995 | ) | $ | (8,677,966 | ) |
6. Fair Value Measurements
The fund’s investments valuation process is based on several considerations and may use multiple inputs to determine the fair value of the investments held by the fund. In conformity with accounting principles generally accepted in the United States of America, the inputs used to determine a valuation are classified into three broad levels.
| • | Level 1 valuation inputs consist of unadjusted quoted prices in an active market for identical investments. |
| • | Level 2 valuation inputs consist of direct or indirect observable market data (including quoted prices for comparable investments, evaluations of subsequent market events, interest rates, prepayment speeds, credit risk, etc.). These inputs also consist of quoted prices for identical investments initially expressed in local currencies that are adjusted through translation into U.S. dollars. |
| • | Level 3 valuation inputs consist of unobservable data (including a fund’s own assumptions). |
The level classification is based on the lowest level input that is significant to the fair valuation measurement. The valuation inputs are not necessarily an indication of the risks associated with investing in these securities or other financial instruments.
16
The following is a summary of the level classifications as of period end. The Schedule of Investments provides additional information on the fund’s portfolio holdings.
| Level 1 | Level 2 | Level 3 | ||||||
| Assets | ||||||||
| Investment Securities | ||||||||
| Zero-Coupon U.S. Treasury Securities and Equivalents | — | $ | 129,327,386 | — | ||||
| Zero-Coupon U.S. Government Agency Securities | — | 15,970,321 | — | |||||
| Temporary Cash Investments | $ | 411 | 417,000 | — | ||||
| $ | 411 | $ | 145,714,707 | — | ||||
7. Federal Tax Information
The tax character of distributions paid during the years ended September 30, 2018 and September 30, 2017 were as follows:
| 2018 | 2017 | |||||
| Distributions Paid From | ||||||
| Ordinary income | $ | 5,662,380 | $ | 5,998,487 | ||
| Long-term capital gains | $ | 663,065 | $ | 5,166,364 | ||
The book-basis character of distributions made during the year from net investment income or net realized gains may differ from their ultimate characterization for federal income tax purposes. These differences reflect the differing character of certain income items and net realized gains and losses for financial statement and tax purposes, and may result in reclassification among certain capital accounts on the financial statements.
As of period end, the federal tax cost of investments and the components of distributable earnings on a tax-basis were as follows:
| Federal tax cost of investments | $ | 140,613,681 | |
| Gross tax appreciation of investments | $ | 5,338,081 | |
| Gross tax depreciation of investments | (236,644 | ) | |
| Net tax appreciation (depreciation) of investments | $ | 5,101,437 | |
| Undistributed ordinary income | $ | 4,425,503 | |
| Accumulated short-term capital losses | $ | (128,120 | ) |
| Accumulated long-term capital losses | $ | (179,156 | ) |
The difference between book-basis and tax-basis unrealized appreciation (depreciation) is attributable primarily to the tax deferral of losses on wash sales.
Accumulated capital losses represent net capital loss carryovers that may be used to offset future realized capital gains for federal income tax purposes. The capital loss carryovers may be carried forward for an unlimited period. Future capital loss carryover utilization in any given year may be subject to Internal Revenue Code limitations.
8. Recently Issued Accounting Standards
In March 2017, the Financial Accounting Standards Board (FASB) issued Accounting Standards Update No. 2017-08, “Receivables - Nonrefundable Fees and Other Costs (Subtopic 310-20), Premium Amortization on Purchased Callable Debt Securities” (ASU 2017-08). ASU 2017-08 amends the amortization period for certain purchased callable debt securities held at a premium, shortening such period to the earliest call date. The amendments are effective for fiscal years, and interim periods within those fiscal years, beginning after December 15, 2018. Management is currently evaluating the impact that adopting ASU 2017-08 will have on the financial statements.
17
| Financial Highlights |
| For a Share Outstanding Throughout the Years Ended September 30 (except as noted) | ||||||||||||||||
| Per-Share Data | Ratios and Supplemental Data | |||||||||||||||
Income From Investment Operations: | Distributions From: | Ratio to Average Net Assets of: | ||||||||||||||
Net Asset Value, Beginning of Period | Net Investment Income (Loss)(1) | Net Realized and Unrealized Gain (Loss) | Total From Investment Operations | Net Investment Income | Net Realized Gains | Total Distributions | Reverse Share Split | Net Asset Value, End of Period | Total Return(2) | Operating Expenses | Net Investment Income (Loss) | Portfolio Turnover Rate | Net Assets, End of Period (in thousands) | |||
| Investor Class | ||||||||||||||||
| 2018 | $104.19 | 3.86 | (4.94) | (1.08) | (3.37) | (0.39) | (3.76) | 3.76 | $103.11 | (1.04)% | 0.55% | 3.73% | 5% | $143,214 | ||
| 2017 | $105.20 | 3.53 | (4.54) | (1.01) | (3.16) | (3.17) | (6.33) | 6.33 | $104.19 | (0.96)% | 0.55% | 3.40% | 10% | $170,288 | ||
| 2016 | $101.97 | 3.18 | 0.05 | 3.23 | (3.10) | (2.03) | (5.13) | 5.13 | $105.20 | 3.17% | 0.56% | 3.08% | 43% | $189,667 | ||
| 2015 | $97.29 | 3.65 | 1.03 | 4.68 | (3.40) | (2.75) | (6.15) | 6.15 | $101.97 | 4.81% | 0.55% | 3.64% | 39% | $189,734 | ||
| 2014 | $95.27 | 3.45 | (1.43) | 2.02 | (3.47) | (4.15) | (7.62) | 7.62 | $97.29 | 2.12% | 0.55% | 3.60% | 40% | $228,528 | ||
| Advisor Class | ||||||||||||||||
| 2018 | $99.46 | 3.42 | (4.70) | (1.28) | (3.11) | (0.39) | (3.50) | 3.50 | $98.18 | (1.29)% | 0.80% | 3.48% | 5% | $2,354 | ||
| 2017 | $100.68 | 3.11 | (4.33) | (1.22) | (2.90) | (3.17) | (6.07) | 6.07 | $99.46 | (1.20)% | 0.80% | 3.15% | 10% | $3,388 | ||
| 2016 | $97.83 | 2.80 | 0.05 | 2.85 | (2.84) | (2.03) | (4.87) | 4.87 | $100.68 | 2.90% | 0.81% | 2.83% | 43% | $6,094 | ||
| 2015 | $93.57 | 3.28 | 0.98 | 4.26 | (3.15) | (2.75) | (5.90) | 5.90 | $97.83 | 4.56% | 0.80% | 3.39% | 39% | $6,026 | ||
| 2014 | $91.86 | 3.10 | (1.39) | 1.71 | (3.24) | (4.15) | (7.39) | 7.39 | $93.57 | 1.86% | 0.80% | 3.35% | 40% | $6,498 | ||
| Notes to Financial Highlights |
| (1) | Computed using average shares outstanding throughout the period. |
| (2) | Total returns are calculated based on the net asset value of the last business day. Total returns for periods less than one year are not annualized. |
See Notes to Financial Statements.
| Report of Independent Registered Public Accounting Firm |
To the Board of Trustees of American Century Target Maturities Trust and Shareholders of Zero Coupon 2020 Fund:
Opinion on the Financial Statements
We have audited the accompanying statement of assets and liabilities, including the schedule of investments, of Zero Coupon 2020 Fund (one of the funds constituting American Century Target Maturities Trust, referred to hereafter as the “Fund”) as of September 30, 2018, the related statement of operations for the year ended September 30, 2018, the statement of changes in net assets for each of the two years in the period ended September 30, 2018, including the related notes, and the financial highlights for each of the five years in the period ended September 30, 2018 (collectively referred to as the “financial statements”). In our opinion, the financial statements present fairly, in all material respects, the financial position of the Fund as of September 30, 2018, the results of its operations for the year then ended, the changes in its net assets for each of the two years in the period ended September 30, 2018 and the financial highlights for each of the five years in the period ended September 30, 2018 in conformity with accounting principles generally accepted in the United States of America.
Basis for Opinion
These financial statements are the responsibility of the Fund’s management. Our responsibility is to express an opinion on the Fund’s financial statements based on our audits. We are a public accounting firm registered with the Public Company Accounting Oversight Board (United States) (“PCAOB”) and are required to be independent with respect to the Fund in accordance with the U.S. federal securities laws and the applicable rules and regulations of the Securities and Exchange Commission and the PCAOB.
We conducted our audits of these financial statements in accordance with the standards of the PCAOB. Those standards require that we plan and perform the audit to obtain reasonable assurance about whether the financial statements are free of material misstatement, whether due to error or fraud.
Our audits included performing procedures to assess the risks of material misstatement of the financial statements, whether due to error or fraud, and performing procedures that respond to those risks. Such procedures included examining, on a test basis, evidence regarding the amounts and disclosures in the financial statements. Our audits also included evaluating the accounting principles used and significant estimates made by management, as well as evaluating the overall presentation of the financial statements. Our procedures included confirmation of securities owned as of September 30, 2018 by correspondence with the custodian. We believe that our audits provide a reasonable basis for our opinion.
/s/ PricewaterhouseCoopers LLP
Kansas City, Missouri
November 16, 2018
We have served as the auditor of one or more investment companies in American Century Investments since 1997.
19
| Management |
Board of Trustees
The individuals listed below serve as trustees of the funds. Each trustee will continue to serve in this capacity until death, retirement, resignation or removal from office. The board has adopted a mandatory retirement age for trustees who are not “interested persons,” as that term is defined in the Investment Company Act (independent trustees). Independent trustees shall retire on December 31 of the year in which they reach their 75th birthday; provided, however, that on or after January 1, 2022, independent trustees shall retire on December 31 of the year in which they reach their 76th birthday.
Mr. Thomas is an “interested person” because he currently serves as President and Chief Executive Officer of American Century Companies, Inc. (ACC), the parent company of American Century Investment Management, Inc. (ACIM or the advisor). The other trustees (more than three-fourths of the total number) are independent. They are not employees, directors or officers of, and have no financial interest in, ACC or any of its wholly owned, direct or indirect, subsidiaries, including ACIM, American Century Investment Services, Inc. (ACIS) and American Century Services, LLC (ACS), and they do not have any other affiliations, positions or relationships that would cause them to be considered “interested persons” under the Investment Company Act. The trustees serve in this capacity for eight (in the case of Jonathan S. Thomas, 16; and Ronald J. Gilson, 9) registered investment companies in the American Century Investments family of funds.
The following table presents additional information about the trustees. The mailing address for each trustee other than Mr. Thomas is 1665 Charleston Road, Mountain View, California 94043. The mailing address for Mr. Thomas is 4500 Main Street, Kansas City, Missouri 64111.
| Name (Year of Birth) | Position(s) Held with Funds | Length of Time Served | Principal Occupation(s) During Past 5 Years | Number of American Century Portfolios Overseen by Trustee | Other Directorships Held During Past 5 Years |
| Independent Trustees | |||||
| Tanya S. Beder (1955) | Trustee | Since 2011 | Chairman and CEO, SBCC Group Inc. (independent advisory services) (2006 to present) | 45 | CYS Investments, Inc.; Nabors Industries Ltd. |
| Jeremy I. Bulow (1954) | Trustee | Since 2011 | Professor of Economics, Stanford University, Graduate School of Business (1979 to present) | 45 | None |
| Anne Casscells (1958) | Trustee | Since 2016 | Co-Chief Executive Officer and Chief Investment Officer, Aetos Alternatives Management (investment advisory firm) (2001 to present); Lecturer in Accounting, Stanford University, Graduate School of Business (2009 to present) | 45 | None |
| Ronald J. Gilson (1946) | Trustee and Chairman of the Board | Since 1995 (Chairman since 2005) | Charles J. Meyers Professor of Law and Business, Emeritus, Stanford Law School (1979 to 2016); Marc and Eva Stern Professor of Law and Business, Columbia University School of Law (1992 to present) | 50 | None |
20
| Name (Year of Birth) | Position(s) Held with Funds | Length of Time Served | Principal Occupation(s) During Past 5 Years | Number of American Century Portfolios Overseen by Trustee | Other Directorships Held During Past 5 Years |
| Independent Trustees | |||||
| Frederick L. A. Grauer (1946) | Trustee | Since 2008 | Senior Advisor, iShares by BlackRock, Inc. (investment management firm) (2010 to 2011, 2013 to 2015); Senior Advisor, Course Hero (an educational technology company) (2015 to present) | 45 | None |
| Jonathan D. Levin (1972) | Trustee | Since 2016 | Philip H. Knight Professor and Dean, Graduate School of Business, Stanford University (2016 to present); Professor, Stanford University, (2000 to present); Chair, Department of Economics, Stanford University (2011 to 2014) | 45 | None |
| Peter F. Pervere (1947) | Trustee | Since 2007 | Retired | 45 | None |
| John B. Shoven (1947) | Trustee | Since 2002 | Charles R. Schwab Professor of Economics, Stanford University (1973 to present) | 45 | Cadence Design Systems; Exponent; Financial Engines |
| Interested Trustee | |||||
| Jonathan S. Thomas (1963) | Trustee and President | Since 2007 | President and Chief Executive Officer, ACC (2007 to present). Also serves as Chief Executive Officer, ACS; Executive Vice President, ACIM; Director, ACC, ACIM and other ACC subsidiaries | 117 | BioMed Valley Discoveries, Inc. |
The Statement of Additional Information has additional information about the fund's trustees and is available without charge, upon request, by calling 1-800-345-2021.
21
Officers
The following table presents certain information about the executive officers of the funds. Each officer serves as an officer for 16 (in the case of Robert J. Leach, 15) investment companies in the American Century family of funds. No officer is compensated for his or her service as an officer of the funds. The listed officers are interested persons of the funds and are appointed or re-appointed on an annual basis. The mailing address for each of the officers listed below is 4500 Main Street, Kansas City, Missouri 64111.
| Name (Year of Birth) | Offices with the Funds | Principal Occupation(s) During the Past Five Years |
| Jonathan S. Thomas (1963) | Trustee and President since 2007 | President and Chief Executive Officer, ACC (2007 to present). Also serves as Chief Executive Officer, ACS; Executive Vice President, ACIM; Director, ACC, ACIM and other ACC subsidiaries |
| R. Wes Campbell (1974) | Chief Financial Officer and Treasurer since 2018 | Investment Operations and Investment Accounting, ACS (2000 to present) |
| Amy D. Shelton (1964) | Chief Compliance Officer and Vice President since 2014 | Chief Compliance Officer, American Century funds, (2014 to present); Chief Compliance Officer, ACIM (2014 to present); Chief Compliance Officer, ACIS (2009 to present); Vice President, Client Interactions and Marketing, ACIS (2013 to 2014). Also serves as Vice President, ACIS |
| Charles A. Etherington (1957) | General Counsel since 2007 and Senior Vice President since 2006 | Attorney, ACC (1994 to present); Vice President, ACC (2005 to present); General Counsel, ACC (2007 to present). Also serves as General Counsel, ACIM, ACS, ACIS and other ACC subsidiaries; and Senior Vice President, ACIM and ACS |
| C. Jean Wade (1964) | Vice President since 2012 | Senior Vice President, ACS (2017 to present); Vice President, ACS (2000 to 2017) |
| Robert J. Leach (1966) | Vice President since 2006 | Vice President, ACS (2000 to present) |
| David H. Reinmiller (1963) | Vice President since 2000 | Attorney, ACC (1994 to present). Also serves as Vice President, ACIM and ACS |
| Ward D. Stauffer (1960) | Secretary since 2005 | Attorney, ACC (2003 to present) |
22
Approval of Management Agreement |
At a meeting held on June 19, 2018, the Fund’s Board of Trustees (the "Board") unanimously approved the renewal of the management agreement pursuant to which American Century Investment Management, Inc. (the “Advisor”) acts as the investment advisor for the Fund. Under Section 15(c) of the Investment Company Act, contracts for investment advisory services are required to be reviewed, evaluated, and approved by a majority of a fund’s directors/trustees, including a majority of the independent Trustees, each year. The Board regards this annual evaluation and renewal as one of its most important responsibilities.
The independent Trustees have memorialized a statement regarding the relationship between their ongoing obligations to oversee and evaluate the performance of the Advisor and their annual consideration of renewal of the management agreement. In that statement, the independent Trustees noted that their assessment of the Advisor’s performance is an ongoing process that takes place over the entire year and is informed by all of the extensive information that the Board and its committees receive and consider over time. This information, together with the additional materials provided specifically in connection with the review, are central to the Board’s assessment of the Advisor’s performance and its determination whether to renew the Fund’s management agreement.
Prior to its consideration of the renewal of the management agreement, the Board requested and reviewed extensive data and analysis relating to the proposed renewal. This information and analysis was compiled by the Advisor and certain independent providers of evaluation data concerning the Fund and the services provided to the Fund by the Advisor.
In connection with its consideration of the renewal of the management agreement, the Board’s review and evaluation of the services provided by the Advisor included, but was not limited to, the following:
| • | the nature, extent, and quality of investment management, shareholder services, and other services provided to the Fund; |
| • | the wide range of other programs and services the Advisor provides to the Fund and its shareholders on a routine and non-routine basis; |
| • | the investment performance of the Fund, including data comparing the Fund’s performance to appropriate benchmarks and/or a peer group of other mutual funds with similar investment objectives and strategies; |
| • | the cost of owning the Fund compared to the cost of owning similar funds; |
| • | the Advisor’s compliance policies, procedures, and regulatory experience; |
| • | financial data showing the cost of services provided to the Fund, the profitability of the Fund to the Advisor, and the overall profitability of the Advisor; |
| • | strategic plans of the Advisor; |
| • | any economies of scale associated with the Advisor’s management of the Fund and other accounts; |
| • | services provided and charges to other investment management clients of the Advisor; |
| • | acquired fund fees and expenses; |
| • | payments and practices in connection with financial intermediaries holding shares of the Fund and the services provided by intermediaries in connection therewith; and |
| • | any collateral benefits derived by the Advisor from the management of the Fund. |
In keeping with its practice, the Board held two in-person meetings to review and discuss the information provided in response to their request and held active discussions with the Advisor regarding the renewal of the management agreement. The independent Trustees had the benefit of the advice of their independent counsel throughout the process.
23
Factors Considered
The Trustees considered all of the information provided by the Advisor, the independent data providers, and the independent Trustees’ independent counsel in connection with the approval. They determined that the information was sufficient for them to evaluate the management agreement for the Fund. In connection with their review, the Trustees did not identify any single factor as being all-important or controlling and each Trustee may have attributed different levels of importance to different factors. In deciding to renew the management agreement, the Board based its decision on a number of factors, including the following:
Nature, Extent and Quality of Services - Generally. Under the management agreement, the Advisor is responsible for providing or arranging for all services necessary for the operation of the Fund. The Board noted that the Advisor provides or arranges at its own expense a wide variety of services including:
| • | constructing and designing the Fund |
| • | portfolio research and security selection |
| • | initial capitalization/funding |
| • | securities trading |
| • | Fund administration |
| • | custody of Fund assets |
| • | daily valuation of the Fund’s portfolio |
| • | shareholder servicing and transfer agency, including shareholder confirmations, recordkeeping, and communications |
| • | legal services (except the independent Trustees’ counsel) |
| • | regulatory and portfolio compliance |
| • | financial reporting |
| • | marketing and distribution (except amounts paid by the Fund under Rule 12b-1 plans) |
The Board noted that many of these services have expanded over time in terms of both quantity and complexity in response to shareholder demands, competition in the industry, changing distribution channels, and the changing regulatory environment.
Investment Management, Shareholder, and Other Services. The nature of the investment management services provided to the Fund is quite complex and allows Fund shareholders access to professional money management, instant diversification of their investments within an asset class, the opportunity to easily diversify among asset classes by investing in or exchanging among various American Century Investments funds, and liquidity. In evaluating investment performance, the Board expects the Advisor to manage the Fund in accordance with its investment objectives and approved strategies. Further, the Trustees recognize that the Advisor has an obligation to seek the best execution of fund trades. In providing these services, the Advisor utilizes teams of investment professionals (portfolio managers, analysts, research assistants, and securities traders) who require extensive information technology, research, training, compliance, and other systems to conduct their business. The Board, directly and through its Portfolio Committee, regularly reviews investment performance information for the Fund, together with comparative information for appropriate benchmarks and/or peer groups of similarly-managed funds, over different time horizons. The Trustees also review detailed performance information during the management agreement approval process. If performance concerns are identified, the Fund receives special reviews until performance improves, during which the Board discusses with the Advisor the reasons for such results (e.g., market conditions, security selection) and any efforts being undertaken to improve performance. The Fund’s performance was above its benchmark for the one-, three-, and five-year periods and below its benchmark for the ten-year period reviewed by the Board. The Board found the investment management services provided by the Advisor to the Fund to be satisfactory and consistent with the management agreement.
24
Under the management agreement, the Advisor provides the Fund with a comprehensive package of transfer agency, shareholder, and other services. The Board, directly and through various committees of the Board, regularly reviews reports and evaluations of such services at its regular meetings. These reports include, but are not limited to, information regarding the operational efficiency and accuracy of the shareholder and transfer agency services provided, staffing levels, shareholder satisfaction (as measured by external as well as internal sources), technology support, new products and services offered to Fund shareholders, securities trading activities, portfolio valuation services, auditing services, and legal and operational compliance activities. The Board found the services provided by the Advisor to the Fund under the management agreement to be competitive and of high quality.
Costs of Services and Profitability. The Advisor provides detailed information concerning its cost of providing various services to the Fund, its profitability in managing the Fund, its overall profitability, and its financial condition. The Trustees have reviewed with the Advisor the methodology used to prepare this financial information. This information is considered in evaluating the Advisor’s financial condition, its ability to continue to provide services under the management agreement, and the reasonableness of the current management fee. The Board concluded that the Advisor’s profits were reasonable in light of the services provided to the Fund.
Economies of Scale. The Board also reviewed information provided by the Advisor regarding the possible existence of economies of scale in connection with the management of the Fund. The Board concluded that economies of scale are difficult to measure and predict with precision, especially on a fund-by-fund basis. The Board concluded that the Advisor is appropriately sharing economies of scale through its competitive fee structure, offering competitive fees from fund inception, and through reinvestment in its business to provide shareholders enhanced and expanded services.
Comparison to Other Funds’ Fees. The management agreement provides that the Fund pays the Advisor a single, all-inclusive (or unified) management fee for providing all services necessary for the management and operation of the Fund, other than brokerage expenses, expenses attributable to short sales, taxes, interest, extraordinary expenses, the fees and expenses of the Fund’s independent Trustees (including their independent legal counsel), and expenses incurred in connection with the provision of shareholder services and distribution services under a plan adopted pursuant to Rule 12b-1 under the 1940 Act. Under the unified fee structure, the Advisor is responsible for providing all investment advisory, custody, audit, administrative, compliance, recordkeeping, marketing, and shareholder services, or arranging and supervising third parties to provide such services. By contrast, most other funds are charged a variety of fees, including an investment advisory fee, a transfer agency fee, an administrative fee, distribution charges, and other expenses. Other than their investment advisory fees and any applicable Rule 12b-1 distribution fees, all other components of the total fees charged by these other funds may be increased without shareholder approval. The Board believes the unified fee structure is a benefit to Fund shareholders because it clearly discloses to shareholders the cost of owning Fund shares, and, since the unified fee cannot be increased without a vote of Fund shareholders, it shifts to the Advisor the risk of increased costs of operating the Fund and provides a direct incentive to minimize administrative inefficiencies. Part of the Board’s analysis of fee levels involves reviewing certain evaluative data compiled by an independent provider and comparing the Fund’s unified fee to the total expense ratio of peer funds. The unified fee charged to shareholders of the Fund was in the lowest quartile of the total expense ratios of the Fund’s peer universe. The Board concluded that the management fee paid by the Fund to the Advisor under the management agreement is reasonable in light of the services provided to the Fund.
Comparison to Fees and Services Provided to Other Clients of the Advisor. The Board also requested and received information from the Advisor concerning the nature of the services, fees, costs, and profitability of its advisory services to advisory clients other than the Fund. They observed that these varying types of client accounts require different services and involve different regulatory and entrepreneurial risks than the management of the Fund. The Board analyzed this
25
information and concluded that the fees charged and services provided to the Fund were reasonable by comparison.
Payments to Intermediaries. The Trustees also requested and received a description of payments made to intermediaries by the Fund and the Advisor and services provided by intermediaries. These payments include various payments made by the Fund or the Advisor to different types of intermediaries and recordkeepers for distribution and service activities provided for the Fund. The Trustees reviewed such information and received representations from the Advisor that all such payments by the Fund were made pursuant to the Fund’s Rule 12b-1 Plan and that all such payments by the Advisor were made from the Advisor’s resources and reasonable profits. The Board found such payments to be reasonable in scope and purpose.
Collateral or “Fall-Out” Benefits Derived by the Advisor. The Board considered the existence of collateral benefits the Advisor may receive as a result of its relationship with the Fund. The Board noted that the Advisor’s primary business is managing mutual funds and it generally does not use fund or shareholder information to generate profits in other lines of business, and therefore does not derive any significant collateral benefits from them. The Board noted that the Advisor may receive proprietary research from broker-dealers that execute fund portfolio transactions. The Board also determined that the Advisor is able to provide investment management services to certain clients other than the Fund, at least in part, due to its existing infrastructure built to serve the fund complex. The Board noted that the assets of those other accounts are, where applicable, included with the assets of the Fund to determine breakpoints in the management fee schedule.
Existing Relationship. The Board also considered whether there was any reason for not continuing the existing arrangement with the Advisor. In this regard, the Board was mindful of the potential disruptions of the Fund’s operations and various risks, uncertainties, and other effects that could occur as a result of a decision not to continue such relationship. In particular, the Board recognized that most shareholders have invested in the Fund on the strength of the Advisor’s industry standing and reputation and in the expectation that the Advisor will have a continuing role in providing advisory services to the Fund.
Conclusion of the Trustees. As a result of this process, the Board, including all of the independent Trustees and assisted by the advice of independent legal counsel, taking into account all of the factors discussed above and the information provided by the Advisor and others in connection with its review and throughout the year, concluded that the management agreement between the Fund and the Advisor is fair and reasonable in light of the services provided and should be renewed.
26
| Additional Information |
Retirement Account Information
As required by law, distributions you receive from certain retirement accounts are subject to federal income tax withholding, unless you elect not to have withholding apply*. Tax will be withheld on the total amount withdrawn even though you may be receiving amounts that are not subject to withholding, such as nondeductible contributions. In such case, excess amounts of withholding could occur. You may adjust your withholding election so that a greater or lesser amount will be withheld.
If you don’t want us to withhold on this amount, you must notify us to not withhold the federal income tax. You may notify us in writing or in certain situations by telephone or through other electronic means. For systematic withdrawals, your withholding election will remain in effect until revoked or changed by filing a new election. You have the right to revoke your election at any time and change your withholding percentage for future distributions.
Remember, even if you elect not to have income tax withheld, you are liable for paying income tax on the taxable portion of your withdrawal. If you elect not to have income tax withheld or you don’t have enough income tax withheld, you may be responsible for payment of estimated tax. You may incur penalties under the estimated tax rules if your withholding and estimated tax payments are not sufficient. You can reduce or defer the income tax on a distribution by directly or indirectly rolling such distribution over to another IRA or eligible plan. You should consult your tax advisor for additional information.
State tax will be withheld if, at the time of your distribution, your address is within one of the mandatory withholding states and you have federal income tax withheld (or as otherwise required by state law). State taxes will be withheld from your distribution in accordance with the respective state rules.
*Some 403(b), 457 and qualified retirement plan distributions may be subject to 20% mandatory withholding, as they are subject to special tax and withholding rules. Your plan administrator or plan sponsor is required to provide you with a special tax notice explaining those rules at the time you request a distribution. If applicable, federal and/or state taxes may be withheld from your distribution amount.
Proxy Voting Policies
Descriptions of the principles and policies that the fund's investment advisor uses in exercising the voting rights associated with the securities purchased and/or held by the fund are available without charge, upon request, by calling 1-800-345-2021 or visiting the "About Us" page of American Century Investments’ website at americancentury.com. A description of the policies is also available on the Securities and Exchange Commission’s website at sec.gov. Information regarding how the investment advisor voted proxies relating to portfolio securities during the most recent 12-month period ended June 30 is available on the "About Us" page at americancentury.com. It is also available at sec.gov.
Quarterly Portfolio Disclosure
The fund files its complete schedule of portfolio holdings with the Securities and Exchange Commission (SEC) for the first and third quarters of each fiscal year on Form N-Q. The fund’s Forms N-Q are available on the SEC’s website at sec.gov. The fund also makes its complete schedule of portfolio holdings for the most recent quarter of its fiscal year available on its website at americancentury.com and, upon request, by calling 1-800-345-2021.
27
Other Tax Information
The following information is provided pursuant to provisions of the Internal Revenue Code.
The fund hereby designates $663,065, or up to the maximum amount allowable, as long-term capital gain distributions (20% rate gain distributions) for the fiscal year ended September 30, 2018.
28
| ||
| Contact Us | americancentury.com | |
| Automated Information Line | 1-800-345-8765 | |
| Investor Services Representative | 1-800-345-2021 or 816-531-5575 | |
| Investors Using Advisors | 1-800-378-9878 | |
| Business, Not-For-Profit, Employer-Sponsored Retirement Plans | 1-800-345-3533 | |
| Banks and Trust Companies, Broker-Dealers, Financial Professionals, Insurance Companies | 1-800-345-6488 | |
| Telecommunications Relay Service for the Deaf | 711 | |
| American Century Target Maturities Trust | ||
Investment Advisor: American Century Investment Management, Inc. Kansas City, Missouri | ||
| This report and the statements it contains are submitted for the general information of our shareholders. The report is not authorized for distribution to prospective investors unless preceded or accompanied by an effective prospectus. | ||
| ©2018 American Century Proprietary Holdings, Inc. All rights reserved. CL-ANN-90822 1811 | ||
| Annual Report | |
| September 30, 2018 | |
| Zero Coupon 2025 Fund | |
| Investor Class (BTTRX) | |
| Advisor Class (ACTVX) | |
| Table of Contents |
| President’s Letter | 2 | |
| Performance | 3 | |
| Portfolio Commentary | ||
| Fund Characteristics | ||
| Shareholder Fee Example | ||
| Schedule of Investments | ||
| Statement of Assets and Liabilities | ||
| Statement of Operations | ||
| Statement of Changes in Net Assets | ||
| Notes to Financial Statements | ||
| Financial Highlights | ||
| Report of Independent Registered Public Accounting Firm | ||
| Management | ||
| Approval of Management Agreement | ||
| Additional Information | ||
Any opinions expressed in this report reflect those of the author as of the date of the report, and do not necessarily represent the opinions of American Century Investments® or any other person in the American Century Investments organization. Any such opinions are subject to change at any time based upon market or other conditions and American Century Investments disclaims any responsibility to update such opinions. These opinions may not be relied upon as investment advice and, because investment decisions made by American Century Investments funds are based on numerous factors, may not be relied upon as an indication of trading intent on behalf of any American Century Investments fund. Security examples are used for representational purposes only and are not intended as recommendations to purchase or sell securities. Performance information for comparative indices and securities is provided to American Century Investments by third party vendors. To the best of American Century Investments’ knowledge, such information is accurate at the time of printing.
| President’s Letter |
Jonathan ThomasDear Investor:
Thank you for reviewing this annual report for the 12 months ended September 30, 2018. Annual reports help convey important information about fund returns, including market factors that affected performance during the reporting period. For additional, updated investment and market insights, we encourage you to visit our website, americancentury.com.
Treasury Yields Climbed to Multiyear Highs on Economic Strength
U.S. Treasury investors faced an increasingly challenging backdrop as the 12-month period unfolded. Early on, Treasury yields moved slightly higher amid modest economic gains and the Federal Reserve’s (Fed’s) continued approach to gradually normalizing short-term interest rates.
In early 2018, the landscape turned dramatically different. Volatility, a force that remained relatively dormant during 2017, re-emerged with a vengeance. A batch of better-than-expected economic data triggered expectations for rising inflation, higher interest rates, and a more-hawkish Fed. On the political front, President Trump’s administration announced a series of tariffs that fueled fears of a global trade war and contributed to broad global market unrest. In response to the improving economic data, U.S. Treasury yields rocketed to their highest levels in several years. Meanwhile, upbeat growth, employment, and inflation data prompted the Fed to boost its rate-hike outlook for 2018 from three hikes to potentially four.
After reaching multiyear highs in May, Treasury yields eased somewhat and generally stabilized. Concerns about tariffs and other geopolitical issues sparked a flight to quality, causing Treasury yields to retreat from their earlier highs. At the same time, core inflation held steady near the Fed’s target level of 2%. But, as economic data continued to gather momentum, Treasury yields spiked again in September. Additionally, the Fed implemented its third rate hike of the year and appeared likely to repeat that move in December. The benchmark 10-year Treasury yield climbed back to its May high, closing the period at 3.06%.
Looking ahead, fixed-income investors may continue to face a backdrop of solid economic growth and higher interest rates. We believe this scenario warrants a disciplined, diversified, and risk-aware approach, using professionally managed portfolios in pursuit of investment goals. We appreciate your continued trust and confidence in us.
Sincerely,
Jonathan Thomas
President and Chief Executive Officer
American Century Investments
2
| Performance |
| Total Returns as of September 30, 2018 | |||||
| Average Annual Returns | |||||
Ticker Symbol | 1 year | 5 years | 10 years | Inception Date | |
| Investor Class | BTTRX | -3.24% | 3.15% | 5.27% | 2/15/96 |
| 11/15/2025 STRIPS Issue | — | -2.83% | 3.42% | 5.95% | — |
| ICE BofAML 10+ Year U.S. Treasury Index | — | -3.57% | 4.31% | 5.36% | — |
| Advisor Class | ACTVX | -3.48% | 2.89% | 5.00% | 6/1/98 |
| Growth of $10,000 Over 10 Years |
| $10,000 investment made September 30, 2008 |
| Performance for other share classes will vary due to differences in fee structure. |
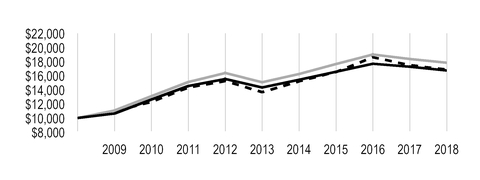
| Value on September 30, 2018 | |
| Investor Class — $16,710 | |
| 11/15/2025 STRIPS Issue — $17,825 | |
| ICE BofAML 10+ Year U.S. Treasury Index — $16,863 | |
| Total Annual Fund Operating Expenses | |
| Investor Class | Advisor Class |
| 0.55% | 0.80% |
The total annual fund operating expenses shown is as stated in the fund’s prospectus current as of the date of this report. The prospectus may vary from the expense ratio shown elsewhere in this report because it is based on a different time period, includes acquired fund fees and expenses, and, if applicable, does not include fee waivers or expense reimbursements.
Data presented reflect past performance. Past performance is no guarantee of future results. Current performance may be higher or lower than the performance shown. Total returns for periods less than one year are not annualized. Investment return and principal value will fluctuate, and redemption value may be more or less than original cost. Data assumes reinvestment of dividends and capital gains, and none of the charts reflect the deduction of taxes that a shareholder would pay on fund distributions or the redemption of fund shares. To obtain performance data current to the most recent month end, please call 1-800-345-2021 or visit americancentury.com. For additional information about the fund, please consult the prospectus.
3
| Portfolio Commentary |
Portfolio Managers: Brian Howell, Jim Platz, Bob Gahagan, and Miguel Castillo
Performance Summary
Zero Coupon 2025 declined -3.24%* for the 12 months ended September 30, 2018. The portfolio’s benchmark, a coupon-based Treasury STRIPS issue maturing on November 15, 2025, declined -2.83%.
U.S. Treasury yields increased for the 12-month period, which primarily accounted for the negative absolute performance of the portfolio and the Treasury STRIPS issue. From a relative performance perspective, operating expenses reduce portfolio returns but do not apply to benchmark returns.
In the rising-rate environment, intermediate- and long-maturity government securities generally underperformed those with short maturities. Overall, modest spread tightening (a decrease in yield differences) between Treasury STRIPS and non-Treasury zero-coupon bonds (zeros) aided portfolio performance.
Market Backdrop
Against a backdrop of Federal Reserve (Fed) tightening, improving economic growth, and modest inflation, U.S. Treasury yields headed higher across the yield curve. The upward march gained momentum in early 2018, as investors reacted to better-than-expected economic data. Specifically, in February, U.S. wage growth accelerated to a nearly nine-year high. Investors feared rising wages, combined with the anticipated growth effects of recently enacted federal tax reform, would trigger higher inflation and rising interest rates. This caused Treasury yields to increase sharply.
As the period progressed, the U.S. economy continued to exhibit solid growth. Annualized gross domestic product jumped from 2.2% in the first quarter of 2018 to 4.2% in the second quarter, its strongest pace in four years. Core inflation edged higher and finally reached the Fed’s 2% target. In addition, the U.S. unemployment rate continued to trend lower, while wages continued to edge higher. In May, the 10-year Treasury yield surged above 3% for the first time in more than four years. In June, after raising the federal funds rate target for the second time in 2018 (the first time was in March), the Fed took a more-hawkish tone. The central bank stated that economic conditions could warrant a total of four rate hikes in 2018, one more than it previously forecasted.
After topping 3% in May, longer-maturity Treasury yields eased and generally stabilized through the summer. But another upward spike occurred in September. Economic growth remained robust, and the Fed raised rates again and maintained its fairly hawkish outlook. By the end of the month, the yield on the 10-year Treasury note climbed back to its May high of 3.06%, compared with 2.33% at the end of September 2017. Meanwhile, Fed tightening and expectations for future rate hikes helped drive the yield on the two-year Treasury note to 2.82%, compared with 1.49% a year earlier. In terms of total return, the broad U.S. Treasury market declined -1.62% for the 12-month period. The two-year Treasury note returned -0.21%, while the 10-year Treasury note returned -3.97%.
* All fund returns referenced in this commentary are for Investor Class shares. Performance for other share classes will vary due to differences in fee structures; when Investor Class performance exceeds that of the fund’s benchmark, other share classes may not. See page 3 for returns for all share classes.
4
Portfolio Strategy
We continued to look for what we believed were attractive relative values among Treasury STRIPS, Treasury-equivalent zeros, and, to a lesser degree, government agency zeros. These securities
are “stripped” and packaged into their component parts, including the series of coupon payments and the ultimate principal repayment.
We seek to take advantage of spread movements between Treasury STRIPS and non-Treasury zeros. Spreads began the period at relatively tight levels, leaving only little room for additional narrowing during the subsequent 12 months. Within the U.S. government securities market, demand for high-quality spread (non-Treasury) securities, including Treasury equivalents and agency securities, remained robust. In this climate, our positions in Treasury-equivalent securities (primarily Resolution Funding Corporation, or REFCORP, STRIPS) and government agency zeros contributed to performance relative to Treasury STRIPS.
We continue to believe our non-Treasury zeros offer attractive long-term return potential, and we expect these securities will have a favorable impact on the portfolio’s Anticipated Value at Maturity (AVM). Our allocation to Treasury STRIPS and Treasury equivalents accounted for approximately 88% of the portfolio at the end of the reporting period, compared with 87% a year earlier. At the end of September 2018, REFCORP STRIPS comprised the majority of this allocation. By prospectus mandate, we also may invest up to 20% of the portfolio’s assets in government agency zero-coupon bonds. These securities represented approximately 12% of the portfolio at the end of September 2018, compared with approximately 13% at the end of September 2017.
Outlook
We believe the Fed will continue to normalize monetary policy, which will continue to put upward rate pressure on the short-maturity end of the Treasury yield curve. On the longer-maturity end of the curve, we believe interest rates are likely to slowly climb higher amid a climate of solid, above-trend economic growth. Against this broad backdrop, we believe demand for high-credit-quality spread securities will remain firm, which likely will keep spreads tight.
Zero Coupon 2025 is not an asset allocation retirement fund. The date refers to when the bonds will mature. The principal value of the fund is not guaranteed at any time, including at the target date. The fund’s AVM (see next page), though not guaranteed, provides what we believe is an appropriate estimate of the fund’s value at the target date.
5
| Fund Characteristics |
| SEPTEMBER 30, 2018 | |
| Portfolio at a Glance | |
| Anticipated Annual Growth Rate (Investor Class) | 2.66% |
| Weighted Average Maturity Date | 10/22/25 |
Anticipated Value at Maturity (AVM) (Investor Class)(1) | $116.23 |
| (1) See graph below. | |
| Past performance is no guarantee of future results. Even if class shares are held to maturity, there is no guarantee that the class’s share price will reach its AVM. There is also no guarantee that the AVM will fluctuate as little in the future as it has in the past. For more information, please consult the prospectus. | |
| Types of Investments in Portfolio | % of net assets |
| REFCORP STRIPS | 49.7% |
| Treasury STRIPS | 38.1% |
| Total Treasuries and Equivalents | 87.8% |
| Government Agency STRIPS | 12.0% |
| Temporary Cash Investments | 0.5% |
| Other Assets and Liabilities | (0.3)% |
| Share Price vs. Anticipated Value at Maturity (Investor Class) | |
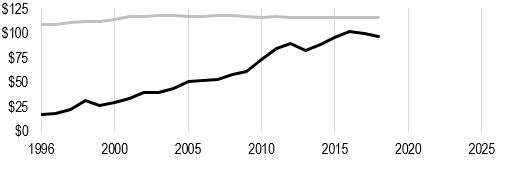
| Actual Share Price (Historical) — $96.41 | |
| Anticipated Value at Maturity (Estimated Share Price) — $116.23 | |
The top line in the graph represents the class’s AVM, which fluctuates from day to day based on the fund’s weighted average maturity date. The bottom line represents the class’s historical share price, which is managed to grow over time to reach the class’s AVM. The AVM for other share classes will vary due to differences in fee structure. While this graph demonstrates the class’s expected long-term growth pattern, please keep in mind that the fund may experience significant share-price volatility over the short term. Even if shares are held to maturity, there is no guarantee that the class’s share price will reach its AVM. There is also no guarantee that the AVM will fluctuate as little in the future as it has in the past.
6
| Shareholder Fee Example |
Fund shareholders may incur two types of costs: (1) transaction costs, including sales charges (loads) on purchase payments and redemption/exchange fees; and (2) ongoing costs, including management fees; distribution and service (12b-1) fees; and other fund expenses. This example is intended to help you understand your ongoing costs (in dollars) of investing in your fund and to compare these costs with the ongoing cost of investing in other mutual funds.
The example is based on an investment of $1,000 made at the beginning of the period and held for the entire period from April 1, 2018 to September 30, 2018.
Actual Expenses
The table provides information about actual account values and actual expenses for each class. You may use the information, together with the amount you invested, to estimate the expenses that you paid over the period. First, identify the share class you own. Then simply divide your account value by $1,000 (for example, an $8,600 account value divided by $1,000 = 8.6), then multiply the result by the number under the heading “Expenses Paid During Period” to estimate the expenses you paid on your account during this period.
If you hold Investor Class shares of any American Century Investments fund, or I Class shares of the American Century Diversified Bond Fund, in an American Century Investments account (i.e., not a financial intermediary or retirement plan account), American Century Investments may charge you a $12.50 semiannual account maintenance fee if the value of those shares is less than $10,000. We will redeem shares automatically in one of your accounts to pay the $12.50 fee. In determining your total eligible investment amount, we will include your investments in all personal accounts (including American Century Investments Brokerage accounts) registered under your Social Security number. Personal accounts include individual accounts, joint accounts, UGMA/UTMA accounts, personal trusts, Coverdell Education Savings Accounts and IRAs (including traditional, Roth, Rollover, SEP-, SARSEP- and SIMPLE-IRAs), and certain other retirement accounts. If you have only business, business retirement, employer-sponsored or American Century Investments Brokerage accounts, you are currently not subject to this fee. If you are subject to the Account Maintenance Fee, your account value could be reduced by the fee amount.
Hypothetical Example for Comparison Purposes
The table also provides information about hypothetical account values and hypothetical expenses based on the actual expense ratio of each class of your fund and an assumed rate of return of 5% per year before expenses, which is not the actual return of a fund’s share class. The hypothetical account values and expenses may not be used to estimate the actual ending account balance or expenses you paid for the period. You may use this information to compare the ongoing costs of investing in your fund and other funds. To do so, compare this 5% hypothetical example with the 5% hypothetical examples that appear in the shareholder reports of the other funds.
Please note that the expenses shown in the table are meant to highlight your ongoing costs only and do not reflect any transactional costs, such as sales charges (loads) or redemption/exchange fees. Therefore, the table is useful in comparing ongoing costs only, and will not help you determine the relative total costs of owning different funds. In addition, if these transactional costs were included, your costs would have been higher.
7
| Beginning Account Value 4/1/18 | Ending Account Value 9/30/18 | Expenses Paid During Period(1) 4/1/18 - 9/30/18 | Annualized Expense Ratio(1) | |
| Actual | ||||
| Investor Class | $1,000 | $989.70 | $2.74 | 0.55% |
| Advisor Class | $1,000 | $988.50 | $3.99 | 0.80% |
| Hypothetical | ||||
| Investor Class | $1,000 | $1,022.31 | $2.79 | 0.55% |
| Advisor Class | $1,000 | $1,021.06 | $4.05 | 0.80% |
| (1) | Expenses are equal to the class's annualized expense ratio listed in the table above, multiplied by the average account value over the period, multiplied by 183, the number of days in the most recent fiscal half-year, divided by 365, to reflect the one-half year period. Annualized expense ratio reflects actual expenses, including any applicable fee waivers or expense reimbursements and excluding any acquired fund fees and expenses. |
8
| Schedule of Investments |
SEPTEMBER 30, 2018
Principal Amount/ Shares | Value | |||||
ZERO-COUPON U.S. TREASURY SECURITIES AND EQUIVALENTS(1) — 87.8% | ||||||
| REFCORP STRIPS - COUPON, 0.00%, 4/15/24 | $ | 385,000 | $ | 323,444 | ||
| REFCORP STRIPS - COUPON, 0.00%, 1/15/25 | 8,445,000 | 6,901,168 | ||||
| REFCORP STRIPS - COUPON, 0.00%, 4/15/25 | 18,013,000 | 14,601,941 | ||||
| STRIPS - COUPON, 0.00%, 11/15/25 | 57,800,000 | 46,489,985 | ||||
| REFCORP STRIPS - COUPON, 0.00%, 1/15/26 | 17,500,000 | 13,818,804 | ||||
| REFCORP STRIPS - COUPON, 0.00%, 4/15/26 | 25,000,000 | 19,529,602 | ||||
| REFCORP STRIPS - COUPON, 0.00%, 7/15/26 | 7,000,000 | 5,421,855 | ||||
TOTAL ZERO-COUPON U.S. TREASURY SECURITIES AND EQUIVALENTS (Cost $93,780,780) | 107,086,799 | |||||
ZERO-COUPON U.S. GOVERNMENT AGENCY SECURITIES(1) — 12.0% | ||||||
| FNMA STRIPS - COUPON, MTN, 0.00%, 4/8/24 | 10,000 | 8,377 | ||||
| TVA STRIPS - COUPON, 0.00%, 5/1/24 | 1,000,000 | 828,805 | ||||
| FHLMC STRIPS - COUPON, 0.00%, 9/15/24 | 42,000 | 34,610 | ||||
| FNMA STRIPS - COUPON, 0.00%, 8/7/25 | 1,838,000 | 1,465,652 | ||||
| FHLMC STRIPS - COUPON, 0.00%, 9/15/25 | 1,645,000 | 1,307,651 | ||||
| FHLMC STRIPS - COUPON, 0.00%, 9/15/25 | 7,162,000 | 5,693,434 | ||||
| TVA STRIPS - PRINCIPAL, 0.00%, 11/1/25 | 6,000,000 | 4,696,832 | ||||
| FNMA STRIPS - COUPON, 0.00%, 1/15/26 | 841,000 | 658,630 | ||||
TOTAL ZERO-COUPON U.S. GOVERNMENT AGENCY SECURITIES (Cost $13,028,927) | 14,693,991 | |||||
| TEMPORARY CASH INVESTMENTS — 0.5% | ||||||
Federal Home Loan Bank Discount Notes, 2.04%, 10/1/18(2) | 559,000 | 559,000 | ||||
| State Street Institutional U.S. Government Money Market Fund, Premier Class | 478 | 478 | ||||
TOTAL TEMPORARY CASH INVESTMENTS (Cost $559,478) | 559,478 | |||||
TOTAL INVESTMENT SECURITIES — 100.3% (Cost $107,369,185) | 122,340,268 | |||||
| OTHER ASSETS AND LIABILITIES — (0.3)% | (366,694 | ) | ||||
| TOTAL NET ASSETS — 100.0% | $ | 121,973,574 | ||||
| NOTES TO SCHEDULE OF INVESTMENTS | ||
| Equivalent | - | Security whose payments are secured by the U.S. Treasury |
| FHLMC | - | Federal Home Loan Mortgage Corporation |
| FNMA | - | Federal National Mortgage Association |
| MTN | - | Medium Term Note |
| REFCORP | - | Resolution Funding Corporation |
| STRIPS | - | Separate Trading of Registered Interest and Principal of Securities |
| TVA | - | Tennessee Valley Authority |
| (1) | Security is a zero-coupon bond. Zero-coupon securities are issued at a substantial discount from their value at maturity. |
| (2) | The rate indicated is the yield to maturity at purchase. |
See Notes to Financial Statements.
9
| Statement of Assets and Liabilities |
| SEPTEMBER 30, 2018 | |||
| Assets | |||
| Investment securities, at value (cost of $107,369,185) | $ | 122,340,268 | |
| Receivable for capital shares sold | 16,323 | ||
| 122,356,591 | |||
| Liabilities | |||
| Payable for capital shares redeemed | 327,997 | ||
| Accrued management fees | 54,746 | ||
| Distribution and service fees payable | 274 | ||
| 383,017 | |||
| Net Assets | $ | 121,973,574 | |
| Net Assets Consist of: | |||
| Capital paid in | $ | 102,150,792 | |
| Distributable earnings | 19,822,782 | ||
| $ | 121,973,574 | ||
| Net Assets | Shares Outstanding | Net Asset Value Per Share | ||||||
| Investor Class | $120,676,086 | 1,251,750 | $96.41 | |||||
| Advisor Class | $1,297,488 | 14,152 | $91.68 | |||||
See Notes to Financial Statements.
10
| Statement of Operations |
| YEAR ENDED SEPTEMBER 30, 2018 | |||
| Investment Income (Loss) | |||
| Income: | |||
| Interest | $ | 5,478,745 | |
| Expenses: | |||
| Management fees | 704,112 | ||
| Distribution and service fees - Advisor Class | 3,635 | ||
| Trustees' fees and expenses | 8,135 | ||
| Other expenses | 67 | ||
| 715,949 | |||
| Net investment income (loss) | 4,762,796 | ||
| Realized and Unrealized Gain (Loss) | |||
| Net realized gain (loss) on investment transactions | 2,230,722 | ||
| Change in net unrealized appreciation (depreciation) on investments | (11,388,387 | ) | |
| Net realized and unrealized gain (loss) | (9,157,665 | ) | |
| Net Increase (Decrease) in Net Assets Resulting from Operations | $ | (4,394,869 | ) |
See Notes to Financial Statements.
11
| Statement of Changes in Net Assets |
| YEARS ENDED SEPTEMBER 30, 2018 AND SEPTEMBER 30, 2017 | ||||||
| Increase (Decrease) in Net Assets | September 30, 2018 | September 30, 2017 | ||||
| Operations | ||||||
| Net investment income (loss) | $ | 4,762,796 | $ | 5,200,215 | ||
| Net realized gain (loss) | 2,230,722 | 2,981,216 | ||||
| Change in net unrealized appreciation (depreciation) | (11,388,387 | ) | (15,019,216 | ) | ||
| Net increase (decrease) in net assets resulting from operations | (4,394,869 | ) | (6,837,785 | ) | ||
| Distributions to Shareholders | ||||||
| From earnings: | ||||||
| Investor Class | (6,102,563 | ) | (5,693,162 | ) | ||
| Advisor Class | (67,780 | ) | (60,811 | ) | ||
| Decrease in net assets from distributions | (6,170,343 | ) | (5,753,973 | ) | ||
| Capital Share Transactions | ||||||
| Net increase (decrease) in net assets from capital share transactions (Note 5) | (9,580,998 | ) | (55,300,592 | ) | ||
| Net increase (decrease) in net assets | (20,146,210 | ) | (67,892,350 | ) | ||
| Net Assets | ||||||
| Beginning of period | 142,119,784 | 210,012,134 | ||||
| End of period | $ | 121,973,574 | $ | 142,119,784 | ||
See Notes to Financial Statements.
12
| Notes to Financial Statements |
SEPTEMBER 30, 2018
1. Organization
American Century Target Maturities Trust (the trust) is registered under the Investment Company Act of 1940, as amended (the 1940 Act), as an open-end management investment company and is organized as a Massachusetts business trust. Zero Coupon 2025 Fund (the fund) is one fund in a series issued by the trust. The fund’s investment objective is to seek the highest return consistent with investment in U.S. Treasury securities. The fund is managed to mature in the year identified in its name and will be liquidated near the end of its maturity year. The fund offers the Investor Class and Advisor Class.
2. Significant Accounting Policies
The following is a summary of significant accounting policies consistently followed by the fund in preparation of its financial statements. The fund is an investment company and follows accounting and reporting guidance in accordance with accounting principles generally accepted in the United States of America. This may require management to make certain estimates and assumptions at the date of the financial statements. Actual results could differ from these estimates. Management evaluated the impact of events or transactions occurring through the date the financial statements were issued that would merit recognition or disclosure.
Investment Valuations — The fund determines the fair value of its investments and computes its net asset value per share at the close of regular trading (usually 4 p.m. Eastern time) on the New York Stock Exchange (NYSE) on each day the NYSE is open. The Board of Trustees has adopted valuation policies and procedures to guide the investment advisor in the fund’s investment valuation process and to provide methodologies for the oversight of the fund’s pricing function.
Fixed income securities are valued at the evaluated bid as provided by independent pricing services or at the most recent bid as provided by investment dealers. U.S. Treasury and Government Agency securities are valued using market models that consider trade data, quotations from dealers and active market makers, relevant yield curve and spread data, creditworthiness, trade data or market information on comparable securities, and other relevant security specific information.
Open-end management investment companies are valued at the reported net asset value per share.
If the fund determines that the market price for an investment is not readily available or the valuation methods mentioned above do not reflect an investment’s fair value, such investment is valued as determined in good faith by the Board of Trustees or its delegate, in accordance with policies and procedures adopted by the Board of Trustees. In its determination of fair value, the fund may review several factors including, but not limited to, market information regarding the specific investment or comparable investments and correlation with other investment types, futures indices or general market indicators. Circumstances that may cause the fund to use these procedures to value an investment include, but are not limited to: an investment has been declared in default or is distressed; trading in a security has been suspended during the trading day or a security is not actively trading on its principal exchange; prices received from a regular pricing source are deemed unreliable; or there is a foreign market holiday and no trading occurred.
The fund monitors for significant events occurring after the close of an investment’s primary exchange but before the fund’s net asset value per share is determined. Significant events may include, but are not limited to: corporate announcements and transactions; governmental action and political unrest that could impact a specific investment or an investment sector; or armed conflicts, natural disasters and similar events that could affect investments in a specific country or region.
Security Transactions — Security transactions are accounted for as of the trade date. Net realized gains and losses are determined on the identified cost basis, which is also used for federal income tax purposes.
Investment Income — Interest income is recorded on the accrual basis and includes accretion of discounts.
Income Tax Status — It is the fund’s policy to distribute substantially all net investment income and net realized gains to shareholders and to otherwise qualify as a regulated investment company under provisions of the Internal Revenue Code. Accordingly, no provision has been made for income taxes. The fund files U.S.
13
federal, state, local and non-U.S. tax returns as applicable. The fund's tax returns are subject to examination by the relevant taxing authority until expiration of the applicable statute of limitations, which is generally three years from the date of filing but can be longer in certain jurisdictions. At this time, management believes there are no uncertain tax positions which, based on their technical merit, would not be sustained upon examination and for which it is reasonably possible that the total amounts of unrecognized tax benefits will significantly change in the next twelve months.
Multiple Class — All shares of the fund represent an equal pro rata interest in the net assets of the class to which such shares belong, and have identical voting, dividend, liquidation and other rights and the same terms and conditions, except for class specific expenses and exclusive rights to vote on matters affecting only individual classes. Income, non-class specific expenses, and realized and unrealized capital gains and losses of the fund are allocated to each class of shares based on their relative net assets.
Distributions to Shareholders — Distributions from net investment income and net realized gains, if any, are generally declared and paid annually. The fund may elect to treat a portion of its payment to a redeeming shareholder, which represents the pro rata share of undistributed net investment income and net realized gains, as a distribution for federal income tax purposes (tax equalization).
Reverse Share Splits — When the fund pays a distribution, the trustees declare a reverse share split that exactly offsets the per-share amount of the distribution. After taking into account the reverse share split, a shareholder reinvesting dividends and capital gain distributions will hold exactly the same number of shares owned prior to the distribution and reverse share split. A shareholder electing to receive dividends in cash will own fewer shares.
Indemnifications — Under the trust’s organizational documents, its officers and trustees are indemnified against certain liabilities arising out of the performance of their duties to the fund. In addition, in the normal course of business, the fund enters into contracts that provide general indemnifications. The maximum exposure under these arrangements is unknown as this would involve future claims that may be made against a fund. The risk of material loss from such claims is considered by management to be remote.
3. Fees and Transactions with Related Parties
Certain officers and trustees of the trust are also officers and/or directors of American Century Companies, Inc. (ACC). The trust’s investment advisor, American Century Investment Management, Inc. (ACIM), the trust’s distributor, American Century Investment Services, Inc. (ACIS), and the trust’s transfer agent, American Century Services, LLC, are wholly owned, directly or indirectly, by ACC.
Management Fees — The trust has entered into a management agreement with ACIM, under which ACIM provides the fund with investment advisory and management services in exchange for a single, unified management fee (the fee) per class. The agreement provides that all expenses of managing and operating the fund, except distribution and service fees, brokerage expenses, taxes, interest, fees and expenses of the independent trustees (including legal counsel fees), and extraordinary expenses, will be paid by ACIM. The fee is computed and accrued daily based on each class's daily net assets and paid monthly in arrears. The fee consists of (1) an Investment Category Fee based on the daily net assets of the fund and certain other accounts managed by the investment advisor that are in the same broad investment category as the fund and (2) a Complex Fee based on the assets of all the funds in the American Century Investments family of funds. The rates for the Investment Category Fee range from 0.2425% to 0.3600% and the rates for the Complex Fee range from 0.2500% to 0.3100%. The effective annual management fee for each class for the period ended September 30, 2018 was 0.54%.
Distribution and Service Fees — The Board of Trustees has adopted a separate Master Distribution and Individual Shareholder Services Plan for the Advisor Class (the plan), pursuant to Rule 12b-1 of the 1940 Act. The plan provides that the Advisor Class will pay ACIS an annual distribution and service fee of 0.25%. The fees are computed and accrued daily based on the Advisor Class’s daily net assets and paid monthly in arrears. The fees are used to pay financial intermediaries for distribution and individual shareholder services. Fees incurred under the plan during the period ended September 30, 2018 are detailed in the Statement of Operations.
Trustees’ Fees and Expenses — The Board of Trustees is responsible for overseeing the investment advisor’s management and operations of the fund. The trustees receive detailed information about the fund and its investment advisor regularly throughout the year, and meet at least quarterly with management of the investment advisor to review reports about fund operations. The fund’s officers do not receive compensation from the fund.
14
Interfund Transactions — The fund may enter into security transactions with other American Century Investments funds and other client accounts of the investment advisor, in accordance with the 1940 Act rules and procedures adopted by the Board of Trustees. The rules and procedures require, among other things, that these transactions be effected at the independent current market price of the security. There were no interfund transactions during the period.
4. Investment Transactions
Purchases and sales of investment securities, excluding short-term investments, for the period ended September 30, 2018 were $19,783,531 and $35,837,245, respectively, all of which are U.S. Treasury and Government Agency obligations.
5. Capital Share Transactions
Transactions in shares of the fund were as follows (unlimited number of shares authorized):
| Year ended September 30, 2018 | Year ended September 30, 2017 | |||||||||
| Shares | Amount | Shares | Amount | |||||||
| Investor Class | ||||||||||
| Sold | 280,323 | $ | 27,453,156 | 394,401 | $ | 38,617,981 | ||||
| Issued in reinvestment of distributions | 63,131 | 5,996,768 | 60,730 | 5,586,523 | ||||||
| Redeemed | (437,888 | ) | (42,848,471 | ) | (1,013,843 | ) | (98,248,631 | ) | ||
| Reverse share split | (64,197 | ) | — | (61,849 | ) | — | ||||
| (158,631 | ) | (9,398,547 | ) | (620,561 | ) | (54,044,127 | ) | |||
| Advisor Class | ||||||||||
| Sold | 3,886 | 362,353 | 5,785 | 533,670 | ||||||
| Issued in reinvestment of distributions | 728 | 65,926 | 677 | 59,602 | ||||||
| Redeemed | (6,597 | ) | (610,730 | ) | (19,838 | ) | (1,849,737 | ) | ||
| Reverse share split | (748 | ) | — | (691 | ) | — | ||||
| (2,731 | ) | (182,451 | ) | (14,067 | ) | (1,256,465 | ) | |||
| Net increase (decrease) | (161,362 | ) | $ | (9,580,998 | ) | (634,628 | ) | $ | (55,300,592 | ) |
6. Fair Value Measurements
The fund’s investments valuation process is based on several considerations and may use multiple inputs to determine the fair value of the investments held by the fund. In conformity with accounting principles generally accepted in the United States of America, the inputs used to determine a valuation are classified into three broad levels.
| • | Level 1 valuation inputs consist of unadjusted quoted prices in an active market for identical investments. |
| • | Level 2 valuation inputs consist of direct or indirect observable market data (including quoted prices for comparable investments, evaluations of subsequent market events, interest rates, prepayment speeds, credit risk, etc.). These inputs also consist of quoted prices for identical investments initially expressed in local currencies that are adjusted through translation into U.S. dollars. |
| • | Level 3 valuation inputs consist of unobservable data (including a fund’s own assumptions). |
The level classification is based on the lowest level input that is significant to the fair valuation measurement. The valuation inputs are not necessarily an indication of the risks associated with investing in these securities or other financial instruments.
15
The following is a summary of the level classifications as of period end. The Schedule of Investments provides additional information on the fund’s portfolio holdings.
| Level 1 | Level 2 | Level 3 | ||||||
| Assets | ||||||||
| Investment Securities | ||||||||
| Zero-Coupon U.S. Treasury Securities and Equivalents | — | $ | 107,086,799 | — | ||||
| Zero-Coupon U.S. Government Agency Securities | — | 14,693,991 | — | |||||
| Temporary Cash Investments | $ | 478 | 559,000 | — | ||||
| $ | 478 | $ | 122,339,790 | — | ||||
7. Federal Tax Information
The tax character of distributions paid during the years ended September 30, 2018 and September 30, 2017 were as follows:
| 2018 | 2017 | |||||
| Distributions Paid From | ||||||
| Ordinary income | $ | 4,644,671 | $ | 5,753,973 | ||
| Long-term capital gains | $ | 1,525,672 | — | |||
The book-basis character of distributions made during the year from net investment income or net realized gains may differ from their ultimate characterization for federal income tax purposes. These differences reflect the differing character of certain income items and net realized gains and losses for financial statement and tax purposes, and may result in reclassification among certain capital accounts on the financial statements.
As of period end, the federal tax cost of investments and the components of distributable earnings on a tax-basis were as follows:
| Federal tax cost of investments | $ | 107,921,776 | |
| Gross tax appreciation of investments | $ | 15,131,832 | |
| Gross tax depreciation of investments | (713,340 | ) | |
| Net tax appreciation (depreciation) of investments | 14,418,492 | ||
| Undistributed ordinary income | $ | 3,243,421 | |
| Accumulated long-term gain | $ | 2,160,869 | |
The difference between book-basis and tax-basis unrealized appreciation (depreciation) is attributable primarily to the tax deferral of losses on wash sales.
8. Recently Issued Accounting Standards
In March 2017, the Financial Accounting Standards Board (FASB) issued Accounting Standards Update No. 2017-08, “Receivables - Nonrefundable Fees and Other Costs (Subtopic 310-20), Premium Amortization on Purchased Callable Debt Securities” (ASU 2017-08). ASU 2017-08 amends the amortization period for certain purchased callable debt securities held at a premium, shortening such period to the earliest call date. The amendments are effective for fiscal years, and interim periods within those fiscal years, beginning after December 15, 2018. Management is currently evaluating the impact that adopting ASU 2017-08 will have on the financial statements.
16
| Financial Highlights |
| For a Share Outstanding Throughout the Years Ended September 30 (except as noted) | ||||||||||||||||
| Per-Share Data | Ratios and Supplemental Data | |||||||||||||||
| Income From Investment Operations: | Distributions From: | Ratio to Average Net Assets of: | ||||||||||||||
Net Asset Value, Beginning of Period | Net Investment Income (Loss)(1) | Net Realized and Unrealized Gain (Loss) | Total From Investment Operations | Net Investment Income | Net Realized Gains | Total Distributions | Reverse Share Split | Net Asset Value, End of Period | Total Return(2) | Operating Expenses | Net Investment Income (Loss) | Portfolio Turnover Rate | Net Assets, End of Period (in thousands) | |||
| Investor Class | ||||||||||||||||
| 2018 | $99.63 | 3.57 | (6.79) | (3.22) | (3.19) | (1.05) | (4.24) | 4.24 | $96.41 | (3.24)% | 0.55% | 3.66% | 15% | $120,676 | ||
| 2017 | $101.92 | 3.28 | (5.57) | (2.29) | (3.25) | — | (3.25) | 3.25 | $99.63 | (2.25)% | 0.55% | 3.36% | 13% | $140,516 | ||
| 2016 | $95.42 | 2.82 | 3.68 | 6.50 | (2.49) | (0.27) | (2.76) | 2.76 | $101.92 | 6.82% | 0.56% | 2.87% | 55% | $206,997 | ||
| 2015 | $88.86 | 2.88 | 3.68 | 6.56 | (2.29) | — | (2.29) | 2.29 | $95.42 | 7.38% | 0.55% | 3.08% | 33% | $191,827 | ||
| 2014 | $82.55 | 2.90 | 3.41 | 6.31 | (3.25) | (6.09) | (9.34) | 9.34 | $88.86 | 7.65% | 0.55% | 3.41% | 24% | $148,183 | ||
| Advisor Class | ||||||||||||||||
| 2018 | $94.98 | 3.17 | (6.47) | (3.30) | (2.94) | (1.05) | (3.99) | 3.99 | $91.68 | (3.48)% | 0.80% | 3.41% | 15% | $1,297 | ||
| 2017 | $97.41 | 2.90 | (5.33) | (2.43) | (3.01) | — | (3.01) | 3.01 | $94.98 | (2.49)% | 0.80% | 3.11% | 13% | $1,604 | ||
| 2016 | $91.43 | 2.49 | 3.49 | 5.98 | (2.26) | (0.27) | (2.53) | 2.53 | $97.41 | 6.54% | 0.81% | 2.62% | 55% | $3,015 | ||
| 2015 | $85.35 | 2.55 | 3.53 | 6.08 | (2.06) | — | (2.06) | 2.06 | $91.43 | 7.12% | 0.80% | 2.83% | 33% | $2,578 | ||
| 2014 | $79.49 | 2.57 | 3.29 | 5.86 | (3.05) | (6.09) | (9.14) | 9.14 | $85.35 | 7.37% | 0.80% | 3.16% | 24% | $2,667 | ||
| Notes to Financial Highlights |
| (1) | Computed using average shares outstanding throughout the period. |
| (2) | Total returns are calculated based on the net asset value of the last business day. Total returns for periods less than one year are not annualized. |
See Notes to Financial Statements.
| Report of Independent Registered Public Accounting Firm |
To the Board of Trustees of American Century Target Maturities Trust and Shareholders of Zero Coupon 2025 Fund:
Opinion on the Financial Statements
We have audited the accompanying statement of assets and liabilities, including the schedule of investments, of Zero Coupon 2025 Fund (one of the funds constituting American Century Target Maturities Trust, referred to hereafter as the “Fund”) as of September 30, 2018, the related statement of operations for the year ended September 30, 2018, the statement of changes in net assets for each of the two years in the period ended September 30, 2018, including the related notes, and the financial highlights for each of the five years in the period ended September 30, 2018 (collectively referred to as the “financial statements”). In our opinion, the financial statements present fairly, in all material respects, the financial position of the Fund as of September 30, 2018, the results of its operations for the year then ended, the changes in its net assets for each of the two years in the period ended September 30, 2018 and the financial highlights for each of the five years in the period ended September 30, 2018 in conformity with accounting principles generally accepted in the United States of America.
Basis for Opinion
These financial statements are the responsibility of the Fund’s management. Our responsibility is to express an opinion on the Fund’s financial statements based on our audits. We are a public accounting firm registered with the Public Company Accounting Oversight Board (United States) (“PCAOB”) and are required to be independent with respect to the Fund in accordance with the U.S. federal securities laws and the applicable rules and regulations of the Securities and Exchange Commission and the PCAOB.
We conducted our audits of these financial statements in accordance with the standards of the PCAOB. Those standards require that we plan and perform the audit to obtain reasonable assurance about whether the financial statements are free of material misstatement, whether due to error or fraud.
Our audits included performing procedures to assess the risks of material misstatement of the financial statements, whether due to error or fraud, and performing procedures that respond to those risks. Such procedures included examining, on a test basis, evidence regarding the amounts and disclosures in the financial statements. Our audits also included evaluating the accounting principles used and significant estimates made by management, as well as evaluating the overall presentation of the financial statements. Our procedures included confirmation of securities owned as of September 30, 2018 by correspondence with the custodian. We believe that our audits provide a reasonable basis for our opinion.
/s/ PricewaterhouseCoopers LLP
Kansas City, Missouri
November 16, 2018
We have served as the auditor of one or more investment companies in American Century Investments since 1997.
18
| Management |
Board of Trustees
The individuals listed below serve as trustees of the funds. Each trustee will continue to serve in this capacity until death, retirement, resignation or removal from office. The board has adopted a mandatory retirement age for trustees who are not “interested persons,” as that term is defined in the Investment Company Act (independent trustees). Independent trustees shall retire on December 31 of the year in which they reach their 75th birthday; provided, however, that on or after January 1, 2022, independent trustees shall retire on December 31 of the year in which they reach their 76th birthday.
Mr. Thomas is an “interested person” because he currently serves as President and Chief Executive Officer of American Century Companies, Inc. (ACC), the parent company of American Century Investment Management, Inc. (ACIM or the advisor). The other trustees (more than three-fourths of the total number) are independent. They are not employees, directors or officers of, and have no financial interest in, ACC or any of its wholly owned, direct or indirect, subsidiaries, including ACIM, American Century Investment Services, Inc. (ACIS) and American Century Services, LLC (ACS), and they do not have any other affiliations, positions or relationships that would cause them to be considered “interested persons” under the Investment Company Act. The trustees serve in this capacity for eight (in the case of Jonathan S. Thomas, 16; and Ronald J. Gilson, 9) registered investment companies in the American Century Investments family of funds.
The following table presents additional information about the trustees. The mailing address for each trustee other than Mr. Thomas is 1665 Charleston Road, Mountain View, California 94043. The mailing address for Mr. Thomas is 4500 Main Street, Kansas City, Missouri 64111.
| Name (Year of Birth) | Position(s) Held with Funds | Length of Time Served | Principal Occupation(s) During Past 5 Years | Number of American Century Portfolios Overseen by Trustee | Other Directorships Held During Past 5 Years |
| Independent Trustees | |||||
| Tanya S. Beder (1955) | Trustee | Since 2011 | Chairman and CEO, SBCC Group Inc. (independent advisory services) (2006 to present) | 45 | CYS Investments, Inc.; Nabors Industries Ltd. |
| Jeremy I. Bulow (1954) | Trustee | Since 2011 | Professor of Economics, Stanford University, Graduate School of Business (1979 to present) | 45 | None |
| Anne Casscells (1958) | Trustee | Since 2016 | Co-Chief Executive Officer and Chief Investment Officer, Aetos Alternatives Management (investment advisory firm) (2001 to present); Lecturer in Accounting, Stanford University, Graduate School of Business (2009 to present) | 45 | None |
| Ronald J. Gilson (1946) | Trustee and Chairman of the Board | Since 1995 (Chairman since 2005) | Charles J. Meyers Professor of Law and Business, Emeritus, Stanford Law School (1979 to 2016); Marc and Eva Stern Professor of Law and Business, Columbia University School of Law (1992 to present) | 50 | None |
19
| Name (Year of Birth) | Position(s) Held with Funds | Length of Time Served | Principal Occupation(s) During Past 5 Years | Number of American Century Portfolios Overseen by Trustee | Other Directorships Held During Past 5 Years |
| Independent Trustees | |||||
| Frederick L. A. Grauer (1946) | Trustee | Since 2008 | Senior Advisor, iShares by BlackRock, Inc. (investment management firm) (2010 to 2011, 2013 to 2015); Senior Advisor, Course Hero (an educational technology company) (2015 to present) | 45 | None |
| Jonathan D. Levin (1972) | Trustee | Since 2016 | Philip H. Knight Professor and Dean, Graduate School of Business, Stanford University (2016 to present); Professor, Stanford University, (2000 to present); Chair, Department of Economics, Stanford University (2011 to 2014) | 45 | None |
| Peter F. Pervere (1947) | Trustee | Since 2007 | Retired | 45 | None |
| John B. Shoven (1947) | Trustee | Since 2002 | Charles R. Schwab Professor of Economics, Stanford University (1973 to present) | 45 | Cadence Design Systems; Exponent; Financial Engines |
| Interested Trustee | |||||
| Jonathan S. Thomas (1963) | Trustee and President | Since 2007 | President and Chief Executive Officer, ACC (2007 to present). Also serves as Chief Executive Officer, ACS; Executive Vice President, ACIM; Director, ACC, ACIM and other ACC subsidiaries | 117 | BioMed Valley Discoveries, Inc. |
The Statement of Additional Information has additional information about the fund's trustees and is available without charge, upon request, by calling 1-800-345-2021.
20
Officers
The following table presents certain information about the executive officers of the funds. Each officer serves as an officer for 16 (in the case of Robert J. Leach, 15) investment companies in the American Century family of funds. No officer is compensated for his or her service as an officer of the funds. The listed officers are interested persons of the funds and are appointed or re-appointed on an annual basis. The mailing address for each of the officers listed below is 4500 Main Street, Kansas City, Missouri 64111.
| Name (Year of Birth) | Offices with the Funds | Principal Occupation(s) During the Past Five Years |
| Jonathan S. Thomas (1963) | Trustee and President since 2007 | President and Chief Executive Officer, ACC (2007 to present). Also serves as Chief Executive Officer, ACS; Executive Vice President, ACIM; Director, ACC, ACIM and other ACC subsidiaries |
| R. Wes Campbell (1974) | Chief Financial Officer and Treasurer since 2018 | Investment Operations and Investment Accounting, ACS (2000 to present) |
| Amy D. Shelton (1964) | Chief Compliance Officer and Vice President since 2014 | Chief Compliance Officer, American Century funds, (2014 to present); Chief Compliance Officer, ACIM (2014 to present); Chief Compliance Officer, ACIS (2009 to present); Vice President, Client Interactions and Marketing, ACIS (2013 to 2014). Also serves as Vice President, ACIS |
| Charles A. Etherington (1957) | General Counsel since 2007 and Senior Vice President since 2006 | Attorney, ACC (1994 to present); Vice President, ACC (2005 to present); General Counsel, ACC (2007 to present). Also serves as General Counsel, ACIM, ACS, ACIS and other ACC subsidiaries; and Senior Vice President, ACIM and ACS |
| C. Jean Wade (1964) | Vice President since 2012 | Senior Vice President, ACS (2017 to present); Vice President, ACS (2000 to 2017) |
| Robert J. Leach (1966) | Vice President since 2006 | Vice President, ACS (2000 to present) |
| David H. Reinmiller (1963) | Vice President since 2000 | Attorney, ACC (1994 to present). Also serves as Vice President, ACIM and ACS |
| Ward D. Stauffer (1960) | Secretary since 2005 | Attorney, ACC (2003 to present) |
21
Approval of Management Agreement |
At a meeting held on June 19, 2018, the Fund’s Board of Trustees (the "Board") unanimously approved the renewal of the management agreement pursuant to which American Century Investment Management, Inc. (the “Advisor”) acts as the investment advisor for the Fund. Under Section 15(c) of the Investment Company Act, contracts for investment advisory services are required to be reviewed, evaluated, and approved by a majority of a fund’s directors/trustees, including a majority of the independent Trustees, each year. The Board regards this annual evaluation and renewal as one of its most important responsibilities.
The independent Trustees have memorialized a statement regarding the relationship between their ongoing obligations to oversee and evaluate the performance of the Advisor and their annual consideration of renewal of the management agreement. In that statement, the independent Trustees noted that their assessment of the Advisor’s performance is an ongoing process that takes place over the entire year and is informed by all of the extensive information that the Board and its committees receive and consider over time. This information, together with the additional materials provided specifically in connection with the review, are central to the Board’s assessment of the Advisor’s performance and its determination whether to renew the Fund’s management agreement.
Prior to its consideration of the renewal of the management agreement, the Board requested and reviewed extensive data and analysis relating to the proposed renewal. This information and analysis was compiled by the Advisor and certain independent providers of evaluation data concerning the Fund and the services provided to the Fund by the Advisor.
In connection with its consideration of the renewal of the management agreement, the Board’s review and evaluation of the services provided by the Advisor included, but was not limited to, the following:
| • | the nature, extent, and quality of investment management, shareholder services, and other services provided to the Fund; |
| • | the wide range of other programs and services the Advisor provides to the Fund and its shareholders on a routine and non-routine basis; |
| • | the investment performance of the Fund, including data comparing the Fund’s performance to appropriate benchmarks and/or a peer group of other mutual funds with similar investment objectives and strategies; |
| • | the cost of owning the Fund compared to the cost of owning similar funds; |
| • | the Advisor’s compliance policies, procedures, and regulatory experience; |
| • | financial data showing the cost of services provided to the Fund, the profitability of the Fund to the Advisor, and the overall profitability of the Advisor; |
| • | strategic plans of the Advisor; |
| • | any economies of scale associated with the Advisor’s management of the Fund and other accounts; |
| • | services provided and charges to other investment management clients of the Advisor; |
| • | acquired fund fees and expenses; |
| • | payments and practices in connection with financial intermediaries holding shares of the Fund and the services provided by intermediaries in connection therewith; and |
| • | any collateral benefits derived by the Advisor from the management of the Fund. |
In keeping with its practice, the Board held two in-person meetings to review and discuss the information provided in response to their request and held active discussions with the Advisor regarding the renewal of the management agreement. The independent Trustees had the benefit of the advice of their independent counsel throughout the process.
22
Factors Considered
The Trustees considered all of the information provided by the Advisor, the independent data providers, and the independent Trustees’ independent counsel in connection with the approval. They determined that the information was sufficient for them to evaluate the management agreement for the Fund. In connection with their review, the Trustees did not identify any single factor as being all-important or controlling and each Trustee may have attributed different levels of importance to different factors. In deciding to renew the management agreement, the Board based its decision on a number of factors, including the following:
Nature, Extent and Quality of Services - Generally. Under the management agreement, the Advisor is responsible for providing or arranging for all services necessary for the operation of the Fund. The Board noted that the Advisor provides or arranges at its own expense a wide variety of services including:
| • | constructing and designing the Fund |
| • | portfolio research and security selection |
| • | initial capitalization/funding |
| • | securities trading |
| • | Fund administration |
| • | custody of Fund assets |
| • | daily valuation of the Fund’s portfolio |
| • | shareholder servicing and transfer agency, including shareholder confirmations, recordkeeping, and communications |
| • | legal services (except the independent Trustees’ counsel) |
| • | regulatory and portfolio compliance |
| • | financial reporting |
| • | marketing and distribution (except amounts paid by the Fund under Rule 12b-1 plans) |
The Board noted that many of these services have expanded over time in terms of both quantity and complexity in response to shareholder demands, competition in the industry, changing distribution channels, and the changing regulatory environment.
Investment Management, Shareholder, and Other Services. The nature of the investment management services provided to the Fund is quite complex and allows Fund shareholders access to professional money management, instant diversification of their investments within an asset class, the opportunity to easily diversify among asset classes by investing in or exchanging among various American Century Investments funds, and liquidity. In evaluating investment performance, the Board expects the Advisor to manage the Fund in accordance with its investment objectives and approved strategies. Further, the Trustees recognize that the Advisor has an obligation to seek the best execution of fund trades. In providing these services, the Advisor utilizes teams of investment professionals (portfolio managers, analysts, research assistants, and securities traders) who require extensive information technology, research, training, compliance, and other systems to conduct their business. The Board, directly and through its Portfolio Committee, regularly reviews investment performance information for the Fund, together with comparative information for appropriate benchmarks and/or peer groups of similarly-managed funds, over different time horizons. The Trustees also review detailed performance information during the management agreement approval process. If performance concerns are identified, the Fund receives special reviews until performance improves, during which the Board discusses with the Advisor the reasons for such results (e.g., market conditions, security selection) and any efforts being undertaken to improve performance. The Fund’s performance was above its benchmark for the one-, three-, and five-year periods and below its benchmark for the ten-year period reviewed by the Board. The Board found the investment management services provided by the Advisor to the Fund to be satisfactory and consistent with the management agreement.
23
Under the management agreement, the Advisor provides the Fund with a comprehensive package of transfer agency, shareholder, and other services. The Board, directly and through various committees of the Board, regularly reviews reports and evaluations of such services at its regular meetings. These reports include, but are not limited to, information regarding the operational efficiency and accuracy of the shareholder and transfer agency services provided, staffing levels, shareholder satisfaction (as measured by external as well as internal sources), technology support, new products and services offered to Fund shareholders, securities trading activities, portfolio valuation services, auditing services, and legal and operational compliance activities. The Board found the services provided by the Advisor to the Fund under the management agreement to be competitive and of high quality.
Costs of Services and Profitability. The Advisor provides detailed information concerning its cost of providing various services to the Fund, its profitability in managing the Fund, its overall profitability, and its financial condition. The Trustees have reviewed with the Advisor the methodology used to prepare this financial information. This information is considered in evaluating the Advisor’s financial condition, its ability to continue to provide services under the management agreement, and the reasonableness of the current management fee. The Board concluded that the Advisor’s profits were reasonable in light of the services provided to the Fund.
Economies of Scale. The Board also reviewed information provided by the Advisor regarding the possible existence of economies of scale in connection with the management of the Fund. The Board concluded that economies of scale are difficult to measure and predict with precision, especially on a fund-by-fund basis. The Board concluded that the Advisor is appropriately sharing economies of scale through its competitive fee structure, offering competitive fees from fund inception, and through reinvestment in its business to provide shareholders enhanced and expanded services.
Comparison to Other Funds’ Fees. The management agreement provides that the Fund pays the Advisor a single, all-inclusive (or unified) management fee for providing all services necessary for the management and operation of the Fund, other than brokerage expenses, expenses attributable to short sales, taxes, interest, extraordinary expenses, the fees and expenses of the Fund’s independent Trustees (including their independent legal counsel), and expenses incurred in connection with the provision of shareholder services and distribution services under a plan adopted pursuant to Rule 12b-1 under the 1940 Act. Under the unified fee structure, the Advisor is responsible for providing all investment advisory, custody, audit, administrative, compliance, recordkeeping, marketing, and shareholder services, or arranging and supervising third parties to provide such services. By contrast, most other funds are charged a variety of fees, including an investment advisory fee, a transfer agency fee, an administrative fee, distribution charges, and other expenses. Other than their investment advisory fees and any applicable Rule 12b-1 distribution fees, all other components of the total fees charged by these other funds may be increased without shareholder approval. The Board believes the unified fee structure is a benefit to Fund shareholders because it clearly discloses to shareholders the cost of owning Fund shares, and, since the unified fee cannot be increased without a vote of Fund shareholders, it shifts to the Advisor the risk of increased costs of operating the Fund and provides a direct incentive to minimize administrative inefficiencies. Part of the Board’s analysis of fee levels involves reviewing certain evaluative data compiled by an independent provider and comparing the Fund’s unified fee to the total expense ratio of peer funds. The unified fee charged to shareholders of the Fund was in the lowest quartile of the total expense ratios of the Fund’s peer universe. The Board concluded that the management fee paid by the Fund to the Advisor under the management agreement is reasonable in light of the services provided to the Fund.
Comparison to Fees and Services Provided to Other Clients of the Advisor. The Board also requested and received information from the Advisor concerning the nature of the services, fees, costs, and profitability of its advisory services to advisory clients other than the Fund. They observed that these varying types of client accounts require different services and involve different regulatory and entrepreneurial risks than the management of the Fund. The Board analyzed this
24
information and concluded that the fees charged and services provided to the Fund were reasonable by comparison.
Payments to Intermediaries. The Trustees also requested and received a description of payments made to intermediaries by the Fund and the Advisor and services provided by intermediaries. These payments include various payments made by the Fund or the Advisor to different types of intermediaries and recordkeepers for distribution and service activities provided for the Fund. The Trustees reviewed such information and received representations from the Advisor that all such payments by the Fund were made pursuant to the Fund’s Rule 12b-1 Plan and that all such payments by the Advisor were made from the Advisor’s resources and reasonable profits. The Board found such payments to be reasonable in scope and purpose.
Collateral or “Fall-Out” Benefits Derived by the Advisor. The Board considered the existence of collateral benefits the Advisor may receive as a result of its relationship with the Fund. The Board noted that the Advisor’s primary business is managing mutual funds and it generally does not use fund or shareholder information to generate profits in other lines of business, and therefore does not derive any significant collateral benefits from them. The Board noted that the Advisor may receive proprietary research from broker-dealers that execute fund portfolio transactions. The Board also determined that the Advisor is able to provide investment management services to certain clients other than the Fund, at least in part, due to its existing infrastructure built to serve the fund complex. The Board noted that the assets of those other accounts are, where applicable, included with the assets of the Fund to determine breakpoints in the management fee schedule.
Existing Relationship. The Board also considered whether there was any reason for not continuing the existing arrangement with the Advisor. In this regard, the Board was mindful of the potential disruptions of the Fund’s operations and various risks, uncertainties, and other effects that could occur as a result of a decision not to continue such relationship. In particular, the Board recognized that most shareholders have invested in the Fund on the strength of the Advisor’s industry standing and reputation and in the expectation that the Advisor will have a continuing role in providing advisory services to the Fund.
Conclusion of the Trustees. As a result of this process, the Board, including all of the independent Trustees and assisted by the advice of independent legal counsel, taking into account all of the factors discussed above and the information provided by the Advisor and others in connection with its review and throughout the year, concluded that the management agreement between the Fund and the Advisor is fair and reasonable in light of the services provided and should be renewed.
25
| Additional Information |
Retirement Account Information
As required by law, distributions you receive from certain retirement accounts are subject to federal income tax withholding, unless you elect not to have withholding apply*. Tax will be withheld on the total amount withdrawn even though you may be receiving amounts that are not subject to withholding, such as nondeductible contributions. In such case, excess amounts of withholding could occur. You may adjust your withholding election so that a greater or lesser amount will be withheld.
If you don’t want us to withhold on this amount, you must notify us to not withhold the federal income tax. You may notify us in writing or in certain situations by telephone or through other electronic means. For systematic withdrawals, your withholding election will remain in effect until revoked or changed by filing a new election. You have the right to revoke your election at any time and change your withholding percentage for future distributions.
Remember, even if you elect not to have income tax withheld, you are liable for paying income tax on the taxable portion of your withdrawal. If you elect not to have income tax withheld or you don’t have enough income tax withheld, you may be responsible for payment of estimated tax. You may incur penalties under the estimated tax rules if your withholding and estimated tax payments are not sufficient. You can reduce or defer the income tax on a distribution by directly or indirectly rolling such distribution over to another IRA or eligible plan. You should consult your tax advisor for additional information.
State tax will be withheld if, at the time of your distribution, your address is within one of the mandatory withholding states and you have federal income tax withheld (or as otherwise required by state law). State taxes will be withheld from your distribution in accordance with the respective state rules.
*Some 403(b), 457 and qualified retirement plan distributions may be subject to 20% mandatory withholding, as they are subject to special tax and withholding rules. Your plan administrator or plan sponsor is required to provide you with a special tax notice explaining those rules at the time you request a distribution. If applicable, federal and/or state taxes may be withheld from your distribution amount.
Proxy Voting Policies
Descriptions of the principles and policies that the fund's investment advisor uses in exercising the voting rights associated with the securities purchased and/or held by the fund are available without charge, upon request, by calling 1-800-345-2021 or visiting the "About Us" page of American Century Investments’ website at americancentury.com. A description of the policies is also available on the Securities and Exchange Commission’s website at sec.gov. Information regarding how the investment advisor voted proxies relating to portfolio securities during the most recent 12-month period ended June 30 is available on the "About Us" page at americancentury.com. It is also available at sec.gov.
Quarterly Portfolio Disclosure
The fund files its complete schedule of portfolio holdings with the Securities and Exchange Commission (SEC) for the first and third quarters of each fiscal year on Form N-Q. The fund’s Forms N-Q are available on the SEC’s website at sec.gov. The fund also makes its complete schedule of portfolio holdings for the most recent quarter of its fiscal year available on its website at americancentury.com and, upon request, by calling 1-800-345-2021.
26
Other Tax Information
The following information is provided pursuant to provisions of the Internal Revenue Code.
The fund hereby designates $1,659,252, or up to the maximum amount allowable, as long-term capital gain distributions (20% rate gain distributions) for the fiscal year ended September 30, 2018.
The fund utilized earnings and profits of $410,854 distributed to shareholders on redemption of shares as part of the dividends paid deduction (tax equalization).
27
| Notes |
28
| ||
| Contact Us | americancentury.com | |
| Automated Information Line | 1-800-345-8765 | |
| Investor Services Representative | 1-800-345-2021 or 816-531-5575 | |
| Investors Using Advisors | 1-800-378-9878 | |
| Business, Not-For-Profit, Employer-Sponsored Retirement Plans | 1-800-345-3533 | |
| Banks and Trust Companies, Broker-Dealers, Financial Professionals, Insurance Companies | 1-800-345-6488 | |
| Telecommunications Relay Service for the Deaf | 711 | |
| American Century Target Maturities Trust | ||
Investment Advisor: American Century Investment Management, Inc. Kansas City, Missouri | ||
| This report and the statements it contains are submitted for the general information of our shareholders. The report is not authorized for distribution to prospective investors unless preceded or accompanied by an effective prospectus. | ||
| ©2018 American Century Proprietary Holdings, Inc. All rights reserved. CL-ANN-90823 1811 | ||
ITEM 2. CODE OF ETHICS.
| (a) | The registrant has adopted a Code of Ethics for Senior Financial Officers that applies to the registrant’s principal executive officer, principal financial officer, principal accounting officer, and persons performing similar functions. |
| (b) | No response required. |
| (c) | None. |
| (d) | None. |
| (e) | Not applicable. |
| (f) | The registrant’s Code of Ethics for Senior Financial Officers was filed as Exhibit 12 (a)(1) to American Century Asset Allocation Portfolios, Inc.’s Annual Certified Shareholder Report on Form N-CSR, File No. 811-21591, on September 29, 2005, and is incorporated herein by reference. |
ITEM 3. AUDIT COMMITTEE FINANCIAL EXPERT.
| (a)(1) | The registrant's board has determined that the registrant has at least one audit committee financial expert serving on its audit committee. |
| (a)(2) | Tanya S. Beder, Anne Casscells, Peter F. Pervere and Ronald J. Gilson are the registrant's designated audit committee financial experts. They are "independent" as defined in Item 3 of Form N-CSR. |
| (a)(3) | Not applicable. |
| (b) | No response required. |
| (c) | No response required. |
| (d) | No response required. |
ITEM 4. PRINCIPAL ACCOUNTANT FEES AND SERVICES.
| (a) | Audit Fees. |
The aggregate fees billed for each of the last two fiscal years for professional services rendered by the principal accountant for the audit of the registrant’s annual financial statements or services that are normally provided by the accountant in connection with statutory and regulatory filings or engagements for those fiscal years were as follows:
FY 2017: $56,545
FY 2018: $53,619
| (b) | Audit-Related Fees. |
The aggregate fees billed in each of the last two fiscal years for assurance and related services by the principal accountant that are reasonably related to the performance of the audit of the registrant’s financial statements and are not reported under paragraph (a) of this Item were as follows:
For services rendered to the registrant:
FY 2017:$0
FY 2018:$0
Fees required to be approved pursuant to paragraph (c)(7)(ii) of Rule 2-01 of Regulation S-X (relating to certain engagements for non-audit services with the registrant’s investment adviser and its affiliates):
FY 2017:$0
FY 2018:$0
| (c) | Tax Fees. |
The aggregate fees billed in each of the last two fiscal years for professional services rendered by the principal accountant for tax compliance, tax advice, and tax planning were as follows:
For services rendered to the registrant:
FY 2017: $0
FY 2018: $0
Fees required to be approved pursuant to paragraph (c)(7)(ii) of Rule 2-01 of Regulation S-X (relating to certain engagements for non-audit services with the registrant’s investment adviser and its affiliates):
FY 2017: $0
FY 2018: $0
| (d) | All Other Fees. |
The aggregate fees billed in each of the last two fiscal years for products and services provided by the principal accountant, other than the services reported in paragraphs (a) through (c) of this Item were as follows:
For services rendered to the registrant:
FY 2017:$0
FY 2018:$0
Fees required to be approved pursuant to paragraph (c)(7)(ii) of Rule 2-01 of Regulation S-X (relating to certain engagements for non-audit services with the registrant’s investment adviser and its affiliates):
FY 2017:$0
FY 2018:$0
| (e)(1) | In accordance with paragraph (c)(7)(i)(A) of Rule 2-01 of Regulation S-X, before the accountant is engaged by the registrant to render audit or non-audit services, the engagement is approved by the registrant’s audit committee. Pursuant to paragraph (c)(7)(ii) of Rule 2-01 of Regulation S-X, the registrant’s audit committee also pre-approves its accountant’s engagements for non-audit services with the registrant’s investment adviser, its parent company, and any entity controlled by, or under common control with the investment adviser that provides ongoing services to the registrant, if the engagement relates directly to the operations and financial reporting of the registrant. |
| (e)(2) | All services described in each of paragraphs (b) through (d) of this Item were pre-approved before the engagement by the registrant’s audit committee pursuant to paragraph (c)(7)(i)(A) of Rule 2-01 of Regulation S-X. Consequently, none of such services were required to be approved by the audit committee pursuant to paragraph (c)(7)(i)(C). |
| (f) | The percentage of hours expended on the principal accountant’s engagement to audit the registrant’s financial statements for the most recent fiscal year that were attributed to work performed by persons other than the principal accountant’s full-time, permanent employees was less than 50%. |
| (g) | The aggregate non-audit fees billed by the registrant’s accountant for services rendered to the registrant, and rendered to the registrant’s investment adviser (not including any sub-adviser whose role is primarily portfolio management and is subcontracted with or overseen by another investment adviser), and any entity controlling, controlled by, or under common control with the adviser that provides ongoing services to the registrant for each of the last two fiscal years of the registrant were as follows: |
FY 2017: $145,111
FY 2018: $129,838
| (h) | The registrant’s investment adviser and accountant have notified the registrant’s audit committee of all non-audit services that were rendered by the registrant’s accountant to the registrant’s investment adviser, its parent company, and any entity controlled by, or under common control with the investment adviser that provides services to the registrant, which services were not required to be pre-approved pursuant to paragraph (c)(7)(ii) of Rule 2-01 of Regulation S-X. The notification provided to the registrant’s audit committee included sufficient details regarding such services to allow the registrant’s audit committee to consider the continuing independence of its principal accountant. |
ITEM 5. AUDIT COMMITTEE OF LISTED REGISTRANTS.
Not applicable.
ITEM 6. INVESTMENTS.
| (a) | The schedule of investments is included as part of the report to stockholders filed under Item 1 of this Form. |
| (b) | Not applicable. |
ITEM 7. DISCLOSURE OF PROXY VOTING POLICIES AND PROCEDURES FOR CLOSED-END MANAGEMENT INVESTMENT COMPANIES.
Not applicable.
ITEM 8. PORTFOLIO MANAGERS OF CLOSED-END MANAGEMENT INVESTMENT COMPANIES.
Not applicable.
ITEM 9. PURCHASES OF EQUITY SECURITIES BY CLOSED-END MANAGEMENT INVESTMENT COMPANY AND AFFILIATED PURCHASERS.
Not applicable.
ITEM 10. SUBMISSION OF MATTERS TO A VOTE OF SECURITY HOLDERS.
During the reporting period, there were no material changes to the procedures by which shareholders may recommend nominees to the registrant’s board.
ITEM 11. CONTROLS AND PROCEDURES.
| (a) | The registrant's principal executive officer and principal financial officer have concluded that the registrant's disclosure controls and procedures (as defined in Rule 30a-3(c) under the Investment Company Act of 1940) are effective based on their evaluation of these controls and procedures as of a date within 90 days of the filing date of this report. |
| (b) | There were no changes in the registrant's internal control over financial reporting (as defined in Rule 30a-3(d) under the Investment Company Act of 1940) that occurred during the period covered by this report that have materially affected, or are reasonably likely to materially affect, the registrant's internal control over financial reporting. |
ITEM 12. DISCLOSURE OF SECURITIES LENDING ACTIVITIES FOR CLOSED-END MANAGEMENT INVESTMENT COMPANIES.
Not applicable.
ITEM 13. EXHIBITS.
| (a)(1) | Registrant’s Code of Ethics for Senior Financial Officers, which is the subject of the disclosure required by Item 2 of Form N-CSR, was filed as Exhibit 12(a)(1) to American Century Asset Allocation Portfolios, Inc.’s Certified Shareholder Report on Form N-CSR, File No. 811-21591, on September 29, 2005. |
| (a)(2) | Separate certifications by the registrant’s principal executive officer and principal financial officer, pursuant to Section 302 of the Sarbanes-Oxley Act of 2002 and Rule 30a-2(a) under the Investment Company Act of 1940, are filed and attached hereto as EX-99.CERT. |
| (a)(3) | Not applicable. |
| (a)(4) | Not applicable. |
| (b) | A certification by the registrant’s chief executive officer and chief financial officer, pursuant to Section 906 of the Sarbanes-Oxley Act of 2002, is furnished and attached hereto as EX-99.906CERT. |
SIGNATURES
Pursuant to the requirements of the Securities Exchange Act of 1934 and the Investment Company Act of 1940, the registrant has duly caused this report to be signed on its behalf by the undersigned, thereunto duly authorized.
| Registrant: | American Century Target Maturities Trust | ||
| By: | /s/ Jonathan S. Thomas | ||
| Name: | Jonathan S. Thomas | ||
| Title: | President | ||
| Date: | November 27, 2018 | ||
Pursuant to the requirements of the Securities Exchange Act of 1934 and the Investment Company Act of 1940, this report has been signed below by the following persons on behalf of the registrant and in the capacities and on the dates indicated.
| By: | /s/ Jonathan S. Thomas | |
| Name: | Jonathan S. Thomas | |
| Title: | President | |
| (principal executive officer) | ||
| Date: | November 27, 2018 | |
| By: | /s/ R. Wes Campbell | |
| Name: | R. Wes Campbell | |
| Title: | Treasurer, and | |
| Chief Financial Officer | ||
| (principal financial officer) | ||
| Date: | November 27, 2018 | |