Item 1: Report to Shareholders| Tax-Free High Yield Fund | August 31, 2005 |
The views and opinions in this report were current as of August 31, 2005. They are not guarantees of performance or investment results and should not be taken as investment advice. Investment decisions reflect a variety of factors, and the managers reserve the right to change their views about individual stocks, sectors, and the markets at any time. As a result, the views expressed should not be relied upon as a forecast of the fund’s future investment intent. The report is certified under the Sarbanes-Oxley Act of 2002, which requires mutual funds and other public companies to affirm that, to the best of their knowledge, the information in their financial reports is fairly and accurately stated in all material respects.
REPORTS ON THE WEB
Sign up for our E-mail Program, and you can begin to receive updated fund reports and prospectuses online rather than through the mail. Log in to your account at troweprice.com for more information.
Fellow ShareholdersTax-free bonds produced positive returns that matched those of their taxable bond counterparts for the six-month period ended August 31, 2005. Short- and intermediate-term municipal yields increased as the Federal Reserve continued raising the overnight federal funds target rate, but long-term yields declined. Long-term and high-yield securities maintained their performance advantage over shorter-term and investment-grade issues.
MARKET ENVIRONMENT
Economic conditions were generally favorable during the last six months, despite surging oil prices. Annualized Gross Domestic Product (GDP) growth remained above 3%, the housing market stayed robust, job growth was steady, and the unemployment rate hovered around 5%. With core inflation benign, the Federal Reserve persisted in its gradual pace of raising the federal funds target rate to a less accommodative level. Since the end of February, the central bank lifted the target rate from 2.50% to 3.50% in four quarter-point increments.
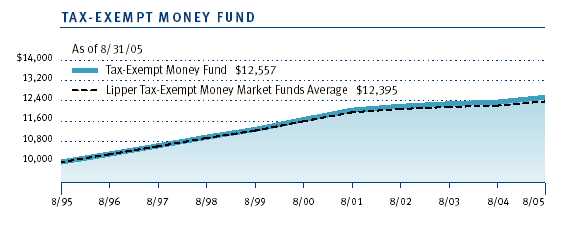
As shown in the graph, municipal money market and shorter-term bond yields rose in tandem with the federal funds rate in the last six months. Long-term rates edged lower, resulting in a flatter municipal yield curve and long-term municipal bonds outperforming shorter-term securities. The taxable bond market experienced the same trends, and municipal and taxable bond returns for the past six months were the same; the Lehman Brothers Municipal Bond Index and the Lehman Brothers U.S. Aggregate Index each returned 2.85%.

MUNICIPAL MARKET NEWS
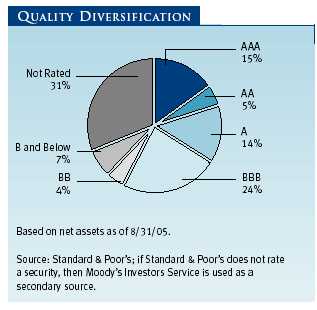
Tobacco bonds were top performers as yields in this industry fell to their lowest level on record. Overall, BBB and lower-rated bond returns were notably better than the broad index. Credit spreads for high-yield issues are about as narrow as they have been in five years, reflecting investor willingness in a healthy economy to seek incremental yield from higher-risk securities.
New municipal supply in the first eight months of 2005 totaled $276 billion (according to The Bond Buyer), a pace that will likely result in another year of record supply. Issuers are rapidly refinancing older, high-cost debt at lower yields. State income tax receipts are mostly higher than expected, strengthening the general obligation sector as overall state finances improve. Although individual investors’ demand for munis remains lukewarm because of the low rates, institutional demand, particularly from hedge funds and other nontraditional buyers of municipal securities, has picked up the slack. Overall, municipals are in demand despite good supply and low yields.
PORTFOLIO STRATEGY
Tax-Exempt Money Fund
Your fund outperformed its peers during the 6- and 12-month periods ended August 31, 2005, with returns of 0.98% and 1.56%, respectively, versus the Lipper peer group average of 0.83% and 1.31%. Money fund investors benefited from rising yields in response to continued tightening by the Federal Reserve. Since our February report, the fund’s seven-day simple yield has moved up 69 basis points to 2.08% (100 basis points equal one percent).
| PERFORMANCE COMPARISON |
| Periods Ended 8/31/05 | 6 Months | | 12 Months | |
| Tax-Exempt Money Fund | 0.98 | % | 1.56 | % |
| Lipper Tax-Exempt Money | | | | |
| Market Funds Average | 0.83 | | 1.31 | |
While the money market yield curve pushes higher with each Fed tightening, recent market action suggests we may be closing in on the Fed’s target rate. Notably, the money market curve is flatter than at our last report. One-year Libor (a taxable benchmark) is up 67 basis points yielding 4.24%, but its spread versus the overnight funds rate is narrower—about 65 basis points versus 110 basis points in February—suggesting the market thinks rates won’t go much higher. Municipal rates are higher as well, though the favorable yield relationship versus taxable money markets, which typified the past few years, has begun to dissipate. Municipal overnight and seven-day variable rates were about 75 basis points higher versus the prior six months, yielding on average 2.35%. One-year note yields increased 55 basis points over the same period, ending August at 2.95%.
For much of the past six months, we felt that yields on most longer-dated maturities did not fully reflect the impact of further Fed tightening. In March and April we sought to overweight our investments in the short end of the yield curve. May presented us with an opportunity to lock in attractive yields in slightly longer maturities out to about 90 days, allowing us to avoid the seasonal volatility in variable rates normally associated with June and July. In August, one-year notes briefly traded at yields that priced in our rate expectations, and we took advantage of that opportunity as well.
| PORTFOLIO DIVERSIFICATION |
| | Percent of | | Percent of | |
| | Net Assets | | Net Assets | |
| Periods Ended | 2/28/05 | | 8/31/05 | |
| Hospital Revenue | 22.3 | % | 22.0 | % |
| General Obligation – Local | 13.3 | | 14.6 | |
| General Obligation – State | 8.1 | | 10.6 | |
| Housing Finance Revenue | 7.1 | | 9.8 | |
| Educational Revenue | 14.6 | | 8.7 | |
| Dedicated Tax Revenue | 3.2 | | 7.1 | |
| Life Care/Nursing Home Revenue | 5.9 | | 6.6 | |
| Electric Revenue | 5.7 | | 5.8 | |
| Other Assets | 19.8 | | 14.8 | |
| Total | 100.0 | % | 100.0 | % |
The near-term outlook for interest rates has become much less certain due to Hurricane Katrina and its potential impact on the economy. The brief runup in yields in August has since reversed itself. Therefore, we find ourselves leery of extending the fund further in the near term, choosing instead to let the economic picture clear somewhat over the next few months.
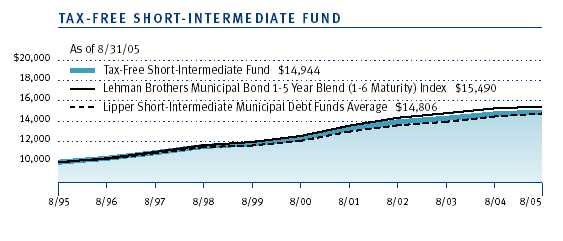
Tax-Free Short-Intermediate FundOver the past six months, fund performance precisely matched that of our Lipper peer group but was below the Lipper average for the 12-month period. Dividends per share remained stable at $0.07 during the six-month period, and the fund’s net asset value (NAV) declined slightly, from $5.40 to $5.38 per share.
| PERFORMANCE COMPARISON |
| Periods Ended 8/31/05 | 6 Months | | 12 Months | |
| Tax-Free Short- | | | | |
| Intermediate Fund | 1.03 | % | 1.24 | % |
| Lipper Short-Intermediate | | | | |
| Municipal Debt Funds Average | 1.03 | | 1.43 | |
The environment for short- to intermediate-term securities has been difficult, as the Federal Reserve raised the federal funds rate 2.5 percentage points since June 2004, from 1.00% to 3.5%. As a result, the yields on high-grade municipal bonds with maturities out to six years moved higher, although considerably less than the fed funds rate. Rising shorter-term rates have resulted in low returns for our segment of the market, but signs have begun to emerge that the worst may be over. Looking ahead, conditions should begin to improve. With rates now higher, we should be closer to the end than the beginning of the tightening cycle.
Our strategy focused on keeping the portfolio’s duration shorter than that of the benchmark while short-term rates were rising (duration is a measure of a bond fund’s sensitivity to changes in interest rates). We extended duration to a neutral position in March when rates hit their high points for the period. Our allocation of bonds has changed slightly since our last report; at the end of August, we held more two-year securities and a small position in longer-term intermediate bonds to take advantage of their higher yields. These changes were offset by a decrease in cash as well as in three- to four-year bonds, which appeared overvalued.
Credit quality has remained stable, reflecting an increased exposure to higher-quality sectors such as state and local general obligation, dedicated tax, and prerefunded bonds. During the period, we also exchanged out of high-quality states such as Virginia, Maryland, Florida, and Texas into others that had experienced problems during the economic slowdown. The latter group includes California, New York, Pennsylvania, and New Jersey—states we believe will benefit from improving credit quality and investor demand going forward.| PORTFOLIO DIVERSIFICATION |
| | Percent of | | Percent of | |
| | Net Assets | | Net Assets | |
| Periods Ended | 2/28/05 | | 8/31/05 | |
| General Obligation – State | 16.2 | % | 16.2 | % |
| Dedicated Tax Revenue | 13.4 | | 14.0 | |
| General Obligation – Local | 12.3 | | 12.9 | |
| Electric Revenue | 12.6 | | 10.9 | |
| Air and Sea Transportation Revenue | 8.6 | | 8.7 | | |
| Lease Revenue | 7.7 | | 7.3 | |
| Prerefunded Bonds | 4.6 | | 5.9 | |
| Hospital Revenue | 5.8 | | 5.1 | |
| Other Assets and Reserves | 18.8 | | 19.0 | |
| Total | 100.0 | % | 100.0 | % |
An operating change that took place over the summer is explained in detail in a shaded box following this letter. Briefly, in the past we limited the fund’s below investment-grade bonds to those rated BB. The fund can now invest up to 5% of its assets in noninvestment-grade securities with no minimum rating.
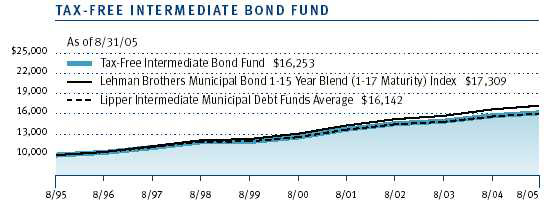
Tax-Free Intermediate Bond Fund
The fund outpaced its peer group average during the 6- and 12-month periods ended August 31, 2005, with returns of 1.80% and 2.84% versus 1.73% and 2.60%, respectively. The fund’s dividend remained stable at $0.20 per share during the past six months, and the NAV dropped a penny to $11.25 per share.
| PERFORMANCE COMPARISON |
| Periods Ended 8/31/05 | 6 Months | | 12 Months | |
| Tax-Free Intermediate | | | | |
| Bond Fund | 1.80 | % | 2.84 | % |
| Lipper Intermediate | | | | |
| Municipal Debt Funds Average | 1.73 | | 2.60 | |
We were generally negative on interest rates, believing they would be rising throughout 2005, and our plan was to keep duration short of the benchmark’s (duration is a measure of a bond fund’s sensitivity to changes in interest rates). We did, however, take advantage of opportunities that presented themselves in March by extending to a neutral position when yields hit their high points for the period. At the end of August, we shortened duration again because of the bond market rally following Hurricane Katrina’s devastation of the Gulf Coast, which sent yields lower and prices higher.
As we entered the six-month period, we had adopted a moderate so-called “barbell” structure—consisting of shorter and longer maturities—to take advantage of the flattening yield curve we saw emerging. We accomplished this by allocating 10% to 15% of the portfolio in bonds with unusually long maturities for our fund, while simultaneously overweighting cash and short-term bonds. As the yield curve flattened, we opportunistically moderated this structure by reducing some of our longer-maturity positions and moving into 7- to 15-year bonds.
| PORTFOLIO DIVERSIFICATION |
| | Percent of | | Percent of | |
| | Net Assets | | Net Assets | |
| Periods Ended | 2/28/05 | | 8/31/05 | |
| General Obligation – Local | 13.3 | % | 14.9 | % |
| Prerefunded Bonds | 11.5 | | 14.5 | |
| Dedicated Tax Revenue | 9.7 | | 11.1 | |
| Electric Revenue | 12.5 | | 10.7 | |
| Lease Revenue | 10.5 | | 10.0 | |
| General Obligation – State | 7.4 | | 8.2 | |
| Hospital Revenue | 9.3 | | 7.6 | |
| Air and Sea Transportation Revenue | 5.9 | | 5.6 | |
| Other Assets and Reserves | 19.9 | | 17.4 | |
| Total | 100.0 | % | 100.0 | % |
Our sector allocation changed little on balance over the past six months. We increased exposure somewhat to higher-quality sectors such as local general obligation, prerefunded, and dedicated tax revenue bonds and decreased exposure to electric utility and hospital revenue securities. This strategy was more a result of valuation than an effort to increase credit quality. We believe municipal credit quality is still improving, but tight yield spreads due to heavy demand for higher-yielding bonds have made it difficult to find good opportunities in revenue bonds. On the other end of the spectrum, we did continue to build exposure to below investment-grade bonds, a program that began in fall 2004 and continued into this year. We believe that over time this program will enable us to better utilize our proprietary research and increase portfolio returns.
Tax-Free Income Fund
Despite a backdrop of rising short-term rates over the past six months, long-term rates actually fell, leading to positive returns for longer-term bond funds. The Tax-Free Income Fund and Advisor Class produced good returns for the six-month and one-year periods, exceeding the peer group average in both time frames. Since the end of February the fund’s NAV rose $0.07 to $10.13, while the dividend remained stable at $0.22 cents a share.
| PERFORMANCE COMPARISON |
| Periods Ended 8/31/05 | 6 Months | | 12 Months | |
| Tax-Free Income Fund | 2.89 | % | 5.43 | % |
| Tax-Free Income Fund– | | | | |
| Advisor Class | 2.72 | | 5.20 | |
| Lipper General Municipal | | | | |
| Debt Funds Average | 2.50 | | 4.71 | |
Long-term rates fell roughly 30 basis points since February while short-term rates rose more than 50, creating a flatter yield curve. Since the Federal Reserve began its program of raising short-term rates, we have tilted the fund’s maturity profile toward a so-called “barbell” structure, emphasizing longer-term bonds balanced by a higher-than-normal level of very short-term debt and avoiding the middle of the yield curve. This structure served us well over the past year as long bonds performed best and rising short-term rates helped in the front end. We believe most of the Fed’s work is done in terms of returning short-term rates to more normal levels, so going forward we will begin moving back to a more typical structure, with “laddered” bond maturities—that is, bonds maturing periodically over time.
The generally low interest rate environment has unleashed a steady stream of debt refunding as issuers rush to lower their interest expense by calling in bonds issued as long as 10 years ago with higher yields. While we generally hold on to higher-yielding positions as a good source of income for the fund, these early terminations lower our income stream. Not all of the bonds leave the portfolio; some positions are advance-refunded to a call date anywhere from one to 10 years in the future. While this is generally positive from a credit standpoint as the debt typically becomes backed by U.S. Treasuries, it also results in shorter ultimate maturities. During the past six months, prerefunded debt in the portfolio rose 4% and, in total, represents about 20% of our holdings.
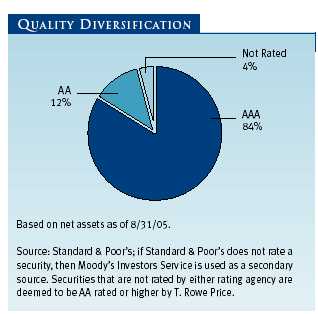
| PORTFOLIO DIVERSIFICATION |
| | Percent of | | Percent of | |
| | Net Assets | | Net Assets | |
| Periods Ended | 2/28/05 | | 8/31/05 | |
| Hospital Revenue | 15.2 | % | 16.4 | % |
| Prerefunded Bonds | 9.7 | | 13.7 | |
| Electric Revenue | 9.4 | | 9.4 | |
| General Obligation – Local | 8.9 | | 8.7 | |
| Dedicated Tax Revenue | 9.6 | | 8.5 | |
| General Obligation – State | 6.4 | | 7.4 | |
| Lease Revenue | 7.5 | | 6.5 | |
| Escrowed to Maturity | 6.5 | | 6.1 | |
| Other Assets and Reserves | 26.8 | | 23.3 | |
| Total | 100.0 | % | 100.0 | % |
We generally managed the portfolio’s interest rate risk with a neutral posture relative to our benchmarks. While we have been concerned about the potential for rising rates, the continued low volatility of the municipal bond market dictated a neutral posture. In what was mainly a range-bound market, we took advantage of a few opportunities to both extend and reduce interest rate exposure in a narrow band. To maintain our yield, we focused on certain bond structures that offer higher yields—for example, zero coupon and current coupon bonds as opposed to high-premium coupon bonds trading at high prices.
We also became more selective in our credit decisions. We sold one position we thought might be exposed to any potential weakness in the housing market. We added a few lower-rated bonds but offset them with sales of similarly rated bonds. Along with bond calls and refunded debt, the portfolio’s exposure to bonds rated A or lower fell from 25% to 22%, which is consistent with our view that lower-quality credits are fully priced with little room for further appreciation.
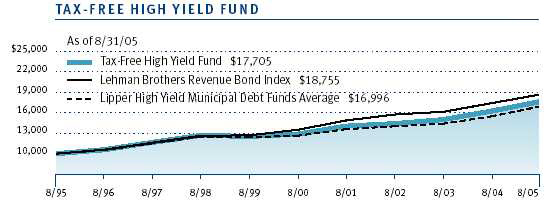
While it is too early to speculate about the ultimate impact of Hurricane Katrina’s destructive forces, the portfolio has minimal exposure to the carnage. We have no direct exposure to state and local government debt in the hurricane’s path, and only one-half of one-percent exposure to Entergy, the dominant utility in the area. The portfolio is well diversified in terms of credit risk, a good position to be in when disaster strikes. (Please refer to the fund’s portfolio of investments for a complete listing of holdings and the amount each represents of the portfolio.)Tax-Free High Yield Fund
The Tax-Free High Yield Fund slightly outpaced the Lipper peer average for the six-month period. For the 12 months ended August 31, 2005, the fund modestly lagged, returning 8.56% versus 8.71% for the Lipper average. The fund’s dividends per share remained steady at $0.29, while the NAV rose from $11.86 at the end of February to $12.06, resulting in a strong total return.
| PERFORMANCE COMPARISON |
| Periods Ended 8/31/05 | 6 Months | | 12 Months | |
| Tax-Free High Yield Fund | 4.20 | % | 8.56 | % |
| Lipper High Yield Municipal | | | | |
| Debt Funds Average | 4.16 | | 8.71 | |
Medium- and lower-quality bonds continued their impressive performance, outpacing AAA rated municipals by a considerable margin. Persistently low interest rates and solid economic underpinnings remained key drivers of demand in the tax-exempt high-yield marketplace. Limited new supply of higher-yielding bonds through the summer months also drove risk premiums lower during the period.
The fund benefited from its significant exposure to life care revenue bonds, which returned roughly 6% for the period, driven by improving demographics and a favorable credit environment, increased advance-refunding activity, and limited supply. Hospital revenue bonds also aided performance as the hospital portion of the Lehman Brothers Municipal Bond Index outperformed the overall average by approximately 1% over the six-month period. Hospitals have enjoyed a sustained period of financial improvement and solid reimbursement following the difficulties experienced in the late 1990s. We continue to maintain overweight positions in these sectors.
Toll road revenue bonds generated outstanding total returns for the period as well. In June, Pocahontas Parkway (Virginia) entered into a tentative agreement to sell the road to Transurban Inc., a for-profit operator, and the bonds rallied sharply in anticipation of a potential refunding in highly rated securities. Connector 2000 (South Carolina) bonds also strengthened. Positive factors for this project included improved usage, a toll increase, and increased merger and acquisition activity in the sector. (Please refer to the fund’s portfolio of investments for a complete listing of holdings and the amount each represents of the portfolio.)
Our conservative weightings in tobacco securitization bonds and airline-backed bonds tempered returns for the period. Tobacco bonds backed by the Master Settlement Agreement rallied sharply over the past 12 months as a string of litigation successes by “Big Tobacco,” most notably in the U.S. Department of Justice’s racketeering case, fueled demand in this sector. Unenhanced tobacco bonds rallied approximately 25% during the one-year period. Airline bonds also posted strong results for much of the period as participants reached for yield in this distressed area of the marketplace.
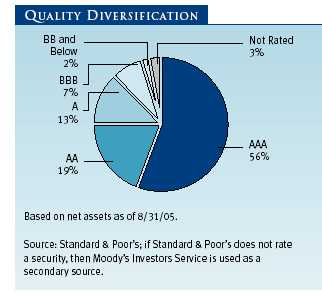
| PORTFOLIO DIVERSIFICATION |
| | Percent of | | Percent of | |
| Net Assets | | Net Assets | |
| Periods Ended | 2/28/05 | | 8/31/05 | |
| Life Care/Nursing Home Revenue | 16.0 | % | 15.1 | % |
| Hospital Revenue | 14.3 | | 14.7 | |
| Industrial and Pollution | | | | |
| Control Revenue | 13.0 | | 11.4 | |
| Prerefunded Bonds | 5.1 | | 8.9 | |
| Electric Revenue | 9.0 | | 8.6 | |
| Dedicated Tax Revenue | 6.8 | | 7.0 | |
| Lease Revenue | 7.4 | | 5.1 | |
| General Obligation – State | 3.4 | | 4.0 | |
| Other Assets and Reserves | 25.0 | | 25.2 | |
| Total | 100.0 | % | 100.0 | % |
Looking ahead, we believe that prospects for investing in higher-yielding sectors of the municipal market are mixed. While low interest rates and a growing U.S. economy provide a solid framework for high-yield investing, risk premiums in these sectors remain quite low versus historical norms. Heightened concerns about oil price spikes, the continuing impact of Hurricane Katrina, increased government spending, and higher short-term rates could ultimately force market participants to demand greater risk premiums in the months ahead. As always, we will rely on our research-intensive process in an effort to uncover undervalued securities within the high-yield municipal market.
OUTLOOK
For most of our reporting period, the municipal market seemed to accept higher short-term rates, a flatter yield curve, and a vigilant Fed bent on cooling the economy just enough to avoid a pace of economic growth that might stoke inflation. Hurricane Katrina, which devastated New Orleans and other cities along the Gulf Coast as our reporting period ended, has introduced higher levels of volatility while the market parses information about the emerging health of the economy. Although we expect the effects to be temporary, we believe it is appropriate to maintain a neutral to slightly cautious stance while we wait for a clearer view of the longer-term impact of this tragic natural disaster.
We thank you for your continued support.
Respectfully submitted,

Joseph K. Lynagh
Chairman of the Investment Advisory Committee
Tax-Exempt Money Fund

Charles B. Hill
Chairman of the Investment Advisory Committees
Tax-Free Short-Intermediate and Tax-Free Intermediate Bond Funds

Mary J. Miller
Chairman of the Investment Advisory Committee
Tax-Free Income Fund

James M. Murphy
Chairman of the Investment Advisory Committee
Tax-Free High Yield Fund
September 20, 2005
The committee chairmen have day-to-day responsibility for managing the portfolios and work with committee members in developing and executing the funds’ investment program.
T. ROWE PRICE TAX-FREE SHORT-INTERMEDIATE FUND, INC.
SUPPLEMENT TO PROSPECTUS DATED JULY 1, 2005
This updates the Tax-Free Short-Intermediate Fund’s prospectus dated July 1, 2005. On July 20, 2005, the fund’s Board of Directors authorized the fund to change the current restriction allowing the fund to invest up to 5% of its assets in noninvestment-grade securities with a rating no lower than BB to a new restriction allowing the fund to invest up to 5% of its assets in any type of noninvestment-grade security. Therefore, the prospectus has been revised as noted below. On page two of the prospectus, the last sentence of the Tax-Free Short-Intermediate Fund’s investment strategy has been revised as follows:
The fund may invest up to 5% of total assets in below investment-grade securities, including those with the lowest rating or, if unrated, believed by T. Rowe Price to be noninvestment grade.
On page 40, the “High-Yield, High-Risk Bonds” operating policy has been revised to state that the Tax-Free Short-Intermediate Fund may invest up to 5% of total assets in below investment-grade securities.
The date of this supplement is October 14, 2005.
RISKS OF FIXED-INCOME INVESTINGSince money market funds are managed to maintain a constant $1.00 share price, there should be little risk of principal loss. However, there is no assurance the fund will avoid principal losses if fund holdings default or are downgraded, or if interest rates rise sharply in an unusually short period. In addition, the fund’s yield will vary; it is not fixed for a specific period like the yield on a bank certificate of deposit. An investment in the fund is not insured or guaranteed by the Federal Deposit Insurance Corporation (FDIC) or any other government agency. Although a money market fund seeks to preserve the value of your investment at $1.00 per share, it is possible to lose money by investing in it.
Bonds are subject to interest rate risk (the decline in bond prices that usually accompanies a rise in interest rates) and credit risk (the chance that any fund holding could have its credit rating downgraded, or that a bond issuer will default by failing to make timely payments of interest or principal), potentially reducing the fund’s income level and share price. High-yield bonds could have greater price declines than funds that invest primarily in high-quality bonds. Municipalities issuing high-yield bonds are not as strong financially as those with higher credit ratings, so the bonds are usually considered speculative investments.
GLOSSARY
Average maturity: For a bond fund, the average of the stated maturity dates of the portfolio’s securities. In general, the longer the average maturity, the greater the fund’s sensitivity to interest rate changes, which means greater price fluctuation. A shorter average maturity usually means a less sensitive, and consequently, less volatile portfolio.
Basis points: One hundred basis points equal one percentage point.
Duration: A measure of a bond fund’s sensitivity to changes in interest rates. For example, a fund with a duration of 6.0 years would fall about 6% in price in response to a one-percentage-point rise in interest rates, and vice versa.
Fed funds target rate: An overnight lending rate set by the Federal Reserve and used by banks to meet reserve requirements. Banks also use the fed funds rate as a benchmark for their prime lending rates.
Lehman Brothers Municipal Bond Index: An unmanaged index that includes investment-grade, tax-exempt, and fixed-rate bonds with maturities greater than two years selected from issues larger than $75 million.
Lehman Brothers U.S. Aggregate Index: An unmanaged index made up of the Lehman Brothers Government/Corporate Bond Index, Mortgage-Backed Securities Index, and Asset-Backed Securities Index, including securities of investment-grade quality or better, with at least one year to maturity, and an outstanding par value of at least $250 million.
Libor rate: The rate that contributor banks in London offer one another for interbank deposits. In effect, the Libor rate is a rate at which a fellow London bank can borrow money from other banks.
Lipper averages: The averages of available mutual fund performance returns for specified time periods in defined categories as tracked by Lipper Inc.
Yield curve: A graphic depiction of the relationship among the yields for similar bonds with different maturities. A yield curve is positive when short-term yields are lower than long-term yields and negative when short-term yields are higher than long-term yields.
| PORTFOLIO CHARACTERISTICS |
| | |
| | | | | | | | | | | | | | | Tax-Free | | | | |
| | | Tax- | | | Tax-Free | | | Tax-Free | | | | | | Income | | | Tax-Free | |
| | | Exempt | | | Short- | | | Intermediate | | | Tax-Free | | | Fund– | | | High | |
| Periods Ended | | Money | | | Intermediate | | | Bond | | | Income | | | Advisor | | | Yield | |
| 8/31/05 | | Fund | | | Fund | | | Fund | | | Fund | | | Class | | | Fund | |
| Price Per Share | $ | 1.00 | | $ | 5.38 | | $ | 11.25 | | $ | 10.13 | | $ | 10.14 | | $ | 12.06 | |
| | |
| Dividends Per Share | | | | | | | | | | | | | | | | | | |
| For 6 months | | 0.010 | | | 0.07 | | | 0.20 | | | 0.22 | | | 0.20 | | | 0.29 | |
| For 12 months | | 0.015 | * | | 0.15 | * | | 0.40 | | | 0.43 | * | | 0.40 | | | 0.59 | * |
| | |
| Dividend Yield | | | | | | | | | | | | | | | | | | |
| (7-Day Simple) ** | | 2.08 | % | | – | | | – | | | – | | | – | | | – | |
| | |
| 30-Day | | | | | | | | | | | | | | | | | | |
| Dividend Yield ** | | – | | | 2.90 | % | | 3.61 | % | | 4.29 | % | | 3.98 | % | | 4.84 | % |
| | |
| 30-Day Standardized | | | | | | | | | | | | | | | | | | |
| Yield to Maturity | | – | | | 2.82 | | | 3.05 | | | 3.47 | | | 3.15 | | | 4.07 | |
| | |
| Weighted Average | | | | | | | | | | | | | | | | | | |
| Maturity (years) | | 47 | *** | | 3.9 | | | 7.6 | | | 13.8 | | | 13.8 | | | 17.5 | |
| | |
| Weighted Average | | | | | | | | | | | | | | | | | | |
| Effective Duration | | | | | | | | | | | | | | | | | | |
| (years) | | – | | | 3.1 | | | 4.6 | | | 5.3 | | | 5.3 | | | 5.1 | |
| | |
| * 12-month dividends may not equal the combined six-month figures due to rounding. | | |
| ** Dividends earned for the last 30 days (7 days for the money fund) are annualized and divided by the | |
| fund’s net asset value at the end of the period. | |
| *** Weighted average maturity for the money fund is in days. | | |
| Note: Yields will vary and are not guaranteed. A money fund’s yield more closely reflects its current | |
| earnings than does the total return. | |
This chart shows the value of a hypothetical $10,000 investment in the fund over the past 10 fiscal year periods or since inception (for funds lacking 10-year records). The result is compared with benchmarks, which may include a broad-based market index and a peer group average or index. Market indexes do not include expenses, which are deducted from fund returns as well as mutual fund averages and indexes.

| AVERAGE ANNUAL COMPOUND TOTAL RETURN |
This table shows how the funds would have performed if their actual (or cumulative) returns for the periods shown had been
earned at a constant rate.
|
| | | | | | | | | |
| | | | | | | | | |
| | | | | | | | Since | | Inception |
| Periods Ended 8/31/05 | 1 Year | | 5 Years | | 10 Years | | Inception | | Date |
| Tax-Exempt Money Fund | 1.56 | % | 1.47 | % | 2.30 | % | | | |
| Tax-Free Short- | | | | | | | | | |
| Intermediate Fund | 1.24 | | 3.89 | | 4.10 | | | | |
| Tax-Free Intermediate Bond Fund | 2.84 | | 5.12 | | 4.98 | | | | |
| Tax-Free Income Fund | 5.43 | | 6.21 | | 5.90 | | | | |
| Tax-Free Income Fund– | | | | | | | | | |
| Advisor Class | 5.20 | | – | | – | | 4.19 | % | 9/30/02 |
| Tax-Free High Yield Fund | 8.56 | | 6.56 | | 5.88 | | | | |
| Returns do not reflect taxes that the shareholder may pay on fund distributions or the redemption of
fund shares. Past performance cannot guarantee future results. When assessing performance, investors
should consider both short- and long-term returns. |
As a mutual fund shareholder, you may incur two types of costs: (1) transaction costs such as redemption fees or sales loads and (2) ongoing costs, including management fees, distribution and service (12b-1) fees, and other fund expenses. The following example is intended to help you understand your ongoing costs (in dollars) of investing in the fund and to compare these costs with the ongoing costs of investing in other mutual funds. The example is based on an investment of $1,000 invested at the beginning of the most recent six-month period and held for the entire period.
Actual Expenses
The first line of the following table (“Actual”) provides information about actual account values and actual expenses. You may use the information in this line, together with your account balance, to estimate the expenses that you paid over the period. Simply divide your account value by $1,000 (for example, an $8,600 account value divided by $1,000 = 8.6), then multiply the result by the number in the first line under the heading “Expenses Paid During Period” to estimate the expenses you paid on your account during this period.
Please note that a fund may have two share classes: The original share class (“investor class”) charges no distribution and service (12b-1) fee. Advisor Class shares are offered only through unaffiliated brokers and other financial intermediaries and charge a 0.25% 12b-1 fee. Each share class is presented separately in the table.
Hypothetical Example for Comparison Purposes
The information on the second line of the table (“Hypothetical”) is based on hypothetical account values and expenses derived from the fund’s actual expense ratio and an assumed 5% per year rate of return before expenses (not the fund’s actual return). You may compare the ongoing costs of investing in the fund with other funds by contrasting this 5% hypothetical example and the 5% hypothetical examples that appear in the shareholder reports of the other funds. The hypothetical account values and expenses may not be used to estimate the actual ending account balance or expenses you paid for the period.
Note: T. Rowe Price charges an annual small-account maintenance fee of $10, generally for accounts with less than $2,000 ($500 for UGMA/UTMA). The fee is waived for any investor whose T. Rowe Price mutual fund accounts total $25,000 or more, accounts employing automatic investing, and IRAs and other retirement plan accounts that utilize a prototype plan sponsored by T. Rowe Price (although a separate custodial or administrative fee may apply to such accounts). This fee is not included in the accompanying table. If you are subject to the fee, keep it in mind when you are estimating the ongoing expenses of investing in the fund and when comparing the expenses of this fund with other funds.
You should also be aware that the expenses shown in the table highlight only your ongoing costs and do not reflect any transaction costs, such as redemption fees or sales loads. Therefore, the second line of the table is useful in comparing ongoing costs only and will not help you determine the relative total costs of owning different funds. To the extent a fund charges transaction costs, however, the total cost of owning that fund is higher.
| T. ROWE PRICE TAX-EXEMPT MONEY FUND |
| | |
| | Beginning | Ending | Expenses Paid | |
| | Account Value | Account Value | During Period | * |
| | 3/1/05 | 8/31/05 | 3/1/05 to 8/31/05 | |
| Actual | $1,000.00 | $1,009.80 | $2.43 | |
| Hypothetical (assumes | | | | |
| 5% return before expenses) | 1,000.00 | 1,022.79 | 2.45 | |
| | | | | |
* Expenses are equal to the fund’s annualized expense ratio for the six-month period (0.48%), multiplied by the average
account value over the period, multiplied by the number of days in the most recent fiscal half year (184) divided by the
days in the year (365) to reflect the half-year period. |
| | | | | |
| T. ROWE PRICE TAX-FREE SHORT-INTERMEDIATE FUND |
| | |
| | Beginning | Ending | Expenses Paid | |
| | Account Value | Account Value | During Period | * |
| | 3/1/05 | 8/31/05 | 3/1/05 to 8/31/05 | |
| Actual | $1,000.00 | $1,010.30 | $2.58 | |
| Hypothetical (assumes | | | | |
| 5% return before expenses) | 1,000.00 | 1,022.63 | 2.60 | |
| | | | | |
* Expenses are equal to the fund’s annualized expense ratio for the six-month period (0.51%), multiplied by the average
account value over the period, multiplied by the number of days in the most recent fiscal half year (184) divided by the
days in the year (365) to reflect the half-year period. |
| T. ROWE PRICE TAX-FREE INTERMEDIATE BOND FUND |
| | |
| | Beginning | Ending | Expenses Paid | |
| | Account Value | Account Value | During Period | * |
| | 3/1/05 | 8/31/05 | 3/1/05 to 8/31/05 | |
| Actual | $1,000.00 | $1,018.00 | $2.90 | |
| Hypothetical (assumes | | | | |
| 5% return before expenses) | 1,000.00 | 1,022.33 | 2.91 | |
| | | | | |
* Expenses are equal to the fund’s annualized expense ratio for the six-month period (0.57%), multiplied by the average
account value over the period, multiplied by the number of days in the most recent fiscal half year (184) divided by the
days in the year (365) to reflect the half-year period. |
| T. ROWE PRICE TAX-FREE INCOME FUND |
| | |
| | Beginning | Ending | Expenses Paid | |
| | Account Value | Account Value | During Period | * |
| | 3/1/05 | 8/31/05 | 3/1/05 to 8/31/05 | |
| Investor Class | | | | |
| Actual | $1,000.00 | $1,028.90 | $2.71 | |
| Hypothetical (assumes 5% | | | | |
| return before expenses) | 1,000.00 | 1,022.53 | 2.70 | |
| Advisor Class | | | | |
| Actual | 1,000.00 | 1,027.20 | 4.34 | |
| Hypothetical (assumes 5% | | | | |
| return before expenses) | 1,000.00 | 1,020.92 | 4.33 | |
| | | | | |
* Expenses are equal to the fund’s annualized expense ratio for the six-month period, multiplied by the average account
value over the period, multiplied by the number of days in the most recent fiscal half year (184) divided by the days in
the year (365) to reflect the half-year period. The annualized expense ratio of the Investor Class was 0.53%; the
Advisor Class was 0.85%.
|
| T. ROWE PRICE TAX-FREE HIGH YIELD FUND |
| | |
| | Beginning | Ending | Expenses Paid | |
| | Account Value | Account Value | During Period | * |
| | 3/1/05 | 8/31/05 | 3/1/05 to 8/31/05 | |
| Actual | $1,000.00 | $1,042.00 | $3.60 | |
| Hypothetical (assumes | | | | |
| 5% return before expenses) | 1,000.00 | 1,021.68 | 3.57 | |
| | | | | |
* Expenses are equal to the fund’s annualized expense ratio for the six-month period (0.70%), multiplied by the average
account value over the period, multiplied by the number of days in the most recent fiscal half year (184) divided by the
days in the year (365) to reflect the half-year period.
|
| 7-Day | | | | | | | |
| Periods Ended 6/30/05 | Simple Yield | | 1 Year | | 5 Years | | 10 Years | |
| Tax-Exempt Money Fund | 2.05 | % | 1.32 | % | 1.52 | % | 2.32 | % |
| Tax-Free Short-Intermediate Fund | – | | 2.90 | | 4.21 | | 4.20 | |
| Tax-Free Intermediate Bond Fund | – | | 5.31 | | 5.53 | | 5.15 | |
| Tax-Free Income Fund | – | | 8.02 | | 6.69 | | 6.02 | |
| Tax-Free Income Fund–Advisor Class | – | | 7.67 | | – | | – | |
| Tax-Free High Yield Fund | – | | 9.96 | | 6.87 | | 5.93 | |
| |
Current performance may be higher or lower than the quoted past performance, which cannot guarantee future results.
Share price, principal value, and return will vary, and you may have a gain or loss when you sell your shares. For the
most recent month-end performance information, please visit our Web site (troweprice.com) or contact a T. Rowe Price
representative at 1-800-225-5132. |
| |
This table provides returns net of all expenses through the most recent calendar quarter-end rather than through the
end of the funds’ fiscal period. It shows how each fund class would have performed each year if its actual (or cumulative)
returns for the periods shown had been earned at a constant rate. Average annual total returns include changes in principal
value, reinvested dividends, and capital gain distributions. Returns do not reflect taxes that the shareholder may pay on
fund distributions or the redemption of fund shares. When assessing performance, investors should consider both short- and
long-term returns. A money fund’s yield more closely represents its current earnings than does the total return. |
Unaudited
| FINANCIAL HIGHLIGHTS | | | | For a share outstanding throughout each period |
| |
| | | 6 Months | | Year | | | | | | | | |
| | | Ended | | Ended | | | | | | | | |
| | | 8/31/05** | | 2/28/05** | | 2/29/04 | | 2/28/03 | | 2/28/02 | | 2/28/01 |
| NET ASSET VALUE | | | | | | | | | | | | |
| Beginning of period | $ | 11.86 | $ | 11.83 | $ | 11.48 | $ | 11.50 | $ | 11.56 | $ | 11.21 |
|
|
| |
| Investment activities | | | | | | | | | | | | |
| Net investment | | | | | | | | | | | | |
| income (loss) | | 0.29 | | 0.60 | | 0.62 | | 0.64 | | 0.67 | | 0.67 |
| Net realized and | | | | | | | | | | | | |
| unrealized gain (loss) | | 0.20 | | 0.03 | | 0.34 | | (0.02) | | (0.07) | | 0.35 |
|
|
| Total from | | | | | | | | | | | | |
| investment activities | | 0.49 | | 0.63 | | 0.96 | | 0.62 | | 0.60 | | 1.02 |
|
|
| |
| Distributions | | | | | | | | | | | | |
| Net investment income | | (0.29) | | (0.60) | | (0.61) | | (0.64) | | (0.66) | | (0.67) |
|
|
| |
| NET ASSET VALUE | | | | | | | | | | | | |
| End of period | $ | 12.06 | $ | 11.86 | $ | 11.83 | $ | 11.48 | $ | 11.50 | $ | 11.56 |
|
|
| |
| |
| Ratios/Supplemental Data | | | | | | | | | | | | |
| Total return^ | | 4.20% | | 5.49% | | 8.59% | | 5.54% | | 5.28% | | 9.36% |
| Ratio of total expenses to | | | | | | | | | | | | |
| average net assets | | 0.70%† | | 0.70% | | 0.71% | | 0.71% | | 0.71% | | 0.72% |
| Ratio of net investment | | | | | | | | | | | | |
| income (loss) to average | | | | | | | | | | | | |
| net assets | | 4.89%† | | 5.12% | | 5.33% | | 5.56% | | 5.72% | | 5.89% |
| Portfolio turnover rate | | 17.8%† | | 22.8% | | 26.5% | | 30.8% | | 32.7% | | 15.1% |
| Net assets, end of period | | | | | | | | | | | | |
| (in millions) | $ | 1,366 | $ | 1,266 | $ | 1,173 | $ | 1,121 | $ | 1,110 | $ | 1,095 |
| ^ | Total return reflects the rate that an investor would have earned on an investment in the fund during each period, |
| | assuming reinvestment of all distributions. |
| † | Annualized. |
| ** Per share amounts calculated using average shares outstanding method. |
| |
| The accompanying notes are an integral part of these financial statements. |
Unaudited
| PORTFOLIO OF INVESTMENTS (1) | $ Par | Value |
| (Amounts in 000s) | | |
| | | |
| ALABAMA 1.4% | | |
| | | |
| Baldwin County Eastern Shore Hosp. Auth. | | |
| Thomas Hosp. | | |
| 5.75%, 4/1/27 | 885 | 897 |
| 6.75%, 4/1/21 | 1,950 | 2,004 |
| Camden Ind. Dev. Board, IDRB | | |
| Weyerhaeuser | | |
| 6.125%, 12/1/24 | 2,100 | 2,341 |
| 6.375%, 12/1/24 # | 1,500 | 1,652 |
| Courtland IDB, PCR, Int'l. Paper, 6.70%, 11/1/29 # | 1,000 | 1,089 |
| Huntsville - Redstone Village Special Care Fac. Fin. Auth. | | |
| 8.125%, 12/1/26 | 2,950 | 2,658 |
| 8.25%, 12/1/32 | 500 | 444 |
| Phoenix PCR, IDB | | |
| MeadWestvaco | | |
| 6.10%, 5/15/30 | 2,050 | 2,193 |
| 6.35%, 5/15/35 # | 3,000 | 3,255 |
| Selma Ind. Dev. Board PCR, Int'l. Paper, 6.70%, 2/1/18 # | 2,000 | 2,186 |
| Total Alabama (Cost $17,858) | | 18,719 |
| |
| ALASKA 1.0% | | |
| | | |
| Alaska HFC | | |
| Single Family | | |
| 5.875%, 12/1/24 (Prerefunded 12/1/05) (MBIA Insured) | 2,505 | 2,574 |
| 6.10%, 6/1/30 | 3,935 | 4,153 |
| 6.15%, 6/1/39 | 6,300 | 6,637 |
| Total Alaska (Cost $12,448) | | 13,364 |
| |
| ARIZONA 1.6% | | |
| | | |
| Coconino County PCR, Nevada Power, 6.375%, 10/1/36 # | 4,055 | 4,167 |
| Maricopa County IDA, Gran Victoria Housing, 9.50%, 5/1/23 | 4,130 | 4,187 |
| Peoria IDA | | |
| Sierra Winds Life Care | | |
| 6.25%, 8/15/14 | 2,040 | 2,095 |
| 6.25%, 8/15/20 | 4,500 | 4,578 |
| 6.375%, 8/15/29 | 1,250 | 1,266 |
| 6.50%, 8/15/31 | 1,000 | 1,018 |
| Tempe IDA | | |
| Friendship Village | | |
| 5.375%, 12/1/13 | 1,000 | 1,027 |
| 6.75%, 12/1/30 | 2,700 | 2,828 |
| Total Arizona (Cost $20,086) | | 21,166 |
| |
| CALIFORNIA 13.3% | | |
| | | |
| ABAG Fin. Auth. for Nonprofit Corp. | | |
| Windemere Ranch, 6.00%, 9/1/34 | 4,900 | 5,289 |
| California, GO | | |
| 5.25%, 11/1/16 | 10,000 | 11,031 |
| 5.50%, 4/1/30 | 5,500 | 6,215 |
| 5.50%, 11/1/33 | 10,640 | 11,975 |
| 5.65%, 6/1/30 | 5,750 | 6,275 |
| Economic Recovery, 5.00%, 7/1/16 | 6,250 | 6,737 |
| California Dept. of Water Resources | | |
| Power Supply | | |
| 5.375%, 5/1/21 | 1,925 | 2,106 |
| 5.50%, 5/1/14 (AMBAC Insured) | 9,000 | 10,181 |
| 5.75%, 5/1/17 | 3,000 | 3,367 |
| California Pollution Control Fin. Auth. PCR | | |
| Pacific Gas & Electric, 3.50%, 12/1/23 | | |
| (Tender 6/1/07) (FGIC Insured) # | 10,000 | 10,041 |
| Southern California Edison, 2.00%, 3/1/08 (Tender 3/1/06) | 3,000 | 2,977 |
| Waste Management, 5.40%, 4/1/25 # | 3,000 | 3,135 |
| California Public Works Board | | |
| Community College | | |
| 5.50%, 6/1/21 | 1,155 | 1,288 |
| 5.50%, 6/1/22 | 1,220 | 1,359 |
| 5.50%, 6/1/23 | 1,285 | 1,427 |
| Dept. of Mental Health, Coalinga, 5.125%, 6/1/29 | 6,000 | 6,357 |
| California Statewide CDA | | |
| Daughters of Charity Health, 5.25%, 7/1/24 | 2,000 | 2,119 |
| Memorial Health Services, 6.00%, 10/1/23 | 2,250 | 2,528 |
| Capistrano Unified School Dist. #90-2, 6.00%, 9/1/33 | 1,250 | 1,340 |
| City of Roseville | | |
| Stoneridge East Community Fac. Dist. #1 | | |
| 6.20%, 9/1/21 | 1,250 | 1,359 |
| 6.30%, 9/1/31 | 2,500 | 2,703 |
| Corona Community Fac. Dist. #2002-4 | | |
| 5.80%, 9/1/29 | 2,000 | 2,044 |
| 5.875%, 9/1/34 | 2,000 | 2,044 |
| Corona-Norco PFA, 6.125%, 9/1/34 | 3,500 | 3,605 |
| East Palo Alto Redev. Agency | | |
| Univ. Circle Gateway/101 Corridor | | |
| 6.50%, 10/1/19 | 1,000 | 1,084 |
| 6.625%, 10/1/29 | 1,780 | 1,914 |
| El Dorado County, 5.25%, 9/1/35 | 2,500 | 2,552 |
| Folsom, Community Fac. Dist. #10, 5.875%, 9/1/28 | 4,000 | 4,245 |
| Foothill / Eastern Transportation Corridor Agency | | |
| Zero Coupon, 1/1/15 (Escrowed to Maturity) | 2,650 | 1,846 |
| Zero Coupon, 1/1/19 (Escrowed to Maturity) | 10,000 | 5,791 |
| Fresno Joint Powers Fin. Auth., 6.55%, 9/2/12 | 1,900 | 1,923 |
| Golden State Tobacco Securitization Corp. | | |
| Tobacco Settlement | | |
| 5.00%, 6/1/45 | 4,500 | 4,690 |
| 5.50%, 6/1/33 (Prerefunded 6/1/13†) | 9,100 | 10,327 |
| 5.50%, 6/1/43 (Prerefunded 6/1/13†) | 1,050 | 1,192 |
| 5.625%, 6/1/38 (Prerefunded 6/1/13†) | 8,000 | 9,146 |
| 6.75%, 6/1/39 | 2,000 | 2,306 |
| Lincoln, Community Fac. Dist. No. 2003-1, 6.00%, 9/1/34 | 2,500 | 2,654 |
| Los Angeles Dept. of Water & Power | | |
| 5.125%, 7/1/40 (FGIC Insured) | 2,000 | 2,100 |
| Orange County Community Fac. Dist., Ladera Ranch #02-1 | | |
| 5.55%, 8/15/33 | 3,500 | 3,633 |
| Sacramento City Fin. Auth., Sacramento Hotel, 6.25%, 1/1/30 | 10,000 | 10,537 |
| Univ. of California Regents, 5.125%, 5/15/20 (AMBAC Insured) | 1,500 | 1,651 |
| Vernon Electric, Malburg Generating Station | | |
| 5.50%, 4/1/33 (Prerefunded 4/1/08†) | 4,620 | 4,918 |
| West Hollywood Community Dev., East Side Redev. | | |
| 5.75%, 9/1/33 | 2,000 | 2,107 |
| Total California (Cost $169,439) | | 182,118 |
| | | |
| COLORADO 1.7% | | |
| | | |
| Beacon Point Metropolitan Dist., 4.375%, 12/1/15 | 1,145 | 1,157 |
| Colorado Ed. & Cultural Fac. Auth. | | |
| Elbert County Charter | | |
| 7.25%, 3/1/24 | 735 | 751 |
| 7.375%, 3/1/35 | 785 | 803 |
| Excel Academy | | |
| 5.50%, 12/1/25 (XLCA Insured) | 1,295 | 1,457 |
| 5.50%, 12/1/33 (XLCA Insured) | 1,550 | 1,723 |
| 6.50%, 5/1/36 | 1,950 | 2,000 |
| 7.30%, 12/1/23 (Prerefunded 12/1/11†) | 1,000 | 1,147 |
| 7.50%, 12/1/33 (Prerefunded 12/1/11†) | 1,750 | 2,112 |
| Peak to Peak Charter Schools | | |
| 7.50%, 8/15/21 (Prerefunded 8/15/11†) | 940 | 1,135 |
| 7.625%, 8/15/31 (Prerefunded 8/15/11†) | 1,000 | 1,225 |
| Colorado HFA | | |
| Adventist Health/Sunbelt | | |
| 6.50%, 11/15/31 | 2,000 | 2,245 |
| 6.625%, 11/15/26 | 500 | 566 |
| Covenant Retirement Communities, 6.125%, 12/1/33 | 4,900 | 5,367 |
| Denver City & County, VRDN (Currently 2.36%) (AMBAC Insured) | 1,600 | 1,600 |
| Total Colorado (Cost $21,099) | | 23,288 |
| |
| CONNECTICUT 1.8% | | |
| | | |
| Mashantucket Western Pequot Tribe | | |
| 5.50%, 9/1/28 | 5,000 | 5,167 |
| 144A, 5.70%, 9/1/12 | 1,000 | 1,059 |
| 144A, 5.75%, 9/1/18 | 1,000 | 1,047 |
| 144A, 5.75%, 9/1/27 | 4,000 | 4,147 |
| Mohegan Tribe Indians | | |
| 6.25%, 1/1/21 | 2,500 | 2,719 |
| 6.25%, 1/1/31 | 10,000 | 10,801 |
| Total Connecticut (Cost $23,288) | | 24,940 |
| | | |
| DELAWARE 0.2% | | |
| | | |
| Delaware HFA | | |
| Beebe Medical Center | | |
| 5.00%, 6/1/24 | 1,000 | 1,038 |
| 5.00%, 6/1/30 | 1,000 | 1,025 |
| Catholic Health East, 5.75%, 11/15/33 | 750 | 811 |
| Total Delaware (Cost $2,832) | | 2,874 |
| |
| DISTRICT OF COLUMBIA 2.0% | | |
| | | |
| District of Columbia | | |
| American Geophysical Union, 5.875%, 9/1/23 | 1,750 | 1,752 |
| Henry Adams House/Gables, 6.60%, 11/1/15 | 1,935 | 2,113 |
| Medlantic Health, 5.75%, 8/15/26 | | |
| (Escrowed to Maturity) (MBIA Insured) | 6,000 | 6,265 |
| The Methodist Home of D.C. | | |
| 5.50%, 1/1/11 | 1,000 | 1,013 |
| 6.00%, 1/1/20 | 3,920 | 4,013 |
| District of Columbia, GO, VR | | |
| 8.119%, 6/1/17 (FSA Insured) ‡ | 2,375 | 2,766 |
| 8.373%, 6/1/13 (FSA Insured) ‡ | 4,685 | 5,465 |
| 8.373%, 6/1/14 (FSA Insured) ‡ | 2,810 | 3,284 |
| Total District of Columbia (Cost $24,189) | | 26,671 |
| |
| FLORIDA 3.2% | | |
| | | |
| Brandy Creek Community Dev. Dist. | | |
| 5.40%, 5/1/09 | 425 | 430 |
| 6.35%, 5/1/34 | 985 | 1,053 |
| Double Branch Community Dev. Dist. | | |
| 5.60%, 5/1/07 | 145 | 147 |
| 6.70%, 5/1/34 | 1,485 | 1,631 |
| Fishhawk Community Dev. Dist. II | | |
| 5.00%, 11/1/07 | 975 | 986 |
| 5.125%, 11/1/09 | 2,025 | 2,061 |
| Greyhawk Landing Community Dev. Dist., 6.25%, 5/1/09 | 1,505 | 1,537 |
| Heritage Harbour South Community Dev. Dist., 5.40%, 11/1/08 | 1,885 | 1,906 |
| Laguna Lakes Community Dev. Dist. | | |
| 5.25%, 11/1/07 | 190 | 192 |
| 6.40%, 5/1/33 | 980 | 1,057 |
| Lee County IDA, Cypress Cove at Healthpark, 6.375%, 10/1/25 | 2,600 | 2,672 |
| Middle Village Community Dev. Dist. | | |
| 5.00%, 5/1/09 | 1,140 | 1,152 |
| 5.80%, 5/1/22 | 1,000 | 1,038 |
| Orange County HFA | | |
| Westminster Community Care | | |
| 6.50%, 4/1/12 | 1,935 | 1,958 |
| 6.75%, 4/1/34 | 2,695 | 2,678 |
| Preserve at Wilderness Lake Community Dev. Dist. | | |
| 5.00%, 5/1/09 | 850 | 856 |
| 5.90%, 5/1/34 | 2,225 | 2,309 |
| Saddlebrook Community Dev. Dist., 6.25%, 5/1/09 | 195 | 198 |
| Saint John's County IDA, Vicar's Landing, 6.75%, 2/15/12 | 3,585 | 3,615 |
| Seven Oaks Community Dev. Dist. II | | |
| 5.00%, 5/1/09 | 4,520 | 4,566 |
| 5.30%, 11/1/08 | 2,340 | 2,366 |
| 5.875%, 5/1/35 | 2,000 | 2,078 |
| South Bay Community Dev. Dist., 5.125%, 11/1/09 | 4,500 | 4,555 |
| South Village Community Dev. Dist., 5.70%, 5/1/35 | 3,000 | 3,087 |
| Total Florida (Cost $42,964) | | 44,128 |
| |
| GEORGIA 2.9% | | |
| | | |
| Americus & Sumter County Hosp. Auth. | | |
| Magnolia Manor | | |
| 6.25%, 5/15/19 | 1,000 | 1,028 |
| 6.375%, 5/15/29 | 3,500 | 3,598 |
| Athens - Clarke County Residential Care Fac. | | |
| Wesley Woods of Athens, 6.375%, 10/1/27 | 2,500 | 2,262 |
| Augusta, 5.15%, 1/1/35 | 1,600 | 1,643 |
| Chatham County Hosp. Auth., Memorial Univ. Medical Center | | |
| 6.125%, 1/1/24 | 3,250 | 3,569 |
| Coweta County Residential Care Fac. for the Elderly | | |
| Wesley Woods of Newnan-Peachtree City, 8.25%, 10/1/26 | 3,145 | 3,254 |
| Fulton County Residential Care Fac., Canterbury Court | | |
| 6.125%, 2/15/34 | 2,000 | 2,068 |
| Milledgeville & Baldwin County Dev. Auth. | | |
| Georgia College & State Univ. Foundation, 6.00%, 9/1/33 | 2,500 | 2,726 |
| Municipal Electric Auth. of Georgia, Electric Power Supply | | |
| 6.25%, 1/1/17 | 4,000 | 4,821 |
| Rockdale County Dev. Auth. | | |
| Pratt Industries USA | | |
| 7.40%, 1/1/16 # | 3,170 | 3,218 |
| 7.50%, 1/1/26 # | 3,800 | 3,857 |
| Savannah Economic Dev. Auth. | | |
| Marshes of Skidaway | | |
| 6.85%, 1/1/19 | 2,240 | 2,304 |
| 7.40%, 1/1/34 | 1,575 | 1,656 |
| Savannah College of Art & Design, 6.80%, 10/1/19 | | |
| (Prerefunded 10/1/09†) | 3,430 | 3,913 |
| Total Georgia (Cost $37,721) | | 39,917 |
| |
| HAWAII 0.5% | | |
| | | |
| Hawaii Dept. of Budget & Fin. | | |
| Hawaii Pacific Health, B&F Kapiolani | | |
| 6.20%, 7/1/16 (Prerefunded 7/1/06†) | 2,000 | 2,091 |
| 6.25%, 7/1/21 (Prerefunded 7/1/06†) | 5,000 | 5,229 |
| Total Hawaii (Cost $7,035) | | 7,320 |
| |
| IDAHO 0.6% | | |
| | | |
| Idaho Housing Agency, Single Family, 7.80%, 1/1/23 # | 140 | 140 |
| Idaho Student Loan Fund Marketing Assoc., 6.70%, 10/1/07 # | 2,465 | 2,469 |
| Nez Perce County PCR, IDRB, Potlatch Corp., 7.00%, 12/1/14 | 1,000 | 1,146 |
| Power County PCR, FMC Corp., 6.45%, 8/1/32 # | 4,570 | 4,766 |
| Total Idaho (Cost $8,004) | | 8,521 |
| |
| ILLINOIS 4.2% | | |
| | | |
| Aurora Economic Dev., Advocate Health Care Network | | |
| 8.75%, 7/1/14 | 2,980 | 2,988 |
| Chicago Board of Ed., GO, VRDN (Currently 2.33%) | | |
| (FSA Insured) | 700 | 700 |
| Chicago O'Hare Int'l. Airport, United Airlines | | |
| 5.20%, 4/1/11 #* | 4,400 | 695 |
| Illinois Dev. Fin. Auth. PCR, Citgo Petroleum, 8.00%, 6/1/32 # | 1,750 | 2,008 |
| Illinois EFA, Augustana College, 5.70%, 10/1/32 | 2,500 | 2,628 |
| Illinois Fin. Auth., Northwestern Memorial Hosp. | | |
| 5.50%, 8/15/43 | 8,000 | 8,690 |
| Illinois HFA | | |
| Friendship Village of Schaumburg, 5.625%, 2/15/37 | 3,700 | 3,761 |
| Glen Oaks Medical Center, 7.00%, 11/15/19 | | |
| (Escrowed to Maturity) | 3,300 | 3,495 |
| Hinsdale Hosp., 7.00%, 11/15/19 (Escrowed to Maturity) | 5,100 | 5,592 |
| Lutheran Senior Ministries, 7.375%, 8/15/31 | 6,530 | 7,092 |
| Northwestern Memorial Hosp., VRDN (Currently 2.34%) | 1,200 | 1,200 |
| Riverside Health | | |
| 5.75%, 11/15/20 | 2,620 | 2,711 |
| 6.00%, 11/15/32 | 4,000 | 4,337 |
| 6.80%, 11/15/20 (Prerefunded 11/15/10†) | 2,250 | 2,634 |
| Villa Saint Benedict | | |
| 5.75%, 11/15/15 | 1,000 | 1,000 |
| 6.90%, 11/15/33 | 3,500 | 3,710 |
| Village of Carol Stream | | |
| Windsor Park Manor | | |
| 7.00%, 12/1/13 (Prerefunded 12/1/07†) | 2,000 | 2,194 |
| 7.20%, 12/1/14 (Prerefunded 12/1/07†) | 1,200 | 1,322 |
| Total Illinois (Cost $53,074) | | 56,757 |
| |
| INDIANA 1.2% | | |
| | | |
| Goshen, Greencroft Obligated Group, 5.75%, 8/15/28 | 4,000 | 4,012 |
| Indiana HFA | | |
| Clarian Health Partners, 5.50%, 2/15/16 (MBIA Insured) | 2,800 | 2,939 |
| Community Foundation, 6.00%, 3/1/34 | 3,000 | 3,225 |
| Indianapolis Airport Auth., United Airlines | | |
| 6.50%, 11/15/31 #* | 11,628 | 1,395 |
| Saint Joseph County | | |
| Madison Center | | |
| 5.45%, 2/15/17 | 3,400 | 3,494 |
| 5.50%, 2/15/21 | 1,150 | 1,178 |
| Total Indiana (Cost $23,883) | | 16,243 |
| | | |
| IOWA 0.6% | | |
| | | |
| Scott County | | |
| Ridgecrest Village | | |
| 5.625%, 11/15/18 | 1,600 | 1,679 |
| 7.25%, 11/15/26 | 4,750 | 5,107 |
| Tobacco Settlement Auth., Tobacco Industry, 5.30%, 6/1/25 | 1,400 | 1,428 |
| Total Iowa (Cost $7,844) | | 8,214 |
| |
| KANSAS 1.2% | | |
| | | |
| City of Olathe, Aberdeen, 8.00%, 5/15/30 | | |
| (Prerefunded 5/15/10†) | 2,000 | 2,403 |
| Lenexa Health Care Fac., Lakeview Village, 6.875%, 5/15/32 | 1,100 | 1,203 |
| Overland Park Dev. Corp., 7.375%, 1/1/32 | 5,500 | 6,030 |
| Wyandotte County | | |
| Unified Gov't. | | |
| 4.75%, 12/1/16 | 3,250 | 3,315 |
| 5.00%, 12/1/20 | 3,350 | 3,447 |
| Total Kansas (Cost $15,060) | | 16,398 |
| |
| KENTUCKY 0.5% | | |
| | | |
| Florence, Kentucky Bluegrass, 7.625%, 5/1/27 | | |
| (Prerefunded 5/1/07†) | 2,500 | 2,734 |
| Kenton County Airport Board, Delta Airlines, 7.50%, 2/1/12 # | 3,750 | 3,459 |
| Total Kentucky (Cost $6,225) | | 6,193 |
| |
| LOUISIANA 1.2% | | |
| | | |
| Hodge Utility PCR, Stone Container, 7.45%, 3/1/24 # | 6,250 | 7,511 |
| Louisiana PFA | | |
| Pendleton Memorial Methodist Hosp. | | |
| 5.25%, 6/1/17 (Prerefunded 6/1/08†) | 4,515 | 4,773 |
| 5.25%, 6/1/28 (Prerefunded 6/1/08†) | 3,780 | 3,996 |
| Total Louisiana (Cost $14,236) | | 16,280 |
| | | |
| MARYLAND 4.0% | | |
| | | |
| Baltimore, Harborview Lot #2, 6.50%, 7/1/31 | 1,750 | 1,893 |
| Gaithersburg, Asbury Solomons Group, 5.50%, 1/1/15 | 5,500 | 5,503 |
| Maryland Energy Fin. Administration | | |
| Office Paper Systems, 7.50%, 9/1/15 # | 5,290 | 5,989 |
| Maryland Economic Dev. Corp. | | |
| Anne Arundel County Golf Course, 8.25%, 6/1/28 | | |
| (Prerefunded 6/1/11†) | 4,000 | 4,845 |
| Chesapeake Bay Hyatt | | |
| 7.625%, 12/1/22 | 3,000 | 3,197 |
| 7.73%, 12/1/27 | 2,000 | 2,139 |
| Morgan State Univ. Student Housing, 6.00%, 7/1/34 | 8,250 | 8,876 |
| Univ. of Maryland College Park Student Housing | | |
| 5.75%, 6/1/31 | 2,000 | 2,086 |
| Maryland HHEFA | | |
| Adventist Healthcare, 5.75%, 1/1/25 | 2,750 | 2,977 |
| Carroll Hosp. Center | | |
| 5.80%, 7/1/32 | 1,500 | 1,598 |
| 6.00%, 7/1/19 | 1,300 | 1,428 |
| 6.00%, 7/1/26 | 1,000 | 1,083 |
| Collington Episcopal Life Care | | |
| 6.75%, 4/1/23 | 120 | 109 |
| 8.00%, 4/1/22 (Tender 4/1/07) | 860 | 861 |
| Doctor's Community Hosp., 5.50%, 7/1/24 | 5,060 | 5,064 |
| Sheppard & Enoch Pratt Foundation | | |
| Muni Auction Rate (Currently 2.63%) 7/1/28 (RAA Insured) | 3,675 | 3,675 |
| Northeast Maryland Waste Disposal Auth. IDRB | | |
| Waste Management, 5.00%, 1/1/12 # | 3,250 | 3,345 |
| Prince Georges County Hosp. | | |
| Collington Episcopal Life Care | | |
| 5.625%, 4/1/09 | 30 | 27 |
| 6.00%, 4/1/13 | 50 | 46 |
| Total Maryland (Cost $50,322) | | 54,741 |
| |
| MASSACHUSETTS 2.8% | | |
| | | |
| Massachusetts, GO | | |
| VRDN (Currently 2.33%) | 1,250 | 1,250 |
| 5.00%, 8/1/10 (AMBAC Insured) | 4,810 | 5,195 |
| 5.00%, 8/1/10 (Escrowed to Maturity) (AMBAC Insured) | 190 | 206 |
| VR, 7.824%, 8/1/19 (MBIA Insured) | 5,000 | 6,765 |
| Massachusetts Bay Transportation Auth., GO | | |
| 7.00%, 3/1/19 | 2,500 | 3,187 |
| 7.00%, 3/1/21 | 2,000 | 2,552 |
| Massachusetts Dev. Fin. Agency | | |
| Beverly Enterprises, 7.375%, 4/1/09 | 2,300 | 2,319 |
| Boston Univ., 5.45%, 5/15/59 (XLCA Insured) | 2,500 | 2,981 |
| Covanta Haverhill | | |
| 5.30%, 12/1/14 # | 1,000 | 1,016 |
| 6.70%, 12/1/14 # | 2,250 | 2,442 |
| Massachusetts HEFA, Partners Healthcare, 5.75%, 7/1/32 | 3,600 | 3,991 |
| Massachusetts Ind. Fin. Agency | | |
| Bradford College, 5.625%, 11/1/28 * | 6,000 | 270 |
| Covanta Haverhill | | |
| 5.40%, 12/1/11 # | 3,600 | 3,695 |
| 5.60%, 12/1/19 # | 2,000 | 2,057 |
| Total Massachusetts (Cost $37,200) | | 37,926 |
| |
| MICHIGAN 1.4% | | |
| | | |
| Cornell Township Economic Dev., MeadWestvaco | | |
| 5.875%, 5/1/18 (Prerefunded 5/01/12†) | 2,250 | 2,576 |
| Delta County Economic Dev. Corp., MeadWestvaco | | |
| 6.25%, 4/15/27 (Prerefunded 4/15/12†) | 1,000 | 1,166 |
| Garden City Hosp. Fin. Auth. | | |
| Garden City Hosp. | | |
| 5.625%, 9/1/10 | 1,040 | 1,049 |
| 5.75%, 9/1/17 | 1,280 | 1,265 |
| Kent Hosp. Fin. Auth., Spectrum Health, 5.00%, 7/15/11 | 5,000 | 5,383 |
| Michigan Hosp. Fin. Auth., Ascension Health | | |
| 5.30%, 11/15/33 (Tender 11/15/06) | 1,000 | 1,028 |
| Michigan Strategic Fund IDRB, Waste Management | | |
| 5.20%, 4/1/10 # | 6,500 | 6,856 |
| Total Michigan (Cost $18,047) | | 19,323 |
| | | |
| MINNESOTA 0.5% | | |
| | | |
| Hubbard County Solid Waste Disposal IDRB | | |
| Potlatch Corp., 7.25%, 8/1/14 # | 3,000 | 3,443 |
| Minneapolis, Walker Methodist Senior Services | | |
| 6.00%, 11/15/28 | 3,632 | 3,521 |
| Total Minnesota (Cost $6,596) | | 6,964 |
| |
| MISSISSIPPI 1.5% | | |
| | | |
| Mississippi Business Fin. PCR, Entergy Corp., 5.90%, 5/1/22 | 14,325 | 14,728 |
| Mississippi Dev. Bank, BP PLC, VRDN (Currently 2.48%) | 1,000 | 1,000 |
| Mississippi Hosp. Equipment Fac. Auth., North Mississippi Health | | |
| Services, VRDN (Currently 2.52%) | 3,150 | 3,150 |
| Warren County PCR, Int'l. Paper, 6.75%, 8/1/21 # | 2,000 | 2,205 |
| Total Mississippi (Cost $20,067) | | 21,083 |
| |
| MISSOURI 0.8% | | |
| | | |
| Good Shepherd Nursing Home Dist. | | |
| 5.45%, 8/15/08 | 725 | 743 |
| 5.90%, 8/15/23 | 2,000 | 2,026 |
| Missouri HEFA | | |
| Lutheran Senior Living, 5.375%, 2/1/35 | 3,500 | 3,686 |
| Washington Univ., VRDN (Currently 2.33%) | 600 | 600 |
| Sugar Creek IDRB, LaFarge North America, 5.65%, 6/1/37 # | 3,750 | 3,922 |
| Total Missouri (Cost $10,699) | | 10,977 |
| |
| MONTANA 0.2% | | |
| | | |
| Montana Board of Housing, Single Family, 6.00%, 12/1/29 # | 2,490 | 2,545 |
| Total Montana (Cost $2,490) | | 2,545 |
| |
| NEBRASKA 0.0% | | |
| | | |
| City of Kearney | | |
| Great Platte River Road Memorial | | |
| Zero Coupon, 9/1/12 | 1,583 | 24 |
| 8.00%, 9/1/12 | 130 | 98 |
| Nebraska Investment Fin. Auth., Single Family, 6.30%, 9/1/20 # | 445 | 445 |
| Total Nebraska (Cost $574) | | 567 |
| |
| NEVADA 2.4% | | |
| | | |
| Clark County IDRB, PCR | | |
| Nevada Power | | |
| 5.60%, 10/1/30 # | 5,000 | 5,000 |
| 5.90%, 10/1/30 # | 6,500 | 6,500 |
| Southwest Gas | | |
| 5.45%, 3/1/38 (Tender 3/1/13) | 2,875 | 3,071 |
| 5.80%, 3/1/38 (Tender 3/1/13) # | 7,545 | 8,151 |
| Henderson Local Improvement Dist. | | |
| Sun City Anthem Phase II, 5.80%, 3/1/23 | 2,050 | 2,119 |
| Nevada Dept. of Business & Industry, Las Ventanas | | |
| 7.00%, 11/15/34 | 3,200 | 3,343 |
| Washoe County Water Fac., Sierra Pacific Power | | |
| 5.00%, 3/1/36 (Tender 7/1/09) # | 4,000 | 4,078 |
| Total Nevada (Cost $30,878) | | 32,262 |
| |
| NEW HAMPSHIRE 0.7% | | |
| | | |
| New Hampshire HEFA | | |
| Covenant Health, 6.125%, 7/1/31 | 5,000 | 5,476 |
| Exeter Hosp., 6.00%, 10/1/24 | 2,000 | 2,205 |
| Southern New Hampshire Univ., 5.00%, 1/1/36 (ACA Insured) | 2,000 | 2,057 |
| Total New Hampshire (Cost $8,904) | | 9,738 |
| |
| NEW JERSEY 4.9% | | |
| | | |
| Gloucester County Improvement Auth., IDRB | | |
| Waste Management, 6.85%, 12/1/29 (Tender 12/1/09) | 1,000 | 1,117 |
| New Jersey Economic Dev. Auth. | | |
| Cigarette Tax, 5.75%, 6/15/29 | 4,000 | 4,320 |
| Franciscan Oaks, 5.75%, 10/1/23 | 1,775 | 1,804 |
| Kapkowski Road Landfill | | |
| 5.75%, 10/1/21 | 4,225 | 4,649 |
| 6.375%, 4/1/18 (Prerefunded 5/15/14†) | 2,000 | 2,396 |
| 6.375%, 4/1/31 (Prerefunded 5/15/14†) | 2,000 | 2,400 |
| Keswick Pines | | |
| 5.70%, 1/1/18 | 1,500 | 1,538 |
| 5.75%, 1/1/24 | 3,885 | 3,971 |
| Lions Gate | | |
| 5.00%, 1/1/15 | 650 | 658 |
| 5.875%, 1/1/37 | 2,230 | 2,297 |
| Presbyterian Homes at Montgomery, 6.375%, 11/1/31 | 4,200 | 4,362 |
| The Evergreens, 6.00%, 10/1/17 | 1,300 | 1,340 |
| Winchester Gardens at Ward Homestead, 5.80%, 11/1/31 | 1,500 | 1,588 |
| New Jersey Economic Dev. Auth. IDRB, Continental Airlines | | |
| 6.25%, 9/15/19 # | 4,690 | 4,323 |
| New Jersey HFFA | | |
| Pascack Valley Hosp. Assoc. | | |
| 6.50%, 7/1/23 | 3,000 | 3,111 |
| 6.625%, 7/1/36 | 4,875 | 5,058 |
| Somerset Medical Center, 5.50%, 7/1/18 | 3,755 | 3,975 |
| South Jersey Hosp. | | |
| 5.875%, 7/1/21 | 4,500 | 4,893 |
| 6.00%, 7/1/32 | 1,130 | 1,220 |
| Tobacco Settlement Fin. Corp. | | |
| 5.75%, 6/1/32 | 5,000 | 5,227 |
| 6.75%, 6/1/39 | 3,600 | 4,199 |
| 7.00%, 6/1/41 | 2,095 | 2,504 |
| Total New Jersey (Cost $62,076) | | 66,950 |
| |
| NEW YORK 9.6% | | |
| | | |
| Brookhaven IDA, Methodist Retirement Community Dev. Corp. | | |
| VR, 4.375%, 11/1/31 (Tender 11/1/06) | 2,500 | 2,524 |
| Dormitory Auth. of the State of New York | | |
| 5.50%, 7/1/25 (Prerefunded 7/1/06†) (MBIA Insured) | 3,500 | 3,647 |
| 5.625%, 7/1/16 | 3,100 | 3,560 |
| Catholic Health Services, 5.10%, 7/1/34 | 2,000 | 2,064 |
| City Univ., 6.00%, 7/1/14 | 2,730 | 3,116 |
| Mount Sinai NYU Health, 5.50%, 7/1/26 | 7,250 | 7,400 |
| Nyack Hosp., 6.25%, 7/1/13 | 1,500 | 1,486 |
| State Univ. | | |
| 5.25%, 5/15/13 | 5,000 | 5,541 |
| 5.875%, 5/15/17 | 3,000 | 3,540 |
| Huntington Housing Auth., Gurwin Jewish Senior Home | | |
| 6.00%, 5/1/39 | 1,140 | 1,144 |
| Long Island Power Auth., 5.125%, 12/1/22 (FSA Insured) | 1,000 | 1,057 |
| Metropolitan Transportation Auth., 5.25%, 11/15/32 | 6,000 | 6,446 |
| New York City, 5.875%, 3/15/13 (Prerefunded 3/15/06†) | 2,700 | 2,785 |
| New York City, GO | | |
| 5.00%, 8/1/06 | 3,000 | 3,059 |
| 5.00%, 8/1/22 | 4,315 | 4,607 |
| 5.00%, 4/1/26 | 5,000 | 5,296 |
| 5.50%, 8/1/15 | 4,810 | 5,317 |
| 5.875%, 3/15/13 | 50 | 52 |
| 6.25%, 8/1/09 | 4,995 | 5,210 |
| 6.25%, 8/1/09 (Prerefunded 8/1/06†) | 2,005 | 2,097 |
| New York City IDA, 7 World Trade Center, 6.25%, 3/1/15 | 10,500 | 11,158 |
| New York City IDA, IDRB, JFK Airport, 5.50%, 7/1/28 # | 6,000 | 6,100 |
| New York City Municipal Water Fin. Auth. | | |
| VRDN (Currently 2.52%) (AMBAC Insured) | 1,000 | 1,000 |
| New York IDA, IAC / InterActive Corp., 5.00%, 9/1/35 | 4,200 | 4,303 |
| New York State Mortgage Agency, Single Family | | |
| 5.90%, 4/1/27 | 2,655 | 2,751 |
| New York State Urban Dev. Corp., Corrections & Youth Fac. | | |
| 5.25%, 1/1/21 (Tender 1/1/09) | 5,500 | 5,831 |
| Niagara County IDA | | |
| American Ref-Fuel | | |
| 5.55%, 11/15/24 (Tender 11/15/13) # | 1,000 | 1,077 |
| 5.55%, 11/15/24 (Tender 11/15/15) | 2,000 | 2,126 |
| Oneida County IDA | | |
| Saint Elizabeth Medical Center | | |
| 5.625%, 12/1/09 | 1,400 | 1,433 |
| 5.875%, 12/1/29 | 2,750 | 2,832 |
| 6.00%, 12/1/19 | 2,520 | 2,620 |
| Suffolk County IDA | | |
| Huntington Hosp., 5.875%, 11/1/32 | 4,000 | 4,269 |
| Jeffersons Ferry | | |
| 7.20%, 11/1/19 | 1,250 | 1,364 |
| 7.25%, 11/1/28 | 2,000 | 2,181 |
| Tobacco Settlement Fin. Corp. | | |
| 5.25%, 6/1/20 (AMBAC Insured) | 4,500 | 4,947 |
| 5.50%, 6/1/15 | 2,500 | 2,736 |
| Yonkers IDA, Civic Fac., 6.625%, 2/1/26 (Prerefunded 2/1/11†) | 4,000 | 4,685 |
| Total New York (Cost $123,318) | | 131,361 |
| |
| NORTH CAROLINA 3.1% | | |
| | | |
| Gaston County IDRB, PCR, National Gypsum, 5.75%, 8/1/35 # | 3,800 | 3,972 |
| Haywood County PCR | | |
| Int'l. Paper | | |
| 5.50%, 10/1/18 # | 2,000 | 2,034 |
| 5.75%, 12/1/25 # | 2,100 | 2,132 |
| North Carolina Eastern Municipal Power Agency | | |
| 5.125%, 1/1/14 | 2,000 | 2,131 |
| 5.75%, 1/1/26 | 4,350 | 4,586 |
| 6.75%, 1/1/26 | 10,125 | 11,341 |
| North Carolina Medical Care Commission | | |
| Maria Parham Medical Center, 6.50%, 10/1/26 | 3,400 | 3,778 |
| Presbyterian Homes, 7.00%, 10/1/31 | 4,000 | 4,291 |
| North Carolina Municipal Power Agency #1 | | |
| Catawba Electric | | |
| 6.375%, 1/1/13 | 3,000 | 3,336 |
| 6.50%, 1/1/20 | 4,500 | 4,991 |
| Total North Carolina (Cost $39,651) | | 42,592 |
| |
| NORTH DAKOTA 0.5% | | |
| | | |
| Grand Forks Health Care, Altru Health System Obligated Group | | |
| 7.125%, 8/15/24 | 2,000 | 2,224 |
| Mercer County PCR, Basin Electric Power Co-Op. | | |
| 7.20%, 6/30/13 (AMBAC Insured) | 3,500 | 4,184 |
| Total North Dakota (Cost $5,817) | | 6,408 |
| |
| OHIO 1.5% | | |
| | | |
| Akron, COP | | |
| 5.00%, 12/1/16 | 3,645 | 3,952 |
| Baseball, STEP, 6.90%, 12/1/16 (Prerefunded 12/1/06) | 2,200 | 2,349 |
| Franklin County, Ohio Presbyterian Retirement Services | | |
| 7.125%, 7/1/29 | 500 | 563 |
| Montgomery County Hosp. | | |
| Catholic Health Initiatives | | |
| 6.00%, 12/1/19 | 1,715 | 1,902 |
| 6.00%, 12/1/19 (Escrowed to Maturity) | 1,785 | 2,003 |
| Kettering Medical Center, 6.75%, 4/1/18 | 2,100 | 2,336 |
| Ohio Environmental Fac. IDRB, Ford Motor Company | | |
| 5.75%, 4/1/35 # | 5,500 | 5,212 |
| Ohio Water Dev. Auth. PCR, FirstEnergy, 6.10%, 8/1/20 # | 2,600 | 2,721 |
| Total Ohio (Cost $20,248) | | 21,038 |
| |
| OKLAHOMA 1.2% | | |
| | | |
| Jackson County Memorial Hosp. Auth., 7.30%, 8/1/15 | 5,910 | 6,005 |
| Oklahoma Dev. Fin. Auth. | | |
| Hillcrest Healthcare, 5.625%, 8/15/29 (Prerefunded 8/15/09†) | 5,000 | 5,479 |
| Inverness Village, 8.00%, 2/1/32 | 6,400 | 5,080 |
| Total Oklahoma (Cost $15,361) | | 16,564 |
| |
| OREGON 0.9% | | |
| | | |
| Oregon, Dept. of Administation Services, COP | | |
| 5.25%, 11/1/20 (MBIA Insured) | 10,000 | 10,865 |
| Western Generation Agency, Wauna Cogeneration | | |
| 7.25%, 1/1/09 # | 800 | 812 |
| Total Oregon (Cost $10,967) | | 11,677 |
| |
| PENNSYLVANIA 5.3% | | |
| | | |
| Allegheny County Hosp. Dev. Auth. | | |
| West Penn Allegheny Health | | |
| 9.25%, 11/15/22 | 1,000 | 1,206 |
| 9.25%, 11/15/30 | 4,000 | 4,805 |
| Beaver County PCR, IDA, FirstEnergy, 7.75%, 5/1/20 | 2,000 | 2,058 |
| Bucks County IDA | | |
| Chandler Hall | | |
| 6.20%, 5/1/19 | 1,275 | 1,317 |
| 6.30%, 5/1/29 | 7,625 | 7,853 |
| Cumberland County Municipal Auth., Wesley Affiliated Services | | |
| 7.125%, 1/1/25 | 4,200 | 4,639 |
| Delaware County IDA, American Ref-Fuel, 6.20%, 7/1/19 | 3,405 | 3,547 |
| Lancaster County Hosp. Auth., St. Anne's Home for the Aged | | |
| 6.60%, 4/1/24 | 3,200 | 3,227 |
| Monroe County Hosp. Auth., Pocono Medical Center | | |
| 6.00%, 1/1/43 | 4,000 | 4,322 |
| Montgomery County HHEFA | | |
| Philadelphia Geriatric Center | | |
| 7.00%, 12/1/12 | 3,360 | 3,695 |
| 7.25%, 12/1/19 | 2,500 | 2,728 |
| Montgomery County IDA | | |
| The Hill at Whitemarsh | | |
| 6.125%, 2/1/28 | 4,750 | 5,005 |
| 6.25%, 2/1/35 | 2,800 | 2,963 |
| Pennsylvania Economic Dev. Fin. Auth., IDRB, Reliant Energy | | |
| 6.75%, 12/1/36 # | 6,000 | 6,470 |
| Pennsylvania Higher EFA | | |
| Philadelphia Univ., 5.25%, 6/1/32 | 1,650 | 1,678 |
| Widener Univ., 5.375%, 7/15/29 | 1,000 | 1,055 |
| Philadelphia Auth. for Ind. Dev. | | |
| Paul's Run Retirement Community | | |
| 5.85%, 5/15/13 | 1,165 | 1,211 |
| 5.875%, 5/15/28 | 3,340 | 3,417 |
| Saint Mary Hosp. Auth., Catholic Health East | | |
| 5.375%, 11/15/34 | 1,000 | 1,066 |
| West Shore Area Auth., Holy Spirit Hosp., 6.25%, 1/1/32 | 3,750 | 4,093 |
| Westmoreland County IDA, Redstone Presbyterian Seniorcare | | |
| 8.00%, 11/15/23 | 5,000 | 5,522 |
| Total Pennsylvania (Cost $65,664) | | 71,877 |
| |
| PUERTO RICO 0.7% | | |
| | | |
| Puerto Rico Highway & Transportation Auth., 5.50%, 7/1/18 | 5,000 | 5,171 |
| The Children's Trust Fund | | |
| Tobacco Settlement | | |
| Zero Coupon, 5/15/50 | 30,000 | 1,929 |
| Zero Coupon, 5/15/55 | 58,000 | 1,989 |
| Total Puerto Rico (Cost $8,830) | | 9,089 |
| | | |
| RHODE ISLAND 0.3% | | |
| | | |
| Central Falls Detention Fac., 7.25%, 7/15/35 | 3,800 | 3,917 |
| Total Rhode Island (Cost $3,825) | | 3,917 |
| |
| SOUTH CAROLINA 1.9% | | |
| | | |
| Connector 2000 Assoc. | | |
| Zero Coupon, 1/1/08 | 2,600 | 1,975 |
| Zero Coupon, 1/1/10 | 2,900 | 1,092 |
| Zero Coupon, 1/1/21 (ACA Insured) | 5,100 | 2,199 |
| Zero Coupon, 1/1/31 | 21,100 | 2,589 |
| Georgetown County PCR, Int'l. Paper, 6.25%, 9/1/23 # | 2,000 | 2,144 |
| Greenville Hosp. Board of Trustees | | |
| VR, 5/1/35 (AMBAC Insured) | 1,200 | 1,200 |
| Piedmont Municipal Power Agency, 5.25%, 1/1/21 | 1,000 | 1,021 |
| South Carolina Jobs Economic Dev. Auth., Bon Secours Health | | |
| 5.625%, 11/15/30 | 8,500 | 9,088 |
| South Carolina Public Service Auth., 5.875%, 1/1/23 | | |
| (Prerefunded 1/1/06†) (FGIC Insured) | 5,000 | 5,146 |
| Total South Carolina (Cost $29,379) | | 26,454 |
| |
| SOUTH DAKOTA 0.3% | | |
| | | |
| South Dakota HEFA, Sioux Valley Hosp., 5.50%, 11/1/31 | 3,500 | 3,793 |
| Total South Dakota (Cost $3,570) | | 3,793 |
| |
| TENNESSEE 1.4% | | |
| | | |
| Chattanooga Health, Ed. & Housing Board | | |
| CDFI Phase I | | |
| 5.125%, 10/1/35 | 4,000 | 4,033 |
| 5.50%, 10/1/20 | 1,500 | 1,513 |
| 6.00%, 10/1/35 | 3,100 | 3,176 |
| Maury County IDRB, Occidental Petroleum Corp. | | |
| 6.25%, 8/1/18 # | 3,600 | 4,009 |
| Shelby County Health, Ed. & Housing Board | | |
| The Village at Germantown | | |
| 6.375%, 12/1/13 | 700 | 732 |
| 7.25%, 12/1/34 | 2,500 | 2,639 |
| Sullivan County Health, Ed. & Housing, Wellmont Health | | |
| 6.25%, 9/1/22 | 3,100 | 3,441 |
| Total Tennessee (Cost $18,396) | | 19,543 |
| |
| TEXAS 7.7% | | |
| | | |
| Abilene Health Fac. Dev. Corp. | | |
| Sears Methodist Retirement System Obligation Group | | |
| 5.875%, 11/15/18 | 2,750 | 2,822 |
| 6.00%, 11/15/29 | 3,500 | 3,564 |
| 7.00%, 11/15/33 | 4,250 | 4,652 |
| Alliance Airport Auth. IDRB, Federal Express, 6.375%, 4/1/21 # | 1,530 | 1,591 |
| Amarillo Health Fac. Dev. Corp., Sears | | |
| 7.75%, 8/15/26 (Prerefunded 8/15/06†) | 4,800 | 5,114 |
| Brazos River Auth., TXU Energy | | |
| 5.75%, 5/1/36 (Tender 11/1/11) # | 3,075 | 3,285 |
| Brazos River Auth. PCR | | |
| Centerpoint Energy, 7.75%, 12/1/18 | 5,000 | 5,547 |
| TXU Energy | | |
| 5.05%, 6/1/30 (Tender 6/19/06) # | 1,515 | 1,532 |
| 6.75%, 10/1/38 # | 1,435 | 1,605 |
| 7.70%, 4/1/33 # | 4,850 | 5,835 |
| Dallas / Fort Worth Airport, 6.10%, 11/1/20 (FGIC Insured) # | 6,000 | 6,565 |
| Denison Hosp. Auth., Texoma Medical Center | | |
| 7.10%, 8/15/24 | 5,005 | 5,061 |
| Gulf Coast Waste Disposal Auth. | | |
| Anheuser-Busch Companies, 5.90%, 4/1/36 # | 6,750 | 7,284 |
| Waste Management, 3.625%, 5/1/28 (Tender 5/1/06) # | 2,000 | 2,001 |
| Harris County Health Fac. Dev. Corp., Memorial Hermann | | |
| Healthcare, 6.375%, 6/1/29 ++ | 5,250 | 5,807 |
| Houston, 6.40%, 6/1/27 | 4,250 | 4,609 |
| Houston Airport IDRB | | |
| Continental Airlines | | |
| 6.125%, 7/15/27 # | 4,500 | 3,847 |
| 6.75%, 7/1/29 # | 6,730 | 6,449 |
| Houston Health Fac. Dev. Corp. | | |
| Buckingham Senior Living Community | | |
| 7.00%, 2/15/23 | 500 | 556 |
| 7.00%, 2/15/26 | 1,500 | 1,664 |
| Port Corpus Christi Auth. PCR, CNA Holdings | | |
| 6.70%, 11/1/30 # | 6,910 | 7,497 |
| Port Corpus Christi PCR, IDC, Citgo Petroleum | | |
| 8.25%, 11/1/31 # | 3,750 | 4,004 |
| Red River Auth., CNA Holdings, 6.70%, 11/1/30 # | 2,000 | 2,170 |
| Sabine River Auth. PCR, TXU Energy | | |
| 5.50%, 5/1/22 (Tender 11/1/11) | 4,175 | 4,464 |
| San Antonio Health Fac. Dev., Beverly Enterprises | | |
| 8.25%, 12/1/19 | 1,000 | 1,002 |
| Tarrant County Health Fac. Dev. Corp., Baylor Health Care | | |
| 5.375%, 11/15/21 | 3,210 | 3,496 |
| Texas Affordable Housing Corp., NHT\GTEX | | |
| 7.25%, 10/1/31 * | 4,000 | 402 |
| Tomball Hosp. Auth., 6.10%, 7/1/08 | 2,500 | 2,535 |
| Total Texas (Cost $101,870) | | 104,960 |
| |
| UTAH 0.6% | | |
| | | |
| Tooele County PCR | | |
| Safety-Kleen, 7.55%, 7/1/27 #* | 2,000 | 5 |
| Union Pacific, 5.70%, 11/1/26 # | 8,000 | 8,412 |
| Total Utah (Cost $9,756) | | 8,417 |
| |
| VIRGINIA 2.8% | | |
| | | |
| Arlington County IDA, Arlington Hosp. Center, 5.50%, 7/1/10 | 3,375 | 3,679 |
| Buena Vista Public Recreational Auth. | | |
| 5.50%, 7/15/35 (ACA Insured) | 2,075 | 2,220 |
| Charles City County IDA, IDRB, Waste Management | | |
| 6.25%, 4/1/27 (Tender 4/1/12) # | 1,500 | 1,667 |
| Chesapeake Hosp. Auth., Chesapeake General Hosp. | | |
| 5.25%, 7/1/14 | 2,975 | 3,190 |
| Henrico County Economic Dev. Auth., Virginia United Methodist | | |
| Homes, 6.50%, 6/1/22 | 1,000 | 1,077 |
| Hopewell IDA, Smurfit - Stone Container Corp., 5.25%, 6/1/15 | 6,900 | 6,797 |
| Lexington IDA | | |
| Stonewall Jackson Hosp. | | |
| 6.05%, 7/1/09 | 125 | 126 |
| 7.00%, 7/1/25 | 230 | 233 |
| Norfolk Redev. & Housing Auth. | | |
| Harbors Edge Retirement Community | | |
| 6.00%, 1/1/25 | 500 | 519 |
| 6.125%, 1/1/35 | 1,150 | 1,187 |
| Pocahontas Parkway Assoc. | | |
| Zero Coupon, 8/15/09 | 2,100 | 1,658 |
| Zero Coupon, 8/15/10 | 3,600 | 2,677 |
| Zero Coupon, 8/15/13 | 2,800 | 1,741 |
| Zero Coupon, 8/15/14 | 3,100 | 1,815 |
| Zero Coupon, 8/15/17 | 2,095 | 1,026 |
| Zero Coupon, 8/15/19 | 2,000 | 869 |
| Zero Coupon, 8/15/22 | 4,600 | 1,654 |
| Zero Coupon, 8/15/23 | 4,700 | 1,590 |
| 5.50%, 8/15/28 | 2,500 | 2,608 |
| York County IDA, Virginia Electric & Power, 5.50%, 7/1/09 | 2,350 | 2,436 |
| Total Virginia (Cost $37,908) | | 38,769 |
| |
| WASHINGTON 0.5% | | |
| | | |
| Port of Seattle IDRB, Northwest Airlines, 7.25%, 4/1/30 # | 3,000 | 2,796 |
| Snohomish County Housing Auth., Millwood Estates | | |
| 5.50%, 6/1/29 | 3,750 | 3,818 |
| Total Washington (Cost $6,623) | | 6,614 |
| |
| WEST VIRGINIA 0.4% | | |
| | | |
| West Virginia Hosp. Fin. Auth., Oak Hill Hosp. | | |
| 6.75%, 9/1/22 (Prerefunded 9/1/10†) | 5,000 | 5,837 |
| Total West Virginia (Cost $4,930) | | 5,837 |
| |
| WISCONSIN 0.6% | | |
| | | |
| Oconto Falls CDA, Oconto Falls Tissue, 7.75%, 12/1/22 # | 2,600 | 1,914 |
| Wisconsin HEFA, National Regency of New Berlin | | |
| 8.00%, 8/15/25 (Prerefunded 2/15/06†) | 5,655 | 5,887 |
| Total Wisconsin (Cost $8,120) | | 7,801 |
| | | |
| U. S. VIRGIN ISLANDS 0.3% | | |
| | | |
| Virgin Islands PFA | | |
| Hovensa Refinery | | |
| 5.875%, 7/1/22 # | 1,800 | 1,960 |
| 6.125%, 7/1/22 # | 2,350 | 2,597 |
| Total U. S. Virgin Islands (Cost $4,156) | | 4,557 |
| |
| PREFERRED SHARES 0.8% | | |
| | | |
| Charter Mac Equity Issuer Trust, Pfd., (Series A) | | |
| 144A, 6.00%, 4/30/19 | 4,000 | 4,424 |
| Munimae Bond Subsidiary Cum. Pfd., (Series A) | | |
| 144A, 6.875%, 6/30/49 (Tender 6/30/09) # | 6,000 | 6,583 |
| Total Preferred Shares (Cost $10,000) | | 11,007 |
| |
| FUTURES 0.0% | | |
| Variation margin receivable (payable) on open futures contracts (2) | | (85) |
| Total Futures | | (85) |
| | | |
| Total Investments in Securities | | |
| 98.7% of Net Assets (Cost $1,283,527) | | $ 1,348,377 |
| (1) | Denominated in U.S. dollars unless other- | FSA | Financial Security Assurance Inc. |
| | wise noted | GO | General Obligation |
| # | Interest subject to alternative minimum tax | HEFA | Health & Educational Facility Authority |
| * | In default with respect to payment of interest. | HFA | Health Facility Authority |
| ++ | All or a portion of this security is pledged to | HFC | Housing Finance Corp. |
| | cover margin requirements on futures con- | HFFA | Health Facility Financing Authority |
| | tracts at August 31, 2005. | HHEFA | Health & Higher Educational Facility Authority |
| † | Used in determining portfolio maturity | IDA | Industrial Development Authority/Agency |
| 144A | Security was purchased pursuant to Rule | IDB | Industrial Development Bond |
| | 144A under the Securities Act of 1933 and | IDC | Industrial Development Corp. |
| | may be resold in transactions exempt from | IDRB | Industrial Development Revenue Bond |
| | registration only to qualified institutional | MBIA | MBIA Insurance Corp. |
| | buyers – total value of such securities at | PCR | Pollution Control Revenue |
| | period-end amounts to $17,260 and repre- | PFA | Public Finance Authority |
| | sents 1.3% of net assets | RAA | Radian Asset Assurance Inc. |
| ACA | American Capital Access Financial Guaranty | STEP | Stepped coupon bond for which the coupon |
| | Corp. | | rate of interest will adjust on specified future |
| AMBAC | AMBAC Assurance Corp. | | date(s) |
| CDA | Community Development | VR | Variable Rate; rate shown is effective rate |
| | Administration/Authority | | at period-end |
| COP | Certificates of Participation | VRDN | Variable-Rate Demand Note; rate shown is |
| EFA | Educational Facility Authority | | effective rate at period-end |
| FGIC | Financial Guaranty Insurance Company | XLCA | XL Capital Assurance Inc. |
| (2) Open Futures Contracts at August 31, 2005 were as follows: |
| ($ 000s) | | | | | |
| | | | Contract | | Unrealized |
| | Expiration | | Value | | Gain (Loss) |
| Short, 150 U.S. Treasury ten year notes | | | | | |
| contracts, $300 par of 6.375% Harris | | | | | |
| County Health Fac. Dev. Corp. bonds | | | | | |
| pledged as initial margin | 9/05 | $ | (16,939) | $ | (33) |
| Net payments (receipts) of variation | | | | | |
| margin to date | | | | | (52) |
| Variation margin receivable (payable) | | | | | |
| on open futures contracts | | | | $ | (85) |
| ‡Restricted Securities | | | |
| Amounts in (000s) | | | |
| |
| |
| The fund may invest in securities that cannot be offered for public resale without first being | |
| registered under the Securities Act of 1933 and related rules. The total restricted securities | |
| (excluding 144A issues) at period-end amounts to $11,515 and represents 0.8% of net assets. | |
| |
| | Acquisition | Acquisition |
| Description | Date | | Cost |
| District of Columbia, GO, VR, 8.119%, 6/1/17 | 8/10/99 | $ | 2,258 |
| District of Columbia, GO, VR, 8.373%, 6/1/13 | 8/10/99 | | 4,755 |
| District of Columbia, GO, VR, 8.373%, 6/1/14 | 8/10/99 | | 2,828 |
| Totals | | $ | 9,841 |
| |
| The fund has registration rights for certain restricted securities held as of August 31, 2005. Any |
| costs related to such registration are borne by the issuer. | | | |
The accompanying notes are an integral part of these financial statements.
Unaudited
| STATEMENT OF ASSETS AND LIABILITIES | | |
| (In thousands except shares and per share amounts) | | |
| Assets | | |
| Investments in securities, at value (cost $1,283,527) | $ | 1,348,377 |
| Interest receivable | | 19,300 |
| Receivable for investment securities sold | | 4,199 |
| Receivable for shares sold | | 1,719 |
| Other assets | | 232 |
|
|
| Total assets | | 1,373,827 |
|
|
| |
| Liabilities | | |
| Investment management fees payable | | 697 |
| Payable for investment securities purchased | | 4,207 |
| Payable for shares redeemed | | 557 |
| Due to affiliates | | 39 |
| Other liabilities | | 1,966 |
|
|
| Total liabilities | | 7,466 |
|
|
| |
| NET ASSETS | $ | 1,366,361 |
|
|
| Net Assets Consist of: | | |
| Undistributed net investment income (loss) | $ | 2,070 |
| Undistributed net realized gain (loss) | | (38,543) |
| Net unrealized gain (loss) | | 64,902 |
| Paid-in-capital applicable to 113,338,050 shares of | | |
| $0.01 par value capital stock outstanding; | | |
| 1,000,000,000 shares authorized | | 1,337,932 |
|
|
| |
| NET ASSETS | $ | 1,366,361 |
|
|
| |
| NET ASSET VALUE PER SHARE | $ | 12.06 |
|
|
The accompanying notes are an integral part of these financial statements.
Unaudited
| STATEMENT OF OPERATIONS | | |
| ($ 000s) | | |
| | | 6 Months |
| | | Ended |
| | | 8/31/05 |
| Investment Income (Loss) | | |
| Interest income | $ | 36,796 |
|
|
| Expenses | | |
| Investment management | | 4,021 |
| Shareholder servicing | | 305 |
| Custody and accounting | | 116 |
| Prospectus and shareholder reports | | 35 |
| Registration | | 34 |
| Legal and audit | | 34 |
| Proxy and annual meeting | | 6 |
| Directors | | 4 |
| Miscellaneous | | 59 |
|
|
| Total expenses | | 4,614 |
| Expenses paid indirectly | | (4) |
|
|
| Net expenses | | 4,610 |
|
|
| Net investment income (loss) | | 32,186 |
|
|
| |
| Realized and Unrealized Gain (Loss) | | |
| Net realized gain (loss) | | |
| Securities | | (214) |
| Futures | | (552) |
|
|
| Net realized gain (loss) | | (766) |
|
|
| Change in net unrealized gain (loss) | | |
| Securities | | 22,491 |
| Futures | | (333) |
|
|
| Change in net unrealized gain (loss) | | 22,158 |
|
|
| Net realized and unrealized gain (loss) | | 21,392 |
|
|
| |
| INCREASE (DECREASE) IN NET | | |
| ASSETS FROM OPERATIONS | $ | 53,578 |
|
|
The accompanying notes are an integral part of these financial statements.
Unaudited
| STATEMENT OF CHANGES IN NET ASSETS | | | | |
| ($ 000s) | | | | |
| | | 6 Months | | Year |
| | | Ended | | Ended |
| | | 8/31/05 | | 2/28/05 |
| |
| Increase (Decrease) in Net Assets | | | | |
| Operations | | | | |
| Net investment income (loss) | $ | 32,186 | $ | 60,432 |
| Net realized gain (loss) | | (766) | | 387 |
| Change in net unrealized gain (loss) | | 22,158 | | 3,013 |
|
|
| Increase (decrease) in net assets from operations | | 53,578 | | 63,832 |
|
|
| |
| Distributions to shareholders | | | | |
| Net investment income | | (31,970) | | (60,207) |
|
|
| |
| Capital share transactions * | | | | |
| Shares sold | | 133,635 | | 222,181 |
| Distributions reinvested | | 21,489 | | 39,737 |
| Shares redeemed | | (75,919) | | (172,867) |
|
|
| Increase (decrease) in net assets from capital | | | | |
| share transactions | | 79,205 | | 89,051 |
|
|
| |
| Net Assets | | | | |
| Increase (decrease) during period | | 100,813 | | 92,676 |
| Beginning of period | | 1,265,548 | | 1,172,872 |
|
|
| |
| End of period | $ | 1,366,361 | $ | 1,265,548 |
|
|
| (Including undistributed net investment income of | | | | |
| $2,070 at 8/31/05 and $1,854 at 2/28/05) | | | | |
| |
| *Share information | | | | |
| Shares sold | | 11,210 | | 18,976 |
| Distributions reinvested | | 1,799 | | 3,402 |
| Shares redeemed | | (6,374) | | (14,823) |
|
|
| Increase (decrease) in shares outstanding | | 6,635 | | 7,555 |
The accompanying notes are an integral part of these financial statements.
Unaudited
| NOTES TO FINANCIAL STATEMENTS |
NOTE 1 - SIGNIFICANT ACCOUNTING POLICIES
T. Rowe Price Tax-Free High Yield Fund, Inc. (the fund) is registered under the Investment Company Act of 1940 (the 1940 Act) as a diversified, open-end management investment company. The fund commenced operations on March 1, 1985. The fund seeks to provide a high level of income exempt from federal income taxes by investing primarily in long-term low- to upper-medium-grade municipal securities.
The accompanying financial statements were prepared in accordance with accounting principles generally accepted in the United States of America, which require the use of estimates made by fund management. Fund management believes that estimates and security valuations are appropriate; however actual results may differ from those estimates, and the security valuations reflected in the financial statements may differ from the value the fund receives upon sale of the securities.
Valuation The fund values its investments and computes its net asset value per share at the close of the New York Stock Exchange (NYSE), normally 4 p.m. ET, each day that the NYSE is open for business. Debt securities are generally traded in the over-the-counter market. Securities are valued at prices furnished by dealers who make markets in such securities or by an independent pricing service, which considers yield or price of bonds of comparable quality, coupon, maturity, and type, as well as prices quoted by dealers who make markets in such securities.
Financial futures contracts are valued at closing settlement prices.
Other investments, including restricted securities, and those for which the above valuation procedures are inappropriate or are deemed not to reflect fair value are stated at fair value as determined in good faith by the T. Rowe Price Valuation Committee, established by the fund’s Board of Directors.
Credits The fund earns credits on temporarily uninvested cash balances at the custodian that reduce the fund’s custody charges. Custody expense in the accompanying financial statements is presented before reduction for credits, which are reflected as expenses paid indirectly.
Investment Transactions, Investment Income, and Distributions Income and expenses are recorded on the accrual basis. Premiums and discounts on debt securities are amortized for financial reporting purposes. Investment transactions are accounted for on the trade date. Realized gains and losses are reported on the identified cost basis. Payments (“variation margin”) made or received to settle the daily fluctuations in the value of futures contracts are recorded as unrealized gains or losses until the contracts are closed. Unsettled variation margin on futures contracts is included in investments in securities, and unrealized gains and losses on futures contracts are included in the change in net unrealized gain or loss in the accompanying financial statements. Distributions to shareholders are recorded on the ex-dividend date. Income distributions are declared on a daily basis and paid monthly. Capital gain distributions, if any, are declared and paid by the fund, typically on an annual basis.
NOTE 2 - INVESTMENT TRANSACTIONS
Consistent with its investment objective, the fund engages in the following practices to manage exposure to certain risks or enhance performance. The investment objective, policies, program, and risk factors of the fund are described more fully in the fund’s prospectus and Statement of Additional Information.
Noninvestment-Grade Debt Securities At August 31, 2005, approximately 38% of the fund’s net assets were invested in noninvestment-grade debt securities, commonly referred to as “high-yield” or “junk” bonds. A real or perceived economic downturn or higher interest rates could adversely affect the liquidity or value, or both, of such securities because such events could lessen the ability of issuers to make principal and interest payments.
Restricted Securities The fund may invest in securities that are subject to legal or contractual restrictions on resale. Although certain of these securities may be readily sold, for example, under Rule 144A, others may be illiquid, their sale may involve substantial delays and additional costs, and prompt sale at an acceptable price may be difficult.
Futures Contracts During the six months ended August 31, 2005, the fund was a party to futures contracts, which provide for the future sale by one party and purchase by another of a specified amount of a specific financial instrument at an agreed upon price, date, time, and place. Risks arise from possible illiquidity of the futures market and from movements in security values and/or interest rates.
Other Purchases and sales of portfolio securities, other than short-term securities, aggregated $213,325,000 and $113,522,000, respectively, for the six months ended August 31, 2005.
NOTE 3 - FEDERAL INCOME TAXES
No provision for federal income taxes is required since the fund intends to continue to qualify as a regulated investment company under Subchapter M of the Internal Revenue Code and distribute to shareholders all of its income and gains. Federal income tax regulations differ from generally accepted accounting principles; therefore, distributions determined in accordance with tax regulations may differ in amount or character from net investment income and realized gains for financial reporting purposes. Financial reporting records are adjusted for permanent book/tax differences to reflect tax character. Financial records are not adjusted for temporary differences. The amount and character of tax-basis distributions and composition of net assets are finalized at fiscal year-end; accordingly, tax-basis balances have not been determined as of August 31, 2005.
The fund intends to retain realized gains to the extent of available capital loss carryforwards. As of February 28, 2005, the fund had $36,088,000 of unused capital loss carryforwards, of which $10,066,000 expire in fiscal 2008, $15,713,000 expire in fiscal 2009, and $10,309,000 thereafter through fiscal 2011.
At August 31, 2005, the cost of investments for federal income tax purposes was $1,281,688,000. Net unrealized gain aggregated $66,741,000 at period-end, of which $90,832,000 related to appreciated investments and $24,091,000 related to depreciated investments.
NOTE 4 - RELATED PARTY TRANSACTIONS
The fund is managed by T. Rowe Price Associates, Inc. (the manager or Price Associates), a wholly owned subsidiary of T. Rowe Price Group, Inc. The investment management agreement between the fund and the manager provides for an annual investment management fee, which is computed daily and paid monthly. The fee consists of an individual fund fee, equal to 0.30% of the fund’s average daily net assets, and a group fee. The group fee rate is calculated based on the combined net assets of certain mutual funds sponsored by Price Associates (the group) applied to a graduated fee schedule, with rates ranging from 0.48% for the first $1 billion of assets to 0.29% for assets in excess of $160 billion. Prior to May 1, 2005, the maximum group fee rate in the graduated fee schedule had been 0.295% for assets in excess of $120 billion. The fund’s group fee is determined by applying the group fee rate to the fund’s average daily net assets. At August 31, 2005, the effective annual group fee rate was 0.31%.
In addition, the fund has entered into service agreements with Price Associates and a wholly owned subsidiary of Price Associates (collectively, Price). Price Associates computes the daily share price and maintains the financial records of the fund. T. Rowe Price Services, Inc., provides shareholder and administrative services in its capacity as the fund’s transfer and dividend disbursing agent. For the six months ended August 31, 2005, expenses incurred pursuant to these service agreements were $52,000 for Price Associates and $213,000 for T. Rowe Price Services. The total amount payable at period end pursuant to these service agreements is reflected as Due to Affiliates in the accompanying financial statements.
| INFORMATION ON PROXY VOTING POLICIES, PROCEDURES, AND RECORDS |
A description of the policies and procedures used by T. Rowe Price funds and portfolios to determine how to vote proxies relating to portfolio securities is available in each fund’s Statement of Additional Information, which you may request by calling 1-800-225-5132 or by accessing the SEC’s Web site, www.sec.gov. The description of our proxy voting policies and procedures is also available on our Web site, www.troweprice.com. To access it, click on the words “Company Info” at the top of our homepage for individual investors. Then, in the window that appears, click on the “Proxy Voting Policy” navigation button in the top left corner.
Each fund’s most recent annual proxy voting record is available on our Web site and through the SEC’s Web site. To access it through our Web site, follow the directions above, then click on the words “Proxy Voting Record” at the bottom of the Proxy Voting Policy page.
| HOW TO OBTAIN QUARTERLY PORTFOLIO HOLDINGS |
The fund files a complete schedule of portfolio holdings with the Securities and Exchange Commission for the first and third quarters of each fiscal year on Form N-Q. The fund’s Form N-Q is available electronically on the SEC’s Web site (www.sec.gov); hard copies may be reviewed and copied at the SEC’s Public Reference Room, 450 Fifth St. N.W., Washington, DC 20549. For more information on the Public Reference Room, call 1-800-SEC-0330.
| APPROVAL OF INVESTMENT MANAGEMENT AGREEMENT |
On March 2, 2005, the fund’s Board of Directors unanimously approved the investment advisory contract (“Contract”) between the fund and its investment manager, T. Rowe Price Associates, Inc. (“Manager”). The Board considered a variety of factors in connection with its review of the Contract, also taking into account information provided by the Manager during the course of the year, as discussed below:
Services Provided by the Manager
The Board considered the nature, quality, and extent of the services provided to the fund by the Manager. These services included, but were not limited to, management of the fund’s portfolio and a variety of activities related to portfolio management. The Board also reviewed the background and experience of the Manager’s senior management team and investment personnel involved in the management of the fund. The Board concluded that it was satisfied with the nature, quality, and extent of the services provided by the Manager.
Investment Performance of the Fund
The Board reviewed the fund’s average annual total return over the 1-, 3-, 5-, and 10-year periods as well as the fund’s year-by-year returns and compared these returns to previously agreed upon comparable performance measures and market data, including those supplied by Lipper and Morningstar, which are independent providers of mutual fund data. On the basis of this evaluation and the Board’s ongoing review of investment results, the Board concluded that the fund’s performance was satisfactory.
Costs, Benefits, Profits, and Economies of Scale
The Board reviewed detailed information regarding the revenues received by the Manager under the Contract and other benefits that the Manager (and its affiliates) may have realized from its relationship with the fund, including research received under “soft dollar” agreements. The Board also received information on the estimated costs incurred and profits realized by the Manager and its affiliates from advising T. Rowe Price mutual funds, as well as estimates of the gross profits realized from managing the fund in particular. The Board concluded that the Manager’s profits were reasonable in light of the services provided to the fund. The Board also considered whether the fund or other funds benefit under the fee levels set forth in the Contract from any economies of scale realized by the Manager. Under the Contract, the fund pays a fee to the Manager composed of two components—a group fee rate based on the aggregate assets of certain T. Rowe Price mutual funds (including the fund) that declines at certain asset levels and an individual fund fee rate that is assessed on the assets of the fund. The Board concluded that an additional breakpoint should be added to the group fee component of the fees paid by the fund under the Contract at a level of $160 billion. The Board further concluded that, with this change, the advisory fee structure for the fund continued to provide for a reasonable sharing of benefits from economies of scale with the fund’s investors.
Fees
The Board reviewed the fund’s management fee rate, operating expenses, and total expense ratio and compared them to fees and expenses of other comparable funds based on information and data supplied by Lipper. The information provided to the Board indicated that the fund’s management fee rate was above the median for certain groups of comparable funds but below the median for other groups of comparable funds. The information also indicated that the fund’s expense ratio was generally below the median for comparable funds. The Board also reviewed the fee schedules for comparable privately managed accounts of the Manager and its affiliates. Management informed the Board that the Manager’s responsibilities for privately managed accounts are more limited than its responsibilities for the fund and other T. Rowe Price mutual funds that it or its affiliates advise. On the basis of the information provided, the Board concluded that the fees paid by the fund under the Contract were reasonable.
Approval of the Contract
As noted, the Board approved the continuation of the Contract as amended to add an additional breakpoint to the group fee rate. No single factor was considered in isolation or to be determinative to the decision. Rather, the Board concluded, in light of a weighting and balancing of all factors considered, that it was in the best interests of the fund to approve the continuation of the Contract, including the fees to be charged for services thereunder.
Item 2. Code of Ethics.
A code of ethics, as defined in Item 2 of Form N-CSR, applicable to its principal executive officer, principal financial officer, principal accounting officer or controller, or persons performing similar functions is filed as an exhibit to the registrant’s annual Form N-CSR. No substantive amendments were approved or waivers were granted to this code of ethics during the registrant’s most recent fiscal half-year.
Item 3. Audit Committee Financial Expert.
Disclosure required in registrant’s annual Form N-CSR.
Item 4. Principal Accountant Fees and Services.
Disclosure required in registrant’s annual Form N-CSR.
Item 5. Audit Committee of Listed Registrants.
Not applicable.
Item 6. Schedule of Investments.
Not applicable. The complete schedule of investments is included in Item 1 of this Form N-CSR.
Item 7. Disclosure of Proxy Voting Policies and Procedures for Closed-End Management Investment Companies.
Not applicable.
Item 8. Portfolio Managers of Closed-End Management Investment Companies.
Not applicable.
Item 9. Purchases of Equity Securities by Closed-End Management Investment Company and Affiliated Purchasers.
Not applicable.
Item 10. Submission of Matters to a Vote of Security Holders.
Not applicable.
Item 11. Controls and Procedures.
(a) The registrant’s principal executive officer and principal financial officer have evaluated the registrant’s disclosure controls and procedures within 90 days of this filing and have concluded that the registrant’s disclosure controls and procedures were effective, as of that date, in ensuring that information required to be disclosed by the registrant in this Form N-CSR was recorded, processed, summarized, and reported timely.
(b) The registrant’s principal executive officer and principal financial officer are aware of no change in the registrant’s internal control over financial reporting that occurred during the registrant’s second fiscal quarter covered by this report that has materially affected, or is reasonably likely to materially affect, the registrant’s internal control over financial reporting.
Item 12. Exhibits.
(a)(1) The registrant’s code of ethics pursuant to Item 2 of Form N-CSR is filed with the registrant’s annual Form N-CSR.
(2) Separate certifications by the registrant's principal executive officer and principal financial officer, pursuant to Section 302 of the Sarbanes-Oxley Act of 2002 and required by Rule 30a-2(a) under the Investment Company Act of 1940, are attached.
(3) Written solicitation to repurchase securities issued by closed-end companies: not applicable.
(b) A certification by the registrant's principal executive officer and principal financial officer, pursuant to Section 906 of the Sarbanes-Oxley Act of 2002 and required by Rule 30a-2(b) under the Investment Company Act of 1940, is attached.
SIGNATURES |
| |
| | Pursuant to the requirements of the Securities Exchange Act of 1934 and the Investment |
| Company Act of 1940, the registrant has duly caused this report to be signed on its behalf by the |
| undersigned, thereunto duly authorized. |
| |
| T. Rowe Price Tax-Free High Yield Fund, Inc. |
| |
| By | /s/ James S. Riepe |
| | James S. Riepe |
| | Principal Executive Officer |
| |
| Date | October 14, 2005 |
| |
| |
| | Pursuant to the requirements of the Securities Exchange Act of 1934 and the Investment |
| Company Act of 1940, this report has been signed below by the following persons on behalf of |
| the registrant and in the capacities and on the dates indicated. |
| |
| |
| By | /s/ James S. Riepe |
| | James S. Riepe |
| | Principal Executive Officer |
| |
| Date | October 14, 2005 |
| |
| |
| |
| By | /s/ Joseph A. Carrier |
| | Joseph A. Carrier |
| | Principal Financial Officer |
| |
| Date | October 14, 2005 |