
Better Lives. Better Planet.SM Q4 and Full Year FY 2012 Financial Results September 13, 2012 Exhibit 99.2

2 The matters discussed in this presentation contain “forward-looking statements” as defined in the Private Securities Litigation Reform Act of 1995. Results for fiscal year 2012 are preliminary until the Company's Form 10-K is filed with the Securities and Exchange Commission on or before October 1, 2012. Forward-looking statements are those that address activities, events or developments that the Company or management intends, expects, projects, believes or anticipates will or may occur in the future. All statements regarding future performance, earnings projections, earnings guidance, management’s expectations about its future cash needs, dilution from the disposition or future allocation of capital and effective tax rate, and other future events or developments are forward-looking statements. Forward-looking statements are those that use terms such as “may,” “will,” “expect,” “believe,” “intend,” “should,” “could,” “anticipate,” “estimate,” “forecast,” “project,” “plan,” “predict,” “potential,” and similar expressions. Forward-looking statements contained in this and other written and oral reports are based on management’s assumptions and assessments in light of past experience and trends, current conditions, expected future developments and other relevant factors. The Company’s forward-looking statements are subject to risks and uncertainties and are not guarantees of future performance, and actual results, developments and business decisions may differ materially from those envisaged by the Company’s forward-looking statements. Such risks and uncertainties include, but are not limited to, those discussed in Part I–Item 1A.–Risk Factors in the 2011 Form 10-K, and other reports the Company files with the Securities and Exchange Commission, including: the impact of legislative, regulatory and political developments globally; the impact of the uncertain global economic environment; the extent to which adverse economic conditions may affect the Company’s sales volume and results; demand for our products and business relationships with key customers and suppliers, which may be impacted by their cash flow and payment practices; delays or cancellations in shipments; the Company's ability to develop and commercialize new technologies or obtain regulatory approval or market acceptance of new technologies; increase in costs of manufacturing and operating costs; the Company’s ability to achieve and sustain the savings anticipated from its structural cost initiatives; the Company’s ability to meet its regulatory obligations; changes in product mix, market mix and product pricing, particularly relating to the expansion of the systems business; the Company’s ability to successfully complete the Company's business improvement initiatives, which include supply chain enhancements and integrating and upgrading the Company's information systems; the effect of a serious disruption in the Company's information systems; fluctuations in the Company’s effective tax rate; the Company’s ability to enforce patents and protect proprietary products and manufacturing techniques; the Company’s ability to successfully complete or integrate any acquisitions; volatility in foreign currency exchange rates, interest rates and energy costs and other macroeconomic challenges currently affecting the Company; the impact of pricing and other actions by competitors; the effect of litigation and regulatory inquiries associated with the restatement of the Company's prior period financial statements; the Company’s ability to attract and retain management talent or the loss of members of its senior management team; and the effect of the restrictive covenants in the Company’s debt facilities. Factors or events that could cause the Company's actual results to differ may emerge from time to time, and it is not possible for the Company to predict all of them. The Company makes these statements as of the date of this disclosure and undertakes no obligation to update them, whether as a result of new information, future developments or otherwise. Management uses certain non-GAAP measurements to assess the Company’s current and future financial performance. The non-GAAP measurements do not replace the presentation of the Company’s GAAP financial results. These measurements provide supplemental information to assist management in analyzing the Company’s financial position and results of operations. The Company has chosen to provide this information to facilitate meaningful comparisons of past, present and future operating results and as a means to emphasize the results of ongoing operations. Reconciliations of the non-GAAP financial measures used throughout this presentation to the most directly comparable GAAP measures appear at the end of this presentation in the Appendix and are also available on Pall’s website at www.pall.com/investor. Forward-Looking Statements
3 Conference Call Replay Info • Toll-Free: 855.859.2056 • International: 404.537.3406 • Conference ID: 26044759 • Internet: www.pall.com/investor
4 Agenda • Pall Outlook and FY 2012 Summary • Q4 and FY 2012 Performance • FY 2013 Guidance • Q&A All remarks in this presentation are on a “Continuing Operations” basis, which excludes the results of the Blood product line divestiture, unless indicated otherwise.
5 FY 2012 Summary & Outlook • Record quarter despite headwinds • Progress on People, Process and Technology initiatives • Capital allocation priorities • Structural cost improvement initiative • Macro environment and headwinds Value Creation in a Volatile Economy
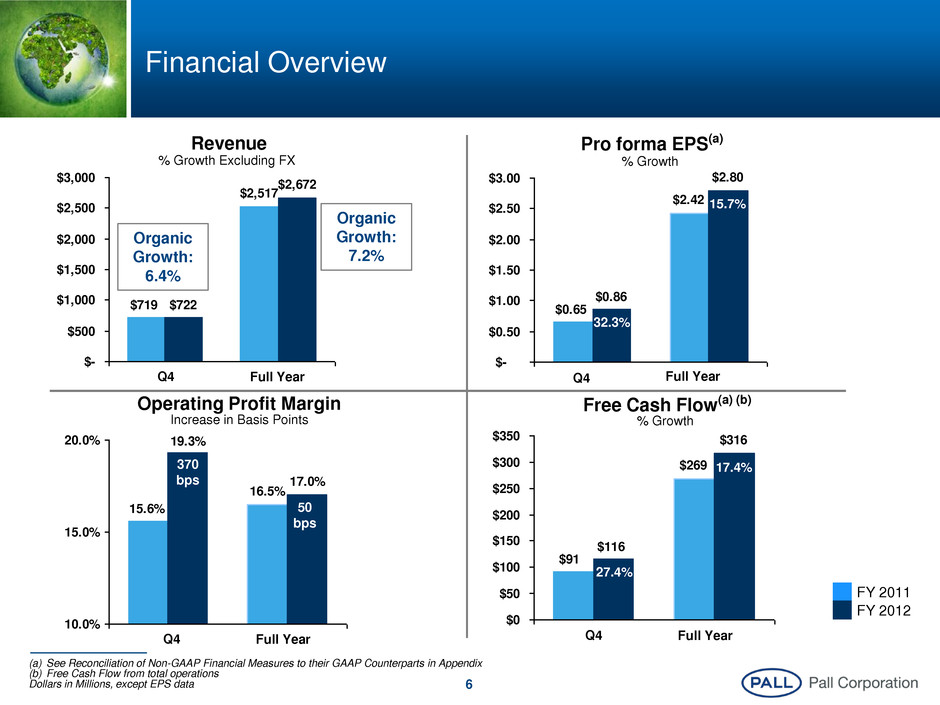
6 $2,517 $2,672 $719 $722 $- $500 $1,000 $1,500 $2,000 $2,500 $3,000 Revenue % Growth Excluding FX Q4 Full Year Financial Overview (a) See Reconciliation of Non-GAAP Financial Measures to their GAAP Counterparts in Appendix (b) Free Cash Flow from total operations Dollars in Millions, except EPS data $2.42 $2.80 $0.65 $0.86 $- $0.50 $1.00 $1.50 $2.00 $2.50 $3.00 Pro forma EPS(a) % Growth Q4 Full Year 15.7% 32.3% 16.5% 17.0% 15.6% 19.3% 10.0% 15.0% 20.0% Operating Profit Margin Increase in Basis Points Q4 Full Year 370 bps 50 bps $269 $316 $91 $116 $0 $50 $100 $150 $200 $250 $300 $350 Free Cash Flow(a) (b) Q4 Full Year % Growth 27.4% 17.4% FY 2011 FY 2012 Organic Growth: 6.4% Organic Growth: 7.2%
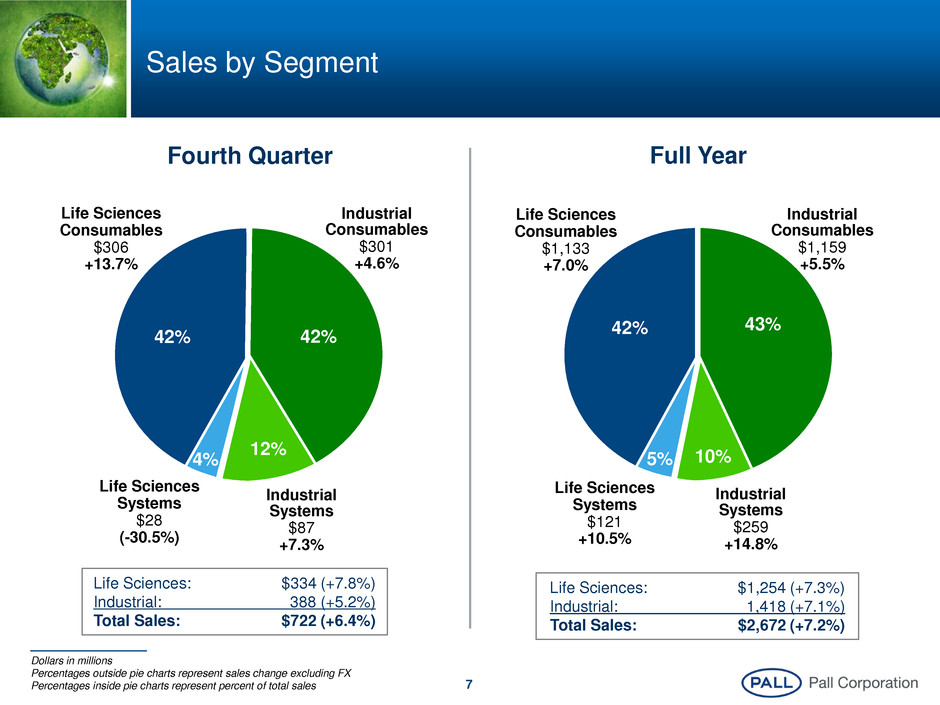
7 Fourth Quarter Life Sciences Consumables $306 +13.7% Industrial Consumables $301 +4.6% Industrial Systems $87 +7.3% Life Sciences Systems $28 (-30.5%) 42% 42% 12% 4% Sales by Segment Life Sciences Consumables $1,133 +7.0% Industrial Consumables $1,159 +5.5% Full Year Industrial Systems $259 +14.8% Life Sciences Systems $121 +10.5% 42% 43% 10% 5% Life Sciences: $334 (+7.8%) Industrial: 388 (+5.2%) Total Sales: $722 (+6.4%) Dollars in millions Percentages outside pie charts represent sales change excluding FX Percentages inside pie charts represent percent of total sales Life Sciences: $1,254 (+7.3%) Industrial: 1,418 (+7.1%) Total Sales: $2,672 (+7.2%)
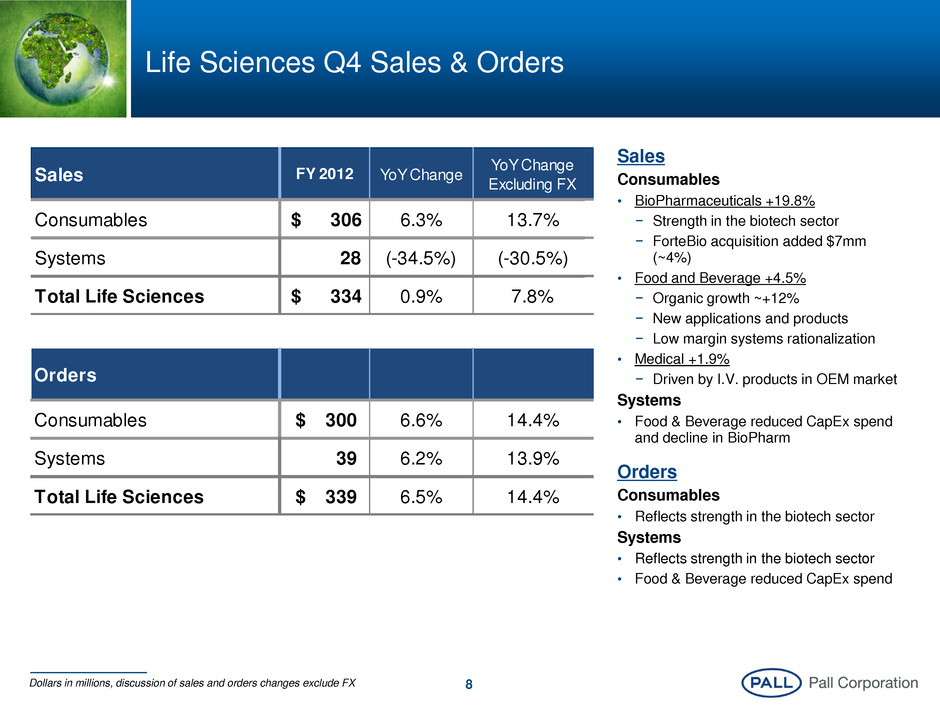
8 Life Sciences Q4 Sales & Orders Sales Consumables • BioPharmaceuticals +19.8% − Strength in the biotech sector − ForteBio acquisition added $7mm (~4%) • Food and Beverage +4.5% − Organic growth ~+12% − New applications and products − Low margin systems rationalization • Medical +1.9% − Driven by I.V. products in OEM market Systems • Food & Beverage reduced CapEx spend and decline in BioPharm Orders Consumables • Reflects strength in the biotech sector Systems • Reflects strength in the biotech sector • Food & Beverage reduced CapEx spend Dollars in millions, discussion of sales and orders changes exclude FX Orders Consumables $ 300 6.6% 14.4% Systems 39 6.2% 13.9% Total Life Sciences $ 339 6.5% 14.4% Sale FY 2012 YoY Change YoY Change Excluding FX Consumables $ 306 6.3% 13.7% Systems 28 (-34.5%) (-30.5%) Total Life Sci nces $ 334 0.9% 7.8%
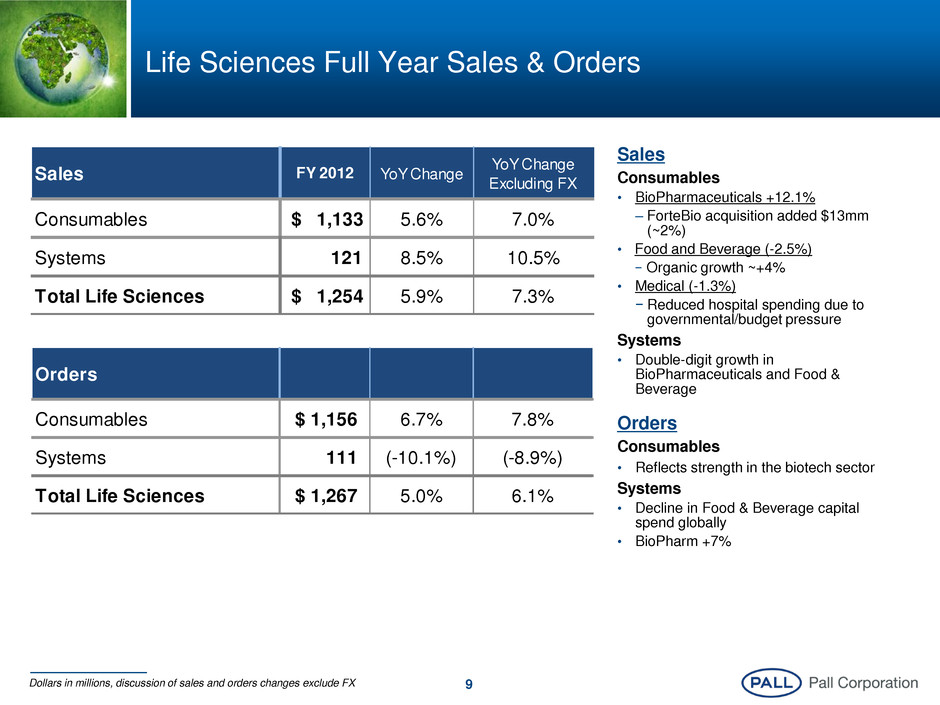
9 Life Sciences Full Year Sales & Orders Sales Consumables • BioPharmaceuticals +12.1% – ForteBio acquisition added $13mm (~2%) • Food and Beverage (-2.5%) − Organic growth ~+4% • Medical (-1.3%) − Reduced hospital spending due to governmental/budget pressure Systems • Double-digit growth in BioPharmaceuticals and Food & Beverage Orders Consumables • Reflects strength in the biotech sector Systems • Decline in Food & Beverage capital spend globally • BioPharm +7% Dollars in millions, discussion of sales and orders changes exclude FX Orders Consumable $ 1,156 6.7% 7.8% Systems 111 (-10.1%) (-8.9%) Total Life Sci nces $ 1,267 5.0% 6.1% Sale FY 2012 YoY Change YoY Change Excluding FX Consumables $ 1,133 5.6% 7.0% Systems 121 8.5% 10.5% Total Life Sci ces $ 1,254 5.9% 7.3%
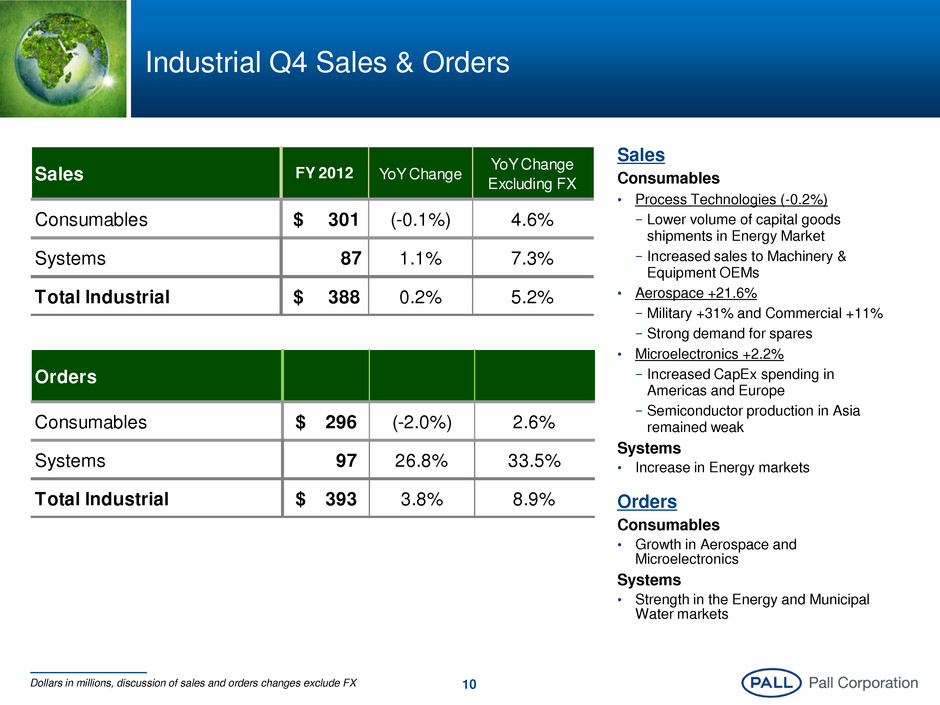
10 Industrial Q4 Sales & Orders Sales Consumables • Process Technologies (-0.2%) − Lower volume of capital goods shipments in Energy Market − Increased sales to Machinery & Equipment OEMs • Aerospace +21.6% − Military +31% and Commercial +11% − Strong demand for spares • Microelectronics +2.2% − Increased CapEx spending in Americas and Europe − Semiconductor production in Asia remained weak Systems • Increase in Energy markets Orders Consumables • Growth in Aerospace and Microelectronics Systems • Strength in the Energy and Municipal Water markets Dollars in millions, discussion of sales and orders changes exclude FX Sales FY 2012 YoY Change YoY Change Excluding FX Consumables $ 301 (-0.1%) 4.6% Systems 87 1.1% 7.3% Total Industrial $ 388 0.2% 5.2% Orders Consumables $ 296 (-2.0%) 2.6% Systems 97 26.8% 33.5% Total Industrial $ 393 3.8% 8.9%
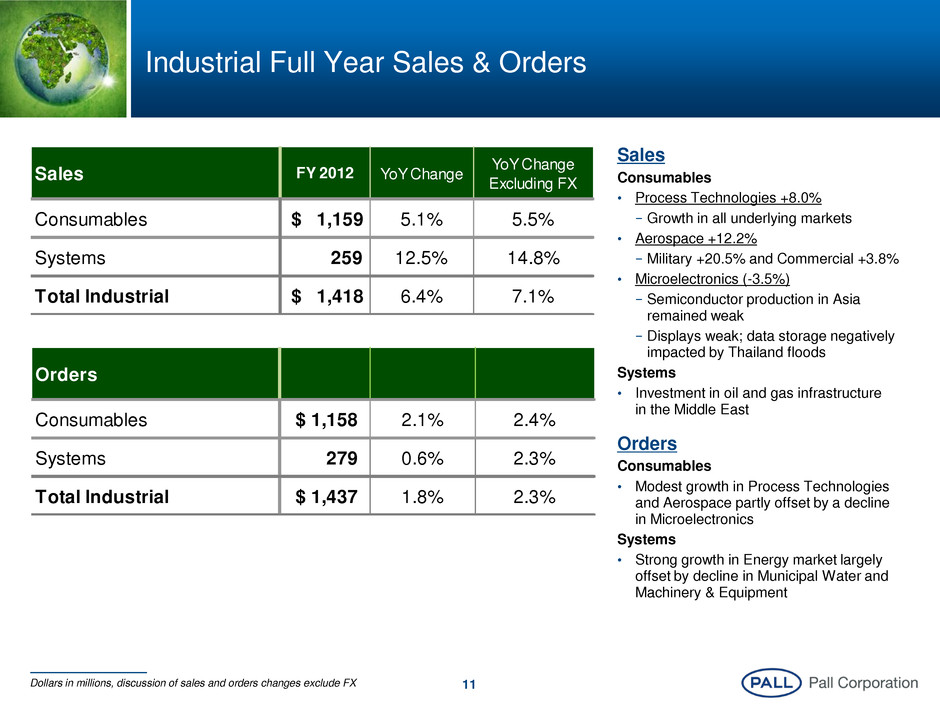
11 Industrial Full Year Sales & Orders Sales Consumables • Process Technologies +8.0% − Growth in all underlying markets • Aerospace +12.2% − Military +20.5% and Commercial +3.8% • Microelectronics (-3.5%) − Semiconductor production in Asia remained weak − Displays weak; data storage negatively impacted by Thailand floods Systems • Investment in oil and gas infrastructure in the Middle East Orders Consumables • Modest growth in Process Technologies and Aerospace partly offset by a decline in Microelectronics Systems • Strong growth in Energy market largely offset by decline in Municipal Water and Machinery & Equipment Dollars in millions, discussion of sales and orders changes exclude FX Sales FY 2012 YoY Change YoY Change Excluding FX Consumables $ 1,159 5.1% 5.5% Systems 259 12.5% 14.8% Total Indust ial $ 1,418 6.4% 7.1% Orders Consumable $ 1,158 2.1% 2.4% Systems 279 0.6% 2.3% Total Indust ia $ 1,437 1.8% 2.3%
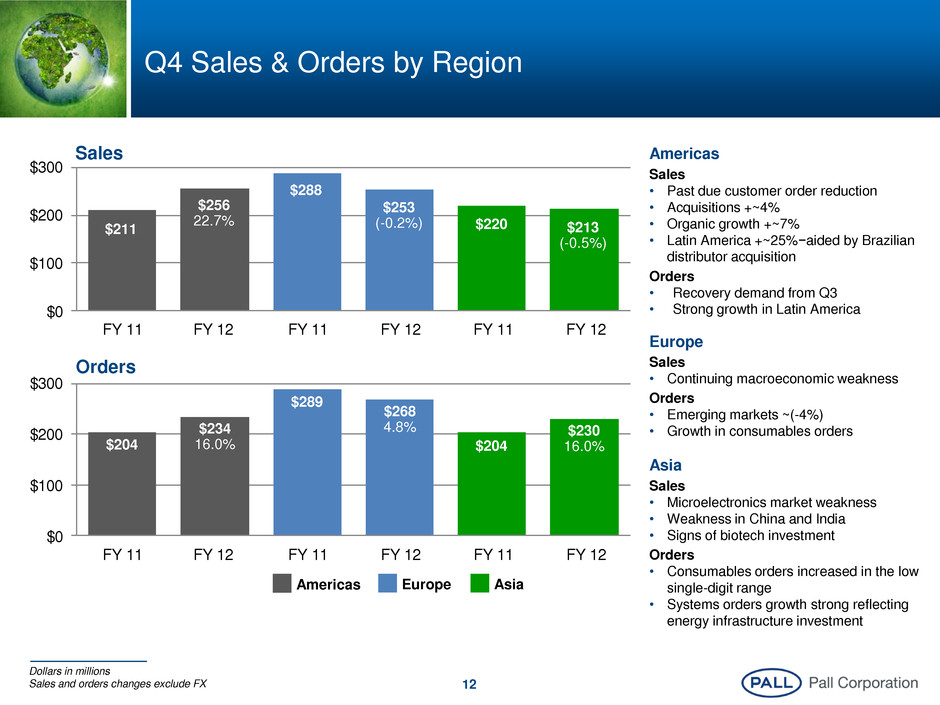
12 Q4 Sales & Orders by Region Dollars in millions Sales and orders changes exclude FX Americas Sales • Past due customer order reduction • Acquisitions +~4% • Organic growth +~7% • Latin America +~25%−aided by Brazilian distributor acquisition Orders • Recovery demand from Q3 • Strong growth in Latin America Europe Sales • Continuing macroeconomic weakness Orders • Emerging markets ~(-4%) • Growth in consumables orders Asia Sales • Microelectronics market weakness • Weakness in China and India • Signs of biotech investment Orders • Consumables orders increased in the low single-digit range • Systems orders growth strong reflecting energy infrastructure investment Asia Europe Americas $0 $100 $200 $300 FY 11 FY 12 FY 11 FY 12 FY 11 FY 12 $204 $234 16.0% $289 $268 4.8% $204 $230 16.0% Orders $0 $100 $200 $300 FY 11 FY 12 FY 11 FY 12 FY 11 FY 12 $211 $256 22.7% $288 $253 (-0.2%) $220 $213 (-0.5%) Sales
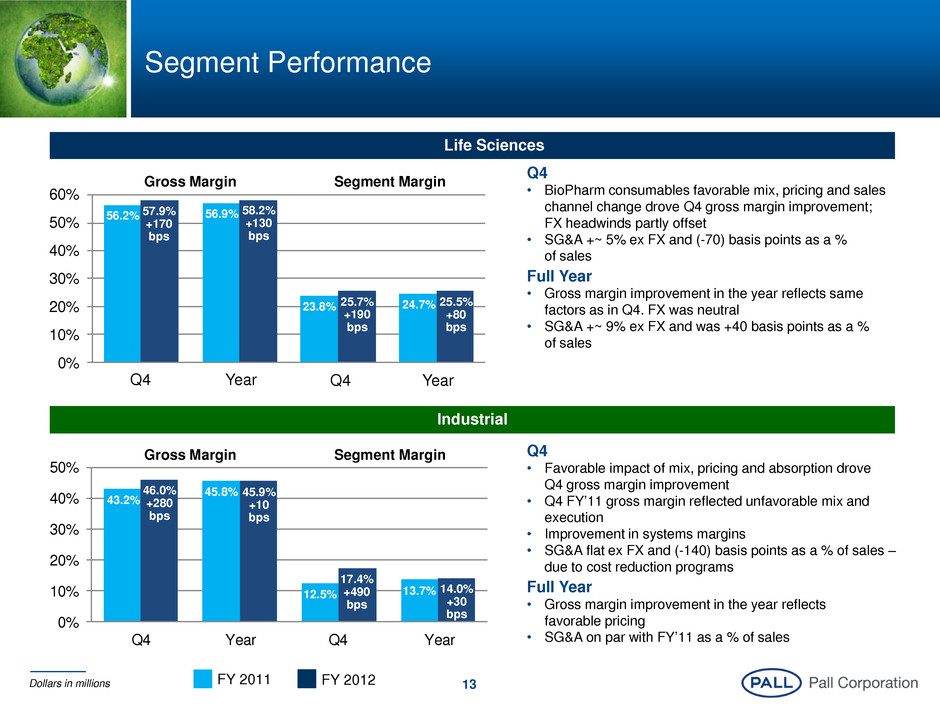
13 0% 10% 20% 30% 40% 50% Q4 Year Q4 Year 46.0% +280 bps 43.2% 45.9% +10 bps 45.8% 17.4% +490 bps 12.5% 14.0% +30 bps 13.7% Gross Margin Segment Margin Segment Performance Life Sciences Q4 • BioPharm consumables favorable mix, pricing and sales channel change drove Q4 gross margin improvement; FX headwinds partly offset • SG&A +~ 5% ex FX and (-70) basis points as a % of sales Full Year • Gross margin improvement in the year reflects same factors as in Q4. FX was neutral • SG&A +~ 9% ex FX and was +40 basis points as a % of sales Dollars in millions 0% 10% 20% 30 40% 50% 60% Q4 Year Q4 Year 57.9% +170 bps 56.2% 58.2% +130 bps 56.9% 25.7% +190 bps 23.8% 25.5% +80 bps 24.7% Gross Margin Segment Margin Q4 Year Q4 Year Industrial Q4 • Favorable impact of mix, pricing and absorption drove Q4 gross margin improvement • Q4 FY’11 gross margin reflected unfavorable mix and execution • Improvement in systems margins • SG&A flat ex FX and (-140) basis points as a % of sales – due to cost reduction programs Full Year • Gross margin improvement in the year reflects favorable pricing • SG&A on par with FY’11 as a % of sales FY 2011 FY 2012
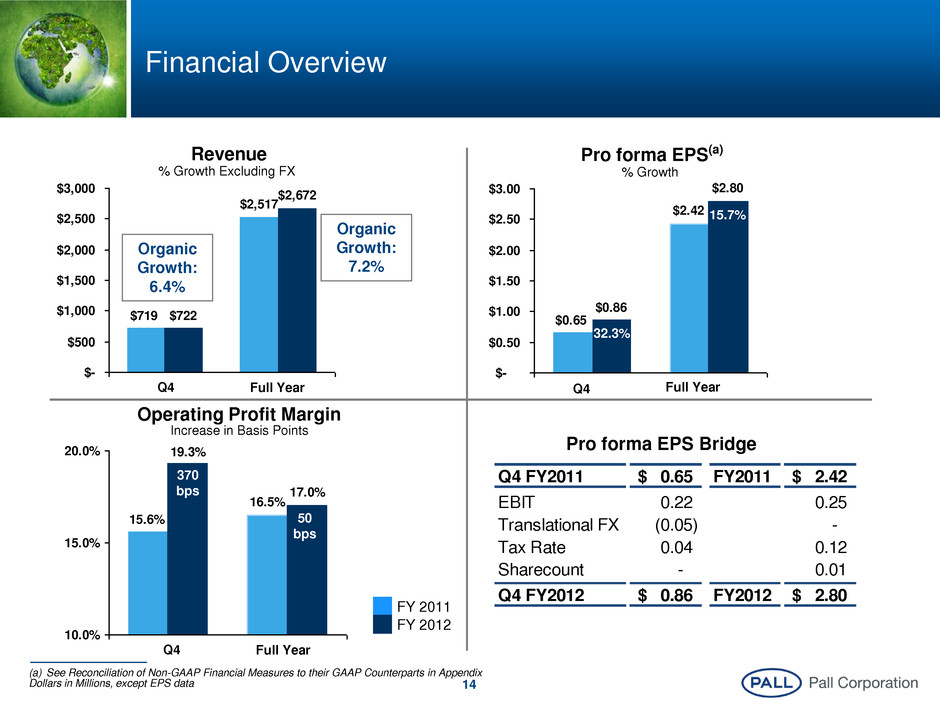
14 $2,517 $2,672 $719 $722 $- $500 $1,000 $1,500 $2,000 $2,500 $3,000 Revenue % Growth Excluding FX Q4 Full Year Financial Overview (a) See Reconciliation of Non-GAAP Financial Measures to their GAAP Counterparts in Appendix Dollars in Millions, except EPS data $2.42 $2.80 $0.65 $0.86 $- $0.50 $1.00 $1.50 $2.00 $2.50 $3.00 Pro forma EPS(a) % Growth Q4 Full Year 15.7% 32.3% 16.5% 17.0% 15.6% 19.3% 10.0% 15.0% 20.0% Operating Profit Margin Increase in Basis Points Q4 Full Year 370 bps 50 bps FY 2011 FY 2012 Q4 FY2011 0.65$ FY2011 2.42$ EBIT 0.22 0.25 Translational FX (0.05) - Tax Rate 0.04 0.12 Sharecount - 0.01 Q4 FY2012 0.86$ FY2012 2.80$ Pro forma EPS Bridge Organic Growth: 6.4% Organic Growth: 7.2%
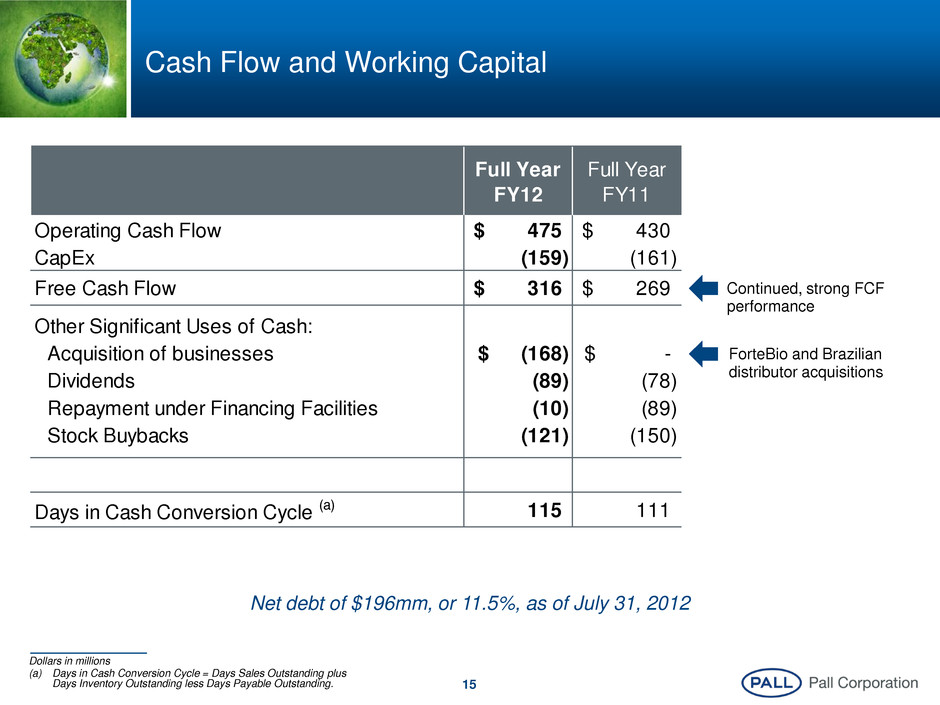
15 Cash Flow and Working Capital Full Year FY12 Full Year FY11 Operating Cash Flow 475$ 430$ CapEx (159) (161) Free Cash Flow 316$ 269$ Other Significant Uses of Cash: Acquisition of businesses (168)$ -$ Dividends (89) (78) Repayment under Financing Facilities (10) (89) Stock Buybacks (121) (150) Days in Cash Conversion Cycle (a) 115 111 Dollars in millions (a) Days in Cash Conversion Cycle = Days Sales Outstanding plus Days Inventory Outstanding less Days Payable Outstanding. Continued, strong FCF performance Net debt of $196mm, or 11.5%, as of July 31, 2012 ForteBio and Brazilian distributor acquisitions
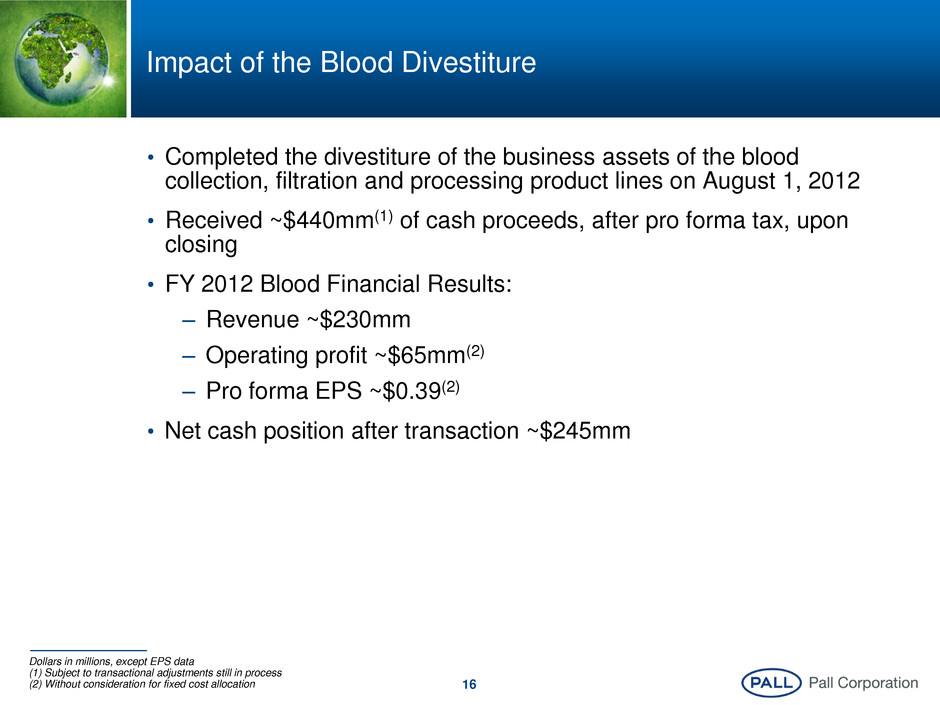
16 Impact of the Blood Divestiture • Completed the divestiture of the business assets of the blood collection, filtration and processing product lines on August 1, 2012 • Received ~$440mm(1) of cash proceeds, after pro forma tax, upon closing • FY 2012 Blood Financial Results: – Revenue ~$230mm – Operating profit ~$65mm(2) – Pro forma EPS ~$0.39(2) • Net cash position after transaction ~$245mm Dollars in millions, except EPS data (1) Subject to transactional adjustments still in process (2) Without consideration for fixed cost allocation
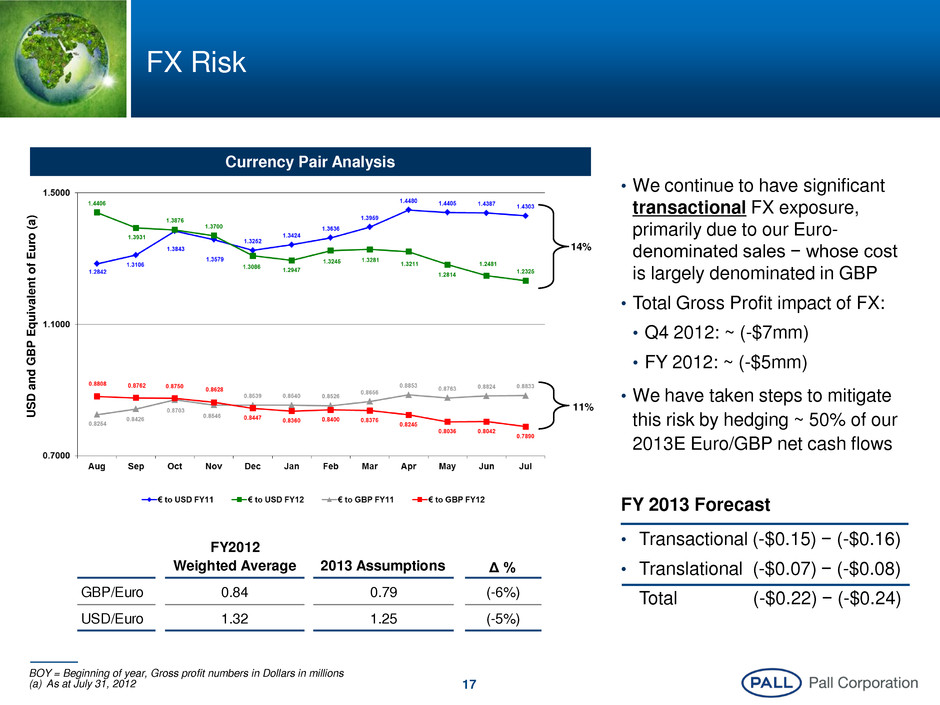
17 FX Risk BOY = Beginning of year, Gross profit numbers in Dollars in millions (a) As at July 31, 2012 U S D a n d GBP E q u iv a le n t o f E u ro ( a ) 14% 11% FY2012 Weighted Average 2013 Assumptions Δ % GBP/Euro 0.84 0.79 (-6%) USD/Euro 1.32 1.25 (-5%) Currency Pair Analysis • We continue to have significant transactional FX exposure, primarily due to our Euro- denominated sales − whose cost is largely denominated in GBP • Total Gross Profit impact of FX: • Q4 2012: ~ (-$7mm) • FY 2012: ~ (-$5mm) • We have taken steps to mitigate this risk by hedging ~ 50% of our 2013E Euro/GBP net cash flows FY 2013 Forecast • Transactional (-$0.15) − (-$0.16) • Translational (-$0.07) − (-$0.08) Total (-$0.22) − (-$0.24)
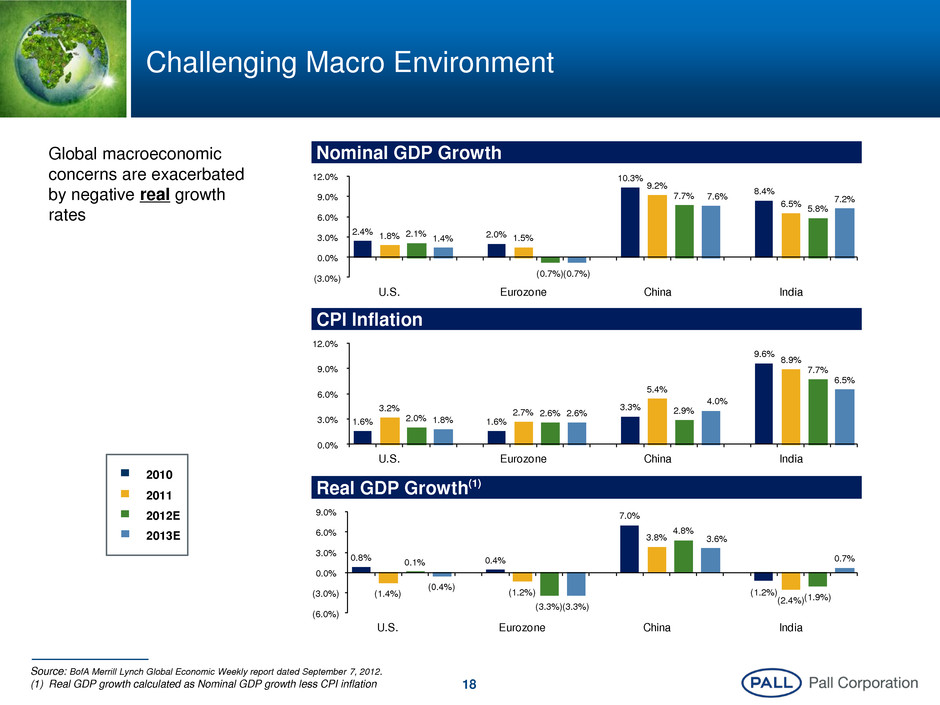
18 Challenging Macro Environment Global macroeconomic concerns are exacerbated by negative real growth rates Nominal GDP Growth CPI Inflation Real GDP Growth(1) 2010 2011 2012E 2013E Source: BofA Merrill Lynch Global Economic Weekly report dated September 7, 2012. (1) Real GDP growth calculated as Nominal GDP growth less CPI inflation 0.8% (1.4%) 0.1% (0.4%) 0.4% (1.2%) (3.3%)(3.3%) 7.0% 3.8% 4.8% 3.6% (1.2%) (2.4%)(1.9%) 0.7% (6.0%) (3.0%) 0.0% 3.0% 6.0% 9.0% U.S. Eurozone China India 1.6% 3.2% 2.0% 1.8% 1.6% 2.7% 2.6% 2.6% 3.3% 5.4% 2.9% 4.0% 9.6% 8.9% 7.7% 6.5% 0. 3.0% 6.0% 9.0% 12.0% U.S. Eurozone China India 2.4% 1.8% 2.1% 1.4% 2.0% 1.5% (0.7%)(0.7%) 10.3% 9.2% 7.7% 7.6% 8.4% 6.5% 5.8% 7.2% (3.0 ) 0.0% 3.0% 6.0% 9.0% 12.0% U.S. Eurozone China India
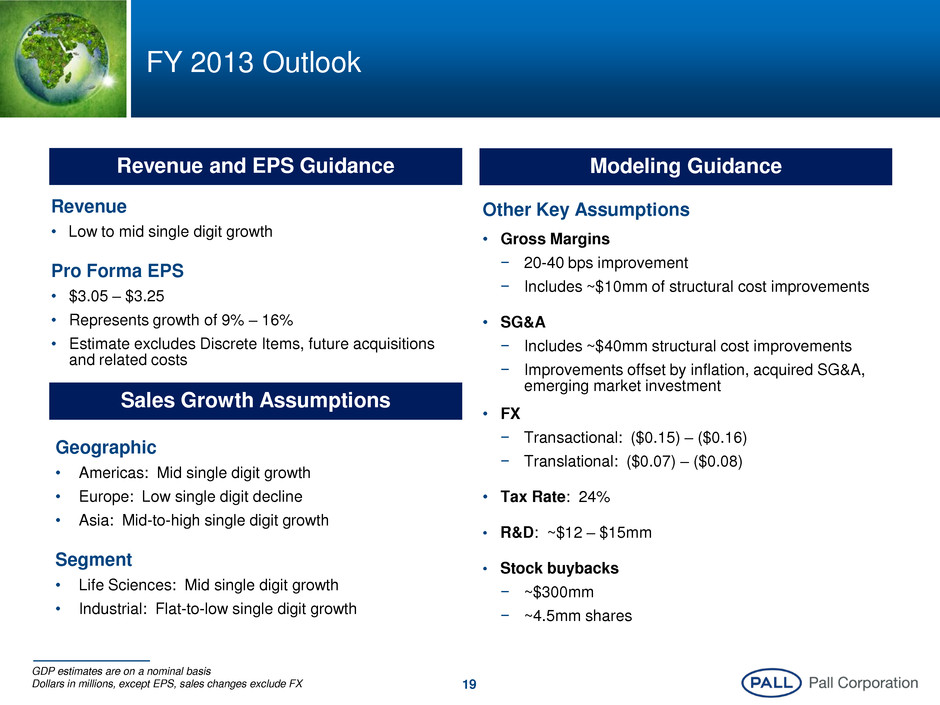
19 Revenue • Low to mid single digit growth Pro Forma EPS • $3.05 – $3.25 • Represents growth of 9% – 16% • Estimate excludes Discrete Items, future acquisitions and related costs FY 2013 Outlook Other Key Assumptions • Gross Margins − 20-40 bps improvement − Includes ~$10mm of structural cost improvements • SG&A − Includes ~$40mm structural cost improvements − Improvements offset by inflation, acquired SG&A, emerging market investment • FX − Transactional: ($0.15) – ($0.16) − Translational: ($0.07) – ($0.08) • Tax Rate: 24% • R&D: ~$12 – $15mm • Stock buybacks − ~$300mm − ~4.5mm shares GDP estimates are on a nominal basis Dollars in millions, except EPS, sales changes exclude FX Geographic • Americas: Mid single digit growth • Europe: Low single digit decline • Asia: Mid-to-high single digit growth Segment • Life Sciences: Mid single digit growth • Industrial: Flat-to-low single digit growth Revenue and EPS Guidance Modeling Guidance Sales Growth Assumptions
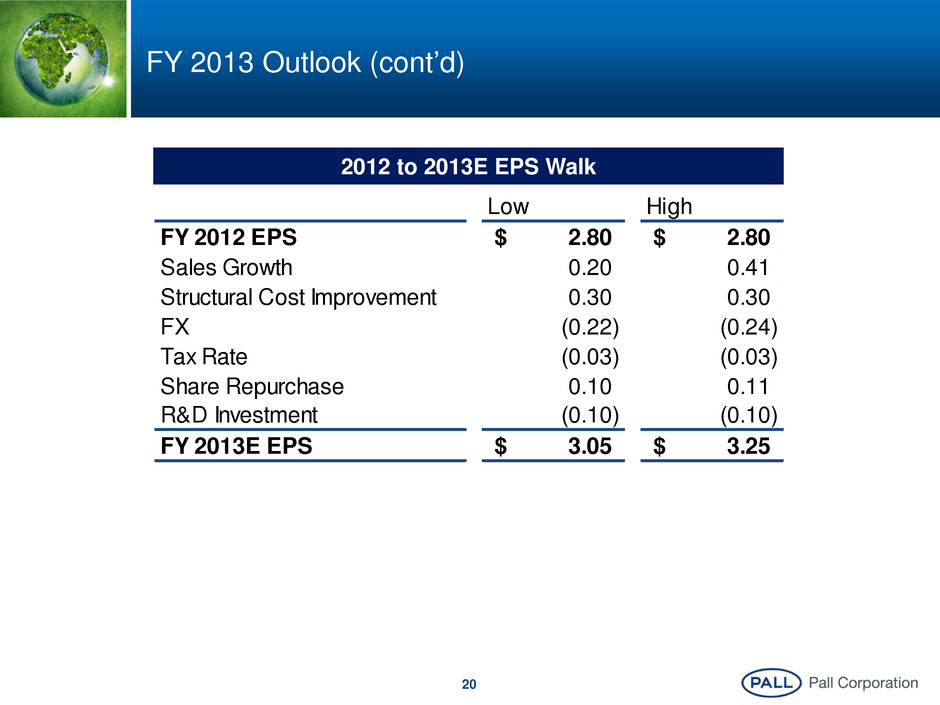
20 FY 2013 Outlook (cont’d) 2012 to 2013E EPS Walk Low High FY 2012 EPS 2.80$ 2.80$ Sales Growth 0.20 0.41 Structural Cost Improvement 0.30 0.30 FX (0.22) (0.24) Tax Rate (0.03) (0.03) Share Repurchase 0.10 0.11 R&D Investment (0.10) (0.10) FY 2013E EPS 3.05$ 3.25$

Better Lives. Better Planet.SM Appendix
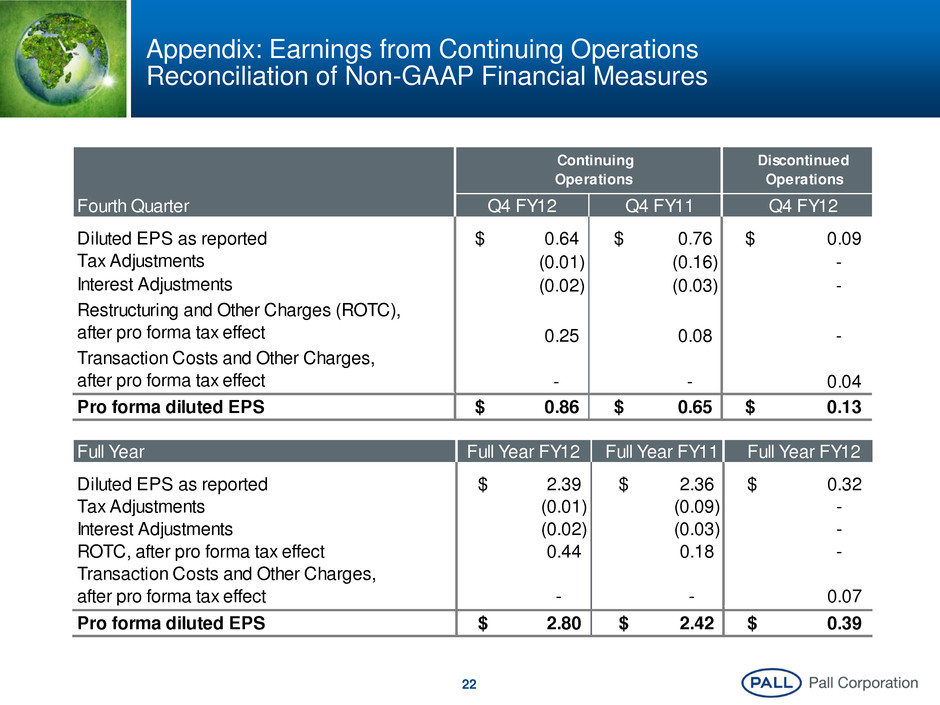
22 Appendix: Earnings from Continuing Operations Reconciliation of Non-GAAP Financial Measures Discontinued Operations Fourth Quarter Diluted EPS as reported 0.64$ 0.76$ 0.09$ Tax Adjustments (0.01) (0.16) - Interest Adjustments (0.02) (0.03) - Restructuring and Other Charges (ROTC), after pro forma tax effect 0.25 0.08 - Transaction Costs and Other Charges, after pro forma tax effect - - 0.04 Pro forma diluted EPS 0.86$ 0.65$ 0.13$ Q4 FY12 Q4 FY11 Q4 FY12 Continuing Operations Full Year Diluted EPS s reported 2.39$ 2.36$ .32$ Tax Adjustments (0.01) (0.09) - Interest Adjustm nts ( 02) ( 03) - ROTC, after pro forma tax effect 0.44 0.18 - Transaction Costs and Other Charges, after pro forma tax effect - - 0.07 Pro forma diluted EPS 2.80$ 2.42$ 0.39$ Full Year FY12 Full Year FY11 Full Year FY12
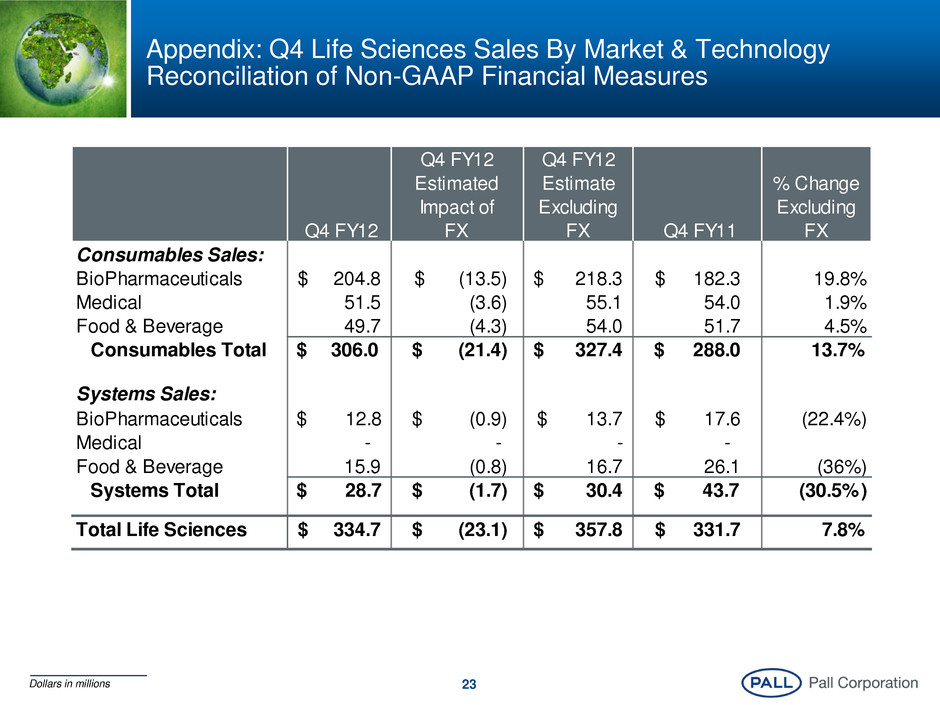
23 Appendix: Q4 Life Sciences Sales By Market & Technology Reconciliation of Non-GAAP Financial Measures Q4 FY12 Q4 FY12 Estimated Impact of FX Q4 FY12 Estimate Excluding FX Q4 FY11 % Change Excluding FX Consumables Sales: BioPharmaceuticals 204.8$ (13.5)$ 218.3$ 182.3$ 19.8% Medical 51.5 (3.6) 55.1 54.0 1.9% Food & Beverage 49.7 (4.3) 54.0 51.7 4.5% Consumables Total $ 306.0 (21.4)$ 327.4$ $ 288.0 13.7% Systems Sales: BioPharmaceuticals $ 12.8 (0.9)$ 13.7$ 17.6$ (22.4%) Medical - - - - Food & Beverage 15.9 (0.8) 16.7 26.1 (36%) Systems Total $ 28.7 (1.7)$ 30.4$ $ 43.7 (30.5%) Total Life Sciences 334.7$ (23.1)$ 357.8$ 331.7$ 7.8% Dollars in millions
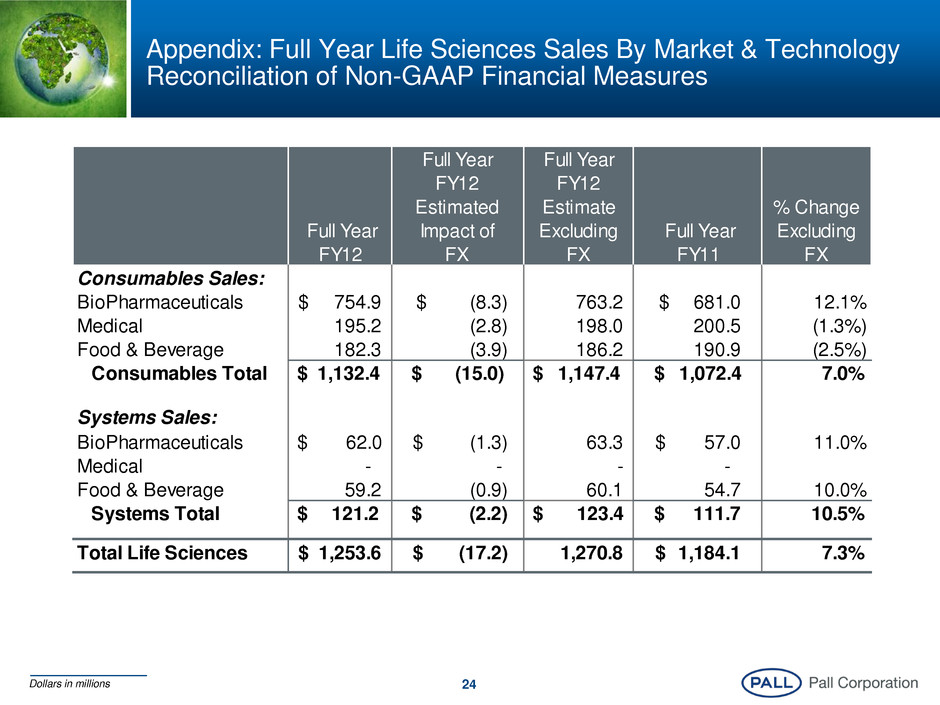
24 Appendix: Full Year Life Sciences Sales By Market & Technology Reconciliation of Non-GAAP Financial Measures Full Year FY12 Full Year FY12 Estimated Impact of FX Full Year FY12 Estimate Excluding FX Full Year FY11 % Change Excluding FX Consumables Sales: BioPharmaceuticals 754.9$ (8.3)$ 763.2 681.0$ 12.1% Medical 195.2 (2.8) 198.0 200.5 (1.3%) Food & Beverage 182.3 (3.9) 186.2 190.9 (2.5%) Consumables Total $ 1,132.4 $ (15.0) $ 1,147.4 $ 1,072.4 7.0% Systems Sales: BioPharmaceuticals $ 62.0 (1.3)$ 63.3 57.0$ 11.0% Medical - - - - Food & Beverage 59.2 (0.9) 60.1 54.7 10.0% Systems Total $ 121.2 $ (2.2) $ 123.4 $ 111.7 10.5% Total Life Sciences 1,253.6$ (17.2)$ 1,270.8 1,184.1$ 7.3% Dollars in millions
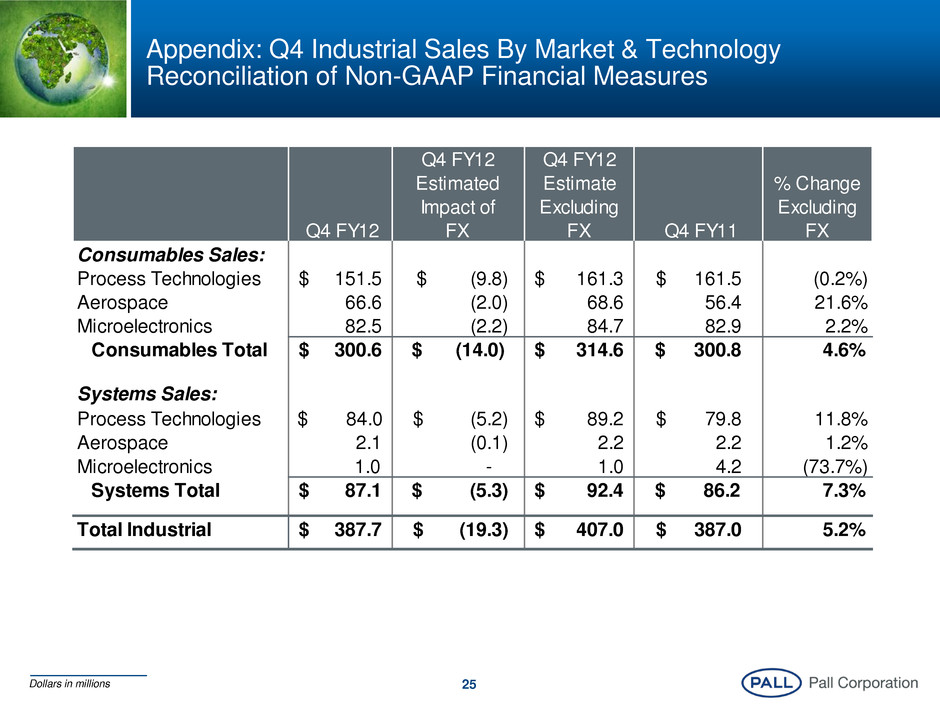
25 Appendix: Q4 Industrial Sales By Market & Technology Reconciliation of Non-GAAP Financial Measures Q4 FY12 Q4 FY12 Estimated Impact of FX Q4 FY12 Estimate Excluding FX Q4 FY11 % Change Excluding FX Consumables Sales: Process Technologies 151.5$ (9.8)$ 161.3$ 161.5$ (0.2%) Aerospace 66.6 (2.0) 68.6 56.4 21.6% Microelectronics 82.5 (2.2) 84.7 82.9 2.2% Consumables Total 300.6$ $ (14.0) 314.6$ $ 300.8 4.6% Systems Sales: Process Technologies $ 84.0 (5.2)$ 89.2$ 79.8$ 11.8% Aerospac 2.1 (0.1) 2.2 2.2 1.2% Microelectronics 1.0 - 1.0 4.2 (73.7%) Systems Total 87.1$ $ (5.3) 92.4$ $ 86.2 7.3% Total Industrial 387.7$ (19.3)$ 407.0$ 387.0$ 5.2% Dollars in millions
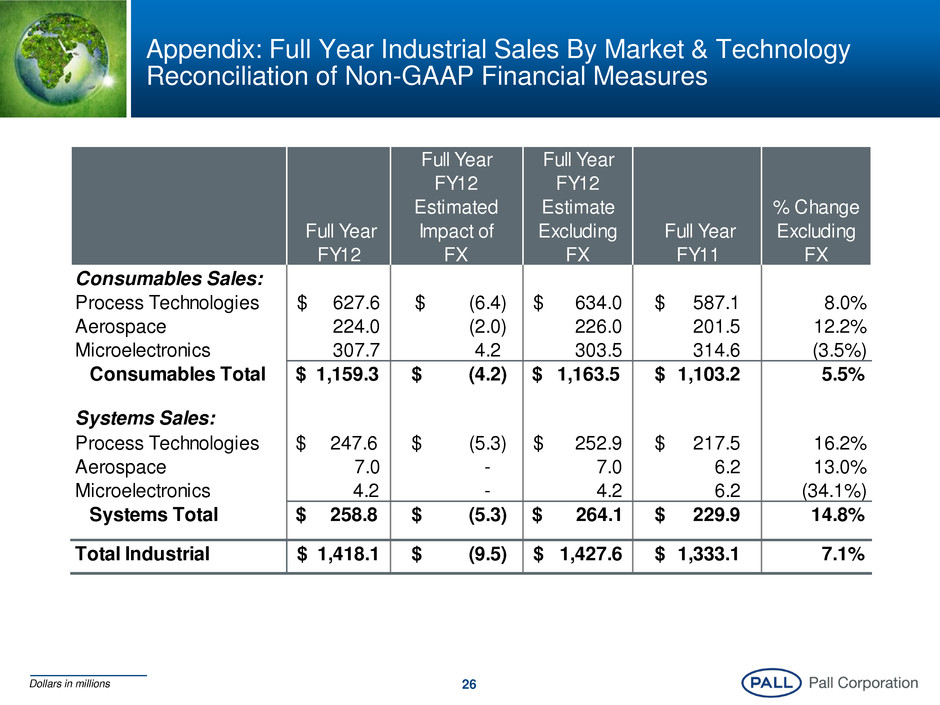
26 Appendix: Full Year Industrial Sales By Market & Technology Reconciliation of Non-GAAP Financial Measures Full Year FY12 Full Year FY12 Estimated Impact of FX Full Year FY12 Estimate Excluding FX Full Year FY11 % Change Excluding FX Consumables Sales: Process Technologies 627.6$ (6.4)$ 634.0$ 587.1$ 8.0% Aerospace 224.0 (2.0) 226.0 201.5 12.2% Microelectronics 307.7 4.2 303.5 314.6 (3.5%) Consumables Total $ 1,159.3 (4.2)$ $ 1,163.5 1,103.2$ 5.5% Systems Sales: Process Technologies $ 247.6 (5.3)$ 252.9$ 217.5$ 16.2% Aerospac 7.0 - 7.0 6.2 13.0% Microelectronics 4.2 - 4.2 6.2 (34.1%) Systems Total $ 258.8 (5.3)$ $ 264.1 229.9$ 14.8% Total Industrial 1,418.1$ (9.5)$ 1,427.6$ 1,333.1$ 7.1% Dollars in millions
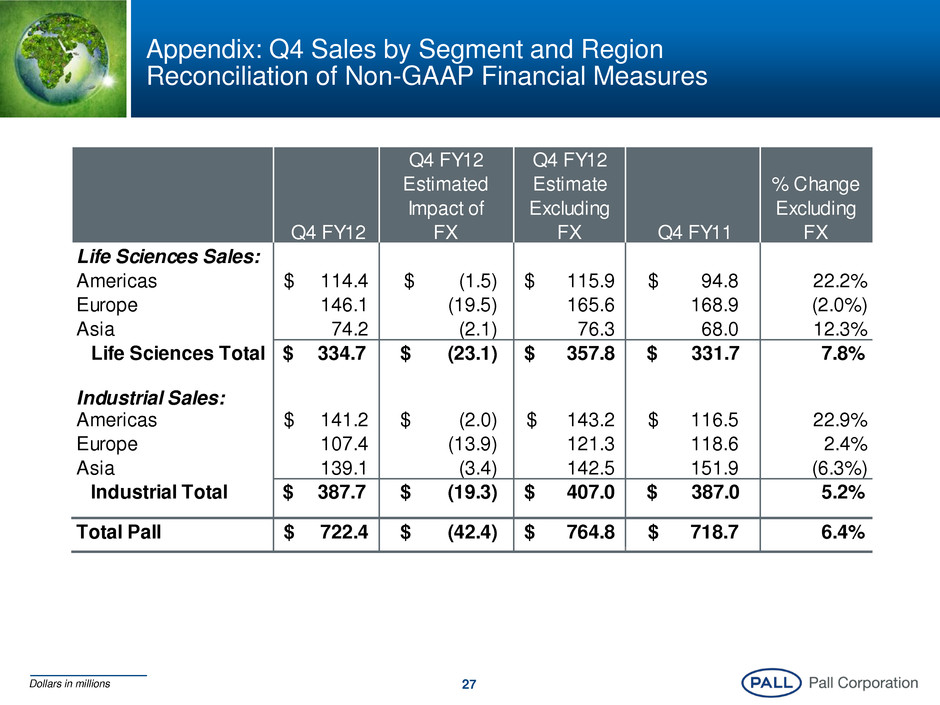
27 Appendix: Q4 Sales by Segment and Region Reconciliation of Non-GAAP Financial Measures Q4 FY12 Q4 FY12 Estimated Impact of FX Q4 FY12 Estimate Excluding FX Q4 FY11 % Change Excluding FX Life Sciences Sales: Americas 114.4$ (1.5)$ 115.9$ 94.8$ 22.2% Europe 146.1 (19.5) 165.6 168.9 (2.0%) Asia 74.2 (2.1) 76.3 68.0 12.3% Life Sciences Total $ 334.7 (23.1)$ 357.8$ $ 331.7 7.8% Industrial Sales: Americas 141.2$ (2.0)$ 143.2$ 116.5$ 22.9% Europe 107.4 (13.9) 121.3 118.6 2.4% Asia 139.1 (3.4) 142.5 151.9 (6.3%) Industrial Total $ 387.7 (19.3)$ 407.0$ $ 387.0 5.2% Total Pall 722.4$ (42.4)$ 764.8$ 718.7$ 6.4% Dollars in millions
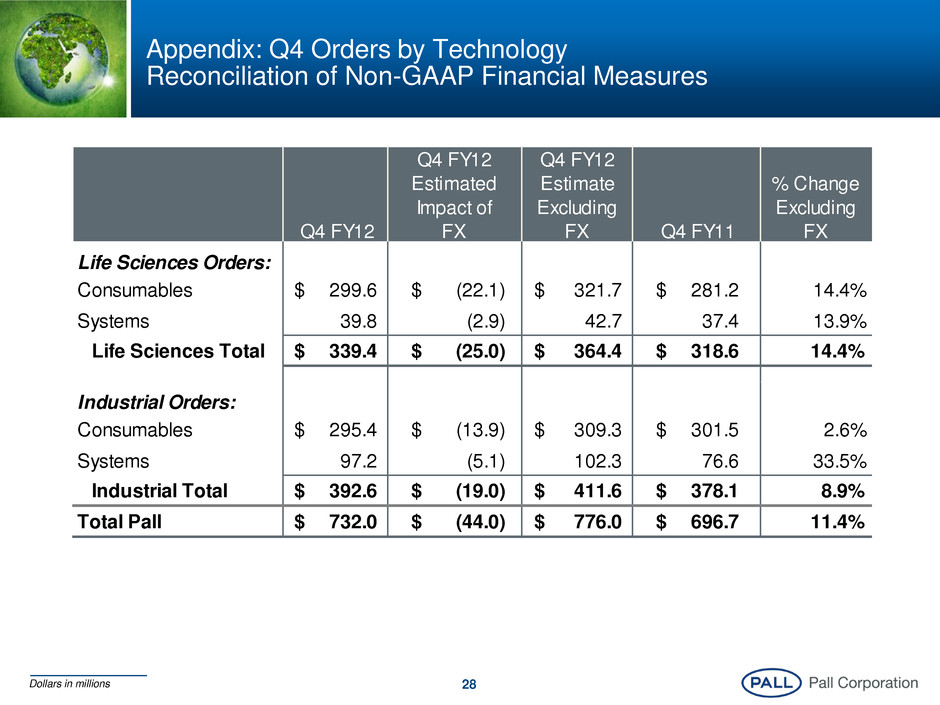
28 Appendix: Q4 Orders by Technology Reconciliation of Non-GAAP Financial Measures Dollars in millions Q4 FY12 Q4 FY12 Estimated Impact of FX Q4 FY12 Estimate Excluding FX Q4 FY11 % Change Excluding FX Life Sciences Orders: Consumables 299.6$ (22.1)$ 321.7$ 281.2$ 14.4% Systems 39.8 (2.9) 42.7 37.4 13.9% Life Sciences Total 339.4$ (25.0)$ 364.4$ 318.6$ 14.4% Industrial Orders: C nsumables 295.4$ (13.9)$ 309.3$ 301.5$ 2.6% Systems 97.2 (5.1) 102.3 76.6 33.5% Industrial Total 392.6$ (19.0)$ 411.6$ 378.1$ 8.9% Total Pall 732.0$ (44.0)$ 776.0$ 696.7$ 11.4%
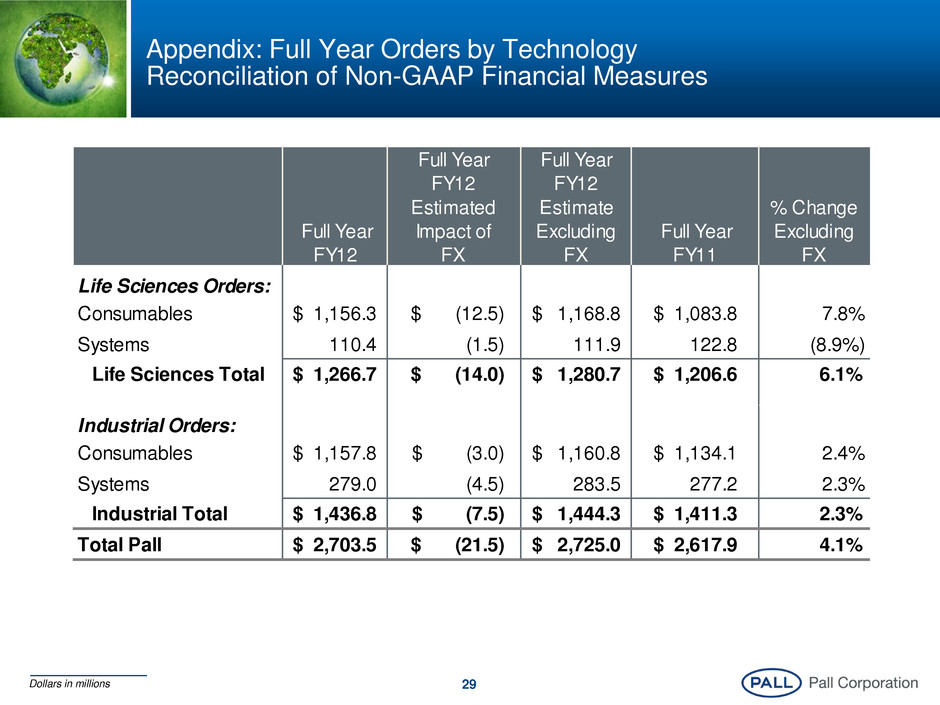
29 Appendix: Full Year Orders by Technology Reconciliation of Non-GAAP Financial Measures Dollars in millions Full Year FY12 Full Year FY12 Estimated Impact of FX Full Year FY12 Estimate Excluding FX Full Year FY11 % Change Excluding FX Life Sciences Orders: Consumables 1,156.3$ (12.5)$ 1,168.8$ 1,083.8$ 7.8% Systems 110.4 (1.5) 111.9 122.8 (8.9%) Life Sciences Total 1,266.7$ (14.0)$ 1,280.7$ 1,206.6$ 6.1% Industrial Orders: C nsumables 1,157.8$ (3.0)$ 1,160.8$ 1,134.1$ 2.4% Systems 279.0 (4.5) 283.5 277.2 2.3% Industrial Total 1,436.8$ (7.5)$ 1,444.3$ 1,411.3$ 2.3% Total Pall 2,703.5$ (21.5)$ 2,725.0$ 2,617.9$ 4.1%
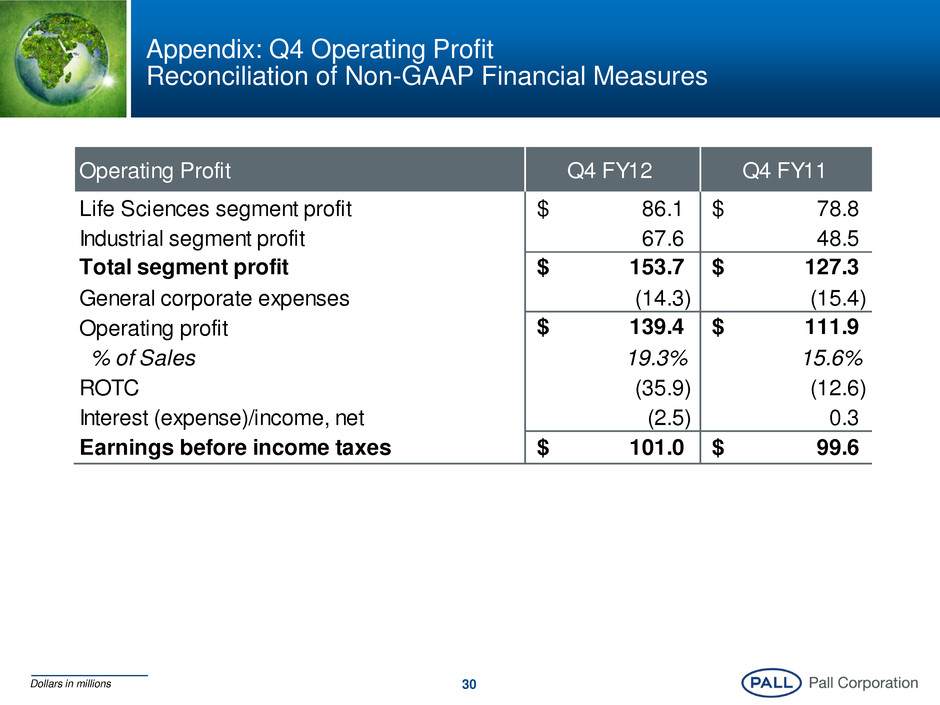
30 Appendix: Q4 Operating Profit Reconciliation of Non-GAAP Financial Measures Operating Profit Q4 FY12 Q4 FY11 Life Sciences segment profit 86.1$ 78.8$ Industrial segment profit 67.6 48.5 Total segment profit 153.7$ 127.3$ General corporate expenses (14.3) (15.4) Ope ating profit 139.4$ 111.9$ % of Sales 19.3% 15.6% ROTC (35.9) (12.6) Interest (expense)/income, net (2.5) 0.3 Earnings before income taxes 101.0$ 99.6$ Dollars in millions

31 Appendix: Full Year Operating Profit Reconciliation of Non-GAAP Financial Measures Operating Profit Full Year FY12 Full Year FY11 Life Sciences segment profit 319.3$ 292.5$ Industrial segment profit 198.8 182.7 Total segment profit 518.1$ 475.2$ General corporate expenses (64.1) (61.1) Operating profit 454.0$ 414.1$ % of Sales 17.0% 16.5% ROTC (66.9) (26.5) Interest (expense)/income, net (20.2) (18.9) Earnings before income taxes 366.9$ 368.7$ Dollars in millions

Better Lives. Better Planet.SM www.pall.com/green


