UNITED STATES
SECURITIES AND EXCHANGE COMMISSION
Washington, D.C. 20549
FORM N-CSR
CERTIFIED SHAREHOLDER REPORT OF REGISTERED
MANAGEMENT INVESTMENT COMPANIES
Investment Company Act file number811- 4173
John Hancock Investors Trust
(Exact name of registrant as specified in charter)
200 Berkeley Street, Boston, Massachusetts 02116
(Address of principal executive offices) (Zip code)
Salvatore Schiavone
Treasurer
200 Berkeley Street
Boston, Massachusetts 02116
(Name and address of agent for service)
Registrant's telephone number, including area code:617-663-4497
| Date of fiscal year end: | October 31 |
| | |
| Date of reporting period: | April 30, 2019 |
ITEM 1. REPORTS TO STOCKHOLDERS.
John Hancock
Investors Trust
Ticker: JHI
Semiannual report 4/30/19
Beginning on January 1, 2021, as permitted by regulations adopted by the Securities and Exchange Commission, paper copies of the fund's shareholder reports such as this one will no longer be sent by mail, unless you specifically request paper copies of the reports from the transfer agent or from your financial intermediary. Instead, the reports will be made available on our website, and you will be notified by mail each time a report is posted and be provided with a website link to access the report.
If you have already elected to receive shareholder reports electronically, you will not be affected by this change and you do not need to take any action. You may elect to receive shareholder reports and other communications electronically by calling the transfer agent, Computershare, at 800-852-0218, by going to "Communication Preferences" at computershare.com/investor, or by contacting your financial intermediary.
You may elect to receive all reports in paper, free of charge, at any time. You can inform the transfer agent or your financial intermediary that you wish to continue receiving paper copies of your shareholder reports by following the instructions listed above. Your election to receive reports in paper will apply to all funds held with John Hancock Investment Management or your financial intermediary.

A message to shareholders
Dear shareholder,
A solid and stable economy enabled the U.S. Federal Reserve (Fed) to continue normalizing monetary policy for most of 2018; however, concerns about the strength of the broader global economy and the durability of the now 10-year-old bull market led investors to dial back riskexposures. Those concerns may ultimately have been shared by the Fed, which has so far in 2019 shifted to a neutral stance on interest rates after three years of hikes. The markets responded favorably, with most bond indexes registering gains in the first four months of 2019 before hitting a patch of turbulence after period end as trade turmoil between the United States and China flared again.
As always, your best resource in unpredictable markets is your financial advisor, who can help position your portfolio so that it's sufficiently diversified to meet your long-term objectives and to withstand the inevitable turbulence along the way.
On behalf of everyone at John Hancock Investment Management, I'd like to take this opportunity to welcome new shareholders and thank existing shareholders for the continued trust you've placed in us.
Sincerely,
Andrew G. Arnott
President and CEO,
John Hancock Investment Management
Head of Wealth and Asset Management,
United States and Europe
This commentary reflects the CEO's views, which are subject to change at any time. Investing involves risks, including the potential loss of principal. Diversification does not guarantee a profit or eliminate the risk of a loss. It is not possible to invest directly in an index. For more up-to-date information, please visit our website at jhinvestments.com.
John Hancock
Investors Trust
Table of contents
| | | | |
| 2 | | Your fund at a glance |
| 3 | | Portfolio Summary |
| 5 | | Fund's investments |
| 18 | | Financial statements |
| 22 | | Financial highlights |
| 24 | | Notes to financial statements |
| 34 | | Additional information |
| 35 | | Shareholder meeting |
| 36 | | More information |
SEMIANNUAL REPORT | JOHN HANCOCK INVESTORS TRUST 1
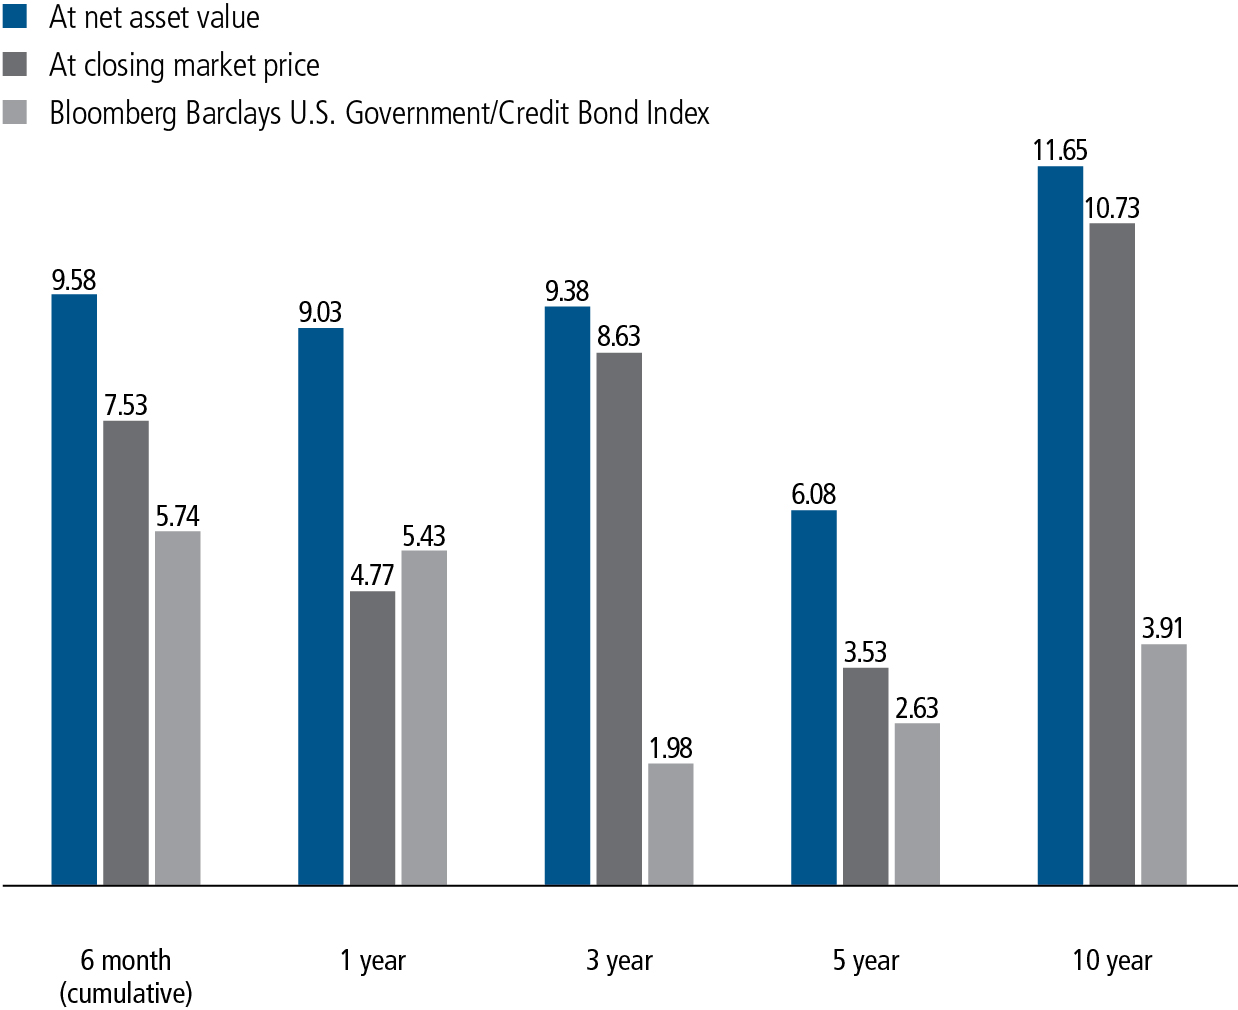
INVESTMENT OBJECTIVE
The fund seeks to generate income for distribution to its shareholders, with capital appreciation as a secondary objective.
AVERAGE ANNUAL TOTAL RETURNS AS OF 4/30/19 (%)
The Bloomberg Barclays U.S. Government/Credit Bond Index is an unmanaged index of U.S. government bonds, U.S. corporate bonds, and Yankee bonds.
It is not possible to invest directly in an index. Index figures do not reflect expenses and sales charges, which would result in lower returns.
The performance data contained within this material represents past performance, which does not guarantee future results.
Investment returns and principal value will fluctuate and a shareholder may sustain losses. Further, the fund's performance at net asset value (NAV) is different from the fund's performance at closing market price because the closing market price is subject to the dynamics of secondary market trading. Market risk may be augmented when shares are purchased at a premium to NAV or sold at a discount to NAV. Current month-end performance may be higher or lower than the performance cited. The fund's most recent performance can be found at jhinvestments.com or by calling 800-852-0218.
SEMIANNUAL REPORT | JOHN HANCOCK INVESTORS TRUST 2
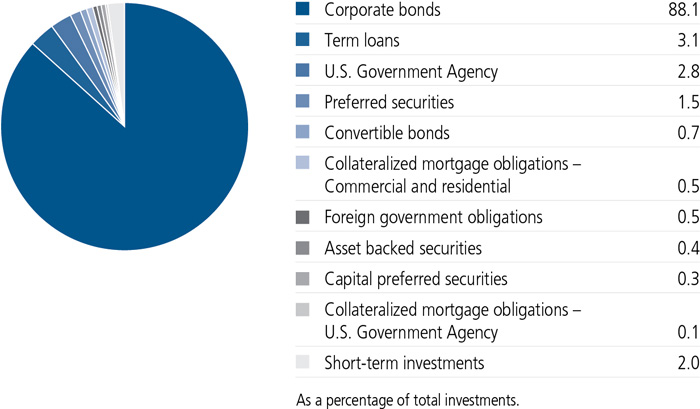
PORTFOLIO COMPOSITION AS OF 4/30/19 (%)
A note about risks
As is the case with all exchange-listed, closed-end funds, shares of this fund may trade at a discount or a premium to the fund's net asset value (NAV). An investment in the fund is subject to investment and market risks, including the possible loss of the entire principal invested. There is no guarantee prior distribution levels will be maintained, and distributions may include a substantial return of capital. Fixed-income investments are subject to interest-rate and credit risk; their value will normally decline as interest rates rise or if a creditor, grantor, or counterparty is unable or unwilling to make principal, interest, or settlement payments. Investments in higher-yielding, lower-rated securities are subject to a higher risk of default. An issuer of securities held by the fund may default, have its credit rating downgraded, or otherwise perform poorly, which may affect fund performance. Liquidity—the extent to which a security may be sold or a derivative position closed without negatively affecting its market value—may be impaired by reduced trading volume, heightened volatility, rising interest rates, and other market conditions. The fund's use of leverage creates additional risks, including greater volatility of the fund's NAV, market price, and returns. There is no assurance that the fund's leverage strategy will be successful. Derivatives transactions, such as hedging and other strategic transactions, may increase a fund's volatility and could produce disproportionate losses, potentially more than the fund's principal investment. Cybersecurity incidents may allow an unauthorized party to gain access to fund assets, customer data, or proprietary information, or cause a fund or its service providers to suffer data corruption or lose operational functionality. Similar incidents affecting issuers of fund securities may negatively impact performance.
SEMIANNUAL REPORT | JOHN HANCOCK INVESTORS TRUST 3
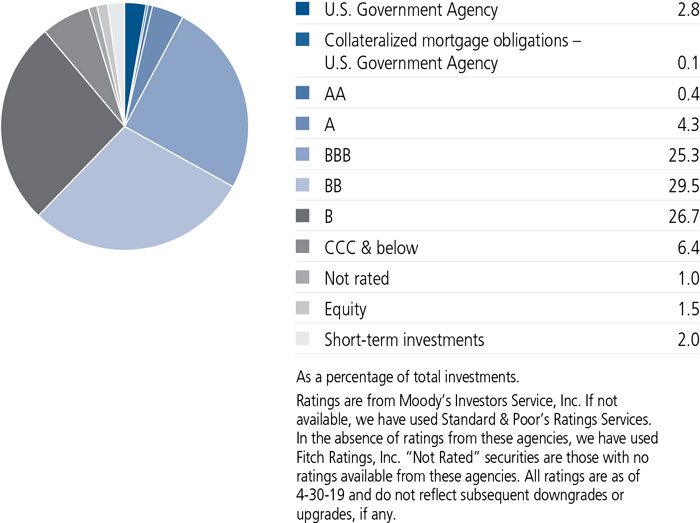
QUALITY COMPOSITION AS OF 4/30/19 (%)
COUNTRY COMPOSITION AS OF 4/30/19 (%)
| | |
| United States | 65.1 |
| Mexico | 5.2 |
| Netherlands | 3.2 |
| United Kingdom | 3.2 |
| France | 3.0 |
| Brazil | 2.9 |
| Luxembourg | 2.4 |
| Canada | 2.2 |
| Chile | 2.0 |
| Cayman Islands | 1.4 |
| Other countries | 9.4 |
| TOTAL | 100.0 |
| As a percentage of total investments. | |
SEMIANNUAL REPORT | JOHN HANCOCK INVESTORS TRUST 4
AS OF 4-30-19 (unaudited)
| | Rate (%) | Maturity date | | Par value^ | Value |
| U.S. Government and Agency obligations 4.2% (2.8% of Total investments) | | $6,574,565 |
| (Cost $6,591,818) | | | | | |
| U.S. Government Agency 4.2% | | | | | 6,574,565 |
| Federal National Mortgage Association | | | | | |
| 30 Yr Pass Thru | 4.000 | 12-01-40 | | 1,730,196 | 1,807,733 |
| 30 Yr Pass Thru | 4.000 | 09-01-41 | | 1,513,364 | 1,576,927 |
| 30 Yr Pass Thru | 4.000 | 10-01-41 | | 875,902 | 914,881 |
| 30 Yr Pass Thru | 4.000 | 01-01-42 | | 441,417 | 461,060 |
| 30 Yr Pass Thru | 4.500 | 10-01-40 | | 1,126,768 | 1,199,975 |
| 30 Yr Pass Thru | 5.000 | 04-01-41 | | 241,312 | 261,239 |
| 30 Yr Pass Thru | 5.500 | 08-01-40 | | 68,289 | 74,276 |
|
| 30 Yr Pass Thru | 6.500 | 01-01-39 | | 244,161 | 278,474 |
| Foreign government obligations 0.8% (0.5% of Total investments) | | $1,261,549 |
| (Cost $1,320,000) | | | | | |
| Oman 0.8% | | | | | 1,261,549 |
|
Oman Sovereign Sukuk SAOC
Bond (A) | 4.397 | 06-01-24 | | 1,320,000 | 1,261,549 |
|
| Corporate bonds 135.5% (88.1% of Total investments) | | $211,557,428 |
| (Cost $210,378,011) | | | | | |
| Communication services 28.9% | | | | 45,079,226 |
| Diversified telecommunication services 4.4% | | | |
| GCI LLC (B)(C) | 6.875 | 04-15-25 | | 935,000 | 979,413 |
| Intelsat Connect Finance SA (A) | 9.500 | 02-15-23 | | 480,000 | 445,200 |
| Intelsat Jackson Holdings SA (A) | 8.500 | 10-15-24 | | 735,000 | 725,353 |
| Level 3 Financing, Inc. (B)(C) | 5.250 | 03-15-26 | | 1,365,000 | 1,385,908 |
| Level 3 Financing, Inc. (B)(C) | 5.625 | 02-01-23 | | 825,000 | 833,250 |
| Telecom Italia Capital SA | 6.000 | 09-30-34 | | 1,560,000 | 1,443,000 |
| Turk Telekomunikasyon AS (A)(B)(C) | 4.875 | 06-19-24 | | 1,220,000 | 1,092,756 |
| Entertainment 4.5% | | | |
| AMC Entertainment Holdings, Inc. (B)(C) | 6.125 | 05-15-27 | | 1,000,000 | 931,250 |
| Lions Gate Capital Holdings LLC (A)(B)(C) | 5.875 | 11-01-24 | | 1,095,000 | 1,116,900 |
| Lions Gate Capital Holdings LLC (A) | 6.375 | 02-01-24 | | 1,200,000 | 1,255,500 |
| Netflix, Inc. (B)(C) | 4.875 | 04-15-28 | | 1,245,000 | 1,234,106 |
| Netflix, Inc. (B)(C) | 5.875 | 11-15-28 | | 1,220,000 | 1,287,100 |
| Viacom, Inc. (C) | 5.850 | 09-01-43 | | 1,125,000 | 1,229,999 |
| Interactive media and services 1.0% | | | |
| Uber Technologies, Inc. (A) | 8.000 | 11-01-26 | | 1,350,000 | 1,441,125 |
| Media 12.5% | | | |
| Altice Financing SA (A)(B)(C) | 7.500 | 05-15-26 | | 1,000,000 | 1,015,000 |
| Altice France SA (A)(B)(C) | 6.250 | 05-15-24 | | 1,675,000 | 1,716,875 |
| SEE NOTES TO FINANCIAL STATEMENTS | SEMIANNUAL REPORT | JOHN HANCOCK INVESTORS TRUST | 5 |
| | Rate (%) | Maturity date | | Par value^ | Value |
| Communication services (continued) | | | | |
| Media (continued) | | | |
| Altice Luxembourg SA (A)(B)(C) | 7.750 | 05-15-22 | | 755,000 | $769,156 |
| Cablevision Systems Corp. (B)(C) | 8.000 | 04-15-20 | | 1,000,000 | 1,041,780 |
| CCO Holdings LLC (A)(B)(C) | 5.000 | 02-01-28 | | 1,630,000 | 1,627,963 |
| CCO Holdings LLC | 5.125 | 02-15-23 | | 950,000 | 964,250 |
| CCO Holdings LLC (A)(B)(C) | 5.125 | 05-01-27 | | 1,245,000 | 1,263,675 |
| Cengage Learning, Inc. (A)(B)(C) | 9.500 | 06-15-24 | | 1,350,000 | 1,255,500 |
| CSC Holdings LLC (A) | 5.500 | 04-15-27 | | 1,245,000 | 1,282,512 |
| CSC Holdings LLC (A)(B)(C) | 7.500 | 04-01-28 | | 855,000 | 933,019 |
| Grupo Televisa SAB (B)(C) | 4.625 | 01-30-26 | | 725,000 | 742,788 |
| Grupo Televisa SAB | 8.490 | 05-11-37 | MXN | 26,200,000 | 1,126,716 |
| McGraw-Hill Global Education Holdings LLC (A)(B)(C) | 7.875 | 05-15-24 | | 1,100,000 | 940,500 |
| MDC Partners, Inc. (A)(B)(C) | 6.500 | 05-01-24 | | 1,955,000 | 1,651,975 |
| Myriad International Holdings BV (A)(B)(C) | 4.850 | 07-06-27 | | 1,445,000 | 1,502,442 |
| Myriad International Holdings BV (A) | 5.500 | 07-21-25 | | 915,000 | 990,767 |
| Time Warner Cable LLC | 4.500 | 09-15-42 | | 815,000 | 722,008 |
| Wireless telecommunication services 6.5% | | | |
| America Movil SAB de CV | 6.000 | 06-09-19 | MXN | 37,470,000 | 1,966,657 |
| America Movil SAB de CV | 6.450 | 12-05-22 | MXN | 10,370,000 | 501,462 |
| Colombia Telecomunicaciones SA ESP (A) | 5.375 | 09-27-22 | | 1,000,000 | 1,015,010 |
| Comunicaciones Celulares SA (A) | 6.875 | 02-06-24 | | 1,775,000 | 1,837,125 |
| Sprint Communications, Inc. (B)(C) | 6.000 | 11-15-22 | | 935,000 | 940,844 |
| Sprint Corp. | 7.125 | 06-15-24 | | 750,000 | 751,641 |
| T-Mobile USA, Inc. (B)(C) | 4.750 | 02-01-28 | | 640,000 | 645,600 |
| T-Mobile USA, Inc. (C) | 6.500 | 01-15-26 | | 1,125,000 | 1,203,413 |
| United States Cellular Corp. | 6.700 | 12-15-33 | | 1,195,000 | 1,269,688 |
| Consumer discretionary 5.3% | | | | 8,321,459 |
| Auto components 0.1% | | | |
| Lear Corp. (C) | 5.250 | 01-15-25 | | 210,000 | 217,704 |
| Automobiles 0.6% | | | |
| General Motors Financial Company, Inc. (6.500% to 9-30-28, then 3 month LIBOR + 3.436%) (B)(C)(D) | 6.500 | 09-30-28 | | 1,000,000 | 967,500 |
| Hotels, restaurants and leisure 2.0% | | | |
| Eldorado Resorts, Inc. (B)(C) | 6.000 | 09-15-26 | | 590,000 | 612,125 |
| GLP Capital LP | 5.375 | 04-15-26 | | 815,000 | 860,689 |
| MGM Resorts International | 6.000 | 03-15-23 | | 395,000 | 421,663 |
| Waterford Gaming LLC (A)(E)(F) | 8.625 | 09-15-14 | | 377,791 | 0 |
| Wyndham Destinations, Inc. (B)(C) | 6.350 | 10-01-25 | | 1,190,000 | 1,264,375 |
| Household durables 0.5% | | | |
| William Lyon Homes, Inc. | 6.000 | 09-01-23 | | 720,000 | 712,800 |
| 6 | JOHN HANCOCK INVESTORS TRUST | SEMIANNUAL REPORT | SEE NOTES TO FINANCIAL STATEMENTS |
| | Rate (%) | Maturity date | | Par value^ | Value |
| Consumer discretionary (continued) | | | | |
| Internet and direct marketing retail 1.3% | | | |
| Expedia Group, Inc. (B)(C) | 5.000 | 02-15-26 | | 1,000,000 | $1,067,353 |
| QVC, Inc. | 5.950 | 03-15-43 | | 1,000,000 | 926,250 |
| Specialty retail 0.8% | | | |
| Group 1 Automotive, Inc. (A)(C) | 5.250 | 12-15-23 | | 1,240,000 | 1,271,000 |
| Consumer staples 2.1% | | | | 3,280,774 |
| Food and staples retailing 0.3% | | | |
| Rite Aid Corp. (A)(B)(C) | 6.125 | 04-01-23 | | 550,000 | 468,531 |
| Food products 1.0% | | | |
| Darling Ingredients, Inc. (A) | 5.250 | 04-15-27 | | 550,000 | 559,625 |
| Post Holdings, Inc. (A) | 5.500 | 03-01-25 | | 540,000 | 552,825 |
| Post Holdings, Inc. (A)(B)(C) | 5.625 | 01-15-28 | | 510,000 | 516,023 |
| Personal products 0.3% | | | |
| Revlon Consumer Products Corp. | 6.250 | 08-01-24 | | 740,000 | 436,600 |
| Tobacco 0.5% | | | |
| Reynolds American, Inc. (C) | 6.875 | 05-01-20 | | 720,000 | 747,170 |
| Energy 24.2% | | | | 37,736,241 |
| Energy equipment and services 2.0% | | | |
| Archrock Partners LP | 6.000 | 10-01-22 | | 1,185,000 | 1,193,888 |
| CSI Compressco LP | 7.250 | 08-15-22 | | 1,635,000 | 1,451,063 |
| CSI Compressco LP (A) | 7.500 | 04-01-25 | | 500,000 | 485,625 |
| Oil, gas and consumable fuels 22.2% | | | |
| Andeavor Logistics LP | 5.250 | 01-15-25 | | 870,000 | 913,475 |
| Blue Racer Midstream LLC (A) | 6.125 | 11-15-22 | | 1,230,000 | 1,243,838 |
| Cheniere Corpus Christi Holdings LLC | 5.875 | 03-31-25 | | 995,000 | 1,072,113 |
| Cheniere Corpus Christi Holdings LLC | 7.000 | 06-30-24 | | 800,000 | 897,000 |
| Chesapeake Energy Corp. (B)(C) | 7.500 | 10-01-26 | | 1,325,000 | 1,281,938 |
| Chesapeake Energy Corp. (B)(C) | 8.000 | 06-15-27 | | 925,000 | 904,444 |
| DCP Midstream Operating LP | 5.375 | 07-15-25 | | 1,600,000 | 1,681,936 |
| DCP Midstream Operating LP (5.850% to 5-21-23, then 3 month LIBOR + 3.850%) (A) | 5.850 | 05-21-43 | | 1,060,000 | 980,500 |
| Denbury Resources, Inc. (A)(B)(C) | 7.500 | 02-15-24 | | 715,000 | 657,800 |
| Diamondback Energy, Inc. (A) | 4.750 | 11-01-24 | | 930,000 | 949,763 |
| Energy Transfer Operating LP (C) | 4.200 | 04-15-27 | | 1,500,000 | 1,508,433 |
| Kinder Morgan, Inc. (C) | 5.550 | 06-01-45 | | 500,000 | 545,340 |
| Laredo Petroleum, Inc. (B)(C) | 6.250 | 03-15-23 | | 1,195,000 | 1,102,388 |
| Marathon Petroleum Corp. (B)(C) | 4.750 | 09-15-44 | | 1,500,000 | 1,505,493 |
| Oasis Petroleum, Inc. (A)(B)(C) | 6.250 | 05-01-26 | | 985,000 | 955,450 |
| Oasis Petroleum, Inc. | 6.875 | 03-15-22 | | 667,000 | 669,501 |
| Odebrecht Offshore Drilling Finance, Ltd. (A) | 6.720 | 12-01-22 | | 175,115 | 166,797 |
| SEE NOTES TO FINANCIAL STATEMENTS | SEMIANNUAL REPORT | JOHN HANCOCK INVESTORS TRUST | 7 |
| | Rate (%) | Maturity date | | Par value^ | Value |
| Energy (continued) | | | | |
| Oil, gas and consumable fuels (continued) | | | |
| Odebrecht Offshore Drilling Finance, Ltd. (7.720% Cash or 2.048% PIK) (A) | 7.720 | 12-01-26 | | 683,017 | $170,754 |
| Odebrecht Oil & Gas Finance, Ltd. (A)(D) | 0.000 | 06-03-19 | | 100,959 | 505 |
| Parsley Energy LLC (A)(B)(C) | 5.375 | 01-15-25 | | 370,000 | 377,030 |
| Parsley Energy LLC (A)(B)(C) | 5.625 | 10-15-27 | | 590,000 | 603,275 |
| PBF Holding Company LLC | 7.250 | 06-15-25 | | 455,000 | 468,650 |
| Petrobras Global Finance BV (B)(C) | 7.375 | 01-17-27 | | 1,755,000 | 1,955,070 |
| Petroleos Mexicanos | 5.500 | 01-21-21 | | 755,000 | 769,534 |
| Petroleos Mexicanos | 7.470 | 11-12-26 | MXN | 61,356,000 | 2,612,471 |
| Phillips 66 Partners LP (B)(C) | 4.900 | 10-01-46 | | 1,585,000 | 1,604,479 |
| Sabine Pass Liquefaction LLC (C) | 5.000 | 03-15-27 | | 1,000,000 | 1,063,241 |
| Sabine Pass Liquefaction LLC (B)(C) | 5.875 | 06-30-26 | | 610,000 | 679,165 |
| SM Energy Company (B)(C) | 5.625 | 06-01-25 | | 880,000 | 825,000 |
| SM Energy Company (B)(C) | 6.750 | 09-15-26 | | 530,000 | 507,475 |
| Sunoco Logistics Partners Operations LP (C) | 3.900 | 07-15-26 | | 925,000 | 920,714 |
| Tallgrass Energy Partners LP (A) | 5.500 | 09-15-24 | | 915,000 | 942,450 |
| Targa Resources Partners LP (A) | 6.500 | 07-15-27 | | 1,300,000 | 1,392,625 |
| The Oil and Gas Holding Company BSCC (A)(B)(C) | 7.500 | 10-25-27 | | 1,155,000 | 1,231,854 |
| Whiting Petroleum Corp. (B)(C) | 5.750 | 03-15-21 | | 705,000 | 722,414 |
| WPX Energy, Inc. | 5.250 | 09-15-24 | | 700,000 | 722,750 |
| Financials 26.8% | | | | 41,803,913 |
| Banks 15.2% | | | |
| Banco BTG Pactual SA (A) | 5.750 | 09-28-22 | | 2,540,000 | 2,569,718 |
| Banco de Credito del Peru (A) | 4.850 | 10-30-20 | PEN | 3,405,000 | 1,030,305 |
| Banco Nacional de Comercio Exterior SNC (3.800% to 8-11-21, then 5 Year CMT + 3.000%) (A) | 3.800 | 08-11-26 | | 1,385,000 | 1,360,776 |
| Bank of America Corp. (6.100% to 3-17-25, then 3 month LIBOR + 3.898%) (B)(C)(D) | 6.100 | 03-17-25 | | 1,385,000 | 1,485,413 |
| Barclays PLC (7.750% to 9-15-23, then 5 Year U.S. Swap Rate + 4.842%) (D) | 7.750 | 09-15-23 | | 1,330,000 | 1,374,888 |
| BBVA Bancomer SA (A) | 6.500 | 03-10-21 | | 870,000 | 910,533 |
| BNP Paribas SA (7.000% to 8-16-28, then 5 Year U.S. Swap Rate + 3.980%) (A)(B)(C)(D) | 7.000 | 08-16-28 | | 1,205,000 | 1,251,694 |
| Corp. Group Banking SA (A) | 6.750 | 03-15-23 | | 1,000,000 | 995,970 |
| Credit Agricole SA (7.875% to 1-23-24, then 5 Year U.S. Swap Rate + 4.898%) (A)(B)(C)(D) | 7.875 | 01-23-24 | | 865,000 | 939,614 |
| Credit Agricole SA (8.125% to 12-23-25, then 5 Year U.S. Swap Rate + 6.185%) (A)(D) | 8.125 | 12-23-25 | | 1,495,000 | 1,701,947 |
| 8 | JOHN HANCOCK INVESTORS TRUST | SEMIANNUAL REPORT | SEE NOTES TO FINANCIAL STATEMENTS |
| | Rate (%) | Maturity date | | Par value^ | Value |
| Financials (continued) | | | | |
| Banks (continued) | | | |
| Freedom Mortgage Corp. (A) | 8.250 | 04-15-25 | | 840,000 | $745,500 |
| HSBC Holdings PLC (6.500% to 3-23-28, then 5 Year U.S. ISDAFIX + 3.606%) (B)(C)(D) | 6.500 | 03-23-28 | | 2,015,000 | 2,050,263 |
| HSBC Holdings PLC (6.875% to 6-1-21, then 5 Year U.S. ISDAFIX + 5.514%) (C)(D) | 6.875 | 06-01-21 | | 760,000 | 797,050 |
| ING Groep NV (6.500% to 4-16-25, then 5 Year U.S. Swap Rate + 4.446%) (B)(C)(D) | 6.500 | 04-16-25 | | 1,060,000 | 1,070,282 |
| JPMorgan Chase & Co. (6.750% to 2-1-24, then 3 month LIBOR + 3.780%) (B)(C)(D) | 6.750 | 02-01-24 | | 1,500,000 | 1,661,715 |
| Lloyds Banking Group PLC (7.500% to 6-27-24, then 5 Year U.S. Swap Rate + 4.760%) (D) | 7.500 | 06-27-24 | | 1,465,000 | 1,538,250 |
| Societe Generale SA (7.375% to 9-13-21, then 5 Year U.S. Swap Rate + 6.238%) (A)(B)(C)(D) | 7.375 | 09-13-21 | | 1,470,000 | 1,528,800 |
| Wells Fargo & Company (5.875% to 6-15-25, then 3 month LIBOR + 3.990%) (B)(C)(D) | 5.875 | 06-15-25 | | 665,000 | 718,200 |
| Capital markets 2.6% | | | |
| Credit Suisse Group AG (7.250% to 9-12-25, then 5 Year U.S. Swap Rate + 4.332%) (A)(B)(C)(D) | 7.250 | 09-12-25 | | 1,500,000 | 1,559,250 |
| Credit Suisse Group AG (7.500% to 7-17-23, then 5 Year U.S. Swap Rate + 4.600%) (A)(B)(C)(D) | 7.500 | 07-17-23 | | 1,100,000 | 1,153,625 |
| Morgan Stanley (C) | 5.750 | 01-25-21 | | 1,000,000 | 1,048,000 |
| The Goldman Sachs Group, Inc. (B)(C) | 3.750 | 05-22-25 | | 375,000 | 380,288 |
| Consumer finance 5.1% | | | |
| American Express Company (4.900% to 3-15-20, then 3 month LIBOR + 3.285%) (C)(D) | 4.900 | 03-15-20 | | 1,300,000 | 1,303,991 |
| Avation Capital SA (A) | 6.500 | 05-15-21 | | 1,730,000 | 1,730,000 |
| Enova International, Inc. (A) | 8.500 | 09-01-24 | | 465,000 | 446,400 |
| Enova International, Inc. (A) | 8.500 | 09-15-25 | | 1,200,000 | 1,170,276 |
| Springleaf Finance Corp. (B)(C) | 6.875 | 03-15-25 | | 1,650,000 | 1,769,625 |
| Springleaf Finance Corp. | 7.125 | 03-15-26 | | 1,375,000 | 1,476,406 |
| Diversified financial services 0.7% | | | |
| ASP AMC Merger Sub, Inc. (A) | 8.000 | 05-15-25 | | 835,000 | 534,400 |
| Gogo Intermediate Holdings LLC (A) | 9.875 | 05-01-24 | | 500,000 | 511,250 |
| Insurance 1.1% | | | |
| Aquarius & Investments PLC (6.375% to 9-1-19, then 5 Year U.S. Swap Rate + 5.210%) | 6.375 | 09-01-24 | | 1,200,000 | 1,209,888 |
| SEE NOTES TO FINANCIAL STATEMENTS | SEMIANNUAL REPORT | JOHN HANCOCK INVESTORS TRUST | 9 |
| | Rate (%) | Maturity date | | Par value^ | Value |
| Financials (continued) | | | | |
| Insurance (continued) | | | |
| Ardonagh Midco 3 PLC (A)(B)(C) | 8.625 | 07-15-23 | | 545,000 | $459,163 |
| Mortgage real estate investment trusts 0.6% | | | |
| Starwood Property Trust, Inc. (C) | 5.000 | 12-15-21 | | 970,000 | 990,613 |
| Thrifts and mortgage finance 1.5% | | | |
| Quicken Loans, Inc. (A)(B)(C) | 5.250 | 01-15-28 | | 900,000 | 873,000 |
| Quicken Loans, Inc. (A) | 5.750 | 05-01-25 | | 900,000 | 913,500 |
| Stearns Holdings LLC (A) | 9.375 | 08-15-20 | | 578,000 | 543,320 |
| Health care 9.7% | | | | 15,188,430 |
| Health care providers and services 7.7% | | | |
| Centene Corp. (A) | 5.375 | 06-01-26 | | 1,000,000 | 1,043,750 |
| DaVita, Inc. (B)(C) | 5.125 | 07-15-24 | | 1,145,000 | 1,145,000 |
| Encompass Health Corp. | 5.750 | 11-01-24 | | 1,545,000 | 1,566,244 |
| HCA, Inc. | 5.250 | 04-15-25 | | 1,000,000 | 1,071,039 |
| HCA, Inc. | 5.500 | 06-15-47 | | 1,760,000 | 1,872,986 |
| MEDNAX, Inc. (A) | 5.250 | 12-01-23 | | 1,575,000 | 1,602,563 |
| Select Medical Corp. | 6.375 | 06-01-21 | | 1,500,000 | 1,501,875 |
| Team Health Holdings, Inc. (A)(B)(C) | 6.375 | 02-01-25 | | 1,240,000 | 1,054,000 |
| Tenet Healthcare Corp. (B)(C) | 6.750 | 06-15-23 | | 1,110,000 | 1,132,200 |
| Pharmaceuticals 2.0% | | | |
| Bausch Health Americas, Inc. (A)(B)(C) | 8.500 | 01-31-27 | | 507,000 | 552,313 |
| Endo Finance LLC (A)(B)(C) | 5.375 | 01-15-23 | | 932,000 | 773,560 |
| Mallinckrodt International Finance SA (A)(B)(C) | 5.500 | 04-15-25 | | 865,000 | 622,800 |
| Teva Pharmaceutical Finance Netherlands III BV (B)(C) | 6.000 | 04-15-24 | | 520,000 | 529,100 |
| Teva Pharmaceutical Finance Netherlands III BV (B)(C) | 6.750 | 03-01-28 | | 700,000 | 721,000 |
| Industrials 9.0% | | | | 14,024,674 |
| Aerospace and defense 0.8% | | | |
| TransDigm, Inc. (A)(B)(C) | 6.250 | 03-15-26 | | 1,185,000 | 1,233,881 |
| Air freight and logistics 0.9% | | | |
| Mexico City Airport Trust (A) | 5.500 | 10-31-46 | | 1,535,000 | 1,431,388 |
| Airlines 1.4% | | | |
| Air Canada Pass Through Trust (A)(C) | 3.300 | 07-15-31 | | 974,400 | 941,270 |
| Virgin Australia Holdings, Ltd. (A) | 8.500 | 11-15-19 | | 1,250,000 | 1,274,063 |
| Building products 0.8% | | | |
| Standard Industries, Inc. (A)(C) | 5.375 | 11-15-24 | | 1,220,000 | 1,242,875 |
| Commercial services and supplies 1.9% | | | |
| Cimpress NV (A) | 7.000 | 06-15-26 | | 1,300,000 | 1,283,880 |
| LSC Communications, Inc. (A)(B)(C) | 8.750 | 10-15-23 | | 1,000,000 | 1,045,000 |
| Tervita Escrow Corp. (A) | 7.625 | 12-01-21 | | 655,000 | 663,188 |
| 10 | JOHN HANCOCK INVESTORS TRUST | SEMIANNUAL REPORT | SEE NOTES TO FINANCIAL STATEMENTS |
| | Rate (%) | Maturity date | | Par value^ | Value |
| Industrials (continued) | | | | |
| Construction and engineering 0.9% | | | |
| AECOM (B)(C) | 5.125 | 03-15-27 | | 850,000 | $853,196 |
| HC2 Holdings, Inc. (A) | 11.500 | 12-01-21 | | 615,000 | 529,669 |
| Industrial conglomerates 0.8% | | | |
| General Electric Company (5.000% to 1-21-21, then 3 month LIBOR + 3.330%) (B)(C)(D) | 5.000 | 01-21-21 | | 1,250,000 | 1,183,213 |
| Machinery 0.5% | | | |
| Stevens Holding Company, Inc. (A)(B)(C) | 6.125 | 10-01-26 | | 775,000 | 815,688 |
| Trading companies and distributors 1.0% | | | |
| United Rentals North America, Inc. (B)(C) | 5.500 | 07-15-25 | | 1,475,000 | 1,527,363 |
| Information technology 9.5% | | | | 14,785,996 |
| Communications equipment 1.0% | | | |
| CommScope, Inc. (A)(B)(C) | 6.000 | 03-01-26 | | 632,000 | 669,130 |
| CommScope, Inc. (A)(B)(C) | 8.250 | 03-01-27 | | 800,000 | 864,000 |
| Electronic equipment, instruments and components 0.8% | | | |
| TTM Technologies, Inc. (A)(B)(C) | 5.625 | 10-01-25 | | 1,200,000 | 1,185,000 |
| IT services 1.3% | | | |
| Sixsigma Networks Mexico SA de CV (A) | 7.500 | 05-02-25 | | 725,000 | 716,844 |
| Travelport Corporate Finance PLC (A) | 6.000 | 03-15-26 | | 1,250,000 | 1,343,750 |
| Semiconductors and semiconductor equipment 1.4% | | | |
| Advanced Micro Devices, Inc. (B)(C) | 7.000 | 07-01-24 | | 1,110,000 | 1,153,013 |
| Micron Technology, Inc. | 5.327 | 02-06-29 | | 1,000,000 | 1,031,080 |
| Software 0.9% | | | |
| Ascend Learning LLC (A) | 6.875 | 08-01-25 | | 469,000 | 476,621 |
| j2 Cloud Services LLC (A) | 6.000 | 07-15-25 | | 848,000 | 886,160 |
| Technology hardware, storage and peripherals 4.1% | | | |
| Dell International LLC (A)(B)(C) | 6.020 | 06-15-26 | | 1,450,000 | 1,570,625 |
| Dell International LLC (A)(B)(C) | 8.350 | 07-15-46 | | 600,000 | 738,222 |
| Lexmark International, Inc. (B)(C) | 7.125 | 03-15-20 | | 850,000 | 794,750 |
| Seagate HDD Cayman | 4.750 | 06-01-23 | | 715,000 | 722,273 |
| Seagate HDD Cayman | 4.875 | 06-01-27 | | 1,090,000 | 1,043,613 |
| Seagate HDD Cayman (B)(C) | 5.750 | 12-01-34 | | 1,700,000 | 1,590,915 |
| Materials 11.7% | | | | 18,297,108 |
| Chemicals 3.6% | | | |
| Ashland LLC | 6.875 | 05-15-43 | | 845,000 | 902,038 |
| Braskem Finance, Ltd. | 6.450 | 02-03-24 | | 700,000 | 765,625 |
| Braskem Netherlands Finance BV (A)(B)(C) | 3.500 | 01-10-23 | | 1,105,000 | 1,092,304 |
| Braskem Netherlands Finance BV (A) | 4.500 | 01-10-28 | | 490,000 | 480,200 |
| Mexichem SAB de CV (A) | 5.500 | 01-15-48 | | 1,200,000 | 1,144,512 |
| SEE NOTES TO FINANCIAL STATEMENTS | SEMIANNUAL REPORT | JOHN HANCOCK INVESTORS TRUST | 11 |
| | Rate (%) | Maturity date | | Par value^ | Value |
| Materials (continued) | | | | |
| Chemicals (continued) | | | |
| The Chemours Company (B)(C) | 6.625 | 05-15-23 | | 1,240,000 | $1,284,578 |
| Containers and packaging 1.1% | | | |
| ARD Finance SA (7.125% Cash or 7.875% PIK) | 7.125 | 09-15-23 | | 500,000 | 499,375 |
| Ardagh Packaging Finance PLC (A)(B)(C) | 6.000 | 02-15-25 | | 1,185,000 | 1,193,888 |
| Metals and mining 6.5% | | | |
| AngloGold Ashanti Holdings PLC | 5.375 | 04-15-20 | | 675,000 | 686,948 |
| Corp. Nacional del Cobre de Chile (A) | 4.250 | 07-17-42 | | 310,000 | 307,467 |
| Corp. Nacional del Cobre de Chile (A) | 4.875 | 11-04-44 | | 2,345,000 | 2,532,272 |
| First Quantum Minerals, Ltd. (A)(B)(C) | 7.250 | 05-15-22 | | 875,000 | 884,844 |
| First Quantum Minerals, Ltd. (A) | 7.500 | 04-01-25 | | 600,000 | 579,750 |
| Freeport-McMoRan, Inc. | 5.450 | 03-15-43 | | 1,500,000 | 1,353,750 |
| Freeport-McMoRan, Inc. (B)(C) | 6.875 | 02-15-23 | | 840,000 | 886,200 |
| MMC Norilsk Nickel OJSC (A) | 5.550 | 10-28-20 | | 750,000 | 770,268 |
| Teck Resources, Ltd. | 6.250 | 07-15-41 | | 830,000 | 896,509 |
| Vale Overseas, Ltd. (B)(C) | 6.250 | 08-10-26 | | 1,165,000 | 1,272,180 |
| Paper and forest products 0.5% | | | |
| Norbord, Inc. (A) | 6.250 | 04-15-23 | | 735,000 | 764,400 |
| Real estate 0.9% | | | | 1,405,088 |
| Equity real estate investment trusts 0.5% | | | |
| Iron Mountain, Inc. (A)(B)(C) | 5.250 | 03-15-28 | | 815,000 | 802,775 |
| Real estate management and development 0.4% | | | |
| Williams Scotsman International, Inc. (A) | 7.875 | 12-15-22 | | 575,000 | 602,313 |
| Utilities 7.4% | | | | 11,634,519 |
| Electric utilities 4.9% | | | |
| ABY Transmision Sur SA (A) | 6.875 | 04-30-43 | | 2,004,828 | 2,240,395 |
| Empresa Electrica Angamos SA (A) | 4.875 | 05-25-29 | | 913,000 | 923,509 |
| Instituto Costarricense de Electricidad (A) | 6.375 | 05-15-43 | | 1,595,000 | 1,276,000 |
| Israel Electric Corp., Ltd. (A)(C) | 4.250 | 08-14-28 | | 2,320,000 | 2,343,748 |
| Vistra Operations Company LLC (A)(B)(C) | 5.500 | 09-01-26 | | 900,000 | 927,000 |
| Gas utilities 1.3% | | | |
| AmeriGas Partners LP | 5.625 | 05-20-24 | | 900,000 | 938,250 |
| AmeriGas Partners LP | 5.750 | 05-20-27 | | 1,000,000 | 1,032,500 |
| Independent power and renewable electricity producers 1.2% | | | |
| Clearway Energy Operating LLC | 5.375 | 08-15-24 | | 1,290,000 | 1,311,117 |
|
| NRG Energy, Inc. (B)(C) | 6.625 | 01-15-27 | | 600,000 | 642,000 |
| 12 | JOHN HANCOCK INVESTORS TRUST | SEMIANNUAL REPORT | SEE NOTES TO FINANCIAL STATEMENTS |
| | Rate (%) | Maturity date | | Par value^ | Value |
|
| Convertible bonds 1.0% (0.7% of Total investments) | | $1,623,894 |
| (Cost $1,786,775) | | | | | |
| Communication services 0.8% | | | | 1,309,339 |
| Entertainment 0.3% | | | |
| DHX Media, Ltd. (A) | 5.875 | 09-30-24 | CAD | 999,000 | 552,556 |
| Media 0.5% | | | |
| DISH Network Corp. | 3.375 | 08-15-26 | | 825,000 | 756,783 |
| Information technology 0.2% | | | | 314,555 |
| Semiconductors and semiconductor equipment 0.2% | | | |
|
| Novellus Systems, Inc. | 2.625 | 05-15-41 | | 50,000 | 314,555 |
| Capital preferred securities (G) 0.5% (0.3% of Total investments) | | $745,553 |
| (Cost $688,386) | | | | | |
| Financials 0.5% | | | | 745,553 |
| Banks 0.5% | | | |
|
| Wachovia Capital Trust III (Greater of 3 month LIBOR + 0.930% or 5.570%) (C)(D)(H) | 5.570 | 06-03-19 | | 750,000 | 745,553 |
| Term loans (I) 4.7% (3.1% of Total investments) | | $7,369,615 |
| (Cost $7,498,958) | | | | | |
| Communication services 0.5% | | | | | 859,963 |
| Interactive media and services 0.5% | | | | | |
| Ancestry.com Operations, Inc., 2017 1st Lien Term Loan (1 month LIBOR + 3.250%) | 5.740 | 10-19-23 | | 859,533 | 859,963 |
| Consumer discretionary 1.2% | | | | | 1,890,036 |
| Auto components 1.2% | | | | | |
| American Tire Distributors, Inc., 2015 Term Loan (3 month LIBOR + 7.500%) | 10.129 | 09-02-24 | | 1,886,330 | 1,763,719 |
| American Tire Distributors, Inc., PIK, Exit FILO Term Loan (3 month LIBOR + 6.000%) | 8.663 | 09-01-23 | | 126,952 | 126,317 |
| Financials 1.6% | | | | | 2,427,604 |
| Capital markets 0.8% | | | | | |
| Jane Street Group LLC, 2018 Term Loan B (1 month LIBOR + 3.000%) | 5.483 | 08-25-22 | | 1,200,000 | 1,194,756 |
| Diversified financial services 0.8% | | | | | |
| Refinitiv US Holdings, Inc., 2018 USD Term Loan (1 month LIBOR + 3.750%) | 6.233 | 10-01-25 | | 1,246,875 | 1,232,848 |
| SEE NOTES TO FINANCIAL STATEMENTS | SEMIANNUAL REPORT | JOHN HANCOCK INVESTORS TRUST | 13 |
| | Rate (%) | Maturity date | | Par value^ | Value |
| Industrials 0.6% | | | | | $903,375 |
| Airlines 0.0% | | | | | |
| Global Aviation Holdings, Inc., PIK, 2nd Lien Term Loan (E)(F) | 0.000 | 07-13-19 | | 51,038 | 0 |
| Global Aviation Holdings, Inc., PIK, 3rd Lien Term Loan (E)(F) | 0.000 | 03-13-20 | | 514,063 | 0 |
| Commercial services and supplies0.6% | | | | | |
| Quad/Graphics, Inc., 2018 Term Loan B (1 month LIBOR + 5.000%) | 7.490 | 01-31-26 | | 900,000 | 903,375 |
| Real estate 0.8% | | | | | 1,288,637 |
| Equity real estate investment trusts0.8% | | | | | |
|
| iStar, Inc., 2016 Term Loan B (1 month LIBOR + 2.750%) | 5.233 | 06-28-23 | | 1,290,250 | 1,288,637 |
| Collateralized mortgage obligations 1.0% (0.6% of Total investments) | | $1,485,506 |
| (Cost $1,103,663) | | | | | |
| Commercial and residential 0.9% | | | | | 1,337,844 |
| HarborView Mortgage Loan Trust | | | | | |
| Series 2007-3, Class ES IO (A) | 0.350 | 05-19-47 | | 3,306,899 | 57,518 |
| Series 2007-4, Class ES IO | 0.350 | 07-19-47 | | 3,405,712 | 56,672 |
| Series 2007-6, Class ES IO (A) | 0.353 | 08-19-37 | | 2,880,977 | 41,490 |
| IndyMac Index Mortgage Loan Trust | | | | | |
| Series 2005-AR18, Class 1X IO | 0.706 | 10-25-36 | | 4,741,331 | 188,472 |
| Series 2005-AR18, Class 2X IO | 0.467 | 10-25-36 | | 4,237,656 | 65,990 |
MSCG Trust
Series 2016-SNR, Class D (A) | 6.550 | 11-15-34 | | 926,500 | 927,702 |
| U.S. Government Agency 0.1% | | | | | 147,662 |
Federal Home Loan Mortgage Corp.
Series K017, Class X1 IO | 1.446 | 12-25-21 | | 3,165,642 | 88,870 |
|
Government National Mortgage Association
Series 2012-114, Class IO | 0.766 | 01-16-53 | | 1,290,693 | 58,792 |
| Asset backed securities 0.6% (0.4% of Total investments) | | $938,932 |
| (Cost $918,876) | | | | | |
| Asset backed securities 0.6% | | | | | 938,932 |
Coinstar Funding LLC
Series 2017-1A, Class A2 (A) | 5.216 | 04-25-47 | | 147,000 | 149,825 |
ContiMortgage Home Equity Loan Trust
Series 1995-2, Class A5 | 8.100 | 08-15-25 | | 18,776 | 10,981 |
Driven Brands Funding LLC
Series 2015-1A, Class A2 (A) | 5.216 | 07-20-45 | | 752,700 | 778,126 |
|
| 14 | JOHN HANCOCK INVESTORS TRUST | SEMIANNUAL REPORT | SEE NOTES TO FINANCIAL STATEMENTS |
| | | | | Shares | Value |
| Common stocks 0.0% (0.0% of Total investments) | | $1,717 |
| (Cost $595,095) | | | | | |
| Communication services 0.0% |
| Media 0.0% | | |
| Vertis Holdings, Inc. (F)(J) | | | | 34,014 | 0 |
| Industrials 0.0% |
| Airlines 0.0% | | |
| Global Aviation Holdings, Inc., Class A (F)(J) | | | | 82,159 | 0 |
| Information technology 0.0% |
| Software 0.0% | | |
|
| Avaya Holdings Corp. (J) | | | | 90 | 1,717 |
| Preferred securities (K) 2.3% (1.5% of Total investments) | | $3,506,839 |
| (Cost $3,550,830) | | | | | |
| Energy 0.2% | | | | | 213,763 |
| Energy equipment and services 0.2% | |
| Nabors Industries, Ltd., 6.000% (B)(C) | | 7,950 | 213,763 |
| Financials 0.7% | | | | | 1,102,233 |
| Banks 0.7% | |
| GMAC Capital Trust I (3 month LIBOR + 5.785%), 8.469% (H) | | 41,910 | 1,102,233 |
| Utilities 1.4% | | | | | 2,190,843 |
| Multi-utilities 1.1% | |
| Dominion Energy, Inc., 6.750% | | 19,820 | 995,559 |
| DTE Energy Company, 6.500% | | 11,745 | 655,488 |
| Water utilities 0.3% | |
| Aqua America, Inc., 6.000% | | 9,890 | 539,796 |
| Warrants 0.0% (0.0% of Total investments) | | $56,073 |
| (Cost $0) | | | | | |
| Avaya Holdings Corp. (Expiration Date: 12-15-22; Strike Price: $25.55) (J) | | | | 20,390 | 56,073 |
| | Yield* (%) | Maturity date | | Par value^ | Value |
| Short-term investments 3.1% (2.0% of Total investments) | $4,868,000 |
| (Cost $4,868,000) | | | | | |
| U.S. Government Agency 2.9% | | | | | 4,555,000 |
| Federal Agricultural Mortgage Corp. Discount Note | 2.350 | 05-01-19 | | 1,786,000 | 1,786,000 |
| Federal Home Loan Bank Discount Note | 2.300 | 05-01-19 | | 2,769,000 | 2,769,000 |
| SEE NOTES TO FINANCIAL STATEMENTS | SEMIANNUAL REPORT | JOHN HANCOCK INVESTORS TRUST | 15 |
| | | | | Par value^ | Value |
| Repurchase agreement 0.2% | | | | | 313,000 |
|
| Repurchase Agreement with State Street Corp. dated 4-30-19 at 1.300% to be repurchased at $313,011 on 5-1-19, collateralized by $315,000 U.S. Treasury Notes, 2.625% due 7-15-21 (valued at $319,609, including interest) | | | | 313,000 | 313,000 |
|
| Total investments (Cost $239,300,412) 153.7% | | | $239,989,671 |
| Other assets and liabilities, net (53.7%) | | | (83,838,870) |
| Total net assets 100.0% | | | $156,150,801 |
| The percentage shown for each investment category is the total value of the category as a percentage of the net assets of the fund unless otherwise indicated. |
| ^All par values are denominated in U.S. dollars unless otherwise indicated. |
| Currency Abbreviations |
| CAD | Canadian Dollar |
| MXN | Mexican Peso |
| PEN | Peruvian Nuevo Sol |
| Security Abbreviations and Legend |
| CMT | Constant Maturity Treasury |
| IO | Interest-Only Security - (Interest Tranche of Stripped Mortgage Pool). Rate shown is the annualized yield at the end of the period. |
| ISDAFIX | International Swaps and Derivatives Association Fixed Interest Rate Swap Rate |
| LIBOR | London Interbank Offered Rate |
| PIK | Pay-in-Kind Security - Represents a payment-in-kind which may pay interest in additional par and/or cash. Rates shown are the current rate and most recent payment rate. |
| (A) | These securities are exempt from registration under Rule 144A of the Securities Act of 1933. Such securities may be resold, normally to qualified institutional buyers, in transactions exempt from registration. Rule 144A securities amounted to $107,528,315 or 68.9% of the fund's net assets as of 4-30-19. |
| (B) | All or a portion of this security is on loan as of 4-30-19, and is a component of the fund's leverage under the Liquidity Agreement. |
| (C) | All or a portion of this security is pledged as collateral pursuant to the Liquidity Agreement. Total collateral value at 4-30-19 was $89,769,439. A portion of the securities pledged as collateral were loaned pursuant to the Liquidity Agreement. The value of securities on loan amounted to $69,583,611. |
| (D) | Perpetual bonds have no stated maturity date. Date shown as maturity date is next call date. |
| (E) | Non-income producing - Issuer is in default. |
| (F) | Security is valued using significant unobservable inputs and is classified as Level 3 in the fair value hierarchy. |
| (G) | Includes hybrid securities with characteristics of both equity and debt that trade with, and pay, interest income. |
| (H) | Variable rate obligation. The coupon rate shown represents the rate at period end. |
| (I) | Term loans are variable rate obligations. The coupon rate shown represents the rate at period end. |
| (J) | Non-income producing security. |
| (K) | Includes preferred stocks and hybrid securities with characteristics of both equity and debt that pay dividends on a periodic basis. |
| * | Yield represents either the annualized yield at the date of purchase, the stated coupon rate or, for floating rate securities, the rate at period end. |
| 16 | JOHN HANCOCK INVESTORS TRUST | SEMIANNUAL REPORT | SEE NOTES TO FINANCIAL STATEMENTS |
DERIVATIVES
FORWARD FOREIGN CURRENCY CONTRACTS
| Contract to buy | Contract to sell | Counterparty (OTC) | Contractual
settlement
date | Unrealized
appreciation | Unrealized
depreciation |
| USD | 594,546 | CAD | 791,000 | GSI | 6/19/2019 | $3,382 | — |
| USD | 5,672,029 | MXN | 110,894,056 | GSI | 6/19/2019 | — | $(133,133) |
| USD | 335,344 | MXN | 6,490,000 | SSB | 6/19/2019 | — | (4,399) |
| USD | 1,005,760 | PEN | 3,405,000 | SSB | 10/30/2019 | — | (16,354) |
| | | | | | | $3,382 | $(153,886) |
| Derivatives Currency Abbreviations |
| CAD | Canadian Dollar |
| MXN | Mexican Peso |
| PEN | Peruvian Nuevo Sol |
| USD | U.S. Dollar |
| Derivatives Abbreviations |
| GSI | Goldman Sachs International |
| OTC | Over-the-counter |
| SSB | State Street Bank and Trust Company |
At 4-30-19, the aggregate cost of investments for federal income tax purposes was $240,041,331. Net unrealized depreciation aggregated to $202,164, of which $6,605,065 related to gross unrealized appreciation and $6,807,229 related to gross unrealized depreciation.
See Notes to financial statements regarding investment transactions and other derivatives information.
| SEE NOTES TO FINANCIAL STATEMENTS | SEMIANNUAL REPORT | JOHN HANCOCK INVESTORS TRUST | 17 |
STATEMENT OF ASSETS AND LIABILITIES 4-30-19 (unaudited)
| Assets | |
| Unaffiliated investments, at value (Cost $239,300,412) | $239,989,671 |
| Unrealized appreciation on forward foreign currency contracts | 3,382 |
| Cash | 21,261 |
| Foreign currency, at value (Cost $25,286) | 25,315 |
| Dividends and interest receivable | 3,507,945 |
| Receivable for investments sold | 1,439,073 |
| Other assets | 233,827 |
| Total assets | 245,220,474 |
| Liabilities | |
| Unrealized depreciation on forward foreign currency contracts | 153,886 |
| Liquidity agreement | 86,900,000 |
| Payable for investments purchased | 1,650,566 |
| Interest payable | 223,019 |
| Payable to affiliates | |
| Accounting and legal services fees | 19,548 |
| Trustees' fees | 224 |
| Other liabilities and accrued expenses | 122,430 |
| Total liabilities | 89,069,673 |
| Net assets | $156,150,801 |
| Net assets consist of | |
| Paid-in capital | $172,098,095 |
| Total distributable earnings (loss) | (15,947,294) |
| Net assets | $156,150,801 |
| |
| Net asset value per share | |
| Based on 8,707,025 shares of beneficial interest outstanding - unlimited number of shares authorized with no par value | $ 17.93 |
| 18 | JOHN HANCOCK INVESTORS TRUST | SEMIANNUAL REPORT | SEE NOTES TO FINANCIAL STATEMENTS |
STATEMENT OF OPERATIONSFor the six months ended 4-30-19 (unaudited)
| Investment income | |
| Interest | $7,235,649 |
| Dividends | 116,644 |
| Total investment income | 7,352,293 |
| Expenses | |
| Investment management fees | 637,373 |
| Interest expense | 1,335,919 |
| Accounting and legal services fees | 17,620 |
| Transfer agent fees | 33,405 |
| Trustees' fees | 22,120 |
| Custodian fees | 13,575 |
| Printing and postage | 35,786 |
| Professional fees | 49,843 |
| Stock exchange listing fees | 11,776 |
| Other | 4,238 |
| Total expenses | 2,161,655 |
| Less expense reductions | (8,545) |
| Net expenses | 2,153,110 |
| Net investment income | 5,199,183 |
| Realized and unrealized gain (loss) | |
| Net realized gain (loss) on | |
| Unaffiliated investments and foreign currency transactions | (2,316,898) |
| Forward foreign currency contracts | (230,701) |
| | (2,547,599) |
| Change in net unrealized appreciation (depreciation) of | |
| Unaffiliated investments and translation of assets and liabilities in foreign currencies | 10,824,075 |
| Forward foreign currency contracts | (330,073) |
| | 10,494,002 |
| Net realized and unrealized gain | 7,946,403 |
| Increase in net assets from operations | $13,145,586 |
| | |
| SEE NOTES TO FINANCIAL STATEMENTS | SEMIANNUAL REPORT | JOHN HANCOCK INVESTORS TRUST | 19 |
STATEMENTS OF CHANGES IN NET ASSETS
| | Six months ended
4-30-19
(unaudited) | Year ended
10-31-18 |
| Increase (decrease) in net assets | | |
| From operations | | |
| Net investment income | $5,199,183 | $10,516,299 |
| Net realized loss | (2,547,599) | (1,883,083) |
| Change in net unrealized appreciation (depreciation) | 10,494,002 | (13,655,582) |
| Increase (decrease) in net assets resulting from operations | 13,145,586 | (5,022,366) |
| Distributions to shareholders | | |
| From net investment income and net realized gain | (4,897,703) | (10,818,479) |
| Total distributions | (4,897,703) | (10,818,479) |
| Total increase (decrease) | 8,247,883 | (15,840,845) |
| Net assets | | |
| Beginning of period | 147,902,918 | 163,743,763 |
| End of period | $156,150,801 | $147,902,918 |
| Share activity | | |
| Shares outstanding | | |
| Beginning of period | 8,707,025 | 8,707,025 |
| End of period | 8,707,025 | 8,707,025 |
| 20 | JOHN HANCOCK INVESTORS TRUST | SEMIANNUAL REPORT | SEE NOTES TO FINANCIAL STATEMENTS |
STATEMENT OF CASH FLOWSFor the six months ended 4-30-19 (unaudited)
| | |
| Cash flows from operating activities | |
| Net increase in net assets from operations | $13,145,586 |
| Adjustments to reconcile net increase in net assets from operations to net cash provided by operating activities: | |
| Long-term investments purchased | (41,084,780) |
| Long-term investments sold | 43,045,365 |
| Net purchases and sales in short-term investments | (2,797,000) |
| Net amortization of premium (discount) | 16,647 |
| (Increase) Decrease in assets: | |
| Unrealized appreciation on forward foreign currency contracts | 177,115 |
| Foreign currency, at value | (24,966) |
| Dividends and interest receivable | (141,695) |
| Receivable for investments sold | 1,372,316 |
| Other assets | (11,598) |
| Increase (Decrease) in liabilities: | |
| Unrealized depreciation on forward foreign currency contracts | 152,958 |
| Payable for investments purchased | (624,570) |
| Interest payable | 7,118 |
| Payable to affiliates | (5,339) |
| Other liabilities and accrued expenses | 31,136 |
| Net change in unrealized (appreciation) depreciation on: | |
| Investments | (10,802,784) |
| Net realized (gain) loss on: | |
| Investments | 2,317,410 |
| Net cash provided by operating activities | $4,772,919 |
| Cash flows provided by (used in) financing activities | |
| Distributions to shareholders | $(4,897,703) |
| Net cash used in financing activities | $(4,897,703) |
| Net decrease in cash | $(124,784) |
| Cash at beginning of period | $146,045 |
| Cash at end of period | $21,261 |
| Supplemental disclosure of cash flow information: | |
| Cash paid for interest | $1,328,801 |
| SEE NOTES TO FINANCIAL STATEMENTS | SEMIANNUAL REPORT | JOHN HANCOCK INVESTORS TRUST | 21 |
| Period ended | 4-30-191 | 10-31-18 | 10-31-17 | 10-31-16 | 10-31-15 | 10-31-14 |
| Per share operating performance | | | | | | |
| Net asset value, beginning of period | $16.99 | $18.81 | $18.11 | $17.20 | $19.56 | $19.76 |
| Net investment income2 | 0.60 | 1.21 | 1.28 | 1.32 | 1.41 | 1.58 |
| Net realized and unrealized gain (loss) on investments | 0.90 | (1.79) | 0.72 | 0.96 | (2.28) | (0.14) |
| Total from investment operations | 1.50 | (0.58) | 2.00 | 2.28 | (0.87) | 1.44 |
| Less distributions | | | | | | |
| From net investment income | (0.56) | (1.24) | (1.30) | (1.39) | (1.49) | (1.64) |
| Anti-dilutive impact of repurchase plan | — | — | — | 0.023 | — | — |
| Anti-dilutive impact of shelf offering | — | — | — | — | — | —4 |
| Net asset value, end of period | $17.93 | $16.99 | $18.81 | $18.11 | $17.20 | $19.56 |
| Per share market value, end of period | $16.07 | $15.51 | $17.87 | $16.73 | $15.20 | $19.06 |
| Total return at net asset value (%)5,6 | 9.587 | (2.74) | 11.87 | 14.95 | (3.85) | 7.65 |
| Total return at market value (%)5 | 7.537 | (6.54) | 15.05 | 20.17 | (12.80) | 7.40 |
| Ratios and supplemental data | | | | | | |
| Net assets, end of period (in millions) | $156 | $148 | $164 | $158 | $151 | $172 |
| Ratios (as a percentage of average net assets): | | | | | | |
| Expenses before reductions | 2.948 | 2.52 | 1.95 | 1.79 | 1.54 | 1.38 |
| Expenses including reductions9 | 2.938 | 2.51 | 1.94 | 1.78 | 1.53 | 1.37 |
| Net investment income | 7.088 | 6.76 | 6.96 | 7.75 | 7.70 | 7.94 |
| Portfolio turnover (%) | 18 | 52 | 53 | 62 | 74 | 71 |
| Senior securities | | | | | | |
| Total debt outstanding end of period (in millions) | $87 | $87 | $87 | $87 | $87 | $87 |
| Asset coverage per $1,000 of debt10 | $2,797 | $2,702 | $2,884 | $2,814 | $2,741 | $2,979 |
| 22 | JOHN HANCOCK Investors Trust | SEMIANNUAL REPORT | SEE NOTES TO FINANCIAL STATEMENTS |
| 1 | Period ended 04-30-19. Unaudited. |
| 2 | Based on average daily shares outstanding. |
| 3 | The repurchase plan was completed at an average repurchase price of $13.99 for 84,400 shares for the period ended 10-31-16. |
| 4 | Less than $0.005 per share. |
| 5 | Total return based on net asset value reflects changes in the fund’s net asset value during each period. Total return based on market value reflects changes in market value. Each figure assumes that distributions from income, capital gains and tax return of capital, if any, were reinvested. |
| 6 | Total returns would have been lower had certain expenses not been reduced during the applicable periods. |
| 7 | Not annualized. |
| 8 | Annualized. |
| 9 | Expenses including reductions excluding interest expense were 1.11% (annualized), 1.12%, 1.06%, 1.16%, 1.06% and 1.05% for the periods ended 4-30-19, 10-31-18, 10-31-17, 10-31-16, 10-31-15 and 10-31-14, respectively. |
| 10 | Asset coverage equals the total net assets plus borrowings divided by the borrowings of the fund outstanding at period end (Note 8). As debt outstanding changes, the level of invested assets may change accordingly. Asset coverage ratio provides a measure of leverage. |
| SEE NOTES TO FINANCIAL STATEMENTS | SEMIANNUAL REPORT | JOHN HANCOCK Investors Trust | 23 |
Notes to financial statements (unaudited)
Note 1 — Organization
John Hancock Investors Trust (the fund) is a closed-end management investment company organized as a Massachusetts business trust and registered under the Investment Company Act of 1940, as amended (the 1940 Act).
In 2012, 2015 and 2018, the fund filed registration statements with the Securities and Exchange Commission (SEC), in each case registering and/or carrying forward 1,000,000 common shares, through equity shelf offering programs. Under these programs, the fund, subject to market conditions, may raise additional equity capital from time to time by offering new common shares at a price equal to or above the fund's net asset value (NAV) per common share.
Note 2 — Significant accounting policies
The financial statements have been prepared in conformity with accounting principles generally accepted in the United States of America (US GAAP), which require management to make certain estimates and assumptions as of the date of the financial statements. Actual results could differ from those estimates and those differences could be significant. The fund qualifies as an investment company under Topic 946 of Accounting Standards Codification of US GAAP.
Events or transactions occurring after the end of the fiscal period through the date that the financial statements were issued have been evaluated in the preparation of the financial statements. The following summarizes the significant accounting policies of the fund:
Security valuation.Investments are stated at value as of the scheduled close of regular trading on the New York Stock Exchange (NYSE), normally at 4:00 p.m., Eastern Time. In case of emergency or other disruption resulting in the NYSE not opening for trading or the NYSE closing at a time other than the regularly scheduled close, the NAV may be determined as of the regularly scheduled close of the NYSE pursuant to the fund's Valuation Policies and Procedures.
In order to value the securities, the fund uses the following valuation techniques: Debt obligations are typically valued based on the evaluated prices provided by an independent pricing vendor. Independent pricing vendors utilize matrix pricing which takes into account factors such as institutional-size trading in similar groups of securities, yield, quality, coupon rate, maturity, type of issue, trading characteristics and other market data, as well as broker supplied prices. Equity securities held by the fund are typically valued at the last sale price or official closing price on the exchange or principal market where the security trades. In the event there were no sales during the day or closing prices are not available, the securities are valued using the last available bid price. Forward foreign currency contracts are valued at the prevailing forward rates which are based on foreign currency exchange spot rates and forward points supplied by an independent pricing vendor. Foreign securities and currencies are valued in U.S. dollars based on foreign currency exchange rates supplied by an independent pricing vendor.
In certain instances, the Pricing Committee may determine to value equity securities using prices obtained from another exchange or market if trading on the exchange or market on which prices are typically obtained did not open for trading as scheduled, or if trading closed earlier than scheduled, and trading occurred as normal on another exchange or market.
Other portfolio securities and assets, for which reliable market quotations are not readily available, are valued at fair value as determined in good faith by the fund's Pricing Committee following procedures established by the Board of Trustees. The frequency with which these fair valuation procedures are used cannot be predicted and fair value of securities may differ significantly from the value that would have been used had a ready market for such securities existed. Trading in foreign securities may be completed before the scheduled daily close of trading on the NYSE. Significant events at the issuer or market level may affect the values of securities between the time when the valuation of the securities is generally determined and the close of the NYSE. If a significant event occurs, these securities may be fair valued, as determined in good faith by the fund's Pricing Committee, following procedures established by the
SEMIANNUAL REPORT | JOHN HANCOCK INVESTORS TRUST 24
Board of Trustees. The fund uses fair value adjustment factors provided by an independent pricing vendor to value certain foreign securities in order to adjust for events that may occur between the close of foreign exchanges or markets and the close of the NYSE.
The fund uses a three-tier hierarchy to prioritize the pricing assumptions, referred to as inputs, used in valuation techniques to measure fair value. Level 1 includes securities valued using quoted prices in active markets for identical securities. Level 2 includes securities valued using other significant observable inputs. Observable inputs may include quoted prices for similar securities, interest rates, prepayment speeds and credit risk. Prices for securities valued using these inputs are received from independent pricing vendors and brokers and are based on an evaluation of the inputs described. Level 3 includes securities valued using significant unobservable inputs when market prices are not readily available or reliable, including the fund's own assumptions in determining the fair value of investments. Factors used in determining value may include market or issuer specific events or trends, changes in interest rates and credit quality. The inputs or methodology used for valuing securities are not necessarily an indication of the risks associated with investing in those securities. Changes in valuation techniques and related inputs may result in transfers into or out of an assigned level within the disclosure hierarchy.
The following is a summary of the values by input classification of the fund's investments as of April 30, 2019, by major security category or type:
| | | | | | | | | | | | | | | |
| | | | | Total
value at
4-30-19 | | | Level 1
quoted
price | | | Level 2
significant
observable
inputs | | | Level 3
significant
unobservable
inputs | |
| | Investments in securities: | | | | | | | | | | | | | |
| | Assets | | | | | | | | | | | | | |
| | U.S. Government and Agency obligations | | | $6,574,565 | | | — | | | $6,574,565 | | | — | |
| | Foreign government obligations | | | 1,261,549 | | | — | | | 1,261,549 | | | — | |
| | Corporate bonds | | | 211,557,428 | | | — | | | 211,557,428 | | | — | |
| | Convertible bonds | | | 1,623,894 | | | — | | | 1,623,894 | | | — | |
| | Capital preferred securities | | | 745,553 | | | — | | | 745,553 | | | — | |
| | Term loans | | | 7,369,615 | | | — | | | 7,369,615 | | | — | |
| | Collateralized mortgage obligations | | | 1,485,506 | | | — | | | 1,485,506 | | | — | |
| | Asset backed securities | | | 938,932 | | | — | | | 938,932 | | | — | |
| | Common stocks | | | 1,717 | | | $1,717 | | | — | | | — | |
| | Preferred securities | | | 3,506,839 | | | 3,506,839 | | | — | | | — | |
| | Warrants | | | 56,073 | | | — | | | 56,073 | | | — | |
| | Short-term investments | | | 4,868,000 | | | — | | | 4,868,000 | | | — | |
| | Total investments in securities | | | $239,989,671 | | | $3,508,556 | | | $236,481,115 | | | — | |
| | Derivatives: | | | | | | | | | | | | | |
| | Assets | | | | | | | | | | | | | |
| | Forward foreign currency contracts | | | $3,382 | | | — | | | $3,382 | | | — | |
| | Liabilities | | | | | | | | | | | | | |
| | Forward foreign currency contracts | | | (153,886 | ) | | — | | | (153,886 | ) | | — | |
Repurchase agreements.The fund may enter into repurchase agreements. When a fund enters into a repurchase agreement, it receives collateral that is held in a segregated account by the fund's custodian, or for tri-party repurchase agreements, collateral is held at a third-party custodian bank in a segregated account for the benefit of the
SEMIANNUAL REPORT | JOHN HANCOCK INVESTORS TRUST 25
fund. The collateral amount is marked-to-market and monitored on a daily basis to ensure that the collateral held is in an amount not less than the principal amount of the repurchase agreement plus any accrued interest. Collateral received by the fund for repurchase agreements is disclosed in the Fund's investments as part of the caption related to the repurchase agreement.
Repurchase agreements are typically governed by the terms and conditions of the Master Repurchase Agreement and/or Global Master Repurchase Agreement (collectively, MRA). Upon an event of default, the non-defaulting party may close out all transactions traded under the MRA and net amounts owed. Absent an event of default, assets and liabilities resulting from repurchase agreements are not offset in the Statement of assets and liabilities. In the event of a default by the counterparty, realization of the collateral proceeds could be delayed, during which time the collateral value may decline or the counterparty may have insufficient assets to pay back claims resulting from close-out of the transactions.
Term loans (Floating rate loans).The fund may invest in term loans, which are debt securities and are often rated below investment grade at the time of purchase. Term loans are generally subject to legal or contractual restrictions on resale and generally have longer settlement periods than conventional debt securities. Term loans involve special types of risk, including credit risk, interest-rate risk, counterparty risk and risk associated with extended settlement. The liquidity of term loans, including the volume and frequency of secondary market trading in such loans, varies significantly over time and among individual loans. During periods of infrequent trading, valuing a term loan can be more difficult and buying and selling a term loan at an acceptable price can be more difficult and delayed, which could result in a loss.
The fund's ability to receive payments of principal, interest and other amounts in connection with term loans will depend primarily on the financial condition of the borrower. The fund's failure to receive scheduled payments on a term loan due to a default, bankruptcy or other reason would adversely affect the fund's income and would likely reduce the value of its assets. Transactions in loan investments typically take a significant amount of time (i.e., seven days or longer) to settle. This could pose a liquidity risk to the fund and, if the fund's exposure to such investments is substantial, could impair the fund's ability to meet redemptions. Because term loans may not be rated by independent credit rating agencies, a decision to invest in a particular loan could depend exclusively on the subadvisor's credit analysis of the borrower and/or term loan agents. There is greater risk that the fund may have limited rights to enforce the terms of an underlying loan than for other types of debt instruments.
Security transactions and related investment income. Investment security transactions are accounted for on a trade date plus one basis for daily NAV calculations. However, for financial reporting purposes, investment transactions are reported on trade date. Interest income is accrued as earned. Interest income includes coupon interest and amortization/accretion of premiums/discounts on debt securities. Debt obligations may be placed in a non-accrual status and related interest income may be reduced by stopping current accruals and writing off interest receivable when the collection of all or a portion of interest has become doubtful. Dividend income is recorded on the ex-date, except for dividends of foreign securities where the dividend may not be known until after the ex-date. In those cases, dividend income, net of withholding taxes, is recorded when the fund becomes aware of the dividends. Non-cash dividends, if any, are recorded at the fair market value of the securities received. Distributions received on securities that represent a tax return of capital or capital gain are recorded as a reduction of cost of investments and/or as a realized gain if amounts are estimable. Gains and losses on securities sold are determined on the basis of identified cost and may include proceeds from litigation.
Foreign investing.Assets, including investments, and liabilities denominated in foreign currencies are translated into U.S. dollar values each day at the prevailing exchange rate. Purchases and sales of securities, income and expenses are translated into U.S. dollars at the prevailing exchange rate on the date of the transaction. The effect of
SEMIANNUAL REPORT | JOHN HANCOCK INVESTORS TRUST 26
changes in foreign currency exchange rates on the value of securities is reflected as a component of the realized and unrealized gains (losses) on investments. Foreign investments are subject to a decline in the value of a foreign currency versus the U.S. dollar, which reduces the dollar value of securities denominated in that currency.
Funds that invest internationally generally carry more risk than funds that invest strictly in U.S. securities. These risks are heightened for investments in emerging markets. Risks can result from differences in economic and political conditions, regulations, market practices (including higher transaction costs), accounting standards and other factors.
Foreign taxes. The fund may be subject to withholding tax on income, capital gains or repatriation taxes imposed by certain countries, a portion of which may be recoverable. Foreign taxes are accrued based upon the fund's understanding of the tax rules and rates that exist in the foreign markets in which it invests. Taxes are accrued based on gains realized by the fund as a result of certain foreign security sales. In certain circumstances, estimated taxes are accrued based on unrealized appreciation of such securities. Investment income is recorded net of foreign withholding taxes.
Stripped securities.Stripped securities are financial instruments structured to separate principal and interest cash flows so that one class receives principal payments from the underlying assets (PO or principal only), while the other class receives the interest cash flows (IO or interest only). Both PO and IO investments represent an interest in the cash flows of an underlying stripped security. If the underlying assets experience greater than anticipated prepayments of principal, the fund may fail to fully recover its initial investment in an IO security. The market value of these securities can be extremely volatile in response to changes in interest rates or prepayments on the underlying securities. In addition, these securities also have the risk that the fund may not receive all or part of its principal or interest payments because the borrower or issuer has defaulted on its obligation.
Overdrafts.Pursuant to the custodian agreement, the fund's custodian may, in its discretion, advance funds to the fund to make properly authorized payments. When such payments result in an overdraft, the fund is obligated to repay the custodian for any overdraft, including any costs or expenses associated with the overdraft. The custodian may have a lien, security interest or security entitlement in any fund property that is not otherwise segregated or pledged, to the maximum extent permitted by law, to the extent of any overdraft.
Expenses. Within the John Hancock group of funds complex, expenses that are directly attributable to an individual fund are allocated to such fund. Expenses that are not readily attributable to a specific fund are allocated among all funds in an equitable manner, taking into consideration, among other things, the nature and type of expense and the fund's relative net assets. Expense estimates are accrued in the period to which they relate and adjustments are made when actual amounts are known.
Federal income taxes. The fund intends to continue to qualify as a regulated investment company by complying with the applicable provisions of the Internal Revenue Code and will not be subject to federal income tax on taxable income that is distributed to shareholders. Therefore, no federal income tax provision is required.
Under the Regulated Investment Company Modernization Act of 2010, the fund is permitted to carry forward capital losses incurred in taxable years beginning after December 22, 2010 for an unlimited period. Any losses incurred during those taxable years will be required to be utilized prior to the losses incurred in pre-enactment taxable years. As a result of this ordering rule, pre-enactment capital loss carryforwards may be more likely to expire unused. Additionally, post-enactment capital losses that are carried forward will retain their character as either short-term or long-term capital losses rather than being considered all short-term as under previous law.
SEMIANNUAL REPORT | JOHN HANCOCK INVESTORS TRUST 27
For federal income tax purposes, as of October 31, 2018, the fund has a capital loss carryforward of $14,374,463 available to offset future net realized capital gains. The following table details the capital loss carryforward available as of October 31, 2018:
| | | |
| Capital loss carryforward expiring October 31, | No expiration date |
| 2019 | Short term | Long term |
| $2,044,097 | $2,191,776 | $10,138,590 |
As of October 31, 2018, the fund had no uncertain tax positions that would require financial statement recognition, derecognition or disclosure. The fund's federal tax returns are subject to examination by the Internal Revenue Service for a period of three years.
Distribution of income and gains. Distributions to shareholders from net investment income and net realized gains, if any, are recorded on the ex-date. The fund generally declares and pays dividends quarterly and capital gain distributions, if any, annually.
Such distributions, on a tax basis, are determined in conformity with income tax regulations, which may differ from US GAAP. Distributions in excess of tax basis earnings and profits, if any, are reported in the fund's financial statements as a return of capital. The final determination of tax characteristics of the fund's distribution will occur at the end of the year and will subsequently be reported to shareholders.
Capital accounts within the financial statements are adjusted for permanent book-tax differences. These adjustments have no impact on net assets or the results of operations. Temporary book-tax differences, if any, will reverse in a subsequent period. Book-tax differences are primarily attributable to contingent payment debt instruments, foreign currency transactions, derivative transactions, and amortization and accretion on debt securities.
Statement of cash flows. A Statement of cash flows is presented when a fund has a significant amount of borrowing during the period, based on the average total borrowing in relation to total assets, or when a certain percentage of the fund's investments is classified as Level 3 in the fair value hierarchy. Information on financial transactions that have been settled through the receipt and disbursement of cash is presented in the Statement of cash flows. The cash amount shown in the Statement of cash flows is the amount included in the fund's Statement of assets and liabilities and represents the cash on hand at the fund's custodian and does not include any short-term investments or Collateral held at broker for futures contracts.
Note 3 — Derivative instruments
The fund may invest in derivatives in order to meet its investment objective. Derivatives include a variety of different instruments that may be traded in the over-the-counter (OTC) market, on a regulated exchange or through a clearing facility. The risks in using derivatives vary depending upon the structure of the instruments, including the use of leverage, optionality, the liquidity or lack of liquidity of the contract, the creditworthiness of the counterparty or clearing organization and the volatility of the position. Some derivatives involve risks that are potentially greater than the risks associated with investing directly in the referenced securities or other referenced underlying instrument. Specifically, the fund is exposed to the risk that the counterparty to an OTC derivatives contract will be unable or unwilling to make timely settlement payments or otherwise honor its obligations. OTC derivatives transactions typically can only be closed out with the other party to the transaction.
Forward foreign currency contracts are typically traded through the OTC market. Certain forwards are regulated by the Commodity Futures Trading Commission. Derivative counterparty risk is managed through an ongoing evaluation of the creditworthiness of all potential counterparties and, if applicable, designated clearing organizations. The fund attempts to reduce its exposure to counterparty risk for derivatives traded in the OTC market, whenever possible, by
SEMIANNUAL REPORT | JOHN HANCOCK INVESTORS TRUST 28
entering into an International Swaps and Derivatives Association (ISDA) Master Agreement with each of its OTC counterparties. The ISDA gives each party to the agreement the right to terminate all transactions traded under the agreement if there is certain deterioration in the credit quality or contractual default of the other party, as defined in the ISDA. Upon an event of default or a termination of the ISDA, the non-defaulting party has the right to close out all transactions and to net amounts owed.
Forward foreign currency contracts. A forward foreign currency contract is an agreement between two parties to buy and sell specific currencies at a price that is set on the date of the contract. The forward contract calls for delivery of the currencies on a future date that is specified in the contract. Risks related to the use of forwards include the possible failure of counterparties to meet the terms of the forward agreement, the failure of the counterparties to timely post collateral if applicable, the risk that currency movements will not favor the fund thereby reducing the fund's total return, and the potential for losses in excess of the amounts recognized on the Statement of assets and liabilities.
The market value of a forward foreign currency contract fluctuates with changes in foreign currency exchange rates. Forward foreign currency contracts are marked-to-market daily and the change in value is recorded by the fund as an unrealized gain or loss. Realized gains or losses, equal to the difference between the value of the contract at the time it was opened and the value at the time it was closed, are recorded upon delivery or receipt of the currency or settlement with the counterparty.
During thesix months ended April 30, 2019, the fund used forward foreign currency contracts to manage currency exposure. The fund held forward foreign currency contracts with U.S. Dollar notional values ranging from $6.0 million to $8.1 million as measured at each quarter end.
Fair value of derivative instruments by risk category
The table below summarizes the fair value of derivatives held by the fund at April 30, 2019 by risk category:
| | | | | | | | | | | | | | | | | | |
| | Risk | | | Statement of assets and
liabilities location | | | | | | Financial
instruments location | | | Assets derivatives
fair value | | | Liabilities derivatives
fair value | |
| | Foreign currency | | | Unrealized appreciation (depreciation) on forward foreign currency contracts | | | | | | Forward foreign currency contracts | | | $3,382 | | | ($153,886 | ) |
Effect of derivative instruments on the Statement of operations
The table below summarizes the net realized gain (loss) included in the net increase (decrease) in net assets from operations, classified by derivative instrument and risk category, for the six months ended April 30, 2019:
| | | | | | |
| | Statement of operations location - net realized gain (loss) on: | |
| | Risk | | | Forward foreign
currency contracts | |
| | Foreign currency | | | ($230,701 | ) |
SEMIANNUAL REPORT | JOHN HANCOCK INVESTORS TRUST 29
The table below summarizes the net change in unrealized appreciation (depreciation) included in the net increase (decrease) in net assets from operations, classified by derivative instrument and risk category, for the six months ended April 30, 2019:
| | | | | | |
| | Statement of operations location - change in net unrealized appreciation (depreciation) of: | |
| | Risk | | | Forward foreign
currency contracts | |
| | Foreign currency | | | ($330,073 | ) |
Note 4 — Guarantees and indemnifications
Under the fund's organizational documents, its Officers and Trustees are indemnified against certain liabilities arising out of the performance of their duties to the fund. Additionally, in the normal course of business, the fund enters into contracts with service providers that contain general indemnification clauses. The fund's maximum exposure under these arrangements is unknown, as this would involve future claims that may be made against the fund that have not yet occurred. The risk of material loss from such claims is considered remote.
Note 5 — Fees and transactions with affiliates
John Hancock Advisers, LLC (the Advisor) serves as investment advisor for the fund. John Hancock Funds, LLC (the Distributor), an affiliate of the Advisor, serves as distributor for the common shares offered through the equity shelf offering. The Advisor is an indirect, wholly owned subsidiary of Manulife Financial Corporation (MFC).
Management fee. The fund has an investment management agreement with the Advisor under which the fund pays a daily management fee to the Advisor, equivalent on an annual basis, to the sum of (a) 0.650% of the first $150 million of the fund's average daily managed assets (net assets plus borrowings under the Liquidity Agreement (see Note 8), (b) 0.375% of the next $50 million of the fund's average daily managed assets, (c) 0.350% of the next $100 million of the fund's average daily managed assets and (d) 0.300% of the fund's average daily managed assets in excess of $300 million. The Advisor has a subadvisory agreement with Manulife Investment Management (US), LLC, an indirectly owned subsidiary of MFC and an affiliate of the Advisor. The fund is not responsible for payment of the subadvisory fees. Prior to May 7, 2019, Manulife Investment Management (US) LLC was known as John Hancock Asset Management, a division of Manulife Asset Management (US) LLC.
The Advisor has contractually agreed to waive a portion of its management fee and/or reimburse expenses for certain funds of the John Hancock group of funds complex, including the fund (the participating portfolios). This waiver is based upon aggregate net assets of all the participating portfolios. The amount of the reimbursement is calculated daily and allocated among all the participating portfolios in proportion to the daily net assets of each fund. During the six months ended April 30, 2019, this waiver amounted to 0.01% of the fund's average daily managed assets (on annualized basis). This agreement expires on June 30, 2020, unless renewed by mutual agreement of the Fund and the Advisor based upon a determination that this is appropriate under the circumstances at that time.
The expense reductions described above amounted to $8,545 for the six months ended April 30, 2019.
The investment management fees, including the impact of the waivers and reimbursements as described above, incurred for the six months ended April 30, 2019 were equivalent to a net annual effective rate of 0.54% of the fund's average daily managed assets.
Accounting and legal services. Pursuant to a service agreement, the fund reimburses the Advisor for all expenses associated with providing the administrative, financial, legal, compliance, accounting and recordkeeping services to the fund, including the preparation of all tax returns, periodic reports to shareholders and regulatory reports, among
SEMIANNUAL REPORT | JOHN HANCOCK INVESTORS TRUST 30
other services. These accounting and legal services fees incurred for the six months ended April 30, 2019 amounted to an annual rate of 0.02% of the fund's average daily managed assets.
Distributor.The fund will compensate the Distributor with respect to sales of the common shares offered through the equity shelf offering at a commission rate of 1.00% of the gross proceeds of the sale of common shares, a portion of which is allocated to the selling dealers. During the six months ended April 30, 2019 and the year ended October 31, 2018, there was no compensation paid to the Distributor. The Distributor has an agreement with a sub-placement agent in the sale of common shares. The fund is not responsible for payment of commissions to the sub placement agent.
Trustee expenses.The fund compensates each Trustee who is not an employee of the Advisor or its affiliates. These Trustees receive from the fund and the other John Hancock closed-end funds an annual retainer. In addition, compensation and expenses are allocated to the fund based on its net assets relative to other funds within the John Hancock group of funds complex.
Note 6 — Fund share transactions
On December 10, 2015, the Board of Trustees approved a share repurchase plan, which is subsequently reviewed and approved by the Board of Trustees each year in December 2018. Under the current share repurchase plan, the fund may purchase in the open market, up to 10% of its outstanding common shares as of December 31, 2018. The current share repurchase plan will remain in effect between January 1, 2019 to December 31, 2019.
During the six months ended April 30, 2019 and the year ended October 31, 2018, the fund had no activities under the repurchase program.Shares repurchased and corresponding dollar amounts are included on the Statements of changes in net assets. The anti-dilutive impact of these share repurchases is included in the Financial highlights. Transactions in common shares for the six months ended April 30, 2019 and year ended October 31, 2018 are presented in the statements of changes in net assets. Proceeds received in connection with the shelf offering are net of commissions and offering costs. Total Offering costs of $248,706 have been prepaid by the fund. As of April 30, 2019, $44,629 has been deducted from proceeds of shares issued and the remaining $204,077 is included in Other receivables and prepaid expenses on the Statement of assets and liabilities.
Note 7 — Leverage risk
The fund utilizes a Liquidity Agreement to increase its assets available for investment. When the fund leverages its assets, shareholders bear the expenses associated with the Liquidity Agreement and have potential to benefit or be disadvantaged from the use of leverage. The Advisor's fee is also increased in dollar terms from the use of leverage. Consequently, the fund and the Advisor may have differing interests in determining whether to leverage the fund's assets. Leverage creates risks that may adversely affect the return for the holders of shares, including:
| • | the likelihood of greater volatility of NAV and market price of shares; |
| • | fluctuations in the interest rate paid for the use of the Liquidity Agreement; |
| • | increased operating costs, which may reduce the fund's total return; |
| • | the potential for a decline in the value of an investment acquired through leverage, while the fund's obligations under such leverage remains fixed; and |
| • | the fund is more likely to have to sell securities in a volatile market in order to meet asset coverage or other debt compliance requirements. |
To the extent the income or capital appreciation derived from securities purchased with funds received from leverage exceeds the cost of leverage, the fund's return will be greater than if leverage had not been used; conversely, returns would be lower if the cost of the leverage exceeds the income or capital appreciation derived. The use of securities
SEMIANNUAL REPORT | JOHN HANCOCK INVESTORS TRUST 31
lending to obtain leverage in the fund's investments may subject the fund to greater risk of loss than would reinvestment of collateral in short-term highly rated investments.
In addition to the risks created by the fund's use of leverage, the fund is subject to the risk that it would be unable to timely, or at all, obtain replacement financing if the Liquidity Agreement is terminated. Were this to happen, the fund would be required to de-leverage, selling securities at a potentially inopportune time and incurring tax consequences. Further, the fund's ability to generate income from the use of leverage would be adversely affected.
Note 8 — Liquidity agreement
The fund has entered into a Liquidity Agreement (LA) with State Street Bank and Trust Company (SSB) that allows it to borrow or otherwise access up to $86.9 million (maximum facility amount) through a line of credit, securities lending and reverse repurchase agreements. The amounts outstanding at April 30, 2019 are shown in the Statement of assets and liabilities as the Liquidity agreement.
The fund pledges its assets as collateral to secure obligations under the LA. The fund retains the risks and rewards of the ownership of assets pledged to secure obligations under the LA and makes these assets available for securities lending and reverse repurchase transactions with SSB acting as the fund's authorized agent for these transactions. All transactions initiated through SSB are required to be secured with cash collateral received from the securities borrower (the Borrower) or cash is received from the reverse repurchase agreement (Reverse Repo) counterparties. Securities lending transactions will be secured with cash collateral in amounts at least equal to 100% of the market value of the securities utilized in these transactions. Cash received by SSB from securities lending or Reverse Repo transactions is credited against the amounts borrowed under the line of credit.
Upon return of securities by the Borrower or Reverse Repo counterparty, SSB will return the cash collateral to the Borrower or proceeds from the Reverse Repo, as applicable, which will eliminate the credit against the line of credit and will cause the drawdowns under the line of credit to increase by the amounts returned. Income earned on the loaned securities is retained by SSB, and any interest due on the reverse repurchase agreements is paid by SSB.
SSB has indemnified the fund for certain losses that may arise if the Borrower or a Reverse Repo Counterparty fails to return securities when due. With respect to securities lending transactions, upon a default of the securities borrower, SSB uses the collateral received from the Borrower to purchase replacement securities of the same issue, type, class and series. If the value of the collateral is less than the purchase cost of replacement securities, SSB is responsible for satisfying the shortfall but only to the extent that the shortfall is not due to any of the fund's losses on the reinvested cash collateral. Although the risk of the loss of the securities is mitigated by receiving collateral from the Borrower or proceeds from the Reverse Repo counterparty and through SSB indemnification, the fund could experience a delay in recovering securities or could experience a lower than expected return if the Borrower or Reverse Repo counterparty fails to return the securities on a timely basis.
Under normal circumstances, interest charged is at the rate of one month LIBOR (London Interbank Offered Rate) plus 0.60%, is payable monthly on the aggregate balance of the drawdowns outstanding under the LA. As of April 30, 2019, the fund had an aggregate balance of $86,900,000 at an interest rate of 3.08%, which is reflected in the Liquidity agreement on the Statement of assets and liabilities. During the six months ended April 30, 2019, the average balance of the LA and the effective average interest rate were $86,900,000 and 3.10%, respectively.
After the six month anniversary of the effective date of the agreement, the fund may terminate the LA with 60 days' notice. If certain asset coverage and collateral requirements, or other covenants are not met, the LA could be deemed in default and result in termination. Absent a default or facility termination event, SSB is required to provide the fund with 360 days' notice prior to terminating the LA.
SEMIANNUAL REPORT | JOHN HANCOCK INVESTORS TRUST 32
Note 9 — Purchase and sale of securities
Purchases and sales of securities, other than short-term securities, amounted to $41,084,780 and $43,045,365, respectively, for the six months ended April 30, 2019.
Note 10 — Industry or sector risk
The fund may invest a large percentage of its assets in one or more particular industries or sectors of the economy. If a large percentage of the fund's assets are economically tied to a single or small number of industries or sectors of the economy, the fund will be less diversified than a more broadly diversified fund, and it may cause the fund to underperform if that industry or sector underperforms. In addition, focusing on a particular industry or sector may make the fund's NAV more volatile. Further, a fund that invests in particular industries or sectors is particularly susceptible to the impact of market, economic, regulatory and other factors affecting those industries or sectors.
Note 11 — New accounting pronouncement
In March 2017, the Financial Accounting Standards Board issued Accounting Standards Update (ASU) 2017-08, Premium Amortization on Purchased Callable Debt Securities, which shortens the premium amortization period for purchased non-contingently callable debt securities. The standard is effective for annual periods beginning after December 15, 2018 and interim periods within those fiscal years. Management does not expect the ASU to have an impact on the fund's net assets or total return. Depending upon holdings of the fund, the shortening of the premium amortization period could decrease interest income with a corresponding offset to unrealized gain (loss).
SEMIANNUAL REPORT | JOHN HANCOCK INVESTORS TRUST 33
ADDITIONAL INFORMATION
Unaudited
Investment objective and policy
The fund is a diversified, closed-end, management investment company, common shares of which were initially offered to the public in January 1971. The fund's primary investment objective is to generate income for distribution to its shareholders, with capital appreciation as a secondary objective. The preponderance of the fund's assets are invested in a diversified portfolio of debt securities issued by U.S. and non-U.S. corporations and governments, some of which may carry equity features. Up to 50% of the value of the fund's assets may be invested in restricted securities acquired through private placements. The fund may also invest in repurchase agreements. The fund utilizes a credit facility agreement to increase its assets available for investments.
Dividends and distributions
During the six months ended April 30, 2019, distributions from net investment income totaling $0.5625 per share were paid to shareholders. The dates of payments and the amounts per share were as follows:
| | |
| Payment Date | Income Distributions |
| December 31, 2018 | $0.3167 |
| March 29, 2019 | 0.2458 |
| Total | $0.5625 |
SEMIANNUAL REPORT | JOHN HANCOCK INVESTORS TRUST 34
Shareholder meeting
The fund held its Annual Meeting of Shareholders on Thursday, February 7, 2019. The following proposal was considered by the shareholders:
Proposal:To elect thirteen (13) Trustees to serve until their respective successors have been duly elected and qualified.
| | | |
| | Total votes
for the nominee | Total votes withheld
from the nominee |
| Independent Trustees | | |
| Charles L. Bardelis | 6,335,185.604 | 278,254.812 |
| James R. Boyle | 6,324,616.508 | 288,823.908 |
| Peter S. Burgess | 6,312,376.929 | 301,063.487 |
| William H. Cunningham | 6,193,151.563 | 420,288.853 |
| Grace K. Fey | 6,356,105.647 | 257,334.769 |
| Theron S. Hoffman | 6,362,252.929 | 251,187.487 |
| Deborah C. Jackson | 6,357,461.592 | 255,978.824 |
| Hassell H. McClellan | 6,360,397.563 | 253,042.853 |
| James M. Oates | 6,364,911.604 | 248,528.812 |
| Steven R. Pruchansky | 6,196,510.563 | 416,929.853 |
| Gregory A. Russo | 6,212,659.874 | 400,780.542 |
| Non-Independent Trustee | | |
| Andrew G. Arnott | 6,300,773.833 | 312,666.583 |
| Marianne Harrison | 6,295,988.592 | 317,451.824 |
SEMIANNUAL REPORT | JOHN HANCOCK INVESTORS TRUST 35
| | |
Trustees
Hassell H. McClellan,Chairperson
Steven R. Pruchansky,Vice Chairperson
Andrew G. Arnott†
Charles L. Bardelis*
James R. Boyle
Peter S. Burgess*
William H. Cunningham
Grace K. Fey
Marianne Harrison†#
Theron S. Hoffman*
Deborah C. Jackson
James M. Oates
Gregory A. Russo
Officers
Andrew G. Arnott
President
Francis V. Knox, Jr.
Chief Compliance Officer
Charles A. Rizzo
Chief Financial Officer
Salvatore Schiavone
Treasurer
Christopher (Kit) Sechler**
Secretary and Chief Legal Officer
| Investment advisor
John Hancock Advisers, LLC
Subadvisor
Manulife Investment Management (US) LLC
Portfolio Managers
John F. Addeo, CFA
Jeffrey N. Given, CFA
Dennis F. McCafferty, CFA
Distributor
John Hancock Funds, LLC
Custodian
State Street Bank and Trust Company
Transfer agent
Computershare Shareowner Services, LLC
Legal counsel
K&L Gates LLP
Stock symbol
Listed New York Stock Exchange: JHI
|
* Member of the Audit Committee
† Non-Independent Trustee
# Effective 6-19-18
** Effective 9-13-18
The fund's proxy voting policies and procedures, as well as the fund's proxy voting record for the most recent twelve-month period ended June 30, are available free of charge on the Securities and Exchange Commission (SEC) website at sec.gov or on our website.
All of the fund's holdings as of the end of the third month of every fiscal quarter are filed with the SEC on Form N-PORT within 60 days of the end of the fiscal quarter. The fund's Form N-PORT filings are available on our website and the SEC's website, sec.gov.
We make this information on your fund, as well asmonthly portfolio holdings, and other fund details available on our website at jhinvestments.com or by calling 800-852-0218.
The report is certified under the Sarbanes-Oxley Act, which requires closed-end funds and other public companies to affirm that, to the best of their knowledge, the information in their financial reports is fairly and accurately stated in all material respects.| | | | |
| | You can also contact us: |
| | 800-852-0218
jhinvestments.com | Regular mail:
Computershare
P.O. Box 505000
Louisville, KY 40233
| Express mail:
Computershare
462 South 4th Street, Suite 1600
Louisville, KY 40202
|
SEMIANNUAL REPORT | JOHN HANCOCK INVESTORS TRUST 36
John Hancock family of funds
| | | |
DOMESTIC EQUITY FUNDS
Blue Chip Growth
Classic Value
Disciplined Value
Disciplined Value Mid Cap
Equity Income
Financial Industries
Fundamental All Cap Core
Fundamental Large Cap Core
Fundamental Large Cap Value
New Opportunities
Regional Bank
Small Cap Core
Small Cap Growth
Small Cap Value
U.S. Global Leaders Growth
U.S. Quality Growth
Value Equity
GLOBAL AND INTERNATIONAL EQUITY FUNDS
Disciplined Value International
Emerging Markets
Emerging Markets Equity
Fundamental Global Franchise
Global Equity
Global Shareholder Yield
Global Thematic Opportunities
International Dynamic Growth
International Growth
International Small Company
| | INCOME FUNDS
Bond
California Tax-Free Income
Emerging Markets Debt
Floating Rate Income
Government Income
High Yield
High Yield Municipal Bond
Income
Investment Grade Bond
Money Market
Short Duration Credit Opportunities
Spectrum Income
Strategic Income Opportunities
Tax-Free Bond
ALTERNATIVE AND SPECIALTY FUNDS
Absolute Return Currency
Alternative Asset Allocation
Disciplined Alternative Yield
Global Absolute Return Strategies
Infrastructure
Seaport Long/Short
|
The fund's investment objectives, risks, charges, and expenses are included in the prospectus and should be considered carefully before investing. For a prospectus, contact your financial professional, call John Hancock Investments at 800-852-0218, or visit the fund's website at jhinvestments.com. Please read the prospectus carefully before investing or sending money.
| | | |
ASSET ALLOCATION
Balanced
Income Allocation
Multi-Index Lifetime Portfolios
Multi-Index Preservation Portfolios
Multimanager Lifestyle Portfolios
Multimanager Lifetime Portfolios
Retirement Income 2040
EXCHANGE-TRADED FUNDS
John Hancock Multifactor Consumer Discretionary ETF
John Hancock Multifactor Consumer Staples ETF
John Hancock Multifactor Developed International ETF
John Hancock Multifactor Emerging Markets ETF
John Hancock Multifactor Energy ETF
John Hancock Multifactor Financials ETF
John Hancock Multifactor Healthcare ETF
John Hancock Multifactor Industrials ETF
John Hancock Multifactor Large Cap ETF
John Hancock Multifactor Materials ETF
John Hancock Multifactor Media and
Communications ETF
John Hancock Multifactor Mid Cap ETF
John Hancock Multifactor Small Cap ETF
John Hancock Multifactor Technology ETF
John Hancock Multifactor Utilities ETF
| | ENVIRONMENTAL, SOCIAL, AND
GOVERNANCE FUNDS
ESG All Cap Core
ESG Core Bond
ESG International Equity
ESG Large Cap Core
CLOSED-END FUNDS
Financial Opportunities
Hedged Equity & Income
Income Securities Trust
Investors Trust
Preferred Income
Preferred Income II
Preferred Income III
Premium Dividend
Tax-Advantaged Dividend Income
Tax-Advantaged Global Shareholder Yield
|
John Hancock Multifactor ETF shares are bought and sold at market price (not NAV), and are not individually redeemed
from the fund. Brokerage commissions will reduce returns.
John Hancock ETFs are distributed by Foreside Fund Services, LLC, and are subadvised by Dimensional Fund Advisors LP.
Foreside is not affiliated with John Hancock Funds, LLC or Dimensional Fund Advisors LP.
Dimensional Fund Advisors LP receives compensation from John Hancock in connection with licensing rights to the
John Hancock Dimensional indexes. Dimensional Fund Advisors LP does not sponsor, endorse, or sell, and makes no
representation as to the advisability of investing in, John Hancock Multifactor ETFs.
John Hancock Investment Management
A trusted brand
John Hancock Investment Management is a premier asset manager
representing one of America's most trusted brands, with a heritage of
financial stewardship dating back to 1862. Helping our shareholders
pursue their financial goals is at the core of everything we do. It's why
we support the role of professional financial advice and operate with
the highest standards of conduct and integrity.
A better way to invest
We serve investors globally through a unique multimanager approach:
We search the world to find proven portfolio teams with specialized
expertise for every strategy we offer, then we apply robust investment
oversight to ensure they continue to meet our uncompromising
standards and serve the best interests of our shareholders.
Results for investors
Our unique approach to asset management enables us to provide
a diverse set of investments backed by some of the world's best
managers, along with strong risk-adjusted returns across asset classes.
John Hancock Advisers, LLC
200 Berkeley Street n Boston, MA 02116-5010 n 800-852-0218 n jhinvestments.com
ITEM 2. CODE OF ETHICS.
Not applicable.
ITEM 3. AUDIT COMMITTEE FINANCIAL EXPERT.
Not applicable at this time.
ITEM 4. PRINCIPAL ACCOUNTANT FEES AND SERVICES.
Not applicable at this time.
ITEM 5. AUDIT COMMITTEE OF LISTED REGISTRANTS.
Not applicable at this time.
ITEM 6. SCHEDULE OF INVESTMENTS.
(a) Not applicable.
(b) Not applicable.
ITEM 7. DISCLOSURE OF PROXY VOTING POLICIES AND PROCEDURES FOR CLOSED-END MANAGEMENT INVESTMENT COMPANIES.
Not applicable.
ITEM 8. PORTFOLIO MANAGERS OF CLOSED-END MANAGEMENT INVESTMENT COMPANIES.
Not applicable.
ITEM 9. PURCHASES OF EQUITY SECURITIES BY CLOSED-END MANAGEMENT INVESTMENT COMPANY AND AFFILIATED PURCHASERS.
| | | Total number of | Maximum number of |
| | | shares purchased | shares that may yet |
| Total number of | Average price per | as part of publicly | be purchased under |
| Period | shares purchased | share | announced plans* | the plans |
| Nov-18 | - | - | - | 870,703 |
| Dec-18 | - | - | - | 870,703 |
| Jan-19 | - | - | - | 870,703* |
| Feb-19 | - | - | - | 870,703 |
| Mar-19 | - | - | - | 870,703 |
| Apr-19 | - | - | - | 870,703 |
| Total | - | - | | |
| | | | | |
* On December 10, 2015, the Board of Trustees approved a share repurchase plan, which has been subsequently reviewed and approved by the Board of Trustees. Under the current share repurchase plan, the Fund may purchase in the open market, up to 10% of its outstanding common shares as of December 31, 2018. The current share plan will remain in effect between January 1, 2019 and December 31, 2019. |
ITEM 10. SUBMISSION OF MATTERS TO A VOTE OF SECURITY HOLDERS.
The registrant has adopted procedures by which shareholders may recommend nominees to the registrant’s Board of Trustees. A copy of the procedures is filed as an exhibit to this Form N-CSR. See attached “John Hancock Funds – Nominating, Governance and Administration Committee Charter.”
ITEM 11. CONTROLS AND PROCEDURES.
(a) Based upon their evaluation of the registrant's disclosure controls and procedures as conducted within 90 days of the filing date of this Form N-CSR, the registrant's principal executive officer and principal financial officer have concluded that those disclosure controls and procedures provide reasonable assurance that the material information required to be disclosed by the registrant on this report is recorded, processed, summarized and reported within the time periods specified in the Securities and Exchange Commission's rules and forms.
(b) There were no changes in the registrant's internal control over financial reporting that occurred during the second fiscal quarter of the period covered by this report that have materially affected, or are reasonably likely to materially affect, the registrant's internal control over financial reporting.
ITEM 12. DISCLOSURE OF SECURITIES LENDING ACTIVITIES FOR CLOSED-END MANAGEMENT INVESTMENT COMPANIES.
The Fund did not participate directly in securities lending activities. See Note 8 to financial statements in Item 1.
ITEM 13. EXHIBITS.
(a) Separate certifications for the registrant's principal executive officer and principal financial officer, as required by Section 302 of the Sarbanes-Oxley Act of 2002 and Rule 30a-2(a) under the Investment Company Act of 1940, are attached.
(b)(1) Separate certifications for the registrant's principal executive officer and principal financial officer, as required by 18 U.S.C. Section 1350, as adopted pursuant to Section 906 of the Sarbanes-Oxley Act of 2002, and Rule 30a-2(b) under the Investment Company Act of 1940, are attached. The certifications furnished pursuant to this paragraph are not deemed to be "filed" for purposes of Section 18 of the Securities Exchange Act of 1934, or otherwise subject to the liability of that section. Such certifications are not deemed to be incorporated by reference into any filing under the Securities Act of 1933 or the Securities Exchange Act of 1934, except to the extent that the Registrant specifically incorporates them by reference.
(c)(1) Submission of Matters to a Vote of Security Holders is attached. See attached “John Hancock Funds – Nominating, Governance and Administration Committee Charter.”
SIGNATURES
Pursuant to the requirements of the Securities Exchange Act of 1934 and the Investment Company Act of 1940, the registrant has duly caused this report to be signed on its behalf by the undersigned, thereunto duly authorized.
John Hancock Investors Trust
| By: | /s/ Andrew Arnott |
| Andrew Arnott |
| President |
| |
| Date: | June 21, 2019 |
Pursuant to the requirements of the Securities Exchange Act of 1934 and the Investment Company Act of 1940, this report has been signed below by the following persons on behalf of the registrant and in the capacities and on the dates indicated.
| By: | /s/ Andrew Arnott |
| Andrew Arnott |
| President |
| |
| Date: | June 21, 2019 |
| | |
| By: | /s/ Charles A. Rizzo |
| Charles A. Rizzo |
| Chief Financial Officer |
| |
| Date: | June 21, 2019 |
| | |