 Credit Suisse 2015 Financial Services Forum February 10, 2015 Bruce Van Saun Chairman and Chief Executive Officer Exhibit 99.1 |
 Forward-looking statements and Non-GAAP financial measures Forward-Looking Statements This document contains forward-looking statements within the Private Securities Litigation Reform Act of 1995. Any statement that does not describe historical or current facts is a forward-looking statement. These statements often include the words “believes,” “expects,” “anticipates,” “estimates,” “intends,” “plans,” “goals,” “targets,” “initiatives,” “potentially,” “probably,” “projects,” “outlook” or similar expressions or future conditional verbs such as “may,” “will,” “should,” “would,” and “could.” Forward-looking statements are based upon the current beliefs and expectations of management and on information currently available to management. Our statements speak as of the date hereof, and we do not assume any obligation to update these statements or to update the reasons why actual results could differ from those contained in such statements in light of new information or future events. We caution you, therefore, against relying on any of these forward-looking statements. They are neither statements of historical fact nor guarantees or assurances of future performance. While there is no assurance that any list of risks and uncertainties or risk factors is complete, important factors that could cause actual results to differ materially from those in the forward-looking statements include the following, without limitation: negative economic conditions that adversely affect the general economy, housing prices, the job market, consumer confidence and spending habits which may affect, among other things, the level of nonperforming assets, charge-offs and provision expense; the rate of growth in the economy and employment levels, as well as general business and economic conditions; our ability to implement our strategic plan, including the cost savings and efficiency components, and achieve our indicative performance targets; our ability to remedy regulatory deficiencies and meet supervisory requirements and expectations; liabilities resulting from litigation and regulatory investigations; our capital and liquidity requirements (including under regulatory capital standards, such as the Basel III capital standards) and our ability to generate capital internally or raise capital on favorable terms; the effect of the current low interest rate environment or changes in interest rates on our net interest income, net interest margin and our mortgage originations, mortgage servicing rights and mortgages held for sale; changes in interest rates and market liquidity, as well as the magnitude of such changes, which may reduce interest margins, impact funding sources and affect the ability to originate and distribute financial products in the primary and secondary markets; the effect of changes in the level of checking or savings account deposits on our funding costs and net interest margin; financial services reform and other current, pending or future legislation or regulation that could have a negative effect on our revenue and businesses, including the Dodd-Frank Act and other legislation and regulation relating to bank products and services; a failure in or breach of our operational or security systems or infrastructure, or those of our third party vendors or other service providers, including as a result of cyber attacks; management’s ability to identify and manage these and other risks; and any failure by us to successfully replicate or replace certain functions, systems and infrastructure provided by The Royal Bank of Scotland Group plc (“RBS”) In addition to the above factors, we also caution that the amount and timing of any future common stock dividends or share repurchases will depend on our financial condition, earnings, cash needs, regulatory constraints, capital requirements (including requirements of our subsidiaries), and any other factors that our Board of Directors deems relevant in making such a determination. Therefore, there can be no assurance that we will pay any dividends to holders of our common stock, or as to the amount of any such dividends. In addition, the timing and manner of the sale of RBS's remaining ownership of our common stock remains uncertain, and we have no control over the manner in which RBS may seek to divest such remaining shares. Any such sale would impact the price of our shares of common stock. More information about factors that could cause actual results to differ materially from those described in the forward-looking statements can be found under “Risk Factors” in our Registration Statement on Form S-1 filed with the United States Securities and Exchange Commission and declared effective on September 23, 2014. Non-GAAP Financial Measures This document contains non-GAAP financial measures such as, “return on average tangible common equity”, “return on average total tangible assets” and “efficiency ratio”. These non-GAAP measures exclude goodwill impairment, restructuring charges and special items, which are usually included, where applicable, in the financial results presented in accordance with GAAP. Special items include regulatory expenses, expenses relating to our initial public offering, and other expenses or income. All references to “Adjusted” results are non-GAAP financial measures. These measures exclude restructuring charges and special items. We believe these non-GAAP measures provide useful information to investors because these are among the measures used by our management team to evaluate our operating performance and make day-to-day operating decisions. In addition, we believe goodwill impairment, restructuring charges and special items in any period do not reflect the operational performance of the business in that period and, accordingly, it is useful to consider these line items with and without goodwill impairment, restructuring charges and special items. We believe this presentation also increases comparability of period-to-period results. Other companies may use similarly titled non-GAAP financial measures that are calculated differently from the way we calculate such measures. Accordingly, our non-GAAP financial measures may not be comparable to similar measures used by other companies. We caution investors not to place undue reliance on such non-GAAP measures, but instead to consider them with the most directly comparable GAAP measure. Non-GAAP financial measures have limitations as analytical tools, and should not be considered in isolation, or as a substitute for our results as reported under GAAP. A reconciliation of non-GAAP measures to the most comparable financial measure prepared in accordance with GAAP is included in the Appendix hereto. 1 |
 2 Citizens: Building a top-performing regional bank HOW Charting a clear course … delivering for our stakeholders |
 What Where When 3 Citizens: Building a top-performing regional bank How Who Citizens went public on September 24, 2014 70.5% owned by RBS with plan for full divesture by YE 2016 Who are we? |
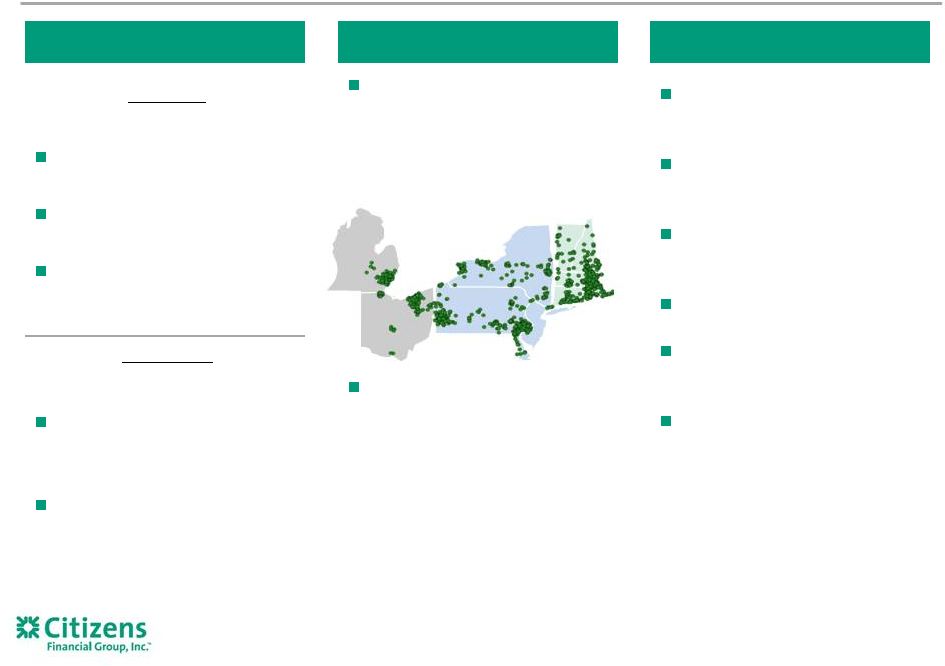
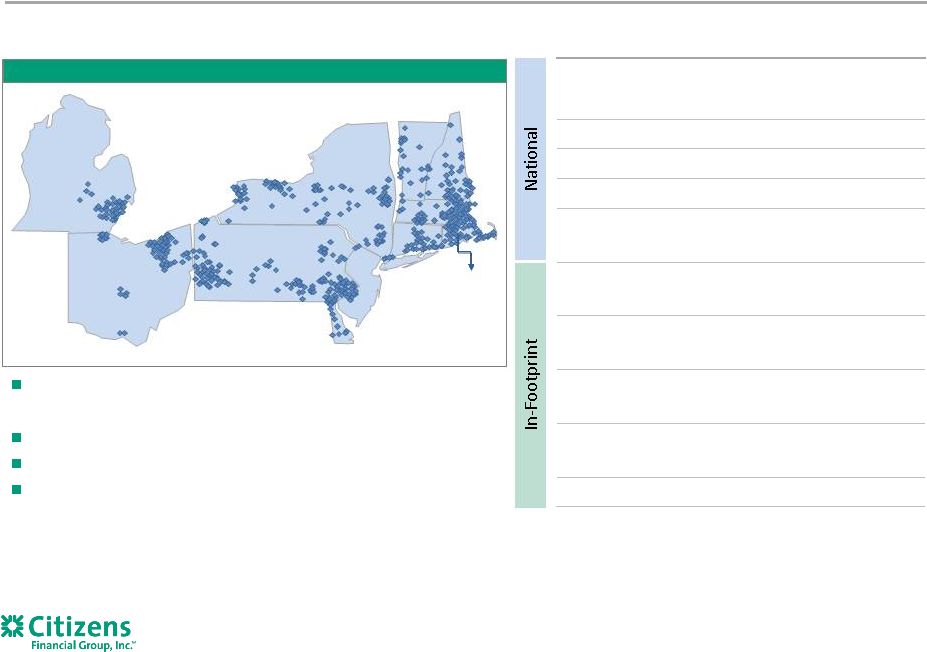 Dimension (2) Rank (3) Assets - $132.9 billion #13 Loans - $93.4 billion #13 Deposits - $95.7 billion #14 Branches - ~1,200 #11 ATM network - ~3,200 #7 Lead/joint lead bookrunner #8 (4) Deposits - $95.7 billion Top 5 rank: 9/10 markets (1) HELOC - $16.0 billion Top 5 rank: 8/9 markets (5) Auto - $12.7 billion Top 5 rank: 3/9 markets (6) Mortgage – $11.8 billion Top 5 rank: 1/9 markets (7) Middle-market lending #5 (8) Source: SNL Financial, unless otherwise noted. 1. As of 6/30/2014, excludes non-retail branches and banks with limited retail operations. 2. As of 12/31/2014, unless otherwise noted 3. As of 9/30/2014, unless otherwise noted; excludes non-retail depository institutions, includes U.S. subsidiaries of foreign banks. 4. Thomson Reuters LPC, 2014 data based on number of deals for Overall Middle Market (defined as Borrower Revenues < $500MM and Deal Size < $500MM). 5. According to Equifax; origination volume as of 3Q14. 6. According to Autocount; origination volume as of 3Q14. 7. According to Equifax; origination volume as of 2Q14. 8. Based on market penetration, according to Greenwich Associates 3Q14 rolling four-quarter data. Leading deposit market share of 9.1% in top 10 MSAs (1) – #2 deposit market share in New England Relatively diverse economies/affluent demographics Serve 5 million+ individuals, institutions and companies ~17,700 colleagues Solid franchise with leading positions in attractive markets Retail presence in 11 states Top 5 deposit market share in 9 of 10 largest MSAs (1) Buffalo, NY: #4 Albany, NY: #2 Pittsburgh, PA: #2 Cleveland, OH: #4 Manchester, NH: #1 Boston, MA: #2 Rochester, NY: #4 Philadelphia, PA: #5 Detroit, MI: #8 Providence, RI: #1 4 |
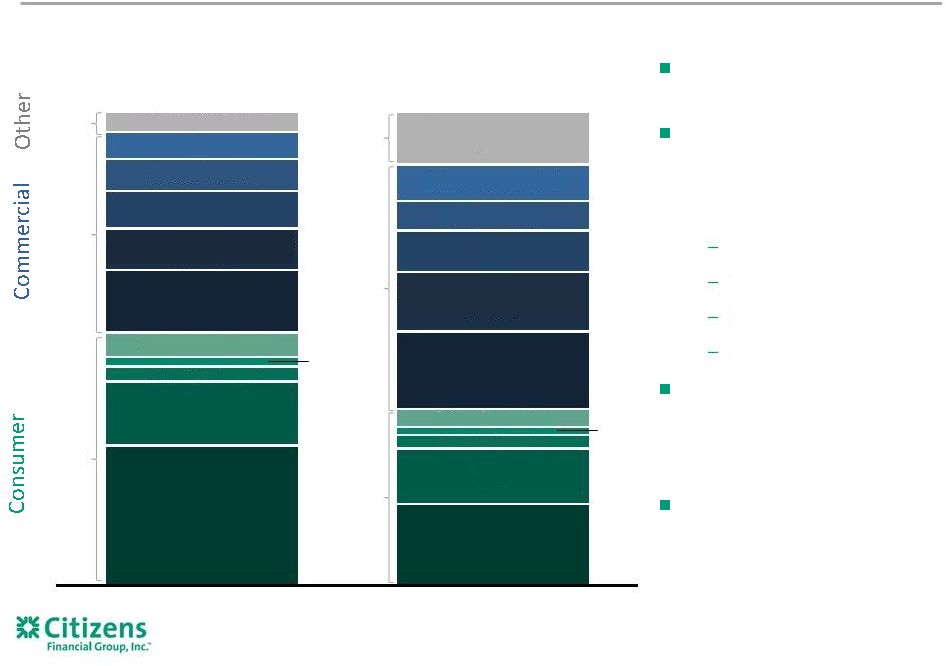
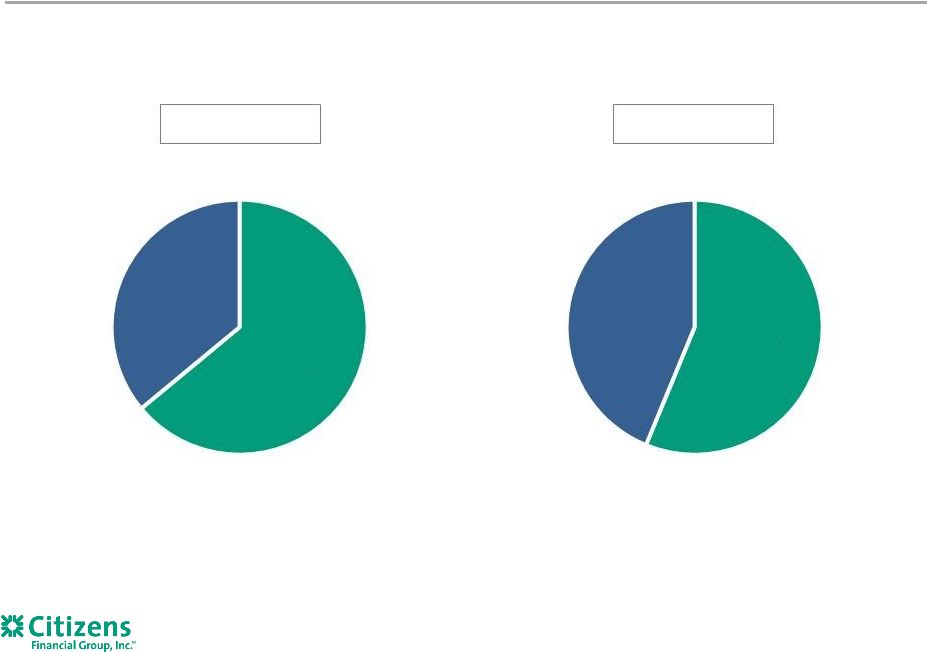 Balanced business mix 5 Period-end loans and leases (1) $74B 2009 Consumer Commercial $90B 2014 Consumer Commercial 1. Reflects loans in our operating segments (Consumer Banking and Commercial Banking). Excludes Other segment, which includes Non-core loans. Includes loans held for sale. Targeting 50/50 mix over time 64% 36% 56% 44% |
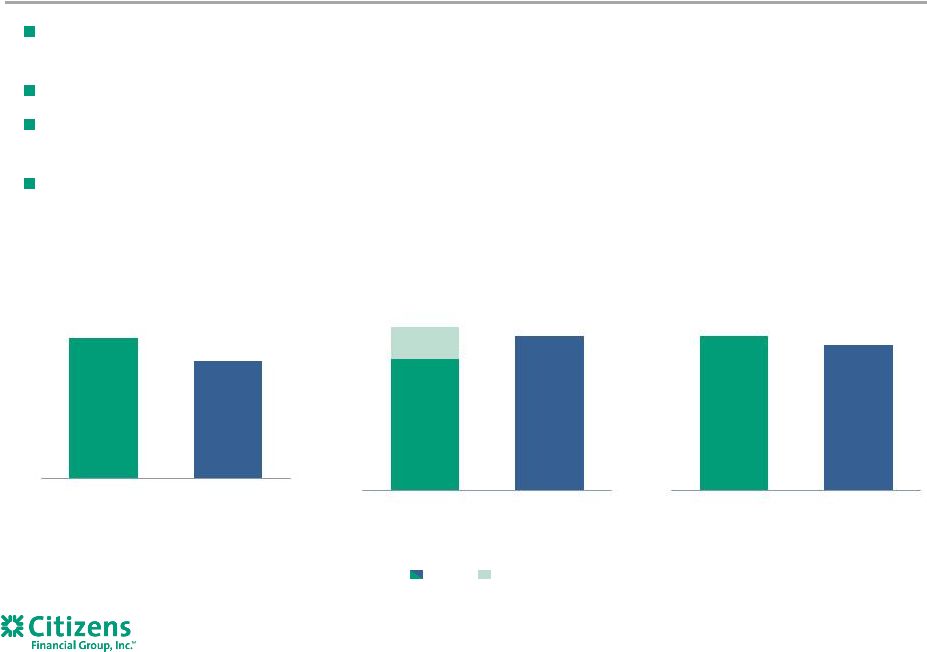 Well capitalized with a 4Q14 Tier 1 common equity ratio of 12.4%; pro forma common equity Tier 1 ratio of 12.1% on a fully phased-in Basel III basis Solid asset quality performance with 2014 net charge-offs of 36 bps Strong deposit franchise with $83.6 billion of core deposits (1) , or 87% of total period-end deposits, and a total deposit cost of 17 bps Internal plan to address Fed’s CCAR standards on track Strong, clean balance sheet funded with low-cost deposits 6 2014 period-end Tier 1 common equity ratio 2014 average cost of deposits 2014 net charge-offs/ average loans and leases (2) (2) (2) 0.36% 0.29% 0.34% CFG Peer Average 0.17% 0.16% CFG Peer Average 12.4% 10.4% CFG Peer Average Core Non-Core Source: SNL financial, Company filings 1) Core deposits defined as deposits, excluding term deposits. 2) Peer banks include BB&T (BBT), Comerica (CMA), Fifth Third (FITB), KeyCorp (KEY), M&T (MTB), PNC (PNC), Regions (RF), SunTrust (STI), and US Bancorp (USB). 3) Current reporting period regulatory capital ratios are preliminary |
 Corporate banking Commercial real estate Franchise finance Asset finance PE/sponsor finance Healthcare/technology/not for profit verticals Capital markets Treasury Solutions Commercial deposit services Retail deposit services Mobile/online banking Credit/debit card Wealth management Home equity loans/lines Mortgage Auto Education finance Business banking Consumer Commercial Robust product offerings with strong customer service Deep client relationships + Drive cross-sell and wallet share Extensive product set Recipient of numerous awards for our products and services Highest Mobile Banking Smartphone Ratings Award 2013 & 2014 Money Magazine Best Banks in America 2013 & 2014 Three gold Stevie Awards for sales and service 2014 7 |
 Average industry experience of 26 years Strong and experienced Board & Leadership team Board Member Committees Bruce Van Saun Chairman and Chief Executive Officer Arthur F. Ryan Lead Director; Chair of Compensation and Human Resources Committee; Member of Nominating and Corporate Governance Committee Mark Casady Member of Risk Committee Anthony Di Iorio Member of Audit Committee; Nominating and Corporate Governance Committee Robert Gillespie William P. Hankowsky Member of Audit Committee; Compensation and Human Resources Committee Howard W. Hanna III Member of Audit Committee; Nominating and Corporate Governance Committee Lee Higdon Member of Audit Committee; Compensation and Human Resources Committee Charles J. (“Bud”) Koch Chair of Risk Committee; Member of Audit Committee Shivan S. Subramaniam Chair of Nominating and Corporate Governance Committee; Member of Risk Committee Wendy A. Watson Chair of Audit Committee; Member of Risk Committee; Compensation and Human Resources Committee Marita Zuraitis Member of Risk Committee Leadership Team Member Title Bruce Van Saun Chairman and Chief Executive Officer David Bowerman Vice Chairman and Head of Citizens Business Services Brad Conner Vice Chairman and Head of Consumer Banking Michael Cleary EVP and Head of Distribution Consumer Banking John Fawcett Chief Financial Officer Stephen Gannon EVP, General Counsel and Chief Legal Officer Beth Johnson EVP and Head of Corporate Strategy Susan LaMonica EVP and Director of Human Resources Robert Nelson EVP and Chief Compliance Officer Brian O’Connell EVP and Regional Director Technology Services Robert Rubino EVP and Interim Co-Head of Commercial Banking Nancy Shanik EVP and Chief Risk Officer Stephen Woods EVP and Interim Co-Head of Commercial Banking 8 |
 Citizens went public on September 24, 2014 70.5% owned by RBS with plan for full divesture by YE 2016 Who are we? 9 Citizens: Building a top-performing regional bank Where When How Who What is the vision for Citizens? What are the strategy and key priorities? What are the key financial targets? What |
 Colleagues Offer fulfilling jobs Regulators Comply with letter and spirit of rules and regulations Investors Deliver strong value proposition and attractive returns Communities & Society Support sustainable prosperity Aspire to be a top-performing regional bank, delivering well for all stakeholders 10 Customer-centric culture Customers Serve our customers well |
 Our strategy to achieve this is to: Offer our customers a differentiated customer experience through the quality of our colleagues, products and services – Foster a culture around customer-centricity, commitment to excellence, leadership, teamwork and integrity Build a great brand that invokes trust from our customers and reinforces our value proposition – Consumer: Simple. Clear. Personal. – Commercial: Thought Leadership Strive to deliver attractive risk-adjusted returns by making good capital and resource allocation decisions, being good stewards of our resources, and rigorously evaluating our execution Operate with a strong balance sheet with regards to capital, liquidity and funding, coupled with a well-defined and prudent risk appetite Maintain a balanced business mix between Commercial Banking and Consumer Banking Position the bank as a ‘community leader’ that makes a positive impact on the communities and local economies we serve Our vision and strategy Our objective is to be a top-performing regional bank that delivers well for our stakeholders Our vision is to deliver the best possible banking experience 11 |
 12 Position Consumer Banking to deliver improved capabilities and profitability – Re-energize household growth and deepen relationships through cross-sell – Scale up growth in consumer asset businesses – Move towards smaller branch formats with fewer, but more productive bankers, and enhanced on- line and mobile functionality Continue our momentum in Commercial Banking – Equip our bankers to drive thought leadership and differentiate our customer experience – Deepen customer relationships with a focus on Capital Markets and Treasury Solutions Grow our balance sheet to build scale while maintaining a strong capital position – Focus on growing a cost-effective, sustainable deposit base in support of business loan growth Tightly manage expense base while funding technology, colleague, and regulatory needs and maintaining sufficient investment in our infrastructure Embed risk management throughout the organization and build stronger relationships with regulators Develop a high-performing, customer-centric organization and culture – Live our values every day – Empowerment with accountability Our strategy results in six priorities |
 13 These priorities have been mapped to specific initiatives Build out Mid-Corporate & Specialty verticals Continued development of Capital Markets Build out Treasury Solutions Grow Franchise Finance Core Commercial growth Target 7 – 8% loan growth Complete $750 million remaining capital conversion transactions (1) Target $200 million expense savings by end of 2016 Continue significant technology investment CCAR progress Regulatory issue remediation New Vision & Credo Organization Health Index / Leadership standards Improved Consumer Bank Continued Commercial Momentum Balance Sheet Growth/ Capital Mix Normalization Enhanced Efficiency & Infrastructure Embed Robust Risk/Regulatory Framework 1. Subject to regulatory approval. Reenergize Household growth Grow Auto Grow Education Finance Expand Business Banking Expand Mortgage sales force Expand Wealth sales force High-Performing, Customer-Centric Culture |
 14 We target a 10%+ run-rate ROTCE by the end of 2016 1. 2013 excludes $4.4 billion pre-tax ($4.1 billion after-tax) goodwill impairment charge. See appendix for a reconciliation of non-GAAP items. 2. See appendix for a reconciliation of non-GAAP items. 3. Excludes restructuring charges and special items. Making steady progress Key Indicators 2011 2013 (1) 2014 4Q14 End 2016 Targets Return on average tangible common equity ("ROTCE") (2) 4.2% 4.9% 6.7% 6.1% Adjusted ROTCE (2)(3) 4.5% 5.1% 6.1% 6.8% Return on average total tangible assets (2) 0.4% 0.6% 0.7% 0.7% 1.0%+ Adjusted efficiency ratio (2)(3) 66% 69% 69% 67% ~60% Tier 1 common equity ratio 13.3% 13.5% 12.4% 12.4% ~11% Future target 12%+ 10%+ |
 What is the vision for Citizens? What are the strategy and key priorities? What are the key financial targets? Citizens went public on September 24, 2014 70.5% owned by RBS with plan for full divesture by YE 2016 Who are we? 15 Citizens: Building a top-performing regional bank What When How Who Where will we play? Where will we allocate capital? Where |
 We have made choices on where we will focus Geography We pursue national businesses if: – We can be relevant to customers – It is a scalable business nationally – It reinforces the core business in our footprint Target: ~25% of revenue Business Customers Consumer Target: 50% of revenue Focus on customer segments with a broad range of needs Strong focus on mass, mass- affluent and affluent segments Build on the strong base we have with small business customers Commercial Target: 50% of revenue Focus on companies with annual revenues between $25 million and $2.5 billion Only enter specialty verticals that have strong industry presence in our footprint Return on Average Tangible Common Equity > 10% Ability to gain market leadership Element of recurring fee- based revenues Element of self-funding Critical part of the customer experience Consistent with our risk appetite Mid-West Mid-Atlantic New England We will concentrate on opportunities in our current footprint Target: ~75%+ of revenue 16 |
 17 Capital allocation focused on maximizing growth and returns 4Q14 Balances Emphasize risk-adjusted returns in allocating capital Focus on acquiring and deepening customer relationships to help drive cross-sell: Mortgage Wealth Capital Markets Treasury Solutions Measure total relationship profitability in Commercial when assessing customer returns Drive better analytics on Consumer and Commercial customer and segment profitability 53% 42% 5% 1. Based on 4Q14 average loan balances, excludes held for sale. $92.0 Billion $106.0 Billion Average Loans (1) Period-end Risk Weighted Assets 37% 52% 11% Student Lending Student Lending Home Lending Auto Business Banking Other Consumer Middle Market Mid Corporate & Specialty Verticals CRE Asset Finance Other Commercial Treasury/Non-Core Home Lending Auto Business Banking Other Consumer Middle Market Mid Corporate & Specialty Verticals CRE Asset Finance Other Commercial Treasury/Non-Core |
 Citizens went public on September 24, 2014 70.5% owned by RBS with plan for full divesture by YE 2016 Who are we? What is the vision for Citizens? What are the strategy and key priorities? What are the key financial targets? Where will we play? Where will we allocate capital? 18 Citizens: Building a top-performing regional bank What Where How Who When will we deliver the key objectives in our Plan? When will we get to top-performing? When |
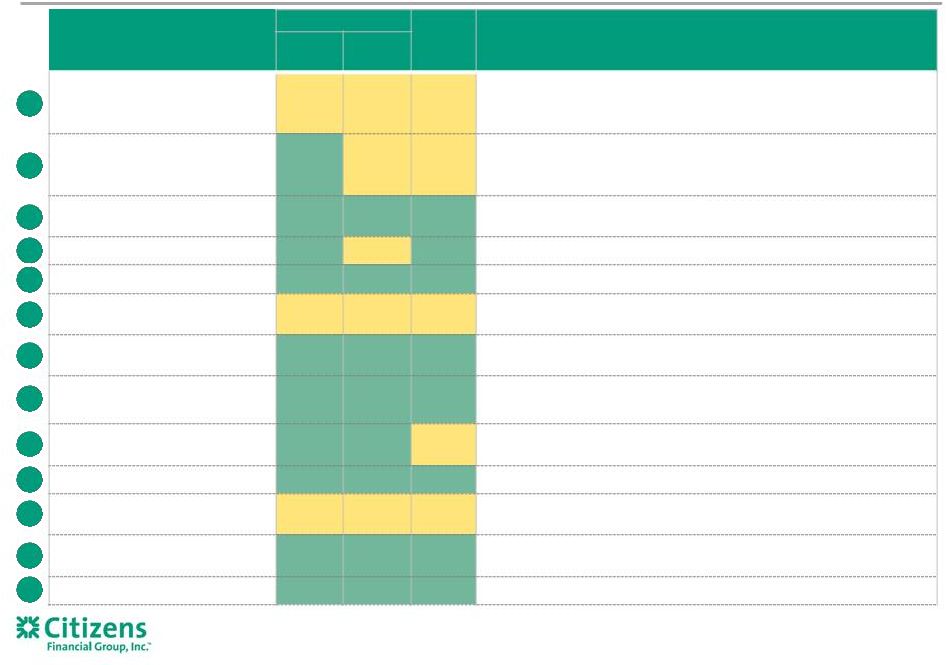
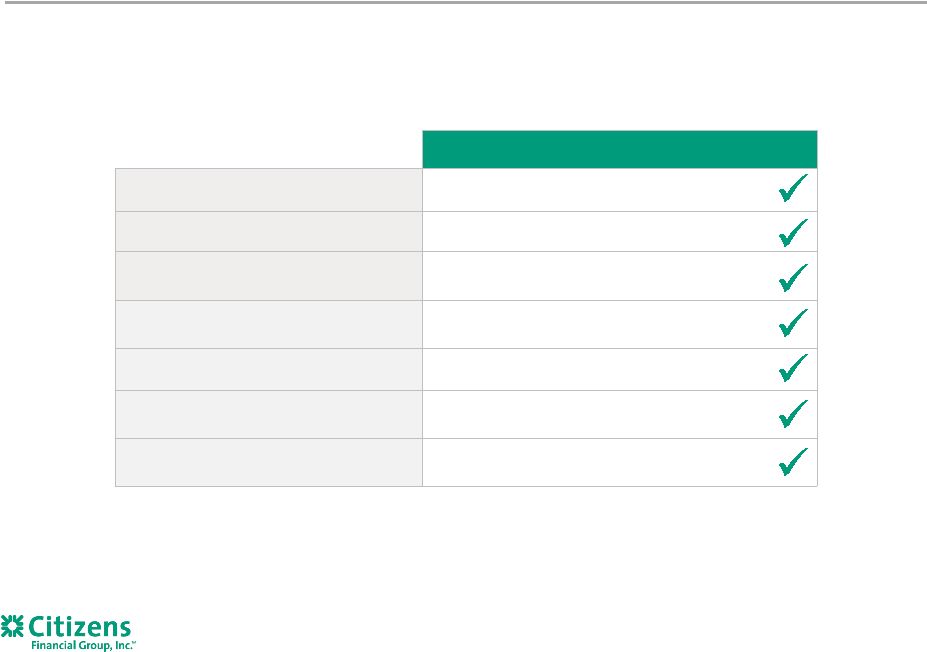 2014 Operating Plan Net interest income High- single-digit growth Loan portfolio Mid- single-digit growth Credit quality 35-45 bps of net charge-offs Efficiency ratio <70% Loan-to-deposit ratio < 100% ROTCE (adjusted) (1) ~ 6.0% Tier 1 Common Equity ratio ~ 120 bps reduction Plan spans three years to end of 2016; tracked well in 2014 Targets progressed as planned in 2014 19 1. Non-GAAP item. See important information on use of Non-GAAP items in the Appendix. |
 External Factors Macro Environment Interest Rates Housing Market Overall health of consumer Competitor Actions Competitive hiring market Easing competitor credit pricing and discipline Investment in technology, convenience, formats Consumer Behavior Stickiness of deposit base in rising rate environment Conforming %, purchase mortgage origination mix Orientation towards financial advice Current view entering 2015 External factors broadly consistent except for rates Focused on further expense initiatives to help mitigate challenges posed by rate curve 20 |
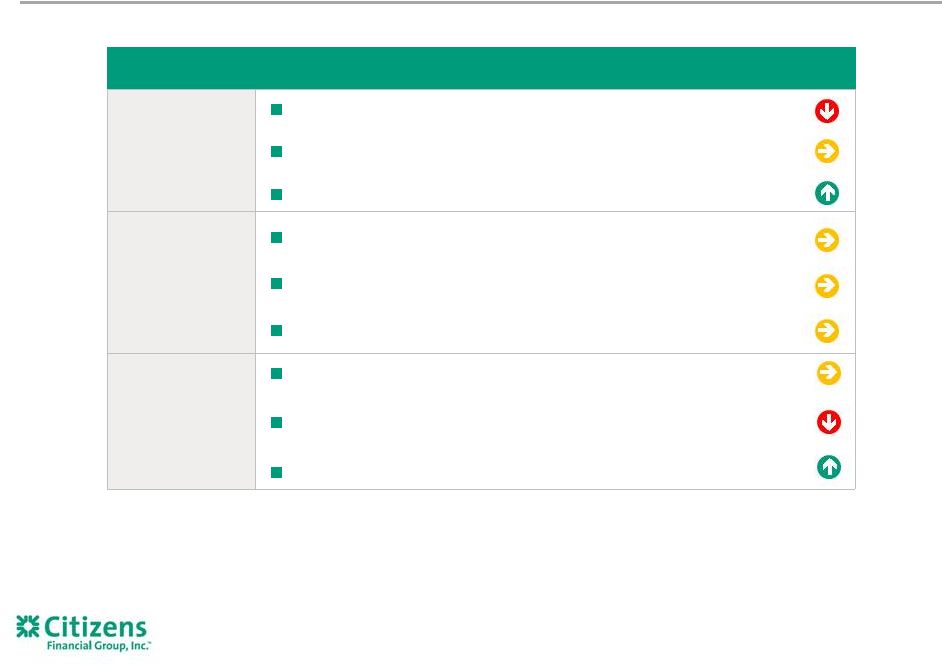
 1 2 3 4 5 6 7 8 9 10 11a 11b 11c INITIATIVE 2014 Status 2015 Outlook Commentary CFG Execution Market Condition Reenergize household growth Arrested household decline with new offerings. Contending with competition and reduced foot traffic. Key is training/improved lead generation. Expand mortgage sales force Achieved 2014 hiring goals; increased LOs by 66 including 41 in 4Q14, with attrition starting to normalize. Market conforming product mix and refi activity are wild cards. Grow Auto Performed well in 2014 with 35% YoY portfolio growth & yield expansion throughout the year (+10bps from 1Q14 to 4Q14). Grow Student Strong new refi product origination of $169 million in 4Q’14. Expand Business Banking Solid loan origination & deposit performance expected to continue. Expand Wealth sales force Strong market conditions have created competitive hiring environment for financial consultants. Build out Mid-Corp & verticals Met RM hiring goals in 2014 and well positioned for growth in 2015. Continue development of Capital Markets Capital markets rank and fees up nicely in 2014. Improved capabilities in FX and Sales & Trading will be operational in 2015. Build out Treasury Solutions New leader in place. Expect to see ramp up in benefits from recent people and technology investments over in 2015. Grow Franchise Finance Strong performance due to pace of new client acquisition (60+ in 2014). Core: Middle Market Strong origination activity expected to continue; focus on reducing portfolio run-off and optimizing pricing. Core: CRE CRE loans up 12% YoY to $7.8 billion at YE 2014. Continued momentum expected with focus on improvements in yield. Core: Asset Finance 2015 performance continues to look promising. 21 Initiatives broadly on track |
 22 We are focused on fully meeting regulatory expectations Step-change improvement in CCAR capabilities – Integrated capital planning – Deepened expertise in stress testing and modeling Significant progress in remediating regulatory issue backlog, though more to do Strengthened the risk culture – Focus on proactive identification and management of risk – Embedding risk appetite across the organization Intense focus on building an organization that evolves alongside heightened regulatory standards |
 Achieve current targets, then raise the bar Strive for consistency in performance, limit tail risk Target relatively high pay-out ratio, steady and growing dividend Investors Customers Colleagues Community Regulators Continue to improve customer satisfaction – Top 10 in JD Power for Consumer segment – Top performer in RM quality, value of ideas in Commercial Gain market share in targeted segments (Consumer & Commercial) Achieve top quartile Organizational Health rating Continue to develop talent and enhance culture Achieve heightened volunteer and financial giving aspirations Use our position to improve the well-being of the communities we serve Achieve and sustain heightened standards across broad regulatory agenda, and earn the respect of our regulators 23 We have a clear plan with rolling objectives for each stakeholder Once three-year targets are met, we aspire to further stretch our goals Getting to top performing |
 Citizens went public on September 24, 2014 70.5% owned by RBS with plan for full divesture by YE 2016 Who are we? What is the vision for Citizens? What are the strategy and key priorities? What are the key financial targets? Where will we play? Where will we allocate capital? When will we deliver the key objectives in our Plan? When will we get to top-performing? 24 Citizens: Building a top-performing regional bank What Where When Who How will we sustain our execution? How will we meet the challenges along the way? How |
 25 Monitoring metrics regularly (vs. targets) Maintaining flexibility to adapt based on progress and environment To achieve this we need to continue to hire, develop, and retain the right talent Focused on strengthening the leadership of the organization Execution: Intense focus delivering against the plan Identified and communicated priority initiatives Assigned ownership Aligned resources Mapped out metrics and targets for each initiative Culture is focused on: – Customer – Leadership – Accountability and execution – Community focus Key to execution is the quality of our talent and instilling the right culture People Culture Building alignment and capability in our leadership – Over 18 months have attracted or promoted from within 24 new members to our Executive Leadership Group (top 120) |
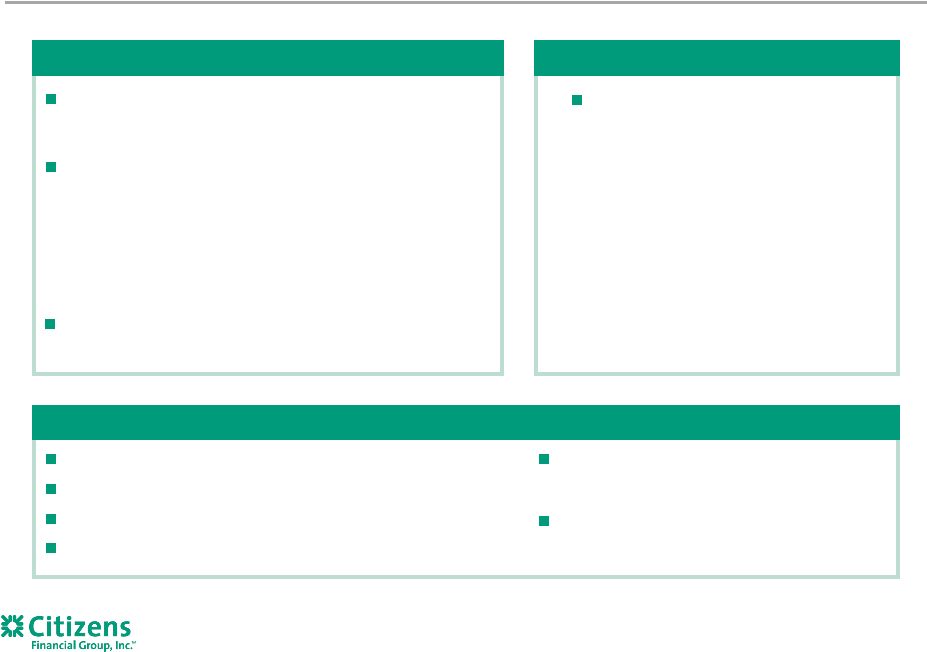
 26 How will we deal with the myriad of challenges we face? Driving balance sheet growth in areas that provide the most attractive returns Remaining disciplined on pricing Increasing focus on fee-generating businesses Low-rate environment Regularly engaging with regulators to get consistent feedback “early and often” on plans and progress Proactively monitoring and mitigating emerging risks Embedding risk management across the organization Leading with our value proposition rather than price: – Consumer – “Simple. Clear. Personal.” – Commercial – “Thought Leadership” Focusing in areas where we’re strongest – Geographies; customer segments; products Investment in technology, convenience, formats Competitive landscape Regulatory |
 27 Investment Thesis 13 th largest U.S. retail bank holding company with attractive demographics in core markets Attractive business mix with growing and profitable commercial business complementing strong consumer business Client-centric model focused on deepening customer relationships Attractive, client-centric franchise with scale Intense focus on strategic priorities driving attractive growth with improving asset mix and returns Committed to driving enhanced efficiency and effectiveness Prudently optimizing capital structure and risk profile to help drive improved risk-adjusted returns Peer-leading capital ratios Stable, low-cost deposit base Solid asset quality through credit cycles Strong, clean balance sheet supports growth plans Expected path to double-digit ROTCE Making good progress on a comprehensive plan to deliver for stakeholders |
 28 Q&A |
 Appendix 29 |
 Non-GAAP Reconciliation Table 30 (Excluding restructuring charges and special items) $s in millions, except per share data QUARTERLY 2011 2013 2014 4Q14 Net income (loss), excluding restructuring charges and special items: Net income (loss) (GAAP) $506 ($3,426) $865 $197 Add: Restructuring charges and special items, net of income tax expense (benefit) 42 4,097 (75) 20 Net income (loss), excluding restructuring charges and special items (non-GAAP) $548 $671 $790 $217 Return on average tangible common equity and return on average tangible common equity, excluding restructuring charges and special items: Average common equity (GAAP) $23,137 $21,834 $19,399 $19,209 Less: Average goodwill (GAAP) 11,311 9,063 6,876 6,876 Less: Average other intangibles (GAAP) 15 9 7 6 Add: Average deferred tax liabilities related to goodwill (GAAP) 295 459 377 403 Average tangible common equity (non-GAAP) $12,106 $13,221 $12,893 $12,730 Return on average tangible common equity (non-GAAP) 4.2 % (25.9)% 6.7 % 6.1 % Return on average tangible common equity, excluding restructuring charges and special items (non-GAAP) 4.5 % 5.1 % 6.1 % 6.8 % Return on average total tangible assets and return on average total tangible assets, excluding restructuring charges and special items: Average total assets (GAAP) $128,344 $120,866 $127,624 $130,671 Less: Average goodwill (GAAP) 11,311 9,063 6,876 6,876 Less: Average other intangibles (GAAP) 15 9 7 6 Add: Average deferred tax liabilities related to goodwill (GAAP) 295 459 377 403 Average tangible assets (non-GAAP) $117,313 $112,253 $121,118 $124,192 Return on average total tangible assets, excluding restructuring charges and special items (non-GAAP) 0.4 % 0.6 % 0.7 % 0.7 % Noninterest expense, excluding restructuring charges and special items: Noninterest expense (GAAP) $3,371 $7,679 $3,392 $824 Less: Restructuring charges and special expense items 65 4,461 169 33 Noninterest expense, excluding restructuring charges and special items (non-GAAP) $3,306 $3,218 $3,223 $791 Efficiency ratio and efficiency ratio, excluding restructuring charges and special items: Net interest income (GAAP) $3,320 $3,058 $3,301 $840 Add: Noninterest income (GAAP) 1,711 1,632 1,678 339 Total revenue (GAAP) $5,031 $4,690 $4,979 $1,179 Efficiency ratio, excluding restructuring charges and special items (non-GAAP) 66 % 69 % 69 % 67 % FULL YEAR |
 |