Exhibit 99.2
|

Exhibit 99.2
2Q15 Financial Results
July 21, 2015
|
Forward-looking statements
This document contains forward-looking statements within the Private Securities Litigation Reform Act of 1995. Any statement that does not describe historical or current facts is a forward-looking statement. These statements often include the words “believes,” “expects,” “anticipates,” “estimates,” “intends,” “plans,” “goals,” “targets,” “initiatives,” “potentially,” “probably,” “projects,” “outlook” or similar expressions or future conditional verbs such as “may,” “will,” “should,” “would,” and “could.”
Forward-looking statements are based upon the current beliefs and expectations of management, and on information currently available to management. Our statements speak as of the date hereof, and we do not assume any obligation to update these statements or to update the reasons why actual results could differ from those contained in such statements in light of new information or future events. We caution you, therefore, against relying on any of these forward-looking statements. They are neither statements of historical fact nor guarantees or assurances of future performance. While there is no assurance that any list of risks and uncertainties or risk factors is complete, important factors that could cause actual results to differ materially from those in the forward-looking statements include the following, without limitation:
negative economic conditions that adversely affect the general economy, housing prices, the job market, consumer confidence and spending habits which may affect, among other things, the level of nonperforming assets, charge-offs and provision expense;
the rate of growth in the economy and employment levels, as well as general business and economic conditions;
our ability to implement our strategic plan, including the cost savings and efficiency components, and achieve our indicative performance targets; our ability to remedy regulatory deficiencies and meet supervisory requirements and expectations; liabilities resulting from litigation and regulatory investigations;
our capital and liquidity requirements (including under regulatory capital standards, such as the Basel III capital standards) and our ability to generate capital internally or raise capital on favorable terms;
the effect of the current low interest rate environment or changes in interest rates on our net interest income, net interest margin and our mortgage originations, mortgage servicing rights and mortgages held for sale;
changes in interest rates and market liquidity, as well as the magnitude of such changes, which may reduce interest margins, impact funding sources and affect the ability to originate and distribute financial products in the primary and secondary markets;
the effect of changes in the level of checking or savings account deposits on our funding costs and net interest margin;
financial services reform and other current, pending or future legislation or regulation that could have a negative effect on our revenue and businesses, including the Dodd-
Frank Act and other legislation and regulation relating to bank products and services;
a failure in or breach of our operational or security systems or infrastructure, or those of our third party vendors or other service providers, including as a result of cyber attacks; management’s ability to identify and manage these and other risks; and any failure by us to successfully replicate or replace certain functions, systems and infrastructure provided by The Royal Bank of Scotland Group plc (RBS).
In addition to the above factors, we also caution that the amount and timing of any future common stock dividends or share repurchases will depend on our financial condition, earnings, cash needs, regulatory constraints, capital requirements (including requirements of our subsidiaries), and any other factors that our board of directors deems relevant in making such a determination. Therefore, there can be no assurance that we will pay any dividends to holders of our common stock, or as to the amount of any such dividends. In addition, the timing and manner of the sale of RBS’s remaining ownership of our common stock remains uncertain, and we have no control over the manner in which RBS may seek to divest such remaining shares. Any such sale would impact the price of our shares of common stock.
More information about factors that could cause actual results to differ materially from those described in the forward-looking statements can be found under “Risk Factors” in Part I, Item 1A in our Annual Report on Form 10-K for the year ended December 31, 2014, filed with the United States Securities and Exchange Commission on March 3, 2015.
Note: Percentage changes, per share amounts, and ratios presented in this document are calculated using whole dollars.
1 |
|
|
2Q15 highlights
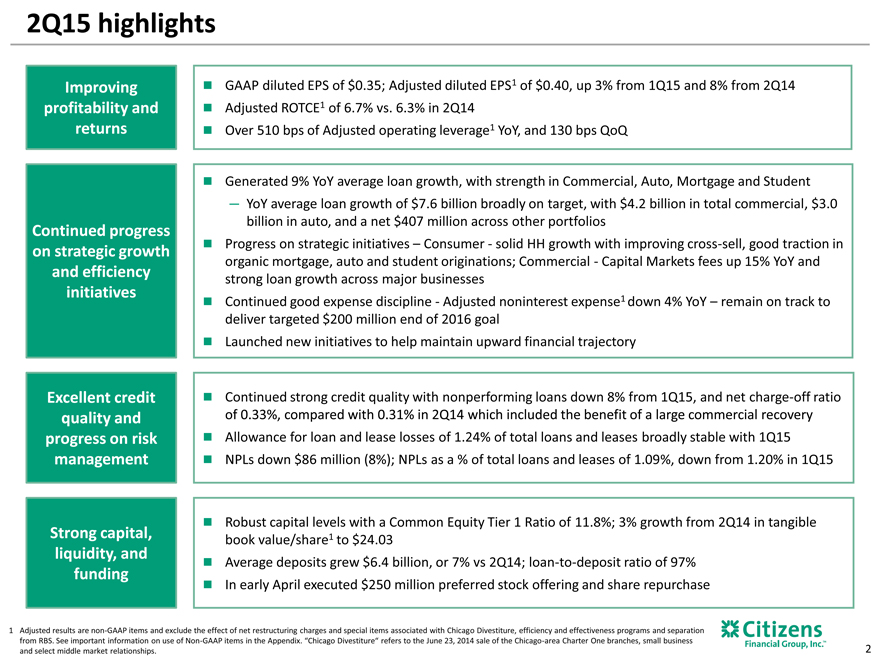
Improving GAAP diluted EPS of $0.35; Adjusted diluted EPS1 of $0.40, up 3% from 1Q15 and 8% from 2Q14
profitability and Adjusted ROTCE1 of 6.7% vs. 6.3% in 2Q14
returns Over 510 bps of Adjusted operating leverage1 YoY, and 130 bps QoQ
Generated 9% YoY average loan growth, with strength in Commercial, Auto, Mortgage and Student
YoY average loan growth of $7.6 billion broadly on target, with $4.2 billion in total commercial, $3.0
billion in auto, and a net $407 million across other portfolios
Continued progress
on strategic growth Progress on strategic initiatives – Consumer—solid HH growth with improving cross-sell, good traction in
organic mortgage, auto and student originations; Commercial—Capital Markets fees up 15% YoY and
and efficiency strong loan growth across major businesses
initiatives Continued good expense discipline—Adjusted noninterest expense1 down 4% YoY – remain on track to
deliver targeted $200 million end of 2016 goal
Launched new initiatives to help maintain upward financial trajectory
Excellent credit Continued strong credit quality with nonperforming loans down 8% from 1Q15, and net charge-off ratio
quality and of 0.33%, compared with 0.31% in 2Q14 which included the benefit of a large commercial recovery
progress on risk Allowance for loan and lease losses of 1.24% of total loans and leases broadly stable with 1Q15
management NPLs down $86 million (8%); NPLs as a % of total loans and leases of 1.09%, down from 1.20% in 1Q15
Robust capital levels with a Common Equity Tier 1 Ratio of 11.8%; 3% growth from 2Q14 in tangible
Strong capital, book value/share1 to $24.03
liquidity, and Average deposits grew $6.4 billion, or 7% vs 2Q14; loan-to-deposit ratio of 97%
funding
In early April executed $250 million preferred stock offering and share repurchase
Adjusted results are non-GAAP items and exclude the effect of net restructuring charges and special items associated with Chicago Divestiture, efficiency and effectiveness programs and separation from RBS. See important information on use of Non-GAAP items in the Appendix. “Chicago Divestiture” refers to the June 23, 2014 sale of the Chicago-area Charter One branches, small business and select middle market relationships.
2 |
|
|
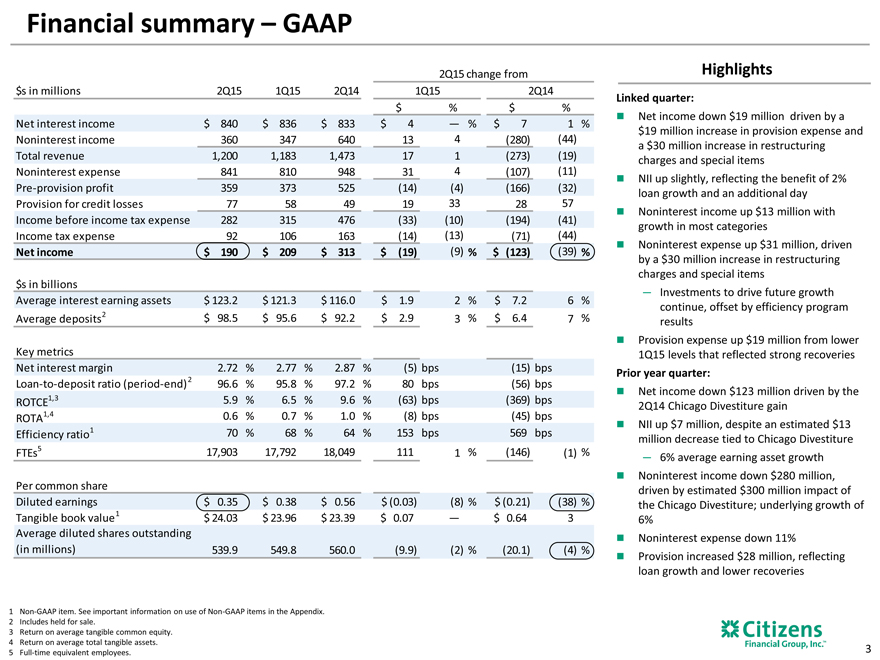
Financial summary – GAAP
2Q15 change from
$s in millions 2Q15 1Q15 2Q14 1Q15 2Q14
$ % $ %
Net interest income $ 840 $ 836 $ 833 $ 4 — % $ 7 1 %
Noninterest income 360 347 640 13 4 (280) (44)
Total revenue 1,200 1,183 1,473 17 1 (273) (19)
Noninterest expense 841 810 948 31 4 (107) (11)
Pre-provision profit 359 373 525 (14) (4) (166) (32)
Provision for credit losses 77 58 49 19 33 28 57
Income before income tax expense 282 315 476 (33) (10) (194) (41)
Income tax expense 92 106 163 (14) (13) (71) (44)
Net income $ 190 $ 209 $ 313 $ (19) (9) % $ (123) (39) %
$s in billions
Average interest earning assets $ 123.2 $ 121.3 $ 116.0 $ 1.9 2 % $ 7.2 6 %
Average deposits2 $ 98.5 $ 95.6 $ 92.2 $ 2.9 3 % $ 6.4 7 %
Key metrics
Net interest margin 2.72 % 2.77 % 2.87 % (5) bps (15) bps
Loan-to-deposit ratio (period-end) 2 96.6 % 95.8 % 97.2 % 80 bps (56) bps
ROTCE1,3 5.9 % 6.5 % 9.6 % (63) bps (369) bps
ROTA1,4 0.6 % 0.7 % 1.0 % (8) bps (45) bps
Efficiency ratio1 70 % 68 % 64 % 153 bps 569 bps
FTEs5 17,903 17,792 18,049 111 1 % (146) (1) %
Per common share
Diluted earnings $ 0.35 $ 0.38 $ 0.56 $ (0.03) (8) % $ (0.21) (38) %
Tangible book value1 $ 24.03 $ 23.96 $ 23.39 $ 0.07 — $ 0.64 3
Average diluted shares outstanding
(in millions) 539.9 549.8 560.0 (9.9) (2) % (20.1) (4) %
Highlights
Linked quarter:
Net income down $19 million driven by a $19 million increase in provision expense and a $30 million increase in restructuring charges and special items NII up slightly, reflecting the benefit of 2% loan growth and an additional day Noninterest income up $13 million with growth in most categories Noninterest expense up $31 million, driven by a $30 million increase in restructuring charges and special items
Investments to drive future growth continue, offset by efficiency program results Provision expense up $19 million from lower 1Q15 levels that reflected strong recoveries
Prior year quarter:
Net income down $123 million driven by the 2Q14 Chicago Divestiture gain NII up $7 million, despite an estimated $13 million decrease tied to Chicago Divestiture
6% average earning asset growth Noninterest income down $280 million, driven by estimated $300 million impact of the Chicago Divestiture; underlying growth of 6% Noninterest expense down 11% Provision increased $28 million, reflecting loan growth and lower recoveries
1 |
| Non-GAAP item. See important information on use of Non-GAAP items in the Appendix. |
2 |
| Includes held for sale. |
3 |
| Return on average tangible common equity. |
4 |
| Return on average total tangible assets. |
5 |
| Full-time equivalent employees. |
3 |
|
|
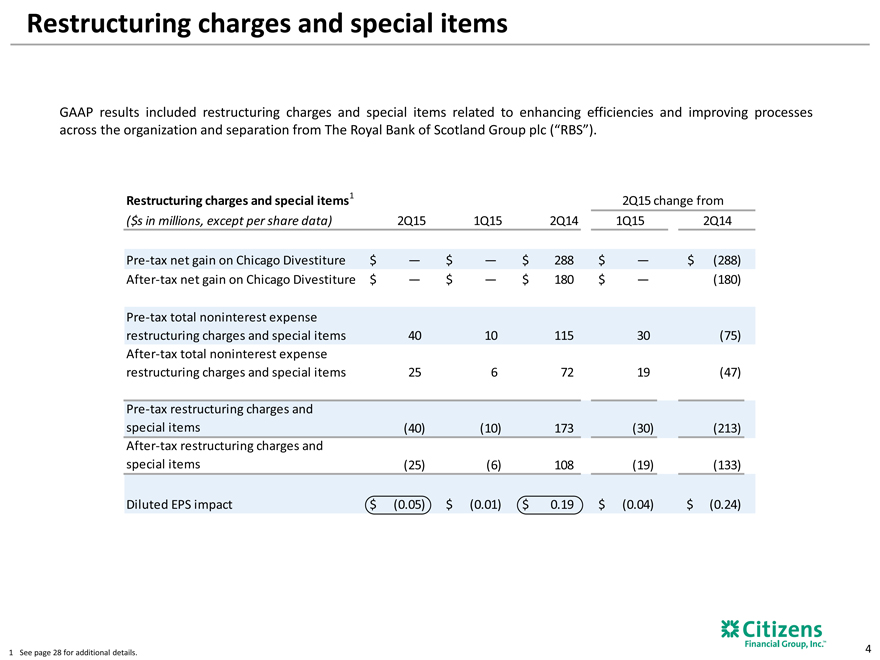
Restructuring charges and special items
GAAP results included restructuring charges and special items related to enhancing efficiencies and improving processes across the organization and separation from The Royal Bank of Scotland Group plc (“RBS”).
Restructuring charges and special items1 2Q15 change from
($s in millions, except per share data) 2Q15 1Q15 2Q14 1Q15 2Q14
Pre-tax net gain on Chicago Divestiture $ — $ — $ 288 $ — $ (288)
After-tax net gain on Chicago Divestiture $ — $ — $ 180 $ — (180)
Pre-tax total noninterest expense
restructuring charges and special items 40 10 115 30 (75)
After-tax total noninterest expense
restructuring charges and special items 25 6 72 19 (47)
Pre-tax restructuring charges and
special items (40) (10) 173 (30) (213)
After-tax restructuring charges and
special items (25) (6) 108 (19) (133)
Diluted EPS impact $ (0.05) $ (0.01) $ 0.19 $ (0.04) $ (0.24)
1 |
| See page 28 for additional details. |
4 |
|
|
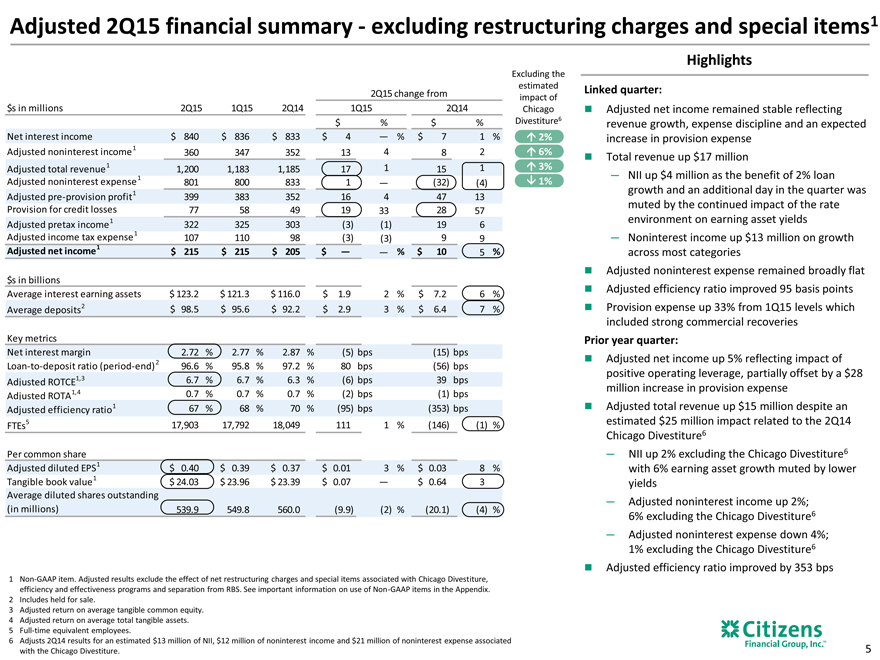
Adjusted 2Q15 financial summary—excluding restructuring charges and special items1
2Q15 change from
$s in millions 2Q15 1Q15 2Q14 1Q15 2Q14
$ % $ %
Net interest income $ 840 $ 836 $ 833 $ 4 — % $ 7 1 %
Adjusted noninterest income1 360 347 352 13 4 8 2
Adjusted total revenue1 1,200 1,183 1,185 17 1 15 1
Adjusted noninterest expense 1 801 800 833 1 — (32) (4)
Adjusted pre-provision profit1 399 383 352 16 4 47 13
Provision for credit losses 77 58 49 19 33 28 57
Adjusted pretax income1 322 325 303 (3) (1) 19 6
Adjusted income tax expense1 107 110 98 (3) (3) 9 9
Adjusted net income1 $ 215 $ 215 $ 205 $ — — % $ 10 5 %
$s in billions
Average interest earning assets $ 123.2 $ 121.3 $ 116.0 $ 1.9 2 % $ 7.2 6 %
Average deposits2 $ 98.5 $ 95.6 $ 92.2 $ 2.9 3 % $ 6.4 7 %
Key metrics
Net interest margin 2.72 % 2.77 % 2.87 % (5) bps (15) bps
Loan-to-deposit ratio (period-end) 2 96.6 % 95.8 % 97.2 % 80 bps (56) bps
Adjusted ROTCE1,3 6.7 % 6.7 % 6.3 % (6) bps 39 bps
Adjusted ROTA1,4 0.7 % 0.7 % 0.7 % (2) bps (1) bps
Adjusted efficiency ratio1 67 % 68 % 70 % (95) bps (353) bps
FTEs5 17,903 17,792 18,049 111 1 % (146) (1) %
Per common share
Adjusted diluted EPS1 $ 0.40 $ 0.39 $ 0.37 $ 0.01 3 % $ 0.03 8 %
Tangible book value1 $ 24.03 $ 23.96 $ 23.39 $ 0.07 — $ 0.64 3
Average diluted shares outstanding
(in millions) 539.9 549.8 560.0 (9.9) (2) % (20.1) (4) %
1 Non-GAAP item. Adjusted results exclude the effect of net restructuring charges and special items associated with Chicago Divestiture, efficiency and effectiveness programs and separation from RBS. See important information on use of Non-GAAP items in the Appendix.
2 |
| Includes held for sale. |
3 |
| Adjusted return on average tangible common equity. |
4 |
| Adjusted return on average total tangible assets. |
5 |
| Full-time equivalent employees. |
6 Adjusts 2Q14 results for an estimated $13 million of NII, $12 million of noninterest income and $21 million of noninterest expense associated with the Chicago Divestiture.
Excluding the
estimated
impact of
Chicago
Divestiture6
2%
6%
3%
1%
Highlights
Linked quarter:
Adjusted net income remained stable reflecting revenue growth, expense discipline and an expected increase in provision expense Total revenue up $17 million
NII up $4 million as the benefit of 2% loan growth and an additional day in the quarter was muted by the continued impact of the rate environment on earning asset yields
Noninterest income up $13 million on growth across most categories Adjusted noninterest expense remained broadly flat Adjusted efficiency ratio improved 95 basis points Provision expense up 33% from 1Q15 levels which included strong commercial recoveries
Prior year quarter:
Adjusted net income up 5% reflecting impact of positive operating leverage, partially offset by a $28 million increase in provision expense Adjusted total revenue up $15 million despite an estimated $25 million impact related to the 2Q14 Chicago Divestiture6
NII up 2% excluding the Chicago Divestiture6 with 6% earning asset growth muted by lower yields
Adjusted noninterest income up 2%; 6% excluding the Chicago Divestiture6
Adjusted noninterest expense down 4%; 1% excluding the Chicago Divestiture6 Adjusted efficiency ratio improved by 353 bps
5 |
|
|
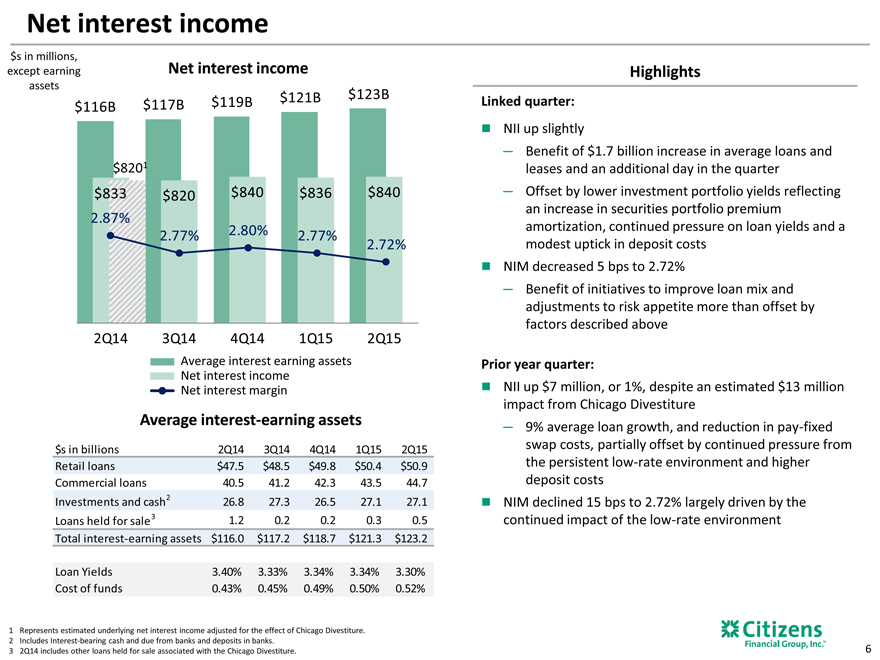
Net interest income
$s in millions,
except earning Net interest income
assets
$116B $117B $119B $121B $123B
$8201
$833 $820 $840 $836 $840
2.87%
2.77% 2.80% 2.77%
2.72%
2Q14 3Q14 4Q14 1Q15 2Q15
Average interest earning assets
Net interest income
Net interest margin
Average interest-earning assets
$s in billions 2Q14 3Q14 4Q14 1Q15 2Q15
Retail loans $47.5 $48.5 $49.8 $50.4 $50.9
commercial loans 40.5 41.2 42.3 43.5 44.7
Investments and cash2 26.8 27.3 26.5 27.1 27.1
Loans held for sale3 1.2 0.2 0.2 0.3 0.5
Total interest-earning assets $116.0 $117.2 $118.7 $121.3 $123.2
Loans Yields 3.40% 3.33% 3.34% 3.34% 3.30%
Cost of funds 0.43% 0.45% 0.49% 0.50% 0.52%
Highlights
Linked quarter:
NII up slightly
Benefit of $1.7 billion increase in average loans and leases and an additional day in the quarter
Offset by lower investment portfolio yields reflecting an increase in securities portfolio premium amortization, continued pressure on loan yields and a modest uptick in deposit costs NIM decreased 5 bps to 2.72%
Benefit of initiatives to improve loan mix and adjustments to risk appetite more than offset by factors described above
Prior year quarter:
NII up $7 million, or 1%, despite an estimated $13 million impact from Chicago Divestiture
9% average loan growth, and reduction in pay-fixed swap costs, partially offset by continued pressure from the persistent low-rate environment and higher deposit costs NIM declined 15 bps to 2.72% largely driven by the continued impact of the low-rate environment
Represents estimated underlying net interest income adjusted for the effect of Chicago Divestiture.
Includes Interest-bearing cash and due from banks and deposits in banks.
2Q14 includes other loans held for sale associated with the Chicago Divestiture.
6 |
|
|
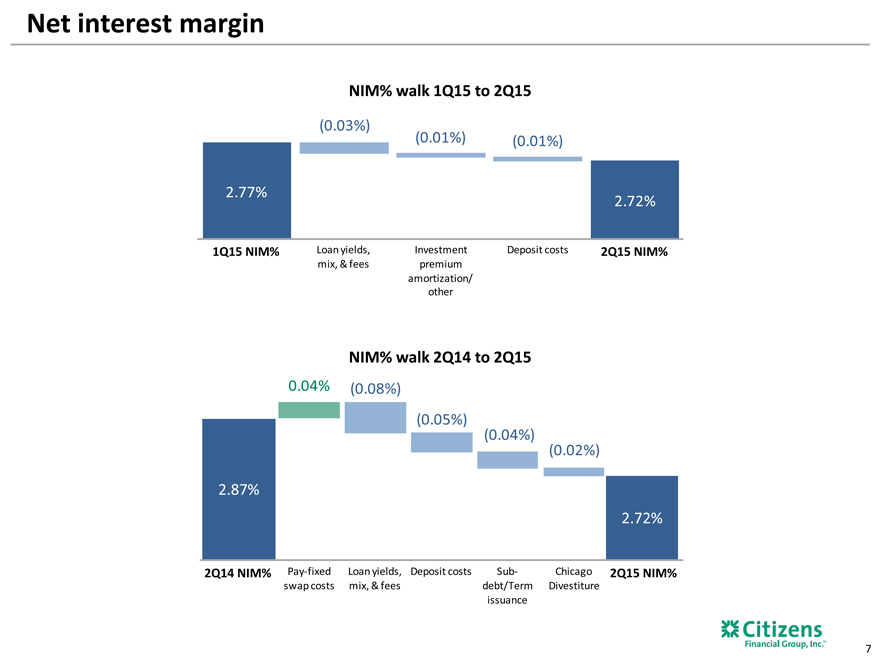
Net interest margin
NIM% walk 1Q15 to 2Q15
(0.03%)
(0.01%) (0.01%)
2.77% 2.72%
1Q15 NIM% Loan yields, Investment Deposit costs 2Q15 NIM%
mix, & fees premium
amortization/
other
NIM% walk 2Q14 to 2Q15
0.04% (0.08%)
(0.05%)
(0.04%)
(0.02%)
2.87%
2.72%
2Q14 NIM% Pay-fixed Loan yields, Deposit costs Sub- Chicago 2Q15 NIM%
swap costs mix, & fees debt/Term Divestiture
issuance
7 |
|
|
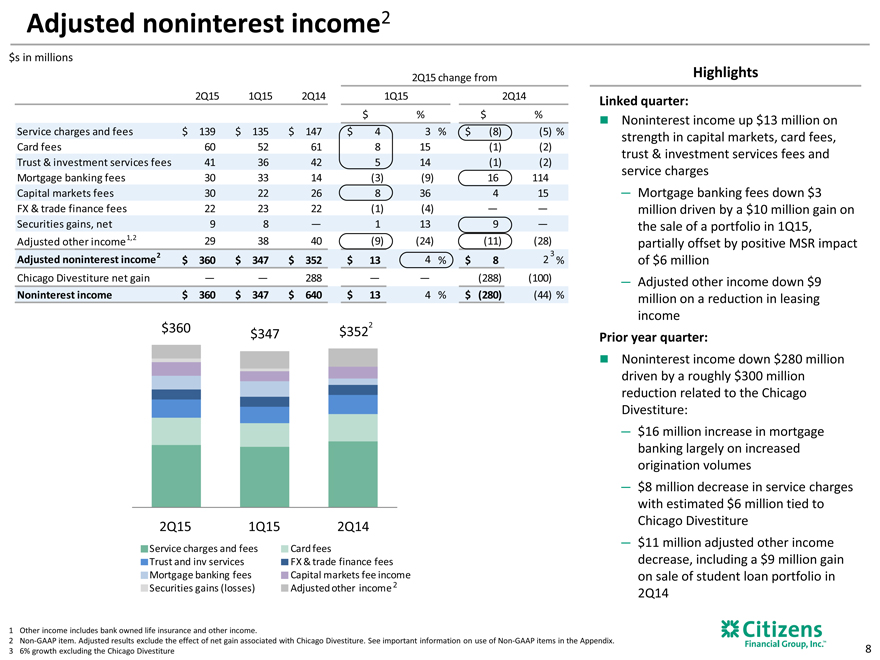
Adjusted noninterest income2
$ s in millions
2Q15 change from
2Q15 1Q15 2Q14 1Q15 2Q14
$ % $ %
Service charges and fees $ 139 $ 135 $ 147 $ 4 3 % $ (8) (5) %
Card fees 60 52 61 8 15 (1) (2)
Trust & investment services fees 41 36 42 5 14 (1) (2)
Mortgage banking fees 30 33 14 (3) (9) 16 114
Capital markets fees 30 22 26 8 36 4 15
FX & trade finance fees 22 23 22 (1) (4) — —
Securities gains, net 9 8 — 1 13 9 —
Adjusted other income1,2 29 38 40 (9) (24) (11) (28)
Adjusted noninterest income2 $ 360 $ 347 $ 352 $ 13 4 % $ 8 2 3 %
Chicago Divestiture net gain — — 288 — — (288) (100)
Noninterest income $ 360 $ 347 $ 640 $ 13 4 % $ (280) (44) %
$360 $3522
$347
2Q15 1Q15 2Q14
Service charges and fees Card fees
Trust and inv services FX & trade finance fees
Mortgage banking fees Capital markets fee income
Securities gains (losses) Adjusted other income 2
Other income includes bank owned life insurance and other income.
Non-GAAP item. Adjusted results exclude the effect of net gain associated with Chicago Divestiture. See important information on use of Non-GAAP items in the Appendix.
6% growth excluding the Chicago Divestiture
Highlights
Linked quarter:
Noninterest income up $13 million on strength in capital markets, card fees, trust & investment services fees and service charges
Mortgage banking fees down $3 million driven by a $10 million gain on the sale of a portfolio in 1Q15, partially offset by positive MSR impact of $6 million
Adjusted other income down $9 million on a reduction in leasing income
Prior year quarter:
Noninterest income down $280 million driven by a roughly $300 million reduction related to the Chicago Divestiture:
$16 million increase in mortgage banking largely on increased origination volumes
$8 million decrease in service charges with estimated $6 million tied to Chicago Divestiture
$11 million adjusted other income decrease, including a $9 million gain on sale of student loan portfolio in 2Q14
8 |
|
|
Adjusted noninterest expense – excluding. restructuring charges and special items1
2Q15 change from
$s in millions 2Q15 1Q15 2Q14 1Q15 2Q14
$ % $ %
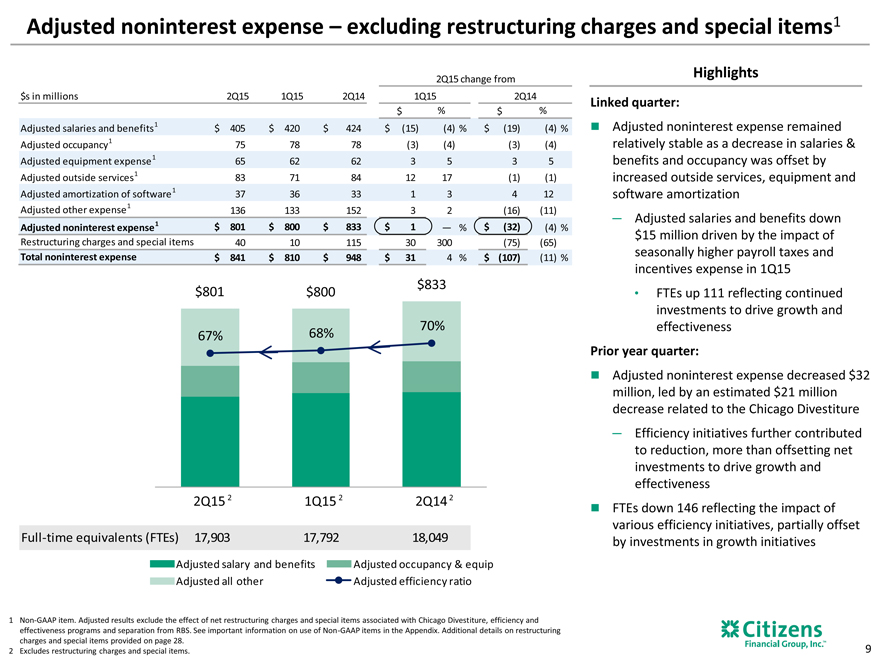
Adjusted salaries and benefits1 $ 405 $ 420 $ 424 $ (15) (4) % $ (19) (4) %
Adjusted occupancy1 75 78 78 (3) (4) (3) (4)
Adjusted equipment expense 1 65 62 62 3 5 3 5
Adjusted outside services1 83 71 84 12 17 (1) (1)
Adjusted amortization of software 1 37 36 33 1 3 4 12
Adjusted other expense1 136 133 152 3 2 (16) (11)
Adjusted noninterest expense1 $ 801 $ 800 $ 833 $ 1 — % $ (32) (4) %
Restructuring charges and special items 40 10 115 30 300 (75) (65)
Total noninterest expense $ 841 $ 810 $ 948 $ 31 4 % $ (107) (11) %
Highlights
Linked quarter:
Adjusted noninterest expense remained relatively stable as a decrease in salaries & benefits and occupancy was offset by increased outside services, equipment and software amortization
Adjusted salaries and benefits down $15 million driven by the impact of seasonally higher payroll taxes and incentives expense in 1Q15
FTEs up 111 reflecting continued investments to drive growth and effectiveness
Prior year quarter:
Adjusted noninterest expense decreased $32 million, led by an estimated $21 million decrease related to the Chicago Divestiture
Efficiency initiatives further contributed to reduction, more than offsetting net investments to drive growth and effectiveness FTEs down 146 reflecting the impact of various efficiency initiatives, partially offset by investments in growth initiatives
$801 $800 $833
67% 68% 70%
2Q15 2 1Q15 2 2Q14 2
Full-time equivalents (FTEs) 17,903 17,792 18,049
Adjusted salary and benefits Adjusted occupancy & equip
Adjusted all other Adjusted efficiency ratio
Non-GAAP item. Adjusted results exclude the effect of net restructuring charges and special items associated with Chicago Divestiture, efficiency and effectiveness programs and separation from RBS. See important information on use of Non-GAAP items in the Appendix. Additional details on restructuring charges and special items provided on page 28.
Excludes restructuring charges and special items.
9
|
Consolidated 2Q15 average balance sheet
2Q15 change from
$s in billions 2Q15 1Q15 2Q14 1Q15 2Q14
$ % $ %
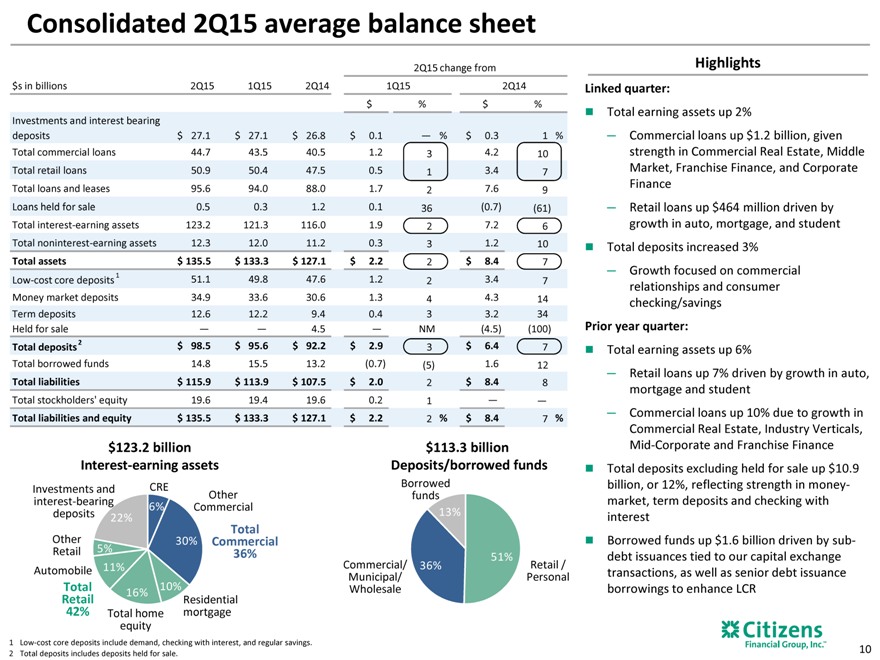
Investments and interest bearing
deposits $ 27.1 $ 27.1 $ 26.8 $ 0.1 — % $ 0.3 1 %
Total commercial loans 44.7 43.5 40.5 1.2 3 4.2 10
Total retail loans 50.9 50.4 47.5 0.5 1 3.4 7
Total loans and leases 95.6 94.0 88.0 1.7 2 7.6 9
Loans held for sale 0.5 0.3 1.2 0.1 36 (0.7) (61)
Total interest-earning assets 123.2 121.3 116.0 1.9 2 7.2 6
Total noninterest-earning assets 12.3 12.0 11.2 0.3 3 1.2 10
Total assets $ 135.5 $ 133.3 $ 127.1 $ 2.2 2 $ 8.4 7
Low-cost core deposits1 51.1 49.8 47.6 1.2 2 3.4 7
Money market deposits 34.9 33.6 30.6 1.3 4 4.3 14
Term deposits 12.6 12.2 9.4 0.4 3 3.2 34
Held for sale — — 4.5 — NM (4.5) (100)
Total deposits2 $ 98.5 $ 95.6 $ 92.2 $ 2.9 3 $ 6.4 7
Total borrowed funds 14.8 15.5 13.2 (0.7) (5) 1.6 12
Total liabilities $ 115.9 $ 113.9 $ 107.5 $ 2.0 2 $ 8.4 8
Total stockholders’ equity 19.6 19.4 19.6 0.2 1 — —
Total liabilities and equity $ 135.5 $ 133.3 $ 127.1 $ 2.2 2 % $ 8.4 7 %
$123.2 billion
Interest-earning assets
Investments and CRE Other
interest-bearing 6% Commercial
deposits 22%
Total
Other 30% Commercial
Retail 5% 36%
Automobile 11%
Total 10%
16%
Retail Residential
42% Total home mortgage
equity
$113.3 billion
Deposits/borrowed funds
Borrowed
funds
13%
51%
Commercial/ 36% Retail /
Municipal/ Personal
Wholesale
Highlights
Linked quarter:
Total earning assets up 2%
Commercial loans up $1.2 billion, given strength in Commercial Real Estate, Middle Market, Franchise Finance, and Corporate Finance
Retail loans up $464 million driven by growth in auto, mortgage, and student Total deposits increased 3%
Growth focused on commercial relationships and consumer checking/savings
Prior year quarter:
Total earning assets up 6%
Retail loans up 7% driven by growth in auto, mortgage and student
Commercial loans up 10% due to growth in Commercial Real Estate, Industry Verticals, Mid-Corporate and Franchise Finance Total deposits excluding held for sale up $10.9 billion, or 12%, reflecting strength in money-market, term deposits and checking with interest Borrowed funds up $1.6 billion driven by sub-debt issuances tied to our capital exchange transactions, as well as senior debt issuance borrowings to enhance LCR
10
|
Consumer Banking average loans and leases
$s in billions
Average loans and leases
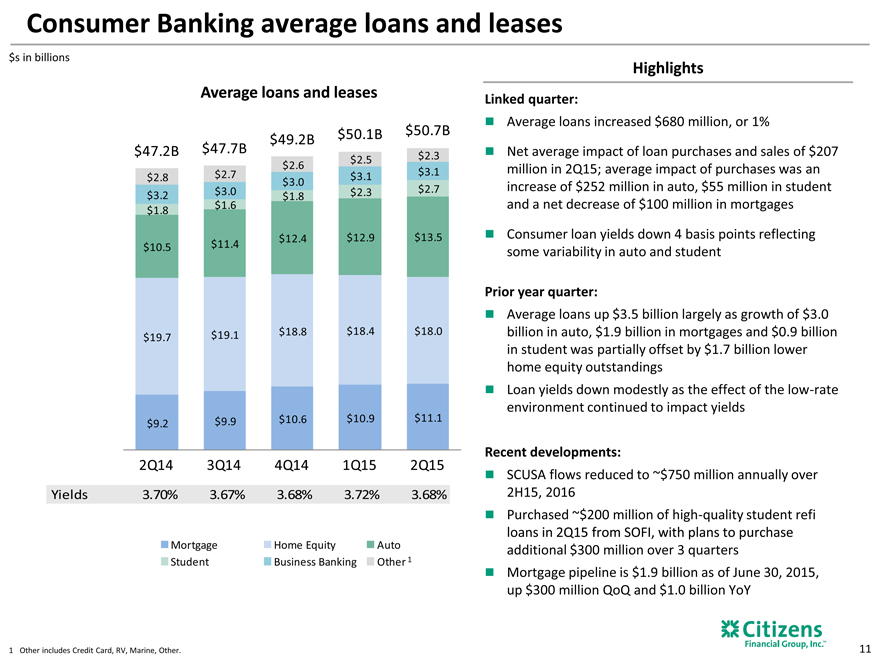
$49.2B $50.1B $50.7B
$47.2B $47.7B $2.3
$2.6 $2.5
$2.8 $2.7 $3.1 $3.1
$3.0
$3.0 $2.3 $2.7
$3.2 $1.8
$1.8 $1.6
$12.4 $12.9 $13.5
$10.5 $11.4
$19.7 $19.1 $18.8 $18.4 $18.0
$9.2 $9.9 $10.6 $10.9 $11.1
2Q14 3Q14 4Q14 1Q15 2Q15
Yields 3.70% 3.67% 3.68% 3.72% 3.68%
Mortgage Home Equity Auto
Student Business Banking Other 1
Highlights
Linked quarter:
Average loans increased $680 million, or 1%
Net average impact of loan purchases and sales of $207 million in 2Q15; average impact of purchases was an increase of $252 million in auto, $55 million in student and a net decrease of $100 million in mortgages
Consumer loan yields down 4 basis points reflecting some variability in auto and student
Prior year quarter:
Average loans up $3.5 billion largely as growth of $3.0 billion in auto, $1.9 billion in mortgages and $0.9 billion in student was partially offset by $1.7 billion lower home equity outstandings Loan yields down modestly as the effect of the low-rate environment continued to impact yields
Recent developments:
SCUSA flows reduced to ~$750 million annually over 2H15, 2016 Purchased ~$200 million of high-quality student refi loans in 2Q15 from SOFI, with plans to purchase additional $300 million over 3 quarters Mortgage pipeline is $1.9 billion as of June 30, 2015, up $300 million QoQ and $1.0 billion YoY
11
|
Commercial Banking average loans and leases
$s in billions
Average loans and leases
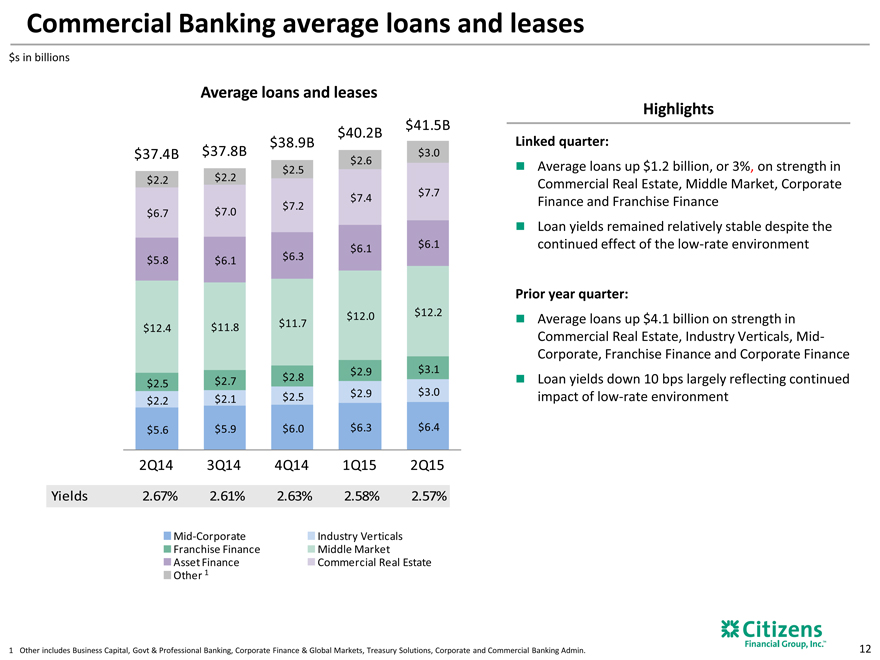
$40.2B $41.5B
$38.9B
$37.4B $37.8B $3.0
$2.6
$2.5
$2.2 $2.2
$7.4 $7.7
$6.7 $7.0 $7.2
$6.1 $6.1
$5.8 $6.1 $6.3
$12.0 $12.2
$12.4 $11.8 $11.7
$2.9 $3.1
$2.5 $2.7 $2.8
$2.2 $2.1 $2.5 $2.9 $3.0
$5.6 $5.9 $6.0 $6.3 $6.4
2Q14 3Q14 4Q14 1Q15 2Q15
Yields 2.67% 2.61% 2.63% 2.58% 2.57%
Mid-Corporate Industry Verticals
Franchise Finance Middle Market
Asset Finance Commercial Real Estate
Other 1
Highlights
Linked quarter:
Average loans up $1.2 billion, or 3%, on strength in Commercial Real Estate, Middle Market, Corporate Finance and Franchise Finance Loan yields remained relatively stable despite the continued effect of the low-rate environment
Prior year quarter:
Average loans up $4.1 billion on strength in Commercial Real Estate, Industry Verticals, Mid-Corporate, Franchise Finance and Corporate Finance Loan yields down 10 bps largely reflecting continued impact of low-rate environment
12
|
Average funding and cost of funds
$s in billions
Average interest-bearing liabilities1
$85.4B $86.9B
$82.5B
$80.8B $3.9
$3.9
$74.8B $2.0 $2.8 $6.5
$7.0
$1.4 $6.7 $6.1 $4.4
$6.0 $5.1 $4.6
$6.3
$5.7 $12.2 $12.6
$11.9
$10.6
$9.4
$16.6
$15.2 $15.7 $16.0
$13.8
$38.4 $40.1 $40.9 $41.7 $43.0
2Q14 3Q14 4Q14 1Q15 2Q15
Total cost of funds1 0.44% 0.45% 0.49% 0.50% 0.52%
Money market & savings Checking with interest
Term & time deposits Total fed funds & repo
Short-term borrowed funds Total long-term borrowings
Highlights
Linked quarter:
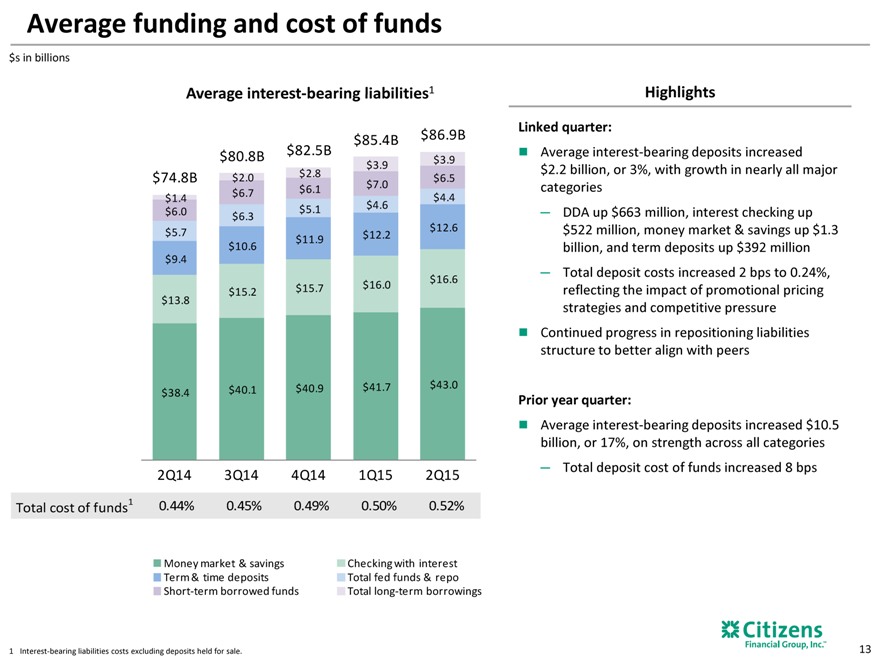
Average interest-bearing deposits increased $2.2 billion, or 3%, with growth in nearly all major categories
DDA up $663 million, interest checking up $522 million, money market & savings up $1.3 billion, and term deposits up $392 million
Total deposit costs increased 2 bps to 0.24%, reflecting the impact of promotional pricing strategies and competitive pressure Continued progress in repositioning liabilities structure to better align with peers
Prior year quarter:
Average interest-bearing deposits increased $10.5 billion, or 17%, on strength across all categories
Total deposit cost of funds increased 8 bps
13
|
Summary of progress on strategic initiatives
2Q15 2015
Initiative Commentary
Status Outlook
1 |
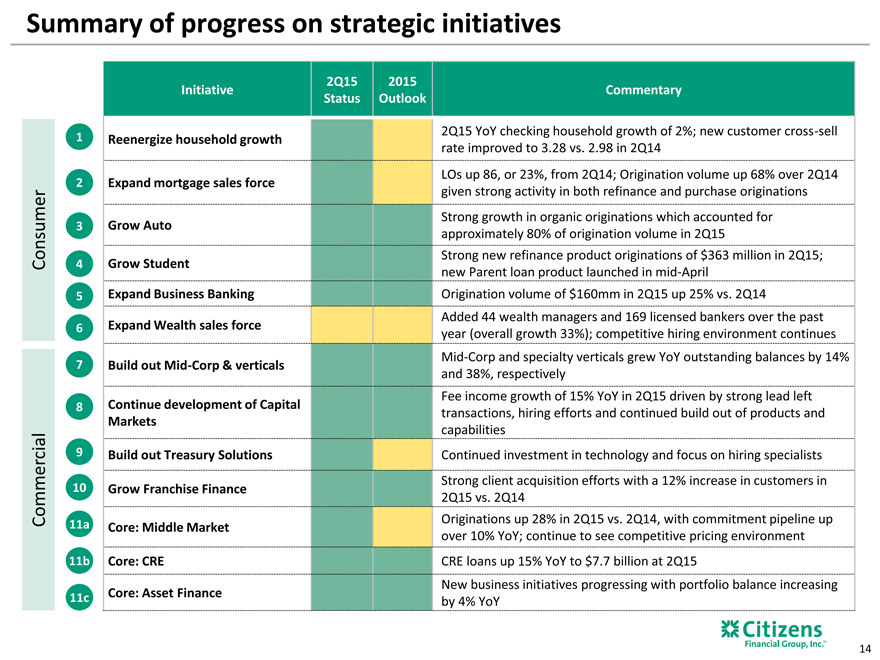
| Reenergize household growth 2Q15 YoY checking household growth of 2%; new customer cross-sell |
rate improved to 3.28 vs. 2.98 in 2Q14
LOs up 86, or 23%, from 2Q14; Origination volume up 68% over 2Q14
2 |
| Expand mortgage sales force |
given strong activity in both refinance and purchase originations
Strong growth in organic originations which accounted for
3 |
| Grow Auto approximately 80% of origination volume in 2Q15 |
Strong new refinance product originations of $363 million in 2Q15;
Consumer 4 Grow Student
new Parent loan product launched in mid-April
5 |
| Expand Business Banking Origination volume of $160mm in 2Q15 up 25% vs. 2Q14 |
Added 44 wealth managers and 169 licensed bankers over the past
6 |
| Expand Wealth sales force year (overall growth 33%); competitive hiring environment continues |
Mid-Corp and specialty verticals grew YoY outstanding balances by 14%
7 |
| Build out Mid-Corp & verticals |
and 38%, respectively
Fee income growth of 15% YoY in 2Q15 driven by strong lead left
8 |
| Continue development of Capital transactions, hiring efforts and continued build out of products and |
Markets
capabilities
9 Build out Treasury Solutions Continued investment in technology and focus on hiring specialists
10 Grow Franchise Finance Strong client acquisition efforts with a 12% increase in customers in
2Q15 vs. 2Q14
Commercial Originations up 28% in 2Q15 vs. 2Q14, with commitment pipeline up
11a Core: Middle Market
over 10% YoY; continue to see competitive pricing environment
11b Core: CRE CRE loans up 15% YoY to $7.7 billion at 2Q15
New business initiatives progressing with portfolio balance increasing
Core: Asset Finance
11c by 4% YoY
14
|
Strong credit quality trends continue
$ s in millions Net charge-offs (recoveries)
$88
$ 68 $80 $54 $78
$9
$ 11 $6 $7 $3
$75 $72 $68
$ 70 $69
0.31% 0.38% 0.35% 0.33%
0.23%
$7
($ 13) $4 $2 ($22)
2Q14 3Q14 4Q14 1Q15 2Q15
Commercial Retail
SBO Net c/o ratio
Provision for credit losses, charge-offs, NPLs
$88
$77 $80 $78 $77
$68 $72
$54 $58
$49
$1.2B $1.1B $1.1B $1.1B $1.1B
2Q14 3Q14 4Q14 1Q15 2Q15
Net charge-offs Provision NPLs
For credit
losses
1 |
| Allowance for loan and lease losses to nonperforming loans and leases. |
Highlights
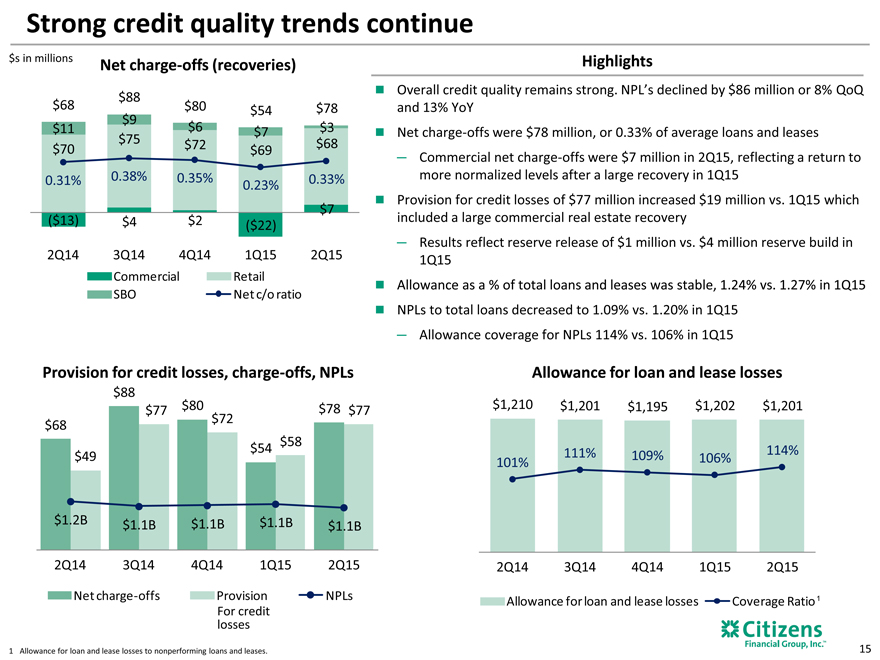
Overall credit quality remains strong. NPL’s declined by $86 million or 8% QoQ and 13% YoY
Net charge-offs were $78 million, or 0.33% of average loans and leases
Commercial net charge-offs were $7 million in 2Q15, reflecting a return to more normalized levels after a large recovery in 1Q15
Provision for credit losses of $77 million increased $19 million vs. 1Q15 which included a large commercial real estate recovery
Results reflect reserve release of $1 million vs. $4 million reserve build in 1Q15
Allowance as a % of total loans and leases was stable, 1.24% vs. 1.27% in 1Q15
NPLs to total loans decreased to 1.09% vs. 1.20% in 1Q15
Allowance coverage for NPLs 114% vs. 106% in 1Q15
Allowance for loan and lease losses
$1,210 $1,201 $1,195 $1,202 $1,201
101% 111% 109% 106% 114%
2Q14 3Q14 4Q14 1Q15 2Q15
Allowance for loan and lease losses Coverage Ratio 1
15
|
Capital and liquidity remain strong
as of
$s in billions (period-end) 2Q14 3Q14 4Q14 1Q15 2Q15
Basel I/III transitional basis1,2 Basel I Basel III
Common equity tier 1 capital $ 13.4 $ 13.3 $ 13.2 $ 13.4 $ 13.3
Risk-weighted assets $ 101.4 $ 103.2 $ 106.0 $ 109.8 $ 112.1
Common equity tier 1 ratio 13.3 % 12.9 % 12.4 % 12.2 % 11.8 %
Total capital ratio 16.2 % 16.1 % 15.8 % 15.5 % 15.3 %
Basel III fully phased-in1,3
Common equity tier 1 ratio 13.0% 12.5% 12.1% 12.1% 11.8%
Basel III minimum for CET1 ratio 2015 2016 2017 2018 2019
Basel III minimum plus phased-in
capital conservation buffer 4.5 % 5.1 % 5.8 % 6.4 % 7.0 %
Capital ratio trend Loan-to-deposit ratio5
16.2% 16.1% 15.8% 15.5% 15.3% 97% 97% 98% 96% 97%
13.3% 12.9%
12.4% 12.2% 11.8%
2Q14 3Q14 4Q14 1Q15 2Q15 2Q14 3Q14 4Q14 1Q15 2Q15
Total capital ratio 1,2
Common equity tier 1 ratio 1,2
Highlights
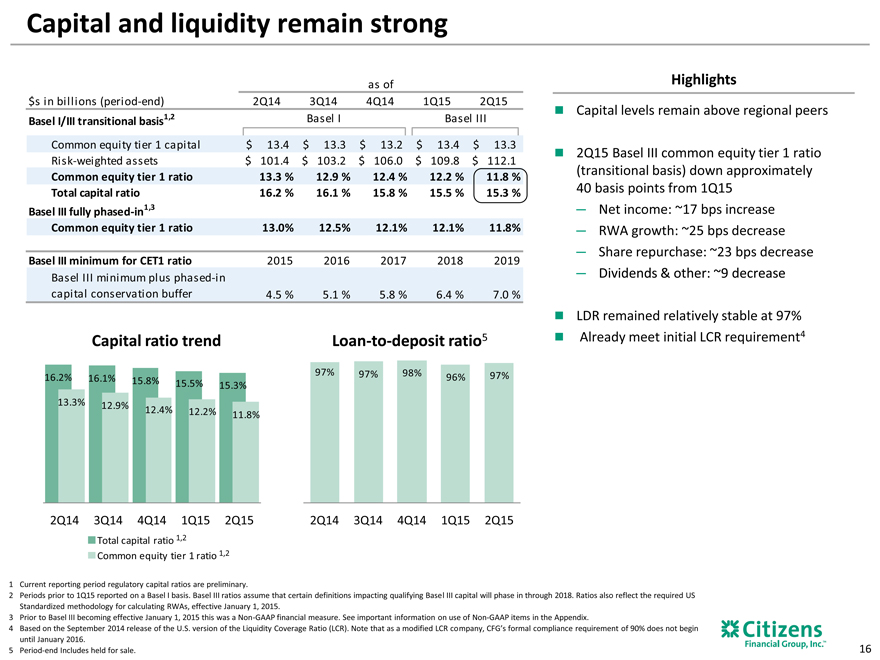
Capital levels remain above regional peers
2Q15 Basel III common equity tier 1 ratio (transitional basis) down approximately 40 basis points from 1Q15
Net income: ~17 bps increase
RWA growth: ~25 bps decrease
Share repurchase: ~23 bps decrease
Dividends & other: ~9 decrease
LDR remained relatively stable at 97% Already meet initial LCR requirement4
Current reporting period regulatory capital ratios are preliminary.
Periods prior to 1Q15 reported on a Basel I basis. Basel III ratios assume that certain definitions impacting qualifying Basel III capital will phase in through 2018. Ratios also reflect the required US Standardized methodology for calculating RWAs, effective January 1, 2015.
Prior to Basel III becoming effective January 1, 2015 this was a Non-GAAP financial measure. See important information on use of Non-GAAP items in the Appendix.
Based on the September 2014 release of the U.S. version of the Liquidity Coverage Ratio (LCR). Note that as a modified LCR company, CFG’s formal compliance requirement of 90% does not begin until January 2016.
Period-end Includes held for sale.
16
|
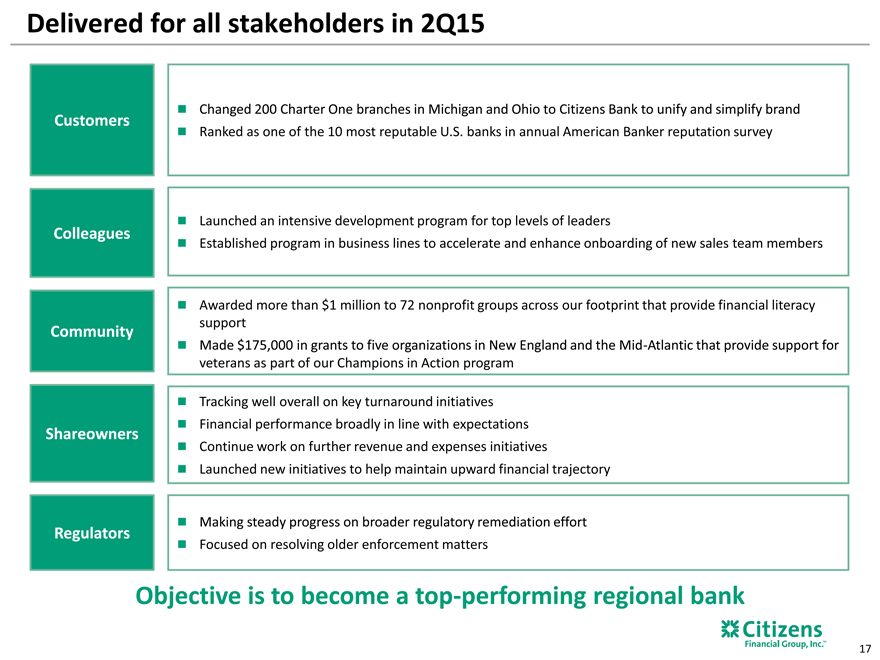
Delivered for all stakeholders in 2Q15
Changed 200 Charter One branches in Michigan and Ohio to Citizens Bank to unify and simplify brand
Customers
Ranked as one of the 10 most reputable U.S. banks in annual American Banker reputation survey
Launched an intensive development program for top levels of leaders
Colleagues
Established program in business lines to accelerate and enhance onboarding of new sales team members
Awarded more than $1 million to 72 nonprofit groups across our footprint that provide financial literacy
Community support
Made $175,000 in grants to five organizations in New England and the Mid-Atlantic that provide support for
veterans as part of our Champions in Action program
Tracking well overall on key turnaround initiatives
Financial performance broadly in line with expectations
Shareowners
Continue work on further revenue and expenses initiatives
Launched new initiatives to help maintain upward financial trajectory
Making steady progress on broader regulatory remediation effort
Regulators
Focused on resolving older enforcement matters
Objective is to become a top-performing regional bank
17
|
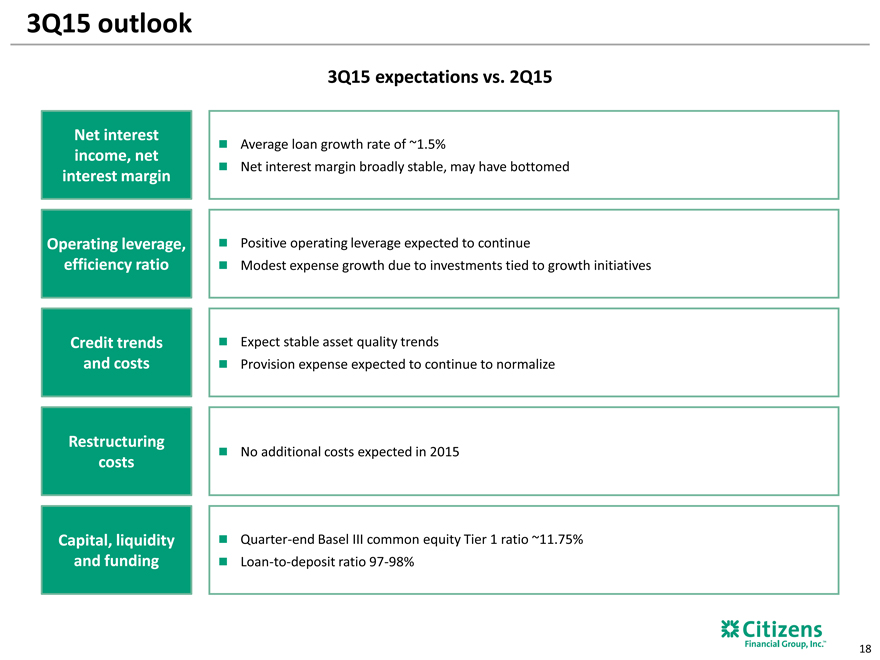
3Q15 outlook
3Q15 expectations vs. 2Q15
Net interest Average loan growth rate of ~1.5%
income, net
Net interest margin broadly stable, may have bottomed
interest margin
Operating leverage, Positive operating leverage expected to continue
efficiency ratio Modest expense growth due to investments tied to growth initiatives
Credit trends Expect stable asset quality trends
and costs Provision expense expected to continue to normalize
Restructuring
No additional costs expected in 2015
costs
Capital, liquidity Quarter-end Basel III common equity Tier 1 ratio ~11.75%
and funding Loan-to-deposit ratio 97-98%
18
|
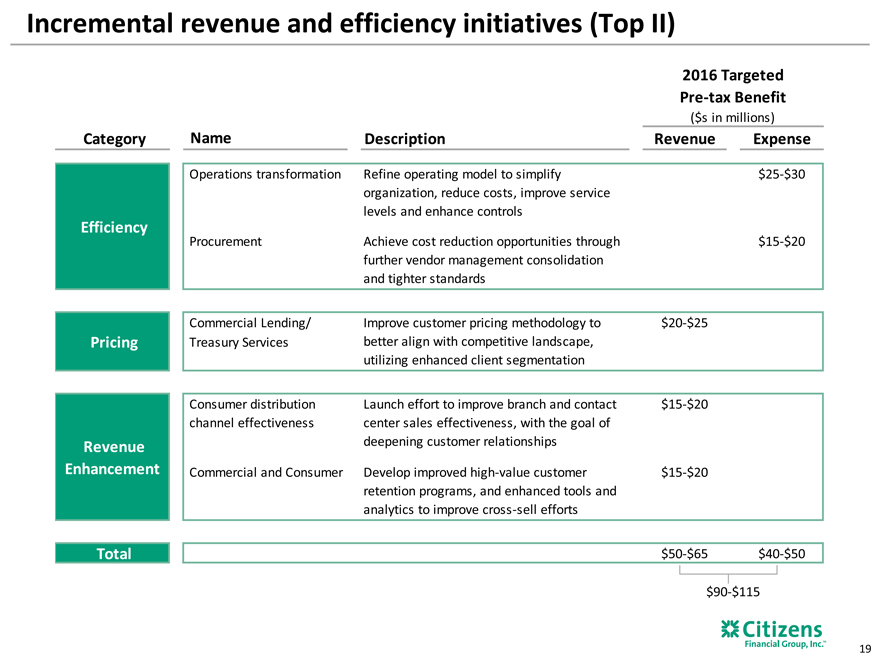
Incremental revenue and efficiency initiatives (Top II)
2016 Targeted
Pre-tax Benefit
($s in millions)
Category Name Description Revenue Expense
Operations transformation Refine operating model to simplify $25-$30
organization, reduce costs, improve service
levels and enhance controls
Efficiency
Procurement Achieve cost reduction opportunities through $15-$20
further vendor management consolidation
and tighter standards
Commercial Lending/ Improve customer pricing methodology to $20-$25
Pricing Treasury Services better align with competitive landscape,
utilizing enhanced client segmentation
Consumer distribution Launch effort to improve branch and contact $15-$20
channel effectiveness center sales effectiveness, with the goal of
Revenue deepening customer relationships
Enhancement Commercial and Consumer Develop improved high-value customer $15-$20
retention programs, and enhanced tools and
analytics to improve cross-sell efforts
Total $50-$65 $40-$50
$90-$115
19
|
Impact on guidance
Broadly reaffirm overall FY 2015 guidance provided on 4Q14 earnings call
Expectation is for lower revenues offset by better expenses, credit provision
Main headwind from rates; now assuming only one rate hike at year-end
Expect Top II initiatives to provide ~$25 million pre-tax benefit in 2015, thereby protecting outlook
Targeted benefit of Top II revenue and efficiency initiatives for 2016 primarily offset slower build on fee-based business, lower NIM starting point
Expect to be able to cover “ROTCE walk” elements ex-rates impact (NII & OCI)
Have adjusted timing for Mortgage and Wealth build-outs to extend an additional year given current trends/market conditions
Plans will be regularly adjusted based on market and competitive conditions, will continue to develop new ideas Current forward Fed Funds curve creates revenue gap in 2016
As a result, achievement of 10% ROTCE run-rate target by end 2016 is likely pushed out
Will provide 2016 guidance in January 2016
20
|
Key messages
Continue to execute well on our broad agenda
Good momentum in both Consumer and Commercial
Have developed new initiatives to continue our upward financial trajectory Asset sensitivity continues to be stable, await benefit from higher rates Asset quality, capital ratios, and liquidity position remain strong
21
|
Appendix
22
|
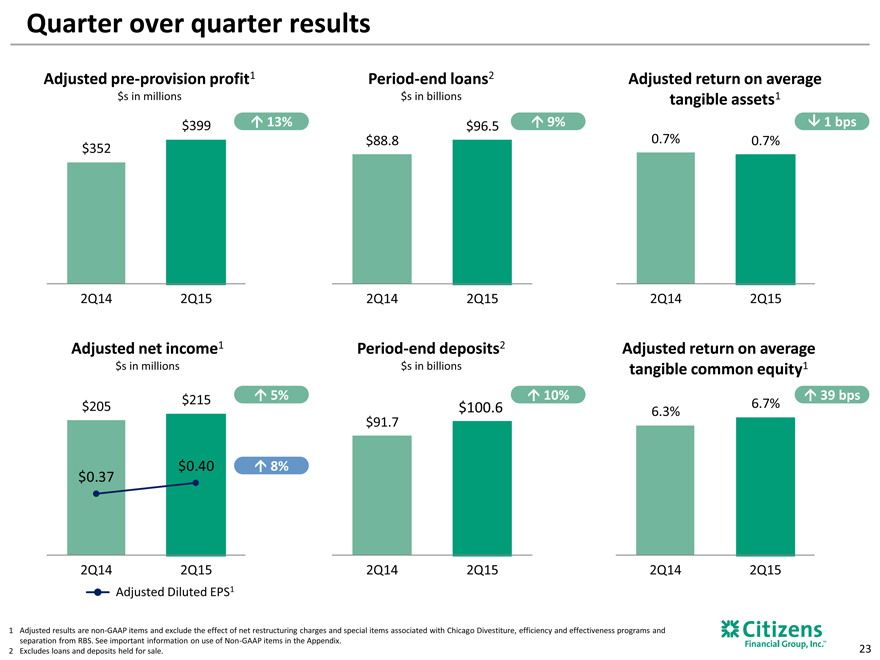
Quarter over quarter results
Adjusted pre-provision profit1 Period-end loans2 Adjusted return on average
$s in millions $s in billions tangible assets1
$399 13% $96.5 9% 1 bps
$352 $88.8 0.7% 0.7%
2Q14 2Q15 2Q14 2Q15 2Q14 2Q15
Adjusted net income1 Period-end deposits2 Adjusted return on average
$s in millions $s in billions tangible common equity1
$215 5% 10% 39 bps
$205 $100.6 6.3% 6.7%
$91.7
$0.40 8%
$0.37
2Q14 2Q15 2Q14 2Q15 2Q14 2Q15
Adjusted Diluted EPS1
Adjusted results are non-GAAP items and exclude the effect of net restructuring charges and special items associated with Chicago Divestiture, efficiency and effectiveness programs and separation from RBS. See important information on use of Non-GAAP items in the Appendix.
Excludes loans and deposits held for sale.
23
|
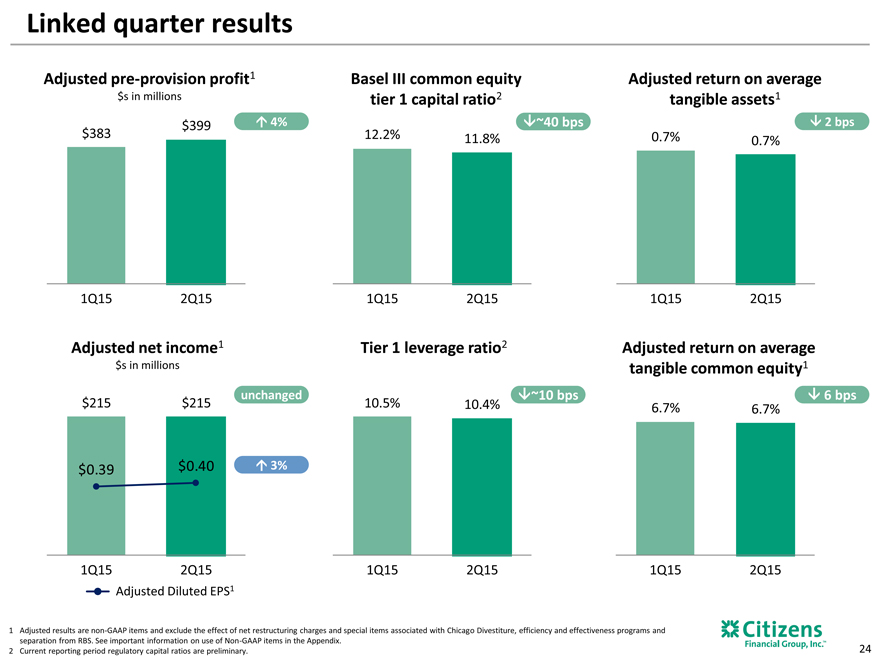
Linked quarter results
Adjusted pre-provision profit1 Basel III common equity Adjusted return on average
$s in millions tier 1 capital ratio2 tangible assets1
$399 4% ~40 bps 2 bps
$383 12.2% 11.8% 0.7% 0.7%
1Q15 2Q15 1Q15 2Q15 1Q15 2Q15
Adjusted net income1 Tier 1 leverage ratio2 Adjusted return on average
$s in millions tangible common equity1
unchanged ~10 bps 6 bps
$215 $215 10.5% 10.4% 6.7% 6.7%
$0.39 $0.40 3%
1Q15 2Q15 1Q15 2Q15 1Q15 2Q15
Adjusted Diluted EPS1
Adjusted results are non-GAAP items and exclude the effect of net restructuring charges and special items associated with Chicago Divestiture, efficiency and effectiveness programs and separation from RBS. See important information on use of Non-GAAP items in the Appendix.
Current reporting period regulatory capital ratios are preliminary.
24
|
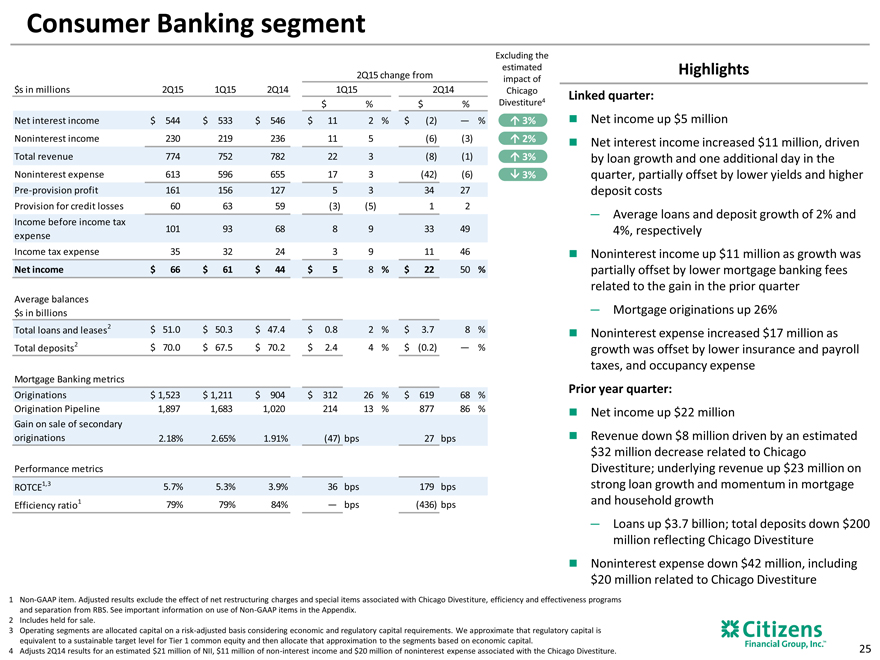
Consumer Banking segment
2Q15 change from
$s in millions 2Q15 1Q15 2Q14 1Q15 2Q14
$ % $ %
Net interest income $ 544 $ 533 $ 546 $ 11 2 % $ (2) — %
Noninterest income 230 219 236 11 5 (6) (3)
Total revenue 774 752 782 22 3 (8) (1)
Noninterest expense 613 596 655 17 3 (42) (6)
Pre-provision profit 161 156 127 5 3 34 27
Provision for credit losses 60 63 59 (3) (5) 1 2
Income before income tax
101 93 68 8 9 33 49
expense
Income tax expense 35 32 24 3 9 11 46
Net income $ 66 $ 61 $ 44 $ 5 8 % $ 22 50 %
Average balances
$s in billions
Total loans and leases2 $ 51.0 $ 50.3 $ 47.4 $ 0.8 2 % $ 3.7 8 %
Total deposits2 $ 70.0 $ 67.5 $ 70.2 $ 2.4 4 % $ (0.2) — %
Mortgage Banking metrics
Originations $ 1,523 $ 1,211 $ 904 $ 312 26 % $ 619 68 %
Origination Pipeline 1,897 1,683 1,020 214 13 % 877 86 %
Gain on sale of secondary
originations 2.18% 2.65% 1.91% (47) bps 27 bps
Performance metrics
ROTCE1,3 5.7% 5.3% 3.9% 36 bps 179 bps
Efficiency ratio1 79% 79% 84% — bps (436) bps
Excluding the
estimated
impact of
Chicago
Divestiture4
3%
2%
3%
3%
Highlights
Linked quarter:
Net income up $5 million
Net interest income increased $11 million, driven by loan growth and one additional day in the quarter, partially offset by lower yields and higher deposit costs
Average loans and deposit growth of 2% and 4%, respectively Noninterest income up $11 million as growth was partially offset by lower mortgage banking fees related to the gain in the prior quarter
Mortgage originations up 26%
Noninterest expense increased $17 million as growth was offset by lower insurance and payroll taxes, and occupancy expense
Prior year quarter:
Net income up $22 million
Revenue down $8 million driven by an estimated $32 million decrease related to Chicago Divestiture; underlying revenue up $23 million on strong loan growth and momentum in mortgage and household growth
Loans up $3.7 billion; total deposits down $200 million reflecting Chicago Divestiture Noninterest expense down $42 million, including $20 million related to Chicago Divestiture
Non-GAAP item. Adjusted results exclude the effect of net restructuring charges and special items associated with Chicago Divestiture, efficiency and effectiveness programs and separation from RBS. See important information on use of Non-GAAP items in the Appendix.
Includes held for sale.
Operating segments are allocated capital on a risk-adjusted basis considering economic and regulatory capital requirements. We approximate that regulatory capital is equivalent to a sustainable target level for Tier 1 common equity and then allocate that approximation to the segments based on economic capital.
Adjusts 2Q14 results for an estimated $21 million of NII, $11 million of non-interest income and $20 million of noninterest expense associated with the Chicago Divestiture.
25
|
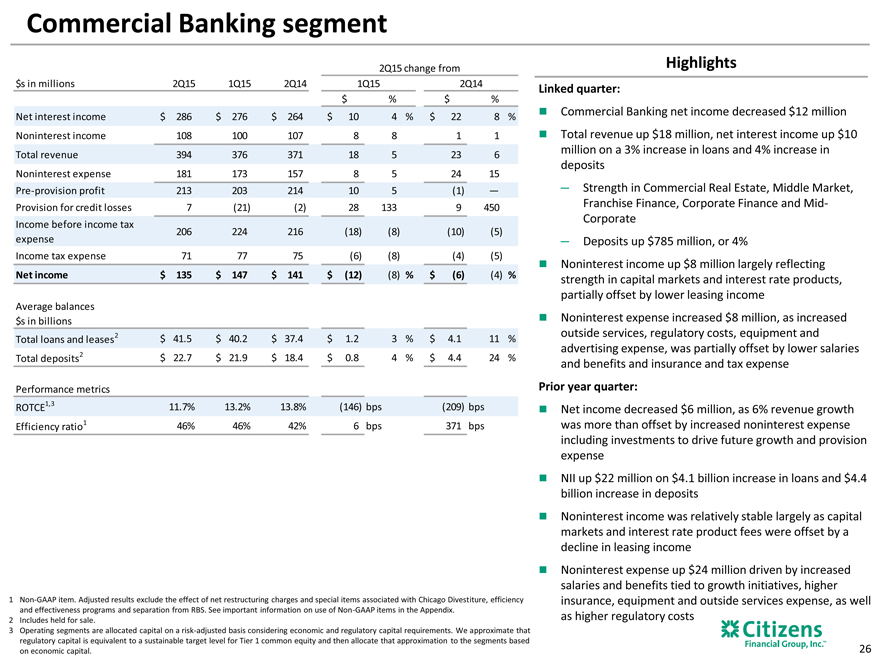
Commercial Banking segment
2Q15 change from
$s in millions 2Q15 1Q15 2Q14 1Q15 2Q14
$ % $ %
Net interest income $ 286 $ 276 $ 264 $ 10 4 % $ 22 8 %
Noninterest income 108 100 107 8 8 1 1
Total revenue 394 376 371 18 5 23 6
Noninterest expense 181 173 157 8 5 24 15
Pre-provision profit 213 203 214 10 5 (1) —
Provision for credit losses 7 (21) (2) 28 133 9 450
Income before income tax
206 224 216 (18) (8) (10) (5)
expense
Income tax expense 71 77 75 (6) (8) (4) (5)
Net income $ 135 $ 147 $ 141 $ (12) (8) % $ (6) (4) %
Average balances
$s in billions
Total loans and leases2 $ 41.5 $ 40.2 $ 37.4 $ 1.2 3 % $ 4.1 11 %
Total deposits2 $ 22.7 $ 21.9 $ 18.4 $ 0.8 4 % $ 4.4 24 %
Performance metrics
ROTCE1,3 11.7% 13.2% 13.8% (146) bps (209) bps
Efficiency ratio1 46% 46% 42% 6 bps 371 bps
Highlights
Linked quarter:
Commercial Banking net income decreased $12 million Total revenue up $18 million, net interest income up $10 million on a 3% increase in loans and 4% increase in deposits
Strength in Commercial Real Estate, Middle Market, Franchise Finance, Corporate Finance and Mid-Corporate
Deposits up $785 million, or 4%
Noninterest income up $8 million largely reflecting strength in capital markets and interest rate products, partially offset by lower leasing income
Noninterest expense increased $8 million, as increased outside services, regulatory costs, equipment and advertising expense, was partially offset by lower salaries and benefits and insurance and tax expense
Prior year quarter:
Net income decreased $6 million, as 6% revenue growth was more than offset by increased noninterest expense including investments to drive future growth and provision expense
NII up $22 million on $4.1 billion increase in loans and $4.4 billion increase in deposits
Noninterest income was relatively stable largely as capital markets and interest rate product fees were offset by a decline in leasing income
Noninterest expense up $24 million driven by increased salaries and benefits tied to growth initiatives, higher insurance, equipment and outside services expense, as well as higher regulatory costs
Non-GAAP item. Adjusted results exclude the effect of net restructuring charges and special items associated with Chicago Divestiture, efficiency and effectiveness programs and separation from RBS. See important information on use of Non-GAAP items in the Appendix.
Includes held for sale.
Operating segments are allocated capital on a risk-adjusted basis considering economic and regulatory capital requirements. We approximate that regulatory capital is equivalent to a sustainable target level for Tier 1 common equity and then allocate that approximation to the segments based on economic capital.
26
|
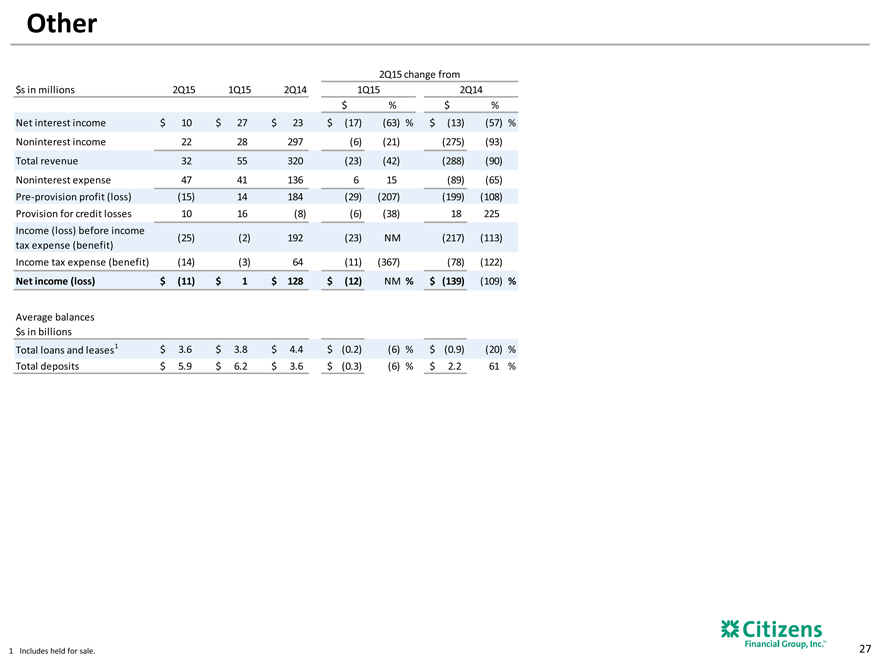
Other
2Q15 change from
$s in millions 2Q15 1Q15 2Q14 1Q15 2Q14
$ % $ %
Net interest income $ 10 $ 27 $ 23 $ (17) (63) % $ (13) (57) %
Noninterest income 22 28 297 (6) (21) (275) (93)
Total revenue 32 55 320 (23) (42) (288) (90)
Noninterest expense 47 41 136 6 15 (89) (65)
Pre-provision profit (loss) (15) 14 184 (29) (207) (199) (108)
Provision for credit losses 10 16 (8) (6) (38) 18 225
Income (loss) before income
(25) |
| (2) 192 (23) NM (217) (113) |
tax expense (benefit)
Income tax expense (benefit) (14) (3) 64 (11) (367) (78) (122)
Net income (loss) $ (11) $ 1 $ 128 $ (12) NM % $ (139) (109) %
Average balances
$s in billions
Total loans and leases1 $ 3.6 $ 3.8 $ 4.4 $ (0.2) (6) % $ (0.9) (20) %
Total deposits $ 5.9 $ 6.2 $ 3.6 $ (0.3) (6) % $ 2.2 61 %
Includes held for sale.
27
|
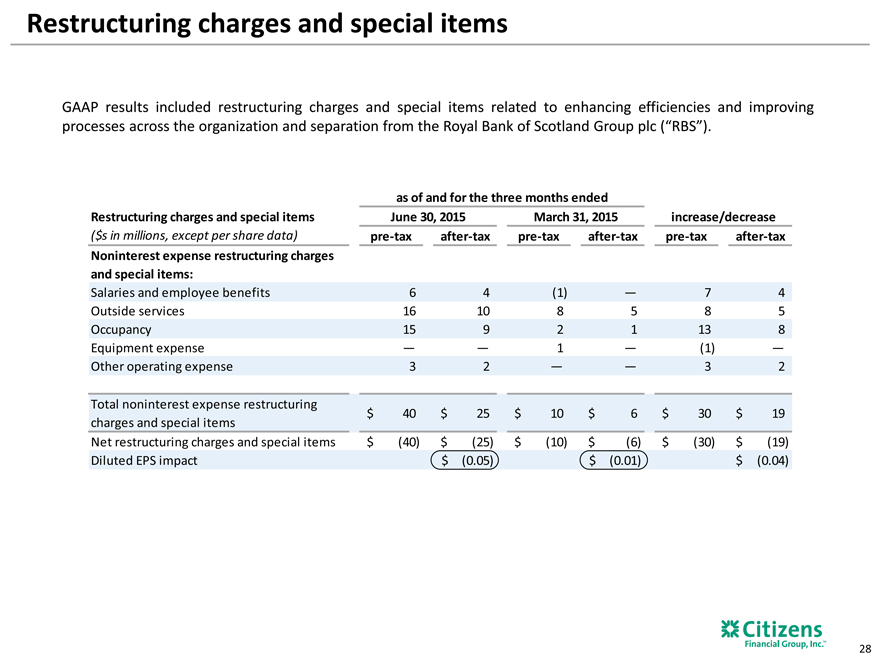
Restructuring charges and special items
GAAP results included restructuring charges and special items related to enhancing efficiencies and improving processes across the organization and separation from the Royal Bank of Scotland Group plc (“RBS”).
as of and for the three months ended
Restructuring charges and special items June 30, 2015 March 31, 2015 increase/decrease
($s in millions, except per share data) pre-tax after-tax pre-tax after-tax pre-tax after-tax
Noninterest expense restructuring charges
and special items:
Salaries and employee benefits 6 4 (1) — 7 4
Outside services 16 10 8 5 8 5
Occupancy 15 9 2 1 13 8
Equipment expense — — 1 — (1) —
Other operating expense 3 2 — — 3 2
Total noninterest expense restructuring
$ 40 $ 25 $ 10 $ 6 $ 30 $ 19
charges and special items
Net restructuring charges and special items $ (40) $ (25) $ (10) $ (6) $ (30) $ (19)
Diluted EPS impact $ (0.05) $ (0.01) $ (0.04)
28
|
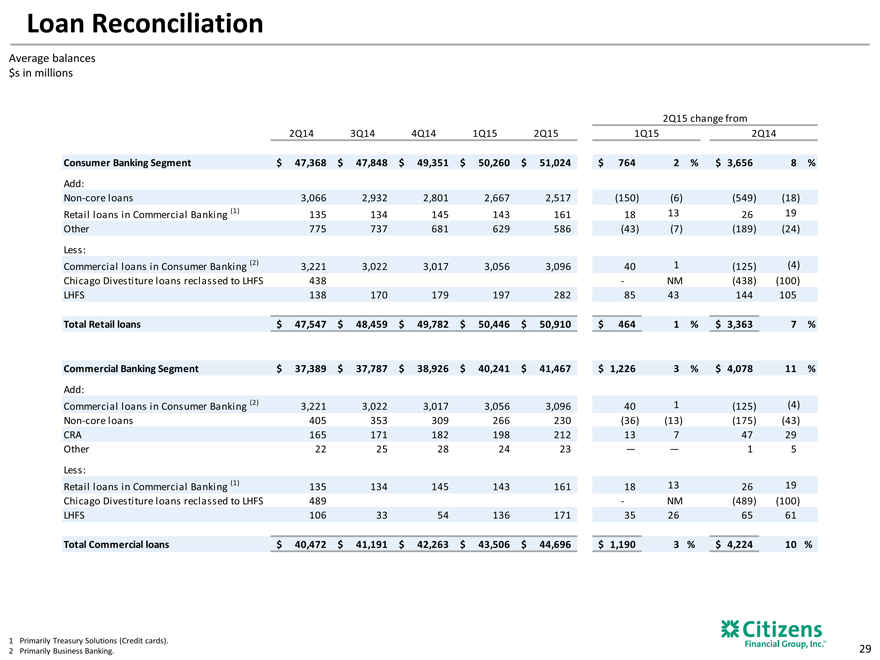
Loan Reconciliation
Average balances $s in millions
2Q15 change from
2Q14 3Q14 4Q14 1Q15 2Q15 1Q15 2Q14
Consumer Banking Segment $ 47,368 $ 47,848 $ 49,351 $ 50,260 $ 51,024 $ 764 2 % $ 3,656 8 %
Add:
Non-core loans 3,066 2,932 2,801 2,667 2,517 (150) (6) (549) (18)
Retail loans in Commercial Banking (1) 135 134 145 143 161 18 13 26 19
Other 775 737 681 629 586 (43) (7) (189) (24)
Less:
Commercial loans in Consumer Banking (2) 3,221 3,022 3,017 3,056 3,096 40 1 (125) (4)
Chicago Divestiture loans reclassed to LHFS 438 — NM (438) (100)
LHFS 138 170 179 197 282 85 43 144 105
Total Retail loans $ 47,547 $ 48,459 $ 49,782 $ 50,446 $ 50,910 $ 464 1 % $ 3,363 7 %
Commercial Banking Segment $ 37,389 $ 37,787 $ 38,926 $ 40,241 $ 41,467 $ 1,226 3 % $ 4,078 11 %
Add:
Commercial loans in Consumer Banking (2) 3,221 3,022 3,017 3,056 3,096 40 1 (125) (4)
Non-core loans 405 353 309 266 230 (36) (13) (175) (43)
CRA 165 171 182 198 212 13 7 47 29
Other 22 25 28 24 23 — — 1 5
Less:
Retail loans in Commercial Banking (1) 135 134 145 143 161 18 13 26 19
Chicago Divestiture loans reclassed to LHFS 489 — NM (489) (100)
LHFS 106 33 54 136 171 35 26 65 61
Total Commercial loans $ 40,472 $ 41,191 $ 42,263 $ 43,506 $ 44,696 $ 1,190 3 % $ 4,224 10 %
Primarily Treasury Solutions (Credit cards).
Primarily Business Banking.
29
|
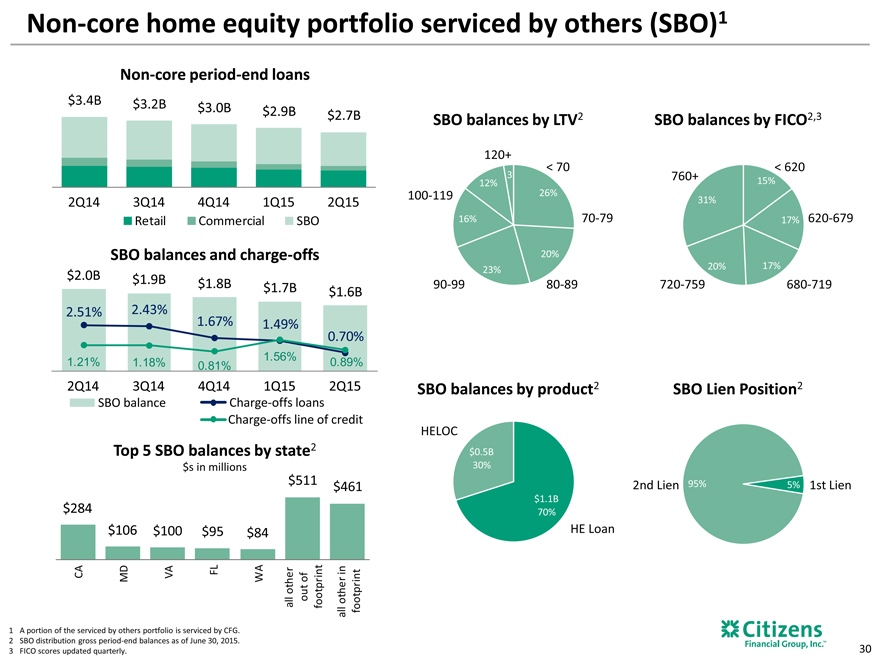
Non-core home equity portfolio serviced by others (SBO)1
Non-core period-end loans
$3.4B $3.2B $3.0B $2.9B
$2.7B
2Q14 3Q14 4Q14 1Q15 2Q15
Retail Commercial SBO
SBO balances and charge-offs
$2.0B
$1.9B $1.8B
$1.7B $1.6B
2.51% 2.43%
1.67% 1.49%
0.70%
1.56%
1.21% 1.18% 0.81% 0.89%
2Q14 3Q14 4Q14 1Q15 2Q15
SBO balance Charge-offs loans
Charge-offs line of credit
Top 5 SBO balances by state2
$s in millions
$511 $461
$284
$106 $100 $95 $84
CA MD VA FL WA of in
all other out footprint other otprint
ll fo
a
SBO balances by LTV2 SBO balances by FICO2,3
120+
< 70 < 620
3 |
| 760+ |
12% 15%
100-119 26% 31%
16% 70-79 17% 620-679
20%
23% 20% 17%
90-99 80-89 720-759 680-719
SBO balances by product2 SBO Lien Position2
HELOC
$0.5B
30%
2nd Lien 95% 5% 1st Lien
$1.1B
70%
HE Loan
A portion of the serviced by others portfolio is serviced by CFG.
SBO distribution gross period-end balances as of June 30, 2015.
FICO scores updated quarterly.
30
|
Non-GAAP Financial Measures
This document contains non-GAAP financial measures. The table below presents reconciliations of certain non-GAAP measures. These reconciliations exclude restructuring charges and/or special items, which are usually included, where applicable, in the financial results presented in accordance with GAAP. Restructuring charges and special items include expenses related to our efforts to improve processes and enhance efficiencies, as well as rebranding, separation from RBS and regulatory expenses.
The non-GAAP measures set forth below include “total revenue”, “noninterest income”, “ noninterest expense”, “pre-provision profit”, “income before income tax expense (benefit)”, “income tax expense (benefit)”, “net income (loss)”, “salaries and employee benefits”, “outside services”, “occupancy”, “equipment expense”, “amortization of software”, “other operating expense”, “net income (loss) per average common share”, “return of average common equity” and “return on average total assets”. In addition, we present computations for “tangible book value per common share”, “return on average tangible common equity”, “return on average total tangible assets” and “efficiency ratio” as part of our non-GAAP measures. Additionally, “pro forma Basel III fully phased-in common equity tier 1 capital” computations for periods prior to first quarter 2015 are presented as part of our non-GAAP measures.
We believe these non-GAAP measures provide useful information to investors because these are among the measures used by our management team to evaluate our operating performance and make day-to-day operating decisions. In addition, we believe restructuring charges and special items in any period do not reflect the operational performance of the business in that period and, accordingly, it is useful to consider these line items with and without restructuring charges and special items. We believe this presentation also increases comparability of period-to-period results.
We also consider pro forma capital ratios defined by banking regulators but not effective at each period end to be non-GAAP financial measures. Since analysts and banking regulators may assess our capital adequacy using these pro forma ratios, we believe they are useful to provide investors the ability to assess our capital adequacy on the same basis.
Other companies may use similarly titled non-GAAP financial measures that are calculated differently from the way we calculate such measures. Accordingly, our non-GAAP financial measures may not be comparable to similar measures used by other companies. We caution investors not to place undue reliance on such non-GAAP measures, but instead to consider them with the most directly comparable GAAP measure. Non-GAAP financial measures have limitations as analytical tools, and should not be considered in isolation, or as a substitute for our results as reported under GAAP.
31
|
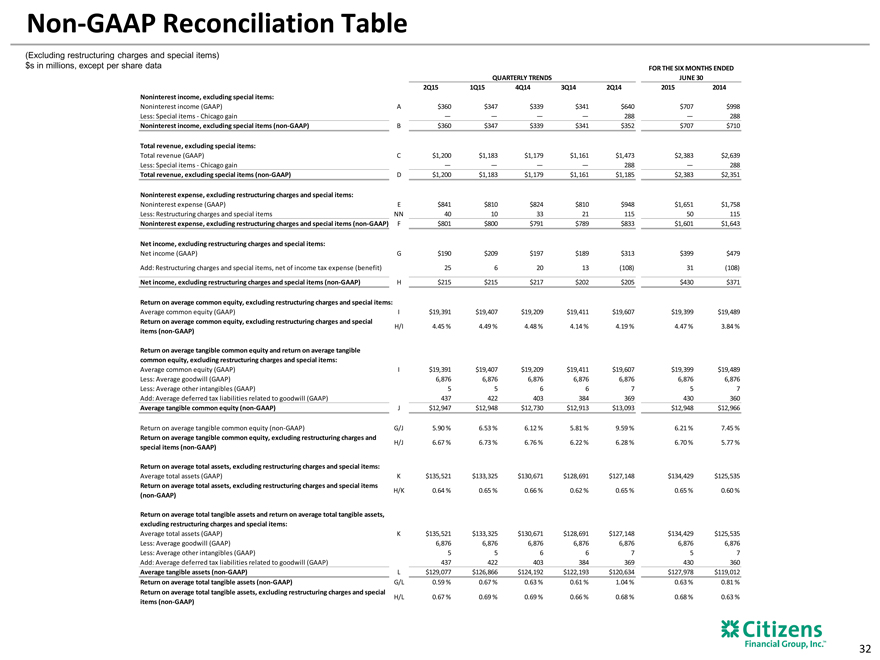
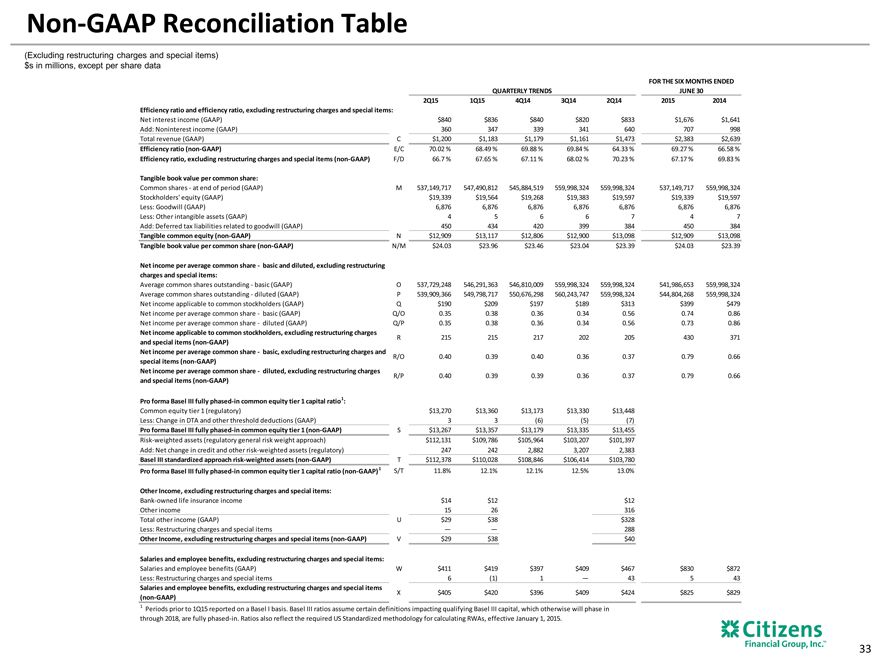
Non-GAAP Reconciliation Table
(Excluding restructuring charges and special items) $s in millions, except per share data
FOR THE SIX MONTHS ENDED
QUARTERLY TRENDS JUNE 30
2Q15 1Q15 4Q14 3Q14 2Q14 2015 2014
Noninterest income, excluding special items:
Noninterest income (GAAP) A $360 $347 $339 $341 $640 $707 $998
Less: Special items—Chicago gain — — — — 288 — 288
Noninterest income, excluding special items (non-GAAP) B $360 $347 $339 $341 $352 $707 $710
Total revenue, excluding special items:
Total revenue (GAAP) C $1,200 $1,183 $1,179 $1,161 $1,473 $2,383 $2,639
Less: Special items—Chicago gain — — — — 288 — 288
Total revenue, excluding special items (non-GAAP) D $1,200 $1,183 $1,179 $1,161 $1,185 $2,383 $2,351
Noninterest expense, excluding restructuring charges and special items:
Noninterest expense (GAAP) E $841 $810 $824 $810 $948 $1,651 $1,758
Less: Restructuring charges and special items NN 40 10 33 21 115 50 115
Noninterest expense, excluding restructuring charges and special items (non-GAAP) F $801 $800 $791 $789 $833 $1,601 $1,643
Net income, excluding restructuring charges and special items:
Net income (GAAP) G $190 $209 $197 $189 $313 $399 $479
Add: Restructuring charges and special items, net of income tax expense (benefit) 25 6 20 13 (108) 31 (108)
Net income, excluding restructuring charges and special items (non-GAAP) H $215 $215 $217 $202 $205 $430 $371
Return on average common equity, excluding restructuring charges and special items:
Average common equity (GAAP) I $19,391 $19,407 $19,209 $19,411 $19,607 $19,399 $19,489
Return on average common equity, excluding restructuring charges and special
H/I 4.45 % 4.49 % 4.48 % 4.14 % 4.19 % 4.47 % 3.84 %
items (non-GAAP)
Return on average tangible common equity and return on average tangible
common equity, excluding restructuring charges and special items:
Average common equity (GAAP) I $19,391 $19,407 $19,209 $19,411 $19,607 $19,399 $19,489
Less: Average goodwill (GAAP) 6,876 6,876 6,876 6,876 6,876 6,876 6,876
Less: Average other intangibles (GAAP) 5 5 6 6 7 5 7
Add: Average deferred tax liabilities related to goodwill (GAAP) 437 422 403 384 369 430 360
Average tangible common equity (non-GAAP) J $12,947 $12,948 $12,730 $12,913 $13,093 $12,948 $12,966
Return on average tangible common equity (non-GAAP) G/J 5.90 % 6.53 % 6.12 % 5.81 % 9.59 % 6.21 % 7.45 %
Return on average tangible common equity, excluding restructuring charges and
H/J 6.67 % 6.73 % 6.76 % 6.22 % 6.28 % 6.70 % 5.77 %
special items (non-GAAP)
Return on average total assets, excluding restructuring charges and special items:
Average total assets (GAAP) K $135,521 $133,325 $130,671 $128,691 $127,148 $134,429 $125,535
Return on average total assets, excluding restructuring charges and special items
H/K 0.64 % 0.65 % 0.66 % 0.62 % 0.65 % 0.65 % 0.60 %
(non-GAAP)
Return on average total tangible assets and return on average total tangible assets,
excluding restructuring charges and special items:
Average total assets (GAAP) K $135,521 $133,325 $130,671 $128,691 $127,148 $134,429 $125,535
Less: Average goodwill (GAAP) 6,876 6,876 6,876 6,876 6,876 6,876 6,876
Less: Average other intangibles (GAAP) 5 5 6 6 7 5 7
Add: Average deferred tax liabilities related to goodwill (GAAP) 437 422 403 384 369 430 360
Average tangible assets (non-GAAP) L $129,077 $126,866 $124,192 $122,193 $120,634 $127,978 $119,012
Return on average total tangible assets (non-GAAP) G/L 0.59 % 0.67 % 0.63 % 0.61 % 1.04 % 0.63 % 0.81 %
Return on average total tangible assets, excluding restructuring charges and special
H/L 0.67 % 0.69 % 0.69 % 0.66 % 0.68 % 0.68 % 0.63 %
items (non-GAAP)
32
|
Non-GAAP Reconciliation Table
(Excluding restructuring charges and special items)
$s in millions, except per share data
FOR THE SIX MONTHS ENDED
QUARTERLY TRENDS JUNE 30
2Q15 1Q15 4Q14 3Q14 2Q14 2015 2014
Efficiency ratio and efficiency ratio, excluding restructuring charges and special items:
Net interest income (GAAP) $840 $836 $840 $820 $833 $1,676 $1,641
Add: Noninterest income (GAAP) 360 347 339 341 640 707 998
Total revenue (GAAP) C $1,200 $1,183 $1,179 $1,161 $1,473 $2,383 $2,639
Efficiency ratio (non-GAAP) E/C 70.02 % 68.49 % 69.88 % 69.84 % 64.33 % 69.27 % 66.58 %
Efficiency ratio, excluding restructuring charges and special items (non-GAAP) F/D 66.7 % 67.65 % 67.11 % 68.02 % 70.23 % 67.17 % 69.83 %
Tangible book value per common share:
Common shares—at end of period (GAAP) M 537,149,717 547,490,812 545,884,519 559,998,324 559,998,324 537,149,717 559,998,324
Stockholders’ equity (GAAP) $19,339 $19,564 $19,268 $19,383 $19,597 $19,339 $19,597
Less: Goodwill (GAAP) 6,876 6,876 6,876 6,876 6,876 6,876 6,876
Less: Other intangible assets (GAAP) 4 5 6 6 7 4 7
Add: Deferred tax liabilities related to goodwill (GAAP) 450 434 420 399 384 450 384
Tangible common equity (non-GAAP) N $12,909 $13,117 $12,806 $12,900 $13,098 $12,909 $13,098
Tangible book value per common share (non-GAAP) N/M $24.03 $23.96 $23.46 $23.04 $23.39 $24.03 $23.39
Net income per average common share—basic and diluted, excluding restructuring
charges and special items:
Average common shares outstanding—basic (GAAP) O 537,729,248 546,291,363 546,810,009 559,998,324 559,998,324 541,986,653 559,998,324
Average common shares outstanding—diluted (GAAP) P 539,909,366 549,798,717 550,676,298 560,243,747 559,998,324 544,804,268 559,998,324
Net income applicable to common stockholders (GAAP) Q $190 $209 $197 $189 $313 $399 $479
Net income per average common share—basic (GAAP) Q/O 0.35 0.38 0.36 0.34 0.56 0.74 0.86
Net income per average common share—diluted (GAAP) Q/P 0.35 0.38 0.36 0.34 0.56 0.73 0.86
Net income applicable to common stockholders, excluding restructuring charges
R 215 215 217 202 205 430 371
and special items (non-GAAP)
Net income per average common share—basic, excluding restructuring charges and
R/O 0.40 0.39 0.40 0.36 0.37 0.79 0.66
special items (non-GAAP)
Net income per average common share—diluted, excluding restructuring charges
R/P 0.40 0.39 0.39 0.36 0.37 0.79 0.66
and special items (non-GAAP)
Pro forma Basel III fully phased-in common equity tier 1 capital ratio1 :
Common equity tier 1 (regulatory) $13,270 $13,360 $13,173 $13,330 $13,448
Less: Change in DTA and other threshold deductions (GAAP) 3 3 (6) (5) (7)
Pro forma Basel III fully phased-in common equity tier 1 (non-GAAP) S $13,267 $13,357 $13,179 $13,335 $13,455
Risk-weighted assets (regulatory general risk weight approach) $112,131 $109,786 $105,964 $103,207 $101,397
Add: Net change in credit and other risk-weighted assets (regulatory) 247 242 2,882 3,207 2,383
Basel III standardized approach risk-weighted assets (non-GAAP) T $112,378 $110,028 $108,846 $106,414 $103,780
Pro forma Basel III fully phased-in common equity tier 1 capital ratio (non-GAAP)1 S/T 11.8% 12.1% 12.1% 12.5% 13.0%
Other Income, excluding restructuring charges and special items:
Bank-owned life insurance income $14 $12 $12
Other income 15 26 316
Total other income (GAAP) U $29 $38 $328
Less: Restructuring charges and special items — — 288
Other Income, excluding restructuring charges and special items (non-GAAP) V $29 $38 $40
Salaries and employee benefits, excluding restructuring charges and special items:
Salaries and employee benefits (GAAP) W $411 $419 $397 $409 $467 $830 $872
Less: Restructuring charges and special items 6 (1) 1 — 43 5 43
Salaries and employee benefits, excluding restructuring charges and special items
X $405 $420 $396 $409 $424 $825 $829
(non-GAAP)
1 Periods prior to 1Q15 reported on a Basel I basis. Basel III ratios assume certain definitions impacting qualifying Basel III capital, which otherwise will phase in
through 2018, are fully phased-in. Ratios also reflect the required US Standardized methodology for calculating RWAs, effective January 1, 2015.
33
|
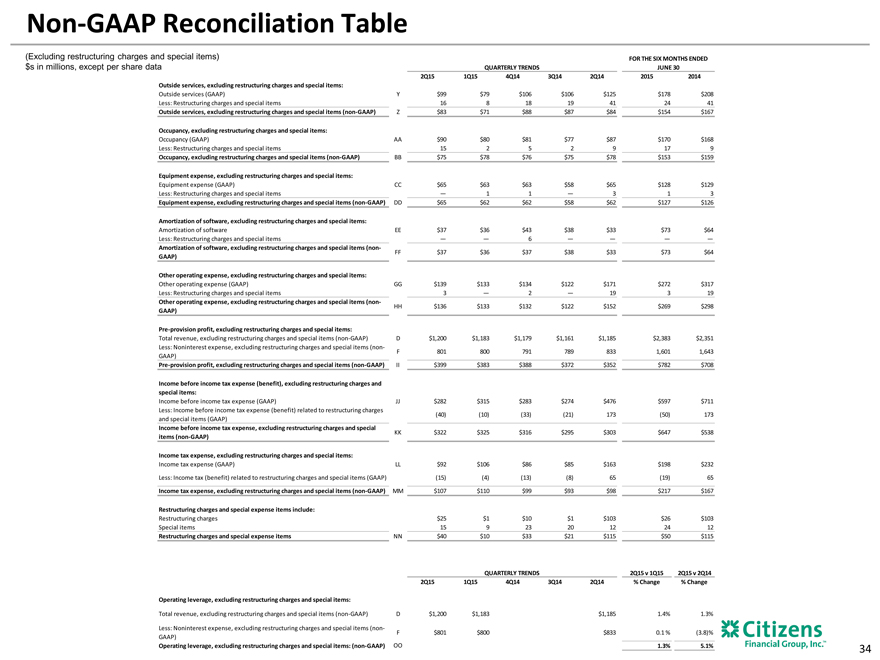
Non-GAAP Reconciliation Table
(Excluding restructuring charges and special items) FOR THE SIX MONTHS ENDED
$s in millions, except per share data QUARTERLY TRENDS JUNE 30
2Q15 1Q15 4Q14 3Q14 2Q14 2015 2014
Outside services, excluding restructuring charges and special items:
Outside services (GAAP) Y $99 $79 $106 $106 $125 $178 $208
Less: Restructuring charges and special items 16 8 18 19 41 24 41
Outside services, excluding restructuring charges and special items (non-GAAP) Z $83 $71 $88 $87 $84 $154 $167
Occupancy, excluding restructuring charges and special items:
Occupancy (GAAP) AA $90 $80 $81 $77 $87 $170 $168
Less: Restructuring charges and special items 15 2 5 2 9 17 9
Occupancy, excluding restructuring charges and special items (non-GAAP) BB $75 $78 $76 $75 $78 $153 $159
Equipment expense, excluding restructuring charges and special items:
Equipment expense (GAAP) CC $65 $63 $63 $58 $65 $128 $129
Less: Restructuring charges and special items — 1 1 — 3 1 3
Equipment expense, excluding restructuring charges and special items (non-GAAP) DD $65 $62 $62 $58 $62 $127 $126
Amortization of software, excluding restructuring charges and special items:
Amortization of software EE $37 $36 $43 $38 $33 $73 $64
Less: Restructuring charges and special items — — 6 — — — —
Amortization of software, excluding restructuring charges and special items (non-
FF $37 $36 $37 $38 $33 $73 $64
GAAP)
Other operating expense, excluding restructuring charges and special items:
Other operating expense (GAAP) GG $139 $133 $134 $122 $171 $272 $317
Less: Restructuring charges and special items 3 — 2 — 19 3 19
Other operating expense, excluding restructuring charges and special items (non-
HH $136 $133 $132 $122 $152 $269 $298
GAAP)
Pre-provision profit, excluding restructuring charges and special items:
Total revenue, excluding restructuring charges and special items (non-GAAP) D $1,200 $1,183 $1,179 $1,161 $1,185 $2,383 $2,351
Less: Noninterest expense, excluding restructuring charges and special items (non-
F 801 800 791 789 833 1,601 1,643
GAAP)
Pre-provision profit, excluding restructuring charges and special items (non-GAAP) II $399 $383 $388 $372 $352 $782 $708
Income before income tax expense (benefit), excluding restructuring charges and
special items:
Income before income tax expense (GAAP) JJ $282 $315 $283 $274 $476 $597 $711
Less: Income before income tax expense (benefit) related to restructuring charges
(40) |
| (10) (33) (21) 173 (50) 173 |
and special items (GAAP)
Income before income tax expense, excluding restructuring charges and special
KK $322 $325 $316 $295 $303 $647 $538
items (non-GAAP)
Income tax expense, excluding restructuring charges and special items:
Income tax expense (GAAP) LL $92 $106 $86 $85 $163 $198 $232
Less: Income tax (benefit) related to restructuring charges and special items (GAAP) (15) (4) (13) (8) 65 (19) 65
Income tax expense, excluding restructuring charges and special items (non-GAAP) MM $107 $110 $99 $93 $98 $217 $167
Restructuring charges and special expense items include:
Restructuring charges $25 $1 $10 $1 $103 $26 $103
Special items 15 9 23 20 12 24 12
Restructuring charges and special expense items NN $40 $10 $33 $21 $115 $50 $115
QUARTERLY TRENDS 2Q15 v 1Q15 2Q15 v 2Q14
2Q15 1Q15 4Q14 3Q14 2Q14 % Change % Change
Operating leverage, excluding restructuring charges and special items:
Total revenue, excluding restructuring charges and special items (non-GAAP) D $1,200 $1,183 $1,185 1.4% 1.3%
Less: Noninterest expense, excluding restructuring charges and special items (non-
F $801 $800 $833 0.1 % (3.8)%
GAAP)
34
|

Non-GAAP Reconciliation Table
Non-GAAP Reconciliation—Segments
$s in millions T hree M o nths Ended June 30, T hree M o nths Ended M arch 31, T hree M o nths Ended D ecember 31,
2015 2015 2014
C o nsumer C o mmercial C o nsumer C o mmercial C o nsumer C o mmercial
B anking B anking Other C o nso lidated B anking B anking Other C o nso lidated B anking B anking Other C o nso lidated
Net income (loss) (GAAP) A $66 $135 ($11) $190 $61 $147 $1 $209 $52 $140 $5 $197
R eturn o n average tangible co mmo n equity
Average common equity (GAAP) B $4,681 $4,625 $10,085 $19,391 $4,649 $4,526 $10,232 $19,407 $4,756 $4,334 $10,119 $19,209
Less: Average goodwill (GAAP) — — 6,876 6,876 — — 6,876 6,876 — — 6,876 6,876
Average other intangibles (GAAP) — — 5 5 — — 5 5 — — 6 6
Add: Average deferred tax liabilities related to goodwill (GAAP) — — 437 437 — — 422 422 — — 403 403
Average tangible common equity (non-GAAP) C $4,681 $4,625 $3,641 $12,947 $4,649 $4,526 $3,773 $12,948 $4,756 $4,334 $3,640 $12,730
Return on average tangible common equity (non-GAAP) A/C 5.66 % 11.69 % NM 5.90 % 5.30 % 13.15 % NM 6.53 % 4.30 % 12.76 % NM 6.12 %
Return on average total tangible assets
Average total assets (GAAP) D $52,489 $42,617 $40,415 $135,521 $51,602 $41,606 $40,117 $133,325 $50,546 $40,061 $40,064 $130,671
Less: Average goodwill (GAAP) — — 6,876 6,876 — — 6,876 6,876 — — 6,876 6,876
Average other intangibles (GAAP) — — 5 5 — — 5 5 — — 6 6
Add: Average deferred tax liabilities related to goodwill (GAAP) — — 437 437 — — 422 422 — — 403 403
Average tangible assets (non-GAAP) E $52,489 $42,617 $33,971 $129,077 $51,602 $41,606 $33,658 $126,866 $50,546 $40,061 $33,585 $124,192
Return on average total tangible assets (non-GAAP) A/E 0.51% 1.27 % NM 0.59 % 0.48 % 1.43 % NM 0.67 % 0.40 % 1.38 % NM 0.63 %
Efficiency ratio
Noninterest expense (GAAP) F $613 $181 $47 $841 $596 $173 $41 $810 $611 $180 $33 $824
Net interest income (GAAP) 544 286 10 840 533 276 27 836 536 283 21 840
Noninterest income (GAAP) 230 108 22 360 219 100 28 347 218 111 10 339
Total revenue G $774 $394 $32 $1,200 $752 $376 $55 $1,183 $754 $394 $31 $1,179
Efficiency ratio (non-GAAP) F/G 79.25 % 46.07 % NM 70.02 % 79.25 % 46.01% NM 68.49 % 81.09 % 45.48 % NM 69.88 %
NON-GAAP FINANCIAL MEASURES AND RECONCILIATIONS��SEGMENTS (CONTINUED)
(dollars in millions)
Three Months Ended September 30, Three Months Ended June 30,
2014 2014
Consumer Commercial Consumer Commercial
Banking Banking Other Consolidated Banking Banking Other Consolidated
Net income (loss) (GAAP) A $54 $139 ($4) $189 $44 $141 $128 $313
Return o n average tangible commo n equity
Average common equity (GAAP) B $4,685 $4,205 $10,521 $19,411 $4,640 $4,129 $10,838 $19,607
Less: Average goodwill (GAAP) — — 6,876 6,876 — — 6,876 6,876
Average other intangibles (GAAP) — — 6 6 — — 7 7
Add: Average deferred tax liabilities related to goodwill (GAAP) — — 384 384 — — 369 369
Average tangible common equity (non-GAAP) C $4,685 $4,205 $4,023 $12,913 $4,640 $4,129 $4,324 $13,093
Return on average tangible common equity (non-GAAP) A/C 4.57 % 13.10 % NM 5.81% 3.87 % 13.78 % NM 9.59 %
Return on average total tangible assets
Average total assets (GAAP) D $49,012 $38,854 $40,825 $128,691 $48,556 $38,022 $40,570 $127,148
Less: Average goodwill (GAAP) — — 6,876 6,876 — — 6,876 6,876
Average other intangibles (GAAP) — — 6 6 — — 7 7
Add: Average deferred tax liabilities related to goodwill (GAAP) — — 384 384 — — 369 369
Average tangible assets (non-GAAP) E $49,012 $38,854 $34,327 $122,193 $48,556 $38,022 $34,056 $120,634
Return on average total tangible assets (non-GAAP) A/E 0.44 % 1.42 % NM 0.61% 0.37 % 1.50 % NM 1.04 %
Efficiency ratio
Noninterest expense (GAAP) F $609 $162 $39 $810 $655 $157 $136 $948
Net interest income (GAAP) 532 270 18 820 546 264 23 833
Noninterest income (GAAP) 226 104 11 341 236 107 297 640
Total revenue G $758 $374 $29 $1,161 $782 $371 $320 $1,473
Efficiency ratio (non-GAAP) F/G 80.42 % 43.35 % NM 69.84 % 83.61% 42.36 % NM 64.33 %
35
|
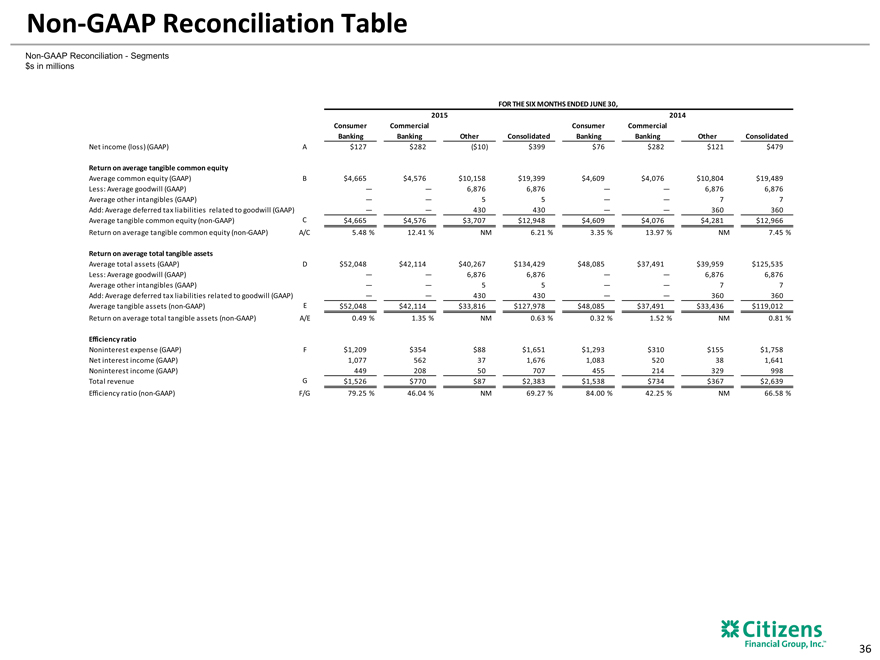
Non-GAAP Reconciliation Table
Non-GAAP Reconciliation—Segments
$s in millions
FOR THE SIX MONTHS ENDED JUNE 30,
2015 2014
Consumer Commercial Consumer Commercial
Banking Banking Other Consolidated Banking Banking Other Consolidated
Net income (loss) (GAAP) A $127 $282 ($10) $399 $76 $282 $121 $479
Return on average tangible common equity
Average common equity (GAAP) B $4,665 $4,576 $10,158 $19,399 $4,609 $4,076 $10,804 $19,489
Less: Average goodwill (GAAP) — — 6,876 6,876 — — 6,876 6,876
Average other intangibles (GAAP) — — 5 5 — — 7 7
Add: Average deferred tax liabilities related to goodwill (GAAP) — — 430 430 — — 360 360
Average tangible common equity (non-GAAP) C $4,665 $4,576 $3,707 $12,948 $4,609 $4,076 $4,281 $12,966
Return on average tangible common equity (non-GAAP) A/C 5.48 % 12.41 % NM 6.21 % 3.35 % 13.97 % NM 7.45 %
Return on average total tangible assets
Average total assets (GAAP) D $52,048 $42,114 $40,267 $134,429 $48,085 $37,491 $39,959 $125,535
Less: Average goodwill (GAAP) — — 6,876 6,876 — — 6,876 6,876
Average other intangibles (GAAP) — — 5 5 — — 7 7
Add: Average deferred tax liabilities related to goodwill (GAAP) — — 430 430 — — 360 360
Average tangible assets (non-GAAP) E $52,048 $42,114 $33,816 $127,978 $48,085 $37,491 $33,436 $119,012
Return on average total tangible assets (non-GAAP) A/E 0.49 % 1.35 % NM 0.63 % 0.32 % 1.52 % NM 0.81 %
Efficiency ratio
Noninterest expense (GAAP) F $1,209 $354 $88 $1,651 $1,293 $310 $155 $1,758
Net interest income (GAAP) 1,077 562 37 1,676 1,083 520 38 1,641
Noninterest income (GAAP) 449 208 50 707 455 214 329 998
Total revenue G $1,526 $770 $87 $2,383 $1,538 $734 $367 $2,639
Efficiency ratio (non-GAAP) F/G 79.25 % 46.04 % NM 69.27 % 84.00 % 42.25 % NM 66.58 %
36
|

Citizens financial Groups, Inc™
37