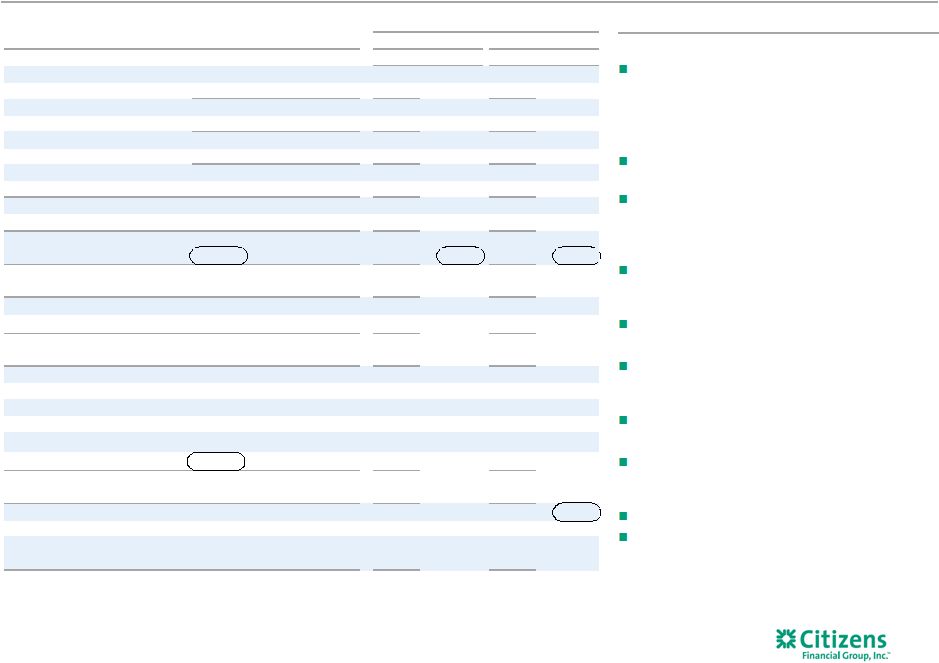
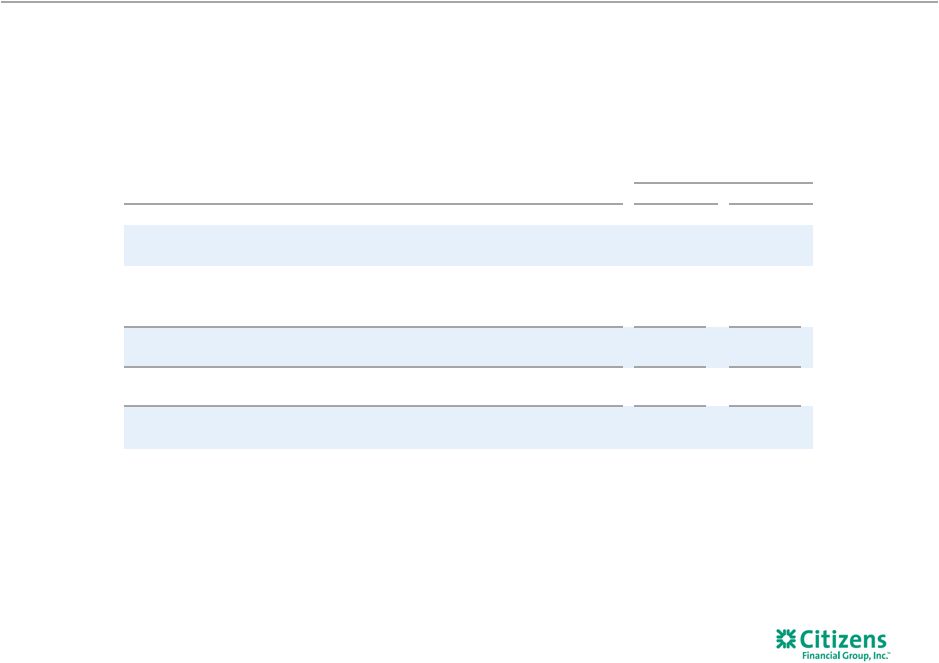
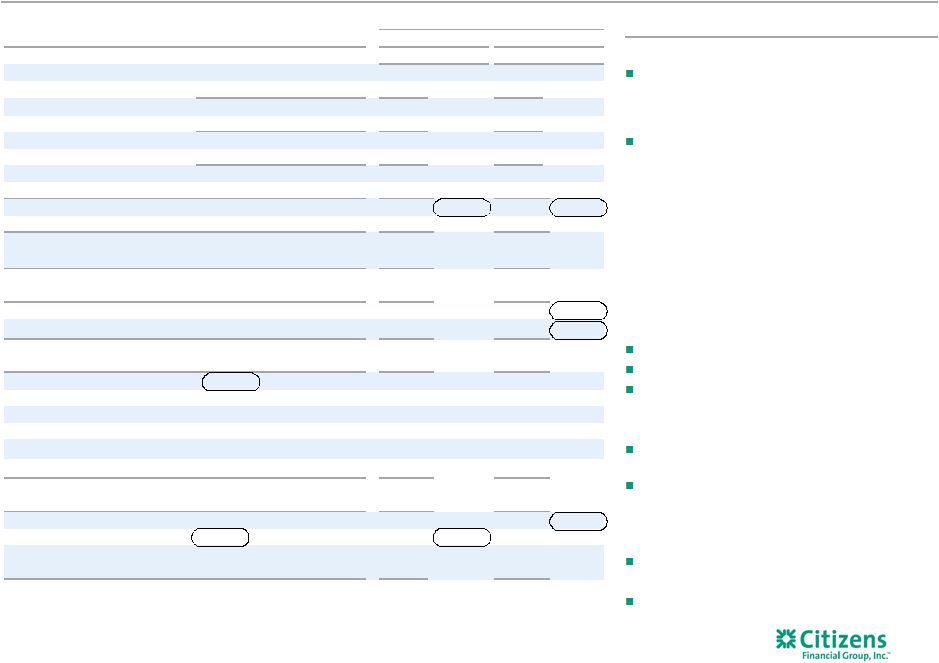
Non-GAAP Reconciliation Table 30 (Excluding restructuring charges and special items) $s in millions, except per share data 3Q15 2Q15 1Q15 4Q14 3Q14 2015 2014 Efficiency ratio and efficiency ratio, excluding restructuring charges and special items: Net interest income (GAAP) $856 $840 $836 $840 $820 $2,532 $2,461 Add: Noninterest income (GAAP) 353 360 347 339 341 1,060 1,339 Total revenue (GAAP) C $1,209 $1,200 $1,183 $1,179 $1,161 $3,592 $3,800 Efficiency ratio (non-GAAP) E/C 66.02 % 70.02 % 68.49 % 69.88 % 69.84 % 68.17 % 67.58 % Efficiency ratio, excluding restructuring charges and special items (non-GAAP) F/D 66.02 % 66.70% 67.65 % 67.11 % 68.02 % 66.78 % 69.23 % Tangible book value per common share: Common shares - at end of period (GAAP) P 527,636,510 537,149,717 547,490,812 545,884,519 559,998,324 527,636,510 559,998,324 Stockholders' equity (GAAP) $19,353 $19,339 $19,564 $19,268 $19,383 $19,353 $19,383 Less: Goodwill (GAAP) 6,876 6,876 6,876 6,876 6,876 6,876 6,876 Less: Other intangible assets (GAAP) 3 4 5 6 6 3 6 Add: Deferred tax liabilities related to goodwill (GAAP) 465 450 434 420 399 465 399 Tangible common equity (non-GAAP) Q $12,939 $12,909 $13,117 $12,806 $12,900 $12,939 $12,900 Tangible book value per common share (non-GAAP) Q/P $24.52 $24.03 $23.96 $23.46 $23.04 $24.52 $23.04 Net income per average common share - basic and diluted, excluding restructuring charges and special items: Average common shares outstanding - basic (GAAP) R 530,985,255 537,729,248 546,291,363 546,810,009 559,998,324 538,279,222 559,998,324 Average common shares outstanding - diluted (GAAP) S 533,398,158 539,909,366 549,798,717 550,676,298 560,243,747 540,926,361 560,081,031 Net income available to common stockholders (GAAP) I $213 $190 $209 $197 $189 $612 $668 Net income per average common share - basic (GAAP) I/R 0.40 0.35 0.38 0.36 0.34 1.14 1.19 Net income per average common share - diluted (GAAP) I/S 0.40 0.35 0.38 0.36 0.34 1.13 1.19 Net income available to common stockholders, excluding restructuring charges and special items (non-GAAP) J 213 215 215 217 202 643 573 Net income per average common share - basic, excluding restructuring charges and special items (non-GAAP) J/R 0.40 0.40 0.39 0.40 0.36 1.20 1.02 Net income per average common share - diluted, excluding restructuring charges and special items (non-GAAP) J/S 0.40 0.40 0.39 0.39 0.36 1.19 1.02 Pro forma Basel III fully phased-in common equity tier 1 capital ratio¹: Common equity tier 1 (regulatory) $13,200 $13,270 $13,360 $13,173 $13,330 Less: Change in DTA and other threshold deductions (GAAP) 2 3 3 (6) (5) Pro forma Basel III fully phased-in common equity tier 1 (non-GAAP) T $13,198 $13,267 $13,357 $13,179 $13,335 Risk-weighted assets (regulatory general risk weight approach) $112,277 $112,131 $109,786 $105,964 $103,207 Add: Net change in credit and other risk-weighted assets (regulatory) 243 247 242 2,882 3,207 Basel III standardized approach risk-weighted assets (non-GAAP) U $112,520 $112,378 $110,028 $108,846 $106,414 Pro forma Basel III fully phased-in common equity tier 1 capital ratio (non-GAAP)¹ T/U 11.7% 11.8% 12.1% 12.1% 12.5% Salaries and employee benefits, excluding restructuring charges and special items: Salaries and employee benefits (GAAP) V $404 $411 $419 $397 $409 $1,234 $1,281 Less: Restructuring charges and special items — 6 (1) 1 — 5 43 Salaries and employee benefits, excluding restructuring charges and special items (non-GAAP) W $404 $405 $420 $396 $409 $1,229 $1,238 FOR THE NINE MONTHS ENDED SEPTEMBER 30 QUARTERLY TRENDS 1 Periods prior to 1Q15 reported on a Basel I basis. Basel III ratios assume certain definitions impacting qualifying Basel III capital, which otherwise will phase in through 2018, are fully phased-in. Ratios also reflect the required US Standardized methodology for calculating RWAs, effective January 1, 2015. |