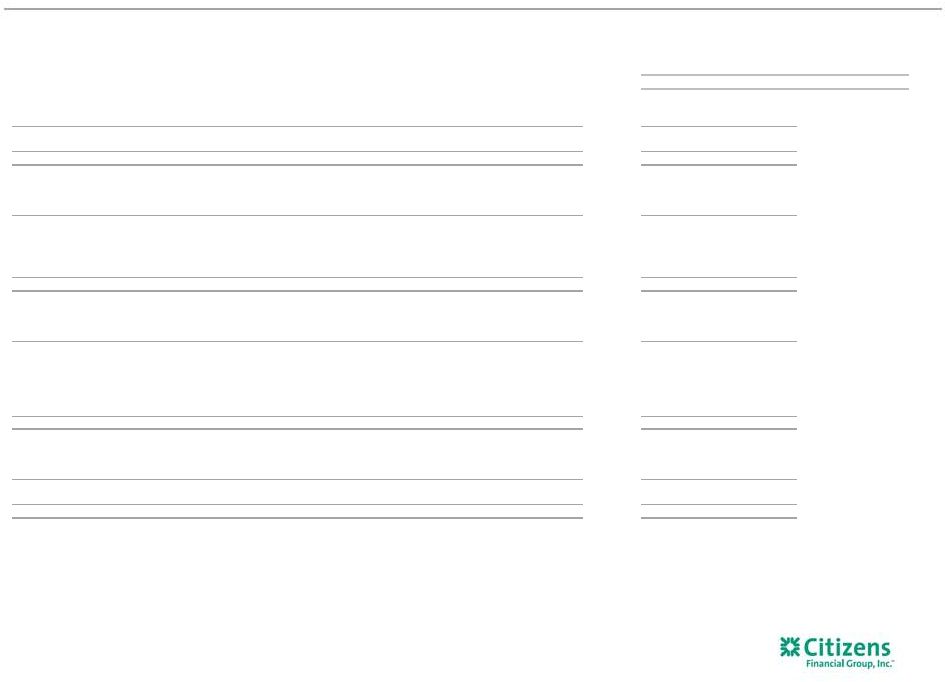
Non-GAAP reconciliation table 22 (Excluding restructuring charges and special items) $s in millions, except per share data 2016 2015 2016 Change from 2015 Total revenue, excluding special items: Total revenue (GAAP) T $1,234 $1,183 Less: Special items - - Total revenues, excluding special items (non-GAAP) U $1,234 $1,183 4.3 % Noninterest expense, excluding restructuring charges and special items: Noninterest expense (GAAP) V $811 $810 Less: Restructuring charges and special items — 10 Noninterest expense, excluding restructuring charges and special items (non-GAAP) W $811 $800 1.4 % Efficiency ratio: Efficiency ratio (non-GAAP) V/T 66 % 68 % Efficiency ratio, excluding restructuring charges and special items (non-GAAP) W/U 66 % 68 % (199) bps Operating leverage: Total revenue (GAAP) T $1,234 $1,183 4% Noninterest expense (GAAP) V $811 $810 0% Operating leverage (non-GAAP) 4% Operating leverage, excluding restructuring charges and special items: Total revenue, excluding restructuring charges and special items (non-GAAP) U $1,234 $1,183 4% Less: Noninterest expense, excluding restructuring charges and special items (non-GAAP) W $811 $800 1% Operating leverage, excluding restructuring charges and special items: (non-GAAP) 3% Net income, excluding restructuring charges and special items: Net income (GAAP) X $223 $209 Add: Restructuring charges and special items, net of income tax expense — 6 Net income, excluding restructuring charges and special items (non-GAAP) Y $223 $215 3.7 % Net income available to common stockholders, excluding restructuring charges and special items: Net income available to common stockholders (GAAP) Z $216 $209 Add: Restructuring charges and special items, net of income tax expense - 6 Net income available to common stockholders, excluding restructuring charges and special items (non-GAAP) AA $216 $215 0.5 % Net income per average common share - basic and diluted, excluding restructuring charges and special items: Average common shares outstanding - basic (GAAP) BB 528,070,648 546,291,363 Average common shares outstanding - diluted (GAAP) CC 530,446,188 549,798,717 Net income available to common stockholders (GAAP) Z 216 209 Net income per average common share - basic (GAAP) Z/BB 0.41 0.38 8 % Net income per average common share - diluted (GAAP) Z/CC 0.41 0.38 8 % Net income available to common stockholders, excluding restructuring charges and special items (non-GAAP) AA 216 215 Net income per average common share - basic, excluding restructuring charges and special items (non-GAAP) AA/BB 0.41 0.39 5 % Net income per average common share - diluted, excluding restructuring charges and special items (non-GAAP) AA/CC 0.41 0.39 5 % Return on average tangible common equity and return on average tangible common equity, excluding restructuring charges and special items: Average common equity (GAAP) $19,567 $19,407 Less: Average goodwill (GAAP) 6,876 6,876 Less: Average other intangibles (GAAP) 3 5 Add: Average deferred tax liabilities related to goodwill (GAAP) 481 422 Average tangible common equity (non-GAAP) DD $13,169 $12,948 Return on average tangible common equity (non-GAAP) Z/DD 6.61 % 6.53 % Return on average tangible common equity, excluding restructuring charges and special items (non-GAAP) AA/DD 6.61 % 6.73 % (12) bps Tangible book value per common share: Common shares - at end of period (GAAP) EE 528,933,727 Stockholders' equity (GAAP) $19,718 Less: Goodwill (GAAP) 6,876 Less: Other intangible assets (GAAP) 3 Add: Deferred tax liabilities related to goodwill (GAAP) 494 Tangible common equity (non-GAAP) FF $13,333 Tangible book value per common share (non-GAAP) FF/EE $25.21 FOR THE QUARTER ENDED MARCH 31, |