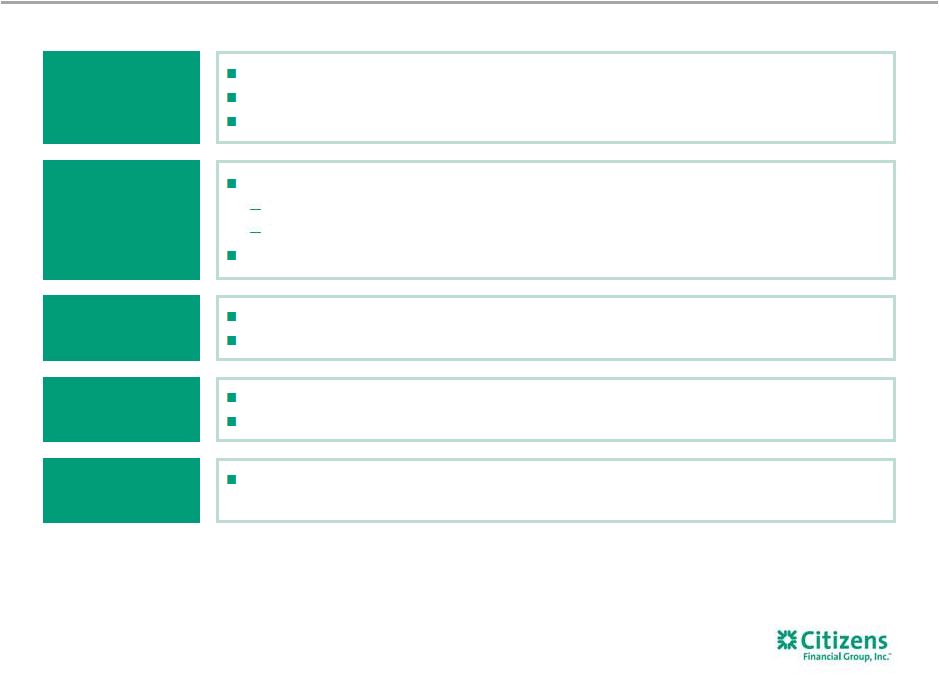
TOP II Program TOP II Program TOP III Program TOP III Program Revenue initiatives Target ~$60-$65 million Citizens Checkup: Launched with more than 210k customer appointments kept to-date; customer satisfaction has been positive with 78% very to completely satisfied Consumer Retention: Initiative underway and showing strength in deposit retention; successful platinum launch driving retention with the Mass Affluent customer segment Middle Market Share of Wallet: Opportunity pipeline remains ~2X larger than historical levels (1) leading to stronger capital markets penetration Commercial Pricing: Re-priced 12,000 cash management accounts; improved loan pricing discipline and increased lending revenue by 13% and improved IRP spreads (2) Revenue initiatives Target ~$60-$65 million Citizens Checkup: Launched with more than 210k customer appointments kept to-date; customer satisfaction has been positive with 78% very to completely satisfied Consumer Retention: Initiative underway and showing strength in deposit retention; successful platinum launch driving retention with the Mass Affluent customer segment Middle Market Share of Wallet: Opportunity pipeline remains ~2X larger than historical levels (1) leading to stronger capital markets penetration Commercial Pricing: Re-priced 12,000 cash management accounts; improved loan pricing discipline and increased lending revenue by 13% and improved IRP spreads (2) Expense initiatives Target ~$40 million Operations Transformation: Streamlining of organization complete; focused on next wave of opportunities Supply Chain Services: 2016 run-rate savings achieved driven by reduction in external resources and tightening of internal travel and office supplies policies Expense initiatives Target ~$40 million Operations Transformation: Streamlining of organization complete; focused on next wave of opportunities Supply Chain Services: 2016 run-rate savings achieved driven by reduction in external resources and tightening of internal travel and office supplies policies Revenue initiatives Target ~$25-$30 million Commercial Attrition: Predictive tool is now in the hands of our RMs that identifies at-risk clients and allows them to proactively develop retention plans for those clients Unsecured Lending: Initiative launched with good initial customer responses; early read on performance is positive Business Banking Share of Wallet: Realignment of salesforce complete; executing on plans to deepen relationships Revenue initiatives Target ~$25-$30 million Commercial Attrition: Predictive tool is now in the hands of our RMs that identifies at-risk clients and allows them to proactively develop retention plans for those clients Unsecured Lending: Initiative launched with good initial customer responses; early read on performance is positive Business Banking Share of Wallet: Realignment of salesforce complete; executing on plans to deepen relationships Expense initiatives Target ~$55-$65 million Consumer Efficiencies: First phase of streamlining non-revenue staff is complete; focus on branch optimization and efficiencies in the mortgage business Commercial Efficiencies: Streamlining end-to-end processing and portfolio management; actions are largely complete Functional Efficiencies: Good progress on reengineering processes; streamlining forecasting and reporting in finance and recruiting and training in HR Fraud: Project underway; initial focus on improving algorithms and enhancing chargeback processes Expense initiatives Target ~$55-$65 million Consumer Efficiencies: First phase of streamlining non-revenue staff is complete; focus on branch optimization and efficiencies in the mortgage business Commercial Efficiencies: Streamlining end-to-end processing and portfolio management; actions are largely complete Functional Efficiencies: Good progress on reengineering processes; streamlining forecasting and reporting in finance and recruiting and training in HR Fraud: Project underway; initial focus on improving algorithms and enhancing chargeback processes Tax efficiencies Target ~$20 million (3) Tax-Rate Optimization: Aligning tax rate to peer levels; beginning to see benefit in 3Q16; seeing strength in investment and historic tax credits Tax efficiencies Target ~$20 million (3) Tax-Rate Optimization: Aligning tax rate to peer levels; beginning to see benefit in 3Q16; seeing strength in investment and historic tax credits Launched mid 2015 — On track to deliver $100 -$105 million annual pre-tax benefit by end of 2016 Launched mid 2016 — Targeted run-rate benefit of $100-$115 million by end of 2017 9 Tapping Our Potential (TOP) programs remain on track Self funding necessary investments through our efficiency initiatives 1) Represents opportunities per product specialist as of October 2016 vs. March 2015. 2) Improved lending revenue and IRP (interest-rate products) pricing, as well as improved lending revenue on in-scope deals, which exclude syndicated transactions, select franchise finance customers, asset-based lending deals and letters of credit.” 3) ~$20 million pre-tax benefit; noninterest income pre-tax impact ~($20) million; tax expense benefit of ~$40 million on a pre-tax equivalent basis. |