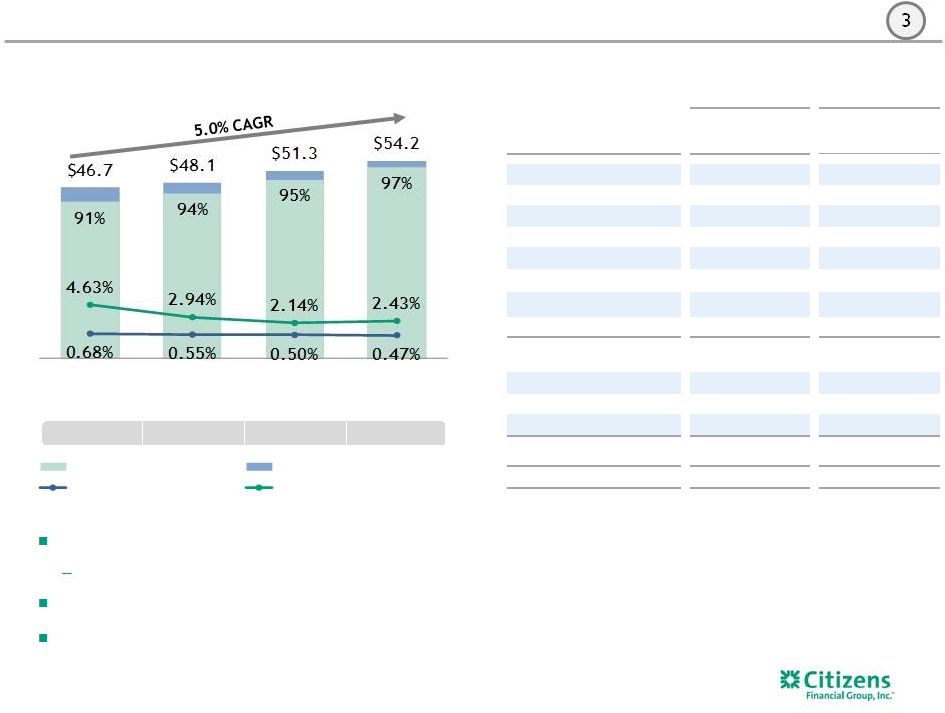
Key performance metrics, Non-GAAP financial measures and reconciliations 40 $s in millions, except share, per share and ratio data MAR. 31, DEC. 31, SEP. 30, JUNE 30, MAR. 31, DEC. 31, SEP. 30, JUNE 30, MAR. 31, DEC. 31, SEP. 30, JUNE 30, MAR. 31, DEC. 31, SEP. 30, 2017 2016 2016 2016 2016 2015 2015 2015 2015 2014 2014 2014 2014 2013 2013 Total revenue, adjusted: Total revenue (GAAP) A $1,384 $1,363 $1,380 $1,278 $1,234 $1,232 $1,209 $1,200 $1,183 $1,179 $1,161 $1,473 $1,166 $1,158 $1,153 Less: Special items — — — — — — — — — — — 288 — — — Less: Notable items — — 67 — — — — — — — — — — — — Total revenues, adjusted (non-GAAP) B $1,384 $1,363 $1,313 $1,278 $1,234 $1,232 $1,209 $1,200 $1,183 $1,179 $1,161 $1,185 $1,166 $1,158 $1,153 Noninterest expense, adjusted: Noninterest expense (GAAP) C $854 $847 $867 $827 $811 $810 $798 $841 $810 $824 $810 $948 $810 $818 $788 Less: Restructuring charges and special items — — — — — — — 40 10 33 21 115 — 26 — Less: Notable items — — 36 — — — — — — — — — — — — Noninterest expense, adjusted (non-GAAP) D $854 $847 $831 $827 $811 $810 $798 $801 $800 $791 $789 $833 $810 $792 $788 Efficiency ratio and efficiency ratio, adjusted: Efficiency ratio C/A 62 % 62 % 63 % 65 % 66 % 66 % 66 % 70 % 68 % 70 % 70 % 64 % 69 % 71 % 68 % Efficiency ratio, adjusted (non-GAAP) D/B 62 Add: Notable items, net of income tax expense (benefit) 62 63 65 66 66 66 67 68 67 68 70 69 68 68 Net income, adjusted: Net income (GAAP) E $320 $282 $297 $243 $223 $221 $220 $190 $209 $197 $189 $313 $166 $152 $144 Add: Restructuring charges and special items, net of income tax expense (benefit) — — — — — — — 25 6 20 13 (108) — 17 — Add: Notable items, net of income tax expense (benefit) — — (19) — — — — — — — — — — — — Net income, adjusted (non-GAAP) F $320 $282 $278 $243 $223 $221 $220 $215 $215 $217 $202 $205 $166 $169 $144 Net income per average common share - diluted, and net income per average common share - diluted, adjusted Net income available to common stockholders (GAAP) G $313 $282 $290 $243 $216 $221 $213 $190 $209 $197 $189 $313 $166 $152 $144 Add: Restructuring charges and special items, net of income tax expense (benefit) — — — — — — — 25 6 20 13 (108) — 17 — — — (19) — — — — — — — — — — — — Net income available to common stockholders, adjusted (non-GAAP) H $313 $282 $271 $243 $216 $221 $213 $215 $215 $217 $202 $205 $166 $169 $144 Average common shares outstanding - diluted (GAAP) P 511,348,200 513,897,085 521,122,466 530,365,203 530,446,188 530,275,673 533,398,158 539,909,366 549,798,717 550,676,298 560,243,747 559,998,324 559,998,324 559,998,324 559,998,324 Net income per average common share - diluted G/P $0.61 $0.55 $0.56 $0.46 $0.41 $0.42 $0.40 $0.35 $0.38 $0.36 $0.34 $0.56 $0.30 $0.27 $0.26 Net income per average common share - diluted, adjusted (non-GAAP) H/P 0.61 0.55 0.52 0.46 0.41 0.42 0.40 0.40 0.39 0.39 0.36 0.37 0.30 0.30 0.26 Return on average tangible common equity and return on average tangible common equity, adjusted: Average common equity (GAAP) $19,460 $19,645 $19,810 $19,768 $19,567 $19,359 $19,261 $19,391 $19,407 $19,209 $19,411 $19,607 $19,370 $19,364 $19,627 Less: Average goodwill (GAAP) 6,876 6,876 6,876 6,876 6,876 6,876 6,876 6,876 6,876 6,876 6,876 6,876 6,876 6,876 6,876 Less: Average other intangibles (GAAP) — 1 1 2 3 3 4 5 5 6 6 7 7 8 9 Add: Average deferred tax liabilities related to goodwill (GAAP) 531 523 509 496 481 468 453 437 422 403 384 369 351 342 325 Average tangible common equity J $13,115 $13,291 $13,442 $13,386 $13,169 $12,948 $12,834 $12,947 $12,948 $12,730 $12,913 $13,093 $12,838 $12,822 $13,067 Return on average tangible common equity G/J 9.68 % 8.43 % 8.58 % 7.30 % 6.61 % 6.75 % 6.60 % 5.90 % 6.53 % 6.12 % 5.81 % 9.59 % 5.24 % 4.71 % 4.34 % Return on average tangible common equity, adjusted (non-GAAP) H/J 9.68 8.43 8.02 7.30 6.61 6.75 6.60 6.67 6.73 6.76 6.22 6.28 5.24 5.24 4.34 Return on average total tangible assets and return on average total tangible assets, adjusted: Average total assets (GAAP) K $148,786 $147,315 $144,399 $142,179 $138,780 $136,298 $135,103 $135,521 $133,325 $130,671 $128,691 $127,148 $123,904 $120,393 $117,386 Less: Average goodwill (GAAP) 6,876 6,876 6,876 6,876 6,876 6,876 6,876 6,876 6,876 6,876 6,876 6,876 6,876 6,876 6,876 Less: Average other intangibles (GAAP) — 1 1 2 3 3 4 5 5 6 6 7 7 8 9 Add: Average deferred tax liabilities related to goodwill (GAAP) 531 523 509 496 481 468 453 437 422 403 384 369 351 342 325 Average tangible assets L $142,441 $140,961 $138,031 $135,797 $132,382 $129,887 $128,676 $129,077 $126,866 $124,192 $122,193 $120,634 $117,372 $113,851 $110,826 Return on average total tangible assets E/L 0.91 % 0.79 % 0.86 % 0.72 % 0.68 % 0.67 % 0.68 % 0.59 % 0.67 % 0.63 % 0.61 % 1.04 % 0.57 % 0.53 % 0.52 % Return on average total tangible assets, adjusted (non-GAAP) F/L 0.91 0.79 0.80 0.72 0.68 0.67 0.68 0.67 0.69 0.69 0.66 0.68 0.57 0.59 0.52 FOR THE THREE MONTHS ENDED |