4Q18 and 2018 Financial Results January 18, 2019 Exhibit 99.2
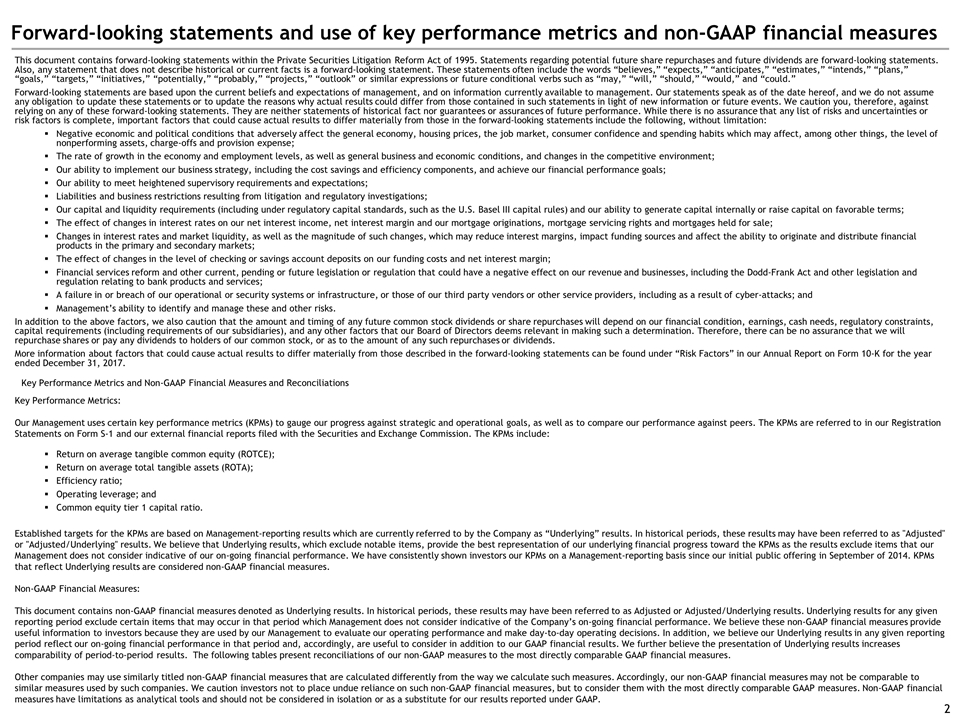
Forward-looking statements and use of key performance metrics and non-GAAP financial measures This document contains forward-looking statements within the Private Securities Litigation Reform Act of 1995. Statements regarding potential future share repurchases and future dividends are forward-looking statements. Also, any statement that does not describe historical or current facts is a forward-looking statement. These statements often include the words “believes,” “expects,” “anticipates,” “estimates,” “intends,” “plans,” “goals,” “targets,” “initiatives,” “potentially,” “probably,” “projects,” “outlook” or similar expressions or future conditional verbs such as “may,” “will,” “should,” “would,” and “could.” Forward-looking statements are based upon the current beliefs and expectations of management, and on information currently available to management. Our statements speak as of the date hereof, and we do not assume any obligation to update these statements or to update the reasons why actual results could differ from those contained in such statements in light of new information or future events. We caution you, therefore, against relying on any of these forward-looking statements. They are neither statements of historical fact nor guarantees or assurances of future performance. While there is no assurance that any list of risks and uncertainties or risk factors is complete, important factors that could cause actual results to differ materially from those in the forward-looking statements include the following, without limitation: Negative economic and political conditions that adversely affect the general economy, housing prices, the job market, consumer confidence and spending habits which may affect, among other things, the level of nonperforming assets, charge-offs and provision expense; The rate of growth in the economy and employment levels, as well as general business and economic conditions, and changes in the competitive environment; Our ability to implement our business strategy, including the cost savings and efficiency components, and achieve our financial performance goals; Our ability to meet heightened supervisory requirements and expectations; Liabilities and business restrictions resulting from litigation and regulatory investigations; Our capital and liquidity requirements (including under regulatory capital standards, such as the U.S. Basel III capital rules) and our ability to generate capital internally or raise capital on favorable terms; The effect of changes in interest rates on our net interest income, net interest margin and our mortgage originations, mortgage servicing rights and mortgages held for sale; Changes in interest rates and market liquidity, as well as the magnitude of such changes, which may reduce interest margins, impact funding sources and affect the ability to originate and distribute financial products in the primary and secondary markets; The effect of changes in the level of checking or savings account deposits on our funding costs and net interest margin; Financial services reform and other current, pending or future legislation or regulation that could have a negative effect on our revenue and businesses, including the Dodd-Frank Act and other legislation and regulation relating to bank products and services; A failure in or breach of our operational or security systems or infrastructure, or those of our third party vendors or other service providers, including as a result of cyber-attacks; and Management’s ability to identify and manage these and other risks. In addition to the above factors, we also caution that the amount and timing of any future common stock dividends or share repurchases will depend on our financial condition, earnings, cash needs, regulatory constraints, capital requirements (including requirements of our subsidiaries), and any other factors that our Board of Directors deems relevant in making such a determination. Therefore, there can be no assurance that we will repurchase shares or pay any dividends to holders of our common stock, or as to the amount of any such repurchases or dividends. More information about factors that could cause actual results to differ materially from those described in the forward-looking statements can be found under “Risk Factors” in our Annual Report on Form 10-K for the year ended December 31, 2017. Key Performance Metrics and Non-GAAP Financial Measures and Reconciliations Key Performance Metrics: Our Management uses certain key performance metrics (KPMs) to gauge our progress against strategic and operational goals, as well as to compare our performance against peers. The KPMs are referred to in our Registration Statements on Form S-1 and our external financial reports filed with the Securities and Exchange Commission. The KPMs include: Return on average tangible common equity (ROTCE); Return on average total tangible assets (ROTA); Efficiency ratio; Operating leverage; and Common equity tier 1 capital ratio. Established targets for the KPMs are based on Management-reporting results which are currently referred to by the Company as “Underlying” results. In historical periods, these results may have been referred to as "Adjusted" or "Adjusted/Underlying" results. We believe that Underlying results, which exclude notable items, provide the best representation of our underlying financial progress toward the KPMs as the results exclude items that our Management does not consider indicative of our on-going financial performance. We have consistently shown investors our KPMs on a Management-reporting basis since our initial public offering in September of 2014. KPMs that reflect Underlying results are considered non-GAAP financial measures. Non-GAAP Financial Measures: This document contains non-GAAP financial measures denoted as Underlying results. In historical periods, these results may have been referred to as Adjusted or Adjusted/Underlying results. Underlying results for any given reporting period exclude certain items that may occur in that period which Management does not consider indicative of the Company’s on-going financial performance. We believe these non-GAAP financial measures provide useful information to investors because they are used by our Management to evaluate our operating performance and make day-to-day operating decisions. In addition, we believe our Underlying results in any given reporting period reflect our on-going financial performance in that period and, accordingly, are useful to consider in addition to our GAAP financial results. We further believe the presentation of Underlying results increases comparability of period-to-period results. The following tables present reconciliations of our non-GAAP measures to the most directly comparable GAAP financial measures. Other companies may use similarly titled non-GAAP financial measures that are calculated differently from the way we calculate such measures. Accordingly, our non-GAAP financial measures may not be comparable to similar measures used by such companies. We caution investors not to place undue reliance on such non-GAAP financial measures, but to consider them with the most directly comparable GAAP measures. Non-GAAP financial measures have limitations as analytical tools and should not be considered in isolation or as a substitute for our results reported under GAAP.
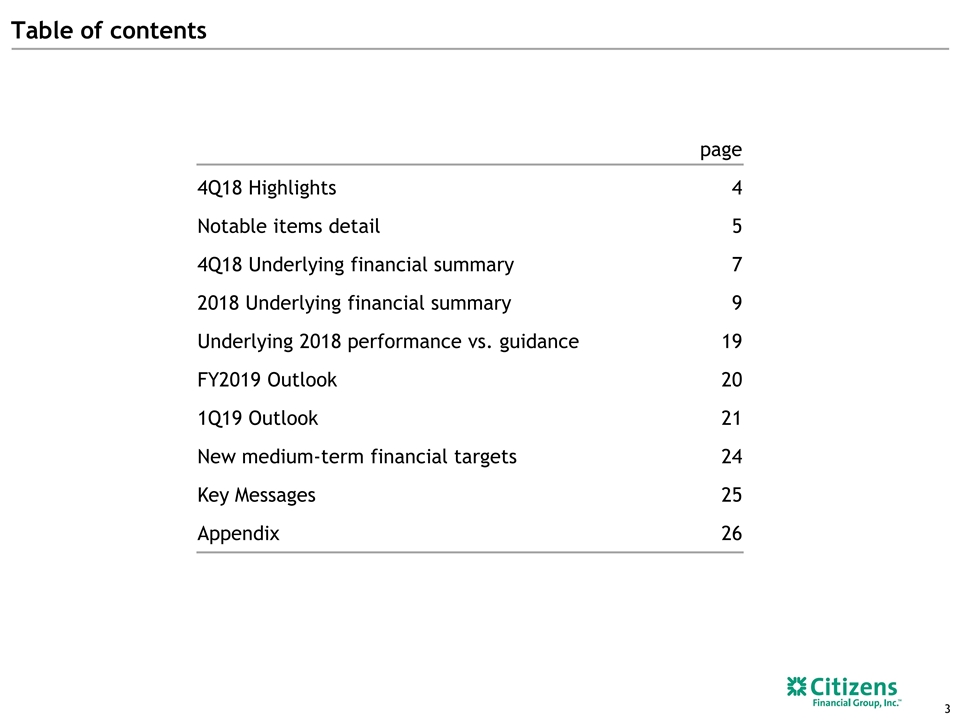
Table of contents page 4Q18 Highlights 4 Notable items detail 5 4Q18 Underlying financial summary 7 2018 Underlying financial summary 9 Underlying 2018 performance vs. guidance 19 FY2019 Outlook 20 1Q19 Outlook 21 New medium-term financial targets 24 Key Messages 25 Appendix 26
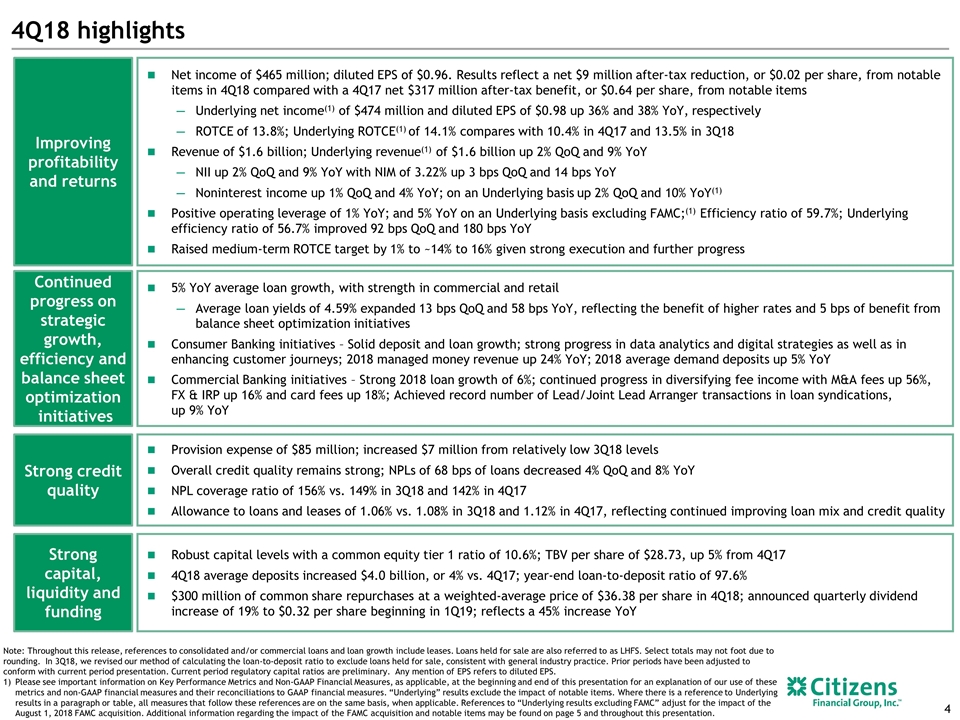
Provision expense of $85 million; increased $7 million from relatively low 3Q18 levels Overall credit quality remains strong; NPLs of 68 bps of loans decreased 4% QoQ and 8% YoY NPL coverage ratio of 156% vs. 149% in 3Q18 and 142% in 4Q17 Allowance to loans and leases of 1.06% vs. 1.08% in 3Q18 and 1.12% in 4Q17, reflecting continued improving loan mix and credit quality 5% YoY average loan growth, with strength in commercial and retail Average loan yields of 4.59% expanded 13 bps QoQ and 58 bps YoY, reflecting the benefit of higher rates and 5 bps of benefit from balance sheet optimization initiatives Consumer Banking initiatives – Solid deposit and loan growth; strong progress in data analytics and digital strategies as well as in enhancing customer journeys; 2018 managed money revenue up 24% YoY; 2018 average demand deposits up 5% YoY Commercial Banking initiatives – Strong 2018 loan growth of 6%; continued progress in diversifying fee income with M&A fees up 56%, FX & IRP up 16% and card fees up 18%; Achieved record number of Lead/Joint Lead Arranger transactions in loan syndications, up 9% YoY 4Q18 highlights Improving profitability and returns Strong capital, liquidity and funding Strong credit quality Continued progress on strategic growth, efficiency and balance sheet optimization initiatives Robust capital levels with a common equity tier 1 ratio of 10.6%; TBV per share of $28.73, up 5% from 4Q17 4Q18 average deposits increased $4.0 billion, or 4% vs. 4Q17; year-end loan-to-deposit ratio of 97.6% $300 million of common share repurchases at a weighted-average price of $36.38 per share in 4Q18; announced quarterly dividend increase of 19% to $0.32 per share beginning in 1Q19; reflects a 45% increase YoY Net income of $465 million; diluted EPS of $0.96. Results reflect a net $9 million after-tax reduction, or $0.02 per share, from notable items in 4Q18 compared with a 4Q17 net $317 million after-tax benefit, or $0.64 per share, from notable items Underlying net income(1) of $474 million and diluted EPS of $0.98 up 36% and 38% YoY, respectively ROTCE of 13.8%; Underlying ROTCE(1) of 14.1% compares with 10.4% in 4Q17 and 13.5% in 3Q18 Revenue of $1.6 billion; Underlying revenue(1) of $1.6 billion up 2% QoQ and 9% YoY NII up 2% QoQ and 9% YoY with NIM of 3.22% up 3 bps QoQ and 14 bps YoY Noninterest income up 1% QoQ and 4% YoY; on an Underlying basis up 2% QoQ and 10% YoY(1) Positive operating leverage of 1% YoY; and 5% YoY on an Underlying basis excluding FAMC;(1) Efficiency ratio of 59.7%; Underlying efficiency ratio of 56.7% improved 92 bps QoQ and 180 bps YoY Raised medium-term ROTCE target by 1% to ~14% to 16% given strong execution and further progress Note: Throughout this release, references to consolidated and/or commercial loans and loan growth include leases. Loans held for sale are also referred to as LHFS. Select totals may not foot due to rounding. In 3Q18, we revised our method of calculating the loan-to-deposit ratio to exclude loans held for sale, consistent with general industry practice. Prior periods have been adjusted to conform with current period presentation. Current period regulatory capital ratios are preliminary. Any mention of EPS refers to diluted EPS. Please see important information on Key Performance Metrics and Non-GAAP Financial Measures, as applicable, at the beginning and end of this presentation for an explanation of our use of these metrics and non-GAAP financial measures and their reconciliations to GAAP financial measures. “Underlying” results exclude the impact of notable items. Where there is a reference to Underlying results in a paragraph or table, all measures that follow these references are on the same basis, when applicable. References to “Underlying results excluding FAMC” adjust for the impact of the August 1, 2018 FAMC acquisition. Additional information regarding the impact of the FAMC acquisition and notable items may be found on page 5 and throughout this presentation.
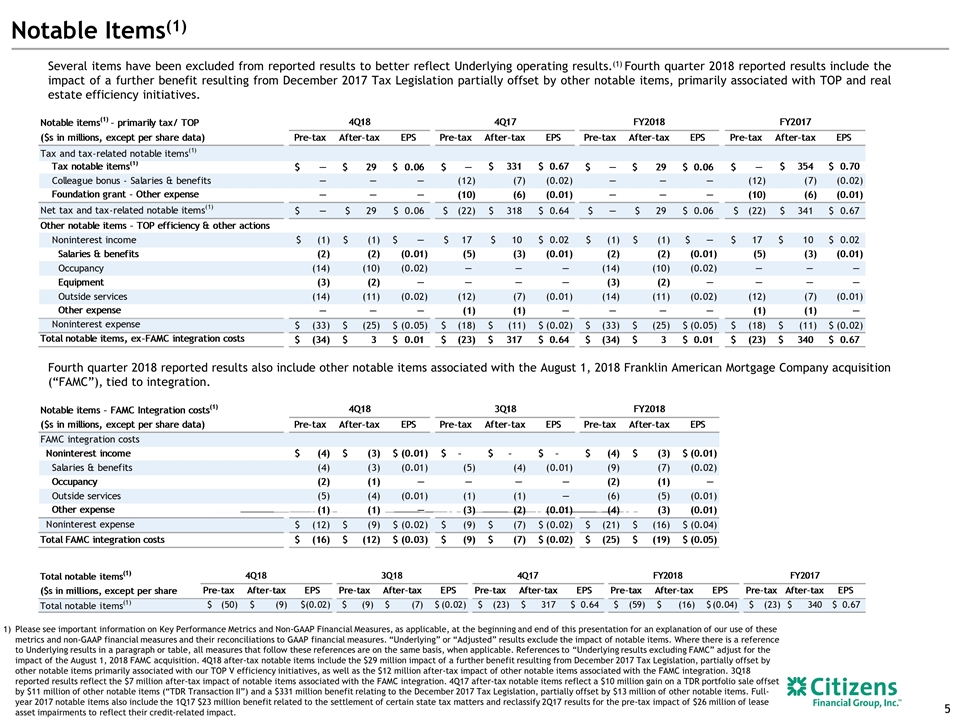
Notable Items(1) Several items have been excluded from reported results to better reflect Underlying operating results.(1) Fourth quarter 2018 reported results include the impact of a further benefit resulting from December 2017 Tax Legislation partially offset by other notable items, primarily associated with TOP and real estate efficiency initiatives. Please see important information on Key Performance Metrics and Non-GAAP Financial Measures, as applicable, at the beginning and end of this presentation for an explanation of our use of these metrics and non-GAAP financial measures and their reconciliations to GAAP financial measures. “Underlying” or “Adjusted” results exclude the impact of notable items. Where there is a reference to Underlying results in a paragraph or table, all measures that follow these references are on the same basis, when applicable. References to “Underlying results excluding FAMC” adjust for the impact of the August 1, 2018 FAMC acquisition. 4Q18 after-tax notable items include the $29 million impact of a further benefit resulting from December 2017 Tax Legislation, partially offset by other notable items primarily associated with our TOP V efficiency initiatives, as well as the $12 million after-tax impact of other notable items associated with the FAMC integration. 3Q18 reported results reflect the $7 million after-tax impact of notable items associated with the FAMC integration. 4Q17 after-tax notable items reflect a $10 million gain on a TDR portfolio sale offset by $11 million of other notable items (“TDR Transaction II”) and a $331 million benefit relating to the December 2017 Tax Legislation, partially offset by $13 million of other notable items. Full- year 2017 notable items also include the 1Q17 $23 million benefit related to the settlement of certain state tax matters and reclassify 2Q17 results for the pre-tax impact of $26 million of lease asset impairments to reflect their credit-related impact. Fourth quarter 2018 reported results also include other notable items associated with the August 1, 2018 Franklin American Mortgage Company acquisition (“FAMC”), tied to integration.
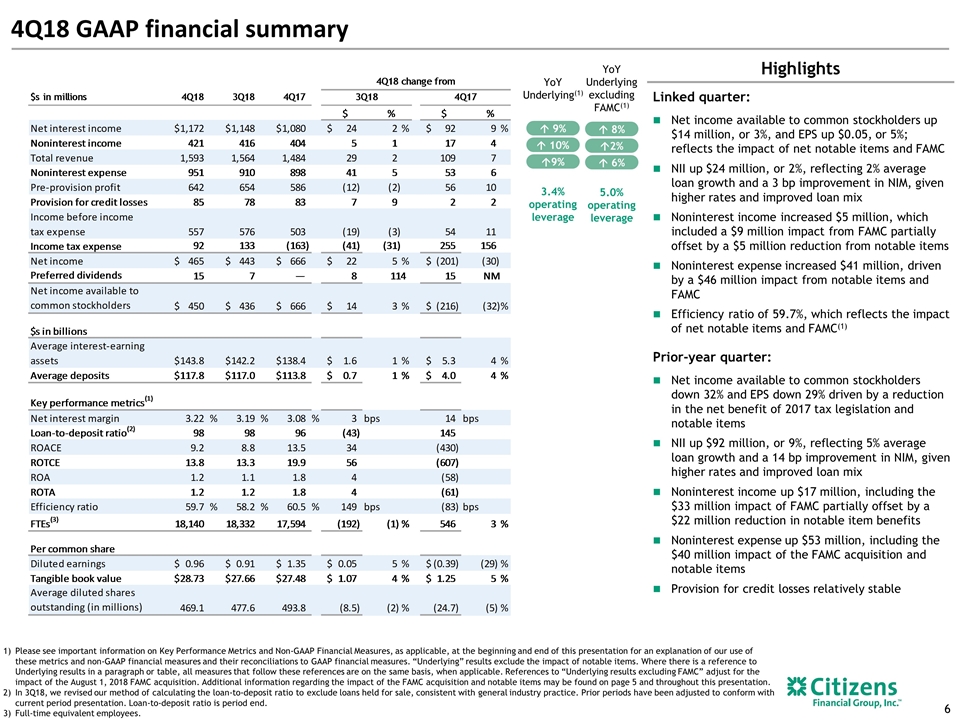
4Q18 GAAP financial summary Please see important information on Key Performance Metrics and Non-GAAP Financial Measures, as applicable, at the beginning and end of this presentation for an explanation of our use of these metrics and non-GAAP financial measures and their reconciliations to GAAP financial measures. “Underlying” results exclude the impact of notable items. Where there is a reference to Underlying results in a paragraph or table, all measures that follow these references are on the same basis, when applicable. References to “Underlying results excluding FAMC” adjust for the impact of the August 1, 2018 FAMC acquisition. Additional information regarding the impact of the FAMC acquisition and notable items may be found on page 5 and throughout this presentation. In 3Q18, we revised our method of calculating the loan-to-deposit ratio to exclude loans held for sale, consistent with general industry practice. Prior periods have been adjusted to conform with current period presentation. Loan-to-deposit ratio is period end. Full-time equivalent employees. Highlights YoY Underlying(1) á9% á 10% á 9% 3.4% operating leverage YoY Underlying excluding FAMC(1) á 6% á2% á 8% 5.0% operating leverage Linked quarter: Net income available to common stockholders up $14 million, or 3%, and EPS up $0.05, or 5%; reflects the impact of net notable items and FAMC NII up $24 million, or 2%, reflecting 2% average loan growth and a 3 bp improvement in NIM, given higher rates and improved loan mix Noninterest income increased $5 million, which included a $9 million impact from FAMC partially offset by a $5 million reduction from notable items Noninterest expense increased $41 million, driven by a $46 million impact from notable items and FAMC Efficiency ratio of 59.7%, which reflects the impact of net notable items and FAMC(1) Prior-year quarter: Net income available to common stockholders down 32% and EPS down 29% driven by a reduction in the net benefit of 2017 tax legislation and notable items NII up $92 million, or 9%, reflecting 5% average loan growth and a 14 bp improvement in NIM, given higher rates and improved loan mix Noninterest income up $17 million, including the $33 million impact of FAMC partially offset by a $22 million reduction in notable item benefits Noninterest expense up $53 million, including the $40 million impact of the FAMC acquisition and notable items Provision for credit losses relatively stable
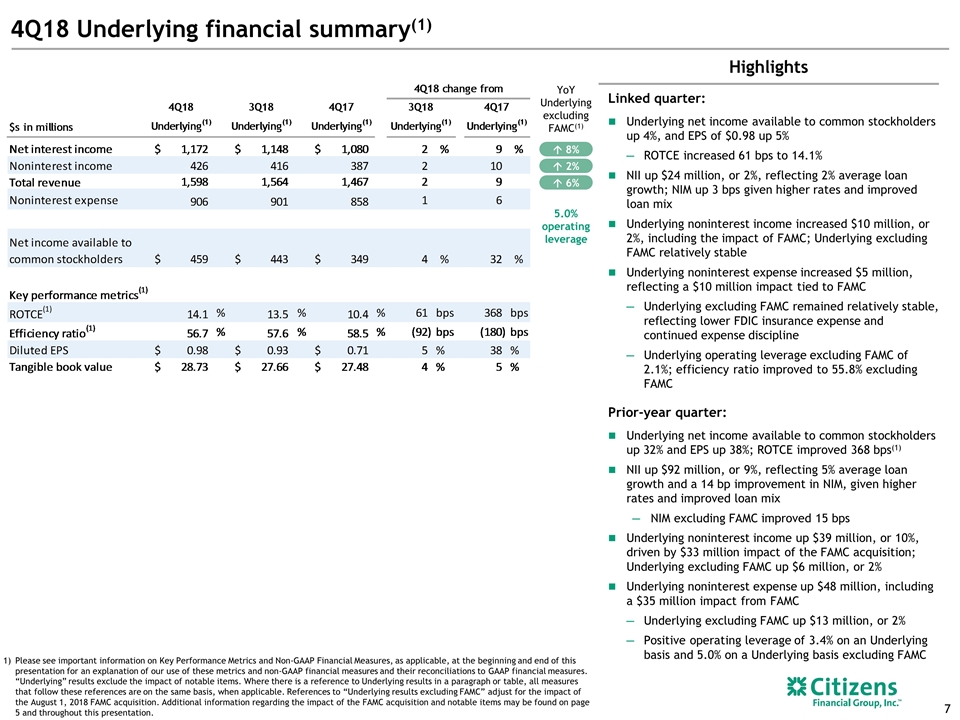
5.0% operating leverage Please see important information on Key Performance Metrics and Non-GAAP Financial Measures, as applicable, at the beginning and end of this presentation for an explanation of our use of these metrics and non-GAAP financial measures and their reconciliations to GAAP financial measures. “Underlying” results exclude the impact of notable items. Where there is a reference to Underlying results in a paragraph or table, all measures that follow these references are on the same basis, when applicable. References to “Underlying results excluding FAMC” adjust for the impact of the August 1, 2018 FAMC acquisition. Additional information regarding the impact of the FAMC acquisition and notable items may be found on page 5 and throughout this presentation. Highlights 4Q18 Underlying financial summary(1) YoY Underlying excluding FAMC(1) á 6% á 2% á 8% Linked quarter: Underlying net income available to common stockholders up 4%, and EPS of $0.98 up 5% ROTCE increased 61 bps to 14.1% NII up $24 million, or 2%, reflecting 2% average loan growth; NIM up 3 bps given higher rates and improved loan mix Underlying noninterest income increased $10 million, or 2%, including the impact of FAMC; Underlying excluding FAMC relatively stable Underlying noninterest expense increased $5 million, reflecting a $10 million impact tied to FAMC Underlying excluding FAMC remained relatively stable, reflecting lower FDIC insurance expense and continued expense discipline Underlying operating leverage excluding FAMC of 2.1%; efficiency ratio improved to 55.8% excluding FAMC Prior-year quarter: Underlying net income available to common stockholders up 32% and EPS up 38%; ROTCE improved 368 bps(1) NII up $92 million, or 9%, reflecting 5% average loan growth and a 14 bp improvement in NIM, given higher rates and improved loan mix NIM excluding FAMC improved 15 bps Underlying noninterest income up $39 million, or 10%, driven by $33 million impact of the FAMC acquisition; Underlying excluding FAMC up $6 million, or 2% Underlying noninterest expense up $48 million, including a $35 million impact from FAMC Underlying excluding FAMC up $13 million, or 2% Positive operating leverage of 3.4% on an Underlying basis and 5.0% on a Underlying basis excluding FAMC
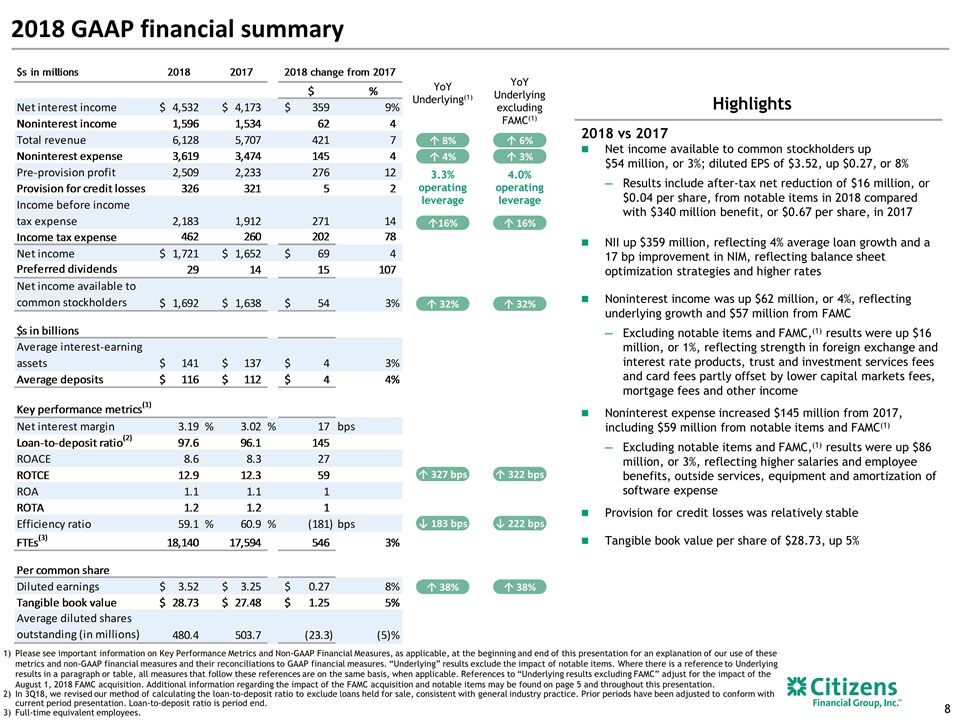
2018 vs 2017 Net income available to common stockholders up $54 million, or 3%; diluted EPS of $3.52, up $0.27, or 8% Results include after-tax net reduction of $16 million, or $0.04 per share, from notable items in 2018 compared with $340 million benefit, or $0.67 per share, in 2017 NII up $359 million, reflecting 4% average loan growth and a 17 bp improvement in NIM, reflecting balance sheet optimization strategies and higher rates Noninterest income was up $62 million, or 4%, reflecting underlying growth and $57 million from FAMC Excluding notable items and FAMC,(1) results were up $16 million, or 1%, reflecting strength in foreign exchange and interest rate products, trust and investment services fees and card fees partly offset by lower capital markets fees, mortgage fees and other income Noninterest expense increased $145 million from 2017, including $59 million from notable items and FAMC(1) Excluding notable items and FAMC,(1) results were up $86 million, or 3%, reflecting higher salaries and employee benefits, outside services, equipment and amortization of software expense Provision for credit losses was relatively stable Tangible book value per share of $28.73, up 5% 2018 GAAP financial summary Please see important information on Key Performance Metrics and Non-GAAP Financial Measures, as applicable, at the beginning and end of this presentation for an explanation of our use of these metrics and non-GAAP financial measures and their reconciliations to GAAP financial measures. “Underlying” results exclude the impact of notable items. Where there is a reference to Underlying results in a paragraph or table, all measures that follow these references are on the same basis, when applicable. References to “Underlying results excluding FAMC” adjust for the impact of the August 1, 2018 FAMC acquisition. Additional information regarding the impact of the FAMC acquisition and notable items may be found on page 5 and throughout this presentation. In 3Q18, we revised our method of calculating the loan-to-deposit ratio to exclude loans held for sale, consistent with general industry practice. Prior periods have been adjusted to conform with current period presentation. Loan-to-deposit ratio is period end. Full-time equivalent employees. Highlights á 8% ↓ 183 bps YoY Underlying(1) á 4% á16% á 32% á 38% á 327 bps YoY Underlying excluding FAMC(1) á 6% ↓ 222 bps á 3% á 16% á 32% á 38% á 322 bps 4.0% operating leverage 3.3% operating leverage
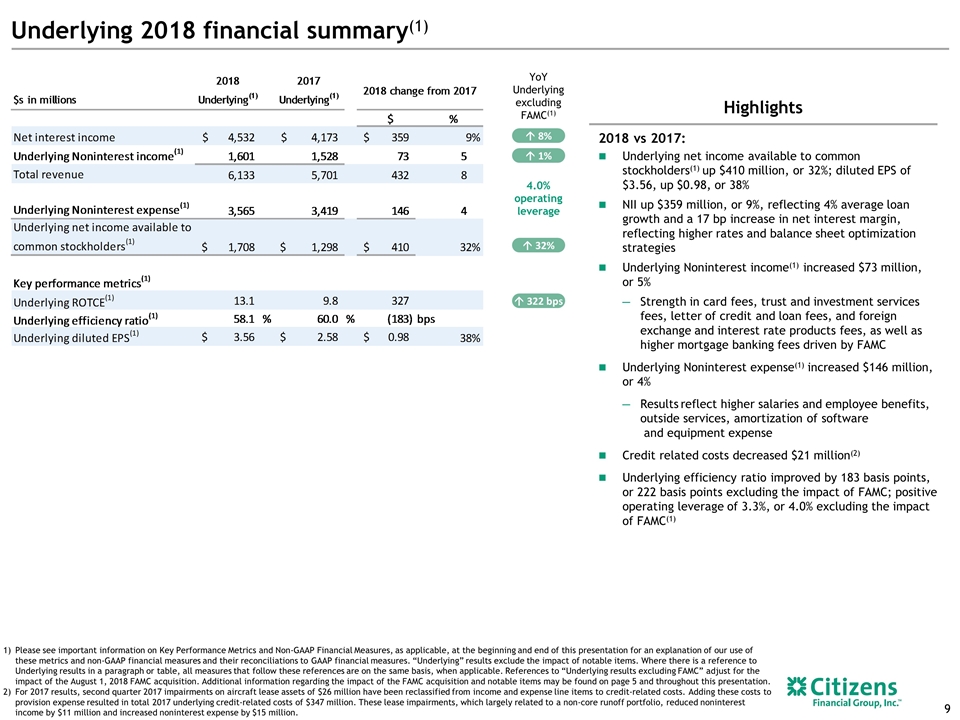
2018 vs 2017: Underlying net income available to common stockholders(1) up $410 million, or 32%; diluted EPS of $3.56, up $0.98, or 38% NII up $359 million, or 9%, reflecting 4% average loan growth and a 17 bp increase in net interest margin, reflecting higher rates and balance sheet optimization strategies Underlying Noninterest income(1) increased $73 million, or 5% Strength in card fees, trust and investment services fees, letter of credit and loan fees, and foreign exchange and interest rate products fees, as well as higher mortgage banking fees driven by FAMC Underlying Noninterest expense(1) increased $146 million, or 4% Results reflect higher salaries and employee benefits, outside services, amortization of software and equipment expense Credit related costs decreased $21 million(2) Underlying efficiency ratio improved by 183 basis points, or 222 basis points excluding the impact of FAMC; positive operating leverage of 3.3%, or 4.0% excluding the impact of FAMC(1) Highlights Please see important information on Key Performance Metrics and Non-GAAP Financial Measures, as applicable, at the beginning and end of this presentation for an explanation of our use of these metrics and non-GAAP financial measures and their reconciliations to GAAP financial measures. “Underlying” results exclude the impact of notable items. Where there is a reference to Underlying results in a paragraph or table, all measures that follow these references are on the same basis, when applicable. References to “Underlying results excluding FAMC” adjust for the impact of the August 1, 2018 FAMC acquisition. Additional information regarding the impact of the FAMC acquisition and notable items may be found on page 5 and throughout this presentation. For 2017 results, second quarter 2017 impairments on aircraft lease assets of $26 million have been reclassified from income and expense line items to credit-related costs. Adding these costs to provision expense resulted in total 2017 underlying credit-related costs of $347 million. These lease impairments, which largely related to a non-core runoff portfolio, reduced noninterest income by $11 million and increased noninterest expense by $15 million. Underlying 2018 financial summary(1) YoY Underlying excluding FAMC(1) á 8% á 1% á 32% á 322 bps 4.0% operating leverage
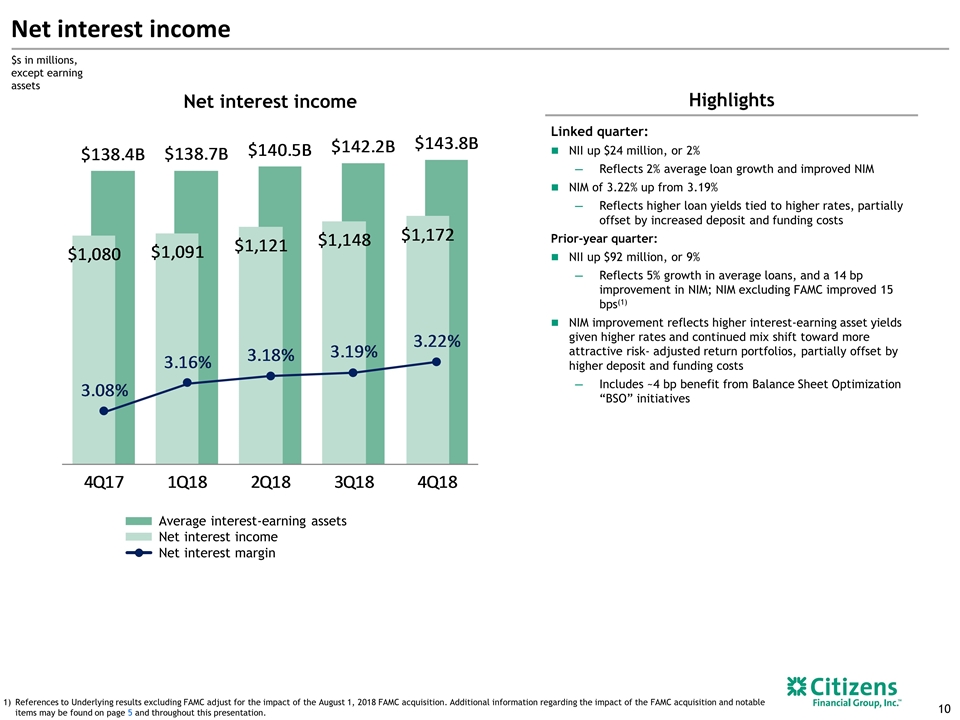
Highlights Net interest income Linked quarter: NII up $24 million, or 2% Reflects 2% average loan growth and improved NIM NIM of 3.22% up from 3.19% Reflects higher loan yields tied to higher rates, partially offset by increased deposit and funding costs Prior-year quarter: NII up $92 million, or 9% Reflects 5% growth in average loans, and a 14 bp improvement in NIM; NIM excluding FAMC improved 15 bps(1) NIM improvement reflects higher interest-earning asset yields given higher rates and continued mix shift toward more attractive risk- adjusted return portfolios, partially offset by higher deposit and funding costs Includes ~4 bp benefit from Balance Sheet Optimization “BSO” initiatives Net interest income $s in millions, except earning assets Average interest-earning assets Net interest income Net interest margin References to Underlying results excluding FAMC adjust for the impact of the August 1, 2018 FAMC acquisition. Additional information regarding the impact of the FAMC acquisition and notable items may be found on page 5 and throughout this presentation.
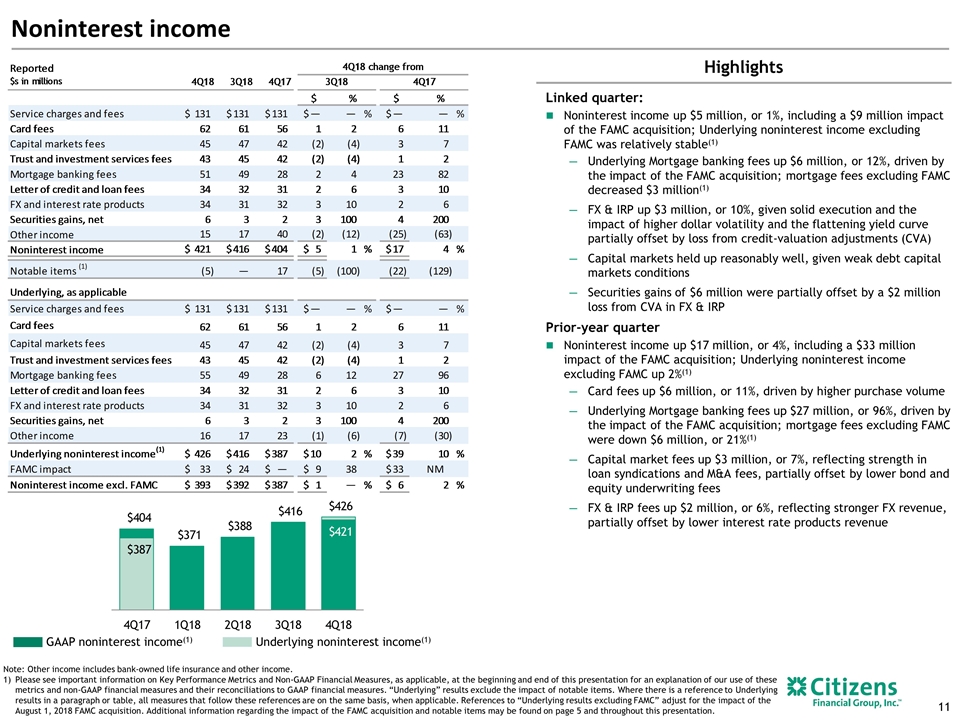
Note: Other income includes bank-owned life insurance and other income. Please see important information on Key Performance Metrics and Non-GAAP Financial Measures, as applicable, at the beginning and end of this presentation for an explanation of our use of these metrics and non-GAAP financial measures and their reconciliations to GAAP financial measures. “Underlying” results exclude the impact of notable items. Where there is a reference to Underlying results in a paragraph or table, all measures that follow these references are on the same basis, when applicable. References to “Underlying results excluding FAMC” adjust for the impact of the August 1, 2018 FAMC acquisition. Additional information regarding the impact of the FAMC acquisition and notable items may be found on page 5 and throughout this presentation. Noninterest income Highlights Underlying noninterest income(1) GAAP noninterest income(1) Linked quarter: Noninterest income up $5 million, or 1%, including a $9 million impact of the FAMC acquisition; Underlying noninterest income excluding FAMC was relatively stable(1) Underlying Mortgage banking fees up $6 million, or 12%, driven by the impact of the FAMC acquisition; mortgage fees excluding FAMC decreased $3 million(1) FX & IRP up $3 million, or 10%, given solid execution and the impact of higher dollar volatility and the flattening yield curve partially offset by loss from credit-valuation adjustments (CVA) Capital markets held up reasonably well, given weak debt capital markets conditions Securities gains of $6 million were partially offset by a $2 million loss from CVA in FX & IRP Prior-year quarter Noninterest income up $17 million, or 4%, including a $33 million impact of the FAMC acquisition; Underlying noninterest income excluding FAMC up 2%(1) Card fees up $6 million, or 11%, driven by higher purchase volume Underlying Mortgage banking fees up $27 million, or 96%, driven by the impact of the FAMC acquisition; mortgage fees excluding FAMC were down $6 million, or 21%(1) Capital market fees up $3 million, or 7%, reflecting strength in loan syndications and M&A fees, partially offset by lower bond and equity underwriting fees FX & IRP fees up $2 million, or 6%, reflecting stronger FX revenue, partially offset by lower interest rate products revenue
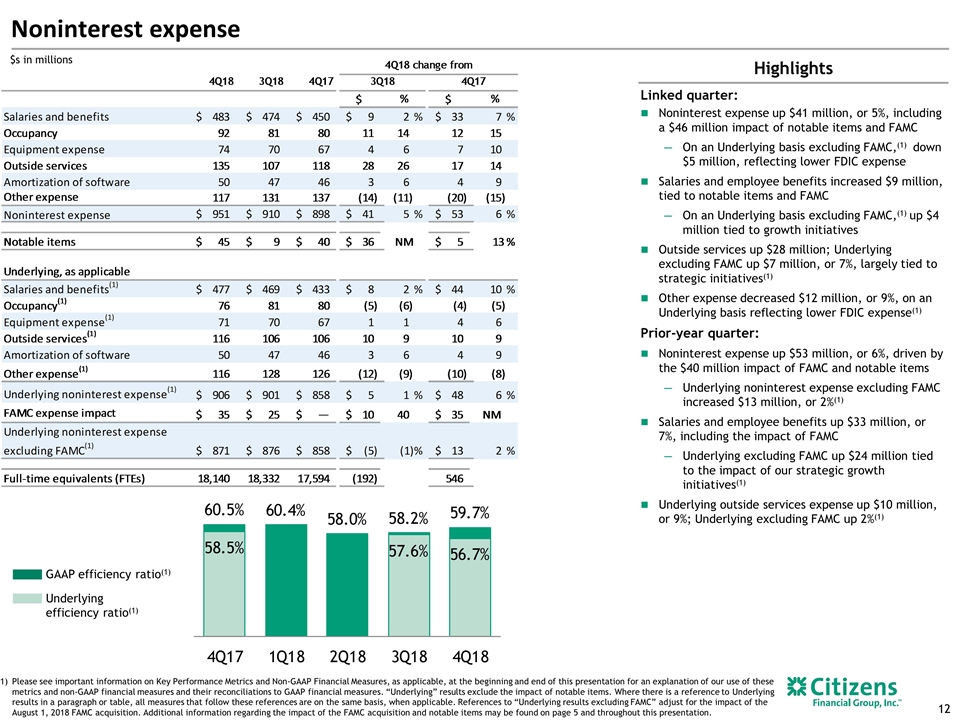
$s in millions Noninterest expense Please see important information on Key Performance Metrics and Non-GAAP Financial Measures, as applicable, at the beginning and end of this presentation for an explanation of our use of these metrics and non-GAAP financial measures and their reconciliations to GAAP financial measures. “Underlying” results exclude the impact of notable items. Where there is a reference to Underlying results in a paragraph or table, all measures that follow these references are on the same basis, when applicable. References to “Underlying results excluding FAMC” adjust for the impact of the August 1, 2018 FAMC acquisition. Additional information regarding the impact of the FAMC acquisition and notable items may be found on page 5 and throughout this presentation. Highlights Underlying efficiency ratio(1) GAAP efficiency ratio(1) Linked quarter: Noninterest expense up $41 million, or 5%, including a $46 million impact of notable items and FAMC On an Underlying basis excluding FAMC,(1) down $5 million, reflecting lower FDIC expense Salaries and employee benefits increased $9 million, tied to notable items and FAMC On an Underlying basis excluding FAMC,(1) up $4 million tied to growth initiatives Outside services up $28 million; Underlying excluding FAMC up $7 million, or 7%, largely tied to strategic initiatives(1) Other expense decreased $12 million, or 9%, on an Underlying basis reflecting lower FDIC expense(1) Prior-year quarter: Noninterest expense up $53 million, or 6%, driven by the $40 million impact of FAMC and notable items Underlying noninterest expense excluding FAMC increased $13 million, or 2%(1) Salaries and employee benefits up $33 million, or 7%, including the impact of FAMC Underlying excluding FAMC up $24 million tied to the impact of our strategic growth initiatives(1) Underlying outside services expense up $10 million, or 9%; Underlying excluding FAMC up 2%(1)
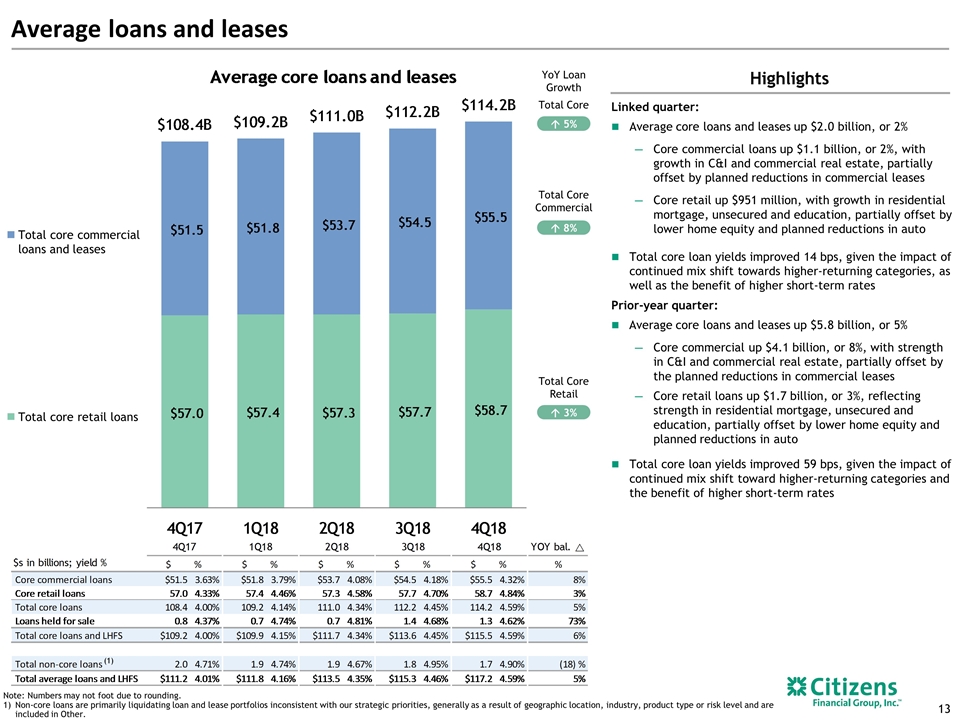
Average loans and leases Highlights YoY Loan Growth á 5% á 3% á 8% Total Core Total Core Retail Total Core Commercial Total core commercial loans and leases Total core retail loans (1) Note: Numbers may not foot due to rounding. Non-core loans are primarily liquidating loan and lease portfolios inconsistent with our strategic priorities, generally as a result of geographic location, industry, product type or risk level and are included in Other. Linked quarter: Average core loans and leases up $2.0 billion, or 2% Core commercial loans up $1.1 billion, or 2%, with growth in C&I and commercial real estate, partially offset by planned reductions in commercial leases Core retail up $951 million, with growth in residential mortgage, unsecured and education, partially offset by lower home equity and planned reductions in auto Total core loan yields improved 14 bps, given the impact of continued mix shift towards higher-returning categories, as well as the benefit of higher short-term rates Prior-year quarter: Average core loans and leases up $5.8 billion, or 5% Core commercial up $4.1 billion, or 8%, with strength in C&I and commercial real estate, partially offset by the planned reductions in commercial leases Core retail loans up $1.7 billion, or 3%, reflecting strength in residential mortgage, unsecured and education, partially offset by lower home equity and planned reductions in auto Total core loan yields improved 59 bps, given the impact of continued mix shift toward higher-returning categories and the benefit of higher short-term rates
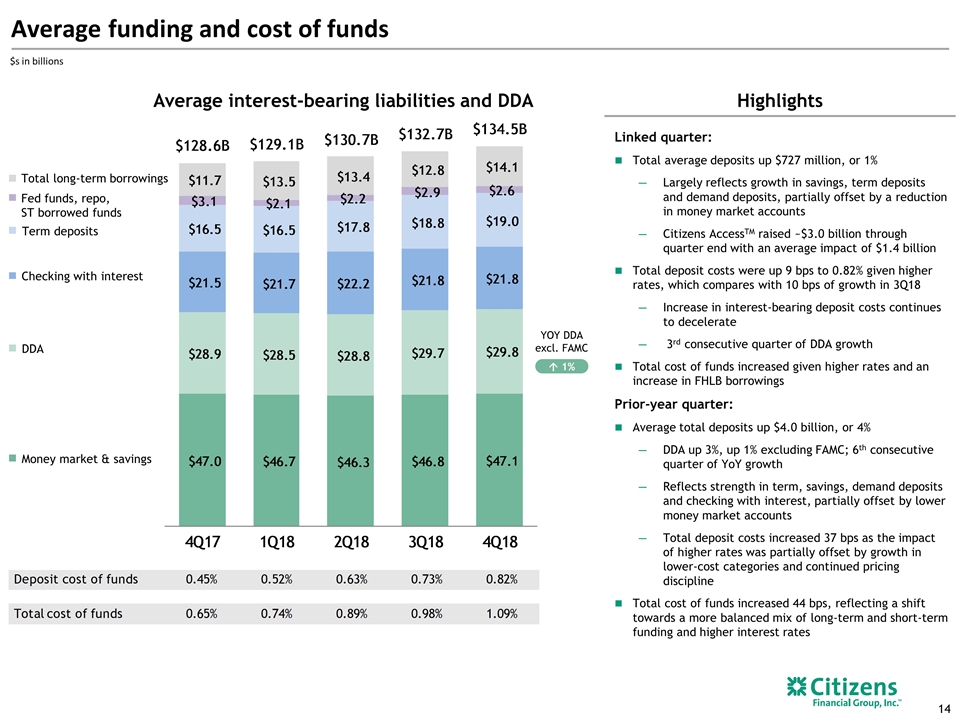
Linked quarter: Total average deposits up $727 million, or 1% Largely reflects growth in savings, term deposits and demand deposits, partially offset by a reduction in money market accounts Citizens AccessTM raised ~$3.0 billion through quarter end with an average impact of $1.4 billion Total deposit costs were up 9 bps to 0.82% given higher rates, which compares with 10 bps of growth in 3Q18 Increase in interest-bearing deposit costs continues to decelerate 3rd consecutive quarter of DDA growth Total cost of funds increased given higher rates and an increase in FHLB borrowings Prior-year quarter: Average total deposits up $4.0 billion, or 4% DDA up 3%, up 1% excluding FAMC; 6th consecutive quarter of YoY growth Reflects strength in term, savings, demand deposits and checking with interest, partially offset by lower money market accounts Total deposit costs increased 37 bps as the impact of higher rates was partially offset by growth in lower-cost categories and continued pricing discipline Total cost of funds increased 44 bps, reflecting a shift towards a more balanced mix of long-term and short-term funding and higher interest rates Average funding and cost of funds Highlights $s in billions Average interest-bearing liabilities and DDA Total long-term borrowings Fed funds, repo, ST borrowed funds Term deposits Checking with interest DDA Money market & savings á 1% YOY DDA excl. FAMC
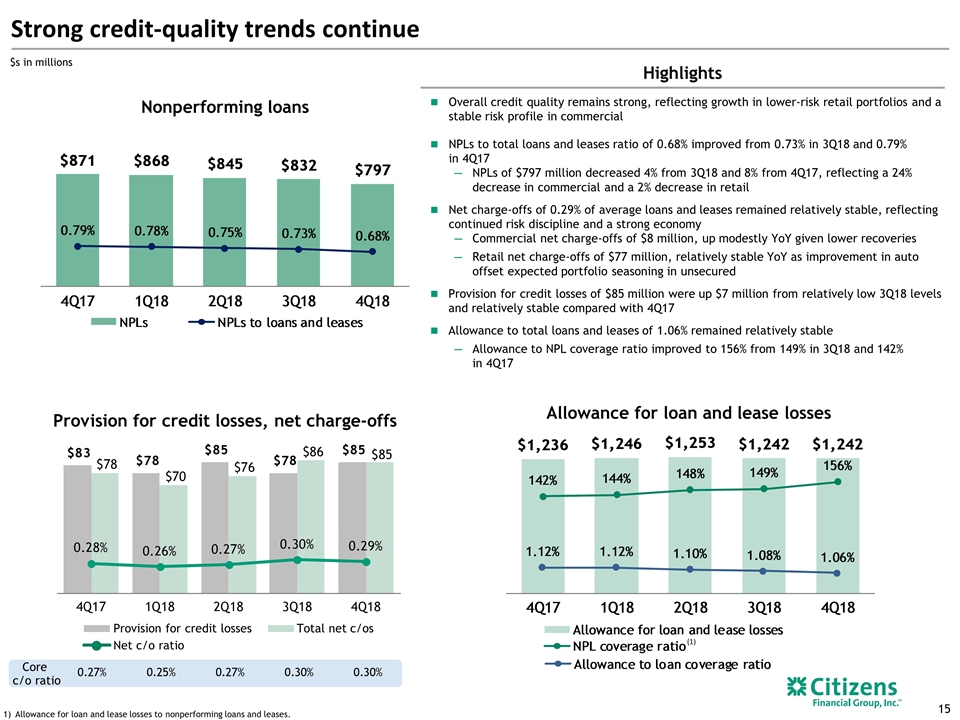
Strong credit-quality trends continue Allowance for loan and lease losses to nonperforming loans and leases. $s in millions (1) Nonperforming loans Allowance for loan and lease losses Highlights Provision for credit losses, net charge-offs Provision for credit losses Total net c/os Net c/o ratio Core c/o ratio Overall credit quality remains strong, reflecting growth in lower-risk retail portfolios and a stable risk profile in commercial NPLs to total loans and leases ratio of 0.68% improved from 0.73% in 3Q18 and 0.79% in 4Q17 NPLs of $797 million decreased 4% from 3Q18 and 8% from 4Q17, reflecting a 24% decrease in commercial and a 2% decrease in retail Net charge-offs of 0.29% of average loans and leases remained relatively stable, reflecting continued risk discipline and a strong economy Commercial net charge-offs of $8 million, up modestly YoY given lower recoveries Retail net charge-offs of $77 million, relatively stable YoY as improvement in auto offset expected portfolio seasoning in unsecured Provision for credit losses of $85 million were up $7 million from relatively low 3Q18 levels and relatively stable compared with 4Q17 Allowance to total loans and leases of 1.06% remained relatively stable Allowance to NPL coverage ratio improved to 156% from 149% in 3Q18 and 142% in 4Q17
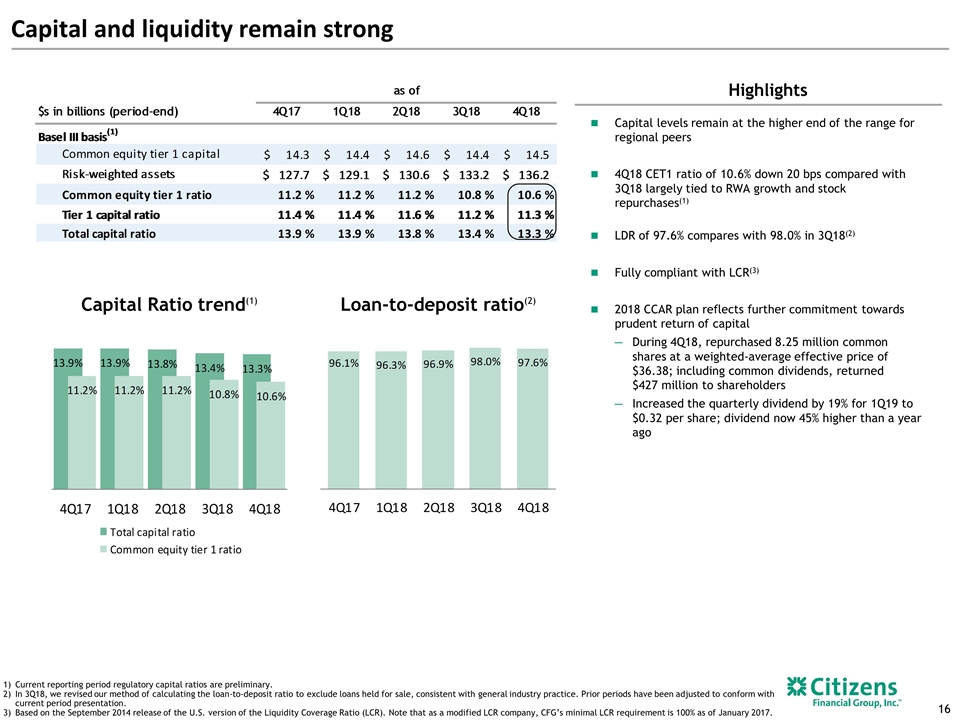
Capital levels remain at the higher end of the range for regional peers 4Q18 CET1 ratio of 10.6% down 20 bps compared with 3Q18 largely tied to RWA growth and stock repurchases(1) LDR of 97.6% compares with 98.0% in 3Q18(2) Fully compliant with LCR(3) 2018 CCAR plan reflects further commitment towards prudent return of capital During 4Q18, repurchased 8.25 million common shares at a weighted-average effective price of $36.38; including common dividends, returned $427 million to shareholders Increased the quarterly dividend by 19% for 1Q19 to $0.32 per share; dividend now 45% higher than a year ago Capital and liquidity remain strong Highlights Current reporting period regulatory capital ratios are preliminary. In 3Q18, we revised our method of calculating the loan-to-deposit ratio to exclude loans held for sale, consistent with general industry practice. Prior periods have been adjusted to conform with current period presentation. Based on the September 2014 release of the U.S. version of the Liquidity Coverage Ratio (LCR). Note that as a modified LCR company, CFG’s minimal LCR requirement is 100% as of January 2017. Capital Ratio trend(1) Loan-to-deposit ratio(2)
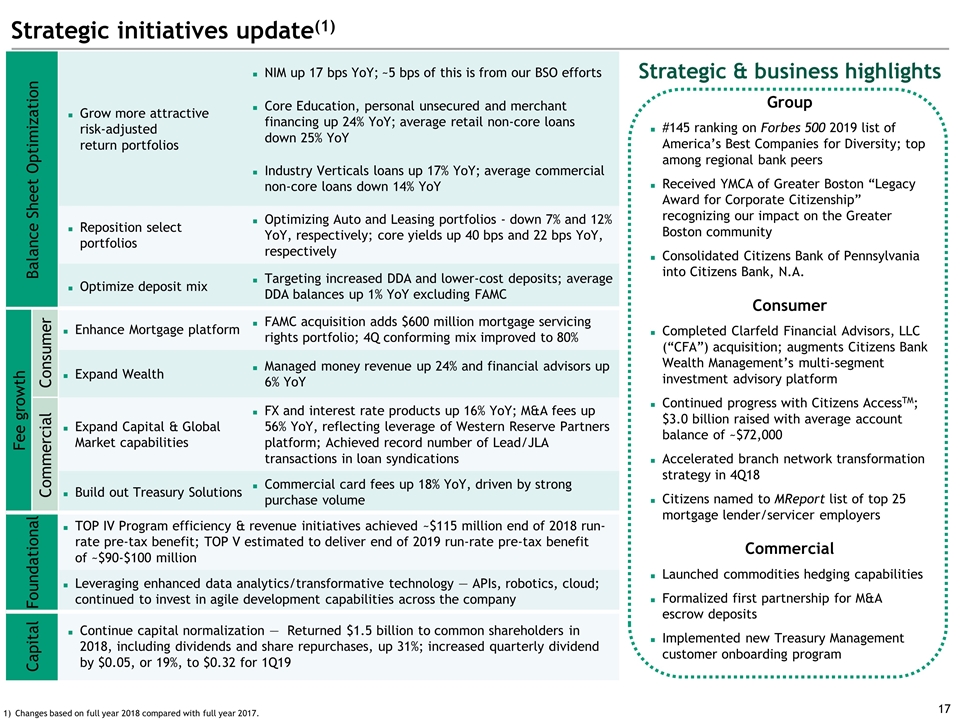
Strategic initiatives update(1) Balance Sheet Optimization Grow more attractive risk-adjusted return portfolios NIM up 17 bps YoY; ~5 bps of this is from our BSO efforts Core Education, personal unsecured and merchant financing up 24% YoY; average retail non-core loans down 25% YoY Industry Verticals loans up 17% YoY; average commercial non-core loans down 14% YoY Reposition select portfolios Optimizing Auto and Leasing portfolios - down 7% and 12% YoY, respectively; core yields up 40 bps and 22 bps YoY, respectively Optimize deposit mix Targeting increased DDA and lower-cost deposits; average DDA balances up 1% YoY excluding FAMC Fee growth Consumer Enhance Mortgage platform FAMC acquisition adds $600 million mortgage servicing rights portfolio; 4Q conforming mix improved to 80% Expand Wealth Managed money revenue up 24% and financial advisors up 6% YoY Commercial Expand Capital & Global Market capabilities FX and interest rate products up 16% YoY; M&A fees up 56% YoY, reflecting leverage of Western Reserve Partners platform; Achieved record number of Lead/JLA transactions in loan syndications Build out Treasury Solutions Commercial card fees up 18% YoY, driven by strong purchase volume Foundational TOP IV Program efficiency & revenue initiatives achieved ~$115 million end of 2018 run-rate pre-tax benefit; TOP V estimated to deliver end of 2019 run-rate pre-tax benefit of ~$90-$100 million Leveraging enhanced data analytics/transformative technology — APIs, robotics, cloud; continued to invest in agile development capabilities across the company Capital Continue capital normalization — Returned $1.5 billion to common shareholders in 2018, including dividends and share repurchases, up 31%; increased quarterly dividend by $0.05, or 19%, to $0.32 for 1Q19 Strategic & business highlights Group #145 ranking on Forbes 500 2019 list of America’s Best Companies for Diversity; top among regional bank peers Received YMCA of Greater Boston “Legacy Award for Corporate Citizenship” recognizing our impact on the Greater Boston community Consolidated Citizens Bank of Pennsylvania into Citizens Bank, N.A. Consumer Completed Clarfeld Financial Advisors, LLC (“CFA”) acquisition; augments Citizens Bank Wealth Management’s multi-segment investment advisory platform Continued progress with Citizens AccessTM; $3.0 billion raised with average account balance of ~$72,000 Accelerated branch network transformation strategy in 4Q18 Citizens named to MReport list of top 25 mortgage lender/servicer employers Commercial Launched commodities hedging capabilities Formalized first partnership for M&A escrow deposits Implemented new Treasury Management customer onboarding program Changes based on full year 2018 compared with full year 2017.
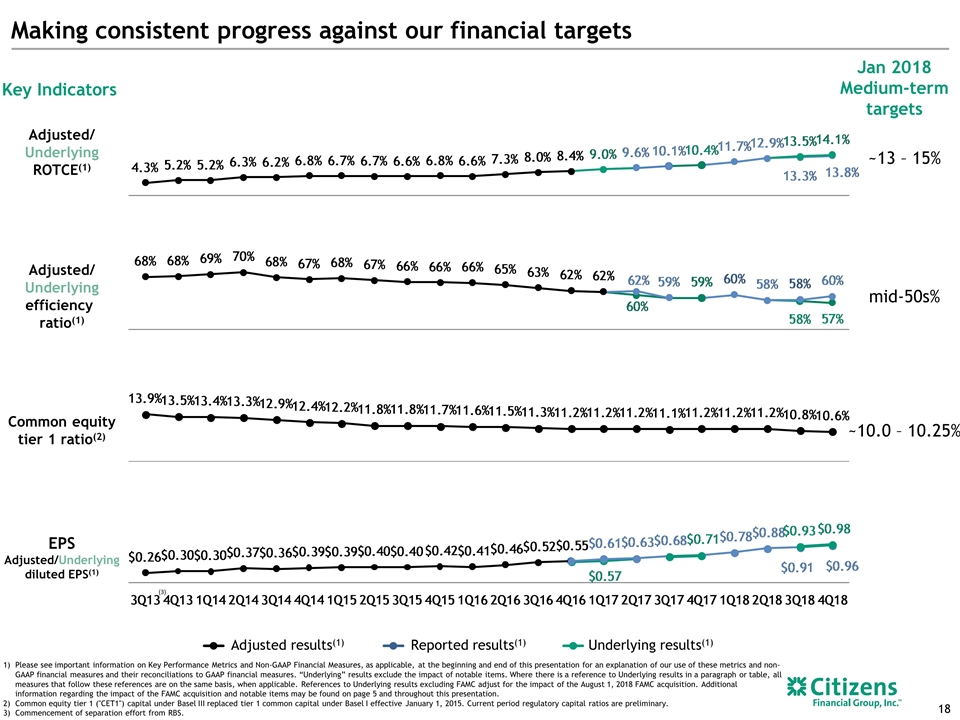
Making consistent progress against our financial targets Adjusted/ Underlying efficiency ratio(1) ~13 – 15% Key Indicators Adjusted/ Underlying ROTCE(1) EPS Adjusted/Underlying diluted EPS(1) Common equity tier 1 ratio(2) (3) Underlying results(1) Reported results(1) Adjusted results(1) Please see important information on Key Performance Metrics and Non-GAAP Financial Measures, as applicable, at the beginning and end of this presentation for an explanation of our use of these metrics and non-GAAP financial measures and their reconciliations to GAAP financial measures. “Underlying” results exclude the impact of notable items. Where there is a reference to Underlying results in a paragraph or table, all measures that follow these references are on the same basis, when applicable. References to Underlying results excluding FAMC adjust for the impact of the August 1, 2018 FAMC acquisition. Additional information regarding the impact of the FAMC acquisition and notable items may be found on page 5 and throughout this presentation. Common equity tier 1 ("CET1") capital under Basel III replaced tier 1 common capital under Basel I effective January 1, 2015. Current period regulatory capital ratios are preliminary. Commencement of separation effort from RBS. Jan 2018 Medium-term targets mid-50s% ~10.0 – 10.25%
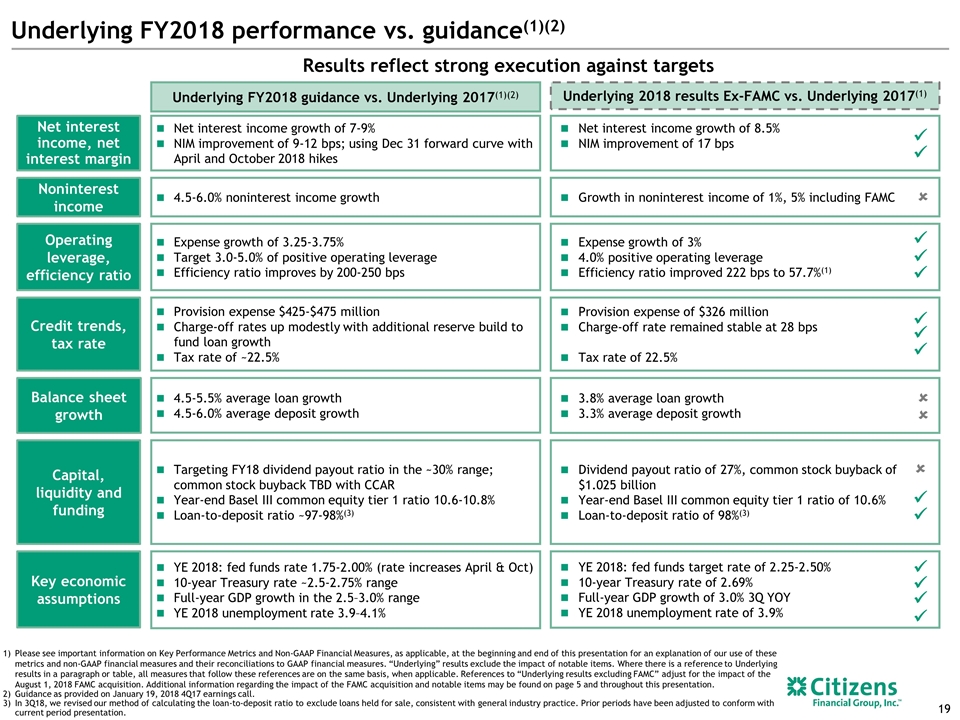
Underlying FY2018 guidance vs. Underlying 2017(1)(2) Underlying FY2018 performance vs. guidance(1)(2) Underlying 2018 results Ex-FAMC vs. Underlying 2017(1) Results reflect strong execution against targets Please see important information on Key Performance Metrics and Non-GAAP Financial Measures, as applicable, at the beginning and end of this presentation for an explanation of our use of these metrics and non-GAAP financial measures and their reconciliations to GAAP financial measures. “Underlying” results exclude the impact of notable items. Where there is a reference to Underlying results in a paragraph or table, all measures that follow these references are on the same basis, when applicable. References to “Underlying results excluding FAMC” adjust for the impact of the August 1, 2018 FAMC acquisition. Additional information regarding the impact of the FAMC acquisition and notable items may be found on page 5 and throughout this presentation. Guidance as provided on January 19, 2018 4Q17 earnings call. In 3Q18, we revised our method of calculating the loan-to-deposit ratio to exclude loans held for sale, consistent with general industry practice. Prior periods have been adjusted to conform with current period presentation. Net interest income, net interest margin Operating leverage, efficiency ratio Credit trends, tax rate Capital, liquidity and funding Key economic assumptions Noninterest income Net interest income growth of 8.5% NIM improvement of 17 bps Expense growth of 3% 4.0% positive operating leverage Efficiency ratio improved 222 bps to 57.7%(1) Provision expense of $326 million Charge-off rate remained stable at 28 bps Tax rate of 22.5% Dividend payout ratio of 27%, common stock buyback of $1.025 billion Year-end Basel III common equity tier 1 ratio of 10.6% Loan-to-deposit ratio of 98%(3) YE 2018: fed funds target rate of 2.25-2.50% 10-year Treasury rate of 2.69% Full-year GDP growth of 3.0% 3Q YOY YE 2018 unemployment rate of 3.9% Growth in noninterest income of 1%, 5% including FAMC ü ü ü ü ü ü ü ü ü ü ü ü ü û Net interest income growth of 7-9% NIM improvement of 9-12 bps; using Dec 31 forward curve with April and October 2018 hikes Expense growth of 3.25-3.75% Target 3.0-5.0% of positive operating leverage Efficiency ratio improves by 200-250 bps Provision expense $425-$475 million Charge-off rates up modestly with additional reserve build to fund loan growth Tax rate of ~22.5% Targeting FY18 dividend payout ratio in the ~30% range; common stock buyback TBD with CCAR Year-end Basel III common equity tier 1 ratio 10.6-10.8% Loan-to-deposit ratio ~97-98%(3) YE 2018: fed funds rate 1.75-2.00% (rate increases April & Oct) 10-year Treasury rate ~2.5-2.75% range Full-year GDP growth in the 2.5–3.0% range YE 2018 unemployment rate 3.9–4.1% 4.5-6.0% noninterest income growth û ü Balance sheet growth 3.8% average loan growth 3.3% average deposit growth 4.5-5.5% average loan growth 4.5-6.0% average deposit growth û û
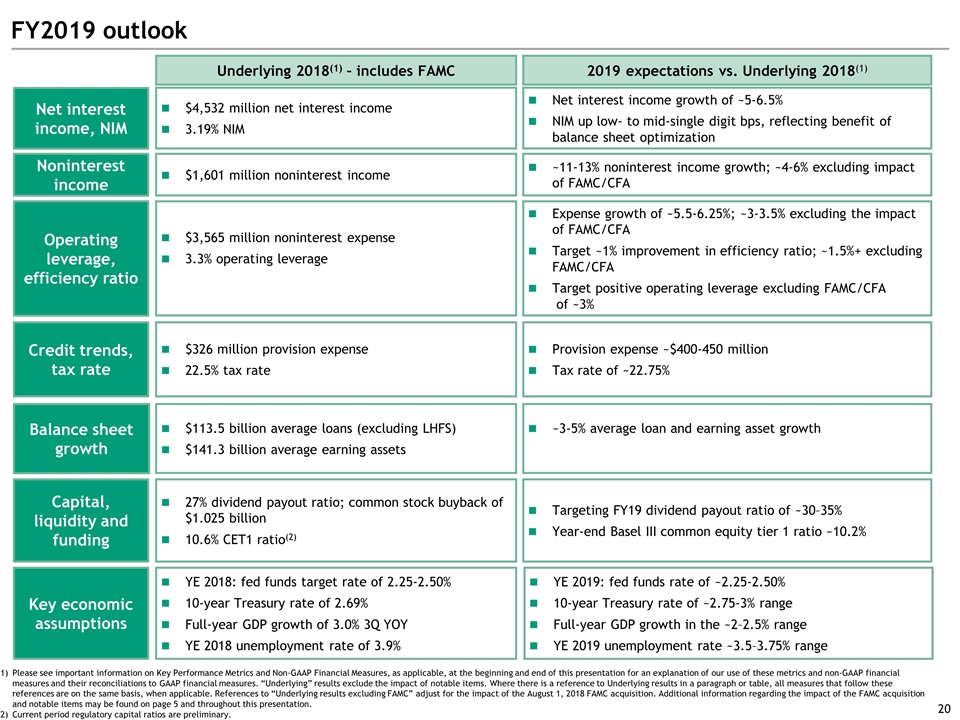
FY2019 outlook Net interest income growth of ~5-6.5% NIM up low- to mid-single digit bps, reflecting benefit of balance sheet optimization Expense growth of ~5.5-6.25%; ~3-3.5% excluding the impact of FAMC/CFA Target ~1% improvement in efficiency ratio; ~1.5%+ excluding FAMC/CFA Target positive operating leverage excluding FAMC/CFA of ~3% Provision expense ~$400-450 million Tax rate of ~22.75% 2019 expectations vs. Underlying 2018(1) Targeting FY19 dividend payout ratio of ~30–35% Year-end Basel III common equity tier 1 ratio ~10.2% YE 2019: fed funds rate of ~2.25-2.50% 10-year Treasury rate of ~2.75-3% range Full-year GDP growth in the ~2–2.5% range YE 2019 unemployment rate ~3.5–3.75% range ~11-13% noninterest income growth; ~4-6% excluding impact of FAMC/CFA Please see important information on Key Performance Metrics and Non-GAAP Financial Measures, as applicable, at the beginning and end of this presentation for an explanation of our use of these metrics and non-GAAP financial measures and their reconciliations to GAAP financial measures. “Underlying” results exclude the impact of notable items. Where there is a reference to Underlying results in a paragraph or table, all measures that follow these references are on the same basis, when applicable. References to “Underlying results excluding FAMC” adjust for the impact of the August 1, 2018 FAMC acquisition. Additional information regarding the impact of the FAMC acquisition and notable items may be found on page 5 and throughout this presentation. Current period regulatory capital ratios are preliminary. Underlying 2018(1) – includes FAMC Net interest income, NIM Operating leverage, efficiency ratio Credit trends, tax rate Capital, liquidity and funding Key economic assumptions Noninterest income $4,532 million net interest income 3.19% NIM $3,565 million noninterest expense 3.3% operating leverage $326 million provision expense 22.5% tax rate 27% dividend payout ratio; common stock buyback of $1.025 billion 10.6% CET1 ratio(2) YE 2018: fed funds target rate of 2.25-2.50% 10-year Treasury rate of 2.69% Full-year GDP growth of 3.0% 3Q YOY YE 2018 unemployment rate of 3.9% $1,601 million noninterest income ~3-5% average loan and earning asset growth Balance sheet growth $113.5 billion average loans (excluding LHFS) $141.3 billion average earning assets
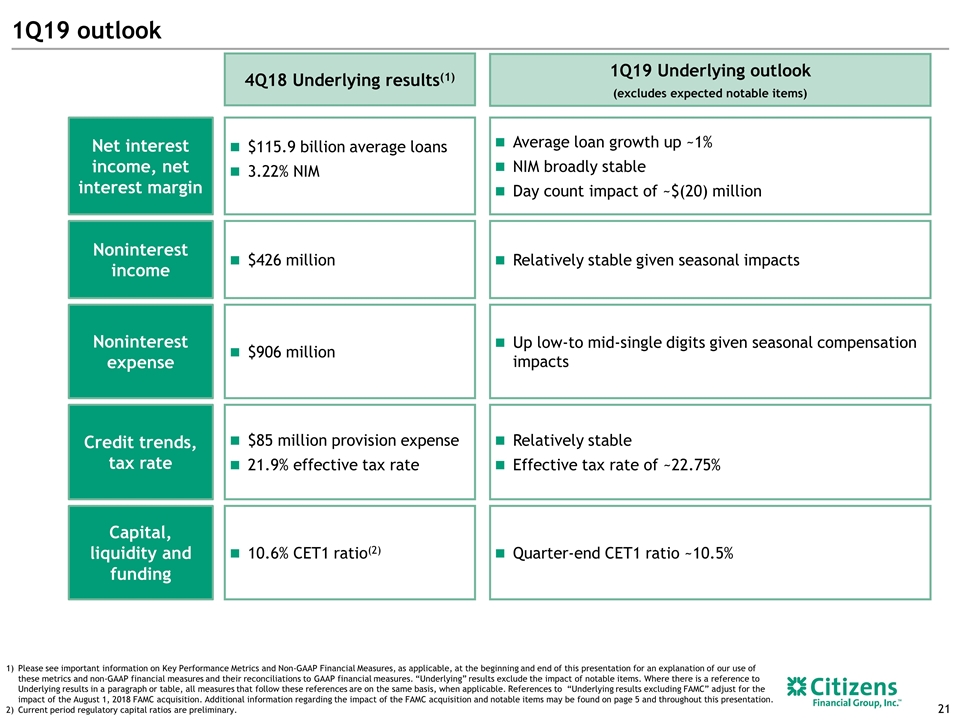
1Q19 outlook Net interest income, net interest margin Noninterest expense Credit trends, tax rate 1Q19 Underlying outlook (excludes expected notable items) Capital, liquidity and funding Noninterest income $906 million $85 million provision expense 21.9% effective tax rate 4Q18 Underlying results(1) 10.6% CET1 ratio(2) $426 million $115.9 billion average loans 3.22% NIM Please see important information on Key Performance Metrics and Non-GAAP Financial Measures, as applicable, at the beginning and end of this presentation for an explanation of our use of these metrics and non-GAAP financial measures and their reconciliations to GAAP financial measures. “Underlying” results exclude the impact of notable items. Where there is a reference to Underlying results in a paragraph or table, all measures that follow these references are on the same basis, when applicable. References to “Underlying results excluding FAMC” adjust for the impact of the August 1, 2018 FAMC acquisition. Additional information regarding the impact of the FAMC acquisition and notable items may be found on page 5 and throughout this presentation. Current period regulatory capital ratios are preliminary. Up low-to mid-single digits given seasonal compensation impacts Relatively stable Effective tax rate of ~22.75% Quarter-end CET1 ratio ~10.5% Relatively stable given seasonal impacts Average loan growth up ~1% NIM broadly stable Day count impact of ~$(20) million
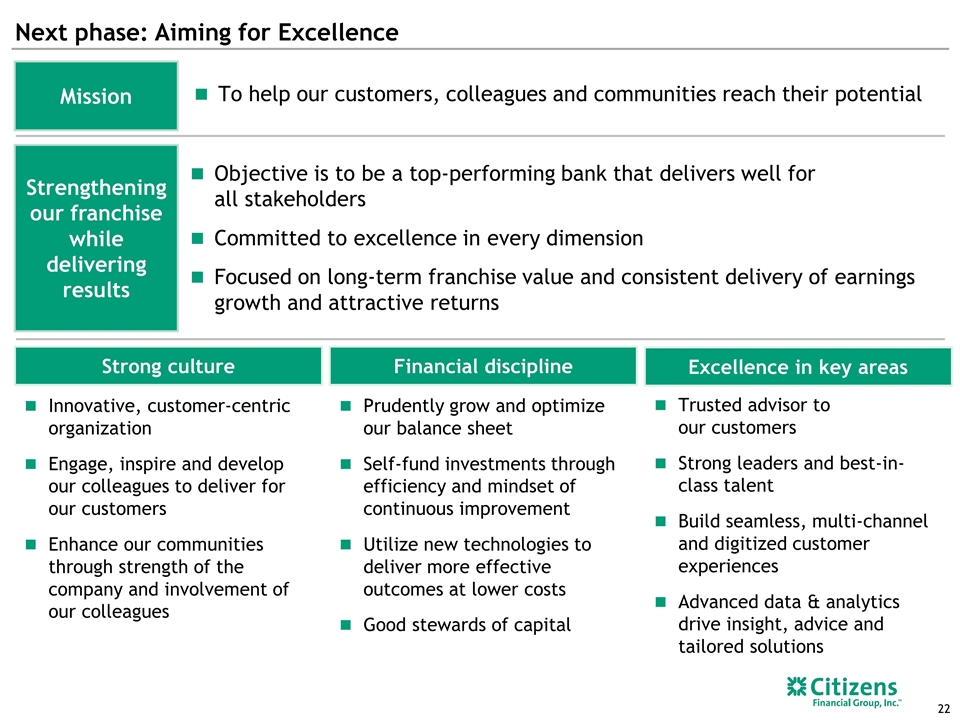
Next phase: Aiming for Excellence To help our customers, colleagues and communities reach their potential Objective is to be a top-performing bank that delivers well for all stakeholders Committed to excellence in every dimension Focused on long-term franchise value and consistent delivery of earnings growth and attractive returns Trusted advisor to our customers Strong leaders and best-in-class talent Build seamless, multi-channel and digitized customer experiences Advanced data & analytics drive insight, advice and tailored solutions Innovative, customer-centric organization Engage, inspire and develop our colleagues to deliver for our customers Enhance our communities through strength of the company and involvement of our colleagues Prudently grow and optimize our balance sheet Self-fund investments through efficiency and mindset of continuous improvement Utilize new technologies to deliver more effective outcomes at lower costs Good stewards of capital Strengthening our franchise while delivering results Mission Excellence in key areas Strong culture Financial discipline
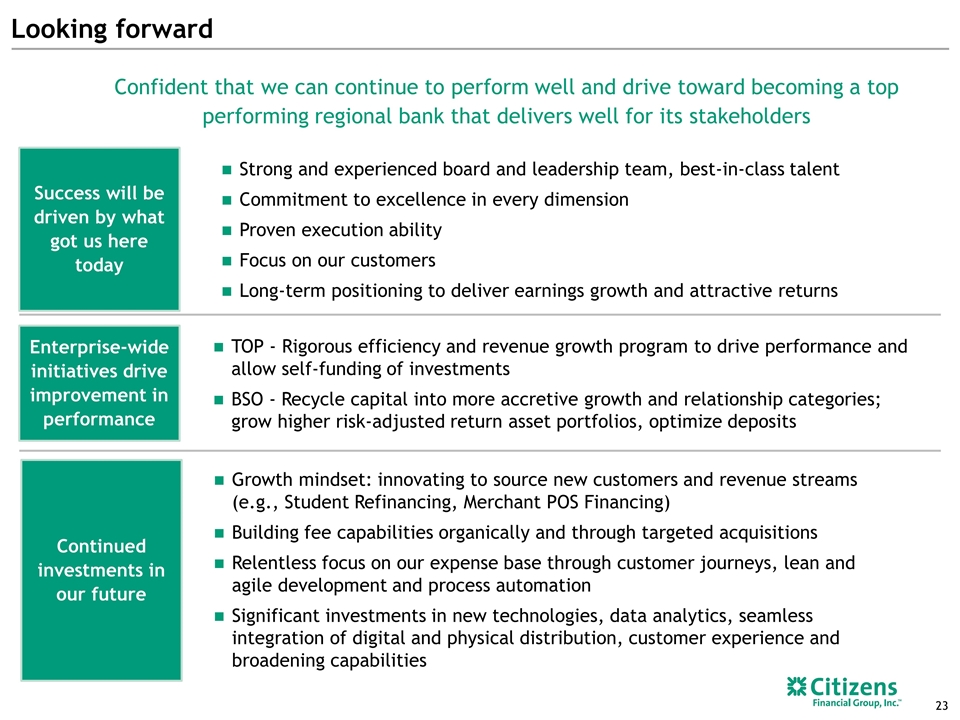
Looking forward Success will be driven by what got us here today Continued investments in our future Strong and experienced board and leadership team, best-in-class talent Commitment to excellence in every dimension Proven execution ability Focus on our customers Long-term positioning to deliver earnings growth and attractive returns Confident that we can continue to perform well and drive toward becoming a top performing regional bank that delivers well for its stakeholders Enterprise-wide initiatives drive improvement in performance TOP - Rigorous efficiency and revenue growth program to drive performance and allow self-funding of investments BSO - Recycle capital into more accretive growth and relationship categories; grow higher risk-adjusted return asset portfolios, optimize deposits Growth mindset: innovating to source new customers and revenue streams (e.g., Student Refinancing, Merchant POS Financing) Building fee capabilities organically and through targeted acquisitions Relentless focus on our expense base through customer journeys, lean and agile development and process automation Significant investments in new technologies, data analytics, seamless integration of digital and physical distribution, customer experience and broadening capabilities
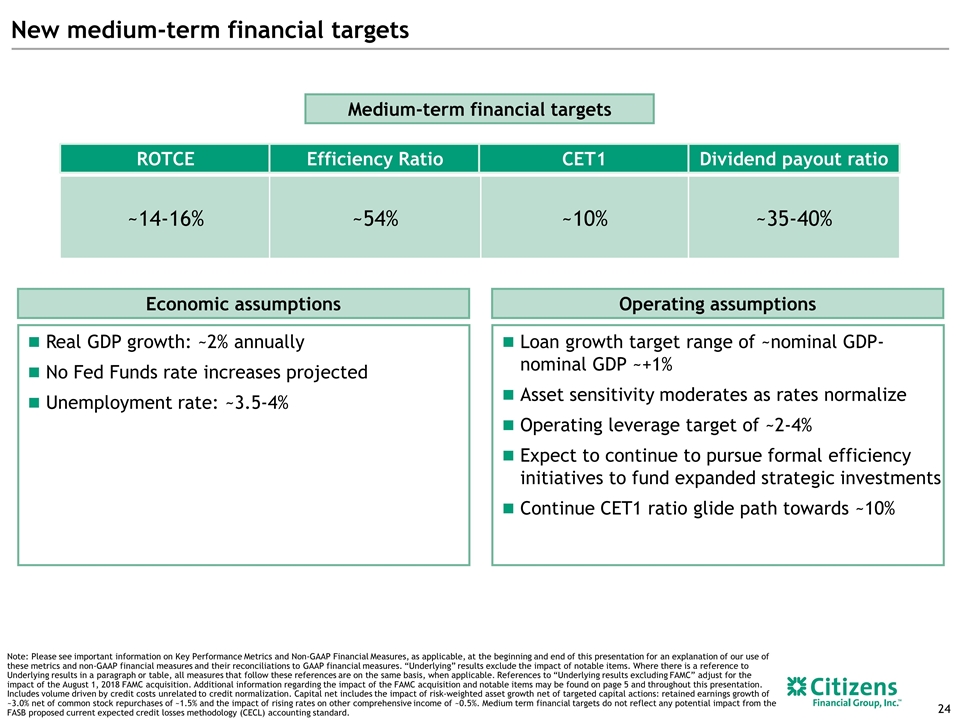
New medium-term financial targets Medium-term financial targets Note: Please see important information on Key Performance Metrics and Non-GAAP Financial Measures, as applicable, at the beginning and end of this presentation for an explanation of our use of these metrics and non-GAAP financial measures and their reconciliations to GAAP financial measures. “Underlying” results exclude the impact of notable items. Where there is a reference to Underlying results in a paragraph or table, all measures that follow these references are on the same basis, when applicable. References to “Underlying results excluding FAMC” adjust for the impact of the August 1, 2018 FAMC acquisition. Additional information regarding the impact of the FAMC acquisition and notable items may be found on page 5 and throughout this presentation. Includes volume driven by credit costs unrelated to credit normalization. Capital net includes the impact of risk-weighted asset growth net of targeted capital actions: retained earnings growth of ~3.0% net of common stock repurchases of ~1.5% and the impact of rising rates on other comprehensive income of ~0.5%. Medium term financial targets do not reflect any potential impact from the FASB proposed current expected credit losses methodology (CECL) accounting standard. Economic assumptions Real GDP growth: ~2% annually No Fed Funds rate increases projected Unemployment rate: ~3.5-4% Operating assumptions Loan growth target range of ~nominal GDP- nominal GDP ~+1% Asset sensitivity moderates as rates normalize Operating leverage target of ~2-4% Expect to continue to pursue formal efficiency initiatives to fund expanded strategic investments Continue CET1 ratio glide path towards ~10% ~14-16% ~10% ~54% ROTCE Efficiency Ratio CET1 ~35-40% Dividend payout ratio
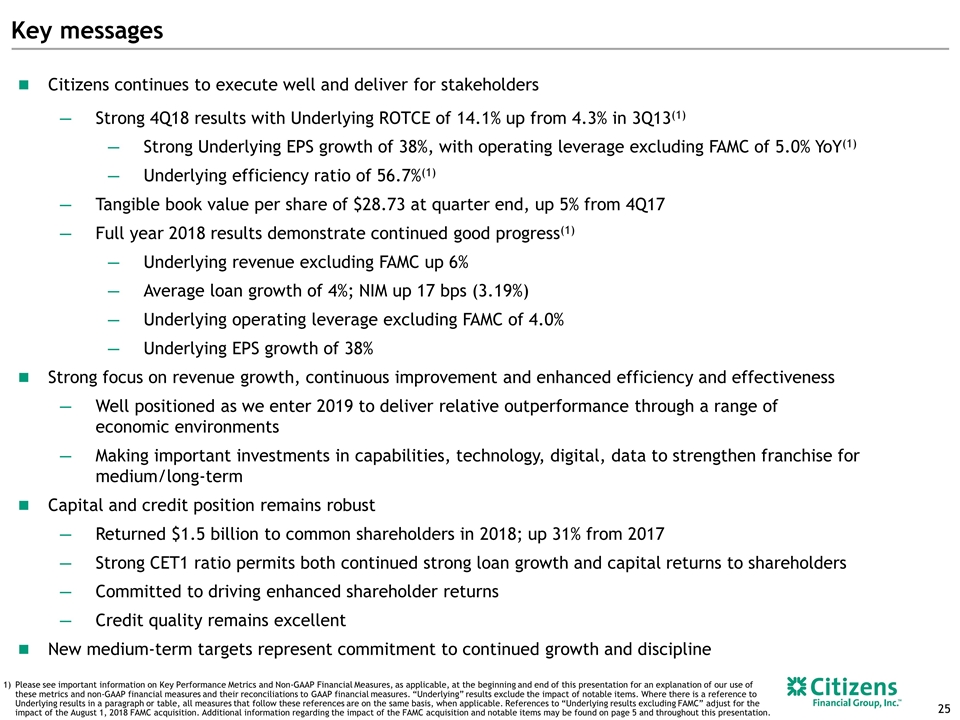
Key messages Citizens continues to execute well and deliver for stakeholders Strong 4Q18 results with Underlying ROTCE of 14.1% up from 4.3% in 3Q13(1) Strong Underlying EPS growth of 38%, with operating leverage excluding FAMC of 5.0% YoY(1) Underlying efficiency ratio of 56.7%(1) Tangible book value per share of $28.73 at quarter end, up 5% from 4Q17 Full year 2018 results demonstrate continued good progress(1) Underlying revenue excluding FAMC up 6% Average loan growth of 4%; NIM up 17 bps (3.19%) Underlying operating leverage excluding FAMC of 4.0% Underlying EPS growth of 38% Strong focus on revenue growth, continuous improvement and enhanced efficiency and effectiveness Well positioned as we enter 2019 to deliver relative outperformance through a range of economic environments Making important investments in capabilities, technology, digital, data to strengthen franchise for medium/long-term Capital and credit position remains robust Returned $1.5 billion to common shareholders in 2018; up 31% from 2017 Strong CET1 ratio permits both continued strong loan growth and capital returns to shareholders Committed to driving enhanced shareholder returns Credit quality remains excellent New medium-term targets represent commitment to continued growth and discipline Please see important information on Key Performance Metrics and Non-GAAP Financial Measures, as applicable, at the beginning and end of this presentation for an explanation of our use of these metrics and non-GAAP financial measures and their reconciliations to GAAP financial measures. “Underlying” results exclude the impact of notable items. Where there is a reference to Underlying results in a paragraph or table, all measures that follow these references are on the same basis, when applicable. References to “Underlying results excluding FAMC” adjust for the impact of the August 1, 2018 FAMC acquisition. Additional information regarding the impact of the FAMC acquisition and notable items may be found on page 5 and throughout this presentation.

Appendix
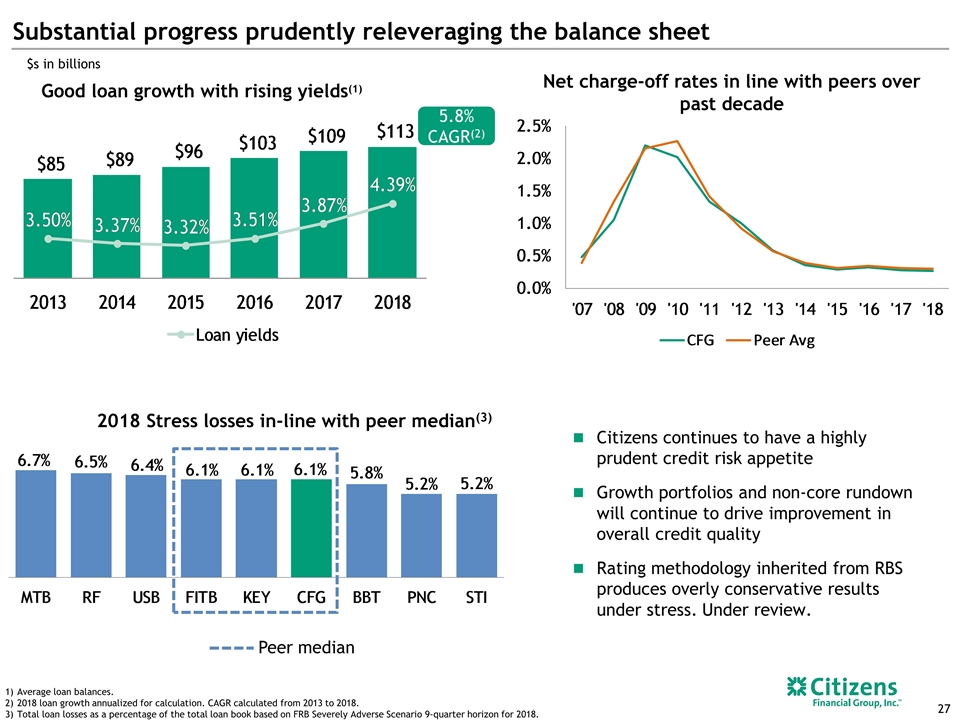
Substantial progress prudently releveraging the balance sheet Good loan growth with rising yields(1) $s in billions Average loan balances. 2018 loan growth annualized for calculation. CAGR calculated from 2013 to 2018. Total loan losses as a percentage of the total loan book based on FRB Severely Adverse Scenario 9-quarter horizon for 2018. 27 2018 Stress losses in-line with peer median(3) Peer median Citizens continues to have a highly prudent credit risk appetite Growth portfolios and non-core rundown will continue to drive improvement in overall credit quality Rating methodology inherited from RBS produces overly conservative results under stress. Under review. 5.8% CAGR(2) Net charge-off rates in line with peers over past decade
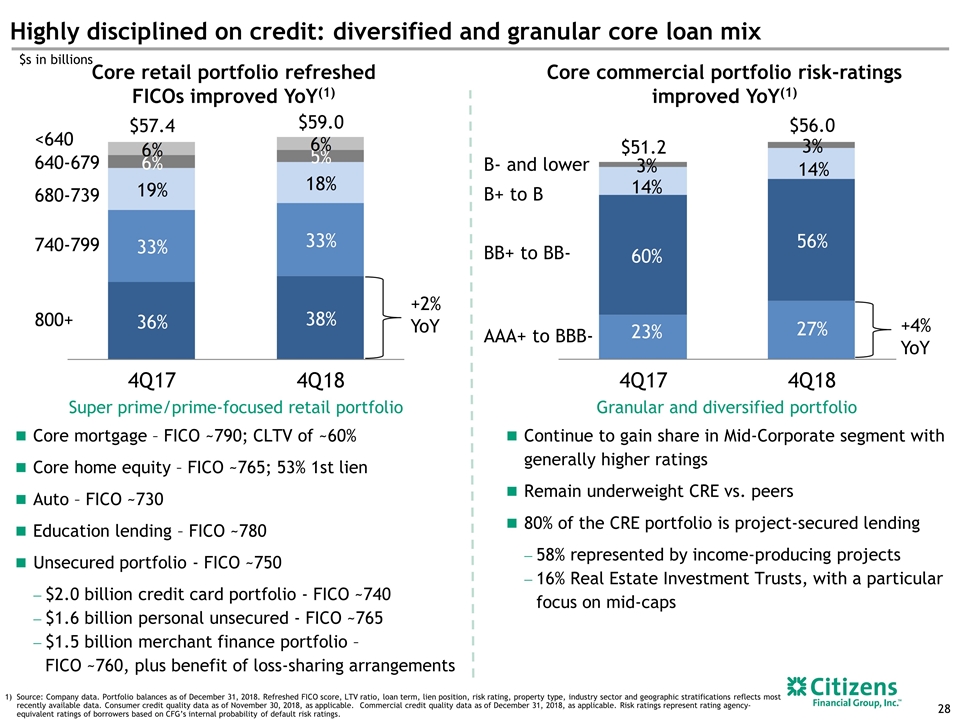
Source: Company data. Portfolio balances as of December 31, 2018. Refreshed FICO score, LTV ratio, loan term, lien position, risk rating, property type, industry sector and geographic stratifications reflects most recently available data. Consumer credit quality data as of November 30, 2018, as applicable. Commercial credit quality data as of December 31, 2018, as applicable. Risk ratings represent rating agency-equivalent ratings of borrowers based on CFG’s internal probability of default risk ratings. Core commercial portfolio risk-ratings improved YoY(1) Highly disciplined on credit: diversified and granular core loan mix Super prime/prime-focused retail portfolio Core mortgage – FICO ~790; CLTV of ~60% Core home equity – FICO ~765; 53% 1st lien Auto – FICO ~730 Education lending – FICO ~780 Unsecured portfolio - FICO ~750 $2.0 billion credit card portfolio - FICO ~740 $1.6 billion personal unsecured - FICO ~765 $1.5 billion merchant finance portfolio – FICO ~760, plus benefit of loss-sharing arrangements 800+ 740-799 680-739 640-679 <640 Granular and diversified portfolio Continue to gain share in Mid-Corporate segment with generally higher ratings Remain underweight CRE vs. peers 80% of the CRE portfolio is project-secured lending 58% represented by income-producing projects 16% Real Estate Investment Trusts, with a particular focus on mid-caps $59.0 $57.4 Core retail portfolio refreshed FICOs improved YoY(1) $51.2 $56.0 $s in billions B- and lower B+ to B BB+ to BB- AAA+ to BBB- +2% YoY +4% YoY
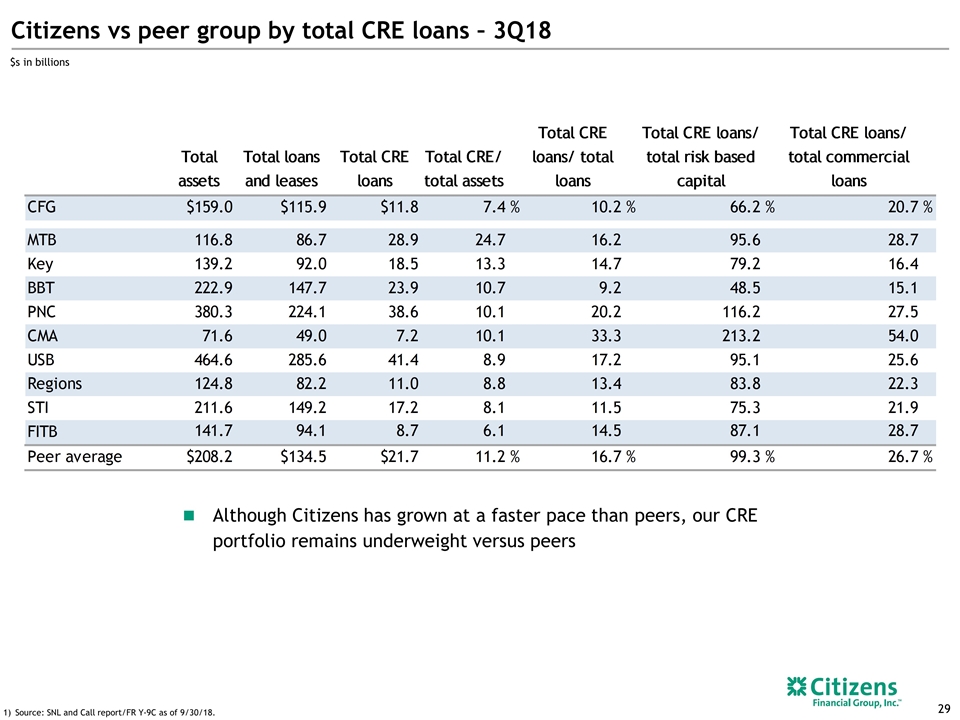
Citizens vs peer group by total CRE loans – 3Q18 Source: SNL and Call report/FR Y-9C as of 9/30/18. 29 $s in billions Although Citizens has grown at a faster pace than peers, our CRE portfolio remains underweight versus peers
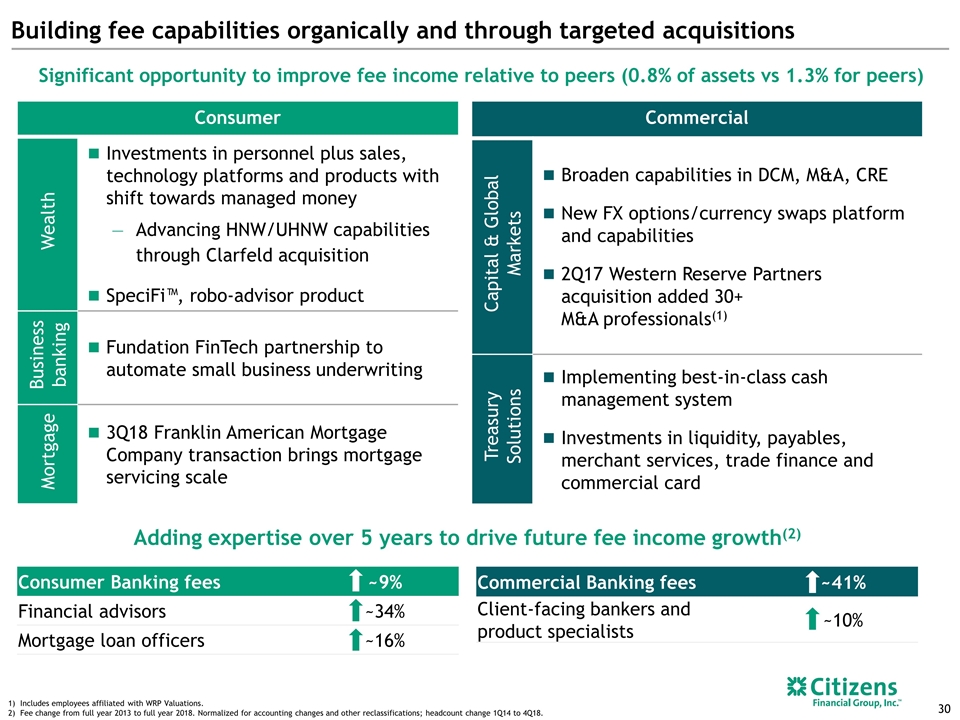
Commercial Capital & Global Markets Broaden capabilities in DCM, M&A, CRE New FX options/currency swaps platform and capabilities 2Q17 Western Reserve Partners acquisition added 30+ M&A professionals(1) Treasury Solutions Implementing best-in-class cash management system Investments in liquidity, payables, merchant services, trade finance and commercial card 30 Building fee capabilities organically and through targeted acquisitions Includes employees affiliated with WRP Valuations. Fee change from full year 2013 to full year 2018. Normalized for accounting changes and other reclassifications; headcount change 1Q14 to 4Q18. Consumer Wealth Investments in personnel plus sales, technology platforms and products with shift towards managed money Advancing HNW/UHNW capabilities through Clarfeld acquisition SpeciFi™, robo-advisor product Business banking Fundation FinTech partnership to automate small business underwriting Mortgage 3Q18 Franklin American Mortgage Company transaction brings mortgage servicing scale Significant opportunity to improve fee income relative to peers (0.8% of assets vs 1.3% for peers) Consumer Banking fees ~9% Financial advisors ~34% Mortgage loan officers ~16% Commercial Banking fees ~41% Client-facing bankers and product specialists ~10% Adding expertise over 5 years to drive future fee income growth(2)
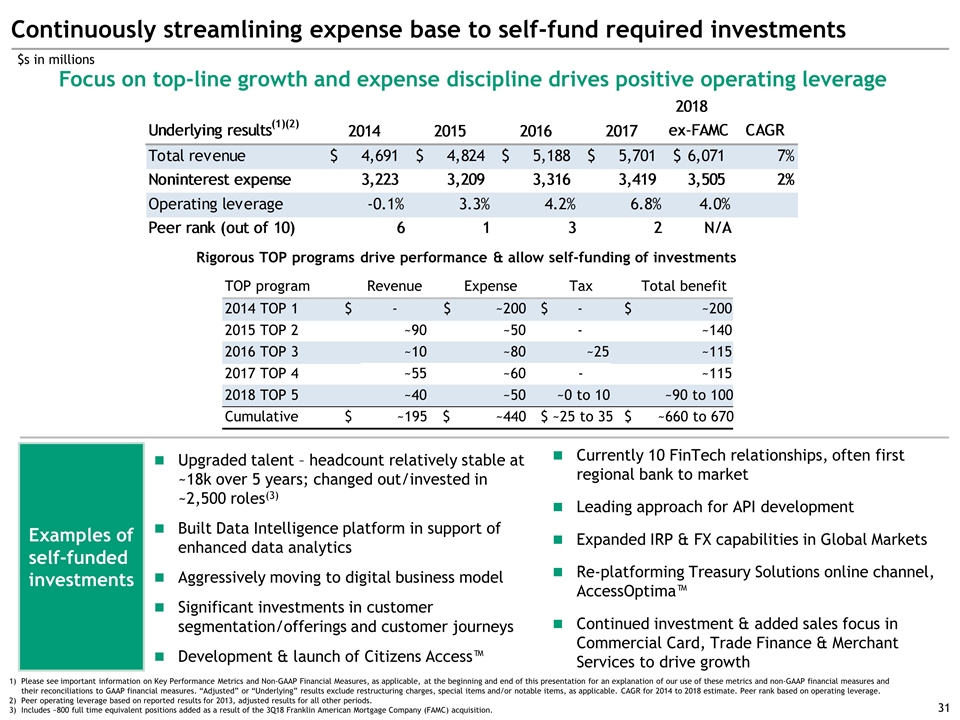
Rigorous TOP programs drive performance & allow self-funding of investments Continuously streamlining expense base to self-fund required investments 31 Focus on top-line growth and expense discipline drives positive operating leverage Upgraded talent – headcount relatively stable at ~18k over 5 years; changed out/invested in ~2,500 roles(3) Built Data Intelligence platform in support of enhanced data analytics Aggressively moving to digital business model Significant investments in customer segmentation/offerings and customer journeys Development & launch of Citizens Access™ Examples of self-funded investments Currently 10 FinTech relationships, often first regional bank to market Leading approach for API development Expanded IRP & FX capabilities in Global Markets Re-platforming Treasury Solutions online channel, AccessOptima™ Continued investment & added sales focus in Commercial Card, Trade Finance & Merchant Services to drive growth $s in millions Please see important information on Key Performance Metrics and Non-GAAP Financial Measures, as applicable, at the beginning and end of this presentation for an explanation of our use of these metrics and non-GAAP financial measures and their reconciliations to GAAP financial measures. “Adjusted” or “Underlying” results exclude restructuring charges, special items and/or notable items, as applicable. CAGR for 2014 to 2018 estimate. Peer rank based on operating leverage. Peer operating leverage based on reported results for 2013, adjusted results for all other periods. Includes ~800 full time equivalent positions added as a result of the 3Q18 Franklin American Mortgage Company (FAMC) acquisition. TOP program Revenue Expense Tax Total benefit 2014 TOP 1 $ - $ ~200 $ - $ ~200 2015 TOP 2 ~90 ~50 - ~140 2016 TOP 3 ~10 ~80 ~25 ~115 2017 TOP 4 ~55 ~60 - ~115 2018 TOP 5 ~40 ~50 ~0 to 10 ~90 to 100 Cumulative $ ~195 $ ~440 $ ~25 to 35 $ ~660 to 670
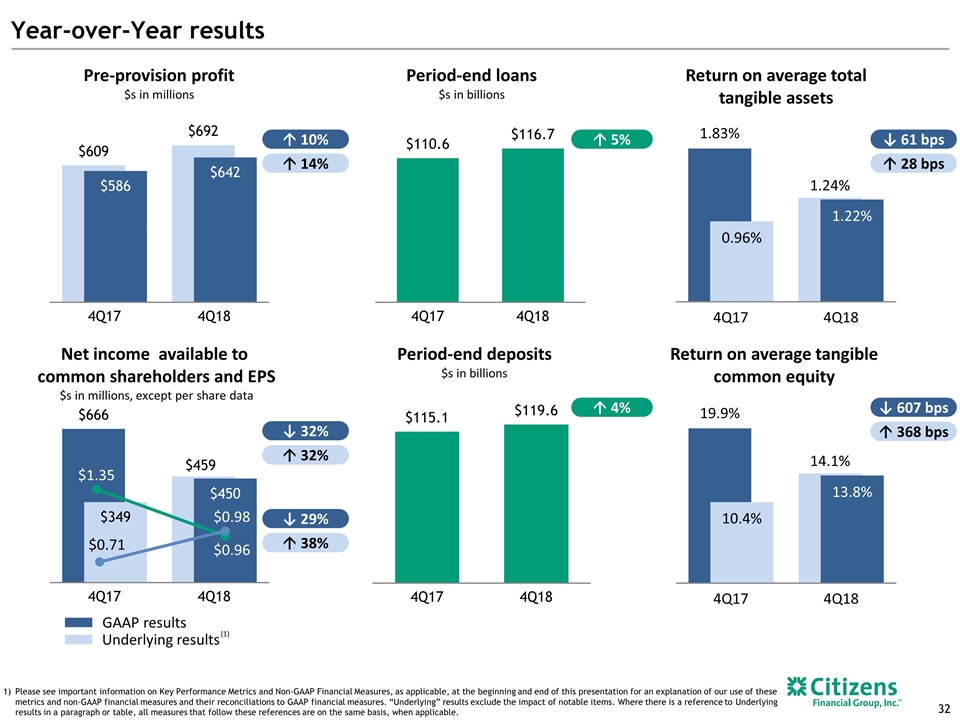
Year-over-Year results Pre-provision profit $s in millions Return on average total tangible assets Net income available to common shareholders and EPS $s in millions, except per share data Return on average tangible common equity á 10% Period-end loans $s in billions Period-end deposits $s in billions á 5% á 4% ↓ 61 bps á 14% GAAP results Underlying results (1) á 28 bps ↓ 607 bps á 368 bps $0.96 ↓ 29% á 38% ↓ 32% á 32% Please see important information on Key Performance Metrics and Non-GAAP Financial Measures, as applicable, at the beginning and end of this presentation for an explanation of our use of these metrics and non-GAAP financial measures and their reconciliations to GAAP financial measures. “Underlying” results exclude the impact of notable items. Where there is a reference to Underlying results in a paragraph or table, all measures that follow these references are on the same basis, when applicable. $0.71 $1.35 $0.98
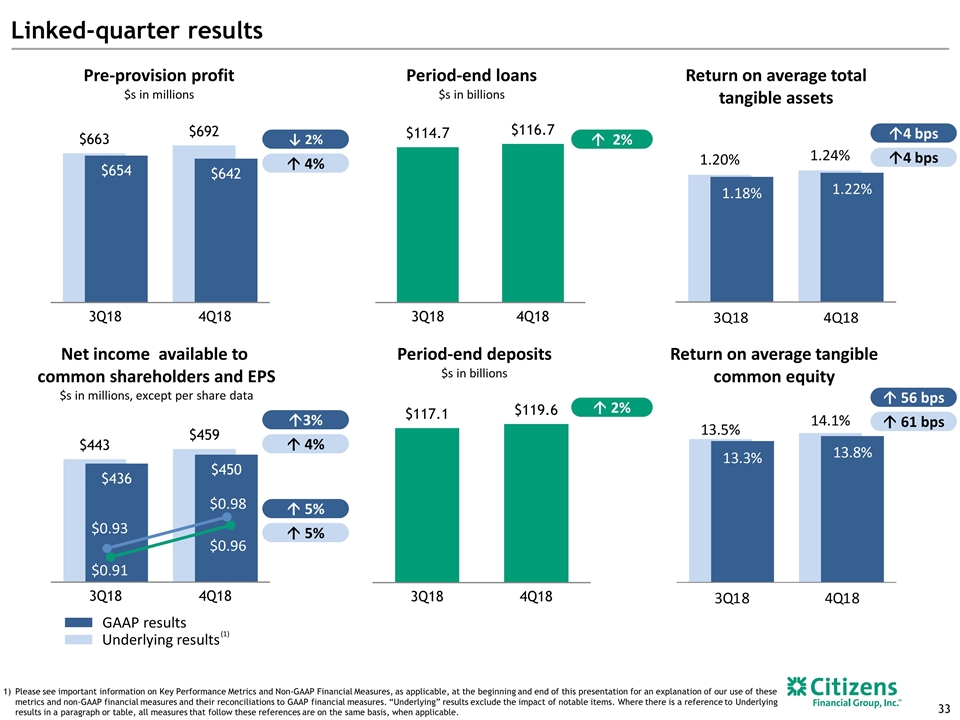
Linked-quarter results Pre-provision profit $s in millions Return on average total tangible assets Net income available to common shareholders and EPS $s in millions, except per share data Return on average tangible common equity ↓ 2% Period-end loans $s in billions Period-end deposits $s in billions á 2% á 2% $0.91 á4 bps á 4% GAAP results Underlying results (1) á4 bps á 56 bps á 61 bps á 5% á 5% á3% á 4% Please see important information on Key Performance Metrics and Non-GAAP Financial Measures, as applicable, at the beginning and end of this presentation for an explanation of our use of these metrics and non-GAAP financial measures and their reconciliations to GAAP financial measures. “Underlying” results exclude the impact of notable items. Where there is a reference to Underlying results in a paragraph or table, all measures that follow these references are on the same basis, when applicable. $0.96 $0.93 $0.98
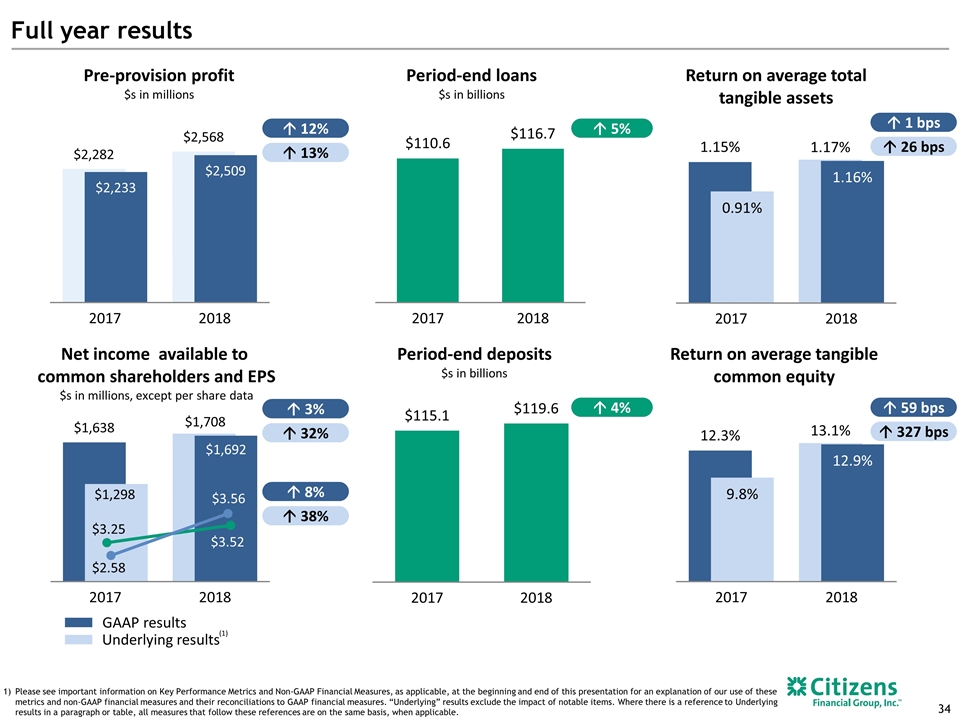
Full year results Pre-provision profit $s in millions Return on average total tangible assets Net income available to common shareholders and EPS $s in millions, except per share data Return on average tangible common equity á 12% Period-end loans $s in billions Period-end deposits $s in billions á 5% á 4% $3.52 $2.58 á 1 bps 34 á 13% GAAP results Underlying results (1) á 26 bps á 59 bps á 327 bps $3.56 á 8% á 38% á 3% á 32% Please see important information on Key Performance Metrics and Non-GAAP Financial Measures, as applicable, at the beginning and end of this presentation for an explanation of our use of these metrics and non-GAAP financial measures and their reconciliations to GAAP financial measures. “Underlying” results exclude the impact of notable items. Where there is a reference to Underlying results in a paragraph or table, all measures that follow these references are on the same basis, when applicable. $3.25
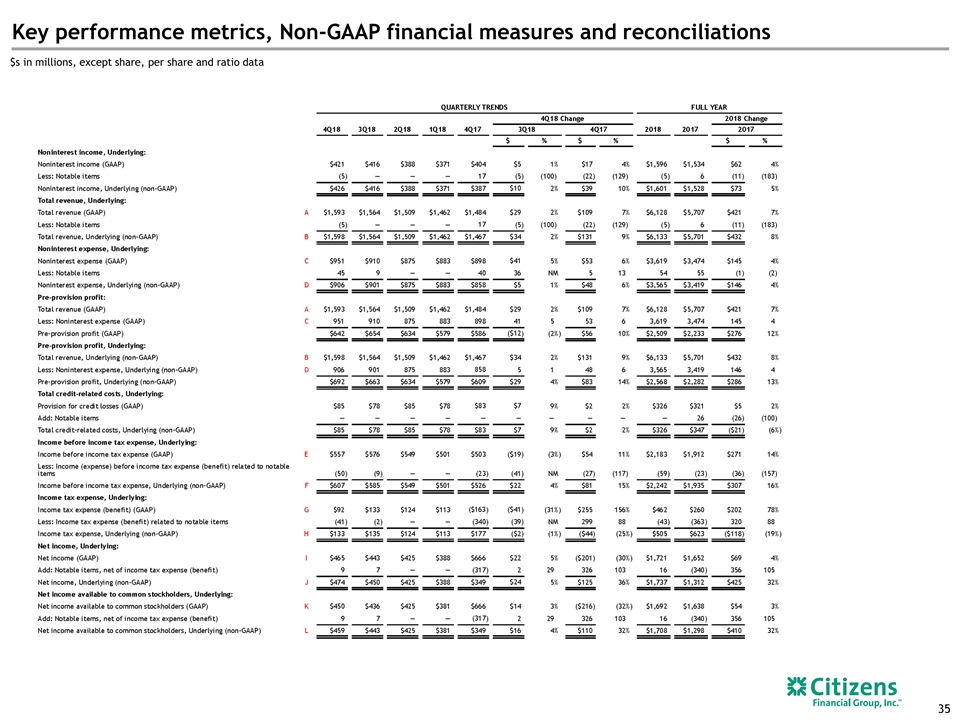
Key performance metrics, Non-GAAP financial measures and reconciliations 35 $s in millions, except share, per share and ratio data
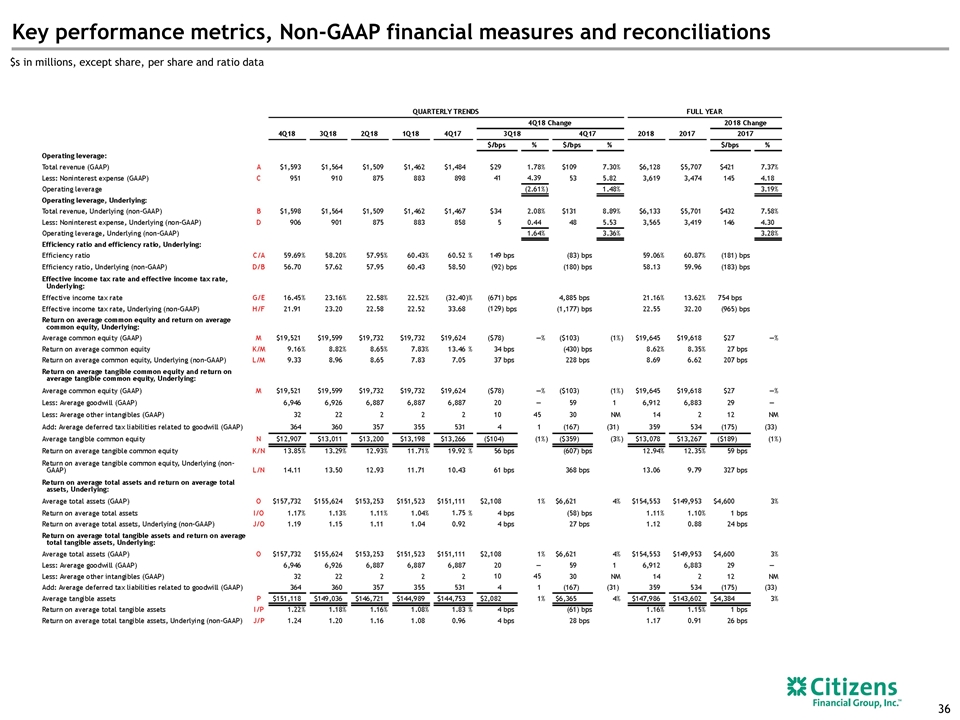
Key performance metrics, Non-GAAP financial measures and reconciliations 36 $s in millions, except share, per share and ratio data
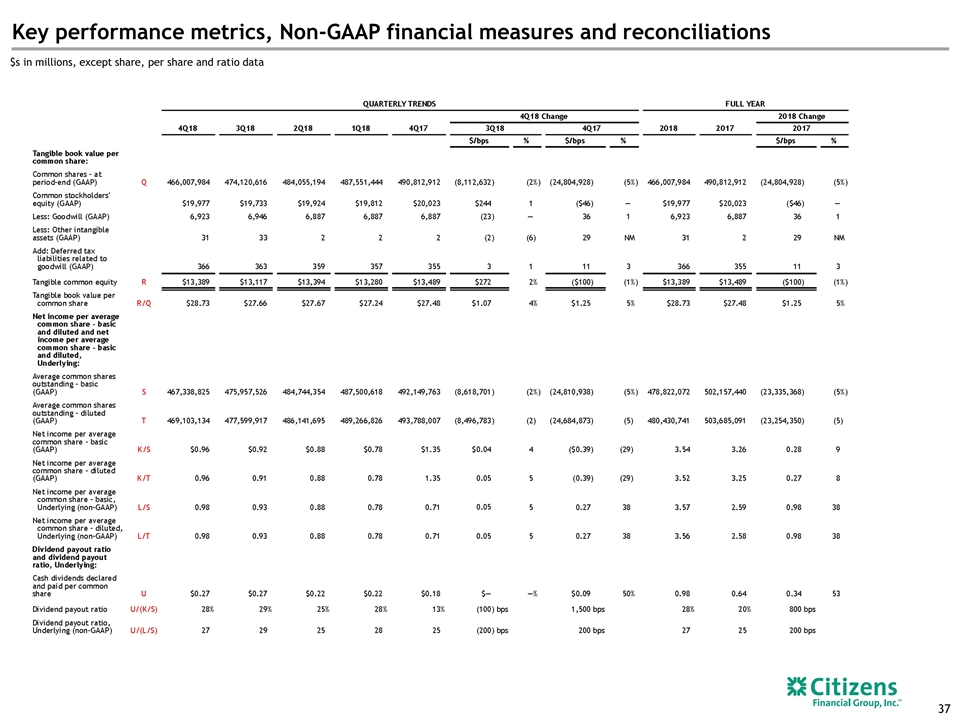
Key performance metrics, Non-GAAP financial measures and reconciliations 37 $s in millions, except share, per share and ratio data
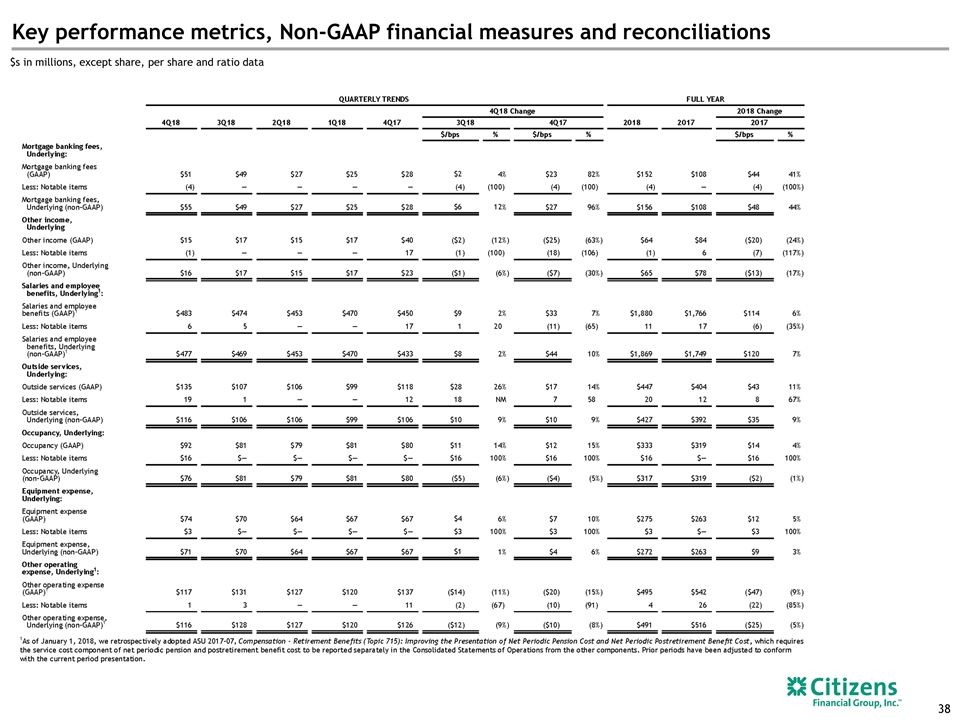
Key performance metrics, Non-GAAP financial measures and reconciliations 38 $s in millions, except share, per share and ratio data
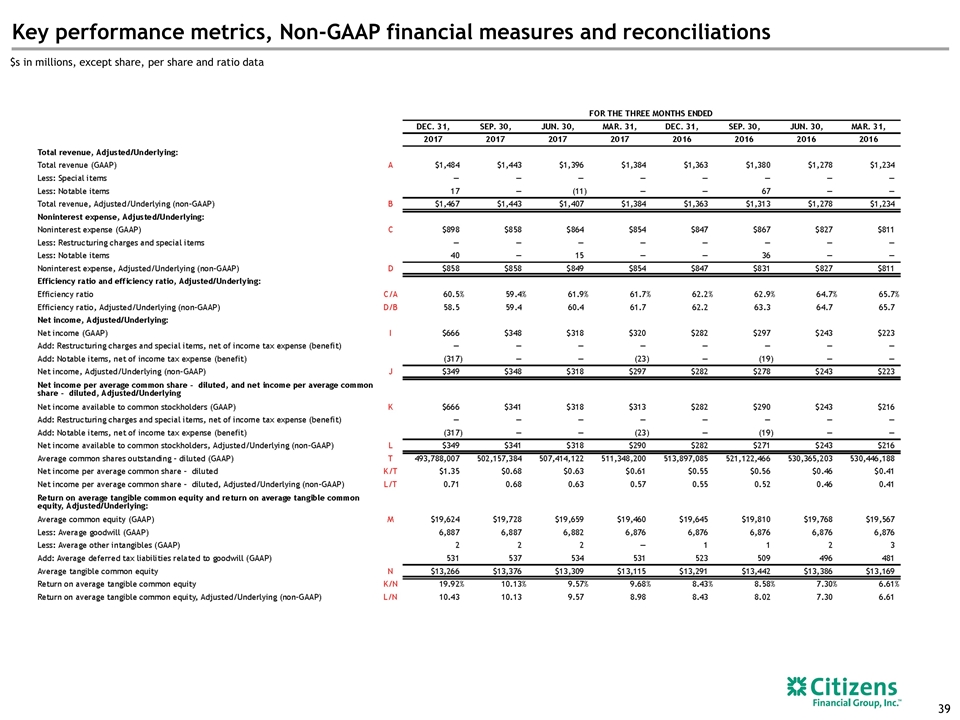
Key performance metrics, Non-GAAP financial measures and reconciliations 39 $s in millions, except share, per share and ratio data
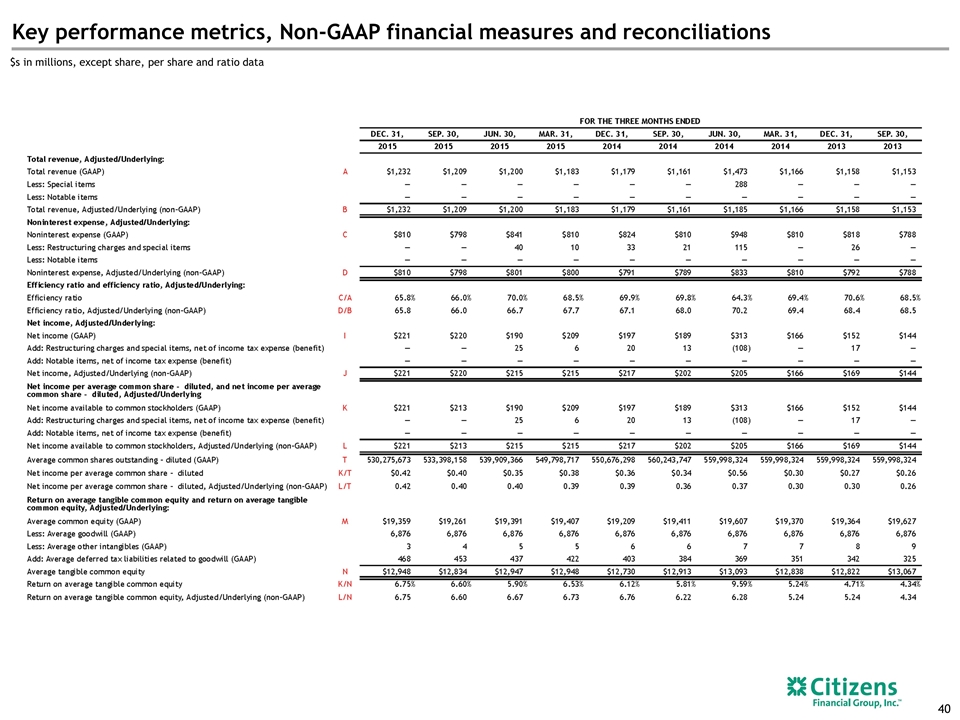
Key performance metrics, Non-GAAP financial measures and reconciliations 40 $s in millions, except share, per share and ratio data
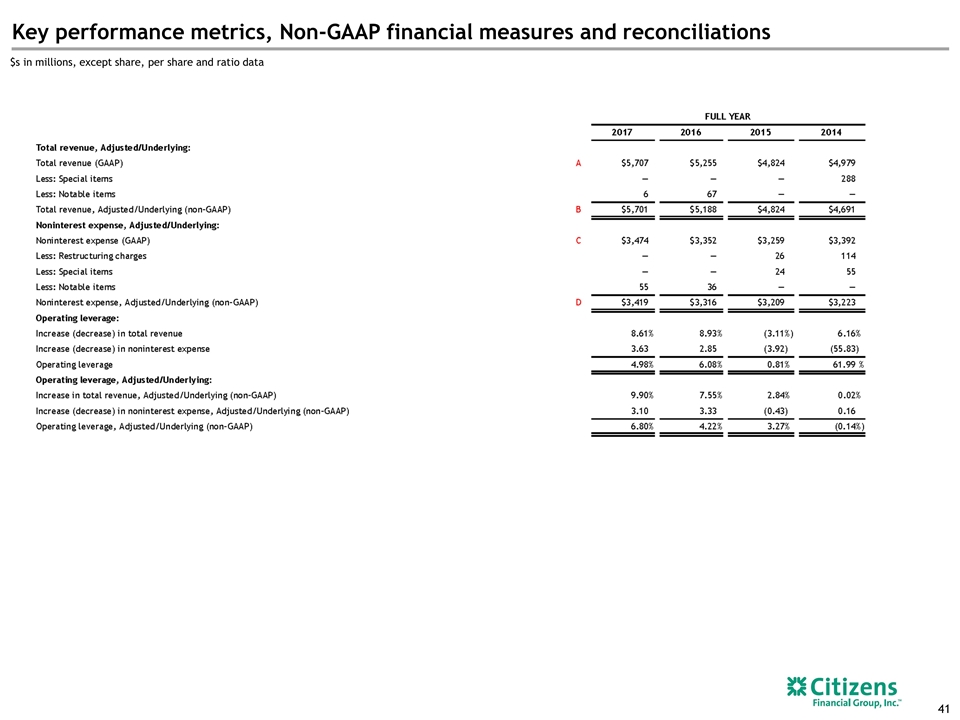
Key performance metrics, Non-GAAP financial measures and reconciliations 41 $s in millions, except share, per share and ratio data
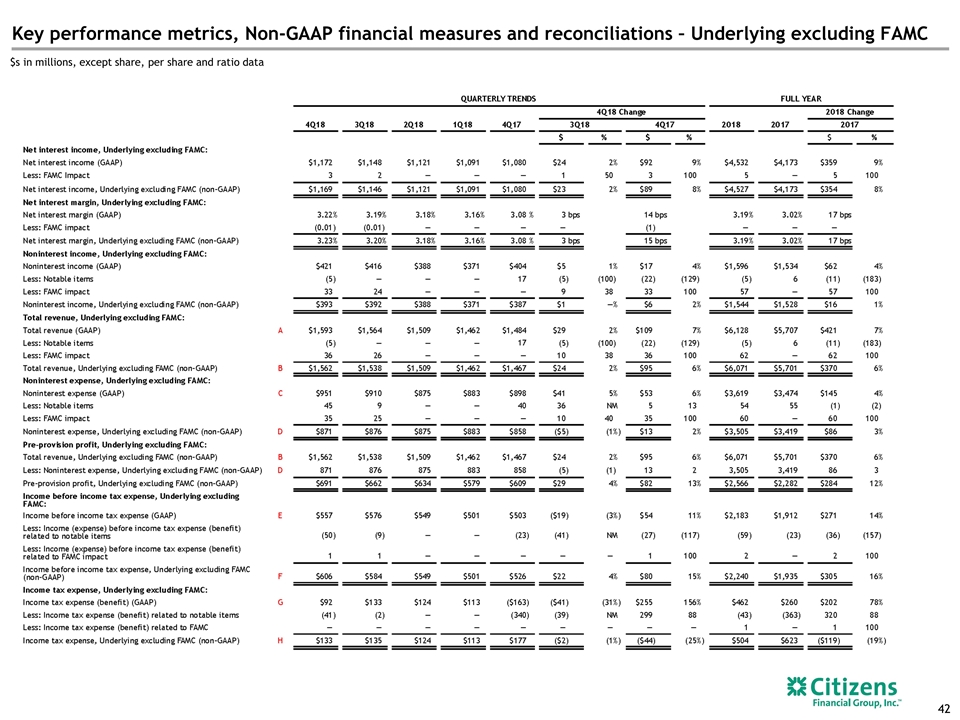
Key performance metrics, Non-GAAP financial measures and reconciliations – Underlying excluding FAMC 42 $s in millions, except share, per share and ratio data
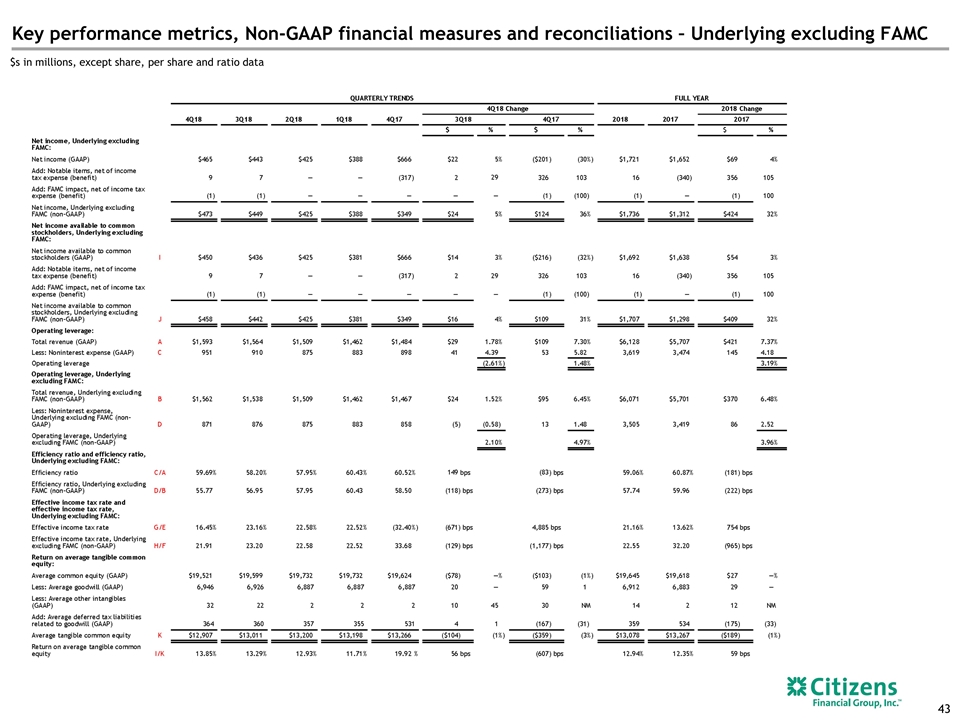
Key performance metrics, Non-GAAP financial measures and reconciliations – Underlying excluding FAMC 43 $s in millions, except share, per share and ratio data
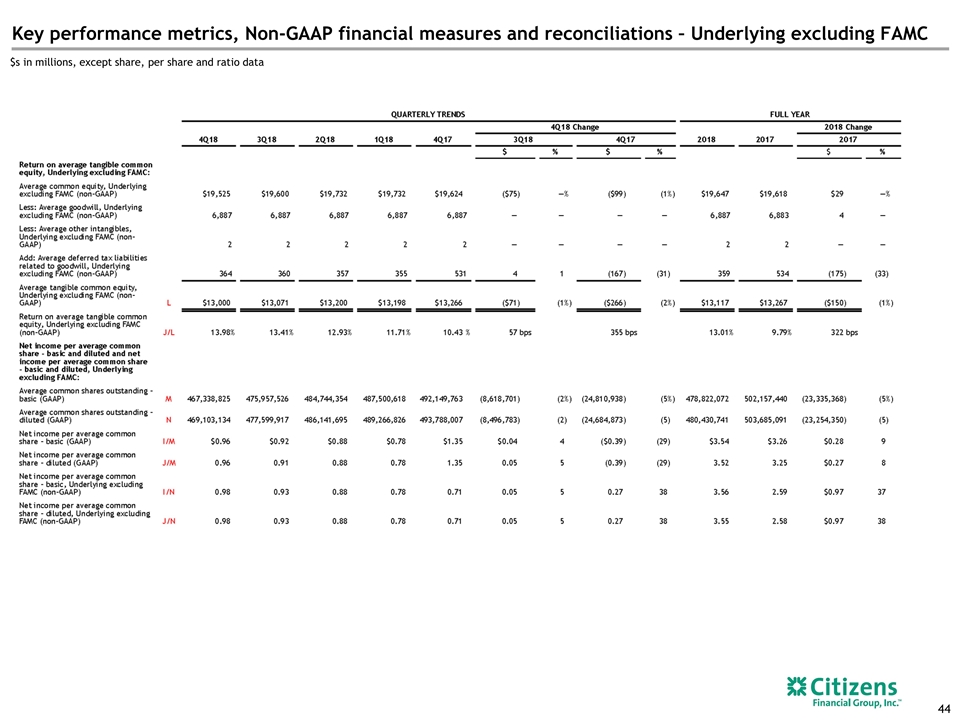
Key performance metrics, Non-GAAP financial measures and reconciliations – Underlying excluding FAMC 44 $s in millions, except share, per share and ratio data
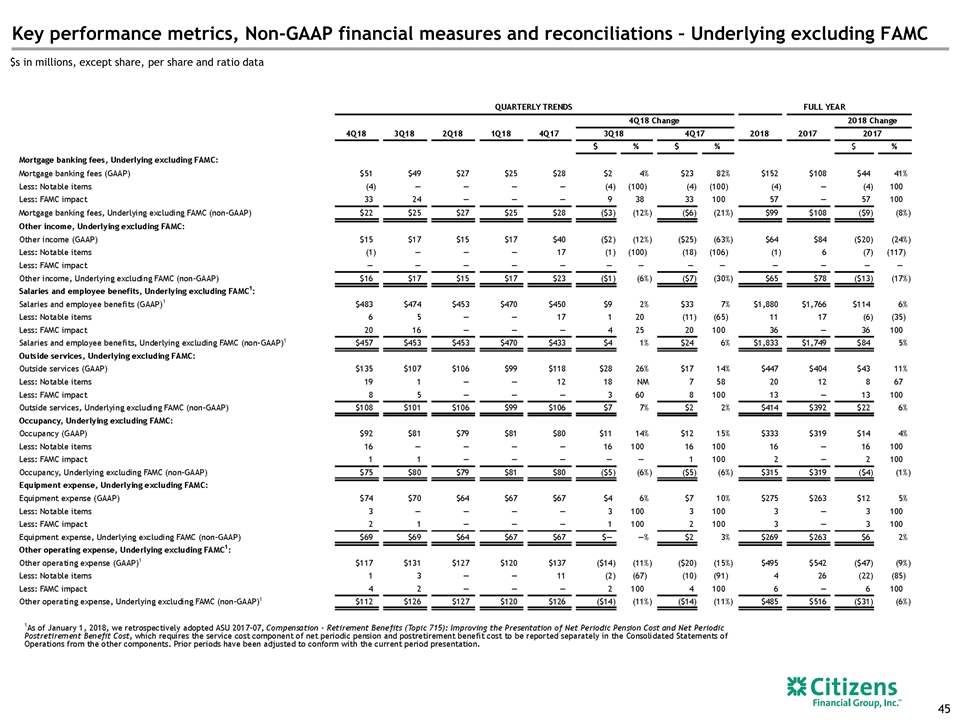
Key performance metrics, Non-GAAP financial measures and reconciliations – Underlying excluding FAMC 45 $s in millions, except share, per share and ratio data
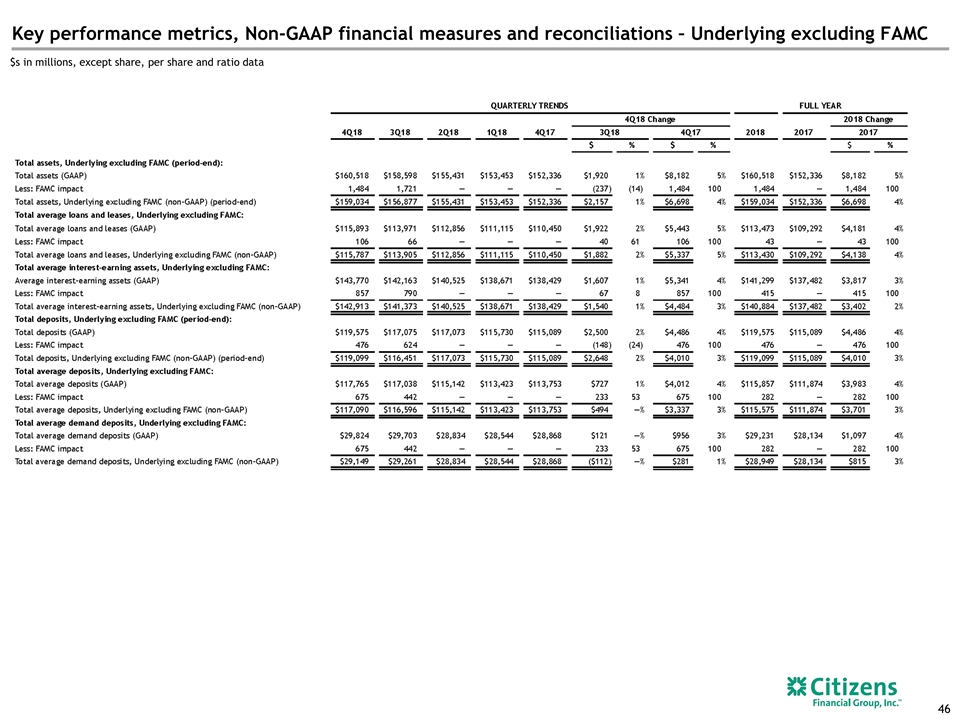
Key performance metrics, Non-GAAP financial measures and reconciliations – Underlying excluding FAMC 46 $s in millions, except share, per share and ratio data

47


