
Barclays Global Financial Services Conference Bruce Van Saun Chief Executive Officer September 10, 2019 Exhibit 99.1
Forward-looking statements and use of key performance metrics and non-GAAP financial measures This document contains forward-looking statements within the meaning of Private Securities Litigation Reform Act of 1995. Statements regarding potential future share repurchases and future dividends are forward-looking statements. Also, any statement that does not describe historical or current facts is a forward-looking statement. These statements often include the words “believes,” “expects,” “anticipates,” “estimates,” “intends,” “plans,” “goals,” “targets,” “initiatives,” “potentially,” “probably,” “projects,” “outlook” or similar expressions or future conditional verbs such as “may,” “will,” “should,” “would,” and “could.” Forward-looking statements are based upon the current beliefs and expectations of management, and on information currently available to management. Our statements speak as of the date hereof, and we do not assume any obligation to update these statements or to update the reasons why actual results could differ from those contained in such statements in light of new information or future events. We caution you, therefore, against relying on any of these forward-looking statements. They are neither statements of historical fact nor guarantees or assurances of future performance. While there is no assurance that any list of risks and uncertainties or risk factors is complete, important factors that could cause actual results to differ materially from those in the forward-looking statements include the following, without limitation: Negative economic and political conditions that adversely affect the general economy, housing prices, the job market, consumer confidence and spending habits which may affect, among other things, the level of nonperforming assets, charge-offs and provision expense; The rate of growth in the economy and employment levels, as well as general business and economic conditions, and changes in the competitive environment; Our ability to implement our business strategy, including the cost savings and efficiency components, and achieve our financial performance goals; Our ability to meet heightened supervisory requirements and expectations; Liabilities and business restrictions resulting from litigation and regulatory investigations; Our capital and liquidity requirements (including under regulatory capital standards, such as the U.S. Basel III capital rules) and our ability to generate capital internally or raise capital on favorable terms; The effect of changes in interest rates on our net interest income, net interest margin and our mortgage originations, mortgage servicing rights and mortgages held for sale; Changes in interest rates and market liquidity, as well as the magnitude of such changes, which may reduce interest margins, impact funding sources and affect the ability to originate and distribute financial products in the primary and secondary markets; The effect of changes in the level of checking or savings account deposits on our funding costs and net interest margin; Financial services reform and other current, pending or future legislation or regulation that could have a negative effect on our revenue and businesses, including the Dodd-Frank Act and other legislation and regulation relating to bank products and services; A failure in or breach of our operational or security systems or infrastructure, or those of our third party vendors or other service providers, including as a result of cyber-attacks; and Management’s ability to identify and manage these and other risks. In addition to the above factors, we also caution that the actual amounts and timing of any future common stock dividends or share repurchases will be subject to various factors, including our capital position, financial performance, capital impacts of strategic initiatives, market conditions, and regulatory and accounting considerations, as well as any other factors that our Board of Directors deems relevant in making such a determination. Therefore, there can be no assurance that we will repurchase shares or pay any dividends to holders of our common stock, or as to the amount of any such repurchases or dividends. More information about factors that could cause actual results to differ materially from those described in the forward-looking statements can be found under “Risk Factors” in our Annual Report on Form 10-K for the year ended December 31, 2018. Key Performance Metrics and Non-GAAP Financial Measures and Reconciliations Key Performance Metrics: Our Management uses certain key performance metrics (KPMs) to gauge our progress against strategic and operational goals, as well as to compare our performance against peers. The KPMs are referred to in our Registration Statements on Form S-1 and our external financial reports filed with the Securities and Exchange Commission. The KPMs include: Return on average tangible common equity (ROTCE); Return on average total tangible assets (ROTA); Efficiency ratio; Operating leverage; and Common equity tier 1 capital ratio. Established targets for the KPMs are based on Management-reporting results which are currently referred to by the Company as “Underlying” results. In historical periods, these results may have been referred to as "Adjusted" or "Adjusted/Underlying" results. We believe that Underlying results, which exclude notable items, provide the best representation of our underlying financial progress toward the KPMs as the results exclude items that our Management does not consider indicative of our on-going financial performance. We have consistently shown investors our KPMs on a Management-reporting basis since our initial public offering in September of 2014. KPMs that reflect Underlying results are considered non-GAAP financial measures. Non-GAAP Financial Measures: This document contains non-GAAP financial measures denoted as Underlying results. In historical periods, these results may have been referred to as Adjusted or Adjusted/Underlying results. Underlying results for any given reporting period exclude certain items that may occur in that period which Management does not consider indicative of the Company’s on-going financial performance. We believe these non-GAAP financial measures provide useful information to investors because they are used by our Management to evaluate our operating performance and make day-to-day operating decisions. In addition, we believe our Underlying results in any given reporting period reflect our on-going financial performance in that period and, accordingly, are useful to consider in addition to our GAAP financial results. We further believe the presentation of Underlying results increases comparability of period-to-period results. The appendix presents reconciliations of our non-GAAP measures to the most directly comparable GAAP financial measures. Other companies may use similarly titled non-GAAP financial measures that are calculated differently from the way we calculate such measures. Accordingly, our non-GAAP financial measures may not be comparable to similar measures used by such companies. We caution investors not to place undue reliance on such non-GAAP financial measures, but to consider them with the most directly comparable GAAP measures. Non-GAAP financial measures have limitations as analytical tools and should not be considered in isolation or as a substitute for our results reported under GAAP.
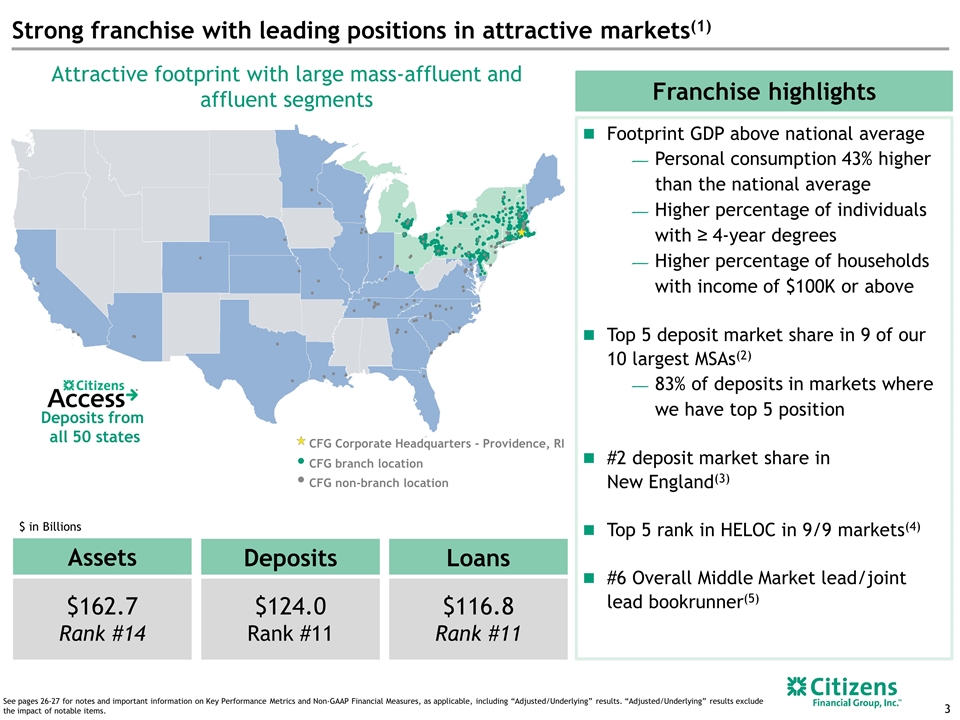
Loans $116.8 Rank #11 Assets $162.7 Rank #14 Strong franchise with leading positions in attractive markets(1) Deposits $124.0 Rank #11 Footprint GDP above national average Personal consumption 43% higher than the national average Higher percentage of individuals with ≥ 4-year degrees Higher percentage of households with income of $100K or above Top 5 deposit market share in 9 of our 10 largest MSAs(2) 83% of deposits in markets where we have top 5 position #2 deposit market share in New England(3) Top 5 rank in HELOC in 9/9 markets(4) #6 Overall Middle Market lead/joint lead bookrunner(5) Franchise highlights $ in Billions See pages 26-27 for notes and important information on Key Performance Metrics and Non-GAAP Financial Measures, as applicable, including “Adjusted/Underlying” results. “Adjusted/Underlying” results exclude the impact of notable items. CFG non-branch location CFG branch location CFG Corporate Headquarters - Providence, RI Deposits from all 50 states Attractive footprint with large mass-affluent and affluent segments
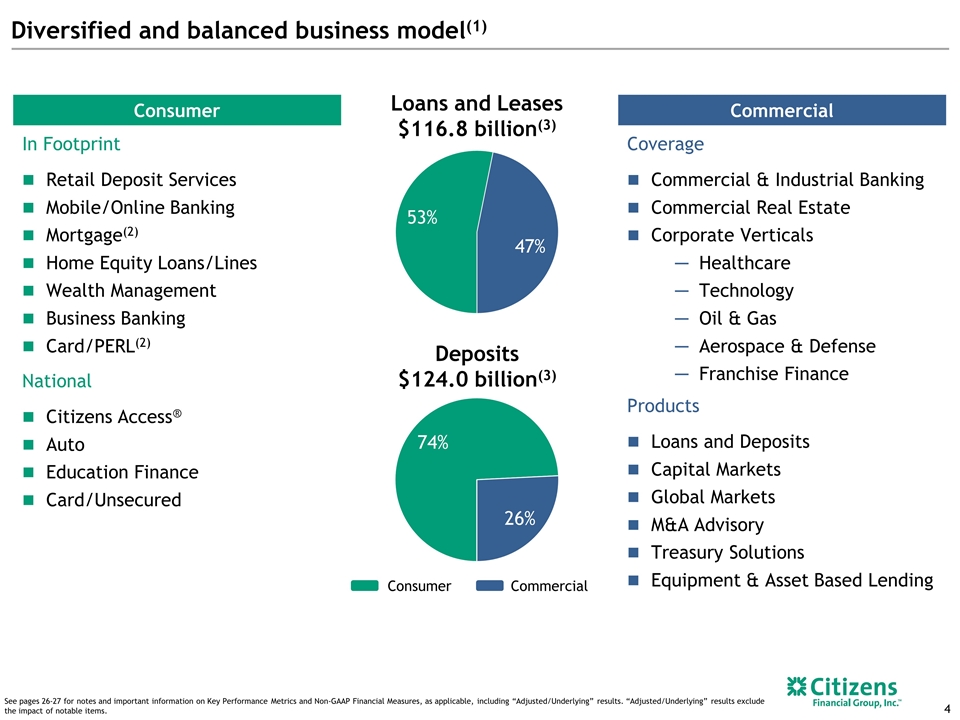
Diversified and balanced business model(1) Commercial Coverage Commercial & Industrial Banking Commercial Real Estate Corporate Verticals Healthcare Technology Oil & Gas Aerospace & Defense Franchise Finance Products Loans and Deposits Capital Markets Global Markets M&A Advisory Treasury Solutions Equipment & Asset Based Lending Deposits $124.0 billion(3) Loans and Leases $116.8 billion(3) Consumer Commercial See pages 26-27 for notes and important information on Key Performance Metrics and Non-GAAP Financial Measures, as applicable, including “Adjusted/Underlying” results. “Adjusted/Underlying” results exclude the impact of notable items. Consumer In Footprint Retail Deposit Services Mobile/Online Banking Mortgage(2) Home Equity Loans/Lines Wealth Management Business Banking Card/PERL(2) National Citizens Access® Auto Education Finance Card/Unsecured
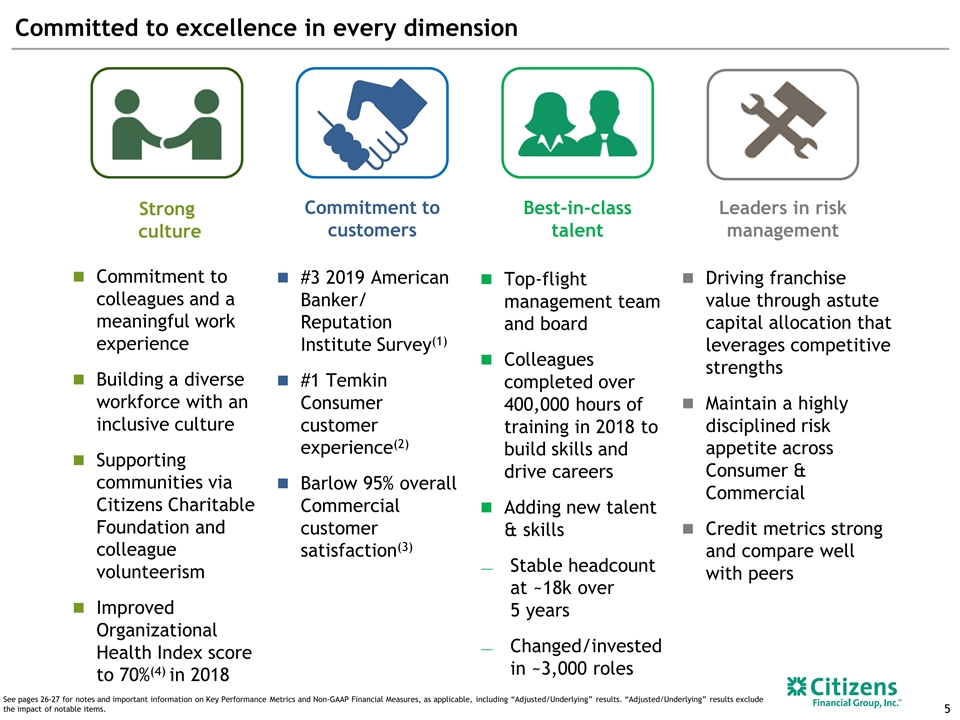
Committed to excellence in every dimension Commitment to colleagues and a meaningful work experience Building a diverse workforce with an inclusive culture Supporting communities via Citizens Charitable Foundation and colleague volunteerism Improved Organizational Health Index score to 70%(4) in 2018 #3 2019 American Banker/ Reputation Institute Survey(1) #1 Temkin Consumer customer experience(2) Barlow 95% overall Commercial customer satisfaction(3) Top-flight management team and board Colleagues completed over 400,000 hours of training in 2018 to build skills and drive careers Adding new talent & skills Stable headcount at ~18k over 5 years Changed/invested in ~3,000 roles Driving franchise value through astute capital allocation that leverages competitive strengths Maintain a highly disciplined risk appetite across Consumer & Commercial Credit metrics strong and compare well with peers Leaders in risk management Commitment to customers Strong culture See pages 26-27 for notes and important information on Key Performance Metrics and Non-GAAP Financial Measures, as applicable, including “Adjusted/Underlying” results. “Adjusted/Underlying” results exclude the impact of notable items. Best-in-class talent
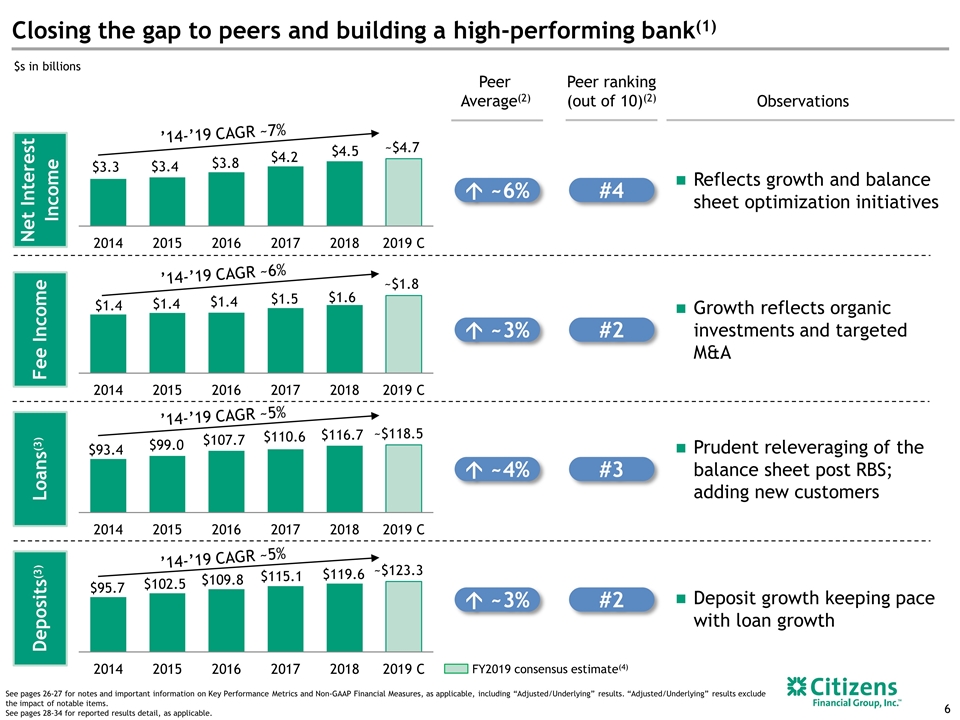
Peer Average(2) #3 Deposits(3) Loans(3) Fee Income Net Interest Income Executive Summary---Positioning Citizens to Investors ’14-’19 CAGR ~5% Reflects growth and balance sheet optimization initiatives Growth reflects organic investments and targeted M&A Prudent releveraging of the balance sheet post RBS; adding new customers Deposit growth keeping pace with loan growth Observations See pages 26-27 for notes and important information on Key Performance Metrics and Non-GAAP Financial Measures, as applicable, including “Adjusted/Underlying” results. “Adjusted/Underlying” results exclude the impact of notable items. See pages 28-34 for reported results detail, as applicable. ’14-’19 CAGR ~5% $s in billions ’14-’19 CAGR ~6% ’14-’19 CAGR ~7% á ~6% á ~3% á ~4% á ~3% #4 #2 #2 Peer ranking (out of 10)(2) Closing the gap to peers and building a high-performing bank(1) FY2019 consensus estimate(4)
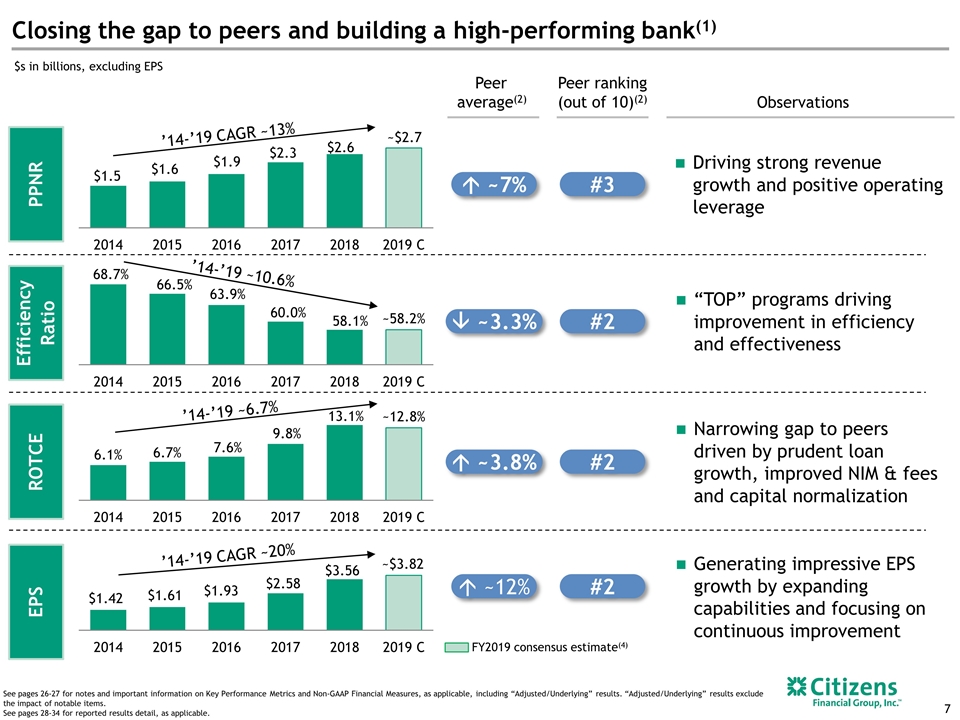
“TOP” programs driving improvement in efficiency and effectiveness #2 Efficiency Ratio â ~3.3% #2 #2 Executive Summary---Positioning Citizens to Investors Closing the gap to peers and building a high-performing bank(1) EPS ROTCE ’14-’19 CAGR ~20% Generating impressive EPS growth by expanding capabilities and focusing on continuous improvement Narrowing gap to peers driven by prudent loan growth, improved NIM & fees and capital normalization Observations See pages 26-27 for notes and important information on Key Performance Metrics and Non-GAAP Financial Measures, as applicable, including “Adjusted/Underlying” results. “Adjusted/Underlying” results exclude the impact of notable items. See pages 28-34 for reported results detail, as applicable. $s in billions, excluding EPS á ~3.8% á ~12% Peer average(2) Peer ranking (out of 10)(2) #3 PPNR ’14-’19 CAGR ~13% Driving strong revenue growth and positive operating leverage á ~7% FY2019 consensus estimate(4) ’14-’19 ~6.7% ’14-’19 ~10.6%
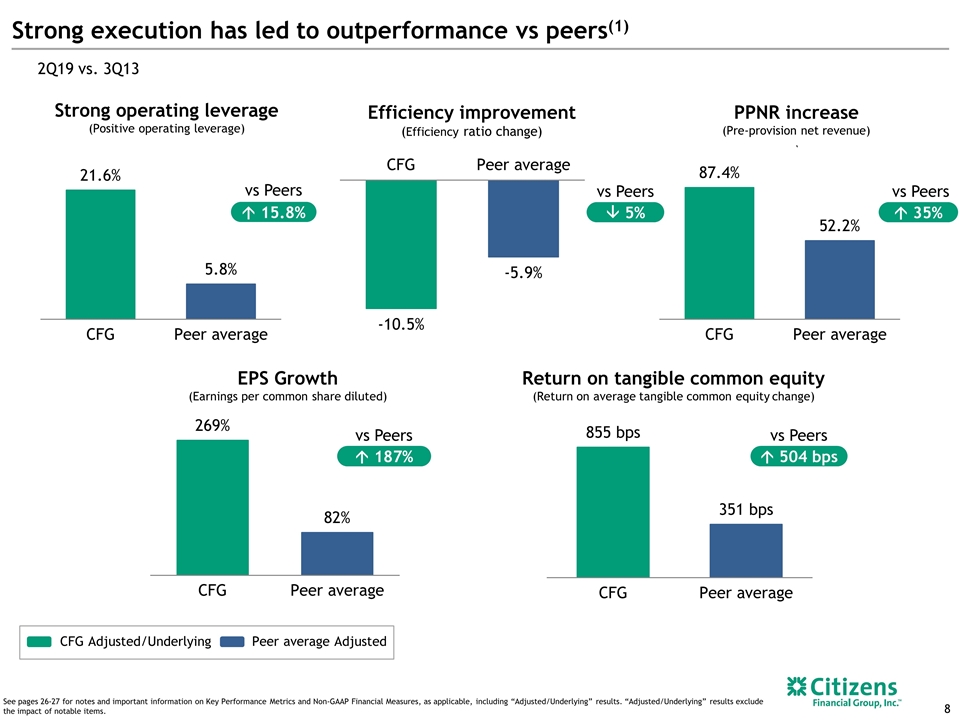
Peer average Adjusted CFG Adjusted/Underlying Return on tangible common equity (Return on average tangible common equity change) â 5% vs Peers Efficiency improvement (Efficiency ratio change) á 15.8% vs Peers Strong operating leverage (Positive operating leverage) EPS Growth (Earnings per common share diluted) Executive Summary---Positioning Citizens to Investors PPNR increase (Pre-provision net revenue) ` Strong execution has led to outperformance vs peers(1) 2Q19 vs. 3Q13 á 187% vs Peers á 504 bps vs Peers á 35% vs Peers See pages 26-27 for notes and important information on Key Performance Metrics and Non-GAAP Financial Measures, as applicable, including “Adjusted/Underlying” results. “Adjusted/Underlying” results exclude the impact of notable items.
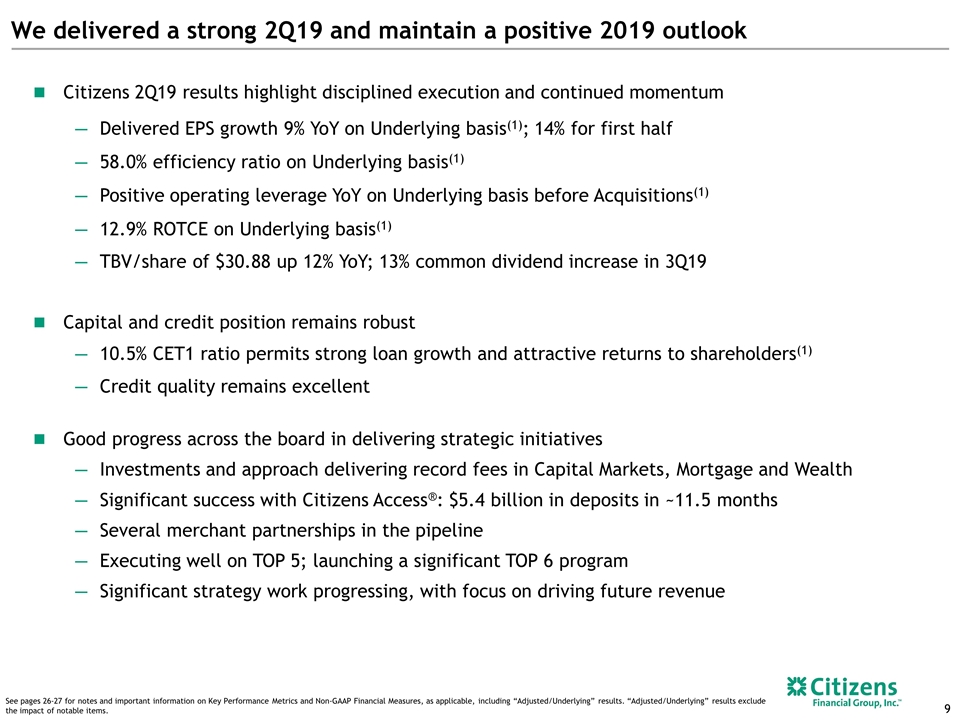
We delivered a strong 2Q19 and maintain a positive 2019 outlook Citizens 2Q19 results highlight disciplined execution and continued momentum Delivered EPS growth 9% YoY on Underlying basis(1); 14% for first half 58.0% efficiency ratio on Underlying basis(1) Positive operating leverage YoY on Underlying basis before Acquisitions(1) 12.9% ROTCE on Underlying basis(1) TBV/share of $30.88 up 12% YoY; 13% common dividend increase in 3Q19 Capital and credit position remains robust 10.5% CET1 ratio permits strong loan growth and attractive returns to shareholders(1) Credit quality remains excellent Good progress across the board in delivering strategic initiatives Investments and approach delivering record fees in Capital Markets, Mortgage and Wealth Significant success with Citizens Access®: $5.4 billion in deposits in ~11.5 months Several merchant partnerships in the pipeline Executing well on TOP 5; launching a significant TOP 6 program Significant strategy work progressing, with focus on driving future revenue See pages 26-27 for notes and important information on Key Performance Metrics and Non-GAAP Financial Measures, as applicable, including “Adjusted/Underlying” results. “Adjusted/Underlying” results exclude the impact of notable items.
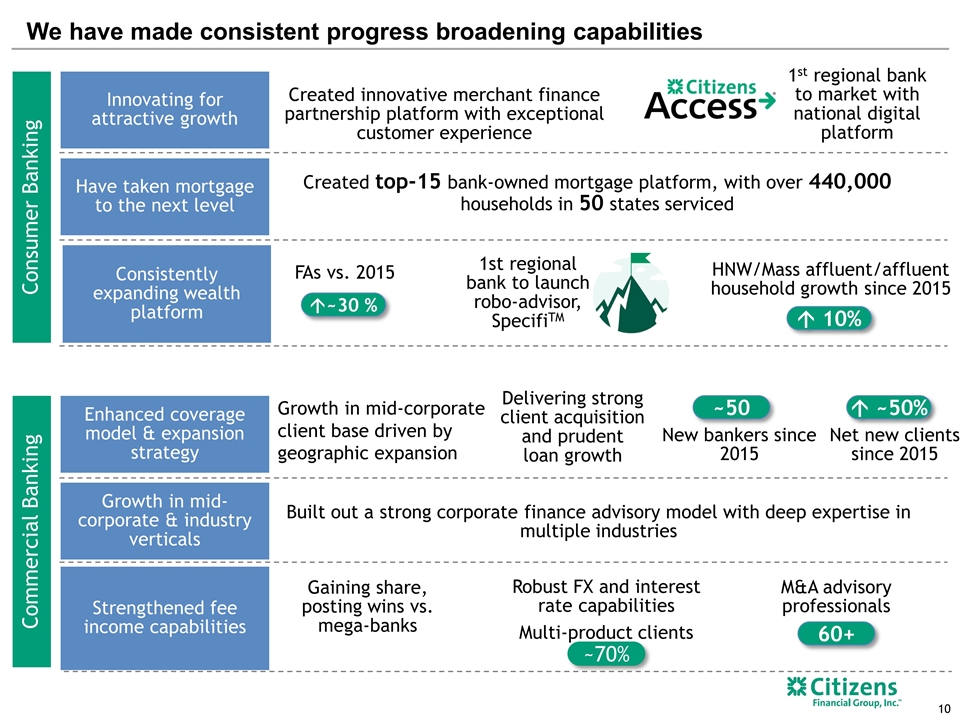
Innovating for attractive growth Consistently expanding wealth platform Have taken mortgage to the next level á~30 % Created innovative merchant finance partnership platform with exceptional customer experience Created top-15 bank-owned mortgage platform, with over 440,000 households in 50 states serviced FAs vs. 2015 1st regional bank to launch robo-advisor, SpecifiTM á 10% HNW/Mass affluent/affluent household growth since 2015 Commercial Banking Strengthened fee income capabilities Growth in mid-corporate & industry verticals Enhanced coverage model & expansion strategy We have made consistent progress broadening capabilities Net new clients since 2015 á ~50% New bankers since 2015 ~50 Delivering strong client acquisition and prudent loan growth M&A advisory professionals 60+ Built out a strong corporate finance advisory model with deep expertise in multiple industries Robust FX and interest rate capabilities Gaining share, posting wins vs. mega-banks Consumer Banking 1st regional bank to market with national digital platform Multi-product clients ~70% Growth in mid-corporate client base driven by geographic expansion
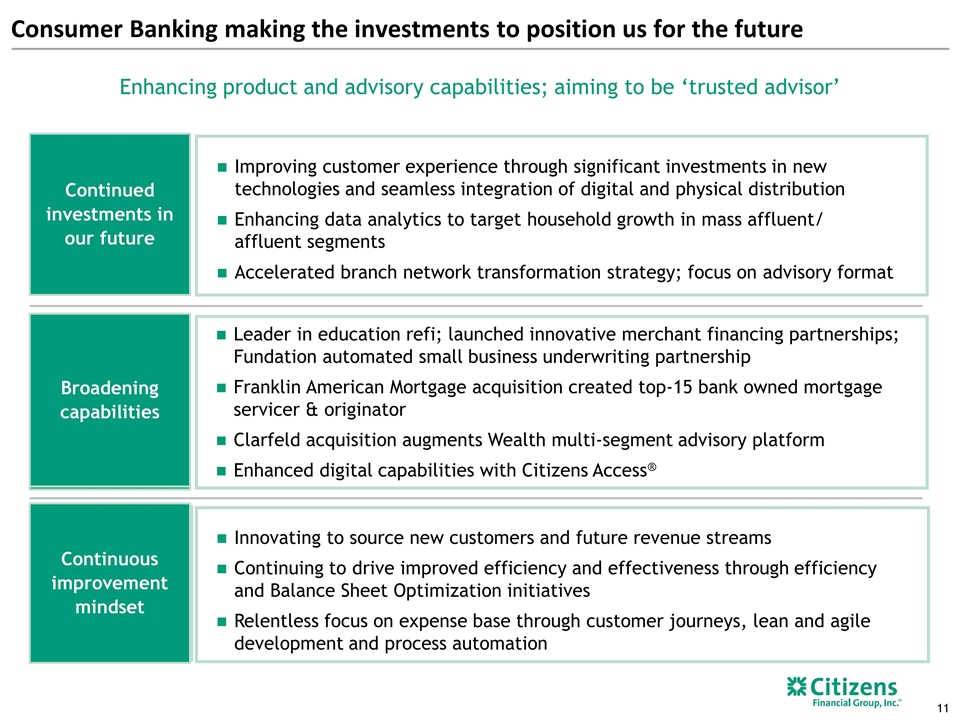
Consumer Banking making the investments to position us for the future Continued investments in our future Continuous improvement mindset Improving customer experience through significant investments in new technologies and seamless integration of digital and physical distribution Enhancing data analytics to target household growth in mass affluent/ affluent segments Accelerated branch network transformation strategy; focus on advisory format Enhancing product and advisory capabilities; aiming to be ‘trusted advisor’ Broadening capabilities Leader in education refi; launched innovative merchant financing partnerships; Fundation automated small business underwriting partnership Franklin American Mortgage acquisition created top-15 bank owned mortgage servicer & originator Clarfeld acquisition augments Wealth multi-segment advisory platform Enhanced digital capabilities with Citizens Access® Innovating to source new customers and future revenue streams Continuing to drive improved efficiency and effectiveness through efficiency and Balance Sheet Optimization initiatives Relentless focus on expense base through customer journeys, lean and agile development and process automation Broadening capabilities Continuous improvement mindset
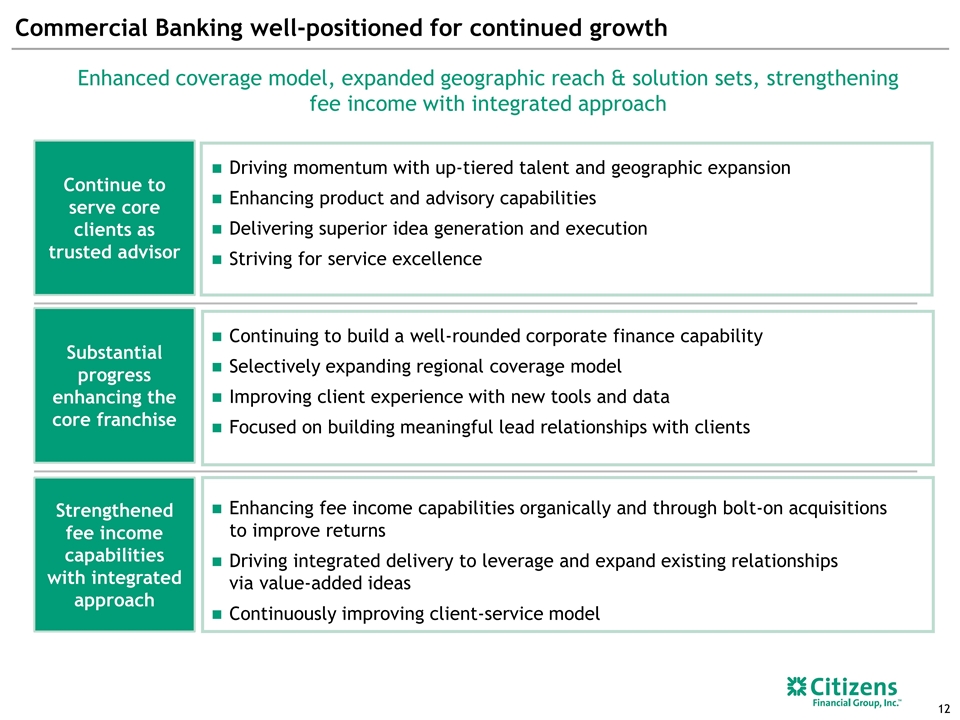
Commercial Banking well-positioned for continued growth Driving momentum with up-tiered talent and geographic expansion Enhancing product and advisory capabilities Delivering superior idea generation and execution Striving for service excellence Enhancing fee income capabilities organically and through bolt-on acquisitions to improve returns Driving integrated delivery to leverage and expand existing relationships via value-added ideas Continuously improving client-service model Continuing to build a well-rounded corporate finance capability Selectively expanding regional coverage model Improving client experience with new tools and data Focused on building meaningful lead relationships with clients Continue to serve core clients as trusted advisor Strengthened fee income capabilities with integrated approach Substantial progress enhancing the core franchise Enhanced coverage model, expanded geographic reach & solution sets, strengthening fee income with integrated approach
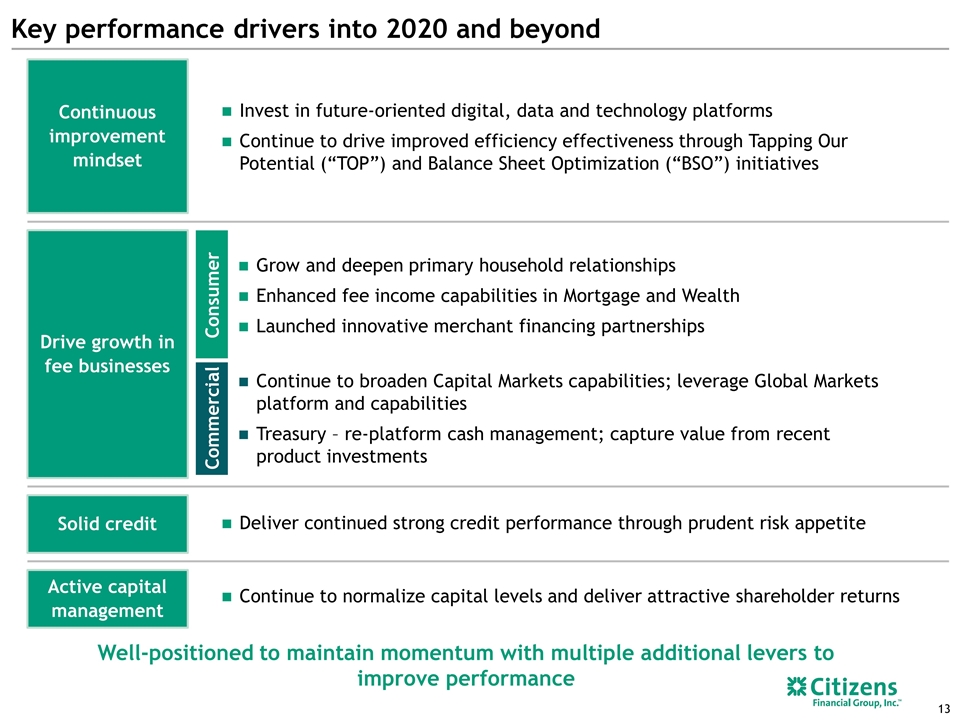
Key performance drivers into 2020 and beyond Continuous improvement mindset Drive growth in fee businesses Active capital management Invest in future-oriented digital, data and technology platforms Continue to drive improved efficiency effectiveness through Tapping Our Potential (“TOP”) and Balance Sheet Optimization (“BSO”) initiatives Continue to normalize capital levels and deliver attractive shareholder returns Solid credit Deliver continued strong credit performance through prudent risk appetite Well-positioned to maintain momentum with multiple additional levers to improve performance Consumer Grow and deepen primary household relationships Enhanced fee income capabilities in Mortgage and Wealth Launched innovative merchant financing partnerships Commercial Continue to broaden Capital Markets capabilities; leverage Global Markets platform and capabilities Treasury – re-platform cash management; capture value from recent product investments
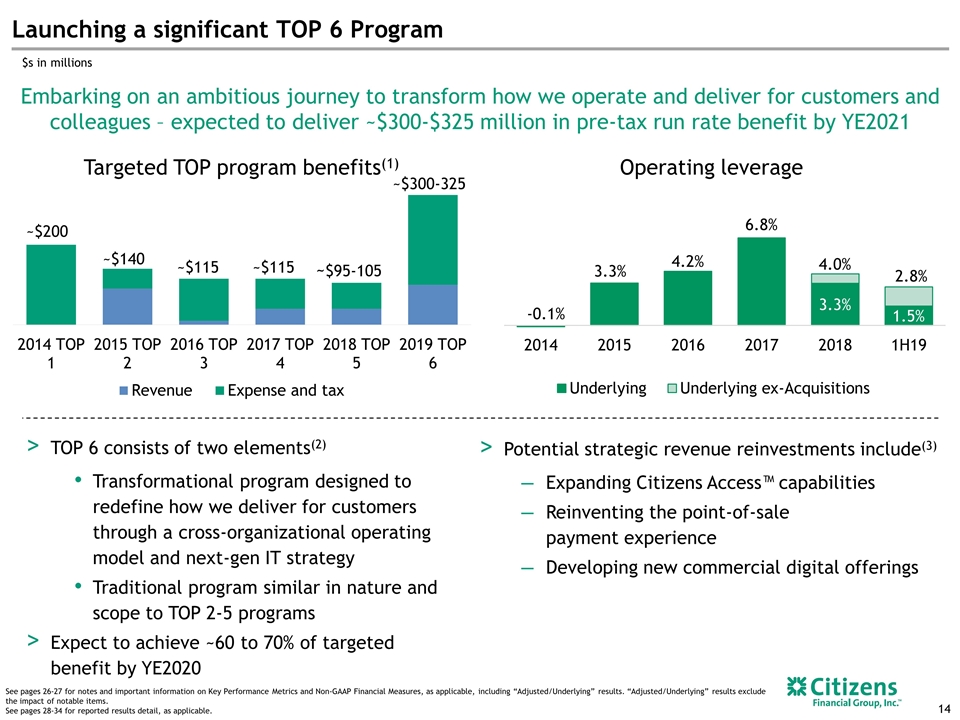
Potential strategic revenue reinvestments include(3) Expanding Citizens Access™ capabilities Reinventing the point-of-sale payment experience Developing new commercial digital offerings Launching a significant TOP 6 Program Embarking on an ambitious journey to transform how we operate and deliver for customers and colleagues – expected to deliver ~$300-$325 million in pre-tax run rate benefit by YE2021 $s in millions Operating leverage ~$200 ~$140 ~$115 ~$115 ~$95-105 Targeted TOP program benefits(1) See pages 26-27 for notes and important information on Key Performance Metrics and Non-GAAP Financial Measures, as applicable, including “Adjusted/Underlying” results. “Adjusted/Underlying” results exclude the impact of notable items. See pages 28-34 for reported results detail, as applicable. TOP 6 consists of two elements(2) Transformational program designed to redefine how we deliver for customers through a cross-organizational operating model and next-gen IT strategy Traditional program similar in nature and scope to TOP 2-5 programs Expect to achieve ~60 to 70% of targeted benefit by YE2020 ~$300-325
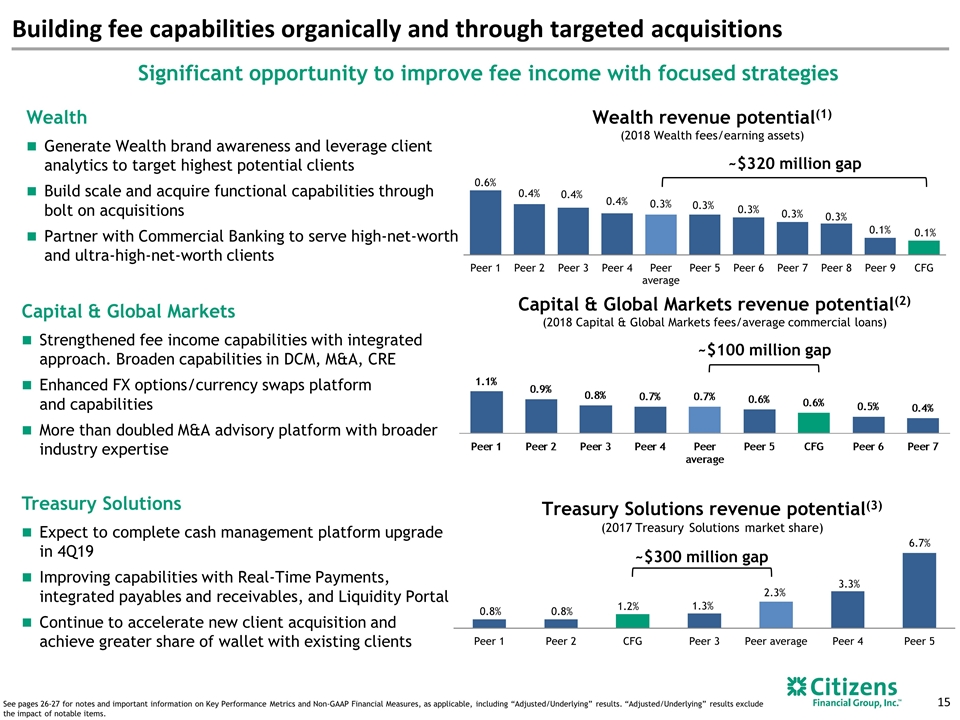
Treasury Solutions revenue potential(3) (2017 Treasury Solutions market share) Capital & Global Markets Strengthened fee income capabilities with integrated approach. Broaden capabilities in DCM, M&A, CRE Enhanced FX options/currency swaps platform and capabilities More than doubled M&A advisory platform with broader industry expertise Treasury Solutions Expect to complete cash management platform upgrade in 4Q19 Improving capabilities with Real-Time Payments, integrated payables and receivables, and Liquidity Portal Continue to accelerate new client acquisition and achieve greater share of wallet with existing clients Building fee capabilities organically and through targeted acquisitions Significant opportunity to improve fee income with focused strategies Wealth Generate Wealth brand awareness and leverage client analytics to target highest potential clients Build scale and acquire functional capabilities through bolt on acquisitions Partner with Commercial Banking to serve high-net-worth and ultra-high-net-worth clients ~$320 million gap See pages 26-27 for notes and important information on Key Performance Metrics and Non-GAAP Financial Measures, as applicable, including “Adjusted/Underlying” results. “Adjusted/Underlying” results exclude the impact of notable items. Capital & Global Markets revenue potential(2) (2018 Capital & Global Markets fees/average commercial loans) Wealth revenue potential(1) (2018 Wealth fees/earning assets) ~$100 million gap ~$300 million gap
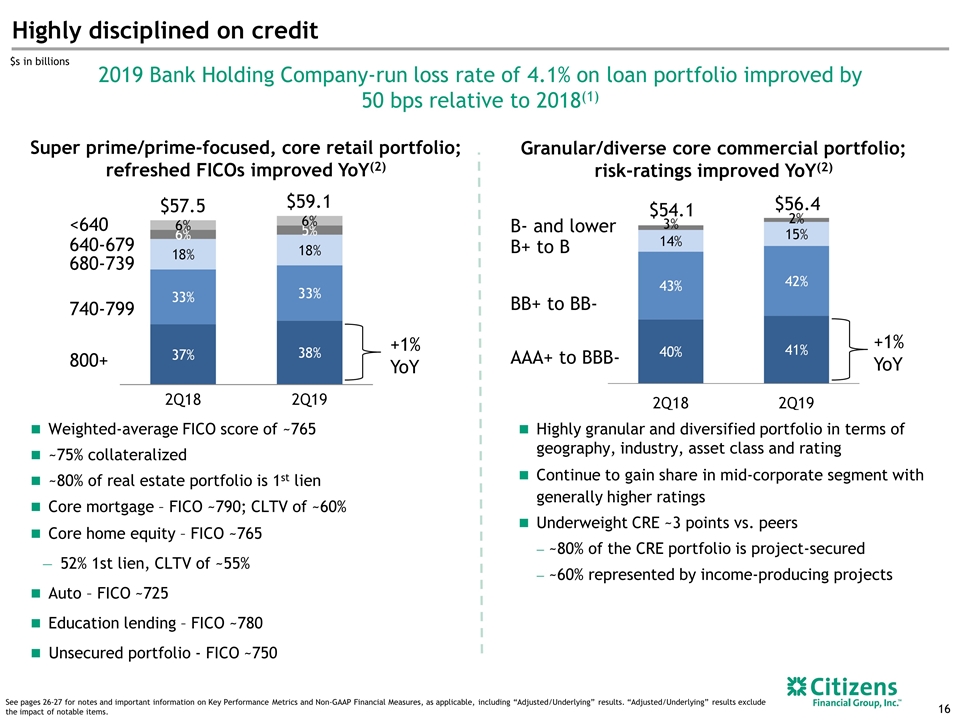
Highly disciplined on credit Weighted-average FICO score of ~765 ~75% collateralized ~80% of real estate portfolio is 1st lien Core mortgage – FICO ~790; CLTV of ~60% Core home equity – FICO ~765 52% 1st lien, CLTV of ~55% Auto – FICO ~725 Education lending – FICO ~780 Unsecured portfolio - FICO ~750 Highly granular and diversified portfolio in terms of geography, industry, asset class and rating Continue to gain share in mid-corporate segment with generally higher ratings Underweight CRE ~3 points vs. peers ~80% of the CRE portfolio is project-secured ~60% represented by income-producing projects See pages 26-27 for notes and important information on Key Performance Metrics and Non-GAAP Financial Measures, as applicable, including “Adjusted/Underlying” results. “Adjusted/Underlying” results exclude the impact of notable items. 800+ 740-799 680-739 640-679 <640 $59.1 $57.5 $54.1 $56.4 B- and lower B+ to B BB+ to BB- AAA+ to BBB- +1% YoY +1% YoY Granular/diverse core commercial portfolio; risk-ratings improved YoY(2) Super prime/prime-focused, core retail portfolio; refreshed FICOs improved YoY(2) 2019 Bank Holding Company-run loss rate of 4.1% on loan portfolio improved by 50 bps relative to 2018(1) $s in billions
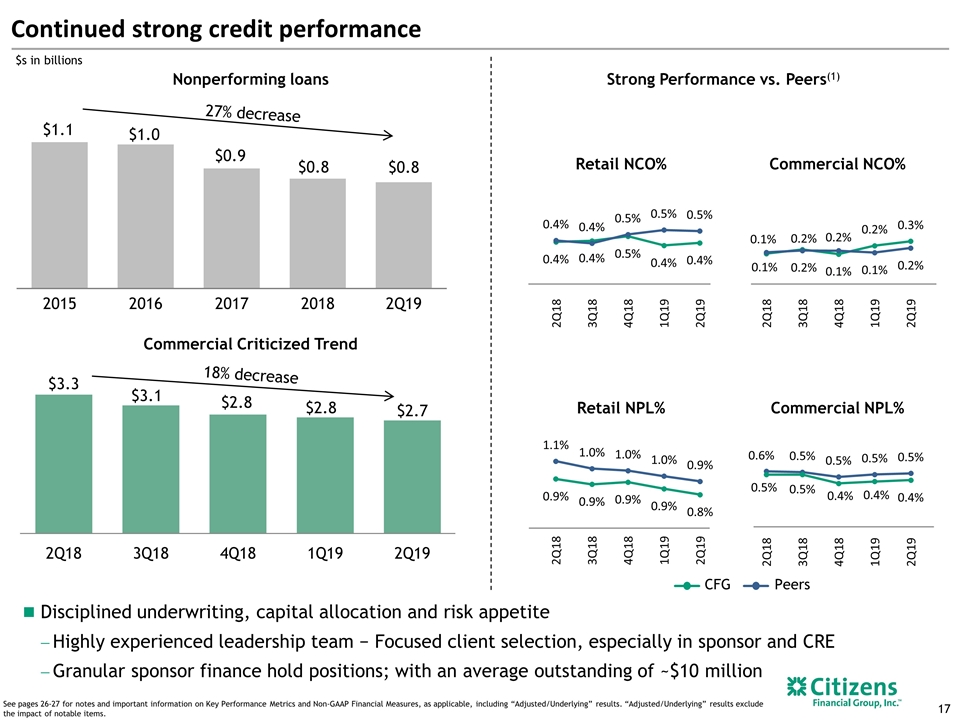
Disciplined underwriting, capital allocation and risk appetite Highly experienced leadership team − Focused client selection, especially in sponsor and CRE Granular sponsor finance hold positions; with an average outstanding of ~$10 million See pages 26-27 for notes and important information on Key Performance Metrics and Non-GAAP Financial Measures, as applicable, including “Adjusted/Underlying” results. “Adjusted/Underlying” results exclude the impact of notable items. Continued strong credit performance Retail NCO% Retail NPL% Commercial NPL% Commercial NCO% Strong Performance vs. Peers(1) Nonperforming loans 27% decrease Commercial Criticized Trend CFG Peers 18% decrease $s in billions
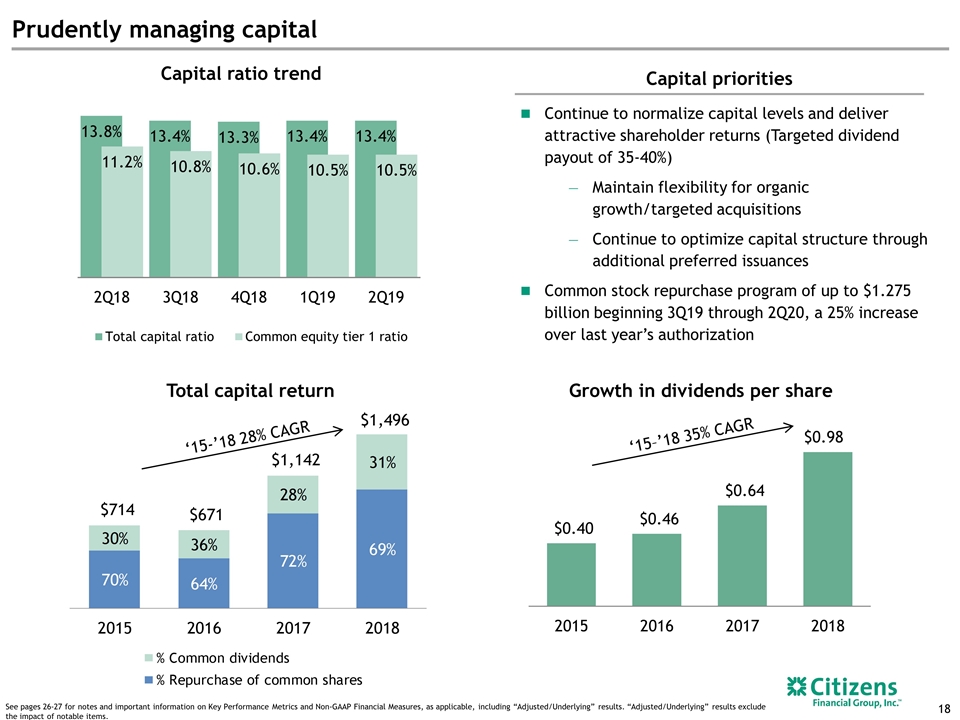
Total capital return Prudently managing capital Continue to normalize capital levels and deliver attractive shareholder returns (Targeted dividend payout of 35-40%) Maintain flexibility for organic growth/targeted acquisitions Continue to optimize capital structure through additional preferred issuances Common stock repurchase program of up to $1.275 billion beginning 3Q19 through 2Q20, a 25% increase over last year’s authorization Capital priorities Capital ratio trend Growth in dividends per share See pages 26-27 for notes and important information on Key Performance Metrics and Non-GAAP Financial Measures, as applicable, including “Adjusted/Underlying” results. “Adjusted/Underlying” results exclude the impact of notable items. ‘15-’18 28% CAGR ‘15–’18 35% CAGR
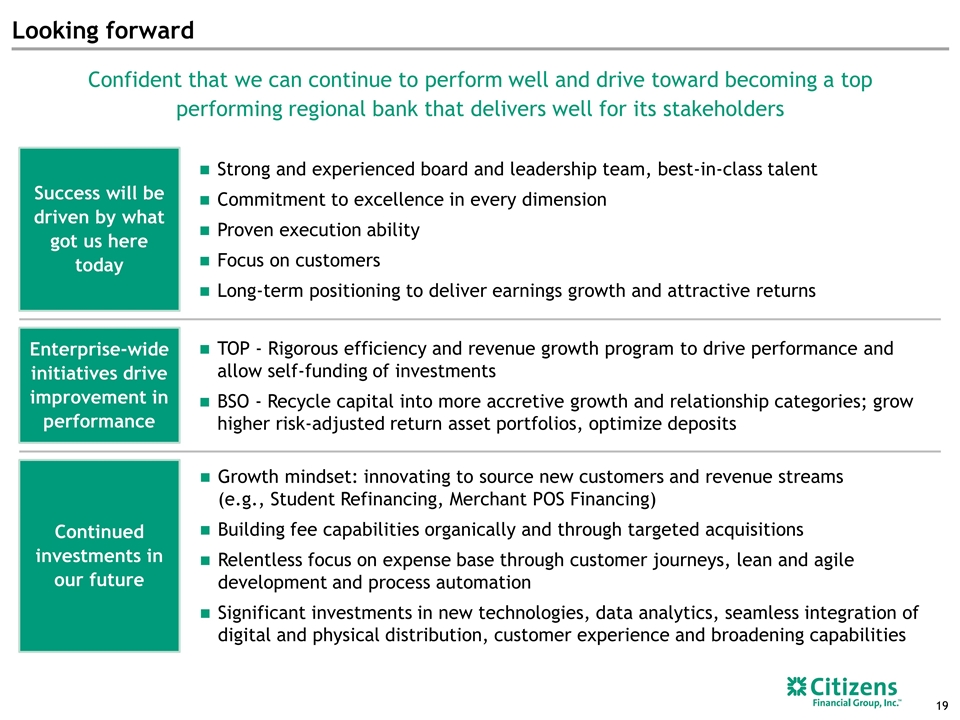
Looking forward Success will be driven by what got us here today Continued investments in our future Strong and experienced board and leadership team, best-in-class talent Commitment to excellence in every dimension Proven execution ability Focus on customers Long-term positioning to deliver earnings growth and attractive returns Confident that we can continue to perform well and drive toward becoming a top performing regional bank that delivers well for its stakeholders Enterprise-wide initiatives drive improvement in performance TOP - Rigorous efficiency and revenue growth program to drive performance and allow self-funding of investments BSO - Recycle capital into more accretive growth and relationship categories; grow higher risk-adjusted return asset portfolios, optimize deposits Growth mindset: innovating to source new customers and revenue streams (e.g., Student Refinancing, Merchant POS Financing) Building fee capabilities organically and through targeted acquisitions Relentless focus on expense base through customer journeys, lean and agile development and process automation Significant investments in new technologies, data analytics, seamless integration of digital and physical distribution, customer experience and broadening capabilities
Appendix / Key performance metrics, Non-GAAP financial measures and reconciliations
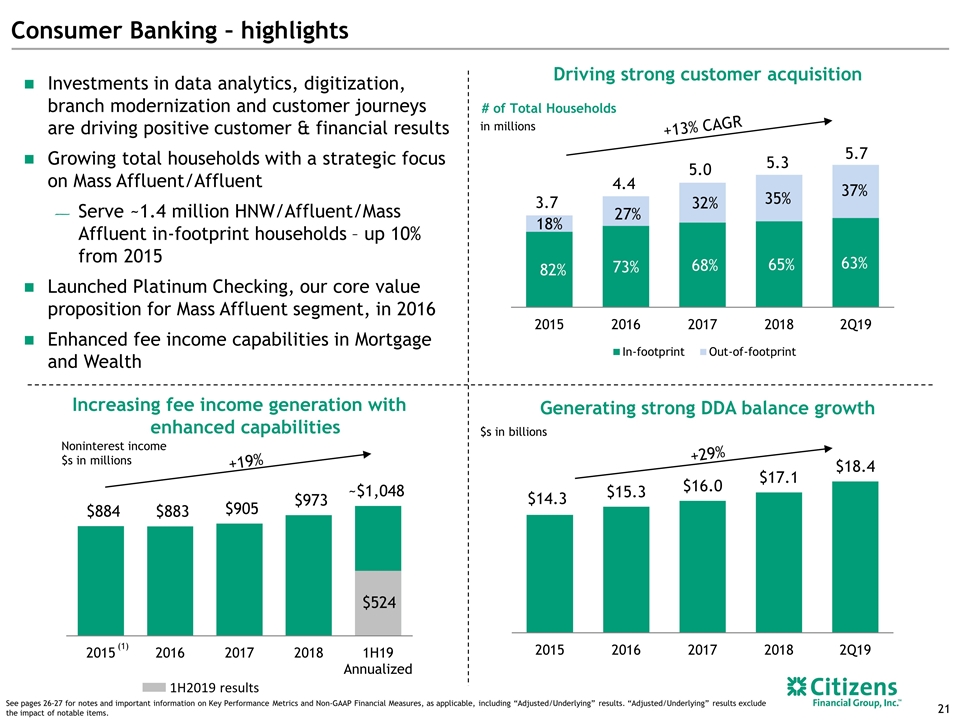
+19% Consumer Banking – highlights Investments in data analytics, digitization, branch modernization and customer journeys are driving positive customer & financial results Growing total households with a strategic focus on Mass Affluent/Affluent Serve ~1.4 million HNW/Affluent/Mass Affluent in-footprint households – up 10% from 2015 Launched Platinum Checking, our core value proposition for Mass Affluent segment, in 2016 Enhanced fee income capabilities in Mortgage and Wealth Increasing fee income generation with enhanced capabilities # of Total Households +13% CAGR Noninterest income $s in millions See pages 26-27 for notes and important information on Key Performance Metrics and Non-GAAP Financial Measures, as applicable, including “Adjusted/Underlying” results. “Adjusted/Underlying” results exclude the impact of notable items. in millions Driving strong customer acquisition Generating strong DDA balance growth $s in billions 3.7 4.4 5.3 (1) +29% 1H2019 results 5.0 5.7
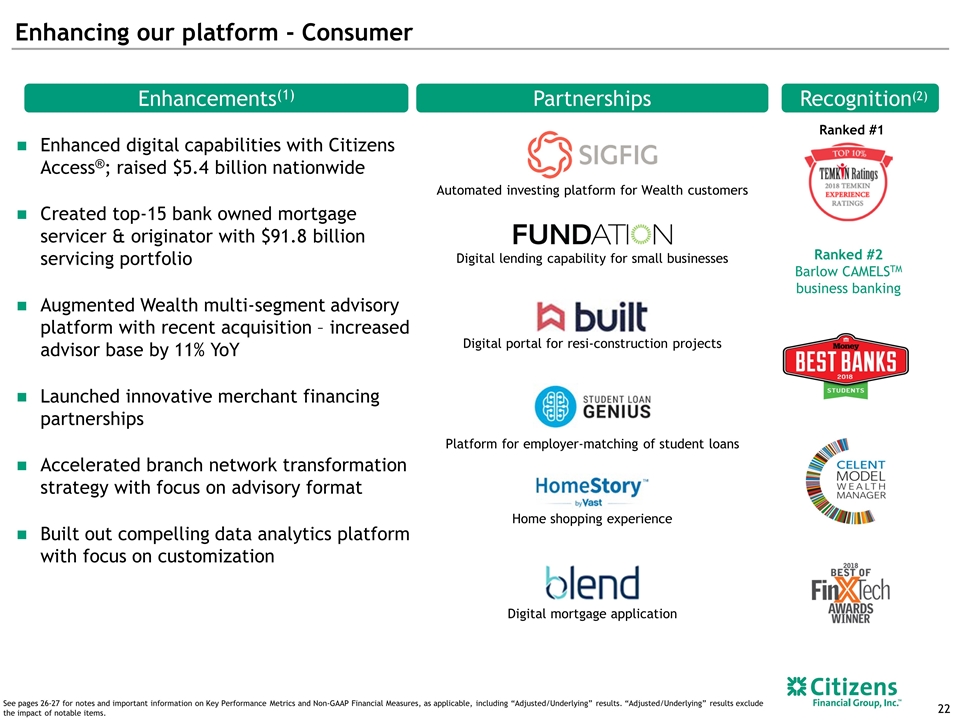
Enhancing our platform - Consumer Recognition(2) Enhancements(1) Partnerships Ranked #1 Enhanced digital capabilities with Citizens Access®; raised $5.4 billion nationwide Created top-15 bank owned mortgage servicer & originator with $91.8 billion servicing portfolio Augmented Wealth multi-segment advisory platform with recent acquisition – increased advisor base by 11% YoY Launched innovative merchant financing partnerships Accelerated branch network transformation strategy with focus on advisory format Built out compelling data analytics platform with focus on customization Ranked #2 Barlow CAMELSTM business banking Automated investing platform for Wealth customers Digital lending capability for small businesses Digital portal for resi-construction projects Platform for employer-matching of student loans Home shopping experience Digital mortgage application See pages 26-27 for notes and important information on Key Performance Metrics and Non-GAAP Financial Measures, as applicable, including “Adjusted/Underlying” results. “Adjusted/Underlying” results exclude the impact of notable items.
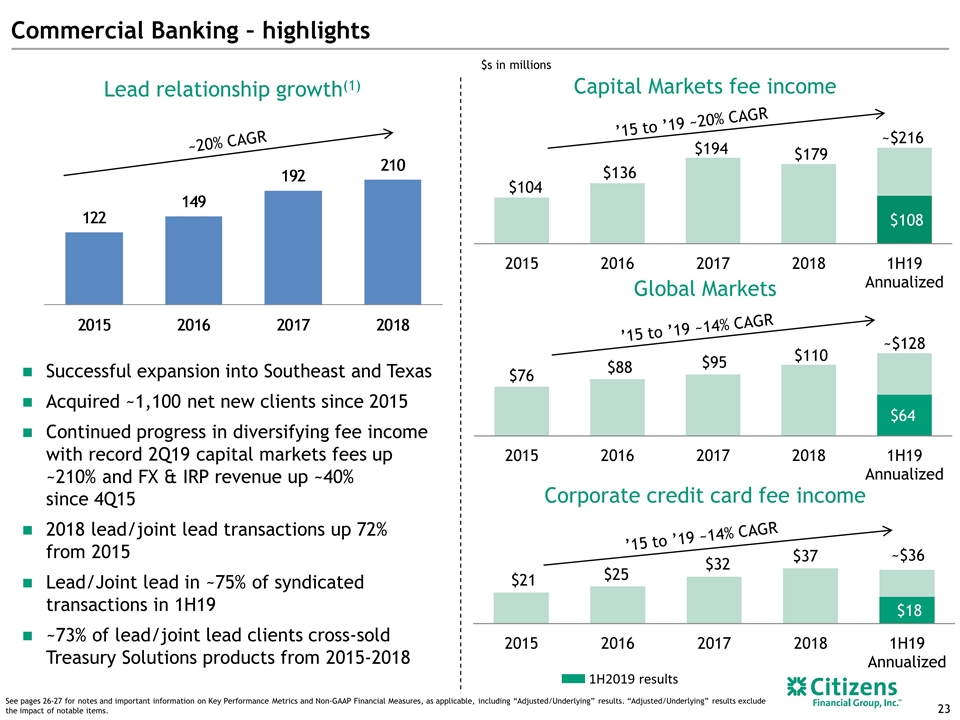
’15 to ’19 ~14% CAGR Commercial Banking – highlights Lead relationship growth(1) Successful expansion into Southeast and Texas Acquired ~1,100 net new clients since 2015 Continued progress in diversifying fee income with record 2Q19 capital markets fees up ~210% and FX & IRP revenue up ~40% since 4Q15 2018 lead/joint lead transactions up 72% from 2015 Lead/Joint lead in ~75% of syndicated transactions in 1H19 ~73% of lead/joint lead clients cross-sold Treasury Solutions products from 2015-2018 See pages 26-27 for notes and important information on Key Performance Metrics and Non-GAAP Financial Measures, as applicable, including “Adjusted/Underlying” results. “Adjusted/Underlying” results exclude the impact of notable items. Global Markets $s in millions Corporate credit card fee income ’15 to ’19 ~20% CAGR Capital Markets fee income ~20% CAGR 1H2019 results ’15 to ’19 ~14% CAGR
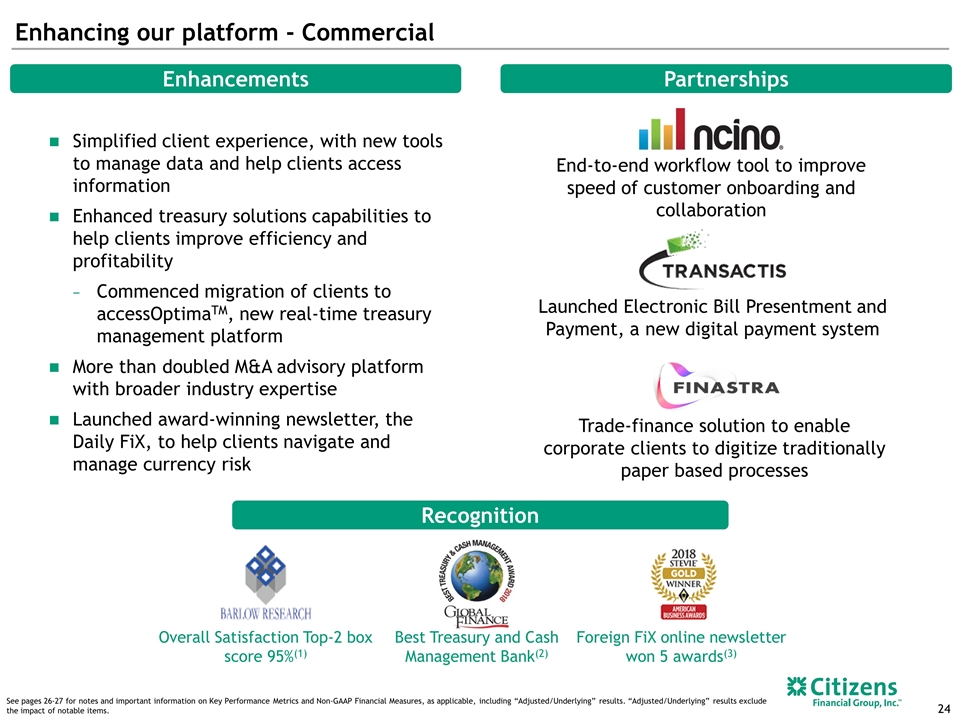
Enhancing our platform - Commercial Recognition Enhancements Partnerships Simplified client experience, with new tools to manage data and help clients access information Enhanced treasury solutions capabilities to help clients improve efficiency and profitability Commenced migration of clients to accessOptimaTM, new real-time treasury management platform More than doubled M&A advisory platform with broader industry expertise Launched award-winning newsletter, the Daily FiX, to help clients navigate and manage currency risk End-to-end workflow tool to improve speed of customer onboarding and collaboration Trade-finance solution to enable corporate clients to digitize traditionally paper based processes Launched Electronic Bill Presentment and Payment, a new digital payment system See pages 26-27 for notes and important information on Key Performance Metrics and Non-GAAP Financial Measures, as applicable, including “Adjusted/Underlying” results. “Adjusted/Underlying” results exclude the impact of notable items. Best Treasury and Cash Management Bank(2) Overall Satisfaction Top-2 box score 95%(1) Foreign FiX online newsletter won 5 awards(3)
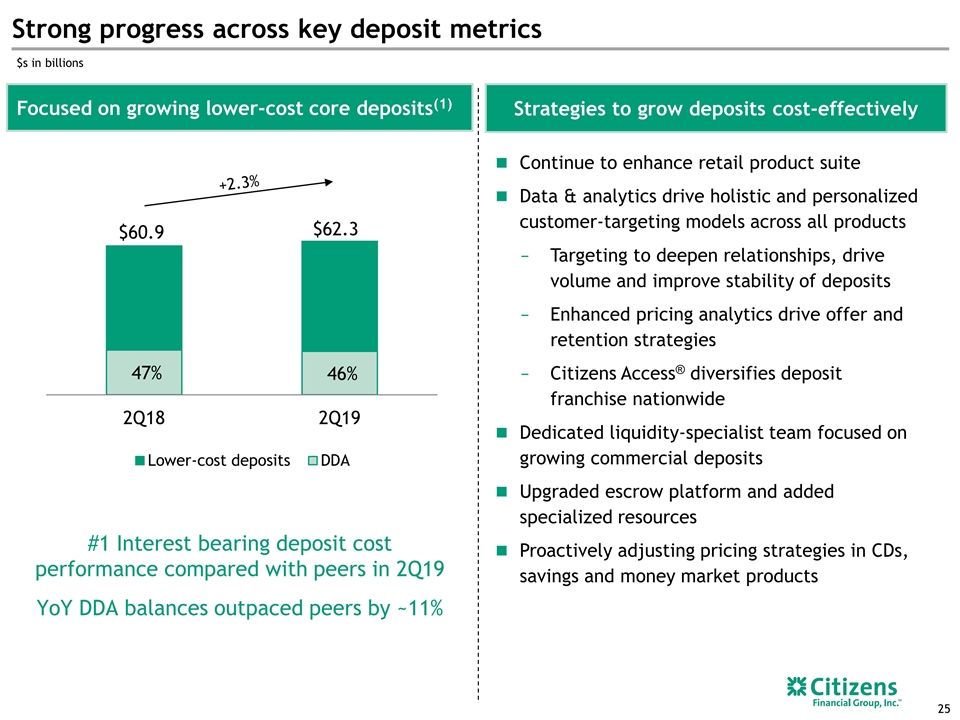
Strong progress across key deposit metrics Strategies to grow deposits cost-effectively Focused on growing lower-cost core deposits(1) #1 Interest bearing deposit cost performance compared with peers in 2Q19 YoY DDA balances outpaced peers by ~11% Continue to enhance retail product suite Data & analytics drive holistic and personalized customer-targeting models across all products Targeting to deepen relationships, drive volume and improve stability of deposits Enhanced pricing analytics drive offer and retention strategies Citizens Access® diversifies deposit franchise nationwide Dedicated liquidity-specialist team focused on growing commercial deposits Upgraded escrow platform and added specialized resources Proactively adjusting pricing strategies in CDs, savings and money market products $s in billions +2.3%
Notes Notes on Key Performance Metrics and Non-GAAP Financial Measures See important information on Key Performance Metrics and Non-GAAP Financial Measures, as applicable, at the beginning and end of this presentation for an explanation of our use of these metrics and non-GAAP financial measures and their reconciliations to GAAP financial measures. “Underlying” or “Adjusted” results exclude the impact of notable items. Where there is a reference to Underlying results in a paragraph or table, all measures that follow these references are on the same basis, when applicable. References to “Underlying results before the impact of Acquisitions” exclude the impact acquisitions that occurred after second quarter 2018 and notable items, as applicable. 2Q19 and 1Q19 after-tax notable items include the $5 million and $4 million, respectively, after-tax impact of notable items primarily tied to the integration of FAMC. 4Q18 after-tax notable items include the $29 million impact of a further benefit resulting from December 2017 Tax Legislation, partially offset by other notable items primarily associated with our TOP 5 efficiency initiatives, as well as the $12 million after-tax impact of other notable items associated with the FAMC integration. 3Q18 reported results reflect the $7 million after-tax impact of notable items associated with the FAMC integration. General Notes References to net interest margin are on a fully taxable equivalent ("FTE") basis. In 1Q19, Citizens changed its quarterly presentation of net interest income and net interest margin (NIM). Consistent with our understanding of general peer practice, the Company simplified the calculation of its reported NIM to equal net interest income, annualized based on the actual number of days in the period, divided by average total interest earning assets for the period. Under the Company’s prior methodology, NIM was calculated using the difference between the annualized yield on average total interest-earning assets and total interest-bearing liabilities for the period. The Company also began presenting both net interest income and NIM on an FTE basis. Prior periods have been revised consistent with the current presentation. Beginning in the first quarter of 2019, borrowed funds balances and the associated interest expense are based on original maturity. Prior periods have been adjusted to conform with the current period presentation. References to “Underlying results before the impact of Acquisitions” exclude the impact of acquisitions occurring after 2Q18 and notable items, as applicable. References to loan growth are on an average basis unless otherwise noted. Throughout this presentation, references to consolidated and/or commercial loans and loan growth include leases. Loans held for sale are also referred to as LHFS. Select totals may not sum due to rounding. Any mention of EPS refers to diluted EPS. Notes on slide 3 – Strong franchise with leading position in attractive markets Period-end balances as of June 30, 2019, loan balances exclude loans held for sale. Ranking based on 1Q19 data, unless otherwise noted; excludes non-retail depository institutions, includes U.S. subsidiaries of foreign banks. Source: FDIC, June 2018. Excludes “non-retail banks” as defined by SNL Financial. The scope of “non-retail banks” is subject to the discretion of SNL Financial, but typically includes: industrial bank and non-depository trust charters, institutions with more than 20% brokered deposits (of total deposits), institutions with more than 20% credit card loans (of total loans), institutions deemed not to broadly participate in the banking services market and other non-retail competitor banks. Source: FDIC June 2018 and SNL Financial. Top MSAs determined by retail branch count. Branches with ≥$500 million in deposits excluded. Excludes “non-retail banks” as defined by SNL Financial. The scope of “non-retail banks” is subject to the discretion of SNL Financial, but typically includes: industrial bank and non-depository trust charters, institutions with more than 20% brokered deposits (of total deposits), institutions with more than 20% credit card loans (of total loans), institutions. According to Equifax; origination volume as of 2Q19. Thomson Reuters LPC, Loan syndication league table ranking for the prior twelve months as of 2Q19 based on volume for Overall U.S. Middle Market (defined as Borrower Revenues < $500 million and Deal Size < $500 million). Notes on slide 4 – Diversified and balanced business model Period-end balances as of June 30, 2019. Includes select originations outside the traditional branch banking footprint. Consumer/Commercial deposit and loan mix percentages exclude non-core loans and leases of $2.0 billion and deposits of $6.9 billion in Other. Notes on slide 5 – Committed to excellence in every dimension American Banker/Reputation Institute Survey of Bank Reputations 2019 2018 Temkin Experience Rating, U.S. March 2018. Barlow Associates Annual Voice of Client Survey for all Corporate Banking, 2018 (Top-2 box score). The Organizational Health Index is a McKinsey™ survey. Notes on slide 6,7 – Closing the gap to peers and building a high performing bank See above note on key performance metrics and non-GAAP financial measures. U.S. superregional peer group of 10 banks per CFG proxy statement. Peer average represents 2014 to 2019 CAGR, or percentage change for efficiency ratio and ROTCE. Incorporates FY2019 consensus estimates per Bloomberg as of September 5, 2019, or annualized 1H2019 results where consensus unavailable. Represent period-end balances. FY2019 Consensus estimates; source Bloomberg as September 5, 2019. Notes on slide 8 – Strong execution has led to outperformance vs peers See above note on key performance metrics and non-GAAP financial measures. Notes on slide 9 – We delivered a strong 2Q19 and maintain a positive 2019 outlook See above note on key performance metrics and non-GAAP financial measures. Notes on slide 14 – Launching a significant TOP 6 Program Estimated annual non-rate benefit at the completion of the program. Cost of Top program implementation expected to be ~$50-$75 million over 2020/21 Potential strategic revenue initiatives’ net P&L investment of ~$50 million over 2020/21 will be funded by TOP run-rate benefits; expected to be meaningfully accretive over medium-term (2022-2025) Notes on slide 15 – Building fee capabilities organically and through targeted acquisitions Source: Company filings. Data for FY2018. Peers with relevant information available include BBT, CMA, FITB, KEY, MTB, PNC, RF, STI and USB. PNC adjusted to exclude BlackRock equity earnings. Source: Company filings and SNL Financial (capital markets fees defined as trading revenue, investment banking, advisory and underwriting fees). Data for FY2018. Peers include BBT, FITB, KEY, PNC, RF, STI and USB. Source: Novantas and public filings for estimate of 2017 market share. Treasury Solutions peers with relevant information available include FITB, KEY, PNC, STI and USB. Treasury Solutions revenue includes deposit spread, net Treasury Management fees, Commercial Card, Merchant Processing and Trade Finance.
Notes Notes on Key Performance Metrics and Non-GAAP Financial Measures See important information on Key Performance Metrics and Non-GAAP Financial Measures, as applicable, at the beginning and end of this presentation for an explanation of our use of these metrics and non-GAAP financial measures and their reconciliations to GAAP financial measures. “Underlying” or “Adjusted” results exclude the impact of notable items. Where there is a reference to Underlying results in a paragraph or table, all measures that follow these references are on the same basis, when applicable. References to “Underlying results before the impact of Acquisitions” exclude the impact acquisitions that occurred after second quarter 2018 and notable items, as applicable. 2Q19 and 1Q19 after-tax notable items include the $5 million and $4 million, respectively, after-tax impact of notable items primarily tied to the integration of FAMC. 4Q18 after-tax notable items include the $29 million impact of a further benefit resulting from December 2017 Tax Legislation, partially offset by other notable items primarily associated with our TOP 5 efficiency initiatives, as well as the $12 million after-tax impact of other notable items associated with the FAMC integration. 3Q18 reported results reflect the $7 million after-tax impact of notable items associated with the FAMC integration. General Notes References to net interest margin are on a fully taxable equivalent ("FTE") basis. In 1Q19, Citizens changed its quarterly presentation of net interest income and net interest margin (NIM). Consistent with our understanding of general peer practice, the Company simplified the calculation of its reported NIM to equal net interest income, annualized based on the actual number of days in the period, divided by average total interest earning assets for the period. Under the Company’s prior methodology, NIM was calculated using the difference between the annualized yield on average total interest-earning assets and total interest-bearing liabilities for the period. The Company also began presenting both net interest income and NIM on an FTE basis. Prior periods have been revised consistent with the current presentation. Beginning in the first quarter of 2019, borrowed funds balances and the associated interest expense are based on original maturity. Prior periods have been adjusted to conform with the current period presentation. References to “Underlying results before the impact of Acquisitions” exclude the impact of acquisitions occurring after 2Q18 and notable items, as applicable. References to loan growth are on an average basis unless otherwise noted. Throughout this presentation, references to consolidated and/or commercial loans and loan growth include leases. Loans held for sale are also referred to as LHFS. Select totals may not sum due to rounding. Any mention of EPS refers to diluted EPS. Notes on slide 16 – Highly disciplined on credit CFG’s 2019 Bank Holding Company-run credit loss rate of 4.1% on its loan portfolio improved by 50 basis points relative to 2018. These internal results, which utilized the 2019 Dodd Frank Stress Test Severely Adverse Scenario published by the Federal Reserve, reflect continued strong risk discipline, improvement in the underlying credit quality of the loan portfolio and the impact of a more favorable scenario. Source: Company data. Portfolio balances and credit quality data as of June 30, 2019, as applicable. Refreshed FICO score, LTV ratio, loan term, lien position, risk rating, property type, industry sector and geographic stratifications reflects most recently available data. Risk ratings represent bond-equivalent ratings of borrowers based on CFG’s internal probability of default risk ratings. Notes on slide 17 – Continued strong credit performance Source: SNL Financial. Product view - regulatory reporting basis. Peer banks include CMA, BBT, FITB, KEY, MTB, PNC, RF, STI and USB. NPL% equals nonaccrual loans plus 90+ days past due and still‐accruing loans (excluding FDIC “covered” loans and loans guaranteed by the U.S. government) as a % of total. Notes on slide 21 – Consumer Banking - highlights For consistency, 2015 GAAP results for non-interest income in Consumer Banking are adjusted for the $26 million impact of a change in accounting for card rewards that occurred in 1Q16. Notes on slide 22 – Enhancing our platform – Consumer Enhancement data as of 2Q19 Recognition is as follows: 2018 Temkin Experience Rating, U.S. March 2019 Barlow CAMELSTM Score represents Small Business Banking with >$100,000 & < $10 million in annual revenue with a composite CAMELSTM score of 57; (1Q2016-4Q2017). The Barlow Research CAMELSTM score looks at total banking experience as measured in six performance components: channel satisfaction, attitude toward their bank, management of relationships, error avoidance, loyalty product cross-sell ratios and selling performance. Money magazine’s Best Bank for College Students in the Northeast. Celent Model Wealth Manager Platform Award for SpeciFi®. Award for Citizen Bank’s Digital Business Loan Collaboration with Fundation. Notes on slide 23 – Commercial Banking – highlights Lead left and Joint Lead Arranger Transactions. Notes on slide 24 – Enhancing our platform – Commercial Barlow Research 2018 Voice of the Customer Survey (Top 2 Box score). Citizens Bank awarded Best Treasury and Cash Management provider for the Northeast, Mid-Atlantic and Midwest regions. IAC is the Internet Advertising Competition. The Gold award from the Financial Communications Society is for B2B Digital Media: App & Tools category. Notes on slide 25 – Strong progress across key deposit metrics 1. Lower-cost deposits includes average checking with interest and traditional savings balances. Citizens Access deposits are excluded. DDA includes mortgage escrow.
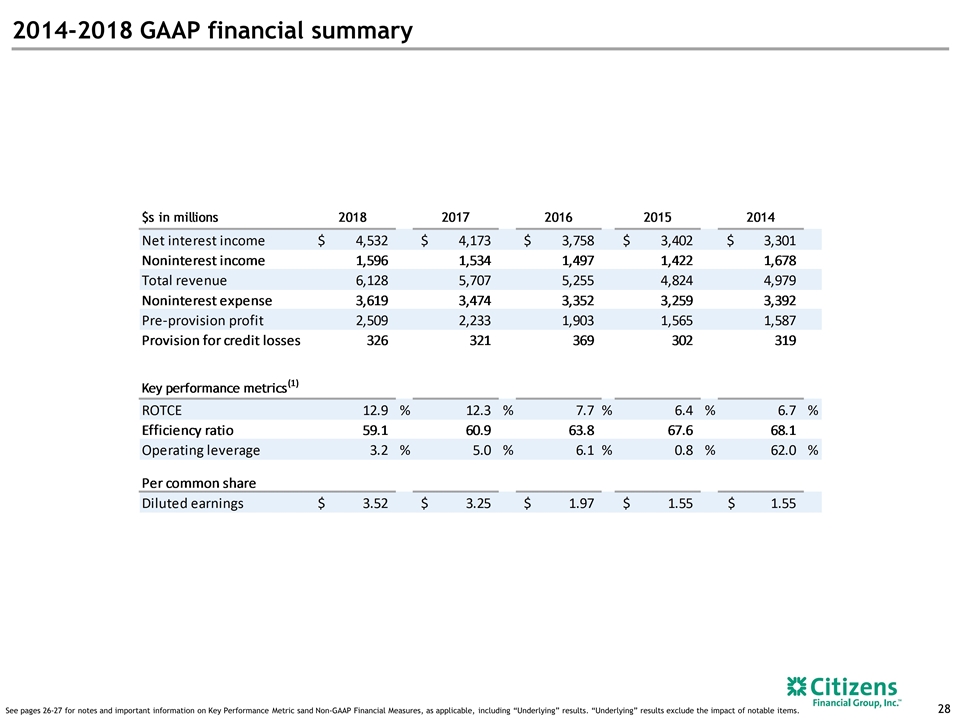
2014-2018 GAAP financial summary See pages 26-27 for notes and important information on Key Performance Metric sand Non-GAAP Financial Measures, as applicable, including “Underlying” results. “Underlying” results exclude the impact of notable items.
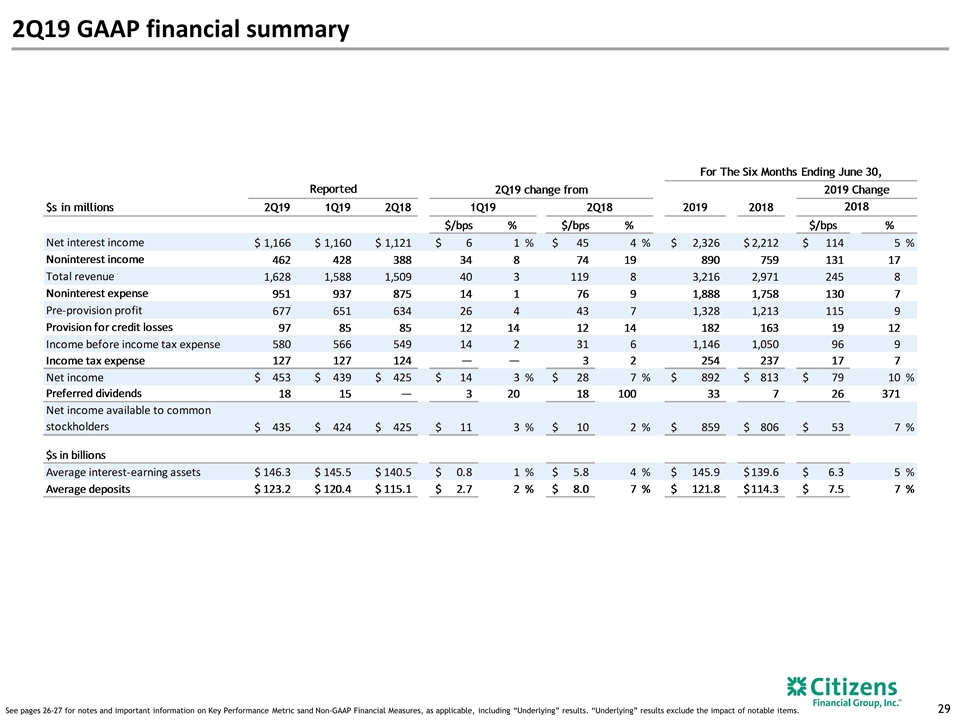
2Q19 GAAP financial summary See pages 26-27 for notes and important information on Key Performance Metric sand Non-GAAP Financial Measures, as applicable, including “Underlying” results. “Underlying” results exclude the impact of notable items.
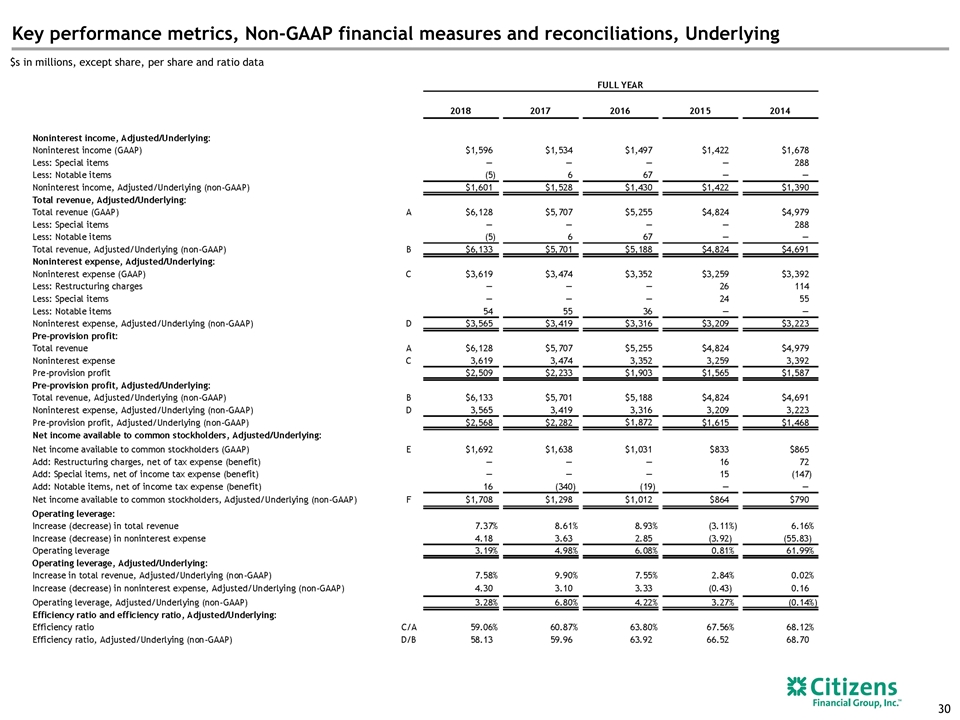
Key performance metrics, Non-GAAP financial measures and reconciliations, Underlying $s in millions, except share, per share and ratio data
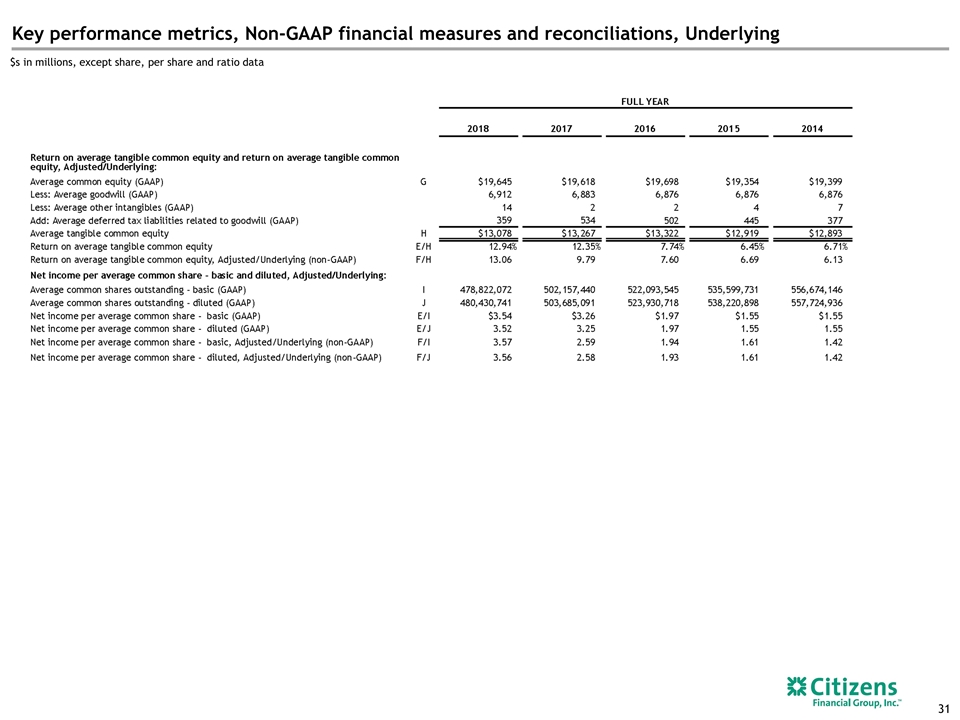
Key performance metrics, Non-GAAP financial measures and reconciliations, Underlying $s in millions, except share, per share and ratio data
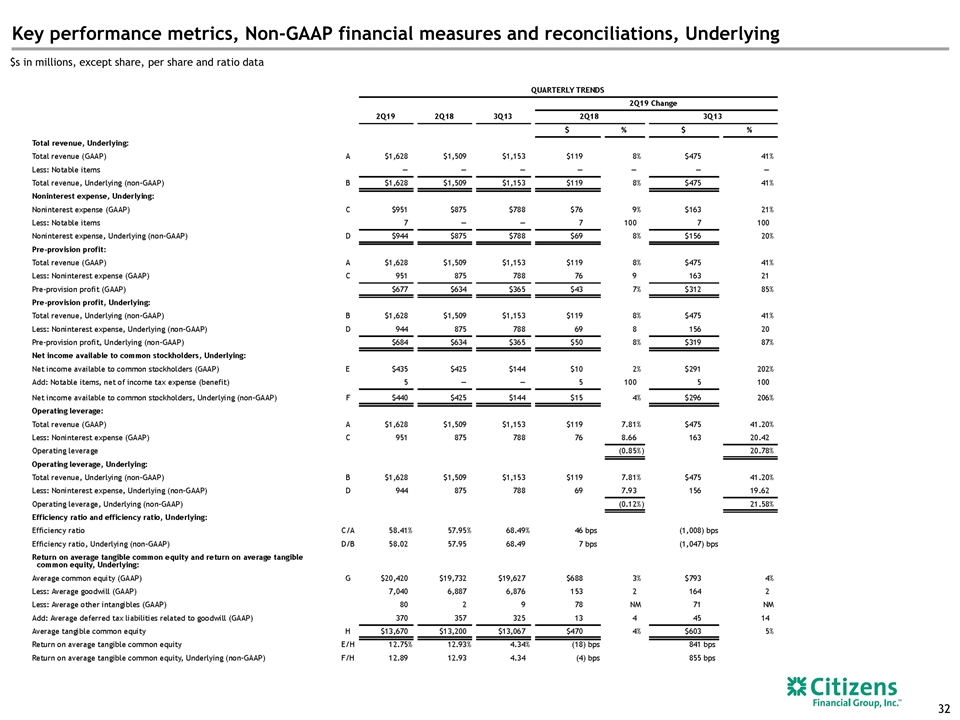
Key performance metrics, Non-GAAP financial measures and reconciliations, Underlying $s in millions, except share, per share and ratio data
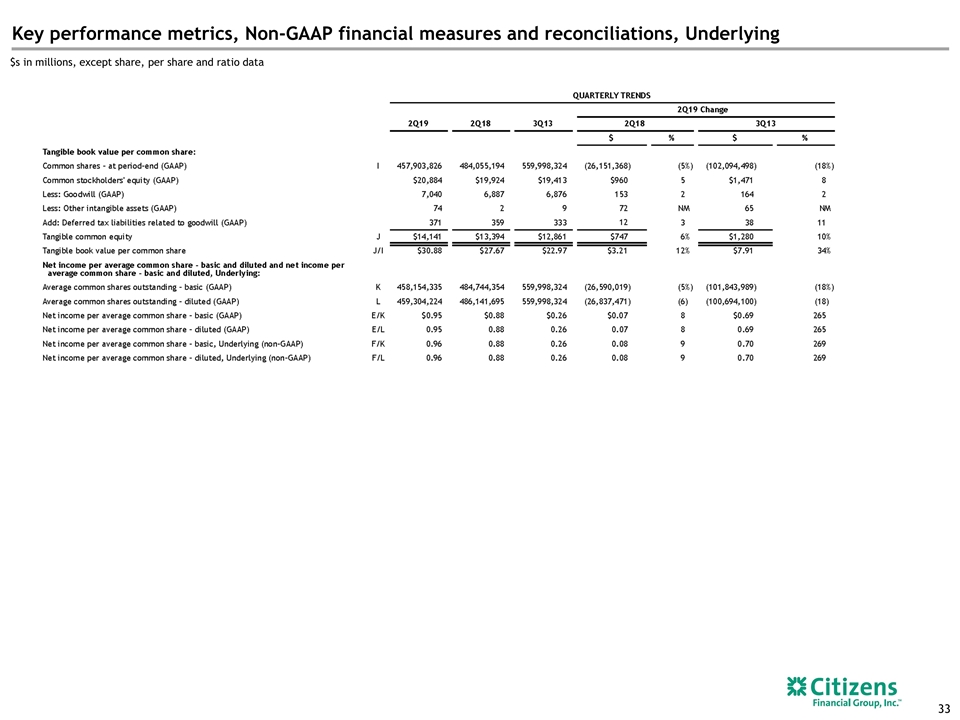
Key performance metrics, Non-GAAP financial measures and reconciliations, Underlying $s in millions, except share, per share and ratio data
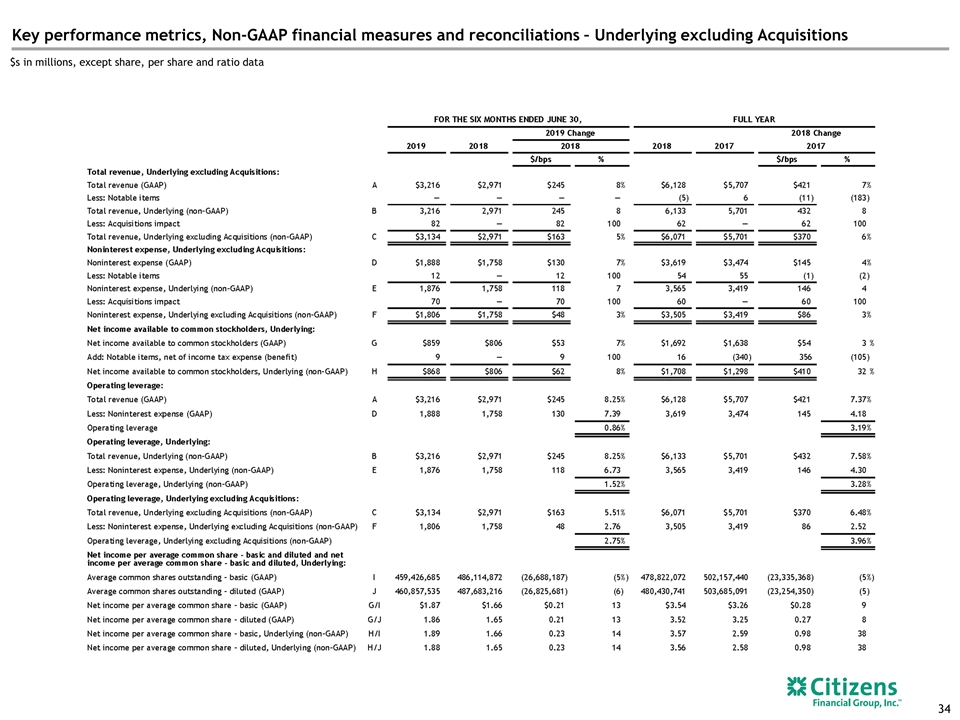
Key performance metrics, Non-GAAP financial measures and reconciliations – Underlying excluding Acquisitions $s in millions, except share, per share and ratio data
