Exhibit D

Republic of Panama
This description of the Republic of Panama is dated as of September 30, 2005 and appears as Exhibit D to the Republic of Panama’s Annual Report on Form 18-K to the U.S. Securities and Exchange Commission for the fiscal year ended December 31, 2004.
TABLE OF CONTENTS
| | |
| | | Page
|
Recent Developments | | D-2 |
The Republic of Panama | | D-6 |
The Panamanian Economy | | D-9 |
Structure of the Panamanian Economy | | D-25 |
The Panama Canal | | D-36 |
The Colón Free Zone | | D-41 |
Employment and Labor | | D-42 |
Public Finance | | D-47 |
Financial System | | D-53 |
Foreign Trade and Balance of Payments | | D-60 |
Public Sector Debt | | D-67 |
Tables and Supplementary Information | | D-73 |
The fiscal year of the Government of the Republic of Panama (the “Government”) ends on December 31. The twelve-month period ended December 31, 2004 is referred to in this description of the Republic of Panama as “2004” and other years are referred to in a similar manner unless otherwise indicated. All references to “$” or “dollars” are to United States Dollars.
Totals in certain tables in this description of the Republic of Panama may differ from the sum of the respective individual items in such tables due to rounding.
INDEX OF TABLES
| | |
| | | Page
|
Table No. 1 – Selected Panamanian Economic Indicators | | D-5 |
Table No. 2 – Inflation | | D-20 |
Table No. 3 – Gross Domestic Product | | D-21 |
Table No. 4 – Sectoral Origin of Gross Domestic Product (in millions of dollars) | | D-22 |
Table No. 5 – Percentage Change from Prior Year for Sectoral Origin of Gross Domestic Product | | D-23 |
Table No. 6 – Sectoral Origin of Gross Domestic Product (as percentage of GDP) | | D-24 |
Table No. 7 – Selected State-Owned Enterprises 2004 Financial Statistics | | D-27 |
Table No. 8 – Selected Completed Privatizations and Concessions | | D-33 |
Table No. 9 – Panama Canal Principal Statistics | | D-36 |
Table No. 10 – Labor Force and Employment | | D-43 |
Table No. 11 – Average Real Monthly Wages | | D-45 |
Table No. 12 – Budgeted Expenditures of the Central Government by Function | | D-48 |
Table No. 13 – Central Government Operations | | D-50 |
Table No. 14 – Consolidated Non-Financial Public Sector Operations | | D-51 |
Table No. 15 – International Reserves | | D-52 |
Table No. 16 – Largest Banking Institutions | | D-54 |
Table No. 17 – The Banking Sector | | D-55 |
Table No. 18 – Banco Nacional de Panama Balance Sheet | | D-58 |
Table No. 19 – Composition of Merchandise Exports, F.O.B. | | D-62 |
Table No. 20 – Composition of Merchandise Imports, C.I.F. | | D-63 |
Table No. 21 – Direction of Merchandise Trade | | D-64 |
Table No. 22 – Balance of Payments | | D-66 |
Table No. 23 – Public Sector Internal Debt | | D-68 |
Table No. 24 – Public Sector External Debt | | D-69 |
Table No. 25 – Public Sector External Debt Amortization | | D-70 |
Table No. 26 – External Direct Debt of the Republic, Central Government | | D-73 |
Table No. 27 – External Debt Guaranteed by the Republic, Decentralized Institutions | | D-74 |
Table No. 28 – Internal Securities Debt of the Republic Outstanding on December 31, 2004 | | D-75 |
D-1
RECENT DEVELOPMENTS
Government
On September 3, 2005, President Martin Torrijos (“Torrijos”) announced changes to his Cabinet by appointing new ministers of Education and Social Development. In addition, Torrijos named persons to assume high level positions in several areas of the Government, including the Ministry of Economy and Finance, the Ministry of Agricultural Development, the Ministry of Labor, the National Police and the Department of Immigration.
The Economy
Panama’s economy grew in virtually all sectors in the first quarter of 2005. Panama’s gross domestic product (“GDP”) registered a real increase of 6.5% in the first quarter of 2005 compared to the same period of 2004. Inflation, as measured by the end-of-period CPI, was 3.0% for the twelve-months ending March 31, 2005, due to higher prices for petroleum and certain agricultural products as a result of a decline in production caused by severe weather during the first quarter of 2005.
In the first quarter of 2005, the primary sector grew an estimated 10.7% compared to the same period of 2004, with the agriculture sector growing an estimated 10.6% compared to the same period of 2004 due to an increase in the export and price of coffee and sugar and continued growth in melon, watermelon and pineapple exports. The fisheries sector grew by an estimated 14.6% in the first quarter of 2005 compared to the same period of 2004 primarily due to increases in the export and price of shrimp. The transportation and telecommunications sector grew by an estimated 11.0% in the first quarter of 2005 compared to the same period of 2004 due to increased cellular phone and internet usage. Port activities grew 20.2% in the first quarter of 2005 compared to the same period of 2004 due to the increased movement of containers. Mining activities grew 1.6% in the first quarter of 2005 compared to the same period of 2004 due to high demand for mining products from construction activity. The construction industry grew 2.2% in the first quarter of 2005 compared to the same period of 2004 due to a number of large projects still under construction.
Activities of the Colón Free Trade Zone (or the “CFZ”) increased an estimated 14.7% in the first quarter of 2005 compared to the same period of 2004. This increase is primarily attributable to the continued economic recovery of South America and increased trade with China. The commerce, hotels and restaurants sector grew an estimated 10.3% in the first quarter of 2005 compared to the same period of 2004 due to a rise in the number of tourists visiting Panama. Panama Canal activities grew an estimated 4.8% in the first quarter of 2005 compared to the same period of 2004 due to increases in cargo volume and the provision of maritime services. The financial intermediation sector grew an estimated 4.3% in the first quarter of 2005 compared to the same period of 2004 due to rising interest rates and a growth in insurance activity. The public utilities sector grew by an estimated 1.0% in the first quarter of 2005 compared to the same period of 2004. This increase is in part attributable to improvements in the system used to register and invoice water consumption. The manufacturing sector declined 1.0% in the first quarter of 2005 compared to the same period of 2004.
The Torrijos administration has substantially decreased the amount of accounts payable that existed when President Torrijos took office. The total value of accounts payable inherited by the current administration was approximately $503.1 million, including registered and non-registered debts. By December 31, 2004, the Government had reduced the inherited accounts payable to suppliers to $148.7 million and as of March 14, 2005, additional payments of $113.9 million had reduced such accounts payable to $34.8 million.
In February 2005, the National Assembly passed Law No. 6, introducing certain fiscal reforms aimed at increasing tax revenues and reducing the public sector deficit. The fiscal reforms seek to increase tax revenues through the creation of an alternative minimum income tax of 1.4%, a tax on professional services, and a selective consumption tax on certain products, services and activities, such as jewelry, weapons, cable television, cellular phones and casino and gaming activities. Certain tax provisions have
D-2
been eliminated by the fiscal reforms, including taxes on sugar production, insurance and private pension plans. As a result of the fiscal reforms, the Government will discontinue the use of open-ended tax incentives and will create tax incentives that are limited to a specific amount and time period. In addition, the fiscal reforms provide for a gradual reduction of current Government expenditures for wages and salaries through a reduction in the size of the Government work force. Under Law No. 6, public institutions will submit to the Cabinet for approval specific plans to reduce by January 1, 2008 the number of public employees to a number no greater than the number of public employees as of December 31, 1999.
The National Assembly approved Panama’s 2005 budget on November 21, 2004. The 2005 budget contemplates total expenditures of $6.192 billion, with budget estimates based on an anticipated 5.0% growth in nominal GDP and an anticipated consolidated non-financial public sector deficit of approximately $524.8 million (or approximately 3.6% of nominal GDP) for 2005. As of June 30, 2005, Panama’s non-financial public sector balance for 2005 registered a deficit of approximately $164.5 million (or 1.1% of nominal GDP).
As of August 31, 2005, Panama’s external debt was equal to $7.464 billion, up from $7.219 billion as of December 31, 2004. Panama’s total public sector debt as of August 31, 2005 was $10.067 billion, up from $9.977 billion as of December 31, 2004. As of August 31, 2005, outstanding Brady Bonds totaled $359.1 million, consisting of approximately $221.2 million aggregate principal amount of PDIs, approximately $115.0 million aggregate principal amount of IRBs, approximately $9.7 million aggregate principal amount of Par Bonds, and approximately $13.2 million aggregate principal amount of Discount Bonds.
On August 11, 2005, Panama issued $250 million aggregate principal amount of its 8.125% Global Bonds due 2034, which was consolidated to form a single series with the $250 million principal amount of such bonds that had been previously issued in January 2004.
On September 14, 2005, the Cabinet adopted Cabinet Decree No. 25, which authorizes Panama to file a $2 billion shelf registration statement with the U.S. Securities and Exchange Commission. The securities to be registered may be used to raise funds for general government financing and for liability management transactions.
In an effort to promote the development of Panama’s capital markets, the Government has continued with a program of Treasury Note issuances in the local market. On July 12, 2005, Panama retired $250 million of its 7.25% Treasury Notes due 2005, the first notes issued as part of the program initiated in July 2002. In five monthly auctions from January 11, 2005 to May 3, 2005, the Government issued $91.8 million of 5.25% Treasury Notes due 2009. In four monthly auctions from June 9, 2005 to September 6, 2005, the Government issued $196.3 million of 5.75% Treasury Notes due 2010. As of August 31, 2005, outstanding Treasury Notes amounted to $721.3 million. The proceeds of issuances in 2005 have been used to finance the Government’s general budgetary needs.
In February 2005, the Torrijos administration issued Cabinet Decree No. 1, authorizing a $70 million syndicated loan to Aeropuerto Internacional de Tocumen, S. A. BNP Paribas will act as lead bank for the loan, which is guaranteed by the Government and will be used to finance the modernization and expansion of Tocumen International Airport. The modernization and expansion of Tocumen International Airport is scheduled for completion in 2006. Also in February 2005, the Torrijos administration issued Cabinet Decree No. 2, authorizing the signing of a $19.9 million loan agreement with the Inter-American Development Bank (“IADB”), which is intended to promote sustainable development within communities in the Panama Canal watershed.
In June 2005, the National Assembly approved Law No. 17, reforming Panama’s social security system by raising the minimum retirement age for men from 62 to 65, and for women from 57 to 60. Additionally, Law No. 17 gradually increases employer contributions from 10.75% to 13.25% and employee contributions from 7.25% to 9% through 2010. As a result of the reforms, by 2015 employees will be required to make contributions into the social security system for 25 years (up from the current 15 year requirement) before becoming eligible to receive benefits. In June 2005, opponents of Law No. 17 organized nationwide protests. Teachers, construction and public health workers participated in several weeks of strikes and called for the repeal of Law No. 17. In response, on July 5, 2005, the Government postponed the effective date of Law No. 17 for 90 days to accommodate a national discussion to address the concerns of the unions and to assess proposed amendments to the law submitted by the private sector. On September 22, 2005, the Torrijos administration extended the national discussion for an additional month.
D-3
In September 2005, the Torrijos administration repealed a decision by the Moscoso administration to cancel annual payments by the Panama Ports Company to the Government in exchange for significant investments to expand and modernize the ports. As a result, the Panama Ports Company will pay the Government $102 million in back fees and proceed with its $1 billion ports expansion program.
In 2005, the Financial Analysis Unit, an independent investigative unit reporting to the President that monitors certain financial transactions exceeding $10,000, has signed memoranda of understanding with regulatory bodies in 10 other countries to combat money laundering.
International Trade
In May 2005, after a six-year interruption, Panama resumed negotiations to conclude a free trade agreement with Chile. The eighth round of free trade negotiations with the United States concluded in February 2005.
In February 2005, Panama signed a second modification to the bilateral protocol with Colombia that includes a negotiated list of 219 products for Panama and 111 products for Colombia for inclusion under the protocol, effective March 17, 2005. In April 2005, Panama concluded free trade negotiations with Singapore, which negotiations began in February 2004. Upon effectiveness, Panama will receive immediate zero-tariff access for all products exported to Singapore. Panama negotiated varying terms (0-10 years) for reduction in tariffs on agricultural and industrial imports from Singapore and excluded from the agreement more than 200 agricultural products, including rice, pork, dairy products and chicken. The agreement, which was negotiated in English, will be submitted to the National Assembly for approval once it has been translated into Spanish.
IMF Relationship
Panama’s most recent standby agreement with the International Monetary Fund (“IMF”) expired in March 2002, and no new standby facility has been arranged. The IMF concluded its most recent Article IV review of Panama in March 2005. In this review, the IMF Executive Board noted Panama’s recent strong economic growth, which helped to lower unemployment and keep inflation low. The IMF also noted the importance of strengthening the competitiveness of the export-oriented service sector for Panama’s medium-term outlook and welcomed Panama’s commitment for further integration into the regional and global economy.
The Panama Canal
On May 1, 2005, furthering changes to the toll structure that began in 2002, Panama implemented a revised measurement and pricing system applicable to full container vessels and other vessel types with on-deck container carrying capacity. The Panama Canal Authority has adopted the Twenty Foot Equivalent Unit (“TEU”) as the new measurement unit for full container vessels, thereby replacing the Panama Canal Universal Measurement System (PC/UMS). As of May 1, 2005, fully dedicated container vessels are being charged based on the total number of TEUs the vessel can carry fully loaded, taking into account the visibility restriction imposed by the Panama Canal Authority that limits the height of on-deck containers. For other vessel types with on-deck container carrying capacity, the former PC/UMS system will be used to measure spaces below-deck and the TEU toll will be applied to the actual number of containers on-deck. Under the new system, vessels in ballast (not carrying containers or any other cargo above or below deck) are charged less than laden vessels. The new measurement and pricing system is being phased-in over three years from May 2005. Under the new system, tolls increased nearly one-third from May 1, 2005 and will increase approximately 65% by the end of the phase-in period. Revenues generated by the new toll system will help fund the Canal’s modernization program.
In July 2005, the National Assembly approved the Panama Canal Authority’s budget for fiscal year 2006, allocating $198.7 million to the Canal’s investment program.
On September 2, 2005, the feeder roads to the second bridge over the Panama Canal were completed at a cost of $87.2 million.
D-4
TABLE NO. 1
Selected Panamanian Economic Indicators(1)
The following table sets forth Panama’s principal economic indicators for the years 2000 through 2004:
| | | | | | | | | | | | | | | | | | | | |
| | | 2000(R)
| | | 2001(R)
| | | 2002(R)
| | | 2003(E)
| | | 2004(E)
| |
Economic Data: | | | | | | | | | | | | | | | | | | | | |
GDP(2) | | $ | 11,621 | | | $ | 11,808 | | | $ | 12,272 | | | $ | 12,862 | (P) | | $ | 13,734 | |
GDP (constant dollars)(3) | | $ | 11,371 | | | $ | 11,436 | | | $ | 11,691 | | | $ | 12,196 | (P) | | $ | 12,957 | |
GDP (% change, constant dollars)(3) | | | 2.7 | % | | | 0.6 | % | | | 2.2 | % | | | 4.3 | %(P) | | | 6.2 | % |
Service Sector (% change, constant dollars)(3)(4) | | | 6.3 | % | | | 1.8 | % | | | 1.0 | % | | | 3.7 | % | | | 7.0 | % |
Other (% change, constant dollars)(3)(5) | | | (0.6 | )% | | | (5.5 | )% | | | (0.6 | )% | | | 7.4 | % | | | 6.7 | % |
Population (millions) | | | 2.85 | | | | 2.90 | | | | 3.06 | | | | 3.12 | | | | 3.17 | |
CPI (% change)(6) | | | 0.7 | % | | | 0.0 | % | | | 1.8 | % | | | 1.7 | % | | | 1.5 | % |
Unemployment | | | ... | | | | 11.2 | % | | | 10.9 | % | | | 10.9 | % | | | 9.2 | % |
Public Finance: | | | | | | | | | | | | | | | | | | | | |
Total Consolidated Non-Financial Public Sector Revenues | | $ | 2,860 | | | $ | 2,809 | | | $ | 2,792 | | | $ | 2,869 | | | $ | 2,995 | |
Total Consolidated Non-Financial Public Sector Expenditures (7) | | $ | 2,587 | | | $ | 2,689 | | | $ | 2,763 | | | $ | 3,020 | | | $ | 3,194 | |
Overall Surplus (Deficit) | | $ | (94 | ) | | $ | (289 | ) | | $ | (415 | ) | | $ | (623 | ) | | $ | (691 | ) |
As % of Current GDP(2) | | | (0.8 | )% | | | (2.4 | )% | | | (3.4 | )% | | | (4.8 | )% | | | (5.0 | )% |
Central Government Surplus (Deficit) | | $ | (152 | ) | | $ | (342 | ) | | | (345 | ) | | $ | (489 | ) | | $ | (768 | ) |
As % of Current GDP(2) | | | (1.3 | )% | | | (2.9 | )% | | | (2.8 | )% | | | (3.8 | )% | | | (5.6 | )% |
Public Debt (at December 31): | | | | | | | | | | | | | | | | | | | | |
Internal Debt | | $ | 2,128 | | | $ | 2,138 | | | $ | 2,172 | | | $ | 2,158 | | | $ | 2,758 | |
External Debt | | $ | 5,604 | | | $ | 6,263 | | | $ | 6,349 | | | $ | 6,504 | | | $ | 7,219 | |
Total Public Debt | | $ | 7,732 | | | $ | 8,401 | | | $ | 8,521 | | | $ | 8,662 | | | $ | 9,977 | |
Public Debt (as % of Current GDP)(2) | | | | | | | | | | | | | | | | | | | | |
Internal Debt | | | 18.3 | % | | | 18.1 | % | | | 17.7 | % | | | 16.8 | % | | | 20.1 | % |
External Debt | | | 48.2 | % | | | 53.0 | % | | | 51.7 | % | | | 50.6 | % | | | 52.6 | % |
Trade Data: | | | | | | | | | | | | | | | | | | | | |
Exports (f.o.b.) Goods(8) | | $ | 5,839 | | | $ | 5,992 | | | $ | 5,315 | | | $ | 5,049 | | | $ | 5,886 | |
Imports (c.i.f.) Goods(8) | | $ | (6,981 | ) | | $ | (6,689 | ) | | $ | (6,350 | ) | | $ | (6,162 | ) | | $ | (7,471 | ) |
Merchandise Trade Balance | | $ | (1,143 | ) | | $ | (696 | ) | | $ | (1,035 | ) | | $ | (1,113 | ) | | $ | (1,585 | ) |
Current Account Surplus (Deficit) | | $ | (716 | ) | | $ | (174 | ) | | $ | (96 | ) | | $ | (437 | ) | | $ | (1,104 | ) |
Overall Balance of Payments Surplus (Deficit)(9) | | $ | (328 | ) | | $ | 644 | | | $ | 146 | | | $ | (153 | ) | | $ | (395 | ) |
Total Official Reserves (at December 31)(10) | | $ | 707 | | | $ | 1,075 | | | $ | 1,166 | | | $ | 992 | | | $ | 611 | |
| (1) | All monetary amounts in millions of U.S. dollars at current prices, unless otherwise noted. |
| (2) | Nominal GDP figures reflect a revised base year of 1996. |
| (3) | Constant GDP figures are based on 1996 constant dollars. See “The Panamanian Economy—Economic Performance—2000 Through 2004.” |
| (4) | Including real estate, public administration, commerce, hotels and restaurants, financial services, the CFZ, Panama Canal, transportation and communications and public utilities. |
| (5) | Including manufacturing, agriculture and construction. |
| (6) | End of period. The CPI figure for 2004 has been calculated using a newly adopted methodology and a revised base year of 2002. Figures prior to 2004 have been calculated using an earlier methodology with a base year of 1987. |
| (7) | Excluding interest on external debt. |
| (9) | Figures were calculated pursuant to the V Version of the Balance of Payments Manual prepared by the IMF. |
| (10) | See “Public Finance—International Reserves” for components. |
Sources: Directorate of Analysis and Economic Policies, Office of the Comptroller General, Banco Nacional de Panama (“BNP”) and Ministry of Economy and Finance.
D-5
THE REPUBLIC OF PANAMA
Area and Population
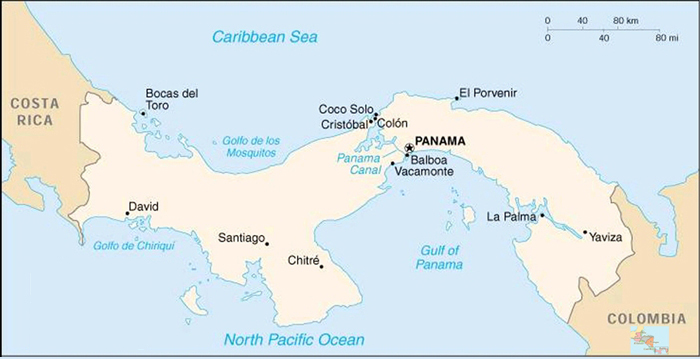
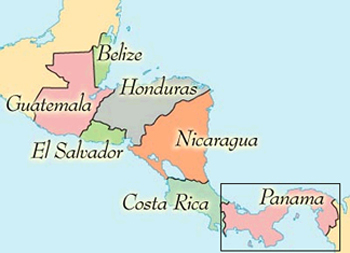
Panama is a republic located on the narrowest point of the Central American isthmus, which connects the continents of North America and South America. It has a coastline of approximately 1,868 miles on the Caribbean Sea and Pacific Ocean, and is bordered on the east by Colombia and on the west by Costa Rica. Panama has a national territory of approximately 29,157 square miles situated within its coastline and 345 miles of land borders, and includes numerous coastal islands. The Panama Canal, one of the most important commercial waterways in the world, which connects the Atlantic and Pacific Oceans, bisects the country running northwest to southeast. Panama’s climate is primarily tropical.
As of December 31, 2004, Panama had an estimated population of 3.17 million and a population density of 108.7 people per square mile. During the period from 2000 to 2004, the population grew by an average of 2.5% per annum. Approximately 63.0% of Panama’s population lives in cities and towns with more than 1,500 inhabitants, and 10% of the population is indigenous, some of whom are seeking greater autonomy from the Government. Of the Panamanian population, 32.0% is under 15 years of age, 61.9% is between the ages of 15 and 64, and 6.0% is over the age of 65. Average life expectancy in Panama is 75.1 years. The infant mortality rate is estimated at 19.4 per 1,000 births. Panama’s official language is Spanish.
Panama’s per capita GDP for 2004, expressed in 1996 constant prices, was approximately $4,084. Education indicators show that Panama’s adult literacy rate is approximately 92.3%. During the period 2000-2004, the Government spent an average of 4.6% of GDP and 25.1% of Central Government expenditures on education. Estimates show that 40.5% of the population is considered to be living in poverty (which is defined as annual expenditure per capita below $905) while 26.5% is considered to be living in extreme poverty (annual expenditure per capita below $519).
Panama City, Panama’s capital and its largest city, is the political, financial, commercial, communications and cultural center of Panama. Panama City’s population is estimated to comprise 14.7% of Panama’s total population. Other principal cities are San Miguelito, a suburb of Panama City (estimated to comprise 10.3% of the total population), and Colón, located at the northern terminus of the Panama Canal (estimated to comprise 1.5% of the total population).
Historical Information
Panama gained its independence from Spain in 1821 and subsequently joined the Confederation of Greater Colombia, from which Panama declared its independence on November 3, 1903. Several weeks after independence, Panama signed the Hay/Bunau-Varilla Treaty with the United States (“U.S.”), which, among other things, granted the U.S. the right to occupy a ten-mile wide zone and a concession for the construction, maintenance, operation and protection of the Panama Canal (the “Canal Zone”). See “The Panama Canal—General.”
Panama adopted its first constitution in 1904, and, between 1904 and 1968, Panama generally experienced social and political stability and economic growth under a constitutional democracy. During the period immediately following World War II, the Panamanian military interfered with the civilian government, although this interference largely ended by the mid-1950s. Constitutional government continued until October 1968, when the National Guard successfully mounted a military coup and replaced the civilian government. Although the military made nominal efforts during the late 1970s to return to civilian government, the military generally remained in control of the Government until 1989.
Issues related to control of the Panama Canal and the Canal Zone caused considerable unrest in Panama. In 1977, following 13 years of negotiations, Panama signed treaties with the U.S. that provided for abolishing the Canal Zone in 1979 and the eventual turnover of the Panama Canal to Panama in 1999. See “The Panama Canal—The Canal Treaty of 1977.”
D-6
In 1983, General Manuel Antonio Noriega (“Noriega”) became Commander of the National Guard and assumed effective control of the Government. In the spring of 1987, a political crisis galvanized Noriega opponents and resulted in the formation of a major civilian protest and opposition movement widely supported by civilian organizations, political parties and the business community. This political crisis evoked an economic crisis as well.
In response to the ensuing political crisis, in March 1988, the U.S. suspended its Agency for International Development (“AID”) programs to Panama and blocked preferential sugar quotas, causing further economic disruption. The U.S. imposed additional economic sanctions that year, including a freeze on all U.S. payments for the Panama Canal (at that time, approximately $6 million per month), an order prohibiting American citizens and companies from making payments to the Government and a freeze on all Government accounts (and certain additional assets) in the U.S.
In December 1989, relations between Panama and the U.S. deteriorated, culminating in a U.S. military intervention that resulted in the removal of Noriega. Guillermo Endara (“Endara”), who had been elected by a significant majority of the popular vote earlier in the year, was subsequently sworn in as President.
Since the end of 1989, Panama has enjoyed political and economic stability under democratically elected governments. Relations with the U.S. have been fully restored. Endara finished his presidential term, and in the spring of 1994, orderly national elections were held. Ernesto Pérez Balladares (“Pérez Balladares”), who was elected President with 33% of the vote in May 1994, finished his presidential term in August 1999. Mireya Moscoso, who was elected with 44.8% of the vote in May 1999, took office on September 1, 1999 and completed her presidential term on August 31, 2004. On May 2, 2004, Martin Torrijos was elected President with 47.4% of the vote. He took office on September 1, 2004.
The Panamanian military was disbanded in 1990, and, in 1994, by constitutional amendment, the military was abolished. Costa Rica, Panama’s western neighbor, also does not have a military. If Panama were attacked by a foreign force and the neutrality of the Panama Canal were jeopardized, the U.S. would have the right under treaties related to the Panama Canal to take measures to protect the neutrality of the Canal. The national police force of Panama also has certain defensive capabilities.
Form of Government and Political Parties
Panama is a republic with a representative form of government. In 1972, the original version of the current Constitution was adopted (the fourth in Panama’s history), setting forth the structure of the Government, individual and collective rights and duties, and the division of powers among the executive, legislative and judicial branches.
Executive power is vested in the President and the presidentially appointed Ministers, who constitute the Cabinet. The President, the First Vice-President and the Second Vice-President are each elected by direct, universal suffrage for a term of five years. The President and Vice-Presidents may not be reelected to the same office within ten years after the expiration of their term. In the event the President is unable to finish a term, the First Vice-President would succeed to the presidency. As a result of amendments to the Constitution in 2004, the executive branch will have one vice president beginning with national elections in 2009.
National legislative power is vested in the National Assembly (“Assembly”), Panama’s unicameral legislative body. The number of electoral circuits, each comprising between 20,000 and 40,000 persons, determines the number of legislators; as of December 31, 2004, the Assembly consisted of 78 members. As a result of amendments to the Constitution in 2004, beginning with national elections in 2009 the membership of the National Assembly will be limited to 71. The full Assembly is elected by universal suffrage every five years. Members of the Assembly are not subject to limits on the number of terms in office to which they may be elected. The Assembly has, among other powers, the power to enact legislation, ratify treaties, approve the budget and ratify the appointment of the Comptroller General, the Attorney General and justices of the Supreme Court of Justice (the “Supreme Court”). To be enacted,
D-7
legislation must be approved after three separate readings by a majority of all legislators or by a majority of legislators present at the session, depending on the substance of the legislation being enacted. The President may veto bills adopted by the Assembly, but the Assembly may override presidential vetoes by a vote of two-thirds of its members. Pursuant to the Constitution, the Assembly may empower the President and the Cabinet to adopt legislation when the Assembly is not in session. The Assembly has the power to amend the Constitution. Amendments to the Constitution may be adopted either by a majority vote of all legislators in two different Assemblies or by a majority vote of all legislators in two sessions of the same Assembly and a public referendum.
Martin Torrijos, leader of the Partido Revolucionario Democrático (“PRD”), was elected president for a five-year term with 47.4% of the vote, and took office on September 1, 2004. Torrijos’ coalition, consisting of the PRD and the Partido Popular (“PP”), won a majority of the 78 seats available in the National Assembly, with the PRD and the PP securing 38 and 3 seats, respectively. The Partido Arnulfista (“PA”) secured 17 seats and the Partido Solidaridad (“Solidarity Party”) secured 9 seats.
Historically, there have been few material ideological differences among the significant political parties in Panama. To some extent, the PRD has tended to enjoy more support in urban areas while the PA has had more rural support. However, the primary distinctions among political parties have tended to be associated with the personalities involved in their leadership. The next elections for President and the Assembly are scheduled for May 2009. Currently, there are constitutional provisions prohibiting the reelection of a president within ten years after the expiration of his or her term.
Judicial power is vested in the Supreme Court and various lower tribunals. The President appoints the nine justices of the Supreme Court for staggered ten-year terms, with two justices being selected every two years, subject to ratification by the Assembly. Lower court judges are appointed by the Supreme Court. The judicial branch prepares its own budget and sends it to the executive branch for inclusion in the general budget presented to the Assembly for approval. The Supreme Court is the final court of appeal and has the power to declare null and void laws, regulations or other acts of the executive or legislative branches that conflict with the Constitution.
Panama is administratively divided into nine provinces and three territories. In each province, executive power is exercised by a governor who is appointed by the President. There are no provincial legislative or judicial bodies. Provincial governments do not have their own independent budgets. Within each province are municipalities that are, in turn, divided into precincts. Each municipality has a municipal council and a mayor, who exercises executive power. Mayors and members of municipal councils are elected by direct, universal suffrage for five-year terms. Municipalities levy and collect municipal taxes and adopt their own budgets for financing local projects.
Foreign Affairs and International Organizations
Panama maintains diplomatic relations with 123 countries. Panama is a charter member of the United Nations (“U.N.”) and a member of various other international organizations, including the IMF and the Inter-American Development Bank (“IDB”). Panama is a founding member of the Organization of American States and is also a member of the International Bank for Reconstruction and Development (“World Bank”) and the World Bank affiliates, the International Finance Corporation (“IFC”) and the Multilateral Investment Guaranty Agency (“MIGA”), as well as a member of the San José Pact. On September 6, 1997, Panama acceded to membership in the World Trade Organization (“WTO”).
Panama consults with various international agencies, such as the IDB, the World Bank and the IMF, regarding its economic program, objectives, projections and policies. Panama has utilized the IDB, the World Bank and the IMF for significant external financing. See “Public Sector Debt—External Debt.”
D-8
THE PANAMANIAN ECONOMY
General
Panama’s unique geographic position, service economy (including the Panama Canal) and monetary regime anchored on the use of the U.S. dollar as legal tender are major factors in Panama’s economic performance.
Panama has used the U.S. dollar as its legal tender since shortly after gaining its independence. The national currency, the Balboa, is used primarily as a unit of account linked to the U.S. dollar at a ratio of one dollar per one Balboa. The Government does not print paper currency, although a limited amount of coinage is minted. Panama’s monetary system is based on its Constitution (beginning with the 1904 Constitution, which established the Balboa) and Panamanian laws expressly recognizing the U.S. dollar as legal tender. There are no Panamanian foreign exchange controls or reporting requirements, and capital moves freely in and out of the country, without local currency risk. Under Panama’s unique monetary system, foreign exchange reserves are not needed to support the currency.
The absence of a national printed currency and a Balboa exchange market causes the balance of payments to be less important than fiscal policy as an indicator of the Government’s external debt service capacity. Surpluses and deficits in the balance of payments have less effect than public sector fiscal surpluses and deficits on the accumulation and drawdown of Government reserves available for sovereign debt service. Moreover, this monetary system imposes an element of discipline on Panamanian authorities in the areas of monetary and fiscal policy. Panama is limited in its ability to conduct a stimulative monetary policy and can finance public sector deficits only through borrowing. From 2000 through 2004, the non-financial public sector’s deficits averaged 4.1% of GDP. From 2000 to 2003, Panama experienced an average annual rate of inflation, as measured by the end-of-period CPI, of 1.1%. In 2004, the rate of inflation, as measured by a revised end-of-period CPI with a base year of 2002, was estimated at 1.5%.
The Panamanian economy is dominated by a large service sector, which in recent years has represented an average of over three-quarters of GDP. The manufacturing and agricultural sectors represent far smaller percentages. Historically, the Panamanian economy has been characterized by an imbalance between the open, internationally oriented service sector and the fairly closed manufacturing and agricultural sectors, where productivity has been considerably lower and government polices in recent decades have impeded efficient resource allocation. See “Structure of the Panamanian Economy—Principal Sectors of the Economy.”
While much of the service sector economic activity is represented by activities associated with public administration, commerce and real estate, the significant, internationally oriented activities of this sector distinguish the Panamanian economy. The Panama Canal has played a significant role in the economy, accounting for an average of 4.8% of GDP since 2000. In 2004, commercial oceangoing traffic registered 14,035 transits, and the Canal’s toll revenue was $757.7 million. The withdrawal of the U.S. military and reversion of facilities in the former Canal Zone, culminating with the reversion of the Canal itself at the end of 1999, had substantial fiscal and macroeconomic impacts on Panama and its economy. These impacts have largely been absorbed by Panama in the years since the withdrawal. See “The Panama Canal—Reversion of the Canal Area to Panama.”
Another significant and distinctive factor in the Panamanian economy is the CFZ, a tax-favored export and import trading zone located near the Atlantic entrance to the Canal, which has accounted for approximately 7.1% of GDP since 2000. See “The Colón Free Zone.” As a result of the dollar-based economy, the international trade associated with the Panama Canal, the CFZ and certain legislative initiatives, Panama has also developed an important banking sector that has represented an average of 8.6% of GDP since 2000, although the share of the banking sector in GDP has been falling in recent years and reached 7.1% in 2004. There is no lender of last resort or deposit insurance in Panama. See “Financial System—The Banking Sector.”
D-9
Reforms and Development Programs
In September 1994, the Pérez Balladares administration announced its development plan, Desarrollo Social con Eficiencia Económica, or “Social Development with Economic Efficiency” (the “Development Program”). The Development Program acknowledged that Panama’s public sector had imposed inefficiencies and rigidities on the economy that had significantly curtailed investment, including an inflexible labor code, various barriers to free trade, including high import duties and non-tariff measures, price controls, discriminatory tax policies and high cost public utility monopolies. These conditions, in turn, had adversely affected the social conditions and development of Panama. The principal initial objectives of the Pérez Balladares administration and the Development Program were: Panama’s accession to the WTO and the associated trade liberalization measures which accession would require; maintenance of fiscal discipline and internal savings; normalization of external debt; privatization; revision of Panama’s inflexible labor code; elimination of price controls; establishment of antitrust authorities; expansion of educational programs; development of health and housing programs to ease Panama’s severe poverty and unemployment; and infrastructure improvements. The Pérez Balladares administration achieved many of its legislative objectives in a number of these areas.
In September 1999, the Moscoso administration announced its initial development plan, Nuestro Compromiso para el Cambio, or “Our Commitment for Change.” In December 1999, the Moscoso administration proposed, as a complementary plan to Nuestro Compromiso para el Cambio, the development plan Desarollo Económico, Social y Financiero con Inversión en Capital Humano, or “Economic, Social and Financial Development with Investment in Human Capital” (the “Economic Development Plan”). The Economic Development Plan focused on implementing policies designed to help reduce the level of debt, implement a social investment program and reduce the level of poverty. The Economic Development Plan originally contemplated the sale of the Government’s remaining interest in Cable & Wireless (Panama) S.A. (“C&W Panama”) and the use of the Development Trust Fund, the trust fund created by the Government in 1995 to hold and manage proceeds generated from certain privatizations, to retire certain external debt of the Republic and finance certain social development programs. On June 27, 2000, the Assembly approved Law No. 22, which approved the use of the Development Trust Fund principal for social development programs (“Law No. 22”). See “Structure of the Panamanian Economy—The Role of the Government in the Economy” and “Public Finance—Central Government Budget.”
In September 2004, the Torrijos administration announced its initial development plan, Alianza para la Patria Nueva, or “Alliance for a New Homeland.” The development plan contemplates wide-ranging reforms, including reforms to the Constitution, fiscal system, public sector and judiciary. Before assuming office, Torrijos also pledged to seek enhancements in consumer protection, to combat corruption and to promote sustainable economic and human development. In November 2004, the National Assembly ratified Legislative Act No. 1 of July 27, 2004, amending the Constitution. As a result of these amendments, beginning with national elections in 2009, the executive branch will have one vice president and membership of the National Assembly will be limited to 71. In addition, the Supreme Court will be permitted to conduct investigations of National Assembly members without specific authorization from the National Assembly.
Privatization. The Pérez Balladares administration pursued partial privatization of the sizable state sector of the economy. Generally, entities were slated for privatization based on whether they performed customary governmental functions and in order of the complexity that would be involved in the privatization process. More straightforward privatizations were undertaken first, while certain more complex transactions requiring special legislation and the restructuring of operations and organizations prior to completion were undertaken later. In May 1997, the Pérez Balladares administration completed the partial privatization of the landline telephone company, INTEL, S.A. (“INTEL”), through the sale of a 49% interest and management control to a subsidiary of Cable & Wireless. The Economic Development Plan originally included a proposal for the sale of the Government’s remaining 49% interest in the successor entity to INTEL, C&W Panama. However, after review, the Moscoso Administration decided to maintain Panama’s interest in C&W Panama. In February 1996, a $72.6 million concession was granted to a consortium that includes an affiliate of BellSouth International, Inc. (the “BellSouth Consortium”) for Panama’s first cellular telephone service.
D-10
In February 1995, the Assembly passed legislation allowing the electric utility, Instituto de Recursos Hidráulicos y de Electrificación (“IRHE”), to purchase energy from private suppliers. In February 1997, legislation was approved by the Assembly authorizing the restructuring and privatization of IRHE. In October 1998, 51% of the stock of the three IRHE distribution companies was sold for an aggregate of $302 million, and in January 1999, the stock of the four IRHE generation companies was also sold for a total of $302 million. In May 1998, privatization legislation with respect to water and sewage utilities was revised and approved by the Cabinet pursuant to the Assembly’s delegation of legislative powers to the executive branch for this purpose. Operation of certain major Government-owned ports has been turned over to the private sector through concessions, while new port facilities are being built and managed by private sector concessionaires.
In September 1999, the Moscoso administration announced that it would not privatize the national water and sewage utility, Instituto de Acueductos y Alcantarillados Nacionales (“IDAAN”). In September 2000, the Moscoso administration, acting through the Interoceanic Region Authority (“ARI”), entered into an agreement with the IFC to study investment opportunities for former U.S. military bases such as Forts Howard, Kobbe and Sherman. One proposal developed by the IFC and eventually accepted by the Assembly was the conversion of the Fort Howard air base into a special economic zone. See “Structure of the Panamanian Economy—The Role of the Government in the Economy.”
In January 2003, Panama decided not to privatize the Tocumen International Airport, located outside Panama City. On January 29, 2003, the Assembly enacted legislation to create the Civil Aeronautic Authority, an autonomous state entity that will oversee civil aviation in Panama. The Assembly also approved accompanying legislation aimed at the development and maintenance of Panama’s airport facilities, including measures to improve operating efficiency. In June 2003, control over the airport was transferred from the Civil Aeronautic Authority to Aeropuerto Internacional de Tocumen, S.A., a state-owned corporation established to manage and operate the airport pursuant to Law No. 23, also enacted on January 29, 2003. The privatization of Panama City’s Convention Center was still under discussion as of December 31, 2003, but the effort was abandoned with the issuance of Resolution No. 20 of February 13, 2004.
Panama’s privatization efforts have resulted in the sale of interests in 17 enterprises and concessions since 1990, raising a total of $1.646 billion. With the exception of IDAAN and Caja de Seguro Social (Panama’s social security agency), there remain very few public institutions to privatize in Panama. There have been no significant privatizations since 1999.
Trade Liberalization. Trade liberalization received new impetus under the Pérez Balladares administration. Panama’s accession to the WTO became effective September 6, 1997. Panama had begun lowering its duties and quantitative restrictions in anticipation of WTO accession, although significant duties permitted under WTO rules remained in place for certain products. On January 1, 1997, a series of measures became effective generally providing for the: (i) conversion of all existing quotas and import permits to ad valorem tariffs; (ii) conversion of all remaining specific or mixed tariffs to ad valorem tariffs; and (iii) setting of a tariff ceiling of 40% for industrial products and 50% for agri-industrial products. A major piece of legislation designed, in part, to remove barriers to Panama’s accession to the WTO, the Ley de Universalización de Incentivos Tributarios a la Producción (the “LUIT”), was passed by the Assembly in June 1995. As of September 1, 1997, tariffs were reduced to 10% for components of bread, cooking oils and numerous construction industry inputs, including steel and cement. The Ministry of Planning and Economic Policy, now the Ministry of Economy and Finance, retained a consultant to study further lowering of duties below those agreed to with the WTO, and on October 10, 1997, the Cabinet approved additional reductions of tariffs on certain specific products to 15%. Upon assuming office, the Moscoso administration increased certain tariffs for certain agricultural products in October 1999. See “Foreign Trade and Balance of Payments—Tariffs and Other Trade Restrictions.”
D-11
In early 2002, Panama signed an agreement in principle (the “Free Trade Agreement”) with Costa Rica, El Salvador, Guatemala, Honduras and Nicaragua to work towards a Central American free trade zone by 2005. The agreement is aimed at diversifying the commercial market and services in the region, eliminating trade barriers and increasing investment. The National Assembly approved the Free Trade Agreement in February 2003. Pursuant to the Free Trade Agreement, Panama and El Salvador signed a bilateral protocol, also approved by the National Assembly in February 2003, which covers approximately 85% of both countries’ output. Panama entered into a bilateral trade agreement with the Dominican Republic that became effective in December 2003, after each country ratified a negotiated list of 199 products for inclusion in the agreement. On August 21, 2003, Panama signed a free trade agreement with Taiwan. The agreement, which took effect on January 1, 2004, was ratified by Taiwan’s legislature on October 1, 2003 and by Panama’s National Assembly on October 13, 2003. Under the agreement, 95 percent of import tariffs will be phased out over ten years. On November 18, 2003, the U.S. Trade Representative notified the U.S. Congress of his intent to initiate free trade negotiations with the Republic of Panama. Free trade negotiations with the U.S. began in the second quarter of 2004. In February 2004, Panama began negotiations for a free trade agreement with Singapore.
In May 2002, Panama announced the creation of the Baru Free Trade Zone, located in the District of Baru, in the western province of Chiriqui. The objective of the creation of the Baru Free Trade Zone is to facilitate commercial access to and from markets in the Pacific, Central America, Mexico and the West Coast of the United States.
On July 20, 2004, the Assembly adopted Law No. 41 creating a special economic zone at the former U.S. military base of Fort Howard in the district of Arraijan and established an independent agency responsible for administering the zone. The Area Económica Especial Panamá-Pacifico (“AEEPP”) is intended to attract foreign investment and to create jobs by granting preferential tax treatment to businesses involved in such areas as technology, airline repair and maintenance, maritime cargo and transportation logistics. The AEEPP is not expected to compete with the CFZ as a result of a prohibition in the legislation on the importation into and reexportation out of the AEEPP of finished products.
Other Economic Reforms. Other areas of economic reform during the Pérez Balladares administration included elimination of virtually all price controls, adoption of a competition law addressing antitrust, consumer protection and other issues, establishment of a public utility regulatory body and adoption of securities laws. Under the Moscoso administration, reforms included strengthening anti-money laundering legislation and promoting investment in infrastructure and services in order to stimulate private investment in the interior. President Torrijos has announced his intention to pursue reforms to the Constitution, the judiciary, the public sector and the Fiscal Responsibility Law. See “Structure of the Panamanian Economy—The Role of the Government in the Economy.”
Fiscal Reforms. To enforce fiscal discipline and budgetary compliance, the Government has established special review procedures for public sector expenditures. See “Public Finance—Central Government Budget.” In addition, the LUIT removes some of the fiscal mechanisms used to disfavor foreign competition in the domestic economy and eliminates certain tax exemptions and fiscal incentives that are believed to have led to distortions in the economy. The LUIT reduces the maximum tax rate applicable to most corporations for non-CFZ income and reforms the tax subsidies and incentives regime by generally granting all enterprises, regardless of size, similar tax abatements on imports of manufacturing inputs and investments in capital goods. Previously, many of these subsidies and incentives were available only to a specified class of manufacturers. In addition, the LUIT authorized the gradual elimination by year-end 2003 of tax exemptions and subsidies, either direct or indirect, for activities that substitute imports. In December 2002, the Assembly approved tax reforms aimed at improving and streamlining tax collection processes, as well as creating a broader tax base. See “Public Finance—Taxation.” The approved tax reform legislation raised the level of income exempt from income tax from $300 to $800 per month, contained measures that combat tax evasion and increased the income tax on banks.
External Debt Normalization. In May 1995, Panama agreed to terms with its Bank Advisory Committee for a Brady Plan restructuring of its medium- and long-term commercial bank debt, and the restructuring was successfully closed in July 1996. Petroleum import debts to Mexico and Venezuela
D-12
under the San José Pact were also settled in 1996. Panamanian public sector borrowers restructured the external debt on which they defaulted in 1987 and normalized relations with their external creditors. See “Public Sector Debt—External Debt.”
Labor Code. In order to facilitate labor market flexibility, in August 1995, the Assembly adopted substantial amendments to Panama’s Labor Code, which eased restrictions in areas such as termination of employees and payment of incentives. Prior to these amendments, the Labor Code significantly and adversely affected the development of the private sector economy and discouraged foreign investment.
Social Developments. Panama’s social spending generally does not involve income subsidies or other welfare benefits but instead focuses on spending in the social sectors of health, education and housing. Together, these areas represented 42.7% of 2004 government expenditures.
Panama entered into an agreement with the IDB in December 1999 pursuant to which the IDB provided a $48.8 million loan aimed at improving living conditions in certain poverty-stricken communities in Panama. On February 5, 2004, Panama and the IDB agreed to cancel $15.0 million of the available principal amount of this loan. As of December 31, 2004, $18.0 million of this loan had been disbursed. In August 1997, the World Bank provided a $28 million loan to fund a project aimed at improving infrastructure in poor rural communities, which project completed operations on June 30, 2004. The laws that currently govern the Development Trust Fund provide that up to $200 million may be drawn down from the Development Trust Fund to support infrastructure projects. The disbursements are to be made against invoices presented to the Ministry of Economy and Finance. See “Structure of the Panamanian Economy—The Role of the Government in the Economy.” For 2002 through 2004, funds were available in the following amounts: $70 million to water supply; $30 million to irrigation and agricultural projects; and $97 million to road rehabilitation. In April 2001, Panama entered into a $47.9 million loan agreement with the World Bank. The loan will finance a land administration program, slated to operate through September 30, 2006, that will provide equitable access to land and provide land administration services in selected rural, semi-urban and urban areas. In March 2003, Panama entered into two loan agreements with the IDB for a total of $25.2 million to support a program for the sustainable development of the Bocas del Toro region and a program to strengthen the fiscal management of the public sector.
Environmental Law. In 1998, the Assembly enacted the Ley General del Ambiente y de los Recursos Naturales (the “Environmental Protection Law”). The Environmental Protection Law created the Autoridad Nacional del Ambiente y los Recursos Naturales (“ANAM”), an autonomous administrative agency, which regulates the use of natural resources in local areas and assists in protecting the environment on the local level. The Environmental Protection Law also created the Consejo Nacional del Ambiente (the “National Environmental Council”), a governmental agency headed by three government ministers. The National Environmental Council advises the Government on appropriate national environmental policy for Panama. In addition to creating the foregoing agencies, the Environmental Protection Law established standards, sanctions and other provisions to protect more effectively the environment in Panama. In December 1999, Panama entered into an agreement with the IDB pursuant to which the IDB provided a $15.8 million loan to ANAM to regulate and manage environmental projects in Panama.
Infrastructure. Through the privatization of major public utilities, the Government has sought significant improvements in Panama’s infrastructure. The Government is expanding the highway network through administrative concessions for toll road projects. See “Structure of the Panamanian Economy—The Role of the Government in the Economy.” In January 2000, a two-lane addition to the Pan American highway was completed, extending from La Chorrera to San Carlos, west of Panama City. In November 2000, the Government, with the assistance of a $72 million loan from the IDB, began a five-year program to install electrical transmission lines to transmit electrical power generated by hydroelectric plants in the countryside to urban areas. In addition, plans were implemented in 2002 for the construction of a new bridge over the Panama Canal, together with feeder roads. The estimated total cost of the project, including the designs, inspections and construction of the bridge and feeder roads, was approximately $204.1 million. On August 15, 2004, the span of the second bridge over the Panama Canal was completed. On September 2, 2005, the feeder roads to the bridge were completed at a cost of $87.2 million.
D-13
Puebla-Panama Plan. In June 2001, Panama, together with Mexico, Nicaragua, Guatemala, Honduras, El Salvador, Belize and Costa Rica signed the Puebla-Panama Plan, a development plan to be supported by up to $2 billion in loans from the IDB and other multilateral organizations. The development would include joint management of natural resources and infrastructure projects such as highways, roads, electricity, seaports, airports, gas pipelines and communications as well as a plan for environmental protection. In July 2003, the IDB approved an additional $37 million loan to Panama to rehabilitate and upgrade a highway on the Pacific Corridor, a component of the Puebla-Panama Plan’s network of Mesoamerican highways.
Prevention of Money Laundering and Other Crimes. The Pérez Balladares administration, with international encouragement and support, targeted certain illegal activities, including money laundering, corruption and drugs, for reduction and elimination. The Moscoso administration continued to target these illegal activities, and the Torrijos administration has pledged to follow suit. The Development Program itself was designed to reduce opportunities for corruption, and the Pérez Balladares administration took several significant actions in the area of money laundering. Legislation adopted in 1994 mandated forfeiture of proceeds derived from money laundering, while a decree issued that year by the Pérez Balladares administration required resident agents of corporations to know the identity of the corporation’s beneficial owners. In June 1995, the Financial Analysis Unit (“UAF”), an independent investigative unit reporting to the President, was created to monitor certain financial transactions. Banks, casinos, financial institutions, exporters and others are required to report to the UAF cash transactions exceeding $10,000. Additionally, new banking legislation was enacted which has tightened controls and supervision of various banking activities. The UAF has signed letters of understanding with regulatory bodies in 38 other countries to combat money laundering. The letters of understanding are intended to pave the way for greater cooperation between countries by facilitating the exchange of information. See “Financial System—The Banking Sector.”
The Government has collaborated with other nations, including the U.S. and Canada, in several investigations and prosecutions related to drug smuggling and money laundering. On February 29, 2000, the U.S. certified Panama under applicable U.S. law as having adequately complied with the U.N. Convention Against Illicit Traffic in Narcotic Drugs and Psychotropic Substances. Since then, the U.S. has not identified Panama as having failed demonstrably to make substantial efforts to adhere to its obligations under the U.N. Convention Against Illicit Traffic in Narcotic Drugs and Psychotropic Substances. In June 2001, the Financial Action Task Force on Money Laundering (“FATF”) of the Organization for Economic Cooperation and Development (“OECD”) removed Panama from its list of countries and jurisdictions that are non-cooperative in the fight against money laundering. In April 2002, the OECD removed Panama from the list of countries that it considers uncooperative tax havens. As part of an agreement with the OECD, Panama has pledged to improve the transparency of its tax system and to provide certain tax information to the OECD member countries. In March 2003, Panama signed a cooperation agreement with Mexico that provides for the exchange of financial information to prevent and detect money laundering.
Economic Performance—2000 Through 2004
Revision of GDP Calculations. In 2002, the Directorate for Statistics and Census of the Comptroller General’s Office (“DEC”) revised its calculation of GDP by adopting a 1996 base year; the base year previously used was 1982. The calculation of Panama’s GDP now also includes, for example, figures from sectors that were previously unaccounted for under the previous methodology, takes into account indirect taxes paid by various sectors and adjusts national accounts figures to account for the offer and use of goods and services. The Government believes that the revised methodology produces a more accurate estimate of Panama’s GDP and is consistent with accounting methods espoused by various international organizations, including the Economic Commission for Latin America and the Caribbean (an economic commission of the U.N. that, along with Panama’s Ministry of Economy and Finance, provided technical assistance to the DEC in its recalculations). The revised methodology has been applied retroactively to, and thus adjusts, economic statistics from fiscal year 2000 onward.
Revision of Non-Financial Public Sector Deficit Calculations. In 2004, the Torrijos administration revised the methodology used by the Moscoso administration to calculate the non-financial public sector
D-14
deficit. The revised methodology used to calculate the 2004 deficit and restate the deficit for prior years going back to 2000 does not include expected Banco Nacional de Panama dividends, the Panama Canal Authority’s net financial results or the savings generated by debt repurchase operations, all of which were included under the previous administration’s methodology. The revised methodology uses cash-based accounting standards.
Revision of Consumer Price Index Calculations. In 2004, the DEC revised its calculation of the consumer price index (“CPI”) by adopting a 2002 base year; the base year previously used was 1987. In addition, beginning with figures for 2004, the area sample will be expanded to incorporate a broader population and updated expenditure weights will be used in the market baskets to reflect new spending patterns.
Revision of Unemployment Rate. In 2004, the DEC revised its calculation of the unemployment rate by adopting open unemployment as the official indicator of unemployment. The open unemployment rate includes only persons actively seeking employment. The Government believes that the adoption of open unemployment as the official indicator of unemployment produces a better comparison with countries in the region, including the United States, that use open unemployment as the official indicator of unemployment. The revised methodology has been applied retroactively to, and thus adjusts, economic statistics from fiscal year 2001 onward.
Economic Performance in 2000. Real GDP increased by 2.7% in 2000. This represented a decrease from 1999’s 3.9% growth in real GDP. The principal sectors of the economy primarily responsible for such growth in 2000 were agriculture, construction, real estate, transportation and communications, public utilities, financial intermediation and public administration. The agricultural sector saw growth of 9.8% from 1999 to 2000 (reflecting a contribution to GDP of 7.0% in 2000) primarily due to a recovery in fishing activities and exports of agricultural products. Construction activity grew 1.3% from 1999 to 2000 (reflecting a contribution to GDP of 4.7% in 2000) due to growth in housing construction. In 2000, the real estate sector also grew for the same reason, increasing 3.6% from 1999 and representing 15.6% of GDP. Transportation and communications activity in 2000 increased 17.8%, from 1999, representing a contribution to GDP of 10.5% in 2000 as compared to 9.1% in 1999. This increase was primarily due to port development permitting an increase in the number of containers handled, the privatization of INTEL and increased public and private sector investment in communications equipment, infrastructure and services. Public utilities activity increased 9.3% from 1999, representing a contribution to GDP of 3.3% in 2000, as compared to 3.1% in 1999. This increase is primarily attributable to a surplus of hydroelectric power. The financial intermediation sector grew 9.7% from 1999 to 2000, representing 9.9% of Panama’s GDP in 2000, due to an increase in credit extended by local banks in the domestic market. The value produced by the public administration sector increased 1.8% from 1999 to 2000, representing 9.4% of GDP in 2000.
The Panama Canal Authority’s activity in 2000 increased 2.3% from 1999, representing a contribution to GDP of 4.7% in 2000, as compared to a GDP contribution of 4.7% in 1999. CFZ activity in 2000 increased 16.0% from 1999, representing a contribution to GDP of 7.1% in 2000 as compared to 6.3% in 1999.
Inflation in 2000, as measured by the end-of-period CPI, was 1.4%, the same rate as in 1999, remaining constant despite a slight increase in health care costs and increases in housing and energy costs. The total unemployment rate increased from 11.8% in 1999 to 13.5% in 2000.
The Government’s current account for 2000 had a surplus of $124 million (1.1% of GDP). The Government’s overall deficit decreased from $228 million in 1999 (2.0% of GDP) to $152 million in 2000 (1.3% of GDP). This decrease in the overall deficit was primarily attributable to increased revenues, relating to the payment of dividends to the Government by privatized companies and to improved tax collections. The overall non-financial public sector registered a deficit of $94 million in 2000, compared to a deficit of $138 million in the previous year, principally due to reductions of government spending and debt levels in 2000. The current account deficit with respect to Panama’s balance of payments decreased from $1.211 billion in 1999 to $715.5 million in 2000, resulting from an increase in the value added by exports and services in 2000.
D-15
On July 13, 2000, Panama issued $350 million principal amount of its 10.75% U.S. Dollar-Denominated Global Bonds Due 2020.
Economic Performance in 2001. Real GDP increased by an estimated 0.6% in 2001. This represented a decrease from the 2.7% growth in real GDP experienced in 2000. The sectors of the economy primarily responsible for such growth in 2001 were transportation and communications, the CFZ, public administration, agriculture and other services. Transportation and communications activity increased by 2.3% in 2001 (contributing 10.7% to GDP in 2001 compared to 10.5% to GDP in 2000). In the transportation sector, this increase was primarily due to modernization of the transportation infrastructure. In the communications sector, C&W Panama completed the first stage of an expansion project and modernized its communications equipment. The contribution of the CFZ to GDP rose from 7.1% in 2000 to 7.8% in 2001. This increase was primarily attributable to an increase in merchandise exports and imports, reflecting an increase in commercial activities in the CFZ. The public administration sector grew 5.8% in 2001, reflecting a contribution of 9.9% to GDP (an increase from 9.4% of GDP in 2000). This increase principally resulted from an increase in personnel in the health and education areas. The agricultural sector experienced an increase of 6.5% from 2000. Activity in other service sectors, including tourism, grew 0.7% in the aggregate in 2001, contributing 5.7% to 2001 GDP (compared to a contribution of 5.7% to 2000 GDP).
Activity in the construction sector fell 21.8% from 2000 to 2001 (compared to an increase of 1.3% from 1999 to 2000) and represented a contribution to GDP of 3.7% in 2001. This decline is attributable to the absence of new construction projects during the year and a slowdown in housing projects. Activities of the Panama Canal Authority continued to grow by increasing 3.1% from 2000 to 2001 (compared to an increase of 2.3% from 1999 to 2000); the sector represented 4.8% of 2001 GDP (compared to 4.7% of 2000 GDP). The growth in Panama Canal Authority activities was attributable to increased Canal traffic.
Inflation in 2001, as measured by the end-of-period CPI, rose 0.3% as compared with 1.4% in 2000. The inflation rate was affected by the cost of electric energy, gas and medical services. The total unemployment rate increased to 14.0% and the open unemployment rate was 11.2% in 2001 due to an increase in the labor force, as well as job losses in the private sector. The economy had difficulty absorbing large numbers of unskilled workers, particularly those migrating from rural to urban areas.
The Government’s current account for 2001 had a deficit of $83 million (0.7% of GDP), compared to a surplus of $124 million (1.1% of GDP) in 2000. The Government’s overall deficit increased from $152 million in 2000 (1.3% of GDP) to $342 million in 2001 (2.9% of GDP). This increase in the overall deficit is primarily attributable to a decrease in federal income tax revenues and an increase in government current expenses, specifically an increase in external debt interest and wages. In 2001, the overall non-financial public sector registered a deficit of $289 million (or 2.4% of 2001 GDP), compared to a deficit of $94 million in 2000 (or 0.8% of 2000 GDP). The current account deficit with respect to Panama’s balance of payments decreased from $715.5 million in 2000 to $173.5 million in 2001, as a result of an increase in the value added by exports and services and a drop in import expenses in 2000.
On February 8, 2001, Panama issued $750 million principal amount of its 9.625% U.S. Dollar-Denominated Global Bonds due 2011. On July 13, 2001, Panama repurchased $158.4 million of its 7.25% Notes due 2002 for cash and warrants to purchase its 9.375% Global Bonds due 2012. On November 16, 2001 and December 11, 2001, Panama issued an aggregate $350 million principal amount of its 8.25% U.S. Dollar-Denominated Global Bonds due 2008 in reopenings of that issue.
Economic Performance in 2002. In 2002, Panama was affected by the general global economic downturn, and economic indicators were mixed. Panama’s economy grew in 2002 with an increase in real GDP of 2.2%, compared to an increase of 0.6% in 2001. The service sector grew an estimated 1.3% but its contribution to GDP slightly declined to an estimated 75.8% in 2002 from 76.5% in 2001. In particular,
D-16
growth was seen in public utilities, commerce, restaurants and hotels, transportation and communications, the Panama Canal and public administration. The public utilities sector grew 6.9% from 2001 to 2002 (representing a contribution to GDP of 3.3% in 2002); unseasonably wet weather resulted in an increase of hydroelectricity production. In 2002, the transportation and communications sector increased 2.5% from 2001 representing a contribution of 10.7% to 2002 GDP. This increase was attributable to an increase in port and railroad activities. The value of goods and services derived from the Panama Canal increased slightly by 0.9% from 2001 to 2002, due primarily to a hike in transit tolls, but the GDP contribution from this source declined from 4.8% in 2001 to 4.7% in 2002. In 2002, the public administration sector grew 3.8% from 2001, representing 10.0% of 2002 GDP. Activity in the commerce, restaurants and hotels sector increased 5.6% in 2002 from 2001, representing a contribution to GDP of 9.7% in 2002. This growth was due to an increase in automobile sales of over ten percent and expanded tourism from cruises.
The agricultural sector experienced a modest increase of 3.3% from 2001. The manufacturing sector continued its decline in 2002, decreasing 2.6% from 2001 (compared to a decrease of 6.3% from 2000 to 2001). The decline of this sector, which represented 8.6% of GDP in 2002, was attributable to the continuing high cost associated with imported raw materials, which are subject to import tariffs. In 2002, the construction sector declined, falling 7.1% from 2001 (compared to a decrease of 21.8% from 2000 to 2001) and representing 3.3% of 2002 GDP. The slowdown of the construction sector was attributable to a continuing decline in construction projects. CFZ activities declined 8.6% in 2002, reflecting a drop in contribution to GDP from 7.8% in 2001 to 7.0% in 2002. This decrease was attributable to a decline in CFZ imports and re-exports, and reflected the impact of the adverse political and economic situation in certain countries that have been major users of the CFZ, such as Colombia, Ecuador and Venezuela.
Inflation, as measured by the end-of-period CPI, rose 1.0% in 2002. The open unemployment rate decreased to 10.9% in 2002 from 11.2% in 2001. The decrease in the open unemployment rate was at least partially attributable to the Government’s adoption of a broader definition of employed persons that includes the self-employed and those engaged in semi-formal employment. The Government’s current account deficit was $14 million for 2002, as compared to a deficit of $83 million in 2001. Panama’s overall deficit was $345 million (or 2.8% of GDP) in 2002 compared to $342 million (or 2.9% of GDP) in 2001. This increase in the overall deficit was primarily attributable to a decline in non-tax related revenues as well as a decline in the interest earnings of the Development Trust Fund. The consolidated non-financial public sector balance showed a deficit of $415 million (or 3.4% of GDP) in 2002 compared to a deficit of $289 million (or 2.4% of GDP) in 2001. This increase in the non-financial public sector deficit resulted primarily from a decline in the net revenues of Caja de Seguro Social and other agencies. The current account deficit with respect to Panama’s balance of payments decreased to $95.5 million in 2002 from $173.5 million in 2001. In 2002, Panama experienced an overall balance of payments surplus of $146 million (or 1.3% of GDP), compared to an overall balance of payments surplus of $644 million (or 5.6% of GDP) in the previous year.
On January 23, 2002, Panama issued $180 million principal amount of its 9.375% Global Bonds due 2012 in exchange for warrants that Panama had issued previously in connection with its July 13, 2001 tender offer for its 7.875% Global Bonds due 2002. On July 19, 2002, Panama issued $150 million principal amount of its 9.375% Global Bonds due 2012 in a reopening of that issue. On September 19, 2002, Panama issued $170 million principal amount of its 9.375% Global Bonds due 2012 in an additional reopening of that issue. A portion of the September reopening was used to repurchase external debt. On December 3, 2002, Panama issued $430 million of its 9.375% Global Bonds due 2023, of which approximately $280 million were used to repurchase external debt. In 2002, a total of $488.3 million principal amount of Brady Bonds was retired through debt management operations.
Economic Performance in 2003. Panama’s GDP registered a real increase of 4.3% during 2003. This represented an increase from the 2.2% growth in real GDP experienced in 2002. The principal sectors of the economy responsible for such growth in 2003 were agriculture, mining, construction, transportation and communications, the Panama Canal, real estate and other services. The agriculture sector grew 4.6% from 2002 to 2003. This increase is primarily attributable to growth in commercial fishing activities, which resulted in increased levels of tuna exportation. Mining increased 25.2% from 2002 to 2003 (reflecting a contribution to GDP of 0.9% in 2003) due to the high level of construction activity. The construction
D-17
sector grew 32.5% from 2002 to 2003, representing a contribution to GDP of 4.2% in 2003, as compared to 3.3% in 2002. This increase is primarily attributable to growth in commercial and public projects, as well as a rise in housing projects due to low mortgage rates and a change in the tax law which created a property tax exemption and tax incentives for middle-income housing. Transportation and communications activity in 2003 increased 15.6%, representing a contribution to GDP of 11.8% in 2003 as compared to 10.7% in 2002. This increase was due to the expansion of port activities to include service to and from Brazil and the increased use of railroads resulting from the growth in port activities. Panama Canal activities grew 9.0% in 2003 (reflecting a contribution to GDP of 5.0% in 2003) due to an increase in toll revenues and shipments, including oil and merchandise, destined for China. In 2003, the real estate sector also grew, increasing 3.7% from 2002 and representing 15.9% of GDP. Activity in other service sectors, including tourism, grew 0.9% in the aggregate in 2003, contributing 5.7% to 2003 GDP (compared to a contribution of 5.9% to 2002 GDP).
Financial intermediation activity in 2003 decreased 6.2% from 2002, representing a contribution to GDP of 7.8% in 2003, as compared to a GDP contribution of 8.7% in 2002. This decrease was principally due to a decline in the banking sector as a result of a continued reduction of external operations. The manufacturing sector continued its decline, decreasing 1.6% from 2002 (as compared to a decline of 2.6% from 2002 to 2001). The decline of this sector, which represented 8.1% of GDP in 2003, is attributable to the closing of Panama’s petroleum refinery in August 2002 as well as to a decrease in the production of textiles, sugar, and footwear, as the manufacturing sector continues to adjust to the removal of fiscal incentives and reduction of import tariffs in that sector.
Inflation in 2003, as measured by the end-of-period CPI, increased to 1.4%, thereby tracking the pattern of inflation in the U.S. The open unemployment rate remained at 10.9% in 2003.
The Government’s current account for 2003 had a deficit of $119 million (0.9% of nominal GDP), compared to a deficit of $14 million in 2002. The Government’s overall deficit increased from $345 million in 2002 (2.8% of GDP) to $489 million in 2003 (3.8% of GDP). The overall non-financial public sector registered an accrued deficit of $623 million in 2003 (4.8% of GDP). The current account deficit with respect to Panama’s balance of payments increased from $95.5 million in 2002 to $437.2 million in 2003, resulting from a significant increase in retained profits in the banking sector. In 2003, Panama experienced an overall balance of payments deficit of $153.0 million, compared to an overall balance of payments surplus of $146.0 million in the previous year.
In an effort to promote the development of Panama’s capital markets, the Government initiated, in July 2002, a program of Treasury Note issuances in the local market. In seven monthly auctions ending on February 4, 2003, Panama issued $250 million of 7.25% Treasury Notes due 2005; in ten monthly auctions from March 11, 2003 to December 2, 2003, Panama issued almost $250 million of 6.75% Treasury Notes due 2007. The Government completed its 2003 financing following the June 2003 auction, and proceeds from subsequent auctions in 2003 were used for debt management operations.
On February 28, 2003, Panama issued $275 million principal amount of its Global Bonds due 2027 in a reopening of that issue. Approximately $50 million of the reopening were used to repurchase external debt, and the remaining balance was allocated to general budgetary purposes. In 2003, Panama repurchased $123.5 million principal amount of its Brady Bonds.
Economic Performance in 2004. Panama’s economy grew in virtually all sectors during 2004. Panama’s gross domestic product (“GDP”) registered a real increase of 6.2% during 2004. In 2004, the primary sector grew an estimated 5.9% from 2003. In particular, the agriculture sector grew 2.4% in 2004, representing a contribution to GDP of 7.3% in 2004 as compared to 7.5% in 2003. This increase is primarily attributable to a continued growth in melon and pineapple exports and an increase in the price of tuna. The transportation and telecommunications sector grew by an estimated 13.5% in 2004 (contributing 12.7% to GDP in 2004 compared to 11.8% in 2003) due to increased cellular phone usage and the opening to competition of the international telecommunications market. Mining activities increased 33.7% in 2004, reflecting a contribution to GDP of 1.2% (an increase from 0.9% of GDP in 2003), due to high demand for mining products from construction activity. The construction industry grew by 16.0% in 2004 due to the
D-18
large number of construction projects, in both the commercial and residential sectors, as a result of favorable interest rates. The contribution of the construction industry to GDP rose from 4.2% in 2003 to 4.6% in 2004. Activities of the CFZ increased 19.0% in 2004, reflecting a contribution to GDP of 7.3% in 2004 compared to 6.5% of GDP in 2003. This increase is primarily attributable to the continued economic recovery of South America. The manufacturing sector grew 2.6% in 2004 due in part to an increase in the production of food and beverages and construction-related materials. Panama Canal activities grew 7.1% in 2004 (contributing 5.0% to GDP in 2004 compared to 5.0% in 2003) due to an increase in canal traffic and cargo volume. The public utilities sector grew by 8.8% in 2004, representing a contribution to GDP of 9.4% in 2004 compared to 9.9% in 2003. This increase is in part attributable to increased hydroelectric power generation due to the opening of the new Estí power plant, expanded activity of the Bayano power plant and increased demand from construction projects and new shopping centers. In 2004, the only sector that declined was the financial intermediation sector, which fell 2.6% in 2004 compared to 2003. This decrease occurred despite an increase in external and internal credit in 2004 compared to 2003.
Inflation, as measured by the end-of-period CPI, was 1.5% in 2004. The open unemployment rate decreased from 10.9% in 2003 to 9.2% in 2004.
The Government’s current account for 2004 registered a deficit of $331 million (2.4% of nominal GDP), compared to a deficit of $119 million in 2003. The Government’s overall deficit increased from $489 million in 2003 (3.8% of nominal GDP) to $768 million in 2004 (5.6% of nominal GDP). In 2004, Panama’s non-financial public sector balance registered a deficit of approximately $691.0 million (or 5.0% of nominal GDP), up from $623.4 million (or 4.8% of nominal GDP) in 2003.
In January 2004, Panama launched an offer to purchase (“Offer to Purchase”) outstanding Brady Bonds, which offer was financed by a further issuance in February 2004 of $326 million of its 9.375% Global Bonds Due 2023, of which $430 million principal amount had been previously issued and are outstanding. Pursuant to the settlement of the Offer to Purchase, which occurred in February 2004, Panama repurchased approximately $406 million aggregate original principal amount of Brady Bonds, of which there were approximately $177 million aggregate original principal amount of Past-Due Interest Bonds Due 2016 (“PDIs”), approximately $221 million aggregate original principal amount of Interest Reduction Bonds Due 2014 (“IRBs”), approximately $5.5 million aggregate original principal amount of Par Bonds Due 2026 (“Par Bonds”) and approximately $2.5 million aggregate original principal amount of Discount Bonds Due 2026 (“Discount Bonds”). The consummation of the Offer to Purchase yielded a nominal net reduction of $57.0 million in Panama’s public sector debt balance and reduced the balance of outstanding Brady Bonds. As of December 31, 2004, outstanding Brady Bonds totaled $371.9 million, consisting of approximately $221.2 million aggregate principal amount of PDIs, approximately $127.8 million aggregate principal amount of IRBs, approximately $9.7 million aggregate principal amount of Par Bonds, and approximately $13.2 million aggregate principal amount of Discount Bonds.
In January 2004, Panama issued $250 million aggregate principal amount of its 8.125% Global Bonds due 2034 containing collective action clauses. In November 2004, Panama issued $600 million aggregate principal amount of its 7.250% Global Bonds due 2015 containing collective action clauses.
D-19
The following table sets forth Panama’s principal price indicators for each of the years 2000 through 2004:
TABLE NO. 2
Inflation
(percentage change from previous period)
| | | | | | | | | | | | | | | |
| | | 2000
| | | 2001
| | | 2002
| | | 2003
| | | 2004(1)
| |
Period Average: | | | | | | | | | | | | | | | |
Consumer Price Index | | 1.4 | % | | 0.3 | % | | 1.0 | % | | 1.4 | % | | 0.5 | % |
Wholesale Price Index: | | | | | | | | | | | | | | | |
Imports | | 13.0 | | | (5.1 | ) | | (4.5 | ) | | 1.5 | | | 6.1 | |
Industrial products | | 5.7 | | | (1.3 | ) | | (1.8 | ) | | 3.6 | | | 3.4 | |
Agricultural products | | 0.6 | | | 0.5 | | | (0.8 | ) | | (3.6 | ) | | 3.1 | |
All products | | 8.8 | | | (3.2 | ) | | (3.0 | ) | | 1.8 | | | 4.6 | |
End of Period: | | | | | | | | | | | | | | | |
Consumer Price Index | | 0.7 | % | | 0.0 | % | | 1.8 | % | | 1.7 | % | | 1.5 | % |
Wholesale Price Index: | | | | | | | | | | | | | | | |
Imports | | 10.9 | | | (13.9 | ) | | 1.7 | | | 1.6 | | | 7.3 | |
Industrial products | | 4.7 | | | (5.2 | ) | | 3.8 | | | 2.9 | | | 1.7 | |
Agricultural products | | 0.3 | | | (0.3 | ) | | (2.2 | ) | | (2.9 | ) | | 2.6 | |
All products | | 7.2 | | | (9.4 | ) | | 2.2 | | | 1.6 | | | 4.4 | |
Source: Office of the Comptroller General and Ministry of Economy and Finance.
| (1) | The CPI figures for 2004 have been calculated using a newly-adopted methodology and a revised base year of 2002. Figures prior to 2004 have been calculated using an earlier methodology with a base year of 1987. |
D-20
Gross Domestic Product
Real GDP grew 2.7% in 2000, but then slowed to 0.6% in 2001. This slowdown in growth was primarily attributable to a decrease in internal demand for agricultural products, a decrease in construction and a slowdown in the Panamanian banking sector. In 2002, real GDP grew 2.2%, recovering from growth of 0.6% in 2001. The growth in 2002 was due to an increase in internal spending and an adjustment of accounting methods to take into account indirect taxes paid by various sectors of the economy. Furthermore, Canal revenues increased in 2002 as a result of a rise in Canal transit tolls. Real GDP grew 4.3% in 2003, which represented an increase from a growth of 2.2% in 2002. This growth was primarily due to an increase in construction, transportation and communication, and mining activities. In 2004, real GDP grew an estimated 6.2%. The growth in 2004 was primarily attributable to a continued increase in construction, transportation and communication and mining activities.
The sectoral composition of Panama’s GDP has remained relatively constant in recent years; in 2004, approximately 75.8% of GDP was attributable to services, 12.4% of GDP was attributable to the industrial activities of manufacturing and construction and 8.4% of GDP was attributable to the primary activities of agriculture, fishing and mining.
The following tables set forth Panama’s GDP, including sectoral origin (in dollars and as a percentage of GDP) and percentage change from 2000 to 2004.
TABLE NO. 3
Gross Domestic Product(1)
| | | | | | | | | | | | | | | | | | | | |
| | | 2000(R)
| | | 2001(R)
| | | 2002(R)
| | | 2003(P)
| | | 2004(E)
| |
Gross Domestic Product (millions of dollars in constant prices)(1) | | $ | 11,370.9 | | | $ | 11,436.2 | | | $ | 11,691.1 | | | $ | 12,196.2 | | | $ | 12,957.4 | |
% Change over Previous Year | | | 2.7 | % | | | 0.6 | % | | | 2.2 | % | | | 4.3 | % | | | 6.2 | % |
Gross Domestic Product (millions of dollars at current prices) | | $ | 11,620.5 | | | $ | 11,807.5 | | | $ | 12,272.4 | | | $ | 12,862.4 | | | $ | 13,733.5 | |
% Change over Previous Year | | | 1.4 | % | | | 1.6 | % | | | 3.9 | % | | | 4.8 | % | | | 6.8 | % |
| (1) | Figures are based on 1996 constant dollars. See “The Panamanian Economy—Economic Performance—2000 Through 2004.” |
Source: Office of the Comptroller General and Ministry of Economy and Finance.
D-21
TABLE NO. 4
Sectoral Origin of Gross Domestic Product
(in millions of dollars)(1)
| | | | | | | | | | | | | | | | | | | | |
| | | 2000(R)
| | | 2001(R)
| | | 2002(R)
| | | 2003(P)
| | | 2004(E)
| |
Primary Activities: | | | | | | | | | | | | | | | | | | | | |
Agriculture(2) | | $ | 797.7 | | | $ | 849.3 | | | $ | 877.4 | | | $ | 918.0 | | | $ | 940.4 | |
Mining | | | 78.8 | | | | 75.6 | | | | 89.7 | | | | 112.3 | | | | 150.2 | |
| | |
|
|
| |
|
|
| |
|
|
| |
|
|
| |
|
|
|
Total | | $ | 876.5 | | | $ | 924.9 | | | $ | 967.1 | | | $ | 1,030.3 | | | $ | 1,090.6 | |
Industrial Activities: | | | | | | | | | | | | | | | | | | | | |
Manufacturing | | $ | 1,095.2 | | | $ | 1,026.3 | | | $ | 999.3 | | | $ | 983.1 | | | $ | 1,008.6 | |
Construction | | | 536.9 | | | | 419.9 | | | | 390.0 | | | | 516.8 | | | | 599.6 | |
| | |
|
|
| |
|
|
| |
|
|
| |
|
|
| |
|
|
|
Total | | $ | 1,632.1 | | | $ | 1,446.2 | | | $ | 1,389.3 | | | $ | 1,499.9 | | | $ | 1,608.2 | |
Services: | | | | | | | | | | | | | | | | | | | | |
Public utilities | | $ | 374.5 | | | $ | 357.0 | | | $ | 381.5 | | | $ | 388.1 | | | $ | 422.1 | |
Commerce, restaurants and hotels | | | 1,088.1 | | | | 1,068.7 | | | | 1,128.1 | | | | 1,171.6 | | | | 1,229.8 | |
Transportation and communications | | | 1,191.2 | | | | 1,218.5 | | | | 1,249.3 | | | | 1,443.9 | | | | 1,639.0 | |
Colón Free Zone | | | 804.5 | | | | 894.0 | | | | 817.4 | | | | 792.1 | | | | 942.6 | |
Panama Canal Authority | | | 532.6 | | | | 549.0 | | | | 553.9 | | | | 603.7 | | | | 646.6 | |
Financial intermediation | | | 1,123.3 | | | | 1,090.4 | | | | 1,011.9 | | | | 949.6 | | | | 925.0 | |
Real estate | | | 1,776.6 | | | | 1,794.4 | | | | 1,867.5 | | | | 1,936.2 | | | | 2,058.2 | |
Public administration | | | 1,067.0 | | | | 1,128.9 | | | | 1,171.3 | | | | 1,201.4 | | | | 1,219.4 | |
Other services | | | 642.9 | | | | 647.5 | | | | 684.8 | | | | 690.8 | | | | 730.5 | |
| | |
|
|
| |
|
|
| |
|
|
| |
|
|
| |
|
|
|
Total | | $ | 8,600.7 | | | $ | 8,748.4 | | | $ | 8,865.7 | | | $ | 9,177.4 | | | $ | 9,813.2 | |
Plus Import Taxes(3) | | $ | 678.0 | | | $ | 685.7 | | | $ | 757.2 | | | $ | 795.6 | | | $ | 765.5 | |
Less Imputed Banking Services | | | (416.4 | ) | | | (369.0 | ) | | | (288.2 | ) | | | (307.0 | ) | | | (320.1 | ) |
Gross Domestic Product | | $ | 11,370.9 | | | $ | 11,436.2 | | | $ | 11,691.1 | | | $ | 12,196.2 | | | $ | 12,957.4 | |
| (1) | Figures are based on 1996 constant dollars. See “—Economic Performance—2000 Through 2004.” |
| (3) | Including value-added tax. |
Source: Office of the Comptroller General and Ministry of Economy and Finance.
D-22
TABLE NO. 5
Percentage Change from Prior Year for
Sectoral Origin of Gross Domestic Product
(percentage change)(1)
| | | | | | | | | | | | | | | |
| | | 2000(R)
| | | 2001(R)
| | | 2002(R)
| | | 2003(P)
| | | 2004(E)
| |
Primary Activities: | | | | | | | | | | | | | | | |
Agriculture(2) | | 9.8 | % | | 6.5 | % | | 3.3 | % | | 4.6 | % | | 2.4 | % |
Mining | | (10.6 | ) | | (4.1 | ) | | 18.7 | | | 25.2 | | | 33.7 | |
Total | | 7.6 | | | 5.5 | | | 4.6 | | | 6.5 | | | 5.9 | |
Industrial Activities: | | | | | | | | | | | | | | | |
Manufacturing | | (7.2 | ) | | (6.3 | ) | | (2.6 | ) | | (1.6 | ) | | 2.6 | |
Construction | | 1.3 | | | (21.8 | ) | | (7.1 | ) | | 32.5 | | | 16.0 | |
Total | | (4.5 | ) | | (11.4 | ) | | (3.9 | ) | | 8.0 | | | 7.2 | |
Services: | | | | | | | | | | | | | | | |
Public utilities | | 9.3 | | | (4.7 | ) | | 6.9 | | | 1.7 | | | 8.8 | |
Commerce, restaurants and hotels | | (3.7 | ) | | (1.8 | ) | | 5.6 | | | 3.9 | | | 5.0 | |
Transportation and communications | | 17.8 | | | 2.3 | | | 2.5 | | | 15.6 | | | 13.5 | |
Colón Free Zone | | 16.0 | | | 11.1 | | | (8.6 | ) | | (3.1 | ) | | 19.0 | |
Panama Canal Authority | | 2.3 | | | 3.1 | | | 0.9 | | | 9.0 | | | 7.1 | |
Financial intermediation | | 9.7 | | | (2.9 | ) | | (7.2 | ) | | (6.2 | ) | | (2.6 | ) |
Real estate | | 3.6 | | | 1.0 | | | 4.1 | | | 3.7 | | | 6.3 | |
Public administration | | 1.8 | | | 5.8 | | | 3.8 | | | 2.6 | | | 1.5 | |
Other services | | (4.0 | ) | | 0.7 | | | 5.8 | | | 0.9 | | | 5.7 | |
Total | | 5.5 | | | 1.7 | | | 1.3 | | | 3.5 | | | 6.9 | |
Plus Import Taxes(3) | | (11.4 | ) | | 1.1 | | | 10.4 | | | 5.1 | | | (3.8 | ) |
Less Imputed Banking Services | | 11.4 | | | (11.4 | ) | | (21.9 | ) | | 6.5 | | | 4.3 | |
Gross Domestic Product | | 2.7 | % | | 0.6 | % | | 2.2 | % | | 4.3 | % | | 6.2 | % |
| (1) | Figures are based on 1996 constant dollars. See “—Economic Performance—2000 Through 2004.” |
| (3) | Including value-added tax. |
Source: Office of the Comptroller General and Ministry of Economy and Finance.
D-23
TABLE NO. 6
Sectoral Origin of Gross Domestic Product
(as percentage of GDP)(1)
| | | | | | | | | | | | | | | |
| | | 2000(R)
| | | 2001(R)
| | | 2002(R)
| | | 2003(P)
| | | 2004(E)
| |
Primary Activities: | | | | | | | | | | | | | | | |
Agriculture(2) | | 7.0 | % | | 7.4 | % | | 7.5 | % | | 7.5 | % | | 7.3 | % |
Mining | | 0.7 | | | 0.7 | | | 0.8 | | | 0.9 | | | 1.2 | |
| | |
|
| |
|
| |
|
| |
|
| |
|
|
Total | | 7.7 | | | 8.1 | | | 8.3 | | | 8.5 | | | 8.4 | |
Industrial Activities: | | | | | | | | | | | | | | | |
Manufacturing | | 9.6 | | | 9.0 | | | 8.6 | | | 8.1 | | | 7.8 | |
Construction | | 4.7 | | | 3.7 | | | 3.3 | | | 4.2 | | | 4.6 | |
| | |
|
| |
|
| |
|
| |
|
| |
|
|
Total | | 14.4 | | | 12.7 | | | 11.9 | | | 12.3 | | | 12.4 | |
Services: | | | | | | | | | | | | | | | |
Public utilities | | 3.3 | | | 3.1 | | | 3.3 | | | 3.2 | | | 3.3 | |
Commerce, restaurants and hotels | | 9.6 | | | 9.4 | | | 9.7 | | | 9.6 | | | 9.5 | |
Transportation and communications | | 10.5 | | | 10.6 | | | 10.7 | | | 11.8 | | | 12.7 | |
Colón Free Zone | | 7.1 | | | 7.8 | | | 7.0 | | | 6.5 | | | 7.3 | |
Panama Canal Authority | | 4.7 | | | 4.8 | | | 4.7 | | | 5.0 | | | 5.0 | |
Financial intermediation | | 9.9 | | | 9.5 | | | 8.7 | | | 7.8 | | | 7.1 | |
Real estate | | 15.6 | | | 15.7 | | | 16.0 | | | 15.9 | | | 15.9 | |
Public administration | | 9.4 | | | 9.9 | | | 10.0 | | | 9.9 | | | 9.4 | |
Other services | | 5.7 | | | 5.7 | | | 5.9 | | | 5.7 | | | 5.6 | |
| | |
|
| |
|
| |
|
| |
|
| |
|
|
Total | | 75.6 | | | 76.5 | | | 75.8 | | | 75.3 | | | 75.8 | |
Plus Import Taxes(3) | | 6.0 | | | 6.0 | | | 6.5 | | | 6.5 | | | 5.9 | |
Less Imputed Banking Services | | (3.7 | ) | | (3.2 | ) | | (2.5 | ) | | (2.5 | ) | | (2.5 | ) |
| | |
|
| |
|
| |
|
| |
|
| |
|
|
Total | | 100.0 | % | | 100.0 | % | | 100.0 | % | | 100.0 | % | | 100.0 | % |
| (1) | Figures are based on 1996 constant dollars. See “—Economic Performance—2000 Through 2004.” |
| (3) | Including value-added tax. |
Source: Office of the Comptroller General and Ministry of Economy and Finance.
D-24
STRUCTURE OF THE PANAMANIAN ECONOMY
Principal Sectors of the Economy
Service Sector
The Panamanian economy is based primarily on the service sector, which accounted for an average of 75.8% of GDP from 2000 to 2004. Services include real estate, transportation and communications, commerce and tourism, banking, public administration, the Panama Canal, the CFZ and public utilities. While real estate and public administration represent significant percentages of GDP (estimated to be 15.9% and 9.4%, respectively, of GDP in 2004), the Panamanian economy is distinguished by the economic benefits generated by the Panama Canal and the CFZ.
Real Estate. The largest single component of the service sector is real estate, which consists of rental income and the imputed rental value of real estate that is occupied but not rented. Real estate represented 15.9% of GDP in 2003 and an estimated 15.9% of GDP in 2004. In October 1999, the Assembly approved an amendment to the Preferential Interest Rate Law, which has encouraged acquisition of new housing and contributed to the growth of the real estate sector.
Transportation and Communications. The transportation and communications sector, which includes ports, rails and telecommunications, is a relatively stable component of the Panamanian economy. It represented an estimated 12.7% of GDP in 2004, 11.8% of GDP in 2003, 10.7% of GDP in 2002, 10.6% of GDP in 2001 and 10.5% of GDP in 2000.
Commerce. Commerce (which includes wholesale and retail activities, restaurants and hotels) represented 9.5% of GDP in 2004, 9.6% of GDP in 2003, 9.7% of GDP in 2002, 9.4% of GDP in 2001 and 9.6% of GDP in 2000. In 1994, the Assembly adopted legislation granting incentives (primarily tax exemptions) for new investment in tourism activities. In May 1997, Panama signed an open skies air service agreement with the U.S., generally deregulating air traffic between the two countries. In executing this agreement, Panama became the first Latin American country to have such an agreement with the U.S.
Financial Services. The financial services sector represented an estimated 7.1% of GDP in 2004, 7.8% of GDP in 2003, 8.7% of GDP in 2002, 9.5% of GDP in 2001, and 9.9% of GDP in 2000. Approximately 90% of this sector’s contribution to GDP is accounted for by the banking sector, which as of December 2004, consisted of BNP and Caja de Ahorros, two state-owned banks, and 71 private banks. The banking sector was one of the sectors of the Panamanian economy most affected by the crisis of 1987-1989. The banking sector includes general license banks, international license banks, and foreign banks with representative offices. Figures show that, as of December 31, 2004, banking sector assets and deposits totaled approximately $34.626 billion and $24.525 billion, respectively. See “Financial System—The Banking Sector.”
Public Administration. Public administration, principally representing government activities, represented an estimated 9.4% of GDP in 2004, 9.9% in 2003, 10.0% in 2002, 9.9% in 2001 and 9.4% in 2000.
Colón Free Zone. The CFZ has developed into the largest duty-free zone in the Western Hemisphere in terms of commercial activity. As of December 31, 2004, approximately 2,619 companies used the CFZ service facilities for a variety of trading activities. The CFZ represented an estimated 7.3% of GDP in 2004, an increase from 6.5% in 2003 and 7.0% in 2002. Total imports to the CFZ rose to $5.104 billion in 2004 from $4.147 billion in 2003. Total re-exports in 2004 were $5.395 billion, as compared with $4.567 billion in 2003. CFZ value added (re-exports minus imports) decreased to an estimated $290.5 million in 2004. See “The Colón Free Zone.”
Panama Canal. For the years 2000 through 2004, economic activity associated with the Panama Canal Authority contributed an average of 4.8% to GDP. Canal transits increased 6.7% in the Canal’s 2004
D-25
fiscal year (which ended September 30, 2004) to 14,035 transits, and cargo tonnage increased 5.4%. Total toll revenue increased 13.8% from $666.0 million at fiscal year-end 2003 to $757.7 million at fiscal year-end 2004. From 2000 to 2004, toll revenues increased 32.0%, while cargo tonnage increased 2.5% and the number of transits increased 2.8%. See “The Panama Canal—General.”
Industrial Sector
After the service sector, the next largest segment of the economy consists of the industrial activities of manufacturing and construction, collectively representing an estimated 12.4% of GDP in 2004, 12.3% of GDP in 2003, 11.9% of GDP in 2002, 12.7% of GDP in 2001, and 14.4% of GDP in 2000. Manufacturing represented an estimated 7.8% of GDP in 2004. Manufacturing is principally geared to the production of processed foods and beverages and, to a lesser extent, clothing, chemical products and construction materials for the domestic market. Traditionally, the manufacturing industries have been protected by high tariffs and fiscal incentives. In connection with Panama’s accession to the WTO and free trade negotiations, many of such protections have decreased significantly and are expected to decrease further. See “Foreign Trade and Balance of Payments—Tariffs and Other Trade Restrictions.” Manufacturing facilities are primarily located in the Panama City and Colón areas, although agricultural processing facilities tend to be located closer to raw materials.
Construction activity fell sharply after 2000 due to the completion of several large infrastructure projects in 1999 as well as the absence of new construction projects and a slowdown in housing projects. Construction activity increased 1.3% in 2000, but decreased by 21.8% and 7.1% in 2001 and 2002, respectively. However, construction activity increased by 32.5% in 2003 and an estimated 16.0% in 2004. This increase is primarily attributable to certain tax exemptions, which expired in December 2003, that provided incentives for constructing middle-income housing and a large number of construction projects, in both the commercial and residential sectors, as a result of favorable interest rates.
Agriculture and Mining Sector
The agriculture and mining sector is the third largest segment of the Panamanian economy in terms of GDP, accounting for an estimated 8.4% of GDP in 2004, 8.5% of GDP in 2003, 8.3% of GDP in 2002, 8.1% of GDP in 2001, and 7.7% of GDP in 2000. This sector employs a significant percentage of the Panamanian employed workforce (19.1% in 2004). Principal products include bananas, shrimp, sugar, coffee, fish, meat, dairy products, tropical fruits, rice, corn and beans. In 2004, the value of agricultural production (which includes fisheries production) is estimated to have increased by 2.4%, after having increased by 4.6% in 2003.
Historically, bananas have been Panama’s primary agricultural product and merchandise export, although in recent years fisheries, as well as cattle and livestock, have gained importance. In 2000, banana production decreased by 16.1% from 1999 and accounted for 13.5% of agricultural value (down from 17.7% of agricultural value in 1999). In 2001, banana production decreased by 20.8% from 2000 and accounted for 10.0% of agricultural value. The decline in 2001 was primarily due to a decrease in banana exports to the European Union (“E.U.”). In 1994, the E.U. established a preferential trade assistance program with certain ACP (African, Caribbean and Pacific) countries receiving assistance under the Lomé Convention, which has resulted in trade barriers adversely affecting Panama’s banana industry. Also contributing to the decline in 2001 were labor conflicts between the banana workers union and the companies.
In 2002, the contribution of banana production to agricultural value declined to 9.5%, reflecting a decline of 2.7% compared to 2001 banana production figures. This decrease resulted primarily from banana union workers’ strikes, poor weather and the saturation of the world fruit market by other countries. In April 2001, the E.U. and the U.S. resolved their ongoing dispute regarding the preferential trade assistance program before the European Commission, agreeing on a tariff-only system to be implemented by 2006. However, in the transition period, Panama’s banana exports to the E.U. continue to experience a decline. In 2003, banana production decreased by 2.5% from 2002 and accounted for 8.8% of agricultural value. In 2004, banana production continued to decline, decreasing 1.1% from 2003 and accounting for an estimated 8.5% of agricultural value.
D-26
Fisheries grew by 1.5% from 2003 to 2004, representing an estimated 38.0% of 2004 agricultural value. The increase experienced in the fisheries sector in 2004 was primarily attributable to the continued expansion of commercial deep-sea fishing. Tuna production and exportation has, in particular, grown rapidly in recent years. See “Foreign Trade and Balance of Payments—General.”
Figures indicate that shrimp exports totaled $53.8 million in 2004, a decrease of 4.8% from $56.5 million in 2003. The shrimp white spot virus had a significant negative impact on shrimp farming in Panama in prior years. Since 2001, the shrimp white spot virus has been partially controlled by strict bio-security measures imposed on cultivated shrimp farms and close surveillance of imported shrimp larvae, but exports have continued to decline. See “Foreign Trade and Balance of Payments—General.”
Cattle and other livestock production represented an estimated 10.7% of 2004 agricultural value and increased slightly by 0.9% from 2003. Cattle and livestock production has accounted for a declining portion of agricultural value in recent years, as other sectors such as fisheries and poultry production have grown in importance. Cattle and livestock production accounted for 10.9%, 11.7%, 14.5% and 14.6% of agricultural value in 2003, 2002, 2001 and 2000.
The Panamanian agriculture and fisheries sector has been protected by significant tariff and non-tariff barriers. Agricultural products are controlled principally by the Ministry of Agriculture and the Agricultural Marketing Institute (“IMA”). As of January 1, 1997, all import quotas and import permits were abolished, although some were replaced by significant tariffs on numerous agricultural products. After an evaluation of the tariffs within WTO guidelines, the Moscoso administration increased tariffs on certain agricultural products in October 1999. See “Foreign Trade and Balance of Payments—Tariffs and Other Trade Restrictions.”
The Role of the Government in the Economy
The Government plays a significant role in the economy through, among other means, its ownership of certain public utilities and other enterprises. Current expenditures by the public sector, including Government-owned enterprises (other than the state-owned financial institutions), were $3.194 billion in 2004, $3.020 billion in 2003, $2.763 billion in 2002, $2.689 billion in 2001 and $2.587 billion in 2000. The Government also has a significant impact on the economy through various statutory and other governmental initiatives, including enforcement of a labor code, subsidies and tariff policies.
The following table sets forth summary financial information on principal public sector businesses for fiscal year 2004:
TABLE NO. 7
Selected State-Owned Enterprises(1)
2004 Financial Statistics(2)
(in millions of dollars)
| | | | | | | | | | | | | | | | |
| | | Total Assets
| | Capital and Reserves
| | Gross Revenues
| | Net Income
| | | Dividends Paid to the Government
|
BNP (banking) | | $ | 3,128.9 | | $ | 500.0 | | $ | 159.6 | | $ | 11.2 | | | $ | 11.2 |
IDAAN (water) | | | 552.2 | | | 408.2 | | | 71.3 | | | (15.8 | ) | | | 0.0 |
| (1) | All enterprises are 100% owned by the Government. |
| (2) | For fiscal year ended December 31, 2004. |
Sources: BNP and IDAAN.
D-27
In 1991, the Government initiated a privatization and public restructuring program managed by the executive branch through the Privatization Process Coordination Unit, an office within the Ministry of Economy and Finance. There were no privatizations in 2004.
In May 1995, the Government created the Development Trust Fund to hold and manage the proceeds generated by most privatizations. Pursuant to the law establishing the Development Trust Fund, the proceeds earned by investments from the monies in the Development Trust Fund were to be used mainly for investment in social development programs and not for financing general Government expenditures. Development Trust Fund legislation was approved on January 7, 1997 by the Cabinet pursuant to the Assembly’s delegation of legislative powers to the executive branch for this purpose. Among other things, the law provides that money deposited in the Development Trust Fund from the proceeds of privatization cannot be withdrawn.
Law No. 22, the June 2000 amendment to the law creating the Development Trust Fund, authorized the investment of the then approximately $1.3 billion of aggregate assets of the Development Trust Fund in seven types of investments:
| | • | | time deposits with investment-grade banks, |
| | • | | certain types of mortgage-backed bonds, |
| | • | | bonds issued by multilateral entities, |
| | • | | investment-grade fixed-income instruments, |
| | • | | bonds issued by the Republic purchased in the international secondary market for investment purposes, |
| | • | | investment-grade bonds issued by the Panama Canal Authority, and |
| | • | | bond funds administered by international managers. |
Pursuant to Law No. 22, not more than 20% of the net assets of the Development Trust Fund could be invested in any type of investment, including investments in bonds issued by the Republic; Development Trust Fund investments in time deposits of investment-grade banks, however, were not subject to this limit. In addition, pursuant to Law No. 22, at least 20% of the assets of the Development Trust Fund had to be invested within Panama in securities meeting the prescribed investment criteria. Law No. 22 further provided that up to $559.0 million of the principal of the Development Trust Fund could be disbursed in the years 2001 to 2004 for social development programs. See “The Panamanian Economy—Reforms and Development Programs.”
Law No. 22 establishes a five-member Advisory Board to determine investment criteria and other policies for the Development Trust Fund. Law No. 22 provides that the Advisory Board shall consist of the Minister of Economy and Finance, who will also be the chairperson of the Advisory Board, another Minister appointed by the President, a representative designated by the Executive Organ, and a delegate from each of the Consejo Nacional de Trabajadores Organizados (the “National Council of Organized Workers”), which represents unionized workers, and the private business sector. The Executive Organ selects the labor and business delegates from a list of three nominees provided by the National Council of Organized Workers or the private business sector, as the case may be.
In the first half of 2002, the National Dialogue (the discussions among government, the business sector, representatives of workers and opposition parties) resulted in an agreement that earnings on Development Trust Fund investments could be used for general budget support. In 2003 and 2004, the Development Trust Fund transferred $61.9 million of investment earnings to the Central Government. The agreement is reflected in the Fiscal Responsibility Law, which was signed on May 7, 2002. The law sets targets for the ratio of total debt to GDP at 50% and the ratio of external debt to GDP at 35% and provides a mechanism, adjusted to reflect the Republic’s economic growth, to meet those targets over the medium term. To facilitate debt management, the law allows the Republic to invest up to 100% of the principal of the Development Trust Fund in Panamanian bonds. The law also provides for up to $200 million in spending of Trust Fund principal on several large infrastructure projects, designed to stimulate
D-28
employment starting in 2003. These projects include the widening of the Inter-American highway for $69 million, road and canal rehabilitation projects for $28 million, irrigation projects for $30 million, and projects aimed at improving the supply of potable water and the sewage system for $70 million. In 2004, the Development Trust Fund disbursed $34.1 million for water and sewage system projects.
In October 2004, the National Assembly approved Law No. 52, which further amends the law creating the Development Trust Fund and reallocates certain funds from the Development Trust Fund to new projects, including aid for neighborhoods destroyed by floods in September 2004.
As of December 31, 2004, audited financial statements showed a balance of $1.216 billion in the Development Trust Fund. This is a slight decrease from the December 2003 balance of $1.260 billion.
The Ministry of Economy and Finance has signed an agreement with three asset managers that permits the asset managers to manage and invest part of the principal of the Development Trust Fund. The asset managers are Goldman, Sachs, Morgan Stanley and BlackRock. The agreement transferred $271.0 million to each manager to invest in global and U.S. domestic securities. The Bank of New York has been appointed global custodian of the funds administered by the asset managers.
The Government has taken other steps in recent years to reduce its direct role in the economy. These include the elimination of price controls and certain import restrictions as well as a general reduction in tariffs. At the same time, the Government has implemented various measures intended to facilitate the operation of the private sector, including the adoption of the LUIT and an antitrust and consumer protection law. See “—Other Legislation Related to Economic Reform—Economic Regulatory System.”
Principal Operations and Privatization of Public Sector Enterprises
Electric Power. Created in 1969, IRHE was the autonomous state entity having exclusive control of the electricity sector in Panama. IRHE was responsible for the planning, coordination and supervision of programs for electricity generation, transmission and distribution, as well as conservation of energy resources. Electric rates were set by IRHE; however, since the privatization of IRHE in 1998, the successors to the assets and liabilities of IRHE have set their own rates, which are subject to review by the Ente Regulador de Servicios Publicos (“ERSP”). See “—Other Legislation Related to Economic Reform —Public Services Law.”
Pursuant to legislation authorizing the restructuring and privatization of IRHE, the company was split into nine corporate entities with 100% of the stock of each owned initially by the Government. These entities included three hydroelectric generating companies, one thermoelectric generating company, four distribution companies and a transmission company as successors to the assets and liabilities of IRHE under the privatization scheme. Following completion of the restructuring, a public bidding process commenced to sell 51% (or more) of the stock in each of the thermoelectric and distribution companies and up to 49% of the hydroelectric companies. The law states that up to 10% of the stock of each company will be made available for the benefit of employees. In October 1998, 51% of the stock of three IRHE distribution companies; in January 1999, 49% of the stock of the hydroelectric generating companies, and 51% of the stock of the thermoelectric generating company was sold. Panama received $604 million in the aggregate for the shares. Pursuant to the law, the transmission company remains 100% state-owned.
Panama currently has high electric rates (an average of 12.1 cents per KWh as of December 31, 2004), and demand for electricity is currently growing at an estimated average rate of 4.8% from 2003. As of December 31, 2004, Panama had an installed generating base of 1,508.2 MW, of which 846 MW was hydroelectric and 662.2 MW was thermoelectric. In November 2003, Hidroelectrica Esti initiated operations of two hydroelectric plants in the province of Chiriqui that generate a base load of 120 MW. In 2004, total energy generation in the wholesale market increased 3.3% from 2003, and Panama registered a gross generation of 5,760.4 GWh, of which 3,778.5 GWh was hydro-electrically generated and 1,981.9 GWh was thermoelectrically generated.
D-29
Telecommunications. INTEL was the state-owned telecommunications company with a monopoly over local and long distance landline service.
In 1997, the Ministry of the Treasury auctioned 49% of INTEL’s stock. Cable & Wireless of the United Kingdom won the public auction by bidding $652 million for the shares. INTEL was subsequently renamed C&W Panama. Although Cable & Wireless is not a majority owner of C&W Panama, it has operational and managerial control of C&W Panama. The Republic retains 49% of the shares of C&W Panama, and the remaining 2% of the shares of C&W Panama are held in a trust fund for C&W Panama’s unionized employees. There are currently no plans for the sale of Panama’s remaining 49% interest in C&W Panama. See “The Panamanian Economy—Reforms and Development Programs.” INTEL was historically profitable and regularly paid dividends to the Central Government. Those dividends averaged approximately $103 million per year during the 1990-1996 period, but have decreased significantly following privatization, in part because Panama holds only 49% of the shares of C&W Panama.
Cable & Wireless’ concession to manage C&W Panama lasts 20 years and is renewable for ten additional years. The C&W Panama board of directors approved a $572 million capital expenditure program to expand and upgrade C&W Panama’s telephone system between 1998 and 2003. Cable & Wireless will be subject to monetary penalties if C&W Panama’s service does not reach certain specified goals. As of December 2001, C&W Panama had not accomplished its goals. As a result, the ERSP levied a fine of $10.0 million on Cable & Wireless for non-fulfillment of its goals. Cable & Wireless has stated that it believes that it has met the goals, and has appealed the fine to the Supreme Court. As of December 31, 2004, the Court had not yet announced its decision.
On December 31, 2002, the exclusive landline telephony service concessions granted to C&W Panama expired, leaving the local and long distance telecommunications market open to competition from other providers effective January 1, 2003. As of December 31, 2004, over 60 companies had entered the telecommunications market.
In the area of cellular telephone service, in July 1995, the Assembly adopted legislation that reserved the B band for development by INTEL and permitted the Government to grant a concession for a competing system on the A band. In February 1996, the Government granted the A band concession for a period of 20 years to the BellSouth Consortium for $72.6 million; commercial operations began in June 1996. In October 1997, the Government granted the B band concession to C&W Panama for cellular telephone service for a period of 20 years for $72.6 million; commercial operations began in December 1997.
In October 2001, the Assembly modified Law No. 88 of 1961 to eliminate the tax charge on international calls. This modification aimed to make Panama more attractive as an international call center. This benefit applies only to the installation and operation of commercial use call center companies. Companies that plan to invest in call center concessions in Panama will be regulated by ERSP.
In June 2002, the Assembly approved Law No. 32, which ratifies the Central American Telecommunications Treaty signed by Panama, Costa Rica, El Salvador, Guatemala, Honduras and Nicaragua in August 1995. The treaty facilitates the integration and development of telecommunications facilities across Central America.
As of December 31, 2004, there were approximately 376,081 telephone lines in the country with a line penetration rate of approximately 11.9 lines per 100 inhabitants. As of December 31, 2004, there were 855,852 subscribers to cellular telephone service.
Water. The national water and sewage utility is the Instituto de Acueductos y Alcantarillados Nacionales, or IDAAN, which serves approximately 83% of the population for which it is responsible (which constitutes 70% of the total population) through its 46 water purification plants, 4 filtration galleries, 149 pumping stations, 554 underground sources and 5 water wheels. Inefficiency in IDAAN’s operations and management, combined with leakage, has accounted for an annual water loss of 44%. Unlike INTEL and IRHE, which had generally paid dividends to the Government on an annual basis prior to privatization and required no Government funding, IDAAN has required periodic transfer payments from the Government in order to meet its operating and capital expenses.
D-30
In 1997 and 1998, the legal framework for the privatization of IDAAN was put in place, but the Government decided in September 1999 not to privatize the company. IDAAN has been reorganizing and modernizing following the passage of Law No. 77 of 2001, which granted IDAAN autonomy and financial independence from the central Government. In 2003, the Government initiated a $20.9 million water optimization program for the areas of Panama City, Colón, Chorrera and Arraijan. As of December 31, 2004, $5.9 million had been disbursed under this program. In 2003, the Government also began designs for the rehabilitation and renovation of the Federico Guardia Conte water purification plant at a total cost of $48.8 million. As of December 31, 2004, $6.7 million of this amount had been disbursed for the rehabilitation and renovation of the plant.
IDAAN periodically conducts a bidding process for water infrastructure projects. At December 31, 2004, approximately $189.3 million had been allocated to the construction of water purification plants and distribution plants. Under the Fiscal Responsibility Law, $70 million was approved for investment in water projects. As of December 2004, the entire $70 million had been allocated to the construction of water purification plants and distribution lines.
Ports. In 1997, the Pérez Balladares administration undertook the initiative to restructure the National Port Authority (“APN”), which owned or controlled most of Panama’s ports. In February 1998, a restructured successor entity, the Panama Maritime Authority (“AMP”), took over the APN’s functions.
Principal APN ports were subject to rigid labor statutes that rendered them less efficient than private sector ports and certain foreign ports. APN participated in several privatization initiatives from 1993 to 1997 involving granting concessions to operate existing port facilities (with the infrastructure to remain Government-owned) and to develop new facilities, principally in the former Canal Zone.
The first concession, for a new container port, was granted in December 1993 to a joint venture formed between Stevedoring Services of America and Motores Internacionales, S.A. This venture invested $130 million in the former U.S. military base at Coco Solo and inaugurated the Manzanillo International Terminal (“MIT”) in April 1995. In MIT’s first year of operation, it handled approximately 300,000 TEUs (20-foot equivalent units) and reduced shipping costs to and from Asia by approximately 33%. A second phase expansion of MIT, valued at approximately $100 million, was completed in June 2001. In 2004, MIT handled approximately 1,473,159 TEUs, or 10,887,376 metric tons, of cargo and containers.
In 1995, the Government awarded a concession to Evergreen International, S.A. (“Evergreen”), a subsidiary of the Evergreen Group of Taiwan, for the development of a new container port in Colón. The initial investment was for $80 million and Evergreen began operations in the fourth quarter of 1997. In 2000, 2001, 2002, 2003 and 2004 the container port in Colón moved 1,015,626, 1,181,869, 1,706,548, 2,248,133 and 3,032,785 metric tons, respectively.
In February 1998, Panama granted a renewable, 25-year concession to the Panama Canal Railway Co., a joint venture between two U.S. corporations, Kansas City Southern Industries, Inc. and MI-JACK Products, Inc., to renovate and reopen the trans-isthmus railway, principally for connecting the container ship ports on both coasts. Under the terms of this concession, this joint venture is required to pay to the Government 5% of its profits until it recovers its initial investment; after recovery of its initial investment, it will be required to pay the Government 10% of its profits. Passenger and container transport services were initiated in September and October 2001, respectively. In 2004, the railway moved approximately 888,106 metric tons of containers, an increase of 46.8% from 604,889 metric tons in 2003. See “The Panama Canal—Reversion of the Canal Area to Panama.”
On March 1, 1997, pursuant to a concession granted in November 1996, Panama Ports Company, a subsidiary of Hutchinson Whampoa, Ltd. of Hong Kong, assumed operation of the principal existing APN ports at Balboa and Cristobal at the entrances to the Panama Canal. Annual payments to the
D-31
Government under this renewable, 25-year concession were set at approximately $22.2 million plus 10% of revenues. In addition, an initial up-front grant to the Government of 10% of the shares in the operating company was required under the concession. In June 2002, Panama agreed to cancel the $22.2 million annual rental payments in view of Hutchinson Whampoa’s investments in terminal expansion, but in September 2005 the Torrijos administration overturned the decision. The Panama Ports Company will pay the Government $102 million in back fees and proceed with its $1 billion ports expansion program.
Banking. The public banking sector is made up of four institutions: Banco Nacional de Panama (“BNP”); Caja de Ahorros (a savings bank); Panama’s agricultural development bank, Banco de Desarrollo Agropecuario (“BDA”); and the national mortgage bank, Banco Hipotecario Nacional (“BHN”). In accordance with the laws that govern these banks, the Government is responsible for the liabilities of all four institutions. BNP is the country’s largest deposit-taking financial institution and Caja de Ahorros is among the largest. Collectively, they had approximately 12.9% of the deposits and 12.2% of the assets in the national banking system as of December 31, 2004. As of December 31, 2004, the Government had not announced any plans to privatize these financial institutions. The Government is planning to increase the operational efficiency of BDA. See “Financial System—Public Sector Banking Institutions.”
Other Privatizations
In July 1992, the Assembly enacted the legal framework for a privatization program for various state-owned entities other than the ports, IRHE, IDAAN and INTEL. Under this privatization law, the privatization of public enterprises could be effected in one of four ways: (i) transforming state enterprises into regular stock corporations, and subsequently selling all of their shares to the private sector; (ii) transforming state enterprises into mixed capital companies whose capital is divided between the Government and the private sector, and in which the Government retains a minority participation; (iii) selling operating concessions; or (iv) leasing or selling the assets of the public enterprises. Since 1990, the Government has privatized 17 companies in various industries. Together with funds from the sale of shares in INTEL, the IRHE successor companies and the cellular telephone concession, a total of approximately $1.6 billion had been raised as of December 31, 2004 from toll road concessions, a concession for Panama City’s racetrack, Hipódromo Presidente Remón, casinos and slot machines concessions, and the sale of two sugar mills.
In January 2003, Panama decided not to privatize the Tocumen International Airport, located outside Panama City. On January 29, 2003, the Assembly enacted legislation to create the Civil Aeronautic Authority, an autonomous state entity that will oversee civil aviation in Panama. The Assembly also approved accompanying legislation aimed at the development and maintenance of Panama’s airport facilities, including measures to improve operating efficiency. In June 2003, control over the airport was transferred from the Civil Aeronautic Authority to Aeropuerto Internacional de Tocumen, S.A., a state-owned corporation established to manage and operate the airport pursuant to Law No. 23, also enacted on January 29, 2003.
D-32
The following table sets forth information on several completed privatizations and concessions:
TABLE NO. 8
Selected Completed Privatizations and Concessions
| | | | | |
Project
| | Date
Completed
| | Purchase Price at
Time of Privatization/
Concession
|
| | | | | (in millions of dollars) |
Hotel Taboga (lodging) | | Nov. 1990 | | $ | 0.6 |
Hotel Washington (lodging) | | Sept. 1991 | | | 2.0 |
Corporación Bananera del Atlántico (bananas) | | Mar. 1992 | | | 6.8 |
Proyecto de Palma Aceitera del Baru (vegetable oil) | | Dec. 1993 | | | 6.0 |
Matadero de Azuero (meat processing) | | Dec. 1993 | | | 1.0 |
Cítricos de Chiriquí, S.A. (citrus fruit) | | Dec. 1993 | | | 5.6 |
Empresa Estatal de Cemento Bayano (cement) | | Aug. 1994 | | | 59.7 |
Band A Cellular telephone concession | | Feb. 1996 | | | 72.6 |
INTEL, S.A. (telephones) (49% sale) | | May 1997 | | | 652.0 |
Racetrack concession | | Jul. 1997 | | | 2.2 |
Band B Cellular telephone concession | | Oct. 1997 | | | 72.6 |
Slot machines | | Dec. 1997 | | | 20.0 |
Casinos A | | Jan. 1998 | | | 3.6 |
Casinos B | | Jan. 1998 | | | 3.0 |
Puerto de Coco Solo | | Jan. 1998 | | | 85.0 |
Autoridad Portuaria Nacional | | May 1998 | | | 50.0 |
IRHE | | Jan. 1999 | | | 603.5 |
| | | | |
|
|
Total | | | | $ | 1,646.1 |
Sources: Office of the Comptroller General and Ministry of Economy and Finance.
Other Legislation Related to Economic Reform
Public Services Law
Most public utility services in Panama were under the exclusive control of Government-owned entities for many years. As a prelude to privatization, in January 1996 the Assembly created ERSP, the administrative body entrusted with overseeing water, sewage, telecommunications and electricity services in Panama.
The Assembly granted ERSP broad authority to regulate prices, grant concessions, set quality standards, foster competition, set performance and efficiency standards, supervise compliance by operators, impose fines and resolve conflicts among regulated entities and the public. All decisions adopted by ERSP are subject to judicial review before the Supreme Court.
Economic Regulatory System
In an effort to make the Panamanian economy more open and competitive and to help satisfy requirements for Panama’s accession to the WTO, in February 1996, Panama enacted the Ley para la Defensa de la Competencia (the “Competition Law”), comprising antitrust regulation, consumer protection and antidumping and subsidies provisions. The antitrust provisions of the law are similar in many respects to those of the U.S.; however, the law does not provide for criminal enforcement or mechanisms to break up existing monopolies, and the sanctions mandated by the law are mainly pecuniary.
D-33
The consumer protection provisions regulate a wide spectrum of matters, including product liability and advertising. The dumping and subsidies provisions of the law are based on the Antidumping and Subsidies Agreements administered by the World Trade Organization.
Regulation of these competition matters is under the administrative jurisdiction of the Commission of Free Competition and Consumer Affairs. All Commission decisions are subject to judicial review before one of four circuit courts specifically created for such purpose.
Price Controls
The Government eliminated price controls in Panama and, under the 1996 Competition Law, the Office of Price Control was abolished. The final price controls on agricultural products were also eliminated in 1996.
Intellectual Property
In August 1994, the Assembly passed legislation to help modernize copyright protection. Under the law, authors and their successors are entitled to benefit from their works for a period of 50 years. The law also contains administrative, civil and criminal sanctions for violations. In 1996, the Assembly passed two laws streamlining the registration procedures and rules for granting intellectual property rights and protecting foreign-owned trademarks, patents and copyrights. In addition, the laws provide for three civil circuit courts with jurisdiction over issues relating to intellectual property rights. On January 5, 2004, the Assembly passed legislation authorizing the imprisonment of, and imposition of fines on, persons who violate intellectual property rights.
Foreign Investment in the Private Sector
Foreign investment in Panama has traditionally reflected the dual nature of the economy. There has been significant foreign investment in the internationally oriented service sector, including the CFZ and the banking sector. However, notwithstanding Panama’s history of low inflation and lack of exchange controls and statutory restrictions on foreign investment, foreign investment in Panama’s domestic sectors, principally manufacturing and agriculture, has not been significant. The limited foreign investment is attributable to inadequate public infrastructure and public services, slow progress on economic reforms, overly rigid employment regulations, limited governmental efforts to attract investment and unfavorable trade policies.
The Moscoso administration successfully negotiated free trade agreements with certain Central American countries. The objective was to diversify commercial markets and services in the region, reduce trade barriers, increase investment, promote economic integration and facilitate negotiation of trade issues with the other trading partners. In early 2002, Panama signed an agreement in principle (the “Free Trade Agreement”) with Costa Rica, El Salvador, Guatemala, Honduras and Nicaragua to work towards a Central American free trade zone by 2005. The National Assembly approved the Free Trade Agreement in February 2003. Pursuant to the Free Trade Agreement, Panama and El Salvador signed a bilateral protocol, also approved by the National Assembly in February 2003, which covers about 85% of both countries’ output. In addition, Panama is negotiating similar bilateral protocols with each of Guatemala, Honduras, Costa Rica and Nicaragua. Panama entered into a bilateral trade agreement with the Dominican Republic that became effective in December 2003, after each country ratified a negotiated list of 199 products for inclusion in the agreement. In August 2003, Panama signed a free trade agreement with Taiwan. In February 2004, Panama entered into free trade negotiations with Singapore, which negotiations continued as of December 31, 2004. In November 2003, the United States announced its intention to begin free trade negotiations with Panama. Free trade negotiations with the United States began in the second quarter of 2004 and continued as of December 31, 2004. See “The Panamanian Economy—Reforms and Development Programs.”
D-34
Panama hosted the temporary administrative headquarters of the Free Trade Area of the Americas (“FTAA”) between March 2001 and February 2003. Panama has initiated negotiations with other FTAA country members to locate the FTAA headquarters in Panama.
In 1996, the Government entered into agreements with the U.S. Overseas Private Investment Corporation, the Export-Import Bank of the U.S., MIGA and certain other bilateral agencies of the OECD countries to enable such entities to offer noncommercial risk insurance to foreign investors.
Additionally, the Government has sought to facilitate foreign investment through the Panamanian Trade Development Institute (which provides investors with information, expedites specific projects, leads investment-seeking missions abroad and supports foreign investment missions).
In addition, the development of several designated export processing zones, which offer tax-free status, special immigration privileges and labor laws and license and customs exemptions to manufacturers located within their boundaries, is intended to promote manufacturing investments. Similarly, the Government has allowed the creation of petroleum export zones with tax-free status and exemption from certain government regulations for the production, refining and exportation of petroleum products.
D-35
THE PANAMA CANAL
General
Following Panama’s declaration of independence from Colombia, Panama ratified the Hay/Bunau-Varilla Treaty with the U.S. on December 2, 1903. Under the terms of the treaty, Panama ceded to the U.S. the Canal Zone, a ten-mile wide strip of Panama’s territory, to build, operate, maintain and protect an interoceanic canal across the isthmus, in return for annual payments. The Panama Canal measures 51 miles from the Atlantic to the Pacific side. The former Canal Zone encompasses a land area of 94,385 hectares (364 square miles) and a water surface of 45,594 hectares (176 square miles) and includes military bases, ports, airports, schools, hospitals and housing units.
The Canal plays a significant role in the Panamanian economy. For the years 2000 through 2004, the activities of the Panama Canal Authority (“PCA”) have accounted for an average of over 4.8% of Panama’s GDP. In the Canal’s fiscal year 1996, commercial ocean cargo registered the highest volume in the Canal’s history with 15,187 transits and toll revenue reached $486.7 million. In the Canal’s 2004 fiscal year, canal transits experienced an increase of 6.7% to 14,035 transits from 13,154 transits in 2003 and cargo tonnage increased by 5.4% to 198.4 million long tons from 188.3 million long tons in 2003. From 1996 to 2004, transits through the Canal decreased by 7.6% and cargo tonnage remained virtually equal. In addition to factors such as the development in recent years of alternative land routes and the general downturn of the global economy in the 2001-2003 period, the increasing size of vessels transiting the Canal has led to a decrease in the number of vessels required to transport cargo. However, from 1996 to 2004, toll revenues increased by 55.7%, primarily due to increases in toll charges. In 2004, total toll revenue was $757.7 million, up 13.8% from 2003.
As of December 31, 2004, the Canal’s total work force (which includes temporary and permanent employees) was 9,021. Of the 2004 total work force, 7,977 were permanent workers and 1,044 were temporary workers. See “Employment and Labor—Salaries and Wages.”
The following table sets forth the Canal’s statistical and financial information for fiscal years 2000 through 2004 (each ending on September 30):
TABLE NO. 9
Panama Canal Principal Statistics
| | | | | | | |
Fiscal Year
| | Number of Transits
| | Tolls
(millions of dollars)
| | Long Tons of
Cargo
(millions)
| |
2000 | | 13,653 | | 574.2 | | 193.6 | |
2001 | | 13,492 | | 579.5 | | 193.1 | |
2002 | | 13,185 | | 588.8 | | 187.8 | |
2003 | | 13,154 | | 666.0 | | 188.3 | |
2004 | | 14,035 | | 757.7 | | 198.4 | (P) |
Source: Panama Canal Authority.
The Canal Treaty of 1977
In September 1977, the Governments of Panama and the U.S. signed two treaties with respect to the Canal which became effective on October 1, 1979. The first treaty, known as the Canal Treaty of 1977, terminated all prior treaties between the U.S. and Panama concerning the Canal and abolished the Canal
D-36
Zone, effective in 1979. The Canal Treaty of 1977 also afforded the U.S. the right to continue to manage, operate and maintain the Canal until the expiration of the treaty on December 31, 1999, at which time Panama would assume full responsibility for the Canal and its facilities. The second treaty, known as the 1977 Treaty on the Permanent Neutrality and Operation of the Canal, committed Panama and the U.S. to continue to protect the Canal and to ensure its permanent neutrality beyond the expiration of the Canal Treaty of 1977. Pursuant to the Canal Treaty of 1977, the U.S., beginning in 1979, gradually transferred former Canal Zone land and facilities to Panama, and on December 31, 1999, Panama acquired full title to the Canal from the U.S.
The Panama Canal Commission and Panama Canal Authority
The Panama Canal Commission
The Canal Treaty of 1977 dissolved the former Panama Canal Company and established the Panama Canal Commission (“PCC”), a binational agency of the executive branch of the U.S. government charged with managing and operating the Canal until the expiration of the Treaty on December 31, 1999. Following the transfer of the Canal to Panama on December 31, 1999, the PCC was closed. The PCC was supervised by a nine-member Board of Directors. Five members were nationals of the U.S. and four were Panamanian citizens nominated by the Panamanian Government and approved by the U.S. government. From 1990 to 1999, the Administrator of the PCC was a Panamanian. The PCC’s primary mission was to service world shipping by operating the Canal in an efficient and orderly manner, while also ensuring the smooth and orderly transfer of the Canal to Panama on December 31, 1999.
Pursuant to the Canal Treaty of 1977, the Canal was expected to be operated by the PCC on a not-for-profit basis and its income was not to exceed its costs. The PCC was expected to recover through tolls and other revenues all costs of operations, maintenance and Canal improvements. The PCC’s operation of the Canal was conducted on a self-financing basis. The PCC independently set the Canal’s tolls.
The PCC’s long-term investment planning was designed to ensure that reliable and efficient service was continually provided and was based primarily on future traffic projections. Investment was financed with PCC resources derived from toll and other revenues. The Canal had operated for many years at close to capacity in terms of transits, and the PCC’s goal was to increase capacity to avoid backlog and permit overhaul work. In this regard, the PCC (and later, the PCA, which assumed management of the Canal from the PCC on December 31, 1999) began several major Canal improvement projects, including the widening of the Canal’s Atlantic entrance; the widening of the Gaillard Cut (the narrowest point in the Canal) to permit two-way traffic; and the overhaul of the Gatun, Miraflores, and Pedro Miguel locks. In November 2001 the PCA completed the widening of the Canal’s Gaillard Cut, a project that the PCC had begun in 1992. The total cost of the project was approximately $232.3 million. Other major maintenance programs, such as the overhaul of the locks, have been successfully completed. The PCA initiated the deepening and dredging of Gatun Lake and the Gaillard Cut in 2002. The cost of this project is estimated to be approximately $171.5 million. As of December 31, 2004, approximately $46.4 million, or 27.1%, of the project cost had been advanced. The project is scheduled to be completed in 2009.
The Panama Canal Authority
Recognizing the importance of the Canal to Panama, the Government took a number of actions to ensure that the Canal would continue to operate efficiently following its reversion to Panama in 1999. A 1994 Constitutional amendment created the PCA, an autonomous public entity which assumed management of the Canal from the PCC on December 31, 1999. The PCA’s annual budget must be prepared in accordance with a three-year financial plan and submitted for approval by the Cabinet and the Assembly. Under the terms of the 1994 amendment, this budget is not included in the budget of the Central Government. The revised public-sector accounting practices used by the Torrijos administration (retroactively back to fiscal year 2000) to calculate the non-financial public sector results do not consolidate the net financial results of the PCA with the Government’s own non-financial public-sector results.
D-37
As was the case with the PCC, the PCA makes annual payments to the Central Government based upon the amount of tonnage that transits the Canal. By law, the rate (as measured on a per ton basis) for such payments may not be set at a level that will generate lower payments than those paid to Panama by the PCC on December 31, 1999. The PCA transfers to the Central Government any net surpluses generated by the Canal. In the fiscal year ended in September 2002, the PCA had a surplus of $166.9 million, up from $118.3 million for fiscal year 2001. In fiscal year 2004, the PCA had a surplus of $380.3, up from $258.0 million for fiscal year 2003.
In July 2002, the Panama Canal Authority announced changes in an effort to modernize its toll structure. The first phase of such changes (implemented in October 2002) raised tolls by an average of 8% and the second phase (implemented in July 2003) raised tolls by an average of 4.5%, with actual toll fees based on vessel type and tonnage, and a fee for locomotive usage based on the number of locomotive cables required.
The Panama Canal Authority announced that total revenues for the quarter ending September 30, 2004 were $181.3 million, an increase of 9.7% over the same period in 2003. The increase is attributable to an increase in transits, fees and tonnage flow. Toll revenues for fiscal year 2004, also ending September 30, 2004, reached $757.7 million, an increase of 13.8% over fiscal year 2003. Toll revenues for fiscal year 2003 were $666 million, an increase of 13.1% over fiscal year 2002.
For 1999 and 2000 the Canal’s capital budgets were for $112.1 million and $164.7 million, respectively. Under the Canal’s budget for fiscal year 2001, approximately $198.3 million was allocated to the Canal’s investment program. The PCA investment plan for 2002 through 2004 totaled more than $350 million, of which $126.1 million were incurred during fiscal year 2002, $113.3 million were incurred during fiscal year 2003 and $136.7 were incurred during fiscal year 2004. The Canal investment plan for fiscal years 2004 through 2006 contemplates investments of more than $497 million, and includes such projects as deepening and widening of the Gaillard Cut, the Gatun Lake and the Pacific and Atlantic entrances of the Canal; acquisition of tugboats and towing locomotives; rehabilitation of railways for towing locomotives; and an increase in the capacity of the potable water system. In August 2004, the National Assembly approved the Panama Canal Authority’s budget for fiscal year 2005, allocating $190.7 million to the Canal’s investment plan.
The Panama Canal Authority has been conducting studies with regard to the construction of a third set of locks that will accommodate vessels currently too large to traverse the Canal. When the plans are further developed, the Government intends to call a referendum to seek approval of the Canal expansion project.
On August 15, 2004, the span of the second bridge over the Panama Canal was completed at a total construction cost of $104.1 million.
Reversion of the Canal Area to Panama
Reversion of the Former Canal Zone Properties
In 1993, the Government established the Interoceanic Region Authority (“ARI”) to assist with the orderly transfer of the Canal and the former Canal Zone. ARI is an autonomous Government agency charged with integrating the former Canal Zone properties and resources into the Panamanian economy to enhance the country’s economic and social development. To this end, ARI is responsible for administering and managing the former Canal Zone areas (other than the Canal itself) after their reversion to Panamanian control. By law, the net proceeds from ARI’s activities are deposited in the Development Trust Fund, together with certain of the proceeds generated by the Government’s privatization program. See “Structure of the Panamanian Economy—The Role of the Government in the Economy.”
With financial assistance from the IDB and the assistance of international consultants, ARI developed a Plan of General Use (the “Plan”) regarding redevelopment of the reverted Canal areas, which was adopted by the Assembly in July 1997. Under the Plan, ARI has broad authority to effect the Plan
D-38
without further legislative approval, including the authority to sell and lease property and to grant concessions and contracts. Among the Plan’s objectives are: increasing maritime business; developing manufacturing for exports; expanding tourism; developing one or more educational and research institutions; improving trade and communications infrastructure; and conserving natural resources within the former Canal Zone. The Plan sets forth a general scheme for use and development of the 140,000 hectares (540 square miles) of land and water surface in the former Canal Zone, of which 31,873 hectares (123 square miles) reverted to Panamanian control between 1997 and 2000, and the 7,000 buildings and other structures on this land. The Plan also concerns 234,707 hectares (906 square miles) of land in the Canal watershed that was not part of the former Canal Zone.
ARI has granted significant concessions, and continues to negotiate several concessions, in furtherance of the Plan’s objectives. Pursuant to a concession, to an international consortium, the former U.S. Fort Amador, located on Panama’s Pacific coast adjacent to Panama City, has been redeveloped as a tourist resort with several hotels and cruise ship facilities. The 197.7-acre resort includes shopping malls, restaurants, office buildings, residential developments and a golf course. The development consortium has contractually agreed to invest not less than $300 million through 2006. Additionally, ARI has granted a concession to a Mobil Corporation affiliate to provide fueling services to ships transiting the Canal. This affiliate has agreed to pay, on average, $1.5 million per year for ten years as a concession fee and to invest $25 million in the project.
In July 2004, the National Assembly created a special economic zone at the former U.S. military base of Fort Howard and established an independent agency responsible for administering the zone. The Area Económica Especial Panamá-Pacifico is intended to attract foreign investment and to create jobs by granting preferential tax treatment to businesses involved in such areas as technology, airline repair and maintenance, maritime cargo and transportation logistics.
In February 2002, the Government announced that the German firm Bilfinger & Berger won the bid for the construction of the second bridge over the Panama Canal. The construction of the bridge began in June 2002 and was completed in August 2004 at a cost of $104.1 million. The Government also announced a project to construct two feeder roads that will offer access to the bridge. On September 2, 2005, the feeder roads to the second bridge over the Panama Canal were completed at a cost of $87.2 million.
Other Trans-Isthmus Transportation
The dimensions of the Canal permit much of the world’s commercial maritime fleet to transit. However, certain classes of ships, principally the largest capacity tankers and container ships, are too large to transit the Canal. This limitation, combined with the fact that the Canal has generally operated at capacity in terms of units, has caused the exploration of other trans-isthmus modes of transportation as a means of connecting the Atlantic and Pacific. Two such modes, a railway which was constructed in the former Canal Zone and an oil pipeline constructed outside of the former Canal Zone, exist. Each is discussed below. Additionally, Panama granted a concession in 1994 for construction of a trans-isthmus toll road between Panama City and Colón to Proyectos y Construcciones, S.A. (“PYCSA”), a Mexican consortium. The first of a total of two sections of this road was completed in May 1999 and is in use. As of December 31, 2004, the second phase was behind schedule and still under construction.
Railway
In February 1998, Panama granted a renewable, 25-year concession to the Panama Canal Railway Co., a joint venture between two U.S. corporations, Kansas City Southern Industries, Inc. and MI-JACK Products, Inc., to renovate and reopen the trans-isthmus railway, principally for connecting the container ship ports on both coasts. Under the terms of this concession, this joint venture is required to pay to the Government 5% of its profits until it recovers its initial investment; after recovery of its initial investment, it will be required to pay the Government 10% of its profits. Passenger and container transport services were initiated in September and October 2001, respectively. In 2004, the railway moved approximately 888,106 metric tons of containers, an increase of 46.8% from 604,889 metric tons in 2003. See “—Reversion of the Canal Area to Panama.”
D-39
Oil Pipeline
The trans-isthmus oil pipeline was completed in 1982 and constructed to address the fact that the world’s largest oil tankers could not transit the Panama Canal. The pipeline operated in an eastward direction, in large part to service the market for Alaskan crude oil shipments to oil refineries on the east coast of the U.S. On November 28, 1995, the U.S. Congress rescinded the ban on the exportation of Alaskan crude oil, thereby allowing the export of Alaskan crude oil to Asia and eliminating the need to transport Alaskan crude oil to the east coast of the U.S. by means of the trans-isthmus oil pipeline. In June 1995, the Government signed a contract with Petroterminales de Panama S.A. (a joint venture between the Government and Northville Industries Corp.) allowing Petroterminales de Panama S.A to expand the pipeline’s terminal ports at Chiriquí Grande on the Caribbean and Puerto Armuelles on the Pacific into general cargo ports until 2016. Since November 2003, the pipeline has reopened to fulfill spot contracts for pumping Ecuadorian crude oil across the isthmus for export to the U.S. Gulf Coast.
D-40
THE COLÓN FREE ZONE
The CFZ was created by the Panamanian Government in 1948 to take advantage of Panama’s unique geographic location and to boost trading activity in the province of Colón. The CFZ, located at the Atlantic entrance of the Panama Canal, has developed into the largest duty-free zone in the Western Hemisphere in terms of commercial activity. As of December 2004, approximately 2,619 companies, an increase from 2,381 companies in 2003, use the CFZ service facilities for a variety of trading activities.
In addition to being exempt from tariffs and duties, companies operating in the CFZ enjoy preferential tax treatment. In the past, the income of CFZ companies was taxed at graduated rates from 2.5% to 8.5%. Under the LUIT, such income was to be taxed at a flat 15%. However, significant protests, including a refusal by some CFZ companies to pay taxes, resulted in the elimination of all taxes on international operations income for CFZ companies effective January 1, 1997.
The CFZ has a significant impact on the Panamanian economy. From 2000 through 2004, it contributed an average of 7.1% of GDP and employed an estimated average of 1.3% of the workforce. The value of goods passing through the CFZ is considerable, particularly in relation to the Panamanian economy as a whole. In 2004, total imports to the CFZ were preliminarily estimated at $5.104 billion (up from $4.147 billion in 2003), while total re-exports were $5.395 billion (up from $4.567 billion in 2003). By contrast, Panama’s non-CFZ nonpetroleum merchandise exports were preliminarily estimated at $885.4 million in 2004, while non-CFZ merchandise imports were $3.594 billion in 2004.
In 2000, the share of GDP derived from the CFZ grew to 7.1% from 6.3% in 1999, reflecting an increase of 16.0% in the sector. This increase is primarily attributable to the recovery of South American economies following the Asian, Russian, Brazilian and Argentine financial crises. The contribution of the CFZ to GDP rose by 11.1%, from 7.1% of GDP in 2000 to 7.8% in 2001. This increase was primarily attributable to an increase in merchandise exports and imports as a result of an increase in commercial activities in the CFZ. In 2002, the contribution of the CFZ to GDP decreased to 7.0%, reflecting a 8.6% drop in CFZ activities. This decrease is attributable to a decline in CFZ imports and re-exports, and reflects the impact of the political and economic difficulties facing countries that are the major users of the CFZ.
In 2003, CFZ activity declined 3.1%, reflecting a decrease in GDP contribution from 7.0% in 2002 to 6.5 % in 2003. The contribution of the CFZ to GDP rose by 19.0%, from 6.5% of GDP in 2003 to 7.3% in 2004. This increase is primarily attributable to the economic recovery of South America.
The CFZ’s major competitors are the Miami, Chile, Aruba, Curaçao and Uruguay free trade zones. Traditionally, the CFZ has enjoyed several competitive advantages over certain of its competitors, including the CFZ’s use of the U.S. dollar as legal tender, lack of restrictions on capital movements and access to frequently traveled land, air and sea routes. However, global and regional trends in trade patterns and capital liberalization have begun to narrow several of these competitive advantages and affect the CFZ’s prospects for continued rapid growth.
D-41
EMPLOYMENT AND LABOR
Labor Force
In 2004, Panama’s labor force was preliminarily estimated at 1.36 million (up from 1.32 million in 2003), which represented approximately 42.9% of the total population. In 2004, the service segment (principally consisting of real estate, commerce and tourism, public administration, the Panama Canal, banking, the CFZ and public utilities) employed 63.2% of the employed labor force, compared to 19.1% for the agricultural and mining sector and 17.7% for the industrial sector (consisting of manufacturing and construction).
In 2004, the Government adopted the open unemployment rate as the official indicator of unemployment. The open unemployment rate considers only those persons actively seeking employment. The Government believes that the open unemployment rate produces a better comparison with countries in the region, including the United States, that rely on open unemployment as the official unemployment indicator. Revised unemployment figures using the open unemployment rate are available from 2001. Overall unemployment figures for 2000 indicated an increase in the overall unemployment rate to 13.5%. This increase is partly attributable to the lower participation rate of the population in 2000.
Figures for 2001 indicated an increase in the overall unemployment rate to 14.0% (with an open unemployment rate of 11.2%), which is attributable to an increase in the labor force, as well as job losses in the private sector. The economy had difficulty absorbing large numbers of unskilled workers, particularly those migrating from rural to urban areas. In 2002, the overall unemployment rate and open unemployment rate dropped to 13.5% and 10.9%, respectively. The decrease in the unemployment rate is at least partially attributable to the Government’s adoption of a broader definition of employed persons that includes the self-employed and those engaged in semi-formal employment. Figures for 2003 indicate a decrease in overall unemployment to 13.1% while the open unemployment rate remained stable at 10.9%, which is attributable to improved economic conditions. In 2004, preliminary figures for the overall unemployment rate and the open unemployment rate decreased to 11.8% and 9.2%, respectively. This decrease is partially attributable to a rise in construction projects and the opening of new shopping centers.
Historically, Panama’s unemployment rate has been influenced by the service-oriented nature of the economy, which is not labor intensive. The Moscoso administration introduced programs aimed at reducing unemployment, including Government-sponsored job fairs and a program to train those entering the work force for the first time. In 2004, the Torrijos administration launched an economic plan that seeks to reduce unemployment by increasing foreign trade and investment and initiating programs to enhance education.
Panamanian private sector workers have the legal right to join unions of their choice, subject to the unions’ registration with the Government. Applicable law prohibits anti-union discrimination by employers. At present, approximately 15% of Panama’s total employed labor force is organized. The largest unions exist in the construction industry and among banana plantation workers. Unions engage in collective bargaining, primarily involving the negotiation of wages. Most workers enjoy the right to strike. Excluded from this right, however, are certain public service providers vital to public welfare and security (e.g., police, health, and PCA employees). While there were significant strikes during the economic and political disruptions of the mid- to late-1980s, there have generally been a limited number of strikes in recent years. In 2000, two strikes took place, one involving 15 members of the Central Hotel Union and the other involving 11 members of the Union of Maritime Services Workers. In 2001, there were 10 strikes involving a total of approximately 4,172 workers, with an average of 10.2 lost worker days per striking worker. Three of these strikes were organized by the construction union and involved a total of approximately 170 unionized construction workers. Three of the strikes were organized by banana plantation workers and involved a total of approximately 3,580 union workers. In 2002, there were four strikes involving a total of approximately 2,454 workers with lost worker days averaging 1.4 days per striking worker. All four strikes occurred in the construction sector. In 2003, there were three strikes involving a total of approximately 650 workers with lost worker days averaging 9.4 days per striking
D-42
worker. One strike occurred in each of the following sectors in 2003: agriculture, gaming and forestry; retail and wholesale business; and construction. In 2004, there was one strike in the transportation sector involving a total of approximately seven workers with 17 lost worker days per striking worker.
The following table sets forth certain labor force and unemployment statistics for the years 2000 through 2004:
TABLE NO. 10
Labor Force and Employment
| | | | | | | | | | | | | | | |
| | | 2000
| | | 2001
| | | 2002
| | | 2003
| | | 2004(P)
| |
| | | (thousands of persons) | |
Total Population | | 2,948 | | | 3,004 | | | 3,060 | | | 3,116 | | | 3,172 | |
Working-Age Population | | 1,806 | | | 2,010 | | | 2,054 | | | 2,099 | | | 2,143 | |
Labor Force | | | | | | | | | | | | | | | |
Employed | | 935.3 | | | 1,045.7 | | | 1,111.7 | | | 1,146.6 | | | 1,197.6 | |
Unemployed | | 146.3 | | | 170.6 | | | 173.3 | | | 172.0 | | | 159.7 | |
| | |
|
| |
|
| |
|
| |
|
| |
|
|
Total | | 1,081.6 | | | 1,216.3 | | | 1,285.0 | | | 1,318.0 | | | 1,357.3 | |
| |
| | | (annual percentage change) | |
Total Population | | 4.9 | % | | 1.9 | % | | 1.9 | % | | 1.8 | % | | 1.8 | % |
Working-Age Population | | 2.6 | | | 11.3 | | | 2.2 | | | 2.2 | | | 2.1 | |
Labor Force | | | | | | | | | | | | | | | |
Employed | | (1.7 | ) | | 11.8 | | | 6.3 | | | 3.1 | | | 4.5 | |
Unemployed | | 15.5 | | | 16.6 | | | 1.6 | | | (0.8 | ) | | (7.2 | ) |
| | |
|
| |
|
| |
|
| |
|
| |
|
|
Total | | 0.3 | % | | 12.5 | % | | 5.6 | % | | 2.6 | % | | 3.0 | % |
| |
| | | (in percent) | |
Labor Force: | | | | | | | | | | | | | | | |
Participation Rate(1) | | 59.9 | % | | 60.5 | % | | 62.6 | % | | 62.8 | % | | 63.3 | % |
Employment Rate(2) | | 86.5 | | | 86.0 | | | 86.5 | | | 86.9 | | | 88.2 | |
Total Unemployment Rate | | 13.5 | | | 14.0 | | | 13.5 | | | 13.1 | | | 11.8 | |
Unemployment Rate(3) | | ... | | | 11.2 | | | 10.9 | | | 10.9 | | | 9.2 | |
Of which: | | | | | | | | | | | | | | | |
Metropolitan Area(4) | | ... | | | ... | | | ... | | | 13.4 | % | | 11.1 | % |
| (1) | Total labor force as percentage of working-age population. |
| (2) | Employed labor force as percentage of total labor force. |
| (3) | Open unemployment based on the annual August Employment Survey. The open unemployment rate, which excludes persons not actively looking for employment, was adopted as the official unemployment rate in 2004. |
| (4) | Including the cities of Panama and Colón. |
Source: Office of the Comptroller General and Ministry of Economy and Finance.
Salaries and Wages
Panamanian labor law provides for a basic minimum wage (currently $0.82 to $1.56 per hour, depending upon the worker’s location), minimum benefits and working conditions for employees, including maximum working hours (48 hours/week), specified holidays, vacations, retirement and severance benefits, and health and safety regulations. The Panamanian economy, however, has a substantial informal sector in which some workers earn below the minimum wage and do not enjoy many
D-43
of the benefits required by law. The informal economy, which is estimated to involve approximately one-fourth of the labor force, includes street vendors, operators and employees of unlicensed businesses and certain other self-employed persons. While overall GDP statistics include economic contributions of the informal sector, the Government has not found it feasible to quantify fully the GDP contribution of this sector.
Workers in the Panama Canal Zone were subject to U.S. wage and labor laws rather than Panamanian wage and labor laws. Although Canal Zone workers have been within the jurisdiction of Panamanian laws since the abolition of the Canal Zone in 1979, numerous treaty provisions and legislative and administrative actions have permitted the continuation of separate wage and benefit regimes for Canal Zone workers. Private sector employees rendering services related to the Panama Canal are subject to a significantly higher minimum wage than is applicable in the rest of Panama. PCC employees and civilian employees of the U.S. military were subject to special labor and social security regimes, depending on their nationality and when they were originally employed. By an amendment to the Constitution adopted in 1994, PCA employees did not have their wages or benefits diminished when the PCA assumed control of the Panama Canal on December 31, 1999. In 2004, as a result of these factors, average monthly wages for the PCA were $2,459.87 for full-time workers, nearly five times higher than the average for all Panamanian workers in 2004, and $1,187.94 for temporary workers.
In 2004, average monthly wages in all sectors of the Panamanian economy increased in real terms an average of 1.2%. In 2003, average monthly wages in all sectors of the Panamanian economy increased in real terms an average of 0.7%, reversing a previous trend of decline. Average monthly wages in all sectors of the Panamanian economy decreased in real terms an average of 1.4% in 2002, an average of 1.3% in 2001 and an average of 4.1% in 2000.
In 2000, total public sector wages increased by 23.2%. The increase in public sector wages in 2000 was primarily due to the transfer of the Canal to the government. Total public sector wages decreased by 1.3% in 2001, due to the layoff of approximately 300 employees hired to conduct the country’s census in 2000. In 2002, total public sector wages increased slightly by 0.2%, due to raises in the salaries of Caja de Seguro Social employees. Total public sector wages increased by 2.2% in 2003, primarily due to the entry into effect of previous legislation that mandated an automatic wage increase for workers in a broad range of government sectors such as health, education and agriculture. In 2004, total public sector wages increased by 0.9%, due to an increase in the number of PCA employees.
In 2004, average real private sector wages grew for the second year in a row increasing by 2.3%. In 2003, government statistics showed that average real private sector wages reversed a previous trend of decline, increasing by 0.2% after decreases of 3.9% in 2002, 2.3% in 2001 and 4.7% in 2000. The growth in private sector wages in 2003 and 2004 is reflective of growth in the Panama Canal, CFZ, ports and other sectors.
By law, the minimum wage is subject to review every two years. In July 2000, the minimum wage was increased by a percentage of between 5.2% and 12.8%, depending on the sector. The minimum wage was raised to its current levels by Executive Decree No. 227 dated July 2, 2003. Banana plantation wages declined by 2.8% in 2000, increased by 1.9% in 2001, declined by 4.8% in 2002, further declined by 5.4% in 2003 and declined 20.7% in 2004. As a response to declining exports, banana plantations have reduced their workforces, resulting in a decline in total wages in 2002 and 2003. In 2004, banana plantation wages continued to be adversely affected by reduced exports.
D-44
The following table sets forth a summary of average real monthly wages for the years 2000 through 2004:
TABLE NO. 11
Average Real Monthly Wages
| | | | | | | | | | | | | | | | | | | | |
| | | 2000
| | | 2001
| | | 2002
| | | 2003(R)
| | | 2004
| |
Public Sector: | | | | | | | | | | | | | | | | | | | | |
Central Government | | $ | 530.32 | | | $ | 494.77 | | | $ | 501.22 | | | $ | 507.90 | | | $ | 508.64 | |
Autonomous agencies(1) | | | 835.07 | | | | 857.62 | | | | 839.96 | | | | 867.72 | | | | 881.87 | |
Municipalities | | | 352.86 | | | | 351.04 | | | | 354.02 | | | | 360.19 | | | | 361.26 | |
All Public Sector | | | 633.61 | | | | 625.18 | | | | 626.38 | | | | 640.33 | | | | 646.35 | |
Private Enterprise | | | 468.56 | | | | 457.84 | | | | 439.98 | | | | 440.96 | | | | 451.02 | |
Banana Plantations(2) | | | 428.82 | | | | 436.92 | | | | 415.77 | | | | 393.42 | | | | 312.01 | |
| | |
|
|
| |
|
|
| |
|
|
| |
|
|
| |
|
|
|
All Employees | | $ | 518.93 | | | $ | 512.33 | | | $ | 505.03 | | | $ | 508.39 | | | $ | 514.69 | |
| | | | | |
| | | 2000
| | | 2001
| | | 2002
| | | 2003
| | | 2004
| |
| | | (annual percentage change) | |
Public Sector: | | | | | | | | | | | | | | | | | | | | |
Central Government | | | 12.2 | % | | | (6.7 | )% | | | 1.3 | % | | | 1.3 | % | | | 0.1 | % |
Autonomous Agencies(1) | | | 36.9 | | | | 2.7 | | | | (2.1 | ) | | | 3.3 | | | | 1.6 | |
Municipalities | | | (0.3 | ) | | | (0.5 | ) | | | 0.8 | | | | 1.7 | | | | 0.3 | |
All Public Sector | | | 23.2 | | | | (1.3 | ) | | | 0.2 | | | | 2.2 | | | | 0.9 | |
Private Enterprise | | | (4.7 | ) | | | (2.3 | ) | | | (3.9 | ) | | | 0.2 | | | | 2.3 | |
Banana Plantations(2) | | | (2.8 | ) | | | 1.9 | | | | (4.8 | ) | | | (5.4 | ) | | | (20.7 | ) |
| | |
|
|
| |
|
|
| |
|
|
| |
|
|
| |
|
|
|
All Employees | | | (4.1 | )% | | | (1.3 | )% | | | (1.4 | )% | | | 0.7 | % | | | 1.2 | % |
| (1) | Starting in 2000, includes PCA employees, which raised average salaries in this category. |
| (2) | Calculation includes wages of laborers on independent producers’ farms, and excludes wages of laborers who work 22 or more days in a given month. |
Source: Office of the Comptroller General and Ministry of Labor.
Social Security
Social security benefits covering private sector and public sector employees are provided by Caja de Seguro Social (“CSS”), with additional benefits for public sector employees provided through the Complementary Pension Fund for Civil Servants (“CPF”). CSS administers the CPF. The main sources of CSS revenue are contributions equal to 18% of wages (7.25% paid by employees and 10.75% by employers), Central Government transfers and investment income. In 2004, CSS’s revenues and expenditures (including transfers from the Central Government) amounted to 6.1% and 8.9%, respectively, of GDP, making it the second largest entity in the public sector.
The CSS performs four separate functions: health, pensions and disability (“IVM”), workers’ compensation and program administration. IVM accounts for approximately half of CSS’s revenues and almost 60% of its expenditures. Demographic trends such as an aging population and an increase in the number of pension beneficiaries have contributed to the deterioration in the financial position of IVM.
The annual deficit of IVM for calendar year 2004 was $42.3 million, down from $43.7 million in 2003. Preliminarily, the IVM’s actuarial deficit as of December 31, 2004 was $4.189 billion, or 30.5% of 2004 nominal GDP. At the Government’s request, the International Labor Organization (“ILO”), a U.N.-related organization, completed a study of methods of restructuring and financing IVM in December 1998.
D-45
As of December 31, 2004, the Government had not implemented the recommendations of the ILO study, which include issues relating to financing of the CSS and the future of the CPF, which provides benefits for public sector employees. The Moscoso administration had initiated discussions in the National Dialogue towards reaching a consensus on a restructuring plan that would implement the ILO study’s recommendations regarding the actuarial deficit of the IVM program. As of December 31, 2004, the Torrijos administration had yet to reinitiate discussions in the National Dialogue, but was preparing draft legislation to submit to the National Assembly.
The CPF was created in 1975 to facilitate the payment of pensions to retired public sector employees, including those eligible to receive pensions on the basis of special laws. Certain of the special laws date back to the 1930s when the Government began granting benefits to particular categories of public sector employees. Special laws generally allow retirement before the CSS’s statutory retirement ages (as of December 31, 2004, 62 for men and 57 for women) with pensions of up to 100% of the most recently earned salary. In addition, once the statutory retirement age is reached and CSS pensions are received, the special laws provide additional pensions so as to maintain 100% of the most recently earned salary (up to certain maximums).
To finance the CPF’s pension payments, since 1975, public sector employees have contributed 2% of their salaries to the CPF while their employers have paid 0.3% of their wage bill to cover the CPF’s administrative costs. The number of retirees covered by the CPF has significantly increased, from 8,300 in 1985 to 30,959 in 2000. In 2001 and 2002, the number of such retirees decreased to 30,812 and 30,471, respectively. In 2003 and 2004, the number of such retirees covered by CPF decreased to 29,988 and 29,480, respectively.
In February 1997, the Assembly adopted legislation that reformed the CPF and established the Public Employees Savings Pension Capitalization System (“SIACAP”), a new defined contribution pension plan for most public sector employees. Only public sector employees who retired or were eligible for CPF pensions on or before December 31, 1999 continue to be CPF participants. Other public sector employees were immediately transferred to SIACAP. SIACAP participants have individual accounts funded initially with Government-issued bonds equal to CPF contributions previously made by the participant plus interest at 5% per annum since contribution. In August 1999, the Government issued $395 million aggregate principal amount of such bonds (the “SIACAP Bonds”). Future contributions will be made by participants and the Government as a percentage of the participant’s wages. Because SIACAP is a defined contribution plan, the value of future retirement benefits will depend on the assets in an individual’s account, thus eliminating future unfunded pension liability for the CPF for SIACAP participants. Because SIACAP participants will no longer be making current contributions to the CPF, the CPF will have no revenues and will run annual deficits, although its annual deficits will decline as the number of participants falls. The CPF’s annual deficit, which has been funded by the Central Government, declined from $110.7 million in 2000 to $100.8 million in 2001. The CPF’s annual deficit was $100.0 million in 2002 and $93.2 million in 2003. The CPF’s annual deficit in 2004 was $88.5 million.
The CPF’s actuarial deficit at the end of 2000 was $1.1 billion (or 11.0% of 2000 GDP). At the end of 2001 and 2002, the actuarial deficit had decreased to $966 million or 9.5% of 2001 GDP and $861.2 million or 7.6% of 2002 GDP, respectively. At the end of 2003, the actuarial deficit decreased further to $798.0 million or 6.5% of 2003 GDP. As of December 31, 2004, the actuarial deficit increased to $811.1 million but this deficit represented a reduced 6.3% of 2004 GDP.
Law No. 4 of January 16, 2004 authorized the early retirement of certain qualifying teachers, and it is estimated that the changes will cost the CPF $18 million in 2005.
D-46
PUBLIC FINANCE
Public finance in Panama is heavily influenced by the U.S. dollar-based monetary arrangements in place since 1904. The lack of a printed national currency and the general absence of domestic budgetary financing through the banking system, except to a limited extent, have imposed constraints on fiscal and monetary policy that are not present in countries that can finance their deficits by printing local currency.
Central Government Budget
The Government’s fiscal year is the calendar year. Pursuant to the Panamanian Constitution, responsibility for the preparation of the Central Government budget rests with the executive branch. Under Articles 264 and 267 of the Constitution, the executive branch must submit a budget proposal to the Assembly by October 1 of each year.
Prior to December 31 of each year, the Assembly may accept, reject or suggest revisions to the budget proposal. If the Assembly accepts either the original or a revised budget proposal, it becomes law. If the Assembly rejects the budget proposal or the Assembly suggests revisions to the executive branch budget proposal and the executive branch does not reflect the revisions in the form of a new budget proposal submitted to the Assembly, for most expenditures, the prior year’s budget remains in force until a new budget is approved. For certain limited classes of expenditures, including budgeted debt service payments, the budget proposal must be implemented each year regardless of Assembly action. If the Assembly fails to take action on the budget by December 31 by accepting, rejecting or suggesting revisions, the new budget automatically becomes law on January 1.
The National Assembly approved the 2004 budget on November 17, 2003. The 2004 budget contemplated total expenditures of $6.003 billion, with budget estimates based on an anticipated 3.0% growth in GDP and an anticipated consolidated non-financial public sector deficit of approximately $250 million (or 2.0% of GDP) for 2004. The 2004 budget was planned in accordance with the Fiscal Responsibility Law. Consequently, the 2004 budget was structured on a cash execution basis unlike budgets prior to 2003, which were formulated on a commitment execution basis. The Moscoso administration believed that the cash execution basis would be an improved tool for managing the Government’s public finances. The 2004 budget included investment projects that were executed within the 2004 fiscal period. Under the 2004 budget, the total financial needs for the year were approximately $691.0 million, which included approximately $604 million for public debt service.
In September 2004, the Torrijos administration revised the methodology used by the former Government to calculate the non-financial public sector deficit. The revised methodology used to calculate the 2004 deficit does not include expected BNP dividends, the Panama Canal Authority’s financial results or the savings generated by debt repurchase operations, all of which were included under the previous administration’s methodology. The revised methodology uses cash-based accounting standards.
The 2004 budget allocated public expenditures as follows: 43.6% to the social sector; 4.6% to infrastructure; 20.5% to production/development; 8.5% to general services; and 22.9% to debt service.
D-47
TABLE NO. 12
Budgeted Expenditures of the Central Government by Function
(in millions)
| | | | | | | | | | | | | | | |
Itemization
| | 2000
| | 2001
| | 2002
| | 2003
| | 2004
|
Legislative | | $ | 40.0 | | $ | 40.8 | | $ | 29.4 | | $ | 38.6 | | $ | 45.4 |
Judiciary | | | 39.6 | | | 40.4 | | | 40.2 | | | 41.0 | | | 42.4 |
Administration and Planning | | | 304.1 | | | 157.1 | | | 279.3 | | | 274.5 | | | 318.9 |
Agriculture | | | 88.1 | | | 91.0 | | | 84.9 | | | 83.2 | | | 113.0 |
Public Security | | | 182.5 | | | 193.2 | | | 250.2 | | | 249.3 | | | 265.0 |
Education | | | 499.5 | | | 554.0 | | | 566.2 | | | 552.8 | | | 563.2 |
Housing | | | 30.8 | | | 35.4 | | | 35.8 | | | 27.9 | | | 28.5 |
Industry and Commerce and Services | | | 15.4 | | | 22.0 | | | 25.1 | | | 23.5 | | | 24.8 |
Foreign Affairs | | | 33.9 | | | 31.4 | | | 36.1 | | | 35.8 | | | 38.3 |
Health | | | 377.7 | | | 404.5 | | | 412.9 | | | 445.7 | | | 437.2 |
Labor | | | 14.3 | | | 17.0 | | | 20.1 | | | 17.5 | | | 20.0 |
Transportation | | | 110.5 | | | 142.8 | | | 200.0 | | | 148.8 | | | 216.7 |
Intergovernmental Transfers | | | 265.4 | | | 286.0 | | | 277.1 | | | 310.6 | | | 297.0 |
| | |
|
| |
|
| |
|
| |
|
| |
|
|
Total | | $ | 2,001.8 | | $ | 2,015.6 | | $ | 2,257.3 | | $ | 2,248.7 | | $ | 2,410.3 |
Source: Ministry of Economy and Finance.
In 2004, Panama’s non-financial public sector balance registered a deficit of approximately $691 million, or 5.0% of GDP. The current account with respect to operations of the Central Government registered a deficit of $768.0 million (or 5.6% of nominal GDP) in 2004, up from a deficit of $489.2 million (or 3.8% of nominal GDP) in 2003. In 2004, Panama’s non-financial public sector balance registered a deficit of approximately $691.0 million (or 5.0% of nominal GDP), up from $623.4 million (or 4.8% of nominal GDP) in 2003.
In September 2004, the Torrijos administration announced a number of measures to limit the non-financial public sector deficit for 2004, including austerity measures to reduce government expenditures for electricity, insurance, transportation and telecommunications. In October 2004, the National Assembly passed Law No. 51, which suspended in fiscal years 2004 and 2005 the requirement, set forth in the Fiscal Responsibility Law, that the annual fiscal deficit not exceed 2% of GDP. Also in October 2004, the Torrijos administration approved Cabinet Resolution No. 106, which imposed a $2.26 million reduction on government expenditures budgeted for the fourth quarter of 2004.
Taxation
The Panamanian Constitution authorizes the levying and collection of taxes by taxing authorities at both the national and municipal levels. The Central Government collects taxes on personal and corporate income, real property and certain securities. In addition, the Central Government collects import and export duties and a 5% value-added tax on all movables, except food, medicine and other minor items. Municipalities are permitted to collect taxes from sources of a more local nature, such as taxes on public performances, sales of alcoholic beverages, quarry activities and forestry.
Preliminary figures indicate that approximately 59.2% of the Central Government’s revenues in 2004 came from various forms of taxation. Preliminarily, Central Government tax revenues in 2004 were $1.209 billion, an increase of 7.3% over 2003 revenues.
Revenues from income taxes represented the primary component of tax revenues in 2004. Approximately 40.4% of 2004 tax revenues were from income taxes, compared to their 38.6% contribution to 2003’s tax revenues. Income tax revenues increased 12.4% in 2004, rising to $489 million from $435 million in 2003.
D-48
On December 26, 2002, the Assembly approved Law No. 61, which enacts tax reforms aimed at improving and streamlining the administrative and operating procedures of the Directorate of Revenues in order to increase efficiency in tax collection. The approved tax reforms also create a broader tax base through: (1) the extension of value-added tax to services, (2) the increase of effective rates for certain traditionally tax-exempt industries, (3) the establishment of a luxury tax on certain goods and (4) the gradual elimination of tax incentives previously granted to certain sectors of the economy. In addition, the approved tax reforms include an income tax exemption for salaried workers earning $800 or less. Law No. 61 took effect April 1, 2003.
Personal income tax rates range from 4% to 33%, and most such taxes are collected through direct payroll deductions. Corporate income taxes are 30% of non-CFZ income, as a result of the LUIT. Domestic transaction taxes, such as the value-added tax, a tax on petroleum products and tobacco and beverage taxes, made up 35.2% of 2004 tax revenues. The balance of tax revenue comes from duties on foreign trade (17.9% of 2004 tax revenues) and a wealth tax assessed on real estate (6.4% of 2004 tax revenues). The foreign trade duties are overwhelmingly assessed on imports rather than exports. As a result of the LUIT, Panama’s accession to the WTO and free trade negotiations, the rates and computation of various import duties have changed and can be expected to continue to change in the future. See “Foreign Trade and Balance of Payments—Tariffs and Other Trade Restrictions.”
In addition to the changes in corporate tax rates, other tax changes in the LUIT include: eliminating the deductibility of certain non-agricultural investment costs by agricultural enterprises (thus reducing a tax preference for the agricultural sector); initially reducing and then eliminating in 2003 tax credit certificates given to certain exporters of non-traditional exports; restricting a tax exemption to only low-cost housing for real estate capital gains income reinvested in new housing; restricting the deductibility of interest paid on back-to-back credits; and eliminating, in 2000, a 25% income tax credit for certain new investments. The LUIT also introduced a drawback mechanism whereby an exporter, at the time of shipping, can obtain a reimbursement of all taxes paid upon importation on account of products used in the process of manufacturing the exported goods.
In addition to Central Government and municipal taxes, other public sector entities also have taxing authority. These include CSS, whose various taxes and assessments generally equal approximately 7.25% of an employer’s wage bill, and an education tax equal to 1.25% of an employer’s wage bill, each as of December 31, 2004.
Revenues and Expenditures
The following tables set forth the revenues, by source, and expenditures, by sector, of the Central Government and the consolidated non-financial public sector for the years 2000 through 2004. The non-financial public sector includes the Central Government, decentralized agencies and non-financial public enterprises. Decentralized agencies include CSS, principal universities and ARI. Under the terms of the 1994 amendments to the Constitution, the PCA budget is not included in the budget of the Central Government.
D-49
TABLE NO. 13
Central Government Operations(1)
(in millions of dollars)
| | | | | | | | | | | | | | | | | | | | |
| | | 2000(R)
| | | 2001(R)
| | | 2002(R)
| | | 2003(R)
| | | 2004(P)
| |
Revenues: | | | | | | | | | | | | | | | | | | | | |
Tax Revenues: | | | | | | | | | | | | | | | | | | | | |
Income tax | | $ | 494 | | | $ | 454 | | | $ | 452 | | | $ | 435 | | | $ | 489 | |
Other direct taxes | | | 53 | | | | 61 | | | | 56 | | | | 84 | | | | 77 | |
Taxes on foreign trade | | | 202 | | | | 172 | | | | 184 | | | | 200 | | | | 217 | |
Taxes on domestic transactions | | | 371 | | | | 351 | | | | 359 | | | | 408 | | | | 426 | |
| | |
|
|
| |
|
|
| |
|
|
| |
|
|
| |
|
|
|
Total | | | 1,120 | | | | 1,039 | | | | 1,051 | | | | 1,127 | | | | 1,209 | |
Nontax Revenues: | | | | | | | | | | | | | | | | | | | | |
Panama Canal | | | 142 | | | | 141 | | | | 152 | | | | 145 | | | | 158 | |
Oil Pipeline | | | | | | | | | | | | | | | 0 | | | | 1 | |
Transfers from balance of public sector | | | 341 | | | | 252 | | | | 212 | | | | 207 | | | | 198 | |
Other(2) | | | 482 | | | | 459 | | | | 544 | | | | 484 | | | | 459 | |
| | |
|
|
| |
|
|
| |
|
|
| |
|
|
| |
|
|
|
Total | | | 965 | | | | 852 | | | | 908 | | | | 836 | | | | 815 | |
Current Revenues | | | 2,085 | | | | 1,890 | | | | 1,959 | | | | 1,962 | | | | 2,024 | |
Grants-in-Aid | | | 4 | | | | 1 | | | | 0 | | | | 0 | | | | 0 | |
Capital Revenues | | | 1 | | | | 59 | | | | 1 | | | | 36 | | | | 18 | |
| | |
|
|
| |
|
|
| |
|
|
| |
|
|
| |
|
|
|
Total Revenues | | | 2,090 | | | | 1,950 | | | | 1,960 | | | | 1,998 | | | | 2,042 | |
Expenditures: | | | | | | | | | | | | | | | | | | | | |
Current Expenditures: | | | | | | | | | | | | | | | | | | | | |
Wages and Salaries(3) | | | 642 | | | | 674 | | | | 696 | | | | 728 | | | | 762 | |
Goods and Services | | | 178 | | | | 172 | | | | 147 | | | | 179 | | | | 208 | |
Pensions and Transfers | | | 615 | | | | 562 | | | | 568 | | | | 560 | | | | 739 | |
of which: | | | | | | | | | | | | | | | | | | | | |
Social Security Agency | | | 346 | | | | 298 | | | | 280 | | | | 282 | | | | 376 | |
Decentralized agencies | | | 85 | | | | 93 | | | | 92 | | | | 93 | | | | 98 | |
Public enterprises | | | 2 | | | | 3 | | | | 2 | | | | 2 | | | | 0 | |
Nonconsolidated agencies | | | 182 | | | | 169 | | | | 194 | | | | 184 | | | | 265 | |
Interest: | | | | | | | | | | | | | | | | | | | | |
Internal | | | 122 | | | | 94 | | | | 66 | | | | 90 | | | | 102 | |
External | | | 363 | | | | 406 | | | | 442 | | | | 470 | | | | 491 | |
| | |
|
|
| |
|
|
| |
|
|
| |
|
|
| |
|
|
|
Total | | | 485 | | | | 500 | | | | 508 | | | | 560 | | | | 593 | |
Other Current Expenditures | | | 45 | | | | 66 | | | | 54 | | | | 54 | | | | 53 | |
| | |
|
|
| |
|
|
| |
|
|
| |
|
|
| |
|
|
|
Total Current Expenditures | | | 1,965 | | | | 1,974 | | | | 1,973 | | | | 2,081 | | | | 2,355 | |
Capital Expenditures: | | | | | | | | | | | | | | | | | | | | |
Fixed Capital Formation | | | 223 | | | | 243 | | | | 284 | | | | 332 | | | | 358 | |
Transfers of Capital: | | | | | | | | | | | | | | | | | | | | |
To decentralized agencies | | | 54 | | | | 75 | | | | 48 | | | | 74 | | | | 97 | |
Other | | | 5 | | | | 37 | | | | 10 | | | | 6 | | | | 47 | |
| | |
|
|
| |
|
|
| |
|
|
| |
|
|
| |
|
|
|
Total | | | 54 | | | | 75 | | | | 48 | | | | 74 | | | | 97 | |
Total Capital Expenditures | | | 277 | | | | 318 | | | | 332 | | | | 406 | | | | 455 | |
Total Expenditures | | | 2,242 | | | | 2,292 | | | | 2,305 | | | | 2,487 | | | | 2,810 | |
Current Account Balance (deficit)(4) | | | 124 | | | | (83 | ) | | | (14 | ) | | | (119 | ) | | | (331 | ) |
Overall Balance (deficit) | | | (152 | ) | | | (342 | ) | | | (345 | ) | | | (489 | ) | | | (768 | ) |
Of which: Capitalization of Interest | | $ | 26 | | | $ | 28 | | | $ | 4 | | | $ | 1 | | | $ | 1 | |
| (1) | Figures exclude savings generated by Brady Bond repurchase operations and anticipated dividends of the National Bank of Panama. |
| (2) | Includes other non-tax revenue, interest received from the Development Trust Fund as a result of privatizations beginning 1997 and dividends. Includes $200 million in June 2001 as an advance payment of interest of the Development Trust Fund. |
| (3) | Includes severance payments and back pay of wages. |
| (4) | Including grants-in-aid. |
Sources: Office of the Comptroller General and Ministry of Economy and Finance.
D-50
TABLE NO. 14
Consolidated Non-Financial Public Sector Operations
(in millions of dollars)(1)
| | | | | | | | | | | | | | | | | | | | |
| | | 2000(R)
| | | 2001(R)
| | | 2002(R)
| | | 2003(R)
| | | 2004(P)
| |
Revenues: | | | | | | | | | | | | | | | | | | | | |
General Government | | | | | | | | | | | | | | | | | | | | |
Central Government | | $ | 1,976 | | | $ | 1807 | | | $ | 1,883 | | | $ | 1,901 | | | $ | 1,964 | |
CSS | | | 742 | | | | 734 | | | | 725 | | | | 725 | | | | 796 | |
Consolidated agencies | | | 80 | | | | 84 | | | | 88 | | | | 78 | | | | 79 | |
| | |
|
|
| |
|
|
| |
|
|
| |
|
|
| |
|
|
|
Total | | | 2,821 | | | | 2,625 | | | | 2,714 | | | | 2,704 | | | | 2,839 | |
Public Enterprises Operations Surplus | | | 80 | | | | 100 | | | | 103 | | | | 91 | | | | 90 | |
Nonconsolidated Agencies Surplus | | | (69 | ) | | | (2 | ) | | | (31 | ) | | | 22 | | | | 25 | |
Education Tax Surplus | | | (16 | ) | | | (2 | ) | | | (6 | ) | | | 3 | | | | 13 | |
Capital Revenues | | | 63 | | | | 87 | | | | 30 | | | | 49 | | | | 28 | |
Donations | | | 4 | | | | 1 | | | | 0 | | | | 0 | | | | 0 | |
| | |
|
|
| |
|
|
| |
|
|
| |
|
|
| |
|
|
|
Total | | $ | 2,860 | | | $ | 2,809 | | | $ | 2,963 | | | $ | 2,869 | | | $ | 2,995 | |
Expenditures: | | | | | | | | | | | | | | | | | | | | |
General Government | | | | | | | | | | | | | | | | | | | | |
Central Government | | | 1,168 | | | | 1,175 | | | | 1,156 | | | | 1,235 | | | | 1,388 | |
CSS | | | 906 | | | | 983 | | | | 1,055 | | | | 1,104 | | | | 1,151 | |
Consolidated agencies | | | 154 | | | | 147 | | | | 153 | | | | 149 | | | | 153 | |
| | |
|
|
| |
|
|
| |
|
|
| |
|
|
| |
|
|
|
Total | | | 2,228 | | | | 2,305 | | | | 2,364 | | | | 2,488 | | | | 2,692 | |
Capital Expenditures | | | 359 | | | | 384 | | | | 399 | | | | 532 | | | | 502 | |
| | |
|
|
| |
|
|
| |
|
|
| |
|
|
| |
|
|
|
Total | | | 2,587 | | | | 2,689 | | | | 2,763 | | | | 3,020 | | | | 3,194 | |
Balance(2) | | | 273 | | | | 120 | | | | 29 | | | | (151 | ) | | | (199 | ) |
External Debt Interest Paid | | | 341 | | | | 381 | | | | 440 | | | | 471 | | | | 491 | |
Surplus/Deficit | | | (68 | ) | | | (261 | ) | | | (411 | ) | | | (622 | ) | | | (690 | ) |
Capitalization of Interest | | | 26 | | | | 28 | | | | 4 | | | | 1 | | | | 1 | |
Overall Surplus (deficit) | | $ | (94 | ) | | $ | (289 | ) | | $ | (415 | ) | | $ | (623 | ) | | $ | (691 | ) |
Percentage of GDP (nominal)(3) | | | 0.8 | % | | | (2.4 | )% | | | (3.4 | )% | | | (4.8 | )% | | | (5.0 | )% |
| (1) | Figures exclude savings generated by Brady Bond repurchase operations, anticipated BNP dividends and the operational surplus of the Panama Canal Authority. |
| (2) | Excluding external interest payments. |
| (3) | Nominal GDP figures reflect a revised base year of 1996. |
Sources: Office of the Comptroller General, Ministry of Economy and Finance and other public institutions.
International Reserves
Because Panama uses the U.S. dollar as legal tender and prints no domestic paper currency, Panama does not have foreign currency reserves in the conventional sense. In Panama, unlike in other countries, foreign currency reserves are not necessary for providing the private sector economy foreign currency to pay for imports or for supporting exchange rates for a domestic currency. Panama’s foreign currency reserves are generally considered to consist of BNP’s U.S. dollar-denominated foreign assets. As of December 31, 2004, BNP’s foreign assets declined to $611.4 million (from $992.9 million as of December 31, 2003), due primarily to the reallocation of certain foreign assets to domestic investments deemed to be more advantageous, including an eleven-year $350 million loan to the Government at an interest rate of 6.5%. Neither BNP nor the Government currently has gold reserves.
D-51
The following table sets forth certain information regarding Panama’s international reserves at the dates indicated:
TABLE NO. 15
International Reserves
(in millions of dollars)
| | | | | | | | | | | | | | | |
| | | December 31,
|
| | | 2000
| | 2001
| | 2002
| | 2003
| | 2004
|
Gold | | $ | 0.0 | | $ | 0.0 | | $ | 0.0 | | $ | 0.0 | | $ | 0.0 |
Foreign Exchange(1) | | | 890.5 | | | 1,143.1 | | | 1,198.8 | | | 992.9 | | | 611.4 |
Reserve Position in IMF | | | 11.9 | | | 11.9 | | | 11.9 | | | 11.9 | | | 11.9 |
Special Drawing Rights | | | 1.3 | | | 1.1 | | | 0.0 | | | 0.0 | | | 0.6 |
| | |
|
| |
|
| |
|
| |
|
| |
|
|
Total | | $ | 903.7 | | $ | 1,156.1 | | $ | 1,210.7 | | $ | 1,004.8 | | $ | 623.9 |
| (1) | Foreign assets of BNP. |
Source: IMF and BNP.
D-52
FINANCIAL SYSTEM
The financial service sector represented an increasing percentage of GDP in the years up to 2000, but decreased in recent years. In 2000 and 2001, this sector represented 9.9% and 9.5% of GDP, respectively. Figures for 2002 and 2003 indicate that this sector represented 8.7% and 7.8% of GDP, respectively. In 2004, the financial service sector represented 7.1% of GDP.
The Banking Sector
The banking sector accounts for approximately 79.6% of the financial system’s contribution to GDP. The banking sector’s development has been fostered by the use of the U.S. dollar as the legal tender, the liberal banking law in effect from 1970 to 1998, the current Banking Law enacted in 1998, tax advantages and the large flows of trade fostered by the Panama Canal and CFZ. The most distinctive feature of the banking sector is its international orientation with numerous foreign banks playing an important role.
Banks in Panama are classified into four groups: (i) official banks, which are those owned by the Government and authorized to carry out banking business in the domestic market and abroad; (ii) general license banks, which can undertake domestic or international operations; (iii) international license banks, which do not undertake domestic operations but are authorized to direct, from their Panamanian offices, transactions that are negotiated, carried out or produce their results abroad; and (iv) foreign banks with representative offices, which may not book transactions in Panama. As of December 31, 2004, two of the four official banks, 37 general license banks, 28 international license banks and six representative offices are considered to constitute the banking sector. Of the 37 general license banks, 14 were incorporated in Panama and the rest abroad.
Measured by Panamanian assets, the largest bank based in Panama is Primer Banco del Istmo, S.A., with $4.483 billion in Panamanian assets at December 31, 2004. BNP, with more than $3.143 billion in assets as of December 31, 2004 and Banco Latinoamericano de Exportaciones, S.A. (commonly known as Bladex), with $2.745 billion in Panamanian assets at December 31, 2004, are the second and third largest, respectively. See “—Public Sector Banking Institutions—Banco Nacional de Panama.” The other two of the five largest banks, based on Panamanian assets, are Banco General, S.A. and Banco Continental de Panamá S.A. Primer Banco del Istmo, S.A. and Banco General, S.A. are Panamanian-owned. Foreign banks with substantial Panamanian assets include HSBC Bank USA, Global Bank Corporation and BNP Paribas. The largest international license banks, based on Panamanian assets, are Bancolombia (Panama), S.A., GTC Bank, Inc., Popular Bank & Trust Ltd., ES Bank (Panama) S.A., Banco de la Provincia de Buenos Aires and Banco de la Nación Argentina.
D-53
The following table sets forth information regarding the largest banks in Panama based on their assets as of December 31, 2004, in each of three categories:
TABLE NO. 16
Largest Banking Institutions
(assets in millions of dollars)
| | | |
| | | Panamanian
Assets
|
Official Banks | | | |
Banco Nacional de Panamá(1) | | $ | 3,143.1 |
Caja de Ahorros(2) | | | 1,096.3 |
General License Banks(3) | | | |
Primer Banco del Istmo, S.A. | | | 4,483.3 |
Banco Latinoamericano de Exportaciones, S.A. | | | 2,744.9 |
Banco General, S.A. | | | 2,594.0 |
Banco Continental de Panamá S.A | | | 2,205.1 |
BNP Paribas. | | | 1,836.4 |
HSBC Bank (Panama), S.A. | | | 1,217.0 |
Banco Bilbao Vizcaya (Panama), S.A. | | | 896.2 |
Global Bank Corporation. | | | 811.3 |
International License Banks | | | |
Bancolombia (Panama), S.A | | | 921.2 |
GTC Bank, Inc. | | | 447.7 |
Popular Bank & Trust, Ltd | | | 399.2 |
ES Bank (Panama) S.A. | | | 389.0 |
Banco de la Provincia de Buenos Aires | | | 175.9 |
Banco de la Nación Argentina | | | 102.8 |
| (1) | Also considered a general license bank. |
| (2) | Not considered a part of the banking sector. |
| (3) | Other than BNP and Caja de Ahorros. |
Source: Superintendency of Banks.
Total assets of the banking sector were approximately 166.1% higher in 2004 than in 1990, and approximately 22.4% above their level in 1985. Deposits were approximately 127.9% higher in 2004 than in 1990, and approximately 12.8% below 1985 levels. The number of banks has decreased, with 23 foreign banks leaving the country during the 1987-1989 period, although several have returned and new banks have opened. In 1986, there were 115 banks in Panama; as of December 31, 2004, there were 73 banks.
D-54
The table below sets forth information on the banking sector at December 31 for each of the years 2000 through 2004:
TABLE NO. 17
The Banking Sector
(in millions of dollars)
| | | | | | | | | | | | | | | |
| | | December 31,
|
| | | 2000
| | 2001
| | 2002
| | 2003
| | 2004
|
Assets: | | | | | | | | | | | | | | | |
Liquid Assets: | | | | | | | | | | | | | | | |
Deposits in local banks | | $ | 2,928 | | $ | 1,938 | | $ | 1,410 | | $ | 1,191 | | $ | 1,096 |
Deposits in foreign banks | | | 6,809 | | | 6,809 | | | 6,108 | | | 6,271 | | | 5,925 |
Other | | | 545 | | | 462 | | | 387 | | | 372 | | | 373 |
| | |
|
| |
|
| |
|
| |
|
| |
|
|
Total | | | 10,282 | | | 8,876 | | | 7,905 | | | 7,834 | | | 7,394 |
Loans | | | 21,495 | | | 22,047 | | | 17,897 | | | 17,389 | | | 19,939 |
Investments in Securities | | | 4,339 | | | 5,440 | | | 5,534 | | | 5,398 | | | 5,759 |
Other assets | | | 1,928 | | | 1,690 | | | 1,813 | | | 1,727 | | | 1,512 |
| | |
|
| |
|
| |
|
| |
|
| |
|
|
Total | | | 38,044 | | | 38,053 | | | 33,149 | | | 32,348 | | | 34,604 |
| | |
|
| |
|
| |
|
| |
|
| |
|
|
Liabilities: | | | | | | | | | | | | | | | |
Deposits: | | | | | | | | | | | | | | | |
Internal: | | | | | | | | | | | | | | | |
Official | | | 1,914 | | | 2,037 | | | 2,205 | | | 1,920 | | | 1,795 |
Public | | | 9,001 | | | 9,893 | | | 9,789 | | | 10,230 | | | 11,064 |
Banks | | | 2,960 | | | 1,900 | | | 1,348 | | | 1,135 | | | 1,083 |
| | |
|
| |
|
| |
|
| |
|
| |
|
|
Total | | | 13,875 | | | 13,830 | | | 13,342 | | | 13,285 | | | 13,942 |
External: | | | | | | | | | | | | | | | |
Official | | | 0 | | | 0 | | | 14 | | | 58 | | | 35 |
Public | | | 5,761 | | | 5,379 | | | 5,632 | | | 5,889 | | | 6,240 |
Banks | | | 7,320 | | | 7,389 | | | 5,101 | | | 4,367 | | | 4,318 |
| | |
|
| |
|
| |
|
| |
|
| |
|
|
Total | | | 13,081 | | | 12,768 | | | 10,747 | | | 10,314 | | | 10,593 |
Total | | | 26,956 | | | 26,598 | | | 24,089 | | | 23,599 | | | 24,536 |
Obligations | | | 5,704 | | | 5,961 | | | 4,306 | | | 3,685 | | | 4,472 |
Other Liabilities | | | 1,830 | | | 1,909 | | | 1,205 | | | 1,046 | | | 950 |
| | |
|
| |
|
| |
|
| |
|
| |
|
|
Total | | | 34,490 | | | 34,468 | | | 29,600 | | | 28,340 | | | 29,958 |
Capital and Reserves | | | 3,554 | | | 3,585 | | | 3,549 | | | 4,018 | | | 4,647 |
| | |
|
| |
|
| |
|
| |
|
| |
|
|
Total Liabilities and Capital | | $ | 38,044 | | $ | 38,053 | | $ | 33,149 | | $ | 32,348 | | $ | 34,604 |
Source: Superintendency of Banks.
Banking Law
On February 26, 1998, the President of the Republic, upon authority granted by the Assembly, adopted Law No. 9 of February 26, 1998 (the “Banking Law”), a comprehensive revision and restatement of the 1970 banking law of Panama. The Banking Law became effective on June 13, 1998. Among the significant changes introduced by the Banking Law were the replacement of the National Banking Commission with the Superintendency of Banks, a more independent regulatory agency with greater supervisory powers, the establishment of new minimum capital requirements and the adoption of capital adequacy standards consistent with those contained in the Basle Accord.
D-55
The Banking Law established the Superintendency of Banks as an autonomous agency of the Government with its own assets and independent governance. The principal governing body of the Superintendency of Banks is a five-member board of directors (the “Board of Directors”). Members of the Board of Directors must meet certain minimum qualifications and are appointed by the President, without need for legislative ratification. Board members are appointed to eight-year terms, with the possibility of an additional term, and may be removed only for cause. In order to provide for staggered terms, the initial terms of three of the members of the Board of Directors were for less than eight years. In addition to exercising administrative functions, the Board of Directors is responsible for approving regulations concerning the interpretation and implementation of banking laws and setting capital adequacy standards.
The Banking Law also established the office of the Superintendent of Banks, a full-time government official appointed by the President (again without legislative intervention) for a maximum of two five-year terms. As with the members of the Board of Directors, the Superintendent of Banks must meet certain minimum qualifications and may be removed only for cause. As chief administrative officer of the Superintendency of Banks, the Superintendent of Banks is charged with managing the day-to-day operations of the agency, granting banking licenses, authorizing new branches, ordering intervention and the liquidation of banks, performing banking inspections required by law or ordered by the Board of Directors, overseeing the activities of banks in the system, imposing sanctions and, in general, exercising all powers that are not reserved to the Board of Directors.
All banks operating in Panama, including BNP and other official banks, are supervised by the Superintendency of Banks. BNP and other official banks are also supervised by the Comptroller General.
Under the Banking Law, general license banks must have paid-in capital of not less than $10 million. Additionally, general license banks must maintain a minimum capital of 8% of their total risk-weighted assets. Capital is defined to include primary capital and secondary capital. Primary capital (also known as tier one capital) is comprised of paid-in capital, declared reserves and retained earnings, and secondary capital (also known as tier two capital) includes undeclared reserves, revaluation reserves, general reserves for losses, certain hybrid instruments and certain subordinated indebtedness. Secondary capital may not exceed primary capital. The Superintendency of Banks is authorized to increase the minimum capital requirement percentage in accordance with generally accepted international capitalization standards.
General license banks are required to maintain 30% of their global deposits in liquid assets of the type prescribed by the Superintendency of Banks. In addition, general license banks are required to maintain local assets in Panama in an amount not less than 85% of their local deposits.
Regulations regarding interest rate ceilings in the prior banking law were abolished by the Banking Law. Currently, each bank in Panama fixes the amount of interest that it charges on loans and other facilities. Banks are required to indicate the effective interest rates of loans and deposits in their statements to clients or at a client’s request. Under the Banking Law, deposits from central banks and other similar institutions are immune from attachment or seizure.
Compared to the prior banking law, the Banking Law provides for lower lending limits to a single borrower and certain related parties. Under the new limits, no bank in Panama may make loans, assume obligations or otherwise extend credit or issue guarantees to any one person or group of related persons in excess of 25% of the bank’s total capital. A higher lending limit of 30% of total capital applies to banks whose shares are owned by governmental and private institutions, whose principal office is located in Panama and whose main line of business is lending to other banks.
The Banking Law also provides for additional limitations and restrictions on a bank’s extending credit and issuing guarantees to parties related to such bank. Such related parties include the bank’s officers and directors and certain shareholders owning individually 5% or more of the capital stock of the bank.
D-56
Banks in Panama are subject to inspection by the Superintendency of Banks at least once every two years. Such supervisory powers of the Superintendency of Banks also extend to each bank’s subsidiaries and branches. Each bank is required to file monthly balance sheets and quarterly and annual statements indicating the performance of its credit facilities and other reports and information as prescribed by the Superintendency of Banks. In addition, each bank is required to make available for inspection its accounting records, minutes, reports on cash on hand, securities, receipts and any other reports or documents that are necessary for the Superintendency of Banks to ensure such bank’s compliance with Panamanian banking laws and regulations. Banks subject to supervision may be fined by the Superintendency of Banks for violations of the banking laws and regulations.
Under the Banking Law, the Superintendency of Banks may order the reorganization of a bank without having intervened previously, when it considers this course of action to be in the best interests of the depositors and to guarantee the solvency and continuity of such bank. The Superintendency of Banks has broad powers under the Banking Law to reorganize banks and can require shareholders to pay in additional capital or to authorize the issuance of new shares and their sale to third parties, at prices determined by the Superintendency of Banks. Furthermore, the Superintendency of Banks may require a bank to restructure itself more fundamentally. For example, the Superintendency of Banks may require a bank to merge or consolidate with other banks, negotiate bridge loans, sell or partially liquidate assets and grant security interests in connection with such reorganization. Ultimately, if the reorganization efforts fail, the Superintendency of Banks is empowered to begin the liquidation process.
The Banking Law established an annual supervisory charge to be paid by general license banks equal to $30,000 plus $35.00 per each $1 million in assets, up to a maximum charge of $100,000.00.
Public Sector Banking Institutions
Banco Nacional de Panama
BNP is a commercial bank created in 1904, which also has many functions of a central bank. BNP is responsible for supplying banks operating in Panama with U.S. dollars and has authority to issue and to distribute coins in Panama. BNP is the Government’s banker and financial agent and acts as a clearinghouse for checks and other instruments for all other Panamanian banks. Also, BNP offers a wide range of commercial banking services through its 62 branches throughout Panama. In accordance with the law that governs BNP, the Government is responsible for the liabilities of BNP.
Given Panama’s U.S. dollar-based economy, BNP does not make monetary policy or print paper currency and is not a lender of last resort for Panama. BNP has no direct regulatory authority over Panamanian banks and, under the Banking Law, BNP has no representation in the Superintendency of Banks. BNP does not use rediscount or loan mechanisms with other commercial banks. There are no restrictions on its activities other than those imposed on commercial banks in Panama. BNP, as with other commercial banks, has the ability to make direct loans to the Government as well as to purchase notes issued by Panama. BNP has certain competitive advantages as compared to the rest of the Panamanian banking system in that it enjoys a monopoly on public sector deposits. The Banking Law, however, subjects BNP to regulation by the Superintendency.
BNP is the largest banking institution in Panama in terms of domestic credit, local deposits and savings deposits. At December 31, 2004, total assets of BNP were $3.129 billion, deposits were $566.1 million and loans were $2.074 billion, of which $841.4 million were made to the public sector and $1.233 billion were made to the private sector. The public sector credits primarily consist of loans to the Central Government, one of which was the result of overdrafts by the Central Government during the 1987-1989 period. See “Public Sector Debt—Internal Debt.”
BNP’s financial position has strengthened considerably since the 1987-1989 period, when it had a negative net worth. As of December 31, 2004, BNP’s capital and reserves represented 88.3% of bank deposits and 16.0% of total assets. BNP generated gross income of $60.1 million in 2004, a decrease of
D-57
57% from 2003, and had net income of $11.2 million, a decrease of 87.7% from 2003. This decrease in net income is primarily attributable to the write-off of certain private sector loans made by BNP in prior years at the direction of the Government. There are no laws pertaining to the payment of dividends by BNP to the Central Government. In 2004, BNP paid the Central Government dividends totaling $11.2 million. Of this amount, $7.5 million was in the form of an offset for amounts payable in respect of loans by BNP to the Government and $3.7 million was paid in December 2003, as an advance of 2004 dividends.
The following table sets forth BNP’s balance sheet at December 31 for the years 2000 through 2004:
TABLE NO. 18
Banco Nacional de Panama
Balance Sheet
(in millions of dollars)
| | | | | | | | | | | | | | | | | | | | |
| | | December 31,
| |
| | | 2000
| | | 2001
| | | 2002
| | | 2003
| | | 2004
| |
Assets: | | | | | | | | | | | | | | | | | | | | |
Cash and checks | | $ | 152.4 | | | $ | 141.1 | | | $ | 121.0 | | | $ | 121.6 | | | $ | 111.2 | |
Bank deposits | | | 1,491.7 | | | | 1,567.4 | | | | 1,309.9 | | | | 976.2 | | | | 566.1 | |
| | |
|
|
| |
|
|
| |
|
|
| |
|
|
| |
|
|
|
Total | | | 1,644.1 | | | | 1,708.5 | | | | 1,430.9 | | | | 1,097.8 | | | | 677.3 | |
Loans: | | | | | | | | | | | | | | | | | | | | |
Domestic loans: | | | | | | | | | | | | | | | | | | | | |
Public sector | | | 703.9 | | | | 619.8 | | | | 577.9 | | | | 517.4 | | | | 841.1 | |
Private sector | | | 689.3 | | | | 817.5 | | | | 980.0 | | | | 1,168.6 | | | | 1,232.9 | |
Foreign loans | | | 0.0 | | | | 0.0 | | | | 0.0 | | | | 0.0 | | | | 0.0 | |
Less provisions | | | (17.3 | ) | | | (28.5 | ) | | | (42.1 | ) | | | (41.3 | ) | | | (104.5 | ) |
| | |
|
|
| |
|
|
| |
|
|
| |
|
|
| |
|
|
|
Total (net) | | | 1,375.9 | | | | 1,408.8 | | | | 1,515.7 | | | | 1,644.7 | | | | 1,969.8 | |
Investments | | | 146.6 | | | | 286.4 | | | | 348.9 | | | | 299.0 | | | | 306.0 | |
Net Fixed Assets | | | 37.8 | | | | 35.8 | | | | 36.2 | | | | 38.6 | | | | 40.3 | |
Other Assets | | | 70.6 | | | | 79.0 | | | | 121.4 | | | | 179.6 | | | | 135.8 | |
| | |
|
|
| |
|
|
| |
|
|
| |
|
|
| |
|
|
|
Total | | | 3,275.0 | | | | 3,518.5 | | | | 3,453.2 | | | | 3,259.6 | | | | 3,128.9 | |
| | |
|
|
| |
|
|
| |
|
|
| |
|
|
| |
|
|
|
Liabilities: | | | | | | | | | | | | | | | | | | | | |
Deposits | | | 2,639.7 | | | | 2,848.7 | | | | 2,787.9 | | | | 2,598.2 | | | | 2,479.6 | |
Obligations with Financial Institutions and International Organizations | | | 77.4 | | | | 70.0 | | | | 58.9 | | | | 51.6 | | | | 42.6 | |
Other Liabilities | | | 57.9 | | | | 99.9 | | | | 106.4 | | | | 109.9 | | | | 106.7 | |
| | |
|
|
| |
|
|
| |
|
|
| |
|
|
| |
|
|
|
Total | | | 2,775.0 | | | | 3,018.5 | | | | 2,953.2 | | | | 2,759.6 | | | | 2,628.9 | |
Capital and Reserves | | | 500.0 | | | | 500.0 | | | | 500.0 | | | | 500.0 | | | | 500.0 | |
| | |
|
|
| |
|
|
| |
|
|
| |
|
|
| |
|
|
|
Total Liabilities and Capital | | $ | 3,275.0 | | | $ | 3,518.5 | | | $ | 3,453.2 | | | $ | 3,259.6 | | | $ | 3,128.9 | |
Source: BNP.
Caja de Ahorros
Caja de Ahorros, the state-owned savings bank, has 42 branches throughout Panama. Caja de Ahorros is primarily a mortgage lender specializing in financing medium-income customers. Due to its liquidity position in recent years, however, Caja de Ahorros has begun to promote personal loans. Total assets of Caja de Ahorros at December 31, 2004 were $1.096 billion (a 9.0% increase from 2003). Total deposits in Caja de Ahorros at December 31, 2004 were $134.9 million (a 6.5% decrease from 2003), while total net loans held by Caja de Ahorros at that date were $691.9 million (a 13.3% increase from 2003). Caja de Ahorros had a net loss of $4.6 million in 2004, a decrease of 141.0% from 2003, primarily due to higher loan loss provisions.
D-58
Other Public Sector Institutions
The Panamanian public banking sector includes two other significant institutions. They are BDA, which is the agricultural development bank, and BHN, which is the national mortgage bank. Panama created BDA to provide a source of financing for agricultural development. BDA’s activities have mainly focused on providing financing to medium and small producers. Historically, BDA had experienced significant losses. An external audit was completed in May 2001 to identify ways to improve BDA’s operational efficiency. After evaluating BDA’s loan portfolio, the external audit estimated a possible loss due to unrecoverable loans of up to $9.0 million in principal and $15.4 million in net interest. Under the LUIT, one-half of a surcharge on consumer and commercial loans (which previously was used exclusively to subsidize certain BDA and commercial bank agricultural loans) has been allocated to bolster BDA’s capital. Additionally, the LUIT tightened eligibility for BDA’s subsidized loans. As of December 31, 2004, preliminary figures indicate that BDA had $93.9 million in loans on its books. As of December 31, 2004, the total assets of BDA reached $260.8 million. BDA had net income of $0.43 million in 2004.
Panama created BHN in 1973 to provide a source of financing for national housing projects and foster the development of savings associations. As of December 31, 2004, BHN’s loan portfolio was $136.7 million and its total assets amounted to $389.2 million. BHN had net income of $1.61 million in 2004.
Other Financial System Components
Stock Exchange
In 1990, a private stock exchange, Bolsa de Valores de Panama (“La Bolsa”) was created. While it has had considerable growth, with aggregate trades increasing from $30.6 million in 1991 to $1.343 billion in 2004, La Bolsa remains a small portion of the financial services sector. Its current listings are highly concentrated in domestic private sector fixed-income securities. Equity trades represented only 4% of 2004 trading volume. Most securities issued by the Republic are traded but not listed on La Bolsa.
Insurance
In 1984, Panama adopted legislation intended to foster offshore insurance activity. In July 1996, the Assembly passed a law establishing a new insurance regulatory structure. As of December 2004, there were 18 insurance companies and 1,893 insurance brokerages, and total registered assets of such insurance companies equaled $765.2 million.
Financial Services
A small non-deposit-taking financial services industry exists that provides leasing, consumer durables financing and other small-scale lending. As of December 31, 2004, there were 140 locally incorporated companies participating in this industry, and in 2004 total assets equaled approximately $583.0 million.
D-59
FOREIGN TRADE AND BALANCE OF PAYMENTS
General
Foreign trade plays a significant role in Panama’s economy because of the internationally oriented service sector, the limited scope of domestic manufacturing capability, the lack of significant domestic energy resources (other than hydroelectric) and the limited scope of agricultural production. These factors have made it necessary to import significant amounts of manufactured goods, raw materials and other merchandise. Notwithstanding a history of significant tariff and non-tariff barriers, imports cover a wide range of raw materials and manufactured goods used throughout the economy.
Panama’s net exports of goods and services rose by 12.6% in 2004 compared to 2003. In 2004, Panama’s imports of goods, excluding the CFZ, rose 15.1% compared to 2003.
The largest single category of exports historically has been bananas, which in 1995 represented 33% of total non-petroleum, non-CFZ merchandise exports. Since 1995, bananas have represented a declining percentage of Panama’s non-petroleum, non-CFZ merchandise exports (20.6% in 2000, 16.2% in 2001, 15.4% in 2002, 14.1% in 2003 and 12.2% in 2004).
Shrimp exports have been an important part of non-CFZ merchandise exports, but the level of shrimp exports in recent years has been adversely affected by the shrimp white spot virus disease. In 2001, shrimp exports constituted 9.3% of total non-petroleum, non-CFZ merchandise exports, and increased 18.0% over the previous year. The increase in shrimp exports in 2001 had been attributed to a partial control of the shrimp white spot virus through strict bio-security measures imposed on cultivated shrimp farms and through close surveillance of imported shrimp larvae. However, in 2002, shrimp exports declined 17.3% from 2001 and represented 8.2% of total 2002 non-petroleum, non-CFZ merchandise exports, due to a resurgence of the white spot virus despite such bio-security measures. In 2003, shrimp exports declined slightly by 2.6% and represented 7.1% of total non-petroleum, non-CFZ merchandise exports. In 2004, shrimp exports decreased by 4.8% and represented 6.1% of total non-petroleum, non-CFZ merchandise exports.
Exportation of fish, in particular tuna, has rapidly increased in recent years. In 2003, exports of frozen yellow fin tuna and fresh and frozen fish filets totaled $261.9 million, reflecting a 54.5% increase from $169.5 million in 2002 and a 270.4% increase from $70.7 million in 1999. In 2004, 2003, 2002, 2001 and 2000, yellow fin tuna, together with fresh and frozen fish filets, constituted 31.8%, 32.8%, 23.9%, 19.7% and 15.5%, respectively, of Panama’s merchandise exports.
Petroleum exports for 2001 were $191.5 million, in comparison to $210.1 million for 2000. Petroleum exports for 2002 were $148.7 million, a decrease of 22.3% compared to 2001. In 2003, preliminary estimates indicate that petroleum exports were $5.4 million. This decrease was primarily attributable to continuing fluctuations in worldwide petroleum prices and the closure of Refinería Panama S.A.’s petroleum refinery. In 2004, preliminary estimates indicate that petroleum exports were $4.9 million.
Because of the use of the U.S. dollar as legal tender and the absence of a Balboa exchange market, Panamanian private sector imports and exports do not affect the Government’s foreign currency reserves. Thus, the balance of payments is less significant than fiscal policy in assessing the external debt service capacity of the Republic.
Tariffs and Other Trade Restrictions
Panama’s trade regime has historically been complex, and levels of tariff protection have varied across sectors of the economy. Various laws have granted companies producing for the local market numerous benefits, including exemptions from import and other taxes. Import duties have traditionally been very high. In 1990, the unweighted average tariff in Panama was approximately 33%, with maximum
D-60
tariffs of 270.5% and 257.5% in the agriculture and manufacturing sectors, respectively. Additionally, Panama has historically had significant non-tariff restrictions including import quotas, import permits for certain products, restrictive sanitary permits or licenses for all agricultural imports, artificially high minimum or reference prices for the computation of tariffs, and price controls that controlled profits on products subject to high import duties. The national 5% value-added tax is also assessed on imports at their time of entry.
In the 1990s, however, the Government enacted a number of trade reforms in preparation for WTO accession. Panama became a member of the WTO on September 6, 1997. In November 1997, the Government passed Cabinet Decree No. 68 of 1997, which reduced import duties for most products to levels significantly below those agreed to under the WTO accession process. As of December 31, 2004, the import duty ceiling for many such products was 15%.
One of the major changes in Panamanian tariffs since 1990 has been the movement away from specific tariffs and mixed specific and ad valorem tariffs to a solely ad valorem system. Panama’s accession to the WTO required Panama to streamline its customs valuation system to conform to international standards. Additionally, Panama changed its international trade classification system from the Customs Cooperation Council Nomenclature and Brussels Tariff Nomenclature to the Harmonized Tariff System, which became effective for the year 1998.
The LUIT also included several tariff reduction measures. A 3% tariff, which had been available to only a limited number of industrial concerns for certain inputs and capital goods, was made available to all enterprises. Similarly, a tax rebate equivalent to 95% of the amount of import taxes paid on imported goods used for exports, which had been available only to exporters of industrial goods, was made available to all exporters.
In October 1999, the Moscoso administration increased tariffs within WTO guidelines for certain agricultural products. These agricultural products include poultry, dairy products, grains (rice) and vegetables (potatoes and onions). The tariffs on poultry were raised from 80% to 300%, on dairy products from 80% to 167%, on grains (rice) from 83% to 130% and on vegetables (potatoes and onions) from 70% to 77%. These tariffs became effective as of October 1999. In 2000, the Moscoso administration increased tariffs on vegetable products to 32.5%, salt to 87% and vegetable oil to 30%. In 2001, the Moscoso administration approved a decrease in the tariff for raw materials for construction and for industrially manufactured products such as cosmetics, shoes, detergents and paper.
The Cabinet, by Decree No. 11 dated April 7, 2004, approved the elimination of import tariffs on certain raw and intermediate materials, such as linseed, corrugated steel bars and support rods for concrete, although the national 5% value-added tax on goods and services will continue to be assessed on such products at their time of entry into Panama.
Composition of Foreign Trade
The U.S. has historically been Panama’s most important trading partner. In 2003, trade with the U.S. was preliminarily estimated at 50.4% and 34.5% of total goods exported and imported, respectively. The significance of U.S. trade, particularly with regard to exports, has increased significantly from 29.8% of exports in 1992 to 50.4% of exports in 2003. While this increase is attributable in part to a continued recovery from the depressed level of exports to the U.S. resulting from the 1988 economic sanctions, it also reflects the impact of E.U. trade policy on banana imports. For instance, the share of Panamanian exports sent to Germany, previously Panama’s second largest export market, fell from 28.0% of exports in 1992 to 0.5% of exports in 2003. Panama’s other significant trading partners have included Costa Rica for exports and Japan, Brazil and Venezuela for imports. Additionally, an average of approximately 12.4% of Panama’s imports from 2000 to 2003 came from the CFZ. Merchandise trade figures according to trading partner are not yet available for 2004.
D-61
The following tables set forth the composition and geographical distribution of Panama’s imports and exports for the years indicated:
TABLE NO. 19
Composition of Merchandise Exports, F.O.B.(1)
(in millions of dollars)
| | | | | | | | | | | | | | | | | |
| | | 2000
| | 2001
| | 2002(P)(R)
| | 2003(P)
| | | 2004(P)
| |
Petroleum(2) | | $ | 210.1 | | $ | 191.5 | | $ | 148.7 | | $ | 5.4 | (3) | | $ | 4.9 | (3) |
Non-petroleum Merchandise Exports: | | | | | | | | | | | | | | | | | |
Bananas | | | 148.3 | | | 122.2 | | | 109.4 | | | 112.8 | | | | 108.2 | |
Muskmelon | | | 11.7 | | | 15.8 | | | 28.0 | | | 26.7 | | | | 49.2 | |
Pineapple | | | 0.1 | | | 0.8 | | | 0.3 | | | 4.0 | | | | 12.0 | |
Watermelon | | | 3.9 | | | 9.8 | | | 12.7 | | | 20.9 | | | | 21.7 | |
Sugar | | | 19.9 | | | 13.9 | | | 15.1 | | | 12.8 | | | | 10.4 | |
Shrimp | | | 59.4 | | | 70.1 | | | 58.0 | | | 56.5 | | | | 53.8 | |
Coffee | | | 16.0 | | | 11.1 | | | 9.2 | | | 12.2 | | | | 11.0 | |
Fishmeal(4) | | | 10.0 | | | 12.8 | | | 7.6 | | | 13.0 | | | | 9.3 | |
Frozen yellow fin tuna, fresh & frozen fish filet | | | 111.2 | | | 148.1 | | | 169.5 | | | 262.6 | | | | 281.8 | |
Other seafood | | | 8.9 | | | 9.3 | | | 8.0 | | | 4.5 | | | | 6.3 | |
Clothing | | | 19.5 | | | 14.3 | | | 13.3 | | | 11.0 | | | | 8.8 | |
Meat from cattle | | | 9.5 | | | 11.4 | | | 14.3 | | | 9.6 | | | | 14.4 | |
Standing cattle | | | 16.6 | | | 37.2 | | | 13.3 | | | 18.0 | | | | 13.2 | |
Leather and similar products | | | 9.0 | | | 8.5 | | | 8.2 | | | 8.5 | | | | 8.9 | |
Other exports | | | 275.2 | | | 267.1 | | | 242.1 | | | 226.7 | | | | 276.4 | |
Total | | | 719.4 | | | 752.4 | | | 709.1 | | | 799.6 | | | | 885.4 | |
Re-exports Other Than CFZ | | | 28.8 | | | 45.4 | | | 42.9 | | | 33.8 | | | | 48.2 | |
| | |
|
| |
|
| |
|
| |
|
|
| |
|
|
|
Total | | $ | 958.3 | | $ | 989.3 | | $ | 900.6 | | $ | 838.8 | | | $ | 938.5 | |
| (2) | Petroleum exports primarily consist of maritime and aviation fuel sales. |
| (3) | Excludes oil sales for consumption abroad. In August 2002, Refinería Panama S.A. closed its refinery operations. |
| (4) | Including fish oil and fishmeal. |
Source: Office of the Comptroller General and Ministry of Economy and Finance.
D-62
TABLE NO. 20
Composition of Merchandise Imports, C.I.F.(1)
(in millions of dollars)
| | | | | | | | | | | | | | | |
| | | 2000(R)
| | 2001(R)
| | 2002(R)
| | 2003(R)
| | 2004(P)
|
Consumer Goods | | $ | 1,099.5 | | $ | 1,019.1 | | $ | 1,207.3 | | $ | 1,294.0 | | $ | 1,547.4 |
Non-durable | | | 500.8 | | | 477.3 | | | 496.9 | | | 545.5 | | | 596.2 |
Semi-durable | | | 293.1 | | | 252.3 | | | 297.3 | | | 270.9 | | | 303.6 |
Domestic utensils | | | 126.2 | | | 104.6 | | | 117.3 | | | 117.6 | | | 131.2 |
Fuels and lubricants | | | 179.3 | | | 184.9 | | | 295.7 | | | 360.0 | | | 516.4 |
| | | | | |
Intermediate Goods | | | 1,367.2 | | | 1,235.7 | | | 1,092.2 | | | 994.4 | | | 1,119.3 |
Agricultural raw materials | | | 50.2 | | | 49.7 | | | 63.2 | | | 74.3 | | | 88.5 |
Industrial raw materials | | | 1,113.3 | | | 1,022.2 | | | 837.6 | | | 671.3 | | | 736.0 |
Construction materials | | | 167.7 | | | 133.7 | | | 158.8 | | | 216.0 | | | 254.9 |
Other intermediate goods | | | 36.1 | | | 30.1 | | | 32.6 | | | 32.8 | | | 39.9 |
| | | | | |
Capital Goods | | | 938.3 | | | 731.6 | | | 735.8 | | | 833.8 | | | 927.7 |
Agricultural | | | 23.3 | | | 15.9 | | | 20.1 | | | 24.0 | | | 26.4 |
Industrial, construction and electricity | | | 356.8 | | | 261.0 | | | 235.1 | | | 254.4 | | | 277.8 |
Transportation equipment and telecommunication | | | 448.2 | | | 368.0 | | | 407.0 | | | 468.0 | | | 525.4 |
Other capital goods | | | 110.1 | | | 86.7 | | | 73.6 | | | 87.4 | | | 98.2 |
| | |
|
| |
|
| |
|
| |
|
| |
|
|
Total | | $ | 3,405.0 | | $ | 2,986.4 | | $ | 3,035.3 | | $ | 3,122.3 | | $ | 3,594.4 |
Source: Office of the Comptroller General and Ministry of Economy and Finance.
D-63
TABLE NO. 21
Direction of Merchandise Trade
(as percentage of total)(1)(2)
| | | | | | | | | | | | |
| | | 2000
| | | 2001(P)
| | | 2002(P)(R)
| | | 2003(P)
| |
Exports (F.O.B.): | | | | | | | | | | | | |
Western Hemisphere: | | | | | | | | | | | | |
U.S. and Canada | | 43.7 | % | | 48.6 | % | | 46.5 | % | | 50.9 | % |
Central America and the Caribbean | | 17.9 | | | 17.9 | | | 19.6 | | | 14.2 | |
South America | | 2.6 | | | 4.0 | | | 2.6 | | | 1.9 | |
Other | | 7.4 | | | 5.0 | | | 5.8 | | | 4.5 | |
| | |
|
| |
|
| |
|
| |
|
|
Total | | 71.6 | | | 75.4 | | | 74.5 | | | 71.5 | |
Europe: | | | | | | | | | | | | |
Germany | | 1.7 | | | 3.2 | | | 0.9 | | | 0.5 | |
Italy | | 3.3 | | | 2.7 | | | 1.0 | | | 1.2 | |
Belgium and Luxembourg | | 5.2 | | | 4.5 | | | 4.4 | | | 3.0 | |
Other | | 13.1 | | | 9.8 | | | 15.9 | | | 19.4 | |
| | |
|
| |
|
| |
|
| |
|
|
Total | | 23.4 | | | 20.3 | | | 22.2 | | | 24.1 | |
Other Countries | | 5.0 | | | 4.3 | | | 3.3 | | | 4.5 | |
TOTAL | | 100.0 | % | | 100.0 | % | | 100.0 | % | | 100.0 | % |
Imports (C.I.F.): | | | | | | | | | | | | |
Western Hemisphere: | | | | | | | | | | | | |
U.S. and Canada | | 33.8 | % | | 33.5 | % | | 34.1 | % | | 35.1 | % |
Mexico | | 3.9 | | | 4.0 | | | 3.7 | | | 3.8 | |
Central America and the Caribbean | | | | | | | | | | | | |
Costa Rica | | 3.5 | | | 3.6 | | | 4.2 | | | 4.8 | |
Trinidad and Tobago | | 0.1 | | | 0.1 | | | 1.3 | | | 0.6 | |
Colón Free Zone | | 12.0 | | | 12.0 | | | 13.0 | | | 12.5 | |
Other | | 5.9 | | | 6.7 | | | 8.1 | | | 11.1 | |
| | |
|
| |
|
| |
|
| |
|
|
Total | | 21.4 | | | 22.4 | | | 26.6 | | | 29.0 | |
South America: | | | | | | | | | | | | |
Venezuela | | 6.6 | | | 5.2 | | | 4.2 | | | 2.7 | |
Ecuador | | 7.2 | | | 7.9 | | | 3.3 | | | 0.2 | |
Brazil | | 1.1 | | | 1.1 | | | 1.6 | | | 3.0 | |
Other | | 5.1 | | | 7.1 | | | 7.3 | | | 5.9 | |
| | |
|
| |
|
| |
|
| |
|
|
Total | | 19.9 | | | 21.3 | | | 16.3 | | | 11.8 | |
TOTAL | | 79.1 | | | 81.2 | | | 80.7 | | | 79.8 | |
Europe: | | | | | | | | | | | | |
Germany | | 1.6 | | | 1.7 | | | 1.5 | | | 1.6 | |
France | | 0.5 | | | 1.5 | | | 0.6 | | | 0.6 | |
Spain | | 1.8 | | | 1.7 | | | 1.4 | | | 1.6 | |
Italy | | 0.7 | | | 0.6 | | | 0.6 | | | 0.7 | |
Netherlands | | 0.6 | | | 0.6 | | | 0.6 | | | 0.5 | |
United Kingdom | | 0.9 | | | 0.7 | | | 0.6 | | | 0.8 | |
Other | | 3.3 | | | 1.8 | | | 2.4 | | | 2.3 | |
| | |
|
| |
|
| |
|
| |
|
|
Total | | 9.4 | | | 8.6 | | | 7.7 | | | 8.0 | |
Japan | | 5.5 | | | 4.3 | | | 5.4 | | | 6.2 | |
Other Countries | | 6.0 | | | 5.9 | | | 6.1 | | | 6.1 | |
| | |
|
| |
|
| |
|
| |
|
|
TOTAL | | 100.0 | % | | 100.0 | % | | 100.0 | % | | 100.0 | % |
| (1) | Includes exports and imports between the CFZ and Panama. |
| (2) | 2004 figures are not yet available. |
Source: Office of the Comptroller General.
D-64
Balance of Payments
The unique Panamanian monetary system and unusual features of the economy cause the balance of payments to be a less important indicator than fiscal policy for purposes of assessing the Government’s debt service capacity. In the absence of a national printed currency and a Balboa exchange market, balance of payments surpluses or deficits have less effect than fiscal policy on the accumulation or drawdown of Government foreign exchange reserves. Panamanian exporters retain the foreign exchange earned from their overseas sales, and Panamanian importers utilize their domestic U.S. dollar-denominated revenues to pay for foreign shipments. In addition, given the absence of a national printed currency and the limited role of BNP in the economy, it is often difficult to register capital movements in an orderly manner. Thus, errors and omissions in the balance of payments figures have tended to be significant.
In 1997, Panama implemented the V Version of the Balance of Payments Manual prepared by the IMF (“V Version”), a different methodology from that previously used, to calculate Panama’s balance of payments.
For 2000, 2001, 2002 and 2003, the balances under the current account calculated under V Version were a $715.5 million deficit, a $173.5 million deficit, a $95.5 million deficit and a $437.2 million deficit, respectively. For 2000, 2001, 2002 and 2003, the balances under the capital and financial account calculated under V Version were a $9.7 million deficit, a $1.280 billion surplus, a $194.3 million surplus and a $25.4 million surplus, respectively. For 2004, the preliminary estimate for the current account balance calculated under V Version is a $1.104 billion deficit. For 2004, the preliminary estimate for the capital and financial account balance calculated under V Version is a $1.007 billion surplus.
In reviewing Panamanian balance of payments statistics for merchandise imports and exports, it is also important to consider the effect of the CFZ and the significant amount of merchandise passing through it. See “The Colón Free Zone.” Panama had $3.594 billion in non-CFZ merchandise imports in 2004 (an increase of 15.1% from 2003), while imports to the CFZ for the same period were $5.104 billion. Similarly, Panama had $938.5 million in non-CFZ merchandise exports in 2004 (11.9% higher than in 2003), while CFZ re-exports for the same period were $5.395 billion.
Excluding the CFZ, Panama has historically suffered large merchandise trade deficits. The deficit, excluding the CFZ, was $2.656 billion (20.5% of GDP) in 2004, an increase of 16.3% from 2003. However, these deficits have been significantly offset by the economic value added by the CFZ. In 2004, the merchandise trade deficit including the CFZ was $1.585 billion (12.2% of GDP), an increase of 42.5% from 2003. Other segments within the service sector of the Panamanian economy, including ports and the Panama Canal, also help offset the merchandise trade deficit. In 2004, the service sector had a net balance of payments surplus of $1.295 billion (an 3.3% increase from 2003). The resulting current account preliminarily registered a deficit of $1.104 billion in 2004, compared to the $437.2 million deficit in 2003.
D-65
The following table sets forth Panama’s balance of payments for the years 2000 through 2004:
TABLE NO. 22
Balance of Payments(1)
(in millions of dollars)
| | | | | | | | | | | | | | | | | | | | |
| | | 2000(R)
| | | 2001(R)
| | | 2002(P)(R)
| | | 2003(P)(R)
| | | 2004(E)
| |
Current Account: | | | | | | | | | | | | | | | | | | | | |
Merchandise Trade Balance(2): | | | | | | | | | | | | | | | | | | | | |
Exports | | $ | 5,838.5 | | | $ | 5,992.4 | | | $ | 5,314.7 | | | $ | 5,048.3 | | | $ | 5,885.6 | |
Imports | | | (6,981.4 | ) | | | (6,688.6 | ) | | | (6,349.8 | ) | | | (6,161.6 | ) | | | (7,470.9 | ) |
| | |
|
|
| |
|
|
| |
|
|
| |
|
|
| |
|
|
|
Surplus (deficit) | | | (1,142.9 | ) | | | (696.2 | ) | | | (1,035.1 | ) | | | (1,112.7 | ) | | | (1,585.3 | ) |
Services | | | 863.9 | | | | 899.0 | | | | 968.1 | | | | 1,254.1 | | | | 1,295.4 | |
Rent(3) | | | (613.5 | ) | | | (602.4 | ) | | | (272.3 | ) | | | (819.9 | ) | | | (1,042.4 | ) |
Unilateral Transfers(4) | | | 177.0 | | | | 226.1 | | | | 243.8 | | | | 241.3 | | | | 228.0 | |
| | |
|
|
| |
|
|
| |
|
|
| |
|
|
| |
|
|
|
Surplus (deficit) | | | (715.5 | ) | | | (173.5 | ) | | | (95.5 | ) | | | (437.2 | ) | | | (1,104.3 | ) |
Capital and Financial Account: | | | | | | | | | | | | | | | | | | | | |
Capital Account | | | 1.7 | | | | 1.6 | | | | 0.0 | | | | 0.0 | | | | 0.0 | |
Financial Account | | | (11.4 | ) | | | 1,278.8 | | | | 194.3 | | | | 25.4 | | | | 1,007.5 | |
Direct Investments | | | 603.4 | | | | 404.6 | | | | 98.6 | | | | 791.5 | | | | 1,012.3 | |
Portfolio Investments | | | (187.0 | ) | | | (20.6 | ) | | | 90.3 | | | | 80.3 | | | | 170.7 | |
Other Capital | | | (427.8 | ) | | | 894.8 | | | | 5.4 | | | | (846.4 | ) | | | (175.5 | ) |
Assets | | | 354.7 | | | | 875.9 | | | | 3,270.4 | | | | 464.1 | | | | (889.3 | ) |
Liabilities | | | (782.5 | ) | | | 18.9 | | | | (3,265.0 | ) | | | (1,310.5 | ) | | | 713.8 | |
| | |
|
|
| |
|
|
| |
|
|
| |
|
|
| |
|
|
|
Surplus (deficit) | | | (9.7 | ) | | | 1,280.4 | | | | (194.3 | ) | | | 25.4 | | | | 1,007.5 | |
Errors and Omissions | | | 397.5 | | | | (462.9 | ) | | | 47.2 | | | | 258.8 | | | | (298.6 | ) |
| | |
|
|
| |
|
|
| |
|
|
| |
|
|
| |
|
|
|
Overall Surplus (deficit) | | | (327.7 | ) | | | 644.0 | | | | 146.0 | | | | (153.0 | ) | | | (395.4 | ) |
Financing | | | 327.7 | | | | (644.0 | ) | | | (146.0 | ) | | | 153.0 | | | | 395.4 | |
Reserves | | | 109.2 | | | | (633.3 | ) | | | (137.9 | ) | | | 162.5 | | | | 396.3 | |
Use of IMF Credits | | | (52.1 | ) | | | (33.6 | ) | | | (8.1 | ) | | | (9.5 | ) | | | (10.0 | ) |
Exceptional Financing(5) | | $ | 270.6 | | | $ | 22.9 | | | $ | 0.0 | | | $ | 0.0 | | | $ | 9.1 | |
| (1) | Figures were calculated pursuant to V Version of the Balance of Payments Manual prepared by the IMF. |
| (3) | Includes wages and investment profits. |
| (4) | Unilateral transfers consist of transactions without a quid pro quo, many of which are gifts and migrant transfers. |
| (5) | “Exceptional Financing” refers only to financing from the exchange or the repurchase of Government bonds and the capitalization of PDI bonds. External financing raised in the international markets by the Central Government is included under the caption “Financial Account.” |
Source: Office of the Comptroller General.
D-66
PUBLIC SECTOR DEBT
Internal Debt
From 2000 to 2004, Panama’s public sector internal debt represented approximately one-fourth of the total public sector debt. A substantial portion of total public sector internal debt is extended by public sector sources, such as CSS and official banking institutions, and BNP in particular.
Two loans by BNP to the Central Government with an outstanding principal amount of $710.4 million as of December 31, 2004, represent 34.2% of BNP’s loan portfolio. The first loan was a result of approximately $933 million in overdrafts by the Noriega-controlled Central Government during the 1987-1989 period. Until 1993, this obligation was undocumented. In October 1993, a restructuring was completed whereby the overdraft was converted into a series of 25-year non-negotiable, non-transferable notes, bearing interest at 2% per annum and requiring $17.3 million in semi-annual principal payments. As of December 31, 2004, $360.4 million of this loan remained outstanding.
In December 2004, the Torrijos administration issued Cabinet Decree No. 47, authorizing an eleven-year $350 million loan agreement with BNP, to refinance a short-term $350 million line of credit authorized in 2003. The Government used the proceeds from this loan to finance the 2004 budget.
The Central Government also has a limited amount of debt obligations outstanding in the domestic private sector. The Ministry of Economy and Finance occasionally has issued domestic bonds, bills and notes in the domestic market. In August 1999 the Government issued $395.0 million aggregate principal amount of SIACAP Bonds for the purpose of initially funding the retirement benefits of SIACAP participants. See “Employment and Labor—Social Security.”
In an effort to promote the development of Panama’s capital market, the Government initiated in July 2002 a program of Treasury Note issuances in the local market. As of December 31, 2004, $708.2 million in Treasury Notes were outstanding.
In twelve monthly auctions from January 13, 2004 to December 1, 2004, the Government issued $208.2 million of 5.25% Treasury Notes due 2009. Proceeds from monthly Treasury Note auctions through December 2004 were allocated to the Government’s 2004 financing needs. In twelve monthly auctions from January 20, 2004 to December 14, 2004, Panama issued $319.6 million of zero-coupon Treasury Bills with six- and twelve-month maturities in Panama’s capital markets.
The Ministry of Economy and Finance expects to continue issuing domestic instruments. In addition, the Government has a cash management plan that is intended to increase the volume of trades on La Bolsa. This plan provides for the issuance of short-term securities to cover current cash needs, which securities have an outstanding balance of $236.6 million as of December 31, 2004.
The third largest component of public sector internal indebtedness as of December 31, 2004 is the $622.6 million owed by the Central Government to CSS. This amount represents accruals of contributions due CSS from the Central Government wage bill that were not made in cash by the Central Government and were evidenced by interest-bearing notes and bonds. In 2004, the Central Government made payments to the CSS aggregating $99.2 million.
In October 2004, the Torrijos administration issued Cabinet Decree No. 36, authorizing a short-term $300 million line of credit with HSBC Bank USA, N.A., Panama Branch. As of December 31, 2004, the Government had repaid $80 million, the full amount disbursed under the line of credit as of that date. As of March 15, 2005, the expiration date of the line of credit, no further disbursements had been made.
D-67
The following table sets forth Panama’s outstanding public sector internal debt at year-end for the years 2000 through 2004:
TABLE NO. 23
Public Sector Internal Debt
(in millions of dollars)
| | | | | | | | | | | | | | | |
| | | December 31,
|
| | | 2000
| | 2001
| | 2002
| | 2003(R)
| | 2004
|
Private Sector Sources: | | | | | | | | | | | | | | | |
Treasury notes(1) | | $ | — | | $ | — | | $ | 159.5 | | $ | 500.0 | | $ | 708.2 |
Treasury bills | | | 114.0 | | | 250.0 | | | 243.4 | | | 218.0 | | | 236.6 |
Domestic bonds | | | 102.0 | | | 92.8 | | | 81.4 | | | 60.8 | | | 31.4 |
Long-term private financing | | | 15.2 | | | 10.8 | | | 6.3 | | | 5.8 | | | 14.0 |
Labor Notes(2) | | | 24.9 | | | 30.1 | | | 15.1 | | | 6.4 | | | 3.9 |
SIACAP Bonds | | | 363.9 | | | 363.9 | | | 363.9 | | | 345.1 | | | 307.4 |
| | |
|
| |
|
| |
|
| |
|
| |
|
|
Total | | $ | 620.1 | | $ | 747.6 | | $ | 869.6 | | $ | 1,136.0 | | $ | 1,301.4 |
Public Sector Sources: | | | | | | | | | | | | | | | |
CSS | | $ | 788.5 | | $ | 762.3 | | $ | 697.9 | | $ | 516.4 | | $ | 622.6 |
Official banking institutions(3) | | | 683.9 | | | 602.7 | | | 579.2 | | | 505.6 | | | 833.7 |
Other | | | 35.5 | | | 25.5 | | | 25.5 | | | 0.0 | | | 0.0 |
| | |
|
| |
|
| |
|
| |
|
| |
|
|
Total | | $ | 1,507.9 | | $ | 1,390.4 | | $ | 1,302.5 | | $ | 1,022.0 | | $ | 1,456.2 |
Total Public Sector Internal Debt | | $ | 2,128.0 | | $ | 2,138.0 | | $ | 2,172.1 | | $ | 2,158.0 | | $ | 2,757.6 |
| (1) | In July 2002, the Government initiated a program of Treasury Note issuances in the local market. |
| (2) | Notes issued under the Government’s early retirement program. |
| (3) | The remaining unpaid overdraft debt that the Central Government incurred at BNP during the 1987-1989 period is reflected in this category. |
Source: Ministry of Economy and Finance.
External Debt
General. As of December 31, 2004, total public sector external debt was approximately $7.219 billion. This includes the external debt of the Central Government as well as debt of other public sector entities, including debt that is guaranteed by the Central Government. As of December 31, 2003, Panama’s external debt was equal to $6.504 billion, up from $6.349 billion as of December 31, 2002 and $6.263 billion as of December 31, 2001. The balance as of December 31, 2004 included $600 million of pre-funding for 2005 obtained as part of the November 2004 issuance of $600 million of 7.250% Global Bonds due 2015.
The amount of total public sector external debt reflects the conclusion in July 1996 of the Republic’s Brady Plan restructuring of substantially all its medium- and long-term commercial bank debt and the outstanding amount of global bonds sold by Panama. On September 26, 1997, Panama retired approximately $713 million in Brady Bonds pursuant to an exchange offer for $600 million of its 8-7/8% U.S. Dollar-Denominated Global Bonds Due 2027. Simultaneously, Panama sold $100 million of these bonds for cash. During 2000 and 2001, Panama repurchased Brady Bonds in the principal amount of $53.5 million and $147.9 million in each respective year. In 2002 and 2003, a total of $488 and $123.5 million principal amount of Brady Bonds was retired through debt management operations, respectively.
D-68
In January 2004, Panama launched an offer to purchase (“Offer to Purchase”) outstanding Brady Bonds, which offer was financed by a further issuance in February 2004 of $326 million of its 9.375% Global Bonds Due 2023, of which $430 million principal amount had been previously issued and are outstanding. Pursuant to the settlement of the Offer to Purchase, which occurred in February 2004, Panama repurchased approximately $406 million aggregate original principal amount of Brady Bonds, of which there were approximately $177 million aggregate original principal amount of Past-Due Interest Bonds Due 2016 (“PDIs”), approximately $221 million aggregate original principal amount of Interest Reduction Bonds Due 2014 (“IRBs”), approximately $5.5 million aggregate original principal amount of Par Bonds Due 2026 (“Par Bonds”) and approximately $2.5 million aggregate original principal amount of Discount Bonds Due 2026 (“Discount Bonds”). The consummation of the Offer to Purchase yielded a nominal net reduction of $57.0 million in Panama’s public sector debt balance and reduced the balance of outstanding Brady Bonds. In 2004, a total of $428.2 million principal amount of Brady Bonds was retired through debt management operations. As of December 31, 2004, approximately 79.1% of the total public sector external debt was owed to commercial lenders and bondholders, with 16.8% owed to multilateral institutions and 4.1% owed to bilateral lenders.
On August 19, 2004, the Government and the U.S. Government signed a debt-for-nature swap agreement, pursuant to which Panama and the United States agreed to restructure debt, aggregating approximately $9.4 million principal amount, owed by Panama to the United States in return for Panama’s commitment to fund, through 2016, a trust devoted to forest conservation activities in Panama’s Darién National Park. This follows a similar debt-for-nature swap agreement that Panama and the United States signed on July 10, 2003, pursuant to which the two countries agreed to restructure other debt owed by Panama to the United States in exchange for Panama’s commitment to fund, through 2016, a trust for conservation activities in Panama’s Chagres National Park. Under the 2003 debt-for-nature swap, approximately $16.1 million principal amount of debt was restructured.
The following tables set forth the composition of public sector external debt outstanding at year-end for the years 2000 through 2004 and the scheduled amortizations for public sector external debt for each of the years indicated:
TABLE NO. 24
Public Sector External Debt(1)
(in millions of dollars)
| | | | | | | | | | | | | | | |
| | | December 31,
|
| | | 2000
| | 2001
| | 2002
| | 2003
| | 2004
|
Commercial banks | | $ | 12.7 | | $ | 12.5 | | $ | 9.1 | | $ | 7.2 | | $ | 9.3 |
Bonds | | | 4,098.3 | | | 4,821.4 | | | 4,833.8 | | | 4,955.0 | | | 5,702.9 |
Suppliers and contractors | | | 0.0 | | | 0.0 | | | 0.0 | | | 0.0 | | | 0.0 |
Multilateral agencies | | | 1,113.1 | | | 1,098.7 | | | 1,175.0 | | | 1,227.7 | | | 1,212.9 |
Bilateral entities | | | 380.0 | | | 330.2 | | | 331.2 | | | 313.8 | | | 294.2 |
| | |
|
| |
|
| |
|
| |
|
| |
|
|
Total | | $ | 5,604.1 | | $ | 6,262.8 | | $ | 6,349.1 | | $ | 6,503.6 | | $ | 7,219.2 |
| (1) | Debt stated at its outstanding principal amount and not at trading value in the secondary market. |
Source: Ministry of Economy and Finance.
D-69
TABLE NO. 25
Public Sector External Debt Amortization(1)
(in millions of dollars)
| | | | | | | | | | | | | | | | | | | |
| | | 2005(R)
| | 2006(R)
| | | 2007(R)
| | 2008(R)
| | 2009(R)
| | 2010-2035(R)
|
Multilaterals | | | | | | | | | | | | | | | | | | | |
World Bank | | $ | 40.24 | | $ | 44.90 | | | $ | 48.01 | | $ | 45.86 | | $ | 35.99 | | $ | 78.44 |
IDB | | | 74.12 | | | 82.08 | | | | 85.58 | | | 90.07 | | | 92.52 | | | 703.31 |
IMF | | | 10.35 | | | 10.75 | | | | 10.75 | | | 5.38 | | | 0.00 | | | 0.00 |
IADF(2) | | | 2.92 | | | 4.31 | | | | 4.31 | | | 4.31 | | | 4.31 | | | 28.11 |
CAF(3) | | | 9.31 | | | 11.67 | | | | 12.08 | | | 6.04 | | | 0.00 | | | 0.00 |
EIB(4) | | | 0.00 | | | 0.00 | | | | 0.00 | | | 0.00 | | | 2.20 | | | 47.80 |
| | |
|
| |
|
|
| |
|
| |
|
| |
|
| |
|
|
Total | | $ | 136.93 | | $ | 153.71 | | | $ | 160.73 | | $ | 151.66 | | $ | 135.02 | | $ | 857.66 |
Bilaterals | | | 26.82 | | | 26.72 | | | | 26.08 | | | 24.17 | | | 20.45 | | | 169.62 |
Bonds | | | 12.78 | | | 517.20 | (5) | | | 21.63 | | | 671.63 | | | 21.63 | | | 4,707.99 |
Commercial Debt | | | 0.00 | | | 1.27 | | | | 1.85 | | | 1.85 | | | 1.85 | | | 2.78 |
| | |
|
| |
|
|
| |
|
| |
|
| |
|
| |
|
|
Total | | $ | 176.53 | | $ | 698.91 | | | $ | 210.29 | | $ | 849.31 | | $ | 178.94 | | $ | 5,738.06 |
| (1) | Projections include the repayment of debt under contract by not yet disbursed as of December 31, 2004. |
| (2) | International Agricultural Development Fund. |
| (3) | Andean Development Corporation. |
| (4) | European Investment Bank. |
| (5) | Projection assumes the exercise of a put option on the Global Bonds due 2029, which would result in an amortization payment of $500.0 million. |
Source: Ministry of Economy and Finance.
The 1980s Debt Crisis. Panama’s economic performance measured by the growth rate of GDP during the 1980s was poor in comparison with the strong results registered during the previous three decades. The factors causing low growth rates included the growing influence of the public sector on the economy and the uncertainty related to the military government’s control of the country. Additionally, Panama had borrowed heavily in the late 1970s and early 1980s, and the profile of maturities on Panamanian public sector debt was highly concentrated.
In 1987, Panama defaulted under all of its external indebtedness. Panama subsequently was declared ineligible to use the resources of the IMF and the World Bank, and the IDB placed the country on non-accrual status.
Following the U.S.’s military operation in December 1989, the Endara government declared that it would honor existing financial obligations. Panama subsequently cleared its substantial arrears with the international financial institutions, the Paris Club and its international bondholders. In 2001, Panama completed payments on its restructured Paris Club debt and, in 2002, on its floating rate notes issued in 1994 to restructure bonds in default at that time.
1995 Financing Plan. On May 9, 1995, Panama and its Bank Advisory Committee reached an agreement-in-principle on the restructuring of Panama’s medium- and long-term public sector indebtedness owed to commercial banks, as well as for interest arrears accrued in respect of such indebtedness since 1987. Pursuant to that agreement, on July 17, 1996, Panama issued approximately $3.23 billion principal amount of bonds to holders of debt (“Eligible Debt”) in consideration for the tender by such holders of their Eligible Debt and interest arrears accrued in respect thereof since 1987 (“Eligible Interest”). The bonds were issued pursuant to an exchange agreement implementing the Republic of Panama 1995 Financing Plan (the “1995 Financing Plan”), which provided for the restructuring of approximately $1.98 billion of Eligible Debt and arrangements for approximately $1.83 billion of Eligible Interest. Panama is not in default on any of its restructured external debt.
D-70
International Financial Institutions. Panama has used the IDB as a significant source of financing. As of December 31, 2004, Panama had agreements with the IDB for a total of $670.4 million in loans, of which $312.4 million had been disbursed. These agreements finance projects in health, transportation, social investment and modernization as well as co-financings with the World Bank concerning the public sector reforms and financial adjustments contemplated by the Development Program and the Economic Development Plan. See “The Panamanian Economy—Reforms and Development Programs.” Prior to 1990, Panama borrowed money from the IDB’s Fund for Special Operations and Social Progress Trust Fund in order to finance agricultural, fisheries, transportation, education, real estate, urban and industrial development programs.
In December 1997, Panama and the IMF established a three-year extended fund facility for Special Drawing Rights (“SDR”) 120 million (approximately $162 million), of which SDR 40 million were disbursed prior to Panama’s cancellation of the extended fund facility in April 2000. On June 30, 2000, the Republic entered into a 21-month standby arrangement with the IMF for SDR 64 million (approximately $85.5 million) to support the Government’s economic program for 2000 to 2001. The Government viewed this standby arrangement as a precautionary measure as it moved forward with important fiscal and structural reforms. No disbursements were made pursuant to the standby agreement. Panama and the IMF have maintained a continuous dialogue concerning Panama’s economic performance and economic programs. As of December 31, 2004 the Government had no arrangement in place with the IMF. In November 2004, the IMF initiated its most recent Article IV review of Panama, and concluded such review in March 2005.
In September 2000, Panama borrowed $35.0 million from the World Bank to finance an education project, which aims at improving the quality and efficiency of basic education, and accessibility to pre-school, primary and lower secondary education for children in rural and poor urban areas. Panama entered into two additional loans with the World Bank in 2001. One loan, approved in January 2001, was in the amount of $47.9 million to finance a Land Administration Program, while the other, approved in July 2001, was in the amount of $10.5 million to finance a project on Technical Assistance Public Politics reform. Both programs were still active as of December 31, 2004.
As of December 31, 2004, Panama’s subscription to the IMF (which corresponds to its quota) was SDR 206.6 million. As of December 31, 2004, Panama’s subscription to the capital of the World Bank was $46.4 million. Of this amount, $3.2 million had been paid as of December 31, 2004. The balance of Panama’s subscription is callable only if required by the World Bank to meet its obligations for funds borrowed or loans guaranteed by it. In addition, Panama has subscriptions to the IFC and MIGA of $1.0 million and $2.5 million, respectively, as of December 31, 2004.
As of December 31, 2004, Panama’s subscription to the IDB was $435.7 million. Of this subscription, $18.7 million had been paid as of December 31, 2004, and the balance is callable if required to meet the IDB’s obligations. Panama’s contribution to the IDB’s Fund for Special Operations (which corresponds to its quota) was $25.2 million as of December 31, 2004.
Other Development Financing
In July 2000, Panama entered into a thirty-year, $30.0 million loan agreement with the International Commercial Bank of China, the proceeds of which were used to decrease poverty levels. The first disbursement, in the amount of $7.5 million, was made in November 2001. The final three disbursements were made in one payment of $22.5 million in June 2002.
D-71
Global Notes and Bonds
On July 13, 2000, Panama issued $350 million principal amount of 10.75% Global Bonds due 2020 (the “Global Bonds due 2020”). On February 8, 2001, Panama issued $750.0 million principal amount of 9.625% Global Bonds due 2011 (the “Global Bonds due 2011”). On July 13, 2001, Panama purchased $245 million of its 7.875% Global Bonds due 2002, and as part of the tender offer, issued warrants to purchase either an existing issue of Global Bonds due 2011 or a new issue of Global Bonds due 2012 in January 2002. On November 16, 2001, Panama issued $250 million principal amount of its 8.25% Notes due 2008, in a reopening of that issue. On December 11, 2001, Panama issued $100 million principal amount of its 8.25% Notes due 2008 in an additional reopening of that issue. On January 16, 2002, Panama issued $180 million principal amount of its 9.375% Global Bonds due 2012 in exchange for warrants that Panama had issued previously in connection with its July 13, 2001 tender offer for its 7.875% Global Bonds due 2002. On July 19, 2002, Panama issued $150 million principal amount of its 9.375% Global Bonds due 2012 in a reopening of that issue.
On September 19, 2002, Panama issued $170 million principal amount of its 9.375% Global Bonds due 2012 in an additional reopening of that issue. A portion of the September reopening was used to repurchase external debt. On December 3, 2002, the Republic issued $430 million of its 9.375% Global Bonds due 2023, of which approximately $280 million were used to repurchase external debt. On February 28, 2003, Panama issued $275 million principal amount in a reopening of its Global Bonds due 2027. Approximately $50 million of the reopening were used to repurchase external debt, and the remaining balance was allocated to general budgetary purposes. In January 2004, Panama issued $250 million aggregate principal amount of its 8.125% Global Bonds due 2034 containing collective action clauses. In February 2004, Panama issued $326 million principal amount of its 9.375% Global Bonds Due 2023 in a reopening of that issue used to finance the purchase of outstanding Brady Bonds. On November 23, 2004, Panama issued $600 million aggregate principal amount of its 7.250% Global Bonds due 2015 containing collective action clauses.
The global notes and bonds issued by Panama in the international capital markets since 1997 are unsecured, pay interest semi-annually, and have been issued in global registered form; these debt securities each rank pari passu in right of payment without any preference among themselves and with all other existing and future unsecured and unsubordinated indebtedness of Panama. In September 2003, Panama amended its fiscal agency agreement with JPMorgan Chase Bank to provide for the issuance in the future of global bonds with collective action clauses that, among other things, permit Panama to amend certain key terms of the bonds, including the maturity date, interest rate and other payment terms, with the consent of the holders of not less than 75% of the aggregate principal amount of outstanding bonds of the same series.
D-72
TABLES AND SUPPLEMENTARY INFORMATION
TABLE NO. 26
External Direct Debt of the Republic
Central Government
| | | | | | | | | | | | | | | |
| | | Interest
| | Issue Date
| | Final Maturity
| | Amortization
| | Amount Issued
| | Principal Amount(s) Outstanding at December 31, 2004(1)
| |
| | | | | | | | | | | (in millions of dollars) | |
| MULTILATERAL ORGANIZATIONS | | | | | | | | | | | | | | | |
International Monetary Fund | | Floating | | Various | | Various | | Various | | $ | 405.2 | | $ | 36.2 | (2) |
World Bank | | Various | | Various | | Various | | Various | �� | | 554.5 | | | 245.5 | (2) |
Inter-American Development Bank | | Various | | Various | | Various | | Various | | | 1,415.1 | | | 807.7 | (2) |
International Agricultural Development Fund | | Various | | Various | | Various | | Various | | | 50.0 | | | 8.7 | (2) |
European Investment Bank | | Floating | | 29-Mar-04 | | 15-Dec-23 | | Semiannually | | | 50.0 | | | 50.0 | |
Andean Development Corporation | | Floating | | Various | | Various | | Semiannually | | | 60.0 | | | 33.0 | |
| | | | | | | | | | | | | |
|
|
|
Total (Multilateral
Organizations) | | | | | | | | | | | | | $ | 1,181.1 | |
| BILATERAL ORGANIZATIONS | | | | | | | | | | | | | | | |
Government Direct Creditors(3) | | Fixed/Various | | Various | | Various | | Semiannually | | $ | 250.0 | | $ | 82.4 | |
Banks with Official Guarantees(4) | | Various | | Various | | Various | | Semiannually | | | 157.0 | | | 111.5 | |
Support Groups | | Floating | | Various | | Various | | Semiannually | | | 146.4 | | | 92.7 | |
| | | | | | | | | | | | | |
|
|
|
Total (Bilateral Organizations) | | | | | | | | | | | | | $ | 286.6 | |
Commercial Banks | | Various | | Various | | Various | | Semiannually | | $ | 58.5 | | $ | 9.3 | |
BONDS | | | | | | | | | | | | | | | |
Par Bonds | | 5.5% | | 17-July-96 | | 17-July-26 | | Bullet | | $ | 262.7 | | $ | 9.7 | |
Discount Bonds | | LIBOR + 13/16% | | 17-July-96 | | 17-July-26 | | Bullet | | | 45.5 | | | 13.2 | |
IRBs | | LIBOR + 13/16% | | 17-July-96 | | 17-July-14 | | Semiannually
beginning
17-July-01 | | | 1,568.6 | | | 127.8 | |
PDI Bonds | | LIBOR + 13/16% | | 17-July-96 | | 17-July-16 | | Semiannually
beginning
17-July-06 | | | 1,350.9 | | | 221.2 | |
Global Bonds due 2027 | | 8-7/8% | | 26-Sep-97 | | 30-Sep-27 | | Bullet | | | 975.0 | | | 975.0 | |
8.25% Notes due 2008 | | 8.25% | | 29-Apr-98 | | 22-Apr-08 | | Bullet | | | 650.0 | | | 650.0 | |
Global Bonds due 2029 | | 9.375% | | 31-Mar-99 | | 1-Apr-29 | | Bullet | | | 500.0 | | | 500.0 | |
Global Bonds due 2020 | | 10.75% | | 13-July-00 | | 15-July-20 | | Bullet | | | 350.0 | | | 350.0 | |
Global Bonds due 2011 | | 9.625% | | 8-Feb-01 | | 8-Feb-11 | | Bullet | | | 750.0 | | | 750.0 | |
Global Bonds due 2012 | | 9.375% | | 23-Jan-02 | | 23-July-12 | | Bullet | | | 500.0 | | | 500.0 | |
Global Bonds due 2023 | | 9.375% | | 3-Dec-02 | | 16-Jan-23 | | Bullet | | | 430.0 | | | 756.0 | |
Global Bonds due 2034 | | 8.125% | | 21-Jan-04 | | 16-Oct-34 | | Bullet | | | 250.0 | | | 250.0 | |
Global Bonds due 2015 | | 7.25% | | 23-Nov-04 | | 15-Mar-15 | | Bullet | | | 600.0 | | | 600.0 | |
| | | | | | | | | | | | | |
|
|
|
Total (Bonds) | | | | | | | | | | | | | $ | 5,702.9 | |
| (1) | All obligations are denominated in U.S. dollars unless otherwise indicated. Currencies other than U.S. dollars are translated into U.S. dollars by the exchange rate (selling) as of December 31, 2004. |
| (3) | Includes former account for AID and AID-Guaranteed. |
| (4) | Former account for Official Providers. |
Source: Ministry of Economy and Finance.
D-73
TABLE NO. 27
External Debt Guaranteed by the Republic
Decentralized Institutions
| | | | | | | | | | | | | | |
| | | Interest
| | Issue Date
| | Maturity
| | Amortizations
| | Disbursed
| | Principal Amount Outstanding as of December 31, 2004(1)
|
| | | | | | | | | | | (in millions of dollars) |
| Multilateral Organizations | | | | | | | | | | | | | | |
Inter-American Development Bank | | Various | | Various | | Various | | Semiannually | | $ | 352.7 | | $ | 31.8 |
| Bilateral Organizations | | | | | | | | | | | | | | |
Government Suppliers | | Fixed | | Various | | Various | | Semiannually | | $ | 20.9 | | $ | 7.0 |
Banks with Official Guarantee | | Various | | Various | | Various | | Semiannually | | | 18.2 | | | 0.6 |
Official Providers(2) | | Various | | Various | | Various | | Semiannually | | | 71.2 | | | 0.0 |
| | | | | | | | | | | | | |
|
|
Total (Bilateral Organizations) | | | | | | | | | | | | | $ | 7.6 |
| (1) | All obligations are denominated in U.S. dollars unless otherwise indicated. Currencies other than U.S. dollars are translated into U.S. dollars by the exchange rate (selling) as of December 31, 2004. |
Source: Ministry of Economy and Finance.
D-74
TABLE NO. 28
Internal Securities Debt of the Republic
Outstanding on December 31, 2004(1)
| | | | | | | | | | | | |
Name
| | Interest Rate
| | | Amortization
| | Issuance Date
| | Final Maturity
| | Outstanding
Amount
|
| | | | | | | | | | | | (millions of dollars) |
| I. Bonds | | | | | | | | | | | | |
State Bonds | | 6.0 | % | | Quarterly | | Various 1987 | | Various 2007 | | $ | .784 |
Agrarian | | 1.0 | % | | Quarterly | | Various 1969 | | Various 2009 | | | 1.029 |
1984 Agrarian A Series | | 6.0 | % | | Quarterly | | Various 1984 | | Various 2009 | | | 1.153 |
Urban Renovation B Series | | 9.0 | % | | Quarterly | | Various 1985 | | Various 2005 | | | .581 |
Public Works Bonds | | LIBOR + 3 1/4 | % | | Quarterly | | October 1997 | | October 2007 | | | 27.819 |
Treasury Notes 2005 | | 7.25 | % | | Semiannually | | Various 2001 | | July 2005 | | | 250.000 |
Treasury Notes 2007 | | 6.75 | % | | Semiannually | | Various 2003 | | March 2007 | | | 250.000 |
Treasury Notes 2009 | | 5.25 | % | | Semiannually | | Various 2004 | | January 2009 | | | 208.165 |
| | | | | | | | | | | |
|
|
Total (Bonds) | | | | | | | | | | | $ | 739.531 |
II. SIACAP Bonds | | | | | | | | | | | | |
SIACAP B Series | | 8.125 | % | | Semiannually | | August 1999 | | August 2006 | | | 75.429 |
SIACAP C Series | | 8.5 | % | | Semiannually | | August 1999 | | August 2013 | | | 231.916 |
| | | | | | | | | | | |
|
|
Total (SIACAP Bonds) | | | | | | | | | | | $ | 307.345 |
| (1) | Instruments with a maturity of more than one year. |
Source: Office of the Comptroller General.
D-75