EXHIBIT D

Republic of Panama
This description of the Republic of Panama is dated as of September 30, 2013 and appears as Exhibit D to the Republic of Panama’s Annual Report on Form 18-K to the U.S. Securities and Exchange Commission for the fiscal year ended December 31, 2012.
TABLE OF CONTENTS
| | | | |
| | | Page | |
RECENT DEVELOPMENTS | | | D-2 | |
THE REPUBLIC OF PANAMA | | | D-8 | |
THE PANAMANIAN ECONOMY | | | D-12 | |
STRUCTURE OF THE PANAMANIAN ECONOMY | | | D-26 | |
THE PANAMA CANAL | | | D-33 | |
THE COLÓN FREE ZONE | | | D-39 | |
EMPLOYMENT AND LABOR | | | D-40 | |
PUBLIC FINANCE | | | D-45 | |
FINANCIAL SYSTEM | | | D-51 | |
FOREIGN TRADE AND BALANCE OF PAYMENTS | | | D-60 | |
PUBLIC SECTOR DEBT | | | D-68 | |
TABLES AND SUPPLEMENTARY INFORMATION | | | D-75 | |
The fiscal year of the Government of the Republic of Panama (the “Government”) ends on December 31. The twelve-month period ended December 31, 2012 is referred to in this description of the Republic of Panama as “2012” and other years are referred to in a similar manner unless otherwise indicated. All references to “$” or “dollars” are to United States Dollars.
Totals in certain tables in this description of the Republic of Panama may differ from the sum of the respective individual items in such tables due to rounding.
i
INDEX OF TABLES
| | | | |
| | | Page | |
TABLE NO. 1 Selected Panamanian Economic Indicators | | | D-7 | |
TABLE NO. 2 Inflation (percentage change from previous period) | | | D-22 | |
TABLE NO. 3 Gross Domestic Product | | | D-22 | |
TABLE NO. 4 Sectoral Origin of Gross Domestic Product (in millions of dollars) | | | D-23 | |
TABLE NO. 5 Percentage Change from Prior Year for Sectoral Origin of Gross Domestic Product (percentage change) | | | D-24 | |
TABLE NO. 6 Sectoral Origin of Gross Domestic Product (as percentage of GDP) | | | D-25 | |
TABLE NO. 7 Selected State-Owned Enterprises 2012 Financial Statistics (in millions of dollars) | | | D-28 | |
TABLE NO. 8 Panama Canal Principal Statistics | | | D-33 | |
TABLE NO. 9 Labor Force and Employment | | | D-41 | |
TABLE NO. 10 Average Real Monthly Wages | | | D-43 | |
TABLE NO. 11 Budgeted Expenditures of the Central Government by Function (in millions) | | | D-46 | |
TABLE NO. 12 Central Government Operations (in millions of dollars) | | | D-48 | |
TABLE NO. 13 Consolidated Non-Financial Public Sector Operations (in millions of dollars) | | | D-49 | |
TABLE NO. 14 International Reserves (in millions of dollars) | | | D-50 | |
TABLE NO. 15 Largest Banking Institutions (assets in millions of dollars) | | | D-52 | |
TABLE NO. 16 The Banking Sector (in millions of dollars) | | | D-53 | |
TABLE NO. 17 Banco Nacional de Panamá Balance Sheet (in millions of dollars) | | | D-57 | |
TABLE NO. 18 Composition of Merchandise Exports, F.O.B. (in millions of dollars) | | | D-62 | |
TABLE NO. 19 Composition of Merchandise Imports, C.I.F. (in millions of dollars) | | | D-63 | |
TABLE NO. 20 Direction of Merchandise Trade (as percentage of total) | | | D-64 | |
TABLE NO. 21 Balance of Payments (in millions of dollars) | | | D-67 | |
TABLE NO. 22 Public Sector Internal Debt (in millions of dollars) | | | D-69 | |
TABLE NO. 23 Public Sector External Debt (in millions of dollars) | | | D-70 | |
TABLE NO. 24 Public Sector External Debt Amortization (in millions of dollars) | | | D-70 | |
TABLE NO. 25 External Direct Debt of the Republic Central Government | | | D-75 | |
TABLE NO. 26 External Debt Guaranteed by the Republic Decentralized Institutions | | | D-76 | |
TABLE NO. 27 Internal Debt Securities of the Republic Outstanding | | | D-77 | |
ii
D-1
RECENT DEVELOPMENTS
Political Developments
In March 2013, Panama’s largest political opposition parties, Partido Revolucionario Democrático (PRD) and Partido Panameñista (PPA), completed their presidential primary elections. Former mayor of Panama City, Juan Carlos Navarro, and Vice President Juan Carlos Varela were elected by the PRD and the PPA, respectively, as candidates for the presidential elections to be held on May 4, 2014.
The incumbent party, Cambio Democrático (CD), held its primary election on May 12, 2013. Jose Domingo Arias, the former Minister of Housing and Territorial Administration (Ministro de Vivienda y Ordenamiento Territorial), won the primary election and will run for president in the 2014 election. Giselle Burillo a candidate in the CD primary election, subsequently resumed her position as head of the Micro, Small and Medium Enterprises Authority (Autoridad de las Micro, Pequeñas y Medianas Empresas, “AMPYME”).
Recent Government Actions
In June 2012, the Government created the Fondo de Ahorro de Panamá, referred to as the Panama Savings Fund or the FAP, pursuant to Law No. 38 of 2012. The initial capital of the Fund will come from the Fondo Fiduciario para el Desarrollo, referred to as the Development Trust Fund. Once the Fund has been capitalized and it begins operations by 2015, the Development Trust Fund will cease to exist. According to the Fund’s accumulation rule, every year income from the Panama Canal Authority (the “Panama Canal Authority” or “PCA”), of up to 3.5% of GDP will be deposited in the National Treasury and any excess over that amount will be transferred to the Fund. The Fund will have two main objectives: macroeconomic stability in cases of national emergencies and long-term national savings. The Fund will also be allowed to repurchase and retire Panamanian sovereign debt once the size of the Fund reaches 5.0% of GDP. The Fund will be managed by the Ministry of Economy and Finance. In addition, Law 38 provides that Banco Nacional de Panamá (“BNP”) will serve as the Fund’s Trustee and that the Fund will have an independent Board of Directors in charge of safeguarding its assets.
Law 87 of December 4, 2012, modified article 5 of Law 38 of 2012. This change affected only the rules relating to the withdrawal of funds from the FAP, restricting the possibility of using funds immediately in respect of natural disasters. In August 2013, Law 48 was approved, which further modified Law 38 of 2012. The amendment establishes that funds resulting from future sales of government-owned companies will be accumulated in the FAP and may only be used to finance reconstruction efforts for damage caused by natural disasters, when such damage represents at least 0.5% of nominal GDP.
The President has appointed the first board of directors of FAP, and the board has appointed the first Technical Director of FAP, effective April 15, 2013, who is responsible for the management of the financial assets of FAP.
During the first quarter of 2011, the Government created an autonomous public entity, Empresa Nacional de Autopistas, referred to as ENA, in order to provide the financing for, and to acquire ownership of, the Corredor Sur and Corredor Norte toll highways in Panama. The Republic subsequently decided to separate the acquisition of the Corredor Sur and Corredor Norte toll roads into two stand-alone transactions. On August 12, 2011, ENA acquired Corredor Sur, and on August 18, 2011, ENA successfully issued and placed $395.0 million in bonds to finance the acquisition of the toll road. The Government contributed $50 million to ENA in connection with the purchase. The transaction was finalized on August 24, 2011. Subsequently, ENA entered into agreements during the second quarter of 2012 for the acquisition of Phases I and IIA and the Panama-Madden segments of Corredor Norte, for a purchase price of $647 million. ENA issued $600 million in bonds and the government contributed approximately $76.2 million in connection with the purchase. The transaction was completed in October 2012.
The Market Makers Program was formally launched on June 21, 2011 through an auction of Treasury Notes with a 5.0% coupon and 2018 maturity (“Notes due 2018”). The indicative amount of the issuance was set at $50.0 million. The volume of bids received for this auction, however, amounted to $632.3 million. The Republic issued $258.0 million of the Notes due 2018, with a weighted average yield of 4.560% and a spread of 229 bps over U.S. Treasury Notes of comparable maturity. On July 26, 2011, the Notes due 2018 were reopened for the first time, with an indicative amount of the issuance set at $50.0 million. The volume of bids received for the reopening, however, amounted to $510.4 million. The Republic issued $100.0 million of the reopened Notes due 2018, with a weighted average yield of 3.977% and a spread of 169 bps over U.S. Treasury Notes of comparable maturity. By the end of 2011, the Treasury Notes due 2018 were auctioned and subsequently reopened three more times. The initial amount of these issuances was set at $200.0 million, the volume of bids received amounted to $1,478.9
D-2
million, and the amount issued totaled $537.9 million. The weighted average price and yield for these Notes due 2018 were 104.65% and 4.212%, respectively. The spread over U.S. Treasury Notes of comparable maturity ranged between 169 bps and 242 bps. Since January 1, 2012, the Government has not issued any Treasury Notes.
In 2012, a new instrument was auctioned through the Market Makers Program, a series of treasury bonds having a 5.625% coupon and a maturity date of 2022 (“Treasury Bonds due 2022”). By the end of 2012, the Treasury Bonds due 2022 had been auctioned in an inaugural offering and 22 reopenings. During 2012, the aggregate of the initial offering amounts set for the Bonds was $925.0 million, the aggregate amount of bids received was $2,840.2 million, and the aggregate amount of Bonds issued was $1,364.0 million. The weighted average price and yield for the Treasury Bonds due 2022 were 111.45% and 4.220%, respectively.
On July 26, 2011, the Ministry of Economy and Finance launched a global securities administration platform administered by Citibank’s Direct Custody and Settlement division, to provide international investors with access to locally issued Panamanian bonds through sub-custody agreements. The Direct Custody and Clearing (DCC) services provide the clearing and settlement services for broker dealers and global custodians to support trading and investing activities around the world.
On May 10, 2011, Law 22 of 2006, which regulates public contracts and related matters, was modified by Law No. 48 of 2011, published in the Gaceta Oficial Digital No. 26,782 of May 11, 2011. The modification grants Dirección General de Contrataciones Públicas, or Public Contracting Authority, the power to impose fines. In addition, it expanded the scope of the law to include regulation of purchases by Caja de Seguro Social (Social Security Fund, or “CSS”) of pharmaceutical products as well as contracts with funding supplied by foreign governments. Law 48 modified provisions that regulate, among other things, exemption from the contractor selection process, and sale of assets under exceptional process, advertising and promotion services contracts.
On November 26, 2012, Cabinet Resolution N° 157 declared a National State of Emergency as a result of severe damage caused to roads and housing infrastructure in the provinces of Panama and Colón, resulting from flooding and landslides from heavy rainfall in November 2012. After a thorough assessment of the situation, the government estimated that the resulting damage totaled approximately $123.2 million, or 0.3% of nominal GDP. In March 2013, the Cabinet approved an extraordinary credit to the National Budget of $123.2 million, allocated to several public institutions responsible for the rehabilitation and reconstruction of the damaged infrastructure and assistance to affected citizens. The largest amounts of extraordinary funds were allocated to the Ministry of Public Works ($83.8 million) and the Ministry of Housing and Territorial Administration ($24.0 million).
In addition, the National Assembly has adopted the following laws ratifying the following treaties for the avoidance of double taxation and prevention of tax evasion: Law 59 of 2012, ratifying the treaty between Panama and the Republic of Ireland; Law 5 of 2013, ratifying the treaty between Panama and the Czech Republic; Law 14 of 2013, ratifying the treaty between Panama and the State of Israel; and Law 13 of 2013, ratifying the treaty between Panama and the United Arab Emirates.
Law 24 of 2013 created the Panama Revenue Authority (Autoridad Nacional de Ingresos -“ANIP”), which will replace the General Directorate of Taxation (Dirección General de Ingresos - “DGI”), currently under the Ministry of Economy and Finance. Following best international practices, this new agency will be given significant autonomy from the Government. The Government expects that the establishment of this new agency will result in increased tax collections, efficiency and greater fiscal transparency. ANIP will execute fiscal policy under the direction of the executive branch. ANIP will be managed by a General Administrator appointed for a seven year period and a board of directors that will oversee its performance and compliance with all legal requirements. In addition, under Law 24 of 2013, ANIP will have an annual budget that cannot be less than the budget assigned to the agency in the previous year.
On September 4, 2012, Mr. Jorge Luis Quijano began his tenure as administrator of the Panama Canal Authority (“PCA”). Mr. Quijano is the successor to Mr. Alberto Alemán Zubieta, whose term expired on September 3, 2012, and who had headed the PCA for the previous 16 years. Before his appointment as administrator, Mr. Quijano held different positions in the Panama Canal, among them as the official in charge of the Panama Canal expansion project and, starting in 2007, as the Executive Vice President of the Department of Engineering and Project Management. Pursuant to the Organic Law of the Panama Canal Authority, Mr. Quijano is appointed for a seven-year term and may be reelected for one additional term by the board of directors of the PCA.
D-3
On April 25, 2013, Law 33 was passed by the National Assembly, creating the National Authority of Transparency and Access to Information. The new government agency will be in charge of promoting transparent, efficient and ethical management of the public sector entities, as well as preventing corrupt practices.
On August 6, 2013, the Government approved Law No. 47 in order to align Panama’s legal framework with international standards for the prevention of the misuse of financial services. The law establishes that every holder of shares issued in bearer form must appoint an authorized custodian to hold the bearer share certificates. The process of immobilization of the instruments will range from two to five years from the date of enactment of the Law, as to bearer shares issued prior to enactment. The law will enter into force two years from its enactment. Bearer shares issued after the law enters into force must be deposited within 20 days of the date of they are approved for issuance. Eligible custodians include local custodians and foreign custodians authorized by law. The local custodians authorized by law consist of general license banks regulated by the Superintendency of Banks of Panama, trusts regulated by the Superintendency, securities houses and central custodians listed and regulated by the Superintendency of the Panama Stock Exchange, and lawyers and law firms registered in the Fourth Chamber of the Supreme Court of Panama in a special registry created for this purpose. The authorized foreign custodians are banks, trusts and financial intermediaries properly licensed to function and established in jurisdictions members of the International Financial Action Task Force on Money Laundering or its associate members and that are registered with the Superintendency of Banks of Panama in a special registry for this purpose.
The Economy
The National Assembly approved Panama’s 2013 budget on October 18, 2012. The 2013 budget contemplates total expenditures of $16.3 billion, with budget estimates based on an anticipated 12.0% growth in nominal gross domestic product (“GDP”), and an anticipated consolidated non-financial public sector deficit of approximately $1,106.5 million (or approximately 2.8% of estimated nominal GDP) for 2013. Under the 2012 budget, nominal GDP for 2012 was expected to be $34.0 billion. Under the 2013 budget, and as of April 2013, the Republic estimated that nominal GDP for 2013 would be approximately $38.8 billion.
As of June 2013, the Republic estimated that nominal GDP for 2013 would be approximately $41 billion. In the first three months of 2013, Panama’s GDP registered an estimated real increase of 7.0% compared to the same period of 2012. The mining sector grew an estimated 27.9% percent in the first three months of 2013, compared to the same period of 2012, primarily due to a greater production of basic materials utilized by the construction industry. Manufacturing activity increased an estimated 2.3% in the first three months of 2013, compared to the same period of 2012, due in part to increased sugar production and production of cement, cast and lime. In the first three months of 2013, the construction sector grew by an estimated 26.6%, compared to the same period of 2012, due to the construction of public and private infrastructure and residential and non-residential projects. The transportation and communications sector grew an estimated 6.4% in the first three months of 2013, compared to the same period of 2012, primarily due to an increase in mobile phone subscriptions and an increase in the number of passengers at Tocumen International Airport. The financial intermediation sector grew an estimated 9.3% in the first three months of 2013, compared to the same period of 2012, primarily due to the performance of the International Banking Center and an increase in new loans.
The agriculture sector increased an estimated 0.7% in the first three months of 2013, compared to the same period of 2012, primarily due to sugar cane production. The fisheries sector increased an estimated 37.4% in the first three months of 2013, compared to the same period of 2012, primarily due to higher international demand for industrial fishing products and shrimp. Commerce decreased an estimated 2.2% in the first three months of 2013, compared to the same period of 2012, primarily due to a slowdown in reexports to Colombia and Venezuela due to trade barriers and the exchange rate regime, respectively. The hotels and restaurant sector increased an estimated 5.6% in the first three months of 2013, compared to the same period of 2012, primarily due to a higher number of tourists and higher tourism expenditure. The real estate sector increased an estimated 8.1% in the first three months of 2013, compared to the same period of 2012, primarily due to an increased level of construction and sale activities in this sector.
Foreign direct investment increased 24.9%, or $245.1 million, during the first quarter of 2013. The increase was primarily due to reinvested earnings.
Public Debt
As of August 31, 2013, Panama’s external debt totaled approximately $12.2 billion, representing an increase of $1.4 billion since December 31, 2012. Panama’s internal debt as of August 31, 2013, was approximately $3.6 billion, representing an increase of $0.1 billion since December 31, 2012. As of August 31, 2013, approximately 74.9% of the total public sector external debt was owed to commercial lenders and bondholders, with 22.5% owed to multilateral institutions and 2.6% owed to bilateral lenders.
D-4
In order to promote the development of Panama’s capital markets, the Government held 10 auctions as part of its Treasury Bill issuances program from January 18, 2011 to October 18, 2011. During that time, Panama issued $322.6 million of zero-coupon Treasury Bills with short-term maturities of one year or less in Panama’s capital markets. As of December 31, 2011, outstanding Treasury Bills amounted to $264.1 million and outstanding Treasury Notes amounted to $1,133.0 million. The Government continued the program of Treasury Bill issuances in 2012 with 12 auctions and 1 direct placement from January 10, 2012 to December 26, 2012. During that time, Panama issued $532.6 million of zero-coupon Treasury Bills with short-term maturities of one year or less in Panama’s capital markets. As of December 31, 2012, outstanding Treasury Bills amounted to $415.1 million and outstanding Treasury Notes amounted to $1,133.0 million. The Government continued the program of Treasury Bill issuances in 2013 with 8 auctions from January 15, 2013 to August 27, 2013. During that time, Panama issued $330.0 million of zero-coupon Treasury Bills with short-term maturities of one year or less in Panama’s capital markets. For information concerning the issuance by the Government of Treasury Notes and Treasury Bonds through the Market Makers Program, see “Recent Developments—Recent Government Actions.”
The Republic has improved its debt-to-GDP ratio in the past five years. The ratio of total public sector debt to GDP as of December 31, 2012 is estimated to have been 39.3%. Using an estimated 2013 year-end nominal GDP figure of $41.0 billion, as of June 2013, the ratio of total public sector debt to GDP is estimated at 37.6%.
International Trade
Panama concluded its free trade negotiations with the United States in December 2006, and signed a free trade agreement with the United States (the “Trade Promotion Agreement”) on June 28, 2007, which was to come into effect upon approval by each country’s legislature and after all conditions for entry into force had been met. The Panamanian Assembly ratified the Trade Promotion Agreement on July 11, 2007. On October 12, 2011, the U.S. Congress ratified the agreement and on October 21, 2011, the President of the United States signed the legislation implementing the Trade Promotion Agreement. The agreement became effective on October 31, 2012.
A free trade agreement between Panama and Peru was approved by the National Assembly on December 13, 2011 and became effective on May 1, 2012. In addition, the Free Trade Agreement between Panama and Canada became effective on April 1, 2013, after ratification by the Canadian Senate on December 14, 2012. The National Assembly through Law 69 of 2010 had approved the treaty. In addition, on March 25, 2013, the National Assembly passed a law that authorized the inclusion of Panama in the European Union - Central America Association Agreement, which came into effect on August 1, 2013.
On June 7, 2011, after signing a tax information exchange agreement with France, Panama moved to the OECD’s list of jurisdictions considered to have substantially implemented the OECD’s tax reporting standards. The Panamanian Assembly, through Law 78 of 2011, published on October 19, 2011, ratified the Treaty between the government of the Republic of Panama and the government of the Republic of France to avoid double taxation and prevent tax evasion.
IMF Relationship
Panama is a member of the International Monetary Fund (“IMF”). Under Article IV of the IMF’s Articles of Agreement, the IMF holds bilateral discussions with its member countries, usually every year, to assess their economic health. The IMF concluded its most recent Article IV consultation with Panama on January 25, 2013.
The Panama Canal
In a national referendum on October 22, 2006, the citizens of Panama voted to approve the canal expansion project proposed by the Panama Canal Authority that includes building a new lane of traffic in conjunction with the construction of a third set of locks which will double the Canal’s capacity, allowing increased traffic and larger ships. Construction began in the third quarter of 2009 and is expected to be completed in 2015. On July 15, 2009, the construction of the third set of locks was awarded to the Grupo Unidos por el Canal consortium, or GUPC, composed of Sacyr Vallehermoso, S.A., Impregilo S.p.A., Jan de Nul n.v., and Constructora Urbana, S.A., for a total base price of approximately $3.3 billion. On August 11, 2009, GUPC provided a performance bond of $400 million to the Panama Canal Authority.
D-5
On December 9, 2008, the Panama Canal Authority signed a $2.3 billion agreement with five multilateral and development organizations to finance the Canal’s expansion project, which is estimated to cost approximately $5.25 billion. The Japan Bank for International Cooperation (“JBIC”), the European Investment Bank (“EIB”), the Inter American Development Bank (“IADB”), Andean Development Corporation (“CAF”) and International Finance Corporation (“IFC”) agreed to provide approximately $800 million, $500 million, $400 million, $300 million and $300 million, respectively, in financing under favorable terms to the Panama Canal Authority. The remaining funds for the expansion project are being derived from the Canal’s regular business operations and implementation of toll increases. To reduce the risk of lowering demand resulting from toll increases, the Panama Canal Authority implemented a three-year phase-in of the toll increase designed to generate the appropriate cash flows needed to finance a significant portion of the program. As of September 30, 2012, the Panama Canal Authority had drawn $1.0 billion from the credit facility for the expansion project, $800 million of which was provided by JBIC and $100 million of which was provided by each of EIB and IADB. Also as of September 30, 2012, the Panama Canal Authority had allocated approximately $3.3 billion of internal funding for the expansion project, a $1.9 billion increase from 2011.
As of June 30, 2013, the total value of all the contracts awarded for the expansion project was approximately $4.36 billion. The Panama Canal Authority continuously monitors the quality of GUPC processes and holds coordination meetings with GUPC quality-control personnel in order to ensure that the work is being performed in accordance with the terms of their agreement.
On August 17, 2012, the Assembly approved the Panama Canal Authority’s budget for its fiscal year ending September 30, 2013, allocating $690.5 million to the Canal’s investment program and $145.4 million to the Canal’s modernization program. On August 20, 2013, the Assembly approved the Panama Canal Authority’s budget for its fiscal year ending September 30, 2014, allocating $269.9 million to the Canal’s regular investment program and $180.1 million to the Canal’s expansion program.
In 2009, the United States, the main source of customers of the Panama Canal, experienced a marked deceleration of economic activity. Trade for the Panama Canal Authority’s fiscal year ended September 30, 2009, was only slightly affected, but toll revenues remained firm despite a decrease in transits. During the Panama Canal Authority’s fiscal year ended September 30, 2010, there was a marginal decline in total transits and tonnage as compared to the fiscal year ended September 30, 2009, from 14,342 transits to 14,230 transits. For the Panama Canal Authority’s fiscal year ended September 30, 2010, toll revenue totaled approximately $1,482.1 million as compared to $1,438.2 million for fiscal year ended September 30, 2009, representing an increase of approximately 3.1%. For the Panama Canal Authority’s fiscal year ended September 30, 2011, toll revenue totaled approximately $1,730 million as compared to $1,482 million in 2010, representing an increase of approximately 16.7%. For the Panama Canal Authority’s fiscal year ended September 30, 2012, toll revenue totaled approximately $1,852.4 million as compared to $1,730 million in 2011, representing an increase of approximately 7.1%.
From the beginning of the Panama Canal Authority’s 2013 fiscal year (October 1, 2012) through June 2013, approximately 10,456 transits passed through the Canal as compared to 11,150 transits for the same period during fiscal year 2012, resulting in a decrease of approximately 6.2%. Approximately 240.0 million PC/UMS (Panama Canal Universal Measurement System) tons of cargo passed through the Canal between October 1, 2012 and June, 2013, as compared to 250.4 million PC/UMS tons during the same period of time for fiscal year 2012. From October 1, 2012 through June, 2013, toll revenue totaled approximately US$1.39 billion, representing an increase of 0.44% as compared to the same period during fiscal year 2012, mainly due to the increase in tolls which came effective in October 2012.
A new toll adjustment went into effect on January 1, 2011 for all segments other than PC/UMS tolls for reefers, which went into effect on April 1, 2011. A toll increase occurred in October 2012 and next toll adjustments will become effective in October 2013.
D-6
TABLE NO. 1
Selected Panamanian Economic Indicators(1)
The following table sets forth Panama’s principal economic indicators for the years 2008 through 2012:
| | | | | | | | | | | | | | | | | | | | |
| | | 2008(R) | | | 2009(R) | | | 2010(R) | | | 2011(P) | | | 2012(P) | |
Economic Data: | | | | | | | | | | | | | | | | | | | | |
GDP (millions, nominal dollars) | | $ | 23,002 | | | $ | 24,163 | | | $ | 27,053 | | | $ | 31,316 | | | $ | 36,253 | |
GDP (millions, constant dollars)(2) | | $ | 18,813 | | | $ | 19,538 | | | $ | 20,994 | | | $ | 23,272 | | | $ | 25,755 | |
GDP (% change, constant dollars)(2) | | | 10.1 | % | | | 3.9 | % | | | 7.5 | % | | | 10.8 | % | | | 10.7 | % |
Service Sector (% change, constant dollars)(2)(3) | | | 9.6 | % | | | 4.8 | % | | | 9.2 | % | | | 10.6 | % | | | 9.1 | % |
Other (% change, constant dollars)(2)(4) | | | 14.1 | % | | | (0.9 | )% | | | (0.9 | )% | | | 9.2 | % | | | 15.8 | % |
GDP Per Capita (constant dollars)(2) | | $ | 5,317 | | | $ | 5,427 | | | $ | 5,733 | | | $ | 6,249 | | | $ | 6,800 | |
Population (millions) | | | 3.54 | | | | 3.60 | | | | 3.66 | | | | 3.72 | | | | 3.79 | |
CPI - Period Average (% change) | | | 8.7 | % | | | 2.4 | % | | | 3.5 | % | | | 5.9 | % | | | 5.7 | % |
Unemployment | | | 5.6 | % | | | 6.6 | % | | | 6.5 | % | | | 4.5 | % | | | 4.0 | % |
Public Finance: | | | | | | | | | | | | | | | | | | | | |
Total Consolidated Non-Financial Public Sector Revenues (millions) | | $ | 6,020 | | | $ | 6,125 | | | $ | 6,874 | | | $ | 7,762 | | | $ | 9,070 | |
Total Consolidated Non-Financial Public Sector Expenditures (millions)(5) | | $ | 5,197 | | | $ | 5,663 | | | $ | 6,669 | | | $ | 7,723 | | | $ | 9,093 | |
Overall Surplus (Deficit) (millions) | | $ | 98 | | | $ | (253 | ) | | $ | (512 | ) | | $ | (703 | ) | | $ | (765 | ) |
As % of Current GDP | | | 0.4 | % | | | (1.0 | )% | | | (1.9 | )% | | | (2.2 | )% | | | (2.1 | )% |
Central Government Surplus (Deficit) (millions) | | $ | 63 | | | $ | (357 | ) | | $ | (683 | ) | | $ | (1,108 | ) | | $ | (1,286 | ) |
As % of Current GDP | | | 0.3 | % | | | (1.5 | )% | | | (2.5 | )% | | | (3.5 | )% | | | (3.5 | )% |
Public Debt (at December 31): | | | | | | | | | | | | | | | | | | | | |
Internal Debt (millions) | | $ | 1,960 | | | $ | 822 | | | $ | 1,191 | | | $ | 1,904 | | | $ | 3,483 | |
External Debt (millions) | | $ | 8,477 | | | $ | 10,150 | | | $ | 10,438 | | | $ | 10,910 | | | $ | 10,782 | |
Public Debt (as % of Current GDP) | | | | | | | | | | | | | | | | | | | | |
Internal Debt | | | 8.5 | % | | | 3.4 | % | | | 4.4 | % | | | 6.1 | % | | | 9.6 | % |
External Debt | | | 36.9 | % | | | 42.2 | % | | | 39.0 | % | | | 35.6 | % | | | 29.7 | % |
Total Public Debt (millions) | | $ | 10,438 | | | $ | 10,972 | | | $ | 11,629 | | | $ | 12,814 | | | $ | 14,265 | |
Trade Data: | | | | | | | | | | | | | | | | | | | | |
Exports (f.o.b.) Goods(6) (millions) | | $ | 10,323 | | | $ | 12,038 | | | $ | 12,675 | | | $ | 16,929 | | | $ | 18,872 | |
Imports (c.i.f.) Goods(6) (millions) | | $ | (14,869 | ) | | $ | (14,218 | ) | | $ | (17,218 | ) | | $ | (22,946 | ) | | $ | (24,623 | ) |
Merchandise Trade Balance (millions) | | $ | (4,546 | ) | | $ | (2,180 | ) | | $ | (4,543 | ) | | $ | (6,017 | ) | | $ | (5,751 | ) |
Current Account Surplus (Deficit) (millions) | | $ | (2,677 | ) | | $ | (179 | ) | | $ | (2,765 | ) | | $ | (3,826 | ) | | $ | (3,267 | ) |
Overall Balance of Payments Surplus (Deficit)(7) (millions) | | $ | 284 | | | $ | 123 | | | $ | 288 | | | $ | 201 | | | $ | 414 | |
Total Official Reserves (at December 31) (millions) | | $ | 2,405 | | | $ | 2,625 | | | $ | 2,154 | | | $ | 1,754 | | | $ | 2,118 | |
| (1) | All monetary amounts in millions of U.S. dollars at current prices, unless otherwise noted. |
| (2) | Constant GDP figures are based on 1996 constant dollars. |
| (3) | Including real estate, public administration, commerce, restaurants and hotels, financial services, the Colón Free Trade Zone (or the “CFZ”), the Panama Canal, transportation and communications, public utilities and other services. |
| (4) | Including mining, manufacturing, agriculture and construction. |
| (5) | Excluding interest payments. |
| (7) | Figures have been calculated pursuant to the V Version of the Balance of Payments Manual prepared by the IMF. |
Sources: Directorate of Analysis and Economic Policies, Office of the Comptroller General, Banco Nacional de Panamá (“BNP”) and Ministry of Economy and Finance.
D-7
THE REPUBLIC OF PANAMA
Area and Population
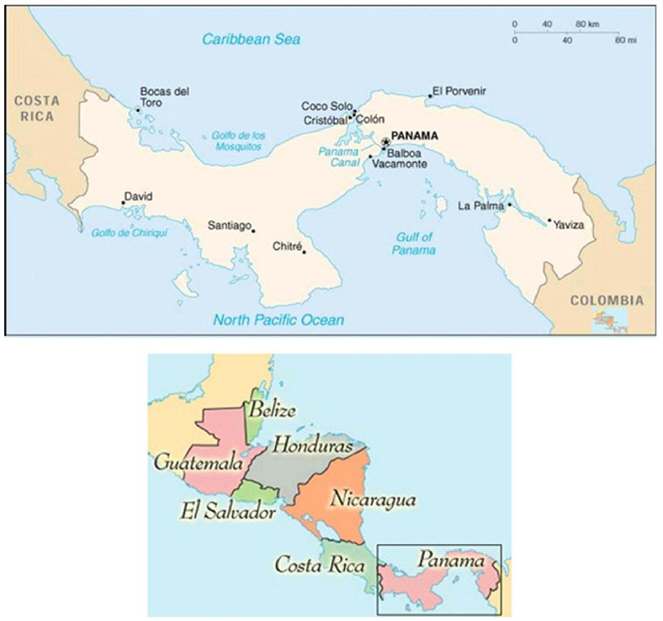
Panama is a republic located on the narrowest point of the Central American isthmus, which connects the continents of North America and South America. It has a coastline of approximately 1,868 miles on the Caribbean Sea and Pacific Ocean and is bordered on the east by Colombia and on the west by Costa Rica. Panama has a national territory of approximately 29,157 square miles situated within its coastline and 345 miles of land borders, and includes numerous coastal islands. The Panama Canal, one of the most important commercial waterways in the world, which connects the Atlantic and Pacific Oceans, bisects the country running northwest to southeast. Panama’s climate is primarily tropical.
As of December 31, 2012, Panama had an estimated population of 3,797,511 million and a population density of 51.1 people per square kilometer.
During the period from 2008 to 2012, the population grew by an average of 2.7% per annum. Approximately 64.6% of Panama’s population lives in cities and towns with more than 1,500 inhabitants, and 6.18% of the population is indigenous, some of whom are seeking greater autonomy from the Government. Of the Panamanian population, 28.5% is under 15 years of age, 64.5% is between the ages of 15 and 64, and 7.1% is over the age of 65. Average life expectancy in Panama is 77.2 years. The infant mortality rate is estimated at 15.4 per 1,000 births. Panama’s official language is Spanish.
In 2012, Panama’s real GDP grew by 10.7% compared to 10.8% in 2011. Inflation, as measured by the end-of-period CPI, was 4.6% in 2012. The Central Government’s current savings for 2012 registered a surplus of $1.9 billion (5.3% of nominal GDP), compared to a surplus of $1.4 billion in 2011 (4.4% of nominal GDP). The Central Government’s overall deficit increased from $1.1 billion in 2011 (3.5% of nominal GDP) to a deficit of $1.3 billion in 2012 (3.5% of nominal GDP). In 2012, Panama’s nonfinancial public sector balance registered a deficit of $765.3 million (or 2.1% of nominal GDP), an increase from a deficit of $703.1 million (or 2.2% of nominal GDP) in 2011.
Panama’s per capita GDP for 2012, expressed in 1996 constant prices, was approximately $6,800. According to the 2010 census, education indicators show that Panama’s literacy rate for people over the age of ten years is approximately 94.5%. As of March 2012, estimates show that 25.8% of the population is considered to be living in poverty while 10.4% is considered to be living in extreme poverty.
Panama Province, the Republic’s largest province, is estimated to comprise 52.0% of Panama’s total population. Colón Province, located at the northern terminus of the Panama Canal, is estimated to comprise 7.0% of the total population.
Historical Information
Panama gained its independence from Spain in 1821 and subsequently joined the Confederation of Greater Colombia, from which Panama declared its independence on November 3, 1903. Several weeks after gaining independence, Panama signed the Hay/Bunau-Varilla Treaty with the United States, which, among other things, granted the United States the right to occupy a ten-mile wide zone and a concession for the construction, maintenance, operation and protection of the Panama Canal (the “Canal Zone”). See “The Panama Canal—General”.
Panama adopted its first constitution in 1904, and, between 1904 and 1968, Panama generally experienced social and political stability and economic growth under a constitutional democracy. During the period immediately following World War II, the Panamanian military interfered with the civilian government, although this interference largely ended by the mid-1950s. Constitutional government continued until October 1968, when the National Guard mounted a military coup and replaced the civilian government. Although the military made nominal efforts during the late 1970s to return to civilian government, the military generally remained in control of the Government until 1989.
Issues related to control of the Panama Canal and the Canal Zone caused considerable unrest in Panama. In 1977, following 13 years of negotiations, Panama signed treaties with the United States that provided for abolishing the Canal Zone in 1979 and the eventual turnover of the Panama Canal to Panama in 1999. See “The Panama Canal—The Canal Treaty of 1977”.
D-8
In 1983, General Manuel Antonio Noriega (“Noriega”) became Commander of the National Guard and assumed effective control of the Government. In the spring of 1987, a political crisis galvanized Noriega opponents and resulted in the formation of a major civilian protest and opposition movement widely supported by civilian organizations, political parties and the business community. This political crisis generated an economic crisis as well.
In response to the ensuing political crisis, in March 1988, the United States suspended its Agency for International Development (“AID”) programs to Panama and blocked preferential sugar quotas, causing further economic disruption. The United States imposed additional economic sanctions that year, including a freeze on all United States payments for the Panama Canal (at that time, approximately $6 million per month), an order prohibiting American citizens and companies from making payments to the Government and a freeze on all Government accounts (and certain additional assets) in the United States.
In December 1989, relations between Panama and the United States deteriorated, culminating in a United States military intervention that resulted in the removal of Noriega. Guillermo Endara (“Endara”), who had been elected by a significant majority of the popular vote earlier in the year, was subsequently sworn in as President.
Since the end of 1989, Panama has enjoyed political and economic stability under democratically elected governments. Relations with the United States have been fully restored. Endara finished his presidential term, and in the spring of 1994, orderly national elections were held. Ernesto Pérez Balladares (“Pérez Balladares”), who was elected President with 33% of the vote in May 1994, finished his presidential term in August 1999. Mireya Moscoso (“Moscoso”), who was elected with 44.8% of the vote in May 1999, took office on September 1, 1999 and completed her presidential term on August 31, 2004. On May 2, 2004, Martín Torrijos (“Torrijos”) was elected President with 47.4% of the vote. He took office on September 1, 2004 and completed his presidential term on June 30, 2009. Ricardo Martinelli (“Martinelli”), who was elected President with 60.0% of the vote on May 3, 2009, took office on July 1, 2009.
The Panamanian military was disbanded in 1990, and, in 1994, by constitutional amendment, the military was abolished. Costa Rica, Panama’s western neighbor, also does not have a military. If Panama were attacked by a foreign force and the neutrality of the Panama Canal were jeopardized, the United States would have the right under treaties related to the Panama Canal to take measures to protect the neutrality of the Canal. The national police force of Panama also has certain defensive capabilities.
Form of Government and Political Parties
Panama is a republic with a representative form of government. In 1972, the original version of the current Constitution was adopted (the fourth in Panama’s history), setting forth the structure of the Government, individual and collective rights and duties, and the division of powers among the executive, legislative and judicial branches.
Executive power is vested in the President and the presidentially-appointed Ministers, who constitute the Cabinet. The President and the Vice-President are each elected by direct, universal suffrage for a term of five years. The President and the Vice-President may not be reelected to the same office within ten years after the expiration of their term. In the event the President is unable to finish a term, the Vice President would succeed to the presidency.
National legislative power is vested in the Assembly, Panama’s unicameral legislative body. The number of electoral circuits, each comprising an average of approximately 61,840 persons, determines the number of legislators; as of August, 2013, the Assembly had 71 seats. The full Assembly is elected by universal suffrage every five years. Members of the Assembly are not subject to limits on the number of terms in office to which they may be elected. The Assembly has, among other powers, the authority to enact legislation, ratify treaties, approve the budget and ratify the appointment of the Comptroller General, the Attorney General and justices of the Supreme Court of Justice (the “Supreme Court”). To be enacted, legislation must be approved after three separate readings by a majority of all legislators or by a majority of legislators present at the session, depending on the substance of the legislation being enacted. The President may veto bills adopted by the Assembly, but the Assembly may override presidential vetoes by a vote of two-thirds of its members. Pursuant to the Constitution, the Assembly may empower the President and the Cabinet to adopt legislation when the Assembly is not in session. The Assembly has the power to amend the Constitution. Amendments to the Constitution may be adopted either by a majority vote of all legislators in two different Assemblies or by a majority vote of all legislators in two sessions of the same Assembly and a public referendum.
On May 3, 2009, Ricardo Martinelli, President of the Cambio Democrático (the “CD”), was elected President of the Republic of Panama for a five-year term with 60.0% of the vote, and took office on July 1, 2009. President
D-9
Martinelli’s coalition, consisting of CD, Partido Panameñista (the “PPA”), MOLIRENA and Unión Patriotica, won a majority of the 71 seats available in the Assembly, securing 15, 21, two and four seats, respectively. The Partido Revolucionario Democrático (the “PRD”) secured 26 seats, the Partido Popular secured one seat, and the Vanguardia Moral de la Patria secured none. Two nonpartisan seats were secured.
On August 30, 2011, President Ricardo Martinelli dismissed Vice President Juan Carlos Varela as Minister of Foreign Affairs, prompting members of Mr. Varela’s party to resign from senior governmental positions and resulting in the termination of the coalition between the President’s party (CD) and that of the Vice President (PPA). In an address to the nation on September 1, 2011, President Martinelli explained his decision, stating that the Minister of Foreign Affairs should be a full-time position, and that Mr. Varela had neglected the duties of his office as a Presidential candidate for the 2014 elections. Mr. Varela, who remains in his elected position as Vice President of the country, is also the President of PPA. The officials from his party who resigned include, most notably, Alberto Vallarino, Minister of Economy and Finance, and Carlos Duboy, Minister of Housing. President Martinelli and the remainder of his Cabinet belong to CD. President Martinelli and his senior economic advisors, including then Vice Minister of Economy Frank De Lima, indicated that the political changes would not alter in any way the course of economic and fiscal policy that has been under way since the beginning of the Martinelli administration in July 2009. Subsequently, on October 6, 2011, Vice Minister De Lima was named Minister of Economy and Finance. Mahesh Khemlani moved from his position as Public Credit Director of the Ministry of Economy and Finance to the position of Vice Minister of Finance on September 1, 2011, replacing former Vice Minister Dulcidio de la Guardia, whose previously planned return to the private sector was unrelated to the political developments mentioned above. On October 10, 2011, following the appointment of Mr. De Lima as Minister of Economy and Finance, Omar Castillo was named Vice Minister of Economy. On June 17, 2013, the Director of Public Credit from the Ministry of Finance Dario A. Espinosa was named Vice Minister of Finance, replacing Mahesh Khemlani.
Judicial power is vested in the Supreme Court and various lower tribunals. The President appoints the nine justices of the Supreme Court for staggered ten-year terms, with two justices being selected every two years, subject to ratification by the Assembly. Lower court judges are appointed by the Supreme Court. The judicial branch prepares its own budget and sends it to the executive branch for inclusion in the general budget presented to the Assembly for approval. The Supreme Court is the final court of appeal and has the power to declare null and void laws, regulations or other acts of the executive or legislative branches that conflict with the Constitution.
Panama is administratively divided into nine provinces and three territories. In each province, executive power is exercised by a governor who is appointed by the President. There are no provincial legislative or judicial bodies. Provincial governments do not have their own independent budgets. Within each province are municipalities that are, in turn, divided into precincts. Each municipality has a municipal council and a mayor who exercises executive power. Mayors and members of municipal councils are elected by direct, universal suffrage for five-year terms. Municipalities levy and collect municipal taxes and adopt their own budgets for financing local projects.
Foreign Affairs and International Organizations
Panama maintains diplomatic relations with 145 countries. Panama is a charter member of the United Nations (“U.N.”) and a member of various other international organizations, including the IMF and the IADB. Panama is a founding member of the Organization of American States and is also a member of the International Bank for Reconstruction and Development (“World Bank”) and the World Bank affiliates, International Finance Corporation (“IFC”) and the Multilateral Investment Guaranty Agency (“MIGA”) (collectively, the “World Bank Group”), as well as a member of the San José Pact, under which Venezuela and Mexico agreed to provide the Central American countries and four Caribbean countries with crude oil and petroleum products under preferential terms. On September 6, 1997, Panama acceded to membership in the World Trade Organization (“WTO”).
Panama consults with various international agencies, such as the World Bank Group and the IADB, regarding its economic program, objectives, projections and policies. In recent years, Panama has utilized the IADB and the World Bank Group for significant external financing. See “Public Sector Debt—External Debt”.
In March 2010, Law No. 5 of 2010 was ratified, approving implementing legislation for the Corporación Andina de Fomento (“CAF”) agreement. Law 5 was published in Gaceta Oficial No. 26,484 on March 8, 2010. CAF is composed of seventeen sovereigns in the Andean region, seven country members and ten Series C shareholders, and was created to benefit the participating members’ development. Panama had already been a CAF Series C shareholder, and as such, was eligible to receive up to eight times its original
D-10
investment in CAF. During the general assembly of shareholders in Caracas, on March 3, 2010, the President of CAF announced the shareholders’ decision that the Republic had met all the conditions to qualify as a Series A country member of CAF, including subscribing to at least $36.0 million in guarantee capital stock. As a Series A country member, the Republic has access to higher financing amounts of up to 15% of CAF’s portfolio, which was $16.3 billion as of December 31, 2012; higher financing possibilities for Panama’s private sector compared to under Panama’s past status as a Series C member; access to a wide variety of technical cooperation programs of CAF; participation as a voting member; and the opportunity to forge better economic and political relationships with the other country members. The Republic finalized its membership as a Series A country member of CAF in July 2010. At August, 2013, the Republic had outstanding borrowings of $646.3 million from CAF. See “Public Sector Debt—External Debt”.
D-11
THE PANAMANIAN ECONOMY
General
Panama’s unique geographic position, service economy (including the Panama Canal) and monetary regime anchored on the use of the U.S. dollar as legal tender are major factors in Panama’s economic performance.
Panama has used the U.S. dollar as its legal tender since shortly after gaining its independence. The national currency, the Balboa, is used primarily as a unit of account linked to the U.S. dollar at a ratio of one dollar per one Balboa. The Government does not print paper currency, although a limited amount of coinage is minted. Panama’s monetary system is based on its Constitution (beginning with the 1904 Constitution, which established the Balboa) and Panamanian laws expressly recognizing the U.S. dollar as legal tender. There are no Panamanian foreign exchange controls or reporting requirements, and capital moves freely in and out of the country, without local currency risk. Under Panama’s unique monetary system, foreign exchange reserves are not needed to support the currency.
The absence of both a national printed currency and a Balboa exchange market diminishes the significance of the balance of payments as an indicator of the Government’s external debt service capacity. Fiscal policy, therefore, is a more accurate indicator of the accumulation and drawdown of Government reserves available for sovereign debt service. Moreover, this monetary system imposes an element of discipline on Panamanian authorities in the areas of monetary and fiscal policy. Panama is limited in its ability to conduct a stimulative monetary policy and can finance public sector deficits only through borrowing.
In 2008, the non-financial public sector registered a surplus of 0.4% of GDP. In 2009, the non-financial public sector registered a deficit of 1.0% of GDP. In 2010, the non-financial public sector registered a deficit of 1.9% of GDP. In 2011, the non-financial public sector registered a deficit of 2.2% of GDP and in 2012 the non-financial public sector registered a deficit of 2.1% of GDP.
From 2008 to 2012, Panama experienced an average annual rate of inflation, as measured by the end-of-period consumer price index, or CPI, of 5.2%. In 2012, the annual rate of inflation, as measured by a revised end-of-period CPI with a base year of 2002, was estimated at 4.6%.
The Panamanian economy is dominated by a large service sector, which has represented an average of over three-quarters of GDP since 2008. The manufacturing and agricultural sectors represent far smaller percentages. Historically, the Panamanian economy has been characterized by an imbalance between the open, internationally-oriented service sector and the fairly closed manufacturing and agricultural sectors, where productivity has been considerably lower and government policies have impeded efficient resource allocation. See “Structure of the Panamanian Economy—Principal Sectors of the Economy”.
While much of the service sector economic activity is represented by activities associated with public administration, commerce and real estate, the significant, internationally-oriented activities of this sector distinguish the Panamanian economy. The Panama Canal has played a significant role in the economy, accounting for an average of 3.7% of GDP from 2008 to 2012. The withdrawal of the U.S. military and reversion of facilities in the former Canal Zone, culminating with the reversion of the Canal itself at the end of 1999, had substantial fiscal and macroeconomic impacts on Panama and its economy. These impacts have largely been absorbed by Panama in the years since the withdrawal.
In the Canal’s 2012 fiscal year (which ended September 30, 2012), commercial oceangoing traffic registered 14,684 transits, and the Canal’s toll revenue was $ 1,852.4 million.
Another significant and distinctive factor in the Panamanian economy is the CFZ, a tax-favored export and import trading zone located near the Atlantic entrance to the Canal, which has accounted for approximately 7.0% of GDP between 2008 and 2012. See “The Colón Free Zone”. As a result of the dollar-based economy, the international trade associated with the Panama Canal and the CFZ, and certain legislative initiatives, Panama has also developed an important banking sector that has represented an average of 6.7% of GDP from 2008 to 2012. There is no lender of last resort or deposit insurance in Panama. See “Financial System—The Banking Sector”.
D-12
Reforms and Development Programs
In December 2005, the Torrijos administration achieved one of its primary legislative objectives when the Assembly approved Law No. 51, which reformed Panama’s social security system by, among other things, requiring employees to make contributions into the social security system for 20 years (up from the prior 15-year requirement) before becoming eligible to receive benefits and gradually transitioning from the current defined benefits system to personal savings accounts. Law No. 51 also establishes the obligation to support the Disability, Old Age and Death Benefit System (Régimen de Invalidez, Vejez y Muerte (“IVM”)) with annual deposits to an administration and investment trust created for the sustainability of the IVM of $75 million in each of the years 2007, 2008 and 2009, $100 million in each of the years 2010, 2011 and 2012, and $140 million in each of the years 2013 through 2060.
Trade Liberalization. Trade liberalization received new impetus under the Pérez Balladares administration. Panama’s accession to the WTO became effective September 6, 1997. Panama had begun lowering its duties and quantitative restrictions in anticipation of WTO accession, although significant duties permitted under WTO rules remained in place for certain products. On January 1, 1997, a series of measures became effective that provided for the: (i) conversion of all existing quotas and import permits to ad valorem tariffs; (ii) conversion of all remaining specific or mixed tariffs to ad valorem tariffs; and (iii) setting of a tariff ceiling of 40% for industrial products and 50% for agri-industrial products. A major piece of legislation designed, in part, to remove barriers to Panama’s accession to the WTO, was passed by the Assembly in June 1995 called the Ley de Universalización de Incentivos Tributarios a la Producción. As of September 1, 1997, tariffs were reduced to 10% for components of bread, cooking oils and numerous construction industry inputs, including steel and cement. The Ministry of Planning and Economic Policy, now referred to as the Ministry of Economy and Finance, retained a consultant to study further lowering of duties below those agreed with the WTO, and on October 10, 1997, the Cabinet approved additional reductions of tariffs on certain specific products to 15%. Upon assuming office, the Moscoso administration increased tariffs for certain agricultural products in October 1999. See “Foreign Trade and Balance of Payments—Tariffs and Other Trade Restrictions”.
Panama has concluded the negotiation of comprehensive free trade agreements with Costa Rica, Honduras, Guatemala and Nicaragua. Law No. 17 of February 13, 2008, published in the Gaceta Oficial Digital No. 25,982 of February 20, 2008, serves as the ratification of the free trade agreement between Panama and Costa Rica; the effective date of the agreement was November 23, 2008, and its Tariffs Program entered into effect on January 1, 2009. Law No. 23 of April 25, 2008, published in the Gaceta Oficial Digital No. 26,032 of May 5, 2008, serves as the ratification of the free trade agreement between Panama and Honduras; this agreement became effective on January 9, 2009. The free trade agreement between Panama and Guatemala was ratified by the Assembly of Panama under Law No. 48 of 2008, published in Gaceta Oficial Digital No. 26,084 of July 16, 2008, and became effective on June 20, 2009. The free trade agreement between Panama and Nicaragua was ratified by the Assembly of Panama under Law No. 29 of 2009, published in Gaceta Oficial Digital No. 26,309 of June 23, 2009, and became effective on November 21, 2009 with the tariff reduction program taking effect on January 1, 2010. Under these commercial agreements with Costa Rica, Guatemala, Honduras and Nicaragua, and an earlier agreement with El Salvador, nearly 90% of Panama’s total exports to these countries enter duty-free.
On January 12, 2007, the Assembly approved Law No. 7, which implements the free trade agreement signed with Chile in June 2006. This free trade agreement entered into force on March 7, 2008, eliminating nearly 93% of Chile’s tariffs on goods immediately, with remaining tariffs phased out over 10 years.
In 2006, more than 96% of Panama’s merchandise exports to the United States entered duty-free considering the application of various trade preference programs designed to promote economic development, such as the Caribbean Basin Initiative and the Generalized System of Preferences. The Trade Promotion Agreement with the United States is expected to expand and secure those benefits for Panama in the long term. Upon effectiveness, this agreement will eliminate nearly 71.2% of Panama’s tariffs on industrial goods immediately, with remaining tariffs phased out over 10 years. In return, the United States will eliminate immediately 99.7% of tariffs applied to industrial goods from Panama. Panama concluded its free trade negotiations with the United States in December 2006, and signed the Trade Promotion Agreement on June 28, 2007 which was to come into effect upon approval by each country’s legislature and after all conditions for entry into force have been met. The Panamanian Assembly ratified the Trade Promotion Agreement on July 11, 2007. On October 12, 2011, the U.S. Congress ratified the agreement and on October 21, 2011, the President of the United States signed the legislation implementing the Trade Promotion Agreement. The agreement became effective on October 31, 2012.
On August 11, 2009, Panama and Canada entered into a free trade agreement. Under the agreement, Panama’s fresh and processed maritime products, representing approximately 30% of its exports to Canada, will have better access to the Canadian
D-13
market, and Canada will immediately eliminate 100% of its tariffs on imports from Panama. In addition, the agreement will remove tariffs on 90% of goods imported from Canada, with the remaining ones to be phased out over the next decade. The countries’ legislative bodies completed their review of the Free Trade Agreement on March 31, 2010, and on May 14, 2010, the Free Trade Agreement became effective.
In December 2009, Panama and Colombia announced that they would begin negotiations on a free trade agreement to increase trade and economic integration between the two countries. As of September 2013, the two countries have completed negotiations rounds, but complete review and ratification of the free trade agreement remains pending. For more information on trade agreements, see “Structure of the Panamanian Economy—Foreign Investment in the Private Sector”.
Other Economic Reforms. On November 6, 2009, Law 69 of 2009, governing public contracts, was ratified. This law was published in the Gaceta Oficial Digital No. 26,402-C of November 6, 2009. The law prohibits modifications or amendments to investment contracts or concession agreements entered into by public sector entities in Panama that would be considered detrimental to the Republic.
On May 10, 2011, Law 22 of 2006, which established a system for government procurement in Panama, was modified by Law No. 48 of 2011, published in the Gaceta Oficial Digital No. 26,782 of May 11, 2011. The modification grants Dirección General de Contrataciones Públicas, or Public Contracting Authority, the power to impose fines. In addition, it expanded the scope of the law to include regulation of acquisitions by Caja de Seguro Social (Social Security Fund, or “CSS”) of pharmaceutical products as well as contracts with funding supplied by foreign governments. Law 48 modified provisions that regulate, among other things, exemption from the contractor selection process, and sale of assets under exceptional process, advertising and promotion services contracts.
During 2007, two export processing zones, or EPZs, were created in Panama. EPZs are well-defined areas for establishing industrial, commercial and service facilities for operation in a free trade system. In June 2007, Zona Procesadora Chilibre was created, and in August 2007, Zona Procesadora Colón Maritime Investor, S.A. was created, to provide the infrastructure, facilities and support systems necessary to attract new business and foreign investments. As of April, 2013, there were 72 official registrations for call centers.
Fiscal Reforms. On January 11, 2007, Law No. 5 was passed which facilitated the process by which companies are formed. The law was created with the intention to foster increased investments within the country and to promote new business ideas. This law also protects commercial enterprises from unfair competition.
On June 5, 2008, Law No. 34 of 2008 was ratified, establishing a Social and Fiscal Responsibility Regime, in order to promote sound fiscal policies and management. This Law was published in the Gaceta Oficial Digital No. 26,056 of June 6, 2008, and came into effect on January 1, 2009. The Social and Fiscal Responsibility Regime requires any new government to present, during the first six months of its administration, a multi-year social strategy, a five-year financial plan and the macroeconomic criteria to manage public expenditures and to incentivize current savings. It sets forth a ceiling on the non-financial public sector fiscal deficit in any year in relation to GDP. Under Cabinet Resolution No. 163 issued on December 29, 2009, published in the Gaceta Oficial Digital No. 26,445-A on January 12, 2010, the Government approved the Strategic Government Plan of the Martinelli administration for the next five years. The Strategic Government Plan seeks to boost economic and social development in order to achieve sustained economic growth, reduce poverty and improve income distribution. In addition to creating the Panama Savings Fund, Law No. 38 of June 5, 2012 amended the Social and Fiscal Responsibility Law in order to increase the fiscal deficit ceiling of the non-financial public sector to 2.9% of GDP for 2012, 2.8% for 2013, 2.7% for 2014, 2.0% for 2015, 1.5% for 2016 and 1.0% for 2017. The reform also allows a temporary suspension of the fiscal deficit ceiling in cases of emergency or a deceleration in economic activity. On November 26, 2012, Cabinet Resolution N° 157 declared a National State of Emergency as a result of the severe damage caused to roads and housing infrastructure in the provinces of Panama and Colón, resulting from flooding and landslides from heavy rainfall in November 2012. After a thorough assessment of the situation, the government estimated that damage caused by this natural event totaled approximately $123.2 million, or 0.3% of nominal GDP, thereby raising the effective fiscal deficit ceiling of the non-financial public sector for 2012 to 3.1% of nominal GDP. In March 2013, the Cabinet approved an extraordinary credit to the National Budget of $123.2 million, allocated to several public institutions responsible for the rehabilitation and reconstruction of the damaged infrastructure. The largest amounts of extraordinary funds were allocated to the Ministry of Public Works ($83.8 million) and the Ministry of Housing and Territorial Administration ($24.0 million).
D-14
On March 9, 2009, the Financial Stimulus Program, referred to as Programa de Estímulo Financiero or PEF, was created under Cabinet Decree No. 9, and published in the Gaceta Oficial Digital No. 26,237 of March 10, 2009. The PEF was established to compensate for the reduction in credit available to Panamanian banks from international sources due to reductions in credit lines from banks abroad and from the international financial markets, in order to promote economic stability and employment growth during the global economic crisis. On June 2, 2009, pursuant to Cabinet Decree No. 19, the Republic modified the fundamentals of the program and reduced the amount of the PEF from $1.1 billion to $610 million, borrowed from Corporación Andina de Fomento (“CAF”), and BNP, leaving open the possibility for BNP to enhance its support to the program in the future. Funds received under the PEF were deposited in a trust administered by BNP (as authorized under Cabinet Resolution No. 28, dated March 16, 2009), and benefit from a guarantee issued by the Republic. The PEF and its trust were duly implemented after the credit facilities were executed, and made publicly available to the Panamanian financial institutions. Panamanian financial institutions seeking access to the PEF were required to provide full collateral for their borrowings. Interest was charged at rates determined with reference to the interest on the loans used to fund the trust and to the term of each loan. Additionally, fees were assessed to cover administrative costs of the program. In connection with the PEF, President Martinelli issued Executive Decree No. 89, dated July 24, 2009, appointing the new Directive Council of the PEF, which was comprised of five individuals, including the General Manager and Risk Manager of BNP, in order to advise the Government on applicable measures to counteract the effects that the global economic crisis may have on Panama and to recommend credit policies applicable to the program. The PEF was cancelled at the end of 2010 after it was determined that the impact of the financial crisis was less than anticipated as indicated by the high levels of liquidity maintained within the Panamanian financial institutions.
On September 17, 2009, Law No. 49 of 2009 was ratified, modifying the Panamanian Fiscal Code. This law was published in the Gaceta Oficial Digital No. 26,370-C of September 17, 2009, and came into force on September 17, 2009, with the exceptions of Articles 9, 10 and 29, which came into effect on January 1, 2010. Currently, the Republic has one of the lowest tax rates in Latin America, which accounts for approximately 10% of GDP. In March 2010, Law No. 8 of 2010 was ratified, modifying the Panamanian Fiscal Code by adopting fiscal measures and creating the Administrative Tax Tribunal. Law 8, published in the Gaceta Oficial Digital No. 26,489-A of March 15, 2010, went into effect on July 1, 2010, with the exception of Articles 9 and 10, relating to personal and corporate income tax rates, which were retroactively effective as of January 1, 2010. This law increased the value-added tax, known as ITBMS, for the first time since it was established in 1976 pursuant to Law No. 75 of December 22, 1976, from 5% to 7%. The modified law also reduced the corporate income tax rate from 30% to 27.5%, effective as of January 1, 2010, with a further reduction, subject to certain exceptions, to 25%, beginning January 1, 2011. Personal income tax rates were modified to reflect the following: (1) taxable income up to $11,000 will have a 0% tax rate; (2) taxable income of more than $11,000 but less than $50,000 will be taxed at 15%; and (3) taxable income of $50,000 or more will be taxed in the amount of $5,850 for the first $50,000 and at 25% for any amount above $50,000. Law 8 of 2010 modified the Fiscal Code to allow the Republic to generate additional revenue to provide for public services such as social expenses, security expenses and infrastructure development. As a result of the modifications to the Fiscal Code, the Republic received approximately $6.8 billion in revenue for 2010, compared to $6.3 billion in 2009, representing an increase of approximately $606.1 million, or 9.7%. The Fiscal Code was again amended on June 30, 2010, pursuant to Law No. 33 of 2010, published in the Gaceta Oficial Digital No. 26,566-A. Among other reforms, Law 33 of 2010 added an additional chapter to the Fiscal Code to cover double taxation treaties so that Panamanian taxpayers can invoke a clause in the treaty itself, as well as refer to the new chapter of the Fiscal Code, in order to avoid paying taxes to two countries on the same transaction or activity.
On April 5, 2011, Law No. 31 was ratified, modifying the Panamanian Fiscal Code. This law was published in the Gaceta Oficial Digital No. 26,757-A. The modified law implemented, among other things, a dividend tax for every loan or credit that companies provide to their shareholders. The dividend tax consists of a withholding of 10% of the amount of a loan or credit, irrespective of income. In the case of bearer shares, the dividend tax increased to 20%. Under the modified law, only legal entities producing taxable income that are subject to income tax will be required to pay a Monthly Advance of Income Tax (AMIR), a tax introduced by Law No. 8 of March 2010.
In August 2012, Law No. 52 eliminated the AMIR that was introduced by Law No. 8 of March 2010. The application of the AMIR did not meet the expectations of the authorities and created additional administrative burden for taxpayers and for the revenue authority. AMIR was replaced by the previous system of estimating income tax payments based on the previous year’s income.
D-15
Social Developments. Panama’s social spending generally does not involve income subsidies or other welfare benefits but instead focuses on spending in the social sectors of health, education and housing. In 2011, health, education and housing represented approximately 41.2% of the Government’s budget. In 2012, health, education and housing represented approximately 40.0% of the Government’s budget.
In May 1995, the Government created the Development Trust Fund, pursuant to Law No. 20, and on June 27, 2000, the Assembly approved Law No. 22, which approved the use of the Development Trust Fund principal for social development programs and infrastructure projects. The laws provided that up to $200 million may be drawn down from the Development Trust Fund to support infrastructure projects. The disbursements are to be made against invoices presented to the Ministry of Economy and Finance. See “Structure of the Panamanian Economy—The Role of the Government in the Economy”. From 2006 through 2010, funds were available in the following amounts: $70.0 million to water supply; $30.0 million to irrigation and agricultural projects; and $97.0 million to road rehabilitation. During the same period, $69.8 million had been disbursed to fund water supply projects; $27.3 million to fund irrigation and agricultural projects; and $94.5 million to fund road rehabilitation projects. From inception through December 31, 2010, approximately $194.3 million had been disbursed from the Development Trust Fund under Law 20 of 2002 to support infrastructure projects, $4.9 million of which was disbursed in 2010. No funds were disbursed in 2011.
In June 2012, the Government created the Fondo de Ahorro de Panamá, referred to as the Panama Savings Fund or the FAP, pursuant to Law No. 38 of 2012. The initial capital of the Fund will come from the Fondo Fiduciario para el Desarrollo, referred to as the Development Trust Fund. Once the Fund has been capitalized and it begins operations by 2015, the Development Trust Fund will cease to exist. According to the Fund’s accumulation rule, every year income from the Canal of up to 3.5% of GDP will be deposited in the National Treasury and any excess over that amount will be transferred to the Fund. The Fund will have two main objectives: macroeconomic stability in cases of national emergencies and long-term national savings. The Fund will also be allowed to repurchase and retire Panama sovereign debt once the size of the Fund reaches 5.0% of GDP. The Fund will be managed by the Ministry of Economy and Finance. In addition, Law 38 provides that Banco Nacional de Panamá (“BNP”) will serve as the Fund’s Trustee and that the Fund will have an independent Board of Directors in charge of safeguarding the assets.
Law 87 of December 4, 2012 modified article 5 of Law 38 of 2012. This change affected only the rules relating to the withdrawal of funds from the FAP, restricting the possibility of using funds immediately in respect of natural disasters. In August 2013, Law 48 was approved, which further modified Law 38 of 2012. The amendment establishes that funds resulting from future sales of government-owned companies will be accumulated in the FAP and may only be used to finance reconstruction efforts for damage caused by natural disasters, when such damage represents at least 0.5% of nominal GDP or more.
The President has appointed the first board of directors of FAP and the board has appointed the first Technical Director of FAP, effective April 15, 2013, who is responsible for the management of the financial assets of FAP.
In April 2001, Panama entered into a $47.9 million loan agreement with the World Bank to finance the Programa Nacional de Administración de Tierras, a national land management program. The program was restructured in March 2006, providing equitable access to land and land administration services in selected rural, semi-urban and urban areas, with a total amount financed of $54.0 million. As of July 31, 2013, the loan has a remaining balance of $14.3 million, which must be paid by October 2015.
On August 4, 2009, Law 44 of 2009 was ratified, establishing a Special Program of Economic Assistance under the Ministry of Social Development. This Law was published in the Gaceta Oficial Digital No. 26,338-A of August 4, 2009. The program consists of issuing a monthly payment of $100 to all Panamanians who are 70 years or older and who do not receive retirement or pension benefits. With this program, the Government seeks to improve the quality of life for the elderly currently living in poverty. In August 2013, Cabinet Resolution No. 147 authorized the Minister of Social Development to propose a modification of Law No. 86 of November 2010, in order to raise this monthly installment by $20 to $120, beginning in fiscal year 2014.
On August 25, 2009, President Martinelli issued Executive Decree No. 55, published in the Gaceta Oficial Digital No. 26,369 of September 16, 2009. This decree created the “Fondo Solidario de Vivienda” under the Ministry of Housing. This fund gives low-income families up to $5,000 per family to use on the purchase of a home not to exceed $30,000. This contribution was given to families that have an income of less than $800 a month. In 2011, Executive Decree No. 55 was modified in order to increase the maximum value of a property to $35,000. In addition, this contribution will be given to families that have an income of less than $800 a month.
D-16
During 2010, the Ministry of Housing invested $17.0 million in housing assistance for approximately 3,000 families, In June 2013, Executive Decree No. 384 raised the maximum value of the property eligible for this subsidy to $40,000 not including legal and closing fees. In addition, eligibility was extended to families that have an income of less than $1,200 a month.
Environmental Law. During 2008 and 2009, numerous executive decrees were enacted concerning environmental policies, including decrees relating to the protection of whale sharks, establishing a national committee on climate change and changing the general environmental law. In addition, many resolutions were enacted in 2009, such as the protection of specific regions, the approval of the management plan for a national park and a regulation for wildlife preservation.
Infrastructure. Beginning in 2007, Panama has experienced a significant increase in infrastructure development spending. In 2008, the Ministerio de Obras Públicas (Ministry of Public Works, also referred to as MOP), invested $248.2 million in projects relating to the construction, rehabilitation and maintenance of all national highways, consisting of 13,615 kilometers of transportation networks. In April 2009, the first phase of the 42 kilometer trans-isthmus toll road connecting Panama City and Colón, referred to as the Madden-Colón highway, became operational. The first phase of the Madden-Colón highway cost approximately $299.6 million and connects Madden to Quebrada Lopez. In July 2012, the second phase of the Madden-Colón highway, connecting Quebrada Lopez to Cuatro Altos, was completed following an investment of approximately $213.6 million.
In March 2012, ground was broken for a 10 km dual two-lane highway extension of the Corredor Norte toll road with completion expected by April 2014. The extension will connect Panama City with the densely populated area of Tocumen and the International Airport, and will complete the peripheral loop around the capital linking Phase I and Phase IIA with the Pan-American Highway. The project has a cost of approximately $140 million. Construction began with the help of a $53 million bridge facility from the Development Trust Fund. Currently all rights and obligations to construct and operate Phase IIB are held by ENA, which also served as a vehicle to provide the financing for, and to acquire ownership of, the Corredor Sur and Corredor Norte toll highways in Panama. See “The Panama Canal - Other Trans-Isthmus Transportation.”
On July 2, 2009, President Martinelli issued Executive Decree No.150, published in the Gaceta Oficial Digital No. 26,316 of July 3, 2009, which came into effect on July 2, 2009 in order to provide Panamanians with a more efficient mass transportation system. This decree created the Secretariat of the Metro for Panama, which is part of the Ministry of the Presidency and is responsible for the organization and execution of all actions necessary with respect to the design, execution, administration, operation and maintenance of the metro transportation system project, known as “El Metro de Panamá”. The consortium known as “Consorcio Linea Uno”, formed by Odebrecht (a Brazilian company) and FCC (Fomento de Construcciones y Contratas - a Spanish company), is in charge of the construction of the first line. The construction started in March 2011 and is expected to be completed 38 months later, by 2014. The cost of the first phase is estimated to be approximately $1.88 billion, which the government is financing through central government borrowings from multilateral and bilateral lending institutions. See “Public Sector Debt—External Debt.”
Proyecto Mesoamérica. In June 2001, Panama, together with Mexico, Nicaragua, Guatemala, Honduras, El Salvador, Belize and Costa Rica, signed the Puebla-Panama Plan, a development plan to be supported by up to $2 billion in loans from the IDB and other multilateral organizations. The development would include joint management of natural resources and infrastructure projects such as highways, roads, electricity, seaports, airports, gas pipelines and communications as well as a plan for environmental protection. During 2007, Plan Puebla-Panama continued its initiative to develop infrastructure projects.
In 2008, the presidents of the countries in Central America, Colombia and Mexico agreed to restructure the Plan Puebla-Panama into the Mesoamerica Project, seeking to strengthen regional integration and to create new opportunities among the member countries. In 2009 the presidents of Belize, Colombia, Costa Rica, El Salvador, Guatemala, Honduras, Mexico, Nicaragua, Panama and the Dominican Republic adopted the institutional framework for the Mesoamerica Project.
One of the initiatives of the Mesoamerica Project is a regional electricity market (MER). The MER includes the construction of the Energy Transmission System for the Central American Countries (Sistema de Interconexión Eléctrica para los Países de América Central - SIEPAC) and the energy transmission systems between Mexico and Guatemala (already in operation), and between Panama and Colombia. SIEPAC’s construction began in 2006 under the Plan Puebla-Panamá and continued under the Mesoamerica Project initiative.
D-17
As of November 30, 2012, 1,663.6 kilometers of energy transmission lines were finished or 95.1% of the complete project. On June 1, 2013, the regulatory framework for the Central American Regional Electricity Market (MER) entered into effect. The estimated total cost of the project is $494.0 million.
Prevention of Money Laundering and Other Crimes. In April 2009, the Group of Twenty Finance Ministers and Central Bank Governors (G-20), established in 1999 to systematically bring together industrialized and developing economies to discuss key issues in the global economy, announced an agreement targeting tax havens. The G-20 noted that the Organisation for Economic Cooperation and Development (OECD), had published a “grey list” of approximately 40 jurisdictions, including Panama, that committed to internationally agreed-upon tax reporting standards, but had not yet fully implemented them.
As of August 2013, Panama has signed treaties and concluded negotiations in order to avoid double taxation with the following countries: Austria, Bahrain, Barbados, Belgium, South Korea, United Arab Emirates, Spain, France, Netherlands, Ireland, Israel, Italy, Luxemburg, Mexico, Portugal, Qatar, United Kingdom, Czech Republic and Singapore. Most OECD member countries have been invited to negotiate, as well as important trading partners such as India and Japan. On June 7, 2011, after signing the tax information exchange agreement with France, Panama moved to the OECD’s list of jurisdictions considered to have substantially implemented the tax reporting standards.
Economic Performance—2008 Through 2012
Economic Performance in 2008. During 2008, Panama’s economy grew in all sectors. Panama’s GDP registered a real increase of 10.1% in 2008 compared to 12.1% in 2007. Average inflation was 8.7% in 2008, compared to 6.5% in 2007. As Panama is a net importer, the decrease in the price of oil and other commodities during the end of 2008 and early 2009 had a short-term positive impact on the Panamanian economy, relieving some of the inflationary pressures and increasing the disposable income of the population in general. The open unemployment rate decreased slightly from 4.7% in 2007 to 4.2% in 2008.
In 2008, the primary sector grew an estimated 11.9% compared to 2007, primarily due to the mining sector, which grew by an estimated 30.9%, and the agriculture sector, which grew an estimated 8.3%. The growth in the mining sector was primarily due to a greater demand for raw materials used by the construction sector, and the growth in the agriculture sector was due to increases in the amount of land used for farming. The construction sector grew by an estimated 30.7% in 2008, as compared to 2007, due to the construction of new high-rise buildings and family residences, the expansion of certain container ports and the Government and the Panama Canal Authority’s investments in infrastructure. However, construction activity decreased by approximately 35.0% in September 2008, 3.9% in October 2008 and 43.1% in November 2008, in each case as compared to the same months in 2007, due primarily to the effects of the global economic crisis. The total value of new construction, additions and repair projects approved in Panama increased 18.7% in 2008 as compared to 2007. During the first six months of 2008, the value of these projects increased over 50% as compared to the same period in 2007; however, during the final quarter of 2008, when the global economic crisis became more pronounced, the value of construction projects approved fell 13.9% as compared to the same period of 2007.
The CFZ grew an estimated 6.1% in 2008 as compared to 2007. The CFZ was part of the PEF (Panama’s Financial Stimulus Program), designed by the Government to offset certain effects of the global economic crisis and to maintain the proper functioning of the productive sectors of the economy. Ongoing projects within the CFZ, including an enhanced computer system for container movement and the completion of the Don Alberto Motta Highway, may have a positive impact in contributing to maintaining the efficiency and competitiveness of the CFZ operations.
The commerce, hotels and restaurant sector grew an estimated 8.0% in 2008 as compared to 2007, primarily due to increased tourism. The transportation and communications sector grew 17.8% in 2008 as compared to 2007, primarily due to an increase in cargo tonnage at ports, increased air travel and the use of cellular phones and the Internet. Specifically, the Republic’s largest regional air carrier, COPA Holdings, S.A., experienced a 20.0% increase in traffic during 2008 as compared to 2007. In December 2008, COPA reported that air traffic increased 16.5% as compared to December 2007. Cable & Wireless Panamá S.A., a telecommunications entity 49% owned by the Government, experienced a 14.0% increase in sales in their fiscal year ended March 31, 2008, as compared to their fiscal year ended March 31, 2007, primarily due to growth in broadband internet usage, mobile
D-18
devices and international communications. The financial intermediation sector grew an estimated 14.1% in 2008 as compared to 2007, primarily due to greater development in international banking. The real estate sector grew an estimated 7.2% in 2008 as compared to 2007.
The Government’s current savings for 2008 registered a surplus of $1.0 billion (4.5% of nominal GDP), compared to a surplus of $982.2 million in 2007 (5.0% of nominal GDP). The Government’s overall surplus decreased from approximately $239.9 million in 2007 (1.2% of nominal GDP) to approximately $63.4 million in 2008 (0.3% of nominal GDP). In 2008, Panama’s non-financial public sector balance registered a surplus of approximately $97.8 million (or 0.4% of nominal GDP), down from $682.8 million (or 3.5% of nominal GDP) in 2007.
Economic Performance in 2009. Despite a global economic slowdown, Panama’s economy grew during 2009, registering a real GDP increase of 3.9% during 2009 compared to 10.1% in 2008. Average inflation was 2.4% in 2009. The open unemployment rate increased from 4.2% in 2008 to 5.2% in 2009.
The transportation and telecommunications sector grew by an estimated 13.3% in 2009, compared to 2008 (contributing 18.0% to GDP in 2009 compared to 16.5% in 2008), due to an increase in revenue by telecommunications companies primarily as a result of increased use of prepaid cellular plans and contracts, internet service and international calls. Mining activities increased 4.4% in 2009 compared to 2008, reflecting a contribution to GDP of 1.4%, due to high demand for mining products from construction activity. The construction industry grew by 4.5% in 2009, compared to 2008, due to public and private investment in primarily non-residential civil engineering projects, including, among others, hydropower projects, expansion of the Panama Canal and the expansion of ports and road rehabilitation projects carried out by the Government. The contribution of the construction industry to GDP maintained its level of 6.0% from 2008 to 2009. The public utilities sector grew by 7.5% in 2009 compared to 2008, representing a contribution to GDP of 2.8% in 2009 compared to 2.7% in 2008. This increase was in part attributable to the establishment of new generating plants, which led to an increase in thermal energy production.
In 2009, the primary sector decreased an estimated 5.5% from 2008. In particular, the agriculture sector decreased 7.8% in 2009, representing 5.3% of GDP in 2009, as compared to 6.0% in 2008. This decrease is due in part to a decrease in the production of rice and fruits, as well as a decrease in exports by fisheries.
Activities of the CFZ increased 2.1% in 2009, compared to 2008, reflecting a contribution to GDP of 6.9% in 2009, compared to 7.0% of GDP in 2008. The low increase was primarily attributable to the international economic downturn and trade restrictions imposed by certain major South American customers, such as Colombia, Ecuador and Venezuela. The manufacturing sector decreased 0.6% in 2009, compared to 2008 (contributing 6.0% to GDP in 2009, compared to 6.2% in 2008) due in part to a decrease in the production of certain food products, paper products and chemical products. Panama Canal activities decreased 10.5% in 2009 compared to 2008 (contributing 3.9% to GDP in 2009, compared to 4.5% in 2008) due in part to a decrease in secondary activities, which led to a reduction in the reservation system. The financial intermediation sector increased 2.9% in 2009, compared to 2008 (contributing 8.5% to GDP in 2009, compared to 8.6% in 2008) due in part to decreased banking activity, including a reduction in banking licenses and service charges.
The Government’s current savings for 2009 registered a surplus of $1.1 billion (4.5% of nominal GDP), compared to a surplus of $1.0 billion in 2008 (4.5% of nominal GDP). The Government’s overall surplus decreased from $63.4 million in 2008 (0.3% of nominal GDP) to a deficit of $357.2 million in 2009 (1.5% of nominal GDP). In 2009, Panama’s non-financial public sector balance registered a deficit of approximately $253.3.5 million (or 1.0% of nominal GDP), down from a surplus of $97.8 million (or 0.4% of nominal GDP) in 2008.
Economic Performance in 2010. In 2010, Panama’s real GDP grew by 7.5% compared to 3.9% in 2009. Average inflation was 3.5% in 2010. The open unemployment rate decreased from 5.2% in 2009 to 4.7% in 2010.
The transportation and telecommunications sector grew by an estimated 19.0% in 2010, compared to 2009 (contributing 19.9% to GDP in 2010, compared to 18.0% in 2009) due to the dynamics in the telecommunications sector, mainly explained by the growth in prepaid and contract cell phones, Internet services and international phone calls. Mining activities increased 7.3% in 2010, compared to 2009, reflecting a contribution of 1.4% to GDP, due to an increased employment of basic materials, mainly coming from rock and sand, used by the
D-19
construction industry and the growth of activities related to the expansion of the Panama Canal and other megaprojects. The construction industry grew by 6.7% in 2010, compared to 2009, due to the execution of public and private investments, primarily civil engineering works and non-residential projects which include large hydroelectric projects, the Panama Canal expansion project and the modernization of the Tocumen International Airport, among others. The contribution of the construction industry to GDP maintained its level of 6.0% from 2009 to 2010. The public utilities sector grew by 6.5% in 2010, compared to 2009, representing a contribution of 2.7% to GDP in 2010, compared to 2.8% in 2009. Growth in this sector was in part attributable to the growth in power generation and an increase in water bill invoices. In 2010, the primary sector decreased an estimated 10.1% from 2009. In particular, the agriculture sector decreased 14.6% in 2010, representing 4.2% of GDP in 2010, compared to 5.3% in 2009. This decrease is due in part to a decrease in the production of rice and fruits, as well as a decrease in exports by fisheries.
Activities of the CFZ increased 7.5% in 2010, compared to 2009, reflecting a contribution of 6.9% to GDP in 2010, compared to 6.9% of GDP in 2009. This increase is primarily attributable to increased exportation due to the economic recovery in the Latin American markets. The manufacturing sector increased 0.9% in 2010, compared to 2009 (contributing 5.6% to GDP in 2010, compared to 6.0% in 2009) due in part to an increase in meat products as well as in the production of basic food items and beverages. Panama Canal activities decreased 1.1% in 2010, compared to 2009 (contributing 3.6% to GDP in 2010, compared to 3.9% in 2009) due in part to a decrease in secondary activities, which led to a reduction in the reservation system. The activities of the financial intermediation sector increased 6.8% in 2010, compared to 2009 (contributing 8.3% to GDP in 2010, compared to 8.5% in 2009) due in part to the growth of banking activity, the rise of commissions on foreign currency transactions and the positive development of local financial services.
The Government’s current savings for 2010 registered a surplus of $1.15 billion (4.3% of nominal GDP), compared to a surplus of $1.1 billion in 2009 (4.5% of nominal GDP). The Government’s overall deficit increased from $357.2 million in 2009 (1.5% of nominal GDP) to a deficit of $682.6 million in 2010 (2.5% of nominal GDP). In 2010, Panama’s non-financial public sector balance registered a deficit of $511.7 million (or 1.9% of nominal GDP), an increase from a deficit of $252.5 million (or 1.0% of nominal GDP) in 2009.
Economic Performance in 2011. In 2011, Panama’s real GDP grew by 10.6% compared to 7.6% in 2010. Average inflation was 5.9% in 2011. The open unemployment rate decreased from 4.7% in 2010 to 2.9% in 2011.
The transportation and telecommunications sector grew by an estimated 14.6% in 2011, compared to 2010 (contributing 20.6% to GDP in 2011, compared to 19.9% in 2010) due to the dynamics in the telecommunications sector, mainly explained by the growth in prepaid and contract cell phones, Internet services and international phone calls. Mining activities increased 18.4% in 2011, compared to 2010, reflecting a contribution of 1.5% to GDP, due to an increase in the exportation of gold, and the demand for basic materials for construction. The construction industry grew by 18.2% in 2011, compared to 2010, primarily due to large-scale projects by the Government such as the expansion of the Panama Canal, the expansion of Tocumen International Airport, and Saneamiento de la Bahía. The contribution of the construction industry to GDP increased 0.4% from 2010 to 2011. The public utilities sector grew by 6.7% in 2011, compared to 2010, representing a contribution of 2.6% to GDP in 2011, a decrease from 2010. In 2011, the primary sector increased an estimated 2.3% from 2010. The agriculture sector decreased 2.9% in 2011, representing 3.7% of GDP in 2011, compared to 4.2% in 2010. This increase is due in part to good rice and corn harvests.
Activities of the CFZ increased 15.1% in 2011, compared to 2010, reflecting a contribution of 7.2% to GDP in 2011, compared to 6.9% of GDP in 2010. This increase is primarily attributable to an increase in re-exports to the principal markets. The manufacturing sector increased 3.2% in 2011, compared to 2010 (contributing 5.2% to GDP in 2011, compared to 5.6% in 2010) due in part to the increase in the processing of meat and production of ethyl alcohol. Panama Canal activities increased 8.5% in 2011, compared to 2010 (contributing 3.5% to GDP in 2011, compared to 3.6% in 2010) due in part to an increase in canal transits, which translated into higher revenues. The activities of the financial intermediation sector increased 7.6% in 2011, compared to 2010 (contributing 8.1% to GDP in 2011, compared to 8.3% in 2010) due in part to an increase in banking activity, including an increase in commissions.
The Government’s current savings for 2011 registered a surplus of $1.4 billion (4.5% of nominal GDP), compared to a surplus of $1.15 billion in 2010 (4.3% of nominal GDP). The Government’s overall deficit increased
D-20
from $682.6 million in 2010 (2.5% of nominal GDP) to a deficit of $1.1 billion in 2011 (3.6% of nominal GDP). In 2011, Panama’s non-financial public sector balance registered a deficit of $703.1 million (or 2.2% of nominal GDP), an increase from a deficit of $511.7 million (or 1.9% of nominal GDP) in 2010.
Economic Performance in 2012. In 2012, Panama’s real GDP grew by an estimated 10.7% compared to 10.8% in 2011. Average inflation, as measured by the end-of-period CPI, was 5.7% in 2012. The open unemployment rate increased from 2.9% in 2011 to 3.0% in 2012.
The transportation, storage and telecommunications sector grew by an estimated 12.8% in 2012, compared to 2011 (contributing 20.9% to estimated GDP in 2012, compared to 20.5% in 2011) due to increased volumes of passengers using Tocumen International Airport, as Panama has grown as a regional hub. Mining activities increased 30.0% in 2012, compared to 2011, reflecting a contribution of 1.8% to GDP, due to increased extraction of raw materials, mainly sand and stone, in response to increased demand by the construction industry, and by increased volumes of gold and silver extraction activities. The construction industry grew by 29.1% in 2012, compared to 2011, primarily due to the execution of large-scale public and private infrastructure projects such as the Panama Metro, the Panama City and Bay sanitation project and residential and non-residential buildings. The contribution of the construction industry to GDP increased from 6.4% in 2011, to 7.5% in 2012. The public utilities sector grew by 11.7% in 2012, compared to 2011, representing a contribution of 2.6% to GDP in 2012, at the same level as in 2011. In 2012, primary activities increased an estimated 11.7% from 2011. Agriculture sector output increased 4.4% in 2012 over 2011, and represented 3.6% of GDP in 2012, compared to 3.8% in 2011. This increase is due to exports of non-traditional products, such as pineapple and watermelon, and growth in local demand for sugar cane and bananas.
Activities of the Colón Free Zone (“CFZ”) increased 3.8% in 2012, compared to 2011, reflecting a contribution of 6.7% to GDP in 2012, compared to 7.2% of GDP in 2011. This increase is primarily attributable to an increase in re-exports to the CFZ’s principal markets. The manufacturing sector grew 3.6% in 2012, compared to 2011 (contributing 4.9% to GDP in 2012, compared to 5.2% in 2011) due to an increase in meat processing and dairy products activities and the production of cement. Panama Canal activities increased 1.7% in 2012, compared to 2011 (contributing 3.2% to GDP in 2012, compared to 3.5% in 2011) due to an increase in net tonnage passing through the canal, despite a decrease in vessels that transited the canal. The activities of the financial intermediation sector increased 10.2% in 2012, compared to 2011 (contributing 8.1% to GDP in 2012, at the same level as 2011) due to increased banking commissions and fees derived from credit growth, mainly related to mining, trade and mortgage activities.
The Central Government’s current savings for 2012 registered a surplus of $1.9 billion (5.4% of nominal GDP), compared to a surplus of $1.4 billion in 2011 (4.4% of nominal GDP). The Government’s overall deficit increased from $1.1 billion in 2011 (3.5% of nominal GDP) to a deficit of $1.3 billion in 2012 (3.6% of nominal GDP). In 2012, Panama’s non-financial public sector balance registered a deficit of $765.3 million (or 2.1% of nominal GDP), an increase from a deficit of $703.1 million (or 2.2% of nominal GDP) in 2011.
The government has entered into various turnkey and deferred payment contracts with multi-year completion and payment schedules. Under Panamanian law, the contracts must receive priority over other capital expenditures in the preparation of the budget. The contracts include certain infrastructure projects such as highways, hospitals, national security infrastructure, sports facilities and a convention center, among others. According to Panamanian law, the amount of the government’s total commitments under these contracts must be included in the Republic’s budget for the year in which each payment is due and they are not categorized as debt instruments. As of the date hereof, the total amount of payments scheduled under outstanding turnkey and deferred payment contracts for the years 2014 to 2016 is less than 3.75% of 2012 GDP for each such year.
D-21
The following table sets forth Panama’s principal price indicators for each of the years 2008 through 2012:
TABLE NO. 2
Inflation
(percentage change from previous period)
| | | | | | | | | | | | | | | | | | | | |
| | | 2008 | | | 2009 | | | 2010 | | | 2011 | | | 2012 | |
Annual Percentage Change: | | | | | | | | | | | | | | | | | | | | |
Consumer Price Index | | | 8.7 | % | | | 2.4 | % | | | 3.5 | % | | | 5.9 | % | | | 5.7 | % |
Wholesale Price Index: | | | | | | | | | | | | | | | | | | | | |
Imports | | | 21.1 | | | | -14.1 | | | | 6.9 | | | | 17.1 | | | | 5.2 | |
Industrial products | | | 11.6 | | | | 0.6 | | | | 0.9 | | | | 6.8 | | | | 3.9 | |
Agricultural products | | | 3.5 | | | | 8.6 | | | | 1.9 | | | | 3.3 | | | | 5.3 | |
All products | | | 15.8 | | | | -6.7 | | | | 3.9 | | | | 11.9 | | | | 4.7 | |
Source: Office of the Comptroller General and Ministry of Economy and Finance.
The following tables set forth Panama’s GDP, including sectoral origin (in dollars and as a percentage of GDP) and percentage change from 2008 to 2012:
TABLE NO. 3
Gross Domestic Product
| | | | | | | | | | | | | | | | | | | | |
| | | 2008 | | | 2009(R) | | | 2010(R) | | | 2011(P) | | | 2012(E) | |
Gross Domestic Product
(millions of dollars in constant prices)(1) | | $ | 18,812.9 | | | $ | 19,538.4 | | | $ | 20,994.4 | | | $ | 23,272.1 | | | $ | 25,755.5 | |
| | | | | |
% Change over Previous Year | | | 10.1 | % | | | 3.9 | % | | | 7.5 | % | | | 10.8 | % | | | 10.7 | % |
Gross Domestic Product
(millions of dollars in nominal prices) | | $ | 23,001.6 | | | $ | 24,162.9 | | | $ | 27,053.0 | | | $ | 31,315.8 | | | $ | 36,252.5 | |
| | | | | |
% Change over Previous Year | | | 16.2 | % | | | 5.1 | % | | | 12.0 | % | | | 15.8 | % | | | 15.8 | % |
| (1) | Figures are based on 1996 constant dollars. |
Source: Office of the Comptroller General and Ministry of Economy and Finance.
D-22
TABLE NO. 4
Sectoral Origin of Gross Domestic Product
(in millions of dollars)(1)
| | | | | | | | | | | | | | | | | | | | |
| | | 2008 | | | 2009 | | | 2010(R) | | | 2011(P) | | | 2012(P) | |
Primary Activities: | | | | | | | | | | | | | | | | | | | | |
Agriculture(2) | | $ | 1,131.6 | | | $ | 1,043.5 | | | $ | 895.6 | | | $ | 889.9 | | | $ | 929.1 | |
Mining | | | 259.0 | | | | 270.8 | | | | 290.7 | | | | 353.5 | | | | 459.7 | |
| | | | | | | | | | | | | | | | | | | | |
Total | | $ | 1,390.6 | | | $ | 1,314.3 | | | $ | 1,186.3 | | | $ | 1,243.4 | | | $ | 1,388.8 | |
| | | | | |
Industrial Activities: | | | | | | | | | | | | | | | | | | | | |
Manufacturing | | $ | 1,170.9 | | | $ | 1,163.9 | | | $ | 1,176.7 | | | $ | 1,214.7 | | | $ | 1,259.0 | |
Construction | | | 1,120.3 | | | | 1,170.4 | | | | 1,252.3 | | | | 1,489.1 | | | | 1,922.1 | |
| | | | | | | | | | | | | | | | | | | | |
Total | | $ | 2,291.2 | | | $ | 2,334.3 | | | $ | 2,429.0 | | | $ | 2,703.8 | | | $ | 3,181.1 | |
| | | | | |
Services: | | | | | | | | | | | | | | | | | | | | |
Public utilities | | $ | 502.9 | | | $ | 540.5 | | | $ | 575.2 | | | $ | 610.7 | | | $ | 682.1 | |
Commerce, restaurants and hotels | | | 1,909.8 | | | | 1,938.1 | | | | 2,166.2 | | | | 2,437.8 | | | | 2,733.2 | |
Transportation, storage and communications | | | 3,099.6 | | | | 3,511.3 | | | | 4,140.4 | | | | 4,765.4 | | | | 5,373.7 | |
Colón Free Zone | | | 1,321.3 | | | | 1,349.1 | | | | 1,450.3 | | | | 1,669.9 | | | | 1,732.8 | |
Panama Canal Authority | | | 846.2 | | | | 757.7 | | | | 749.7 | | | | 813.4 | | | | 827.5 | |
Financial intermediation | | | 1,614.6 | | | | 1,661.4 | | | | 1,754.6 | | | | 1,886.5 | | | | 2,079.7 | |
Real estate | | | 2,795.6 | | | | 2,947.7 | | | | 3,150.9 | | | | 3,395.2 | | | | 3,636.5 | |
Public administration | | | 1,321.0 | | | | 1,353.5 | | | | 1,393.4 | | | | 1,468.1 | | | | 1,548.4 | |
Other services | | | 948.7 | | | | 996.8 | | | | 1,056.7 | | | | 1,129.5 | | | | 1,224.4 | |
| | | | | | | | | | | | | | | | | | | | |
Total | | $ | 14,359.7 | | | $ | 15,056.1 | | | $ | 16,437.4 | | | $ | 18,176.5 | | | $ | 19,838.3 | |
| | | | | |
Plus Import Taxes(3) | | | 1,175.3 | | | | 1,264.2 | | | | 1,388.4 | | | | 1,618.7 | | | | 1,850.0 | |
Less Imputed Banking Services | | | (403.9 | ) | | | (430.5 | ) | | | (446.7 | ) | | | (470.3 | ) | | | (502.7 | ) |
| | | | | | | | | | | | | | | | | | | | |
Gross Domestic Product | | $ | 18,812.9 | | | $ | 19,538.4 | | | $ | 20,994.4 | | | $ | 23,272.1 | | | $ | 25,755.5 | |
| (1) | Figures are based on 1996 constant dollars. |
| (3) | Including value-added tax. |
| | Source: Office of the Comptroller General and Ministry of Economy and Finance. |
D-23
TABLE NO. 5
Percentage Change from Prior Year for
Sectoral Origin of Gross Domestic Product (percentage change)(1)
| | | | | | | | | | | | | | | | | | | | |
| | | 2008 | | | 2009 | | | 2010(R) | | | 2011(P) | | | 2012(P) | |
Primary Activities: | | | | | | | | | | | | | | | | | | | | |
Agriculture(2) | | | 8.3 | % | | | (7.8 | )% | | | (14.2 | )% | | | (0.6 | )% | | | 4.4 | % |
Mining | | | 30.9 | % | | | 4.6 | % | | | 7.3 | % | | | 21.6 | % | | | 30.0 | % |
Total | | | 11.9 | % | | | (5.5 | )% | | | (9.7 | )% | | | 4.8 | % | | | 11.7 | % |
| | | | | |
Industrial Activities: | | | | | | | | | | | | | | | | | | | | |
Manufacturing | | | 3.9 | % | | | (0.6 | )% | | | 1.1 | % | | | 3.2 | % | | | 3.6 | % |
Construction | | | 30.7 | % | | | 4.5 | % | | | 7.0 | % | | | 18.9 | % | | | 29.1 | % |
Total | | | 15.5 | % | | | 1.9 | % | | | 4.1 | % | | | 11.3 | % | | | 17.7 | % |
| | | | | |
Services: | | | | | | | | | | | | | | | | | | | | |
Public utilities | | | 3.8 | % | | | 7.5 | % | | | 6.4 | % | | | 6.2 | % | | | 11.7 | % |
Commerce, restaurants and hotels | | | 8.0 | % | | | 1.5 | % | | | 11.8 | % | | | 12.5 | % | | | 12.1 | % |
Transportation and communications | | | 17.8 | % | | | 13.3 | % | | | 17.9 | % | | | 15.1 | % | | | 12.8 | % |
Colón Free Zone | | | 6.1 | % | | | 2.1 | % | | | 7.5 | % | | | 15.1 | % | | | 3.8 | % |
Panama Canal Authority | | | 7.6 | % | | | (10.5 | )% | | | (1.1 | )% | | | 8.5 | % | | | 1.7 | % |
Financial intermediation | | | 14.1 | % | | | 2.9 | % | | | 5.6 | % | | | 7.5 | % | | | 10.2 | % |
Real estate | | | 7.2 | % | | | 5.4 | % | | | 6.9 | % | | | 7.8 | % | | | 7.1 | % |
Public administration | | | 3.8 | % | | | 2.5 | % | | | 3.0 | % | | | 5.4 | % | | | 5.5 | % |
Other services | | | 6.0 | % | | | 5.1 | % | | | 6.0 | % | | | 6.9 | % | | | 8.4 | % |
Total | | | 9.6 | % | | | 4.8 | % | | | 9.2 | % | | | 10.6 | % | | | 9.1 | % |
| | | | | |
Plus Import Taxes(3) | | | 3.7 | % | | | 7.6 | % | | | 9.8 | % | | | 16.6 | % | | | 14.3 | % |
Less Imputed Banking Services | | | 6.3 | % | | | 6.6 | % | | | 3.8 | % | | | 5.3 | % | | | 6.9 | % |
Gross Domestic Product | | | 10.1 | % | | | 3.9 | % | | | 7.5 | % | | | 10.8 | % | | | 10.7 | % |
| (1) | Figures are based on 1996 constant dollars. |
| (3) | Including value-added tax. |
Source: Office of the Comptroller General and Ministry of Economy and Finance.
D-24
TABLE NO. 6
Sectoral Origin of Gross Domestic Product
(as percentage of GDP)(1)
| | | | | | | | | | | | | | | | | | | | |
| | | 2008 | | | 2009 | | | 2010(R) | | | 2011(P) | | | 2012(P) | |
Primary Activities: | | | | | | | | | | | | | | | | | | | | |
Agriculture(2) | | | 6.0 | % | | | 5.3 | % | | | 4.3 | % | | | 3.8 | % | | | 3.6 | % |
Mining | | | 1.4 | % | | | 1.4 | % | | | 1.4 | % | | | 1.5 | % | | | 1.8 | % |
| | | | | | | | | | | | | | | | | | | | |
Total | | | 7.4 | % | | | 6.7 | % | | | 5.7 | % | | | 5.3 | % | | | 5.4 | % |
| | | | | |
Industrial Activities: | | | | | | | | | | | | | | | | | | | | |
Manufacturing | | | 6.2 | % | | | 6.0 | % | | | 5.6 | % | | | 5.2 | % | | | 4.9 | % |
Construction | | | 6.0 | % | | | 6.0 | % | | | 6.0 | % | | | 6.4 | % | | | 7.5 | % |
| | | | | | | | | | | | | | | | | | | | |
Total | | | 12.2 | % | | | 11.9 | % | | | 11.6 | % | | | 11.6 | % | | | 12.4 | % |
| | | | | |
Services: | | | | | | | | | | | | | | | | | | | | |
Public utilities | | | 2.7 | % | | | 2.8 | % | | | 2.7 | % | | | 2.6 | % | | | 2.6 | % |
Commerce, restaurants and hotels | | | 10.2 | % | | | 9.9 | % | | | 10.3 | % | | | 10.5 | % | | | 10.6 | % |
Transportation and communications | | | 16.5 | % | | | 18.0 | % | | | 19.7 | % | | | 20.5 | % | | | 20.9 | % |
Colón Free Zone | | | 7.0 | % | | | 6.9 | % | | | 6.9 | % | | | 7.2 | % | | | 6.7 | % |
Panama Canal Authority | | | 4.5 | % | | | 3.9 | % | | | 3.6 | % | | | 3.5 | % | | | 3.2 | % |
Financial intermediation | | | 8.6 | % | | | 8.5 | % | | | 8.4 | % | | | 8.1 | % | | | 8.1 | % |
Real estate | | | 14.9 | % | | | 15.1 | % | | | 15.0 | % | | | 14.6 | % | | | 14.1 | % |
Public administration | | | 7.0 | % | | | 6.9 | % | | | 6.6 | % | | | 6.3 | % | | | 6.0 | % |
Other services | | | 5.0 | % | | | 5.1 | % | | | 5.0 | % | | | 4.9 | % | | | 4.8 | % |
| | | | | | | | | | | | | | | | | | | | |
Total | | | 76.3 | % | | | 77.1 | % | | | 78.3 | % | | | 78.1 | % | | | 77.0 | % |
| | | | | |
Plus Import Taxes(3) | | | 6.2 | % | | | 6.5 | % | | | 6.6 | % | | | 7.0 | % | | | 7.2 | % |
Less Imputed Banking Services | | | (2.1 | )% | | | (2.2 | )% | | | (2.1 | )% | | | (2.0 | )% | | | (2.0 | )% |
| | | | | | | | | | | | | | | | | | | | |
Gross Domestic Product | | | 100.0 | % | | | 100.0 | % | | | 100.0 | % | | | 100.0 | % | | | 100.0 | % |
| (1) | Figures are based on 1996 constant dollars. |
| (3) | Including value-added tax. |
Source: Office of the Comptroller General.
D-25
STRUCTURE OF THE PANAMANIAN ECONOMY
Principal Sectors of the Economy
Service Sector. The Panamanian economy is based primarily on the service sector, which accounted for an average of 77.4% of real GDP from 2008 to 2012. Services include: real estate; transportation and communications; commerce, restaurants and hotels; financial intermediation; public administration; the Panama Canal; the CFZ; and public utilities. While the real estate and transportation and communications sectors represent significant percentages of real GDP (estimated to be 14.1% and 20.9%, respectively, of real GDP in 2012), the Panamanian economy is distinguished by the economic benefits generated by the Panama Canal and the CFZ.
Real Estate. The second largest single component of the service sector is real estate, which consists of rental income and the imputed rental value of real estate that is occupied but not rented. Real estate represented an estimated 14.1% of GDP in 2012, 14.5% of GDP in 2011, 15.0% of GDP in 2010, 15.1% of real GDP in 2009 and 14.9% of real GDP in 2008.
Transportation and Communications. The transportation and communications sector, which includes ports, rails and telecommunications, has been an increasing component of the Panamanian economy in recent years. It represented an estimated 20.9% of GDP in 2012, 20.5% of GDP in 2011, 19.7% in 2010, 18.0% of GDP in 2009 and 16.5% of GDP in 2008.
Commerce. Commerce (which includes wholesale and retail activities, restaurants and hotels) represented an estimated 10.6% of GDP in 2012, 10.5% of GDP in 2011, 10.3% of GDP in 2010, 9.9% of GDP in 2009 and 10.2% of GDP in 2008. In 2012, retail activities rose 16.0% compared to 2011, in part as a result of increased sales of food, beverages, fuel and construction materials. In 2012, the restaurants and hotels sector grew 10.6% primarily due to a greater tourism expenditure.
Financial Services. The financial services sector represented an estimated 8.1% of GDP in 2012, 8.1% of GDP in 2011, 8.4% of GDP in 2010, 8.5% of GDP in 2009 and 8.6% of GDP in 2008. Over the period 2008-2012, approximately 80.4% of this sector’s contribution to GDP was accounted for by the banking sector, which as of December 2012, consisted of BNP and Caja de Ahorros, two state-owned banks, and 90 private banks. The banking sector includes general license banks, international license banks, and foreign banks with representative offices. Figures show that, as of December 31, 2012, banking sector assets and deposits totaled approximately $89.8 billion and $64.0 billion, respectively. See “Financial System—The Banking Sector”.
Public Administration. Public administration, principally representing government activities, represented an estimated 6.0% of GDP in 2012, 6.3% of GDP in 2011, 6.6% of GDP in 2010, 6.9% of GDP in 2009 and 7.0% of GDP in 2008.
Colón Free Zone. The CFZ has become the largest duty-free zone in the Western Hemisphere in terms of commercial activity. As of August, 2013, approximately 3,101 companies use the CFZ service facilities for a variety of trading activities. The CFZ represented an estimated 6.7% of GDP in 2012, 7.2% of GDP in 2011, 6.9% of GDP in 2010, 6.9% of GDP in 2009 and 7.0% of GDP in 2008. Total imports to the CFZ rose to $14.6 billion in 2012 from $14.0 billion in 2011. Total re-exports in 2012 were $16.1 billion, as compared with $15.1 billion in 2011. CFZ value added (re-exports minus imports) increased to an estimated $1.5 billion in 2012, compared to $1.1 billion in 2011. See “The Colón Free Zone”.
Panama Canal. For the years 2008 through 2012, economic activity associated with the Panama Canal Authority contributed an average of 3.7% to GDP. In the Canal’s 2012 fiscal year, canal transits decreased to 14,544 transits from 14,684 transits in 2011, while cargo tonnage decreased to 218.1 million long tons from 222.4 million long tons in 2011. The Panama Canal Authority announced that toll revenues for the fiscal year ended September 30, 2012 reached $1,852.4 million, an increase of 7.1% over fiscal year 2011.
Industrial Sector. After the service sector, the next largest segment of the economy consists of the industrial activities of manufacturing and construction, collectively representing an estimated 12.4% of GDP in 2012, 11.6% of GDP in 2011, 11.6% of GDP in 2010, 11.9% of GDP in 2009 and 12.2% of GDP in 2008. Manufacturing represented an estimated 4.9% of GDP in 2012 and 5.2% of GDP in 2011. Manufacturing is principally geared to the production of processed foods and beverages and, to a lesser extent, clothing, chemical products and construction materials for the domestic market. Traditionally, the manufacturing industries have been protected by
D-26
high tariffs and fiscal incentives. In connection with Panama’s accession to the WTO and free trade negotiations, many of such protections have decreased significantly. See “Foreign Trade and Balance of Payments—Tariffs and Other Trade Restrictions”. Manufacturing facilities are primarily located in the Panama City and Colón areas, although agricultural processing facilities tend to be located closer to raw materials.
Construction activity has been rising over the past five years. In 2008, construction activity increased by 30.7% and represented an estimated 6.0% of GDP in part due to the construction of new high-rise buildings and family residences, the expansion of certain container ports and the Government and the Panama Canal Authority’s investments in infrastructure. Construction activity increased by 4.5% in 2009 and represented an estimated 6.0% of GDP in 2009. This increase was primarily attributable to public and private investment in non-residential civil engineering projects. Construction activity increased by 7.0% in 2010 and represented an estimated 6.0% of GDP. This was due to the execution of public and private investments, primarily civil engineering works and nonresidential projects which include large hydroelectric projects, the Panama Canal expansion project and the modernization of the Tocumen International Airport, among others. Construction activity increased by 18.9% in 2011 and represented an estimated 6.4% of GDP. This was due to the ongoing development of large-scale government projects and non-residential projects in the private sector. Construction activity increased by 29.9% in 2012 and represented an estimated 7.5% of GDP. This was due to the execution of public and private infrastructure projects.
Agriculture and Mining Sector. The agriculture and mining sector is the third largest segment of the Panamanian economy in terms of GDP, accounting for an estimated 5.4% of GDP in 2012, 5.3% of GDP in 2011, 5.7% of GDP in 2010, 6.7% of GDP in 2009 and 7.4% of GDP in 2008. This sector employs a significant percentage of the Panamanian employed workforce (15% in March 2013). Principal agricultural products include bananas, fish, shrimp, sugar, coffee, meat, dairy products, tropical fruits, rice, corn and beans. In 2010, the value of agricultural production (which includes fisheries production) is estimated to have decreased by 14.2%, after having decreased by 7.8% in 2009.
In 2008, banana production decreased 15.2% and accounted for 9.5% of agricultural value. In 2009, banana production decreased 38.2% from 2008 and accounted for an estimated 6.4% of agricultural value. In 2010, banana production increased from 2009 and accounted for an estimated 6.7% of agricultural value in 2010. In 2011, banana production decreased from 2010 and accounted for an estimated 6.1% of agricultural value in 2011. In 2012, banana production increased from 2011 and accounted for an estimated 6.0% of agricultural value in 2012.
The Panamanian agriculture and fisheries sector has been protected by significant tariff and non-tariff barriers. Agricultural products are controlled principally by the Ministry of Agriculture and the Agricultural Marketing Institute (“IMA”). See “Foreign Trade and Balance of Payments—Tariffs and Other Trade Restrictions”.
The Role of the Government in the Economy
The Government plays a significant role in the economy through, among other means, its ownership of certain public utilities and other enterprises. General Government expenditures (including Central Government, Caja de Seguro Social and consolidated agencies, but excluding state-owned financial institutions) totaled $5.7 billion in 2012. The Government also has a significant impact on the economy through various statutory and other governmental initiatives, including enforcement of a labor code, subsidies and tariff policies.
D-27
The following table sets forth summary financial information on principal public sector businesses for fiscal year 2012:
TABLE NO. 7
Selected State-Owned Enterprises(1)
2012 Financial Statistics(2)
(in millions of dollars)
| | | | | | | | | | | | | | | | | | | | |
| | | Total
Assets | | | Capital
and
Reserves | | | Gross
Revenues | | | Net
Income | | | Dividends
Paid to the
Government | |
Banco Nacional de Panamá (banking) | | $ | 7,731.2 | | | $ | 644.8 | | | $ | 238.0 | | | $ | 140.1 | | | $ | 130.0 | |
Instituto de Acueductos y Alcantarillados Nacionales (“IDAAN”) (water) | | | 715.1 | | | | 643.2 | | | | 115.5 | | | | (32.7 | ) | | | 0.0 | |
| (1) | All enterprises are 100% owned by the Government. |
| (2) | For fiscal year ended December 31, 2012. |
Sources: BNP and IDAAN.
In May 1995, the Government created the Development Trust Fund pursuant to Law No. 20 to hold and manage the proceeds generated by most privatizations. Pursuant to the law establishing the Development Trust Fund, the proceeds earned by investments from the monies in the Development Trust Fund were to be used mainly for investment in social development programs and not for financing general Government expenditures.
As of December 31, 2012, audited financial statements showed a balance of $1.3 billion in the Development Trust Fund, as compared to a balance of $1.245 billion as of December 31, 2011. Of this amount, approximately $25.4 million was represented by Development Trust Fund holdings in Panamanian bonds. As of June 2013, the interim financial reports provided by Banco Nacional de Panamá, fiduciary of the fund, show total assets of the fund as $1.4 billion. The Ministry of Economy and Finance has invested part of the principal of the Development Trust Fund with three asset managers: Goldman Sachs, Morgan Stanley and BlackRock. As of December 31, 2012, the three asset managers had $819.5 million under management. The Bank of New York Mellon has been appointed global custodian of the funds administered by Morgan Stanley and Goldman Sachs and the custodian for the assets managed by BlackRock is Brown Brothers Harriman.
In June 2012, the Government created the Fondo de Ahorro de Panamá, referred to as the Panama Savings Fund or the FAP, pursuant to Law No. 38 of 2012. The initial capital of the Fund will come from the Fondo Fiduciario para el Desarrollo, referred to as the Development Trust Fund. Once the Fund has been capitalized and it begins operations by 2015, the Development Trust Fund will cease to exist. According to the Fund’s accumulation rule, every year income from the Panama Canal Authority of up to 3.5% of GDP will be deposited in the National Treasury and any excess over that amount will be transferred to the Fund. The Fund will have two main objectives: macroeconomic stability in cases of national emergencies and long-term national savings. The Fund will also be allowed to repurchase and retire Panama sovereign debt once the size of the Fund reaches 5.0% of GDP. The Fund will be managed by the Ministry of Economy and Finance. In addition, Law 38 provides that BNP will serve as the Fund’s Trustee and that the Fund will have an independent Board of Directors in charge of safeguarding the assets.
Law 87 of December 4, 2012, modified article 5 of Law 38 of 2012. This change affected only the rules relating to the withdrawal of funds from the FAP, restricting the possibility of using funds immediately in respect of natural disasters. In August 2013, Law 48 was approved, which further modified Law 38 of 2012. The amendment establishes that funds resulting from future sales of government-owned companies will be accumulated in the FAP and may only be used to finance reconstruction efforts for damage caused by natural disasters, when such damage represents at least 0.5% of nominal GDP.
D-28
The President has appointed the first board of directors of FAP and the board has appointed the first Technical Director of FAP, effective April 15, 2013, who is responsible for the management of the financial assets of FAP.
The Government has taken other steps in recent years to reduce its direct role in the economy. On January 11, 2007, the Assembly approved Law No. 5 which simplifies the prerequisites to establish companies in the Panama. Pursuant to Law No. 5, in 2009 the Government created the Panama Emprende system which streamlines the process by which companies incorporate in Panama by using electronic processes.
Principal Operations and Privatization of Public Sector Enterprises
Electric Power. Created in 1969, Instituto de Recursos Hidráulicos y de Electrificación (“IRHE”) was the autonomous state entity having exclusive control of the electricity sector in Panama. IRHE was responsible for the planning, coordination and supervision of programs for electricity generation, transmission and distribution, as well as conservation of energy resources. Electric rates were set by IRHE; however, since the privatization of IRHE in 1998, the successors to the assets and liabilities of IRHE have set their own rates, which are subject to review by the Ente Regulador de Servicios Públicos (“ERSP”). See “Other Legislation Related to Economic Reform—Public Services Law”.
Pursuant to legislation authorizing the restructuring and privatization of IRHE, the company was split into nine corporate entities with 100% of the stock of each entity owned initially by the Government. These entities included three hydroelectric generating companies, one thermoelectric generating company, four distribution companies and a transmission company, as successors to the assets and liabilities of IRHE under the privatization scheme. Following completion of the restructuring, a public bidding process commenced to sell 51% (or more) of the stock in each of the thermoelectric and distribution companies and up to 49% of the hydroelectric companies. The law states that up to 10% of the stock of each company will be made available for the benefit of employees. In October 1998, 51% of the stock of three IRHE distribution companies was sold. In January 1999, 49% of the stock of the hydroelectric generating companies, and 51% of the stock of the thermoelectric generating company, was sold. Panama received $604 million in the aggregate for the sale of the shares. Pursuant to Panamanian law, the transmission company remains 100% state-owned.
Panama currently has high electric rates (an average of 16.44 cents per Kilowatt Hour as of December 31, 2012), and demand for electricity in 2012 grew at an estimated average rate of 7.4% from 2011. As of December 31, 2012, Panama had an installed generating base of 2,419.03 Megawatts (“MW”), of which 1,465.85 MW (60%) was hydroelectric and 953.18 MW (40%) was thermoelectric. In 2008, total energy generation in the wholesale market registered a gross generation of 6,346.6 GWh, of which 3,924.6 GWh were hydroelectrically generated and 2,422.0 GWh were thermoelectrically generated. In 2009, total energy generation in the wholesale market increased 5.4% from 2008, and Panama registered a gross generation of 6,864.7 GWh, of which 3,893.3 GWh were hydroelectrically generated and 2,971.4 GWh were thermoelectrically generated. In 2010, total energy generation in the wholesale market increased 9.0% and Panama registered a gross generation of 7,484.7 GWh, of which 56.0% were hydroelectrically generated and 44.0% were thermoelectrically generated. In 2011, total energy generation in the wholesale market increased 3.0% and Panama registered a gross generation of 7,715 GWh, of which 52.2% were hydroelectrically generated and 47.8% were thermoelectrically generated. In 2012, total energy generation in the wholesale market increased 8.5% and Panama registered a gross generation of 8,262.97 GWh, of which 60% were hydroelectrically generated and 40% were thermoelectrically generated.
Telecommunications. INTEL, S.A. (“INTEL”) was the state-owned telecommunications company with a monopoly over local and long distance landline service.
In 1997, the then Ministry of the Treasury auctioned 49% of INTEL’s stock. Cable & Wireless of the United Kingdom won the public auction by bidding $652 million for the shares. INTEL was subsequently renamed Cable & Wireless (Panamá) S.A. (“C&W Panama”). Although Cable & Wireless is not a majority owner of C&W Panama, it has operational and managerial control of C&W Panama. The Republic retains 49% of the shares of C&W Panama, and the remaining 2% of the shares of C&W Panama are held in a trust fund for C&W Panama’s unionized employees. INTEL was historically profitable and regularly paid dividends to the Central Government. Those dividends averaged approximately $103 million per year during the 1990-1996 period, but have decreased
D-29
significantly following privatization, in part because Panama holds only 49% of the shares of C&W Panama. For the company’s fiscal year ended March 31, 2010, C&W Panama paid approximately $76 million in dividends to the Central Government. For the company’s fiscal year ended March 31, 2011, C&W Panama paid approximately $68.1 million in dividends to the Central Government. For the company’s fiscal year ended March 31, 2012, C&W Panama paid approximately $60.7 million in dividends to the Central Government.
Cable & Wireless’ concession to manage C&W Panama lasts 20 years and is renewable for ten additional years. Under the concession Cable & Wireless would be subject to monetary penalties if C&W Panama’s service did not reach certain specified goals.
C&W Panama experienced a 0.4% increase in sales in its fiscal year ended March 31, 2011 as compared to the fiscal year ended March 31, 2010, primarily due to the advancement of corporate projects. C&W Panama experienced a 4.1% increase in income from broadband service in its fiscal year ended March 31, 2011, compared to its fiscal year ended March 31, 2010.
C&W Panama experienced a 3.66% decrease in sales in its fiscal year ended March 31, 2012, compared to its fiscal year ended March 31, 2011, primarily due to a decrease in revenues in enterprise and fixed voice services. C&W Panama experienced a 5% increase in income from broadband service in its fiscal year ended March 31, 2012, compared to its fiscal year ended March 31, 2011. C&W Panama experienced a 2.35% decrease in sales in its fiscal year ended March 31, 2013, compared to its fiscal year ended March 31, 2012, primarily due to a decrease in corporate project and voice revenues. C&W Panama experienced a 5% increase in income from broadband service in its fiscal year ended March 31, 2013, compared to its fiscal year ended March 31, 2012.
As of June 15, 2013, the telecommunications market was comprised of approximately 172 operating companies and 357 companies authorized to operate telecommunication concessions. As of December 31, 2012, there were approximately 640,057 telephone lines in the country with a line penetration rate of approximately 16.9 lines per 100 inhabitants. As of December 31, 2012, there were approximately 6.769 million cellular telephone service subscriptions.
Water. The national water and sewage utility is the Instituto de Acueductos y Alcantarillados Nacionales, or IDAAN, which serves approximately 92% of the population for which it is responsible (which constitutes 75% of the total population) through its 54 water purification plants, five filtration galleries, 144 pumping stations and 571 underground sources. Inefficiency in IDAAN’s operations and management, combined with leakage, has accounted for an estimated annual water loss of 47.7%. Unlike INTEL and IRHE, which had generally paid dividends to the Government on an annual basis prior to privatization and required no Government funding, IDAAN has required periodic transfer payments from the Government in order to meet its operating and capital expenses.
The Development Trust Fund under Law 20 of 2002 allocated $70 million for investment in water projects, such as the construction of water purification plants and distribution lines. IDAAN periodically conducts a bidding process for water infrastructure projects.
Ports. The Panama Maritime Authority owns and controls most of Panama’s ports. A number of Panama’s ports have been privatized through the grant of concessions.
The Manzanillo International Terminal (“MIT”) is a container port located at the former United States military base at Coco Solo, and is managed and operated by a joint venture formed between Stevedoring Services of America and Motores Internacionales, S.A. In 2011, MIT handled approximately 1.9 million Twenty Foot Equivalent Units of cargo and containers, compared to approximately 1.6 million Twenty Foot Equivalent Units in 2010. In 2012, MIT handled approximately 2.06 million Twenty Foot Equivalent Units of cargo and containers, compared to approximately 1.9 million Twenty Foot Equivalent Units in 2011.
On May 8, 2007, a $100 million expansion program of MIT was undertaken to increase its annual handling capacity from 1.5 million Twenty Foot Equivalent Units to 2.2 million Twenty Foot Equivalent Units, including the addition of an administrative building, docks and storage yards that are part of the expansion program.
Evergreen International, S.A. (“Evergreen”), a subsidiary of the Evergreen Group of Taiwan, manages and operates the container port in Colón. The initial investment was for $80 million and Evergreen began operations in the fourth quarter of 1997. In recent years, the container port in Colón has moved a significantly increasing number of containers. In 2011, the container port in Colón moved approximately 490,000 Twenty Foot Equivalent Units (“TEUs”) of cargo and containers. In 2012, the container port in Colón moved approximately 608,906 TEUs of cargo and containers.
D-30
The Panama Canal Railway Co., a joint venture between two United States corporations, Kansas City Southern Industries, Inc. and MI-JACK Products, Inc., holds a 25-year concession (that is set to expire in 2023) for the trans-isthmus railway, principally for connecting the container ship ports on both coasts. Under the terms of the concession, the joint venture is required to pay to the Government 5.0% of its profits until it recovers its initial investment. After recovery of its initial investment, the joint venture will be required to pay the Government 10.0% of its profits.
The Panama Ports Company (PPC), a subsidiary of Hutchinson Whampoa, Ltd. of Hong Kong, operates the principal existing ports at Balboa and Cristobal at the entrances to the Panama Canal. Annual payments to the Government under this renewable 25- year concession, granted in 1996, were set at approximately $22.2 million plus 10.0% of revenues. In addition, an initial up-front grant to the Government of 10.0% of the shares in the operating company was required under the concession. In June 2002, Panama agreed to forego the $22.2 million annual rental payments in view of Hutchinson Whampoa’s investments in terminal expansion, but in September 2005, the Torrijos administration overturned the decision. On October 18, 2005, PPC paid the Government $102 million in back fees and initiated the expansion of the Port of Cristobal, which is part of its $1.0 billion ports expansion program. PPC has already invested approximately $500 million in the expansion of maritime operations of both ports. As of December 31, 2011, the wharf of the container terminal at Port of Balboa spanned 182 hectares and there were 57 gantry cranes, while the wharf at the Port of Cristobal spanned 143 hectares and there were 34 gantry cranes. As of December 31, 2012, the wharf of the container terminal at Port of Balboa spanned 182 hectares and there were 83 gantry cranes, while the wharf at the Port of Cristobal spanned 143 hectares and there were 40 gantry cranes.
Banking. The public banking sector is made up of two institutions: BNP and Caja de Ahorros (a savings bank). Pursuant to the laws that govern these banks, the Government is responsible for the liabilities of these institutions. BNP is the country’s largest deposit-taking financial institution and Caja de Ahorros is among the largest deposit-taking financial institutions. Collectively, they had approximately 15.5% of the deposits and 13.6% of the assets in the national banking system as of December 31, 2012. As of December 31, 2012, the Government had not announced any plans to privatize these financial institutions.
Other Privatizations
Under a privatization law that governs the privatization program for various state-owned entities other than the ports, IRHE, IDAAN and INTEL, the privatization of public enterprises may be effected by any of the following means: (i) transforming state enterprises into regular stock corporations, and subsequently selling all of their shares to the private sector; (ii) transforming state enterprises into mixed capital companies whose capital is divided between the Government and the private sector, and in which the Government retains a minority participation; (iii) selling operating concessions; or (iv) leasing or selling the assets of the public enterprises. Such privatization provides the Republic with non-tax revenue. In 2009, the Autoridad Nacional de los Servicios Públicos (“ASEP”) carried out a public bid to award two concessions to provide personal communications services in Panama. On May 14, 2008 in Cabinet Resolutions No. 66 and No. 67, the ASEP awarded Claro Panamá S.A. (“Claro”) and Digicel Panamá S.A (“Digicel”) contracts to provide personal communications services in the Republic. Claro’s contract was awarded for $73.1 million and Digicel’s for $86.0 million. On August 19, 2010, ASEP received presentations from companies seeking to manage a new project, known at Portabilidad Numérica, which seeks to allow cell phone users to change service providers while keeping their cell phone numbers.
In August 2013, Law 48 was approved, which modified Law 38 of 2012, which created the Panama Savings Fund. The amendment establishes that funds resulting from future sales of government-owned companies will be accumulated in the Panama Savings Fund and may only be used to finance reconstruction efforts for damage caused by natural disasters, when such damage represents at least 0.5% of nominal GDP or more. See Recent Developments—Recent Government Actions.”
D-31
Foreign Investment in the Private Sector
Panama has concluded the negotiation of comprehensive free trade agreements with Costa Rica, Honduras and Guatemala. In this regard, Law No. 17 of February 13, 2008, published in the Gaceta Oficial Digital No. 25,982 of February 20, 2008, serves as the ratification of the free trade agreement between Panama and Costa Rica; the effective date of the agreement was November 23, 2008, and its Tariffs Program entered into effect on January 1, 2009. Law No. 23 of April 25, 2008, published in the Gaceta Oficial Digital No. 26,032 of May 5, 2008, serves as the ratification of the free trade agreement between Panama and Honduras; this agreement became effective on January 9, 2009. The free trade agreement between Panama and Guatemala was ratified by the Assembly of Panama under Law No. 48 of 2008, published in Gaceta Oficial Digital No. 26,084 of July 16, 2008, and became effective on June 20, 2009. Pursuant to these commercial agreements, nearly 90% of Panama’s total exports to these countries enter duty-free.
Panama concluded its free trade negotiations with the United States in December 2006, and signed the Trade Promotion Agreement on June 28, 2007 which was to come into effect upon approval by each country’s legislature and after all conditions for entry into force had been met. The Panamanian Assembly ratified the Trade Promotion Agreement on July 11, 2007. On October 12, 2011, the U.S. Congress ratified the agreement and on October 21, 2011, the President of the United States signed the legislation implementing the Trade Promotion Agreement. The agreement became effective on October 31, 2012.
The Free Trade Agreement between Panama and Peru became effective on May 1, 2012. In addition, the Free Trade Agreement between Panama and Canada became effective on April 1, 2013, after ratification by the Canadian Senate on December 14, 2012. The National Assembly through Law 69 of 2010 had approved the treaty. In addition, on March 25, 2013 the National Assembly passed a law that authorized the inclusion of Panama in the European Union—Central America Association Agreement, which came into effect on August 1, 2013.
In addition, the development of several designated export processing zones, which offer tax-free status, special immigration privileges and labor laws and license and customs exemptions to manufacturers located within their boundaries, is intended to promote manufacturing investments. Similarly, the Government has allowed the creation of petroleum export zones with tax-free status and exemption from certain government regulations for the production, refining and exportation of petroleum products.
In order to attract more foreign investment in Panama, the Assembly passed Law No. 41 of August 24, 2007, which creates incentives for multinational enterprises to establish their headquarters in Panama. A principal characteristic of this legislation is that it provides foreign companies the opportunity to establish their headquarters in Panama with tax advantages, provided their activities are focused on international trade, rather than internal trade within Panama. The objectives of this law are to attract and promote investment in the country, to generate employment and the transfer of technology and to make the Republic more competitive in the global economy. Among the incentives that are offered are an exemption from income tax for services rendered by the headquarters to its operations abroad, an exemption from transfer taxes on services and movable goods and the streamlining of the granting of visas to foreign personnel and dependents of the multinational enterprise.
Foreign direct investment increased 25%, or $245 million, during the first quarter of 2013, when compared to the same period in 2012. The increase was primarily due to an increase in reinvested earnings, the purchase of shares in domestic companies by non-resident investors mainly in the tourism and real estate sectors. During the first quarter of 2012, foreign direct investment decreased 15.3%, or $618.2 million. The decrease was primarily due to an increase in the revenues of foreign companies represented in the CFZ. The increase in revenue translated into a decrease in demand for foreign capital. These companies also directed their revenues to the payment of debt obligations directly with their headquarters.
D-32
THE PANAMA CANAL
General
Following Panama’s declaration of independence from Colombia, Panama ratified the Hay/Bunau-Varilla Treaty with the United States on December 2, 1903. Under the terms of the treaty, Panama ceded to the United States the Canal Zone, a ten-mile wide strip of Panama’s territory, to build, operate, maintain and protect an interoceanic canal across the isthmus, in return for annual payments. The Panama Canal measures 51 miles from the Atlantic to the Pacific side. The former Canal Zone encompassed a land area of 94,385 hectares (364 square miles) and a water surface of 45,594 hectares (176 square miles) and included military bases, ports, airports, schools, hospitals and housing units.
The Canal plays a significant role in the Panamanian economy. For the years 2008 through 2012, the activities of the Panama Canal Authority have accounted for an average of approximately 3.7% of Panama’s GDP. In the PCA’s 2012 fiscal year, canal transits decreased to 14,544 transits from 14,684 transits in 2011, while cargo tonnage decreased to 218.1 million long tons from 222.4 million long tons in 2011. The Panama Canal Authority announced that toll revenues for the fiscal year ended September 30, 2012 reached $1,852.4 million, an increase of 7.1% over fiscal year 2011.
From the Canal’s 2008 fiscal year to the Canal’s 2012 fiscal year, transits through the Canal decreased by 1.1% and cargo tonnage increased by 4.0%. Factors such as the development of alternative land routes and the increasing size of vessels transiting the Canal have caused the decrease in the number of vessels required to transport cargo between 2008 and 2012. However, from the Canal’s 2008 fiscal year to the Canal’s 2012 fiscal year, toll revenues increased by 40.6%, primarily due to increases in toll charges.
As of September 30, 2012, the Canal’s total work force (which includes temporary and permanent employees) was 10,262. Of the 2012 total work force, 8,564 were permanent workers and 1,698 were temporary workers. See “Employment and Labor—Salaries and Wages”.
The following table sets forth the Canal’s statistical and financial information for fiscal years 2008 through 2012 (each ended on September 30):
TABLE NO. 8
Panama Canal Principal Statistics
| | | | | | | | | | | | |
| Fiscal Year | | Number
of Transits | | | Tolls
(millions of dollars) | | | Long Tons of Cargo
(millions) | |
2008 | | | 14,702 | | | | 1,317.5 | | | | 209.8 | |
2009 | | | 14,342 | | | | 1,438.2 | | | | 198.0 | |
2010 | | | 14,230 | | | | 1,482.1 | | | | 204.8 | |
2011 | | | 14,684 | | | | 1,730.0 | | | | 222.4 | |
2012 | | | 14,544 | | | | 1,852.4 | | | | 218.1 | |
Source: Panama Canal Authority.
The Canal Treaty of 1977
In September 1977, the Governments of Panama and the United States signed two treaties with respect to the Canal, both effective as of October 1, 1979. The first treaty, known as the Canal Treaty of 1977, terminated all prior treaties between the United States and Panama concerning the Canal and abolished the Canal Zone. The Canal Treaty of 1977 also afforded the United States the right to continue to manage, operate and maintain the Canal until the expiration of the treaty on December 31, 1999, at which time Panama assumed full responsibility for the Canal and its facilities. The second treaty, known as the 1977 Treaty on the Permanent Neutrality and Operation of the Canal, committed Panama and the United States to continue to protect the Canal and to ensure its permanent neutrality beyond the expiration of the Canal Treaty of 1977. Pursuant to the Canal Treaty of 1977, the United States gradually transferred former Canal Zone land and facilities to Panama beginning in 1979. On December 31, 1999, Panama acquired full title to the Canal from the United States.
D-33
The Panama Canal Commission and Panama Canal Authority
The Panama Canal Commission
The Canal Treaty of 1977 dissolved the former Panama Canal Company and established the Panama Canal Commission (“PCC”), a bi-national agency of the executive branch of the United States government charged with managing and operating the Canal until the expiration of the Canal Treaty on December 31, 1999, when Panama assumed full responsibility for the Canal. Following the transfer of the Canal to Panama on December 31, 1999, the PCC was closed. The PCC was supervised by a nine-member Board of Directors. Five members were nationals of the United States and four were Panamanian citizens nominated by the Panamanian Government and approved by the United States government. From 1990 to 1999, the Administrator of the PCC was a Panamanian. The PCC’s primary mission was to service world shipping by operating the Canal in an efficient and orderly manner, while also ensuring the smooth and orderly transfer of the Canal to Panama on December 31, 1999.
Pursuant to the Canal Treaty of 1977, the Canal was expected to be operated by the PCC on a not-for-profit basis and its income was not to exceed its costs. The PCC was expected to recover through tolls and other revenues all costs of operations, maintenance and Canal improvements. The PCC’s operation of the Canal was conducted on a self-financing basis. The PCC independently set the Canal’s tolls.
The PCC’s long-term investment planning was designed to ensure that reliable and efficient service was continually provided and was based primarily on future traffic projections. Investment was financed with PCC resources derived from toll and other revenues. The Canal had operated for many years at close to capacity in terms of numbers of transits, and the PCC’s goal was to increase capacity to avoid backlog and permit overhaul work. In this regard, the PCC (and later, the Panama Canal Authority, which assumed management of the Canal from the PCC on December 31, 1999) began several major Canal improvement projects, including the widening of the Canal’s Atlantic entrance; the widening of the Gaillard Cut (the narrowest point in the Canal) to permit two-way traffic; and the overhaul of the Gatun, Miraflores, and Pedro Miguel locks. In November 2001 the Panama Canal Authority completed the widening of the Gaillard Cut, a project that the PCC had begun in 1992 and cost approximately $232.3 million. Other major maintenance programs, such as the overhaul of the locks, have been successfully completed. The Panama Canal Authority initiated the deepening of Gatun Lake and the Gaillard Cut in 2002, estimated to cost approximately $110.5 million, and completed the project in September 2009 for approximately $113.6 million.
On July 14, 2006, the Assembly approved the canal expansion plan, which was approved in a national referendum held on October 22, 2006. The expansion plan includes $1.0 billion for the Pacific locks, $0.2 billion for water supply improvements, $1.1 billion for the Atlantic Locks; $0.5 billion for waterway improvements, $0.9 billion for improving access channels for new locks and existing navigational channels, $0.5 billion for potential inflationary risk, and up to an aggregate $1.0 billion in contingencies. The plan provides that the project will be funded entirely by the Panama Canal Authority, either with its own resources or from borrowing to be repaid with its own resources and not with resources of the Republic. The Panama Canal Authority will obtain a portion of these resources through an increase in tolls. Water-saving basins will be built alongside the new locks, which will reuse 60% of the water in each transit, thereby eliminating the need for constructing dams, flooding and displacing communities along the Canal’s Watershed. Construction is expected to be completed by 2014.
On December 9, 2008, the Panama Canal Authority signed a $2.3 billion agreement with five multilateral and development organizations to finance the Canal’s expansion project, which is estimated to cost approximately $5.25 billion. The Japan Bank for International Cooperation (“JBIC”), the European Investment Bank (“EIB”), the IADB, CAF and International Finance Corporation (“IFC”) agreed to provide approximately $800 million, $500 million, $400 million, $300 million and $300 million, respectively, in financing under favorable terms to the Panama Canal Authority. The remaining funds for the expansion project are being derived from the Canal’s regular business operations and implementation of toll increases. To reduce the risk of lowering demand resulting from toll increases, the Panama Canal Authority implemented a three-year phase-in of the toll increase designed to generate the appropriate cash flows needed to finance a significant portion of the program. As of September 30, 2012, the Panama Canal Authority had drawn $1.0 billion from the credit facility for the expansion project, $800 million of which was provided by JBIC and $100 million of which was provided by each of EIB and IADB. Also as of September 30, 2012, the Panama Canal Authority had allocated approximately $3.3 billion of internal funding for the expansion project, a $1.9 billion increase from 2011.
D-34
On July 15, 2009, the construction of the third set of locks was awarded to the Grupo Unidos por el Canal consortium, composed of Sacyr Vallehermoso, S.A., Impregilo S.p.A., Jan de Nul n.v., and Constructora Urbana, S.A., for a total base price of approximately $3.1 billion. On August 11, 2009, Grupo Unidos por el Canal provided a performance bond of $400 million to the Panama Canal Authority. As of December 31, 2012, the third set of locks was 37% complete. The expected date of completion was moved to April 2015 from October 2014, due to the failure to meet certain specified concrete mix requirements in connection with the construction of the locks. As of June 30, 2013, the third set of locks was 50% complete.
The Panama Canal Authority
Recognizing the importance of the Canal to Panama, the Government took a number of actions to ensure that the Canal would continue to operate efficiently following its reversion to Panama in 1999. A 1994 Constitutional amendment created the Panama Canal Authority (“PCA”), an autonomous public entity which assumed management of the Canal from the PCC on December 31, 1999. The PCA’s annual budget must be prepared in accordance with a three-year financial plan and submitted for approval by the Cabinet and the Assembly. Under the terms of the 1994 amendment, this budget is not included in the budget of the Central Government. The revised public-sector accounting practices used by the Torrijos administration (retroactively to fiscal year 2000), and currently used by the Martinelli administration, to calculate the non-financial public sector results do not consolidate the net financial results of the PCA with the Government’s own non-financial public-sector results.
As was the case with the PCC, the PCA makes annual payments to the Central Government based upon the amount of tonnage that transits the Canal. By law, the rate (as measured on a per ton basis) for such payments may not be set at a level that will generate lower payments than those paid to Panama by the PCC on December 31, 1999. The PCA transfers to the Central Government any net surpluses generated by the Canal. In fiscal year 2008, the PCA had a surplus of $1.0 billion, up 27.5% from 2007. In fiscal year 2009, the PCA had a surplus of approximately $1.0 billion, down 2.1% from 2008. In fiscal year 2010, the PCA had a surplus of approximately $964.0 million, down 4.3% from 2009. In fiscal year 2011, the PCA had a surplus of approximately $1.2 million, up 27.5% from 2010. In fiscal year 2012, the PCA had a surplus of approximately $1.3 billion, up 2.4% from 2011.
On May 1, 2005, Panama implemented a revised measurement and pricing system applicable to full container vessels and other vessel types with on-deck container carrying capacity, to be phased in over three years. As part of the revised system, PCA adopted TEUs as the new measurement unit for full container vessels, replacing the PC/UMS (Panama Canal Universal Measurement System) and charging fully dedicated container vessels based on the total number of TEUs the vessel can carry fully loaded, taking into account the visibility restriction imposed by the PCA that limits the height of on-deck containers. For other vessel types with on-deck container carrying capacity, the former PC/UMS system is still used to measure spaces below-deck and the TEUs toll is applied to the actual number of containers on-deck. Under this system, vessels in ballast (not carrying containers or any other cargo above or below deck) are charged less than laden vessels. As part of the revised pricing system with a three-step toll increase, tolls increased by nearly one-third beginning May 1, 2005.
Since 2007, when the PCA modified its regulations for vessel measurement, vessels that are charged a toll depending on their displacement have been assessed a toll based on their maximum displacement, and passenger vessels have been assessed based on maximum passenger capacity.
The third phase of the three-step toll increase, a toll rate increase scheduled for May 2009, to which several shipping companies requested cancellation or deferral, was implemented as scheduled after extensive consultations in 2006 and early 2007 and significant accommodations to industry requests.
The Panama Canal Authority believes that its price setting consultation process provides for transparency and predictability in its pricing proposals in a manner that permits industry-wide participation. The final phase of the three-step toll rate increase went into effect on May 1, 2009, with the increase applying to certain shipping categories in October 2009. The average toll increase since 2007 was between 10% and 15%. Revenues generated by the toll system were used to fund the Canal’s modernization program. By May, 2009, the end of the phase-in period, tolls had increased approximately 65%.
D-35
On October 1, 2009, the Panama Canal Authority announced that it would continue a program that provided short-term cost reduction and greater flexibility to its reservation system until April 30, 2010. The program consisted of temporary measures designed to help mitigate the impact of the global economic crisis on the Canal’s clients, using information that was obtained through consultation with customers.
On May 1, 2010 the Panama Canal Authority terminated a short-term cost reduction program consisting of temporary measures designed to help mitigate the impact of the economic crisis on the Panama Canal’s customers and the Panama Canal Authority returned to its regular pricing measures, but it determined to continue to offer flexibility in its reservation system until further notice. Based on discussions with industry representatives, shipping lines, Government representatives and an internal analysis, the Panama Canal Authority decided not to proceed with a toll adjustment in 2010, in part due to the global economic slowdown. Instead, the Panama Canal Authority determined that the new toll adjustment would go into effect on January 1, 2011 for all segments other than PC/UMS tolls for reefers, which went into effect on April 1, 2011. The second toll adjustment became effective on October 1, 2012. The next toll adjustment will become effective October 2013.
On July 10, 2007, the Assembly approved the Panama Canal Authority’s budget for fiscal year 2008, allocating $230.7 million to the Canal’s investment plan. On July 21, 2008, the Assembly approved the Panama Canal Authority’s budget for fiscal year 2009, allocating $152.0 million to the Canal’s investment plan and $835.7 million to the Canal’s expansion project relating to the third set of locks. On September 2, 2009, the Assembly approved the Panama Canal Authority’s budget for fiscal year 2010, allocating $40.3 million to the Canal’s investment program and $752.2 million to the Canal’s modernization program. On August 19, 2010, the Assembly approved the Panama Canal Authority’s budget for fiscal year 2011, allocating $136.3 million to the Canal’s investment program and $234.9 million to the Canal’s modernization program. On September 1, 2011, the Assembly approved the Panama Canal Authority’s budget for its fiscal year ending September 30, 2012, allocating $98.2 million to the Canal’s investment program and $396.9 million to the Canal’s modernization program. On August 17, 2012, the Assembly approved the Panama Canal Authority’s budget for its fiscal year ending September 30, 2013, allocating $690.5 million to the Canal’s investment program and $145.4 million to the Canal’s modernization program. On August 20, 2013, the Assembly approved the Panama Canal Authority’s budget for its fiscal year ending September 30, 2014, allocating $269.9 million to the Canal’s investment program and $180.1 million to the Canal’s modernization program.
Effective April 1, 2006, the Panama Canal Authority increased the rates for tug and linehandling services due to rising operating costs. Rates for tug services increased 7.0% and rates for linehandling services rose 4.0%. Rates for these services had not been increased since March 2004. Due to rising operating costs, effective March 1, 2008, the Panama Canal Authority again increased the rates for tug and linehandling services. Rates for tug services rose 8.0% and rates for linehandling services increased 7.0%. No further increase have occurred since March 1, 2008.
Reversion of the Former Canal Zone Properties
In 1993, the Government established the Interoceanic Region Authority (“ARI”) to assist with the orderly transfer of the Canal and the former Canal Zone. ARI was an autonomous Government agency charged with integrating the former Canal Zone properties and resources into the Panamanian economy to enhance the country’s economic and social development. To this end, ARI was responsible for administering and managing the former Canal Zone areas (other than the Canal itself) after their reversion to Panamanian control. On December 27, 2005, the Cabinet issued Cabinet Resolution No. 108 transferring ARI’s functions and responsibilities to the Ministry of Economy and Finance. On January 1, 2006, the Ministry of Economy and Finance began overseeing the integration of former Canal Zone properties and resources into the Panamanian economy. In May 2006, ARI’s name was changed to the Administrative Unit of Reverted Properties (Unidad Administrativa de Bienes Unidos, or UABR) by Executive Decree No. 67 dated May 25, 2006. Contributions from the sale of the reverted properties were to be transferred to the Development Trust Fund. Between September 2004 through April 2009, contributions to the Development Trust Fund from the UABR amounted to approximately $111.3 million.
D-36
Other Trans-Isthmus Transportation
The dimensions of the Canal permit much of the world’s commercial maritime fleet to transit and the Canal expansion will increase this capacity. However, certain classes of ships, principally the largest capacity tankers and container ships, are too large to transit the Canal and the expansion of the Canal will not accommodate all of them. This limitation, combined with the fact that the Canal has generally operated at capacity in terms of units, has caused the exploration of other trans-isthmus modes of transportation as a means of connecting the Atlantic and Pacific. Two such modes exist; a railway which was constructed in the former Canal Zone and an oil pipeline constructed outside of the former Canal Zone.
Railway. In February 1998, Panama granted a renewable, 25-year concession to the Panama Canal Railway Co., a joint venture between two United States corporations, Kansas City Southern Industries, Inc. and MI-JACK Products, Inc., to renovate and reopen the trans-isthmus railway, principally for connecting the container ship ports on both coasts. Under the terms of this concession, this joint venture is required to pay to the Government 5.0% of its profits until it recovers its initial investment; after recovery of its initial investment, it will be required to pay the Government 10.0% of its profits. Passenger and container transport services were initiated in September and October 2001, respectively. In 2010, the railway moved approximately 1.2 million TEUs, which represents an increase of 478.5 TEUs as compared to 2009. In 2011, the railway moved approximately 1.4 million TEUs, which represents an increase of 181.5 TEUs as compared to 2010. In 2012, the railway moved approximately 1.3 million TEUs, which represents a decrease of 115.5 TEUs as compared to the same period in 2011.
Oil Pipeline. The trans-isthmus oil pipeline, completed in 1982, was constructed because the world’s largest oil tankers could not transit the Panama Canal. The pipeline operated in an eastward direction, in large part to service the market for Alaskan crude oil shipments to oil refineries on the east coast of the United States. On November 28, 1995, the United States Congress rescinded the ban on the exportation of Alaskan crude oil, thereby allowing the export of Alaskan crude oil to Asia and eliminating the need to transport Alaskan crude oil to the east coast of the United States by means of the trans-isthmus oil pipeline. In June 1995, the Government signed a contract with Petroterminales de Panamá S.A. (a joint venture between the Government and Northville Industries Corp.) allowing Petroterminales de Panamá S.A. to expand the pipeline’s terminal ports at Chiriquí Grande on the Caribbean and Puerto Armuelles on the Pacific into general cargo ports until 2016. The Pacific and Atlantic terminals are connected by a 131 kilometer (approximately 81 miles) pipeline. At present, oil is pumped from the Atlantic to the Pacific Terminal, after the completion of the pipeline reversal project in August 2009. The pipeline has a pumping capacity of approximately 800,000 barrels per day.
Toll Road. In 1994, Panama granted a concession to Proyectos y Construcciones, S.A. (“PYCSA”), a Mexican consortium, for construction of the Madden-Colón highway, a trans-isthmus toll road between Panama City and Colón. The first of a total of two sections of this road was completed in May 1999 and is in use. In January 2007, the Government approved the transfer of the concession from PYCSA to Odebrecht, a Brazilian construction company, for the section between Madden to Colón (second phase), which then transferred the concession to Concesionaria Madden-Colón (“CMC”), one of its Panamanian subsidiaries. Odebrecht built and completed the first phase of the toll road from Madden to Quebrada López at a total cost of approximately $299.6 million. On April 29, 2009, the first phase of the Madden-Colón Highway became operational under the maintenance and administration of CMC, and the operation of the highway has been continuous and uninterrupted, and has generated toll payments. In July 2012, the second phase of the Madden-Colón highway connecting Quebrada López to Cuatro Altos was completed following an investment of approximately $213.6 million.
During the first quarter of 2011 the Government created an autonomous public entity, Empresa Nacional de Autopistas, referred to as ENA, in order to provide the financing for, and to acquire ownership of, the Corredor Sur and Corredor Norte toll highways in Panama. The Republic subsequently decided to separate the acquisition of the Corredor Sur and Corredor Norte toll roads into two stand-alone transactions. On August 12, 2011, ENA acquired Corredor Sur, and on August 18, 2011, ENA successfully issued and placed $395.0 million dollars in
D-37
bonds to finance the acquisition of the toll road. The Government contributed $50 million to ENA in connection with the purchase. The transaction was finalized on August 24, 2011. In that regard, ENA entered into agreements during the second quarter of 2012 for the acquisition of Phases I and IIA and the Panama-Madden segments of Corredor Norte, at a purchase price of $647 million. ENA issued $600 million in bonds and the government contributed approximately $76.2 million in connection with the purchase. The transaction was completed in October 2012.
D-38
THE COLÓN FREE ZONE
The CFZ was created by the Panamanian Government in 1948 to take advantage of Panama’s unique geographic location and to boost trading activity in the province of Colón. The CFZ, located at the Atlantic entrance of the Panama Canal, has developed into the largest duty-free zone in the Western Hemisphere in terms of commercial activity. As of August 31, 2013, approximately 3,101 companies used the CFZ service facilities for a variety of trading activities.
In addition to being exempt from tariffs and duties, companies operating in the CFZ enjoy preferential tax treatment. In the past, the income of CFZ companies was taxed at graduated rates from 2.5% to 8.5%. Under the Ley de Universalización de Incentivos Tributarios a la Producción, such income was to be taxed at a flat 15%. However, significant protests, including a refusal by some CFZ companies to pay taxes, resulted in the elimination of all taxes on international operations income for CFZ companies effective January 1, 1997.
The CFZ has a significant impact on the Panamanian economy. From 2008 through 2012, it contributed an average of 7% of GDP. The value of goods passing through the CFZ is considerable, particularly in relation to the Panamanian economy as a whole. In 2011, total imports to the CFZ were preliminarily estimated at $14.0 billion, up from $10.2 billion in 2010, while total re-exports were $15.1 billion, up from $11.4 billion in 2010. By contrast, Panama’s non-CFZ, non-petroleum merchandise exports were preliminarily estimated at $785 million in 2011, while non-CFZ merchandise imports were $11.3 billion in 2011. In 2012, total imports to the CFZ were preliminarily estimated at $14.7 billion, up from $14.0 billion in 2011, while total re-exports were $16.1 billion, up from $15.1 billion in 2011. By contrast, Panama’s non-CFZ, non-petroleum merchandise exports were preliminarily estimated at $821 million in 2012, while non-CFZ merchandise imports were $12.6 billion in 2012.
In 2008, the activities of the CFZ increased by 6.1%, reflecting a contribution of 7.0% of GDP compared to 7.3% of GDP in 2007. In 2009, the activities of the CFZ increased by 2.1% compared to 2008, reflecting a contribution of 6.9% of GDP. This lower increase was due in part to the global economic downturn and trade restrictions imposed by certain major South American customers, such as Colombia, Ecuador and Venezuela. In 2010, the activities of the CFZ increased by 7.5% compared to 2009, reflecting a contribution of 6.9% of GDP. This increase is primarily attributable to an increase in re-exports as a result of the economic recovery in the Latin American markets. In 2011, the activities of the CFZ increased by 15.1% compared to 2010, reflecting a contribution of 7.2% of GDP. This increase is primarily attributable to the increase in re-exports to the principal markets. In 2012, the activities of the CFZ increased by 5.6% compared to 2011, reflecting a contribution of 6.7% of GDP. This increase is primarily attributable to an increase in revenues from re-exports and the merchandized handled.
The CFZ’s major competitors are the Miami, Chile, Aruba, Curaçao and Uruguay free trade zones. Traditionally, the CFZ has enjoyed several competitive advantages over certain of its competitors, including the CFZ’s use of the U.S. dollar as legal tender, lack of restrictions on capital movements and access to frequently traveled land, air and sea routes. Global and regional trends in trade patterns and capital liberalization, however, have begun to narrow several of these competitive advantages and affect the CFZ’s prospects for continued rapid growth. As of June 27, 2013, the amount that Venezuelan importers owed to CFZ exporters is estimated to be $1.1 billion. The measures imposed by the Venezuelan Government, such as the exchange control implemented by the Foreign Exchange Administration Commission (CADIVI), restricts the access to US dollars by Venezuelan importers. On June 18, 2013, Panama filed a dispute at the World Trade Organization (WTO) against Colombia regarding customs measures related to tariffs on the importation of certain textiles, apparel and footwear from the CFZ. Among the Colombian measures are a tariff surcharge of 10% and a tax of $5.00 per gross kilo imported.
D-39
EMPLOYMENT AND LABOR
Labor Force
In 2012, Panama’s labor force was preliminarily estimated at 1.7 million (up from 1.6 million in 2011), which represented approximately 63.5% of the total working age population. As of August 2012, the service segment (principally consisting of real estate, commerce and tourism, public administration, the Panama Canal, banking, the CFZ and public utilities) employed 66.2% of the employed labor force, compared to 16.7% for the primary sector (consisting of agriculture and fisheries) and 17.1% for the industrial sector (consisting of manufacturing and construction).
In 2008 the open unemployment rate decreased slightly to 4.2% primarily as a result of improved economic conditions. In 2009, the open unemployment rate increased to 5.2%. This increase was partially attributable to a decline in construction sector activity, restrictions on access to credit and a reduction in agricultural exports. In 2010, the open unemployment rate decreased slightly to 4.7% as a result of new hiring in the private sector (20,710 employees hired) and in the government (15,470 employees hired). In 2011, the open unemployment rate decreased to 2.9% primarily due to economic stability and an inflow of foreign direct investments. In 2012, the open unemployment rate increased slightly to 3.0%.
Historically, Panama’s unemployment rate has been influenced by the service-oriented nature of the economy, which is not labor intensive. The Moscoso administration introduced programs aimed at reducing unemployment, including Government-sponsored job fairs and a program to train those entering the work force for the first time. In 2004, the Torrijos administration launched an economic plan that sought to reduce unemployment by increasing foreign trade and investment and initiating programs to enhance education. In 2009, the Martinelli administration launched a five-year strategic plan that seeks to stimulate employment through long-term investment in infrastructure projects. Training programs such as My First Job (Mi Primer Empleo) and other similar programs have contributed to reducing the unemployment levels; these programs have been executed by the Ministry of Work and Labor Development (Ministerio de Trabajo y Desarrollo Laboral, or “MITRADEL”), The National Institute of Professional and Human Development (El Instituto Nacional de Formación Profesional y Capacitación para el Desarrollo Humano, or “INADEH”) and The Micro, Small and Medium Enterprises Authority (Autoridad de la Micro, Pequeña y Mediana Empresa, or “AMPYME”).
Panamanian private sector workers have the legal right to join unions of their choice, subject to the unions’ registration with the Government. As of December 31, 2012, approximately 12.6% of Panama’s total employed labor force was organized, with the construction industry union as the largest. Unions engage in collective bargaining, primarily involving the negotiation of wages. The law prohibits anti-union discrimination by employers and most workers enjoy the right to strike. Certain public service workers vital to public welfare and security (e.g., police, health, and Panama Canal Authority employees) are not entitled to strike. While there were significant strikes during the economic and political disruptions of the mid- to late-1980s, the number of strikes in recent years has generally been limited.
D-40
The following table sets forth certain labor force and unemployment statistics for the five years ended August 30, 2008 through August 30, 2012:
TABLE NO. 9
Labor Force and Employment
| | | | | | | | | | | | | | | | | | | | |
| | | 2008 | | | 2009 | | | 2010 | | | 2011(R) | | | 2012 | |
Total Population | | | 3,537.9 | | | | 3,600.0 | | | | 3,661.8 | | | | 3,723.8 | | | | 3,787.5 | |
Working-Age Population | | | 2,356.9 | | | | 2,403.7 | | | | 2,450.4 | | | | 2,603.4 | | | | 2,658.9 | |
| | | | | |
Labor Force | | | | | | | | | | | | | | | | | | | | |
Employed | | | 1,421.9 | | | | 1,440.8 | | | | 1,455.6 | | | | 1,538.1 | | | | 1,621.1 | |
Unemployed | | | 84.0 | | | | 101.1 | | | | 101.5 | | | | 72.2 | | | | 68.4 | |
Total | | | 1,505.9 | | | | 1,541.9 | | | | 1,557.1 | | | | 1,610.2 | | | | 1,689.5 | |
| |
| | | (annual percentage change) | |
Total Population | | | 1.8 | % | | | 1.8 | % | | | 1.7 | % | | | 1.7 | % | | | 1.7 | % |
Working-Age Population | | | 2.0 | % | | | 2.0 | % | | | 1.9 | % | | | 6.2 | % | | | 2.1 | % |
Labor Force | | | | | | | | | | | | | | | | | | | | |
Employed | | | 4.8 | % | | | 1.3 | % | | | 1.0 | % | | | 5.7 | % | | | 5.4 | % |
Unemployed | | | 24.8 | % | | | 20.3 | % | | | 0.3 | % | | | (28.9 | )% | | | (5.3 | )% |
Total | | | 3.9 | % | | | 2.4 | % | | | 1.0 | % | | | 3.4 | % | | | 4.9 | % |
| |
| | | (in percent) | |
Labor Force: | | | | | | | | | | | | | | | | | | | | |
Participation Rate(1) | | | 63.9 | | | | 64.1 | | | | 63.5 | | | | 61.9 | | | | 63.5 | |
Employment Rate(2) | | | 94.4 | | | | 93.4 | | | | 93.5 | | | | 95.5 | | | | 96.0 | |
Unemployment Rate(3) | | | 4.2 | | | | 5.2 | | | | 4.7 | | | | 2.9 | | | | 3.0 | |
| (1) | Total labor force as percentage of working-age population. |
| (2) | Employed labor force as percentage of total labor force. |
| (3) | Open unemployment based on the annual August Employment Survey. The open unemployment rate excludes persons not actively looking for employment. |
Source: Office of the Comptroller General.
Salaries and Wages
Panamanian labor law provides for a basic minimum wage (starting at $1.22 per hour in 2012, depending upon the worker’s location and economic activity). Workers are also entitled to minimum benefits and working conditions including a cap on hours worked weekly (48 hours/week), specified holidays, vacations, retirement and severance benefits, and health and safety regulations. The Panamanian economy, however, has a substantial informal sector in which workers earn below the minimum wage and do not enjoy many of the benefits required by law. The informal economy, which is estimated to involve approximately one-fourth of the labor force, includes street vendors, operators and employees of unlicensed businesses and certain other self-employed persons. While overall GDP statistics include economic contributions of the informal sector, the Government has not found it feasible to quantify fully the GDP contribution of this sector.
D-41
Although Canal Zone workers have been within the jurisdiction of Panamanian laws since the abolition of the Canal Zone in 1979, numerous treaty provisions and legislative and administrative actions have permitted the former Canal Zone workers who continue to work to be subject to United States wage and labor laws and benefits. Private sector employees rendering services related to the Panama Canal must be paid a significantly higher minimum wage than is applicable in the rest of Panama. PCC employees and civilian employees of the United States military were subject to special labor and social security regimes, depending on their nationality and the date of their original employment. By an amendment to the Constitution adopted in 1994, Panama Canal Authority employees did not have their wages or benefits diminished when the Panama Canal Authority assumed control of the Panama Canal on December 31, 1999. In 2012, as a result of these factors, average monthly wages for the Panama Canal Authority were $31.1 million.
On July 22, 2009, President Martinelli issued Executive Decree No. 250, published in the Gaceta Oficial Digital No. 26,329-A of July 22, 2009, which came into force on August 1, 2009. Under this decree, the basic wages of certain positions in the police force have been increased in order to provide citizens better incentive to join the police force and to promote overall security in Panama.
In 2012, average monthly wages for Central Government employees increased to $843.6, an increase of 21.4% as compared to 2011, while average monthly wages for public sector employees of municipalities increased to $481.2 and by 1.1%, compared to 2011. In 2012, average monthly real private sector wages increased to $765.3, or 9.3%, compared to 2011. In 2012, average banana plantation monthly wages were $431.3, an increase of 21.1% from 2011.
In 2012, average monthly wages in all sectors of the Panamanian economy increased in real terms an average of 9.8%. In 2011, average monthly wages in all sectors of the Panamanian economy increased in real terms an average of 5.4%. In 2010, average monthly wages in all sectors of the Panamanian economy increased in real terms an average of 11.1%. In 2009 average monthly wages in all sectors of the Panamanian economy increased in real terms an average of 4.5%. In 2008 average monthly wages in all sectors of the Panamanian economy increased in real terms an average of 5.4%.
In 2012, public sector wages increased by 11.4%. In 2011, public sector wages decreased by 12.6%. In 2010, total public sector wages increased by 24.8%. In 2009, public sector wages increased by 7.9%, and in 2008 public sector wages increased by 3.9%.
In 2012, average monthly real private sector wages increased by 8.8%, compared to 2011. In 2011, average monthly real private sector wages increased by 6.2%, compared to 2010. In 2010, average monthly real private sector wages increased 13.8%, compared to 2009. In 2009, average real private sector wages grew, increasing by 2.9%. In 2008, average real private sector wages grew, increasing by 7.2%.
By law, the minimum wage is subject to review every two years. The minimum wage, which became effective on January 1, 2012, was raised to its current levels by Executive Decree No. 240 dated December 28, 2011, increasing the minimum wage by a percentage of between 15% and 18%, depending on the sector. The minimum wage will be reviewed again in December 2013.
D-42
The following table sets forth a summary of average real monthly wages for the years 2008 through 2012:
TABLE NO. 10
Average Real Monthly Wages
| | | | | | | | | | | | | | | | | | | | |
| | | 2008 | | | 2009 | | | 2010 | | | 2011 | | | 2012 | |
Public Sector: | | | | | | | | | | | | | | | | | | | | |
Central Government | | $ | 599.0 | | | $ | 650.0 | | | $ | 665.3 | | | $ | 694.8 | | | $ | 843.58 | |
Autonomous agencies | | | 796.3 | | | | 864.2 | | | | 857.01 | | | | 876.75 | | | | 955.04 | |
Municipalities | | | 379.1 | | | | 405.6 | | | | 436.4 | | | | 476.0 | | | | 481.16 | |
All Public Sector | | | 732.2 | | | | 790.3 | | | | 986.5 | | | | 862.4 | | | | 960.40 | |
Private Enterprise | | | 565.8 | | | | 582.4 | | | | 662.81 | | | | 704.1 | | | | 766.35 | |
Banana Plantations(1) | | | 362.3 | | | | 354.1 | | | | 392.8 | | | | 356.0 | | | | 431.35 | |
| | | | | | | | | | | | | | | | | | | | |
All Employees | | $ | 608.1 | | | $ | 635.2 | | | $ | 705.8 | | | $ | 744.2 | | | $ | 817.37 | |
| | | | | |
| | | 2008 | | | 2009 | | | 2010 | | | 2011 | | | 2012 | |
| | | (annual percentage change) | |
Public Sector: | | | | | | | | | | | | | | | | | | | | |
Central Government | | | 5.0 | % | | | 8.5 | % | | | 2.4 | % | | | 4.4 | % | | | 21.4 | % |
Autonomous Agencies | | | 5.4 | | | | 4.5 | | | | (0.8 | ) | | | 2.3 | % | | | 8.9 | % |
Municipalities | | | 2.7 | | | | 7.0 | | | | 7.6 | | | | 9.1 | % | | | 1.1 | % |
All Public Sector | | | 3.9 | | | | 7.9 | | | | 24.8 | | | | (12.6 | ) | | | 11.4 | % |
Private Enterprise | | | 7.2 | | | | 2.9 | | | | 13.8 | | | | 6.2 | | | | 8.8 | % |
Banana Plantations(1) | | | 1.3 | | | | (2.3 | ) | | | 10.9 | | | | (9.4 | ) | | | 21.2 | % |
| | | | | | | | | | | | | | | | | | | | |
All Employees | | | 5.4 | % | | | 4.5 | % | | | 11.1 | % | | | 5.4 | % | | | 9.8 | % |
| (1) | Calculation includes wages of laborers on independent producers’ farms, and excludes wages of laborers who work 22 or fewer days in a given month. |
Source: Office of the Comptroller General.
Social Security
Social security benefits covering private sector and public sector employees are provided by Caja de Seguro Social (“CSS”), with additional benefits for public sector employees provided through the Complementary Pension Fund for Civil Servants (“CPF”), administered by CPF. The main sources of CSS revenue are contributions equal to 19.5% of wages (8.0% paid by employees and 11.5% by employers), Central Government transfers and investment income. In 2012, CSS’s revenues and expenditures amounted to 7.3% and 5.7% of nominal GDP, respectively.
On December 28, 2005, after approval by the Assembly on December 21, 2005, the Torrijos administration approved Law No. 51 which reforms Panama’s social security system. Under Law No. 51, effective 2013, employees have to have contributed to the social security system for 20 years (up from the prior 15-year requirement and down from the 25-year requirement embodied in Law No. 17) before becoming eligible to receive benefits. As of December 31, 2012, under Law No. 51, the current retirement age for men is 62 and 57 for women. However, Law No. 51 permits early or delayed retirement within a range of ages and the specific age at which one retires determines a retiree’s level of benefits. Additionally, Law No. 51 increases employer contributions to the social security system from 10.75% to 12.25% and employee contributions from 7.25% to 9.75% through 2013. Furthermore, Law No. 51 reforms Panama’s social security system by gradually transitioning from the defined benefits system to personal savings accounts. All persons under 35 years of age who are covered by the social security system have the option of retaining the defined benefit system or electing to participate in the personal savings accounts.
The CSS provides benefits in the following areas: health, pensions and disability (“IVM”), workers’ compensation and program administration. As of December 31, 2012, IVM accounts for approximately 53.5% of CSS’s revenues and almost 57.7% of its expenditures. Demographic trends such as an aging population and increase in the number of pension beneficiaries have contributed to the decline of the financial position of IVM.
D-43
On September 12, 2008, the Republic, represented by the Ministry of Economy and Finance, executed an Administration and Investment Trust in order to provide annual funds to CSS’s IVM, as mandated by Law No. 51. The Republic disbursed the first deposit of funds to IVM of $75 million in December 2007 to cover the 2007 deficit. During 2008, the Republic disbursed an additional $70.8 million, but the IVM had a surplus for 2008 of $41.5 million, and the scheduled transfer of $75 million for 2009 was not made. In 2009 and 2010, IVM had deficits of $64.1 million and $61.8 million, respectively, and a transfer of $91.5 million was made in 2010. In 2011, a transfer of $100 million was scheduled, but the Republic disbursed $153.3 million. In the event, IVM ran a surplus of $126.4 million in 2011, and a surplus of $31 million in 2012, so no 2012 transfer was made. The Republic is scheduled to disburse an additional $140 million each year from 2013 through 2060 but the amount of disbursements may vary.
The CPF, created in 1975, facilitates payment of pensions to retired public sector employees, including those eligible to receive pensions under certain special laws that generally allow retirement before the CSS’s statutory retirement ages (as of December 31, 2012, 62 for men and 57 for women) with pensions of up to 100% of the most recently earned salary. Some of the special laws date back to the 1930s when the Government began granting benefits to particular categories of public sector employees. Once the statutory retirement age is reached and CSS pensions are received, the special laws provide additional pensions so as to maintain 100% of the most recently earned salary (up to certain maximums).
To finance the CPF’s pension payments, public sector employees contribute 2.0% of their salaries to the CPF and employers pay 0.3% of their employees’ wages to cover the CPF’s administrative costs. In February 1997, the Assembly adopted Law No. 8, which reformed the CPF and established the Public Employees Savings Pension Capitalization System (“SIACAP”), a defined contribution pension plan for most public sector employees. Only public sector employees who retired or were eligible for CPF pensions on or before December 31, 1999 continue to be CPF participants. Other public sector employees were immediately transferred to SIACAP. SIACAP participants have individual accounts funded initially with Government-issued bonds equal to CPF contributions previously made by the participant plus interest at 5.0% per annum since contribution. In August 1999, the Government issued $395 million aggregate principal amount of such bonds (the “SIACAP Bonds”). Future contributions will be made by participants and the Government as a percentage of the participant’s wages. Because SIACAP is a defined contribution plan, the value of future retirement benefits will depend on the assets in an individual’s account, thus eliminating future unfunded pension liability for the CPF for SIACAP participants. Because SIACAP participants will no longer be making current contributions to the CPF, the CPF will have no revenues and will run annual deficits, although its annual deficits will decline as the number of participants falls.
Since its inception on July 7, 2000, through July 31, 2013, SIACAP had received over $1.2 billion in contributions from its participants. As of July 31, 2013, SIACAP had 415,122 participants and carried a balance of $639.9 million. As of December 31, 2012, SIACAP had 408,777 participants and carried a balance of $644.6 million. Of those participants, approximately 100% of its participants, were receiving benefits from SIACAP. As of December 31, 2011, SIACAP had approximately 392,954 participants, a 6.6% increase from the 368,552 participants as of December 31, 2010, and carried a balance of $633.4 million.
D-44
PUBLIC FINANCE
Public finance in Panama is heavily influenced by the U.S. dollar-based monetary arrangements in place since 1904. The lack of a printed national currency and the general absence of domestic budgetary financing through the banking system, except to a limited extent, have imposed constraints on fiscal and monetary policy that are not present in countries that can finance their deficits by printing local currency.
Central Government Budget
The Government’s fiscal year is the calendar year. Pursuant to the Panamanian Constitution, responsibility for the preparation of the Central Government budget rests with the executive branch. Under Article 184 of the Constitution, the executive branch must submit a budget proposal to the Assembly by October 1 of each year.
Prior to December 31 of each year, the Assembly may accept, reject or suggest revisions to the budget proposal. If the Assembly accepts either the original or a revised budget proposal, it becomes law. If the Assembly rejects the budget proposal or the Assembly suggests revisions to the executive branch budget proposal and the executive branch does not reflect the revisions in the form of a new budget proposal submitted to the Assembly, for most expenditures the prior year’s budget remains in force until a new budget is approved. For certain limited classes of expenditures, including budgeted debt service payments, the budget proposal must be implemented each year regardless of Assembly action. If the Assembly fails to take action on the budget by December 31 by accepting, rejecting or suggesting revisions, the new budget automatically becomes law on January 1.
The National Assembly approved Panama’s 2013 budget on October 18, 2012. The 2013 budget contemplates total expenditures of $16.3 billion, with budget estimates based on an anticipated 12.0% growth in nominal GDP, and an anticipated consolidated non-financial public sector deficit of approximately $1,106.5 million (or approximately 2.8% of estimated nominal GDP) for 2013. Under the 2012 budget, nominal GDP for 2012 was expected to be $34.0 billion. Under the 2013 budget, and as of April 2013 the Republic estimated nominal GDP for 2013 would be approximately $38.8 billion. As of June 2013 the Republic estimated that nominal GDP for 2013 would be approximately $41.0 billion.
Under the 2013 budget, the Central Government’s total expenditures for the year are expected to be approximately $9.6 billion, which includes approximately $903.3 million for interest on central government debt. The 2013 budget allocates public expenditures as follows: 48.6% to the social sector; 7.2% to infrastructure; 21.1% to production/development; 12.4% to general services; and 10.7% to debt service.
D-45
TABLE NO. 11
Budgeted Expenditures of the Central Government by Function
(in millions)
| | | | | | | | | | | | | | | | | | | | |
Itemization | | 2008 | | | 2009 | | | 2010 | | | 2011 | | | 2012 | |
Legislative | | | 57.7 | | | | 62.4 | | | | 66.9 | | | | 66.9 | | | | 70.6 | |
Judiciary | | | 61.8 | | | | 74.2 | | | | 84.4 | | | | 89.0 | | | | 112.5 | |
General Comptroller | | | 57.2 | | | | 72.1 | | | | 88.6 | | | | 88.6 | | | | 88.2 | |
Presidency | | | 176.8 | | | | 263.4 | | | | 677.7 | | | | 774.7 | | | | 927.2 | |
Government | | | 382.6 | | | | 519.8 | | | | 673.2 | | | | 592.3 | | | | 827.0 | |
Foreign Affairs | | | 51.2 | | | | 50.8 | | | | 49.8 | | | | 49.8 | | | | 66.7 | |
Education | | | 968.2 | | | | 1,063.0 | | | | 1,186.5 | | | | 1,437.0 | | | | 1,456.7 | |
Commerce and Industry | | | 66.0 | | | | 81.4 | | | | 93.1 | | | | 77.8 | | | | 143.7 | |
Public Works | | | 482.9 | | | | 456.4 | | | | 652.0 | | | | 732.3 | | | | 755.5 | |
Agriculture | | | 104.2 | | | | 115.3 | | | | 107.3 | | | | 107.3 | | | | 161.6 | |
Health | | | 866.2 | | | | 979.8 | | | | 1,078.9 | | | | 1,078.6 | | | | 1,263.1 | |
Labor | | | 89.6 | | | | 98.5 | | | | 100.1 | | | | 100.1 | | | | 53.1 | |
Housing | | | 61.2 | | | | 89.4 | | | | 131.6 | | | | 101.7 | | | | 163.6 | |
Economy and Finance | | | 465.4 | | | | 543.5 | | | | 733.8 | | | | 755.1 | | | | 744.0 | |
Social Development | | | 97.5 | | | | 174.3 | | | | 194.5 | | | | 175.1 | | | | 196.8 | |
Public Ministry | | | 54.3 | | | | 62.7 | | | | 76.7 | | | | 67.7 | | | | 89.6 | |
Electoral Tribunal | | | 63.8 | | | | 36.7 | | | | 35.7 | | | | 39.0 | | | | 62.9 | |
Other expenses | | | 12.8 | | | | 21.3 | | | | 23.1 | | | | 19.9 | | | | 22.9 | |
Total | | $ | 4,119.5 | | | $ | 4,765.0 | | | $ | 6,054.0 | | | $ | 6,352.9 | | | $ | 7,205.7 | |
Source: Ministry of Economy and Finance.
In 2012, Panama’s non-financial public sector balance registered a deficit of approximately $765.3 million (or 2.1% of nominal GDP), down from a deficit of approximately $703.1 million (or 2.2% of nominal GDP) in 2011. In 2011, Panama’s non-financial public sector balance registered a deficit of approximately $703.1 million (or 2.2% of nominal GDP), up from a deficit of approximately $511.7 million (or 1.9% of nominal GDP) in 2010. In 2009. Panama’s non-financial public sector balance registered a deficit of approximately $252.5 million (or 1.0% of nominal GDP), down from a surplus of $97.8 million in 2008 (or 0.4% of nominal GDP).
The Central Government’s overall balance registered a deficit of approximately $1.3 billion (or 3.5% of nominal GDP) in 2012, a deficit of approximately $1.1 billion (or 3.5% of nominal GDP) in 2011, a deficit of approximately $682.6 million (or 2.5% of nominal GDP) in 2010 and a deficit of approximately $357.2 million (or 1.5% of nominal GDP) in 2009, down from a surplus of $63.3 million (or 0.3% of nominal GDP) in 2008.
Taxation
The Panamanian Constitution authorizes the levying and collection of taxes by taxing authorities at both the national and municipal levels. The Central Government collects taxes on personal and corporate income, real property and certain securities. In addition, the Central Government collects import and export duties and a value-added tax on all personal property, except food, medicine and other minor items. In July 2010, the value-added tax was increased from 5.0% to 7.0%. Municipalities are permitted to collect taxes from sources of a more local nature, such as taxes on public performances, sales of alcoholic beverages, quarry activities and forestry.
Preliminary figures indicate that approximately 71.5% of the Central Government’s current revenues in 2012 came from various forms of taxation. The Central Government tax revenues in 2012 were $4.7 billion, an increase of 26.9% over 2011 tax revenues. Approximately 52.8% of 2012 tax revenues were from direct taxes, compared to their 45.8% contribution to 2011’s tax revenues. Direct tax revenues increased 46.1% in 2012, rising to $2.5 billion from $1.7 billion in 2011.
D-46
Personal income tax rates vary by incremental stages based on the individual’s earnings per year. Each tax bracket includes a fixed component as well as a variable percentage assessed on the income above the minimum income level for the applicable bracket. Corporate income taxes are 30% of non-CFZ income, as a result of the Ley de Universalización de Incentivos Tributarios a la Producción (the “LUIT”). Domestic transaction taxes, such as the value-added tax, a tax on petroleum products and tobacco and beverage taxes, made up 47.19% of 2012 tax revenues.
As a result of the LUIT, Panama’s accession to the WTO and free trade negotiations, the rates and computation of various import duties have changed and can be expected to continue to change in the future. See “Foreign Trade and Balance of Payments— Tariffs and Other Trade Restrictions”. In addition to the changes in corporate tax rates, other tax changes in the LUIT included: eliminating the deductibility of certain non-agricultural investment costs by agricultural enterprises (thus reducing a tax preference for the agricultural sector); initially reducing and then eliminating in 2003 tax credit certificates given to certain exporters of nontraditional exports; restricting a tax exemption to only low-cost housing for real estate capital gains income reinvested in new housing; restricting the deductibility of interest paid on back-to-back credits; and eliminating, in 2000, a 25% income tax credit for certain new investments. The LUIT also introduced a drawback mechanism whereby an exporter, at the time of shipping, can obtain a reimbursement of all taxes paid upon importation on account of products used in the process of manufacturing the exported goods.
In addition to Central Government and municipal taxes, other public sector entities also have taxing authority. These include CSS, whose various taxes and assessments generally equal approximately 9.75% of an employee’s wages and 12.25% of the employer’s wage bill, each as of January 1, 2013, while the education tax is equal to 1.25% of an employee’s wages and 1.5% of an employer’s wage bill.
Revenues and Expenditures
The following tables set forth the revenues, by purpose, and expenditures, by sector, of the Central Government and the consolidated non-financial public sector for the years 2008 through 2012. The non-financial public sector includes the Central Government, decentralized agencies and non-financial public enterprises. Decentralized agencies include CSS and principal universities. Under the terms of the 1994 amendments to the Constitution, the Panama Canal Authority budget is not included in the budget of the Central Government.
D-47
TABLE NO. 12
Central Government Operations
(in millions of dollars)
| | | | | | | | | | | | | | | | | | | | |
| | | 2008 | | | 2009 | | | 2010 | | | 2011(P) | | | 2012(E) | |
Total Revenues | | | 4,557.7 | | | | 4,459.9 | | | | 4,993.3 | | | | 5,571.0 | | | | 6,490.1 | |
Current Revenues | | | 4,231.0 | | | | 4,376.7 | | | | 4,845.6 | | | | 5,537.9 | | | | 6,472.6 | |
Tax Revenues | | | 2,439.3 | | | | 2,639.6 | | | | 3,286.4 | | | | 3,711.8 | | | | 4,689.9 | |
Direct | | | 1,257.6 | | | | 1,412.2 | | | | 1,678.6 | | | | 1,701.8 | | | | 2,477.9 | |
Indirect | | | 1,181.7 | | | | 1,227.4 | | | | 1,607.8 | | | | 2,010.0 | | | | 2,212.0 | |
Non Tax Revenues | | | 1,791.7 | | | | 1,737.1 | | | | 1,756.9 | | | | 1,994.1 | | | | 2,051.0 | |
Adjustments to Rent | | | — | | | | — | | | | (197.6 | ) | | | (168.0 | ) | | | (268.3 | ) |
Capital Gains | | | 243.5 | | | | 53.1 | | | | 130.2 | | | | 15.0 | | | | 3.0 | |
Donations | | | 83.2 | | | | 30.1 | | | | 17.5 | | | | 18.1 | | | | 14.4 | |
| | | | | |
Total Expenses | | | 4,494.3 | | | | 4,817.1 | | | | 5,676.0 | | | | 6,678.6 | | | | 7,775.5 | |
Current Expenses | | | 3,200.8 | | | | 3,285.0 | | | | 3,696.9 | | | | 4,164.5 | | | | 4,533.8 | |
Wages and Salaries | | | 1,097.9 | | | | 1,178.6 | | | | 1,278.9 | | | | 1,413.4 | | | | 1,588.3 | |
Goods and Services | | | 322.5 | | | | 335.3 | | | | 324.7 | | | | 407.7 | | | | 527.6 | |
Transfers | | | 977.3 | | | | 983.7 | | | | 1,279.6 | | | | 1,513.7 | | | | 1,546.1 | |
Interest | | | 718.2 | | | | 703.6 | | | | 706.1 | | | | 730.2 | | | | 739.8 | |
Others | | | 84.9 | | | | 83.8 | | | | 107.6 | | | | 99.5 | | | | 131.9 | |
| | | | | |
Current Savings | | | 1,030.2 | | | | 1,091.7 | | | | 1,148.8 | | | | 1,373.4 | | | | 1,938.9 | |
% of GDP | | | 4.5 | % | | | 4.5 | % | | | 4.3 | % | | | 4.4 | % | | | 5.3 | % |
Total Savings | | | 1,356.9 | | | | 1,174.9 | | | | 1,296.5 | | | | 1,406.5 | | | | 1,956.3 | |
% of GDP | | | 5.9 | % | | | 4.9 | % | | | 4.8 | % | | | 4.5 | % | | | 5.4 | % |
| | | | | |
Capital Expenditures | | | 1,293.5 | | | | 1,532.1 | | | | 1,979.1 | | | | 2,514.2 | | | | 3,241.7 | |
| | | | | |
Primary Balance | | | 781.6 | | | | 346.4 | | | | 23.5 | | | | (377.5 | ) | | | (545.7 | ) |
% of GDP | | | 3.4 | % | | | 1.4 | % | | | 0.1 | % | | | (1.2 | )% | | | (1.5 | )% |
Surplus or Deficit | | | 63.4 | | | | (357.2 | ) | | | (682.6 | ) | | | (1,107.7 | ) | | | (1,285.5 | ) |
% of GDP | | | 0.3 | % | | | (1.5 | )% | | | (2.5 | )% | | | (3.5 | )% | | | (3.5 | )% |
Sources: Ministry of Economy and Finance.
D-48
TABLE NO. 13
Consolidated Non-Financial Public Sector Operations
(in millions of dollars)(1)
| | | | | | | | | | | | | | | | | | | | |
| | | 2008 | | | 2009 | | | 2010 | | | 2011 | | | 2012(P) | |
Revenues: | | | | | | | | | | | | | | | | | | | | |
General Government | | | | | | | | | | | | | | | | | | | | |
Central Government | | $ | 3,986.3 | | | $ | 4,182.7 | | | $ | 4,632.8 | | | $ | 5,391.7 | | | $ | 6,343.7 | |
Caja de Seguro Social (“CSS”) | | | 1,330.2 | | | | 1,383.3 | | | | 1,637.1 | | | | 2,041.5 | | | | 2,168.5 | |
Consolidated agencies | | | 134.5 | | | | 171.9 | | | | 161.2 | | | | 147.3 | | | | 154.0 | |
| | | | | | | | | | | | | | | | | | | | |
Total | | $ | 5,451.0 | | | $ | 5,737.9 | | | $ | 6,431.1 | | | $ | 7,580.5 | | | $ | 8,666.2 | |
| | | | | |
Public Enterprises Operations Surplus | | | 275.6 | | | | 225.5 | | | | 197.5 | | | | 147.2 | | | | 176.5 | |
Nonconsolidated Agencies Surplus and Others | | | (7.1 | ) | | | 50.1 | | | | 64.5 | | | | (16.2 | ) | | | 185.6 | |
Education Tax Surplus(2) | | | (29.2 | ) | | | 15.6 | | | | — | | | | — | | | | — | |
Capital Revenues | | | 247.0 | | | | 65.4 | | | | 163.0 | | | | 32.1 | | | | 27.0 | |
Donations | | | 83.2 | | | | 30.1 | | | | 17.5 | | | | 18.1 | | | | 14.4 | |
| | | | | | | | | | | | | | | | | | | | |
Total | | $ | 6,020.4 | | | $ | 6,124.5 | | | $ | 6,873.6 | | | $ | 7,761.7 | | | $ | 9,069.6 | |
| | | | | |
Expenditures: | | | | | | | | | | | | | | | | | | | | |
General Government | | | | | | | | | | | | | | | | | | | | |
Central Government | | | 1,912.3 | | | | 2,047.7 | | | | 2,447.8 | | | | 2,883.0 | | | | 3,365.0 | |
CSS | | | 1,504.7 | | | | 1,672.3 | | | | 1,807.5 | | | | 1,946.4 | | | | 2,079.0 | |
Consolidated agencies | | | 161.0 | | | | 185.0 | | | | 175.6 | | | | 194.9 | | | | 220.1 | |
| | | | | | | | | | | | | | | | | | | | |
Total | | $ | 3,578.0 | | | $ | 3,905.0 | | | $ | 4,430.9 | | | $ | 5,024.3 | | | $ | 5,664.0 | |
| | | | | |
Capital Expenditures | | | 1,619.4 | | | | 1,758.0 | | | | 2,238.3 | | | | 2,698.6 | | | | 3,428.7 | |
| | | | | | | | | | | | | | | | | | | | |
Total | | $ | 5,197.4 | | | $ | 5,663.0 | | | $ | 6,669.2 | | | $ | 7,722.9 | | | $ | 9,092.8 | |
| | | | | | | | | | | | | | | | | | | | |
| | | | | |
Balance(2) | | | 823.0 | | | | 461.5 | | | | 204.4 | | | | 38.9 | | | | (23.1 | ) |
Debt Interest Paid | | | 725.2 | | | | 714.8 | | | | 716.1 | | | | 741.9 | | | | 742.2 | |
Overall Surplus (Deficit) | | $ | 97.8 | | | $ | (253.3 | ) | | $ | (511.7 | ) | | $ | (703.1 | ) | | $ | (765.3 | ) |
Percentage of GDP (nominal) | | | 0.4 | % | | | (1.0 | )% | | | (1.9 | )% | | | (2.2 | )% | | | (2.1 | )% |
| (1) | Figures exclude savings generated by Brady Bond repurchase operations, anticipated BNP dividends and the operational surplus of the Panama Canal Authority. |
| (2) | For the year 2010 and any subsequent year, this figure is included in the “Nonconsolidated Agencies Surplus” line item. |
| (3) | Excluding interest payments. |
Sources: Office of the Comptroller General, Ministry of Economy and Finance and other public institutions.
D-49
International Reserves
Because Panama uses the U.S. dollar as legal tender and prints no domestic paper currency, Panama does not have foreign currency reserves in the conventional sense. In Panama, unlike in other countries, foreign currency reserves are not necessary for providing the private sector economy foreign currency to pay for imports or for supporting exchange rates for a domestic currency. Panama’s foreign currency reserves are generally considered to consist of Banco Nacional de Panamá’s U.S. dollar-denominated foreign assets. As of December 31, 2012, BNP’s foreign assets increased to $2.1 billion (from $1.8 billion as of December 31, 2011), primarily due to increased liquidity and risk diversification. As of December 31, 2011, BNP’s foreign assets decreased to $1.8 billion (from $2.1 billion as of December 31, 2010), primarily due to management policies implemented that reduced foreign assets in order to invest them in the local economy. Neither BNP nor the Government currently has gold reserves.
The following table sets forth certain information regarding Panama’s international reserves at the dates indicated:
TABLE NO. 14
International Reserves
| | | | | | | | | | | | | | | | | | | | |
| | | 2008(R) | | | 2009(R) | | | 2010(R) | | | 2011 | | | 2012 | |
Foreign Exchange(1) | | | 2,404.7 | | | | 2,624.8 | | | | 2,154.3 | | | | 1,754.2 | | | | 2,118.3 | |
Reserve Position in IMF(SDR Million) | | | 11.9 | | | | 11.9 | | | | 11.9 | | | | 11.9 | | | | 11.9 | |
Total(2) | | $ | 2,416.6 | | | $ | 2,636.7 | | | $ | 2,169.2 | | | $ | 1,766.1 | | | $ | 2,130.2 | |
| (1) | Foreign assets of BNP in millions of dollars |
| (2) | In millions of dollars |
Source: IMF and BNP.
D-50
FINANCIAL SYSTEM
In 2008, the financial service sector represented 8.6% of GDP. In 2009, the financial service sector represented 8.5% of GDP and in 2010, the financial sector represented 8.4% of GDP. In 2011, the financial service sector represented 8.1% of GDP. In 2012, the financial service sector represented 8.1% of GDP.
On April 30, 2009, then President Torrijos issued Executive Decree No. 114 of 2009, published in the Gaceta Oficial Digital No. 26,272-A of April 30, 2009, creating the “Comisión de Alto Nivel para la Defensa de los Servicios Internacionales y Financieros.” This Commission was created as a permanent consultative group to advise the President in relation to the development and implementation of a national policy to maintain the competitiveness of the Republic’s national and international financial services. Through Executive Decree No. 206 dated July 15, 2009, President Martinelli designated the new members of the Commission from both the public and private sectors. On September 3, 2012, through Executive Decree No.573, Frank De Lima, current Minister of Economy and Finance, was appointed as President of the Commission.
The Banking Sector
The banking sector accounts for approximately 81.5% of the financial system’s contribution to GDP. The banking sector’s development has been advanced by the use of the U.S. dollar as the legal tender, the liberal banking law in effect from 1970 to 1998, the current Banking Law enacted in 1998, tax advantages and the large flows of trade fostered by the Panama Canal and CFZ. The most distinctive feature of the banking sector is its international orientation with numerous foreign banks playing an important role.
Banks in Panama are classified into four groups: (i) official banks, which are those owned by the Government and authorized to carry out banking business in the domestic market and abroad; (ii) general license banks, which can undertake domestic or international operations; (iii) international license banks, which do not undertake domestic operations but are authorized to direct, from their Panamanian offices, transactions that are negotiated, carried out or produce their results abroad; and (iv) foreign banks with representative offices, which may not book transactions in Panama. As of December 31, 2012, 2 official banks, 47 private sector general license banks, 29 international license banks and 14 representative offices constituted the banking sector. Of the 49 general license banks, 18 were incorporated in Panama and the rest abroad.
At December 31, 2012, measured by Panamanian assets, the largest bank based in Panama was HSBC Bank (Panama) S.A., with $10.8 billion in Panamanian assets at December 31, 2012. Banco General, S.A., with $10.1 billion in Panamanian assets at December 31, 2012, was the second largest bank based in Panama. Two of the other largest banks, based on Panamanian assets, are Banco Nacional de Panamá and Caja de Ahorros, both Government-owned. See “—Public Sector Banking Institutions—Banco Nacional de Panamá”. The largest international license banks, based on Panamanian assets, are Banco de Crédito del Perú, Bancolombia (Panama), S.A., and GTC Bank, Inc. On February 19, 2013, HSBC Bank (Panama) S.A. was sold to Bancolombia, S.A. for $2.1 billion.
D-51
The following table sets forth information regarding the largest banks in Panama based on their assets at December 31, 2012, in each of three categories:
TABLE NO. 15
Largest Banking Institutions
(assets in thousands of dollars)
| | |
| | | Panamanian Assets |
| |
| Official Banks | | 9,916,479.22 |
| |
| Banco Nacional de Panamá(1) | | 7,739,597.38 |
| |
| Caja de Ahorros | | 2,176,881.84 |
| |
| General License Banks(2) | | 63,634,842.55 |
| |
| HSBC Bank (Panama), S.A.(3) | | 10,752,712.16 |
| |
| Banco General, S.A. | | 10,090,923.23 |
| |
| Banco Latinoamericano de Exportaciones, S.A. | | 6,763,182.45 |
| |
| International License Banks | | 16,262,071.18 |
| |
| Banco de Crédito del Perú | | 4,599,888.62 |
| |
| Bancolombia (Panama), S.A | | 3,706,404.51 |
| |
| GTC Bank, Inc. | | 935,711.95 |
| |
| Banco Internacional de Perú, S.A.A. - Interbank | | 923,575.71 |
| (1) | Also considered a general license bank. |
| (2) | Other than BNP and Caja de Ahorros. |
| (3) | Assets of Primer Banco del Istmo, S.A. are included within HSBC Bank (Panama), S.A. |
Source: Superintendency of Banks.
Total assets of the banking sector were approximately 9.1% higher at year-end 2012 than at year-end 2011. Deposits were approximately 10.3% higher at year-end 2012 than at year-end 2011.
D-52
The table below sets forth information on the banking sector at December 31 for each of the years 2008 through 2012:
TABLE NO. 16
The Banking Sector
(in millions of dollars)
| | | | | | | | | | | | | | | | | | | | |
| | | December 31, | |
| | | 2008 | | | 2009 | | | 2010 | | | 2011 | | | 2012 | |
Assets: | | | | | | | | | | | | | | | | | | | | |
Liquid Assets: | | | | | | | | | | | | | | | | | | | | |
Deposits in local banks | | $ | 2,250 | | | $ | 2,219 | | | $ | 1,854 | | | $ | 2,458 | | | $ | 2,630 | |
Deposits in foreign banks | | | 8,238 | | | | 9,054 | | | | 8,603 | | | | 10,192 | | | | 12,192 | |
Other | | | 663 | | | | 675 | | | | 697 | | | | 1,055 | | | | 810 | |
| | | | | | | | | | | | | | | | | | | | |
Total Liquid Assets | | | 11,151 | | | | 11,948 | | | | 11,154 | | | | 13,704 | | | | 15,633 | |
| | | | | |
Loans | | | 30,243 | | | | 30,157 | | | | 33,795 | | | | 50,571 | | | | 56,026 | |
Investments in Securities | | | 9,254 | | | | 8,893 | | | | 10,009 | | | | 14,217 | | | | 14,765 | |
Other assets | | | 2,639 | | | | 2,554 | | | | 2,577 | | | | 3,086 | | | | 3,349 | |
| | | | | | | | | | | | | | | | | | | | |
Total Assets | | | 53,287 | | | | 53,552 | | | | 57,535 | | | | 81,578 | | | | 89,772 | |
Liabilities: | | | | | | | | | | | | | | | | | | | | |
Deposits: | | | | | | | | | | | | | | | | | | | | |
Internal: | | | | | | | | | | | | | | | | | | | | |
Official | | | 4,140 | | | | 4,338 | | | | 4,406 | | | | 4,892 | | | | 5,717 | |
Public | | | 19,583 | | | | 21,995 | | | | 24,322 | | | | 26,398 | | | | 29,328 | |
Banks | | | 2,469 | | | | 2,286 | | | | 1,866 | | | | 2,295 | | | | 2,497 | |
| | | | | | | | | | | | | | | | | | | | |
Total Internal Deposits | | | 26,192 | | | | 28,619 | | | | 30,594 | | | | 33,585 | | | | 37,542 | |
| | | | | |
External: | | | | | | | | | | | | | | | | | | | | |
Official | | | 15 | | | | 19 | | | | 60 | | | | 61 | | | | 44 | |
Public | | | 6,646 | | | | 9,326 | | | | 9,837 | | | | 17,555 | | | | 19,740 | |
Banks | | | 6,511 | | | | 3,920 | | | | 3,711 | | | | 6,746 | | | | 6,683 | |
| | | | | | | | | | | | | | | | | | | | |
Total External Deposits | | | 13,173 | | | | 13,265 | | | | 13,608 | | | | 24,362 | | | | 26,467 | |
Total Deposits | | | 39,364 | | | | 41,884 | | | | 44,202 | | | | 57,947 | | | | 64,009 | |
Obligations | | | 4,956 | | | | 3,700 | | | | 4,325 | | | | 11,932 | | | | 13,408 | |
Other Liabilities | | | 1,811 | | | | 1,683 | | | | 1,839 | | | | 2,568 | | | | 2,778 | |
| | | | | | | | | | | | | | | | | | | | |
Total Liabilities | | | 46,131 | | | | 47,267 | | | | 50,366 | | | | 72,477 | | | | 80,195 | |
Capital and Reserves | | | 7,155 | | | | 6,285 | | | | 7,169 | | | | 9,131 | | | | 9,577 | |
| | | | | | | | | | | | | | | | | | | | |
Total Liabilities and Capital | | $ | 53,287 | | | $ | 53,552 | | | $ | 57,535 | | | $ | 81,578 | | | $ | 89,772 | |
Source: Superintendency of Banks.
Banking Law
On February 26, 1998, the President of the Republic, upon authority granted by the Assembly, adopted Law No. 9 of February 26, 1998 (the “Banking Law”), a comprehensive revision and restatement of the 1970 banking law of Panama. The Banking Law became effective on June 13, 1998. Among the significant changes introduced by the Banking Law were the replacement of the National Banking Commission with the Superintendency of Banks, a more independent regulatory agency with greater supervisory powers, the establishment of new minimum capital requirements and the adoption of capital adequacy standards consistent with those contained in the Basle Accords.
The Banking Law established the Superintendency of Banks as an autonomous agency of the Government with its own assets and independent governance. The principal governing body of the Superintendency of Banks is a five-member board of directors (the “Board of Directors”). Members of the Board of Directors must meet certain minimum qualifications and are appointed by the President, without need for legislative ratification. Board members
D-53
are appointed to eight-year terms, with the possibility of an additional term, and may be removed only for cause. In order to provide for staggered terms, the initial terms of three of the members of the Board of Directors were for less than eight years. In addition to exercising administrative functions, the Board of Directors is responsible for approving regulations concerning the interpretation and implementation of banking laws and setting capital adequacy standards.
The Banking Law also established the office of the Superintendent of Banks, a full-time government official appointed by the President (again without legislative intervention) for a maximum of two five-year terms. As with the members of the Board of Directors, the Superintendent of Banks must meet certain minimum qualifications and may be removed only for cause. As chief administrative officer of the Superintendency of Banks, the Superintendent of Banks is charged with managing the day-to-day operations of the agency, granting banking licenses, authorizing new branches, ordering intervention and the liquidation of banks, performing banking inspections required by law or ordered by the Board of Directors, overseeing the activities of banks in the system, imposing sanctions and, in general, exercising all powers that are not reserved to the Board of Directors.
All banks operating in Panama, including BNP and other official banks, are supervised by the Superintendency of Banks. BNP and other official banks are also supervised by the Comptroller General.
Under the Banking Law, general license banks must have paid-in capital of not less than $10 million. Additionally, general license banks must maintain minimum capital of 8.0% of their total risk-weighted assets. Capital is defined to include primary capital and secondary capital. Primary capital (also known as tier one capital) is comprised of paid-in capital, declared reserves and retained earnings, and secondary capital (also known as tier two capital) includes undeclared reserves, revaluation reserves, general reserves for losses, certain hybrid instruments and certain subordinated indebtedness. Secondary capital may not exceed primary capital. The Superintendency of Banks is authorized to increase the minimum capital requirement percentage in accordance with generally accepted international capitalization standards.
General license banks are required to maintain 30.0% of their global deposits in liquid assets of the type prescribed by the Superintendency of Banks. In addition, general license banks are required to maintain local assets in Panama in an amount not less than 85.0% of their local deposits. The Superintendency of Banks may, in accordance with economic and financial conditions of the Republic, increase the required levels of local assets up to 100% of the local deposits.
Regulations regarding interest rate ceilings in the prior banking law were abolished by the Banking Law. Currently, each bank in Panama fixes the amount of interest that it charges on loans and other facilities. Banks are required to indicate the effective interest rates of loans and deposits in their statements to clients or at a client’s request. Under the Banking Law, deposits from central banks and other similar institutions are immune from attachment or seizure. Compared to the prior banking law, the Banking Law provides for lower lending limits to a single borrower and certain related parties. Under the new limits, no bank in Panama may make loans, assume obligations or otherwise extend credit or issue guarantees to any one person or group of related persons in excess of 25.0% of the bank’s total capital. A higher lending limit of 30.0% of total capital applies to banks whose shares are owned by governmental and private institutions whose principal office is located in Panama and whose main line of business is lending to other banks.
The Banking Law also provides for additional limitations and restrictions on a bank’s extending credit and issuing guarantees to parties related to such bank. Such related parties include the bank’s officers and directors and certain shareholders owning individually 5.0% or more of the capital stock of the bank.
Banks in Panama are subject to inspection by the Superintendency of Banks at least once every two years. Such supervisory powers of the Superintendency of Banks also extend to each bank’s subsidiaries and branches. Each bank is required to file monthly balance sheets and quarterly and annual statements indicating the performance of its credit facilities and other reports and information as prescribed by the Superintendency of Banks. In addition, each bank is required to make available for inspection its accounting records, minutes, reports on cash on hand, securities, receipts and any other reports or documents that are necessary for the Superintendency of Banks to ensure such bank’s compliance with Panamanian banking laws and regulations. Banks subject to supervision may be fined by the Superintendency of Banks for violations of the banking laws and regulations.
D-54
Under the Banking Law, the Superintendency of Banks may order the reorganization of a bank without having intervened it previously, when it considers this course of action to be in the best interests of the depositors and to guarantee the solvency and continuity of such bank. The Superintendency of Banks has broad powers under the Banking Law to reorganize banks and can require shareholders to pay in additional capital or to authorize the issuance of new shares and their sale to third parties, at prices determined by the Superintendency of Banks. Furthermore, the Superintendency of Banks may require a bank to restructure itself more fundamentally. For example, the Superintendency of Banks may require a bank to merge or consolidate with other banks, negotiate bridge loans, sell or partially liquidate assets and grant security interests in connection with such reorganization. Ultimately, if the reorganization efforts fail, the Superintendency of Banks is empowered to begin the liquidation process.
The Banking Law established an annual supervisory charge to be paid by general license banks equal to $30,000 plus $35.00 per each $1.0 million in assets, up to a maximum charge of $100,000.
In 2008, the Banking Law was reformed by Law Decree No. 2 of February 22, 2008, becoming effective on August 25, 2008 (“Bank Law Reform”). The Bank Law Reform was aimed at targeting the new challenges and competition faced by the Panamanian banking system, with particular emphasis on the international market. Some of the principal amendments include the following:
| | • | | extending the regulatory authority of the Superintendency of Banks to cover corporations that, together with banks, form a bank group which includes holding companies of banks. This authority also extends to non-banking corporations affiliated with a bank group; |
| | • | | granting the Superintendency of Banks legal authority to take into consideration other types of risks, such as market risk, operational risk and country risk, in determining the valuation of capital requirements; |
| | • | | modifying the procedures to deal with cases of banks with problems or financial distress to make them more expeditious and enhancing the ability of depositors to recover their savings; |
| | • | | expanding the sanctioning authority of the Superintendency of Banks to regulate in the following areas: (i) non-compliance with provisions of preventing money laundering, funding of terrorism and related crimes; (ii) legal requirements on capital; (iii) banking liquidity; (iv) submission of documents and reports to the Superintendency of Banks; and (v) prohibitions and limitations imposed by the Banking Reform Law on banks and banking groups, including obligations of confidentiality. |
Public Sector Banking Institutions
Banco Nacional de Panamá
BNP, created in 1904, functions as a governmental bank. The General Manager of the bank is appointed by the Executive Branch of the Republic. BNP is responsible for supplying banks operating in Panama with U.S. dollars and has authority to issue and distribute coins in Panama. BNP is the Government’s banker and financial agent and acts as a clearinghouse for checks and other instruments for all other Panamanian banks. Also, BNP offers a wide range of commercial banking services through its 72 branches throughout Panama. In accordance with the law that governs BNP, the Government is responsible for the liabilities of BNP.
Given Panama’s U.S. dollar-based economy, BNP does not make monetary policy or print paper currency and is not a lender of last resort for Panama. BNP has no direct regulatory authority over Panamanian banks, and under the Banking Law BNP has no representation in the Superintendency of Banks. BNP does not use rediscount or loan mechanisms with other commercial banks. There are no restrictions on its activities other than those imposed on commercial banks in Panama. BNP, as other commercial banks, has the ability to make direct loans to the Government as well as to purchase notes issued by Panama. BNP has certain competitive advantages as compared to the rest of the Panamanian banking system in that it enjoys a monopoly on public sector deposits. The Banking Law, however, subjects BNP to regulation by the Superintendency of Banks.
D-55
BNP is the largest banking institution in Panama in terms of domestic credit, local deposits and savings deposits. Total assets of BNP, as of July 31, 2013, were $8.1 billion, bank deposits were $7.2 billion and loans were $3.2 billion, of which $491.0 million were made to the public sector and $2.7 billion were made to the private sector. Total assets of BNP, as of December 31, 2012, were $7.7 billion, bank deposits were $6.6 billion and loans were $2.9 billion, of which $474 million were made to the public sector and $2.5 billion were made to the private sector. See “Public Sector Debt—Internal Debt”.
As of December 31, 2012, BNP’s capital and reserves represent 25.9% of its bank deposits and 8.3% of its total assets. BNP generated gross income of $159.8 million in 2012 and $157.8 million in 2011, compared to $213.2 million in 2010, $161.1 million in 2009, and $181.0 million in 2008. BNP’s net income was $140.1 million in 2012 and $107.1 million in 2011, $102.6 million in 2010, $81.1 million in 2009 and $114.7 million in 2008. This increase in net and gross income is primarily attributable to lower interest costs and increased interest earnings.
As of December 31, 2012, the Republic had paid $745.8 million to the Central Government towards the Republic’s credit agreement with BNP, leaving an outstanding balance of $397.8 million.
D-56
The following table sets forth BNP’s balance sheet at December 31 for the years 2008 through 2012:
TABLE NO. 17
Banco Nacional de Panamá
Balance Sheet
(in millions of dollars)
| | | | | | | | | | | | | | | | | | | | |
| | | December 31, | |
| | 2008 | | | 2009 | | | 2010 | | | 2011 | | | 2012 | |
Assets: | | | | | | | | | | | | | | | | | | | | |
Cash and checks | | $ | 224.0 | | | $ | 225.6 | | | $ | 208.8 | | | $ | 358.9 | | | | 229.3 | |
Bank deposits | | | 2,396.2 | | | | 2,709.0 | | | | 2,221.9 | | | | 2,015.9 | | | | 2,487.3 | |
| | | | | | | | | | | | | | | | | | | | |
Total | | | 2,620.2 | | | | 2,934.6 | | | | 2,430.7 | | | | 2,374.8 | | | | 2,716.6 | |
Loans: | | | | | | | | | | | | | | | | | | | | |
Domestic loans: | | | | | | | | | | | | | | | | | | | | |
Public sector | | | 589.8 | | | | 300.4 | | | | 265.8 | | | | 421.2 | | | | 473.9 | |
Private sector | | | 1,602.1 | | | | 1,743.5 | | | | 2,068.5 | | | | 2,295.8 | | | | 2,516.9 | |
Foreign loans | | | 0.0 | | | | 0.0 | | | | 0.0 | | | | 0.0 | | | | 0.0 | |
Less provisions | | | (98.6 | ) | | | (79.4 | ) | | | (64.3 | ) | | | (54.5 | ) | | | (58.0 | ) |
| | | | | | | | | | | | | | | | | | | | |
Total (net) | | | 2,093.4 | | | | 1,964.4 | | | | 2,270.0 | | | | 2,662.5 | | | | 2,932.8 | |
| | | 700.0 | | | | 1,024.1 | | | | 1,209.7 | | | | 1,541.2 | | | | 1,829.9 | |
Net Fixed Assets | | | 51.2 | | | | 60.7 | | | | 72.2 | | | | 82.8 | | | | 95.6 | |
Other Assets | | | 118.3 | | | | 170.5 | | | | 153.0 | | | | 284.0 | | | | 143.7 | |
| | | | | | | | | | | | | | | | | | | | |
Total | | | 5,583.1 | | | | 6,154.4 | | | | 6,135.7 | | | | 6,945.3 | | | | 7,718.6 | |
Liabilities: | | | | | | | | | | | | | | | | | | | | |
Deposits | | | 4,901.1 | | | | 5,454.2 | | | | 5,308.7 | | | | 5,937.7 | | | | 6,687.4 | |
Obligations with Financial Institutions and International Organizations | | | 9.9 | | | | 2.8 | | | | 0.4 | | | | 0.1 | | | | 0.2 | |
Other Liabilities | | | 165.8 | | | | 175.9 | | | | 293.5 | | | | 381.8 | | | | 386.2 | |
| | | | | | | | | | | | | | | | | | | | |
Total | | | 5,074.8 | | | | 5,632.9 | | | | 5,602.6 | | | | 6,319.6 | | | | 7,073.8 | |
Capital and Reserves | | | 508.3 | | | | 521.5 | | | | 533.1 | | | | 625.7 | | | | 644.8 | |
| | | | | | | | | | | | | | | | | | | | |
Total Liabilities and Capital | | $ | 5,583.1 | | | $ | 6,154.4 | | | $ | 6,135.7 | | | $ | 6,945.3 | | | | 7,718.6 | |
Source: BNP.
D-57
Caja de Ahorros, the state-owned savings bank, has 49 branches as well as 105 automated teller machines throughout Panama. Caja de Ahorros is primarily a mortgage lender specializing in financing medium-income customers. Due to its liquidity position in recent years, however, Caja de Ahorros has begun to promote personal loans. Total assets of Caja de Ahorros as of December 31, 2012, were $2.1 billion (a 13% increase from 2011) and total deposits were $1.8 billion (a 14.85% increase from 2011). Total net loans held by Caja de Ahorros, as of December 31, 2012, were $1.4 billion (a 10% increase from 2011). Caja de Ahorros had net income of $27.8 million in 2012, compared to net income of $23.5 million in 2011, primarily due to an increase in its loan portfolio, implementation of innovative process and human capital development.
Other Public Sector Institutions. The Panamanian public sector includes two other significant institutions that are not part of the banking sector. They are the agricultural development bank, Banco de Desarrollo Agropecuario (“BDA”), and the national mortgage bank, Banco Hipotecario Nacional (“BHN”). Panama created BDA to provide a source of financing for agricultural development. BDA’s activities have mainly focused on providing financing to medium and small producers. Historically, BDA has experienced significant losses. An external audit was completed in May 2001 to identify ways to improve BDA’s operational efficiency. After evaluating BDA’s loan portfolio, the external audit estimated a possible loss due to unrecoverable loans of up to $9.0 million in principal and $15.4 million in net interest. Under the LUIT, one-half of a surcharge on consumer and commercial loans (which previously was used exclusively to subsidize certain BDA and commercial bank agricultural loans) has been allocated to bolster BDA’s capital. Additionally, the LUIT tightened eligibility for BDA’s subsidized loans. As of December 31, 2012, preliminary figures indicate that BDA had $115.8 million in loans on its books. As of December 31, 2012, the total assets of BDA had reached $358.6 million. BDA had net income of $13.6 million in 2012.
Panama created BHN in 1973 to provide a source of financing for national housing projects and foster the development of savings associations. As of December 31, 2012, BHN’s loan portfolio was $133.0 million and its total assets amounted to $234.0 million. BHN had a net loss of $106.2 million in 2012.
Other Financial System Components
Stock Exchange. In 1990, a private stock exchange, Bolsa de Valores de Panamá (“La Bolsa”), was created. While it has had considerable growth, with aggregate trades increasing from $30.6 million in 1991 to $6.6 billion in 2012, La Bolsa remains a small portion of the financial services sector. Equity trades represented 1.7% of 2012 trading volume.
Interest Rates. In December 2012, the average interest rate paid by Panamanian banks for one-year deposits was 2.76%, while the interest rate for personal credit transactions with a maturity of one to five years averaged 9.25% at the end of the month. In general terms, the differential between borrowing and lending interest rates for Panamanian banks was 6.36% at December 31, 2012.
Insurance. In 1984, Panama adopted legislation intended to foster offshore insurance activity. In July 1996, the Assembly passed a law establishing a new insurance regulatory structure. As of December 31, 2012, there were 31 insurance companies and 5,447 insurance brokerages. The 5,447 insurance brokerages consisted of 4,581 individual brokers and 866 brokerage companies. The total registered assets of the insurance companies, as of December 31, 2012, equaled $1.9 billion.
Due to the economic growth that occurred in 2007, the insurance sector grew by approximately 22.3% as compared to 2006. During this time, many local and international insurance companies applied to conduct business in Panama. Additionally, on December 27, 2006, Executive Decree No. 640 mandated that, beginning on January 1, 2007, any vehicle owner must have auto insurance, which also contributed to the increase in the insurance sector.
In 2008, the insurance sector grew by 27.5% as compared to 2007 primarily due to the economic development that the country experienced. In 2009, the insurance sector grew by 9.5% as compared to 2008 primarily due to a 37.8% increase in individual life insurance policies and a 14.2% increase in health insurance policies. In 2010, the insurance sector grew by 8.1% as compared to 2009. In 2011, the insurance sector grew by 20.1% as compared to 2010 primarily due to an increase in premiums paid by policyholders. In 2012, the insurance sector grew by 20.3% as compared to 2011 primarily due to an increase in premiums paid by policyholders.
D-58
Financial Services. A small nondeposit-taking financial services industry exists that provides leasing, consumer durables financing and other small-scale lending. In 2011, there were 160 locally incorporated companies participating in this industry. In 2011, total assets equaled approximately $844 million. In 2012, total assets equaled approximately $1.04 billion. As of July 31, 2013, there were approximately 155 companies participating in this industry.
D-59
FOREIGN TRADE AND BALANCE OF PAYMENTS
General
Foreign trade plays a significant role in Panama’s economy because of the internationally-oriented service sector, the limited scope of domestic manufacturing capability and the limited scope of agricultural production. These factors have made it necessary to import significant amounts of manufactured goods, raw materials and other merchandise. Notwithstanding a history of significant tariff and non-tariff barriers, imports cover a wide range of raw materials and manufactured goods used throughout the economy.
In 2012 Panama’s net exports of goods and services increased to $821.8 million, or by approximately 4.7%, as compared to 2011. In 2012, Panama’s imports of goods and services increased to $11,509.3 million, or by approximately 11.4%, as compared to 2011.
During 2012, bananas fell from 2011, as a percentage of Panama’s non-petroleum, non-CFZ merchandise exports (8.6% in 2008, 7.5% in 2009, 7.9% in 2010, 11.0% in 2011, 10.5% in 2012).
In 2012, exports of frozen yellow fish tuna and fresh and frozen fish filets totaled $33.3 million, reflecting a 28.7% decrease from $46.7 million in 2011. In 2008, 2009, 2010, 2011 and 2012 yellow fin tuna, together with fresh and frozen fish filets, constituted 19.2%, 24.9%, 30.9%, 17.4%, 6.5%, and 4.1% respectively, of Panama’s non-petroleum, non-CFZ merchandise exports.
In 2008, shrimp exports decreased by 28.7% to $40.8 million and represented 3.6% of total non-petroleum, non-CFZ merchandise exports. In 2009, shrimp exports increased by 7.8% to $43.9 million and represented 5.4% of total non-petroleum, non-CFZ merchandise exports. In 2010, shrimp exports decreased by 19.4% to $35.4 million and represented 4.9% of total non-petroleum, non-CFZ merchandise exports. In 2011, shrimp exports increased by 6.5% to $37.7 million and represented 4.8% of total non-petroleum, non-CFZ merchandise exports. In 2012, shrimp exports increased by 7.4% to $40.5 million and represented 4.92% of total non-petroleum, non-CFZ merchandise exports.
In 2008, petroleum exports were $7.2 million, and in 2009, petroleum exports were $7.0 million. In 2010, petroleum exports were $2.0 million, and in 2011, petroleum exports were $0.772 million. In 2012, petroleum exports were $0.618.7 million.
Because of the use of the U.S. dollar as legal tender and the absence of a Balboa exchange market, Panamanian private sector imports and exports do not affect the Government’s foreign currency reserves. Thus, the balance of payments is less significant than fiscal policy in assessing the external debt service capacity of the Republic.
Tariffs and Other Trade Restrictions
In the 1990s, the Government enacted a number of trade reforms in preparation for WTO accession. Panama became a member of the WTO on September 6, 1997. In November 1997, the Government passed Cabinet Decree No. 68 of 1997, which reduced import duties for most products to levels significantly below those agreed to under the WTO accession process and in certain cases eliminated the duties all together.
One of the major changes in Panamanian tariffs since 1990 has been the movement away from specific tariffs and mixed specific and ad valorem tariffs, to a solely ad valorem system. Panama’s accession to the WTO required Panama to streamline its customs valuation system to conform to international standards. Additionally, Panama changed its international trade classification system from the Customs Cooperation Council Nomenclature and Brussels Tariff Nomenclature to the Harmonized Tariff System, which became effective for the year 1998.
The LUIT also included several tariff reduction measures. A 3.0% tariff, which had been available to only a limited number of industrial concerns for certain inputs and capital goods, was made available to all enterprises. Similarly, a tax rebate equivalent to 95.0% of the amount of import taxes paid on imported goods used for exports, which had been available only to exporters of industrial goods, was made available to all exporters.
D-60
The Cabinet, by Decree No. 11 dated April 7, 2004, approved the elimination of import tariffs on certain raw and intermediate materials, such as linseed, corrugated steel bars and support rods for concrete, although the national 7.0% value-added tax on goods and services will continue to be assessed on such products at their time of entry into Panama. On June 26, 2004, the Customs Cooperation Council introduced an amendment to the national tariff system in response to technological advances and changes in trade at the international level. This amendment went into effect in 2007, and facilitated a uniform application of the nomenclature of the Harmonized Tariff System.
During 2009 and 2010, the Government enacted a number of reforms to its tariff system in order to stimulate domestic economic development. In 2009, the Republic imposed import tariffs on certain basic materials and raw materials not produced within Panama and modified the tariffs on a variety of imported household goods. Under Cabinet Decree No. 11 of 2010, published in the Gaceta Oficial Digital No. 26,502 of March 31, 2010, the Republic established an import tariff of 10% for certain commonly-used products. In March 2010, Law 8 of 2010 was ratified, modifying the Panamanian Fiscal Code by adopting fiscal measures and creating the Administrative Tax Tribunal. In addition to a number of tax reforms, this Law increased the value-added tax, known as ITBMS, from 5.0% to 7.0%. Under Cabinet Decree No. 18, dated June 15, 2010, an import tariff for used cars was established, and under Cabinet Decree No. 19, dated June 25, 2010, the Republic increased import tariffs on certain agricultural products in order to promote agricultural activity. Pursuant to Law 8 of 2010, beginning on January 1, 2012, companies in the categories of electric distribution, reinsurance, financial activities as described in Law 42 of 2001, cement production, gambling, mining and banks will pay income tax at the rate of 27.5%, down from the previous rate of 30%. This rate will decrease to 25% by January 1, 2014. Companies that fall under these categories and have a gross income of $1.5 million or more will pay the scheduled income tax or, in the alternative, will pay 4.64% of their gross income towards income tax, whichever is higher. Companies that are owned 40% or more by the Republic will pay 30% of their gross income towards income tax.
Composition of Foreign Trade
The United States has historically been Panama’s most important trading partner. In 2012, trade with the United States was at 19.6% and 23.6% of total goods exported and imported, respectively. In 2011, trade with the United States was at 36.2% and 25.7% of total goods exported and imported, respectively. In 2010, trade with the United States was at 29.1% and 27.5% of total goods exported and imported, respectively. Historically, Panama’s other significant trading partners have included Costa Rica for exports and Japan, Brazil and Venezuela for imports.
For the year ended December 31, 2012, Panama’s largest trading partners for exports were the United States, Canada and Costa Rica, with exports amounting to $161.0 million, $119.8 million and $54.3 million, respectively. For the year ended December 31, 2012, Panama’s largest trading partners for imports were the United States, China and Costa Rica, with imports amounting to $2,976.8 million, $809.8 million and $576.2 million, respectively.
The share of imports from Central American countries other than Costa Rica was 3.1% of total imports in 2012. Additionally, approximately 55.5% of Panama’s 2012 imports came from the CFZ.
D-61
The following tables set forth the composition and geographical distribution of Panama’s imports and exports for the years indicated:
TABLE NO. 18
Composition of Merchandise Exports, F.O.B.(1)
(in millions of dollars)
| | | | | | | | | | | | | | | | | | | | |
| | | 2008(R) | | | 2009(R) | | | 2010(R) | | | 2011(R) | | | 2012(P) | |
Petroleum(2) | | $ | 7.2 | | | $ | 7.0 | | | $ | 2.0 | | | $ | 0.8 | | | $ | 0.6 | |
Non-petroleum Merchandise Exports: | | | | | | | | | | | | | | | | | | | | |
Bananas | | | 98.7 | | | | 62.1 | | | | 65.2 | | | | 86.3 | | | | 85.9 | |
Muskmelon | | | 117.2 | | | | 36.9 | | | | 13.3 | | | | 5.6 | | | | 5.9 | |
Watermelon | | | 96.8 | | | | 45.0 | | | | 37.1 | | | | 16.6 | | | | 15.8 | |
Sugar | | | 15.1 | | | | 13.3 | | | | 19.2 | | | | 37.2 | | | | 34.5 | |
Shrimp | | | 40.8 | | | | 43.9 | | | | 35.4 | | | | 37.7 | | | | 40.5 | |
Coffee | | | 16.0 | | | | 9.6 | | | | 13.7 | | | | 9.4 | | | | 9.4 | |
Fishmeal(3) | | | 15.9 | | | | 16.6 | | | | 10.2 | | | | 14.4 | | | | 19.8 | |
Frozen yellow fin tuna, fresh and frozen fish filet | | | 283.3 | | | | 247.9 | | | | 118.5 | | | | 46.7 | | | | 33.3 | |
Other seafood | | | 0.2 | | | | 0.0 | | | | 0.0 | | | | 0.0 | | | | 1.6 | |
Clothing | | | 10.6 | | | | 7.8 | | | | 9.1 | | | | 12.2 | | | | 10.1 | |
Meat from cattle | | | 14.5 | | | | 14.0 | | | | 14.5 | | | | 18.2 | | | | 24.7 | |
Standing cattle | | | 0.3 | | | | 0.2 | | | | 0.0 | | | | 0.3 | | | | 3.1 | |
Leather and similar products | | | 5.5 | | | | 4.1 | | | | 8.8 | | | | 14.2 | | | | 17.9 | |
Other | | | 421.9 | | | | 313.3 | | | | 380.6 | | | | 485.3 | | | | 518.8 | |
| | | | | | | | | | | | | | | | | | | | |
Total | | | 1,144.0 | | | | 821.7 | | | | 727.6 | | | | 784.9 | | | | 821.9 | |
Re-exports other than CFZ | | | 95.6 | | | | 114.4 | | | | 101.4 | | | | 135.7 | (4) | | | 155.6 | (5) |
Total | | $ | 1,239.6 | | | $ | 936.1 | | | $ | 829.0 | | | $ | 920.6 | | | $ | 977.5 | |
| | | | | | | | | | | | | | | | | | | | |
| (2) | Petroleum exports primarily consist of maritime and aviation fuel sales. |
Source: Office of the Comptroller General and Ministry of Economy and Finance.
D-62
TABLE NO. 19
Composition of Merchandise Imports, C.I.F.
(in millions of dollars)
| | | | | | | | | | | | | | | | | | | | |
| | | 2008(R) | | | 2009(R) | | | 2010(R) | | | 2011(R) | | | 2012(P) | |
Consumer Goods | | $ | 4,078.0 | | | $ | 3,639.6 | | | $ | 4,338.4 | | | $ | 5,385.0 | | | $ | 6,061.2 | |
Non-durable | | | 1,000.9 | | | | 1,065.7 | | | | 1,191.6 | | | | 1,403.5 | | | | 1,561.3 | |
Semi-durable | | | 626.9 | | | | 727.6 | | | | 857.9 | | | | 1,006.5 | | | | 1,183.6 | |
Domestic utensils | | | 584.8 | | | | 574.8 | | | | 589.6 | | | | 549.4 | | | | 544.6 | |
Fuels and lubricants | | | 1,865.4 | | | | 1,271.4 | | | | 1,699.4 | | | | 2,425.6 | | | | 2,771.7 | |
Intermediate Goods | | | 2,626.6 | | | | 2,211.0 | | | | 2,509.1 | | | | 2,913.8 | | | | 3,167.0 | |
Agricultural raw materials | | | 196.7 | | | | 161.2 | | | | 181.9 | | | | 210.9 | | | | 222.2 | |
Industrial raw materials | | | 1,371.6 | | | | 1,184.7 | | | | 1,371.7 | | | | 1,571.1 | | | | 1,663.2 | |
Construction materials | | | 982.5 | | | | 786.5 | | | | 860.2 | | | | 1,005.7 | | | | 1,164.7 | |
Other intermediate goods | | | 75.8 | | | | 78.5 | | | | 95.4 | | | | 126.1 | | | | 116.9 | |
Capital Goods | | | 2,305.3 | | | | 1,938.3 | | | | 2,288.9 | | | | 3,040.9 | | | | 3,404.9 | |
Agricultural | | | 47.0 | | | | 39.9 | | | | 53.3 | | | | 61.5 | | | | 71.8 | |
Industrial, construction and electricity | | | 808.2 | | | | 627.6 | | | | 767.9 | | | | 1,024.5 | | | | 1,216.6 | |
Transportation equipment and telecommunication | | | 756.0 | | | | 628.4 | | | | 744.9 | | | | 1,087.2 | | | | 1,102.0 | |
Other capital goods | | | 694.2 | | | | 642.4 | | | | 722.9 | | | | 867.6 | | | | 1,014.7 | |
Total | | $ | 9,009.9 | | | $ | 7,788.8 | | | $ | 9,136.5 | | | $ | 11,339.7 | | | | 12,633.2 | |
Source: Office of the Comptroller General.
D-63
TABLE NO. 20
Direction of Merchandise Trade
(as percentage of total)(1)
| | | | | | | | | | | | | | | | | | | | |
| | | 2008 | | | 2009 | | | 2010 | | | 2011 | | | 2012(P) | |
Exports (F.O.B.): | | | | | | | | | | | | | | | | | | | | |
Western Hemisphere: | | | | | | | | | | | | | | | | | | | | |
United States and Canada | | | 38.3 | % | | | 43.7 | % | | | 39.5 | % | | | 36.2 | % | | | 34.2 | % |
Mexico | | | 0.8 | | | | 1.0 | | | | 0.7 | | | | 0.5 | | | | 0.61 | |
Central America and the Caribbean: | | | | | | | | | | | | | | | | | | | | |
Costa Rica | | | 5.8 | | | | 7.4 | | | | 6.8 | | | | 6.7 | | | | 6.6 | |
Guatemala | | | 0.7 | | | | 0.7 | | | | 0.9 | | | | 0.8 | | | | 0.8 | |
Colón Free Zone | | | 1.7 | | | | 2.2 | | | | 2.7 | | | | 3.7 | | | | 3.6 | |
Other | | | 7.4 | | | | 8.0 | | | | 9.0 | | | | 8.2 | | | | 7.9 | |
Total | | | 15.6 | | | | 18.3 | | | | 19.4 | | | | 19.4 | | | | 18.9 | |
South America: | | | | | | | | | | | | | | | | | | | | |
Venezuela | | | 0.2 | | | | 0.3 | | | | 0.1 | | | | 0.2 | | | | 0.6 | |
Colombia | | | 1.1 | | | | 1.9 | | | | 1.3 | | | | 1.2 | | | | 1.0 | |
Brazil | | | 0.3 | | | | 0.2 | | | | 0.1 | | | | 0.1 | | | | 0.01 | |
Other | | | 1.5 | | | | 1.3 | | | | 2.5 | | | | 2.7 | | | | 3.5 | |
Total | | | 3.1 | | | | 3.7 | | | | 3.9 | | | | 4.2 | | | | 5.1 | |
TOTAL | | | 57.8 | | | | 66.7 | | | | 63.6 | | | | 60.3 | | | | 58.8 | |
Europe: | | | | | | | | | | | | | | | | | | | | |
Germany | | | 0.4 | | | | 0.4 | | | | 0.6 | | | | 1.6 | | | | 1.1 | |
Spain | | | 5.0 | | | | 6.2 | | | | 2.7 | | | | 2.1 | | | | 2.0 | |
Italy | | | 2.6 | | | | 2.1 | | | | 2.0 | | | | 1.6 | | | | 4.0 | |
Netherlands | | | 10.7 | | | | 6.6 | | | | 6.9 | | | | 4.4 | | | | 5.9 | |
United Kingdom | | | 5.4 | | | | 1.5 | | | | 1.2 | | | | 1.3 | | | | 2.1 | |
Other | | | 7.5 | | | | 7.9 | | | | 6.6 | | | | 11.0 | | | | 6.9 | |
Total | | | 31.6 | | | | 24.7 | | | | 22.0 | | | | 22.0 | | | | 22.0 | |
Other Countries | | | 10.9 | | | | 8.7 | | | | 14.3 | | | | 18.5 | | | | 19.3 | |
TOTAL | | | 100.0 | % | | | 100.0 | % | | | 100.0 | % | | | 100.0 | % | | | 100.0 | % |
| | | | | |
Imports (C.I.F.): | | | | | | | | | | | | | | | | | | | | |
Western Hemisphere: | | | | | | | | | | | | | | | | | | | | |
United States and Canada | | | 30.6 | % | | | 29.7 | % | | | 28.3 | % | | | 25.7 | % | | | 24.1 | % |
Mexico | | | 3.5 | | | | 4.6 | | | | 4.3 | | | | 3.9 | | | | 4.4 | |
Central America and the Caribbean: | | | | | | | | | | | | | | | | | | | | |
Costa Rica | | | 5.1 | | | | 5.2 | | | | 4.9 | | | | 4.5 | | | | 4.6 | |
Guatemala | | | 1.6 | | | | 2.1 | | | | 1.9 | | | | 1.7 | | | | 1.7 | |
Colón Free Zone | | | 9.1 | | | | 11.8 | | | | 11.3 | | | | 10.4 | | | | 10.8 | |
Other | | | 19.4 | | | | 17.2 | | | | 18.3 | | | | 22.2 | | | | 22.2 | |
Total | | | 35.2 | | | | 36.3 | | | | 36.4 | | | | 38.8 | | | | 43.7 | |
South America: | | | | | | | | | | | | | | | | | | | | |
Venezuela | | | 0.5 | | | | 0.4 | | | | 0.2 | | | | 0.2 | | | | 0.3 | |
Colombia | | | 2.7 | | | | 3.3 | | | | 3.3 | | | | 4.1 | | | | 3.4 | |
Brazil | | | 1.6 | | | | 1.9 | | | | 2.7 | | | | 1.9 | | | | 1.4 | |
Other | | | 3.3 | | | | 2.9 | | | | 2.4 | | | | 2.7 | | | | 3.0 | |
Total | | | 8.1 | | | | 8.5 | | | | 8.6 | | | | 8.9 | | | | 8.1 | |
TOTAL | | | 77.4 | | | | 79.0 | | | | 77.6 | | | | 77.3 | | | | 75.9 | |
Europe: | | | | | | | | | | | | | | | | | | | | |
Germany | | | 1.4 | | | | 1.3 | | | | 1.5 | | | | 1.5 | | | | 1.4 | |
Spain | | | 1.6 | | | | 1.5 | | | | 1.8 | | | | 2.6 | | | | 2.5 | |
Italy | | | 0.7 | | | | 0.7 | | | | 0.5 | | | | 0.8 | | | | 0.8 | |
Netherlands | | | 0.4 | | | | 0.5 | | | | 0.5 | | | | 0.5 | | | | 1.2 | |
United Kingdom | | | 0.3 | | | | 0.4 | | | | 0.3 | | | | 0.3 | | | | 0.4 | |
D-64
| | | | | | | | | | | | | | | | | | | | |
Other | | | 2.5 | | | | 2.6 | | | | 2.4 | | | | 2.1 | | | | 2.3 | |
Total | | | 6.9 | | | | 7.0 | | | | 7.0 | | | | 7.8 | | | | 8.6 | |
Japan | | | 4.3 | | | | 3.6 | | | | 3.2 | | | | 2.6 | | | | 2.3 | |
China | | | 5.0 | | | | 4.2 | | | | 5.4 | | | | 6.1 | | | | 6.4 | |
Other Countries | | | 6.4 | | | | 6.2 | | | | 6.8 | | | | 6.2 | | | | 6.8 | |
TOTAL | | | 100.0 | % | | | 100.0 | % | | | 100.0 | % | | | 100.0 | % | | | 100.0 | % |
| (1) | Includes exports and imports between the CFZ and Panama. |
Source: Office of the Comptroller General.
D-65
Balance of Payments
The unique Panamanian monetary system and unusual features of the economy cause the balance of payments to be a less important indicator than fiscal policy for purposes of assessing the Government’s debt service capacity. In the absence of a national printed currency and a Balboa exchange market, balance of payments surpluses or deficits have less effect than fiscal policy on the accumulation or drawdown of Government foreign exchange reserves. Panamanian exporters retain the foreign exchange earned from their overseas sales, and Panamanian importers utilize their domestic U.S. dollar-denominated revenues to pay for foreign shipments. In addition, given the absence of a national printed currency and the limited role of BNP in the economy, it is often difficult to register capital movements in an orderly manner. Thus, errors and omissions in the balance of payments figures have tended to be significant.
In 1997, Panama implemented the V Version of the Balance of Payments Manual prepared by the IMF (“V Version”), a different methodology from that previously used, to calculate Panama’s balance of payments. Accordingly, all calculations for the current account balance and the capital and financial account balance herein are calculated under the V Version.
For 2008 the current account balance was a $2,677.1 million deficit. For 2009, the current account balance was a deficit of $179.0 million. For 2010, the current account balance was a $2,764.6 million deficit. For 2011, the current account balance was a $3,825.6 million deficit. For 2012, the current account balance was a $3,267.0 million deficit. For 2008, the capital and financial account balance was a $2,966.1 million surplus and for 2009, a $331.8 million surplus. For 2010, the capital and financial account balance was a $3,053.1 million surplus. For 2011, the capital and financial account balance was a $4,026.2 million surplus. For 2012, the capital and financial account balance was a $3,681.5 million surplus.
In reviewing Panamanian balance of payments statistics for merchandise imports and exports, it is also important to consider the effect of the CFZ and the significant amount of merchandise passing through it. Panama had $11.7 billion in non-CFZ merchandise imports in 2012 an increase of 11.8% from 2011), while imports to the CFZ for the same period were $14.6 billion. Similarly, Panama had $1,201.7 million in non-CFZ merchandise exports in 2012 (13.1% more than in 2011), while CFZ re-exports for the same period were $16.1 billion.
Excluding the CFZ, Panama has historically suffered large merchandise trade deficits. The deficit, excluding the CFZ, was $4.3 billion (16.5% of real GDP) in 2012, an increase of 16.1% from 2011. However, these deficits have been significantly offset by the economic value added by the CFZ. In 2012, the merchandise trade deficit including the CFZ was $5.7 billion (22.3% of real GDP), a decrease of 4.4% from 2011. Other segments within the service sector of the Panamanian economy, including ports and the Panama Canal, also help offset the merchandise trade deficit. In 2012, the service sector had a net balance of payments surplus of $5.0 billion (a 30.4% increase from 2011). In 2011, the service sector had a net balance of payments surplus of $3.8 billion (a 14.5 % increase from 2010). The Republic registered an overall surplus in 2008 and 2009 of $584.8 million and $605.7 million, respectively. In 2010, the Republic registered an overall deficit of $288.5 million. In 2011, the Republic registered an overall deficit of $200.6 million. In 2012, the Republic registered a current account deficit of $414.5 million.
D-66
The following table sets forth Panama’s balance of payments for the years 2008 through 2012:
TABLE NO. 21
Balance of Payments(1)
(in millions of dollars)
| | | | | | | | | | | | | | | | | | | | |
| | | 2008 | | | 2009 | | | 2010(R) | | | 2011(P) | | | 2012(P) | |
Current Account: | | | | | | | | | | | | | | | | | | | | |
Merchandise Trade(2) | | | | | | | | | | | | | | | | | | | | |
Exports | | | 10,323.2 | | | | 12,037.5 | | | | 12,675.1 | | | | 16,929.1 | | | | 18,872.1 | |
Imports | | | (14,869.1 | ) | | | (14,218.2 | ) | | | (17,218.3 | ) | | | (22,946.2 | ) | | | (24,622.6 | ) |
Balance | | | (4,545.9 | ) | | | (2,180.7 | ) | | | (4,543.2 | ) | | | (6,017.1 | ) | | | (5,750.5 | ) |
Services | | | 3,204.7 | | | | 3,324.2 | | | | 3,490.1 | | | | 3,878.1 | | | | 5,058.0 | |
Rent(3) | | | (1,573.8 | ) | | | (1,448.8 | ) | | | (1,849.2 | ) | | | (1,853.7 | ) | | | (2,655.7 | ) |
Unilateral Transfers(4) | | | 237.9 | | | | 126.3 | | | | 137.7 | | | | 167.1 | | | | 81.2 | |
Balance | | | (2,677.1 | ) | | | (179.0 | ) | | | (2,764.6 | ) | | | (3,825.6 | ) | | | (3,267.0 | ) |
| | | | | |
Capital and Financial Account: | | | | | | | | | | | | | | | | | | | | |
Capital Account | | | 56.9 | | | | 30.0 | | | | 42.5 | | | | 8.9 | | | | — | |
Financial Account | | | 2,909.2 | | | | 301.8 | | | | 3,010.6 | | | | 4,017.3 | | | | 3,681.5 | |
Direct Investment | | | 2,401.7 | | | | 1,259.3 | | | | 2,362.5 | | | | 2,755.0 | | | | 3,019.8 | |
Portfolio Investment | | | (526.6 | ) | | | 302.0 | | | | (1,057.8 | ) | | | (678.8 | ) | | | (116.4 | ) |
Other Capital | | | 1,034.1 | | | | (1,259.5 | ) | | | 1,705.9 | | | | 1,941.1 | | | | 778.1 | |
Assets | | | (3,000.6 | ) | | | (1,568.2 | ) | | | (3,665.4 | ) | | | (3,813.0 | ) | | | (3,464.8 | ) |
Liabilities | | | 4,034.7 | | | | 308.7 | | | | 5,371.3 | | | | 5,754.1 | | | | 4,242.9 | |
Balance | | | 2,966.1 | | | | 331.8 | | | | 3,053.1 | | | | 4,026.2 | | | | 3,699.9 | |
| | | | | |
Errors and Omissions (net) | | | 295.8 | | | | 452.9 | | | | 18.7 | | | | (428.8 | ) | | | (432.9 | ) |
| | | | | |
Overall Surplus (Deficit) | | | 584.8 | | | | 605.7 | | | | 307.2 | | | | (228.2 | ) | | | (18.4 | ) |
| | | | | |
Financing | | | (584.8 | ) | | | (605.7 | ) | | | (307.2 | ) | | | 228.2 | | | | 18.4 | |
Total Reserves | | | (579.4 | ) | | | (605.7 | ) | | | (307.2 | ) | | | 228.2 | | | | 18.4 | |
Use of IMF credit and IMF loans | | | (5.4 | ) | | | — | | | | — | | | | — | | | | — | |
| (1) | Figures have been calculated pursuant to V Version of the Balance of Payments Manual prepared by IMF. |
| (3) | Includes wages and investment profits. |
| (4) | Unilateral transfers consist of transactions without a quid pro quo, many of which are gifts and migrant transfers. |
Source: Office of the Comptroller General.
D-67
PUBLIC SECTOR DEBT
Internal Debt
At December 31, 2012, Panama’s public sector internal debt represented approximately 24.4% of the total public sector debt. A substantial portion of total public sector internal debt is extended by public sector sources, such as CSS and official banking institutions, and BNP in particular. As of December 31, 2012, Panama’s public sector internal debt totaled approximately $3,482.8 million, an increase of $1,579.0 million from December 31, 2011. This increase was due to the issuance of $1,364.0 of Treasury Bonds due 2022, as part of the Market Makers Program, as described below. Panama’s public sector internal debt as a percentage of GDP was 9.6% as of December 31, 2012.
Two significant loans by BNP to the Central Government with a total outstanding principal amount of $676.9 million as of December 31, 2005, were both repaid in 2006. The first loan was a result of approximately $933 million in overdrafts by the Noriega-controlled Central Government during the 1987-1989 period. Until 1993, such obligation was undocumented. In October 1993, a restructuring was completed whereby the overdraft was converted into a series of 25-year non-negotiable, non-transferable notes, bearing interest at 2.0% per annum and requiring $17.3 million in semi-annual principal payments. As of December 31, 2012, BNP’s public sector loans had a total outstanding principal amount of $473.9 million, an increase from $421.8 million in 2011. As of December 31, 2012, BNP’s largest loan to the Central Government had a total outstanding principal amount of $189.9 million, a slight decrease from $190 million in 2011.
The Central Government also has debt obligations outstanding in the domestic private sector. The Ministry of Economy and Finance occasionally has issued domestic bonds, bills and notes in the domestic market. In an effort to promote the development of Panama’s capital market, the Government initiated in July 2002 a program of Treasury Note issuances in the local market; however, the Treasury Notes program had been suspended after the issuance of September 6, 2005. In addition, the Government continued in 2008 with a program of Treasury Bill issuances with seven auctions from January 15, 2008 to August 26, 2008. During that time, Panama issued $211.0 million of zero-coupon Treasury Bills with short-term maturities of one-year or less in Panama’s capital markets. The Treasury Bill issuance program continued in 2009 with seven auctions from January 27, 2009 to December 15, 2009. During that time, Panama issued $493.6 million of zero-coupon Treasury Bills with short-term maturities of one year or less in Panama’s capital markets. As of December 31, 2009, outstanding Treasury Bills amounted to $220.8 million and outstanding Treasury Notes amounted to $265.1 million. The Government continued the program of Treasury Bill issuances in 2010 with seven auctions from January 19, 2010 to July 20, 2010. During that time, Panama issued $179.1 million of zero-coupon Treasury Bills with short-term maturities of one year or less in Panama’s capital markets. Additionally, the Government reinstated the Treasury Notes issuance program in 2010, and on January 26, 2010, the Executive Cabinet Council authorized the issuance of domestic Treasury Notes in a principal amount up to $600 million. In 2010, the Government issued $566.2 million of Treasury Notes in 12 auctions. In 2011, the Government issued $537.9 million of Treasury Notes in four auctions. Since January 1, 2012, the Government has not issued any Treasury Notes.
In 2012, a new instrument was auctioned through the Market Makers Program, a series of treasury bonds having a 5.625% coupon and a maturity date of 2022 (“Treasury Bonds due 2022”). By the end of 2012, the Treasury Bonds due 2022 had been auctioned in an inaugural offering and 22 reopenings. During 2012, the aggregate of the initial offering amounts set for the Bonds was $925.0 million, the aggregate amount of bids received was $2,840.2 million, and the aggregate amount of Bonds issued was $1,364.0 million. The weighted average price and yield for the Treasury Bonds due 2022 were 111.45% and 4.220%, respectively.
The Ministry of Economy and Finance expects to continue issuing Treasury Bills. In addition, the Government has a cash management plan that is intended to increase the volume of trades on La Bolsa. This plan provides for the issuance of short-term securities to cover current cash needs. As of July 31, 2013, Treasury Bills had an outstanding balance of $455.1 million.
In recent years, another significant component of public sector internal indebtedness was represented by amounts owed by the Central Government to CSS. At December 31, 2008, the Central Government owed CSS $541.2 million, which represented accruals of contributions due CSS from the Central Government wage bill that were not made in cash by the Central Government and were evidenced by interest-bearing notes and bonds. In 2009, the Central Government made payments to the CSS aggregating $595.5 million in principal and interest, and subsequently on December 31, 2009, the Central Government no longer owed any amount to CSS.
D-68
The following table sets forth Panama’s outstanding public sector internal debt at year-end for the years 2008 through 2012:
TABLE NO. 22
Public Sector Internal Debt
(in millions of dollars)
| | | | | | | | | | | | | | | | | | | | |
| | | December 31, | |
| | | 2008 | | | 2009 | | | 2010 | | | 2011 | | | 2012 | |
Private Sector Sources: | | | | | | | | | | | | | | | | | | | | |
Treasury notes | | $ | 565.1 | | | $ | 265.1 | | | $ | 635.1 | | | $ | 1,133.0 | | | $ | 1,133.0 | |
Treasury bills(1) | | | 59.0 | | | | 220.8 | | | | 230.0 | | | | 264.1 | | | | 415.1 | |
Domestic bonds | | | 2.2 | | | | 0.0 | | | | 0.0 | | | | 0.0 | | | | 1,364.0 | |
Long-term private financing | | | 35.6 | | | | 33.5 | | | | 29.1 | | | | 24.8 | | | | 20.5 | |
SIACAP Bonds | | | 165.7 | | | | 0.0 | | | | 0.0 | | | | 0.0 | | | | 0.0 | |
Total | | $ | 827.6 | | | $ | 519.4 | | | $ | 894.2 | | | $ | 1,421.9 | | | $ | 2,932.6 | |
Public Sector Sources: | | | | | | | | | | | | | | | | | | | | |
CSS | | $ | 541.2 | | | $ | 0.0 | | | $ | 0.0 | | | $ | 0.0 | | | $ | 0.0 | |
Official banking institutions(2) | | | 591.3 | | | | 302.8 | | | | 296.7 | | | | 481.9 | | | | 550.2 | |
| | | | | | | | | | | | | | | | | | | | |
Total | | $ | 1,132.5 | | | $ | 302.8 | | | $ | 296.7 | | | $ | 481.9 | | | $ | 550.2 | |
| | | | | |
Total Public Sector Internal Debt | | $ | 1,960.1 | | | $ | 822.2 | | | $ | 1,191.0 | | | $ | 1,903.8 | | | $ | 3,482.8 | |
| (1) | Internal Floating Debt of the Republic. |
| (2) | The remaining unpaid overdraft debt that the Central Government incurred at BNP during the 1987-1989 period is reflected in this category. |
Source: Ministry of Economy and Finance.
External Debt
General. At December 31, 2012, total public sector external debt was approximately $10.8 billion, down from $10.9 billion as of December 31, 2011. Panama’s public sector external debt as a percentage of GDP was 29.7% as of December 31, 2012, as compared to 34.8% as of December 31, 2011. As of July 31, 2013, total public sector external debt was approximately $12.1 billion, up from $10.8 billion as of December 31, 2012. Panama’s public sector external debt as a percentage of GDP was 29.4% as of July 31, 2013, as compared to 29.7% as of December 31, 2012.
D-69
The following tables set forth the composition of public sector external debt outstanding at year-end for the years 2008 through 2012 and the scheduled amortizations for public sector external debt for each of the years indicated:
TABLE NO. 23
Public Sector External Debt(1)
(in millions of dollars)
| | | | | | | | | | | | | | | | | | | | |
| | | December 31, | |
| | | 2008 | | | 2009 | | | 2010 | | | 2011 | | | 2012 | |
Commercial banks | | $ | 169.6 | | | $ | 218.8 | | | $ | 216.9 | | | $ | 216.9 | | | $ | 302.2 | |
Bonds | | | 6,747.6 | | | | 8,070.6 | | | | 8,070.6 | | | | 8,274.0 | | | | 7,725.7 | |
Multilateral agencies | | | 1,349.9 | | | | 1,638.1 | | | | 1,825.7 | | | | 2,039.4 | | | | 2,403.0 | |
Bilateral entities | | | 210.3 | | | | 222.7 | | | | 325.4 | | | | 380.9 | | | | 351.6 | |
| | | | | | | | | | | | | | | | | | | | |
Total | | $ | 8,477.4 | | | $ | 10,150.2 | | | $ | 10,438.5 | | | $ | 10,910.4 | | | $ | 10,782.5 | |
| (1) | Debt stated at its outstanding principal amount and not at trading value in the secondary market. All external debt of the Republic is funded debt. Currencies other than U.S dollars are translated into U.S dollars at the exchange rate (selling) as of December 31, 2012. Panama enters into derivatives transactions with respect to its non-dollar denominated obligations when and to the extent it deems appropriate. |
Source: Ministry of Economy and Finance.
TABLE NO. 24
Public Sector External Debt Amortization
(in millions of dollars)
| | | | | | | | | | | | | | | | | | | | |
| | | 2013 | | | 2014 | | | 2015 | | | 2016 | | | 2017-2037 | |
Multilaterals | | | | | | | | | | | | | | | | | | | | |
World Bank | | | 41.6 | | | | 47.7 | | | | 52.8 | | | | 47.1 | | | | 506.9 | |
IDB | | | 111.7 | | | | 106.4 | | | | 119.0 | | | | 139.3 | | | | 1,463.4 | |
IADF(1) | | | 1.5 | | | | 0.9 | | | | 0.9 | | | | 0.9 | | | | 5.5 | |
CAF(2) | | | 10.1 | | | | 11.7 | | | | 47.2 | | | | 54.9 | | | | 579.6 | |
EIB(3) | | | 3.4 | | | | 3.4 | | | | 3.6 | | | | 3.9 | | | | 41.6 | |
OFID(4) | | | 0.4 | | | | 1.8 | | | | 1.8 | | | | 1.8 | | | | 15.9 | |
| | | | | | | | | | | | | | | | | | | | |
Total | | | 168.7 | | | | 171.9 | | | | 225.4 | | | | 248.1 | | | | 2,612.86 | |
| | | | | |
Bilaterals | | | 17.4 | | | | 28.5 | | | | 26.9 | | | | 26.7 | | | | 257.8 | |
Bonds | | | 0.0 | | | | 0.0 | | | | 962.4 | | | | 0.0 | | | | 6,763.3 | |
Commercial Debt | | | 0.0 | | | | 26.2 | | | | 115.2 | | | | 122.0 | | | | 564.6 | |
| | | | | | | | | | | | | | | | | | | | |
Total | | | 17.4 | | | | 54.7 | | | | 1,104.6 | | | | 148.7 | | | | 7,585.7 | |
| (1) | International Agricultural Development Fund. |
| (2) | Andean Development Corporation. |
| (3) | European Investment Bank. |
| (4) | The OPEC Fund for International Development. |
Source: Ministry of Economy and Finance.
D-70
The 1980s Debt Crisis. Panama’s economic performance measured by the growth rate of GDP during the 1980s was poor in comparison with the strong results registered during the previous three decades. The factors causing low growth rates included the growing influence of the public sector on the economy and the uncertainty related to the military government’s control of the country. Additionally, Panama had borrowed heavily in the late 1970s and early 1980s, and the profile of maturities on Panamanian public sector debt was highly concentrated.
In 1987, Panama defaulted under all of its external indebtedness. Panama subsequently was declared ineligible to use the resources of the IMF and the World Bank, and the IADB placed the country on non-accrual status.
Following the United States’s military operation in December 1989, the Endara government declared that it would honor existing financial obligations. Panama subsequently cleared its substantial arrears with the international financial institutions, the Paris Club and its international bondholders. In 2001, Panama completed payments on its restructured Paris Club debt and, in 2002, on its floating rate notes issued in 1994 to restructure bonds in default at that time.
1995 Financing Plan. On May 9, 1995, Panama and its Bank Advisory Committee reached an agreement-in-principle on the restructuring of Panama’s medium- and long-term public sector indebtedness owed to commercial banks, as well as for interest arrears accrued in respect of such indebtedness since 1987. Pursuant to that agreement, on July 17, 1996, Panama issued approximately $3.2 billion principal amount of bonds to holders of debt (“Eligible Debt”) in consideration for the tender by such holders of their Eligible Debt and interest arrears accrued in respect thereof since 1987 (“Eligible Interest”). The bonds were issued pursuant to an exchange agreement implementing the Republic of Panama 1995 Financing Plan (the “1995 Financing Plan”), which provided for the restructuring of approximately $2.0 billion of Eligible Debt and arrangements for approximately $1.8 billion of Eligible Interest. On July 17, 2006, Panama redeemed all of the bonds issued under its 1995 Financing Plan.
International Financial Institutions. The IADB has been a significant source of financing for Panama. As of December 31, 2012, Panama had agreements with the IADB for a total of $4.5 billion in loans, of which $170.8 million had been disbursed in 2012. These agreements finance projects in health, transportation, social investment and modernization as well as co-financings with the World Bank concerning the public sector reforms and financial adjustments contemplated by the Desarrollo Social con Eficiencia Económica, or “Social Development with Economic Efficiency” program, of the Pérez Balladares administration and the Desarrollo Económico, Social y Financiero con Inversión en Capital Humano, or “Economic, Social and Financial Development with Investment in Human Capital” development plan, of the Moscoso administration. Prior to 1990, Panama borrowed money from the IDB’s Fund for Special Operations and Social Progress Trust Fund in order to finance agricultural, fisheries, transportation, education, real estate, urban and industrial development programs.
On June 6, 2007, the IADB approved a 25-year $20.2 million loan to strengthen Red de Oportunidades, Panama’s poverty alleviation and reduction strategy, which was signed by Panama on July 5, 2007. On June 29, 2007, the IADB approved a 25-year $21.6 million loan to Panama for the second stage of a program to improve the administration of justice, which was signed by Panama on March 13, 2008. This second stage will focus on strengthening the management of judicial agencies, opening new judicial units, developing a model for alternative dispute resolution for indigenous groups, and to educate citizens and communities on justice and conflict resolution. On August 2, 2007, the IADB approved a 20-year $27.0 million loan to Panama for modernization of land management in the metropolitan region, which was signed by Panama on October 31, 2007.
In June 2008, the IADB granted Panama a $51.3 million loan for the financing of commercial development and public/private sector competitiveness progress, furthering the governmental goals of strengthening systemic capacities, plans for which were implemented by a $19.7 million financing made available by the IADB. With the support of the IADB, the Republic established and implemented programs to enhance the development of geographic regions with the greatest needs, such as Bocas del Toro, Colón and Provincias Centrales (Coclé, Herrera, Los Santos, Veraguas), with loans of approximately $29 million, $20 million, and $43 million, respectively. The participation of the IADB also included granting of a loan for Empresa de Transmisión Eléctrica S.A., or ETESA, a Republic-owned corporation in charge of energy transmission throughout Panama’s territory. The IADB granted the Republic three loans in 2009 directed at improving living conditions for the poor, energy sector consolidation, and public corporation reforms, for approximately $30 million, $100 million, and $12.5 million, respectively.
D-71
In 2010, the IADB approved four loans to Panama, of which $40 million was given to expand and improve the quality of water and sanitation services, $30 million to improve access to and the quality of education in indigenous zones, $200 million to strengthen fiscal policy and increase transparency, and $70 million to improve the country’s main road network. The IADB also supported the rebuilding and rehabilitation of public infrastructure affected by floods that occurred in December 2010, by approving a $20.6 million loan in early 2011. The IADB continues to support the country’s effort to improve health, fiscal, disaster risk and climate change management, with loans totaling $200 million. In 2012, the IADB approved three new operations with sovereign guarantee. They are: (1) Innovation in School Infrastructure for $70 million with the objective of promoting increases in coverage and improvements in internal efficiency through investments in innovative infrastructure and improvements in the management of schools and the relevance of the curriculum, (2) Reducing Vulnerability to Natural Disasters and Climate Change II for $100 million which is structured as a programmatic loan to support policy reforms in the context of natural disaster risk management and climate change and (3) Strengthening Macrofinancial and Fiscal Management for $350 million, which, at the request of the Panamanian Government, will be in the form of a guarantee. The first operation, as well as the program as a whole, will have four components, aiming to reduce sovereign risk and to prevent systemic risk.
The Republic has entered into several multilateral and bilateral agreements for the construction of the Metro de Panama, which started on March 2011 and is expected to be completed 38 months later, by 2014. The cost of the first phase is estimated to be approximately $1.88 billion, which the government is financing through central government borrowings from multilateral and bilateral lending institutions. In this connection, on July 20, 2011, the Republic entered into an agreement with CAF for a loan in the amount of $400 million. Of this amount, approximately $394.0 million had been disbursed as of August 2013. On February 9, 2012, the Republic entered into credit facilities with Compagnie Française d’Assurance pour le Commerce Extérieur (COFACE) for a loan amount of $297.8 million and with Compañía Española de Seguros de Crédito a la Exportación S.A. (CESCE) for a loan in the amount of $64.1 million. As of August 2013, approximately $185.7 million had been disbursed under the COFACE facility. On June 29, 2012, the Republic entered into a syndicated facility with a MIGA guarantee for a credit up to an amount of $250 million and the facility had been completely disbursed as of August, 2013. As of August, 2013, $41.6 million had been disbursed from the CESCE facility. On February 2013, the Republic entered into a new agreement with CAF, for a loan in the amount of $100.0 million; from this new loan US$80.0 million had been disbursed as of August, 2013.
On June 30, 2000, the Republic entered into a 21-month standby arrangement with the IMF for SDR 64 million (approximately $85.5 million) to support the Government’s economic program for 2000 to 2001. The Government viewed this standby arrangement as a precautionary measure as it moved forward with important fiscal and structural reforms. No disbursements were made pursuant to the standby agreement. Panama and the IMF have maintained a continuous dialogue concerning Panama’s economic performance and economic programs. As of December 31, 2012 the Government had no arrangement in place with the IMF. The IMF concluded its most recent Article IV consultation with Panama on January 25, 2013.
Panama entered into two loans with the World Bank during 2009, which consisted of a loan in the amount of $100.0 million for the competitive development and administration of public finance and a loan in the amount of $80.0 million to improve financial services access for the poor. In October 2011, the World Bank supported Panama‘s initiative to reduce its vulnerability to the impacts of natural disasters through a development policy loan with a Catastrophe Deferred Drawdown Option (CAT DDO) for $66 million. The World Bank approved a new loan on March 26, 2013 for a total amount of $100.0 million. The purpose of this loan is to finance the Second Programmatic Development Policy Loan with the objective of supporting the Panama in creating fiscal space and strengthening social transfer programs.
D-72
As of August 31, 2013, Panama’s subscription to the IMF (which corresponds to its quota) was SDR $206.6 million. As of June 30, 2012, Panama’s subscription to the capital of the World Bank was $46.4 million. Of this amount, $3.2 million had been paid as of June 30, 2012. The balance of Panama’s subscription is callable only if required by the World Bank to meet its obligations for funds borrowed or loans guaranteed by it. As of June 30, 2012, Panama’s subscription to MIGA was $2.5 million. Of this amount, $0.5 million had been paid as of June 30, 2012. As of June 30, 2013, the amount paid by Panama for its share of the capital stock of the IFC was $1.0 million.
As of December 31, 2012, Panama’s subscription to the IADB was $496.3 million. Of this subscription, $20.1 million had been paid as of December 31, 2012, and the balance is callable if required to meet the IADB’s obligations. Panama’s contribution to the IADB’s Fund for Special Operations (which corresponds to its quota) was $26.7 million as of December 31, 2012.
On August 9, 2006, the Cabinet approved Panama’s accession to the Central American Bank for Economic Integration (“BCIE”). In January 2007, Panama joined the BCIE as a non-regional and non-founding member and agreed to pay a subscription of $57.6 million, with 25% as payable capital and 75% as callable capital if required by the BCIE to meet its obligations for funds borrowed or loans guaranteed by it. The BCIE was established in 1960 to promote economic integration and development in Central America. It currently is comprised of seven regional member countries, five non-regional member countries, and one beneficiary country.
Global Notes and Bonds
On March 25, 2009, Panama issued $323,000,000 aggregate principal amount of its 7.250% Global Bonds due 2015, and on November 16, 2009, Panama issued $1.0 billion aggregate principal amount of its 5.200% Global Bonds due 2020.
On March 1, 2010, BNP, acting not in its individual capacity but solely as trustee of the Development Trust Fund, sold $351,667,000 aggregate principal amount of Panama’s 8.875% U.S. Dollar-Denominated Amortizing Global Bonds due 2027. On March 24, 2010, BNP, as trustee of the Development Trust Fund, sold $62,200,000 aggregate principal amount of Panama’s 8.125% Global Bonds due 2034. On April 5, 2010, BNP, as trustee of the Development Trust Fund, sold $95,850,000 aggregate principal amount of Panama’s 6.700% U.S. Dollar-Denominated Amortizing Global Bonds due 2036. On October 26, 2011, BNP, as trustee of the Development Trust Fund, sold $89,500,000 aggregate principal amount of Panama’s 7.125% Global Bonds due 2026. The Republic did not receive any proceeds from these sales.
On January 25, 2011, Panama issued ¥41,500,000,000 aggregate principal amount of its 1.81% Japanese Yen Bonds Series A due 2021, guaranteed by the Japanese Bank for International Cooperation.
On January 17, 2012, Panama announced an invitation to eligible holders of its 7.250% Global Bonds due 2015 to submit, in a modified Dutch auction, offers to sell their 2015 Bonds for cash. On February 1, 2012, Panama accepted U.S.$250,127,000 aggregate principal amount of the 2015 Bonds in exchange for cash pursuant to the invitation. In order to finance the exchange of the 2015 Bonds for cash, the Republic issued, through a local auction, Treasury Bonds with a coupon of 5.625% due 2022. The Republic had $679 million in competitive offers, accepting $400.0 million with an average price of 110.33% and an average yield of 4.385%. Simultaneously with the invitation, the Republic prepared a concurrent exchange invitation inviting eligible holders of its 2015 Bonds to submit, in a modified Dutch auction, offers to exchange their 2015 Bonds for Panama’s 6.700% U.S. Dollar-Denominated Amortizing Global Bonds due 2036. On February 1, 2012, Panama completed the exchange offer, accepting $258,478,000 aggregate principal amount of the 2015 Bonds in exchange for issuing $248,596,000 aggregate principal amount of the 2036 Bonds.
The dollar-denominated global notes and bonds issued by Panama in the international capital markets since 1997 are unsecured, pay interest semi-annually, and have been issued in global registered form; these debt securities each rank pari passu in right of payment without any preference among themselves and with all other existing and future unsecured and unsubordinated indebtedness of Panama. In September 2003, Panama amended its fiscal agency agreement with The Bank of New York Mellon (formerly JPMorgan Chase Bank) to provide for the issuance in the future of global bonds with collective action clauses that, among other things, permit Panama to amend certain key terms of the bonds, including the maturity date, interest rate and other payment terms, with the consent of the holders of not less than 75% of the aggregate principal amount of outstanding bonds of the same series.
D-73
On April 29, 2013, Panama issued $750.0 million aggregate principal of its 4.30% Global Bonds due 2053.
As of December 31, 2012, approximately 74.5% of the total public sector external debt was owed to commercial lenders and bondholders, with 22.3% owed to multilateral institutions and 3.3% owed to bilateral lenders.
D-74
TABLES AND SUPPLEMENTARY INFORMATION
TABLE NO. 25
External Direct Debt of the Republic
Central Government
| | | | | | | | | | | | | | |
| | | Interest | | | Issue Date | | Final
Maturity | | Amortization | | Outstanding
Balance as of
December 31,
2012(1) | |
MULTILATERAL ORGANIZATIONS | | | | | | | | | | | | $ | 2,351.48 | |
Inter-American Development Bank | | | Various | | | Various | | Various | | Semiannually | | | 1,374.30 | |
World Bank | | | Various | | | Various | | Various | | Semiannually | | | 488.88 | |
European Investment Bank | | | Various | | | Various | | Various | | Semiannually | | | 55.95 | |
Andean Development Corporation | | | Various | | | Various | | Various | | Semiannually | | | 430.74 | |
International Agricultural Development Fund | | | Various | | | Various | | Various | | Semiannually | | | 1.59 | |
OPEC Fund for International Development | | | Various | | | Various | | Various | | Semiannually | | | 0.02 | |
BILATERAL ORGANIZATIONS | | | | | | | | | | | | $ | 350.10 | |
Banks with Official Guarantees | | | Various | | | Various | | Various | | Semiannually | | | 43.46 | |
Support Groups | | | Fixed | | | Various | | Various | | Semiannually | | | 36.48 | |
Government Direct Creditors | | | Fixed | | | Various | | Various | | Semiannually | | | 270.16 | |
Commercial Banks | | | Various | | | Various | | Various | | Semiannually | | $ | 302.16 | |
Global Bonds | | | | | | | | | | | | $ | 7,725.70 | |
Global 2036 | | | 6.70% | | | Jan 26, 2006 | | Jan 26, 2036 | | Various | | | 2,033.89 | |
Global 2015 | | | 7.25% | | | Nov 23, 2004 | | Mar 15, 2015 | | Bullet | | | 962.40 | |
Global 2020 | | | 5.20% | | | Nov 23, 2009 | | Jan 01, 2020 | | Bullet | | | 1,000.00 | |
Global 2020 | | | 10.75% | | | July 13, 2000 | | May 15, 2020 | | Bullet | | | 30.71 | |
Global 2023 | | | 9.38% | | | Dec 03, 2002 | | Jan 16, 2023 | | Bullet | | | 138.90 | |
Global 2027 | | | 8.88% | | | Sep 26, 1997 | | Sep 30, 2027 | | Bullet | | | 975.00 | |
Global 2029 | | | 9.38% | | | Mar 31, 1999 | | Apr 01, 2029 | | Bullet | | | 951.43 | |
Global 2034 | | | 8.13% | | | Jan 28, 2004 | | Apr 28, 2034 | | Bullet | | | 172.84 | |
Global 2026 | | | 7.13% | | | Nov 29, 2005 | | Jan 29, 2026 | | Bullet | | | 980.00 | |
Samurai 2021 | | | 1.81% | | | Jan 26, 2011 | | Jan 25, 2021 | | Bullet | | | 480.55 | |
| (1) | All obligations are denominated in U.S. dollars unless otherwise indicated. Currencies other than U.S. dollars are translated into U.S. dollars by the exchange rate (selling) as of December 31, 2012. |
Source: Ministry of Economy and Finance.
D-75
TABLE NO. 26
External Debt Guaranteed by the Republic
Decentralized Institutions
| | | | | | | | | | | | | | | | |
| | | Interest | | Issue Date | | Maturity | | Amortizations | | Disbursed
during
2012 | | | Principal Amount
Outstanding as of
December 31, 2012(1) | |
| | | | | | | | | | | (in millions of dollars) | |
| Multilateral Organizations | | | | | | | | | | | | | | | | |
Inter-American Development Bank(2) | | Various | | Various | | Various | | Semiannually | | $ | 4.67 | | | $ | 51.50 | |
| Bilateral Organizations | | | | | | | | | | | | | | | | |
Government Suppliers | | Fixed | | Various | | Various | | Semiannually | | $ | 0.00 | | | $ | 1.45 | |
Total | | | | | | | | | | | | | | $ | 52.95 | |
| (1) | All obligations are denominated in U.S. dollars unless otherwise indicated. Currencies other than U.S. dollars are translated into U.S. dollars by the exchange rate (selling) as of December 31, 2012. |
Source: Ministry of Economy and Finance.
D-76
TABLE NO. 27
Internal Debt Securities of the Republic
| | | | | | | | | | | | |
Name | | Interest
Rate | | Amortization | | Issuance Date | | Final Maturity | | Principal Amount
outstanding as of
Dec 31, 2012(1) | |
Bonds | | | | | | | | | | (in millions of dollars) | |
Treasury Bonds 2022 | | 5.6% | | Semiannually | | Jan 30, 2012 | | Jul 25, 2022 | | $ | 399.88 | |
Treasury Bonds 2022 | | 5.6% | | Semiannually | | Mar 16, 2012 | | Jul 25, 2022 | | $ | 100.00 | |
Treasury Bonds 2022 | | 5.6% | | Semiannually | | Apr 09, 2012 | | Jul 25, 2022 | | $ | 100.00 | |
Treasury Bonds 2022 | | 5.6% | | Semiannually | | May 11, 2012 | | Jul 25, 2022 | | $ | 25.00 | |
Treasury Bonds 2022 | | 5.6% | | Semiannually | | Jun 22, 2012 | | Jul 25, 2022 | | $ | 50.00 | |
Treasury Bonds 2022 | | 5.6% | | Semiannually | | Jul 06, 2012 | | Jul 25, 2022 | | $ | 100.00 | |
Treasury Bonds 2022 | | 5.6% | | Semiannually | | Jul 27, 2012 | | Jul 25, 2022 | | $ | 100.00 | |
Treasury Bonds 2022 | | 5.6% | | Semiannually | | Aug 17, 2012 | | Jul 25, 2022 | | $ | 50.00 | |
Treasury Bonds 2022 | | 5.6% | | Semiannually | | Aug 24, 2012 | | Jul 25, 2022 | | $ | 25.00 | |
Treasury Bonds 2022 | | 5.6% | | Semiannually | | Aug 31, 2012 | | Jul 25, 2022 | | $ | 25.00 | |
Treasury Bonds 2022 | | 5.6% | | Semiannually | | Sep 07, 2012 | | Jul 25, 2022 | | $ | 25.00 | |
Treasury Bonds 2022 | | 5.6% | | Semiannually | | Sep 18, 2012 | | Jul 25, 2022 | | $ | 25.00 | |
Treasury Bonds 2022 | | 5.6% | | Semiannually | | Sep 21, 2012 | | Jul 25, 2022 | | $ | 25.00 | |
Treasury Bonds 2022 | | 5.6% | | Semiannually | | Sep 28, 2012 | | Jul 25, 2022 | | $ | 25.00 | |
Treasury Bonds 2022 | | 5.6% | | Semiannually | | Oct 05, 2012 | | Jul 25, 2022 | | $ | 13.30 | |
Treasury Bonds 2022 | | 5.6% | | Semiannually | | Oct 19, 2012 | | Jul 25, 2022 | | $ | 25.00 | |
Treasury Bonds 2022 | | 5.6% | | Semiannually | | Oct 26, 2012 | | Jul 25, 2022 | | $ | 16.75 | |
Treasury Bonds 2022 | | 5.6% | | Semiannually | | Nov 02, 2012 | | Jul 25, 2022 | | $ | 25.00 | |
Treasury Bonds 2022 | | 5.6% | | Semiannually | | Nov 09, 2012 | | Jul 25, 2022 | | $ | 23.71 | |
Treasury Bonds 2022 | | 5.6% | | Semiannually | | Nov 20, 2012 | | Jul 25, 2022 | | $ | 25.00 | |
Treasury Bonds 2022 | | 5.6% | | Semiannually | | Nov 23, 2012 | | Jul 25, 2022 | | $ | 15.50 | |
Treasury Bonds 2022 | | 5.6% | | Semiannually | | Nov 30, 2012 | | Jul 25, 2022 | | $ | 25.90 | |
Treasury Bonds 2022 | | 5.6% | | Semiannually | | Dec 21, 2012 | | Jul 25, 2022 | | $ | 119.00 | |
Total | | | | | | | | | | $ | 1,364.04 | |
Treasury Notes 2013 | | 3.5% | | Semiannually | | Feb 04, 2010 | | May 30, 2013 | | $ | 10.28 | |
Treasury Notes 2013 | | 3.5% | | Semiannually | | Mar 11, 2010 | | May 30, 2013 | | $ | 100.00 | |
Total | | | | | | | | | | $ | 110.28 | |
Treasury Notes 2018 | | 5.0% | | Semiannually | | Jun 24, 2011 | | Jun 15, 2018 | | $ | 257.97 | |
Treasury Notes 2018 | | 5.0% | | Semiannually | | Jul 29, 2011 | | Jun 15, 2018 | | $ | 100.00 | |
Treasury Notes 2018 | | 5.0% | | Semiannually | | Sep 23, 2011 | | Jun 15, 2018 | | $ | 80.00 | |
Treasury Notes 2018 | | 5.0% | | Semiannually | | Oct 14, 2011 | | Jun 15, 2018 | | $ | 100.00 | |
Treasury Notes 2018 | | 5.0% | | Semiannually | | Oct 04, 2012 | | Jun 15, 2018 | | $ | 455.97 | |
Total | | | | | | | | | | $ | 993.94 | |
Treasury Notes 2015 | | 7.0% | | Semiannually | | Dec 30, 2005 | | Dec 30, 2015 | | $ | 28.82 | |
| Total Treasury Notes | | | | | | | | | | $ | 2,497.07 | |
| (1) | Instruments with a maturity of more than one year. Source: Ministry of Economy and Finance. |
Source: Ministry of Economy and Finance.
D-77