Exhibit 99.1
1
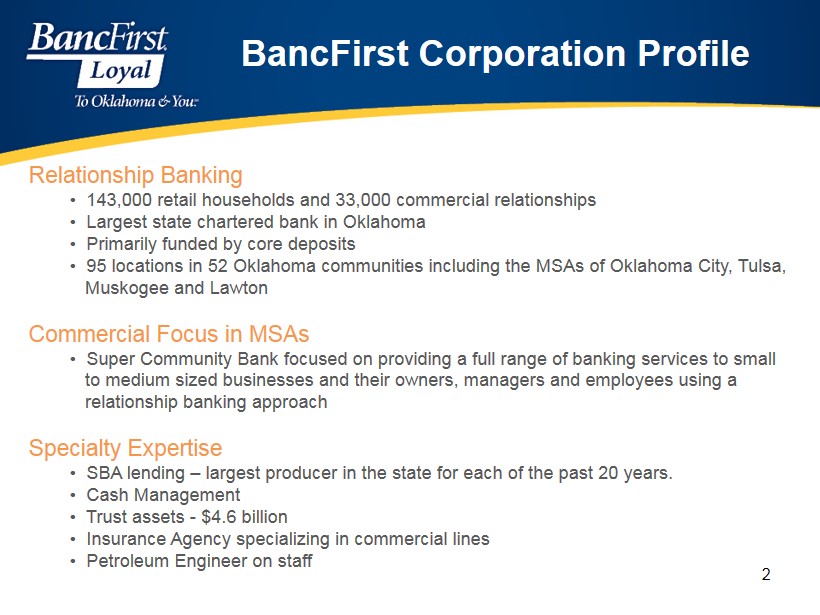
Relationship Banking • 143,000 retail households and 33,000 commercial relationships • Largest state chartered bank in Oklahoma • Primarily funded by core deposits • 95 locations in 52 Oklahoma communities including the MSAs of Oklahoma City, Tulsa, Muskogee and Lawton Commercial Focus in MSAs • Super Community Bank focused on providing a full range of banking services to small to medium sized businesses and their owners, managers and employees using a relationship banking approach Specialty Expertise • SBA lending – largest producer in the state for each of the past 20 years. • Cash Management • Trust assets - $4.6 billion • Insurance Agency specializing in commercial lines • Petroleum Engineer on staff BancFirst Corporation Profile 2
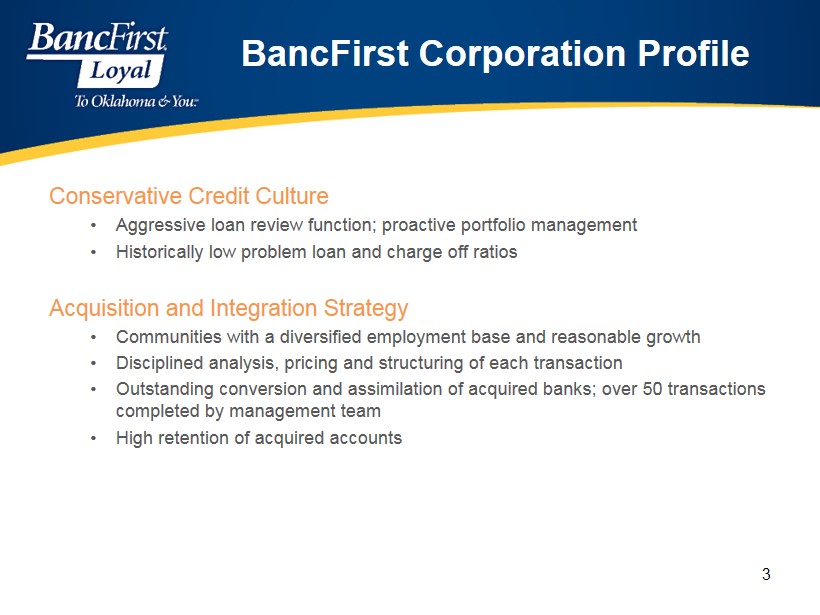
Conservative Credit Culture • Aggressive loan review function; proactive portfolio management • Historically low problem loan and charge off ratios Acquisition and Integration Strategy • Communities with a diversified employment base and reasonable growth • Disciplined analysis, pricing and structuring of each transaction • Outstanding conversion and assimilation of acquired banks; over 50 transactions completed by management team • High retention of acquired accounts BancFirst Corporation Profile 3
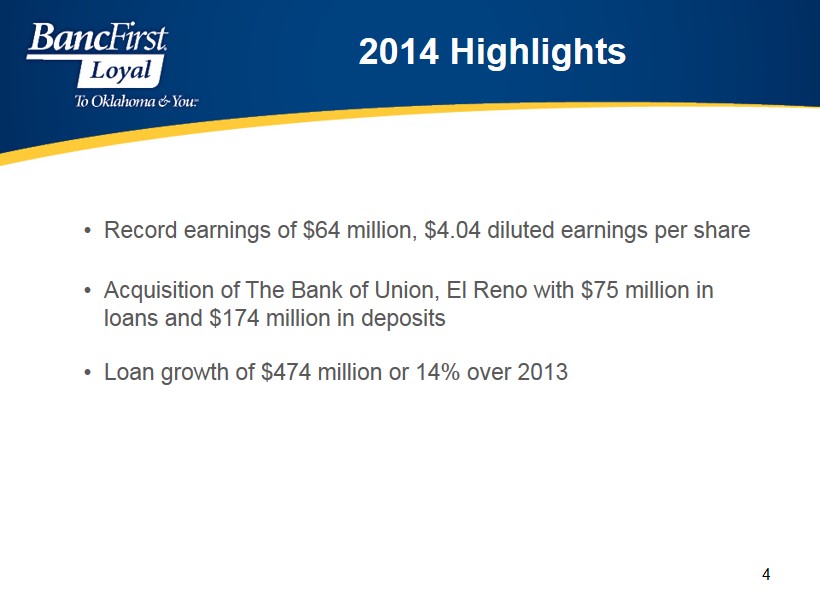
2014 Highlights • Record earnings of $64 million, $4.04 diluted earnings per share • Acquisition of The Bank of Union, El Reno with $75 million in loans and $174 million in deposits • Loan growth of $474 million or 14% over 2013 4
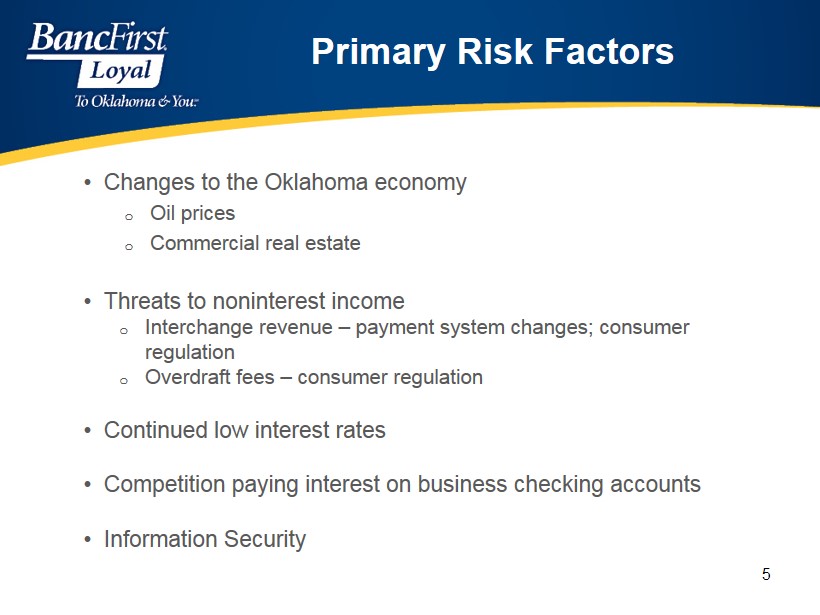
Primary Risk Factors • Changes to the Oklahoma economy o Oil prices o Commercial real estate • Threats to noninterest income o Interchange revenue – payment system changes; consumer regulation o Overdraft fees – consumer regulation • Continued low interest rates • Competition paying interest on business checking accounts • Information Security 5
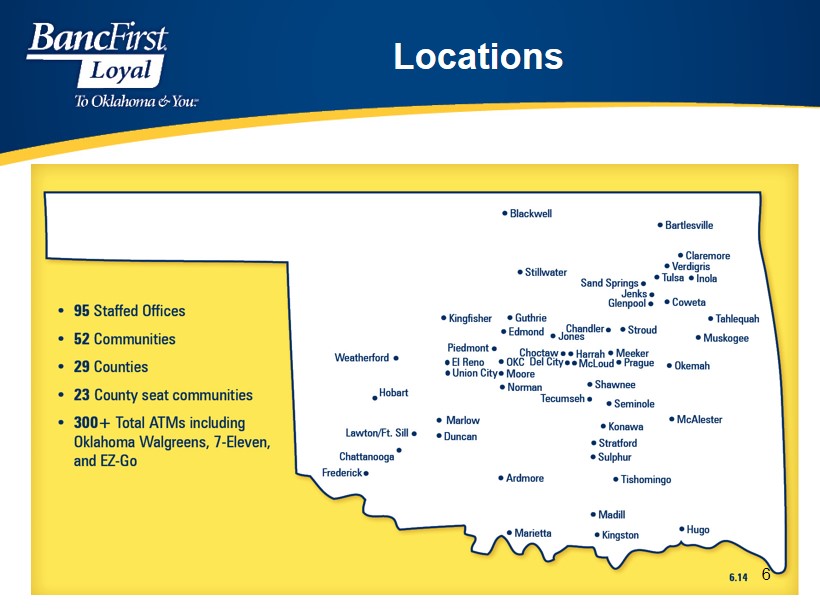
Locations 6
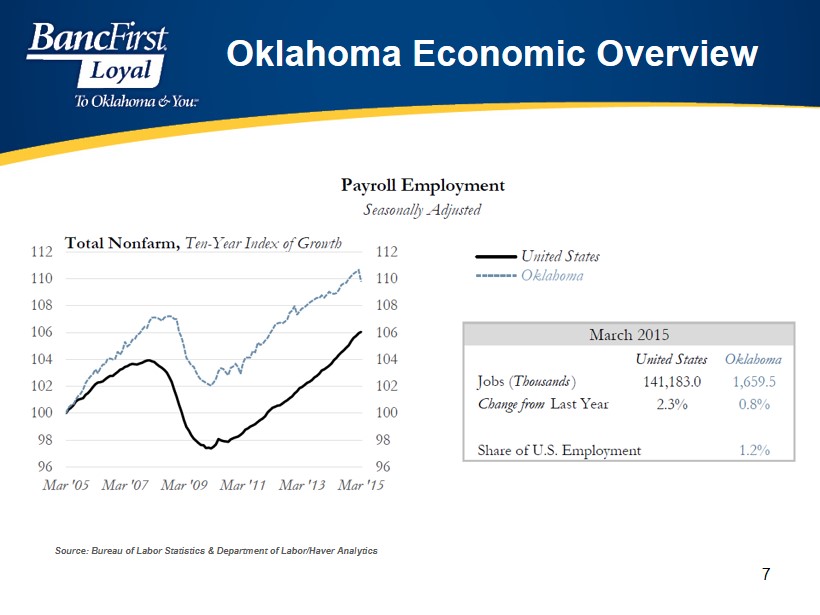
Oklahoma Economic Overview Source: Bureau of Labor Statistics & Department of Labor/ Haver Analytics 7
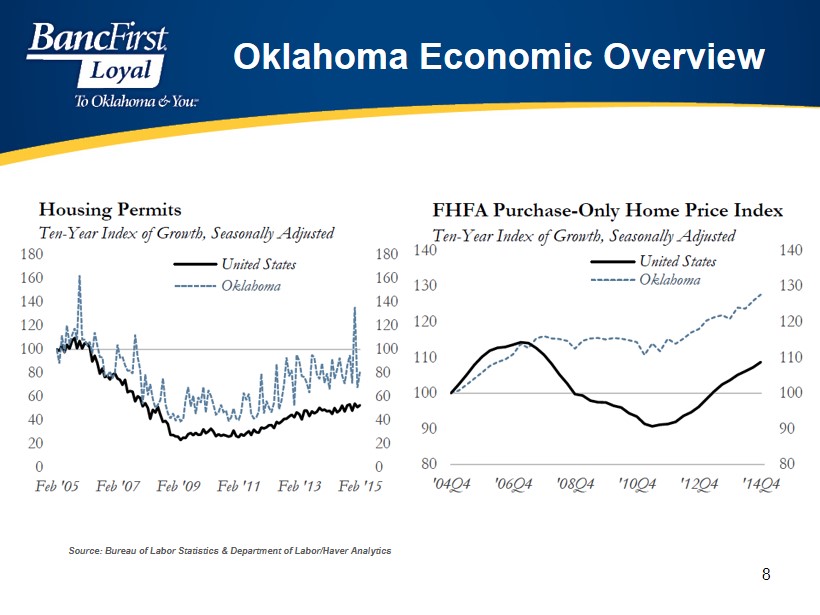
Oklahoma Economic Overview Source: Bureau of Labor Statistics & Department of Labor/ Haver Analytics 8
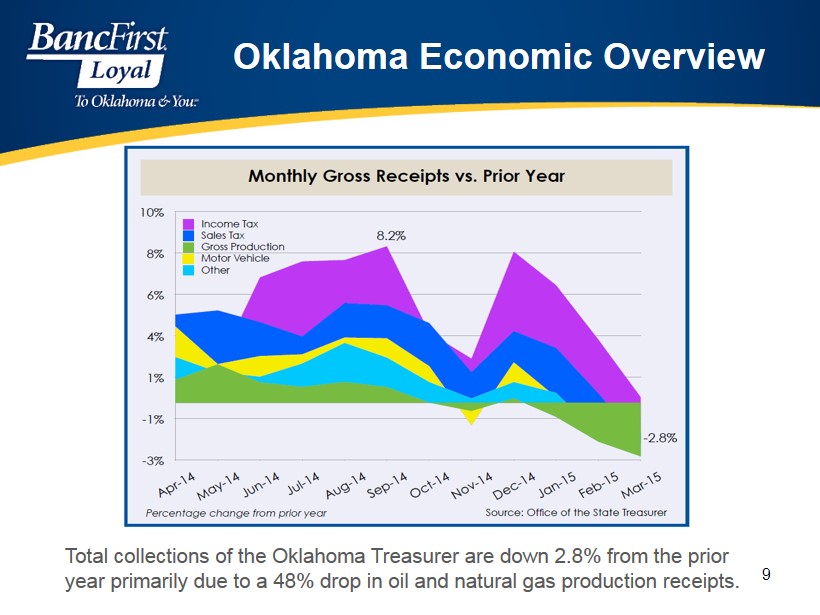
Oklahoma Economic Overview 9 Total collections of the Oklahoma Treasurer are down 2.8% from the prior year primarily due to a 48% drop in oil and natural gas production receipts.
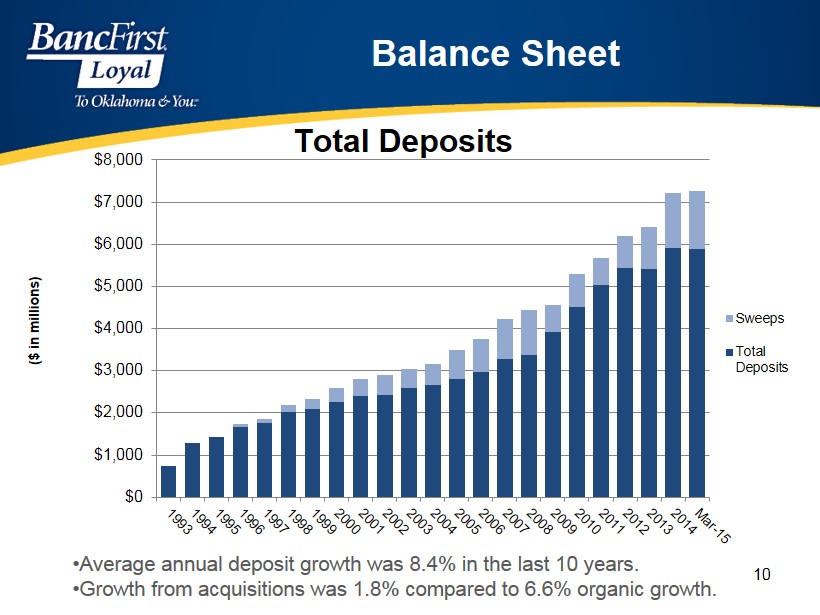
Total Deposits $0 $1,000 $2,000 $3,000 $4,000 $5,000 $6,000 $7,000 $8,000 Sweeps Total Deposits Balance Sheet • Average annual deposit growth was 8.4% in the last 10 years. • Growth from acquisitions was 1.8% compared to 6.6% organic growth. ($ in millions) 10
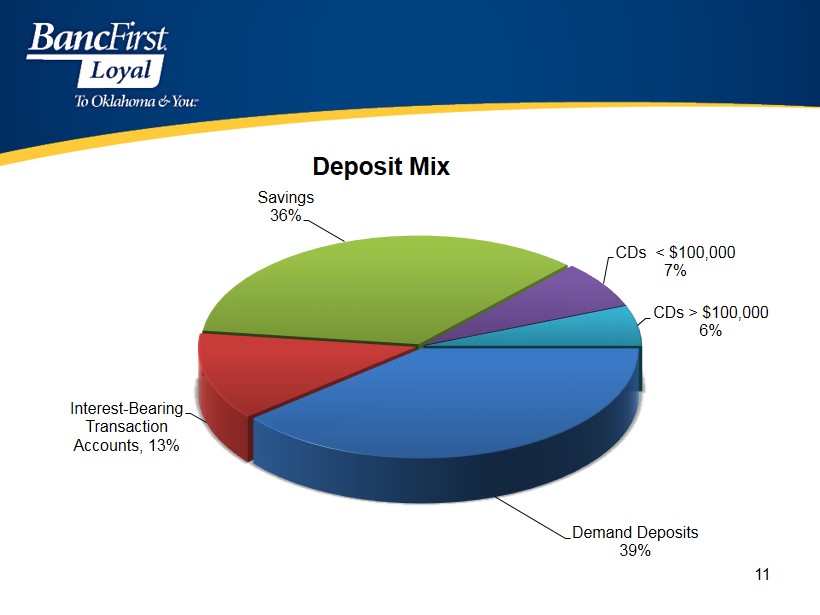
Demand Deposits 39% Interest - Bearing Transaction Accounts, 13% Savings 36% CDs < $100,000 7% CDs > $100,000 6% Deposit Mix 11
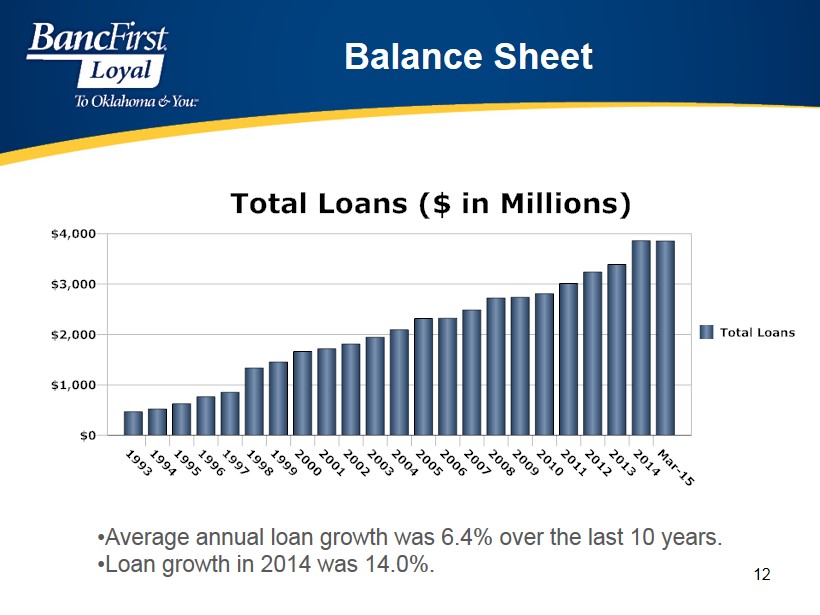
Balance Sheet • Average annual loan growth was 6.4% over the last 10 years. • Loan growth in 2014 was 14.0%. Total Loans ($ in Millions) Total Loans 1 9 9 3 1 9 9 4 1 9 9 5 1 9 9 6 1 9 9 7 1 9 9 8 1 9 9 9 2 0 0 0 2 0 0 1 2 0 0 2 2 0 0 3 2 0 0 4 2 0 0 5 2 0 0 6 2 0 0 7 2 0 0 8 2 0 0 9 2 0 1 0 2 0 1 1 2 0 1 2 2 0 1 3 2 0 1 4 M a r - 1 5 $0 $1,000 $2,000 $3,000 $4,000 12
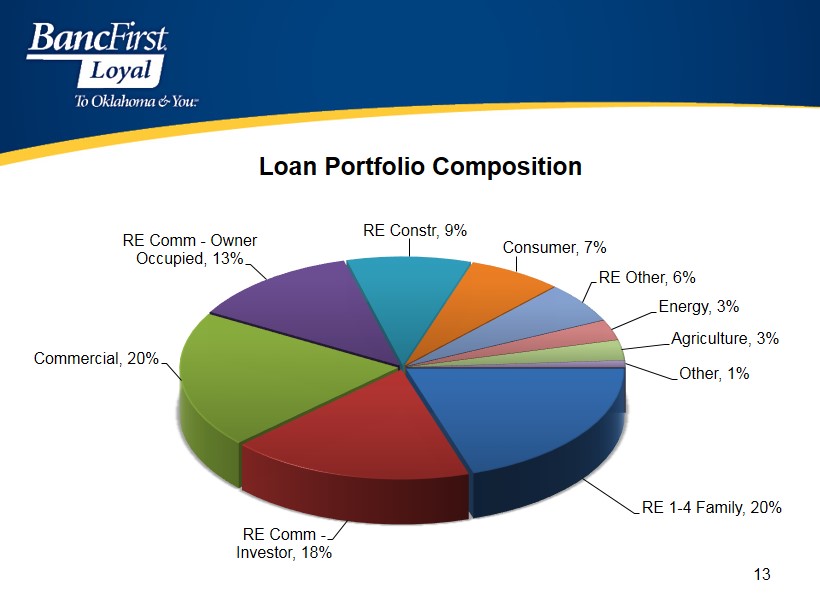
RE 1 - 4 Family , 20% RE Comm - Investor , 18% Commercial , 20% RE Comm - Owner Occupied , 13% RE Constr , 9% Consumer , 7% RE Other , 6% Energy , 3% Agriculture , 3% Other , 1% Loan Portfolio Composition 13
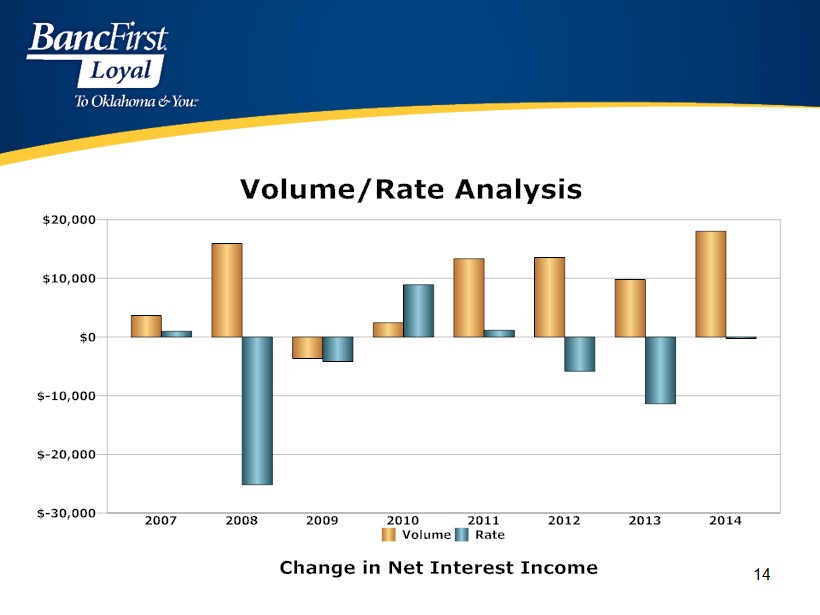
Volume/Rate Analysis Volume Rate 2007 2008 2009 2010 2011 2012 2013 2014 $-30,000 $-20,000 $-10,000 $0 $10,000 $20,000 Change in Net Interest Income 14

FDIC Insured Institutions: Nonperforming Assets to Total Assets US OK BANF 2007 2008 2009 2010 2011 2012 2013 2014 0% 1% 2% 3% 4% 5% 15
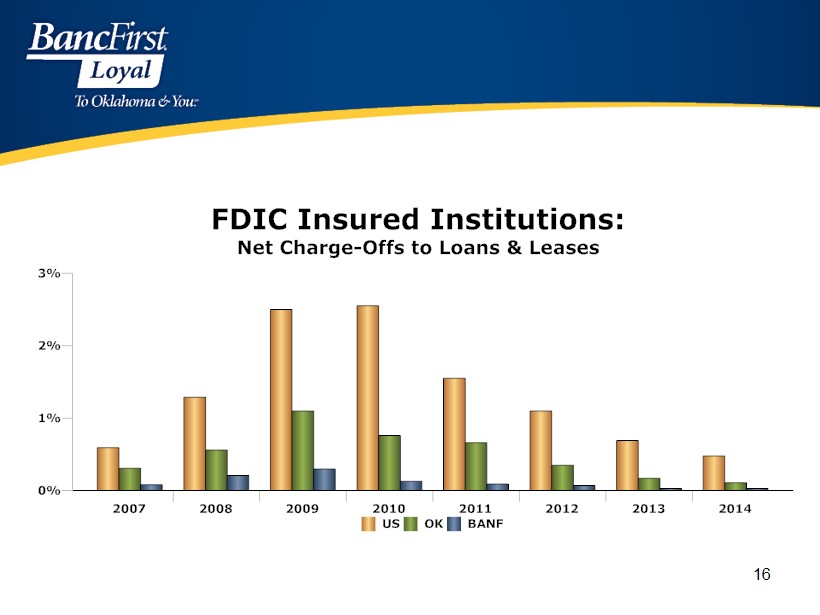
FDIC Insured Institutions: Net Charge-Offs to Loans & Leases US OK BANF 2007 2008 2009 2010 2011 2012 2013 2014 0% 1% 2% 3% 16
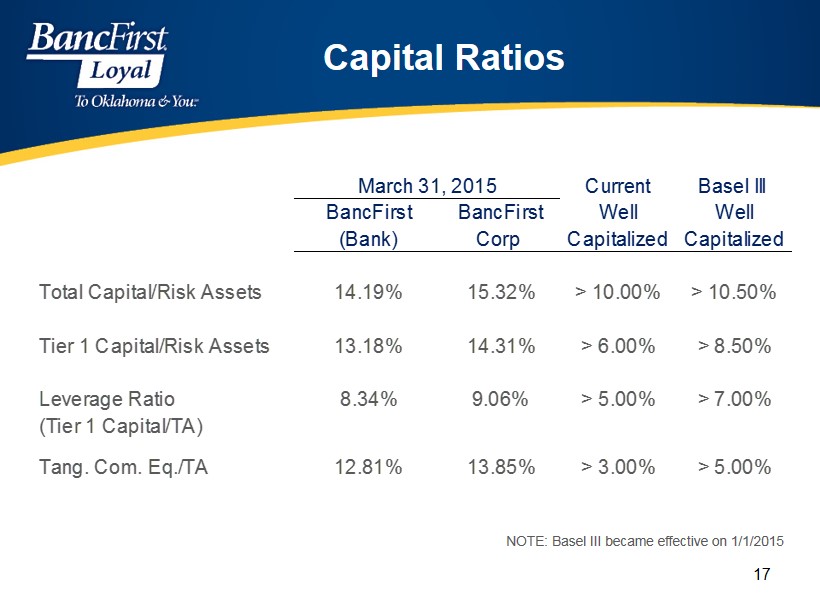
Current Basel III BancFirst BancFirst Well Well (Bank) Corp Capitalized Capitalized Total Capital/Risk Assets 14.19% 15.32% > 10.00% > 10.50% Tier 1 Capital/Risk Assets 13.18% 14.31% > 6.00% > 8.50% Leverage Ratio 8.34% 9.06% > 5.00% > 7.00% (Tier 1 Capital/TA) Tang. Com. Eq./TA 12.81% 13.85% > 3.00% > 5.00% March 31, 2015 NOTE: Basel III became effective on 1/1/2015 Capital Ratios 17
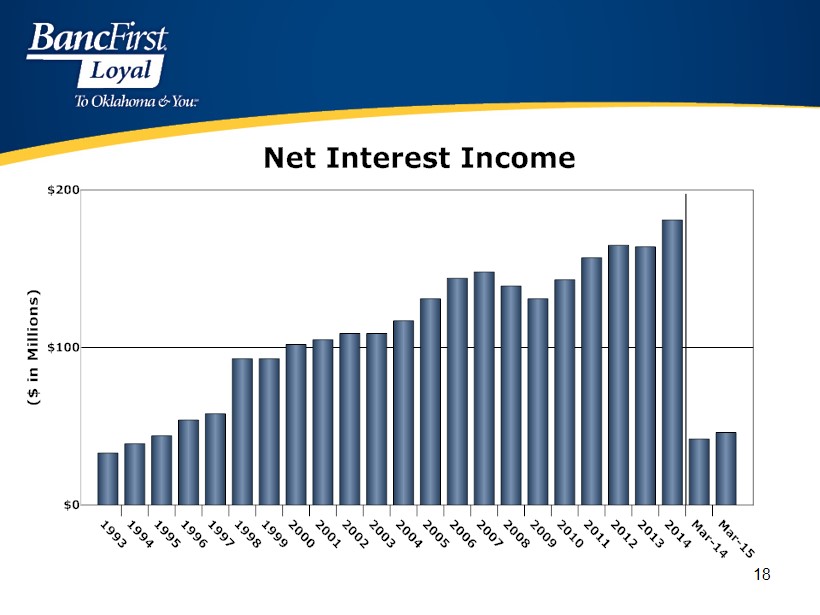
Net Interest Income 1 9 9 3 1 9 9 4 1 9 9 5 1 9 9 6 1 9 9 7 1 9 9 8 1 9 9 9 2 0 0 0 2 0 0 1 2 0 0 2 2 0 0 3 2 0 0 4 2 0 0 5 2 0 0 6 2 0 0 7 2 0 0 8 2 0 0 9 2 0 1 0 2 0 1 1 2 0 1 2 2 0 1 3 2 0 1 4 M a r - 1 4 M a r - 1 5 $0 $100 $200 ( $ i n M i l l i o n s ) 18
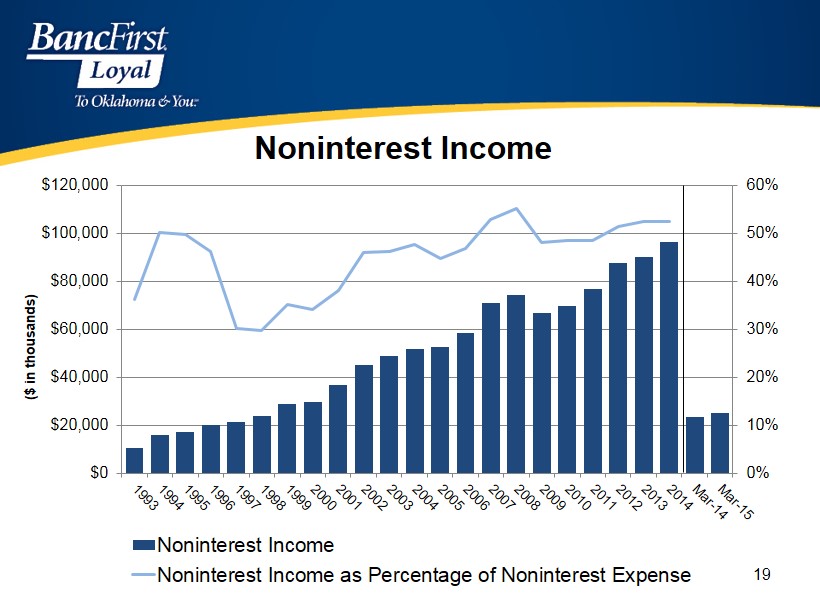
Noninterest Income 0% 10% 20% 30% 40% 50% 60% $0 $20,000 $40,000 $60,000 $80,000 $100,000 $120,000 Noninterest Income Noninterest Income as Percentage of Noninterest Expense ($ in thousands) 19
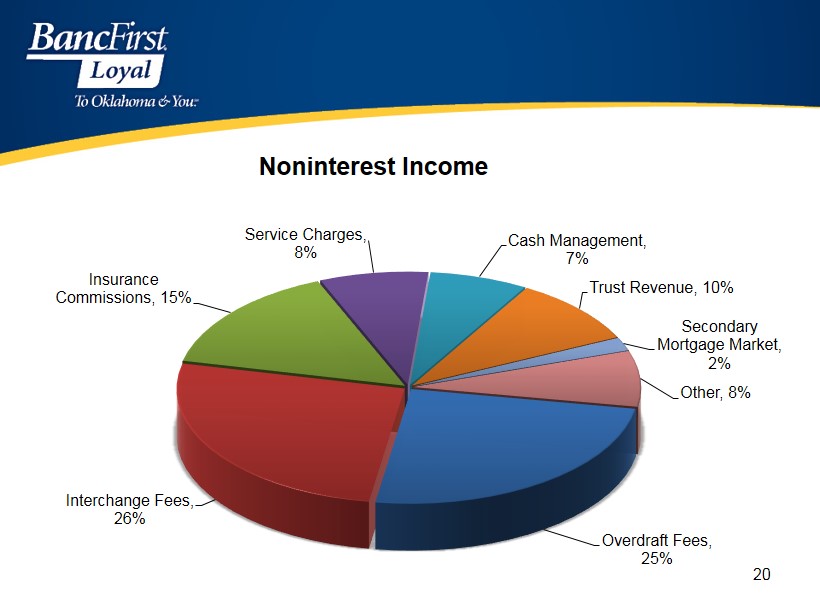
Overdraft Fees , 25% Interchange Fees, 26% Insurance Commissions , 15% Service Charges , 8% Cash Management , 7% Trust Revenue , 10% Secondary Mortgage Market , 2% Other , 8% Noninterest Income 20
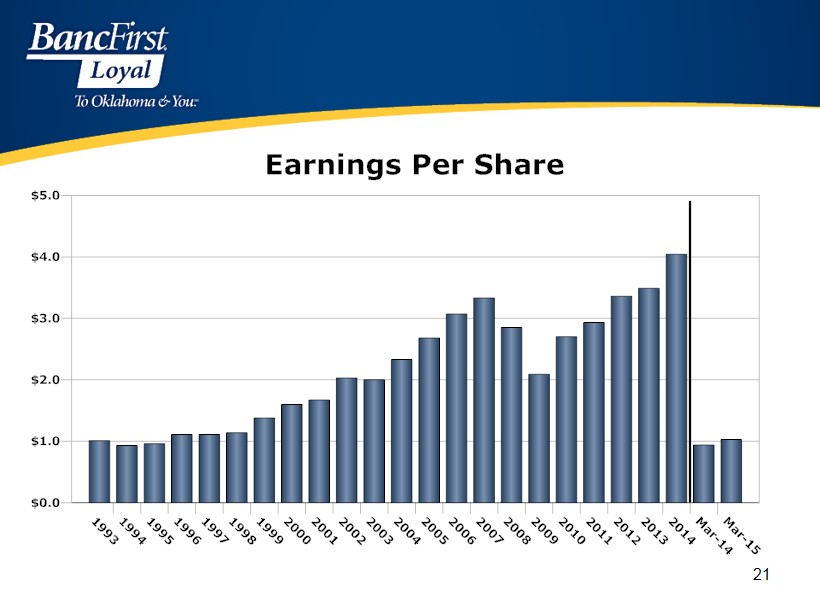
Earnings Per Share 1 9 9 3 1 9 9 4 1 9 9 5 1 9 9 6 1 9 9 7 1 9 9 8 1 9 9 9 2 0 0 0 2 0 0 1 2 0 0 2 2 0 0 3 2 0 0 4 2 0 0 5 2 0 0 6 2 0 0 7 2 0 0 8 2 0 0 9 2 0 1 0 2 0 1 1 2 0 1 2 2 0 1 3 2 0 1 4 M a r - 1 4 M a r - 1 5 $0.0 $1.0 $2.0 $3.0 $4.0 $5.0 21
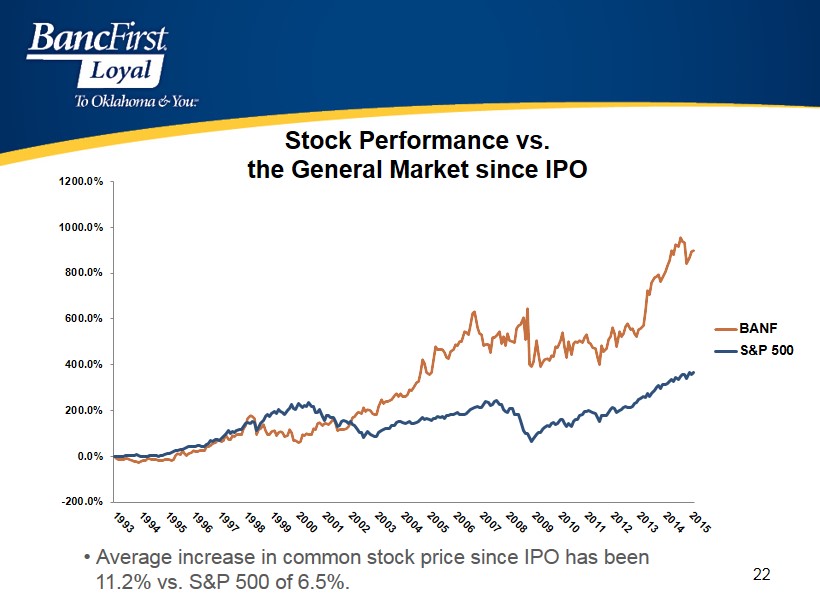
• Average increase in common stock price since IPO has been 11.2% vs. S&P 500 of 6.5%. -200.0% 0.0% 200.0% 400.0% 600.0% 800.0% 1000.0% 1200.0% BANF S&P 500 Stock Performance vs. the General Market since IPO 22
Summary • Sustained asset quality • Strong capital • Sound relationships with both household and commercial customers • Exceptional liquidity; high level of core deposit funding; modest rate risk • Emphasis on non - interest income • Invested management • Acquisition/conversion expertise 23
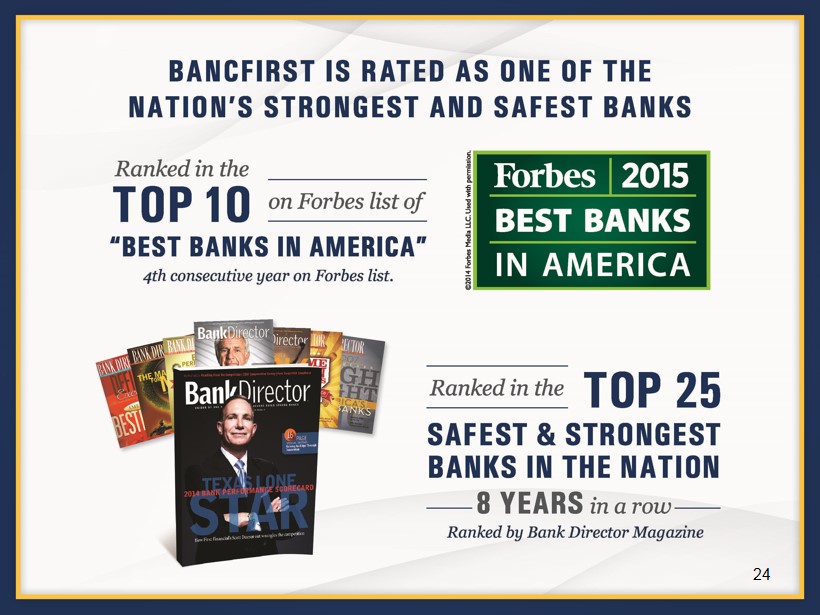
One of America’s Strongest Banks 24
Forward - Looking Statements This presentation contains forward - looking statements within the meaning of Section 27A of the Securities Act of 1933 and Section 21E of the Securities Exchange Act of 1934 with respect to earnings and other financial information, corporate objectives, and other business matters. Forward - looking statements include estimates and give our current expectations or forecasts of future events. These forward - looking statements are subject to numerous assumptions, risks and uncertainties. Actual results may differ materially. These risks and other factors are described more fully in the Company’s Annual Report on Form 10 - K for 2014 and other filings with the Securities and Exchange Commission. 25