EXHIBIT 99.1

BancFirst Corporation Financial Holding Company Super Community Bank Insurance Agency Total Assets: $5.77 billion Total Equity: $528 million 1,700+ Employees Largest State Chartered Bank in Oklahoma Symbol BANF on NASDAQ Global Select
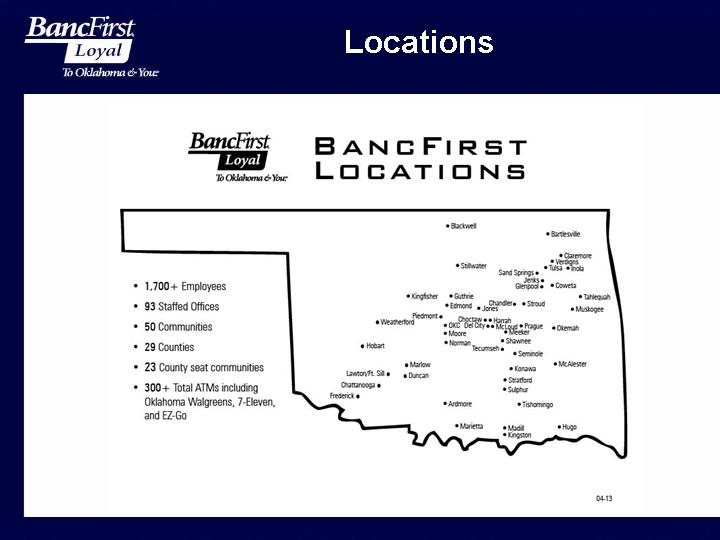
Locations
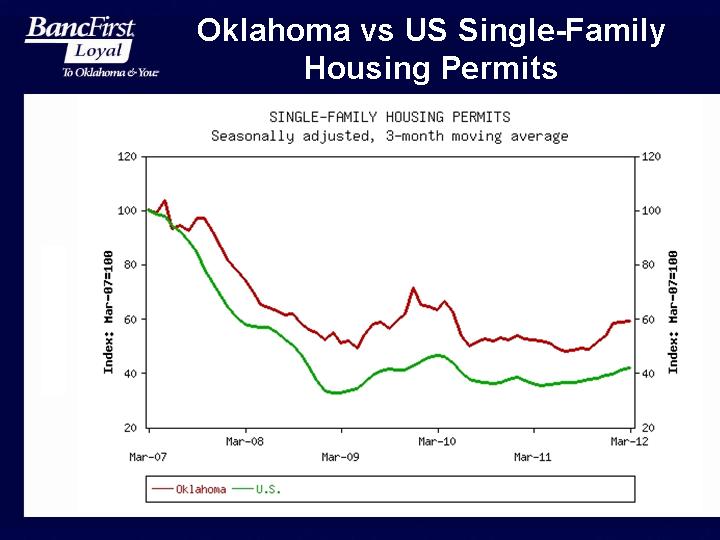
Oklahoma vs US Single-Family Housing Permits Bureau
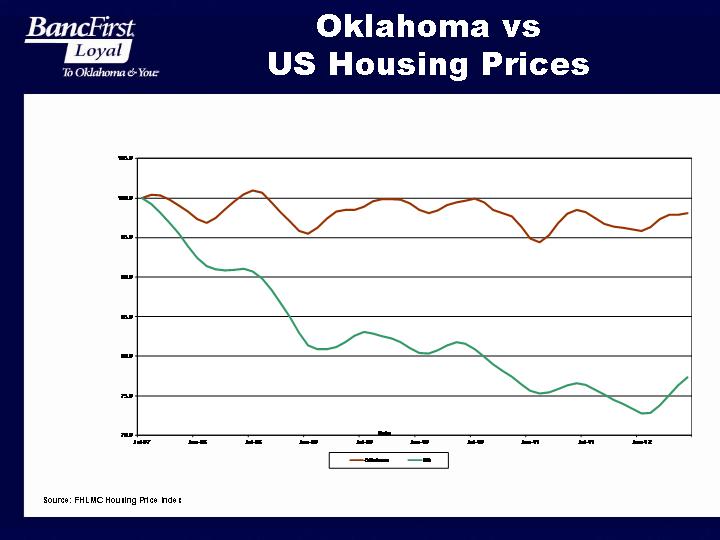
Oklahoma vs US Housing Prices Source: FHLMC Housing Price Index
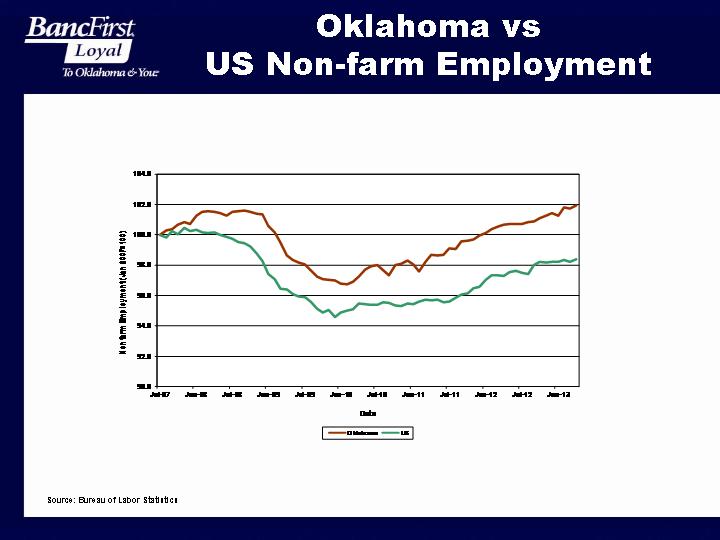
Oklahoma vs US Non-farm Employment Source: Bureau of Labor Statistics
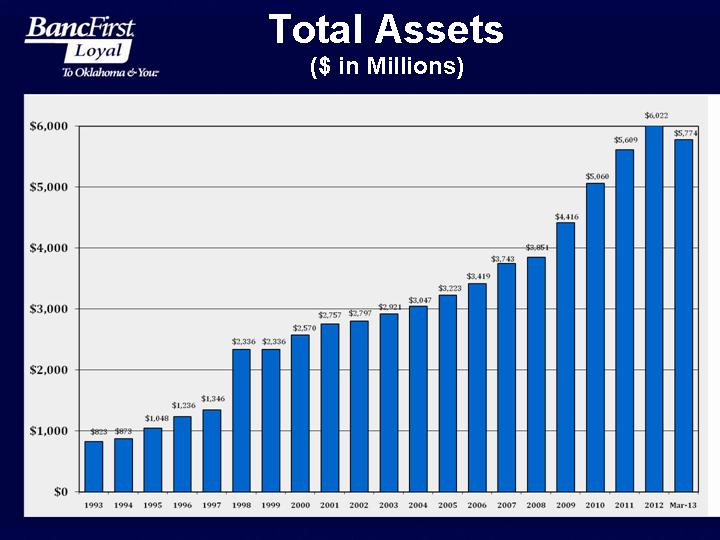
Total Assets ($ in Millions)
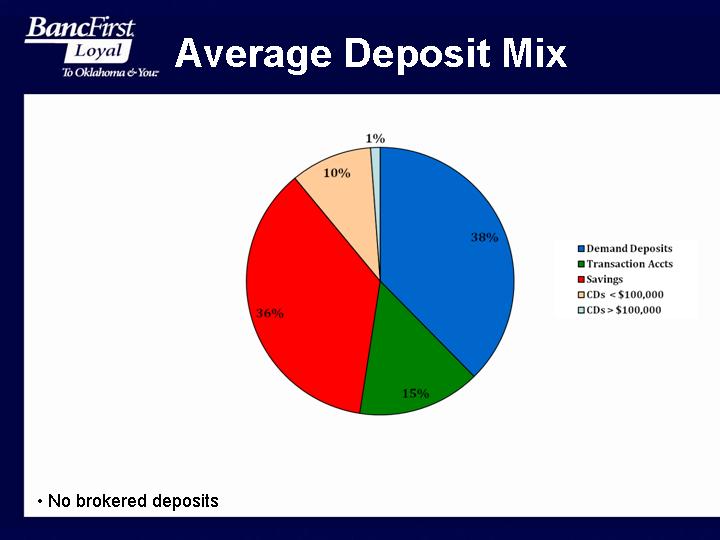
Average Deposit Mix No brokered deposits
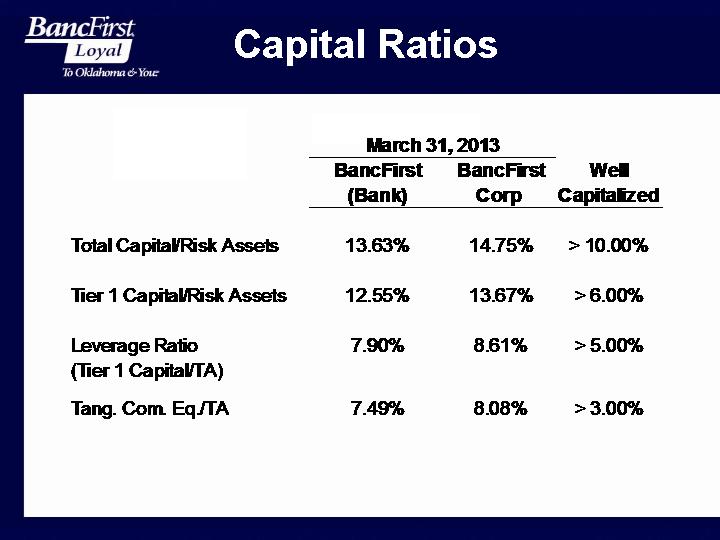
Capital Ratios
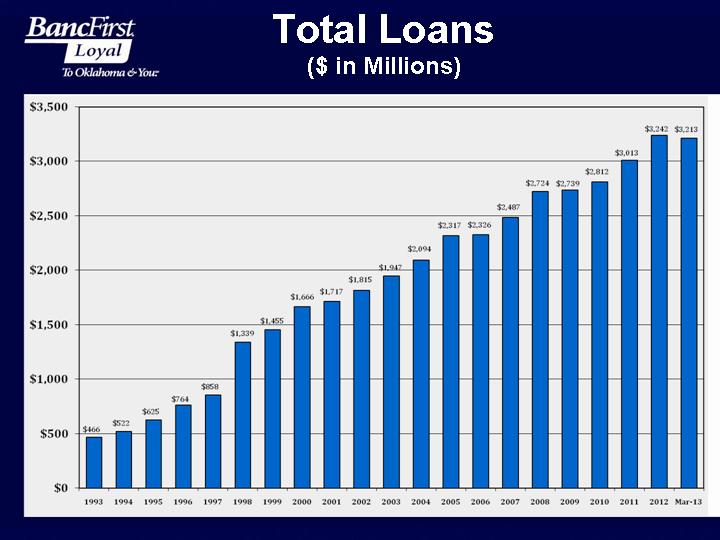
Total Loans ($ in Millions)
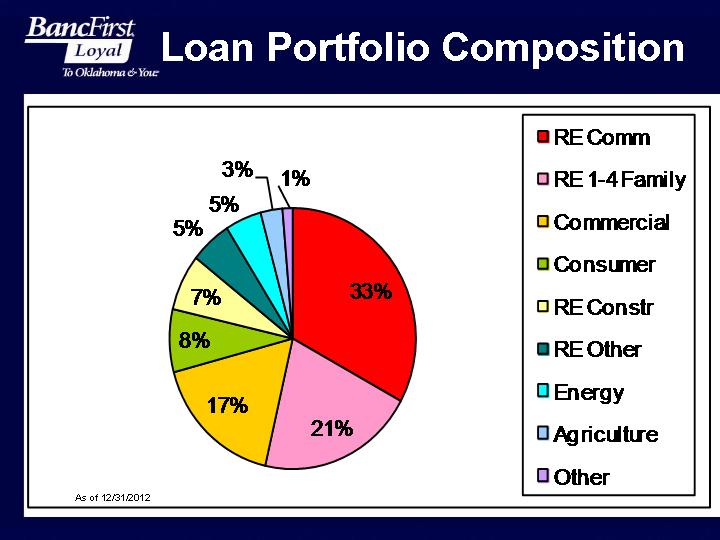
Loan Portfolio Composition As of 12/31/2012
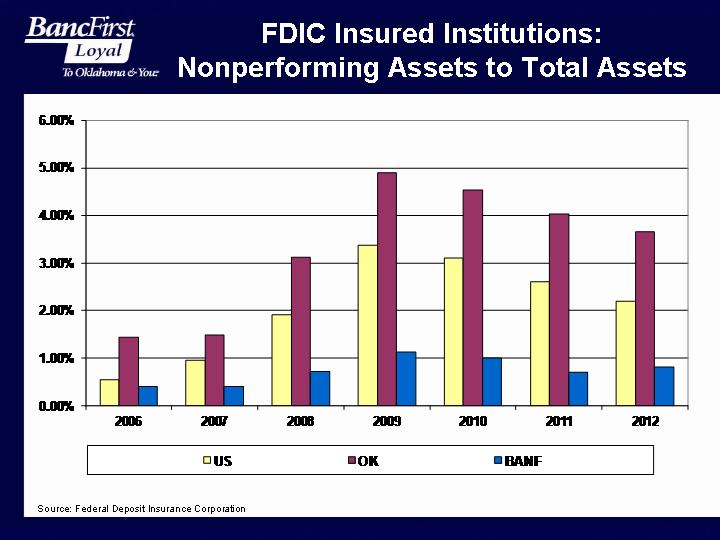
Source: Federal Deposit Insurance Corporation FDIC Insured Institutions: Nonperforming Assets to Total Assets
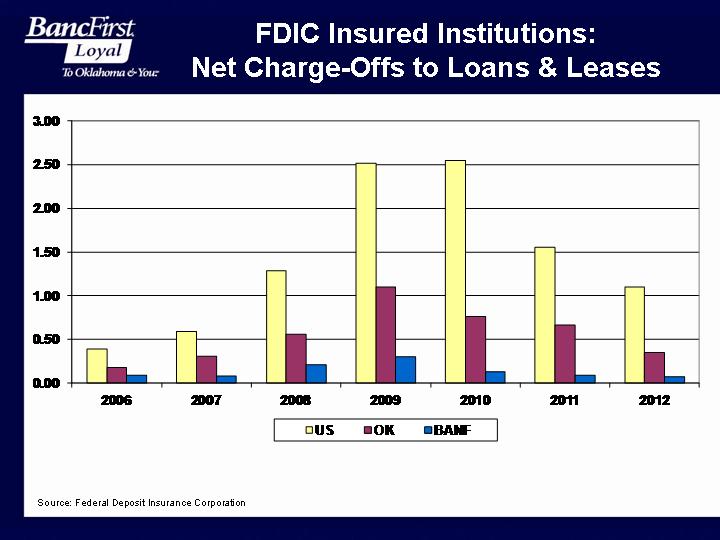
FDIC Insured Institutions: Net Charge-Offs to Loans & Leases Source: Federal Deposit Insurance Corporation
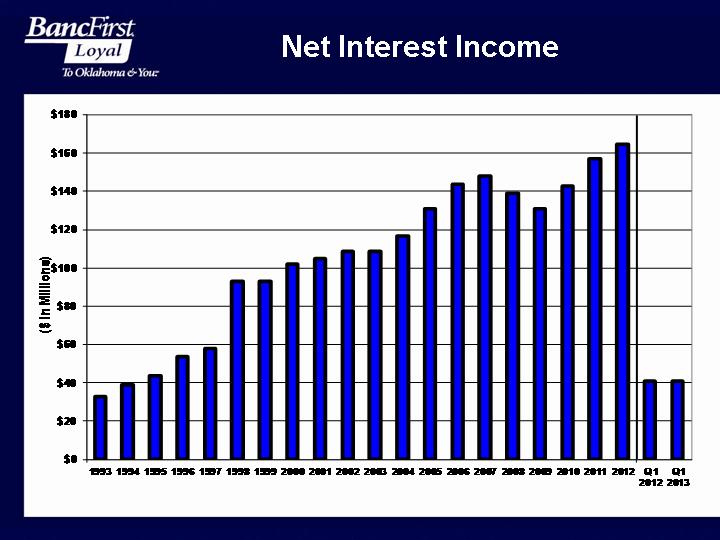
Net Interest Income
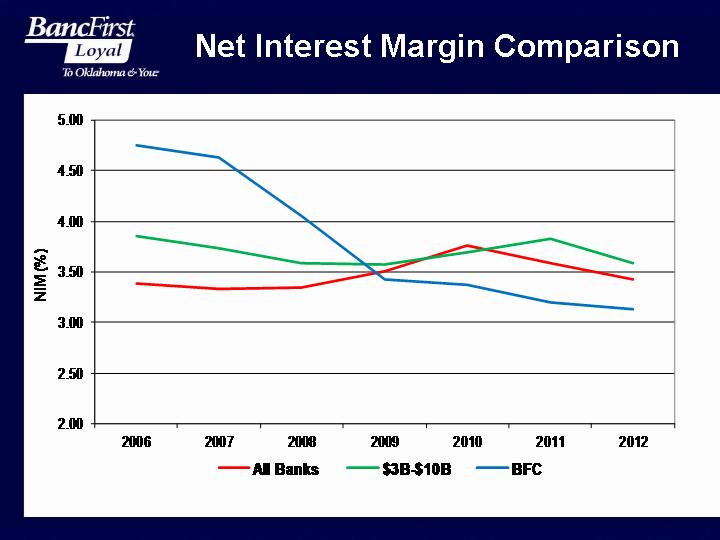
Net Interest Margin Comparison
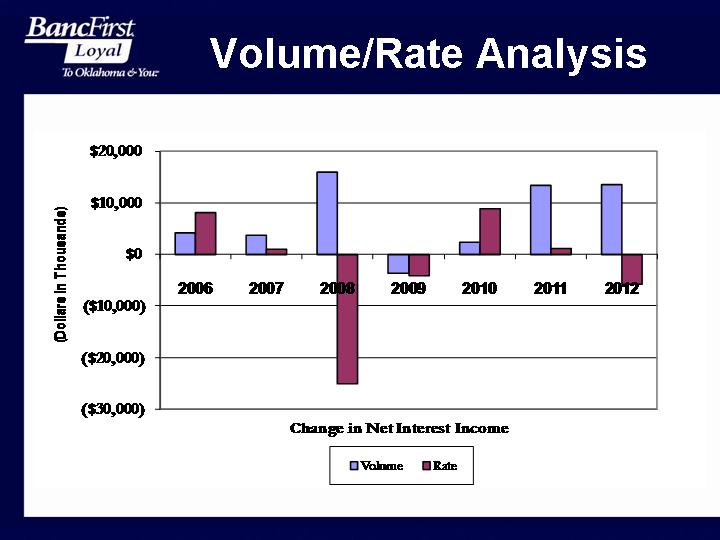
Volume/Rate Analysis
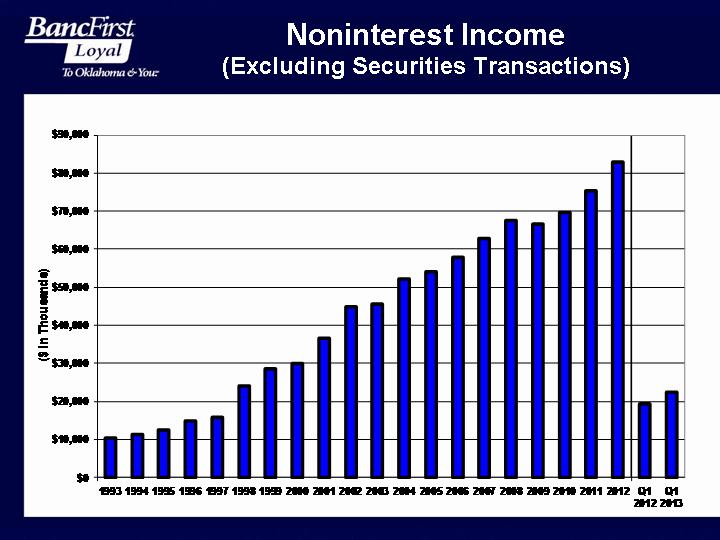
Noninterest Income (Excluding Securities Transactions)
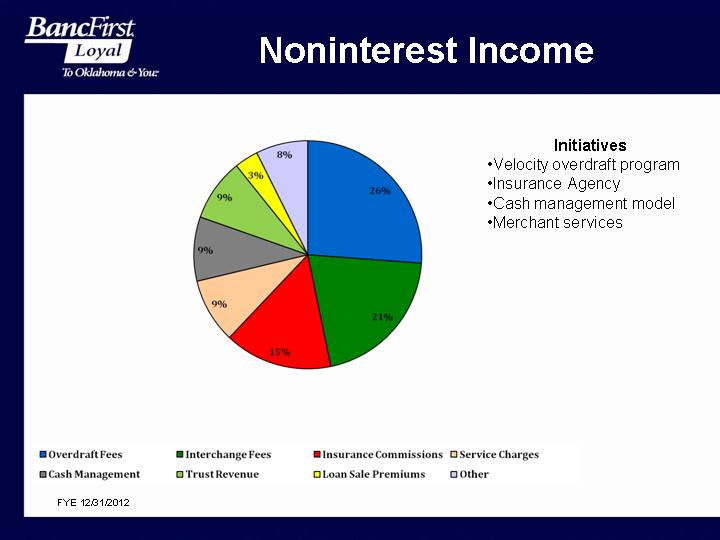
Noninterest Income FYE 12/31/2012 Initiatives Velocity overdraft program Insurance Agency Cash management model Merchant services
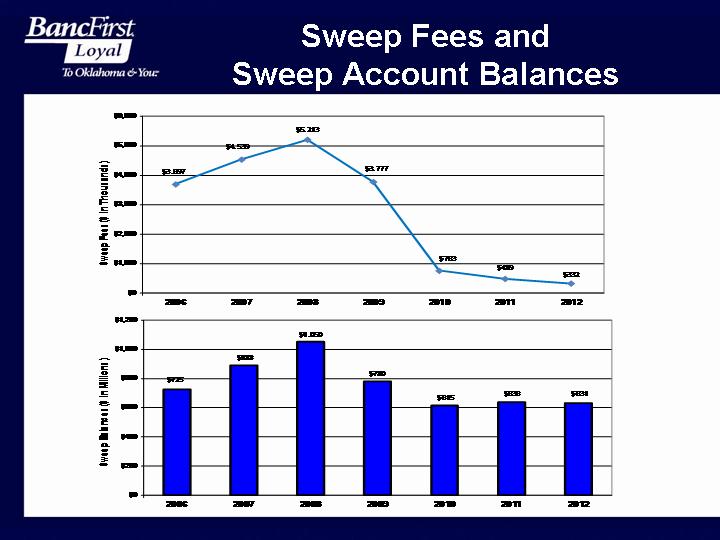
Sweep Fees and Sweep Account Balances
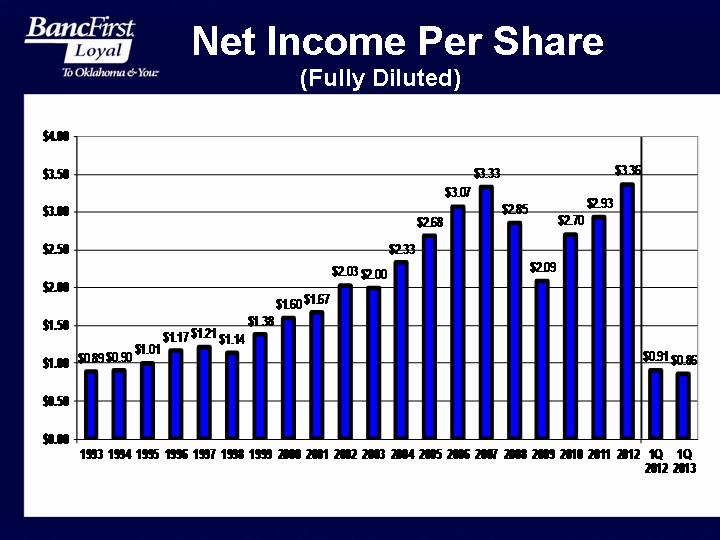
Net Income Per Share (Fully Diluted)
Mergers and Acquisitions Community Profile Population of 5,000 or more residents Institution of Higher Learning Diversified Employment Base Reasonable Market Share Compatible Culture Reasonable Growth
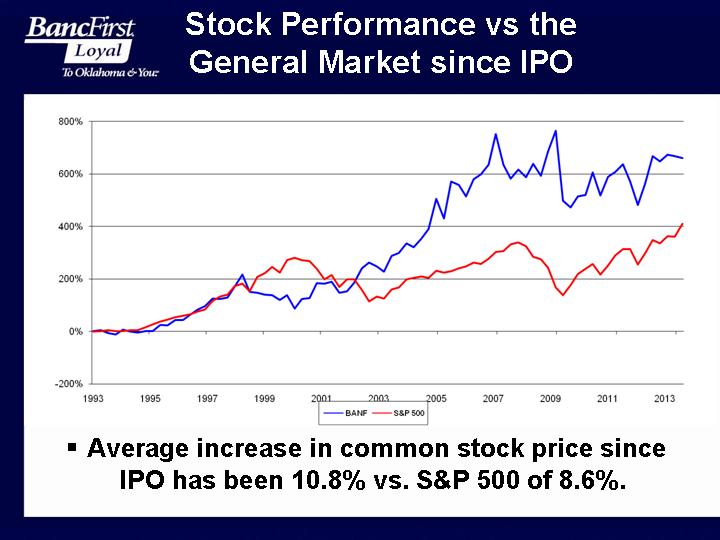
Stock Performance vs the General Market since IPO Average increase in common stock price since IPO has been 10.8% vs. S&P 500 of 8.6%.
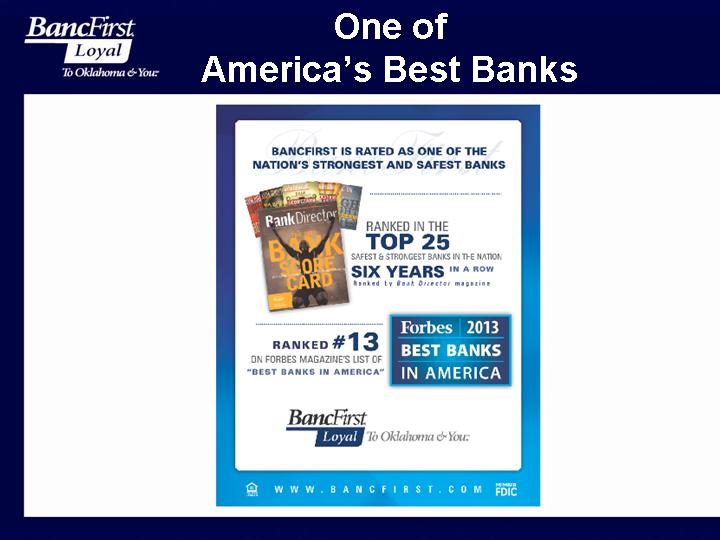
One of America’s Best Banks
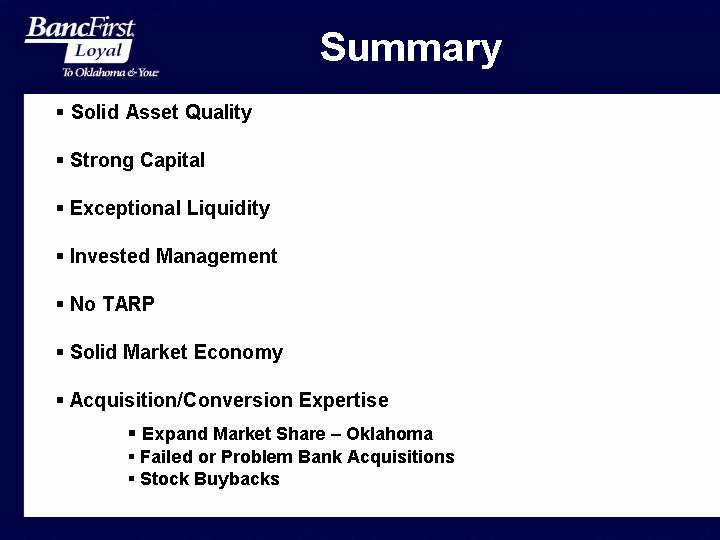
Summary Solid Asset Quality Strong Capital Exceptional Liquidity Invested Management No TARP Solid Market Economy Acquisition/Conversion Expertise Expand Market Share – Oklahoma Failed or Problem Bank Acquisitions Stock Buybacks
Forward-Looking Statements This presentation contains forward-looking statements within the meaning of Section 27A of the Securities Act of 1933 and Section 21E of the Securities Exchange Act of 1934 with respect to earnings and other financial information, corporate objectives, and other business matters. Forward-looking statements include estimates and give our current expectations or forecasts of future events. These forward-looking statements are subject to numerous assumptions, risks and uncertainties. Actual results may differ materially. These risks and other factors are described more fully in the Company’s Annual Report on Form 10-K for 2012 and other filings with the Securities and Exchange Commission.