UNITED STATES
SECURITIES AND EXCHANGE COMMISSION
Washington, D.C. 20549
FORM N-CSR
CERTIFIED SHAREHOLDER REPORT OF REGISTERED MANAGEMENT
INVESTMENT COMPANIES
Investment Company Act file number 811- 4215
Dreyfus Premier GNMA Fund, Inc.
- Dreyfus GNMA Fund
(Exact name of Registrant as specified in charter)
c/o The Dreyfus Corporation
200 Park Avenue
New York, New York 10166
(Address of principal executive offices) (Zip code)
Michael A. Rosenberg, Esq.
200 Park Avenue
New York, New York 10166
(Name and address of agent for service)
| | |
| Registrant's telephone number, including area code: | (212) 922-6000 |
| Date of fiscal year end: | 4/30 | |
| Date of reporting period: | 4/30/2010 | |
FORM N-CSR
Item 1. Reports to Stockholders.
Save time. Save paper. View your next shareholder report online as soon as it’s available. Log into www.dreyfus.com and sign up for Dreyfus eCommunications. It’s simple and only takes a few minutes.
The views expressed in this report reflect those of the portfolio manager only through the end of the period covered and do not necessarily represent the views of Dreyfus or any other person in the Dreyfus organization. Any such views are subject to change at any time based upon market or other conditions and Dreyfus disclaims any responsibility to update such views.These views may not be relied on as investment advice and, because investment decisions for a Dreyfus fund are based on numerous factors, may not be relied on as an indication of trading intent on behalf of any Dreyfus fund.
Not FDIC-Insured • Not Bank-Guaranteed • May Lose Value
| | Contents |
| | THE FUND |
| 2 | A Letter from the Chairman and CEO |
| 3 | Discussion of Fund Performance |
| 6 | Fund Performance |
| 8 | Understanding Your Fund’s Expenses |
| 8 | Comparing Your Fund’s Expenses With Those of Other Funds |
| 9 | Statement of Investments |
| 13 | Statement of Options Written |
| 14 | Statement of Assets and Liabilities |
| 15 | Statement of Operations |
| 16 | Statement of Changes in Net Assets |
| 18 | Financial Highlights |
| 22 | Notes to Financial Statements |
| 36 | Report of Independent Registered Public Accounting Firm |
| 37 | Important Tax Information |
| 38 | Information About the Review and Approval of the Fund’s Management Agreement |
| 44 | Board Members Information |
| 47 | Officers of the Fund |
| | FOR MORE INFORMATION |
| | Back Cover |
Dreyfus
GNMA Fund
The Fund

A LETTER FROM THE CHAIRMAN AND CEO
Dear Shareholder:
We are pleased to present this annual report for Dreyfus GNMA Fund, covering the 12-month period from May 1, 2009, through April 30, 2010.
Fixed-income performance continued to favor higher yield over the reporting period as the global economic recovery made headway. Higher-yielding segments of the world and domestic bond markets, such as emerging market sovereign debt and high yield corporate securities, ranked among the global fixed income leaders. In contrast, higher-quality sovereign securities, namely U.S Treasuries, experienced heightened volatility as a result of continued credit crises overseas but posted moderately positive to negative results for the reporting period as investors sought more than principal protection from their investments.
We believe that a long-term, well-balanced asset allocation strategy including a consideration for fixed income instruments outside of the U.S. can help cushion the volatility of the overall global financial markets. If you have not revisited your investment portfolio after the recent market events, we urge you to speak with your financial advisor about positioning your portfolio to better respond to long-term market fundamentals rather than lie susceptible to short-term market technicals.
For information about how the fund performed during the reporting period, as well as general market perspectives, we have provided a Discussion of Fund Performance.
Thank you for your continued confidence and support.
Jonathan R. Baum
Chairman and Chief Executive Officer
The Dreyfus Corporation
May 17, 2010
2

DISCUSSION OF FUND PERFORMANCE
For the period of May 1, 2009, through April 30, 2010, as provided by Robert M. Bayston, Portfolio Manager
Fund and Market Performance Overview
For the 12-month period ended April 30, 2010, Class A, B, C and Z shares of Dreyfus GNMA Fund produced a total return of 5.96%, 5.21%, 5.24% and 6.13%, respectively.1 In comparison, the fund’s benchmark, the Barclays Capital GNMA Index (the “Index”), achieved a total return of 5.60% for the same period.2
Mortgage-backed securities generally rallied during the reporting period as an economic recovery gained traction, credit markets improved and the Federal Reserve Board (the “Fed”) and U.S. government supported the market with massive purchases of securities from U.S. government agencies, including Ginnie Mae.While these factors helped the fund’s absolute returns, we attribute the fund’s relative performance to our coupon selection strategy.
The Fund’s Investment Approach
The fund seeks to maximize total return, consisting of capital appreciation and current income. To pursue this goal, the fund invests at least 80% of its assets in Government National Mortgage Association (“GNMA”or“Ginnie Mae”) securities.The remainder may be allocated to other mortgage-related securities, including U.S. government agency securities and privately issued mortgage-backed securities, as well as to asset-backed securities, U.S.Treasuries and repurchase agreements.
Economic Recovery, Government Intervention Supported Mortgage Market
Higher yielding sectors of the U.S. bond market generally rallied over the reporting period as an economic recovery gradually gained trac-tion.The rebound was led by some of the riskier segments of the bond market, including high yield corporate bonds and emerging-markets debt. In contrast, more creditworthy market segments either posted less robust total returns or, in the case of U.S.Treasury securities, gave back some of their previous gains. Mortgage-backed securities from
The Fund 3
DISCUSSION OF FUND PERFORMANCE (continued)
U.S. government agencies fared better than Treasuries but trailed their corporate-backed counterparts.
Indeed, mortgage-backed securities suffered heightened volatility early in the reporting period when prepayment rates declined more sharply than expected despite involuntary prepayments stemming from defaults. Historically low short-term interest rates from the Fed were intended to encourage bank lending, but financially stressed homeowners found few financial institutions willing to refinance their mortgages. Lower-than-expected prepayment rates effectively extended the durations of mortgage-backed securities, causing yields to rise and prices to fall.
In an attempt to address this and other issues affecting the mortgage market, the Fed purchased approximately $1.25 trillion of mortgage-backed securities on the open market, thereby boosting market liquidity and providing needed price support.These efforts proved successful in calming the market, and mortgage-backed securities subsequently traded in a relatively narrow range as interest-rates remained steady and implied volatility declined. The purchasing program remained in force through most of the reporting period before ending on the last day of March 2010. Although valuations of mortgage-backed securities generally fell when the support program ended, the transition was orderly, and the market soon stabilized.
Coupon Selection Strategy Bolstered Fund Returns
In this environment, we initially focused on lower-coupon mortgages that we believed would benefit the most from the Fed’s purchase program, which focused in its early stages on lower-coupon mortgages.As these securities reached richer valuations, we gradually shifted the fund’s focus to incrementally higher coupons. The purchase program did likewise: when the supply of lower coupon mortgages waned, the Fed moved on to securities with higher coupons.
In addition, the fund benefited from its holdings of conventional collateral, including mortgage-backed securities from Fannie Mae and Freddie Mac. Sales of put and call options also helped bolster the fund’s results at times during the reporting period.
We set the fund’s average duration in a range between neutral to slightly longer than industry averages. This strategy detracted mildly
4
from the fund’s relative performance during bouts of heightened market volatility.
After the Rally, a More Cautious Investment Posture
In anticipation of the end of the Fed’s purchasing program, we reduced the fund’s holdings of Agency mortgage pass-through securities in favor of U.S. Treasury securities, helping to cushion the effects of heightened volatility when the program ended. In addition, while the economic recovery has progressed, inflationary pressures have not intensified, and the Fed appears likely to hold short-term interest rates at today’s low levels for some time to come.Therefore, we expect market volatility to remain relatively muted, and in the weeks and months ahead we expect to redeploy assets from U.S. Treasury securities to GNMA mortgage-backed securities.
May 17, 2010
| |
| | Bond funds are subject generally to interest rate, credit, liquidity and market risks, to varying |
| | degrees, all of which are more fully described in the fund's prospectus. Generally, all other factors |
| | being equal, bond prices are inversely related to interest-rate changes and rate increases can cause |
| | price declines. |
| | The fund may, but is not required to, use derivative instruments, such as options, futures and |
| | options on futures, forward contracts, swaps (including credit default swaps on corporate bonds and |
| | asset-backed securities), options on swaps, and other credit derivatives. A small investment in |
| | derivatives could have a potentially large impact on the fund’s performance.The use of derivatives |
| | involves risks different from, or possibly greater than, the risks associated with investing directly in |
| | the underlying assets. |
| 1 | Total return includes reinvestment of dividends and any capital gains paid, and does not take into |
| | consideration the maximum initial sales charge in the case of Class A shares, or the applicable |
| | contingent deferred sales charges imposed on redemptions in the case of Class B and Class C |
| | shares. Had these charges been reflected, returns would have been lower. Class Z is not subject to |
| | any initial or deferred sales charge. Past performance is no guarantee of future results. Share price, |
| | yield and investment return fluctuate such that upon redemption, fund shares may be worth more |
| | or less than their original cost. Return figures provided for Class A, B and C shares reflect the |
| | absorption of certain fund expenses by The Dreyfus Corporation pursuant to an agreement in |
| | effect through November30, 2010, at which time it may be extended, modified or terminated. |
| | Had these expenses not been absorbed, the fund’s returns would have been lower. |
| 2 | SOURCE: LIPPER INC. — Reflects reinvestment of dividends and, where applicable, capital |
| | gain distributions.The Barclays Capital GNMA Index is an unmanaged, total return |
| | performance benchmark for the GNMA market consisting of 15- and 30-year fixed-rate securities |
| | backed by mortgage pools of the Government National Mortgage Association. Index returns do |
| | not reflect fees and expenses associated with operating a mutual fund. Investors cannot invest |
| | directly in any index. |
The Fund 5

|
| † Source: Lipper Inc. |
| Past performance is not predictive of future performance. |
| The above graph compares a $10,000 investment made in Class Z shares of Dreyfus GNMA Fund on 4/30/00 to a |
| $10,000 investment made in the Barclays Capital GNMA Index (the “Index”) on that date. All dividends and capital |
| gain distributions are reinvested. |
| The fund invests primarily in Ginnie Maes and its performance shown in the line graph takes into account all applicable |
| fees and expenses for Class Z shares. Performance for Class A, Class B and Class C shares will vary from the |
| performance of Class Z shares shown above due to differences in charges and expenses. Unlike the fund, the Index is an |
| unmanaged total return performance benchmark for the GNMA market, consisting of 15- and 30-year fixed-rate |
| GNMA securities. All issues have at least one year to maturity and an outstanding par value of at least $100 million. |
| These factors can contribute to the Index potentially outperforming or underperforming the fund. Unlike a mutual fund, |
| the Index is not subject to charges, fees and other expenses. Investors cannot invest directly in any index. Further |
| information relating to fund performance, including expense reimbursements, if applicable, is contained in the Financial |
| Highlights section of the prospectus and elsewhere in this report. |
6
| | | | |
| Average Annual Total Returns as of 4/30/10 | | | |
| |
| Inception |
| | Date | 1 Year | 5 Years | 10 Years |
| Class A shares | | | | |
| with maximum sales charge (4.5%) | 5/3/07 | 1.19% | 3.93%††† | 5.11%††† |
| without sales charge | 5/3/07 | 5.96% | 4.89%††† | 5.59%††† |
| Class B shares | | | | |
| with applicable redemption charge † | 5/3/07 | 1.21% | 4.14%††† | 5.59%†††,†††† |
| without redemption | 5/3/07 | 5.21% | 4.48%††† | 5.59%†††,†††† |
| Class C shares | | | | |
| with applicable redemption charge †† | 5/3/07 | 4.24% | 4.44%††† | 5.36%††† |
| without redemption | 5/3/07 | 5.24% | 4.44%††† | 5.36%††† |
| Class Z shares | 5/29/85 | 6.13% | 5.01% | 5.65% |
| Barclays Capital GNMA Index | | 5.60% | 5.91% | 6.37% |
| |
| Past performance is not predictive of future performance.The fund’s performance shown in the graph and table does not |
| reflect the deduction of taxes that a shareholder would pay on fund distributions or the redemption of fund shares. |
| † | The maximum contingent deferred sales charge for Class B shares is 4%. After six years Class B shares convert to |
| | Class A shares. |
| †† | The maximum contingent deferred sales charge for Class C shares is 1% for shares redeemed within one year of |
| | the date of purchase. |
| ††† | The total return performance figures presented for Class A, B and C shares of the fund reflect the performance of |
| | the fund’s Class Z shares for periods prior to 5/3/07 (the inception date for Class A, B and C shares), adjusted |
| | to reflect the applicable sales load for each share class. |
| †††† | Assumes the conversion of Class B shares to Class A shares at the end of the sixth year following the |
| | date of purchase. |
The Fund 7
UNDERSTANDING YOUR FUND’S EXPENSES (Unaudited)
As a mutual fund investor, you pay ongoing expenses, such as management fees and other expenses. Using the information below, you can estimate how these expenses affect your investment and compare them with the expenses of other funds.You also may pay one-time transaction expenses, including sales charges (loads) and redemption fees, which are not shown in this section and would have resulted in higher total expenses. For more information, see your fund’s prospectus or talk to your financial adviser.
Review your fund’s expenses
The table below shows the expenses you would have paid on a $1,000 investment in Dreyfus GNMA Fund from November 1, 2009 to April 30, 2010. It also shows how much a $1,000 investment would be worth at the close of the period, assuming actual returns and expenses.
| | | | |
| Expenses and Value of a $1,000 Investment | | | |
| assuming actual returns for the six months ended April 30, 2010 | | |
| | Class A | Class B | Class C | Class Z |
| Expenses paid per $1,000† | $ 4.92 | $ 8.67 | $ 8.62 | $ 4.32 |
| Ending value (after expenses) | $1,024.80 | $1,020.80 | $1,021.10 | $1,025.50 |
|
| COMPARING YOUR FUND’S EXPENSES |
| WITH THOSE OF OTHER FUNDS (Unaudited) |
Using the SEC’s method to compare expenses
The Securities and Exchange Commission (SEC) has established guidelines to help investors assess fund expenses. Per these guidelines, the table below shows your fund’s expenses based on a $1,000 investment, assuming a hypothetical 5% annualized return. You can use this information to compare the ongoing expenses (but not transaction expenses or total cost) of investing in the fund with those of other funds.All mutual fund shareholder reports will provide this information to help you make this comparison. Please note that you cannot use this information to estimate your actual ending account balance and expenses paid during the period.
| | | | |
| Expenses and Value of a $1,000 Investment | | | |
| assuming a hypothetical 5% annualized return for the six months ended April 30, 2010 |
| | Class A | Class B | Class C | Class Z |
| Expenses paid per $1,000† | $ 4.91 | $ 8.65 | $ 8.60 | $ 4.31 |
| Ending value (after expenses) | $1,019.93 | $1,016.22 | $1,016.27 | $1,020.53 |
Expenses are equal to the fund’s annualized expense ratio of .98% for Class A, 1.73% for Class B, 1.72% for Class C and .86% for Class Z, multiplied by the average account value over the period, multiplied by 181/365 (to reflect the one-half year period).
8
|
| STATEMENT OF INVESTMENTS |
| April 30, 2010 |
| | | | | |
| | Coupon | Maturity | Principal | | |
| Bonds and Notes—103.8% | Rate (%) | Date | Amount ($) | | Value ($) |
| Asset-Backed Ctfs./ | | | | | |
| Auto Receivables—.5% | | | | | |
| Capital Auto Receivables Asset | | | | | |
| Trust, Ser. 2006-2, Cl. A3A | 4.98 | 5/15/11 | 310,807 | | 312,329 |
| Capital Auto Receivables Asset | | | | | |
| Trust, Ser. 2007-1, Cl. A3A | 5.00 | 4/15/11 | 103,217 | | 103,410 |
| Capital One Prime Auto Receivables | | | | | |
| Trust, Ser. 2007-2, Cl. A3 | 4.89 | 1/15/12 | 2,593,143 | | 2,614,221 |
| Daimler Chrysler Auto Trust, | | | | | |
| Ser. 2008-B, Cl. A2B | 1.18 | 7/8/11 | 279,059 | a | 279,167 |
| Honda Auto Receivables Owner | | | | | |
| Trust, Ser. 2007-2, Cl. A3 | 5.46 | 5/23/11 | 111,435 | | 111,827 |
| USAA Auto Owner Trust, | | | | | |
| Ser. 2007-1, Cl. A3 | 5.43 | 10/17/11 | 245,452 | | 246,162 |
| | | | | | 3,667,116 |
| Asset-Backed Ctfs./ | | | | | |
| Home Equity Loans—.2% | | | | | |
| Citicorp Residential Mortgage | | | | | |
| Securities, Ser. 2007-2, Cl. A1A | 5.98 | 6/25/37 | 41,497 | a | 41,429 |
| Countrywide Asset-Backed | | | | | |
| Certificates, Ser. 2007-4, Cl. M5 | 6.92 | 9/25/37 | 875,000 | | 125,291 |
| Equivantage Home Equity Loan | | | | | |
| Trust, Ser. 1997-1, Cl. A4 | 7.78 | 3/25/28 | 286,574 | a | 238,669 |
| GE Capital Mortgage Services, | | | | | |
| Ser. 1999-HE1, Cl. A7 | 6.27 | 4/25/29 | 332,050 | | 331,918 |
| JP Morgan Mortgage Acquisition, | | | | | |
| Ser. 2007-CH1, Cl. MF2 | 5.84 | 10/25/36 | 2,325,000 | a | 429,920 |
| | | | | | 1,167,227 |
| Commercial Mortgage | | | | | |
| Pass-Through Ctfs.—.3% | | | | | |
| GS Mortgage Securities Corporation | | | | | |
| II, Ser. 2007-EOP, Cl. F | 0.73 | 3/6/20 | 2,275,000 | a,b | 1,958,331 |
| Residential Mortgage | | | | | |
| Pass-Through Ctfs.—.4% | | | | | |
| GSR Mortgage Loan Trust, | | | | | |
| Ser. 2004-12, Cl. 2A2 | 3.56 | 12/25/34 | 1,408,080 | a | 1,143,827 |
| JP Morgan Mortgage Trust, | | | | | |
| Ser. 2007-A1, Cl. 3A1 | 4.28 | 7/25/35 | 2,017,069 | a | 1,849,097 |
| | | | | | 2,992,924 |
The Fund 9
STATEMENT OF INVESTMENTS (continued)
| | |
| | Principal | |
| Bonds and Notes (continued) | Amount ($) | Value ($) |
| U.S. Government Agencies/Mortgage-Backed—94.5% | | |
| Federal Home Loan Mortgage Corp.: | | |
| 4.00%, 5/1/10 | 2,700,342 c | 2,708,667 |
| 4.50%, 6/1/39 | 6,732,155 c | 6,798,495 |
| 5.00%, 3/1/20—9/1/39 | 9,909,095 c | 10,317,753 |
| 5.50%, 10/1/38 | 4,903,841 c | 5,187,119 |
| Federal National Mortgage Association: | | |
| 5.00% | 1,975,000 c,d | 2,044,433 |
| 6.50% | 5,660,000 c,d | 6,119,875 |
| 4.50%, 3/1/39 | 6,763,895 c | 6,837,945 |
| 5.00%, 1/1/36—5/1/39 | 10,245,816 c | 10,658,492 |
| 5.50%, 11/1/38—9/1/39 | 16,617,948 c | 17,527,816 |
| 6.00%, 4/1/35 | 3,404,989 c | 3,644,119 |
| Gtd. Pass-Through Ctfs., Ser. 2003-49, | | |
| Cl. JE, 3.00%, 4/25/33 | 757,855 c | 753,638 |
| Pass-Through Ctfs., Ser. 2004-58, | | |
| Cl. LJ, 5.00%, 7/25/34 | 2,732,987 c | 2,874,537 |
| Government National Mortgage Association I: | | |
| 4.50% | 15,445,000 d | 15,686,328 |
| 5.00% | 30,055,000 d | 31,341,745 |
| 5.50% | 13,250,000 d | 14,013,942 |
| 6.50% | 18,805,000 d | 20,353,479 |
| 4.00%, 9/15/24 | 418,638 | 430,211 |
| 4.50%, 10/15/24—3/15/40 | 87,298,454 | 89,266,177 |
| 5.00%, 10/15/23—1/15/40 | 66,336,792 | 69,598,249 |
| 5.50%, 6/15/20—9/15/39 | 107,740,272 | 115,112,486 |
| 6.00%, 10/15/19—9/15/39 | 69,833,126 | 75,279,989 |
| 6.50%, 8/15/10—2/15/39 | 3,492,995 | 3,783,119 |
| 7.00%, 11/15/22—12/15/22 | 12,666 | 14,133 |
| 7.50%, 2/15/17—5/15/26 | 4,306,227 | 4,853,600 |
| 8.00%, 8/15/21—12/15/22 | 1,909,490 | 2,191,435 |
| 8.50%, 12/15/16—12/15/22 | 1,534,686 | 1,732,519 |
| 9.00%, 9/15/19—12/15/22 | 1,449,330 | 1,654,552 |
| 9.50%, 3/15/18—1/15/25 | 353,927 | 408,640 |
| Ser. 2004-39, Cl. LC, 5.50%, 12/20/29 | 3,286,898 | 3,315,640 |
| Government National Mortgage Association II: | | |
| 4.50% | 37,250,000 d | 37,750,826 |
| 5.00% | 53,705,000 d | 55,711,145 |
| 5.50% | 3,680,000 d | 3,901,959 |
| 4.00%, 12/20/24 | 6,512,984 | 6,668,373 |
| 4.50%, 12/20/39 | 4,962,803 | 5,040,369 |
| 5.00%, 9/20/33—6/20/35 | 17,940,704 | 18,810,769 |
| 5.50%, 1/20/34—9/20/35 | 33,299,842 | 35,542,232 |
| 6.00%, 12/20/28—2/20/39 | 17,336,719 | 18,751,095 |
10
| | |
| | Principal | |
| Bonds and Notes (continued) | Amount ($) | Value ($) |
| U.S. Government Agencies/Mortgage-Backed (continued) | | |
| Government National Mortgage Association II (continued): | | |
| 6.50%, 5/20/31—7/20/31 | 1,361,201 | 1,507,886 |
| 7.00%, 4/20/24—4/20/32 | 7,064,625 | 7,915,784 |
| 7.50%, 9/20/30 | 100,032 | 112,703 |
| 9.00%, 7/20/25 | 105,345 | 121,587 |
| 9.50%, 9/20/17—2/20/25 | 75,096 | 85,348 |
| | | 716,429,209 |
| U.S. Treasury Notes—7.9% | | |
| 2.75%, 11/30/16 | 19,270,000 | 18,959,869 |
| 3.25%, 5/31/16 | 24,945,000 e | 25,516,016 |
| 3.50%, 5/31/13 | 6,195,000 | 6,564,284 |
| 3.75%, 11/15/18 | 6,165,000 | 6,298,417 |
| 4.50%, 2/28/11 | 2,765,000 | 2,858,861 |
| | | 60,197,447 |
| Total Bonds and Notes | | |
| (cost $768,603,549) | | 786,412,254 |
| |
| | Face Amount | |
| | Covered by | |
| Purchased Options—.0% | Contracts ($) | Value ($) |
| Call Options | | |
| U.S. Treasury 10 Year Notes, | | |
| May 2010 @ 118 | | |
| (cost $294,543) | 40,800,000 f | 248,627 |
| |
| | Principal | |
| Short-Term Investments—19.6% | Amount ($) | Value ($) |
| U.S. Government Agencies—.4% | | |
| Federal Home Loan Bank, | | |
| 0.15%, 5/12/10 | 2,000,000 | 1,999,950 |
| Federal Home Loan Mortgage Corp., | | |
| 0.17%, 6/21/10 | 900,000 | 899,853 |
| | | 2,899,803 |
| U.S. Treasury Bills—19.2% | | |
| 0.13%, 5/13/10 | 6,000,000 | 5,999,814 |
| 0.13%, 5/20/10 | 93,000,000 | 92,994,606 |
| 0.15%, 6/17/10 | 43,300,000 | 43,292,423 |
| 0.15%, 7/22/10 | 2,984,000 g | 2,983,024 |
| | | 145,269,867 |
| Total Short-Term Investments | | |
| (cost $148,167,562) | | 148,169,670 |
The Fund 11
STATEMENT OF INVESTMENTS (continued)
| | |
| Other Investment—1.6% | Shares | Value ($) |
| Registered Investment Company; | | |
| Dreyfus Institutional Preferred | | |
| Plus Money Market Fund | | |
| (cost $12,131,000) | 12,131,000 h | 12,131,000 |
| |
| Investment of Cash Collateral | | |
| for Securities Loaned—1.8% | | |
| Registered Investment Company; | | |
| Dreyfus Institutional Cash | | |
| Advantage Fund | | |
| (cost $13,677,581) | 13,677,581 h | 13,677,581 |
| |
| Total Investments (cost $942,874,235) | 126.8% | 960,639,132 |
| Liabilities, Less Cash and Receivables | (26.8%) | (203,222,482) |
| Net Assets | 100.0% | 757,416,650 |
|
| a Variable rate security—interest rate subject to periodic change. |
| b Security exempt from registration under Rule 144A of the Securities Act of 1933.This security may be resold in |
| transactions exempt from registration, normally to qualified institutional buyers. At April 30, 2010, this security had |
| a total market value of $1,958,331 or 0.3% of net assets. |
| c On September 7, 2008, the Federal Housing Finance Agency (FHFA) placed Federal National Mortgage |
| Association and Federal Home Loan Mortgage Corporation into conservatorship with FHFA as the conservator. As |
| such, the FHFA will oversee the continuing affairs of these companies. |
| d Purchased on a forward commitment basis. |
| e Security, or portion thereof, on loan. At April 30, 2010, the total market value of the fund’s securities on loan is |
| $13,277,034 and the total market value of the collateral held by the fund is $13,677,581. |
| f Non-income producing security. |
| g Held by a broker as collateral for open financial futures and options positions. |
| h Investment in affiliated money market mutual fund. |
| | | |
| Portfolio Summary (Unaudited)† | | |
| |
| | Value (%) | | Value (%) |
| U.S. Government & Agencies | 102.5 | Asset/Mortgage-Backed | 1.3 |
| Short-Term/ | | Purchased Options | .0 |
| Money Market Investments | 23.0 | | 126.8 |
| |
| † Based on net assets. | | | |
| See notes to financial statements. | | | |
12
|
| STATEMENT OF OPTIONS WRITTEN |
| April 30, 2010 |
| | |
| | Face Amount | |
| | Covered by | |
| | Contracts ($) | Value ($) |
| Call Options: | | |
| 10-Year USD LIBOR-BBA, | | |
| November 2012 @ 4.76 | 11,476,000 a | (677,169) |
| 10-Year USD LIBOR-BBA, | | |
| December 2012 @ 4.61 | 12,900,000 a | (678,742) |
| U.S. Treasury 5-Year Notes, | | |
| May 2010 @ 119 | 81,600,000 a | (204,000) |
| Put Options: | | |
| 10-Year USD LIBOR-BBA, | | |
| February 2011 @ 5.36 | 18,975,000 a | (87,192) |
| 10-Year USD LIBOR-BBA, | | |
| November 2012 @ 4.76 | 11,476,000 a | (630,365) |
| 10-Year USD LIBOR-BBA, | | |
| December 2012 @ 4.61 | 12,900,000 a | (794,682) |
| (Premiums received $3,877,305) | | (3,072,150) |
|
| BBA—British Bankers Association |
| LIBOR—London Interbank Offered Rate |
| USD—US Dollar |
| a Non-income producing security. |
| See notes to financial statements. |
The Fund 13
|
| STATEMENT OF ASSETS AND LIABILITIES |
| April 30, 2010 |
| | | | |
| | | | Cost | Value |
| Assets ($): | | | | |
| Investments in securities—See Statement of Investments (including | | |
| securities on loan, valued at $13,277,034)—Note 1(b): | | |
| Unaffiliated issuers | | | 917,065,654 | 934,830,551 |
| Affiliated issuers | | | 25,808,581 | 25,808,581 |
| Cash | | | | 24,574 |
| Dividends and interest receivable | | | | 3,526,813 |
| Receivable for shares of Common Stock subscribed | | | 36,849 |
| Prepaid expenses | | | | 31,734 |
| | | | | 964,259,102 |
| Liabilities ($): | | | | |
| Due to The Dreyfus Corporation and affiliates—Note 3(c) | | 593,780 |
| Payable for open mortgage-backed dollar rolls—Note 4 | | 166,102,620 |
| Payable for investment securities purchased | | | 22,797,665 |
| Liability for securities on loan—Note 1(b) | | | 13,677,581 |
| Outstanding options written, at value (premiums received | | |
| $3,877,305)—See Statement of Options Written | | | 3,072,150 |
| Payable for shares of Common Stock redeemed | | | 401,336 |
| Accrued expenses | | | | 197,320 |
| | | | | 206,842,452 |
| Net Assets ($) | | | | 757,416,650 |
| Composition of Net Assets ($): | | | | |
| Paid-in capital | | | | 758,800,721 |
| Accumulated undistributed investment income—net | | | 2,169,635 |
| Accumulated net realized gain (loss) on investments | | | (22,123,758) |
| Accumulated net unrealized appreciation (depreciation) | | |
| on investments and options transactions | | | 18,570,052 |
| Net Assets ($) | | | | 757,416,650 |
| |
| |
| Net Asset Value Per Share | | | | |
| | Class A | Class B | Class C | Class Z |
| Net Assets ($) | 90,134,811 | 2,341,114 | 26,567,036 | 638,373,689 |
| Shares Outstanding | 5,915,127 | 153,954 | 1,744,871 | 41,864,838 |
| Net Asset Value Per Share ($) | 15.24 | 15.21 | 15.23 | 15.25 |
| |
| See notes to financial statements. | | | | |
14
|
| STATEMENT OF OPERATIONS |
| Year Ended April 30, 2010 |
| |
| Investment Income ($): | |
| Income: | |
| Interest | 28,928,973 |
| Dividends; | |
| Affiliated issuers | 99,566 |
| Income from securities lending—Note 1(b) | 3,645 |
| Total Income | 29,032,184 |
| Expenses: | |
| Management fee—Note 3(a) | 4,538,641 |
| Shareholder servicing costs—Note 3(c) | 964,124 |
| Service plan and prospectus fees—Note 3(b) | 763,673 |
| Distribution fees—Note 3(b) | 208,965 |
| Custodian fees—Note 3(c) | 122,888 |
| Professional fees | 95,928 |
| Registration fees | 74,654 |
| Directors’ fees and expenses—Note 3(d) | 57,470 |
| Shareholders’ reports | 46,884 |
| Loan commitment fees—Note 2 | 13,730 |
| Miscellaneous | 99,796 |
| Total Expenses | 6,986,753 |
| Less—reduction in expenses due to undertaking—Note 3(a) | (33,350) |
| Less—reduction in fees due to earnings credits—Note 1(b) | (2,784) |
| Net Expenses | 6,950,619 |
| Investment Income—Net | 22,081,565 |
| Realized and Unrealized Gain (Loss) on Investments—Note 4 ($): | |
| Net realized gain (loss) on investments | 7,188,189 |
| Net realized gain (loss) on financial futures | 4,021,693 |
| Net realized gain (loss) on options transactions | 1,580,347 |
| Net Realized Gain (Loss) | 12,790,229 |
| Net unrealized appreciation (depreciation) on investments | 9,570,322 |
| Net unrealized appreciation (depreciation) on financial futures | (604,343) |
| Net unrealized appreciation (depreciation) on options transactions | 739,656 |
| Net Unrealized Appreciation (Depreciation) | 9,705,635 |
| Net Realized and Unrealized Gain (Loss) on Investments | 22,495,864 |
| Net Increase in Net Assets Resulting from Operations | 44,577,429 |
| |
| See notes to financial statements. | |
The Fund 15
STATEMENT OF CHANGES IN NET ASSETS
| | |
| | | Year Ended April 30, |
| | 2010 | 2009 |
| Operations ($): | | |
| Investment income—net | 22,081,565 | 27,493,447 |
| Net realized gain (loss) on investments | 12,790,229 | 7,841,299 |
| Net unrealized appreciation | | |
| (depreciation) on investments | 9,705,635 | 9,414,867 |
| Net Increase (Decrease) in Net Assets | | |
| Resulting from Operations | 44,577,429 | 44,749,613 |
| Dividends to Shareholders from ($): | | |
| Investment income—net: | | |
| Class A Shares | (2,782,374) | (2,436,152) |
| Class B Shares | (108,329) | (295,186) |
| Class C Shares | (624,289) | (410,038) |
| Class Z Shares | (21,926,591) | (25,718,303) |
| Total Dividends | (25,441,583) | (28,859,679) |
| Capital Stock Transactions ($): | | |
| Net proceeds from shares sold: | | |
| Class A Shares | 43,931,849 | 36,574,666 |
| Class B Shares | 395,600 | 2,447,594 |
| Class C Shares | 10,794,209 | 12,806,263 |
| Class Z Shares | 23,380,390 | 23,920,577 |
| Dividends reinvested: | | |
| Class A Shares | 2,072,731 | 1,815,088 |
| Class B Shares | 93,190 | 231,197 |
| Class C Shares | 397,397 | 234,412 |
| Class Z Shares | 18,461,298 | 21,460,126 |
| Cost of shares redeemed: | | |
| Class A Shares | (33,767,490) | (19,994,637) |
| Class B Shares | (4,139,237) | (8,909,589) |
| Class C Shares | (6,157,392) | (1,982,507) |
| Class Z Shares | (60,753,912) | (75,285,685) |
| Increase (Decrease) in Net Assets | | |
| from Capital Stock Transactions | (5,291,367) | (6,682,495) |
| Total Increase (Decrease) in Net Assets | 13,844,479 | 9,207,439 |
| Net Assets ($): | | |
| Beginning of Period | 743,572,171 | 734,364,732 |
| End of Period | 757,416,650 | 743,572,171 |
| Undistributed investment income—net | 2,169,635 | 2,492,969 |
16
| | |
| | | Year Ended April 30, |
| | 2010 | 2009 |
| Capital Share Transactions: | | |
| Class Aa | | |
| Shares sold | 2,932,305 | 2,525,060 |
| Shares issued for dividends reinvested | 138,375 | 125,436 |
| Shares redeemed | (2,247,411) | (1,373,317) |
| Net Increase (Decrease) in Shares Outstanding | 823,269 | 1,277,179 |
| Class Ba | | |
| Shares sold | 26,376 | 169,240 |
| Shares issued for dividends reinvested | 6,241 | 16,023 |
| Shares redeemed | (276,909) | (615,963) |
| Net Increase (Decrease) in Shares Outstanding | (244,292) | (430,700) |
| Class C | | |
| Shares sold | 720,887 | 880,737 |
| Shares issued for dividends reinvested | 26,527 | 16,195 |
| Shares redeemed | (408,815) | (136,224) |
| Net Increase (Decrease) in Shares Outstanding | 338,599 | 760,708 |
| Class Z | | |
| Shares sold | 1,560,000 | 1,643,170 |
| Shares issued for dividends reinvested | 1,232,598 | 1,483,634 |
| Shares redeemed | (4,046,584) | (5,193,307) |
| Net Increase (Decrease) in Shares Outstanding | (1,253,986) | (2,066,503) |
| |
| a | During the period ended April 30, 2010,120,901 Class B shares representing $1,805,596 were automatically |
| | converted to 120,865 Class A shares and during the period ended April 30, 2009, 238,945 Class B shares |
| | representing $3,454,593 were automatically converted to 238,846 Class A shares. |
| See notes to financial statements. |
The Fund 17
FINANCIAL HIGHLIGHTS
The following tables describe the performance for each share class for the fiscal periods indicated. All information (except portfolio turnover rate) reflects financial results for a single fund share.Total return shows how much your investment in the fund would have increased (or decreased) during each period, assuming you had reinvested all dividends and distributions.These figures have been derived from the fund’s financial statements.
| | | |
| | | Year Ended April 30, |
| Class A Shares | 2010 | 2009 | 2008a |
| Per Share Data ($): | | | |
| Net asset value, beginning of period | 14.86 | 14.54 | 14.31 |
| Investment Operations: | | | |
| Investment income—netb | .42 | .53 | .60 |
| Net realized and unrealized | | | |
| gain (loss) on investments | .45 | .35 | .20 |
| Total from Investment Operations | .87 | .88 | .80 |
| Distributions: | | | |
| Dividends from investment income—net | (.49) | (.56) | (.57) |
| Net asset value, end of period | 15.24 | 14.86 | 14.54 |
| Total Return (%)c | 5.96 | 6.21 | 5.73d |
| Ratios/Supplemental Data (%): | | | |
| Ratio of total expenses to average net assets | 1.04 | 1.08 | 1.09e |
| Ratio of net expenses to average net assets | 1.01 | 1.04 | 1.04e |
| Ratio of net investment income to average net assets | 2.81 | 3.62 | 4.17e |
| Portfolio Turnover Ratef | 272.95 | 351.74 | 221.12 |
| Net Assets, end of period ($ x 1,000) | 90,135 | 75,648 | 55,457 |
| |
| a | From May 3, 2007 (commencement of initial offering) to April 30, 2008. |
| b | Based on average shares outstanding at each month end. |
| c | Exclusive of sales charge. |
| d | Not annualized. |
| e | Annualized. |
| f | The portfolio turnover rates excluding mortgage dollar roll transactions for the periods ended April 30, 2010, 2009 |
| | and 2008 were 66.28%, 138.79% and 60.06%, respectively. |
| See notes to financial statements. |
18
| | | |
| | | Year Ended April 30, |
| Class B Shares | 2010 | 2009 | 2008a |
| Per Share Data ($): | | | |
| Net asset value, beginning of period | 14.84 | 14.53 | 14.31 |
| Investment Operations: | | | |
| Investment income—netb | .31 | .44 | .53 |
| Net realized and unrealized | | | |
| gain (loss) on investments | .45 | .34 | .19 |
| Total from Investment Operations | .76 | .78 | .72 |
| Distributions: | | | |
| Dividends from investment income—net | (.39) | (.47) | (.50) |
| Net asset value, end of period | 15.21 | 14.84 | 14.53 |
| Total Return (%)c | 5.21 | 5.49 | 5.12d |
| Ratios/Supplemental Data (%): | | | |
| Ratio of total expenses to average net assets | 1.74 | 1.68 | 1.63e |
| Ratio of net expenses to average net assets | 1.73 | 1.64 | 1.58e |
| Ratio of net investment income to average net assets | 2.16 | 3.11 | 3.65e |
| Portfolio Turnover Ratef | 272.95 | 351.74 | 221.12 |
| Net Assets, end of period ($ x 1,000) | 2,341 | 5,910 | 12,041 |
| |
| a | From May 3, 2007 (commencement of initial offering) to April 30, 2008. |
| b | Based on average shares outstanding at each month end. |
| c | Exclusive of sales charge. |
| d | Not annualized. |
| e | Annualized. |
| f | The portfolio turnover rates excluding mortgage dollar roll transactions for the periods ended April 30, 2010, 2009 |
| | and 2008 were 66.28%, 138.79% and 60.06%, respectively. |
| See notes to financial statements. |
The Fund 19
FINANCIAL HIGHLIGHTS (continued)
| | | |
| | | Year Ended April 30, |
| Class C Shares | 2010 | 2009 | 2008a |
| Per Share Data ($): | | | |
| Net asset value, beginning of period | 14.84 | 14.53 | 14.31 |
| Investment Operations: | | | |
| Investment income—netb | .31 | .41 | .49 |
| Net realized and unrealized | | | |
| gain (loss) on investments | .46 | .36 | .21 |
| Total from Investment Operations | .77 | .77 | .70 |
| Distributions: | | | |
| Dividends from investment income—net | (.38) | (.46) | (.48) |
| Net asset value, end of period | 15.23 | 14.84 | 14.53 |
| Total Return (%)c | 5.24 | 5.40 | 4.96d |
| Ratios/Supplemental Data (%): | | | |
| Ratio of total expenses to average net assets | 1.78 | 1.82 | 1.81e |
| Ratio of net expenses to average net assets | 1.75 | 1.78 | 1.75e |
| Ratio of net investment income to average net assets | 2.07 | 2.83 | 3.46e |
| Portfolio Turnover Ratef | 272.95 | 351.74 | 221.12 |
| Net Assets, end of period ($ x 1,000) | 26,567 | 20,875 | 9,380 |
| |
| a | From May 3, 2007 (commencement of initial offering) to April 30, 2008. |
| b | Based on average shares outstanding at each month end. |
| c | Exclusive of sales charge. |
| d | Not annualized. |
| e | Annualized. |
| f | The portfolio turnover rates excluding mortgage dollar roll transactions for the periods ended April 30, 2010, 2009 |
| | and 2008 were 66.28%, 138.79% and 60.06%, respectively. |
| See notes to financial statements. |
20
| | | | | |
| | | Year Ended April 30, | |
| Class Z Shares | 2010 | 2009 | 2008 | 2007 | 2006 |
| Per Share Data ($): | | | | | |
| Net asset value, beginning of period | 14.87 | 14.55 | 14.38 | 14.21 | 14.67 |
| Investment Operations: | | | | | |
| Investment income—neta | .45 | .56 | .63 | .62 | .53 |
| Net realized and unrealized | | | | | |
| gain (loss) on investments | .44 | .34 | .19 | .19 | (.39) |
| Total from Investment Operations | .89 | .90 | .82 | .81 | .14 |
| Distributions: | | | | | |
| Dividends from investment income—net | (.51) | (.58) | (.65) | (.64) | (.60) |
| Net asset value, end of period | 15.25 | 14.87 | 14.55 | 14.38 | 14.21 |
| Total Return (%) | 6.13 | 6.40 | 5.84 | 5.90 | .89 |
| Ratios/Supplemental Data (%): | | | | | |
| Ratio of total expenses | | | | | |
| to average net assets | .87 | .90 | .90 | .89 | .88 |
| Ratio of net expenses | | | | | |
| to average net assets | .87b | .86 | .85 | .89 | .79 |
| Ratio of net investment income | | | | | |
| to average net assets | 2.97 | 3.84 | 4.38 | 4.33 | 3.68 |
| Portfolio Turnover Ratec | 272.95 | 351.74 | 221.12 | 271.49 | 393.65 |
| Net Assets, end of period ($ x 1,000) | 638,374 | 641,140 | 657,486 | 697,280 | 765,545 |
| |
| a | Based on average shares outstanding at each month end. |
| b | Expense waivers and/or reimbursements amounted to less than .01%. |
| c | The portfolio turnover rates excluding mortgage dollar roll transactions for the periods ended April 30, 2010, 2009, |
| | 2008, 2007 and 2006 were 66.28%, 138.79%, 60.06%, 95.55% and 108.38%, respectively. |
| See notes to financial statements. |
The Fund 21
NOTES TO FINANCIAL STATEMENTS
NOTE 1—Significant Accounting Policies:
Dreyfus GNMA Fund (the “fund”) is the sole series of Dreyfus Premier GNMA Fund, Inc. (the “Company”), which is registered under the Investment Company Act of 1940, as amended (the “Act”), as a diversified open-end management investment company. The fund’s investment objective seeks to maximize total return, consisting of capital appreciation and current income.The Dreyfus Corporation (the “Manager” or “Dreyfus”), a wholly-owned subsidiary of The Bank of New York Mellon Corporation (“BNY Mellon”), serves as the fund’s investment adviser.
MBSC Securities Corporation (the “Distributor”), a wholly-owned subsidiary of the Manager, is the distributor of the fund’s shares. The fund is authorized to issue 1.4 billion shares of $.001 par value Common Stock.The fund currently offers four classes of shares: Class A (100 million shares authorized), Class B (100 million shares authorized), Class C (100 million shares authorized) and Class Z (1.1 billion shares authorized). Class A shares are subject to a sales charge imposed at the time of purchase. Class B shares are subject to a contingent deferred sales charge (“CDSC”) imposed on Class B share redemptions made within six years of purchase and automatically convert to Class A shares after six years. The fund does not offer Class B shares, except in connection with dividend reinvestment and permitted exchanges of Class B shares. Class C shares are subject to a CDSC imposed on Class C shares redeem ed within one year of purchase. Class Z shares are sold at net asset value per share. Class Z shares generally are not available for new accounts. Other differences between the classes include the services offered to and the expenses borne by each class, the allocation of certain transfer agency costs and certain voting rights. Income, expenses (other than expenses attributable to a specific class) and realized and unrealized gains or losses on investments are allocated to each class of shares based on its relative net assets.
22
The Financial Accounting Standards Board (“FASB”) Accounting Standards Codification (“ASC”) has become the exclusive reference of authoritative U.S. generally accepted accounting principles (“GAAP”) recognized by the FASB to be applied by nongovernmental entities. Rules and interpretive releases of the Securities and Exchange Commission (“SEC”) under authority of federal laws are also sources of authoritative GAAP for SEC registrants. The ASC has superseded all existing non-SEC accounting and reporting standards. The fund’s financial statements are prepared in accordance with GAAP, which may require the use of management estimates and assumptions.Actual results could differ from those estimates.
The Company enters into contracts that contain a variety of indemnifications. The fund’s maximum exposure under these arrangements is unknown.The fund does not anticipate recognizing any loss related to these arrangements.
(a) Portfolio valuation: Investments in securities (excluding short-term investments (other than U.S. Treasury Bills), financial futures, options transactions and swap transactions) are valued each business day by an independent pricing service (the “Service”) approved by the Board of Directors. Investments for which quoted bid prices are readily available and are representative of the bid side of the market in the judgment of the Service are valued at the mean between the quoted bid prices (as obtained by the Service from dealers in such securities) and asked prices (as calculated by the Service based upon its evaluation of the market for such securities). Other investments (which constitute a majority of the portfolio securities) are valued as determined by the Service, based on methods which include consideration of: yields or prices of se curities of comparable quality, coupon, maturity and type; indications as to values from dealers; and general market conditions. Restricted securities, as well as securities or other assets for which
The Fund 23
NOTES TO FINANCIAL STATEMENTS (continued)
recent market quotations are not readily available, that are not valued by a pricing service approved by the Board of Directors, or are determined by the fund not to reflect accurately fair value, are valued at fair value as determined in good faith under the direction of the Board of Directors.The factors that may be considered when fair valuing a security include fundamental analytical data, the nature and duration of restrictions on disposition, an evaluation of the forces that influence the market in which the securities are purchased and sold and public trading in similar securities of the issuer or comparable issuers. Short-term investments, excluding U.S.Treasury Bills, are carried at amortized cost, which approximates value. Registered investment companies that are not traded on an exchange are valued at their net asset value. Financial futures and options, which are traded on an exchange, are valued at the last sales p rice on the securities exchange on which such securities are primarily traded or at the last sales price on the national securities market on each business day. Options traded over-the-counter are valued at the mean between the bid and asked price. Investments in swap transactions are valued each business day by an independent pricing service approved by the Board of Directors. Swaps are valued by the service by using a swap pricing model which incorporates among other factors, default probabilities, recovery rates, credit curves of the underlying issuer and swap spreads on interest rates.
The fair value of a financial instrument is the amount that would be received to sell an asset or paid to transfer a liability in an orderly transaction between market participants at the measurement date (i.e. the exit price). GAAP establishes a fair value hierarchy that prioritizes the inputs of valuation techniques used to measure fair value.This hierarchy gives the highest priority to unadjusted quoted prices in active markets for identical assets or liabilities (Level 1 measurements) and the lowest priority to unobservable inputs (Level 3 measurements).
Additionally, GAAP provides guidance on determining whether the volume and activity in a market has decreased significantly and whether such a decrease in activity results in transactions that are not orderly. GAAP requires enhanced disclosures around valuation inputs and techniques used during annual and interim periods.
24
Various inputs are used in determining the value of the fund’s investments relating to fair value measurements.These inputs are summarized in the three broad levels listed below:
Level 1—unadjusted quoted prices in active markets for
identical investments.
Level 2—other significant observable inputs (including quoted
prices for similar investments, interest rates, prepayment speeds,
credit risk, etc.).
Level 3—significant unobservable inputs (including the fund’s own
assumptions in determining the fair value of investments).
The inputs or methodology used for valuing securities are not necessarily an indication of the risk associated with investing in those securities.
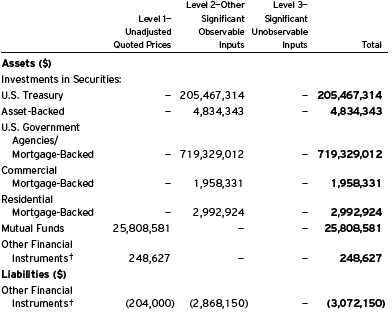
The following is a summary of the inputs used as of April 30, 2010 in valuing the fund’s investments:
|
| † Other financial instruments include derivative instruments such as futures, forward foreign currency |
| exchange contracts, swap contracts and options contracts. Amounts shown represent unrealized |
| appreciation (depreciation), or in the case of options, market value at period end. |
NOTES TO FINANCIAL STATEMENTS (continued)
In January 2010, FASB issued Accounting Standards Update (“ASU”) No. 2010-06 “Improving Disclosures about Fair Value Measurements”. ASU 2010-06 will require reporting entities to make new disclosures about amounts and reasons for significant transfers in and out of Level 1 and Level 2 fair value measurements as well as inputs and valuation techniques used to measure fair value for both recurring and nonrecurring fair value measurements that fall in either Level 2 or Level 3, and information on purchases, sales, issuances and settlements on a gross basis in the reconciliation of activity in Level 3 fair value measurements. The new and revised disclosures are required to be implemented for fiscal years beginning after December 15, 2009 except for the disclosures surrounding purchases,sales,issuances and settlements on a gross basis in the reconciliation of Level 3 fair value measurements, which are effective f or fiscal years beginning after December 15, 2010. Management is currently evaluating the impact the adoption of ASU No. 2010-06 may have on the fund’s financial statement disclosures.
(b) Securities transactions and investment income: Securities transactions are recorded on a trade date basis. Realized gains and losses from securities transactions are recorded on the identified cost basis. Interest income including, where applicable, accretion of discount and amortization of premium on investments is recognized on the accrual basis.
The fund has arrangements with the custodian and cash management bank whereby the fund may receive earnings credits when positive cash balances are maintained, which are used to offset custody and cash management fees. For financial reporting purposes, the fund includes net earnings credits as an expense offset in the Statement of Operations.
Pursuant to a securities lending agreement with The Bank of New York Mellon, a subsidiary of BNY Mellon and an affiliate of Dreyfus, the fund may lend securities to qualified institutions. It is the fund’s policy that, at origination, all loans are secured by collateral of at least 102% of the value of U.S. securities loaned and 105% of the value of foreign securities loaned. Collateral equivalent to at least 100% of the market value of securities on loan is maintained at all times. Collateral
26
is either in the form of cash, which can be invested in certain money market mutual funds managed by the Manager, U.S Government and Agency securities or letters of credit.The fund is entitled to receive all income on securities loaned, in addition to income earned as a result of the lending transaction. Although each security loaned is fully collateralized, the fund bears the risk of delay in recovery of, or loss of rights in, the securities loaned should a borrower fail to return the securities in a timely manner. During the period ended April 30, 2010, The Bank of NewYork Mellon earned $1,963 from lending portfolio securities, pursuant to the securities lending agreement.
(c) Affiliated issuers: Investments in other investment companies advised by the Manager are defined as “affiliated” in the Act.
(d) Dividends to shareholders: Dividends are recorded on the ex-dividend date. Dividends from investment income-net are declared and paid monthly. Dividends from net realized capital gains, if any, are normally declared and paid annually, but the fund may make distributions on a more frequent basis to comply with the distribution requirements of the Internal Revenue Code of 1986, as amended (the “Code”).To the extent that net realized capital gains can be offset by capital loss carryovers, it is the policy of the fund not to distribute such gains. Income and capital gain distributions are determined in accordance with income tax regulations, which may differ from GAAP.
On April 30, 2010, the Board of Directors declared a cash dividend of $0.037 for Class A, $0.031 for Class B, $0.027 for Class C and $0.039 for Class Z shares per share from undistributed investment income-net, payable on May 3, 2010 (ex-dividend date) to shareholders of record as of the close of business on April 30, 2010.
(e) Federal income taxes: It is the policy of the fund to continue to qualify as a regulated investment company, if such qualification is in the best interests of its shareholders, by complying with the applicable provisions of the Code, and to make distributions of taxable income sufficient to relieve it from substantially all federal income and excise taxes.
The Fund 27
NOTES TO FINANCIAL STATEMENTS (continued)
As of and during the period ended April 30, 2010, the fund did not have any liabilities for any uncertain tax positions.The fund recognizes interest and penalties, if any, related to uncertain tax positions as income tax expense in the Statement of Operations. During the period, the fund did not incur any interest or penalties.
Each of the tax years in the four-year period ended April 30, 2010 remains subject to examination by the Internal Revenue Service and state taxing authorities.
At April 30,2010,the components of accumulated earnings on a tax basis were as follows: undistributed ordinary income $2,169,635, accumulated capital losses $21,780,665 and unrealized appreciation $18,226,959.
The accumulated capital loss carryover is available for federal income tax purposes to be applied against future net securities profits, if any, realized subsequent to April 30, 2010. If not applied, $16,488,718 of the carryover expires in fiscal 2014 and $5,291,947 expires in fiscal 2015.
The tax character of distributions paid to shareholders during the fiscal periods ended April 30, 2010 and April 30, 2009 were as follows: ordinary income $25,441,583 and $28,859,679, respectively.
During the period ended April 30, 2010, as a result of permanent book to tax differences, primarily due to the tax treatment for paydown gains and losses on mortgage-backed securities and amortization of premiums, the fund increased accumulated undistributed investment income-net by $3,036,684 and decreased accumulated net realized gain (loss) on investments by the same amount. Net assets and net asset value per share were not affected by this reclassification.
NOTE 2—Bank Lines of Credit:
The fund participates with other Dreyfus-managed funds in a $225 million unsecured credit facility led by Citibank, N.A. and a $300 million unsecured credit facility provided by The Bank of New York Mellon (each, a “Facility”), each to be utilized primarily for temporary or emergency purposes, including the financing of redemptions. In
28
connection therewith, the fund has agreed to pay its pro rata portion of commitment fees for each Facility. Interest is charged to the fund based on rates determined pursuant to the terms of the respective Facility at the time of borrowing. During the period ended April 30, 2010, the fund did not borrow under the Facilities.
NOTE 3—Management Fee and Other Transactions with Affiliates:
(a) Pursuant to a management agreement (“Agreement”) with the Manager, the management fee is computed at the annual rate of .60% of the value of the fund’s average daily net assets and is payable monthly. The Agreement provides that if in any full fiscal year the aggregate expenses of Class Z shares, exclusive of taxes, brokerage fees, interest on borrowings and extraordinary expenses, exceed 1 1 / 2% of the value of Class Z shares average daily net assets, the fund may deduct from payments to be made to the Manager, or the Manager will bear, such excess expense with respect to Class Z shares.There was no reimbursement pursuant to the Agreement for Class Z shares during the period ended April 30 , 2010.
The Manager has undertaken from December 1, 2009 through November 30, 2010, to assume expenses of the fund’s Class A, Class B and Class C shares so that total annual fund operating expenses (exclusive of applicable Rule 12b-1 distribution plan fees and/or shareholder services fees, taxes, interest, brokerage commissions, commitment fees on borrowings and extraordinary expenses) do not exceed .70% of the average daily net assets attributable to that class. The reduction in expenses, pursuant to the undertaking, amounted to $33,350 during the period ended April 30, 2010.
During the period ended April 30, 2010, the Distributor retained $12,293 from commissions earned on sales of the fund’s Class A shares and $3,393 and $12,006 from CDSCs on redemptions of the fund’s Class B and Class C shares, respectively.
The Fund 29
NOTES TO FINANCIAL STATEMENTS (continued)
(b) Under the Distribution Plan (the “Plan”) adopted pursuant to Rule 12b-1 under the Act, Class B and Class C shares pay the Distributor for distributing their shares at an annual rate of .50% of the value of the average daily net assets of Class B shares and .75% of the value of the average daily net assets of Class C shares. During the period ended April 30, 2010, Class B and Class C shares were charged $19,184 and $189,781, respectively, pursuant to the Plan.
Under the Service Plan adopted pursuant to Rule 12b-1 under the Act, Class Z shares reimburse the Distributor for distributing Class Z’s shares, for servicing shareholder accounts and for advertising and marketing relating to Class Z shares.The Service Plan provides for a reimbursement to be made at an aggregate annual rate not to exceed .20% of the value of the average daily net assets of Class Z shares.The Distributor determines the amounts, if any, to be paid to Service Agents (a securities dealer, financial institution or other industry professional) to which it will make payments and the basis on which such payments are made. The Plan also separately provides for Class Z shares to bear the costs of preparing, printing and distributing certain of Class Z prospectuses and statements of additional information and costs associated with implementing and operating the Service Plan, not to exceed the greater of $100,000 or . 005% of the value of the average daily net assets of Class Z shares for any full fiscal year. During the period ended April 30, 2010, Class Z shares were charged $763,673 pursuant to the Service Plan.
(c) Under the Shareholder Services Plan, Class A, Class B and Class C shares pay the Distributor at an annual rate of .25% of the value of the average daily net assets of Class A, Class B and Class C shares, for the provision of certain services. The services provided may include personal services relating to shareholder accounts, such as answering shareholder inquiries regarding the fund and providing reports and other information, and services related to the maintenance of shareholder accounts. The Distributor may make payments to Service Agents (a securities dealer, financial institution or other industry professional) in respect of these services.The Distributor determines the amounts to be paid to Service Agents. During the period ended April 30, 2010, Class
30
A, Class B and Class C shares were charged $215,489, $9,592 and $63,260, respectively, pursuant to the Shareholder Services Plan.
The fund compensates Dreyfus Transfer, Inc., a wholly-owned subsidiary of the Manager, under a transfer agency agreement for providing personnel and facilities to perform transfer agency services for the fund. During the period ended April 30, 2010, the fund was charged $312,049 pursuant to the transfer agency agreement, which is included in Shareholder servicing costs in the Statement of Operations.
The fund compensates The Bank of New York Mellon under a cash management agreement for performing cash management services related to fund subscriptions and redemptions. During the period ended April 30, 2010, the fund was charged $52,300 pursuant to the cash management agreement, which is included in Shareholder servicing costs in the Statement of Operations.These fees were partially offset by earnings credits of $2,784.
The fund also compensates The Bank of New York Mellon under a custody agreement for providing custodial services for the fund. During the period ended April 30, 2010, the fund was charged $122,888 pursuant to the custody agreement.
During the period ended April 30, 2010, the fund was charged $5,388 for services performed by the Chief Compliance Officer.
The components of “Due to The Dreyfus Corporation and affiliates” in the Statement of Assets and Liabilities consist of: management fees $373,592, Rule 12b-1 distribution plan fees $80,489, shareholder services plan fees $24,717, custodian fees $53,964, chief compliance officer fees $3,199 and transfer agency per account fees $58,270, which are offset against an expense reimbursement currently in effect in the amount of $451.
(d) Each Board member also serves as a Board member of other funds within the Dreyfus complex. Annual retainer fees and attendance fees are allocated to each fund based on net assets.
The Fund 31
NOTES TO FINANCIAL STATEMENTS (continued)
NOTE 4—Securities Transactions:
The aggregate amount of purchases and sales (including paydowns) of investment securities, excluding short-term securities, financial futures and options transactions during the period ended April 30, 2010, amounted to $2,219,369,333 and $2,304,846,759 respectively, of which $1,680,474,883 in purchases and $1,687,005,865 in sales were from mortgage dollar roll transactions.
The fund may invest in shares of certain affiliated investment companies also advised or managed by Dreyfus.The fund pays no management fees to these affiliated investment companies. Investments in affiliated investment companies for the period ended April 30, 2010 were as follows:
| | | | | |
| Affiliated | | | | | |
| Investment | Value | | | Value | Net |
| Company | 4/30/2009 ($) | Purchases ($) | Sales ($) | 4/30/2010 ($) | Assets (%) |
| Dreyfus | | | | | |
| Institutional | | | | | |
| Preferred | | | | | |
| Plus Money | | | | | |
| Market | | | | | |
| Fund | 21,040,000 | 439,476,000 | 448,385,000 | 12,131,000 | 1.6 |
| Dreyfus | | | | | |
| Institutional | | | | | |
| Cash | | | | | |
| Advantage | | | | | |
| Fund | 3,806,000 | 70,126,768 | 60,255,187 | 13,677,581 | 1.8 |
| Total | 24,846,000 | 509,602,768 | 508,640,187 | 25,808,581 | 3.4 |
The provisions of ASC Topic 815 “Derivatives and Hedging” require qualitative disclosures about objectives and strategies for using derivatives, quantitative disclosures about fair value amounts of gains and losses on derivative instruments and disclosures about credit-risk-related contingent features in derivative agreements. The disclosure requirements distinguish between derivatives, which are accounted for as “hedges” and those that do not qualify for hedge accounting. Because investment companies value their derivatives at fair value and recognize changes in fair value through the Statement of Operations, they do not qualify for such accounting. Accordingly, even though a fund’s investments in derivatives may represent economic hedges, they are considered to be non-hedge transactions for purposes of this disclosure.
32
Mortgage Dollar Rolls: A mortgage dollar roll transaction involves a sale by the fund of mortgage related securities that it holds with an agreement by the fund to repurchase similar securities at an agreed upon price and date.The securities purchased will bear the same interest rate as those sold, but generally will be collateralized by pools of mortgages with different prepayment histories than those securities sold.
Futures Contracts: In the normal course of pursuing its investment objective, the fund is exposed to market risk, including interest rate risk, as a result of changes in value of underlying financial instruments.The fund invests in financial futures contracts in order to manage its exposure to or protect against changes in the market. A futures contract represents a commitment for the future purchase or a sale of an asset at a specified date. Upon entering into such contracts, these investments require initial margin deposits with a broker, which consist of cash or cash equivalents. The amount of these deposits is determined by the exchange or Board of Trade on which the contract is traded and is subject to change. Accordingly, variation margin payments are received or made to reflect daily unrealized gains or losses which are recorded in the Statement of Operations. Futures contracts are valued daily at the last sales price established by the Board of Trade or exchange upon which they are traded.When the contracts are closed, the fund recognizes a realized gain or loss.There is minimal counterparty credit risk to the fund with futures, since futures are exchange traded and the exchange’s clearinghouse, as counterparty to all exchange traded futures, guarantees the futures against default. At April 30, 2010, there were no open financial futures outstanding.
Options: The fund may purchase and write (sell) put and call options to hedge against changes in interest rates, or as a substitute for an invest-ment.The fund is subject to interest rate risk in the course of pursuing its investment objectives through its investments in options contracts.A call option gives the purchaser of the option the right (but not the obligation) to buy, and obligates the writer to sell, the underlying security or securities at the exercise price at any time during the option
The Fund 33
NOTES TO FINANCIAL STATEMENTS (continued)
period, or at a specified date. Conversely, a put option gives the purchaser of the option the right (but not the obligation) to sell, and obligates the writer to buy the underlying security or securities at the exercise price at any time during the option period, or at a specified date.
As a writer of call options, the fund receives a premium at the outset and then bears the market risk of unfavorable changes in the price of the financial instrument underlying the option. Generally, the fund realizes a gain, to the extent of the premium, if the price of the underlying financial instrument decreases between the date the option is written and the date on which the option is terminated. Generally, the fund incurs a loss, if the price of the financial instrument increases between those dates.
As a writer of put options, the fund receives a premium at the outset and then bears the market risk of unfavorable changes in the price of the financial instrument underlying the option. Generally, the fund realizes a gain, to the extent of the premium, if the price of the underlying financial instrument increases between the date the option is written and the date on which the option is terminated. Generally, the fund incurs a loss, if the price of the financial instrument decreases between those dates.
As a writer of an option, the fund may have no control over whether the underlying securities may be sold (call) or purchased (put) and as a result bears the market risk of an unfavorable change in the price of the security underlying the written option.There is a risk of loss from a change in value of such options which may exceed the related premiums received. One risk of holding a put or a call option is that if the option is not sold or exercised prior to its expiration, it becomes worthless. However, this risk is limited to the premium paid by the fund. Upon the expiration or closing of the option transaction, a gain or loss is reported in the Statement of Operations.
34
The following summarizes the fund’s call/put options written for the period ended April 30, 2010:
| | | | |
| | Face Amount | | Options Terminated |
| | Covered by | Premiums | | Net Realized |
| Options Written: | Contracts ($) | Received ($) | Cost ($) | Gain ($) |
| Contracts outstanding | | | | |
| April 30, 2009 | 41,180,000 | 153,787 | | |
| Contracts written | 613,933,000 | 9,279,014 | | |
| Contracts expired: | | | | |
| Closed | 282,167,000 | 4,733,907 | 3,987,097 | 746,810 |
| Expired | 223,619,000 | 821,589 | — | 821,589 |
| Total contracts | | | | |
| terminated | 505,786,000 | 5,555,496 | 3,987,097 | 1,568,399 |
| Contracts outstanding | | | | |
| April 30, 2010 | 149,327,000 | 3,877,305 | | |
At April 30, 2010, the cost of investments for federal income tax purposes was $943,125,581; accordingly, accumulated net unrealized appreciation on investments was $17,513,551, consisting of $21,512,878 gross unrealized appreciation and $3,999,327 gross unrealized depreciation.
NOTE 5—Subsequent Events Evaluation:
Dreyfus has evaluated the need for disclosures and/or adjustments resulting from subsequent events through the date the financial statements were issued. This evaluation did not result in any subsequent events that necessitated disclosures and/or adjustments.
The Fund 35
|
| REPORT OF INDEPENDENT REGISTERED |
| PUBLIC ACCOUNTING FIRM |
Shareholders and Board of Directors
Dreyfus GNMA Fund
We have audited the accompanying statement of assets and liabilities, including the statements of investments and options written, of Dreyfus GNMA Fund (the sole series comprising Dreyfus Premier GNMA Fund, Inc.), as of April 30, 2010, and the related statement of operations for the year then ended, the statement of changes in net assets for each of the two years in the period then ended, and financial highlights for each of the periods indicated therein. These financial statements and financial highlights are the responsibility of the Fund’s management. Our responsibility is to express an opinion on these financial statements and financial highlights based on our audits.
We conducted our audits in accordance with the standards of the Public Company Accounting Oversight Board (United States).Those standards require that we plan and perform the audit to obtain reasonable assurance about whether the financial statements and financial highlights are free of material misstatement.We were not engaged to perform an audit of the Fund’s internal control over financial reporting. Our audits included consideration of internal control over financial reporting as a basis for designing audit procedures that are appropriate in the circumstances, but not for the purpose of expressing an opinion on the effectiveness of the Fund’s internal control over financial reporting. Accordingly, we express no such opinion.An audit also includes examining, on a test basis, evidence supporting the amounts and disclosures in the financial statements and financial highlights, assessing the accounting principles used and significant estimates made by management, and evaluating the overall financial statement presentation. Our procedures included confirmation of securities owned as of April 30, 2010 by correspondence with the custodian and others.We believe that our audits provide a reasonable basis for our opinion.
In our opinion, the financial statements and financial highlights referred to above present fairly, in all material respects, the financial position of Dreyfus GNMA Fund at April 30, 2010, the results of its operations for the year then ended, the changes in its net assets for each of the two years in the period then ended, and the financial highlights for each of the indicated periods, in conformity with U.S. generally accepted accounting principles.

New York, New York
June 25, 2010
36
IMPORTANT TAX INFORMATION (Unaudited)
For federal tax purposes the fund hereby designates 100% of ordinary income dividends paid during the fiscal year ended April 30, 2010 as qualifying “interest related dividends.”
The Fund 37
|
| INFORMATION ABOUT THE REVIEW AND APPROVAL OF |
| THE FUND’S MANAGEMENT AGREEMENT (Unaudited) |
At a meeting of the fund’s Board of Directors held on November 9-10, 2009, the Board considered the re-approval of the fund’s Management Agreement for an annual period, pursuant to which the Manager provides the fund with investment advisory and administrative services. The Board members, none of whom are “interested persons” (as defined in the Investment Company Act of 1940, as amended) of the fund, were assisted in their review by independent legal counsel and met with counsel at each meeting in executive session separate from representatives of the Manager.
Analysis of Nature,Extent,and Quality of Services Provided to the Fund. The Board members considered information previously provided to them in a presentation from representatives of the Manager regarding services provided to the fund and other funds in the Dreyfus complex, and representatives of the Manager confirmed that there had been no material changes in the information.The Board also discussed the nature, extent, and quality of the services provided to the fund pursuant to the fund’s Management Agreement.The Manager’s representatives reviewed the fund’s distribution of accounts and the relationships the Manager has with various intermediaries and the different needs of each. The Manager’s representatives noted the diversity of distribution channels of the fund, including that it had just recently implemented a multiple class structure , as well as among the funds in the Dreyfus fund complex, and the Manager’s corresponding need for broad, deep, and diverse resources to be able to provide ongoing shareholder services to each of the fund’s distribution channels.The Board also reviewed the number of shareholder accounts in the fund, as well as the fund’s asset size.
The Board members also considered the Manager’s research and portfolio management capabilities. The Board members also considered that the Manager also provides oversight of day-to-day fund operations, including fund accounting and administration and assistance in meeting legal and regulatory requirements, and the Manager’s extensive administrative, accounting, and compliance infrastructure.
38
Comparative Analysis of the Fund’s Management Fee and Expense Ratio and Performance. The Board members reviewed reports furnished by the Manager that were prepared by Lipper, Inc., an independent provider of investment company data, which included information comparing the fund’s management fee and expense ratio with a group of comparable funds (the “Expense Group”) and with a broader group of funds (the “Expense Universe”) that were selected by Lipper. Included in these reports were comparisons of contractual and actual management fee rates and total operating expenses.
The Board members also reviewed the reports prepared by Lipper that presented the fund’s performance, and comparisons of yield and total return performance among the same group of funds as the Expense Group (the “Performance Group”) and to a group of funds that was broader than the Expense Universe (the “Performance Universe”) that also was selected by Lipper.The Manager previously had furnished the Board with a description of the methodology Lipper used to select the fund’s Expense Group and Expense Universe, and Performance Group and Performance Universe.
The Board reviewed the results of the Expense Group and Expense Universe comparisons that were prepared based on financial statements currently available to Lipper as of September 30, 2009. The Board reviewed the range of management fees and expense ratios of the funds in the Expense Group and Expense Universe, and noted that the fund’s contractual management fee was higher than the Expense Group median, and that the fund’s actual management fee was higher than the Expense Group and Expense Universe medians. The Board also noted that the fund’s total expense ratio (for Class A shares) was higher than the Expense Group and Expense Universe medians. Representatives of the Manager advised the Board that the Manager would limit the total expense ratio of the fund’s Class A, Class B, and Class C shares to 0.70% plus applicable Rule 12b-1/share-
The Fund 39
|
| INFORMATION ABOUT THE REVIEW AND APPROVAL OF THE |
| FUND’S MANAGEMENT AGREEMENT (Unaudited) (continued) |
holder servicing fees, taxes, brokerage commissions, commitment fees on borrowings, and extraordinary expenses, for the period from December 1, 2009 through November 30, 2010.
With respect to the fund’s performance, because the fund’s Class A shares have only two full years of performance history, the Board also reviewed results for the fund’s Class Z shares, which is the fund’s oldest share class.The Board noted that the fund’s Class Z shares achieved a third quartile total return ranking (the first quartile being the highest performance ranking group) in the Performance Group for the 1-year period and fourth quartile total return rankings in the Performance Group for each longer-term time period up to 10 years. Class Z shares also achieved third quartile or fourth quartile total return rankings in the Performance Universe for each reported time period up to 10 years. The Board also noted that the fund’s Class A shares achieved lower returns than Class Z shares, and achieved fourth quartile total return rankings in the Performance Group and Performance Universe for each reported time period up to 10 years.The Board received a presentation from the fund’s primary portfolio manager discussing portfolio management strategy for the prior year, and the Board considered the factors presented that contributed to the fund’s relative total return performance.The Board also noted from the reports the fund’s closely competitive absolute total returns due to the narrow spreads among total returns for the fund (Class Z and Class A shares) and the Performance Group funds, noting further that a fraction of one percent separated the fund (Class Z and Class A shares) from second quartile total return rankings for each reported time period up to 10 years.The Board then further noted, from materials separately provided to the Board members at the meeting, that the fund achieved total return results ranking in the second quartile of the fund’s Lipper category on a 3-month and year-to-date basis through September 30, 2009.
On a yield performance basis, the Board noted that the 1-year yield performance for Class Z shares was lower than the Performance Group median for 8 of the 10 annual periods (higher for the other 2 periods) and lower than the Performance Universe median for 7 of the
40
10 annual periods (higher for the other 3 periods). For Class A shares, the 1-year yield performance figures were lower than the Performance Group and Performance Universe medians for each of the two reported annual periods.
Representatives of the Manager reviewed with the Board members the fees paid to the Manager or its affiliates by the one mutual fund managed by the Manager or its affiliates reported in the same Lipper category as the fund (the “Similar Fund”), and explained the nature of the Similar Fund and any differences, from the Manager’s perspective, in providing services to the Similar Fund as compared to the fund.The Manager’s representatives also reviewed the costs associated with distribution through intermediaries. The Board analyzed differences in fees paid to the Manager and discussed the relationship of the management fees paid in light of the services provided.The Board members considered the relevance of the fee information provided for the Similar Fund, to evaluate the appropriateness and reasonableness of the fund’s management fee. Representatives of the Manager also noted that there were no similarly managed institutional separate accounts or wrap fee accounts managed by the Manager or its affiliates with similar investment objectives, policies, and strategies as the fund.
Analysis of Profitability and Economies of Scale. The Manager’s representatives reviewed the dollar amount of expenses allocated and profit received by the Manager and the method used to determine such expenses and profit.The Board considered information, previously provided and discussed, prepared by an independent consulting firm regarding the Manager’s approach to allocating costs to, and determining the profitability of, individual funds and the entire Dreyfus mutual fund complex.The Board members also considered that the methodology had also been reviewed by an independent registered public accounting firm which, like the consultant, found the methodology to be reasonable.The consulting firm also analyzed where any economies of scale might emerge in connection with the management of the fund. The Board members evaluated the profitability analysis in light of the
The Fund 41
|
| INFORMATION ABOUT THE REVIEW AND APPROVAL OF THE |
| FUND’S MANAGEMENT AGREEMENT (Unaudited) (continued) |
relevant circumstances for the fund, including the decline in fund assets from the prior year, and the extent to which economies of scale would be realized if the fund grows and whether fee levels reflect these economies of scale for the benefit of fund shareholders. The Board members also considered potential benefits to the Manager from acting as investment adviser to the fund and noted that there were no soft dollar arrangements in effect with respect to trading the fund’s portfolio.
It was noted at each meeting that the Board members should consider the Manager’s profitability with respect to the fund as part of their evaluation of whether the fees under the Management Agreement bear a reasonable relationship to the mix of services provided by the Manager, including the nature, extent, and quality of such services and that a discussion of economies of scale is predicated on increasing assets and that, if a fund’s assets had been decreasing, the possibility that the Manager may have realized any economies of scale would be less. It was noted at the Meeting that the profitability percentage for managing the fund was within the range determined by appropriate court cases to be reasonable given the services rendered and that the profitability percentage for managing the fund was reasonable given the generally superior service levels provided.
At the conclusion of these discussions, the Board agreed that it had been furnished with sufficient information to make an informed business decision with respect to continuation of the fund’s Management Agreement for the relevant period. Based on the discussions and considerations as described above, the Board reached the following conclusions and determinations.
The Board concluded that the nature, extent, and quality of the ser- vices provided by the Manager are adequate and appropriate.
As to the fund’s performance, the Board noted the general competi- tiveness of the fund’s absolute returns within the asset class and the narrow spreads in total returns among the fund and the Performance Group funds, as well as the portfolio manager’s explanation of the fund’s investment strategy over the past year, and recent total return results.
42
The Board concluded that the fee paid to the Manager by the fund was reasonable in light of the services provided, comparative perfor- mance and expense and advisory fee information, including the Manager’s undertaking to limit the expenses of the fund’s Class A, Class B, and Class C shares for a 1-year period, costs of the services provided, and profits to be realized and benefits derived or to be derived by the Manager from its relationship with the fund.
The Board determined that the economies of scale which may accrue to the Manager and its affiliates in connection with the management of the fund had been adequately considered by the Manager in con- nection with the management fee rate charged to the fund, and that, to the extent in the future it were to be determined that material economies of scale had not been shared with the fund, the Board would seek to have those economies of scale shared with the fund.
The Board members considered these conclusions and determinations, along with the information received on a routine and regular basis throughout the year, and, without any one factor being dispositive, the Board determined that re-approval of the fund’s Management Agreement was in the best interests of the fund and its shareholders.
The Fund 43

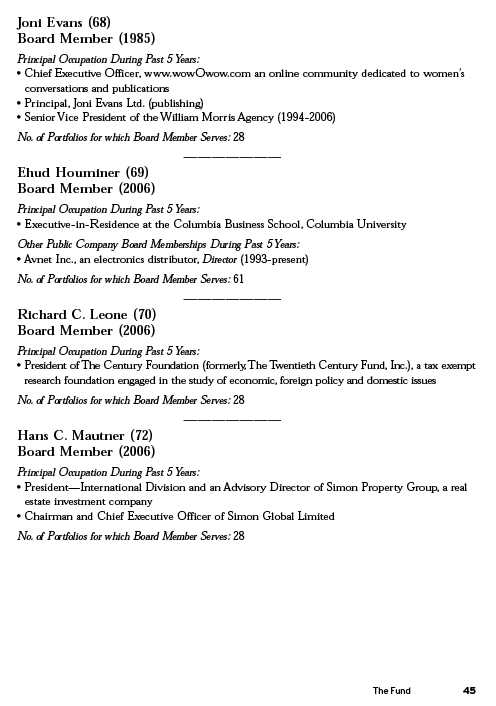
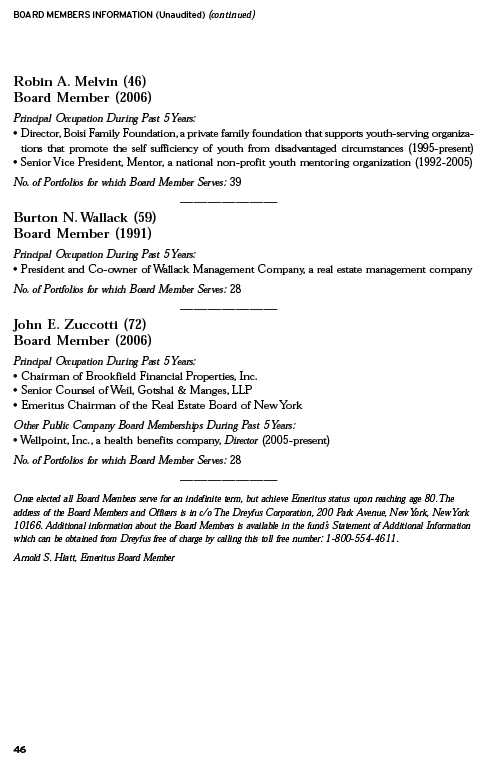
OFFICERS OF THE FUND (Unaudited)
BRADLEY J. SKAPYAK, President since January 2010.
Chief Operating Officer and a director of the Manager since June 2009. From April 2003 to June 2009, Mr. Skapyak was the head of the Investment Accounting and Support Department of the Manager. He is an officer of 76 investment companies (comprised of 167 portfolios) managed by the Manager. He is 51 years old and has been an employee of the Manager since February 1988.
PHILLIP N. MAISANO, Executive Vice President since July 2007.
Chief Investment Officer,Vice Chair and a director of the Manager, and an officer of 76 investment companies (comprised of 167 portfolios) managed by the Manager. Mr. Maisano also is an officer and/or Board member of certain other investment management subsidiaries of The Bank of New York Mellon Corporation, each of which is an affiliate of the Manager. He is 62 years old and has been an employee of the Manager since November 2006. Prior to joining the Manager, Mr. Maisano served as Chairman and Chief Executive Officer of EACM Advisors, an affiliate of the Manager, since August 2004.
MICHAEL A. ROSENBERG, Vice President and Secretary since August 2005.
Assistant General Counsel of BNY Mellon, and an officer of 77 investment companies (comprised of 190 portfolios) managed by the Manager. He is 50 years old and has been an employee of the Manager since October 1991.
KIESHA ASTWOOD, Vice President and Assistant Secretary since January 2010.
Counsel of BNY Mellon, and an officer of 77 investment companies (comprised of 190 portfolios) managed by the Manager. She is 37 years old and has been an employee of the Manager since July 1995.
JAMES BITETTO, Vice President and Assistant Secretary since August 2005.
Senior Counsel of BNY Mellon and Secretary of the Manager, and an officer of 77 investment companies (comprised of 190 portfolios) managed by the Manager. He is 43 years old and has been an employee of the Manager since December 1996.
JONI LACKS CHARATAN, Vice President and Assistant Secretary since August 2005.
Senior Counsel of BNY Mellon, and an officer of 77 investment companies (comprised of 190 portfolios) managed by the Manager. She is 54 years old and has been an employee of the Manager since October 1988.
JOSEPH M. CHIOFFI, Vice President and Assistant Secretary since August 2005.
Senior Counsel of BNY Mellon, and an officer of 77 investment companies (comprised of 190 portfolios) managed by the Manager. He is 48 years old and has been an employee of the Manager since June 2000.
KATHLEEN DENICHOLAS, Vice President and Assistant Secretary since January 2010.
Senior Counsel of BNY Mellon, and an officer of 77 investment companies (comprised of 190 portfolios) managed by the Manager. She is 35 years old and has been an employee of the Manager since February 2001.
JANETTE E. FARRAGHER, Vice President and Assistant Secretary since August 2005.
Assistant General Counsel of BNY Mellon, and an officer of 77 investment companies (comprised of 190 portfolios) managed by the Manager. She is 47 years old and has been an employee of the Manager since February 1984.
The Fund 47
OFFICERS OF THE FUND (Unaudited) (continued)
JOHN B. HAMMALIAN, Vice President and Assistant Secretary since August 2005.
Managing Counsel of BNY Mellon, and an officer of 77 investment companies (comprised of 190 portfolios) managed by the Manager. He is 46 years old and has been an employee of the Manager since February 1991.
M. CRISTINA MEISER, Vice President and Assistant Secretary since January 2010.
Senior Counsel of BNY Mellon, and an officer of 77 investment companies (comprised of 190 portfolios) managed by the Manager. She is 40 years old and has been an employee of the Manager since August 2001.
ROBERT R. MULLERY, Vice President and Assistant Secretary since August 2005.
Managing Counsel of BNY Mellon, and an officer of 77 investment companies (comprised of 190 portfolios) managed by the Manager. He is 58 years old and has been an employee of the Manager since May 1986.
JEFF PRUSNOFSKY, Vice President and Assistant Secretary since August 2005.
Managing Counsel of BNY Mellon, and an officer of 77 investment companies (comprised of 190 portfolios) managed by the Manager. He is 44 years old and has been an employee of the Manager since October 1990.
JAMES WINDELS, Treasurer since November 2001.
Director – Mutual Fund Accounting of the Manager, and an officer of 77 investment companies (comprised of 190 portfolios) managed by the Manager. He is 51 years old and has been an employee of the Manager since April 1985.
RICHARD CASSARO, Assistant Treasurer since January 2008.
Senior Accounting Manager – Money Market and Municipal Bond Funds of the Manager, and an officer of 77 investment companies (comprised of 190 portfolios) managed by the Manager. He is 51 years old and has been an employee of the Manager since September 1982.
GAVIN C. REILLY, Assistant Treasurer since December 2005.
Tax Manager of the Investment Accounting and Support Department of the Manager, and an officer of 77 investment companies (comprised of 190 portfolios) managed by the Manager. He is 41 years old and has been an employee of the Manager since April 1991.
ROBERT ROBOL, Assistant Treasurer since August 2003.
Senior Accounting Manager – Fixed Income Funds of the Manager, and an officer of 77 investment companies (comprised of 190 portfolios) managed by the Manager. He is 46 years old and has been an employee of the Manager since October 1988.
ROBERT SALVIOLO, Assistant Treasurer since July 2007.
Senior Accounting Manager – Equity Funds of the Manager, and an officer of 77 investment companies (comprised of 190 portfolios) managed by the Manager. He is 43 years old and has been an employee of the Manager since June 1989.
48
ROBERT SVAGNA, Assistant Treasurer since August 2005.
Senior Accounting Manager – Equity Funds of the Manager, and an officer of 77 investment companies (comprised of 190 portfolios) managed by the Manager. He is 43 years old and has been an employee of the Manager since November 1990.
JOSEPH W. CONNOLLY, Chief Compliance Officer since October 2004.
Chief Compliance Officer of the Manager and The Dreyfus Family of Funds (77 investment companies, comprised of 190 portfolios). From November 2001 through March 2004, Mr. Connolly was first Vice-President, Mutual Fund Servicing for Mellon Global Securities Services. In that capacity, Mr. Connolly was responsible for managing Mellon’s Custody, Fund Accounting and Fund Administration services to third-party mutual fund clients. He is 52 years old and has served in various capacities with the Manager since 1980, including manager of the firm’s Fund Accounting Department from 1997 through October 2001.
WILLIAM GERMENIS, Anti-Money Laundering Compliance Officer since October 2002.
Vice President and Anti-Money Laundering Compliance Officer of the Distributor, and the Anti-Money Laundering Compliance Officer of 73 investment companies (comprised of 186 portfolios) managed by the Manager. He is 39 years old and has been an employee of the Distributor since October 1998.
The Fund 49
Item 2. Code of Ethics.
The Registrant has adopted a code of ethics that applies to the Registrant's principal executive officer, principal financial officer, principal accounting officer or controller, or persons performing similar functions. There have been no amendments to, or waivers in connection with, the Code of Ethics during the period covered by this Report.
Item 3. Audit Committee Financial Expert.
The Registrant's Board has determined that Ehud Houminer, a member of the Audit Committee of the Board, is an audit committee financial expert as defined by the Securities and Exchange Commission (the "SEC"). Ehud Houminer is "independent" as defined by the SEC for purposes of audit committee financial expert determinations.
Item 4. Principal Accountant Fees and Services.
(a) Audit Fees. The aggregate fees billed for each of the last two fiscal years (the "Reporting Periods") for professional services rendered by the Registrant's principal accountant (the "Auditor") for the audit of the Registrant's annual financial statements or services that are normally provided by the Auditor in connection with the statutory and regulatory filings or engagements for the Reporting Periods, were $56,619 in 2009 and $56,619 in 2010.
(b) Audit-Related Fees. The aggregate fees billed in the Reporting Periods for assurance and related services by the Auditor that are reasonably related to the performance of the audit of the Registrant's financial statements and are not reported under paragraph (a) of this Item 4 were $10, 552 in 2009 and $5,382 in 2010. These services consisted of one or more of the following: (i) agreed upon procedures related to compliance with Internal Revenue Code section 817(h), (ii) security counts required by Rule 17f-2 under the Investment Company Act of 1940, as amended, (iii) advisory services as to the accounting or disclosure treatment of Registrant transactions or events and (iv) advisory services to the accounting or disclosure treatment of the actual or potential im pact to the Registrant of final or proposed rules, standards or interpretations by the Securities and Exchange Commission, the Financial Accounting Standards Boards or other regulatory or standard-setting bodies.
The aggregate fees billed in the Reporting Periods for non-audit assurance and related services by the Auditor to the Registrant's investment adviser (not including any sub-investment adviser whose role is primarily portfolio management and is subcontracted with or overseen by another investment adviser), and any entity controlling, controlled by or under common control with the investment adviser that provides ongoing services to the Registrant ("Service Affiliates"), that were reasonably related to the performance of the annual audit of the Service Affiliate, which required pre-approval by the Audit Committee were $0 in 2009 and $0 in 2010.
(c) Tax Fees. The aggregate fees billed in the Reporting Periods for professional services rendered by the Auditor for tax compliance, tax advice, and tax planning ("Tax Services") were $3,993 in 2009 and $3,488 in 2010. These services consisted of: (i) review or preparation of U.S. federal, state, local and excise tax returns; (ii) U.S. federal, state and local tax planning, advice and assistance regarding statutory, regulatory or administrative developments; (iii) tax advice regarding tax qualification matters and/or treatment of various financial instruments held or proposed to be acquired or held. The aggregate fees billed in the Reporting Periods for Tax Services by the Auditor to Service Affiliates, which required pre-approval by the Audit Committee were $0 in 2009 and $0 in 2010.
(d) All Other Fees. The aggregate fees billed in the Reporting Periods for products and services provided by the Auditor, other than the services reported in paragraphs (a) through (c) of this Item, were $219 in 2009 and $0 in 2010. These services consisted of a review of the Registrant's anti-money laundering program.
The aggregate fees billed in the Reporting Periods for Non-Audit Services by the Auditor to Service Affiliates, other than the services reported in paragraphs (b) through (c) of this Item, which required pre-approval by the Audit Committee, were $0 in 2009 and $0 in 2010.
(e)(1) Audit Committee Pre-Approval Policies and Procedures. The Registrant's Audit Committee has established policies and procedures (the "Policy") for pre-approval (within specified fee limits) of the Auditor's engagements for non-audit services to the Registrant and Service Affiliates without specific case-by-case consideration. The pre-approved services in the Policy can include pre-approved audit services, pre-approved audit-related services, pre-approved tax services and pre-approved all other services. Pre-approval considerations include whether the proposed services are compatible with maintaining the Auditor's independence. Pre-approvals pursuant to the Policy are considered annually.
(e)(2) Note: None of the services described in paragraphs (b) through (d) of this Item 4 were approved by the Audit Committee pursuant to paragraph (c)(7)(i)(C) of Rule 2-01 of Regulation S-X.
(f) None of the hours expended on the principal accountant's engagement to audit the registrant's financial statements for the most recent fiscal year were attributed to work performed by persons other than the principal account's full-time, permanent employees.
Non-Audit Fees. The aggregate non-audit fees billed by the Auditor for services rendered to the Registrant, and rendered to Service Affiliates, for the Reporting Periods were $18,957,657 in 2009 and $27,572,994 in 2010.
Auditor Independence. The Registrant's Audit Committee has considered whether the provision of non-audit services that were rendered to Service Affiliates, which were not pre-approved (not requiring pre-approval), is compatible with maintaining the Auditor's independence.
Item 5. Audit Committee of Listed Registrants.
Not applicable. [CLOSED-END FUNDS ONLY]
Item 6. Investments.
(a) Not applicable.
Item 7. Disclosure of Proxy Voting Policies and Procedures for Closed-End Management Investment Companies.
Not applicable. [CLOSED-END FUNDS ONLY]
Item 8. Portfolio Managers of Closed-End Management Investment Companies.
Not applicable. [CLOSED-END FUNDS ONLY, beginning with reports for periods ended on and after December 31, 2005]
Item 9. Purchases of Equity Securities by Closed-End Management Investment Companies and Affiliated Purchasers.
Not applicable. [CLOSED-END FUNDS ONLY]
Item 10. Submission of Matters to a Vote of Security Holders.
There have been no material changes to the procedures applicable to Item 10.
Item 11. Controls and Procedures.
(a) The Registrant's principal executive and principal financial officers have concluded, based on their evaluation of the Registrant's disclosure controls and procedures as of a date within 90 days of the filing date of this report, that the Registrant's disclosure controls and procedures are reasonably designed to ensure that information required to be disclosed by the Registrant on Form N-CSR is recorded, processed, summarized and reported within the required time periods and that information required to be disclosed by the Registrant in the reports that it files or submits on Form N-CSR is accumulated and communicated to the Registrant's management, including its principal executive and principal financial officers, as appropriate to allow timely decisions regarding required disclosure.
(b) There were no changes to the Registrant's internal control over financial reporting that occurred during the second fiscal quarter of the period covered by this report that have materially affected, or are reasonably likely to materially affect, the Registrant's internal control over financial reporting.
Item 12. Exhibits.
(a)(1) Code of ethics referred to in Item 2.
(a)(2) Certifications of principal executive and principal financial officers as required by Rule 30a-2(a) under the Investment Company Act of 1940.
(a)(3) Not applicable.
(b) Certification of principal executive and principal financial officers as required by Rule 30a-2(b) under the Investment Company Act of 1940.
SIGNATURES
Pursuant to the requirements of the Securities Exchange Act of 1934 and the Investment Company Act of 1940, the Registrant has duly caused this Report to be signed on its behalf by the undersigned, thereunto duly authorized.
| |
| Dreyfus Premier GNMA Fund, Inc. |
| - | Dreyfus GNMA Fund |
| |
| By: | /s/ Bradley J. Skapyak |
| Bradley J. Skapyak, |
| | President |
| |
| Date: | June 23, 2010 |
Pursuant to the requirements of the Securities Exchange Act of 1934 and the Investment Company Act of 1940, this Report has been signed below by the following persons on behalf of the Registrant and in the capacities and on the dates indicated.
| |
| By: | /s/ Bradley J. Skapyak |
| | Bradley J. Skapyak, |
| | President |
| |
| Date: | June 23, 2010 |
| |
| By: | /s/ James Windels |
| James Windels, |
| | Treasurer |
| |
| Date: | June 23, 2010 |
EXHIBIT INDEX
(a)(1) Code of ethics referred to in Item 2.
(a)(2) Certifications of principal executive and principal financial officers as required by Rule 30a-2(a) under the Investment Company Act of 1940. (EX-99.CERT)
(b) Certification of principal executive and principal financial officers as required by Rule 30a-2(b) under the Investment Company Act of 1940. (EX-99.906CERT)