UNITED STATES
SECURITIES AND EXCHANGE COMMISSION
Washington, D.C. 20549
FORM N-CSR
CERTIFIED SHAREHOLDER REPORT OF REGISTERED MANAGEMENT
INVESTMENT COMPANIES
Investment Company Act file number | 811- 04215 | |||||
|
| |||||
| Dreyfus Premier GNMA Fund, Inc. |
| ||||
| (Exact name of Registrant as specified in charter) |
| ||||
|
|
| ||||
|
c/o The Dreyfus Corporation 200 Park Avenue New York, New York 10166 |
| ||||
| (Address of principal executive offices) (Zip code) |
| ||||
|
|
| ||||
| Bennett A. MacDougall, Esq. 200 Park Avenue New York, New York 10166 |
| ||||
| (Name and address of agent for service) |
| ||||
| ||||||
Registrant's telephone number, including area code: | (212) 922-6400 | |||||
|
| |||||
Date of fiscal year end:
| 4/30 |
| ||||
Date of reporting period: | 4/30/2016 |
| ||||
Dreyfus GNMA Fund
| ANNUAL REPORT |

|

Save time. Save paper. View your next shareholder report online as soon as it’s available. Log into www.dreyfus.com and sign up for Dreyfus eCommunications. It’s simple and only takes a few minutes. |
The views expressed in this report reflect those of the portfolio manager only through the end of the period covered and do not necessarily represent the views of Dreyfus or any other person in the Dreyfus organization. Any such views are subject to change at any time based upon market or other conditions and Dreyfus disclaims any responsibility to update such views. These views may not be relied on as investment advice and, because investment decisions for a Dreyfus fund are based on numerous factors, may not be relied on as an indication of trading intent on behalf of any Dreyfus fund. |
Not FDIC-Insured • Not Bank-Guaranteed • May Lose Value |
Contents
THE FUND
With Those of Other Funds | |
Public Accounting Firm | |
the Fund’s Management Agreement | |
FOR MORE INFORMATION
Back Cover
| The Fund |
Dear Shareholder:
We are pleased to present this annual report for Dreyfus GNMA Fund, covering the 12-month period from May 1, 2015 through April 30, 2016. For information about how the fund performed during the reporting period, as well as general market perspectives, we provide a Discussion of Fund Performance on the pages that follow.
A choppy U.S. economic recovery remained intact over the reporting period. Steady job growth, declining unemployment claims, improved consumer confidence, and higher housing prices supported an economic expansion that so far has lasted nearly seven years. These factors, along with low inflation, prompted the Federal Reserve Board in December 2015 to raise short-term interest rates for the first time in nearly a decade.
On the other hand, the global economy continued to stagnate despite historically aggressive monetary policies, including negative short-term interest rates in Europe and Japan. Global growth has been hampered by weak demand, volatile commodity prices, the lingering effects of various financial crises, unfavorable demographic trends, and low productivity growth. These developments proved especially challenging for financial markets in early 2016, but stocks and riskier sectors of the bond market later rallied strongly to post positive total returns, on average, for the reporting period overall.
While we are encouraged by the recent resilience of the financial markets, we expect volatility to persist over the foreseeable future until global economic uncertainty abates. In addition, wide differences in underlying fundamental and technical influences across various asset classes, economic sectors, and regional markets suggest that selectivity may be an important determinant of investment success over the months ahead. We encourage you to discuss the implications of our observations with your financial advisor.
Thank you for your continued confidence and support.
Sincerely,

J. Charles Cardona
President
The Dreyfus Corporation
May 16, 2016
2
DISCUSSION OF FUND PERFORMANCE
For the period of May 1, 2015 through April 30, 2016, as provided by Robert Bayston, CFA, Portfolio Manager
Fund and Market Performance Overview
For the 12-month period ended April 30, 2016, Dreyfus GNMA Fund’s Class A shares produced a total return of 1.57%, Class C shares returned 0.72%, and Class Z shares returned 1.62%.1 Between its inception on September 1, 2015, and April 30, 2016, the fund’s Class Y shares produced a total return of 2.25%. In comparison, the fund’s benchmark, the Barclays GNMA Index (the “Index”), achieved a total return of 2.31% for the 12-month period.2
GNMA mortgage-backed securities produced mildly positive total returns, on average, over the reporting period amid uncertainty regarding monetary policy changes from the Federal Reserve Board (the “Fed”). The fund produced lower returns than its benchmark, in part due to its positions in Treasury Inflation Protected Securities (“TIPS”).
The Fund’s Investment Approach
The fund seeks to maximize total return, consisting of capital appreciation and current income. To pursue this goal, the fund invests at least 80% of its net assets, plus any borrowings for investment purposes, in Government National Mortgage Association (“GNMA” or “Ginnie Mae”) securities. The remainder may be allocated to other mortgage-related securities, including U.S. government agency securities and privately issued mortgage-backed securities, as well as asset-backed securities, U.S. Treasuries, and repurchase agreements.
Mortgage-Backed Securities Lagged amid Uncertainty
Despite a sustained U.S. economic recovery throughout the reporting period, worries about instability in overseas economies dampened investor sentiment. A debt crisis in Greece, an economic slowdown in China, and sharply falling commodity prices triggered a flight to traditional safe havens over the summer of 2015, hurting riskier asset classes while sending prices of high-quality U.S. government securities higher and yields lower. Market volatility continued over the remainder of 2015 when investors reacted to weak global economic data and expectations that the Fed would begin to raise short-term interest rates for the first time in nearly 10 years, as indeed it did in December. The U.S. bond market encountered renewed turbulence in January 2016 when investors again worried that international weakness might derail the U.S. recovery. Although many of these concerns eased over the spring, intensifying demand for high-quality U.S. investments put downward pressure on Treasury yields for the reporting period overall, helping U.S. government securities produce positive total returns.
However, GNMA securities generally lagged U.S. Treasury securities with comparable maturities. A number of factors caused yield differences to widen, including uncertainty as to whether the Fed would continue to reinvest in mortgage-backed securities as part of an accommodative monetary policy. In addition, the Fed’s December rate hike, concerns about further policy tightening, and lower mortgage insurance premiums sparked worries that refinancing rates would increase. Finally, supply-and-demand dynamics contributed to the underperformance of GNMA securities compared to conventional mortgage-backed securities.
3
DISCUSSION OF FUND PERFORMANCE (continued)
TIPS Positions Hampered Fund Results
Although the fund participated in the benchmark’s positive total return over the reporting period, relative performance was undermined to a degree by its generally defensive investment posture. We maintained relatively light positions in GNMA securities in light of their sensitivity to uncertainty surrounding Fed policy, instead allocating a portion of the fund’s assets to TIPS, commercial mortgage-backed securities from U.S. government agencies, and short-term asset-backed securities. Positions in commercial mortgages and asset-backed securities proved additive to the fund’s relative results, but exposure to TIPS offset those benefits when inflationary pressures remained muted.
On a more positive note, the fund’s relative performance was buoyed by a more defensive security selection strategy. We reduced exposure to higher-coupon securities in favor of lower coupons that tend to be less sensitive to prepayment pressures. The fund’s interest-rate strategy—including an average duration that was roughly in line with market averages over most of the reporting period—had relatively little impact on relative results.
At times during the reporting period, we employed futures contracts to establish the fund’s interest-rate positions and swap options to hedge its positions in commercial mortgages.
A Conservative Investment Posture
Despite the adverse impact of global economic headwinds on U.S. exporters and commodities producers, we currently expect the domestic economy to continue to grow. We also anticipate that the Fed will implement one or more additional rate hikes at some point in 2016, but any increases are likely to be modest and gradual. Nonetheless, influences within the mortgage-backed securities market, including ongoing policy and prepayment risks, could continue to weigh on GNMA securities over the months ahead.
Therefore, we have adopted a relatively cautious investment posture designed to protect the fund from market uncertainty. We have maintained underweighted exposure to GNMA securities compared to the benchmark, and we have continued to allocate a portion of the fund’s assets to TIPS and other government-backed bonds that, in our judgment, represent better values. Of course, we are prepared to shift toward a more constructive investment posture as market conditions evolve.
May 16, 2016
Bond funds are subject generally to interest rate, credit, liquidity, and market risks, to varying degrees, all of which are more fully described in the fund’s prospectus. Generally, all other factors being equal, bond prices are inversely related to interest-rate changes, and rate increases can cause price declines.
The fund may use derivative instruments, such as options, futures and options on futures, forward contracts, swaps (including credit default swaps on corporate bonds and asset-backed securities), options on swaps, and other credit derivatives. A small investment in derivatives could have a potentially large impact on the fund’s performance. The use of derivatives involves risks different from, or possibly greater than, the risks associated with investing directly in the underlying assets.
1 Total return includes reinvestment of dividends and any capital gains paid, and does not take into consideration the maximum initial sales charge in the case of Class A shares, or the applicable contingent deferred sales charge imposed on redemptions in the case of Class C shares. Had these charges been reflected, returns would have been lower. Class Z and Class Y are not subject to any initial or deferred sales charge. Past performance is no guarantee of future results. Share price, yield, and investment return fluctuate such that upon redemption, fund shares may be worth more or less than their original cost.
2 SOURCE: Lipper Inc. — Reflects reinvestment of dividends and, where applicable, capital gain distributions. The Barclays GNMA Index is an unmanaged, total return performance benchmark for the GNMA market consisting of 15- and 30-year fixed-rate securities backed by mortgage pools of the Government National Mortgage Association. Index returns do not reflect fees and expenses associated with operating a mutual fund. Investors cannot invest directly in any index.
4
FUND PERFORMANCE
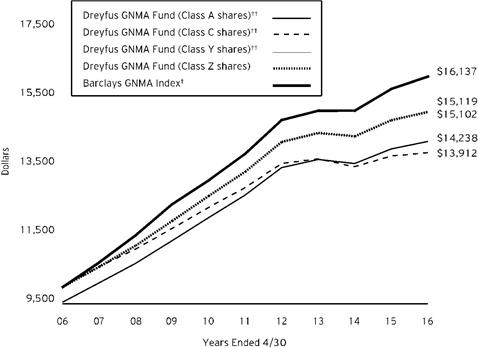
Comparison of change in value of $10,000 investment in Dreyfus GNMA Fund Class A shares, Class C shares, Class Y shares and Class Z shares and the Barclays GNMA Index
† Source: Lipper Inc.
†† The total return figures presented for Class A and Class C shares of the fund reflect the performance of the fund’s Class Z shares for the period prior to 5/3/07 (the inception date for Class A and Class C shares), adjusted to reflect the applicable sales load for Class A shares.
The total return figures presented for Class Y shares of the fund reflect the performance of the fund’s Class Z shares for the period prior to 9/1/15 (the inception date for Class Y shares).
Past performance is not predictive of future performance.
The above graph compares a $10,000 investment made in each of the Class A, Class C, Class Y and Class Z shares of Dreyfus GNMA Fund on 4/30/06 to a $10,000 investment made in the Barclays GNMA Index (the “Index”) on that date. All dividends and capital gain distributions are reinvested.
The fund invests primarily in Ginnie Maes and its performance shown in the line graph above takes into account the maximum initial sales charge on Class A shares and all other applicable fees and expenses on all classes. Unlike the fund, the Index is an unmanaged total return performance benchmark for the GNMA market, consisting of 15- and 30-year fixed-rate GNMA securities. All issues have at least one year to maturity and an outstanding par value of at least $100 million. These factors can contribute to the Index potentially outperforming or underperforming the fund. Unlike a mutual fund, the Index is not subject to charges, fees and other expenses. Investors cannot invest directly in any index. Further information relating to fund performance, including expense reimbursements, if applicable, is contained in the Financial Highlights section of the prospectus and elsewhere in this report.
5
FUND PERFORMANCE (continued)
Average Annual Total Returns as of 4/30/16 | ||||
| ||||
Inception Date | 1 Year | 5 Years | 10 Years | |
Class A shares | ||||
with maximum sales charge (4.5%) | 5/3/07 | -3.03% | 1.42% | 3.60%†† |
without sales charge | 5/3/07 | 1.57% | 2.36% | 4.08%†† |
Class C shares | ||||
with applicable redemption charge † | 5/3/07 | -0.28% | 1.54% | 3.36%†† |
without redemption | 5/3/07 | 0.72% | 1.54% | 3.36%†† |
Class Y shares | 9/1/15 | 1.73%†† | 2.50%†† | 4.22%†† |
Class Z shares | 5/29/85 | 1.62% | 2.48% | 4.21% |
Barclays GNMA Index | 2.31% | 3.05% | 4.90% | |
Past performance is not predictive of future performance. The fund’s performance shown in the graph and table does not reflect the deduction of taxes that a shareholder would pay on fund distributions or the redemption of fund shares. In addition to the performance of Class A shares shown with and without a maximum sales charge, the fund’s performance shown in the table takes into account all other applicable fees and expenses on all classes.
† The maximum contingent deferred sales charge for Class C shares is 1% for shares redeemed within one year of the date of purchase.
†† The total return performance figures presented for Class A and Class C shares of the fund reflect the performance of the fund’s Class Z shares for the period prior to 5/3/07 (the inception date for Class A and Class C shares), adjusted to reflect the applicable sales load for Class A shares.
The total return figures presented for Class Y shares of the fund reflect the performance of the fund’s Class Z shares for the period prior to 9/1/15 (the inception date for Class Y shares).
6
UNDERSTANDING YOUR FUND’S EXPENSES (Unaudited)
As a mutual fund investor, you pay ongoing expenses, such as management fees and other expenses. Using the information below, you can estimate how these expenses affect your investment and compare them with the expenses of other funds. You also may pay one-time transaction expenses, including sales charges (loads) and redemption fees, which are not shown in this section and would have resulted in higher total expenses. For more information, see your fund’s prospectus or talk to your financial adviser.
Review your fund’s expenses
The table below shows the expenses you would have paid on a $1,000 investment in Dreyfus GNMA Fund from November 1, 2015 to April 30, 2016. It also shows how much a $1,000 investment would be worth at the close of the period, assuming actual returns and expenses.
Expenses and Value of a $1,000 Investment | |||||||||||
assuming actual returns for the six months ended April 30, 2016 | |||||||||||
|
|
|
| Class A | Class C | Class Y | Class Z | ||||
Expenses paid per $1,000† | $5.26 | $9.30 | $3.81 | $4.66 | |||||||
Ending value (after expenses) | $1,016.40 | $1,012.00 | $1,018.00 | $1,017.00 | |||||||
COMPARING YOUR FUND’S EXPENSES
WITH THOSE OF OTHER FUNDS (Unaudited)
Using the SEC’s method to compare expenses
The Securities and Exchange Commission (SEC) has established guidelines to help investors assess fund expenses. Per these guidelines, the table below shows your fund’s expenses based on a $1,000 investment, assuming a hypothetical 5% annualized return. You can use this information to compare the ongoing expenses (but not transaction expenses or total cost) of investing in the fund with those of other funds. All mutual fund shareholder reports will provide this information to help you make this comparison. Please note that you cannot use this information to estimate your actual ending account balance and expenses paid during the period.
Expenses and Value of a $1,000 Investment | |||||||||||
assuming a hypothetical 5% annualized return for the six months ended April 30, 2016 | |||||||||||
|
|
|
| Class A | Class C | Class Y | Class Z | ||||
Expenses paid per $1,000† | $5.27 | $9.32 | $3.82 | $4.67 | |||||||
Ending value (after expenses) | $1,019.64 | $1,015.61 | $1,021.08 | $1,020.24 | |||||||
† Expenses are equal to the fund’s annualized expense ratio of 1.05% for Class A, 1.86% for Class C, .76% for Class Y and .93% for Class Z, multiplied by the average account value over the period, multiplied by 182/366 (to reflect the one-half year period).
7
STATEMENT OF INVESTMENTS
April 30, 2016
Bonds and Notes - 106.3% | Coupon Rate (%) | Maturity | Principal | Value ($) | ||||||
Asset-Backed Ctfs./Auto Receivables - 1.4% | ||||||||||
Ally Auto Receivables Trust, | 0.75 | 2/21/17 | 861,833 | 861,743 | ||||||
BMW Vehicle Lease Trust, | 0.73 | 2/21/17 | 1,805,850 | 1,805,363 | ||||||
CarMax Auto Owner Trust, | 0.64 | 1/16/18 | 1,251,941 | 1,250,945 | ||||||
Harley-Davidson Motorcycle Trust, | 0.65 | 7/16/18 | 649,790 | 649,397 | ||||||
Nissan Auto Lease Trust, | 0.80 | 2/15/17 | 2,025,736 | 2,025,476 | ||||||
6,592,924 | ||||||||||
Asset-Backed Ctfs./Equipment - .0% | ||||||||||
John Deere Owner Trust, | 0.60 | 3/15/17 | 23,782 | 23,776 | ||||||
Asset-Backed Ctfs./Home Equity Loans - 3.0% | ||||||||||
Equivantage Home Equity Loan Trust, | 7.78 | 3/25/28 | 3,092 | a | 3,082 | |||||
GE Capital Mortgage Services Trust, | 6.27 | 4/25/29 | 16,729 | 16,849 | ||||||
Invitation Homes Trust, | 1.59 | 12/17/30 | 4,553,866 | a,b | 4,528,040 | |||||
Invitation Homes Trust, | 1.64 | 12/17/31 | 4,989,921 | a,b | 4,959,273 | |||||
Invitation Homes Trust, | 1.89 | 3/17/32 | 3,908,362 | a,b | 3,920,877 | |||||
13,428,121 | ||||||||||
U.S. Government Agencies/Mortgage-Backed - 92.7% | ||||||||||
Federal Home Loan Mortgage Corporation: | ||||||||||
Multifamily Structured Pass Through Certificates, Ser. K049, Cl. A2 , 3.01%, 8/25/25 | 1,400,000 | c | 1,476,808 | |||||||
Multifamily Structured Pass Through Certificates, Ser. KS03, Cl. A4, 3.16%, 5/25/25 | 800,000 | a,c | 846,453 | |||||||
Multifamily Structured Pass Through Certificates, Ser. K051, Cl. A2 , 3.31%, 10/25/48 | 8,000,000 | d | 8,635,883 | |||||||
Multifamily Structured Pass Through Certificates, Ser. K050, Cl. A2 , 3.33%, 8/25/25 | 2,300,000 | a,c | 2,487,163 | |||||||
5.00%, 3/1/20 | 25,098 | c | 25,862 | |||||||
Federal National Mortgage Association: | ||||||||||
2.96%, 10/1/25 | 1,100,000 | c | 1,153,193 | |||||||
2.99%, 1/1/26 | 3,386,430 | c | 3,558,567 | |||||||
3.00%, 12/1/25 | 3,450,000 | c | 3,626,981 | |||||||
Gtd. Pass-Through Ctfs., REMIC, Ser. 2003-49, Cl. JE, 3.00%, 4/25/33 | 101,114 | c | 103,163 | |||||||
4.00%, 1/1/46 | 3,494,345 | c | 3,805,112 | |||||||
4.50%, 1/1/42-4/1/44 | 6,662,892 | c | 7,271,973 | |||||||
6.00%, 4/1/35 | 521,608 | c | 595,476 | |||||||
Government National Mortgage Association I: | ||||||||||
3.50%, 9/15/41-7/15/45 | 55,023,552 | 58,275,041 | ||||||||
4.00%, 9/15/24-6/15/45 | 22,363,213 | 24,026,670 | ||||||||
4.50%, 10/15/24-10/15/41 | 31,228,258 | 34,329,910 | ||||||||
5.00%, 10/15/23-1/15/40 | 12,770,128 | 14,285,502 | ||||||||
5.50%, 6/15/20-6/15/35 | 10,031,109 | 11,402,426 | ||||||||
8
Bonds and Notes - 106.3% (continued) | Coupon Rate (%) | Maturity | Principal | Value ($) | ||||||
U.S. Government Agencies/Mortgage-Backed - 92.7% (continued) | ||||||||||
6.00%, 10/15/19-9/15/38 | 4,542,101 | 5,179,945 | ||||||||
6.50%, 5/15/28-6/15/32 | 162,341 | 186,296 | ||||||||
7.00%, 11/15/22-12/15/22 | 3,061 | 3,284 | ||||||||
7.50%, 2/15/17-5/15/26 | 1,268,960 | 1,324,457 | ||||||||
8.00%, 9/15/21-12/15/22 | 565,460 | 640,615 | ||||||||
8.50%, 12/15/16-12/15/22 | 293,812 | 298,986 | ||||||||
9.00%, 9/15/19-12/15/22 | 360,491 | 373,835 | ||||||||
9.50%, 3/15/18-1/15/25 | 116,154 | 118,327 | ||||||||
Government National Mortgage Association II: | ||||||||||
3.00% | 8,810,000 | d | 9,123,168 | |||||||
3.50% | 3,085,000 | d | 3,258,652 | |||||||
4.00% | 29,140,000 | d | 31,101,259 | |||||||
3.00%, 8/20/42-3/20/46 | 62,306,143 | 64,661,525 | ||||||||
3.50%, 9/20/42-4/20/46 | 90,270,055 | 95,771,235 | ||||||||
4.00%, 12/20/24-12/20/45 | 9,311,926 | 9,949,923 | ||||||||
4.50%, 12/20/39-3/20/41 | 3,588,724 | 3,905,659 | ||||||||
5.00%, 11/20/24-4/20/35 | 2,718,238 | 3,039,240 | ||||||||
5.50%, 1/20/34-9/20/35 | 4,652,438 | 5,251,726 | ||||||||
6.00%, 12/20/28-2/20/36 | 3,560,361 | 4,100,984 | ||||||||
6.50%, 5/20/31-7/20/31 | 473,356 | 569,077 | ||||||||
7.00%, 4/20/24-4/20/32 | 2,709,122 | 3,315,957 | ||||||||
7.50%, 9/20/30 | 37,811 | 47,392 | ||||||||
9.00%, 7/20/25 | 35,358 | 40,639 | ||||||||
9.50%, 9/20/17-2/20/25 | 23,895 | 24,571 | ||||||||
418,192,935 | ||||||||||
U.S. Government Securities - 9.2% | ||||||||||
U.S. Treasury Floating Rate, | 0.32 | 7/31/16 | 6,205,000 | a | 6,206,005 | |||||
U.S. Treasury Floating Rate, | 0.52 | 1/31/18 | 21,000,000 | a | 21,048,951 | |||||
U.S. Treasury Inflation Protected Securities, | 0.13 | 7/15/24 | 14,164,148 | e | 14,293,438 | |||||
41,548,394 | ||||||||||
Total Bonds and Notes | 479,786,150 | |||||||||
Short-Term Investments - .1% | ||||||||||
U.S. Treasury Bills | 0.35 | 9/15/16 | 275,000 | f | 274,742 | |||||
9
STATEMENT OF INVESTMENTS (continued)
Other Investment - 3.0% | Shares | Value ($) | ||||||||
Registered Investment Company; | ||||||||||
Dreyfus Institutional Preferred Plus Money Market Fund | 13,365,668 | g | 13,365,668 | |||||||
Total Investments (cost $481,232,305) | 109.4% | 493,426,560 | ||||||||
Liabilities, Less Cash and Receivables | (9.4%) | (42,231,499) | ||||||||
Net Assets | 100.0% | 451,195,061 | ||||||||
REMIC—Real Estate Mortgage Investment Conduit
a Variable rate security—rate shown is the interest rate in effect at period end. Date shown represents the earlier of the next interest reset date or ultimate maturity date.
b Security exempt from registration pursuant to Rule 144A under the Securities Act of 1933. These securities may be resold in transactions exempt from registration, normally to qualified institutional buyers. At April 30, 2016, these securities were valued at $13,408,190 or 2.97% of net assets.
c The Federal Housing Finance Agency (“FHFA”) placed the Federal Home Loan Mortgage Corporation and Federal National Mortgage Association into conservatorship with FHFA as the conservator. As such, the FHFA oversees the continuing affairs of these companies.
d Purchased on a forward commitment basis.
e Principal amount for accrual purposes is periodically adjusted based on changes in the Consumer Price Index.
f Held by or on behalf of a counterparty for open financial futures contracts.
g Investment in affiliated money market mutual fund.
Portfolio Summary (Unaudited) † | Value (%) |
U.S. Government Agencies/Mortgage-Backed | 101.9 |
Asset-Backed | 4.4 |
Short-Term/Money Market Investments | 3.1 |
109.4 |
† Based on net assets.
See notes to financial statements.
10
STATEMENT OF FINANCIAL FUTURES
April 30, 2016
Contracts | Market Value Covered by Contracts ($) | Expiration | Unrealized (Depreciation) at 04/30/2016 ($) | ||
Financial Futures Short | |||||
U.S. Treasury 5 Year Notes | 29 | (3,506,508) | June 2016 | (40,627) | |
Gross Unrealized Depreciation | (40,627) |
See notes to financial statements.
11
STATEMENT OF ASSETS AND LIABILITIES
April 30, 2016
|
|
|
|
|
|
|
|
|
| Cost |
| Value |
|
Assets ($): |
|
|
|
| ||
Investments in securities—See Statement of Investments: |
|
|
|
| ||
Unaffiliated issuers |
| 467,866,637 |
| 480,060,892 |
| |
Affiliated issuers |
| 13,365,668 |
| 13,365,668 |
| |
Cash |
|
|
|
| 14,376 |
|
Dividends and interest receivable |
|
|
|
| 1,266,422 |
|
Cash collateral held by broker—Note 4 |
|
|
|
| 624,812 |
|
Receivable for swap variation margin—Note 4 |
|
|
|
| 52,459 |
|
Prepaid expenses |
|
|
|
| 45,446 |
|
|
|
|
|
| 495,430,075 |
|
Liabilities ($): |
|
|
|
| ||
Due to The Dreyfus Corporation and affiliates—Note 3(c) |
|
|
|
| 361,292 |
|
Payable for open mortgage dollar roll transactions—Note 4 |
|
|
|
| 39,194,458 |
|
Payable for investment securities purchased |
|
|
|
| 4,362,732 |
|
Payable to broker for swap transactions—Note 4 |
|
|
|
| 103,814 |
|
Payable for shares of Common Stock redeemed |
|
|
|
| 60,103 |
|
Payable for futures variation margin—Note 4 |
|
|
|
| 2,719 |
|
Accrued expenses |
|
|
|
| 149,896 |
|
|
|
|
|
| 44,235,014 |
|
Net Assets ($) |
|
| 451,195,061 |
| ||
Composition of Net Assets ($): |
|
|
|
| ||
Paid-in capital |
|
|
|
| 445,020,521 |
|
Accumulated undistributed investment income—net |
|
|
|
| 956,311 |
|
Accumulated net realized gain (loss) on investments |
|
|
|
| (5,941,323) |
|
Accumulated net unrealized appreciation (depreciation) |
|
|
|
| 11,159,552 |
|
Net Assets ($) |
|
| 451,195,061 |
| ||
Net Asset Value Per Share | Class A | Class C | Class Y | Class Z |
|
Net Assets ($) | 47,353,942 | 4,814,957 | 1,008.66 | 399,025,153 |
|
Shares Outstanding | 3,087,546 | 313,990 | 65.75 | 26,008,513 |
|
Net Asset Value Per Share ($) | 15.34 | 15.33 | 15.34 | 15.34 |
|
See notes to financial statements.
12
STATEMENT OF OPERATIONS
Year Ended April 30, 2016
|
|
|
|
|
|
|
|
|
|
|
|
|
|
Investment Income ($): |
|
|
|
| ||
Income: |
|
|
|
| ||
Interest |
|
| 11,466,160 |
| ||
Dividends from affiliated issuers |
|
| 16,665 |
| ||
Income from securities lending—Note 1(b) |
|
| 6,634 |
| ||
Total Income |
|
| 11,489,459 |
| ||
Expenses: |
|
|
|
| ||
Management fee—Note 3(a) |
|
| 2,792,256 |
| ||
Service plan and prospectus fees—Note 3(b) |
|
| 594,378 |
| ||
Shareholder servicing costs—Note 3(c) |
|
| 473,034 |
| ||
Professional fees |
|
| 115,863 |
| ||
Custodian fees—Note 3(c) |
|
| 89,334 |
| ||
Registration fees |
|
| 49,520 |
| ||
Shareholders’ reports |
|
| 48,585 |
| ||
Distribution fees—Note 3(b) |
|
| 36,759 |
| ||
Directors’ fees and expenses—Note 3(d) |
|
| 35,689 |
| ||
Loan commitment fees—Note 2 |
|
| 5,958 |
| ||
Miscellaneous |
|
| 116,145 |
| ||
Total Expenses |
|
| 4,357,521 |
| ||
Less—reduction in fees due to earnings credits—Note 3(c) |
|
| (3,814) |
| ||
Net Expenses |
|
| 4,353,707 |
| ||
Investment Income—Net |
|
| 7,135,752 |
| ||
Realized and Unrealized Gain (Loss) on Investments—Note 4 ($): |
|
| ||||
Net realized gain (loss) on investments | 2,851,010 |
| ||||
Net realized gain (loss) on financial futures |
|
| 237,833 |
| ||
Net realized gain (loss) on swap transactions |
|
| (67,937) |
| ||
Net Realized Gain (Loss) |
|
| 3,020,906 |
| ||
Net unrealized appreciation (depreciation) on investments |
|
| (2,027,544) |
| ||
Net unrealized appreciation (depreciation) on financial futures |
|
| 50,459 |
| ||
Net unrealized appreciation (depreciation) on swap transactions |
|
| (994,076) |
| ||
Net Unrealized Appreciation (Depreciation) |
|
| (2,971,161) |
| ||
Net Realized and Unrealized Gain (Loss) on Investments |
|
| 49,745 |
| ||
Net Increase in Net Assets Resulting from Operations |
| 7,185,497 |
| |||
See notes to financial statements.
13
STATEMENT OF CHANGES IN NET ASSETS
|
|
|
| Year Ended April 30, | |||||
|
|
|
| 2016 | a |
| 2015 |
| |
Operations ($): |
|
|
|
|
|
|
|
| |
Investment income—net |
|
| 7,135,752 |
|
|
| 6,826,692 |
| |
Net realized gain (loss) on investments |
| 3,020,906 |
|
|
| 5,806,411 |
| ||
Net unrealized appreciation (depreciation) |
| (2,971,161) |
|
|
| 3,731,317 |
| ||
Net Increase (Decrease) in Net Assets | 7,185,497 |
|
|
| 16,364,420 |
| |||
Dividends to Shareholders from ($): |
|
|
|
|
|
|
|
| |
Investment income—net: |
|
|
|
|
|
|
|
| |
Class A |
|
| (932,469) |
|
|
| (889,456) |
| |
Class C |
|
| (57,715) |
|
|
| (49,811) |
| |
Class Y |
|
| (14) |
|
|
| - |
| |
Class Z |
|
| (8,515,131) |
|
|
| (8,035,161) |
| |
Total Dividends |
|
| (9,505,329) |
|
|
| (8,974,428) |
| |
Capital Stock Transactions ($): |
|
|
|
|
|
|
|
| |
Net proceeds from shares sold: |
|
|
|
|
|
|
|
| |
Class A |
|
| 4,820,426 |
|
|
| 2,196,684 |
| |
Class C |
|
| 1,158,658 |
|
|
| 203,956 |
| |
Class Y |
|
| 1,000 |
|
|
| - |
| |
Class Z |
|
| 4,258,264 |
|
|
| 7,015,288 |
| |
Dividends reinvested: |
|
|
|
|
|
|
|
| |
Class A |
|
| 783,041 |
|
|
| 742,817 |
| |
Class C |
|
| 46,350 |
|
|
| 40,046 |
| |
Class Z |
|
| 7,501,196 |
|
|
| 7,035,001 |
| |
Cost of shares redeemed: |
|
|
|
|
|
|
|
| |
Class A |
|
| (8,376,939) |
|
|
| (10,863,481) |
| |
Class C |
|
| (1,755,204) |
|
|
| (1,422,869) |
| |
Class Z |
|
| (43,277,957) |
|
|
| (54,332,629) |
| |
Increase (Decrease) in Net Assets | (34,841,165) |
|
|
| (49,385,187) |
| |||
Total Increase (Decrease) in Net Assets | (37,160,997) |
|
|
| (41,995,195) |
| |||
Net Assets ($): |
|
|
|
|
|
|
|
| |
Beginning of Period |
|
| 488,356,058 |
|
|
| 530,351,253 |
| |
End of Period |
|
| 451,195,061 |
|
|
| 488,356,058 |
| |
Undistributed investment income—net | 956,311 |
|
|
| 1,047,939 |
| |||
14
|
|
|
| Year Ended April 30, | |||||
|
|
|
| 2016 | a |
| 2015 |
| |
Capital Share Transactions (Shares): |
|
|
|
|
|
|
|
| |
Class A |
|
|
|
|
|
|
|
| |
Shares sold |
|
| 316,157 |
|
|
| 143,771 |
| |
Shares issued for dividends reinvested |
|
| 51,375 |
|
|
| 48,646 |
| |
Shares redeemed |
|
| (550,044) |
|
|
| (710,445) |
| |
Net Increase (Decrease) in Shares Outstanding | (182,512) |
|
|
| (518,028) |
| |||
Class C |
|
|
|
|
|
|
|
| |
Shares sold |
|
| 76,153 |
|
|
| 13,384 |
| |
Shares issued for dividends reinvested |
|
| 3,040 |
|
|
| 2,621 |
| |
Shares redeemed |
|
| (115,137) |
|
|
| (93,132) |
| |
Net Increase (Decrease) in Shares Outstanding | (35,944) |
|
|
| (77,127) |
| |||
Class Y |
|
|
|
|
|
|
|
| |
Shares sold |
|
| 66 |
|
|
| - |
| |
Class Z |
|
|
|
|
|
|
|
| |
Shares sold |
|
| 279,260 |
|
|
| 458,320 |
| |
Shares issued for dividends reinvested |
|
| 492,127 |
|
|
| 460,547 |
| |
Shares redeemed |
|
| (2,839,487) |
|
|
| (3,553,014) |
| |
Net Increase (Decrease) in Shares Outstanding | (2,068,100) |
|
|
| (2,634,147) |
| |||
a Effective September 1, 2015, the fund commenced offering Class Y shares. | |||||||||
See notes to financial statements.
15
FINANCIAL HIGHLIGHTS
The following tables describe the performance for each share class for the fiscal periods indicated. All information (except portfolio turnover rate) reflects financial results for a single fund share. Total return shows how much your investment in the fund would have increased (or decreased) during each period, assuming you had reinvested all dividends and distributions. These figures have been derived from the fund’s financial statements.
Year Ended April 30, | |||||||||||||
Class A Shares | 2016 | 2015 | 2014 | 2013 | 2012 | ||||||||
Per Share Data ($): | |||||||||||||
Net asset value, beginning of period | 15.40 | 15.18 | 15.63 | 16.09 | 15.67 | ||||||||
Investment Operations: | |||||||||||||
Investment income—neta | .22 | .19 | .22 | .23 | .20 | ||||||||
Net realized and unrealized | .02 | .28 | (.35) | .04 | .79 | ||||||||
Total from Investment Operations | .24 | .47 | (.13) | .27 | .99 | ||||||||
Distributions: | |||||||||||||
Dividends from | (.30) | (.25) | (.32) | (.30) | (.23) | ||||||||
Dividends from net realized | — | — | — | (.43) | (.34) | ||||||||
Total Distributions | (.30) | (.25) | (.32) | (.73) | (.57) | ||||||||
Net asset value, end of period | 15.34 | 15.40 | 15.18 | 15.63 | 16.09 | ||||||||
Total Return (%)b | 1.57 | 3.11 | (.83) | 1.73 | 6.34 | ||||||||
Ratios/Supplemental Data (%): | |||||||||||||
Ratio of total expenses | 1.03 | 1.03 | 1.02 | 1.03 | 1.04 | ||||||||
Ratio of net expenses | 1.03 | 1.03 | 1.02 | 1.03 | 1.04 | ||||||||
Ratio of net investment income | 1.44 | 1.24 | 1.44 | 1.45 | 1.25 | ||||||||
Portfolio Turnover Ratec | 278.91 | 349.59 | 344.69 | 439.48 | 652.66 | ||||||||
Net Assets, end of period ($ x 1,000) | 47,354 | 50,370 | 57,498 | 77,177 | 75,252 | ||||||||
a Based on average shares outstanding.
b Exclusive of sales charge.
c The portfolio turnover rates excluding mortgage dollar roll transactions for the periods ended April 30, 2016, 2015, 2014, 2013 and 2012 were 104.91%, 69.93%, 89.97%, 85.95% and 95.20%, respectively.
See notes to financial statements.
16
Year Ended April 30, | ||||||||||||
Class C Shares | 2016 | 2015 | 2014 | 2013 | 2012 | |||||||
Per Share Data ($): | ||||||||||||
Net asset value, beginning of period | 15.40 | 15.18 | 15.63 | 16.08 | 15.67 | |||||||
Investment Operations: | ||||||||||||
Investment income—neta | .10 | .07 | .10 | .10 | .08 | |||||||
Net realized and unrealized | .01 | .28 | (.36) | .05 | .78 | |||||||
Total from Investment Operations | .11 | .35 | (.26) | .15 | .86 | |||||||
Distributions: | ||||||||||||
Dividends from | (.18) | (.13) | (.19) | (.17) | (.11) | |||||||
Dividends from net realized | — | — | — | (.43) | (.34) | |||||||
Total Distributions | (.18) | (.13) | (.19) | (.60) | (.45) | |||||||
Net asset value, end of period | 15.33 | 15.40 | 15.18 | 15.63 | 16.08 | |||||||
Total Return (%)b | .72 | 2.29 | (1.64) | .96 | 5.49 | |||||||
Ratios/Supplemental Data (%): | ||||||||||||
Ratio of total expenses | 1.83 | 1.84 | 1.83 | 1.80 | 1.78 | |||||||
Ratio of net expenses | 1.83 | 1.84 | 1.83 | 1.80 | 1.78 | |||||||
Ratio of net investment income | .64 | .43 | .63 | .65 | .52 | |||||||
Portfolio Turnover Ratec | 278.91 | 349.59 | 344.69 | 439.48 | 652.66 | |||||||
Net Assets, end of period ($ x 1,000) | 4,815 | 5,390 | 6,484 | 11,230 | 18,092 | |||||||
a Based on average shares outstanding.
b Exclusive of sales charge.
c The portfolio turnover rates excluding mortgage dollar roll transactions for the periods ended April 30, 2016, 2015, 2014, 2013 and 2012 were 104.91%, 69.93%, 89.97%, 85.95% and 95.20%, respectively.
See notes to financial statements.
17
FINANCIAL HIGHLIGHTS (continued)
Period Ended | |||||||
Class Y Shares | April 30, 2016a | ||||||
Per Share Data ($): | |||||||
Net asset value, beginning of period | 15.21 | ||||||
Investment Operations: | |||||||
Investment income—netb | .16 | ||||||
Net realized and unrealized | .18 | ||||||
Total from Investment Operations | .34 | ||||||
Distributions: | |||||||
Dividends from investment income—net | (.21) | ||||||
Net asset value, end of period | 15.34 | ||||||
Total Return (%)c | 2.25 | ||||||
Ratios/Supplemental Data (%): | |||||||
Ratio of total expenses to average net assetsd | .75 | ||||||
Ratio of net expenses to average net assetsd | .75 | ||||||
Ratio of net investment income | 1.57 | ||||||
Portfolio Turnover Ratee | 278.91 | ||||||
Net Assets, end of period ($ x 1,000) | 1 | ||||||
a From September 1, 2015 (commencement of initial offering) to April 30, 2016.
b Based on average shares outstanding.
c Not annualized.
d Annualized.
e The portfolio turnover rate excluding mortgage dollar roll transactions for the period ended April 30, 2016 was 104.91%.
See notes to financial statements.
18
Year Ended April 30, | |||||||||||||
Class Z Shares | 2016 | 2015 | 2014 | 2013 | 2012 | ||||||||
Per Share Data ($): | |||||||||||||
Net asset value, beginning of period | 15.41 | 15.19 | 15.64 | 16.10 | 15.68 | ||||||||
Investment Operations: | |||||||||||||
Investment income—neta | .24 | .21 | .24 | .25 | .22 | ||||||||
Net realized and unrealized | .00 | b | .28 | (.35) | .04 | .79 | |||||||
Total from Investment Operations | .24 | .49 | (.11) | .29 | 1.01 | ||||||||
Distributions: | |||||||||||||
Dividends from | (.31) | (.27) | (.34) | (.32) | (.25) | ||||||||
Dividends from net realized | — | — | — | (.43) | (.34) | ||||||||
Total Distributions | (.31) | (.27) | (.34) | (.75) | (.59) | ||||||||
Net asset value, end of period | 15.34 | 15.41 | 15.19 | 15.64 | 16.10 | ||||||||
Total Return (%) | 1.62 | 3.26 | (.69) | 1.86 | 6.48 | ||||||||
Ratios/Supplemental Data (%): | |||||||||||||
Ratio of total expenses | .91 | .90 | .88 | .89 | .90 | ||||||||
Ratio of net expenses | .91 | .90 | .88 | .89 | .90 | ||||||||
Ratio of net investment income | 1.56 | 1.36 | 1.58 | 1.59 | 1.39 | ||||||||
Portfolio Turnover Ratec | 278.91 | 349.59 | 344.69 | 439.48 | 652.66 | ||||||||
Net Assets, end of period ($ x 1,000) | 399,025 | 432,595 | 466,370 | 541,867 | 593,198 | ||||||||
a Based on average shares outstanding.
b Amount represents less than $.01 per share.
c The portfolio turnover rates excluding mortgage dollar roll transactions for the periods ended April 30, 2016, 2015, 2014, 2013 and 2012 were 104.91%, 69.93%, 89.97%, 85.95% and 95.20%, respectively.
See notes to financial statements.
19
NOTES TO FINANCIAL STATEMENTS
NOTE 1—Significant Accounting Policies:
Dreyfus GNMA Fund (the “fund”) is the sole series of Dreyfus Premier GNMA Fund, Inc. (the “Company”), which is registered under the Investment Company Act of 1940, as amended (the “Act”), as a diversified open-end management investment company. The fund’s investment objective is to seek to maximize total return, consisting of capital appreciation and current income. The Dreyfus Corporation (the “Manager” or “Dreyfus”), a wholly-owned subsidiary of The Bank of New York Mellon Corporation (“BNY Mellon”), serves as the fund’s investment adviser.
At a meeting held on July 27, 2015, the Company’s Board of Directors (the “Board”) approved, effective September 1, 2015, for the fund to offer Class Y shares.
MBSC Securities Corporation (the “Distributor”), a wholly-owned subsidiary of Dreyfus, is the distributor of the fund’s shares. The fund is authorized to issue 1.4 billion shares of $.001 par value Common Stock. The fund currently offers four classes of shares: Class A (100 million shares authorized), Class C (100 million shares authorized), Class Y (100 million shares authorized) and Class Z (1.1 billion shares authorized). Class A shares generally are subject to a sales charge imposed at the time of purchase. Class C shares are subject to a contingent deferred sales charge (“CDSC”) imposed on Class C shares redeemed within one year of purchase. Class Y shares are sold at net asset value per share generally to institutional investors. Class Z shares are sold at net asset value per share generally to certain shareholders of the fund. Class Z shares generally are not available for new accounts. Other differences between the classes include the services offered to and the expenses borne by each class, the allocation of certain transfer agency costs, and certain voting rights. Income, expenses (other than expenses attributable to a specific class), and realized and unrealized gains or losses on investments are allocated to each class of shares based on its relative net assets.
As of April 30, 2016, MBC Investments Corp., an indirect subsidiary of BNY Mellon, held all of the outstanding Class Y shares of the fund.
The Financial Accounting Standards Board (“FASB”) Accounting Standards Codification (“ASC”) is the exclusive reference of authoritative U.S. generally accepted accounting principles (“GAAP”) recognized by the FASB to be applied by nongovernmental entities. Rules and interpretive releases of the Securities and Exchange Commission (“SEC”) under
20
authority of federal laws are also sources of authoritative GAAP for SEC registrants. The fund’s financial statements are prepared in accordance with GAAP, which may require the use of management estimates and assumptions. Actual results could differ from those estimates.
The Company enters into contracts that contain a variety of indemnifications. The fund’s maximum exposure under these arrangements is unknown. The fund does not anticipate recognizing any loss related to these arrangements.
(a) Portfolio valuation: The fair value of a financial instrument is the amount that would be received to sell an asset or paid to transfer a liability in an orderly transaction between market participants at the measurement date (i.e., the exit price). GAAP establishes a fair value hierarchy that prioritizes the inputs of valuation techniques used to measure fair value. This hierarchy gives the highest priority to unadjusted quoted prices in active markets for identical assets or liabilities (Level 1 measurements) and the lowest priority to unobservable inputs (Level 3 measurements).
Additionally, GAAP provides guidance on determining whether the volume and activity in a market has decreased significantly and whether such a decrease in activity results in transactions that are not orderly. GAAP requires enhanced disclosures around valuation inputs and techniques used during annual and interim periods.
Various inputs are used in determining the value of the fund’s investments relating to fair value measurements. These inputs are summarized in the three broad levels listed below:
Level 1—unadjusted quoted prices in active markets for identical investments.
Level 2—other significant observable inputs (including quoted prices for similar investments, interest rates, prepayment speeds, credit risk, etc.).
Level 3—significant unobservable inputs (including the fund’s own assumptions in determining the fair value of investments).
The inputs or methodology used for valuing securities are not necessarily an indication of the risk associated with investing in those securities.
Changes in valuation techniques may result in transfers in or out of an assigned level within the disclosure hierarchy. Valuation techniques used to value the fund’s investments are as follows:
21
NOTES TO FINANCIAL STATEMENTS (continued)
Registered investment companies that are not traded on an exchange are valued at their net asset value and are generally categorized within Level 1 of the fair value hierarchy.
Investments in securities, excluding short-term investments (other than U.S. Treasury Bills), and financial futures are valued each business day by an independent pricing service (the “Service”) approved by the Board. Investments for which quoted bid prices are readily available and are representative of the bid side of the market in the judgment of the Service are valued at the mean between the quoted bid prices (as obtained by the Service from dealers in such securities) and asked prices (as calculated by the Service based upon its evaluation of the market for such securities). Other investments (which constitute a majority of the portfolio securities) are valued as determined by the Service, based on methods which include consideration of the following: yields or prices of securities of comparable quality, coupon, maturity and type; indications as to values from dealers; and general market conditions. These securities are generally categorized within Level 2 of the fair value hierarchy.
U.S. Treasury Bills are valued at the mean price between quoted bid prices and asked prices by the Service. These securities are generally categorized within Level 2 of the fair value hierarchy.
The Service’s procedures are reviewed by Dreyfus under the general supervision of the Board.
When market quotations or official closing prices are not readily available, or are determined not to reflect accurately fair value, such as when the value of a security has been significantly affected by events after the close of the exchange or market on which the security is principally traded (for example, a foreign exchange or market), but before the fund calculates its net asset value, the fund may value these investments at fair value as determined in accordance with the procedures approved by the Board. Certain factors may be considered when fair valuing investments such as: fundamental analytical data, the nature and duration of restrictions on disposition, an evaluation of the forces that influence the market in which the securities are purchased and sold, and public trading in similar securities of the issuer or comparable issuers. These securities are either categorized within Level 2 or 3 of the fair value hierarchy depending on the relevant inputs used.
For restricted securities where observable inputs are limited, assumptions about market activity and risk are used and are generally categorized within Level 3 of the fair value hierarchy.
22
Financial futures, which are traded on an exchange, are valued at the last sales price on the securities exchange on which such securities are primarily traded or at the last sales price on the national securities market on each business day and are generally categorized within Level 1 of the fair value hierarchy. Investments in swap transactions are valued each business day by the Service. Swaps are valued by the Service by using a swap pricing model which incorporates among other factors, default probabilities, recovery rates, credit curves of the underlying issuer and swap spreads on interest rates and are generally categorized within Level 2 of the fair value hierarchy.
The following is a summary of the inputs used as of April 30, 2016 in valuing the fund’s investments:
| Level 1 - Unadjusted Quoted Prices | Level 2 - Other Significant Observable Inputs | Level 3 -Significant Unobservable Inputs | Total |
Assets ($) |
|
|
|
|
Investments in Securities: |
|
|
|
|
Asset-Backed | - | 20,044,821 | - | 20,044,821 |
Mutual Funds | 13,365,668 | - | - | 13,365,668 |
U.S. Government Agencies/Mortgage-Backed | - | 418,192,935 | - | 418,192,935 |
U.S. Treasury | - | 41,823,136 | - | 41,823,136 |
Liabilities ($) |
|
|
|
|
Financial Futures† | (40,627) | - | - | (40,627) |
Swaps† | - | (994,076) | - | (994,076) |
† Amount shown represents unrealized (depreciation) at period end.
At April 30, 2016, there were no transfers between levels of the fair value hierarchy.
(b) Securities transactions and investment income: Securities transactions are recorded on a trade date basis. Realized gains and losses from securities transactions are recorded on the identified cost basis. Interest income, adjusted for accretion of discount and amortization of premium on investments, is earned from settlement date and recognized on the accrual basis. Securities purchased or sold on a when issued or delayed delivery basis may be settled a month or more after the trade date.
Pursuant to a securities lending agreement with The Bank of New York Mellon, a subsidiary of BNY Mellon and an affiliate of Dreyfus, the fund may lend securities to qualified institutions. It is the fund’s policy that, at
23
NOTES TO FINANCIAL STATEMENTS (continued)
origination, all loans are secured by collateral of at least 102% of the value of U.S. securities loaned and 105% of the value of foreign securities loaned. Collateral equivalent to at least 100% of the market value of securities on loan is maintained at all times. Collateral is either in the form of cash, which can be invested in certain money market mutual funds managed by Dreyfus, or U.S. Government and Agency securities. The fund is entitled to receive all dividends, interest and distributions on securities loaned, in addition to income earned as a result of the lending transaction. Should a borrower fail to return the securities in a timely manner, The Bank of New York Mellon is required to replace the securities for the benefit of the fund or credit the fund with the market value of the unreturned securities and is subrogated to the fund’s rights against the borrower and the collateral. Additionally, the contractual maturity of security lending transactions are on an overnight and continuous basis. During the period ended April 30, 2016, The Bank of New York Mellon earned $1,605 from lending portfolio securities, pursuant to the securities lending agreement.
(c) Affiliated issuers: Investments in other investment companies advised by Dreyfus are defined as “affiliated” under the Act. Investments in affiliated investment companies during the period ended April 30, 2016 were as follows:
Affiliated Investment Company | Value 4/30/2015 ($) | Purchases ($) | Sales ($) | Value 4/30/2016 ($) | Net |
Dreyfus Institutional Preferred Plus Money Market Fund | 19,044,618 | 375,918,138 | 381,597,088 | 13,365,668 | 3.0 |
(d) Dividends to shareholders: Dividends are recorded on the ex-dividend date. Dividends from investment income-net are normally declared and paid on a monthly basis. Dividends from net realized capital gains, if any, are normally declared and paid annually, but the fund may make distributions on a more frequent basis to comply with the distribution requirements of the Internal Revenue Code of 1986, as amended (the “Code”). To the extent that net realized capital gains can be offset by capital loss carryovers, it is the policy of the fund not to distribute such gains. Income and capital gain distributions are determined in accordance with income tax regulations, which may differ from GAAP.
24
On April 29, 2016, the Board declared a cash dividend of $.025, $.014, $.029 and $.026 per share from undistributed investment income-net for Class A, Class C, Class Y and Class Z shares, respectively, payable on May 2, 2016 (ex-dividend date), to shareholders of record as of the close of business on April 29, 2016.
(e) Federal income taxes: It is the policy of the fund to continue to qualify as a regulated investment company, if such qualification is in the best interests of its shareholders, by complying with the applicable provisions of the Code, and to make distributions of taxable income sufficient to relieve it from substantially all federal income and excise taxes.
As of and during the period ended April 30, 2016, the fund did not have any liabilities for any uncertain tax positions. The fund recognizes interest and penalties, if any, related to uncertain tax positions as income tax expense in the Statement of Operations. During the period ended April 30, 2016, the fund did not incur any interest or penalties.
Each tax year in the four-year period ended April 30, 2016 remains subject to examination by the Internal Revenue Service and state taxing authorities.
At April 30, 2016, the components of accumulated earnings on a tax basis were as follows: undistributed ordinary income $974,289, accumulated capital and other losses $6,107,312 and unrealized appreciation $11,307,563.
Under the Regulated Investment Company Modernization Act of 2010, the fund is permitted to carry forward capital losses for an unlimited period. Furthermore, capital loss carryovers retain their character as either short-term or long-term capital losses.
The accumulated capital loss carryover is available for federal income tax purposes to be applied against future net realized capital gains, if any, realized subsequent to April 30, 2016. The fund has $3,141,180 of short-term capital losses and $2,925,815 of long-term capital losses which can be carried forward for an unlimited period.
The tax character of distributions paid to shareholders during the fiscal periods ended April 30, 2016 and April 30, 2015 were as follows: ordinary income $9,505,329 and $8,974,428, respectively.
During the period ended April 30, 2016, as a result of permanent book to tax differences, primarily due to the tax treatment for paydown gains and losses on mortgage-backed securities and amortization of premiums, the fund increased accumulated undistributed investment income-net by $2,277,949 and decreased accumulated net realized gain (loss) on
25
NOTES TO FINANCIAL STATEMENTS (continued)
investments by the same amount. Net assets and net asset value per share were not affected by this reclassification.
NOTE 2—Bank Lines of Credit:
The fund participates with other Dreyfus-managed funds in a $555 million unsecured credit facility led by Citibank, N.A. and a $300 million unsecured credit facility provided by The Bank of New York Mellon (each, a “Facility”), each to be utilized primarily for temporary or emergency purposes, including the financing of redemptions. Prior to January 11, 2016, the unsecured credit facility with Citibank, N.A. was $480 million and prior to October 7, 2015, the unsecured credit facility with Citibank, N.A. was $430 million. In connection therewith, the fund has agreed to pay its pro rata portion of commitment fees for each Facility. Interest is charged to the fund based on rates determined pursuant to the terms of the respective Facility at the time of borrowing. During the period ended April 30, 2016, the fund did not borrow under the Facilities.
NOTE 3—Management Fee and Other Transactions with Affiliates:
(a) Pursuant to a management agreement (the “Agreement”) with Dreyfus, the management fee is computed at the annual rate of .60% of the value of the fund’s average daily net assets and is payable monthly. The Agreement provides that if in any full fiscal year, the aggregate expenses of Class Z shares (excluding taxes, brokerage fees, interest on borrowings and extraordinary expenses) exceed 1½% of the value of Class Z shares’ average daily net assets, the fund may deduct from payments to be made to Dreyfus, or Dreyfus will bear, such excess expense with respect to Class Z shares. There was no reimbursement pursuant to the Agreement for Class Z shares during the period ended April 30, 2016.
During the period ended April 30, 2016, the Distributor retained $95 from commissions earned on sales of the fund’s Class A shares and $187 from CDSCs on redemptions of the fund’s Class C shares.
(b) Under the Distribution Plan adopted pursuant to Rule 12b-1 under the Act, Class C shares pay the Distributor for distributing its shares at an annual rate of .75% of the value of its average daily net assets. During the period ended April 30, 2016, Class C shares were charged $36,759 pursuant to the Distribution Plan.
Under the Service Plan adopted pursuant to Rule 12b-1 under the Act, Class Z shares reimburse the Distributor for distributing its shares, for servicing shareholder accounts and for advertising and marketing relating to Class Z shares. The Service Plan provides for a reimbursement to be
26
made at an aggregate annual rate not to exceed .20% of the value of its average daily net assets. The Distributor determines the amounts, if any, to be paid to Service Agents (securities dealers, financial institutions or other industry professionals) and the basis on which such payments are made.
The Service Plan also separately provides for Class Z shares to bear the costs of preparing, printing and distributing certain of Class Z prospectuses and statements of additional information and costs associated with implementing and operating the Service Plan, not to exceed the greater of $100,000 or .005% of the value of its average daily net assets for any full fiscal year. During the period ended April 30, 2016, Class Z shares were charged $594,378 pursuant to the Service Plan.
(c) Under the Shareholder Services Plan, Class A and Class C shares pay the Distributor at an annual rate of .25% of the value of their average daily net assets for the provision of certain services. The services provided may include personal services relating to shareholder accounts, such as answering shareholder inquiries regarding the fund and providing reports and other information, and services related to the maintenance of shareholder accounts. The Distributor may make payments to Service Agents (securities dealers, financial institutions or other industry professionals) with respect to these services. The Distributor determines the amounts to be paid to Service Agents. During the period ended April 30, 2016, Class A and Class C shares were charged $119,405 and $12,253, respectively, pursuant to the Shareholder Services Plan.
The fund has arrangements with the transfer agent and the custodian whereby the fund may receive earnings credits when positive cash balances are maintained, which are used to offset transfer agency and custody fees. For financial reporting purposes, the fund includes net earnings credits as an expense offset in the Statement of Operations.
The fund compensates Dreyfus Transfer, Inc., a wholly-owned subsidiary of Dreyfus, under a transfer agency agreement for providing transfer agency and cash management services for the fund. The majority of transfer agency fees are comprised of amounts paid on a per account basis, while cash management fees are related to fund subscriptions and redemptions. During the period ended April 30, 2016, the fund was charged $227,306 for transfer agency services and $15,893 for cash management services. These fees are included in Shareholder servicing costs in the Statement of Operations. Cash management fees were partially offset by earnings credits of $3,814.
The fund compensates The Bank of New York Mellon under a custody agreement for providing custodial services for the fund. These fees are
27
NOTES TO FINANCIAL STATEMENTS (continued)
determined based on net assets, geographic region and transaction activity. During the period ended April 30, 2016, the fund was charged $89,334 pursuant to the custody agreement.
The fund compensates The Bank of New York Mellon under a shareholder redemption draft processing agreement for providing certain services related to the fund’s check writing privilege. During the period ended April 30, 2016, the fund was charged $11,735 pursuant to the agreement, which is included in Shareholder servicing costs in the Statement of Operations.
During the period ended April 30, 2016, the fund was charged $10,076 for services performed by the Chief Compliance Officer and his staff.
The components of “Due to The Dreyfus Corporation and affiliates” in the Statement of Assets and Liabilities consist of: management fees $222,812, Distribution Plan fees $48,990, Shareholder Services Plan fees $10,718, custodian fees $47,304, Chief Compliance Officer fees $3,208 and transfer agency fees $28,260.
(d) Each Board member also serves as a Board member of other funds within the Dreyfus complex. Annual retainer fees and attendance fees are allocated to each fund based on net assets.
NOTE 4—Securities Transactions:
The aggregate amount of purchases and sales (including paydowns) of investment securities, excluding short-term securities, financial futures and swap transactions, during the period ended April 30, 2016, amounted to $1,472,385,653 and $1,518,851,781, respectively, of which $918,568,474 in purchases and $920,220,606 in sales were from mortgage dollar roll transactions.
Mortgage Dollar Rolls: A mortgage dollar roll transaction involves a sale by the fund of mortgage related securities that it holds with an agreement by the fund to repurchase similar securities at an agreed upon price and date. The securities purchased will bear the same interest rate as those sold, but generally will be collateralized by pools of mortgages with different prepayment histories than those securities sold. The fund accounts for mortgage dollar rolls as purchases and sales transactions.
Derivatives: A derivative is a financial instrument whose performance is derived from the performance of another asset. Each type of derivative instrument that was held by the fund during the period ended April 30, 2016 is discussed below.
28
Financial Futures: In the normal course of pursuing its investment objective, the fund is exposed to market risk, including interest rate risk, as a result of changes in value of underlying financial instruments. The fund invests in financial futures in order to manage its exposure to or protect against changes in the market. A financial futures contract represents a commitment for the future purchase or a sale of an asset at a specified date. Upon entering into such contracts, these investments require initial margin deposits with a counterparty, which consist of cash or cash equivalents. The amount of these deposits is determined by the exchange or Board of Trade on which the contract is traded and is subject to change. Accordingly, variation margin payments are received or made to reflect daily unrealized gains or losses which are recorded in the Statement of Operations. When the contracts are closed, the fund recognizes a realized gain or loss which is reflected in the Statement of Operations. There is minimal counterparty credit risk to the fund with financial futures since they are exchange traded, and the exchange guarantees the financial futures against default. Financial futures open at April 30, 2016 are set forth in the Statement of Financial Futures.
Swap Transactions: The fund enters into swap agreements to exchange the interest rate on, or return generated by, one nominal instrument for the return generated by another nominal instrument. Swap agreements are privately negotiated in the OTC market or centrally cleared. The fund enters into these agreements to hedge certain market or interest rate risks, to manage the interest rate sensitivity (sometimes called duration) of fixed income securities, to provide a substitute for purchasing or selling particular securities or to increase potential returns.
For OTC swaps, the fund accrues for interim payments on a daily basis, with the net amount recorded within unrealized appreciation (depreciation) on swap agreements in the Statement of Assets and Liabilities. Once the interim payments are settled in cash, the net amount is recorded as a realized gain (loss) on swaps, in addition to realized gain (loss) recorded upon the termination of swap transactions in the Statement of Operations. Upfront payments made and/or received by the fund, are recorded as an asset and/or liability in the Statement of Assets and Liabilities and are recorded as a realized gain or loss ratably over the agreement’s term/event with the exception of forward starting interest rate swaps which are recorded as realized gains or losses on the termination date.
Upon entering into centrally cleared swap agreements, an initial margin deposit is required with a counterparty, which consists of cash or cash equivalents. The amount of these deposits is determined by the exchange on which the agreement is traded and is subject to change. The change in
29
NOTES TO FINANCIAL STATEMENTS (continued)
valuation of centrally cleared swaps is recorded as a receivable or payable for variation margin in the Statement of Assets and Liabilities. Payments received from (paid to) the counterparty, including upon termination, are recorded as realized gain (loss) in the Statement of Operations.
Fluctuations in the value of swap agreements are recorded for financial statement purposes as unrealized appreciation or depreciation on swap transactions.
Interest Rate Swaps: Interest rate swaps involve the exchange of commitments to pay and receive interest based on a notional principal amount. The fund may elect to pay a fixed rate and receive a floating rate, or receive a fixed rate and pay a floating rate on a notional principal amount. The net interest received or paid on interest rate swap agreements is included within realized gain (loss) on swap transactions in the Statement of Operations. Interest rate swap agreements are subject to general market risk, liquidity risk, counterparty risk and interest rate risk.
For OTC swaps, the fund’s maximum risk of loss from counterparty risk is the discounted value of the cash flows to be received from the counterparty over the agreement’s remaining life, to the extent that the amount is positive. This risk may be mitigated by Master Agreements, if any, between the fund and the counterparty and the posting of collateral, if any, by the counterparty to the fund to cover the fund’s exposure to the counterparty. There is minimal counterparty risk to the fund with centrally cleared swaps since they are exchange traded and the exchange guarantees these swaps against default. The following summarizes open interest rate swaps entered into by the fund at April 30, 2016:
Centrally Cleared Interest Rate Swaps | |||||
Notional ($)† | Currency/ Floating Rate | Counterparty | (Pay) Receive Fixed Rate (%) | Expiration | Unrealized (Depreciation) ($) |
20,750,000 | USD - 6 MONTH LIBOR | Goldman Sachs International | 2.11 | 1/7/2025 | (994,076) |
Gross Unrealized Depreciation | (994,076) | ||||
† Clearing House-Chicago Mercantile Exchange
The following summarizes the average market value of derivatives outstanding during the period ended April 30, 2016:
|
| Average Market Value ($) |
Interest rate financial futures | 17,999,063 | |
30
The following summarizes the average notional value of swap agreements outstanding during the period ended April 30, 2016:
|
| Average Notional Value ($) |
Interest rate swap agreements | 6,903,846 | |
At April 30, 2016, the cost of investments for federal income tax purposes was $481,254,963; accordingly, accumulated net unrealized appreciation on investments was $12,171,597, consisting of $12,693,312 gross unrealized appreciation and $521,715 gross unrealized depreciation.
31
REPORT OF INDEPENDENT REGISTERED
PUBLIC ACCOUNTING FIRM
Shareholders and Board of Directors
Dreyfus GNMA Fund
We have audited the accompanying statement of assets and liabilities, including the statements of investments and financial futures, of Dreyfus GNMA Fund (the sole series comprising Dreyfus Premier GNMA Fund, Inc.) as of April 30, 2016, and the related statement of operations for the year then ended, the statement of changes in net assets for each of the two years in the period then ended, and the financial highlights for each of the periods indicated therein. These financial statements and financial highlights are the responsibility of the Fund’s management. Our responsibility is to express an opinion on these financial statements and financial highlights based on our audits.
We conducted our audits in accordance with the standards of the Public Company Accounting Oversight Board (United States). Those standards require that we plan and perform the audit to obtain reasonable assurance about whether the financial statements and financial highlights are free of material misstatement. We were not engaged to perform an audit of the Fund’s internal control over financial reporting. Our audits included consideration of internal control over financial reporting as a basis for designing audit procedures that are appropriate in the circumstances, but not for the purpose of expressing an opinion on the effectiveness of the Fund’s internal control over financial reporting. Accordingly, we express no such opinion. An audit also includes examining, on a test basis, evidence supporting the amounts and disclosures in the financial statements and financial highlights, assessing the accounting principles used and significant estimates made by management, and evaluating the overall financial statement presentation. Our procedures included confirmation of securities owned as of April 30, 2016 by correspondence with the custodian and others. We believe that our audits provide a reasonable basis for our opinion.
In our opinion, the financial statements and financial highlights referred to above present fairly, in all material respects, the financial position of Dreyfus GNMA Fund at April 30, 2016, the results of its operations for the year then ended, the changes in its net assets for each of the two years in the period then ended, and the financial highlights for each of the indicated periods, in conformity with U.S. generally accepted accounting principles.

New York, New York
June 24, 2016
32
IMPORTANT TAX INFORMATION (Unaudited)
For federal tax purposes, the fund hereby reports 100% of ordinary income dividends paid during the fiscal year ended April 30, 2016 as qualifying “interest-related dividends.”
33
INFORMATION ABOUT THE RENEWAL OF THE FUND’S MANAGEMENT AGREEMENT (Unaudited)
At a meeting of the fund’s Board of Directors held on November 2-3, 2015, the Board considered the renewal of the fund’s Management Agreement pursuant to which Dreyfus provides the fund with investment advisory and administrative services (the “Agreement”). The Board members, a majority of whom are not “interested persons” (as defined in the Investment Company Act of 1940, as amended) of the fund, were assisted in their review by independent legal counsel and met with counsel in executive session separate from Dreyfus representatives. In considering the renewal of the Agreement, the Board considered all factors that it believed to be relevant, including those discussed below. The Board did not identify any one factor as dispositive, and each Board member may have attributed different weights to the factors considered.
Analysis of Nature, Extent, and Quality of Services Provided to the Fund. The Board considered information provided to them at the meeting and in previous presentations from Dreyfus representatives regarding the nature, extent, and quality of the services provided to funds in the Dreyfus fund complex. Dreyfus provided the number of open accounts in the fund, the fund’s asset size and the allocation of fund assets among distribution channels. Dreyfus also had previously provided information regarding the diverse intermediary relationships and distribution channels of funds in the Dreyfus fund complex (such as retail direct or intermediary, in which intermediaries typically are paid by the fund and/or Dreyfus) and Dreyfus’ corresponding need for broad, deep, and diverse resources to be able to provide ongoing shareholder services to each intermediary or distribution channel, as applicable to the fund.
The Board also considered research support available to, and portfolio management capabilities of, the fund’s portfolio management personnel and that Dreyfus also provides oversight of day-to-day fund operations, including fund accounting and administration and assistance in meeting legal and regulatory requirements. The Board also considered Dreyfus’ extensive administrative, accounting and compliance infrastructures.
Comparative Analysis of the Fund’s Performance and Management Fee and Expense Ratio. The Board reviewed reports prepared by Lipper, Inc. (“Lipper”), an independent provider of investment company data, which included information comparing (1) the fund’s performance with the performance of a group of comparable funds (the “Performance Group”) and with a broader group of funds (the “Performance Universe”), all for various periods ended September 30, 2015, and (2) the fund’s actual and contractual management fees and total expenses with those of a group of comparable funds (the “Expense Group”) and with a broader group of funds (the “Expense Universe”), the information for which was derived in part from fund financial statements available to Lipper as of the date of its analysis. Dreyfus previously had furnished the Board with a description of the methodology Lipper used to select the Performance Group and Performance Universe and the Expense Group and Expense Universe.
34
Dreyfus representatives stated that the usefulness of performance comparisons may be affected by a number of factors, including different investment limitations that may be applicable to the fund and comparison funds. The Board discussed with representatives of Dreyfus and its affiliates the results of the comparisons and noted that the fund’s total return performance for Class A and Class Z shares was below and variously above and below, respectively, the Performance Group and Performance Universe medians. The yield performance for Class A and Class Z shares were below the Performance Group and Performance Universe medians for the ten one-year periods ended September 30th, commencing in 2008.1 Dreyfus also provided a comparison of the fund’s calendar year total returns to the returns of the fund’s benchmark index.
The Board also reviewed a presentation regarding the transition of Standish Capital Management to Amherst Capital Management along with the approval of a new additional portfolio manager.
The Board also reviewed the range of actual and contractual management fees and total expenses of the Expense Group and Expense Universe funds and discussed the results of the comparisons. The Board noted that the fund’s contractual management fee was above the Expense Group median and the fund’s actual management fee and total expenses were above the Expense Group and Expense Universe medians.
Dreyfus representatives reviewed with the Board the management or investment advisory fees (1) paid by funds advised or administered by Dreyfus that are in the same Lipper category as the fund and (2) paid to Dreyfus or the Dreyfus-affiliated primary employer of the fund’s primary portfolio manager(s) for advising any separate accounts and/or other types of client portfolios that are considered to have similar investment strategies and policies as the fund (the “Similar Client”), and explained the nature of the Similar Clients. They discussed differences in fees paid and the relationship of the fees paid in light of any differences in the services provided and other relevant factors. The Board considered the relevance of the fee information provided for the Similar Clients to evaluate the appropriateness and reasonableness of the fund’s management fee.
Analysis of Profitability and Economies of Scale. Dreyfus representatives reviewed the expenses allocated and profit received by Dreyfus and its affiliates and the resulting profitability percentage for managing the fund and the aggregate profitability percentage to Dreyfus and its affiliates for managing the funds in the Dreyfus fund complex, and the method used to determine the expenses and profit. The Board concluded that the profitability results were not unreasonable, given the services rendered and service levels provided by Dreyfus. The Board also had been provided with information prepared by an independent consulting firm regarding Dreyfus’ approach to allocating costs to, and determining the profitability of, individual funds and the entire Dreyfus fund complex.
1 Additional Class A shares were offered on February 3, 2007, and the existing shares were redesignated as Class Z shares.
35
INFORMATION ABOUT THE RENEWAL OF THE FUND’S MANAGEMENT AGREEMENT (Unaudited) (continued)
The consulting firm also had analyzed where any economies of scale might emerge in connection with the management of a fund.
The Board considered, on the advice of its counsel, the profitability analysis (1) as part of its evaluation of whether the fees under the Agreement bear a reasonable relationship to the mix of services provided by Dreyfus, including the nature, extent and quality of such services, and (2) in light of the relevant circumstances for the fund and the extent to which economies of scale would be realized if the fund grows and whether fee levels reflect these economies of scale for the benefit of fund shareholders. Dreyfus representatives noted that a discussion of economies of scale is predicated on a fund having achieved a substantial size with increasing assets and that, if a fund’s assets had been stable or decreasing, the possibility that Dreyfus may have realized any economies of scale would be less. Dreyfus representatives also noted that, as a result of shared and allocated costs among funds in the Dreyfus fund complex, the extent of economies of scale could depend substantially on the level of assets in the complex as a whole, so that increases and decreases in complex-wide assets can affect potential economies of scale in a manner that is disproportionate to, or even in the opposite direction from, changes in the fund’s asset level. The Board also considered potential benefits to Dreyfus from acting as investment adviser and noted that there were no soft dollar arrangements in effect for trading the fund’s investments.
At the conclusion of these discussions, the Board agreed that it had been furnished with sufficient information to make an informed business decision with respect to the renewal of the Agreement. Based on the discussions and considerations as described above, the Board concluded and determined as follows.
· The Board concluded that the nature, extent and quality of the services provided by Dreyfus are adequate and appropriate.
· The Board accepted the portfolio managers’ presentation regarding the partnership of Standish Capital Management and Amherst Holdings, (which is not affiliated with Dreyfus to form Amherst Capital Management along with the approval of a new additional portfolio manager, but agreed to closely monitor performance.
· The Board concluded that the fee paid to Dreyfus was reasonable in light of the considerations described above.
· The Board determined that the economies of scale which may accrue to Dreyfus and its affiliates in connection with the management of the fund had been adequately considered by Dreyfus in connection with the fee rate charged to the fund pursuant to the Agreement and that, to the extent in the future it were determined that material economies of scale had not been shared with the fund, the Board would seek to have those economies of scale shared with the fund.
36
In evaluating the Agreement, the Board considered these conclusions and determinations and also relied on its previous knowledge, gained through meetings and other interactions with Dreyfus and its affiliates, of the fund and the services provided to the fund by Dreyfus. The Board also relied on information received on a routine and regular basis throughout the year relating to the operations of the fund and the investment management and other services provided under the Agreement, including information on the investment performance of the fund in comparison to similar mutual funds and benchmark performance indices/measures; general market outlook as applicable to the fund; and compliance reports. In addition, the Board’s consideration of the contractual fee arrangements for this fund had the benefit of a number of years of reviews of prior or similar agreements during which lengthy discussions took place between the Board and Dreyfus representatives. Certain aspects of the arrangements may receive greater scrutiny in some years than in others, and the Board’s conclusions may be based, in part, on their consideration of the same or similar arrangements in prior years. The Board determined to renew the Agreement.
37
BOARD MEMBERS INFORMATION (Unaudited)
INDEPENDENT BOARD MEMBERS
Joseph S. DiMartino (72)
Chairman of the Board (1995)
Principal Occupation During Past 5 Years:
· Corporate Director and Trustee (1995-present)
Other Public Company Board Memberships During Past 5 Years:
· CBIZ (formerly, Century Business Services, Inc.), a provider of outsourcing functions for small and medium size companies, Director (1997-present)
No. of Portfolios for which Board Member Serves: 136
———————
Joni Evans (74)
Board Member (1985)
Principal Occupation During Past 5 Years:
· Chief Executive Officer, www.wowOwow.com, an online community dedicated to women’s conversations and publications (2007-present)
· Principal, Joni Evans Ltd. (publishing) (2006-present)
No. of Portfolios for which Board Member Serves: 24
———————
Ehud Houminer (75)
Board Member (2006)
Principal Occupation During Past 5 Years:
· Executive-in-Residence at the Columbia Business School, Columbia
University (1992-present)
Other Public Company Board Memberships During Past 5 Years:
· Avnet, Inc., an electronics distributor, Director (1993-2012)
No. of Portfolios for which Board Member Serves: 59
———————
Hans C. Mautner (78)
Board Member (2006)
Principal Occupation During Past 5 Years:
· Corporate Director and Trustee (1978-present)
No. of Portfolios for which Board Member Serves: 24
———————
38
Robin A. Melvin (52)
Board Member (2006)
Principal Occupation During Past 5 Years:
· Co-chairman, Illinois Mentoring Partnership, non-profit organization dedicated to increasing the quantity and quality of mentoring services in Illinois; (2014-present; served as a board member since 2013)
· Director, Boisi Family Foundation, a private family foundation that supports youth-serving organizations that promote the self sufficiency of youth from disadvantaged circumstances (1995-2012)
No. of Portfolios for which Board Member Serves: 108
———————
Burton N. Wallack (65)
Board Member (1991)
Principal Occupation During Past 5 Years:
· President and Co-owner of Wallack Management Company, a real estate management
company (1987-present)
No. of Portfolios for which Board Member Serves: 24
———————
Benaree Pratt Wiley (69)
Board Member (2016)
Principal Occupation During Past 5 Years:
· Principal, The Wiley Group, a firm specializing in strategy and business development (2005-present)
Other Public Company Board Memberships During Past 5 Years:
· CBIZ (formerly, Century Business Services, Inc.), a provider of outsourcing functions for small and medium size companies, Director (2008-present)
No. of Portfolios for which Board Member Serves: 87
———————
39
BOARD MEMBERS INFORMATION (Unaudited) (continued)
INTERESTED BOARD MEMBER
Gordon J. Davis (74)
Board Member (1995)
Principal Occupation During Past 5 Years:
· Partner in the law firm of Venable LLP (2012-present)
· Partner in the law firm of Dewey & LeBoeuf LLP (1994-2012)
Other Public Company Board Memberships During Past 5 Years:
· Consolidated Edison, Inc., a utility company, Director (1997-2014)
· The Phoenix Companies, Inc., a life insurance company, Director (2000-2014)
No. of Portfolios for which Board Member Serves: 59
Gordon J. Davis is deemed to be an “interested person” (as defined under the Act) of the Company as a result of his affiliation with Venable LLP, which provides legal services to the Company.
———————
Once elected all Board Members serve for an indefinite term, but achieve Emeritus status upon reaching age 80. The address of the Board Members and Officers is c/o The Dreyfus Corporation, 200 Park Avenue, New York, New York 10166. Additional information about the Board Members is available in the fund's Statement of Additional Information which can be obtained from Dreyfus free of charge by calling this toll free number:1-800-DREYFUS.
William Hodding Carter III, Emeritus Board Member
Arnold S. Hiatt, Emeritus Board Member
40
OFFICERS OF THE FUND (Unaudited)
BRADLEY J. SKAPYAK, President since January 2010.
Chief Operating Officer and a director of the Manager since June 2009, Chairman of Dreyfus Transfer, Inc., an affiliate of the Manager and the transfer agent of the funds, since May 2011 and Executive Vice President of the Distributor since June 2007. From April 2003 to June 2009, Mr. Skapyak was the head of the Investment Accounting and Support Department of the Manager. He is an officer of 65 investment companies (comprised of 136 portfolios) managed by the Manager. He is 57 years old and has been an employee of the Manager since February 1988.
BENNETT A. MACDOUGALL, Chief Legal Officer since October 2015.
Chief Legal Officer of the Manager since June 2015; from June 2005 to June 2015, he served in various capacities with Deutsche Bank – Asset & Wealth Management Division, including as Director and Associate General Counsel, and Chief Legal Officer of Deutsche Investment Management Americas Inc. from June 2012 to May 2015. He is an officer of 66 investment companies (comprised of 161 portfolios) managed by the Manager. He is 44 years old and has been an employee of the Manager since June 2015.
JANETTE E. FARRAGHER, Vice President and Secretary since December 2011.
Assistant General Counsel of BNY Mellon, and an officer of 66 investment companies (comprised of 161 portfolios) managed by the Manager. She is 53 years old and has been an employee of the Manager since February 1984.
JAMES BITETTO, Vice President and Assistant Secretary since August 2005.
Managing Counsel of BNY Mellon and Secretary of the Manager, and an officer of 66 investment companies (comprised of 161 portfolios) managed by the Manager. He is 49 years old and has been an employee of the Manager since December 1996.
JONI LACKS CHARATAN, Vice President and Assistant Secretary since August 2005.
Managing Counsel of BNY Mellon, and an officer of 66 investment companies (comprised of 161 portfolios) managed by the Manager. She is 60 years old and has been an employee of the Manager since October 1988.
JOSEPH M. CHIOFFI, Vice President and Assistant Secretary since August 2005.
Managing Counsel of BNY Mellon, and an officer of 66 investment companies (comprised of 161 portfolios) managed by the Manager. He is 54 years old and has been an employee of the Manager since June 2000.
MAUREEN E. KANE, Vice President and Assistant Secretary since April 2015.
Managing Counsel of BNY Mellon since July 2014; from October 2004 until July 2014, General Counsel, and from May 2009 until July 2014, Chief Compliance Officer of Century Capital Management. She is an officer of 66 investment companies (comprised of 161 portfolios) managed by the Manager. She is 54 years old and has been an employee of the Manager since July 2014.
SARAH S. KELLEHER, Vice President and Assistant Secretary since April 2014.
Senior Counsel of BNY Mellon, and an officer of 66 investment companies (comprised of 161 portfolios) managed by the Manager; from August 2005 to March 2013, Associate General Counsel of Third Avenue Management. She is 40 years old and has been an employee of the Manager since March 2013.
JEFF PRUSNOFSKY, Vice President and Assistant Secretary since August 2005.
Senior Managing Counsel of BNY Mellon, and an officer of 66 investment companies (comprised of 161 portfolios) managed by the Manager. He is 50 years old and has been an employee of the Manager since October 1990.
JAMES WINDELS, Treasurer since November 2001.
Director – Mutual Fund Accounting of the Manager, and an officer of 66 investment companies (comprised of 161 portfolios) managed by the Manager. He is 57 years old and has been an employee of the Manager since April 1985.
RICHARD CASSARO, Assistant Treasurer since January 2008.
Senior Accounting Manager – Money Market and Municipal Bond Funds of the Manager, and an officer of 66 investment companies (comprised of 161 portfolios) managed by the Manager. He is 57 years old and has been an employee of the Manager since September 1982.
41
OFFICERS OF THE FUND (Unaudited) (continued)
GAVIN C. REILLY, Assistant Treasurer since December 2005.
Tax Manager of the Investment Accounting and Support Department of the Manager, and an officer of 66 investment companies (comprised of 161 portfolios) managed by the Manager. He is 47 years old and has been an employee of the Manager since April 1991.
ROBERT S. ROBOL, Assistant Treasurer since December 2002.
Senior Accounting Manager – Fixed Income Funds of the Manager, and an officer of 66 investment companies (comprised of 161 portfolios) managed by the Manager. He is 52 years old and has been an employee of the Manager since October 1988.
ROBERT SALVIOLO, Assistant Treasurer since July 2007.
Senior Accounting Manager – Equity Funds of the Manager, and an officer of 66 investment companies (comprised of 161 portfolios) managed by the Manager. He is 49 years old and has been an employee of the Manager since June 1989.
ROBERT SVAGNA, Assistant Treasurer since December 2002.
Senior Accounting Manager – Equity Funds of the Manager, and an officer of 66 investment companies (comprised of 161 portfolios) managed by the Manager. He is 49 years old and has been an employee of the Manager since November 1990.
JOSEPH W. CONNOLLY, Chief Compliance Officer since October 2004.
Chief Compliance Officer of the Manager and The Dreyfus Family of Funds (66 investment companies, comprised of 161 portfolios). He is 58 years old and has served in various capacities with the Manager since 1980, including manager of the firm’s Fund Accounting Department from 1997 through October 2001.
CARIDAD M. CAROSELLA, Anti-Money Laundering Compliance Officer since January 2016
Anti-Money Laundering Compliance Officer of the Dreyfus Family of Funds and BNY Mellon Funds Trust since January 2016; from May 2015 to December 2015, Interim Anti-Money Laundering Compliance Officer of the Dreyfus Family of Funds and BNY Mellon Funds Trust and the Distributor; from January 2012 to May 2015, AML Surveillance Officer of the Distributor and from 2007 to December 2011, Financial Processing Manager of the Distributor. She is an officer of 61 investment companies (comprised of 157 portfolios) managed by the Manager. She is 47 years old and has been an employee of the Distributor since 1997.
42
NOTES
43
NOTES
44
NOTES
45
Dreyfus GNMA Fund
200 Park Avenue
New York, NY 10166
Manager
The Dreyfus Corporation
200 Park Avenue
New York, NY 10166
Custodian
The Bank of New York Mellon
225 Liberty Street
New York, NY 10286
Transfer Agent &
Dividend Disbursing Agent
Dreyfus Transfer, Inc.
200 Park Avenue
New York, NY 10166
Distributor
MBSC Securities Corporation
200 Park Avenue
New York, NY 10166
Ticker Symbols: | Class A: GPGAX Class C: GPNCX Class Y: GPNYX Class Z: DRGMX |
Telephone Call your financial representative or 1-800-DREYFUS
Mail The Dreyfus Family of Funds, 144 Glenn Curtiss Boulevard, Uniondale, NY 11556-0144
E-mail Send your request to info@dreyfus.com
Internet Information can be viewed online or downloaded at www.dreyfus.com
The fund files its complete schedule of portfolio holdings with the Securities and Exchange Commission (“SEC”) for the first and third quarters of each fiscal year on Form N-Q. The fund’s Forms N-Q are available on the SEC’s website at www.sec.gov and may be reviewed and copied at the SEC’s Public Reference Room in Washington, DC. (phone 1-800-SEC-0330 for information).
A description of the policies and procedures that the fund uses to determine how to vote proxies relating to portfolio securities and information regarding how the fund voted these proxies for the most recent 12-month period ended June 30 is available at www.dreyfus.com and on the SEC’s website at www.sec.gov and without charge, upon request, by calling 1-800-DREYFUS.
© 2016 MBSC Securities Corporation |
|

Item 2. Code of Ethics.
The Registrant has adopted a code of ethics that applies to the Registrant's principal executive officer, principal financial officer, principal accounting officer or controller, or persons performing similar functions. There have been no amendments to, or waivers in connection with, the Code of Ethics during the period covered by this Report.
Item 3. Audit Committee Financial Expert.
The Registrant's Board has determined that Ehud Houminer, a member of the Audit Committee of the Board, is an audit committee financial expert as defined by the Securities and Exchange Commission (the "SEC"). Ehud Houminer is "independent" as defined by the SEC for purposes of audit committee financial expert determinations.
Item 4. Principal Accountant Fees and Services.
(a) Audit Fees. The aggregate fees billed for each of the last two fiscal years (the "Reporting Periods") for professional services rendered by the Registrant's principal accountant (the "Auditor") for the audit of the Registrant's annual financial statements or services that are normally provided by the Auditor in connection with the statutory and regulatory filings or engagements for the Reporting Periods, were $39,661 in 2015 and $40,652 in 2016.
(b) Audit-Related Fees. The aggregate fees billed in the Reporting Periods for assurance and related services by the Auditor that are reasonably related to the performance of the audit of the Registrant's financial statements and are not reported under paragraph (a) of this Item 4 were $0 in 2015 and $6,273 in 2016. These services consisted of one or more of the following: (i) agreed upon procedures related to compliance with Internal Revenue Code section 817(h), (ii) security counts required by Rule 17f-2 under the Investment Company Act of 1940, as amended, (iii) advisory services as to the accounting or disclosure treatment of Registrant transactions or events and (iv) advisory services to the accounting or disclosure treatment of the actual or potential impact to the Registrant of final or proposed rules, standards or interpretations by the Securities and Exchange Commission, the Financial Accounting Standards Boards or other regulatory or standard-setting bodies.
The aggregate fees billed in the Reporting Periods for non-audit assurance and related services by the Auditor to the Registrant's investment adviser (not including any sub-investment adviser whose role is primarily portfolio management and is subcontracted with or overseen by another investment adviser), and any entity controlling, controlled by or under common control with the investment adviser that provides ongoing services to the Registrant ("Service Affiliates"), that were reasonably related to the performance of the annual audit of the Service Affiliate, which required pre-approval by the Audit Committee were $0 in 2015 and $0 in 2016.
(c) Tax Fees. The aggregate fees billed in the Reporting Periods for professional services rendered by the Auditor for tax compliance, tax advice, and tax planning ("Tax Services") were $3,781 in 2015 and $4,284 in 2016. These services consisted of: (i) review or preparation of U.S. federal, state, local and excise tax returns; (ii) U.S. federal, state and local tax planning, advice and assistance regarding statutory, regulatory or administrative developments; (iii) tax advice regarding tax qualification matters and/or treatment of various financial instruments held or proposed to be acquired or held. The aggregate fees billed in the Reporting Periods for Tax Services by the Auditor to Service Affiliates, which required pre-approval by the Audit Committee were $0 in 2015 and $0 in 2016.
(d) All Other Fees. The aggregate fees billed in the Reporting Periods for products and services provided by the Auditor, other than the services reported in paragraphs (a) through (c) of this Item, were $3,373 in 2015 and $2,838 in 2016. These services included a review of the Registrant's anti-money laundering program.
The aggregate fees billed in the Reporting Periods for Non-Audit Services by the Auditor to Service Affiliates, other than the services reported in paragraphs (b) through (c) of this Item, which required pre-approval by the Audit Committee, were $0 in 2015 and $0 in 2016.
(e)(1) Audit Committee Pre-Approval Policies and Procedures. The Registrant's Audit Committee has established policies and procedures (the "Policy") for pre-approval (within specified fee limits) of the Auditor's engagements for non-audit services to the Registrant and Service Affiliates without specific case-by-case consideration. The pre-approved services in the Policy can include pre-approved audit services, pre-approved audit-related services, pre-approved tax services and pre-approved all other services. Pre-approval considerations include whether the proposed services are compatible with maintaining the Auditor's independence. Pre-approvals pursuant to the Policy are considered annually.
(e)(2) Note: None of the services described in paragraphs (b) through (d) of this Item 4 were approved by the Audit Committee pursuant to paragraph (c)(7)(i)(C) of Rule 2-01 of Regulation S-X.
(f) None of the hours expended on the principal accountant's engagement to audit the registrant's financial statements for the most recent fiscal year were attributed to work performed by persons other than the principal account's full-time, permanent employees.
Non-Audit Fees. The aggregate non-audit fees billed by the Auditor for services rendered to the Registrant, and rendered to Service Affiliates, for the Reporting Periods were $23,166,205 in 2015 and $19,046,287 in 2016.
Auditor Independence. The Registrant's Audit Committee has considered whether the provision of non-audit services that were rendered to Service Affiliates, which were not pre-approved (not requiring pre-approval), is compatible with maintaining the Auditor's independence.
Item 5. Audit Committee of Listed Registrants.
Not applicable.
Item 6. Investments.
(a) Not applicable.
Item 7. Disclosure of Proxy Voting Policies and Procedures for Closed-End Management Investment Companies.
Not applicable.
Item 8. Portfolio Managers of Closed-End Management Investment Companies.
Not applicable.
Item 9. Purchases of Equity Securities by Closed-End Management Investment Companies and Affiliated Purchasers.
Not applicable.
Item 10. Submission of Matters to a Vote of Security Holders.
There have been no material changes to the procedures applicable to Item 10.
Item 11. Controls and Procedures.
(a) The Registrant's principal executive and principal financial officers have concluded, based on their evaluation of the Registrant's disclosure controls and procedures as of a date within 90 days of the filing date of this report, that the Registrant's disclosure controls and procedures are reasonably designed to ensure that information required to be disclosed by the Registrant on Form N-CSR is recorded, processed, summarized and reported within the required time periods and that information required to be disclosed by the Registrant in the reports that it files or submits on Form N-CSR is accumulated and communicated to the Registrant's management, including its principal executive and principal financial officers, as appropriate to allow timely decisions regarding required disclosure.
(b) There were no changes to the Registrant's internal control over financial reporting that occurred during the second fiscal quarter of the period covered by this report that have materially affected, or are reasonably likely to materially affect, the Registrant's internal control over financial reporting.
Item 12. Exhibits.
(a)(1) Code of ethics referred to in Item 2.
(a)(2) Certifications of principal executive and principal financial officers as required by Rule 30a-2(a) under the Investment Company Act of 1940.
(a)(3) Not applicable.
(b) Certification of principal executive and principal financial officers as required by Rule 30a-2(b) under the Investment Company Act of 1940.
SIGNATURES
Pursuant to the requirements of the Securities Exchange Act of 1934 and the Investment Company Act of 1940, the Registrant has duly caused this Report to be signed on its behalf by the undersigned, thereunto duly authorized.
Dreyfus Premier GNMA Fund, Inc.
By: /s/ Bradley J. Skapyak
Bradley J. Skapyak
President
Date: June 22, 2016
Pursuant to the requirements of the Securities Exchange Act of 1934 and the Investment Company Act of 1940, this Report has been signed below by the following persons on behalf of the Registrant and in the capacities and on the dates indicated.
By: /s/ Bradley J. Skapyak
Bradley J. Skapyak
President
Date: June 22, 2016
By: /s/ James Windels
James Windels
Treasurer
Date: June 22, 2016
EXHIBIT INDEX
(a)(1) Code of ethics referred to in Item 2.
(a)(2) Certifications of principal executive and principal financial officers as required by Rule 30a-2(a) under the Investment Company Act of 1940. (EX-99.CERT)
(b) Certification of principal executive and principal financial officers as required by Rule 30a-2(b) under the Investment Company Act of 1940. (EX-99.906CERT)