Exhibit 99.2
| NABORS INDUSTRIES LTD. October 22, 2024 3Q 2024 Earnings Presentation |

| N A B O R S . C O M We often discuss expectations regarding our future markets, demand for our products and services, and our performance in our annual, quarterly, and current reports, press releases, and other written and oral statements. Such statements, including statements in this document that relate to matters that are not historical facts, are “forward-looking statements” within the meaning of the safe harbor provisions of Section 27A of the U.S. Securities Act of 1933 and Section 21E of the U.S. Securities Exchange Act of 1934. These “forward-looking statements” are based on our analysis of currently available competitive, financial and economic data and our operating plans. They are inherently uncertain, and investors should recognize that events and actual results could turn out to be significantly different from our expectations. Factors to consider when evaluating these forward-looking statements include, but are not limited to: • geopolitical events, pandemics and other macro-events and their respective and collective impact on our operations as well as oil and gas markets and prices; • fluctuations and volatility in worldwide prices of and demand for oil and natural gas; • fluctuations in levels of oil and natural gas exploration and development activities; • fluctuations in the demand for our services; • competitive and technological changes and other developments in the oil and gas and oilfield services industries; • our ability to renew customer contracts in order to maintain competitiveness; • the existence of operating risks inherent in the oil and gas and oilfield services industries; • the possibility of the loss of one or a number of our large customers; • the amount and nature of our future capital expenditures and how we expect to fund our capital expenditures; • The occurrence of cybersecurity incidents, attacks and other breaches to our information technology systems; • the impact of long-term indebtedness and other financial commitments on our financial and operating flexibility; • our access to and the cost of capital, including the impact of a further downgrade in our credit rating, covenant restrictions, availability under our revolving credit facility, and future issuances of debt or equity securities and the global interest rate environment; • our dependence on our operating subsidiaries and investments to meet our financial obligations; • our ability to retain skilled employees; • our ability to complete, and realize the expected benefits of, strategic transactions; • changes in tax laws and the possibility of changes in other laws and regulation; • the possibility of changes to U.S. trade policies and regulations including the imposition of trade embargoes or sanctions; and • global views on and the regulatory environment related to energy transition and our ability to implement our energy transition initiatives; • Forward Looking Statements NABORS INDUSTRIES 2 • potential long-lived asset impairments • the possibility of changes to U.S. trade policies and regulations including the imposition of trade embargoes, sanctions or tariffs; • general economic conditions, including the capital and credit markets; • uncertainty as to whether the conditions to closing the merger will be satisfied; • our ability to obtain approval of the merger from our shareholders and Parker's ability to obtain approval of the merger from its shareholders; • potential adverse reactions or changes to business relationships resulting from the announcement or completion of the merger; • expectations regarding regulatory approval of the merger; • our ability to retain key personnel of Nabors and Parker; • the diversion of management time on merger-related issues; • the combined company's ability to utilize NOLs; • the significant costs required to complete the merger and to integrate Parker's operations with our own; • whether litigation relating to the merger will occur and, if so, the results of any litigation, settlements and investigations; • our ability to realize the expected benefits of the merger with Parker; and • the effects of the business combination, including the combined company's future financial condition, results of operations, strategy and plans. Our businesses depend, to a large degree, on the level of spending by oil and gas companies for exploration, development and production activities. Therefore, sustained lower oil or natural gas prices that have a material impact on exploration, development or production activities could also materially affect our financial position, results of operations and cash flows. The above description of risks and uncertainties is by no means all-inclusive but is designed to highlight what we believe are important factors to consider. For a discussion of these factors and other risks and uncertainties, please refer to our filings with the Securities and Exchange Commission ("SEC"), including those contained in our Annual Reports on Form 10-K and Quarterly Reports on Form 10-Q, which are available at the SEC's website at www.sec.gov. We undertake no obligation to publicly update or revise any forward-looking statement as a result of new information, future events or otherwise, except as otherwise required by law. Non-GAAP Financial Measures This presentation refers to certain “non-GAAP” financial measures, such as adjusted EBITDA, net debt, adjusted gross margin and adjusted free cash flow. The components of these non-GAAP measures are computed by using amounts that are determined in accordance with accounting principles generally accepted in the United States of America (“GAAP”). |
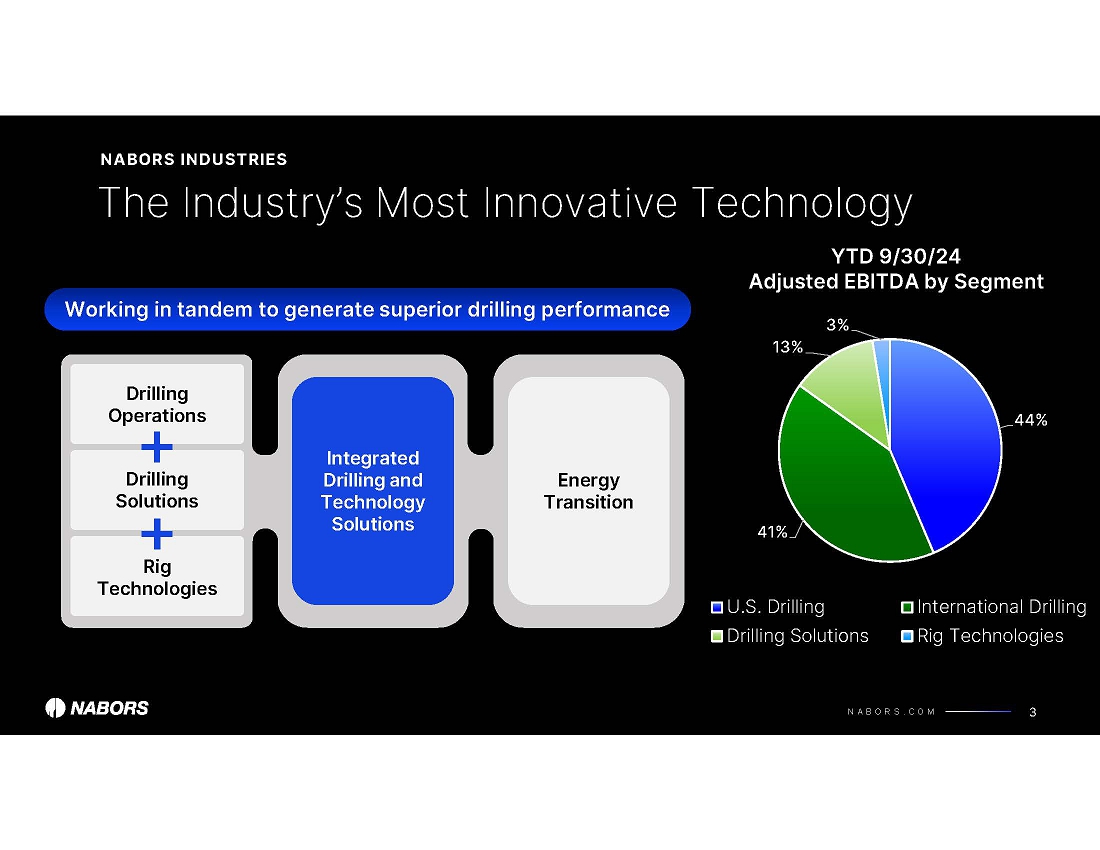
| N A B O R S . C O M 35% 48% 11% 6% YTD 9/30/24 Revenue by Segment U.S. Drilling International Drilling Drilling Solutions Rig Technologies 3 The Industry’s Most Innovative Technology NABORS INDUSTRIES Integrated Drilling and Technology Solutions Drilling Operations Drilling Solutions Rig Technologies Energy Transition Working in tandem to generate superior drilling performance |
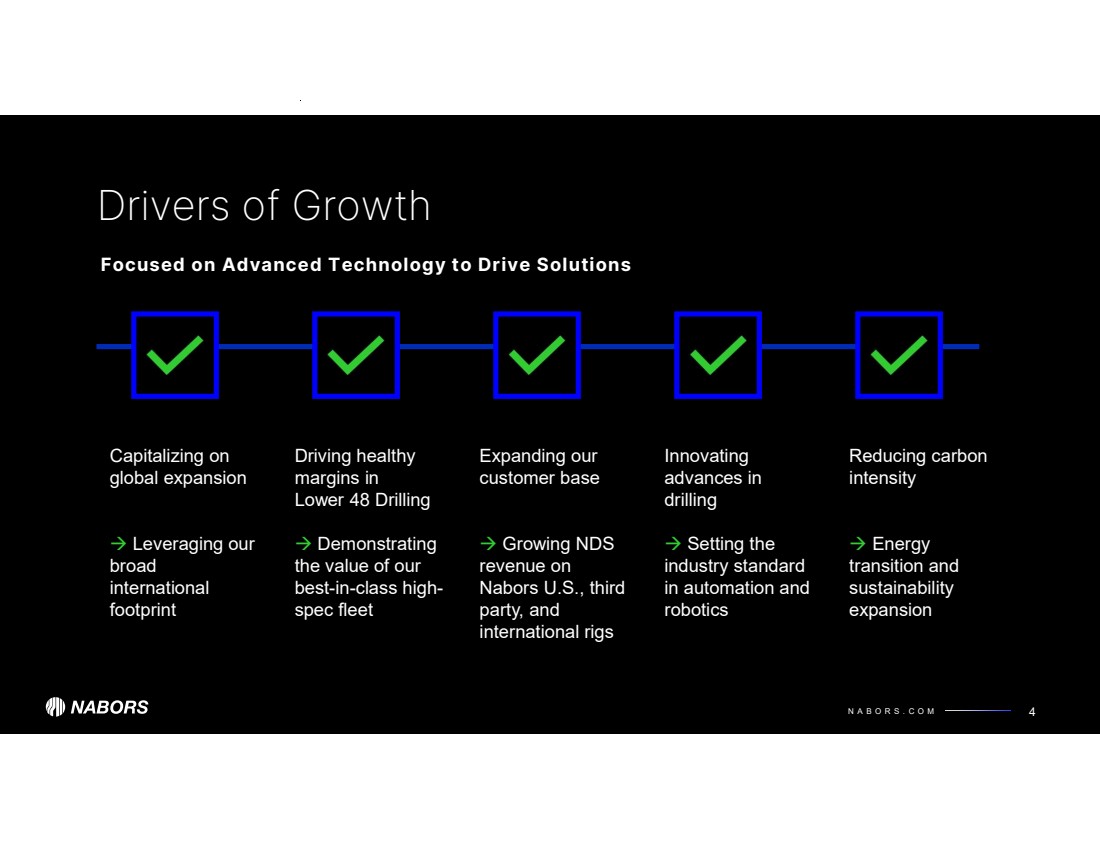
| N A B O R S . C O M 4 Drivers of Growth Capitalizing on global expansion Leveraging our broad international footprint Expanding our customer base Growing NDS revenue on Nabors U.S., third party, and international rigs Driving healthy margins in Lower 48 Drilling Demonstrating the value of our best-in-class high-spec fleet Reducing carbon intensity Energy transition and sustainability expansion Innovating advances in drilling Setting the industry standard in automation and robotics Focused on Advanced Technology to Drive Solutions |
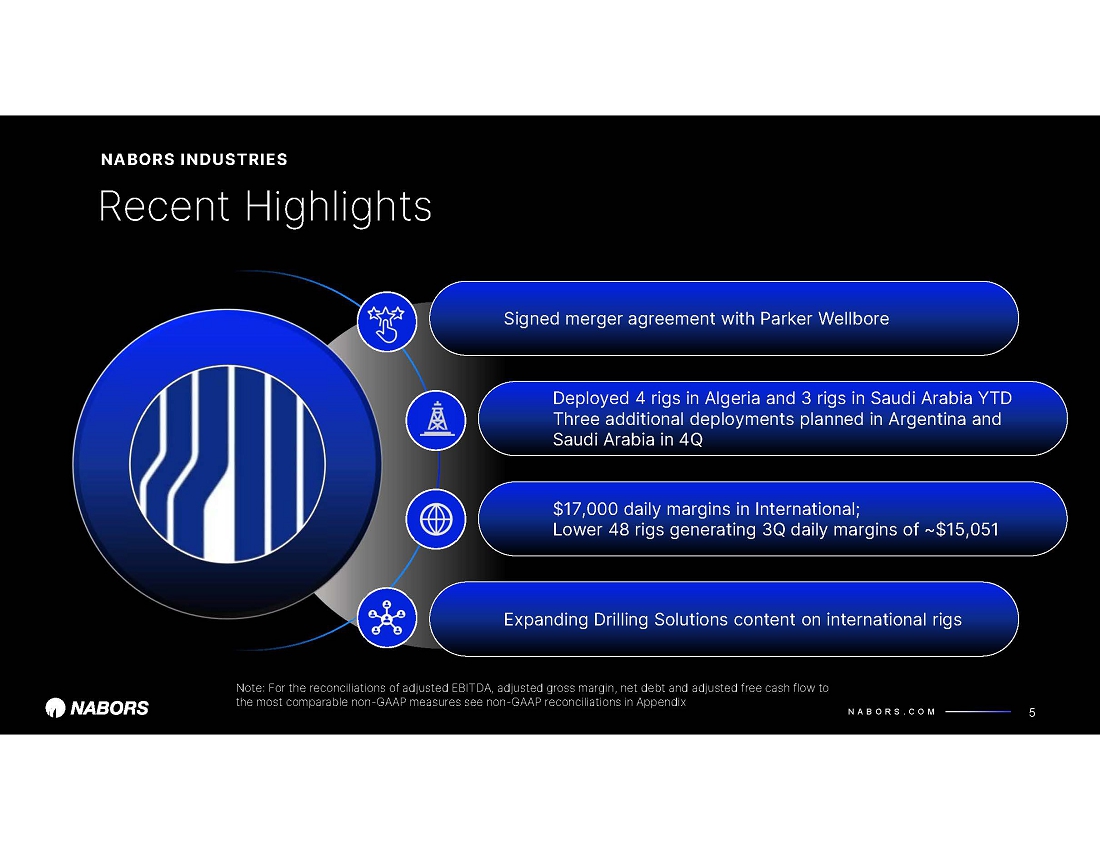
| N A B O R S . C O M Recent Highlights NABORS INDUSTRIES 5 Lower 48 rigs generating 3Q daily margins of ~$15,051, holding above prior market cycle highs Signed merger agreement with Parker Wellbore Deployed 4 rigs in Algeria and 3 rigs in Saudi Arabia YTD Additional deployments planned in Saudi Arabia and Argentina in 4Q Nabors Expanding Drilling Solutions content on international rigs Note: For the reconciliations of adjusted EBITDA, adjusted gross margin, net debt and adjusted free cash flow to the most comparable non-GAAP measures see non-GAAP reconciliations in Appendix |
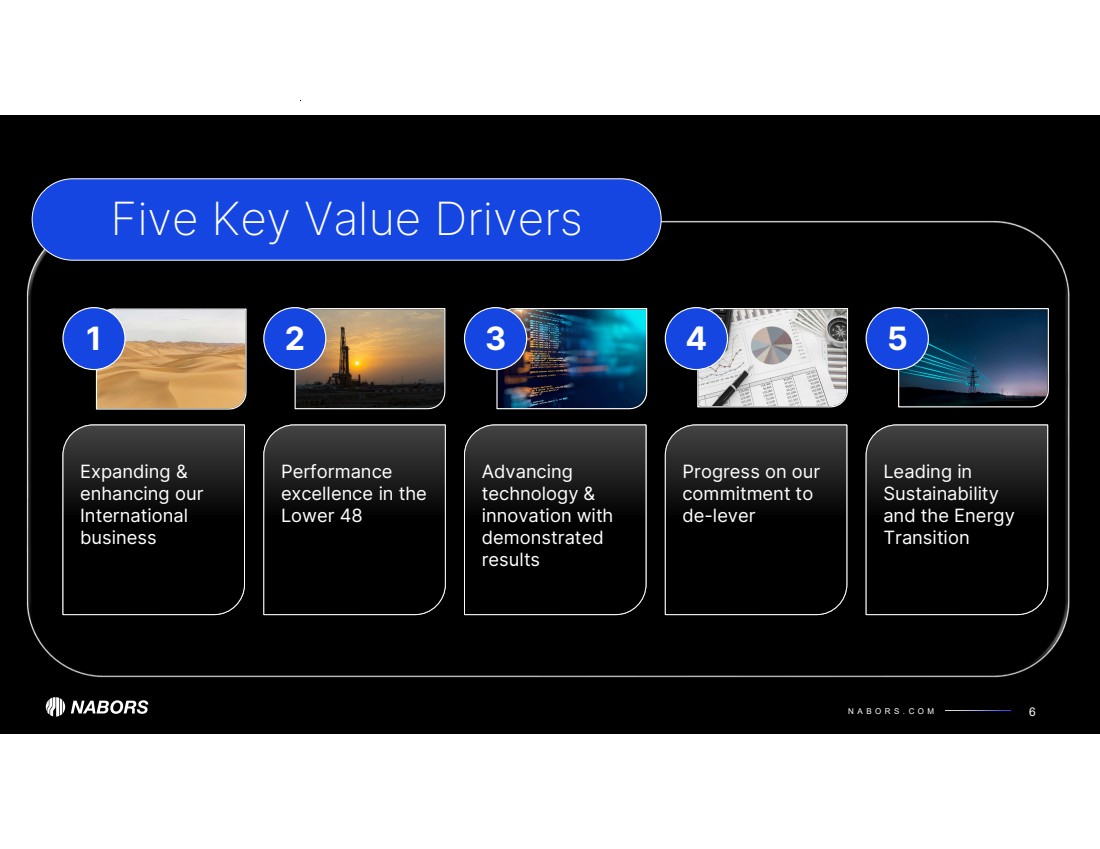
| N A B O R S . C O M Performance excellence in the Lower 48 6 Expanding & enhancing our International business Five Key Value Drivers 1 Advancing technology & innovation with demonstrated results Progress on our commitment to de-lever 2 3 Leading in Sustainability and the Energy Transition 4 5 |
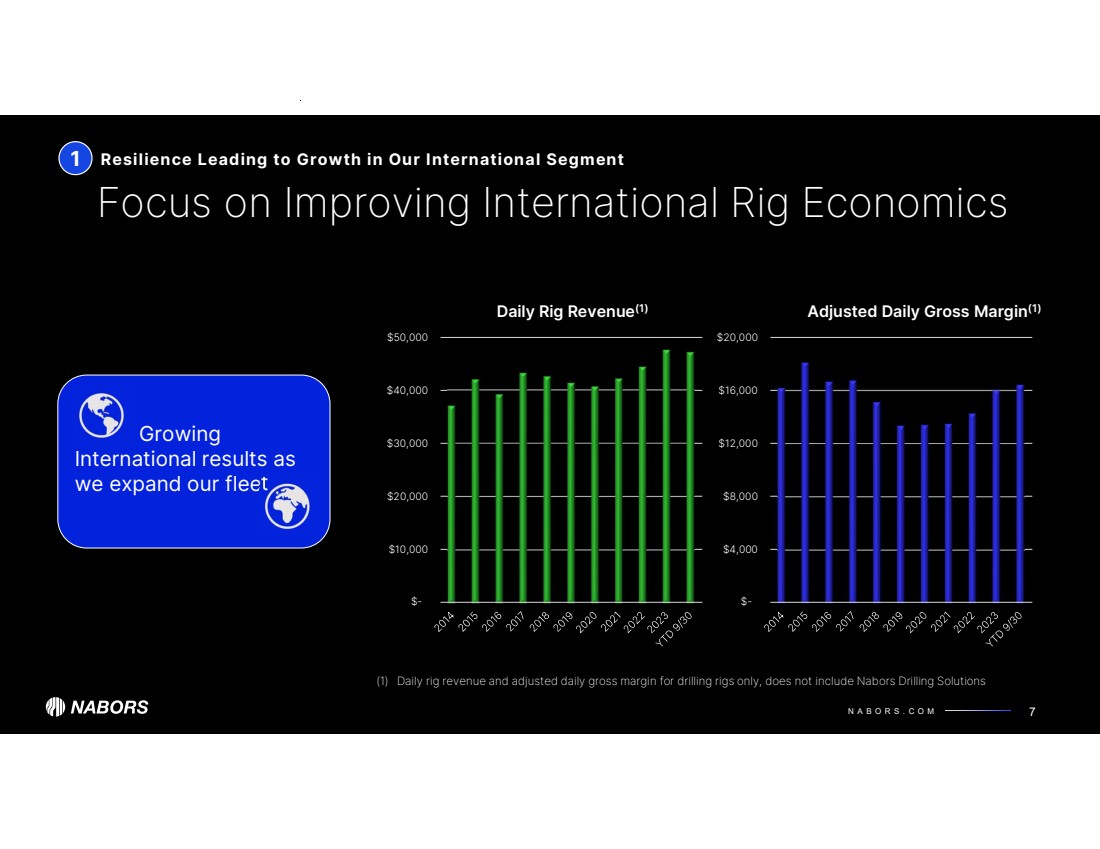
| N A B O R S . C O M $- $4,000 $8,000 $12,000 $16,000 $20,000 Adjusted Daily Gross Margin(1) $- $10,000 $20,000 $30,000 $40,000 $50,000 Daily Rig Revenue(1) 1 Growing International results as we expand our fleet Focus on Improving International Rig Economics Resilience Leading to Growth in Our International Segment 7 (1) Daily rig revenue and adjusted daily gross margin for drilling rigs only, does not include Nabors Drilling Solutions |
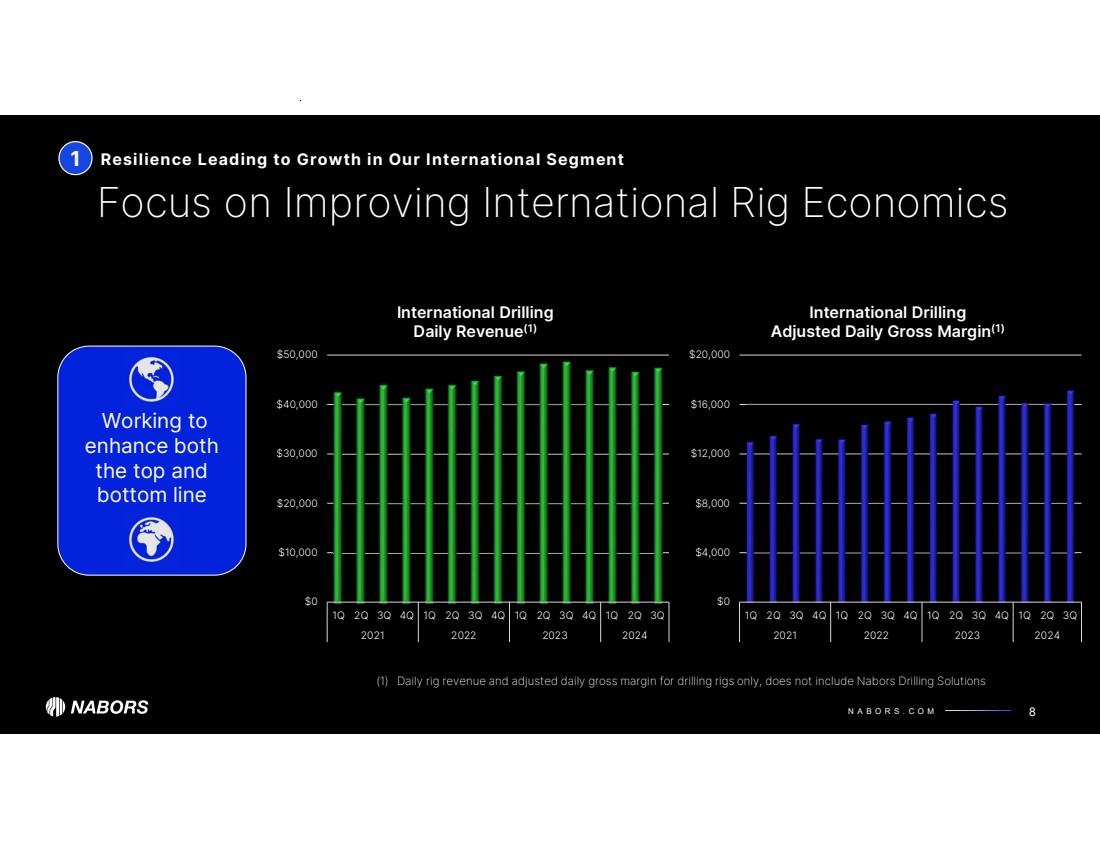
| N A B O R S . C O M $0 $4,000 $8,000 $12,000 $16,000 $20,000 1Q 2Q 3Q 4Q 1Q 2Q 3Q 4Q 1Q 2Q 3Q 4Q 1Q 2Q 3Q 2021 2022 2023 2024 International Drilling Adjusted Daily Gross Margin(1) $0 $10,000 $20,000 $30,000 $40,000 $50,000 1Q 2Q 3Q 4Q 1Q 2Q 3Q 4Q 1Q 2Q 3Q 4Q 1Q 2Q 3Q 2021 2022 2023 2024 International Drilling Daily Revenue(1) 1 Working to enhance both the top and bottom line Focus on Improving International Rig Economics Resilience Leading to Growth in Our International Segment 8 (1) Daily rig revenue and adjusted daily gross margin for drilling rigs only, does not include Nabors Drilling Solutions |
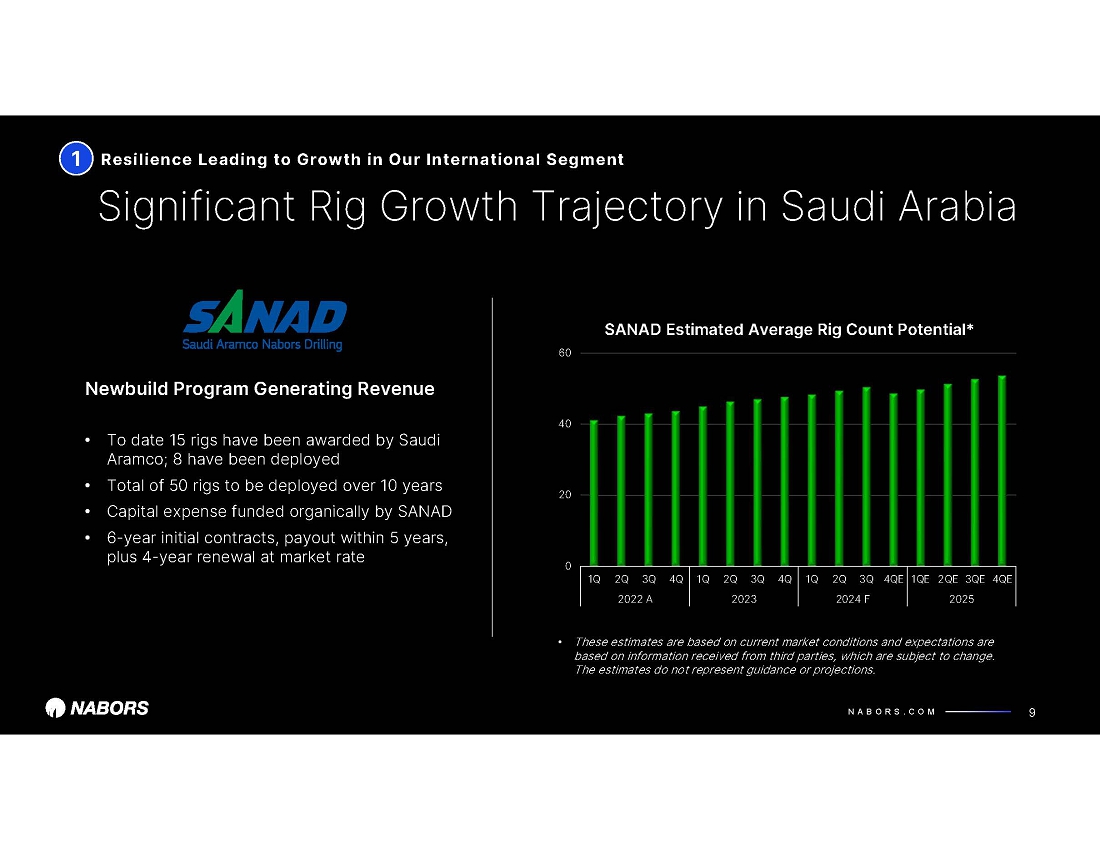
| N A B O R S . C O M 0 20 40 60 1Q 2Q 3Q 4Q 1Q 2Q 3Q 4Q 1Q 2Q 3Q 4QE 1QE 2QE 3QE 4QE 2022 A 2023 2024 F 2025 SANAD Estimated Average Rig Count Potential* 1 Significant Rig Growth Trajectory in Saudi Arabia Resilience Leading to Growth in Our International Segment 9 • Eight operating and one more scheduled in 2024 • To date 15 total rigs scheduled for deployment • Total of 50 rigs to be deployed over 10 years • Capital expense funded organically by SANAD • 6-year initial contracts, payout within 5 years, plus 4-year renewal at market rate Newbuild Program Generating Revenue • These estimates are based on current market conditions and expectations are based on information received from third parties, which are subject to change. The estimates do not represent guidance or projections. |
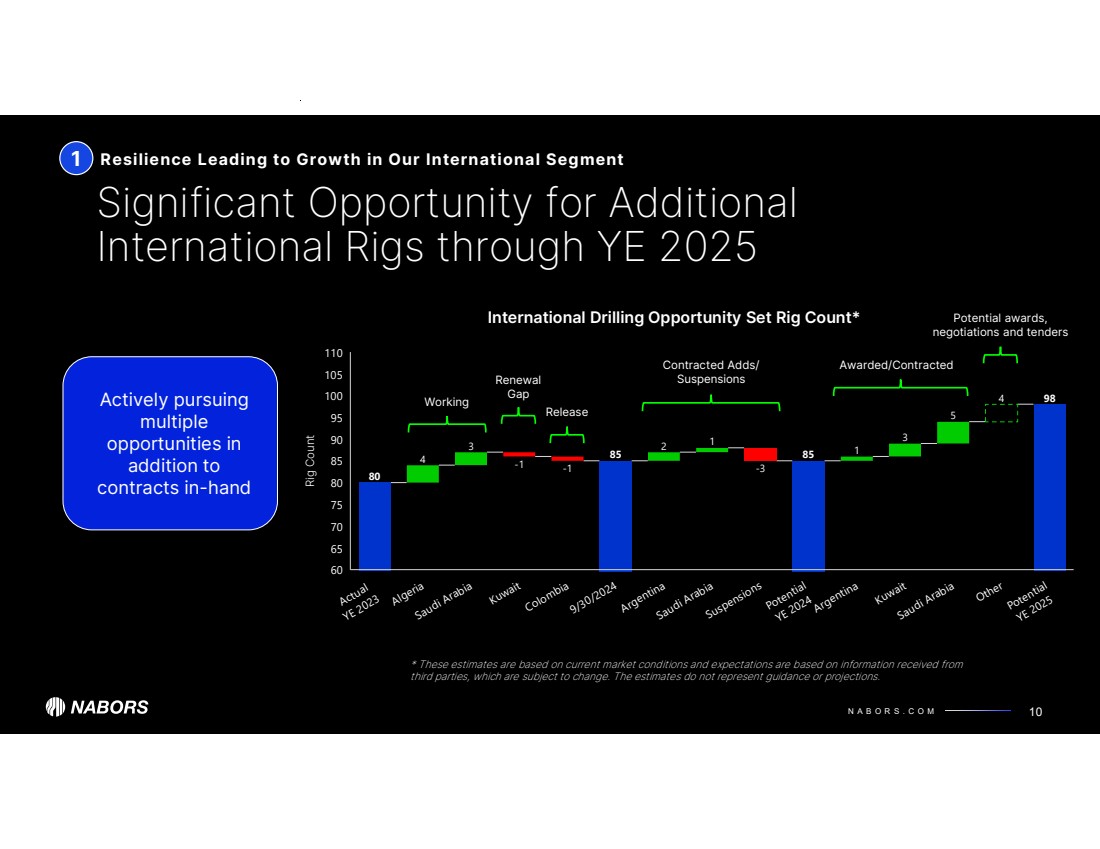
| N A B O R S . C O M 4 3 -1 -1 2 1 -3 1 3 5 4 80 85 85 98 Actual YE 2023 Algeria Saudi Arabia Kuwait Colombia 9/30/2024 Argentina Saudi Arabia Suspensions Potential YE 2024Argentina Kuwait Saudi Arabia Other Potential YE 2025 Rig Count 60 65 70 75 80 85 90 95 100 105 110 1 Significant Opportunity for Additional International Rigs through YE 2025 10 Actively pursuing multiple opportunities in addition to contracts in-hand * These estimates are based on current market conditions and expectations are based on information received from third parties, which are subject to change. The estimates do not represent guidance or projections. Resilience Leading to Growth in Our International Segment Contracted Adds/ Suspensions Potential awards, negotiations and tenders Awarded/Contracted International Drilling Opportunity Set Rig Count* Working Renewal Gap Release |
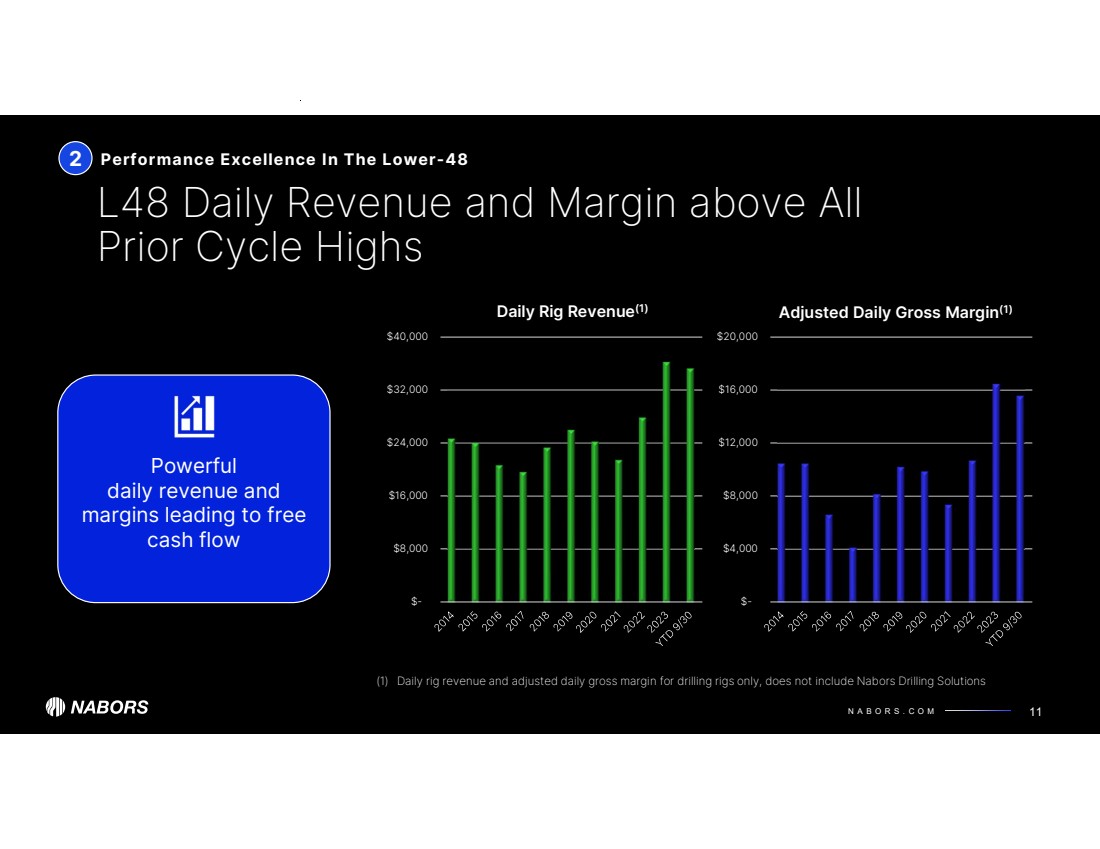
| N A B O R S . C O M $- $8,000 $16,000 $24,000 $32,000 $40,000 Daily Rig Revenue(1) $- $4,000 $8,000 $12,000 $16,000 $20,000 Adjusted Daily Gross Margin(1) 2 L48 Daily Revenue and Margin above All Prior Cycle Highs Performance Excellence In The Lower-48 11 Powerful daily revenue and margins leading to free cash flow (1) Daily rig revenue and adjusted daily gross margin for drilling rigs only, does not include Nabors Drilling Solutions |
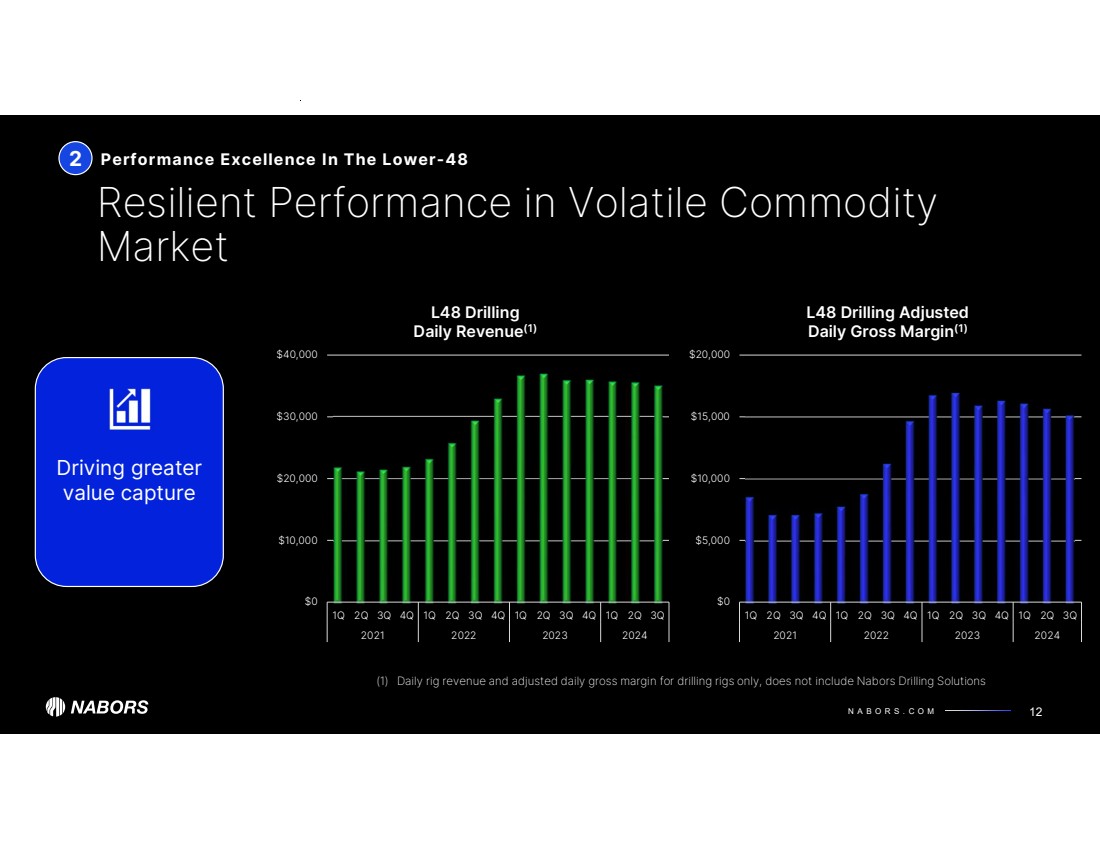
| N A B O R S . C O M $0 $5,000 $10,000 $15,000 $20,000 1Q 2Q 3Q 4Q 1Q 2Q 3Q 4Q 1Q 2Q 3Q 4Q 1Q 2Q 3Q 2021 2022 2023 2024 L48 Drilling Adjusted Daily Gross Margin(1) $0 $10,000 $20,000 $30,000 $40,000 1Q 2Q 3Q 4Q 1Q 2Q 3Q 4Q 1Q 2Q 3Q 4Q 1Q 2Q 3Q 2021 2022 2023 2024 L48 Drilling Daily Revenue(1) 2 Resilient Performance in Volatile Commodity Market Performance Excellence In The Lower-48 12 Driving greater value capture (1) Daily rig revenue and adjusted daily gross margin for drilling rigs only, does not include Nabors Drilling Solutions |
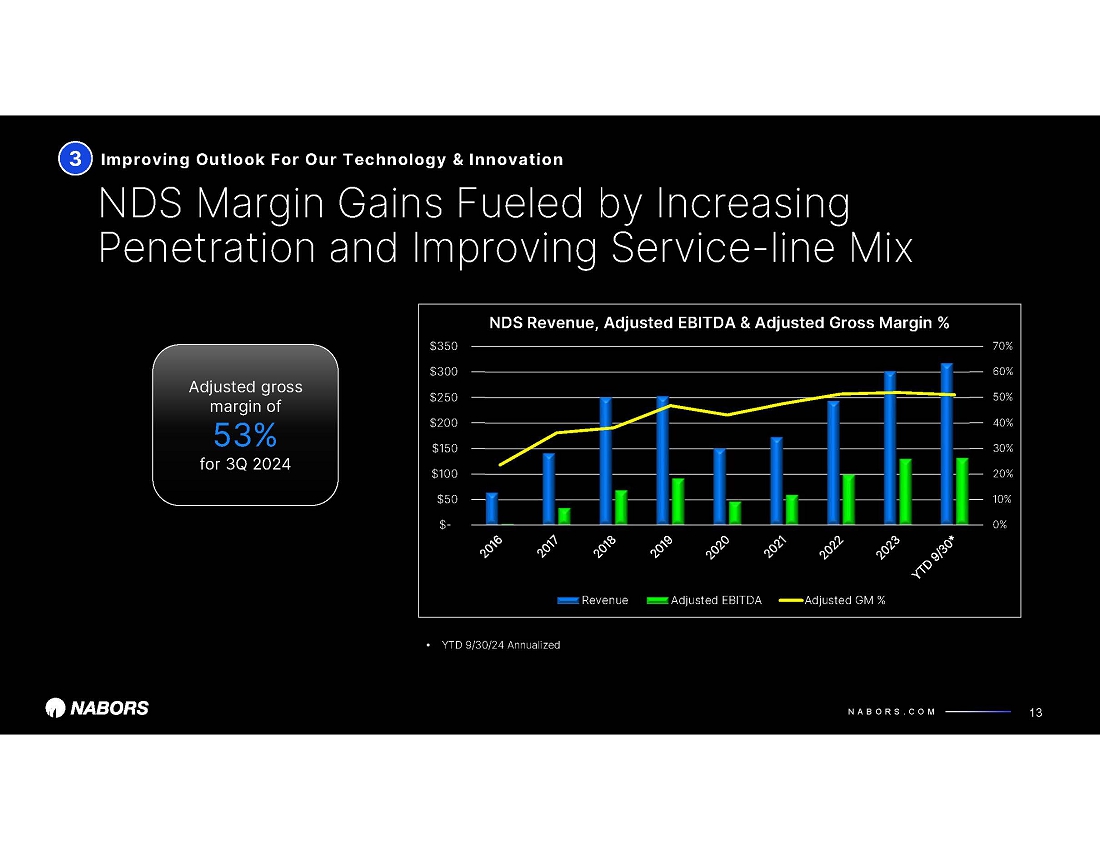
| N A B O R S . C O M 0% 10% 20% 30% 40% 50% 60% 70% $- $50 $100 $150 $200 $250 $300 $350 NDS Revenue, Adjusted EBITDA & Adjusted Gross Margin % Revenue Adjusted EBITDA Adjusted GM % NDS Margin Gains Fueled by Increasing Penetration and Improving Service-line Mix Improving Outlook For Our Technology & Innovation 13 Adjusted gross margin of 51% YTD 9/30/24 3 • YTD 9/30/24 Annualized |
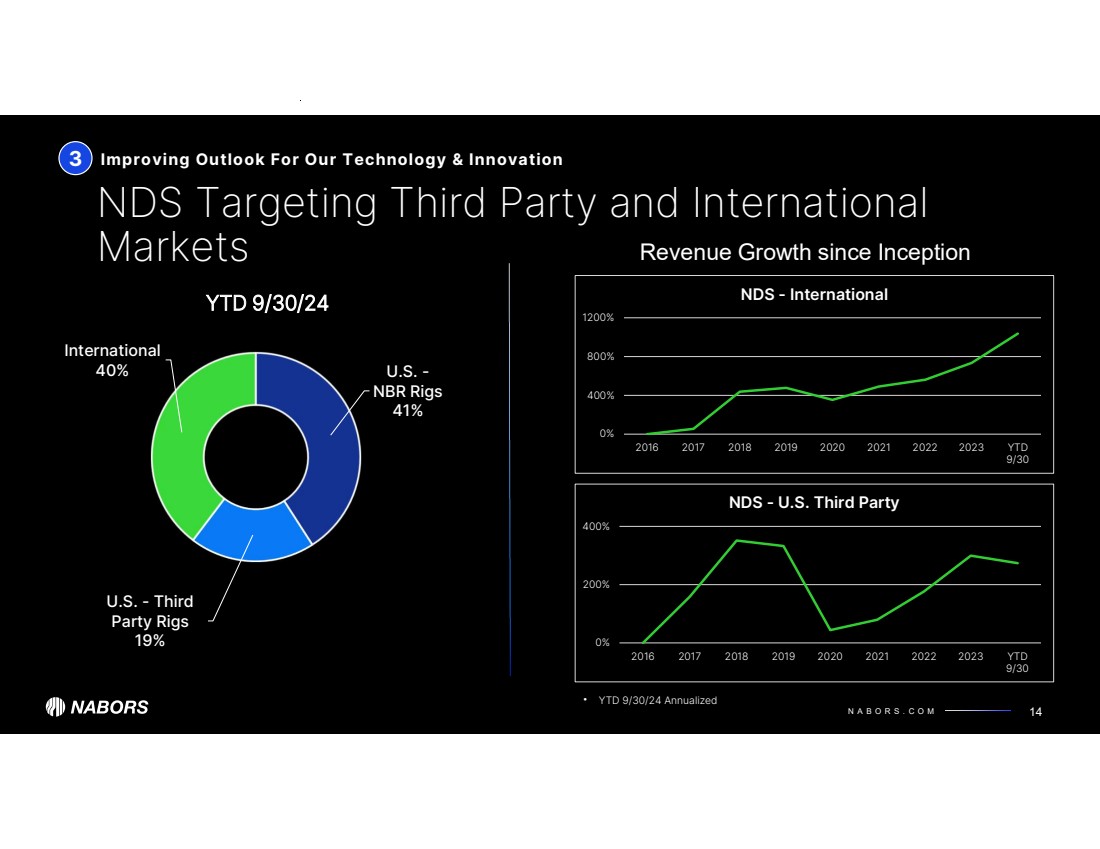
| N A B O R S . C O M 0% 200% 400% 2016 2017 2018 2019 2020 2021 2022 2023 YTD 9/30 NDS - U.S. Third Party 0% 400% 800% 1200% 2016 2017 2018 2019 2020 2021 2022 2023 YTD 9/30 NDS - International NDS Targeting Third Party and International Markets Improving Outlook For Our Technology & Innovation 14 3 • YTD 9/30/24 Annualized U.S. - NBR Rigs 41% U.S. - Third Party Rigs 19% International 40% YTD 9/30/24 Revenue Growth since Inception |
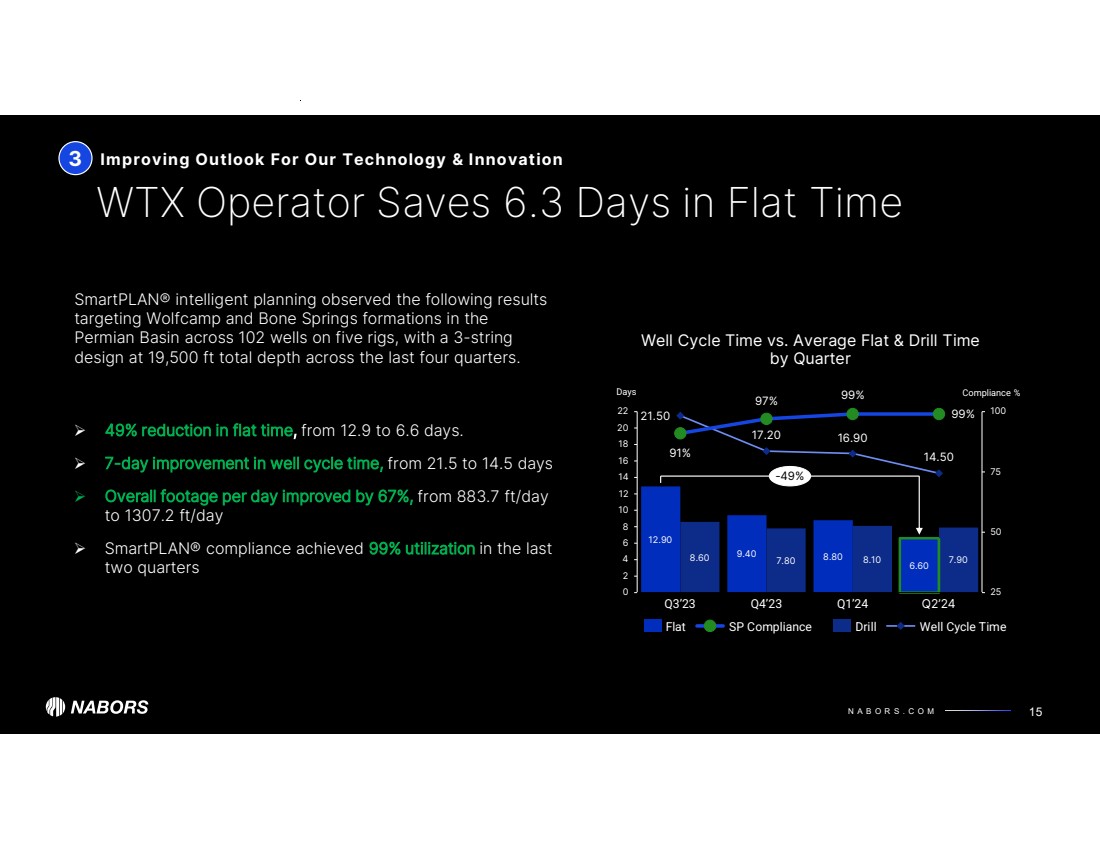
| N A B O R S . C O M WTX Operator Saves 6.3 Days in Flat Time 15 3 Improving Outlook For Our Technology & Innovation 49% reduction in flat time, from 12.9 to 6.6 days. 7-day improvement in well cycle time, from 21.5 to 14.5 days Overall footage per day improved by 67%, from 883.7 ft/day to 1307.2 ft/day SmartPLAN® compliance achieved 99% utilization in the last two quarters Well Cycle Time vs. Average Flat & Drill Time by Quarter 12.90 9.40 8.80 6.60 8.60 7.80 8.10 7.90 21.50 17.20 16.90 14.50 91% 97% 25 50 75 100 0 2 4 6 8 10 12 14 16 18 20 22 Q3’23 Q4’23 99% Q1’24 99% Q2’24 -49% Flat SP Compliance Drill Well Cycle Time Days Compliance % SmartPLAN® intelligent planning observed the following results targeting Wolfcamp and Bone Springs formations in the Permian Basin across 102 wells on five rigs, with a 3-string design at 19,500 ft total depth across the last four quarters. |
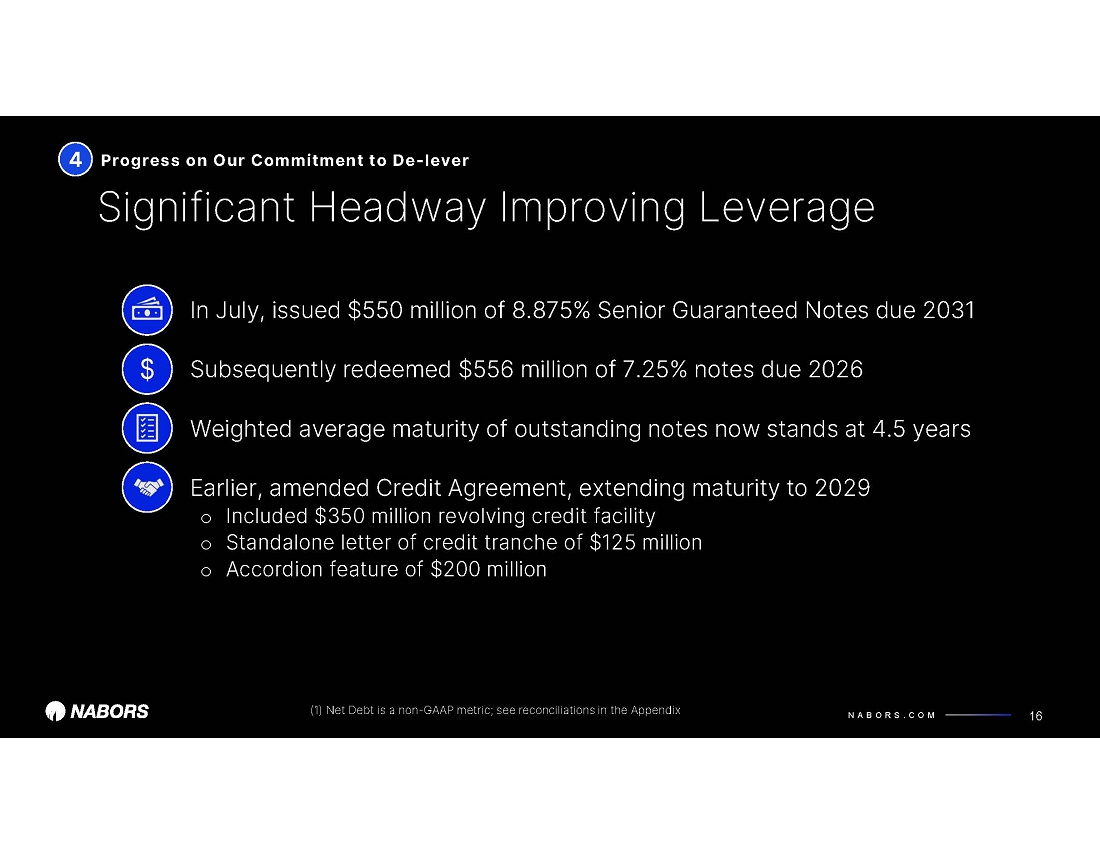
| N A B O R S . C O M $- $1.0 $2.0 $3.0 $4.0 1Q 2Q 3Q 4Q 1Q 2Q 3Q 4Q 1Q 2Q 3Q 4Q 1Q 2Q 3Q 4Q 1Q 2Q 3Q 4Q 1Q 2Q 3Q 4Q 1Q 2Q 3Q 2018 2019 2020 2021 2022 2023 2024 Billions Net Debt Significant Headway Improving Leverage Progress on Our Commitment to De-lever 16 $1.8 billion Net Debt(1) reduction since 1Q 2018 $1.8 billion (1) Net Debt is a non-GAAP metric; see reconciliations in the Appendix 4 |
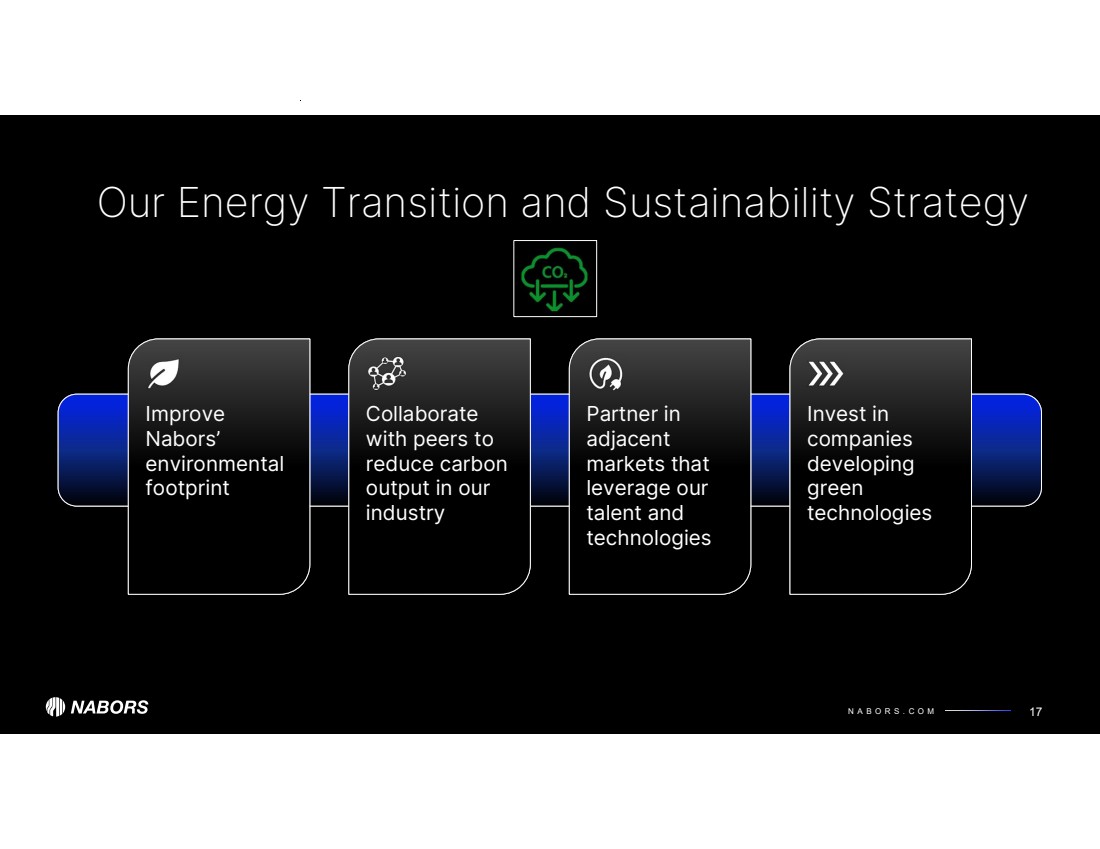
| N A B O R S . C O M Our Energy Transition and Sustainability Strategy 17 Improve Nabors’ environmental footprint Collaborate with peers to reduce carbon output in our industry Partner in adjacent markets that leverage our talent and technologies Invest in companies developing green technologies |
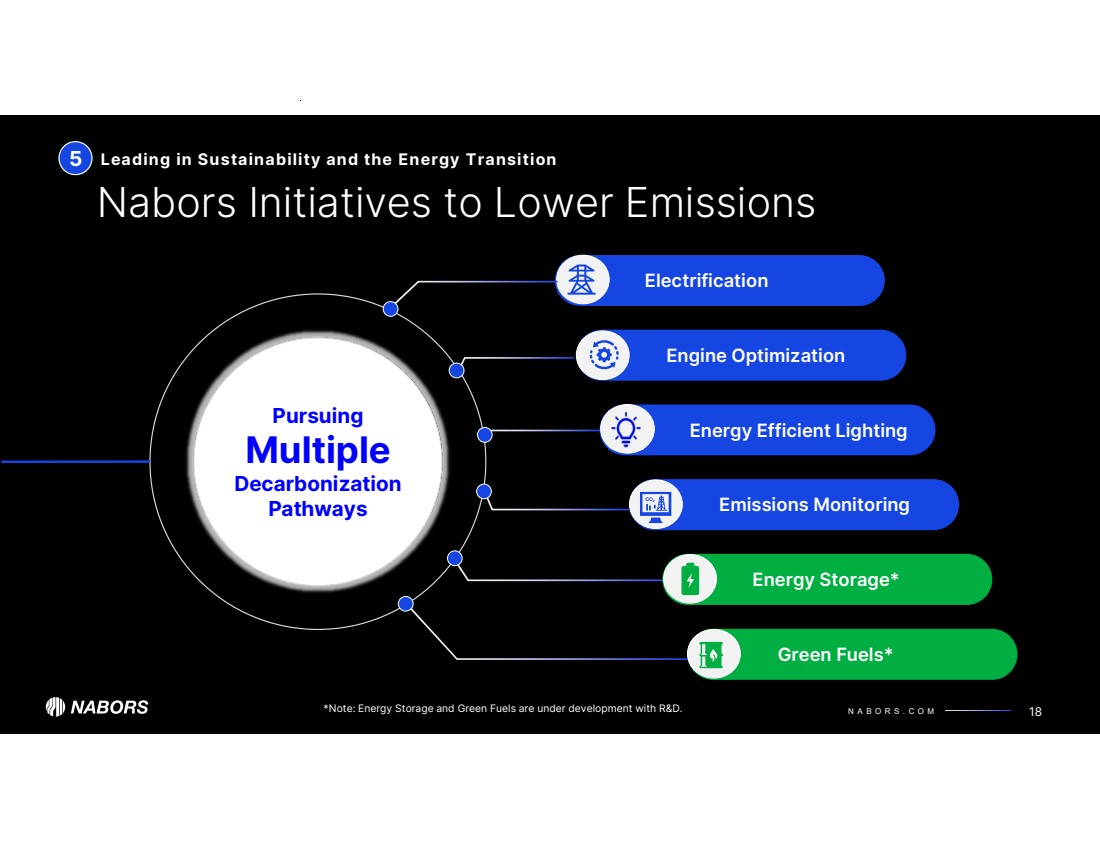
| N A B O R S . C O M Electrification Pursuing Multiple Decarbonization Pathways Green Fuels* Energy Storage* Leading in Sustainability and the Energy Transition Nabors Initiatives to Lower Emissions 18 Emissions Monitoring Engine Optimization 5 Energy Efficient Lighting *Note: Energy Storage and Green Fuels are under development with R&D. |
| Appendix 19 |
| Appendix 20 |
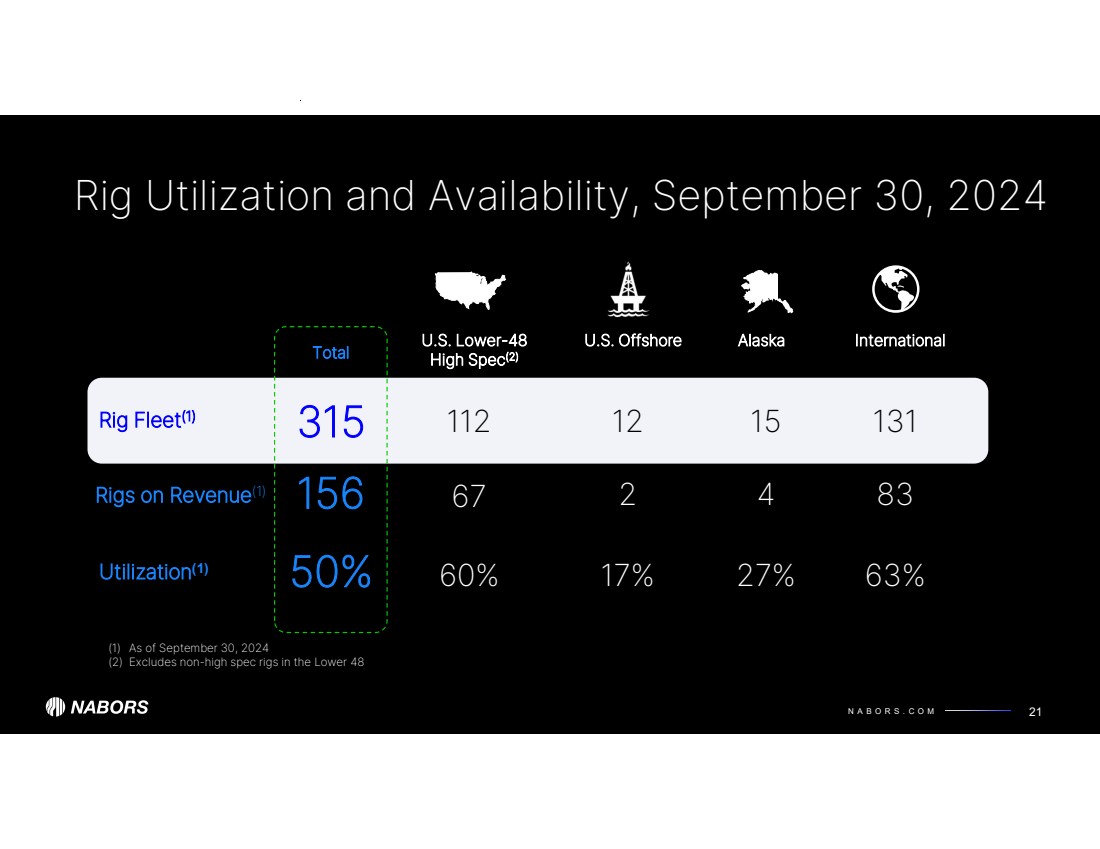
| N A B O R S . C O M Rig Utilization and Availability, September 30, 2024 21 Rig Fleet(1) 315 Rigs on Revenue(1) 156 Utilization(1) 50% Total U.S. Offshore 12 2 17% 15 4 27% Alaska International 131 83 63% 112 67 60% U.S. Lower-48 High Spec(2) (1) As of September 30, 2024 (2) Excludes non-high spec rigs in the Lower 48 |
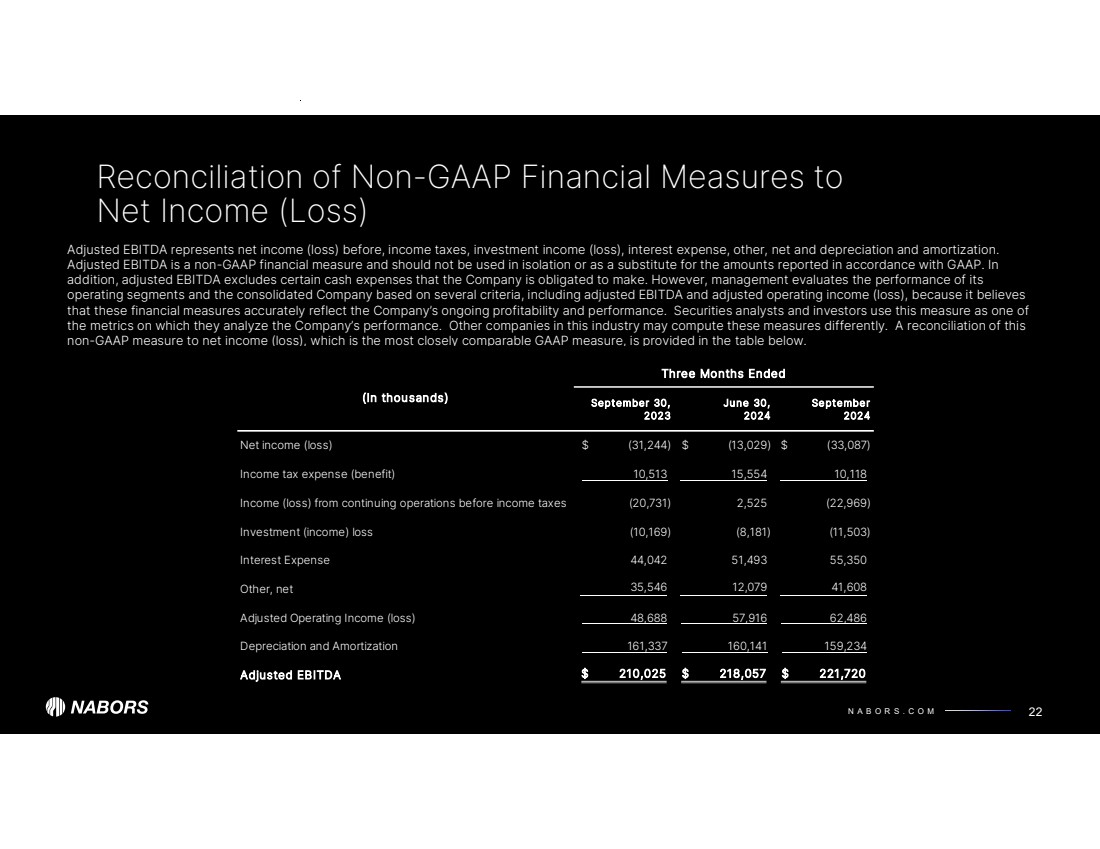
| N A B O R S . C O M Reconciliation of Non-GAAP Financial Measures to Net Income (Loss) 22 Adjusted EBITDA represents net income (loss) before, income taxes, investment income (loss), interest expense, other, net and depreciation and amortization. Adjusted EBITDA is a non-GAAP financial measure and should not be used in isolation or as a substitute for the amounts reported in accordance with GAAP. In addition, adjusted EBITDA excludes certain cash expenses that the Company is obligated to make. However, management evaluates the performance of its operating segments and the consolidated Company based on several criteria, including adjusted EBITDA and adjusted operating income (loss), because it believes that these financial measures accurately reflect the Company’s ongoing profitability and performance. Securities analysts and investors use this measure as one of the metrics on which they analyze the Company’s performance. Other companies in this industry may compute these measures differently. A reconciliation of this non-GAAP measure to net income (loss), which is the most closely comparable GAAP measure, is provided in the table below. (In thousands) September 30, June 30, September 2023 2024 2024 Net income (loss) (31,244) $ (13,029) $ (33,087) $ Income tax expense (benefit) 10,513 15,554 10,118 Income (loss) from continuing operations before income taxes (20,731) 2,525 (22,969) Investment (income) loss (10,169) (8,181) (11,503) Interest Expense 44,042 51,493 55,350 Other, net 35,546 12,079 41,608 Adjusted Operating Income (loss) 48,688 57,916 62,486 Depreciation and Amortization 161,337 160,141 159,234 Adjusted EBITDA $ 210,025 218,057 $ 221,720 $ Three Months Ended |
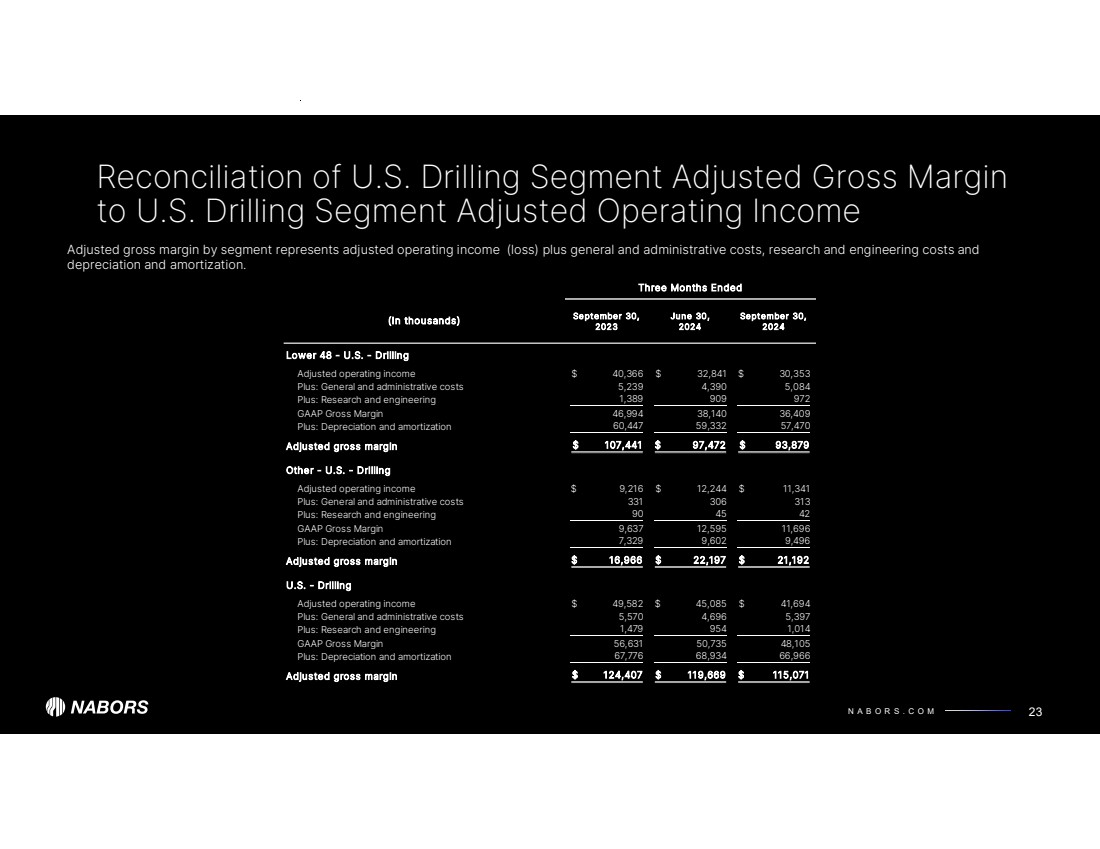
| N A B O R S . C O M Reconciliation of U.S. Drilling Segment Adjusted Gross Margin to U.S. Drilling Segment Adjusted Operating Income 23 Adjusted gross margin by segment represents adjusted operating income (loss) plus general and administrative costs, research and engineering costs and depreciation and amortization. September 30, June 30, September 30, 2023 2024 2024 Lower 48 - U.S. - Drilling Adjusted operating income 40,366 $ 32,841 $ 30,353 $ Plus: General and administrative costs 5,239 4,390 5,084 Plus: Research and engineering 1,389 909 972 GAAP Gross Margin 46,994 38,140 36,409 Plus: Depreciation and amortization 59,332 60,447 57,470 Adjusted gross margin $ 97,472 107,441 $ 93,879 $ Other - U.S. - Drilling Adjusted operating income 9,216 $ 12,244 $ 11,341 $ Plus: General and administrative costs 331 306 313 Plus: Research and engineering 90 45 42 GAAP Gross Margin 9,637 12,595 11,696 Plus: Depreciation and amortization 7,329 9,602 9,496 Adjusted gross margin $ 16,966 22,197 $ 21,192 $ U.S. - Drilling Adjusted operating income 49,582 $ 45,085 $ 41,694 $ Plus: General and administrative costs 5,570 4,696 5,397 Plus: Research and engineering 954 1,479 1,014 GAAP Gross Margin 56,631 50,735 48,105 Plus: Depreciation and amortization 67,776 68,934 66,966 Adjusted gross margin $ 124,407 119,669 $ 115,071 $ (In thousands) Three Months Ended |
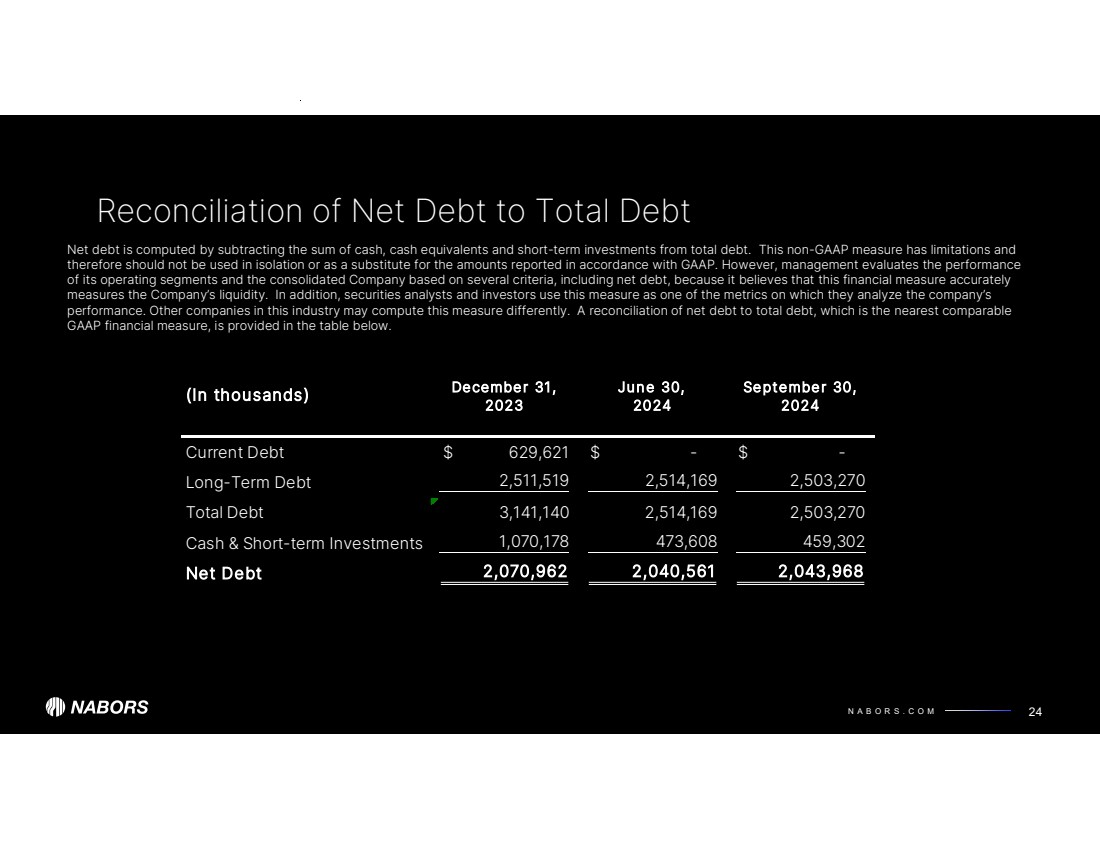
| N A B O R S . C O M Reconciliation of Net Debt to Total Debt 24 Net debt is computed by subtracting the sum of cash, cash equivalents and short-term investments from total debt. This non-GAAP measure has limitations and therefore should not be used in isolation or as a substitute for the amounts reported in accordance with GAAP. However, management evaluates the performance of its operating segments and the consolidated Company based on several criteria, including net debt, because it believes that this financial measure accurately measures the Company’s liquidity. In addition, securities analysts and investors use this measure as one of the metrics on which they analyze the company’s performance. Other companies in this industry may compute this measure differently. A reconciliation of net debt to total debt, which is the nearest comparable GAAP financial measure, is provided in the table below. December 31, June 30, September 30, 2023 2024 2024 Current Debt 629,621 $ - $ - $ Long-Term Debt 2,511,519 2,514,169 2,503,270 Total Debt 3,141,140 2,514,169 2,503,270 Cash & Short-term Investments 1,070,178 473,608 459,302 Net Debt 2,070,962 2,040,561 2,043,968 (In thousands) |
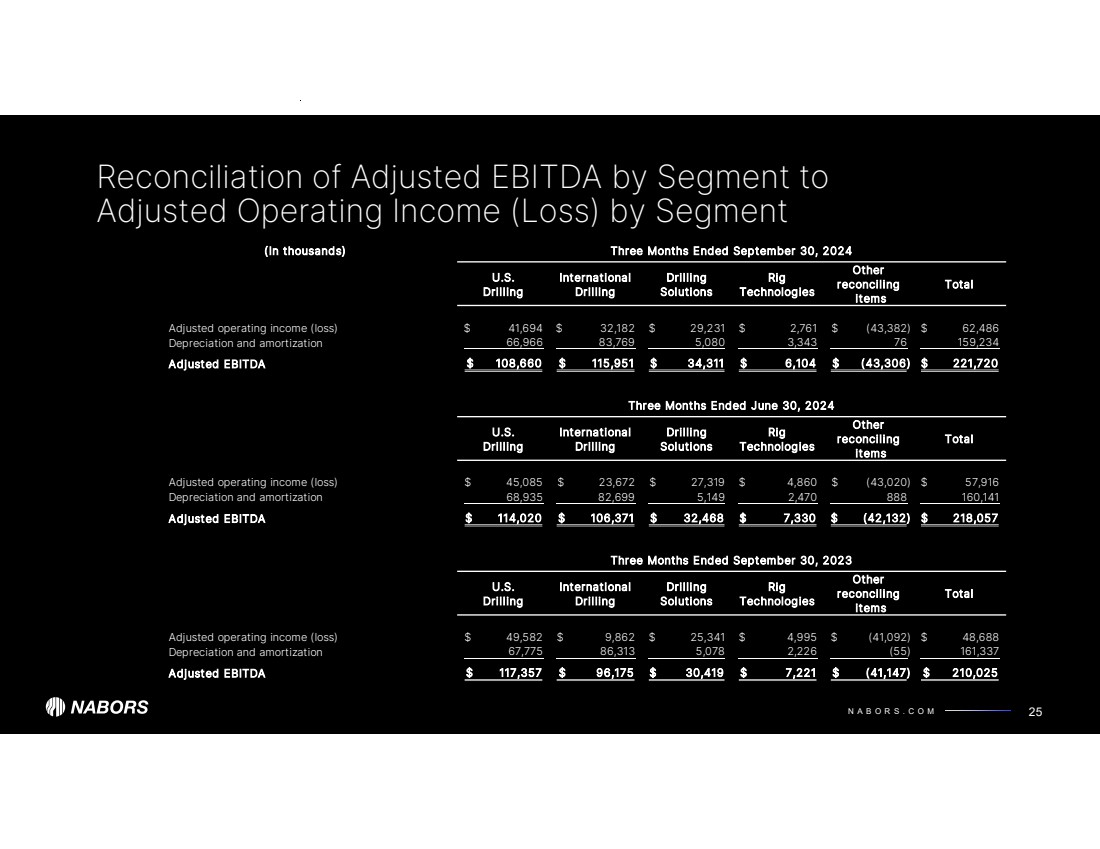
| N A B O R S . C O M Reconciliation of Adjusted EBITDA by Segment to Adjusted Operating Income (Loss) by Segment 25 Adjusted EBITDA by segment represents adjusted income (loss) plus depreciation and amortization. (In thousands) Three Months Ended September 30, 2024 U.S. Drilling International Drilling Drilling Solutions Rig Technologies Other reconciling items Total Adjusted operating income (loss) 41,694 $ 32,182 $ 29,231 $ 2,761 $ (43,382) $ 62,486 $ Depreciation and amortization 83,769 66,966 5,080 3,343 76 159,234 Adjusted EBITDA $ 115,951 108,660 $ 34,311 $ 6,104 $ (43,306) $ 221,720 $ Three Months Ended June 30, 2024 U.S. Drilling International Drilling Drilling Solutions Rig Technologies Other reconciling items Total Adjusted operating income (loss) 45,085 $ 23,672 $ 27,319 $ 4,860 $ (43,020) $ 57,916 $ Depreciation and amortization 82,699 68,935 5,149 2,470 888 160,141 Adjusted EBITDA $ 106,371 114,020 $ 32,468 $ 7,330 $ (42,132) $ 218,057 $ Three Months Ended September 30, 2023 U.S. Drilling International Drilling Drilling Solutions Rig Technologies Other reconciling items Total Adjusted operating income (loss) 49,582 $ 9,862 $ 25,341 $ 4,995 $ (41,092) $ 48,688 $ Depreciation and amortization 67,775 86,313 5,078 2,226 (55) 161,337 Adjusted EBITDA $ 96,175 117,357 $ 30,419 $ 7,221 $ (41,147) $ 210,025 $ |
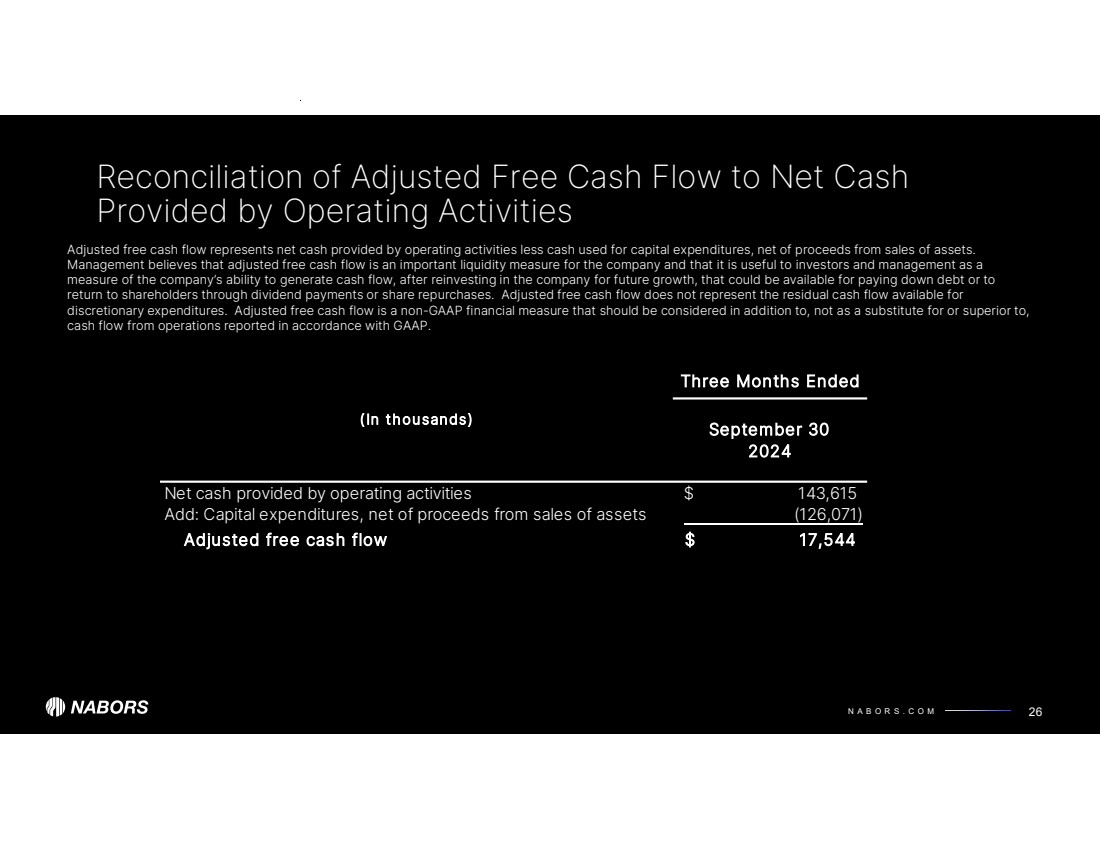
| N A B O R S . C O M Reconciliation of Adjusted Free Cash Flow to Net Cash Provided by Operating Activities 26 Adjusted free cash flow represents net cash provided by operating activities less cash used for capital expenditures, net of proceeds from sales of assets. Management believes that adjusted free cash flow is an important liquidity measure for the company and that it is useful to investors and management as a measure of the company’s ability to generate cash flow, after reinvesting in the company for future growth, that could be available for paying down debt or to return to shareholders through dividend payments or share repurchases. Adjusted free cash flow does not represent the residual cash flow available for discretionary expenditures. Adjusted free cash flow is a non-GAAP financial measure that should be considered in addition to, not as a substitute for or superior to, cash flow from operations reported in accordance with GAAP. Three Months Ended (In thousands) September 30 2024 Net cash provided by operating activities 143,615 $ Add: Capital expenditures, net of proceeds from sales of assets (126,071) Adjusted free cash flow 17,544 $ |
| N A B O R S . C O M No Offer or Solicitation This communication is not intended to and shall not constitute an offer to sell or the solicitation of an offer to sell or the solicitation of an offer to buy any securities or a solicitation of any vote of approval, nor shall there be any sale of securities in any jurisdiction in which such offer, solicitation or sale would be unlawful prior to registration or qualification under the securities laws of any such jurisdiction. No offering of securities shall be made except by means of a prospectus meeting the requirements of Section 10 of the Securities Act of 1933, as amended. Important Additional Information and Where to Find It This presentation does not constitute an offer to sell or the solicitation of an offer to buy any securities or a solicitation of a vote or proxy. In connection with the proposed transaction Nabors will file with the SEC a Registration Statement on Form S-4 to register the shares of Nabors capital stock to be issued in connection with the proposed transaction. The Registration Statement will include a joint proxy statement/prospectus of Nabors and Parker. The definitive joint proxy statement/prospectus will be sent to the shareholders of each of Nabors and Parker seeking their approval of the proposed transaction and other related matters. WE URGE INVESTORS AND SECURITY HOLDERS TO READ THE REGISTRATION STATEMENT ON FORM S-4 AND THE JOINT PROXY STATEMENT/PROSPECTUS INCLUDED WITHIN THE REGISTRATION STATEMENT ON FORM S-4 AND ANY OTHER RELEVANT DOCUMENTS WHEN THEY BECOME AVAILABLE, BECAUSE THEY WILL CONTAIN IMPORTANT INFORMATION ABOUT PARKER, NABORS AND THE PROPOSED TRANSACTION. Investors and security holders will be able to obtain these materials (when they are available) and other documents filed with the SEC by Nabors or Parker free of charge at the SEC's website, www.sec.gov, or from Nabors at its website, www.nabors.com, or from Parker at its website, www.parkerwellbore.com. Participants in the Solicitation Nabors and certain of its directors, executive officers and other employees, and Parker and certain of its directors, executive officers and other employees may be deemed to be participants in the solicitation of proxies for security holder approvals to be obtained for the proposed transaction. A description of participants' direct or indirect interests, by security holdings or otherwise, will be included in the joint proxy statement/prospectus. Disclaimer NABORS INDUSTRIES 27 |
| NABORS INDUSTRIES LTD. NABORS.COM NABORS CORPORATE SERVICES 515 W. Greens Road Suite 1200 Houston, TX 77067-4525 @ n a b o r s g l o b a l Contact Us: William C. Conroy, CFA VP - Corporate Development and Investor Relations William.Conroy@nabors.com Kara K. Peak Director - Corporate Development and Investor Relations Kara.Peak@nabors.com |