WASHINGTON, D.C. 20549
FOR THE FISCAL YEAR ENDED JUNE 30, 2011.
LSI INDUSTRIES INC.
Indicate by check mark if the registrant is a well-known seasoned issuer, as defined in Rule 405 of the Securities Act.
Indicate by check mark whether the registrant has submitted electronically and posted on its corporate Web site, if any, every Interactive Data File required to be submitted and posted pursuant to Rule 405 of Regulation S-T during the preceding 12 months (or for such shorter period that the registrant was required to submit and post such files).
Indicate by check mark whether the registrant is a large accelerated filer, an accelerated filer, a non-accelerated filer, or a smaller reporting company. See the definitions of “large accelerated filer,” “accelerated filer,” and “smaller reporting company” in Rule 12b-2 of the Exchange Act.
As of December 31, 2010, the aggregate market value of the registrant’s common stock held by non-affiliates of the registrant was approximately $171,965,000 based upon a closing sale price of $8.46 per share as reported on The NASDAQ Global Select Market.
At August 18, 2011 there were 24,048,248 no par value Common Shares issued and outstanding.
Portions of the Registrant’s Proxy Statement filed with the Commission for its 2011 Annual Meeting of Shareholders are incorporated by reference in Part III, as specified.
“Safe Harbor” Statement under the Private Securities Litigation Reform Act of 1995
This Form 10-K contains certain forward-looking statements that are subject to numerous assumptions, risks or uncertainties. The Private Securities Litigation Reform Act of 1995 provides a safe harbor for forward-looking statements. Forward-looking statements may be identified by words such as “estimates,” “anticipates,” “projects,” “plans,” “expects,” “intends,” “believes,” “seeks,” “may,” “will,” “should” or the negative versions of those words and similar expressions, and by the context in which they are used. Such statements, whether expressed or implied, are based upon current expectations of the Company and speak only as of the date made. Actual results could differ materially from those contained in or implied by such forward-looking statements as a result of a variety of risks and uncertainties over which the Company may have no control. These risks and uncertainties include, but are not limited to, the impact of competitive products and services, product demand and market acceptance risks, potential costs associated with litigation and regulatory compliance, reliance on key customers, financial difficulties experienced by customers, the cyclical and seasonal nature of our business, the adequacy of reserves and allowances for doubtful accounts, fluctuations in operating results or costs whether as a result of uncertainties inherent in tax and accounting matters or otherwise, unexpected difficulties in integrating acquired businesses, the ability to retain key employees of acquired businesses, unfavorable economic and market conditions, the results of asset impairment assessments and the other risk factors that are identified herein. You are cautioned to not place undue reliance on these forward-looking statements. In addition to the factors described in this paragraph, the risk factors identified in our Form 10-K and other filings the Company may make with the SEC constitute risks and uncertainties that may affect the financial performance of the Company and are incorporated herein by reference. The Company does not undertake and hereby disclaims any duty to update any forward-looking statements to reflect subsequent events or circumstances.
We are a leading provider of comprehensive corporate visual image solutions through the combination of extensive screen and digital graphics capabilities, a wide variety of high quality indoor and outdoor lighting products, and related professional services. We also provide graphics and lighting products and professional services on a stand-alone basis. Our company is the leading provider of corporate visual image solutions to the petroleum/convenience store industry. We use this leadership position to penetrate national retailers and multi-site retailers, including quick service and casual restaurants, eyewear chains, retail chain stores and automobile dealerships located primarily in the United States. In addition, we are a leading provider of digital solid-state LED (light emitting diode) video screens and LED specialty lighting to such markets or industries as sports stadiums and arenas, digital billboards, and entertainment. We design and develop all aspects of the solid-state LED video screens and lighting, from the electronic circuit board, to the software to drive and control the LEDs, to the structure of the LED product.
Our focus on product development and innovation creates products that are essential components of our customers’ corporate visual image strategy. We develop and manufacture lighting, graphics and solid-state LED video screen and lighting products and distribute them through an extensive multi-channel distribution network that allows us to effectively service our target markets. Representative customers include BP, Chevron Texaco, 7-Eleven, ExxonMobil, Shell, Burger King, Dairy Queen, Taco Bell, Wendy’s, Best Buy, CVS Caremark, JC Penney, Target Stores, Wal-Mart Stores, Inc., Chrysler, Ford, General Motors, Nissan, and Toyota. We service our customers at the corporate, franchise and local levels.
We believe that national retailers and niche market companies are increasingly seeking single-source suppliers with the project management skills and service expertise necessary to execute a comprehensive visual image program. The integration of our graphics, lighting, technology and professional services capabilities allows our customers to outsource to us the development of an entire visual image program from the planning and design stage through installation. Our approach is to combine standard, high-production lighting products, custom graphics applications and professional services to create complete customer-focused visual image solutions. We also offer products and services on a stand-alone basis to service our existing image solutions customers, to establish a presence in a new market or to create a relationship with a new customer. We believe that our ability to combine graphics and lighting products and professional services into a comprehensive visual image solution differentiates us from our competitors who offer only stand-alone products for lighting or graphics and who lack professional services offerings. During the past several years, we have continued to enhance our ability to provide comprehensive corporate visual image solutions by adding additional graphics capabilities, lighting products, LED video screens, LED lighting products and professional services through acquisitions and internal development.
Our business is organized as follows: the Lighting Segment, which represented 67% of our fiscal 2011 net sales; the Graphics Segment, which represented 23% of our fiscal 2011 net sales; the Electronic Components Segment, which represented 7% of our fiscal 2011 net sales; and an All Other Category, which represented 3% of our fiscal 2011 net sales. Our most significant market, which includes sales of both the Lighting Segment and the Graphics Segment, is the petroleum / convenience store market with approximately 37%, 35%, and 23% of total net sales concentrated in this market in the fiscal years ended June 30, 2011, 2010, and 2009, respectively. See Note 2 of Notes to Consolidated Financial Statements beginning on page F-27 of this Form 10-K for additional information on business segments. Net sales by segment are as follows (in thousands):
Our Lighting Segment manufactures and markets outdoor and indoor lighting for the commercial, industrial and multi-site retail markets, including the petroleum / convenience store market. Our products are designed and manufactured to provide maximum value and meet the high-quality, competitively-priced product requirements of our niche markets. We generally avoid specialty or custom-designed, low-volume products for single order opportunities. We do, however, design proprietary products used by our national account customers in large volume, and occasionally also provide custom products for large, specified projects. Our concentration is on our high-volume, standard product lines that meet our customers’ needs. By focusing our product offerings, we achieve significant manufacturing and cost efficiencies.
Our lighting fixtures, poles and brackets are produced in a variety of designs, styles and finishes. Important functional variations include types of mounting, such as pole, bracket and surface, and the nature of the light requirement, such as down-lighting, wall-wash lighting, canopy lighting, flood-lighting, area lighting and security lighting. Our engineering staff performs photometric analyses, wind load safety studies for all light fixtures and also designs our fixtures and lighting systems. Our lighting products utilize a wide variety of different light sources, including solid-state LED, high-intensity discharge metal-halide, and fluorescent. The major products and services offered within our lighting segment include: exterior area lighting, interior lighting, canopy lighting, landscape lighting, LED lighting, light poles, lighting analysis and photometric layouts. All of our products are designed for performance, reliability, ease of installation and service, as well as attractive appearance. The Company also has a focus on designing lighting system solutions and implementing strategies related to energy savings in substantially all markets served.
We offer our customers expertise in developing and utilizing high-performance LED color and white lightsource solutions for our Lighting, Graphics and Technology applications, which, when combined with the Company’s lighting fixture expertise and technology has the potential to result in a broad spectrum of white light LED fixtures that offer equivalent or improved lighting performance with significant energy and maintenance savings as compared to the present metal halide and fluorescent lighting fixtures.
Lighting Segment fiscal 2011 net sales of $196,550,000 increased $37.4 million or 23.5% over fiscal 2010 net sales. The $37.4 million increase in Lighting Segment net sales was primarily the result of a $19.8 million or 24.7% increase in lighting sales to our niche markets of petroleum / convenience stores, automotive dealerships, and retail national accounts, and a $17.5 million or 22.2% net increase in commissioned net sales to the commercial and industrial lighting market. Fiscal 2011 Lighting Segment net sales to the petroleum / convenience store market of $61,066,000 increased $9.6 million or 19% from fiscal 2010, and represented 31% of total Lighting Segment net sales as compared to 32% in the prior year. White light solid-state LED light fixtures represent a growth area for the Company, with fiscal 2011 Lighting Segment LED net sales of approximately $60,042,000 (approximately 31% of total Lighting Segment net sales), up 59% from the prior year. The Lighting Segment replaced 7-Eleven, Inc.’s traditional lighting with solid-state LED lighting, with fiscal 2011 net sales of $10,243,000 and fiscal 2010 net sales of $21,391,000.
Lighting Segment fiscal 2010 net sales of $159,105,000 decreased $1.4 million or 0.9% from fiscal 2009 net sales. The $1.4 million or 0.9% decrease in Lighting Segment net sales in fiscal 2010 is primarily the net result of an $18.4 million or 18.9% decrease in commissioned net sales to the commercial and industrial lighting market, partially offset by a $17.0 million or 27.0% increase in lighting sales to our niche markets of petroleum / convenience stores, automotive dealerships, and retail national accounts (7-Eleven, Inc. represented an increase of approximately $19.5 million as it replaced traditional lighting with solid-state LED lighting). Fiscal 2010 Lighting Segment net sales to the petroleum / convenience store market were approximately $51,462,000, representing 32% of total Lighting Segment net sales. White light solid-state LED light fixtures represent a growth area for the Company, with fiscal 2010 Lighting Segment LED sales of approximately $37,800,000 (approximately 24% of total Lighting Segment net sales), up 496% from the prior year.
The Graphics Segment manufactures and sells exterior and interior visual image elements related to graphics. These products are used in graphics displays and visual image programs in several markets, including the petroleum/convenience store market and multi-site retail operations. Our extensive lighting and graphics expertise, product offering, visual image solution implementation capabilities and other professional services represent significant competitive advantages. We work with corporations and design firms to establish and implement cost effective corporate visual image programs. Increasingly, we have become the primary supplier of exterior and interior graphics for our customers. We also offer installation or installation management services for those customers who require the installation of interior or exterior products (utilizing pre-qualified independent subcontractors throughout the United States).
Our business can be significantly impacted by participation in a customer’s “image conversion program,” especially if it were to involve a “roll out” of that new image to a significant number of that customer’s and its franchisees’ retail sites. The impact to our business can be very positive with growth in net sales and profitability when we are engaged in an image conversion program. This can be followed in subsequent periods by lesser amounts of business or negative comparisons following completion of an image conversion program, unless we are successful in replacing that completed business with participation in a new image conversion program of similar size with one or more customers. An image conversion program can potentially involve any or all of the following improvements, changes or refurbishments at a customer’s retail site: interior or exterior lighting (see discussion above about our lighting segment), interior or exterior store signage and graphics, and installation of these products in both the prototype and roll out phases of their program. We believe our retail customers are implementing image conversions on a more frequent basis than in the past in order to maintain a safe, fresh look or new image on their site in order to continue to attract customers to their site, and maintain or grow their market share. However, this trend slowed down during the recent recessionary period.
The major products and services offered within our Graphics Segment include the following: signage and canopy graphics, pump dispenser graphics, building fascia graphics, decals, interior signage and marketing graphics, aisle markers, wall mural graphics, fleet graphics, prototype program graphics, installation services for graphics products and solid state LED video screens for the sports and advertising markets.
Graphics Segment fiscal 2011 net sales of $68,155,000 decreased $0.2 million or 0.4% from fiscal 2010 net sales. The $0.2 million decrease in Graphics Segment net sales in fiscal 2011 is primarily the result of image conversion programs and sales to several petroleum / convenience store customers ($8.7 million net increase), and a fast food restaurant chain ($1.1 million increase). These increases were offset by decreases to a national drug store retailer ($3.2 million decrease), two grocery retailers ($2.5 million decrease), the LED video sports screen market ($5.0 million decrease), and changes in volume or completion of several other graphics programs. Fiscal 2011 Graphics Segment net sales to the petroleum / convenience store market of $47,394,000 increased $8.9 million or 23% from fiscal 2010, and represented 70% of total Graphics net sales as compared to 56% in the prior year. The Graphics Segment replaced 7-Eleven, Inc.’s traditional signage lighting with solid-state LED lighting, with fiscal 2011 net sales of $29,709,000 and fiscal 2010 net sales of $20,606,000. Graphics Segment net sales related to LED products totaled approximately $4,938,000 in fiscal 2011 as compared to $20,275,000 in fiscal 2010 (approximately 7% and 30% of total Graphics Segment net sales in fiscal 2011 and 2010, respectively).
Graphics Segment fiscal 2010 net sales of $68,395,000 increased $7.6 million or 12.6% over fiscal 2009 net sales. The $7.6 million or 12.6% increase in Graphics Segment net sales in fiscal 2010 is primarily the result of image conversion programs and sales to several petroleum / convenience store customers ($16.1 million net increase), and the LED video sports screen market ($0.2 million increase). These increases were partially offset by the following decreases: a grocery retailer ($5.1 million decrease); five retail customers ($1.2 million net decrease); a national drug store retailer ($0.7 million decrease); a lawn care company ($0.4 million decrease); and changes in volume or completion of several other graphics programs. Fiscal 2010 Graphics Segment net sales to the petroleum / convenience store market were approximately $38,490,000, representing 56% of total Graphics net sales. Graphics Segment net sales related to LED products and installation totaled approximately $20,275,000 (approximately 30% of total Graphics Segment net sales).
The Electronic Components Segment includes the results of LSI ADL Technology. This subsidiary operates in Columbus, Ohio and designs, engineers and manufactures custom designed electronic circuit boards, assemblies and sub-assemblies used in various applications including the control of solid-state LED lighting. The Company acquired AdL Technology in fiscal 2010 as a vertical integration of circuit boards for LED lighting as well as the Company’s other LED product lines such as digital scoreboards, advertising ribbons and billboards. LSI ADL Technology allows the Company to stay on the leading edge of product development, while at the same time providing opportunities to drive down manufacturing costs and control delivery of key components.
Customer net sales of the Electronic Components Segment were $21,449,000 in fiscal 2011, up $5.3 million or 33% over fiscal 2010 net sales of $16,116,000. In addition to these customer sales, the Electronic Components Segment supplied a significant amount of electronic circuit boards to both the Lighting and Graphics Segments, with growth of approximately 374% in these intersegment net sales in fiscal 2011.
The All Other Category includes the results of all LSI operations that are not able to be aggregated into one of the three reportable business segments. Operating results of LSI Saco Technologies, LSI Images, LSI Adapt and LSI Marcole are included in the All Other Category. The major products and services offered by operations included in the All Other Category include: design, production, and support of high-performance light engines and large format video screens using LED technology; exterior and interior menu board systems primarily for the quick service restaurant market; and surveying, permitting and installation management services related to products of the Graphics Segment; and for fiscal 2010 and 2009, electrical wire harnesses (for LSI’s light fixtures and for the white goods or appliance industry). LSI Saco Technologies offers its customers expertise in developing and utilizing high-performance LED color and white lightsource solutions for both lighting and graphics applications. This technology generated development in the Company’s Lighting Segment of a broad spectrum of white light LED fixtures that offer equivalent or improved lighting performance with significant energy and maintenance savings as compared to the traditional metal halide and fluorescent lighting fixtures. Additionally, this LED technology is used in the Company’s Graphics Segment to light, accent and provide color lighting to graphics display and visual image programs of the Company’s retail, quick service restaurant and sports market customers.
All Other Category fiscal 2011 net sales of $7,347,000 decreased $3.4 million or 31.9% from fiscal 2010 primarily as the net result of increased net sales of menu board systems ($0.2 million), decreased sales of LED video screens to the entertainment and other markets ($3.0 million), no sales of electrical wire harnesses ($2.9 million) and changes in volume or completion of other customer programs. The Company sold its wire harness operation and business at the end of the third quarter of fiscal 2010 and thereafter had no further sales of wire harnesses. Fiscal 2010 net sales of $10,786,000 decreased $1.8 million or 14.1% from fiscal 2009 primarily as the net result of decreased net sales to two quick service restaurant menu board customers ($0.8 million), decreased net sales of LED video screens to the entertainment market ($0.3 million), decreased net sales of specialty LED lighting ($0.1 million), decreased net sales of electrical wire harnesses ($1.0 million) and changes in volume or completion of other customer programs.
There were no impairments of goodwill or intangible assets in fiscal 2011.
In fiscal 2010, we recorded a $153,000 non-cash intangible asset impairment charge. Due to declining use of a trade name and a reduced outlook of future net sales, we determined that a trade name with a $137,000 carrying value in the All Other Category was fully impaired. Additionally, the Lighting Segment no longer sells a certain product that supported a $16,000 patent intangible asset, therefore it was fully impaired. Goodwill was not impaired in fiscal 2010.
In fiscal 2009, we recorded a $14,467,000 non-cash goodwill impairment charge. Charges totaling $11,185,000 were recorded in the Lighting Segment, charges totaling $716,000 were recorded in the Graphics Segment, and charges totaling $2,566,000 were recorded in the All Other Category. Impairment tests conducted in three of the four fiscal quarters indicated there were full or partial impairments of goodwill in one of our reporting units in our Lighting Segment, one reporting unit in the Graphics Segment and one reporting unit in our All Other Category due to the combination of a decline in the market capitalization of the Company at certain quarter-end balance sheet dates and a decline in the estimated forecasted discounted cash flows which management attributes to a weaker economic cycle impacting certain of our customers, notably national retailers.
Our lighting products are sold primarily throughout the United States, but also in Canada, Australia, Latin America, Europe and the Middle East (about 5% of total net sales are outside the United States) using a combination of regional sales managers, independent sales representatives and distributors. Although in some cases we sell directly to national firms, more frequently we are designated as a preferred vendor for product sales to customer-owned as well as franchised, licensed and dealer operations. Our graphics products, which are program-driven, LED video screens, electronic components, and other products and services sold by operations in the All Other Category are sold primarily through our own sales force. Our marketing approach and means of distribution vary by product line and by type of market.
Sales are developed by contacts with national retail marketers, branded product companies, franchise and dealer operations. In addition, sales are also achieved through recommendations from local architects, engineers, petroleum and electrical distributors and contractors. Our sales are partially seasonal as installation of outdoor lighting and graphic systems in the northern states decreases during the winter months.
Our image center and i-Zone center capabilities are important parts of our sales process. The image center, unique within the lighting and graphics industry, is a facility that can produce a computer-generated virtual prototype of a customer’s facility on a large screen through the combination of high technology software and audio/visual presentation. The i-Zone center is a digitally controlled facility containing a large solid-state LED video screen and several displays that showcase our LED technology and LED products. With these capabilities, our customers can instantly explore a wide variety of lighting and graphics alternatives to develop consistent day and nighttime images. These centers give our customers more options, greater control, and more effective time utilization in the development of lighting, graphics and visual image solutions, all with much less expense than traditional prototyping. In addition to being cost and time effective for our customers, we believe that our image center and i-Zone center capabilities result in the best solution for our customers’ needs.
The image and i-Zone centers also contain comprehensive indoor and outdoor product display areas that allow our customers to see many of our products and services in one setting. This aids our customers in making quick and effective lighting and graphic design decisions through hands-on product demonstrations and side-by-side comparisons. More importantly, these capabilities allow us to expand our customer’s interest from just a single product into other products and solutions. We believe that our image center and i-Zone center capabilities have further enhanced our position as a highly qualified outsourcing partner capable of guiding a customer through image alternatives utilizing our lighting and graphics products and services. We believe this capability distinguishes us from our competitors and will become increasingly beneficial in attracting additional customers.
We design, engineer and manufacture substantially all of our lighting and graphics products through a vertically integrated business model. By emphasizing high-volume production of standard product lines, we achieve significant manufacturing efficiencies. When appropriate, we utilize alliances with vendors to outsource certain products and assemblies. LED products and related software are engineered, designed and final-assembled by the Company, while a portion of the manufacturing has been performed by select qualified vendors. We are not dependent on any one supplier for any of our component parts.
The principal raw materials and purchased components used in the manufacturing of our products are steel, aluminum, wire harnesses, sockets, lamps, certain fixture housings, acrylic and glass lenses, lighting ballasts, inks, various graphics substrates such as decal material and vinyls, LEDs and electrical components. We source these materials and components from a variety of suppliers. Although an interruption of these supplies and components could disrupt our operations, we believe generally that alternative sources of supply exist and could be readily arranged. We strive to reduce price volatility in our purchases of raw materials and components through quarterly or annual contracts with certain of our suppliers. Our lighting operations generally carry relatively small amounts of finished goods inventory, except for certain products that are stocked to meet quick delivery requirements. Most often, lighting products are made to order and shipped shortly after they are manufactured. Our graphics operations manufacture custom graphics products for customers who frequently require us to stock certain amounts of finished goods in exchange for their commitment to that inventory. In some Graphics programs, customers also give us a cash advance for the inventory that we stock for them. The Company’s operations dealing with LED products generally carry LED and LED component inventory due to longer lead times, or worldwide shortages of electronic components. LED products are generally made to order and shipped shortly after assembly is complete. Customers purchasing LED video screens routinely give us cash advances for large projects prior to shipment. Our electronic components operation purchases electronic components from multiple suppliers and manufactures custom electronic circuit boards. Due to the worldwide shortage of electronic component parts, the Company has increased its amount of component parts carried in inventory. Most products are made to order and, as a result, this operation does not carry very much finished goods.
We believe we are a low-cost producer for our types of products, and as such, are in a position to promote our product lines with substantial marketing and sales activities.
We currently operate out of eleven manufacturing facilities and two sales facilities in seven U.S. states and Canada. During fiscal 2011, we consolidated our smallest Lighting manufacturing facility into our largest facility.
Our manufacturing operations are subject to various federal, state and local regulatory requirements relating to environmental protection and occupational health and safety. We do not expect to incur material capital expenditures with regard to these matters and believe our facilities are in compliance with such regulations.
We experience strong competition in all segments of our business, and in all markets served by our product lines. Although we have many competitors, some of which have greater financial and other resources, we do not compete with the same companies across our entire product and service offerings. We believe product quality and performance, price, customer service, prompt delivery, and reputation to be important competitive factors. We also have several product and process patents which have been obtained in the normal course of business which provide a competitive advantage in the marketplace.
Our sales are partially seasonal as installation of outdoor lighting and graphic systems in the northern states lessens during the harshest winter months. We had a backlog of orders, which we believe to be firm, of $28.7 million and $60.5 million at June 30, 2011 and 2010, respectively. All orders are believed to be shippable or installed within twelve months. The decrease as of June 30, 2011 relates primarily to the completion of a $38 million program with 7-Eleven, Inc. to install retrofit solid-state LED lighting at over 3,000 of its sites in North America.
We have approximately 1,200 full-time and 282 temporary employees as of June 30, 2011. We offer a comprehensive compensation and benefit program to most employees, including competitive wages, a discretionary bonus plan, a profit-sharing plan and retirement plan, and a 401(k) savings plan (for U.S. employees), a non-qualified deferred compensation plan (for certain employees), an equity compensation plan, and medical and dental insurance.
LSI Industries Inc. is an Ohio corporation, incorporated in 1976.
In addition to the other information set forth in this report, you should carefully consider the following factors which could materially affect our business, financial condition, cash flows or future results. Any one of these factors could cause the Company’s actual results to vary materially from recent results or from anticipated future results. The risks described below are not the only risks facing our Company. Additional risks and uncertainties not currently known to us or that we currently deem to be immaterial also may materially adversely affect our business, financial condition and/or operating results.
The markets in which we operate are subject to competitive pressures that could affect selling prices, and therefore could adversely affect our operating results.
Our businesses operate in markets that are highly competitive, and we compete on the basis of price, quality, service and/or brand name across the industries and markets served. Some of our competitors for certain products, primarily in the Lighting Segment, have greater sales, assets and financial resources than we have. Some of our competitors are based in foreign countries and have cost structures and prices in foreign currencies. Accordingly, currency fluctuations could cause our U.S. dollar-priced products to be less competitive than our competitors’ products which are priced in other currencies. Competitive pressures could affect prices we charge our customers or demand for our products, which could adversely affect our operating results. Additionally, customers for our products are attempting to reduce the number of vendors from which they purchase in order to reduce the size and diversity of their inventories and their transaction costs. To remain competitive, we will need to invest continuously in manufacturing, marketing, customer service and support, and our distribution networks. We may not have sufficient resources to continue to make such investments and we may be unable to maintain our competitive position.
Lower levels of economic activity in our end markets could adversely affect our operating results.
Our businesses operate in several market segments including commercial, industrial, retail, petroleum / convenience store and entertainment. Operating results can be negatively impacted by volatility in these markets. Future downturns in any of the markets we serve could adversely affect our overall sales and profitability.
Our operating results may be adversely affected by unfavorable economic, political and market conditions.
Economic and political conditions worldwide have from time to time contributed to slowdowns in our industry at large, as well as to the specific segments and markets in which we operate. When combined with ongoing customer consolidation activity and periodic manufacturing and inventory initiatives, the current uncertain macro-economic and political climate, including but not limited to the effects of weakness in domestic and foreign financial and credit markets, could lead to reduced demand from our customers and increased price competition for our products, increased risk of excess and obsolete inventories and uncollectible receivables, and higher overhead costs as a percentage of revenue. If the markets in which we participate experience further economic downturns, as well as a slow recovery period, this could negatively impact our sales and revenue generation, margins and operating expenses, and consequently have a material adverse effect on our business, financial condition and results of operations.
Price increases or significant shortages of raw materials and components could adversely affect our operating margin.
The Company purchases large quantities of raw materials and components — mainly steel, aluminum, light bulbs and fluorescent tubes, lighting ballasts, sockets, wire harnesses, plastic, lenses, glass lenses, vinyls, inks, LEDs, electronic components and corrugated cartons. Materials comprise the largest component of costs, representing approximately 62% of the cost of sales in both 2011 and 2010. While we have multiple sources of supply for each of our major requirements, significant shortages could disrupt the supply of raw materials. Further increases in the price of these raw materials and components could further increase the Company’s operating costs and materially adversely affect margins. Although the Company attempts to pass along increased costs in the form of price increases to customers, the Company may be unsuccessful in doing so for competitive reasons. Even when price increases are successful, the timing of such price increases may lag significantly behind the incurrence of higher costs. As of August 2011, there are selected electronic component parts and certain other parts shortages in the market place, some of which have affected the Company’s manufacturing operations and shipment schedules even though multiple suppliers may be available. The lead times from electronic component suppliers have significantly increased for some component parts and prices of some of these electronic component parts have increased during this period of shortages. Fluorescent tubes and other light bulbs contain rare earth minerals, which have become more expensive and in short supply throughout the world, thereby affecting the Company’s supply and cost of these light sources.
We have a concentration of net sales to the petroleum / convenience store market, and any substantial change in this market could have an adverse affect on our business.
Approximately 37% of our net sales in fiscal year 2011 are concentrated in the petroleum / convenience store market. Sales to this market segment are dependent upon the general conditions prevailing in and the profitability of the petroleum and convenience store industries and general market conditions. Our petroleum market business is subject to reactions by the petroleum industry to world political events, particularly those in the Middle East, and to the price and supply of oil. Major disruptions in the petroleum industry generally result in a curtailment of retail marketing efforts, including expansion and refurbishing of retail outlets, by the petroleum industry and adversely affect our business. Any substantial change in purchasing decisions by one or more of our largest customers, whether due to actions by our competitors, customer financial constraints, industry factors or otherwise, could have an adverse effect on our business.
Difficulties with integrating acquisitions could adversely affect operating costs and expected benefits from those acquisitions.
We have pursued and may continue to seek potential acquisitions to complement and expand our existing businesses, increase our revenues and profitability, and expand our markets. We cannot be certain that we will be able to identify, acquire or profitably manage additional companies or successfully integrate such additional companies without substantial costs, delays or other problems. Also, companies acquired recently and in the future may not achieve revenues, profitability or cash flows that justify our investment in them. We expect to spend significant time and effort in expanding our existing businesses and identifying, completing and integrating acquisitions. We expect to face competition for acquisition candidates which may limit the number of acquisition opportunities available to us, possibly leading to a decrease in the rate of growth of our revenues and profitability, and may result in higher acquisition prices. The success of these acquisitions we do make will depend on our ability to integrate these businesses into our operations. We may encounter difficulties in integrating acquisitions into our operations, retaining key employees of acquired companies and in managing strategic investments. Therefore, we may not realize the degree or timing of the benefits anticipated when we first enter into a transaction.
If acquisitions are made in the future and goodwill and intangible assets are recorded on the balance sheet, circumstances could arise in which the goodwill and intangible assets could become impaired and therefore would be written off.
We have pursued and will continue to seek potential acquisitions to complement and expand our existing businesses, increase our revenues and profitability, and expand our markets through acquisitions. As a result of acquisitions, we have significant goodwill and intangible assets recorded on our balance sheet. We will continue to evaluate the recoverability of the carrying amount of our goodwill and intangible assets on an ongoing basis, and we may incur substantial non-cash impairment charges, which would adversely affect our financial results. There can be no assurance that the outcome of such reviews in the future will not result in substantial impairment charges. Impairment assessment inherently involves judgment as to assumptions about expected future cash flows and the impact of market conditions on those assumptions. Future events and changing market conditions may impact our assumptions as to prices, costs, holding periods or other factors that may result in changes in our estimates of future cash flows. Although we believe the assumptions we used in testing for impairment are reasonable, significant changes in any one of our assumptions could produce a significantly different result. If there were to be a decline in our market capitalization and a decline in estimated forecasted discounted cash flows, there could be an impairment of the goodwill and intangible assets. A non-cash impairment charge could be material to the earnings of the reporting period in which it is recorded.
If customers do not accept new products, we could experience a loss of competitive position which could adversely affect future revenues.
The Company is committed to product innovation on a timely basis to meet customer demands. Development of new products for targeted markets requires the Company to develop or otherwise leverage leading technologies in a cost-effective and timely manner. Failure to meet these changing demands could result in a loss of competitive position and seriously impact future revenues. Products or technologies developed by others may render the Company’s products or technologies obsolete or noncompetitive. A fundamental shift in technologies in key product markets could have a material adverse effect on the Company’s operating results and competitive position within the industry. More specifically, the development of new or enhanced products is a complex and uncertain process requiring the anticipation of technological and market trends. We may experience design, manufacturing, marketing or other difficulties, such as an inability to attract a sufficient number of experienced engineers, that could delay or prevent our development, introduction or marketing of new products or enhancements and result in unexpected expenses. Such difficulties could cause us to lose business from our customers and could adversely affect our competitive position. In addition, added expenses could decrease the profitability associated with those products that do not gain market acceptance.
Our business is cyclical and seasonal, and in downward economic cycles our operating profits and cash flows could be adversely affected.
Historically, sales of our products have been subject to cyclical variations caused by changes in general economic conditions. Our revenues in our third quarter ending March 31 are also affected by the impact of weather on construction and installation programs and the annual budget cycles of major customers. The demand for our products reflects the capital investment decisions of our customers, which depend upon the general economic conditions of the markets that our customers serve, including, particularly, the petroleum and convenience store industries. During periods of expansion in construction and industrial activity, we generally have benefited from increased demand for our products. Conversely, downward economic cycles in these industries result in reductions in sales and pricing of our products, which may reduce our profits and cash flow. During economic downturns, customers also tend to delay purchases of new products. The cyclical and seasonal nature of our business could at times adversely affect our liquidity and financial results.
A loss of key personnel or inability to attract qualified personnel could have an adverse affect on our operating results.
The Company’s future success depends on the ability to attract and retain highly skilled technical, managerial, marketing and finance personnel, and, to a significant extent, upon the efforts and abilities of senior management. The Company’s management philosophy of cost-control results in a very lean workforce. Future success of the Company will depend on, among other factors, the ability to attract and retain other qualified personnel, particularly management, research and development engineers and technical sales professionals. The loss of the services of any key employees or the failure to attract or retain other qualified personnel could have a material adverse effect on the Company’s results of operations.
The costs of litigation and compliance with environmental regulations, if significantly increased, could have an adverse affect on our operating profits.
We are, and may in the future be, a party to any number of legal proceedings and claims, including those involving patent litigation, product liability, employment matters, and environmental matters, which could be significant. Given the inherent uncertainty of litigation, we can offer no assurance that existing litigation or a future adverse development will not have a material adverse impact. We are also subject to various laws and regulations relating to environmental protection and the discharge of materials into the environment, and it could potentially be possible we could incur substantial costs as a result of the noncompliance with or liability for clean up or other costs or damages under environmental laws.
None.
The Company considers these facilities (total of 1,358,000 square feet) adequate for its current level of operations.
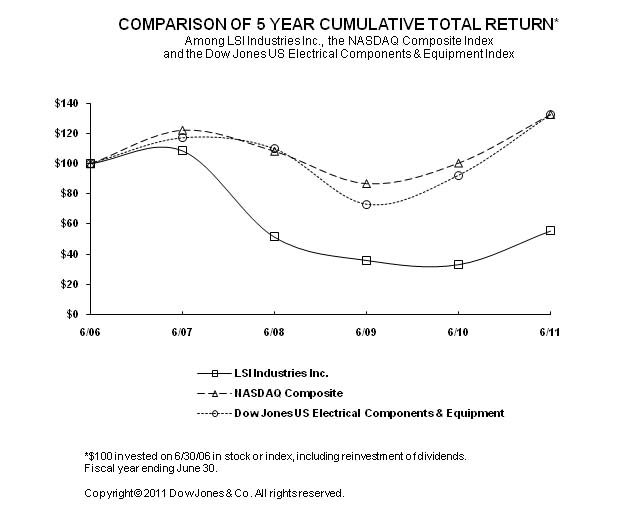
The following graph compares the cumulative total shareholder return on the Company’s common shares during the five fiscal years ended June 30, 2011 with a cumulative total return on the NASDAQ Stock Market Index (U.S. companies) and the Dow Jones Electrical Equipment Index. The comparison assumes $100 was invested June 30, 2006 in the Company’s Common Shares and in each of the indexes presented; it also assumes reinvestment of dividends.
The stock price performance included in this graph is not necessarily indicative of future stock price performance.
“Selected Financial Data” begins on page F-43 of this Form 10-K.
“Management’s Discussion and Analysis of Financial Condition and Results of Operations” appears on pages F-1 through F-14 of this Form 10-K.
The Company is exposed to market risk from changes in variable interest rates, changes in prices of raw materials and component parts, and changes in foreign currency translation rates. Each of these risks is discussed below.
The Company earns interest income on its cash, cash equivalents, and short-term investments (if any) and pays interest expense on its debt. Because of variable interest rates, the Company is exposed to the risk of interest rate fluctuations, which impact interest income, interest expense, and cash flows. With the current balance in the Company’s short-term cash investments and absence of any outstanding variable rate debt, the adverse exposure to interest rate fluctuations has decreased considerably. The Company’s outstanding mortgage debt is at a fixed rate of interest.
All of the Company’s $35,000,000 available lines of credit are subject to interest rate fluctuations, should the Company borrow on these lines of credit. Additionally, the Company expects to generate cash from its operations that will subsequently be used to pay down as much of the debt (if any is outstanding) as possible or invest cash in short-term investments (if no debt is outstanding), while still funding the growth of the Company.
The Company purchases large quantities of raw materials and components, mainly steel, aluminum, light bulbs, fluorescent tubes, lighting ballasts, sockets, wire harnesses, plastic, lenses, glass, vinyls, inks, LEDs, electronic components, and corrugated cartons. The Company’s operating results could be affected by the availability and price fluctuations of these materials. The Company uses multiple suppliers, has alternate suppliers for most materials, and has no significant dependence on any single supplier. Other than industry-wide electronic component supply shortages and the recent shortage in rare earth minerals used in fluorescent lamps, the Company has not experienced any significant supply problems in recent years. Supply shortages of certain electronic components and certain other parts in fiscal 2010 and fiscal 2011 have caused some production and shipment delays, and the Company is dealing with some increased supply chain lead times. Price risk for these materials is related to increases in commodity items that affect all users of the materials, including the Company’s competitors. For the fiscal year ended June 30, 2011, the raw material component of cost of goods sold subject to price risk was approximately $138 million. The Company does not actively hedge or use derivative instruments to manage its risk in this area. The Company does, however, seek new vendors, negotiate with existing vendors, and at times commit to minimum volume levels to mitigate price increases. The Company negotiates supply agreements with certain vendors to lock in prices over a negotiated period of time. In response to rising material prices, the Company’s Lighting Segment announced price increases ranging from 4% to 8%, depending on the product, effective with late April 2011 orders. While competitors of the Company’s lighting business have announced similar price increases, the lighting market remains very price competitive. The Company’s Graphics Segment generally establishes new sales prices, reflective of the then current raw material prices, for each custom graphics program as it begins.
As a result of the operation of a subsidiary in Montreal, Canada, the Company is exposed to fluctuations in foreign currency exchange rates in the operation of its Canadian business. However, a substantial amount of this business is conducted in U.S. dollars, therefore, any potential risk is deemed immaterial. Additionally, the financial transactions and financial statements of this subsidiary are recorded in U.S. dollars.
Schedules other than those listed above are omitted for the reason(s) that they are either not applicable or not required or because the information required is contained in the financial statements or notes thereto. Selected quarterly financial data is found in Note 17 of the accompanying consolidated financial statements.
None.
The Company maintains disclosure controls and procedures (as such term is defined in Rules 13a-15(e) and 15d-15(e) under the Securities Exchange Act of 1934 as amended (the “Exchange Act”)) that are designed to ensure that information required to be disclosed in the Company’s reports under the Exchange Act, is recorded, processed, summarized and reported within the time periods specified in the SEC’s rules and forms, and that such information is accumulated and communicated to management, including the Company’s Chief Executive Officer and Chief Financial Officer, as appropriate, to allow timely decisions regarding required disclosure. The Company periodically reviews the design and effectiveness of its disclosure controls and internal control over financial reporting. The Company makes modifications to improve the design and effectiveness of its disclosure controls and internal control structure, and may take other corrective action, if its reviews identify a need for such modifications or actions. The Company’s disclosure controls and procedures are designed to provide reasonable assurance of achieving their objectives.
As of the end of the period covered by this Form 10-K, an evaluation was completed under the supervision and with the participation of our management, including our principal executive officer and principal financial officer, regarding the design and effectiveness of our disclosure controls and procedures. Based on this evaluation, our management, including our principal executive officer and principal financial officer, has concluded that our disclosure controls and procedures were effective as of June 30, 2011.
There were no changes in the Company’s internal control over financial reporting (as defined in Rules 13a-15(f) and 15d-15(f) under the Exchange Act) during the fiscal quarter ended June 30, 2011, that have materially affected, or are reasonably likely to materially affect, the Company’s internal control over financial reporting. See Management’s Report on Internal Control Over Financial Reporting on page F-15.
None.
LSI will provide shareholders with any exhibit upon the payment of a specified reasonable fee, which fee shall be limited to LSI’s reasonable expenses in furnishing such exhibit. The exhibits identified herein as being filed with the SEC have been so filed with the SEC but may not be included in this version of the Annual Report to Shareholders.
Pursuant to the requirements of Section 13 or 15(d) of the Securities Exchange Act of 1934, the registrant has duly caused this report to be signed on its behalf by the undersigned, thereunto duly authorized.
Pursuant to the requirements of the Securities Exchange Act of 1934, this report has been signed below by the following persons on behalf of the registrant and in the capacities and on the dates indicated.
MANAGEMENT’S DISCUSSION AND ANALYSIS OF FINANCIAL CONDITION AND RESULTS OF OPERATIONS
The Company’s “forward looking statements” and disclosures as presented earlier in this Form 10-K in the “Safe Harbor” Statement, as well as the Company’s consolidated financial statements and accompanying notes presented later in this Form 10-K should be referred to when reading Management’s Discussion and Analysis of Financial Condition and Results of Operations.
Net Sales by Business Segment
| (In thousands) | | 2011 | | | 2010 | | | 2009 | |
| Lighting Segment | | $ | 196,550 | | | | 159,105 | | | $ | 160,475 | |
| Graphics Segment | | | 68,155 | | | | 68,395 | | | | 60,765 | |
| Electronic Components Segment | | | 21,449 | | | | 16,116 | | | | — | |
| All Other Category | | | 7,347 | | | | 10,786 | | | | 12,559 | |
| | | $ | 293,501 | | | | 254,402 | | | $ | 233,799 | |
Operating Income (Loss) by Business Segment
| (In thousands) | | 2011 | | | 2010 | | | 2009 | |
| Lighting Segment | | $ | 11,423 | | | | 9,073 | | | $ | (3,884 | ) |
| Graphics Segment | | | 6,373 | | | | 3,237 | | | | 2,362 | |
| Electronic Components Segment | | | 7,886 | | | | 2,279 | | | | — | |
| All Other Category | | | (543 | ) | | | (1,807 | ) | | | (4,321 | ) |
| Corporate and Eliminations | | | (8,835 | ) | | | (10,873 | ) | | | (8,568 | ) |
| | | $ | 16,304 | | | | 1,909 | | | $ | (14,411 | ) |
Summary Comments
Fiscal 2011 net sales of $293,501,000 increased $39.1 million or 15.4% as compared to fiscal 2010. See Note 2 to the financial statements for discussion of the retroactive reclassification of the Company’s reportable business segments. Net sales were favorably influenced by increased net sales of the Lighting Segment (up $37.4 million or 23.5%), and the Electronic Components Segment (up $5.3 million or 33.1%). Net sales were unfavorably influenced by decreased net sales of the Graphics Segment (down $0.2 million or 0.4%), and the All Other Category (down $3.4 million or 31.9%). Net sales to the petroleum / convenience store market, the Company’s largest niche market, were $108,460,000 or 37% of total net sales and $89,952,000 or 35% of total net sales of fiscal 2011 and 2010, respectively. The $18.5 million or 21% increase is primarily due to an increase of sales of solid-state LED lighting into this market.
The Company recorded intangible asset impairment expenses in fiscal 2010 totaling $153,000 ($16,000 in the Lighting Segment and $137,000 in the All Other Category). There were no such intangible asset impairment expenses in fiscal 2011. The Company recorded significant goodwill impairment expenses in fiscal 2009 totaling $14,467,000 ($11.2 million in the Lighting Segment, $0.7 million in the Graphics Segment and $2.6 million in the All Other Category). There were no goodwill impairment expenses in fiscal 2011 or 2010.
The Company also recorded significant acquisition-related and other professional fees expenses in fiscal 2010, totaling $1,198,000 ($678,000 of inventory adjustments related to acquisition fair value accounting on the opening balance sheet of LSI ADL Technology; and $520,000 of acquisition transaction costs related to the acquisition of LSI ADL Technology). There were no such similar significant expenses in fiscal 2011. See also the section below on Non-GAAP Financial Measures.
The Company’s total net sales of products and services related to solid-state LED technology in light fixtures and video screens for sports, advertising and entertainment markets have been recorded as indicated in the table below. In addition, the Company sells certain elements of graphic identification programs that contain solid-state LED light sources.
| | | LED Net Sales | |
| (In thousands) | | FY 2011 | | | FY 2010 | | | % Change | |
| First Quarter | | $ | 16,673 | | | $ | 17,999 | | | | (7.4)% | |
| Second Quarter | | | 17,585 | | | | 18,533 | | | | (5.1)% | |
| First Half | | | 34,258 | | | | 36,532 | | | | (6.2)% | |
| Third Quarter | | | 12,943 | | | | 11,510 | | | | 12.5% | |
| Nine Months | | | 47,201 | | | | 48,042 | | | | (1.8)% | |
| Fourth Quarter | | | 21,453 | | | | 14,538 | | | | 47.6% | |
| Full Year | | $ | 68,654 | | | $ | 62,580 | | | | 9.7% | |
Fiscal 2011 LED net sales of $68,654,000 were up $6.1 million or 9.7% from fiscal 2010. The $68,654,000 total LED net sales and the $6.1 million increase are primarily the result of Lighting Segment LED net sales of $60,042,000 (up $22.2 million or 59%), Graphics Segment LED net sales of $4,938,000 (down $15.3 million or 76%, primarily due to lower LED sports screen sales and lower LED lighting for signage) and All Other Category LED net sales of $3,674,000 (down $0.8 million or 18% in the entertainment market).
During the recession of 2008 through 2010, virtually all of our markets were adversely impacted and our business suffered as a result. During these difficult and uncertain economic conditions, we took a number of proactive steps to meet our operating challenges, including strict control of expenses, capital expenditure reductions, close management of accounts receivable and inventories, prudent staffing decisions, and maintaining a conservative financial position coupled with positive free cash flow. Economic conditions in many of the markets we serve now have continued to show improvement in fiscal 2011. We continue to adjust our expense levels to production rates we are experiencing and to manage working capital efficiently. We are also strategically positioning the business for future growth and are very positive about the longer term outlook and opportunities for the Company. LSI is still facing a period of challenging business conditions in the near term due to the general economic conditions, but expects to emerge a stronger and more efficient company as business conditions continue to improve.
Non-GAAP Financial Measures
The Company believes it is appropriate to evaluate its performance after making adjustments to the U.S. GAAP net income (loss) for the 2010 and 2009 fiscal years. Adjusted net income and earnings per share, which exclude the impact of the LSI ADL Technology acquisition deal costs, acquisition-related fair value inventory adjustments, the loss on the sale of LSI Marcole, goodwill and intangible asset impairments, and a loss contingency related to a menu board patent litigation, are non-GAAP financial measures. We believe that these adjusted supplemental measures are useful in assessing the operating performance of our business. These supplemental measures are used by our management, including our chief operating decision maker, to evaluate business results. We exclude these items because they are not representative of the ongoing results of operations of our business. Below is a reconciliation of this non-GAAP measure to net income (loss) for the periods indicated.
| | | FY 2011 | | | FY 2010 | | | FY 2009 | |
| | | | | | | Diluted | | | | | | | Diluted | | | | | | | Diluted | |
(In thousands, except per share data; unaudited) | | Amount | | | EPS | | | Amount | | | EPS | | | Amount | | | EPS | |
| Reconciliation of net income (loss) to adjusted net income: | | | | | | | | | | | | | | | | | | | | | | | | |
| | | | | | | | | | | | | | | | | | | | | | | | | |
| Net income (loss) as reported | | $ | 10,828 | | | $ | 0.44 | | | $ | 1,424 | | | $ | 0.06 | | | $ | (13,414 | ) | | $ | (0.62 | ) |
| | | | | | | | | | | | | | | | | | | | | | | | | |
| Adjustment for the loss on sale of LSI Marcole, inclusive of the income tax effect | | | — | | | | — | | | | 422 | (1) | | | 0.02 | | | | — | | | | — | |
| | | | | | | | | | | | | | | | | | | | | | | | | |
| Adjustment for the acquisition deal costs and acquisition-related fair value inventory adjustment, inclusive of the income tax effect | | | — | | | | — | | | | 791 | (2) | | | 0.03 | | | | — | | | | — | |
| | | | | | | | | | | | | | | | | | | | | | | | | |
| Adjustment for the loss contingency related to the menu board patent litigation, inclusive of the income tax effect | | | — | | | | — | | | | — | (3) | | | — | | | | 125 | (3) | | | 0.01 | |
| | | | | | | | | | | | | | | | | | | | | | | | | |
| Adjustment for goodwill and intangible asset impairments, inclusive of the income tax effect | | | — | | | | — | | | | 148 | (4) | | | 0.01 | | | | 13,583 | (5) | | | 0.62 | |
| | | | | | | | | | | | | | | | | | | | | | |
| Adjusted net income and earnings per share | | $ | 10,828 | | | | 0.44 | | | $ | 2,785 | | | $ | 0.12 | | | $ | 294 | | | $ | 0.01 | |
The income tax effects of the adjustments in the tables above were calculated using the estimated U.S. effective income tax rates for the periods indicated, with appropriate consideration given for the permanent non-deductible portion of the goodwill impairments in fiscal 2009. The income tax effects were as follows (in thousands):
| (1) | | $217 |
| | | |
| (2) | | $407 |
| | | |
| (3) | | $75 |
| | | |
| (4) | | $5 |
| | | |
| (5) | | $884 |
Results of Operations
2011 Compared to 2010
| Lighting Segment | | | |
| (In thousands) | | 2011 | | | 2010 | |
| Net Sales | | $ | 196,550 | | | $ | 159,105 | |
| Gross Profit | | $ | 44,499 | | | $ | 37,185 | |
| Operating Income | | $ | 11,423 | | | $ | 9,073 | |
Lighting Segment net sales of $196,550,000 in fiscal 2011 increased 23.5% from fiscal 2010 net sales of $159,105,000. The $37.4 million increase in Lighting Segment net sales is primarily the net result of a $19.8 million or 24.7% net increase in lighting sales to our niche markets (petroleum / convenience store market net sales were up 19%, net sales to the automotive dealership market were up 58%, and net sales to the quick service restaurant market were up 20%) and national retail accounts, and a $17.5 million or 22.2% increase in commissioned net sales to the commercial / industrial lighting market. Sales of lighting to the petroleum / convenience store market represented 31% and 32% of Lighting Segment net sales in fiscal years 2011 and 2010, respectively. Lighting Segment net sales of lighting to this, the Company’s largest niche market, were up 19% from fiscal 2010 to $61,066,000, with approximately $10.2 million related to a program with 7-Eleven, Inc., who replaced traditional canopy, site and sign lighting with solid-state LED lighting. Lighting Segment fiscal 2010 net sales to 7-Eleven, Inc. were approximately $21.4 million for a similar LED replacement lighting program. The petroleum / convenience store market has been, and will continue to be, a very important niche market for the Company. The Lighting Segment’s net sales of light fixtures having solid-state LED technology totaled $60.0 million in fiscal 2011, representing a 59% increase from fiscal 2010 net sales of solid-state LED light fixtures of $37.8 million.
Gross profit of $44,499,000 in fiscal 2011 increased $7.3 million or 20% from fiscal 2010, and decreased from 22.5% to 22.2% as a percentage of Lighting Segment net sales (customer plus inter-segment net sales). The increase in amount of gross profit is due to the net effect of increased net sales at decreased margins, and increased overhead absorption. The following items also influenced the Lighting Segment’s gross profit margin: competitive pricing pressures; $2.2 million increased freight costs; $0.3 million increased benefits and compensation; $0.3 million increased warranty costs; $0.3 million increased utilities; $0.2 million increased repairs and maintenance; $0.4 million increased outside service costs; $0.1 million increased depreciation expense; and $0.6 million increased manufacturing supplies expense.
Selling and administrative expenses of $33,076,000 in fiscal 2011 increased $5.0 million from fiscal 2010. The following items were the primary contributors to the increase: $0.1 million increased compensation and benefits expense; $3.0 million increased sales commission expense reflective of increased net sales; $0.4 million increased research and development expense; $0.8 million increased customer relations expense; $0.2 million increased outside services; $0.1 million increased sales samples expense; $0.1 million decreased communications expense; $0.1 million decreased royalty income; $0.1 million increased advertising; and $0.5 million increased bad debt expense.
The Lighting Segment fiscal 2011 operating income of $11,423,000 increased $2.4 million or 25.9% from operating income of $9,073,000 in fiscal 2010. This increase of $2.4 million was the net result of increased net sales, increased gross profit (at lower margin percentages), and increased selling and administrative expenses.
| | | |
| (In thousands) | | 2011 | | | 2010 | |
| Net Sales | | $ | 68,155 | | | $ | 68,395 | |
| Gross Profit | | $ | 16,903 | | | $ | 13,781 | |
| Operating Income | | $ | 6,373 | | | $ | 3,237 | |
Graphics Segment net sales of $68,155,000 in fiscal 2011 decreased 0.4% from fiscal 2010 net sales of $68,395,000. The $0.2 million decrease in Graphics Segment net sales is primarily the net result of image conversion programs and sales to twelve petroleum / convenience store customers ($8.7 million net increase), grocery market ($2.5 million decrease), the LED video sports screen market ($5.0 million decrease), a national drug store retailer ($3.2 million decrease), a fast food restaurant chain ($1.1 million increase), and changes in volume or completion of several other graphics programs. Sales of graphics products and services to the petroleum / convenience store market represented 70% and 56% of Graphics Segment net sales in fiscal years 2011 and 2010, respectively. Graphics Segment net sales of graphics to this, the Company’s largest niche market, were up 23% from fiscal 2010 to $47,394,000, with approximately $29.7 million related to a program with 7-Eleven, Inc., who replaced traditional sign lighting with solid-state LED lighting. The petroleum / convenience store market has been, and will continue to be, a very important niche market for the Company. The Graphics Segment net sales of solid-state LED video screens and LED lighting for signage totaled $4.9 million in fiscal 2011 as compared to $20.3 million in the prior year.
Image and brand programs, whether full conversions or enhancements, are important to the Company’s strategic direction. Image programs include situations where our customers refurbish their retail sites around the country by replacing some or all of the lighting, graphic elements, menu board systems and possibly other items they may source from other suppliers. These image programs often take several quarters to complete and involve both our customers’ corporate-owned sites as well as their franchisee-owned sites, the latter of which involve separate sales efforts by the Company with each franchisee. The Company may not always be able to replace net sales immediately when a large image conversion program has concluded. Brand programs typically occur as new products are offered or new departments are created within existing retail stores. Relative to net sales to a customer before and after an image or brand program, net sales during the program are typically significantly higher, depending upon how much business is awarded to the Company. Sales related to a customer’s image or brand program are reported in the Lighting Segment, Graphics Segment, or the All Other Category depending upon the product and/or service provided.
Gross profit of $16,903,000 in fiscal 2011 increased $3.1 million or 23% from fiscal 2010, and increased from 19.9% to 24.4% as a percentage of Graphics Segment net sales (customer plus inter-segment net sales). The increase in amount of gross profit is due to the net effect of decreased net sales at increased margins, and decreased overhead absorption. The following items also influenced the Graphics Segment’s gross profit margin: competitive pricing pressures; $0.1 million decreased freight costs; $0.1 million decreased warranty costs; $0.1 million decreased rent/lease expense; and $0.1 million increased property taxes.
Selling and administrative expenses of $10,530,000 in fiscal 2011 were slightly lower than fiscal 2010. The following items of expense changed between years as follows: $0.2 million decreased compensation and benefits; $0.1 million increased rent expense; $0.2 million decreased customer relations expense; $0.1 million increased outside services expense; $0.1 million decreased sales commission expense; and increased expense related to a patent settlement agreement.
The Graphics Segment fiscal 2011 operating income of $6,373,000 increased $3.1 million or 97% from operating income of $3,237,000 in fiscal 2010. The $3.1 million increase in operating income was the result of decreased net sales, increased gross profit, and decreased selling and administrative expenses.
| Electronic Components Segment | | | |
| (In thousands) | | 2011 | | | 2010 | |
| Net Sales | | $ | 21,449 | | | $ | 16,116 | |
| Gross Profit | | $ | 9,601 | | | $ | 3,847 | |
| Operating Income | | $ | 7,886 | | | $ | 2,279 | |
Electronic Components Segment net sales of $21,449,000 in fiscal 2011 increased 33.1% from fiscal 2010 net sales of $16,116,000. The $5.3 million increase in Electronic Components Segment net sales is primarily the net result of a $2.9 million increase to industrial markets, $1.0 million decrease to telecommunications markets, $0.8 million increase to retail markets, $0.5 million increase to medical markets and $0.2 million decrease to transportation related markets. In addition to this segment’s growth in customer sales, its inter-segment net sales grew 374% in support of LED lighting sales.
Gross profit of $9,601,000 in fiscal 2011 increased $5.8 million or 150% from fiscal 2010, and increased from 17.9% to 20.4% as a percentage of Electronic Components Segment net sales (customer plus inter-segment net sales). Approximately $3.8 million of increased gross profit resulted from the significant increase in the amount of inter-segment business as well as from increased Electronic Components customer net sales. Gross profit of the Electronic Components Segment in fiscal 2010 was reduced by $678,000 related to the roll-out of fair value inventory adjustments for LSI ADL Technology’s sales of products that were in finished goods or work-in-process inventory on the acquisition date and therefore were valued at fair value, as opposed to manufactured cost, in the opening balance sheet in accordance with the requirements of purchase accounting. The following items also influenced the Electronic Components Segment’s gross profit margin: competitive pricing pressures; $0.2 million increase shipping costs; $0.4 million increased benefits and compensation; $0.1 million increased outside services; and $0.5 million increased manufacturing supplies.
Selling and administrative expenses of $1,715,000 in fiscal 2011 increased $0.1 million from fiscal 2010. The following items of expense changed between years as follows: $0.1 million increased employee compensation and benefits expense; $0.1 million increased supplies; and $0.1 million increased repairs and maintenance.
The Electronic Components Segment fiscal 2011 operating income of $7,886,000 increased $5.6 million from operating income of $2,279,000 in the same period of fiscal 2010. The $5.6 million increase in operating income was the result of increased net sales and increased gross profit, partially offset by increased selling and administrative expenses.
| | | |
| (In thousands) | | 2011 | | | 2010 | |
| Net Sales | | $ | 7,347 | | | $ | 10,786 | |
| Gross Profit | | $ | 2,089 | | | $ | 1,267 | |
| Operating (Loss) | | $ | (543 | ) | | $ | (1,807 | ) |
All Other Category net sales of $7,347,000 in fiscal 2011 decreased 31.9% from fiscal 2010 net sales of $10,786,000. The $3.4 million decrease in the All Other Category net sales is primarily the net result of net increased sales of menu board systems ($0.2 million), decreased sales of LED video screens to the entertainment and other markets ($3.0 million), no sales of electrical wire harnesses ($2.9 million) and changes in volume or completion of other customer programs. The Company sold its wire harness operation and business at the end of the third quarter of fiscal 2010 and therefore has no further sales or expenses related to wire harnesses.
The gross profit of $2,089,000 in fiscal 2011 increased $0.8 million or 65% from fiscal of 2010, and increased from 7.1% to 16.2% as a percentage of the All Other Category net sales (customer plus inter-segment net sales). The increase in amount of gross profit is due to the net effect of decreased net sales and increased margins. The following items also influenced the All Other Category’s gross profit margin: competitive pricing pressures; $0.6 million decreased indirect wage compensation and benefits; $0.5 million increased installation costs; $0.1 million decreased manufacturing supplies; $0.1 million decreased utilities; $0.2 million decreased warranty expense; and $0.1 million decreased depreciation expense.
Selling and administrative expenses of $2,632,000 in fiscal 2011 decreased $0.4 million or 14% as compared to the prior year. Changes of expense between years include $0.2 million decreased benefits and compensation, $0.2 million decreased royalty expense, $0.1 million decreased depreciation expense, and $0.3 million increased bad debt expense.
The All Other Category fiscal 2011 operating loss of $(543,000) compares to an operating loss of $(1,807,000) in fiscal 2010. This $1.3 million decreased operating loss was the net result of decreased net sales, increased gross profit, and decreased selling and administrative expenses. Sales and resulting gross margins were not high enough to cover selling and administrative expenses.
Corporate and Eliminations | | | |
| (In thousands) | | 2011 | | | 2010 | |
| Gross Profit | | $ | (747 | ) | | $ | (347 | ) |
| Operating (Loss) | | $ | (8,835 | ) | | $ | (10,873 | ) |
The negative gross profit relates to the intercompany profit in inventory elimination.
Selling and administrative expenses of $8,088,000 in fiscal 2011 were down $2.4 million or 23.2% from the same period of the prior year. The reduction in expense is primarily related to the net result of $1.3 million reduced compensation and benefits expense, $0.1 million increased repair and maintenance expense, $0.1 million reduced audit and accounting fees, $0.1 million reduced outside consulting services, $0.4 million reduced research and development expenses, and no acquisition deal costs in fiscal 2011 as compared to $0.5 million in the prior year.
Consolidated Results
The Company reported net interest expense of $137,000 in fiscal 2011 as compared to net interest expense of $125,000 in fiscal 2010. Commitment fees related to the unused portions of the Company’s lines of credit, interest expense on a mortgage, and interest income on invested cash are included in the net interest expense amounts above.
The $5,339,000 income tax expense in fiscal 2011 represents a consolidated effective tax rate of 33.0%. This is the net result of an income tax rate of 31.2% for the Company’s U.S. operations, influenced by certain permanent book-tax differences that were significant relative to the amount of taxable income, by certain U.S. federal and Canadian income tax credits, by a benefit related to uncertain income tax positions, by adjustments to deferred income tax liabilities, and by a full valuation reserve on the Company’s Canadian tax position. The $360,000 income tax expense in fiscal 2010 represents a consolidated effective tax rate of 20.2%. This is the net result of a U.S. federal income tax rate of 34% influenced by certain permanent book-tax differences that were significant relative to the amount of taxable income, by certain U.S. federal and Canadian income tax credits, by a benefit related to uncertain income tax positions, by an increase in state income taxes, and by full valuation reserves on the Company’s Canadian tax position and a certain state deferred income tax asset.
The Company reported net income of $10,828,000 in fiscal 2011 as compared to net income of $1,424,000 in fiscal 2010. The increased net income is primarily the result of increased net sales and increased gross profit, partially offset by increased operating expenses and increased income tax expense. Diluted earnings per share were $0.44 in fiscal 2011 as compared to $0.06 in fiscal 2010. The weighted average common shares outstanding for purposes of computing diluted earnings per share in fiscal 2011 was 24,339,000 shares as compared to 24,134,000 shares in fiscal 2010.
2010 Compared to 2009
| Lighting Segment | | | | | | |
| (In thousands) | | 2010 | | | 2009 | |
| Net Sales | | $ | 159,105 | | | $ | 160,475 | |
| Gross Profit | | $ | 37,185 | | | $ | 36,403 | |
| Operating Income (Loss) | | $ | 9,073 | | | $ | (3,884 | ) |
Lighting Segment net sales of $159,105,000 in fiscal 2010 decreased 0.9% from fiscal 2009 net sales of $160,475,000. The $1.4 million decrease in Lighting Segment net sales is primarily the net result of a $17.0 million or 27% net increase in lighting sales to our niche markets (petroleum / convenience store market net sales were up 70%, net sales to the automotive dealership market were down 29%, and net sales to the quick service restaurant market were down 39%) and national retail accounts, and an $18.4 million or 18.9% decrease in commissioned net sales to the commercial / industrial lighting market. Sales of lighting to the petroleum / convenience store market represented 32% and 19% of Lighting Segment net sales in the fiscal years 2010 and 2009, respectively. Net sales of lighting to this, the Company’s largest niche market, were up 70.0% from fiscal 2009 to $51,462,000, with approximately $21.4 million related to a program with 7-Eleven, Inc., who replaced traditional canopy, site and sign lighting with solid-state LED lighting. The Lighting Segment’s net sales of light fixtures having solid-state LED technology totaled $37.8 million in fiscal 2010, representing a 496% increase from fiscal 2009 net sales of solid-state LED light fixtures of $6.3 million.
Gross profit of $37,185,000 in fiscal 2010 increased $0.8 million or 2.1% from fiscal 2009, and increased from 21.9% to 22.5% as a percentage of Lighting Segment net sales (customer plus inter-segment net sales). The increase in amount of gross profit is due to the net effect of decreased net sales at increased margins, increased overhead absorption and reduced freight costs. The following items also influenced the Lighting Segment’s gross profit margin: competitive pricing pressures; $1.0 million increased benefits and compensation; $1.1 million increased warranty costs; $0.4 million decreased utilities; $0.3 million decreased depreciation expense; and $0.2 million increased property and real estate taxes.
Selling and administrative expenses of $28,096,000 in fiscal year 2010 decreased $1.0 million primarily as the net result of: increased employee compensation and benefits expense ($0.6 million); decreased sales commission expense ($1.1 million); increased research and development expense ($0.9 million); decreased outside services expense ($0.2 million); decreased customer relations expense ($0.5 million); decreased royalty expense ($0.2 million); and decreased warranty expense ($0.4 million).
The Lighting Segment recorded a fiscal 2010 patent intangible asset impairment expense of $16,000 as compared to a fiscal 2009 goodwill impairment expense of $11,185,000, resulting in a favorable change of $11.2 million.
The Lighting Segment fiscal 2010 operating income of $9,073,000 compares to an operating loss of ($3,884,000) in fiscal 2009. The improvement of $13.0 million was the net result of decreased net sales, increased gross profit, decreased selling and administrative expenses, and decreased impairment expense.
| Graphics Segment | | | | | | |
| (In thousands) | | 2010 | | | 2009 | |
| Net Sales | | $ | 68,395 | | | $ | 60,765 | |
| Gross Profit | | $ | 13,781 | | | $ | 13,382 | |
| Operating Income | | $ | 3,237 | | | $ | 2,362 | |
Graphics Segment net sales of $68,395,000 in fiscal 2010 increased 12.6% from fiscal 2009 net sales of $60,765,000. The $7.6 million increase in Graphics Segment net sales is primarily the result of image conversion programs and sales to ten petroleum / convenience store customers ($16.1 million net increase), a grocery retailer ($5.1 million decrease), five retail customers ($1.2 million net decrease), the LED video sports screen market ($0.2 million increase), a national drug store retailer ($0.7 million decrease), a lawn care company ($0.4 million decrease), and changes in volume or completion of several other graphics programs. Sales of graphics products and services to the petroleum / convenience store market represented 56% and 40% of Graphics Segment net sales in fiscal years 2010 and 2009, respectively. Net sales of graphics to this, the Company’s largest niche market, were up 58% from fiscal 2009 to $38,490,000, with approximately $17.1 million related to a program with 7-Eleven, Inc., who replaced traditional sign lighting with solid-state LED lighting. The Graphics Segment net sales of products and services related to solid-state LED video screens and LED lighting for signage totaled $20.3 million in fiscal 2010 as compared to $8.0 million in the prior year.
Image and brand programs, whether full conversions or enhancements, are important to the Company’s strategic direction. Image programs include situations where our customers refurbish their retail sites around the country by replacing some or all of the lighting, graphic elements, menu board systems and possibly other items they may source from other suppliers. These image programs often take several quarters to complete and involve both our customers’ corporate-owned sites as well as their franchisee-owned sites, the latter of which involve separate sales efforts by the Company with each franchisee. The Company may not always be able to replace net sales immediately when a large image conversion program has concluded. Brand programs typically occur as new products are offered or new departments are created within existing retail stores. Relative to net sales to a customer before and after an image or brand program, net sales during the program are typically significantly higher, depending upon how much business is awarded to the Company. Sales related to a customer’s image or brand program are reported in either the Lighting Segment, Graphics Segment, or the All Other Category depending upon the product and/or service provided.
Gross profit of $13,781,000 in fiscal 2010 increased $0.4 million or 3% from fiscal 2009, and decreased from 21.5% to 19.9% as a percentage of Graphics Segment net sales (customer plus inter-segment net sales). The increase in amount of gross profit is due to increased Graphics Segment net sales at lower margins. The following items also influenced the Graphics Segment’s gross profit margin: competitive pricing pressures, and other manufacturing expenses in support of production requirements ($0.1 million of increased indirect wage, compensation and benefits costs; $0.4 million increased warranty expense; $0.1 million decreased supplies expense; $0.1 million decreased rental expense; and $0.3 million decreased depreciation and utilities).
Selling and administrative expenses of $10,544,000 in fiscal 2010 increased $0.2 million primarily as a net result of decreased compensation and benefits ($0.1 million), increased bad debt expense ($0.3 million), increased customer relations expense ($0.2 million), and decreased outside services expense ($0.1 million).
The Graphics Segment recorded a fiscal 2009 goodwill impairment expense of $716,000 with no similar expense in fiscal 2010, resulting in a favorable change of $0.7 million.
The Graphics Segment fiscal 2010 operating income of $3,237,000 increased $0.9 million or 37.0% from operating income of $2,362,000 in fiscal 2009. The $0.9 million increase in operating income was the result of increased net sales, increased gross profit, increased selling and administrative expenses, and decreased impairment expense.
Electronic Components Segment | | | | | | | | |
| (In thousands) | | 2010 | | | 2009 | |
| Net Sales | | $ | 16,116 | | | $ | — | |
| Gross Profit | | $ | 3,847 | | | $ | — | |
| Operating Income | | $ | 2,279 | | | $ | — | |
Electronic Components Segment results include the operations of LSI ADL Technology, a subsidiary that the Company acquired in July 2009. Therefore, the net sales and operating income in fiscal 2010 are incremental additions to the Company’s results as there were no net sales or operating income in fiscal 2009. Operating income in fiscal 2010 was reduced by $678,000 related to the roll-out of fair value inventory adjustments for LSI ADL Technology’s sales of products that were in finished goods or work-in-process inventory on the acquisition date and therefore were valued at fair value, as opposed to manufactured cost, in the opening balance sheet in accordance with the requirements of purchase accounting.
| All Other Category | | | | | | | | |
| (In thousands) | | 2010 | | | 2009 | |
| Net Sales | | $ | 10,786 | | | $ | 12,559 | |
| Gross Profit | | $ | 1,267 | | | $ | 2,060 | |
| Operating (Loss) | | $ | (1,807 | ) | | $ | (4,321 | ) |
All Other Category net sales of $10,786,000 in fiscal 2010 decreased 14% from fiscal 2009 net sales of $12,559,000. The $1.8 million decrease in the All Other Category net sales is primarily the net result of decreased sales to two quick service restaurant menu board customers ($0.8 million), decreased sales of electrical wire harnesses ($1.0 million), decreased sales of solid state-state LED video screens to the entertainment market ($0.3 million) and decreased sales of specialty LED lighting ($0.1 million). The Company sold its wire harness operation and business at the end of the third quarter of fiscal 2010 and will therefore have no further sales of wire harnesses.
The gross profit of $1,267,000 in fiscal 2010 compares to gross profit of $2,060,000 in fiscal 2009. The change is primarily the result of the $639,000 loss recorded on the March 2010 sale of the assets and business of the Company’s wire harness operation. The remaining $0.2 million decrease in amount of gross profit is primarily due to decreased net sales and margins, and decreased indirect wage compensation and benefits.
Selling and administrative expenses of $2,937,000 decreased $878,000 in fiscal year 2010. Changes of expense between years included decreased menu board patent settlement expense ($0.2 million), decreased outside services expense ($0.2 million), decreased depreciation expense ($0.1 million), decreased warranty expense ($0.1 million), decreased bad debt expense ($0.1 million), decreased rent and lease expense ($0.1 million), decreased research and development costs ($0.1 million), decreased amortization expense ($0.1 million) and increased royalty expense ($.2 million).
The All Other Category recorded a fiscal 2009 goodwill impairment expense of $2,566,000 compared to a $137,000 impairment expense in fiscal 2010, resulting in a favorable change of $2.4 million.
The All Other Category fiscal 2010 operating loss of $(1,807,000) compares to an operating loss of $(4,321,000) in fiscal 2009. This $2.5 million decreased loss was the result of less goodwill impairment and decreased selling and administrative expenses, partially offset by decreased sales and gross profit.
| Corporate and Eliminations | | | | | | | | |
| (In thousands) | | 2010 | | | 2009 | |
| Net Sales | | $ | -- | | | $ | -- | |
| Gross Profit | | $ | (347 | ) | | $ | (18 | ) |
| Operating Income | | $ | (10,873 | ) | | $ | (8,568 | ) |
The negative gross profit relates to elimination of the intercompany profit in inventory.
Selling and administrative expenses of $10,526,000 in fiscal 2010 increased $2 million primarily as the net result of: increased compensation, benefits and stock option expense ($1.5 million); increased acquisition deal costs associated with the acquisition of LSI ADL Technology ($0.5 million); increased research and development expenses ($0.3 million); decreased depreciation expense ($0.1 million); and decreased professional fees and outside services ($0.6 million).
Consolidated Results
The Company reported net interest expense of $125,000 in fiscal 2010 as compared to net interest income of $8,000 in fiscal 2009. The Company borrowed on its lines of credit occasionally in fiscal 2009 and essentially its only borrowings in fiscal 2010 were related to the mortgage loan assumed in the acquisition of AdL Technology. Commitment fees related to the unused portions of the Company’s lines of credit, and interest income on invested cash are included in the net interest expense amounts above.
The $360,000 income tax expense in fiscal 2010 represents a consolidated effective tax rate of 20.2%. This is the net result of a U.S. federal income tax rate of 34% influenced by certain permanent book-tax differences that were significant relative to the amount of taxable income, by certain U.S. federal and Canadian income tax credits, by a benefit related to uncertain income tax positions, by an increase in state income taxes, and by full valuation reserves on the Company’s Canadian tax position and a certain state deferred income tax asset. The income tax benefit in fiscal 2009 of $989,000 reflects a tax benefit of $105,000 related to the operations of the Company (which includes a $333,000 release of an uncertain income tax liability associated with a voluntary disclosure program) and a tax benefit of $884,000 associated with the $14,467,000 impairment of goodwill (the majority of which was non-deductible for tax purposes).
The Company reported a net income of $1,424,000 in fiscal 2010 as compared to a net loss of $(13,414,000) in fiscal 2009. The increased net income is primarily the result of increased net sales, increased gross profit, and significant goodwill impairment in fiscal 2009 as compared to a minor intangible asset impairment in fiscal 2010, partially offset by increased operating expenses, increased net interest expense and increased income tax expense. Diluted earnings per share were $0.06 in fiscal 2010 as compared to a loss of $(0.62) in fiscal 2009. The weighted average common shares outstanding for purposes of computing diluted earnings per share in fiscal 2010 were 24,134,000 shares as compared to 21,800,000 shares in fiscal 2009, with the increase in shares primarily related to the weighted effect of the 2,469,676 common shares issued in July 2009 for the acquisition of AdL Technology.
Liquidity and Capital Resources
The Company considers its level of cash on hand, borrowing capacity, current ratio and working capital levels to be its most important measures of short-term liquidity. For long-term liquidity indicators, the Company believes its ratio of long-term debt to equity and its historical levels of net cash flows from operating activities to be the most important measures.
At June 30, 2011, the Company had working capital of $84.5 million, compared to $73.6 million at June 30, 2010. The ratio of current assets to current liabilities was 4.92 to 1, compared to a ratio of 3.85 to 1 at June 30, 2010. The $11.0 million increase in working capital from June 30, 2010 to June 30, 2011 was primarily related to the net effect of increased net accounts receivable ($9.7 million), increased net inventory ($10.2 million), decreased accounts payable ($3.0 million), decreased accrued expenses ($1.3 million), and increased refundable income taxes ($0.6 million), partially offset by decreased cash and cash equivalents ($13.4 million), and decreased other current assets ($0.5 million).
The Company used $3.8 million of cash in operating activities in fiscal 2011 as compared to a generation of $16.7 million in the prior year. This $20.5 million decrease in net cash flows from operating activities is primarily the net result of greater net income (favorable change of $9.4 million), the prior year loss on sale of a subsidiary (unfavorable change of $0.6 million), more of an increase in accounts receivable (unfavorable change of $6.4 million), an increase rather than a decrease in inventories (unfavorable change of $13.3 million), an increase rather than a decrease in refundable income taxes (unfavorable $3.1 million), a decrease rather than an increase in accounts payable (unfavorable change of $5.5 million), a decrease rather than an increase in customer prepayments (unfavorable $2.0 million), an increase rather than a decrease in the allowance for doubtful accounts (favorable $0.6 million), more of an increase in the inventory obsolescence reserve (favorable $0.1 million), less of an increase in accrued expenses and other (unfavorable $0.4 million), decreased stock option expense (unfavorable $1.8 million), and a decrease rather than an increase in deferred income tax assets (favorable $2.6 million).
Net accounts receivable and notes receivable were $45.0 million and $35.3 million at June 30, 2011 and June 30, 2010, respectively. The increase of $9.7 million in net receivables is primarily due to combined effects of a higher amount of net sales in the fourth quarter of fiscal 2011 as compared to the fourth quarter of fiscal 2010 at an increased DSO. The DSO increased to 53 days at June 30, 2011 from 48 days at June 30, 2010. The Company believes that its receivables are ultimately collectible or recoverable, net of certain reserves, and that aggregate allowances for doubtful accounts are adequate.
Net inventories of $50.3 million at June 30, 2011 increased $10.2 million from June 30, 2010 levels. Net inventory increases occurred in fiscal 2011 in the Lighting Segment of approximately $7.1 million, in the Electronic Components Segment of approximately $5.8 million, and net inventory decreases occurred in the Graphics Segment of approximately $0.8 million and in the All Other Category of approximately $1.5 million. The majority of the inventory increases were intentional as the Company increased its inventory of purchased electronic parts in the face of world-wide shortages and increased finished goods of certain LED lighting fixtures in anticipation of customer roll-out programs.
Cash generated from operations and borrowing capacity under two line of credit facilities are the Company’s primary source of liquidity. The Company has an unsecured $30 million revolving line of credit with its bank group in the U.S., with all $30 million of the credit line available as of August 23, 2011. This line of credit is a $30 million three-year committed credit facility expiring in the third quarter of fiscal 2014. Additionally, the Company has a separate $5 million line of credit for the working capital needs of its Canadian subsidiary, LSI Saco Technologies. This line of credit is a $5 million multi-year committed credit facility expiring in the third quarter of fiscal 2013. As of August 23, 2011, all $5 million of this line of credit is available. The Company believes that $35 million total lines of credit plus cash flows from operating activities are adequate for the Company’s fiscal 2012 operational and capital expenditure needs. The Company is in compliance with all of its loan covenants.
The Company used $4.7 million of cash related to investing activities in fiscal 2011, compared to a use of $6.3 million in the prior year, a favorable change of $1.6 million. The change between years relates to the amount of fixed assets purchased, $4,731,000 in fiscal 2011 as compared to $6,150,000 in the prior year ($1.4 million favorable), the larger amount of proceeds from sale of assets in fiscal 2010 primarily related to the sale of LSI Marcole ($0.5 million unfavorable) and the fiscal 2010 acquisition of AdL Technology, net of cash received ($0.7 million favorable). Capital spending in both periods is primarily for tooling and equipment. The Company expects fiscal 2012 capital expenditures to be approximately $5.0 million, exclusive of business acquisitions, if any.
The Company used $4.9 million of cash related to financing activities in fiscal 2011, compared to a use of $7.0 million in the same period of the prior year. The $2.1 million favorable change between periods is primarily related to the payment of long-term debt on the opening balance sheet of the acquired LSI ADL Technology in the first quarter of fiscal 2010 as compared to nominal monthly principal payments in fiscal 2011 ($2.2 million favorable).
The Company has, or could have, on its balance sheet financial instruments consisting primarily of cash and cash equivalents, short-term investments, revolving lines of credit, and long-term debt. The fair value of these financial instruments approximates carrying value because of their short-term maturity and/or variable, market-driven interest rates.
Off-Balance Sheet Arrangements
The Company has no financial instruments with off-balance sheet risk and has no off-balance sheet arrangements.
| | | Payments Due by Period | |
| Contractual Obligations as | | | | | | Less than | | | 1-3 | | | 3-5 | | | More than | |
| of June 30, 2011 (a) | | Total | | | 1 year | | | years | | | years | | | 5 years | |
| | | | | | | | | | | | | | | | | | | | | |
| Long-Term Debt Obligations | | $ | 1,099 | | | $ | 35 | | | $ | 1,064 | | | $ | — | | | $ | — | |
| Interest on Long-Term Debt | | | 100 | | | | 85 | | | | 15 | | | | — | | | | — | |
| Operating Lease Obligations | | | 3,000 | | | | 1,404 | | | | 1,505 | | | | 90 | | | | 1 | |
| Purchase Obligations | | | 13,947 | | | | 13,201 | | | | 616 | | | | 130 | | | | — | |
| Total | | $ | 18,146 | | | $ | 14,725 | | | $ | 3,200 | | | $ | 220 | | | $ | 1 | |
| (a) | The liability for uncertain tax positions of $2.0 million is not included due to the uncertainty of timing of payments. |
Cash Dividends
On August 17, 2011, the Board of Directors declared a regular quarterly cash dividend of $0.05 per share (approximately $1,202,000) payable September 6, 2011 to shareholders of record on August 30, 2011. The Company’s cash dividend policy is that the indicated annual dividend rate will be set between 50% and 70% of the expected net income for the current fiscal year. Consideration will also be given by the Board to special year-end cash or stock dividends. The declaration and amount of any cash and stock dividends will be determined by the Company’s Board of Directors, in its discretion, based upon its evaluation of earnings, cash flow, capital requirements and future business developments and opportunities, including acquisitions. Accordingly, the Board established the indicated annual cash dividend rate of $0.24 per share beginning with the first quarter of fiscal 2012 consistent with the above dividend policy.
Critical Accounting Policies and Estimates
The Company is required to make estimates and judgments in the preparation of its financial statements that affect the reported amounts of assets, liabilities, revenues and expenses, and related footnote disclosures. The Company bases its estimates on historical experience and on various other assumptions that are believed to be reasonable under the circumstances, the results of which form the basis for making judgments about the carrying values of assets and liabilities. The Company continually reviews these estimates and their underlying assumptions to ensure they remain appropriate. The Company believes the items discussed below are among its most significant accounting policies because they utilize estimates about the effect of matters that are inherently uncertain and therefore are based on management’s judgment. Significant changes in the estimates or assumptions related to any of the following critical accounting policies could possibly have a material impact on the financial statements.
Revenue Recognition
Revenue is recognized when title to goods and risk of loss have passed to the customer, there is persuasive evidence of a purchase arrangement, delivery has occurred or services have been rendered, and collectibility is reasonably assured. Revenue is typically recognized at time of shipment. In certain arrangements with customers, as is the case with the sale of some of our solid-state LED video screens, revenue is recognized upon customer acceptance of the video screen at the job site. Sales are recorded net of estimated returns, rebates and discounts. Amounts received from customers prior to the recognition of revenue are accounted for as customer pre-payments and are included in accrued expenses.
The Company has four sources of revenue: revenue from product sales; revenue from installation of products; service revenue generated from providing integrated design, project and construction management, site engineering and site permitting; and revenue from shipping and handling.
Product revenue is recognized on product-only orders upon passing of title and risk of loss, generally at time of shipment. However, product revenue related to orders where the customer requires the Company to install the product is recognized when the product is installed. Other than normal product warranties or the possibility of installation or post-shipment service, support and maintenance of certain solid state LED video screens, billboards, or active digital signage, the Company has no post-shipment responsibilities.
Installation revenue is recognized when the products have been fully installed. The Company is not always responsible for installation of products it sells and has no post-installation responsibilities, other than normal warranties.
Service revenue from integrated design, project and construction management, and site permitting is recognized when all products have been installed at each individual retail site of the customer on a proportional performance basis.
Shipping and handling revenue coincides with the recognition of revenue from sale of the product.
The Company evaluates the appropriateness of revenue recognition in accordance with Accounting Standards Codification (ASC) Subtopic 605-25, Revenue Recognition: Multiple–Element Arrangements, and ASC Subtopic 985-605, Software: Revenue Recognition. Our solid-state LED video screens, billboards and active digital signage contain software elements which the Company has determined are incidental and excluded from the scope of ASC Subtopic 985-605.
Income Taxes
The Company accounts for income taxes in accordance with Accounting Standards Codification Topic 740, Income Taxes. Accordingly, deferred income taxes are provided on items that are reported as either income or expense in different time periods for financial reporting purposes than they are for income tax purposes. Deferred income tax assets and liabilities are reported on the Company’s balance sheet. Significant management judgment is required in developing the Company’s income tax provision, including the estimation of taxable income and the effective income tax rates in the multiple taxing jurisdictions in which the Company operates, the estimation of the liability for uncertain income tax positions, the determination of deferred tax assets and liabilities, and any valuation allowances that might be required against deferred tax assets.
The Company operates in multiple taxing jurisdictions and is subject to audit in these jurisdictions. The Internal Revenue Service and other tax authorities routinely review the Company’s tax returns. These audits can involve complex issues which may require an extended period of time to resolve. In management’s opinion, adequate provision has been made for potential adjustments arising from these examinations.
The Company is recording estimated interest and penalties related to potential underpayment of income taxes as a component of tax expense in the Consolidated Statements of Operations. The reserve for uncertain tax positions is not expected to change significantly in the next twelve months.
Asset Impairment
Carrying values of goodwill and other intangible assets with indefinite lives are reviewed at least annually for possible impairment in accordance with Accounting Standards Codification Topic 350, Intangibles – Goodwill and Other. The Company’s impairment review involves the estimation of the fair value of goodwill and indefinite-lived intangible assets using a combination of a market approach and an income (discounted cash flow) approach, at the reporting unit level, that requires significant management judgment with respect to revenue and expense growth rates, changes in working capital and the selection and use of an appropriate discount rate. The estimates of fair value of reporting units are based on the best information available as of the date of the assessment. The use of different assumptions would increase or decrease estimated discounted future operating cash flows and could increase or decrease an impairment charge. Company management uses its judgment in assessing whether assets may have become impaired between annual impairment tests. Indicators such as adverse business conditions, economic factors and technological change or competitive activities may signal that an asset has become impaired. Also see Note 7.
Carrying values for long-lived tangible assets and definite-lived intangible assets, excluding goodwill and indefinite-lived intangible assets, are reviewed for possible impairment as circumstances warrant as required by Accounting Standards Codification Topic 360, Property, Plant, and Equipment. Impairment reviews are conducted at the judgment of Company management when it believes that a change in circumstances in the business or external factors warrants a review. Circumstances such as the discontinuation of a product or product line, a sudden or consistent decline in the forecast for a product, changes in technology or in the way an asset is being used, a history of negative operating cash flow, or an adverse change in legal factors or in the business climate, among others, may trigger an impairment review. The Company’s initial impairment review to determine if a potential impairment charge is required is based on an undiscounted cash flow analysis at the lowest level for which identifiable cash flows exist. The analysis requires judgment with respect to changes in technology, the continued success of product lines and future volume, revenue and expense growth rates, and discount rates.
Credit and Collections
The Company maintains allowances for doubtful accounts receivable for probable estimated losses resulting from either customer disputes or the inability of its customers to make required payments. If the financial condition of the Company’s customers were to deteriorate, resulting in their inability to make the required payments, the Company may be required to record additional allowances or charges against income. The Company determines its allowance for doubtful accounts by first considering all known collectibility problems of customers’ accounts, and then applying certain percentages against the various aging categories based on the due date of the remaining receivables. The resulting allowance for doubtful accounts receivable is an estimate based upon the Company’s knowledge of its business and customer base, and historical trends. The amount ultimately not collected may differ from the reserve established, particularly in the case where percentages are applied against aging categories. In all cases, it is management’s goal to carry a reserve against the Company’s accounts receivable which is adequate based upon the information available at that time so that net accounts receivable is properly stated. The Company also establishes allowances, at the time revenue is recognized, for returns and allowances, discounts, pricing and other possible customer deductions. These allowances are based upon historical trends.
Warranty Reserves
The Company maintains a warranty reserve which is reflective of its limited warranty policy. The warranty reserve covers the estimated future costs to repair or replace defective product or installation services, whether the product is returned or it is repaired in the field. The warranty reserve is first determined based upon known claims or issues, and then by the application of a specific percentage of sales to cover general claims. The percentage applied to sales to calculate general claims is based upon historical claims as a percentage of sales. Management addresses the adequacy of its warranty reserves on a quarterly basis to ensure the reserve is accurate based upon the most current information.
Inventory Reserves
The Company maintains an inventory reserve for probable obsolescence of its inventory. The Company first determines its obsolete inventory reserve by considering specific known obsolete items, and then by applying certain percentages to specific inventory categories based upon inventory turns. The Company uses various tools, in addition to inventory turns, to identify which inventory items have the potential to become obsolete. Significant judgment is used to establish obsolescence reserves and management adjusts these reserves as more information becomes available about the ultimate disposition of the inventory item. Management values inventory at lower of cost or market.
New Accounting Pronouncements
In December 2010, the Financial Accounting Standards Board issued ASU 2010-29, "Business Combinations (Topic 805)." This amended guidance addresses the diversity in practice related to the interpretation of pro forma revenue and earnings disclosure requirements for business combinations. The objective of this update is for preparers to use a consistent method of reporting pro forma revenue and earnings as a result of a business combination. The amended guidance is for annual reporting periods beginning on or after December 15, 2010 or the Company’s fiscal year 2012. The Company will follow this guidance when it is adopted on future acquisitions.
MANAGEMENT’S REPORT ON INTERNAL CONTROL OVER FINANCIAL REPORTING
The Management of LSI Industries Inc. and subsidiaries (the “Company” or “LSI”) is responsible for the preparation and accuracy of the financial statements and other information included in this report. LSI’s Management is also responsible for establishing and maintaining adequate internal control over financial reporting, as such term is defined in Securities Exchange Act Rules 13a-15(f). Under the supervision and with the participation of Management, including LSI’s principal executive officer and principal financial officer, the Company conducted an evaluation of the effectiveness of internal control over financial reporting as of June 30, 2011, based on the criteria set forth in “Internal Control – Integrated Framework” issued by the Committee of Sponsoring Organizations of the Treadway Commission.
A control system, no matter how well conceived and operated, can provide only reasonable assurance that the objectives of the control system are met. Because of the inherent limitations in all control systems, no evaluation of controls can provide absolute assurance that all control issues and instances of fraud, if any, have been detected. These inherent limitations include the reality that judgments in decision making can be faulty, the possibility of human error, and the circumvention or overriding of the controls and procedures.
In meeting its responsibility for the reliability of the financial statements, the Company depends upon its system of internal accounting controls. The system is designed to provide reasonable assurance that assets are safeguarded and that transactions are properly authorized and recorded. The system is supported by policies and guidelines, and by careful selection and training of financial management personnel. The Company also has a Disclosure Controls Committee, whose responsibility is to help ensure appropriate disclosures and presentation of the financial statements and notes thereto. Additionally, the Company has an Internal Audit Department to assist in monitoring compliance with financial policies and procedures.
The Board of Directors meets its responsibility for overview of the Company’s financial statements through its Audit Committee which is composed entirely of independent Directors who are not employees of the Company. The Audit Committee meets periodically with Management and Internal Audit to review and assess the activities of each in meeting their respective responsibilities. Grant Thornton LLP has full access to the Audit Committee to discuss the results of their audit work, the adequacy of internal accounting controls, and the quality of financial reporting.
Based upon LSI’s evaluation, the Company’s principal executive officer and principal financial officer concluded that internal control over financial reporting was effective as of June 30, 2011. We reviewed the results of Management’s assessment with the Audit Committee of our Board of Directors. Additionally, our independent registered public accounting firm audited and independently assessed the effectiveness of the Company’s internal control over financial reporting. Grant Thornton LLP, an independent registered public accounting firm has issued an attestation report on the effectiveness of the Company’s internal control over financial reporting, which is presented in the financial statements.
Robert J. Ready
President and Chief Executive Officer
(Principal Executive Officer)
Ronald S. Stowell
Vice President, Chief Financial Officer, and Treasurer
(Principal Financial Officer)
REPORT OF INDEPENDENT REGISTERED PUBLIC ACCOUNTING FIRM
To the Board of Directors and Shareholders of
LSI Industries Inc.
We have audited LSI Industries Inc. (an Ohio corporation) and subsidiaries’ (the “Company”) internal control over financial reporting as of June 30, 2011, based on criteria established in Internal Control — Integrated Framework issued by the Committee of Sponsoring Organizations of the Treadway Commission (COSO). The Company’s management is responsible for maintaining effective internal control over financial reporting and for its assessment of the effectiveness of internal control over financial reporting, included in the accompanying Management’s Report On Internal Control Over Financial Reporting. Our responsibility is to express an opinion on the Company’s internal control over financial reporting based on our audit.
We conducted our audit in accordance with the standards of the Public Company Accounting Oversight Board (United States). Those standards require that we plan and perform the audit to obtain reasonable assurance about whether effective internal control over financial reporting was maintained in all material respects. Our audit included obtaining an understanding of internal control over financial reporting, assessing the risk that a material weakness exists, testing and evaluating the design and operating effectiveness of internal control based on the assessed risk, and performing such other procedures as we considered necessary in the circumstances. We believe that our audit provides a reasonable basis for our opinion.
A company’s internal control over financial reporting is a process designed to provide reasonable assurance regarding the reliability of financial reporting and the preparation of financial statements for external purposes in accordance with generally accepted accounting principles. A company’s internal control over financial reporting includes those policies and procedures that (1) pertain to the maintenance of records that, in reasonable detail, accurately and fairly reflect the transactions and dispositions of the assets of the company; (2) provide reasonable assurance that transactions are recorded as necessary to permit preparation of financial statements in accordance with generally accepted accounting principles, and that receipts and expenditures of the company are being made only in accordance with authorizations of management and directors of the company; and (3) provide reasonable assurance regarding prevention or timely detection of unauthorized acquisition, use, or disposition of the company’s assets that could have a material effect on the financial statements. Because of its inherent limitations, internal control over financial reporting may not prevent or detect misstatements. Also, projections of any evaluation of effectiveness to future periods are subject to the risk that controls may become inadequate because of changes in conditions, or that the degree of compliance with the policies or procedures may deteriorate. In our opinion, LSI Industries Inc. and subsidiaries maintained, in all material respects, effective internal control over financial reporting as of June 30, 2011, based on criteria established in Internal Control — Integrated Framework issued by COSO.
We also have audited, in accordance with the standards of the Public Company Accounting Oversight Board (United States), the consolidated balance sheets as of June 30, 2011 and 2010, and the related consolidated statements of operations, shareholders’ equity, cash flows, and financial statement schedule as of and for the years ended June 30, 2011 and 2010 of the Company, and our report dated August 26, 2011 expressed an unqualified opinion on those financial statements and financial statement schedule.
/s/ Grant Thornton LLP
Cincinnati, Ohio
August 26, 2011
REPORT OF INDEPENDENT REGISTERED PUBLIC ACCOUNTING FIRM
To the Board of Directors and Shareholders of
LSI Industries Inc.
We have audited the accompanying consolidated balance sheets of LSI Industries Inc. (an Ohio corporation) and subsidiaries (the “Company”) as of June 30, 2011 and 2010, and the related consolidated statements of operations, shareholders’ equity, and cash flows for the years ended June 30, 2011 and 2010. Our audits of the basic consolidated financial statements included the financial statement schedule for the years ended June 30, 2011 and 2010 listed in the index appearing under Item 15. These financial statements and financial statement schedule are the responsibility of the Company’s management. Our responsibility is to express an opinion on these financial statements and financial statement schedule based on our audits.
We conducted our audits in accordance with the standards of the Public Company Accounting Oversight Board (United States). Those standards require that we plan and perform the audit to obtain reasonable assurance about whether the financial statements are free of material misstatement. An audit includes examining, on a test basis, evidence supporting the amounts and disclosures in the financial statements. An audit also includes assessing the accounting principles used and significant estimates made by management, as well as evaluating the overall financial statement presentation. We believe that our audits provide a reasonable basis for our opinion.
In our opinion, the consolidated financial statements referred to above present fairly, in all material respects, the financial position of LSI Industries Inc. and subsidiaries as of June 30, 2011 and 2010, and the results of their operations and their cash flows for the years ended June 30, 2011 and 2010 in conformity with accounting principles generally accepted in the United States of America. Also in our opinion, the related financial statement schedule, when considered in relation to the basic consolidated financial statements taken as a whole, presents fairly, in all material respects, the information set forth therein.
We also have audited, in accordance with the standards of the Public Company Accounting Oversight Board (United States), the Company’s internal control over financial reporting as of June 30, 2011, based on criteria established in Internal Control—Integrated Framework issued by the Committee of Sponsoring Organizations of the Treadway Commission (COSO) and our report dated August 26, 2011 expressed an unqualified opinion.
/s/ Grant Thornton LLP
Cincinnati, Ohio
August 26, 2011
REPORT OF INDEPENDENT REGISTERED PUBLIC ACCOUNTING FIRM
To the Board of Directors and Shareholders of
LSI Industries Inc.
Cincinnati, Ohio
We have audited the accompanying consolidated statements of operations, shareholders’ equity, and cash flows of LSI Industries Inc. and subsidiaries for the year ended June 30, 2009. Our audit also included the consolidated financial statement schedule listed in the Index at Item 15 for the year ended June 30, 2009. These consolidated financial statements and financial statement schedule are the responsibility of the Company’s management. Our responsibility is to express an opinion on these financial statements and financial statement schedule based on our audit.
We conducted our audit in accordance with the standards of the Public Company Accounting Oversight Board (United States). Those standards require that we plan and perform the audit to obtain reasonable assurance about whether the financial statements are free of material misstatement. An audit includes examining, on a test basis, evidence supporting the amounts and disclosures in the financial statements. An audit also includes assessing the accounting principles used and significant estimates made by management, as well as evaluating the overall financial statement presentation. We believe that our audit provides a reasonable basis for our opinion.
In our opinion, such consolidated financial statements present fairly, in all material respects, the results of LSI Industries Inc. and subsidiaries’ operations and their cash flows for the year ended June 30, 2009, in conformity with accounting principles generally accepted in the United States of America. Also, in our opinion, such consolidated financial statement schedule for the year ended June 30, 2009, when considered in relation to the basic consolidated financial statements taken as a whole, presents fairly, in all material respects, the information set forth therein.
As discussed in Note 2 to the consolidated financial statements, the disclosures in the accompanying 2009 financial statements have been retrospectively adjusted for a change in the composition of reportable segments.
/s/ Deloitte & Touche LLP
Cincinnati, Ohio
September 11, 2009 (August 26, 2011 as to the 2009 segment information in Note 2)
LSI INDUSTRIES INC.
CONSOLIDATED STATEMENTS OF OPERATIONS For the years ended June 30, 2011, 2010, and 2009
(In thousands, except per share data)
| | | | | | | | | | | | | |
| | | 2011 | | | 2010 | | | 2009 | |
| | | | | | | | | | | | | |
| Net sales | | $ | 293,501 | | | $ | 254,402 | | | $ | 233,799 | |
| | | | | | | | | | | | | |
| Cost of products and services sold | | | 221,156 | | | | 198,030 | | | | 181,972 | |
| | | | | | | | | | | | | |
| Loss on sale of subsidiary | | | — | | | | 639 | | | | — | |
| | | | | | | | | | | | | |
| Total cost of products and services sold | | | 221,156 | | | | 198,669 | | | | 181,972 | |
| | | | | | | | | | |
| Gross profit | | | 72,345 | | | | 55,733 | | | | 51,827 | |
| | | | | | | | | | | | | |
| Selling and administrative expenses | | | 56,041 | | | | 53,671 | | | | 51,571 | |
| | | | | | | | | | | | | |
| Loss contingency (see Note 14) | | | — | | | | — | | | | 200 | |
| | | | | | | | | | | | | |
| Goodwill and intangible asset impairments | | | — | | | | 153 | | | | 14,467 | |
| | | | | | | | | | |
| Operating income (loss) | | | 16,304 | | | | 1,909 | | | | (14,411 | ) |
| | | | | | | | | | | | | |
| Interest (income) | | | (43 | ) | | | (28 | ) | | | (97 | ) |
| | | | | | | | | | | | | |
| Interest expense | | | 180 | | | | 153 | | | | 89 | |
| | | | | | | | | | |
| Income (loss) before income taxes | | | 16,167 | | | | 1,784 | | | | (14,403 | ) |
| | | | | | | | | | | | | |
| Income tax expense (benefit) | | | 5,339 | | | | 360 | | | | (989 | ) |
| | | | | | | | | | |
| Net income (loss) | | $ | 10,828 | | | $ | 1,424 | | | $ | (13,414 | ) |
| | | | | | | | | | |
| Earnings (loss) per common share (see Note 4) | | | | | | | | | | | | |
| | | | | | | | | | | | | |
| Basic | | $ | 0.45 | | | $ | 0.06 | | | $ | (0.62 | ) |
| | | | | | | | | | |
| Diluted | | $ | 0.44 | | | $ | 0.06 | | | $ | (0.62 | ) |
| | | | | | | | | | |
| Weighted average common shares outstanding | | | | | | | | | | | | |
| | | | | | | | | | | | | |
| Basic | | | 24,287 | | | | 24,128 | | | | 21,800 | |
| | | | | | | | | | |
| Diluted | | | 24,339 | | | | 24,134 | | | | 21,800 | |
The accompanying notes are an integral part of these financial statements.
LSI INDUSTRIES INC.
CONSOLIDATED BALANCE SHEETS June 30, 2011 and 2010
(In thousands, except shares)
| | | | | | | | | |
| | | 2011 | | | 2010 | |
| | | | | | | | | |
| ASSETS | | | | | | | | |
| | | | | | | | | |
| Current Assets | | | | | | | | |
| | | | | | | | | |
| Cash and cash equivalents | | $ | 4,056 | | | $ | 17,417 | |
| | | | | | | | | |
| Accounts and notes receivable, less allowance for doubtful accounts of $826 and $399, respectively | | | 44,974 | | | | 35,254 | |
| | | | | | | | | |
| Inventories | | | 50,298 | | | | 40,082 | |
| | | | | | | | | |
| Refundable income taxes | | | 1,795 | | | | 1,146 | |
| | | | | | | | | |
| Other current assets | | | 4,977 | | | | 5,512 | |
| | | | | | | | | |
| Total current assets | | | 106,100 | | | | 99,411 | |
| | | | | | | | | |
| Property, Plant and Equipment, at cost | | | | | | | | |
| Land | | | 6,848 | | | | 6,784 | |
| Buildings | | | 37,228 | | | | 36,148 | |
| Machinery and equipment | | | 68,064 | | | | 65,507 | |
| Construction in progress | | | 427 | | | | 434 | |
| | | | 112,567 | | | | 108,873 | |
| Less accumulated depreciation | | | (68,283 | ) | | | (63,962 | ) |
| Net property, plant and equipment | | | 44,284 | | | | 44,911 | |
| | | | | | | | | |
| Goodwill, net | | | 10,766 | | | | 10,766 | |
| | | | | | | | | |
| Other Intangible Assets, net | | | 12,514 | | | | 15,103 | |
| | | | | | | | | |
| Other Long-Term Assets, net | | | 2,357 | | | | 3,654 | |
| | | | | | | | | |
| Total assets | | $ | 176,021 | | | $ | 173,845 | |
The accompanying notes are an integral part of these financial statements.
| | | 2011 | | | 2010 | |
| | | | | | | | | |
| LIABILITIES & SHAREHOLDERS’ EQUITY | | | | | | | | |
| | | | | | | | | |
| Current Liabilities | | | | | | | | |
| Current maturities of long-term debt | | $ | 35 | | | $ | 33 | |
| Accounts payable | | | 9,568 | | | | 12,553 | |
| Accrued expenses | | | 11,973 | | | | 13,257 | |
| | | | | | | | | |
| Total current liabilities | | | 21,576 | | | | 25,843 | |
| | | | | | | | | |
| Other Long-Term Liabilities | | | 3,227 | | | | 3,784 | |
| | | | | | | | | |
| Commitments and contingencies (Note 14) | | | — | | | | — | |
| | | | | | | | | |
| Shareholders’ Equity | | | | | | | | |
| Preferred shares, without par value; | | | | | | | | |
| Authorized 1,000,000 shares, none issued | | | — | | | | — | |
| Common shares, without par value; | | | | | | | | |
| Authorized 40,000,000 shares; | | | | | | | | |
| Outstanding 24,047,485 and 24,054,213 shares, respectively | | | 100,944 | | | | 99,963 | |
| Retained earnings | | | 50,274 | | | | 44,255 | |
| | | | | | | |
| Total shareholders’ equity | | | 151,218 | | | | 144,218 | |
| | | | | | | |
| Total liabilities & shareholders’ equity | | $ | 176,021 | | | $ | 173,845 | |
The accompanying notes are an integral part of these financial statements.
LSI INDUSTRIES INC.
CONSOLIDATED STATEMENTS OF SHAREHOLDERS’ EQUITY For the years ended June 30, 2011, 2010, and 2009
(In thousands, except per share data)
| | | | | | | | | | | | | | | | | |
| | | Common Shares | | | | | | | |
| | | Number of | | | | | | | Retained | | | | |
| | | Shares | | | Amount | | | Earnings | | | Total | |
| | | | | | | | | | | | | | | | | |
| | | | | | | | | | | | | | | | | |
| Balance at June 30, 2008 | | | 21,585 | | | $ | 81,665 | | | $ | 67,525 | | | $ | 149,190 | |
| | | | | | | | | | | | | | | | | |
| Net (loss) | | | — | | | | — | | | | (13,414 | ) | | | (13,414 | ) |
| Stock compensation awards | | | 6 | | | | 41 | | | | — | | | | 41 | |
| Purchase of treasury shares, net | | | (11 | ) | | | (29 | ) | | | — | | | | (29 | ) |
| Deferred stock compensation | | | — | | | | (28 | ) | | | — | | | | (28 | ) |
| Stock option expense | | | — | | | | 1,184 | | | | — | | | | 1,184 | |
| Stock options exercised, net | | | — | | | | — | | | | — | | | | — | |
| Dividends — $0.30 per share | | | — | | | | — | | | | (6,471 | ) | | | (6,471 | ) |
| | | | | | | | | | | | | |
| Balance at June 30, 2009 | | | 21,580 | | | | 82,833 | | | | 47,640 | | | | 130,473 | |
| | | | | | | | | | | | | | | | | |
| Net income | | | — | | | | — | | | | 1,424 | | | | 1,424 | |
| Stock compensation awards | | | 7 | | | | 46 | | | | — | | | | 46 | |
| Purchase of treasury shares, net | | | (2 | ) | | | 52 | | | | — | | | | 52 | |
| Deferred stock compensation | | | — | | | | (49 | ) | | | — | | | | (49 | ) |
| Stock option expense | | | — | | | | 2,633 | | | | — | | | | 2,633 | |
| Stock options exercised, net | | | — | | | | — | | | | — | | | | — | |
| Common shares issued for acquisition | | | 2,469 | | | | 14,448 | | | | — | | | | 14,448 | |
| Dividends — $0.20 per share | | | — | | | | — | | | | (4,809 | ) | | | (4,809 | ) |
| | | | | | | | | | | | | |
| Balance at June 30, 2010 | | | 24,054 | | | | 99,963 | | | | 44,255 | | | | 144,218 | |
| | | | | | | | | | | | | | | | | |
| Net income | | | — | | | | — | | | | 10,828 | | | | 10,828 | |
| Stock compensation awards | | | 6 | | | | 41 | | | | — | | | | 41 | |
| Purchase of treasury shares, net | | | (20 | ) | | | (96 | ) | | | — | | | | (96 | ) |
| Deferred stock compensation | | | — | | | | 126 | | | | — | | | | 126 | |
| Stock option expense | | | — | | | | 851 | | | | — | | | | 851 | |
| Stock options exercised, net | | | 7 | | | | 59 | | | | — | | | | 59 | |
| Dividends — $0.20 per share | | | — | | | | — | | | | (4,809 | ) | | | (4,809 | ) |
| | | | | | | | | | | | | |
| Balance at June 30, 2011 | | | 24,047 | | | $ | 100,944 | | | $ | 50,274 | | | $ | 151,218 | |
The accompanying notes are an integral part of these financial statements.
LSI INDUSTRIES INC.
CONSOLIDATED STATEMENTS OF CASH FLOWS For the years ended June 30, 2011, 2010, and 2009
(In thousands)
| | | 2011 | | | 2010 | | | 2009 | |
| Cash Flows From Operating Activities | | | | | | | | | | | | |
| Net income (loss) | | $ | 10,828 | | | $ | 1,424 | | | $ | (13,414 | ) |
| | | | | | | | | | | | | |
| Non-cash items included in net income (loss) | | | | | | | | | | | | |
| Depreciation and amortization | | | 7,877 | | | | 7,849 | | | | 7,746 | |
| Loss on sale of a subsidiary | | | — | | | | 639 | | | | — | |
| Goodwill and intangible asset impairment | | | — | | | | 153 | | | | 14,467 | |
| Deferred income taxes | | | 1,003 | | | | (1,564 | ) | | | 1,001 | |
| Deferred compensation plan | | | 126 | | | | (49 | ) | | | (28 | ) |
| Stock option expense | | | 851 | | | | 2,633 | | | | 1,184 | |
| Issuance of common shares as compensation | | | 41 | | | | 46 | | | | 41 | |
| Loss on disposition of fixed assets | | | 15 | | | | 41 | | | | 36 | |
| Allowance for doubtful accounts | | | 427 | | | | (142 | ) | | | (53 | ) |
| Inventory obsolescence reserve | | | 276 | | | | 176 | | | | (228 | ) |
| | | | | | | | | | | | | |
| Change in certain assets and liabilities, net of acquisition | | | | | | | | | | | | |
| Accounts and notes receivable | | | (10,147 | ) | | | (3,751 | ) | | | 9,229 | |
| Inventories | | | (10,492 | ) | | | 2,826 | | | | 10,541 | |
| Refundable income taxes | | | (649 | ) | | | 2,473 | | | | (1,785 | ) |
| Accounts payable | | | (2,985 | ) | | | 2,487 | | | | (6,203 | ) |
| Accrued expenses and other | | | 645 | | | | 1,071 | | | | (6,044 | ) |
| Customer prepayments | | | (1,622 | ) | | | 417 | | | | (4 | ) |
| | | | | | | | | | |
| Net cash flows provided by (used in) operating activities | | | (3,806 | ) | | | 16,729 | | | | 16,486 | |
| | | | | | | | | | |
| | | | | | | | | | | | | |
| Cash Flows From Investing Activities | | | | | | | | | | | | |
| Purchases of property, plant, and equipment | | | (4,731 | ) | | | (6,150 | ) | | | (2,994 | ) |
| Proceeds from sale of fixed assets | | | 55 | | | | 521 | | | | 2 | |
| Acquisition of a business, net of cash received | | | — | | | | (675 | ) | | | — | |
| | | | | | | | | | |
| Net cash flows (used in) investing activities | | | (4,676 | ) | | | (6,304 | ) | | | (2,992 | ) |
| | | | | | | | | | |
| | | | | | | | | | | | | |
| Cash Flows From Financing Activities | | | | | | | | | | | | |
| Payment of long-term debt | | | (33 | ) | | | (2,237 | ) | | | (1,282 | ) |
| Proceeds from issuance of long-term debt | | | — | | | | — | | | | 1,282 | |
| Cash dividends paid | | | (4,809 | ) | | | (4,809 | ) | | | (6,471 | ) |
| Purchase of treasury shares | | | (118 | ) | | | (111 | ) | | | (188 | ) |
| Issuance of treasury shares | | | 22 | | | | 163 | | | | 159 | |
| Exercise of stock options | | | 59 | | | | — | | | | — | |
| | | | | | | | | | |
| Net cash flows (used in) financing activities | | | (4,879 | ) | | | (6,994 | ) | | | (6,500 | ) |
| | | | | | | | | | |
| | | | | | | | | | | | | |
| Increase (decrease) in cash and cash equivalents | | | (13,361 | ) | | | 3,431 | | | | 6,994 | |
| | | | | | | | | | | | | |
| Cash and cash equivalents at beginning of year | | | 17,417 | | | | 13,986 | | | | 6,992 | |
| | | | | | | | | | |
| Cash and cash equivalents at end of year | | $ | 4,056 | | | $ | 17,417 | | | $ | 13,986 | |
The accompanying notes are an integral part of these financial statements.
NOTES TO CONSOLIDATED FINANCIAL STATEMENTS
NOTE 1 — SUMMARY OF SIGNIFICANT ACCOUNTING POLICIES
Consolidation:
The consolidated financial statements include the accounts of LSI Industries Inc. (an Ohio corporation) and its subsidiaries (the “Company”), all of which are wholly owned. All intercompany transactions and balances have been eliminated in consolidation.
Revenue Recognition:
Revenue is recognized when title to goods and risk of loss have passed to the customer, there is persuasive evidence of a purchase arrangement, delivery has occurred or services have been rendered, and collectibility is reasonably assured. Revenue from product sales is typically recognized at time of shipment. In certain arrangements with customers, as is the case with the sale of some of our solid-state LED (light emitting diode) video screens, revenue is recognized upon customer acceptance of the video screen at the job site. Sales are recorded net of estimated returns, rebates and discounts. Amounts received from customers prior to the recognition of revenue are accounted for as customer pre-payments and are included in accrued expenses.
The Company has four sources of revenue: revenue from product sales; revenue from installation of products; service revenue generated from providing integrated design, project and construction management, site engineering and site permitting; and revenue from shipping and handling.
Product revenue is recognized on product-only orders upon passing of title and risk of loss, generally at time of shipment. However, product revenue related to orders where the customer requires the Company to install the product is recognized when the product is installed. Other than normal product warranties or the possibility of installation or post-shipment service, support and maintenance of certain solid state LED video screens, billboards, or active digital signage, the Company has no post-shipment responsibilities.
Installation revenue is recognized when the products have been fully installed. The Company is not always responsible for installation of products it sells and has no post-installation responsibilities, other than normal warranties.
Service revenue from integrated design, project and construction management, and site permitting is recognized when all products have been installed at each individual retail site of the customer on a proportional performance basis.
Shipping and handling revenue coincides with the recognition of revenue from sale of the product.
The Company evaluates the appropriateness of revenue recognition in accordance with Accounting Standards Codification (ASC) Subtopic 605-25, Revenue Recognition: Multiple–Element Arrangements, and ASC Subtopic 985-605, Software: Revenue Recognition. Our solid-state LED video screens, billboards and active digital signage contain software elements which the Company has determined are incidental and essential to the functionality of the tangible product and are thus excluded from the scope of ASC Subtopic 985-605.
Credit and Collections:
The Company maintains allowances for doubtful accounts receivable for probable estimated losses resulting from either customer disputes or the inability of its customers to make required payments. If the financial condition of the Company’s customers were to deteriorate, resulting in their inability to make the required payments, the Company may be required to record additional allowances or charges against income. The Company determines its allowance for doubtful accounts by first considering all known collectibility problems of customers’ accounts, and then applying certain percentages against the various aging categories based on the due date of the remaining receivables. The resulting allowance for doubtful accounts receivable is an estimate based upon the Company’s knowledge of its business and customer base, and historical trends. The Company also establishes allowances, at the time revenue is recognized, for returns, discounts, pricing and other possible customer deductions. These allowances are based upon historical trends.
The following table presents the Company’s net accounts and notes receivable at the dates indicated.
| | | June 30, | | | June 30, | |
| (In thousands) | | 2011 | | | 2010 | |
| Accounts and notes receivable | | $ | 45,800 | | | $ | 35,653 | |
| less Allowance for doubtful accounts | | | (826 | ) | | | (399 | ) |
| Accounts and notes receivable, net | | $ | 44,974 | | | $ | 35,254 | |
Cash and Cash Equivalents:
The cash balance includes cash and cash equivalents which have original maturities of less than three months. The Company maintains balances at financial institutions in the United States and Canada. The balances at financial institutions in Canada are not covered by insurance. As of June 30, 2011 and 2010, the Company had bank balances of $1,235,000 and $18,561,000, respectively, in excess of FDIC insured limits and therefore without insurance coverage.
Inventories:
Inventories are stated at the lower of cost or market. Cost is determined on the first-in, first-out basis.
Property, Plant and Equipment and Related Depreciation:
Property, plant and equipment are stated at cost. Major additions and betterments are capitalized while maintenance and repairs are expensed. For financial reporting purposes, depreciation is computed on the straight-line method over the estimated useful lives of the assets as follows:
| Buildings | 28 - 40 years |
| Machinery and equipment | 3 - 10 years |
| Computer software | 3 - 8 years |
Costs related to the purchase, internal development, and implementation of the Company’s fully integrated enterprise resource planning/business operating software system are either capitalized or expensed in accordance with ASC Subtopic 350-40, Intangibles – Goodwill and Other: Internal-Use Software. Leasehold improvements are depreciated over the shorter of fifteen years or the remaining term of the lease.
The following table presents the Company’s property, plant and equipment at the dates indicated.
| | | | | | | | | |
| | | June 30, | | | June 30, | |
| (In thousands) | | 2011 | | | 2010 | |
| Property, plant and equipment, at cost | | $ | 112,567 | | | $ | 108,873 | |
| less Accumulated depreciation | | | (68,283 | ) | | | (63,962 | ) |
| Property, plant and equipment, net | | $ | 44,284 | | | $ | 44,911 | |
The Company recorded $5,288,000, $5,294,000 and $5,667,000 of depreciation expense in the years ended June 30, 2011, 2010 and 2009, respectively.
Intangible Assets:
Intangible assets consisting of customer relationships, trade names and trademarks, patents, technology and software, and non-compete agreements are recorded on the Company's balance sheet. The definite-lived intangible assets are being amortized to expense over periods ranging between two and twenty years. The Company periodically evaluates definite-lived intangible assets for permanent impairment. Neither indefinite-lived intangible assets nor the excess of cost over fair value of assets acquired ("goodwill") are amortized, however they are subject to review for impairment. See additional information about goodwill and intangibles in Note 7.
Fair Value of Financial Instruments:
The Company has financial instruments consisting primarily of cash and cash equivalents, revolving lines of credit, and long-term debt. The fair value of these financial instruments approximates carrying value because of their short-term maturity and/or variable, market-driven interest rates. The Company has no financial instruments with off-balance sheet risk.
Product Warranties:
The Company offers a limited warranty that its products are free of defects in workmanship and materials. The specific terms and conditions vary somewhat by product line, but generally cover defective products returned within one to five years from the date of shipment. The Company records warranty liabilities to cover the estimated future costs for repair or replacement of defective returned products as well as products that need to be repaired or replaced in the field after installation. The Company calculates its liability for warranty claims by applying estimates to cover unknown claims, as well as estimating the total amount to be incurred for known warranty issues. The Company periodically assesses the adequacy of its recorded warranty liabilities and adjusts the amounts as necessary.
Changes in the Company’s warranty liabilities, which are included in accrued expenses in the accompanying consolidated balance sheets, during the periods indicated below were as follows:
| | | | | | | | | |
| | | Twelve | | | Twelve | |
| | | Months Ended | | | Months Ended | |
| | | June 30, | | | June 30, | |
| (In thousands) | | 2011 | | | 2010 | |
| Balance at beginning of the period | | $ | 589 | | | $ | 223 | |
| Additions charged to expense | | | 1,606 | | | | 1,870 | |
| Addition from acquisition | | | -- | | | | 5 | |
| Deductions for repairs and replacements | | | (1,533 | ) | | | (1,509 | ) |
| Balance at end of the period | | $ | 662 | | | $ | 589 | |
Employee Benefit Plans:
The Company has a defined contribution retirement plan and a discretionary profit sharing plan covering substantially all of its non-union employees in the United States, and a non-qualified deferred compensation plan covering certain employees. The costs of employee benefit plans are charged to expense and funded annually. Total costs were $941,000 in 2011, $943,000 in 2010, and $1,592,000 in 2009.
Research and Development Costs:
Research and development expenses are costs directly attributable to new product development, including the development of new technology for both existing and new products, and consist of salaries, payroll taxes, employee benefits, materials, supplies, depreciation and other administrative costs. All costs are expensed as incurred and are classified as operating expenses. The Company follows the requirements of ASC Subtopic 985-20, Software: Costs of Software to be Sold, Leased, or Marketed, by expensing as research and development all costs associated with development of software used in solid-state LED products. Research and development costs related to both product and software development totaled $5,162,000, $5,148,000, and $4,052,000 for fiscal years ended June 30, 2011, 2010 and 2009, respectively, and are included in selling and administrative expenses.
Advertising Expense:
The Company recorded $397,000, $281,000, and $301,000 of advertising expense in 2011, 2010 and 2009, respectively. Advertising costs are expensed the first time the advertising occurs. Expense related to printed product or capabilities literature, brochures, etc. is recorded on a ratable basis over the useful life of that printed media.
Earnings Per Common Share:
The computation of basic earnings per common share is based on the weighted average common shares outstanding for the period net of treasury shares held in the Company’s non-qualified deferred compensation plan. The computation of diluted earnings per share is based on the weighted average common shares outstanding for the period and includes common share equivalents. Common share equivalents include the dilutive effect of stock options, contingently issuable shares and common shares to be issued under a deferred compensation plan, all of which totaled 293,000 shares in 2011, 238,000 shares in 2010 and 226,000 shares in 2009. See further discussion in Note 4.
Stock Options:
The Company measures the cost of employee services received in exchange for an award of equity instruments at the grant date, based on the fair value of the award and recognizes this cost over the period during which an employee is required to provide the services.
The Company recorded $2,300 in fiscal 2011 as a reduction of federal income taxes payable, $58,800 as an increase in common stock, and $2,300 as a reduction of income tax expense to reflect the tax credits it will receive as a result of disqualifying dispositions of shares from stock option exercises. This had the effect of increasing cash flow from financing activities by $58,800. See further discussion in Note 10. There were no disqualifying dispositions of shares from stock option exercises in fiscal years 2010 or 2009.
New Accounting Pronouncements:
In October 2009, the Financial Accounting Standards Board issued ASU 2009-14, "Certain Revenue Arrangements That Include Software Elements." This amended guidance clarifies when revenue can be recognized when tangible products contain both software and non-software components in a multiple deliverable arrangement. This update was effective for revenue arrangements entered into or materially modified in fiscal years beginning on or after June 15, 2010. The Company adopted the amended guidance on July 1, 2010. There was no impact on the consolidated results of operations, cash flows or financial position as a result of the amended guidance.
In October 2009, the Financial Accounting Standards Board issued ASU 2009-13, "Multiple Deliverable Revenue Arrangements." This amended guidance enables companies to account for products or service (deliverables) separately rather than as a combined unit in certain circumstances. Accounting Standards Codification Subtopic 605-25, Revenue Recognition: Multiple-Element Arrangements, established the accounting and reporting guidance for arrangements under which the vendor will perform multiple revenue-generating activities. The Subtopic addresses how to separate deliverables and how to measure and allocate arrangement consideration to one or more units of accounting. The amended guidance was effective for revenue arrangements entered into or materially modified in fiscal years beginning on or after June 15, 2010. The Company adopted the amended guidance on July 1, 2010. There was no impact on the consolidated results of operations, cash flows or financial position as a result of the amended guidance.
Comprehensive Income:
The Company does not have any comprehensive income items other than net income.
Subsequent Events:
The Company has evaluated subsequent events for potential recognition and disclosure through the date the consolidated financial statements were filed. No items were identified during this evaluation that required adjustment to or disclosure in the accompanying financial statements.
Reclassifications:
Certain reclassifications may have been made to prior year amounts in order to be consistent with the presentation for the current year. For segment reporting, the Technology Segment has been reclassified into the All Other Category, and Corporate and Eliminations has been separately stated. See further discussion in Note 2.
Use of Estimates:
The preparation of the financial statements in conformity with accounting principles generally accepted in the United States of America requires the Company to make estimates and assumptions that affect the amounts reported in the financial statements and accompanying notes. Actual results could differ from those estimates.
NOTE 2 — BUSINESS SEGMENT INFORMATION
Accounting Standards Codification Topic 280, Segment Reporting, establishes standards for reporting information regarding operating segments in annual financial statements and requires selected information of those segments to be presented in interim financial statements. Operating segments are identified as components of an enterprise for which separate discrete financial information is available for evaluation by the chief operating decision maker (the Company’s Chief Executive Officer) in making decisions on how to allocate resources and assess performance. While the Company has twelve operating segments, it has only three reportable operating business segments (Lighting, Graphics, and Electronic Components), an All Other Category, and Corporate and Eliminations.
The Company made changes to its reportable business segments in fiscal 2011. The Technology Segment was reclassified into the All Other Category because there were no quantitative measures or qualitative factors that required the operating results of LSI Saco Technologies to be reported in a separate business segment. The Company also reclassified its Corporate Administration and intercompany eliminations out of the All Other Category and into a separate line item in the business segment disclosures because this presents a more appropriate disclosure of operating income (loss) of the All Other Category. Additionally, the Company reclassified an indefinite lived trade name intangible asset and its related intercompany royalty income from the Corporate Administration balance sheet and operating results to the balance sheet and operating results of the Lighting Segment. Also, certain definite lived LED technology intangible assets and related amortization expenses were reclassified from the Corporate Administration balance sheet and operating results to the balance sheets and operating results of the Lighting Segment and the Graphics Segment. All intersegment royalty income related to these LED technology intangible assets has been reclassified from the Corporate Administration operating results to the Graphics Segment operating results. The changes described in this paragraph were made for all reported periods in these financial statements, and they had no impact on the Company’s consolidated results.
The Lighting Segment includes outdoor, indoor, and landscape lighting that has been fabricated and assembled for the commercial, industrial and multi-site retail lighting markets, including the petroleum/convenience store market. The Lighting Segment includes the operations of LSI Ohio Operations, LSI Metal Fabrication, LSI MidWest Lighting, LSI Lightron and LSI Greenlee Lighting. These operations have been integrated, have similar economic characteristics and meet the other requirements for aggregation in segment reporting. The LSI Greenlee facility in Dallas, Texas was consolidated into the Company’s main lighting facility in Ohio in the second quarter of fiscal 2011.
The Graphics Segment designs, manufactures and installs exterior and interior visual image elements related to image programs, solid state LED digital advertising billboards, and solid state LED digital sports video screens (LED video screens are designed and manufactured by the Company’s Lighting Segment and by LSI Saco in the All Other Category). These products are used in visual image programs in several markets, including the petroleum/convenience store market, multi-site retail operations, sports and advertising. The Graphics Segment includes the operations of Grady McCauley, LSI Retail Graphics and LSI Integrated Graphic Systems, which have been aggregated as such facilities manufacture two-dimensional graphics with the use of screen and digital printing, fabricate three-dimensional structural graphics sold in the multi-site retail and petroleum/convenience store markets, and each exhibit similar economic characteristics and meet the other requirements for aggregation in segment reporting.
The Electronic Components Segment designs, engineers and manufactures custom designed electronic circuit boards, assemblies and sub-assemblies used in various applications including the control of solid-state LED lighting. Capabilities of this segment also have applications in the Company’s other LED product lines such as digital scoreboards, advertising ribbon boards and billboards. The Electronic Components Segment includes the operations of LSI ADL Technology.
The All Other Category includes the Company’s operating segments that neither meet the aggregation criteria, nor the criteria to be a separate reportable segment. Operations of LSI Images (menu board systems) and LSI Adapt (surveying, permitting and installation management services related to products of the Graphics Segment) are combined in the All Other Category. Operations of LSI Marcole (electrical wire harnesses) are included in the All Other Category, although this business was sold in March 2010. Additionally, operations of LSI Saco Technologies (designs and produces high-performance light engines, large format video screens using solid-state LED technology, and certain specialty LED lighting) are included in the All Other Category.
The Company’s Corporate Administration activities are reported in a line item titled Corporate and Eliminations. This primarily includes intercompany profit in inventory eliminations, expense related to certain corporate officers and support staff, the Company’s internal audit staff, the Company’s Board of Directors, stock option expense, certain consulting expenses, investor relations activities, a portion of the Company’s legal, auditing and professional fee expenses, and certain research and development expense. Corporate identifiable assets primarily consist of cash, invested cash (if any), refundable income taxes, and deferred income tax assets.
Summarized financial information for the Company’s reportable business segments is provided for the following periods and as of June 30, 2011, June 30, 2010 and June 30, 2009:
| (In thousands) | | 2011 | | | 2010 | | | 2009 | |
| Net sales: | | | | | | | | | | | | |
| Lighting Segment | | $ | 196,550 | | | $ | 159,105 | | | $ | 160,475 | |
| Graphics Segment | | | 68,155 | | | | 68,395 | | | | 60,765 | |
| Electronic Components Segment | | | 21,449 | | | | 16,116 | | | | — | |
| All Other Category | | | 7,347 | | | | 10,786 | | | | 12,559 | |
| | | $ | 293,501 | | | $ | 254,402 | | | $ | 233,799 | |
| | | | | | | | | | |
| Operating income (loss): | | | | | | | | | | | | |
| Lighting Segment | | $ | 11,423 | | | $ | 9,073 | | | $ | (3,884 | ) |
| Graphics Segment | | | 6,373 | | | | 3,237 | | | | 2,362 | |
| Electronic Components Segment | | | 7,886 | | | | 2,279 | | | | — | |
| All Other Category | | | (543 | ) | | | (1,807 | ) | | | (4,321 | ) |
| Corporate and Eliminations | | | (8,835 | ) | | | (10,873 | ) | | | (8,568 | ) |
| | | $ | 16,304 | | | $ | 1,909 | | | $ | (14,411 | ) |
| | | | | | | | | | |
| Capital expenditures: | | | | | | | | | | | | |
| Lighting Segment | | $ | 3,231 | | | $ | 3,033 | | | $ | 977 | |
| Graphics Segment | | | 171 | | | | 2,098 | | | | 1,933 | |
| Electronic Components Segment | | | 855 | | | | 566 | | | | — | |
| All Other Category | | | 119 | | | | 89 | | | | 59 | |
| Corporate and Eliminations | | | 355 | | | | 364 | | | | 25 | |
| | | $ | 4,731 | | | $ | 6,150 | | | $ | 2,994 | |
| | | | | | | | | | |
| Depreciation and amortization: | | | | | | | | | | | | |
| Lighting Segment | | $ | 3,858 | | | $ | 3,703 | | | $ | 3,989 | |
| Graphics Segment | | | 2,000 | | | | 2,026 | | | | 2,204 | |
| Electronic Components Segment | | | 944 | | | | 854 | | | | — | |
| All Other Category | | | 242 | | | | 404 | | | | 576 | |
| Corporate and Eliminations | | | 833 | | | | 862 | | | | 977 | |
| | | $ | 7,877 | | | $ | 7,849 | | | $ | 7,746 | |
| | | June 30, | | | June 30, | | | June 30, | |
| | | 2011 | | | 2010 | | | 2009 | |
| Identifiable assets: | | | | | | | | | | | | |
| Lighting Segment | | $ | 100,659 | | | $ | 81,927 | | | $ | 77,733 | |
| Graphics Segment | | | 29,516 | | | | 36,077 | | | | 36,161 | |
| Electronic Components Segment | | | 31,072 | | | | 23,136 | | | | — | |
| All Other Category | | | 9,963 | | | | 15,372 | | | | 18,130 | |
| Corporate and Eliminations | | | 4,811 | | | | 17,333 | | | | 21,094 | |
| | | $ | 176,021 | | | $ | 173,845 | | | $ | 153,118 | |
Segment net sales represent sales to external customers. Intersegment revenues were eliminated in consolidation as follows:
| | | | | | | | | | | | | |
| (In thousands) | | 2011 | | | 2010 | | | 2009 | |
| Lighting Segment intersegment net sales | | $ | 3,530 | | | $ | 6,383 | | | $ | 6,097 | |
| | | | | | | | | | | | | |
| Graphics Segment intersegment net sales | | $ | 1,024 | | | $ | 862 | | | $ | 1,479 | |
| | | | | | | | | | | | | |
| Electronic Components intersegment net sales | | $ | 25,570 | | | | 5,394 | | | | — | |
| | | | | | | | | | | | | |
| All Other Category intersegment net sales | | $ | 5,568 | | | $ | 6,975 | | | $ | 8,707 | |
Segment operating income, which is used in management’s evaluation of segment performance, represents net sales less all operating expenses including impairment of goodwill and intangible assets, but excluding interest expense and interest income.
Identifiable assets are those assets used by each segment in its operations. Corporate identifiable assets primarily consist of cash, invested cash (if any), refundable income taxes, and deferred income tax assets.
The Company considers its geographic areas to be: 1) the United States; and 2) Canada. The majority of the Company’s operations are in the United States, with one operation in Canada. The geographic distribution of the Company’s net sales and long-lived assets are as follows:
| (In thousands) | | 2011 | | | 2010 | | | 2009 | |
| Net sales (a): | | | | | | | | | | | | |
| United States | | $ | 289,827 | | | $ | 249,897 | | | $ | 229,223 | |
| Canada | | | 3,674 | | | | 4,505 | | | | 4,576 | |
| | | $ | 293,501 | | | $ | 254,402 | | | $ | 233,799 | |
| | | June 30, | | | June 30, | | | June 30, | |
| | | 2011 | | | 2010 | | | 2009 | |
| Long-lived assets (b): | | | | | | | | | | | | |
| United States | | $ | 46,343 | | | $ | 48,220 | | | $ | 45,898 | |
| Canada | | | 298 | | | | 345 | | | | 564 | |
| | | $ | 46,641 | | | $ | 48,565 | | | $ | 46,462 | |
| a. | Net sales are attributed to geographic areas based upon the location of the operation making the sale. |
| b. | Long-lived assets includes property, plant and equipment, and other long term assets. Goodwill and intangible assets are not included in long-lived assets. |
NOTE 3 — MAJOR CUSTOMER CONCENTRATIONS
The Company’s Lighting Segment and Graphics Segment net sales to 7-Eleven, Inc. represented approximately $39,952,000 or 14% and $41,997,000 or 17% of consolidated net sales in the fiscal years ended June 30, 2011 and 2010, respectively. There were no customers or customer programs representing a concentration of 10% or more of the Company’s net sales in the fiscal year ended June 30, 2009. There was no concentration of accounts receivable at June 30, 2011 or 2010.
NOTE 4 — EARNINGS PER COMMON SHARE
The following table presents the amounts used to compute basic and diluted earnings (loss) per common share, as well as the effect of dilutive potential common shares on weighted average shares outstanding:
| (In thousands, except per share data) | | 2011 | | | 2010 | | | 2009 | |
| BASIC EARNINGS (LOSS) PER SHARE | | | | | | | | | | | | |
| | | | | | | | | | | | | |
| Net income (loss) | | $ | 10,828 | | | $ | 1,424 | | | $ | (13,414 | ) |
| | | | | | | | | | |
| | | | | | | | | | | | | |
| Weighted average shares outstanding during the period, net of treasury shares (a) | | | 24,046 | | | | 23,896 | | | | 21,574 | |
| Weighted average shares outstanding in the Deferred Compensation Plan during the period | | | 241 | | | | 232 | | | | 226 | |
| Weighted average shares outstanding | | | 24,287 | | | | 24,128 | | | | 21,800 | |
| | | | | | | | | | |
| Basic earnings (loss) per share | | $ | 0.45 | | | $ | 0.06 | | | $ | (0.62 | ) |
| | | | | | | | | | |
| | | | | | | | | | | | | |
| DILUTED EARNINGS (LOSS) PER SHARE | | | | | | | | | | | | |
| | | | | | | | | | | | | |
| Net income (loss) | | $ | 10,828 | | | $ | 1,424 | | | $ | (13,414 | ) |
| | | | | | | | | | |
| | | | | | | | | | | | | |
| Weighted average shares outstanding | | | | | | | | | | | | |
| | | | | | | | | | | | | |
| Basic | | | 24,287 | | | | 24,128 | | | | 21,800 | |
| | | | | | | | | | | | | |
| Effect of dilutive securities (b): | | | | | | | | | | | | |
| Impact of common shares to be issued under stock option plans, and contingently issuable shares, if any | | | 52 | | | | 6 | | | | — | |
| | | | | | | | | | |
| Weighted average shares outstanding (c) | | | 24,339 | | | | 24,134 | | | | 21,800 | |
| | | | | | | | | | |
| Diluted earnings (loss) per share | | $ | 0.44 | | | $ | 0.06 | | | $ | (0.62 | ) |
| (a) | Includes shares accounted for like treasury stock in accordance with Accounting Standards Codification Topic 710, Compensation — General. |
| | |
| (b) | Calculated using the “Treasury Stock” method as if dilutive securities were exercised and the funds were used to purchase common shares at the average market price during the period. |
| | |
| (c) | Options to purchase 1,881,395 common shares, 2,046,573 common shares, and 1,512,367 common shares at June 30, 2011, 2010, and 2009, respectively, were not included in the computation of diluted earnings per share because the exercise price was greater than the average fair market value of the common shares. |
NOTE 5 — INVENTORIES
The following information is provided as of the dates indicated:
| (In thousands) | | | | | June 30, 2010 | |
| | | | | | | | | |
| Inventories: | | | | | | | | |
| Raw materials | | $ | 32,374 | | | $ | 19,029 | |
| Work-in-process | | | 5,965 | | | | 8,891 | |
| Finished goods | | | 11,959 | | | | 12,162 | |
| | | $ | 50,298 | | | $ | 40,082 | |
NOTE 6 - ACCRUED EXPENSES
The following information is provided as of the dates indicated:
| (In thousands) | | | | | | |
| | | | | | | | | |
| Accrued Expenses: | | | | | | | | |
| Compensation and benefits | | $ | 7,589 | | | $ | 6,725 | |
| Customer prepayments | | | 611 | | | | 2,233 | |
| Accrued sales commissions | | | 1,419 | | | | 884 | |
| Other accrued expenses | | | 2,354 | | | | 3,415 | |
| | | $ | 11,973 | | | $ | 13,257 | |
NOTE 7 - GOODWILL AND OTHER INTANGIBLE ASSETS
In accordance with Accounting Standards Codification (ASC) Topic 350, Intangibles – Goodwill and Other, the Company is required to perform an annual impairment test of its goodwill and indefinite-lived intangible assets. The Company performed this test as of July 1st of each fiscal year, with the last test performed using this date as of July 1, 2010. The Company decided in fiscal 2011 to change the annual testing from July 1st to March 1st in order to reduce administrative burden. The change from a testing date of July 1st to March 1st resulted in two impairment tests in fiscal 2011 that were eight months apart. The Company also performs the test on an interim basis when an event occurs or circumstances change that would more likely than not reduce the fair value of a reporting unit below its carrying amount. The Company uses a combination of the market approach and the income (discounted cash flow) approach in determining the fair value of its reporting units. Under ASC Topic 350, the goodwill impairment test is a two-step process. Under the first step, the fair value of the Company’s reporting unit is compared to its respective carrying value. An indication that goodwill is impaired occurs when the fair value of a reporting unit is less than the carrying value. When there is an indication that goodwill is impaired, the Company is required to perform a second step. In step two, the actual impairment of goodwill is calculated by comparing the implied fair value of the goodwill with the carrying value of the goodwill.
The Company identified its reporting units in conjunction with its annual goodwill impairment testing. The Company relies upon a number of factors, judgments and estimates when conducting its impairment testing. These include operating results, forecasts, anticipated future cash flows and marketplace data, to name a few. There are inherent uncertainties related to these factors and judgments in applying them to the analysis of goodwill impairment.
Due to economic conditions, the effects of the recession on the Company’s markets and the decline in the Company’s stock price, management believed that an additional goodwill impairment test was required as of June 30, 2009. The impairment test performed as of June 30, 2009 was actually the Company’s annual goodwill impairment test that was to be performed in fiscal 2010 as of July 1, 2009; however, because the conditions that resulted in goodwill impairment were present as of June 30, 2009, the test was performed as of that date. There were no triggering events in fiscal 2010 related to goodwill impairment testing and, as a result, there was no impairment of goodwill recorded in fiscal 2010.
Based upon the Company’s analyses as of July 1, 2010, it was determined that the goodwill associated with the four reporting units that contained goodwill was not impaired. The goodwill impairment test in the Electronic Components Segment passed with an estimated business enterprise value that was $2.2 million or 10% above the carrying value of this reporting unit. The goodwill impairment test in the All Other Category passed with an estimated business enterprise value that was $0.9 million or 84% above the carrying value of the reporting unit. The goodwill impairment tests in the Lighting and Graphics Segments passed with significant and substantial margin (in excess of 600% and 150%, respectively).
The Company performed a second annual goodwill impairment test, as of March 1, 2011, as a result of the change in the timing of the performance of the annual test as noted above. Based upon the Company’s analyses as of March 1, 2011, it was determined that the goodwill associated with the four reporting units that contained goodwill was not impaired. The goodwill impairment test in the Electronic Components Segment passed with an estimated business enterprise value that was $16.5 million or 69% above the carrying value of this reporting unit. The goodwill impairment test in the All Other Category passed with an estimated business enterprise value that was $2.3 million or 265% above the carrying value of the reporting unit. The goodwill impairment tests in the Lighting and Graphics Segments passed (in excess of 42% and 91%, respectively).
The following table presents information about the Company's goodwill on the dates or for the periods indicated.
| Goodwill | | | | | | | | Electronic | | | | | | | |
| (In thousands) | | Lighting | | | Graphics | | | Components | | | All Other | | | | |
| | | Segment | | | Segment | | | Segment | | | Category | | | Total | |
| | | | | | | | | | | | | | | | |
| Balance as of June 30, 2010 | | | | | | | | | | | | | | | |
| Goodwill | | $ | 34,913 | | | $ | 24,959 | | | $ | 9,208 | | | $ | 6,850 | | | $ | 75,930 | |
| Accumulated impairment | | | | | | | | | | | | | | | | | | | | |
| Losses | | | (34,778 | ) | | | (24,701 | ) | | | -- | | | | (5,685 | ) | | | (65,164 | ) |
| | | $ | 135 | | | $ | 258 | | | $ | 9,208 | | | $ | 1,165 | | | $ | 10,766 | |
| | | | | | | | | | | | | | | | | | | | | |
| Balance as of June 30, 2011 | | | | | | | | | | | | | | | | | | | | |
| Goodwill | | $ | 34,913 | | | $ | 24,959 | | | $ | 9,208 | | | $ | 6,850 | | | $ | 75,930 | |
| Accumulated impairment | | | | | | | | | | | | | | | | | | | | |
| Losses | | | (34,778 | ) | | | (24,701 | ) | | | -- | | | | (5,685 | ) | | | (65,164 | ) |
| | | $ | 135 | | | $ | 258 | | | $ | 9,208 | | | $ | 1,165 | | | $ | 10,766 | |
Based upon the Company’s analysis as of July 1, 2010, it was determined that its indefinite-lived intangible assets were not impaired. The Company performed a second annual indefinite-lived intangible asset impairment test, as of March 1, 2011, as a result of the change in the timing of the performance of the annual test. Based upon the Company’s analysis as of March 1, 2011, it was determined that its indefinite-lived intangible assets were not impaired.
Based upon the Company’s analysis as of July 1, 2009, it was determined that an intangible asset with a net carrying value of $16,000 for a patent in the Lighting Segment was fully impaired and that an intangible asset with a carrying value of $137,000 for a trade name in the All Other Category was also fully impaired. Accordingly, the Company recorded $153,000 of intangible asset impairment expense in fiscal 2010.
The gross carrying amount and accumulated amortization by major other intangible asset class is as follows:
| | | June 30, 2011 | |
| Intangible Assets | | Gross | | | | | | | |
| | | Carrying | | | Accumulated | | | Net | |
| (In thousands) | | Amount | | | Amortization | | | Amount | |
| Amortized Intangible Assets | | | | | | | | | |
| Customer relationships | | $ | 10,352 | | | $ | 5,745 | | | $ | 4,607 | |
| Patents | | | 70 | | | | 46 | | | | 24 | |
| LED technology firmware, software | | | 11,228 | | | | 7,614 | | | | 3,614 | |
| Trade name | | | 460 | | | | 178 | | | | 282 | |
| Non-compete agreements | | | 890 | | | | 325 | | | | 565 | |
| | | | 23,000 | | | | 13,908 | | | | 9,092 | |
| | | | | | | | | | | | | |
| Indefinite-lived Intangible Assets | | | | | | | | | | | | |
| Trademarks and trade names | | | 3,422 | | | | -- | | | | 3,422 | |
| | | | 3,422 | | | | -- | | | | 3,422 | |
| | | | | | | | | | | | | |
| Total Intangible Assets | | $ | 26,422 | | | $ | 13,908 | | | $ | 12,514 | |
| | | June 30, 2010 | |
| | | Gross | | | | | | | |
| | | Carrying | | | Accumulated | | | Net | |
| (In thousands) | | Amount | | | Amortization | | | Amount | |
| Amortized Intangible Assets | | | | | | | | | |
| Customer relationships | | $ | 10,352 | | | $ | 4,950 | | | $ | 5,402 | |
| Patents | | | 70 | | | | 42 | | | | 28 | |
| LED technology firmware, software | | | 11,228 | | | | 6,043 | | | | 5,185 | |
| Trade name | | | 460 | | | | 86 | | | | 374 | |
| Non-compete agreements | | | 890 | | | | 198 | | | | 692 | |
| | | | 23,000 | | | | 11,319 | | | | 11,681 | |
| | | | | | | | | | | | | |
| Indefinite-lived Intangible Assets | | | | | | | | | | | | |
| Trademarks and trade names | | | 3,422 | | | | -- | | | | 3,422 | |
| | | | 3,422 | | | | -- | | | | 3,422 | |
| | | | | | | | | | | | | |
| Total Intangible Assets | | $ | 26,422 | | | $ | 11,319 | | | $ | 15,103 | |
| | | Amortization Expense of Other Intangible Assets | |
| (In thousands) | | 2011 | | | 2010 | | | 2009 | |
| | | $ | 2,589 | | | $ | 2,555 | | | $ | 2,079 | |
The Company expects to record amortization expense as follows: fiscal 2012 -- $2,588,000; 2013 -- $2,323,000; 2014 -- $619,000; 2015 -- $533,000; 2016 -- $527,000; and after 2016 -- $2,502,000.
NOTE 8 — REVOLVING LINES OF CREDIT AND LONG-TERM DEBT
The Company has a $30 million unsecured revolving line of credit with its bank group in the U.S., all of which was available as of June 30, 2011. The line of credit expires in the third quarter of fiscal 2014. Annually in the third quarter, the credit facility is renewable with respect to adding an additional year of commitment, if the bank group so chooses, to replace the year just ended. Interest on the revolving lines of credit is charged based upon an increment over the LIBOR rate as periodically determined, or at the bank’s base lending rate, at the Company’s option. The increment over the LIBOR borrowing rate, as periodically determined, fluctuates between 175 and 215 basis points depending upon the ratio of indebtedness to earnings before interest, taxes, depreciation and amortization (EBITDA), as defined in the credit facility. The fee on the unused balance of the $30 million committed line of credit is 25 basis points. Under terms of this credit facility, the Company has agreed to a negative pledge of assets and is required to comply with financial covenants that limit the amount of debt obligations, require a minimum amount of tangible net worth, and limit the ratio of indebtedness to EBITDA.
The Company also has a $5 million line of credit for its Canadian subsidiary. The line of credit expires in the third quarter of fiscal 2012. Interest on the Canadian subsidiary’s line of credit is charged based upon a 200 basis point increment over the LIBOR rate or based upon an increment over the United States base rate if funds borrowed are denominated in U.S. dollars or an increment over the Canadian prime rate if funds borrowed are denominated in Canadian dollars. There are no borrowings against this line of credit as of June 30, 2011.
The Company assumed a mortgage loan with the acquisition of AdL Technology in July 2009. Monthly principal and interest payments of approximately $10,000 are to be made through August, 2012 at an interest rate of 7.76%, at which time the balance is payable in full. The real estate of LSI ADL Technology has been pledged as collateral for the mortgage. The Company also assumed approximately $2.2 million of additional long-term debt with the acquisition of AdL Technology and paid it off at the time of the acquisition.
The Company is in compliance with all of its loan covenants as of June 30, 2011.
| (In thousands) | | June 30, 2011 | | | June 30, 2010 | |
| Total mortgage balance | | $ | 1,099 | | | $ | 1,132 | |
| Less current maturities | | | 35 | | | | 33 | |
| Long-term debt | | $ | 1,064 | | | $ | 1,099 | |
Maturities of long-term debt are as follows:
| (In thousands) | | | |
| Fiscal year ended June 30 | | | |
| 2012 | | $ | 35 | |
| 2013 | | | 1,064 | |
| | | $ | 1,099 | |
NOTE 9 — CASH DIVIDENDS
The Company paid cash dividends of $4,809,000, $4,809,000, and $6,471,000 in fiscal years 2011, 2010, and 2009, respectively. In August 2011, the Company’s Board of Directors declared a $0.05 per share regular quarterly cash dividend (approximately $1,202,000) payable on September 6, 2011 to shareholders of record August 30, 2011.
NOTE 10 — EQUITY COMPENSATION
Stock Options
The Company has an equity compensation plan that was approved by shareholders which covers all of its full-time employees, outside directors and certain advisors. The options granted or stock awards made pursuant to this plan are granted at fair market value at date of grant or award. Options granted to non-employee directors become exercisable 25% each ninety days (cumulative) from date of grant and options granted to employees generally become exercisable 25% per year (cumulative) beginning one year after the date of grant. If a stock option holder’s employment with the Company terminates by reason of death, disability or retirement, as defined in the Plan, the Plan generally provides for acceleration of vesting. The number of shares reserved for issuance is 2,800,000, of which 705,779 shares were available for future grant or award as of June 30, 2011. This plan allows for the grant of incentive stock options, non-qualified stock options, stock appreciation rights, restricted and unrestricted stock awards, performance stock awards, and other stock awards. As of June 30, 2011, a total of 2,123,939 options for common shares were outstanding from this plan as well as two previous stock option plans (both of which had also been approved by shareholders), and of these, a total of 1,192,814 options for common shares were vested and exercisable. The approximate unvested stock option expense as of June 30, 2011 that will be recorded as expense in future periods is $781,072. The weighted average time over which this expense will be recorded is approximately 18 months.
The fair value of each option on the date of grant was estimated using the Black-Scholes option pricing model. The below listed weighted average assumptions were used for grants in the periods indicated.
| | | 2011 | | | 2010 | | | 2009 | |
| | | | | | | | | | | | | |
| Dividend yield | | | 3.74 | % | | | 2.95 | % | | | 4.60 | % |
| Expected volatility | | | 53 | % | | | 52 | % | | | 45 | % |
| Risk-free interest rate | | | 1.4 | % | | | 2.4 | % | | | 3.0 | % |
| Expected life | | 4.5 yrs. | | | 4.3 yrs. | | | 5.1 yrs. | |
At June 30, 2011, the 288,200 options granted in fiscal 2011 to both employees and non-employee directors had exercise prices ranging from $4.84 to $8.92, fair values ranging from $1.60 to $3.37, and remaining contractual lives of between nine years and nine years five months.
At June 30, 2010, the 648,500 options granted during fiscal 2010 to both employees and non-employee directors had exercise prices ranging from $5.37 to $8.40, fair values ranging from $1.87 to $2.87 per option, and remaining contractual lives of nine years ten months to nearly ten years.
At June 30, 2009, the 365,800 options granted in fiscal 2009 to non-employee directors had exercise prices ranging from $4.34 to $8.98, fair values ranging from $1.12 to $2.21, and remaining contractual lives of approximately nine and one-half to ten years.
The Company calculates stock option expense using the Black-Scholes model. Stock option expense is recorded on a straight line basis with an estimated 3.6% forfeiture rate effective April 1, 2011, with the previous estimated forfeiture rate having been 3.0% effective July 1, 2010 and 6.55% prior to July 1, 2010. The expected volatility of the Company’s stock was calculated based upon the historic monthly fluctuation in stock price for a period approximating the expected life of option grants. The risk-free interest rate is the rate of a five year Treasury security at constant, fixed maturity on the approximate date of the stock option grant. The expected life of outstanding options is determined to be less than the contractual term for a period equal to the aggregate group of option holders’ estimated weighted average time within which options will be exercised. It is the Company’s policy that when stock options are exercised, new common shares shall be issued. The Company recorded $851,755, $2,633,000 and $1,184,000 of expense related to stock options in fiscal years 2011, 2010 and 2009, respectively. As of June 30, 2011, the Company expects that approximately 910,780 outstanding stock options having a weighted average exercise price of $8.21 per share, intrinsic value of $811,134 and weighted average remaining contractual terms of 8.1 years will vest in the future.
Information related to all stock options for the years ended June 30, 2011, 2010 and 2009 is shown in the following table:
| | | Twelve Months Ended June 30, 2011 | |
| | | | | | | Weighted | | Weighted | | | |
| | | | | | | Average | | Average | | Aggregate | |
| | | | | | | Exercise | | Remaining | | Intrinsic | |
| | | Shares | | | Price | | Contractual Term | | Value | |
| Outstanding at 6/30/10 | | | 2,123,086 | | | $ | 11.64 | | 6.6 years | | $ | 15,270 | |
| | | | | | | | | | | | |
| | | | | | | | | | | | | | |
| Granted | | | 288,200 | | | $ | 5.29 | | | | | | |
| Forfeitures | | | (280,347 | ) | | $ | 11.53 | | | | | | |
| Exercised | | | (7,000 | ) | | $ | 8.40 | | | | | | |
| | | | | | | | | | | | | |
| | | | | | | | | | | | | | |
| Outstanding at 6/30/11 | | | 2,123,939 | | | $ | 10.80 | | 6.3 years | | $ | 955,401 | |
| | | | | | | | | | | | |
| | | | | | | | | | | | | | |
| Exercisable at 6/30/11 | | | 1,192,814 | | | $ | 12.85 | | 5.0 years | | $ | 112,594 | |
| | | Twelve Months Ended June 30, 2010 | |
| | | | | | | Weighted | | Weighted | | | |
| | | | | | | Average | | Average | | Aggregate | |
| | | | | | | Exercise | | Remaining | | Intrinsic | |
| | | Shares | | | Price | | Contractual Term | | Value | |
| Outstanding at 6/30/09 | | | 1,537,212 | | | $ | 13.07 | | 6.4 years | | $ | 33,800 | |
| | | | | | | | | | | | |
| | | | | | | | | | | | | | |
| Granted | | | 648,500 | | | $ | 8.24 | | | | | | |
| Forfeitures | | | (62,626 | ) | | $ | 11.59 | | | | | | |
| Exercised | | | — | | | | n/a | | | | | | |
| | | | | | | | | | | | | |
| | | | | | | | | | | | | | |
| Outstanding at 6/30/10 | | | 2,123,086 | | | $ | 11.64 | | 6.6 years | | $ | 15,270 | |
| | | | | | | | | | | | |
| | | | | | | | | | | | | | |
| Exercisable at 6/30/10 | | | 1,051,211 | | | $ | 12.98 | | 4.7 years | | $ | 5,078 | |
| | | | | | | | | | | | |
| | | | | | | | | | | | | | |
| | | Twelve Months Ended June 30, 2009 | |
| | | | | | | Weighted | | Weighted | | | |
| | | | | | | Average | | Average | | Aggregate | |
| | | | | | | Exercise | | Remaining | | Intrinsic | |
| | | Shares | | | Price | | Contractual Term | | Value | |
| Outstanding at 6/30/08 | | | 1,197,482 | | | $ | 14.44 | | 6.5 years | | $ | — | |
| | | | | | | | | | | | |
| | | | | | | | | | | | | | |
| Granted | | | 365,800 | | | $ | 8.57 | | | | | | |
| Forfeitures | | | (26,070 | ) | | $ | 12.68 | | | | | | |
| Exercised | | | — | | | $ | — | | | | | | |
| | | | | | | | | | | | | |
| | | | | | | | | | | | | | |
| Outstanding at 6/30/09 | | | 1,537,212 | | | $ | 13.07 | | 6.4 years | | $ | 33,800 | |
| | | | | | | | | | | | |
| | | | | | | | | | | | | | |
| Exercisable at 6/30/09 | | | 830,087 | | | $ | 12.52 | | 4.8 years | | $ | 2,550 | |
The aggregate intrinsic value of options exercised during the year ended June 30, 2011 was $6,526. No options were exercised in the years ended June 30, 2010 and 2009.
Stock Compensation Awards
The Company awarded a total of 6,256 common shares in fiscal 2011, 6,848 common shares in fiscal 2010, and 6,032 common shares in fiscal 2009 as stock compensation awards. These common shares were valued at their approximate $40,900, $45,538, and $40,680 fair market values on their dates of issuance, respectively, pursuant to the compensation programs for non-employee directors who receive a portion of their compensation as an award of Company stock and for employees who receive a nominal stock award following their twentieth employment anniversary. Stock compensation awards are made in the form of newly issued common shares of the Company.
Deferred Compensation Plan
The Company has a non-qualified deferred compensation plan providing for both Company contributions and participant deferrals of compensation. This plan is fully funded in a Rabbi Trust. All plan investments are in common shares of the Company. As of June 30, 2011 there were 27 participants, all with fully vested account balances. A total of 244,868 common shares with a cost of $2,499,700, and 224,884 common shares with a cost of $2,403,600 were held in the plan as of June 30, 2011 and June 30, 2010, respectively, and, accordingly, have been recorded as treasury shares. The change in the number of shares held by this plan is the net result of share purchases and sales on the open stock market for compensation deferred into the plan and for distributions to terminated employees. The Company does not issue new common shares for purposes of the non-qualified deferred compensation plan. The Company accounts for assets held in the non-qualified deferred compensation plan in accordance with Accounting Standards Codification Topic 710, Compensation — General. For fiscal year 2012, the Company estimates the Rabbi Trust for the Nonqualified Deferred Compensation Plan will make net repurchases in the range of 26,000 to 28,000 common shares of the Company. During fiscal years 2011 and 2010, the Company used approximately $117,900 and $110,660, respectively, to purchase common shares of the Company in the open stock market for either employee salary deferrals or Company contributions into the non-qualified deferred compensation plan. The Company does not currently repurchase its own common shares for any other purpose.
NOTE 11 — LEASES AND PURCHASE COMMITMENTS
Purchase commitments, including minimum annual rental commitments, of the Company totaled $18,146,000 and $19,972,000 as of June 30, 2011 and June 30, 2010, respectively. The Company leases certain of its facilities and equipment under operating lease arrangements. The facility leases contain the option to renew for periods ranging from one to five years. Rental expense was $2,858,000 in 2011, $2,254,000 in 2010, and $2,243,000 in 2009. Minimum annual rental commitments under non-cancelable operating leases are indicated in the table below:
| 2012 | 2013 | 2014 | 2015 | 2016 |
| $1,404,000 | $1,156,000 | $349,000 | $56,000 | $34,000 |
NOTE 12 — INCOME TAXES
The following information is provided for the years ended June 30:
| (In thousands) | | 2011 | | | 2010 | | | 2009 | |
| Components of income (loss) before income taxes | | | | | | | | | | | | |
| United States | | $ | 17,309 | | | $ | 2,323 | | | $ | (13,911 | ) |
| Foreign | | | (1,263 | ) | | | (539 | ) | | | (492 | ) |
| Income (loss) before income taxes | | $ | 16,046 | | | $ | 1,784 | | | $ | (14,403 | ) |
| | | | | | | | | | |
| | | | | | | | | | | | | |
| Provision (benefit) for income taxes: | | | | | | | | | | | | |
| Current | | | | | | | | | | | | |
| U.S. federal | | $ | 4,047 | | | $ | 2,015 | | | $ | (1,629 | ) |
| State and local | | | 393 | | | | (12 | ) | | | (147 | ) |
| Foreign | | | (104 | ) | | | (79 | ) | | | (214 | ) |
| Total current | | | 4,336 | | | | 1,924 | | | | (1,990 | ) |
| | | | | | | | | | | | | |
| Deferred | | | 1,003 | | | | (1,564 | ) | | | 1,001 | |
| Total provision (benefit) for income taxes | | $ | 5,339 | | | | 360 | | | $ | (989 | ) |
| (In thousands) | | 2011 | | | 2010 | | | 2009 | |
| Reconciliation to federal statutory rate: | | | | | | | | | | | | |
| Federal statutory tax rate | | | 34.3 | % | | | 34.0 | % | | | 34.0 | % |
| State and local taxes, net of federal benefit | | | 1.4 | | | | (11.5 | ) | | | 1.5 | |
| Impact of Foreign Operations | | | (1.5 | ) | | | (9.3 | ) | | | 3.6 | |
| Federal and state tax credits | | | (0.9 | ) | | | (5.8 | ) | | | 1.1 | |
| Goodwill | | | (0.1 | ) | | | (0.5 | ) | | | (27.9 | ) |
| Valuation allowance | | | 3.5 | | | | 19.8 | | | | (3.2 | ) |
| Domestic Production Activities Deduction | | | (2.7 | ) | | | (4.6 | ) | | | — | |
| Other | | | (1.0 | ) | | | (1.9 | ) | | | (2.2 | ) |
| Effective tax rate | | | 33.0 | % | | | 20.2 | % | | | 6.9 | % |
The components of deferred income tax assets and (liabilities) at June 30, 2011 and 2010 are as follows:
| | | | | | | | | |
| (In thousands) | | 2011 | | | 2010 | |
| Reserves against current assets | | $ | 233 | | | $ | 213 | |
| Accrued expenses | | | 1,276 | | | | 1,132 | |
| Depreciation | | | (3,534 | ) | | | (2,701 | ) |
| Goodwill, acquisition costs and intangible assets | | | 2,597 | | | | 3,026 | |
| Deferred compensation | | | 893 | | | | 809 | |
| State net operating loss carryover and credits | | | 1,858 | | | | 1,841 | |
| Foreign net operating loss carryover and credits | | | 3,286 | | | | 2,447 | |
| Valuation reserve | | | (4,200 | ) | | | (3,355 | ) |
| Net deferred income tax asset | | $ | 2,409 | | | $ | 3,412 | |
Reconciliation to the balance sheets as of June 30, 2011 and 2010:
| (In thousands) | | 2011 | | | 2010 | |
| Deferred income tax asset included in: | | | | | | | | |
| Other current assets | | $ | 1,509 | | | $ | 1,345 | |
| Other long-term assets | | | 900 | | | | 2,067 | |
| Net deferred income tax asset | | $ | 2,409 | | | $ | 3,412 | |
As of June 30, 2011 and 2010, the Company has recorded a deferred state income tax asset in the amount of $944,000 and $933,000, respectively, net of federal tax benefits, related to non-refundable New York state tax credits. The Company has determined that these deferred state income tax assets do not require any valuation reserves because, in accordance with Accounting Standards Codification Subtopic 740-10, Income Taxes: Overall, these assets will, more likely than not, be realized. Additionally, as of June 30, 2011 and 2010, the Company has recorded a deferred state income tax asset in the amount of $90,000 and $84,000, respectively, related to a state net operating loss carryover in Tennessee, and has determined that a full valuation reserve is required. This activity netted to an additional state income tax expense (benefit) of $11,000, $(59,000), and $25,000 in fiscal years 2011, 2010 and 2009, respectively.
As of June 30, 2011 and 2010, the Company has recorded deferred tax assets for its Canadian subsidiary related to net operating loss carryover and to research and development tax credits totaling $3,286,000 and $2,447,000, respectively. In view of the impairment of the goodwill and certain intangible assets on the financial statements of this subsidiary and a current series of loss years, the Company has determined these assets, more likely than not, will not be realized. Additionally, as of June 30, 2011 and 2010, the Company has recorded a deferred state tax asset in the amount of $90,000 and $84,000, respectively, related to its subsidiary in Tennessee. Since this business was sold, the Company has determined this asset more likely than not, will not be realized. Additionally, the Company has recorded a deferred state income tax asset in the amount of $824,000, net of federal tax benefit, related to non-refundable New York state tax credits, and has determined that a valuation reserve is required. These credits do not expire, but the Company has determined this asset more likely than not, will not be realized within the next twenty years. Accordingly, full valuation reserves of $4,200,000 and $3,355,000 were recorded as of June 30, 2011 and 2010, respectively.
The Company accounts for uncertain tax positions in accordance with Accounting Standards Codification 740-10. At June 30, 2011, tax and interest, net of potential federal tax benefits, were $1,214,000 and $452,000, respectively, of the total reserve for uncertain tax positions of $1,999,000. Additionally, penalties were $305,000 of the reserve at June 30, 2011. Of the $1,999,000 reserve for uncertain tax positions, $1,694,000 would have an unfavorable impact on the effective tax rate if recognized. At June 30, 2010, tax and interest, net of potential federal tax benefits, were $1,660,000 and $449,000, respectively, of the total reserve for uncertain tax positions of $2,456,000. Additionally, penalties were $347,000 of the reserve at June 30, 2010. Of the $2,456,000 reserve for uncertain tax positions, $2,109,000 would have an unfavorable impact on the effective tax rate if recognized.
The Company recognized a $300,000 tax benefit in fiscal 2011, a $216,000 tax benefit in fiscal 2010, and a $226,000 tax benefit in fiscal 2009 related to the change in reserves for uncertain tax positions. The Company is recording estimated interest and penalties related to potential underpayment of income taxes as a component of tax expense in the Consolidated Statements of Operations. The reserve for uncertain tax positions is not expected to change significantly in the next twelve months.
The fiscal 2011, 2010 and 2009 activity in the Liability for Uncertain Tax Positions, which is included in Other Long-Term Liabilities, was as follows:
| (in thousands) | | 2011 | | | 2010 | | | 2009 | |
| Balance at beginning of the fiscal year | | $ | 2,366 | | | $ | 2,693 | | | $ | 3,040 | |
| Increases — tax positions in prior period | | | — | | | | — | | | | — | |
| Decreases — tax positions in prior period | | | (172 | ) | | | (255 | ) | | | — | |
| Increases — tax positions in current period | | | 74 | | | | 37 | | | | 14 | |
| Decreases — tax positions in current period | | | — | | | | — | | | | — | |
| Settlements and payments | | | — | | | | (85 | ) | | | (361 | ) |
| Lapse of statute of limitations | | | (358 | ) | | | (24 | ) | | | — | |
| Balance at end of the fiscal year | | $ | 1,910 | | | $ | 2,366 | | | $ | 2,693 | |
The Company files a consolidated federal income tax return in the United States, and files various combined and separate tax returns in several foreign, state, and local jurisdictions. With limited exceptions, the Company is no longer subject to U.S. Federal, state and local tax examinations by tax authorities for fiscal years ending prior to June 30, 2007.
NOTE 13 — SUPPLEMENTAL CASH FLOW INFORMATION
| (In thousands) | | 2011 | | | 2010 | | | 2009 | |
| Cash payments: | | | | | | | | | | | | |
| Interest | | $ | 138 | | | $ | 144 | | | $ | 119 | |
| Income taxes | | $ | 6,373 | | | $ | 519 | | | $ | 564 | |
| | | | | | | | | | | | | |
| Issuance of common shares as compensation | | $ | 41 | | | $ | 46 | | | $ | 41 | |
| Issuance of common shares for acquisition | | $ | -- | | | $ | 14,448 | | | $ | -- | |
NOTE 14 — COMMITMENTS AND CONTINGENCIES
The Company is party to various negotiations, customer bankruptcies, and legal proceedings arising in the normal course of business. The Company provides reserves for these matters when a loss is probable and reasonably estimable. In the opinion of management, the ultimate disposition of these matters will not have a material adverse effect on the Company’s financial position, results of operations, cash flows or liquidity.
The Company was named as one of several defendants in a lawsuit filed in August 2010 alleging patent infringement with respect to alleged two way communication features in the Company’s solid-state LED video screens sold over the past four and one half years. The plaintiff was seeking unspecified damages related to the alleged patent infringement. The Company and the plaintiff concluded discussions related to this lawsuit, settled this matter and entered into a license agreement. While the Company believes its LED video screen designs do not infringe upon the plaintiff’s patent, management believed it was in the best interest of the Company in the third quarter of fiscal 2011 to reach agreement with the plaintiff for settlement.
The Company also had been the defendant for a number of years in a complex lawsuit alleging patent infringement with respect to some of the Company’s menu board systems sold over approximately eleven years. Pursuant to settlement discussions initiated by the plaintiffs, the Company made a $2,800,000 offer to settle this matter and, accordingly, recorded a loss contingency reserve in the fourth quarter of fiscal 2008. Following additional discussions in the second quarter of fiscal 2009, the Company reached a full and complete settlement of all matters related to this menu board patent infringement lawsuit. Accordingly, an additional $200,000 expense was recorded in the second quarter of fiscal 2009 and a payment of $3,000,000 was made to the plaintiffs.
NOTE 15 — RELATED PARTY TRANSACTIONS
The Company has recorded expense for the following related party transactions in the fiscal years indicated (amounts in thousands):
| | | 2011 | | | 2010 | | | 2009 | |
| Keating Muething & Klekamp PLL | | $ | 127 | | | $ | 277 | | | $ | 266 | |
| American Engineering and Metal Working | | $ | 178 | | | $ | 200 | | | $ | 202 | |
| 3970957 Canada Inc. | | $ | 181 | | | $ | 181 | | | $ | 180 | |
As of the balance sheet date indicated, the Company had the following liabilities recorded with respect to related party transactions (amounts in thousands):
| | | June 30, | | | June 30, | |
| | | 2011 | | | 2010 | |
| Keating Muething & Klekamp PLL | | $ | 9 | | | $ | 34 | |
| American Engineering and Metal Working | | $ | 6 | | | $ | 61 | |
The law firm of Keating Muething & Klekamp PLL, of which one of the Company’s independent outside directors is a senior partner, is the Company’s primary outside law firm providing legal services in most all areas required other than patents and intellectual property. The manufacturing firm of American Engineering and Metal Working, which is owned and operated by the son of the president of the Company’s Graphics Segment, provides metal fabricated components. 3970957 Canada Inc., which is owned by the former president and another executive of the Company’s LSI Saco Technologies subsidiary, owns the building that the Canadian operation occupies and rents. All related parties provide the Company either products or services at market-based arms-length prices.
NOTE 16 — SALE OF LSI MARCOLE
On January 20, 2010, the Board of Directors approved a plan to close the LSI Marcole facility in Manchester, Tennessee. This facility manufactures wire harnesses used in the manufacture of LSI’s light fixtures and also sells wire harness to select outside customers. The Company decided to sell this facility primarily due to low cost competition of wire harnesses produced outside the United States. While the Company expected to cease production at the facility by April 2, 2010, an interested buyer came forward and purchased certain assets and the business of LSI Marcole on March 30, 2010. The Company received $500,000 of the sales proceeds in cash as well as interest bearing promissory notes in the amount of $669,682 which was paid in full. The Company recorded a $638,747 loss on the sale of certain LSI Marcole assets in cost of products and services sold in the third quarter of fiscal 2010. Subsequent to the sale of the LSI Marcole assets, the Company has continued to purchase wire harnesses from the new owner of the facility pursuant to a manufacturing and supply agreement. The operating results of LSI Marcole were reported under the All Other Category.
The assets and liabilities of LSI Marcole were comprised of the following on the dates indicated:
| (In thousands) | | June 30, 2010 | |
| Accounts receivable, net | | $ | 1 | |
| Note receivable, current portion | | | 670 | |
| Other current assets | | | 14 | |
| Total Assets | | $ | 685 | |
The net customer sales and operating (loss) of LSI Marcole for the periods indicated were as follows:
| (In thousands) | | 2010 | | | 2009 | |
| Net sales | | $ | 2,886 | | | $ | 3,970 | |
| | | | | | | | | |
| Operating (loss) | | $ | (1,101 | ) | | $ | (614 | ) |
NOTE 17 — SUMMARY OF QUARTERLY RESULTS (UNAUDITED)
| | | Quarter Ended | | | Fiscal | |
| (In thousands except per share data) | | Sept. 30 | | | Dec. 31 | | | March 31 | | | June 30 | | | Year | |
| | | | | | | | | | | | | | | | | | | | | |
| 2011 | | | | | | | | | | | | | | | | | | | | |
| Net sales | | $ | 79,851 | | | $ | 74,805 | | | $ | 64,628 | | | $ | 74,217 | | | $ | 293,501 | |
| Gross profit | | | 20,622 | | | | 18,647 | | | | 16,324 | | | | 16,752 | | | | 72,345 | |
| Net income | | | 4,268 | | | | 2,948 | | | | 2,115 | | | | 1,497 | | | | 10,828 | |
| | | | | | | | | | | | | | | | | | | | | |
| Earnings per share | | | | | | | | | | | | | | | | | | | | |
| Basic | | $ | 0.18 | | | $ | 0.12 | | | $ | 0.09 | | | $ | 0.06 | | | $ | 0.45 | |
| Diluted | | $ | 0.18 | | | $ | 0.12 | | | $ | 0.09 | | | $ | 0.06 | | | $ | 0.44 | (a) |
| | | | | | | | | | | | | | | | | | | | | |
| Range of share prices | | | | | | | | | | | | | | | | | | | | |
| High | | $ | 6.46 | | | $ | 9.61 | | | $ | 8.79 | | | $ | 8.62 | | | $ | 9.61 | |
| Low | | $ | 4.69 | | | $ | 6.38 | | | $ | 6.86 | | | $ | 6.90 | | | $ | 4.69 | |
| | | | | | | | | | | | | | | | | | | | | |
| 2010 | | | | | | | | | | | | | | | | | | | | |
| Net sales | | $ | 67,676 | | | $ | 69,374 | | | $ | 53,466 | | | $ | 63,886 | | | $ | 254,402 | |
| Gross profit | | | 16,597 | | | | 16,300 | | | | 8,873 | | | | 13,963 | | | | 55,733 | |
| Net income (loss) | | | 1,637 | | | | 1,592 | | | | (2,532 | ) | | | 727 | | | | 1,424 | |
| | | | | | | | | | | | | | | | | | | | | |
| Earnings (loss) per share | | | | | | | | | | | | | | | | | | | | |
| Basic | | $ | 0.07 | | | $ | 0.07 | | | $ | (.10 | ) | | $ | 0.03 | | | $ | 0.06 | (a) |
| Diluted | | $ | 0.07 | | | $ | 0.07 | | | $ | (.10 | ) | | $ | 0.03 | | | $ | 0.06 | (a) |
| | | | | | | | | | | | | | | | | | | | | |
| Range of share prices | | | | | | | | | | | | | | | | | | | | |
| High | | $ | 8.48 | | | $ | 8.43 | | | $ | 8.42 | | | $ | 7.41 | | | $ | 8.48 | |
| Low | | $ | 5.05 | | | $ | 6.52 | | | $ | 5.50 | | | $ | 4.86 | | | $ | 4.86 | |
| | | | | | | | | | | | | | | | | | | | | |
| 2009 | | | | | | | | | | | | | | | | | | | | |
| Net sales | | $ | 75,838 | | | $ | 60,787 | | | $ | 46,989 | | | $ | 50,185 | | | $ | 233,799 | |
| Gross profit | | | 18,179 | | | | 13,257 | | | | 8,774 | | | | 11,617 | | | | 51,827 | |
| Loss contingency | | | — | | | | 200 | | | | — | | | | — | | | | 200 | |
| Goodwill impairment | | | — | | | | 13,250 | | | | 957 | | | | 260 | | | | 14,467 | |
| Net income (loss) | | | 2,687 | | | | (13,377 | ) | | | (2,467 | ) | | | (257 | ) | | | (13,414 | ) |
| | | | | | | | | | | | | | | | | | | | | |
| Earnings (loss) per share | | | | | | | | | | | | | | | | | | | | |
| Basic | | $ | 0.12 | | | $ | (0.61 | ) | | $ | (0.11 | ) | | $ | (0.01 | ) | | $ | (0.62 | ) (a) |
| Diluted | | $ | 0.12 | | | $ | (0.61 | ) | | $ | (0.11 | ) | | $ | (0.01 | ) | | $ | (0.62 | ) (a) |
| | | | | | | | | | | | | | | | | | | | | |
| Range of share prices | | | | | | | | | | | | | | | | | | | | |
| High | | $ | 10.91 | | | $ | 8.28 | | | $ | 7.39 | | | $ | 6.51 | | | $ | 10.91 | |
| Low | | $ | 7.02 | | | $ | 4.25 | | | $ | 2.75 | | | $ | 4.15 | | | $ | 2.75 | |
| (a) | The total of the earnings per share for each of the four quarters does not equal the total earnings per share for the full year because the calculations are based on the average shares outstanding during each of the individual periods. |
At August 15, 2011, there were 497 shareholders of record. The Company believes this represents approximately 3,000 beneficial shareholders.
LSI INDUSTRIES INC.
SELECTED FINANCIAL DATA
(In thousands except per share data)
The following data has been selected from the Consolidated Financial Statements of the Company for the periods and dates indicated:
Statement of Operations Data:
| | | 2011 | | | 2010 | | | 2009 | | | 2008 | | | 2007 | |
| Net sales | | $ | 293,501 | | | $ | 254,402 | | | $ | 233,799 | | | $ | 305,286 | | | $ | 337,453 | |
| Cost of products and services sold | | | 221,156 | | | | 198,030 | | | | 181,972 | | | | 224,859 | | | | 248,274 | |
| Loss on sale of a subsidiary | | | — | | | | 639 | | | | — | | | | — | | | | — | |
| Operating expenses | | | 56,041 | | | | 53,671 | | | | 51,571 | | | | 60,642 | | | | 57,219 | |
| Loss contingency (a) | | | — | | | | — | | | | 200 | | | | 2,800 | | | | (590 | ) |
| Goodwill and intangible asset impairment (b) | | | — | | | | 153 | | | | 14,467 | | | | 27,955 | | | | — | |
| | | | | | | | | | | | | | | | |
| | | | | | | | | | | | | | | | | | | | | |
| Operating income (loss) | | | 16,304 | | | | 1,909 | | | | (14,411 | ) | | | (10,970 | ) | | | 32,550 | |
| Interest (income) | | | (43 | ) | | | (28 | ) | | | (97 | ) | | | (360 | ) | | | (139 | ) |
| Interest expense | | | 180 | | | | 153 | | | | 89 | | | | 81 | | | | 962 | |
| | | | | | | | | | | | | | | | |
| | | | | | | | | | | | | | | | | | | | | |
| Income (loss) before income taxes | | | 16,167 | | | | 1,784 | | | | (14,403 | ) | | | (10,691 | ) | | | 31,727 | |
| Income taxes | | | 5,339 | | | | 360 | | | | (989 | ) | | | 2,357 | | | | 10,938 | |
| | | | | | | | | | | | | | | | |
| | | | | | | | | | | | | | | | | | | | | |
| Net income (loss) | | $ | 10,828 | | | $ | 1,424 | | | $ | (13,414 | ) | | $ | (13,048 | ) | | $ | 20,789 | |
| | | | | | | | | | | | | | | | |
| | | | | | | | | | | | | | | | | | | | | |
| Earnings (loss) per common share | | | | | | | | | | | | | | | | | | | | |
| Basic | | $ | 0.45 | | | $ | 0.06 | | | $ | (0.62 | ) | | $ | (0.60 | ) | | $ | 0.96 | |
| Diluted | | $ | 0.44 | | | $ | 0.06 | | | $ | (0.62 | ) | | $ | (0.60 | ) | | $ | 0.95 | |
| | | | | | | | | | | | | | | | | | | | | |
| Cash dividends paid per share | | $ | 0.20 | | | $ | 0.20 | | | $ | 0.30 | | | $ | 0.63 | | | $ | 0.51 | |
| | | | | | | | | | | | | | | | | | | | | |
| Weighted average common shares | | | | | | | | | | | | | | | | | | | | |
| Basic | | | 24,287 | | | | 24,128 | | | | 21,800 | | | | 21,764 | | | | 21,676 | |
| Diluted | | | 24,339 | | | | 24,134 | | | | 21,800 | | | | 21,764 | | | | 21,924 | |
Balance Sheet Data:
(At June 30)
| | | 2011 | | | 2010 | | | 2009 | | | 2008 | | | 2007 | |
| Working capital | | $ | 84,524 | | | $ | 73,568 | | | $ | 72,500 | | | $ | 72,863 | | | $ | 68,397 | |
| Total assets | | | 176,021 | | | | 173,845 | | | | 153,118 | | | | 184,214 | | | | 233,612 | |
| Long-term debt, including current maturities | | | 1,099 | | | | 1,132 | | | | — | | | | — | | | | — | |
| Shareholders’ equity | | | 151,218 | | | | 144,218 | | | | 130,473 | | | | 149,190 | | | | 176,061 | |
| (a) | The Company recorded loss contingency reserves in fiscal years 2009 and 2008, and reversed a loss contingency reserve in fiscal 2007 — all related to a patent litigation matter. See Note 14. |
| (b) | The Company recorded a significant impairment of goodwill and intangible assets in fiscal 2009 and 2008. See Note 7. |
LSI INDUSTRIES INC. AND SUBSIDIARIES
SCHEDULE II — VALUATION AND QUALIFYING ACCOUNTS FOR THE YEARS ENDED JUNE 30, 2011, 2010, AND 2009
(In Thousands)
| COLUMN A | | COLUMN B | | | COLUMN C | | | COLUMN D | | | COLUMN E | | | COLUMN F | |
| | | | | | | Additions | | | Additions | | | | | | | | |
| | | Balance | | | Charged to | | | from | | | | | | | Balance | |
| | | Beginning | | | Costs and | | | Acquired | | | (a) | | | End of | |
| Description | | of Period | | | Expenses | | | Company | | | Deductions | | | Period | |
| | | | | | | | | | | | | | | | | | | | | |
| Allowance for Doubtful Accounts: | | | | | | | | | | | | | | | | | | | | |
| | | | | | | | | | | | | | | | | | | | | |
| Year Ended June 30, 2011 | | $ | 399 | | | $ | 1,183 | | | $ | — | | | $ | (756 | ) | | $ | 826 | |
| Year Ended June 30, 2010 | | $ | 532 | | | $ | 424 | | | $ | 9 | | | $ | (566 | ) | | $ | 399 | |
| Year Ended June 30, 2009 | | $ | 585 | | | $ | 135 | | | $ | — | | | $ | (188 | ) | | $ | 532 | |
| | | | | | | | | | | | | | | | | | | | | |
| Inventory Obsolescence Reserve: | | | | | | | | | | | | | | | | | | | | |
| | | | | | | | | | | | | | | | | | | | | |
| Year Ended June 30, 2011 | | $ | 1,537 | | | $ | 1,422 | | | $ | — | | | $ | (1,146 | ) | | $ | 1,813 | |
| Year Ended June 30, 2010 | | $ | 1,410 | | | $ | 1,517 | | | $ | 89 | | | $ | (1,479 | ) | | $ | 1,537 | |
| Year Ended June 30, 2009 | | $ | 1,638 | | | $ | 1,568 | | | $ | — | | | $ | (1,796 | ) | | $ | 1,410 | |
| | | | | | | | | | | | | | | | | | | | | |
| Deferred Tax Asset Valuation Reserve: | | | | | | | | | | | | | | | | | | | | |
| | | | | | | | | | | | | | | | | | | | | |
| Year Ended June 30, 2011 | | $ | 3,355 | | | $ | 845 | | | $ | — | | | $ | — | | | $ | 4,200 | |
| Year Ended June 30, 2010 | | $ | 1,940 | | | $ | 1,415 | | | $ | — | | | $ | — | | | $ | 3,355 | |
| Year Ended June 30, 2009 | | $ | 1,819 | | | $ | 121 | | | $ | — | | | $ | — | | | $ | 1,940 | |
| (a) | For Allowance for Doubtful Accounts, deductions are uncollectible accounts charged off, less recoveries. |