Exhibit 99.1

Annual Meeting of Shareholders Tuesday, June 8, 2021
Anders M. Tomson President & CEO David J. Dalrymple Chairman of the Board 2
Forward - Looking Statements This discussion contains forward - looking statements within the meaning of Section 27A of the Securities Act, Section 21E of the Exchange Act, and the Private Securities Litigation Reform Act of 1995. The Corporation intends its forward - looking statements to be covered by the safe harbor provisions for forward - looking statements in these sections. All statements regarding the Corporation’s expected financial position and operating results, the Corporation’s business strategy, the Corporation’s financial plans, forecasted demographic and economic trends relating to the Corporation’s industry and similar matters are forward - looking statements. These statements can sometimes be identified by the Corporation’s use of forward - looking words such as “may,” “will,” “anticipate,” “estimate,” “expect,” or “intend.” The Corporation cannot guarantee that its expectations in such forward - looking statements will turn out to be correct. The Corporation’s actual results could be materially different from expectations because of various factors, including changes in economic conditions or interest rates, credit risk, difficulties in managing the Corporation’s growth, competition, the impact of the COVID - 19 pandemic, changes in law or the regulatory environment, and changes in general business and economic trends. Information concerning these and other factors can be found in the Corporation’s 2020 Annual Report on Form 10 - K, in the section entitled “Risk Factors. These filings are available publicly on the SEC’s website at http://www.sec.gov , on the Corporation’s website at http://www.chemungcanal.com or by written request to: Kathleen S. McKillip, Corporate Secretary, Chemung Financial Corporation, One Chemung Canal Plaza, Elmira, NY 14901. Except as otherwise required by law, the Corporation undertakes no obligation to publicly update or revise its forward - looking statements, whether as a result of new information, future events or otherwise. 3
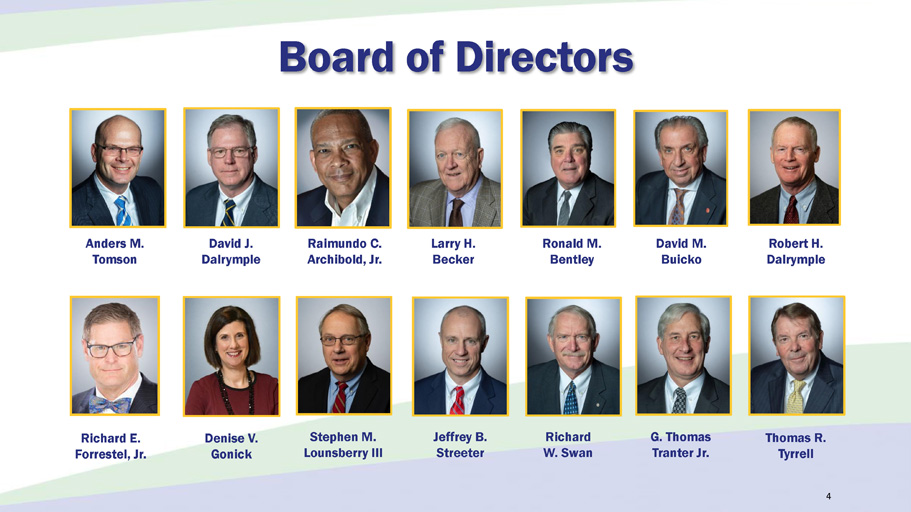
Board of Directors David J. Dalrymple Anders M. Tomson Larry H. Becker Ronald M. Bentley Raimundo C. Archibold , Jr. Stephen M. Lounsberry III Robert H. Dalrymple Denise V. Gonick Richard E. Forrestel , Jr. David M. Buicko 4 Richard W. Swan G. Thomas Tranter Jr. Jeffrey B. Streeter Thomas R. Tyrrell
Thank you, Rich! Richard W. Swan 5

Welcome New Directors! 6 Raimundo C. Archibold , Jr. Richard E. Forrestel , Jr.
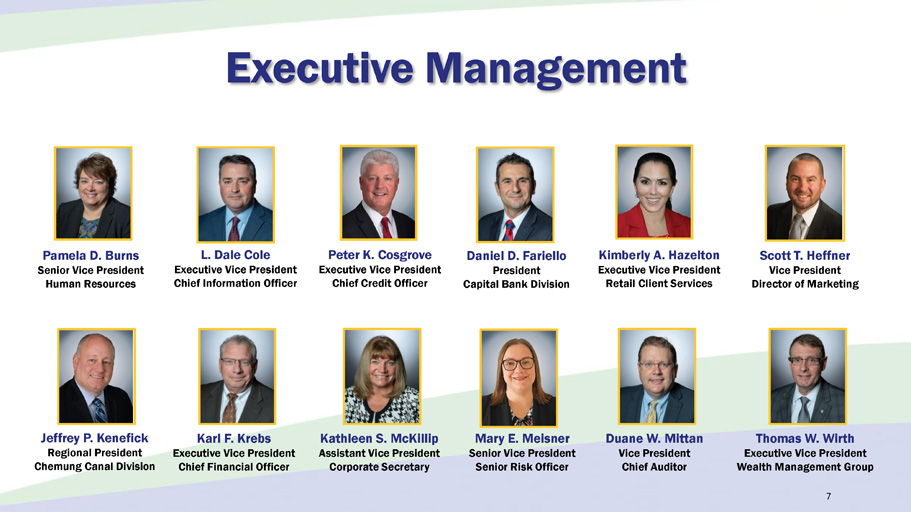
Executive Management 7 Pamela D. Burns Senior Vice President Human Resources L. Dale Cole Executive Vice President Chief Information Officer Peter K. Cosgrove Executive Vice President Chief Credit Officer Daniel D. Fariello President Capital Bank Division Kimberly A. Hazelton Executive Vice President Retail Client Services Scott T. Heffner Vice President Director of Marketing Mary E. Meisner Senior Vice President Senior Risk Officer Kathleen S. McKillip Assistant Vice President Corporate Secretary Karl F. Krebs Executive Vice President Chief Financial Officer Thomas W. Wirth Executive Vice President Wealth Management Group Duane W. Mittan Vice President Chief Auditor Jeffrey P. Kenefick Regional President Chemung Canal Division
8
Results & Initiatives • COVID - 19 Pandemic Response • 2020 Overview and Results • Corporate Realignments • First - Quarter 2021 9

Our Pandemic Response 10
11
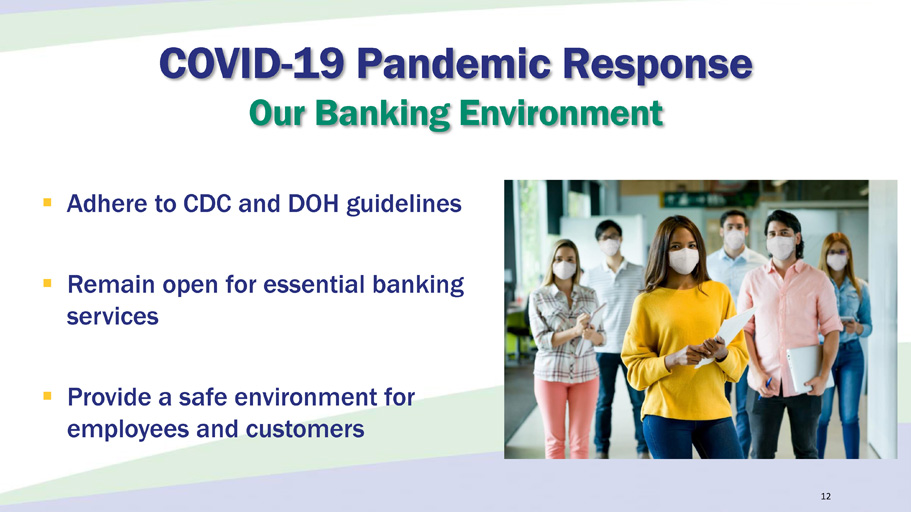
▪ Adhere to CDC and DOH guidelines ▪ Remain open for essential banking services ▪ Provide a safe environment for employees and customers 12 COVID - 19 Pandemic Response Our Banking Environment
▪ Waived or refunded over $30,000 in fees ▪ Provided short - term loan forbearance ▪ 1,064 customers for $211.2 million ▪ Processed over 57,000 Economic Impact Payments for $95.8 million ▪ Offered uninterrupted banking services COVID - 19 Pandemic Response Client Relief Efforts 13
COVID - 19 Pandemic Response Client Relief Efforts 14 ▪ Paycheck Protection Program (PPP) ▪ Phase 1 ▪ 1,260 loans made for $189.8 million ▪ Phase 2 ▪ 874 loans funded for $ 77.5 million

▪ Provided advice in a declining market ▪ Consulted on 401(k) strategies ▪ CARES Act for Retirement Plan Participants & Sponsors ▪ Required Minimum Distributions Waived ▪ Hardship distributions up to $100,000 COVID - 19 Pandemic Response Client Relief Efforts 15
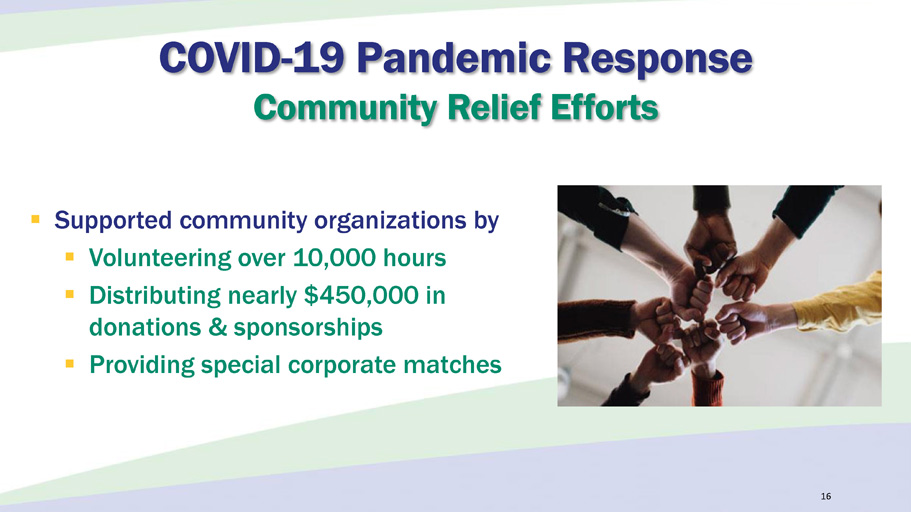
▪ Supported community organizations by ▪ Volunteering over 10,000 hours ▪ Distributing nearly $450,000 in donations & sponsorships ▪ Providing special corporate matches COVID - 19 Pandemic Response Community Relief Efforts 16
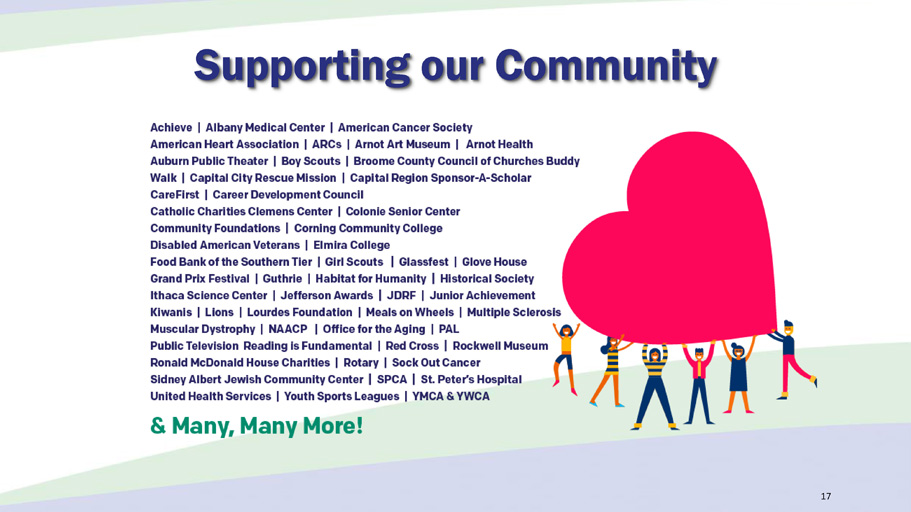
Supporting our Community 17
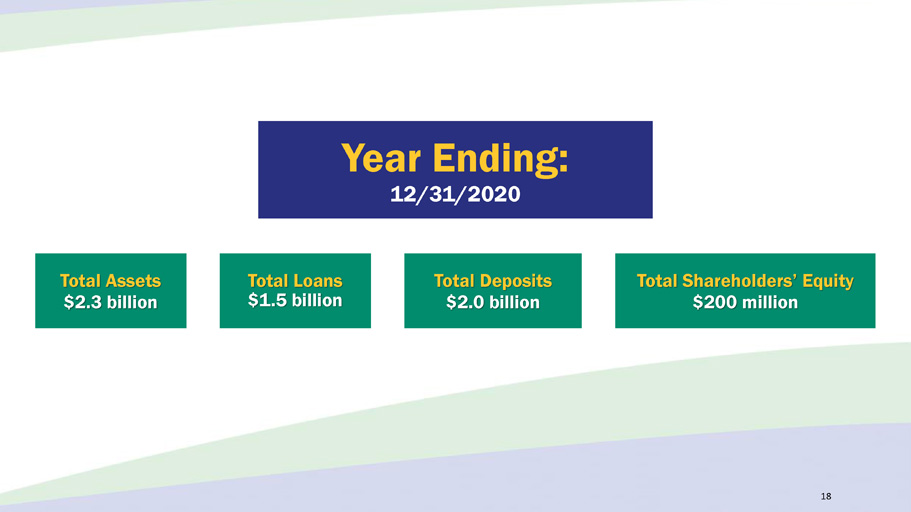
Year Ending: 12/31/2020 Total Assets $2.3 billion Total Loans $1.5 billion Total Deposits $2.0 billion Total Shareholders’ Equity $200 million 18

$17.1 9.3 % $199.7 12/31/2020 $182.6 12/31/2019 Total Shareholders’ Equity (In millions) 19
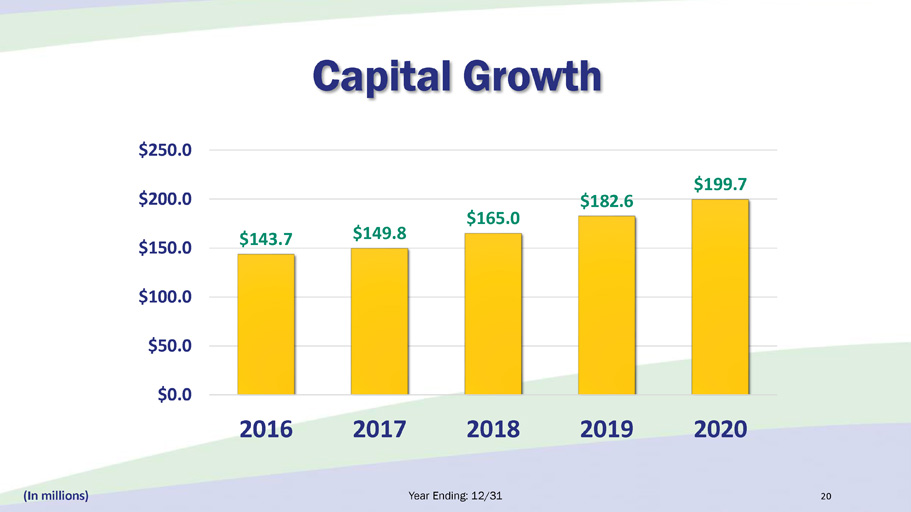
Capital Growth Year Ending: 12/31 20 $143.7 $149.8 $165.0 $182.6 $199.7 $0.0 $50.0 $100.0 $150.0 $200.0 $250.0 2016 2017 2018 2019 2020 (In millions)
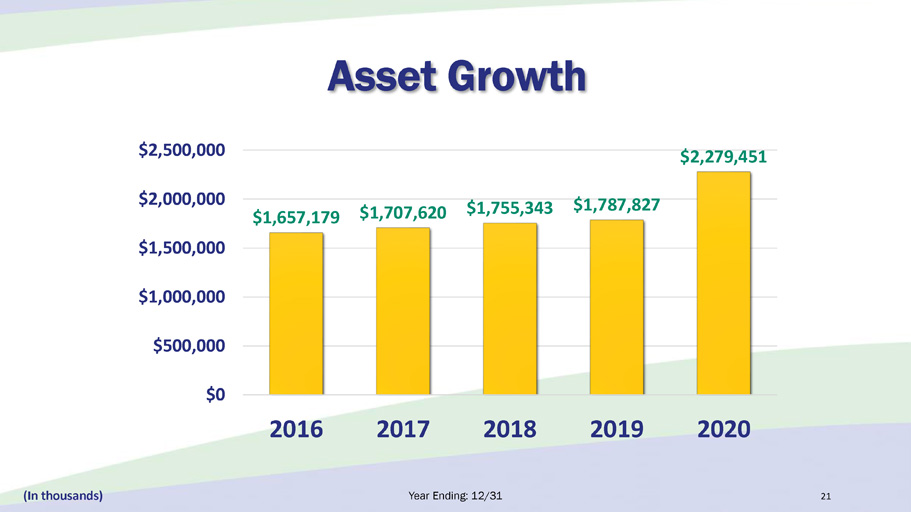
Asset Growth Year Ending: 12/31 21 $1,657,179 $1,707,620 $1,755,343 $1,787,827 $2,279,451 $0 $500,000 $1,000,000 $1,500,000 $2,000,000 $2,500,000 2016 2017 2018 2019 2020 (In thousands )
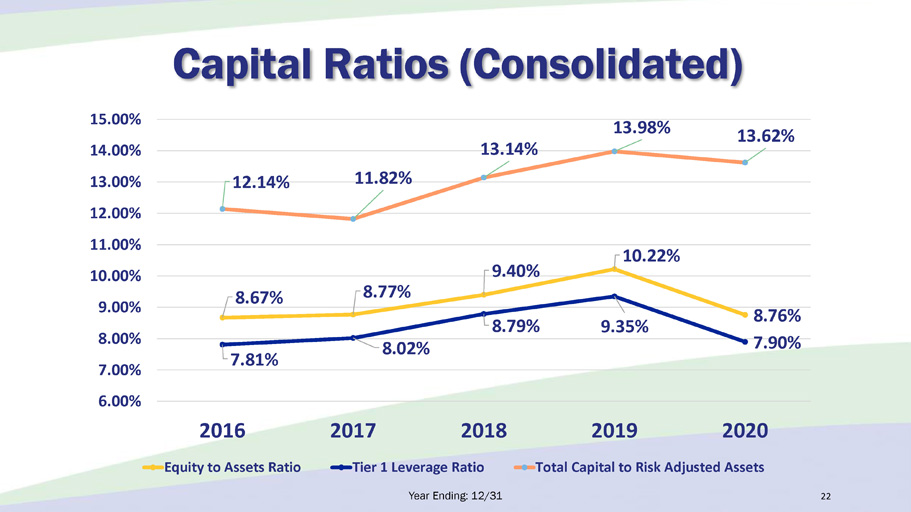
Capital Ratios (Consolidated) 22 8.67% 8.77% 9.40% 10.22% 8.76% 7.81% 8.02% 8.79% 9.35% 7.90% 12.14% 11.82% 13.14% 13.98% 13.62% 6.00% 7.00% 8.00% 9.00% 10.00% 11.00% 12.00% 13.00% 14.00% 15.00% 2016 2017 2018 2019 2020 Equity to Assets Ratio Tier 1 Leverage Ratio Total Capital to Risk Adjusted Assets Year Ending: 12/31
NET INCOME: $19.3 million EPS: $4.01 Year Ending: 12/31/2020 2020 Financial Results: 23
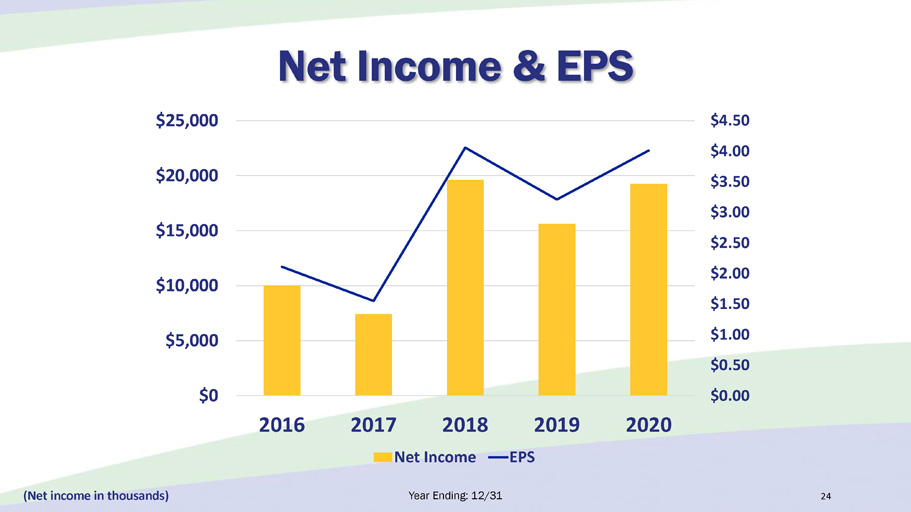
Year Ending: 12/31 24 Net Income & EPS $0.00 $0.50 $1.00 $1.50 $2.00 $2.50 $3.00 $3.50 $4.00 $4.50 $0 $5,000 $10,000 $15,000 $20,000 $25,000 2016 2017 2018 2019 2020 Net Income EPS (Net income in thousands)
0.94% 9.94% Year Ending: 12/31/2020 Return on Average Assets Return on Average Equity 25
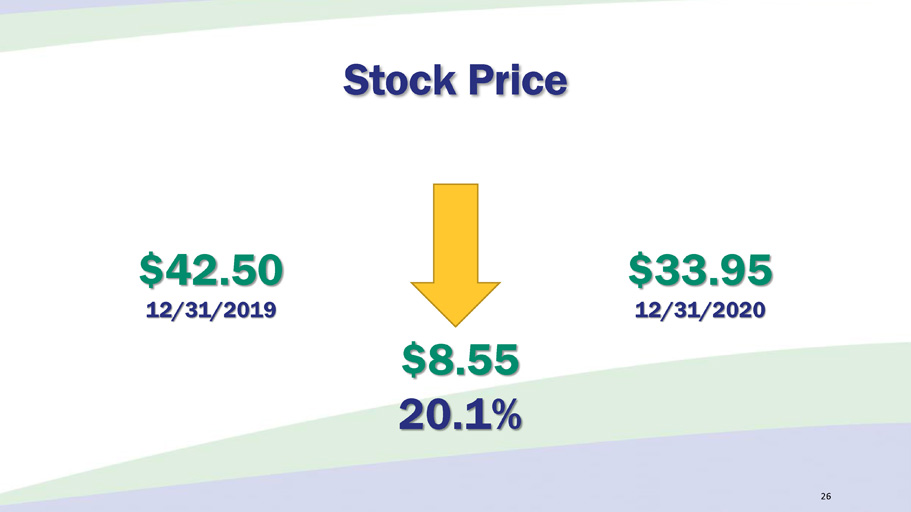
$8.55 20.1% $33.95 12/31/2020 $42.50 12/31/2019 Stock Price 26
$5.0 million $1.04 per share Year Ending: 12/31/2020 Dividends Declared 27
• Deposit & Lending Activity • Technology Enhancements • Growth & Consolidation • Operating Efficiencies • Share Repurchase Program • Continued Community Investment 2020 Key Initiatives 28
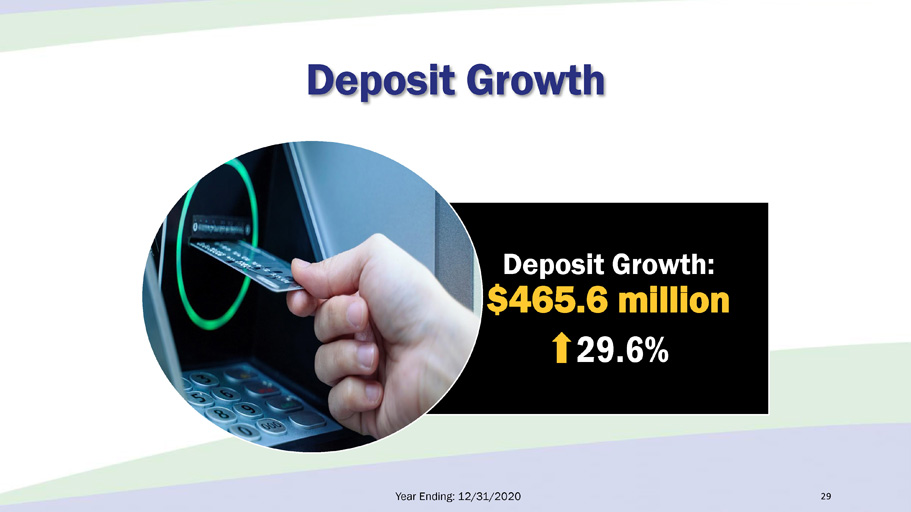
Deposit Growth: $465.6 million 29.6% Year Ending: 12/31/2020 Deposit Growth 29
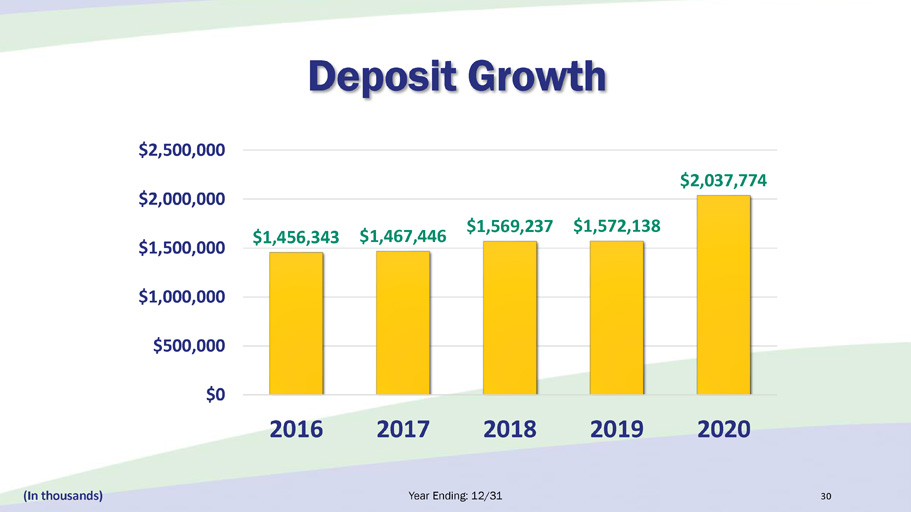
Deposit Growth Year Ending: 12/31 30 $1,456,343 $1,467,446 $1,569,237 $1,572,138 $2,037,774 $0 $500,000 $1,000,000 $1,500,000 $2,000,000 $2,500,000 2016 2017 2018 2019 2020 (In thousands )
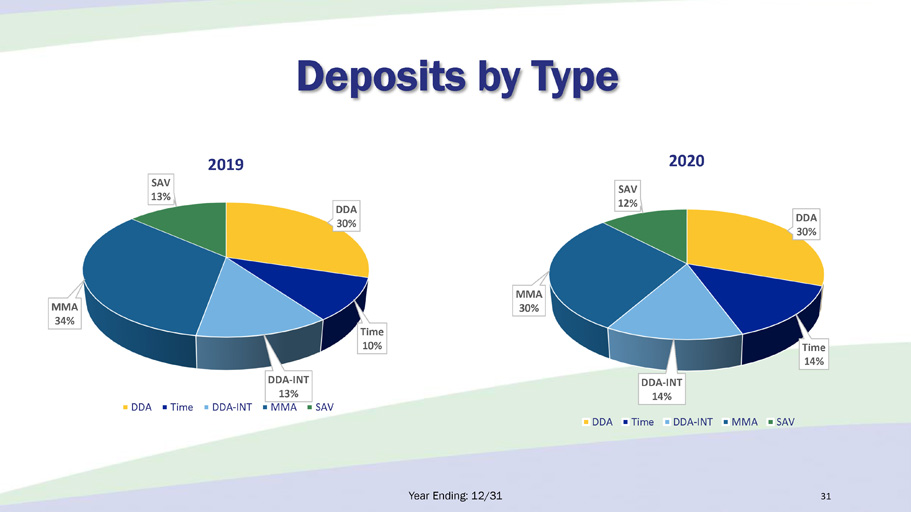
Deposits by Type Year Ending: 12/31 31 DDA 30% Time 14% DDA - INT 14% MMA 30% SAV 12% 2020 DDA Time DDA-INT MMA SAV DDA 30% Time 10% DDA - INT 13% MMA 34% SAV 13% 2019 DDA Time DDA-INT MMA SAV
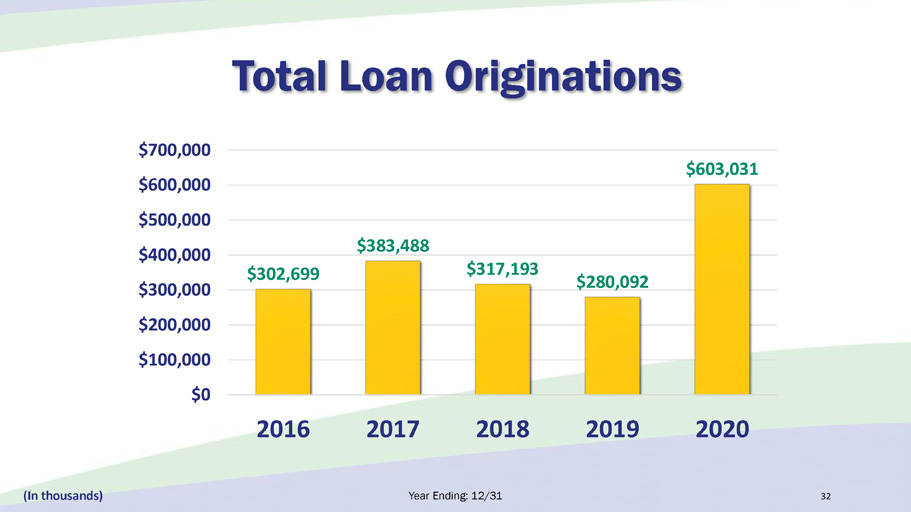
Total Loan Originations Year Ending: 12/31 32 $302,699 $383,488 $317,193 $280,092 $603,031 $0 $100,000 $200,000 $300,000 $400,000 $500,000 $600,000 $700,000 2016 2017 2018 2019 2020 (In thousands )
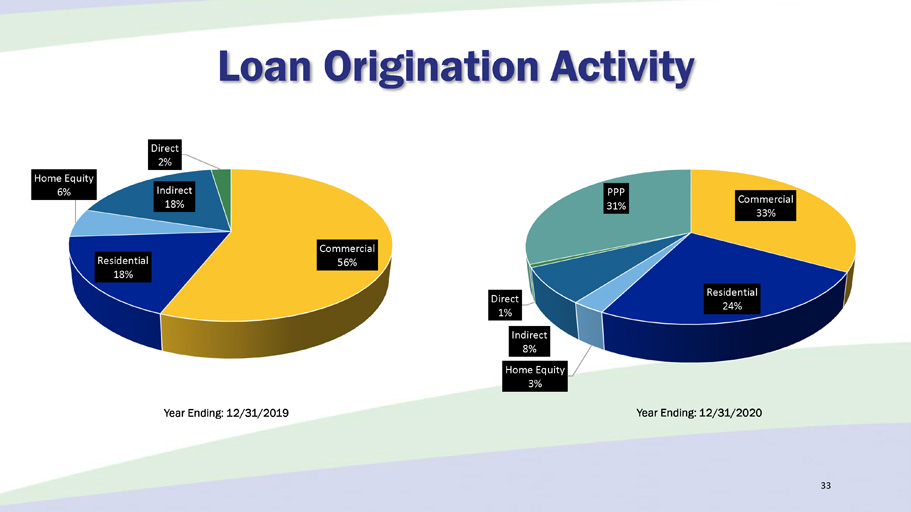
Loan Origination Activity 2019 Total: $267,599 2018 Total: $299,072 Year Ending: 12/31/2019 Year Ending: 12/31/2020 33 Commercial 56% Residential 18% Home Equity 6% Indirect 18% Direct 2% Commercial 33% Residential 24% Home Equity 3% Indirect 8% Direct 1% PPP 31%

Residential Mortgage Production 34 (In thousands) $97,777 194.6% $148,019 12/31/2020 $50,242 12/31/2019
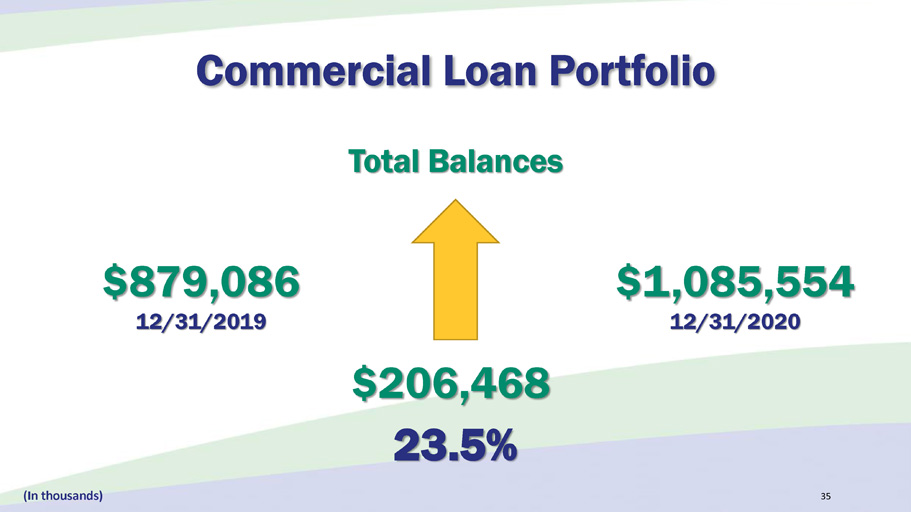
23.5% $1,085,554 12/31/2020 $879,086 12/31/2019 Total Balances $206,468 Commercial Loan Portfolio (In thousands) 35
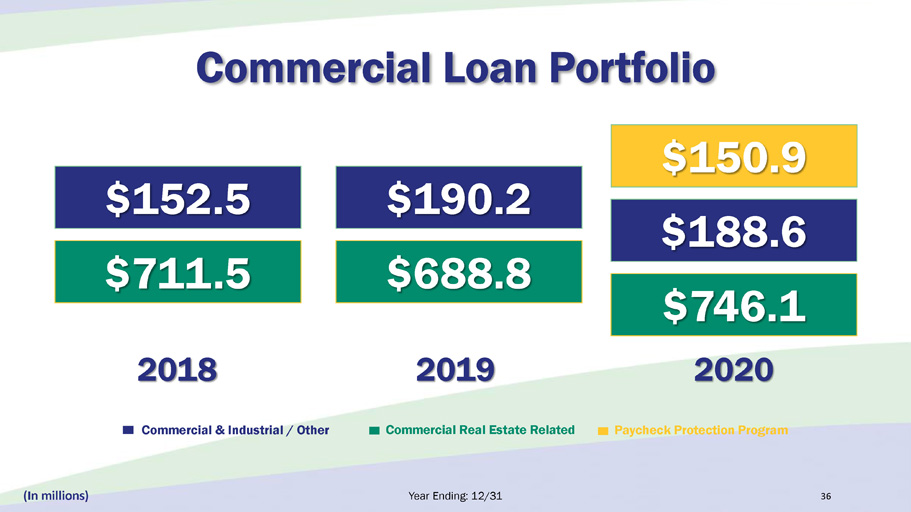
Commercial Loan Portfolio 2018 2019 2020 $746.1 $188.6 Year Ending: 12/31 Commercial & Industrial / Other Commercial Real Estate Related (In millions) 36 $711.5 $152.5 $688.8 $190.2 $150.9 Paycheck Protection Program
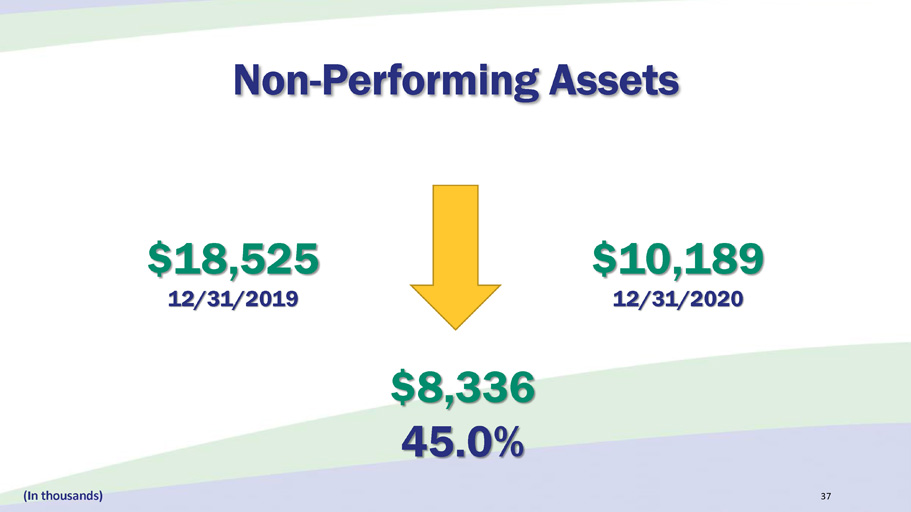
$8,336 45.0 % $10,189 12/31/2020 $18,525 12/31/2019 Non - Performing Assets (In thousands) 37
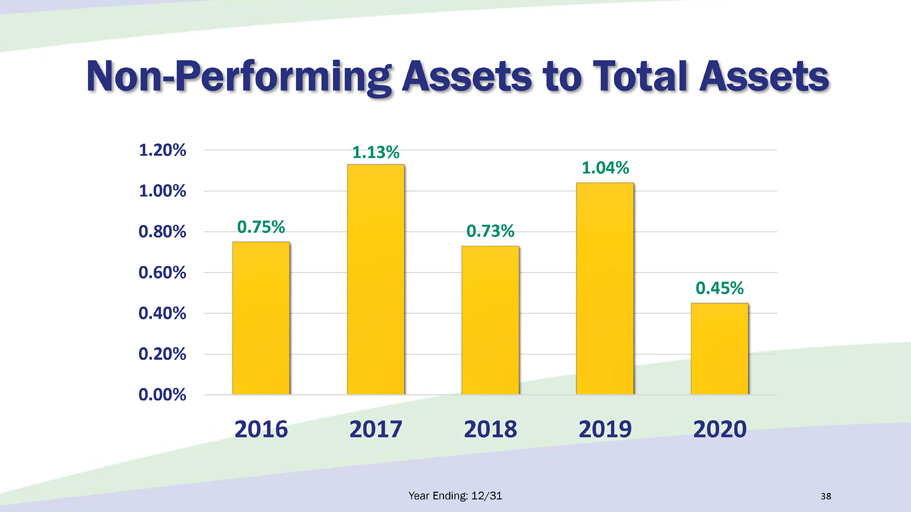
Non - Performing Assets to Total Assets Year Ending: 12/31 38 0.75% 1.13% 0.73% 1.04% 0.45% 0.00% 0.20% 0.40% 0.60% 0.80% 1.00% 1.20% 2016 2017 2018 2019 2020
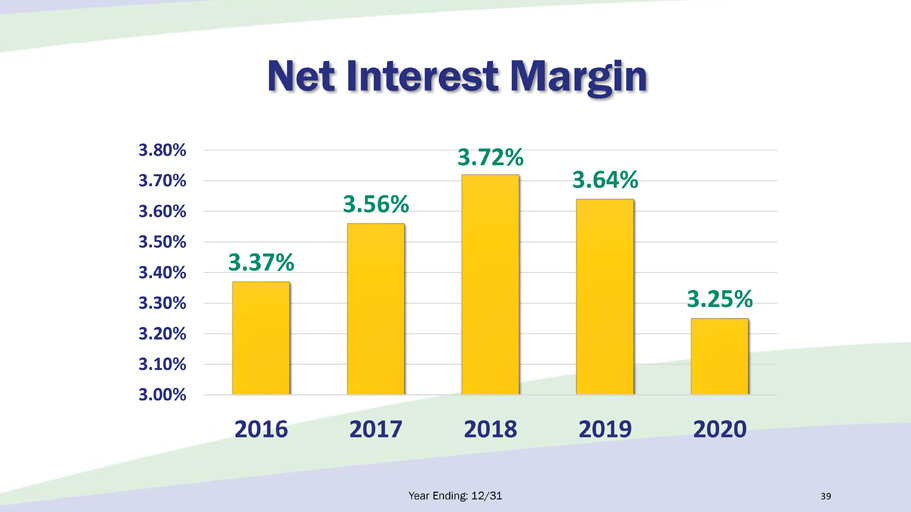
Net Interest Margin Year Ending: 12/31 39 3.37% 3.56% 3.72% 3.64% 3.25% 3.00% 3.10% 3.20% 3.30% 3.40% 3.50% 3.60% 3.70% 3.80% 2016 2017 2018 2019 2020

CCTC 0.31% Peer Group 0.60% Year Ending: 12/31/2019 Year Ending: 12/31/2020 Cost of Interest - Bearing Deposits 40 CCTC 0.56% Peer Group 1.01%

Net Interest Income (In thousands) Year Ending: 12/31 41 $52,329 $56,987 $60,480 $60,611 $62,919 $44,000 $48,000 $52,000 $56,000 $60,000 $64,000 2016 2017 2018 2019 2020
$2.1 Billion Assets Under Management & Administration $9.5 Million Fee Income Year Ending: 12/31/2020 Wealth Management Group 42
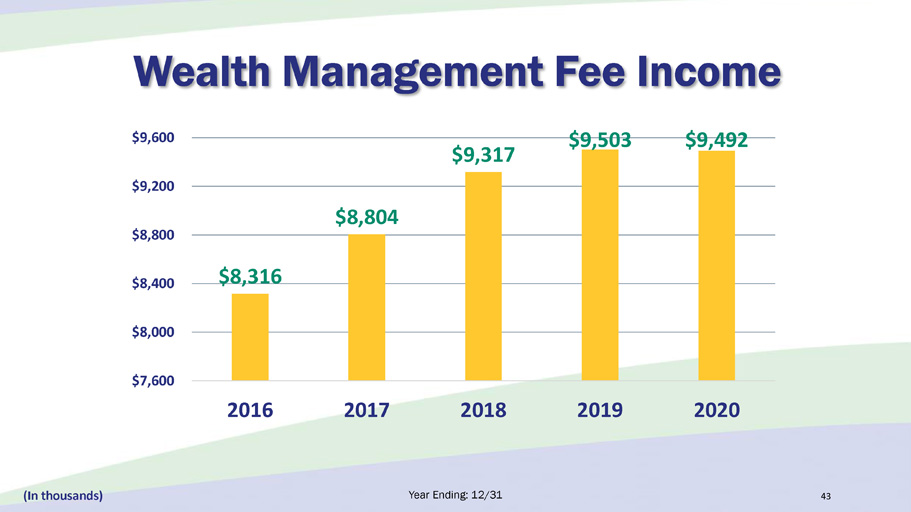
Wealth Management Fee Income (In thousands) Year Ending: 12/31 43 $8,316 $8,804 $9,317 $9,503 $9,492 $7,600 $8,000 $8,400 $8,800 $9,200 $9,600 2016 2017 2018 2019 2020
44
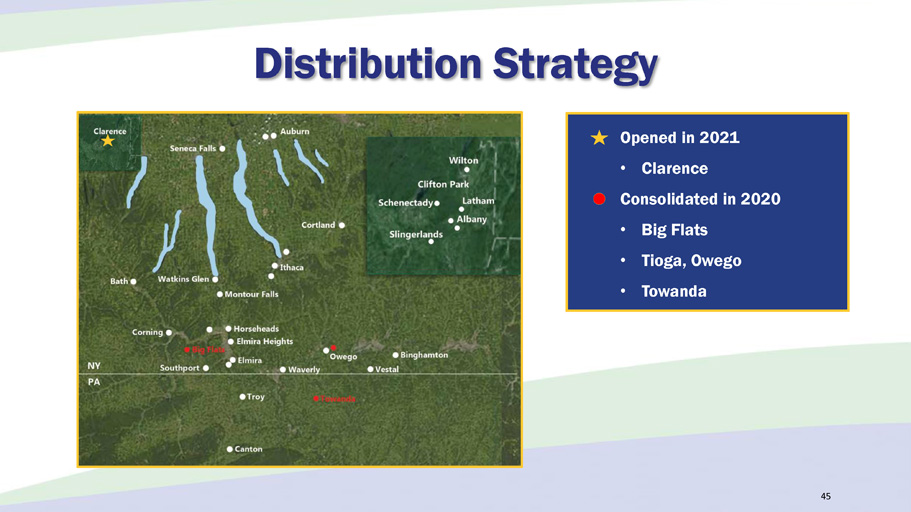
Distribution Strategy Opened in 2021 • Clarence Consolidated in 2020 • Big Flats • Tioga, Owego • Towanda 45

Western NY Expansion 46

▪ Continued Focus on our Digital Future ▪ Introduced Zelle ® - Secure P2P Payment Option in Mobile Banking ▪ Mobile Deposit Enhancements ▪ PPP Processing & Forgiveness ▪ Robotic Process Automation Enhancing Our Digital Platform 47
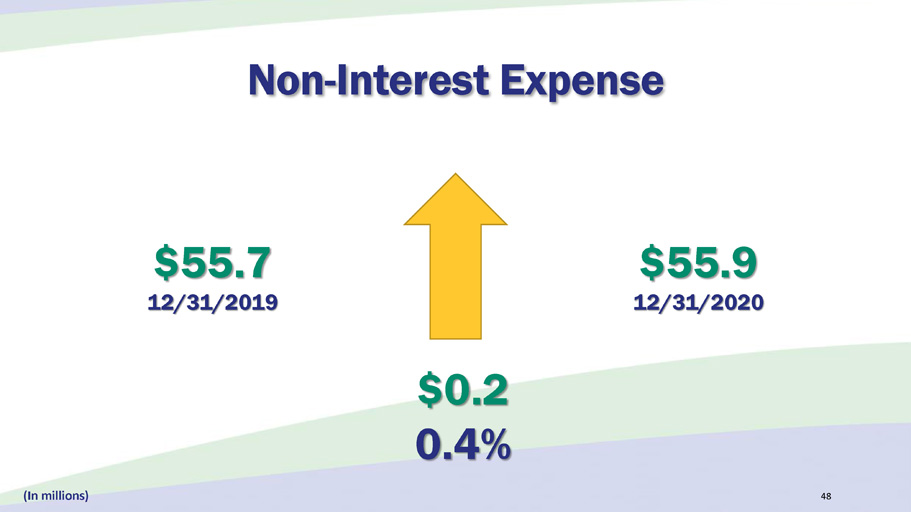
$0.2 0.4 % $ 55.9 12/31/2020 $ 55.7 12/31/2019 Non - Interest Expense 48 (In millions)
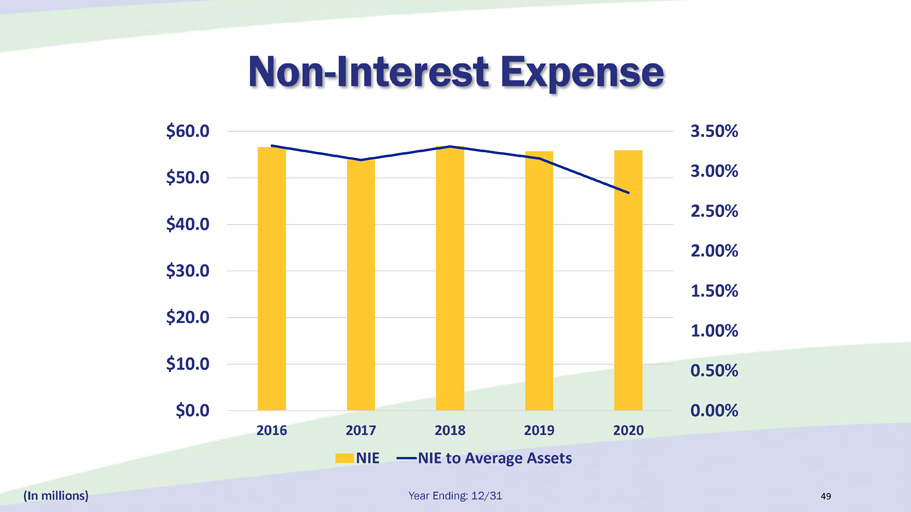
Non - Interest Expense Year Ending: 12/31 49 (In millions) 0.00% 0.50% 1.00% 1.50% 2.00% 2.50% 3.00% 3.50% $0.0 $10.0 $20.0 $30.0 $40.0 $50.0 $60.0 2016 2017 2018 2019 2020 NIE NIE to Average Assets

Employees, Full - Time Equivalent Year Ending: 12/31 50 368 371 374 362 341 320 330 340 350 360 370 380 2016 2017 2018 2019 2020
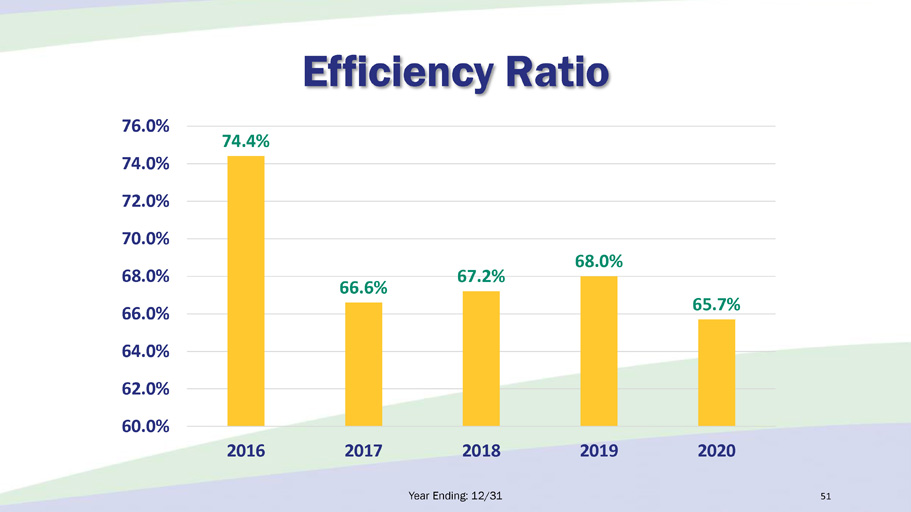
51 Efficiency Ratio 74.4% 66.6% 67.2% 68.0% 65.7% 60.0% 62.0% 64.0% 66.0% 68.0% 70.0% 72.0% 74.0% 76.0% 2016 2017 2018 2019 2020 Year Ending: 12/31

Share Repurchase Programs 52 • 2020 • Repurchased 250,000 shares (approximately 5% of outstanding shares) • Average cost of $29.40 per share • 2021 • 20,625 shares repurchased as of May 31 • Average cost of $34.98 per share • Impact • Increase of $0.19 to EPS as of April 30

53

2021 First - Quarter Recap 54 • Loans increased 2.90% • Non - performing loans decreased 7.00 % • Represents 0.59% of total loans • Unadjusted efficiency ratio decreased to 62.38% • 69.72% in fourth - quarter 2020 • Continued margin compression • Earnings of $6.5 million / $1.39 per share
Corporate Responsibility 55 We embrace our corporate responsibility and commit to fully supporting every community within our footprint. This responsibility requires inclusion, volunteerism, financial support, thoughtful partnerships and the responsible management of our environmental impact. The value we provide to these communities is an integral part of who we are. Our employees’ leadership and service in charitable and civic organizations is foundational to our corporate citizenship. We serve diverse communities and value a representative workforce and Board of Directors. Our community - banking mission focuses equally on all of our stakeholders and promotes the long - term sustainability of our communities.
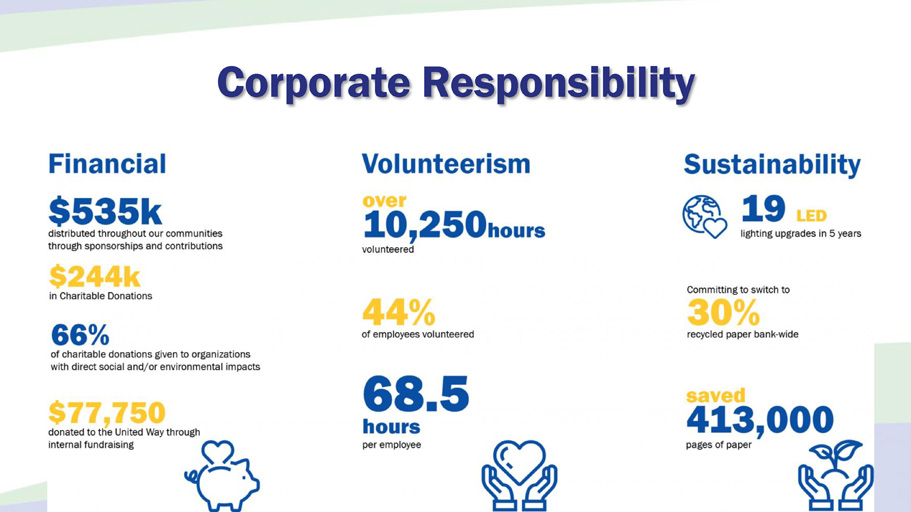
Corporate Responsibility 56
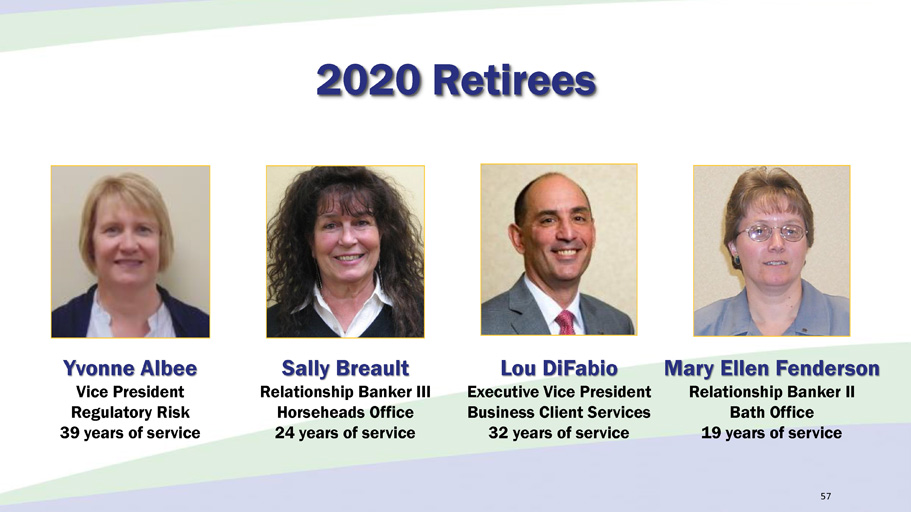
2020 Retirees Yvonne Albee Vice President Regulatory Risk 39 years of service Lou DiFabio Executive Vice President Business Client Services 32 years of service Sally Breault Relationship Banker III Horseheads Office 24 years of service Mary Ellen Fenderson Relationship Banker II Bath Office 19 years of service 57

2020 Retirees Maryanne Kalec Senior Vice President Retail Lending 23 years of service John Sentigar Vice President Information Technology 15 years of service Jack Narosky Assistant Vice President Business Client Services 7 years of service Mike Wayne Senior Vice President Director of Marketing 14 years of service 58

59 Corporate Realignments • Executive Management Team • Market Teams
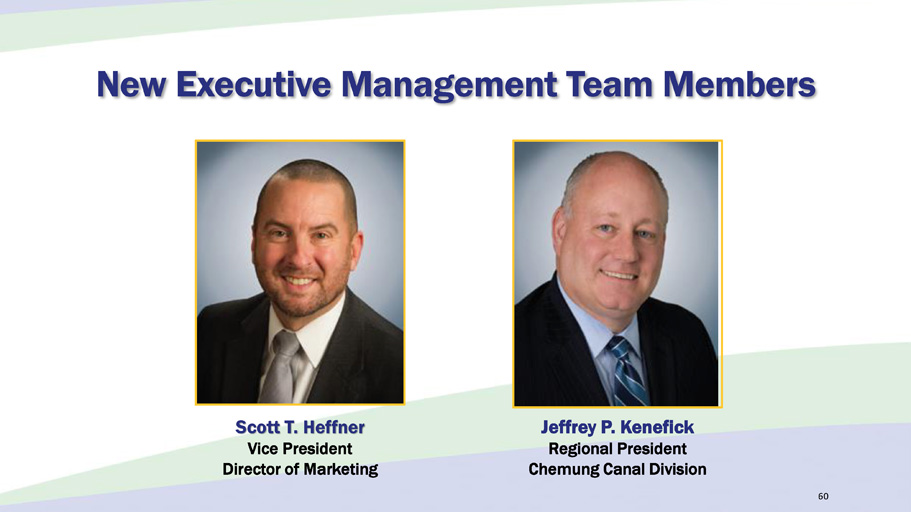
New Executive Management Team Members 60 Jeffrey P. Kenefick Regional President Chemung Canal Division Scott T. Heffner Vice President Director of Marketing
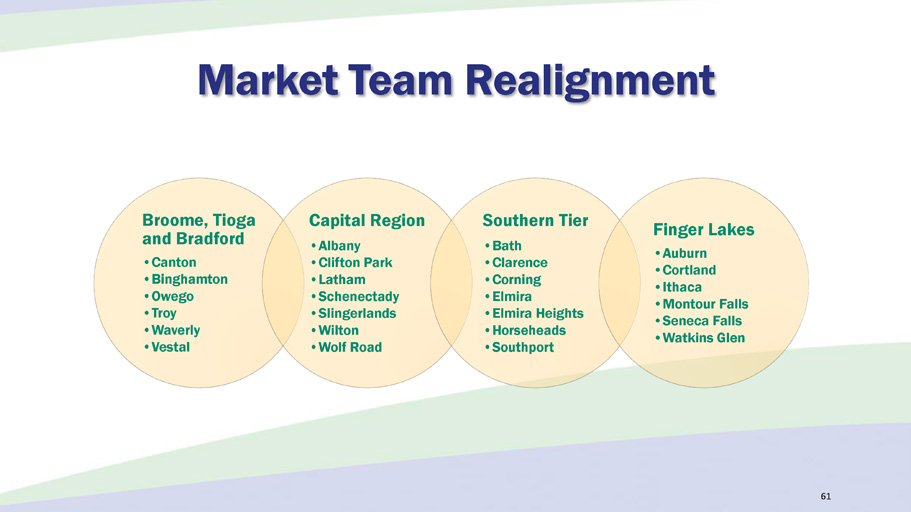
Market Team Realignment 61 Broome, Tioga and Bradford • Canton • Binghamton • Owego • Troy • Waverly • Vestal Capital Region • Albany • Clifton Park • Latham • Schenectady • Slingerlands • Wilton • Wolf Road Southern Tier • Bath • Clarence • Corning • Elmira • Elmira Heights • Horseheads • Southport Finger Lakes • Auburn • Cortland • Ithaca • Montour Falls • Seneca Falls • Watkins Glen

62

63
Annual Meeting of Shareholders Tuesday, June 8, 2021