Exhibit 99.1
Annual Meeting of Shareholders Tuesday, June 7, 2022
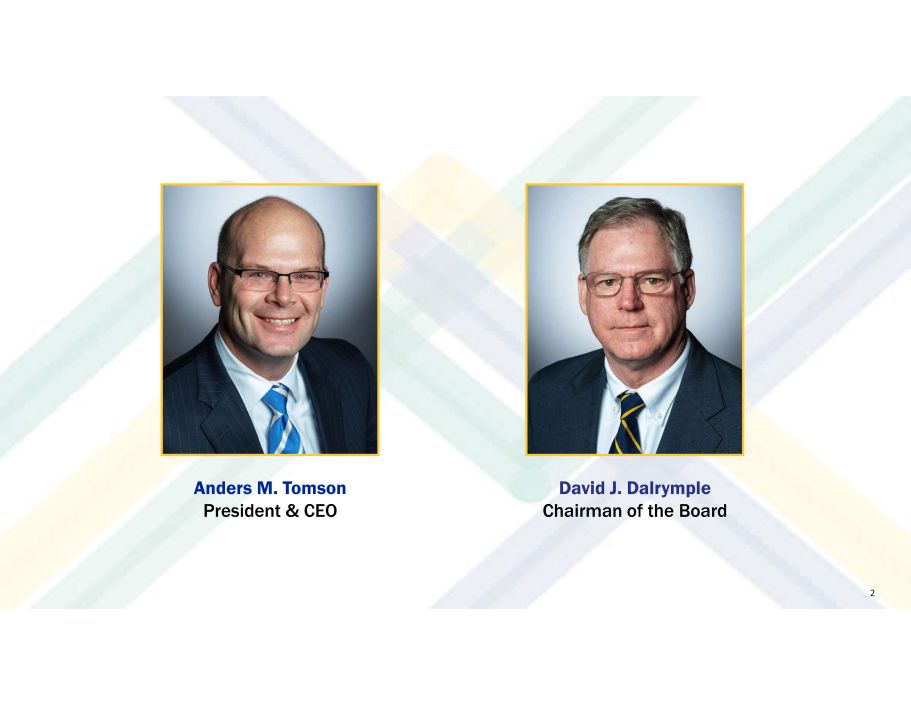
Anders M. Tomson President & CEO David J. Dalrymple Chairman of the Board 2

Agenda • 2021 Overview and Results • 2022 First - Quarter Recap • Key Initiatives & Efforts 3
Forward - Looking Statements This report contains forward - looking statements within the meaning of Section 27A of the Securities Act, Section 21E of the Exchange Act, and the Private Securities Litigation Reform Act of 1995. The Corporation intends its forward - looking statements to be covered by the safe harbor provisions for forward - looking statements in these sections. All statements regarding the Corporation’s expected financial position and operating results, the Corporation’s business strategy, the Corporation’s financial plans, forecasted demographic and economic trends relating to the Corporation’s industry and similar matters are forward - looking statements. These statements can sometimes be identified by the Corporation’s use of forward - looking words such as “may,” “will,” “anticipate,” “estimate,” “expect,” or “intend.” The Corporation cannot guarantee that its expectations in such forward - looking statements will turn out to be correct. The Corporation’s actual results could be materially different from expectations because of various factors, including changes in economic conditions or interest rates, credit risk, difficulties in managing the Corporation’s growth, competition, the impact of the COVID - 19 pandemic, changes in law or the regulatory environment, inflation , and changes in general business and economic trends. Information concerning these and other factors can be found in the Corporation’s 2021 Annual Report on Form 10 - K. These filings are available publicly on the SEC’s website at sec.gov , on the Corporation’s website at chemungcanal.com or by written request to: Kathleen S. McKillip, Corporate Secretary, Chemung Financial Corporation, One Chemung Canal Plaza, Elmira, NY 14901. Except as otherwise required by law, the Corporation undertakes no obligation to publicly update or revise its forward - looking statements, whether as a result of new information, future events or otherwise. 4
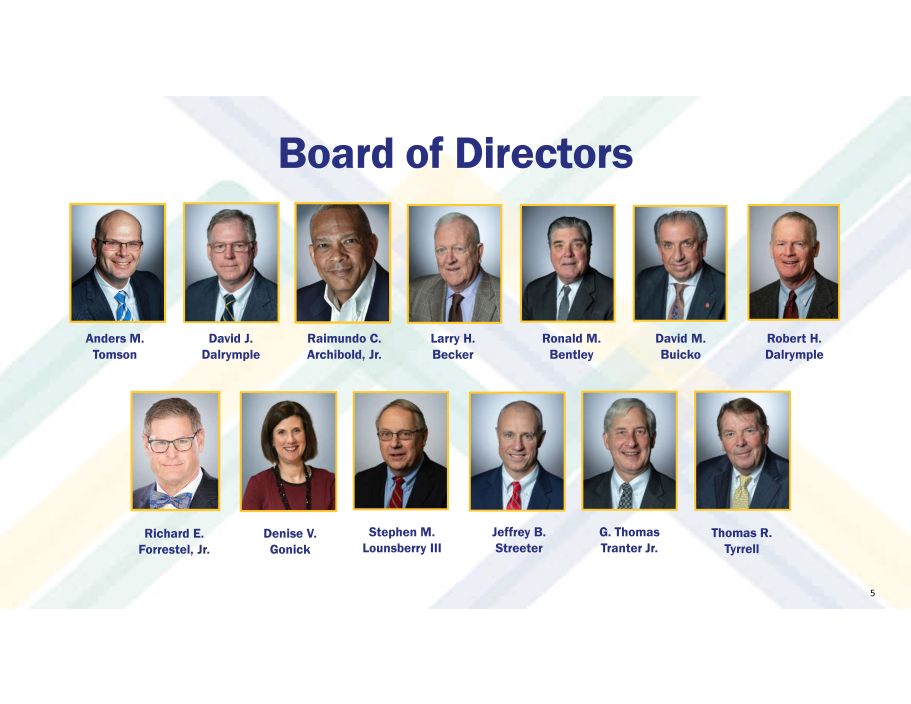
Board of Directors David J. Dalrymple Anders M. Tomson Larry H. Becker Ronald M. Bentley Raimundo C. Archibold , Jr. Stephen M. Lounsberry III Robert H. Dalrymple Denise V. Gonick Richard E. Forrestel , Jr. David M. Buicko 5 G. Thomas Tranter Jr. Jeffrey B. Streeter Thomas R. Tyrrell

Thank you, Larry! 6 Larry H. Becker

7
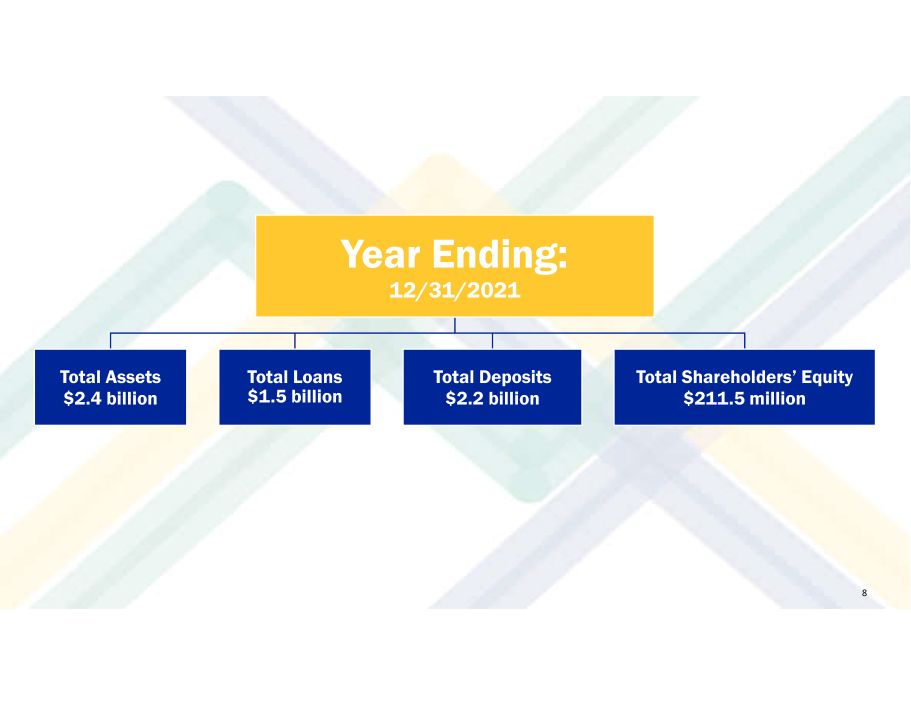
Year Ending: 12/31/2021 Total Assets $2.4 billion Total Loans $1.5 billion Total Deposits $2.2 billion Total Shareholders’ Equity $211.5 million 8
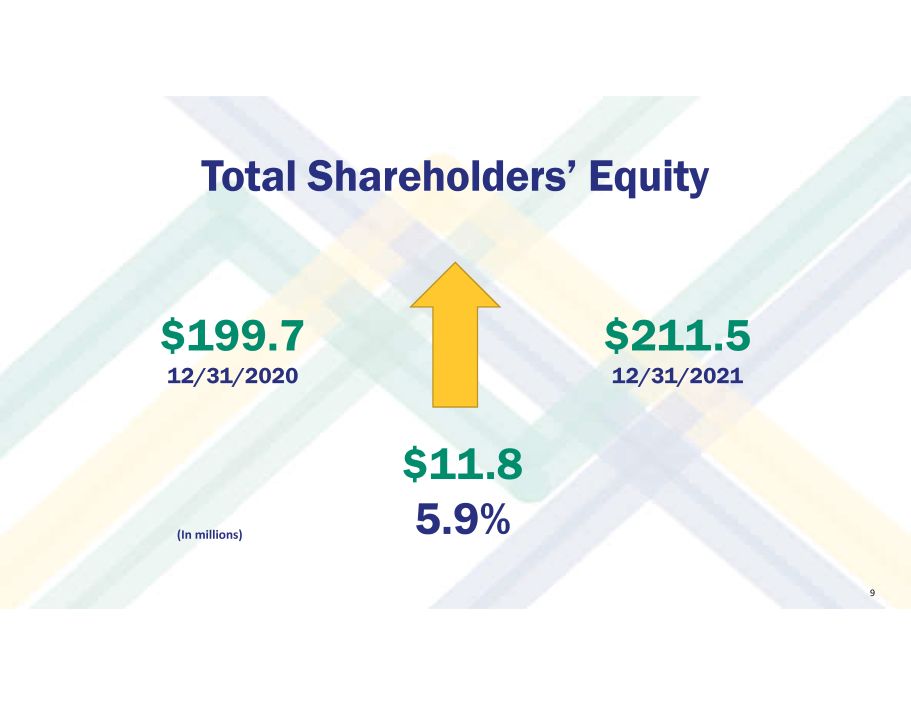
$11.8 5.9% $211.5 12/31/2021 $199.7 12/31/2020 Total Shareholders’ Equity (In millions) 9
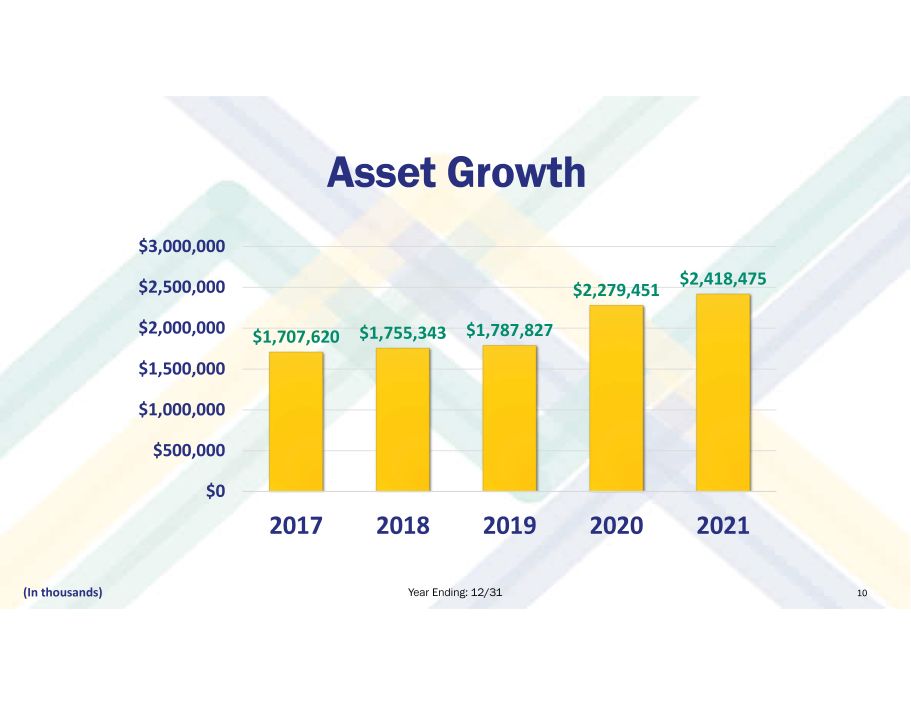
Asset Growth Year Ending: 12/31 10 $1,707,620 $1,755,343 $1,787,827 $2,279,451 $2,418,475 $0 $500,000 $1,000,000 $1,500,000 $2,000,000 $2,500,000 $3,000,000 2017 2018 2019 2020 2021 (In thousands )
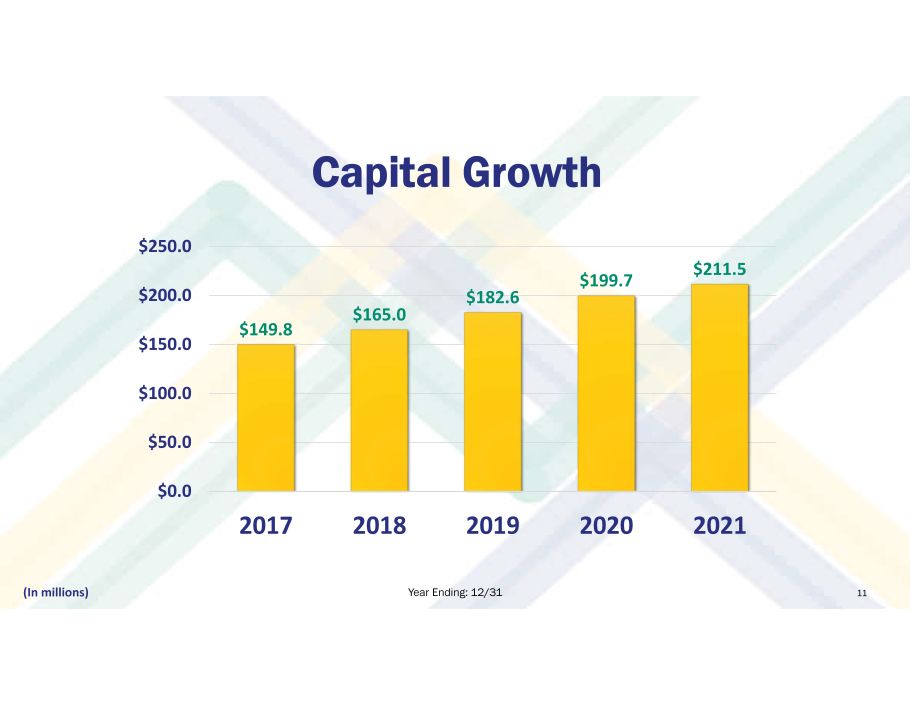
Capital Growth Year Ending: 12/31 11 $149.8 $165.0 $182.6 $199.7 $211.5 $0.0 $50.0 $100.0 $150.0 $200.0 $250.0 2017 2018 2019 2020 2021 (In millions)
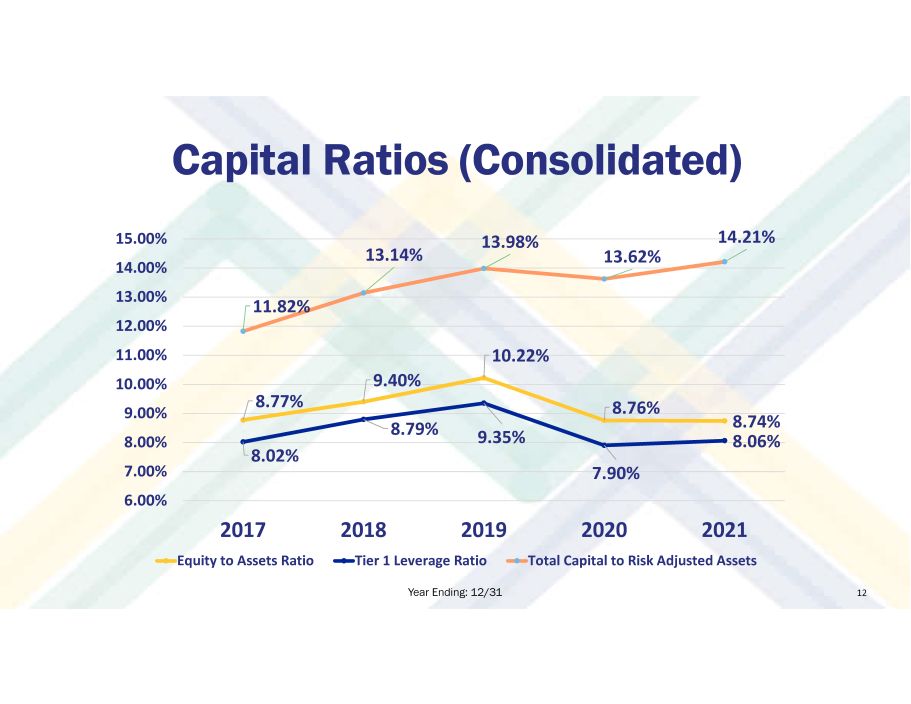
Capital Ratios (Consolidated) 12 8.77% 9.40% 10.22% 8.76% 8.74% 8.02% 8.79% 9.35% 7.90% 8.06% 11.82% 13.14% 13.98% 13.62% 14.21% 6.00% 7.00% 8.00% 9.00% 10.00% 11.00% 12.00% 13.00% 14.00% 15.00% 2017 2018 2019 2020 2021 Equity to Assets Ratio Tier 1 Leverage Ratio Total Capital to Risk Adjusted Assets Year Ending: 12/31
NET INCOME: $26.4 million EPS: $5.64 Year Ending: 12/31/2021 2021 Financial Results: 13
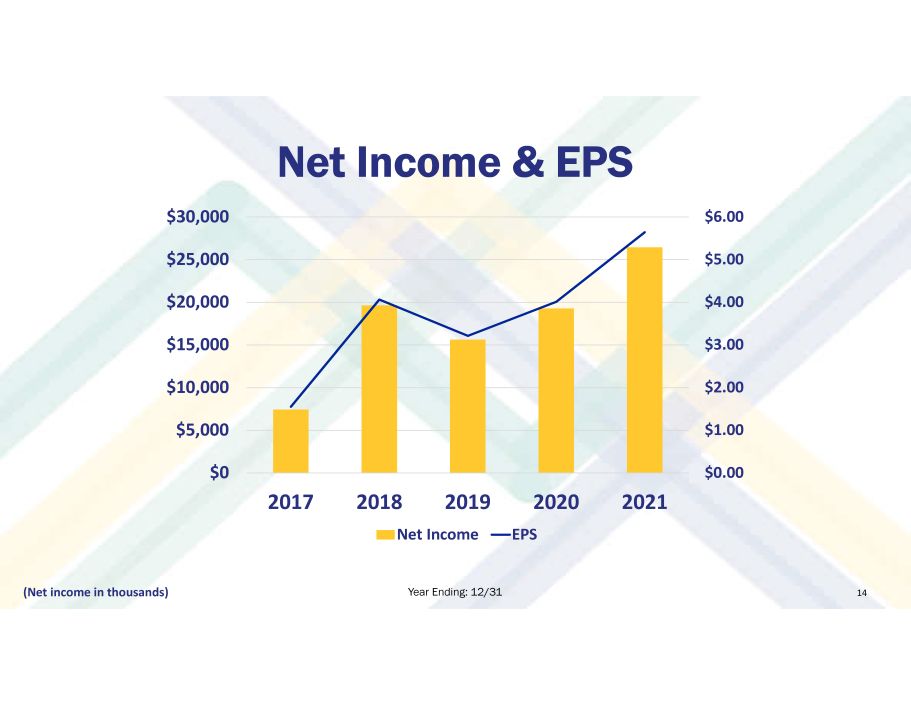
Year Ending: 12/31 14 Net Income & EPS $0.00 $1.00 $2.00 $3.00 $4.00 $5.00 $6.00 $0 $5,000 $10,000 $15,000 $20,000 $25,000 $30,000 2017 2018 2019 2020 2021 Net Income EPS (Net income in thousands)

Average Shares Outstanding Year Ending: 12/31 15 4,800 4,832 4,869 4,802 4,683 4,550 4,600 4,650 4,700 4,750 4,800 4,850 4,900 2017 2018 2019 2020 2021 (In thousands)
Year Ending: 12/31/2021 16 1.09% 12.94% Return on Average Assets Return on Average Equity
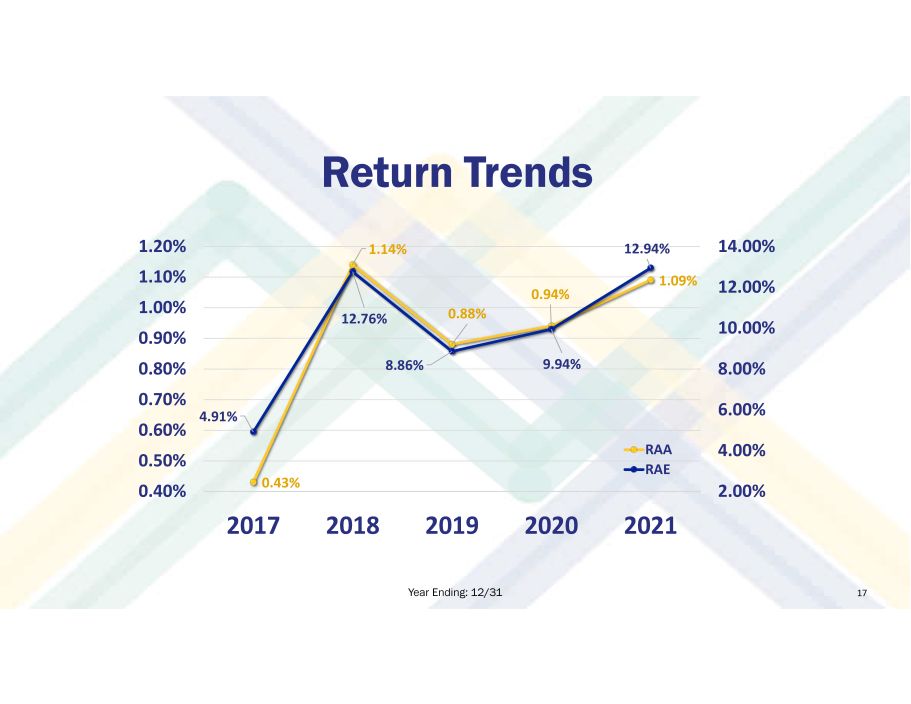
Return Trends Year Ending: 12/31 17 0.43% 1.14% 0.88% 0.94% 1.09% 4.91% 12.76% 8.86% 9.94% 12.94% 2.00% 4.00% 6.00% 8.00% 10.00% 12.00% 14.00% 0.40% 0.50% 0.60% 0.70% 0.80% 0.90% 1.00% 1.10% 1.20% 2017 2018 2019 2020 2021 RAA RAE
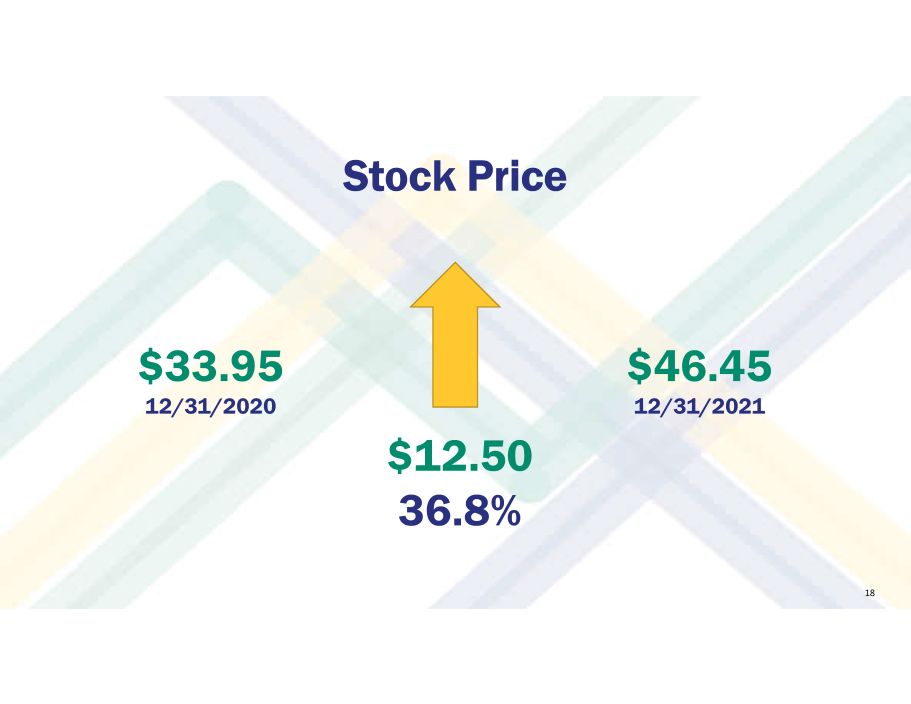
$12.50 36.8% $46.45 12/31/2021 $33.95 12/31/2020 Stock Price 18

Total Shareholder Return Year Ending: 12/31 19 35.19% - 11.95% 5.40% - 17.67% 40.16% -30.00% -20.00% -10.00% 0.00% 10.00% 20.00% 30.00% 40.00% 50.00% 2017 2018 2019 2020 2021
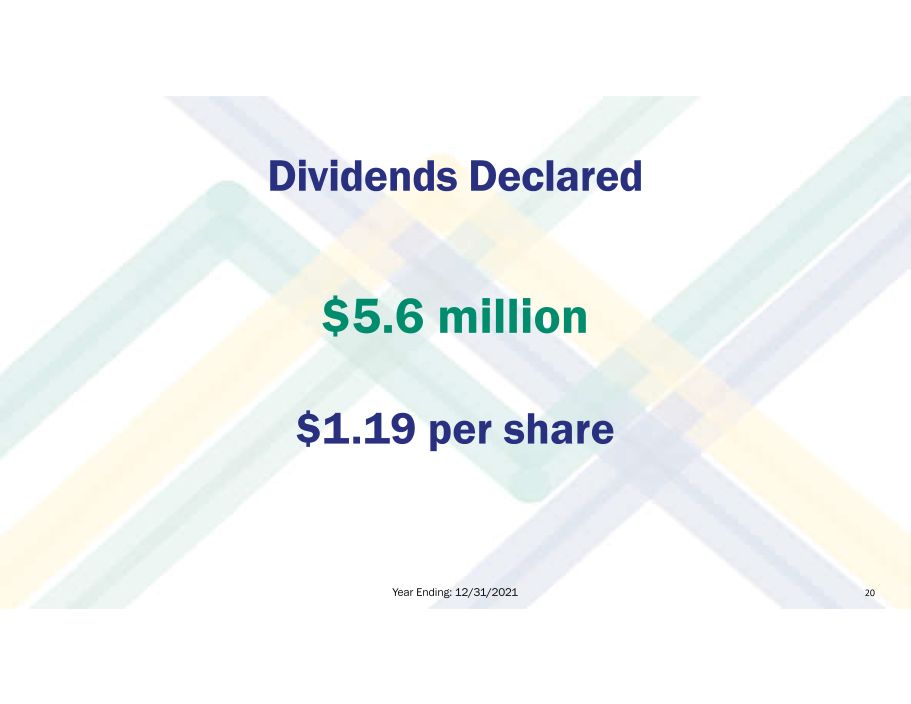
$ 5.6 million $ 1.19 per share Year Ending: 12/31/2021 Dividends Declared 20

Our Pandemic Response 21

22
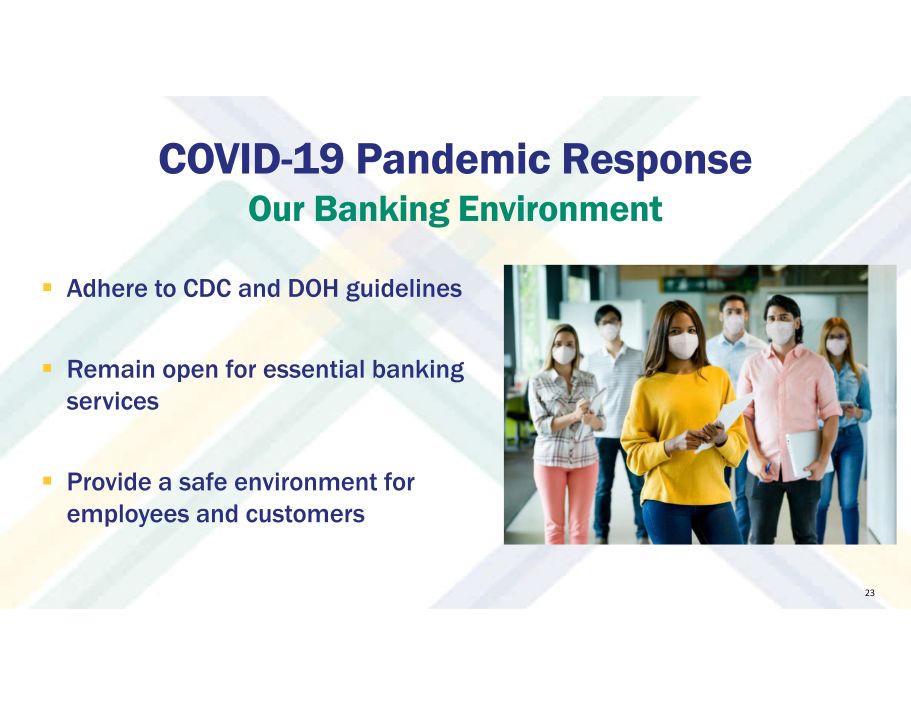
▪ Adhere to CDC and DOH guidelines ▪ Remain open for essential banking services ▪ Provide a safe environment for employees and customers 23 COVID - 19 Pandemic Response Our Banking Environment
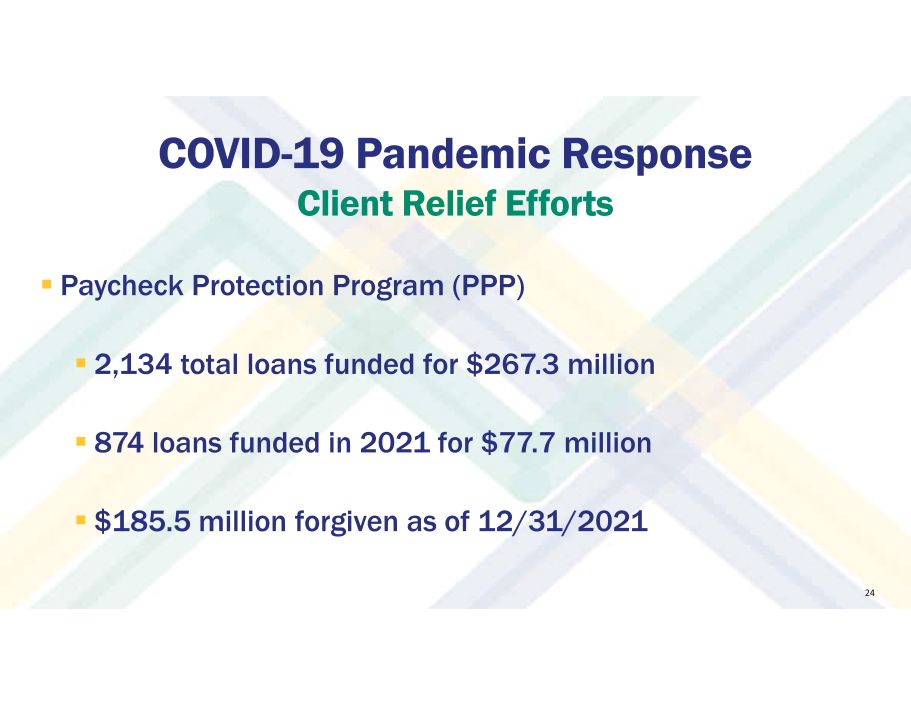
COVID - 19 Pandemic Response Client Relief Efforts 24 ▪ Paycheck Protection Program ( PPP) ▪ 2,134 total loans funded for $267.3 million ▪ 874 loans funded in 2021 for $77.7 million ▪ $185.5 million forgiven as of 12/31/2021
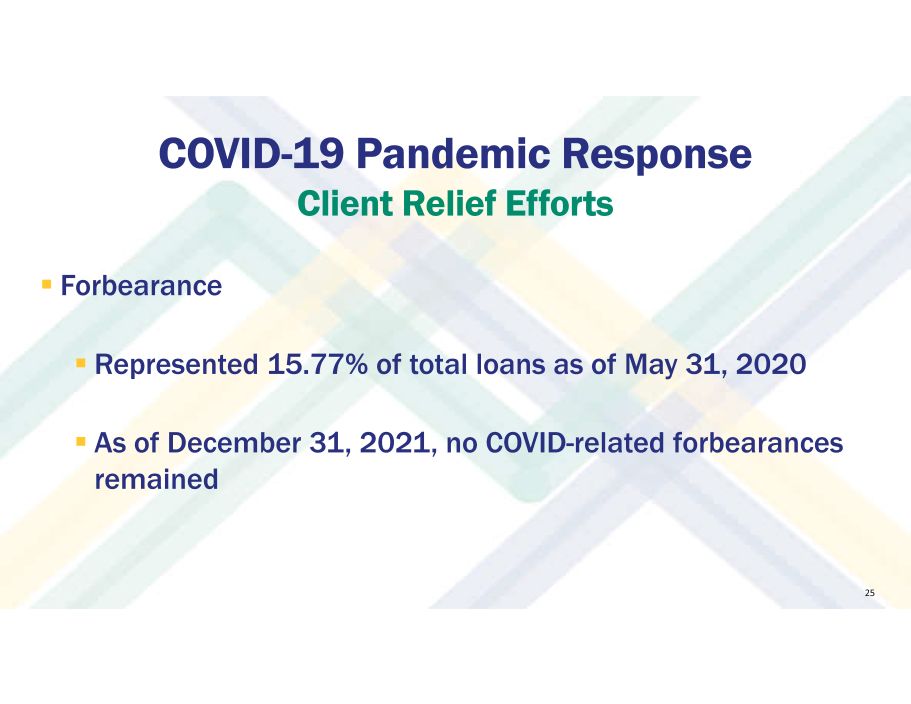
COVID - 19 Pandemic Response Client Relief Efforts 25 ▪ Forbearance ▪ Represented 15.77% of total loans as of May 31, 2020 ▪ As of December 31, 2021, no COVID - related forbearances remained

Deposit & Lending Activity 26
Deposit Growth: $117.7 million 5.8% Year Ending: 12/31/2021 Deposit Growth 27
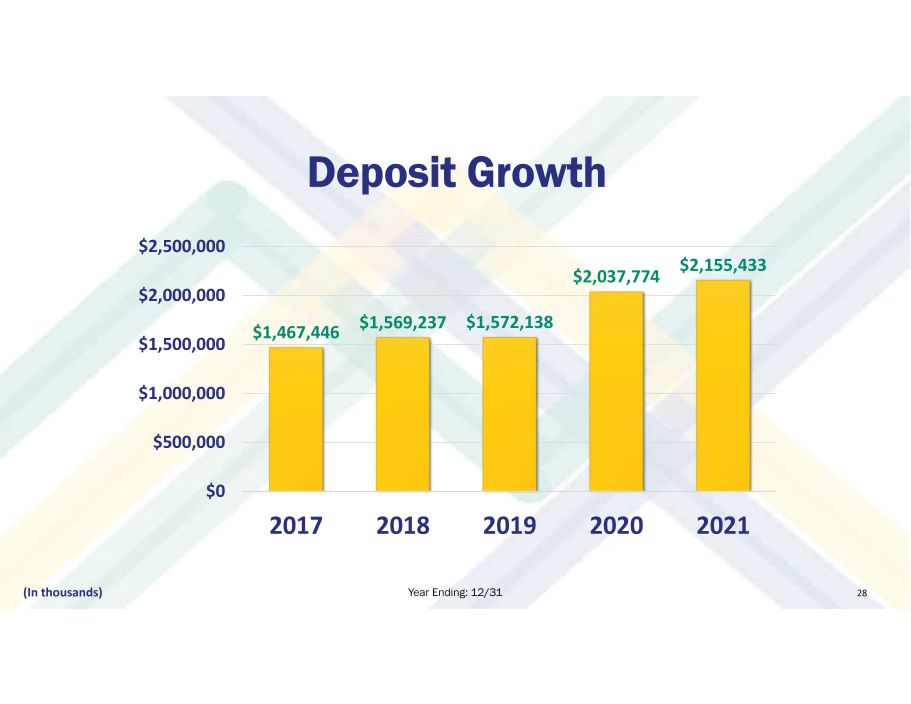
Deposit Growth Year Ending: 12/31 28 $1,467,446 $1,569,237 $1,572,138 $2,037,774 $2,155,433 $0 $500,000 $1,000,000 $1,500,000 $2,000,000 $2,500,000 2017 2018 2019 2020 2021 (In thousands )
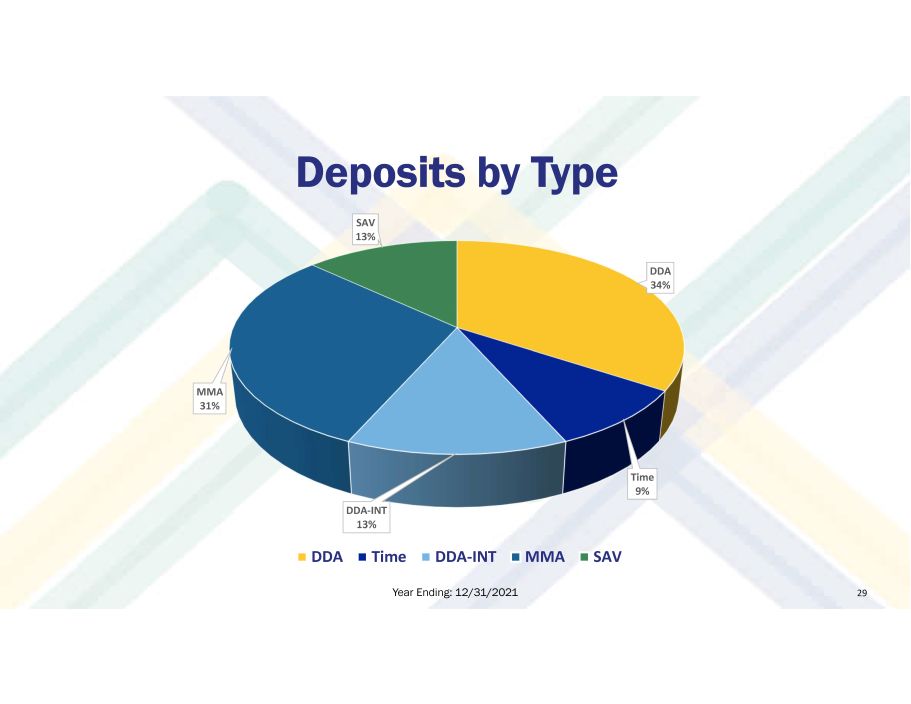
Deposits by Type Year Ending: 12/31/2021 29 DDA 34% Time 9% DDA - INT 13% MMA 31% SAV 13% DDA Time DDA-INT MMA SAV
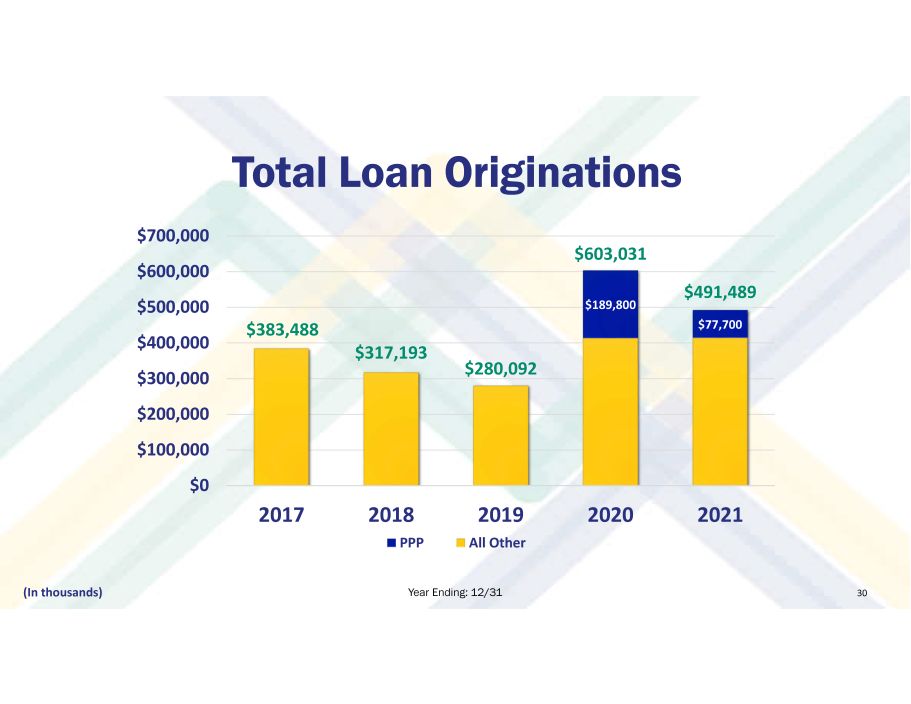
Total Loan Originations Year Ending: 12/31 30 $383,488 $317,193 $280,092 $603,031 $491,489 $189,800 $77,700 $0 $100,000 $200,000 $300,000 $400,000 $500,000 $600,000 $700,000 2017 2018 2019 2020 2021 PPP All Other (In thousands )
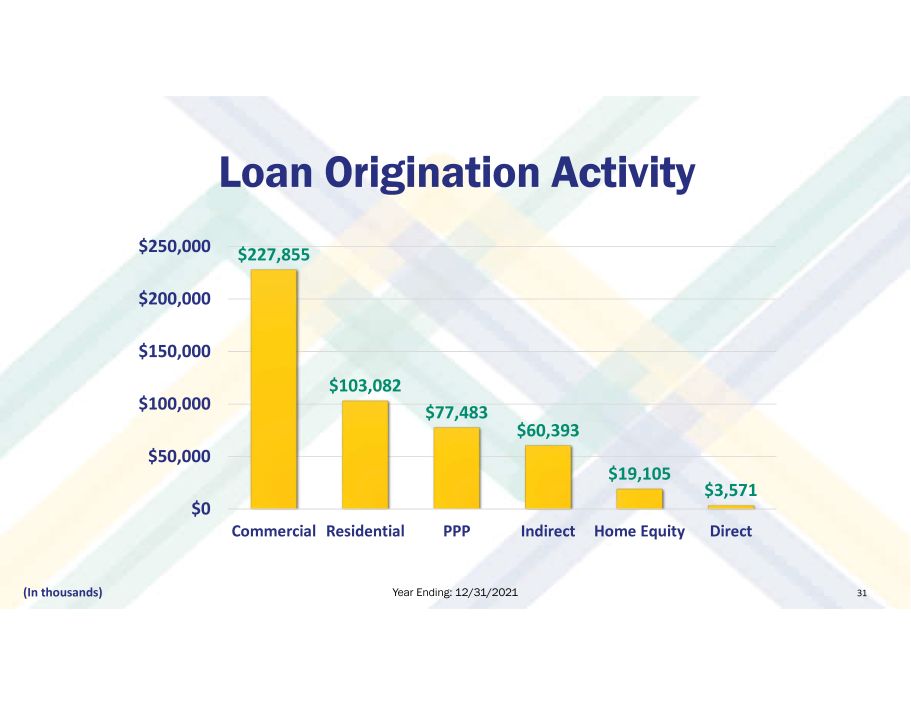
Loan Origination Activity Year Ending: 12/31/2021 31 $227,855 $103,082 $77,483 $60,393 $19,105 $3,571 $0 $50,000 $100,000 $150,000 $200,000 $250,000 Commercial Residential PPP Indirect Home Equity Direct (In thousands )
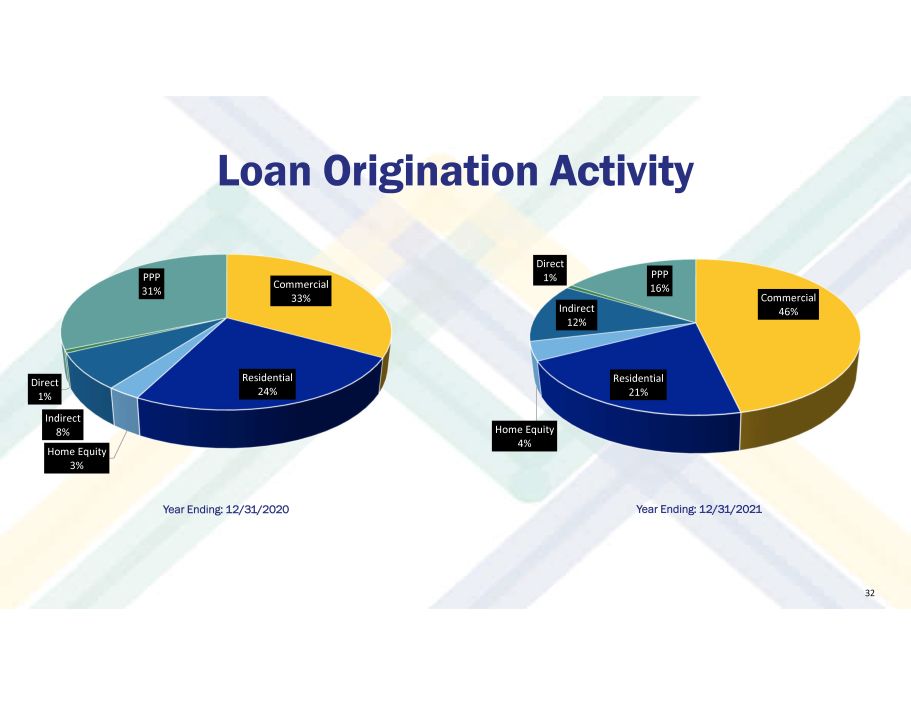
Loan Origination Activity Year Ending: 12/31/2020 Year Ending: 12/31/2021 32 Commercial 33% Residential 24% Home Equity 3% Indirect 8% Direct 1% PPP 31% Commercial 46% Residential 21% Home Equity 4% Indirect 12% Direct 1% PPP 16%
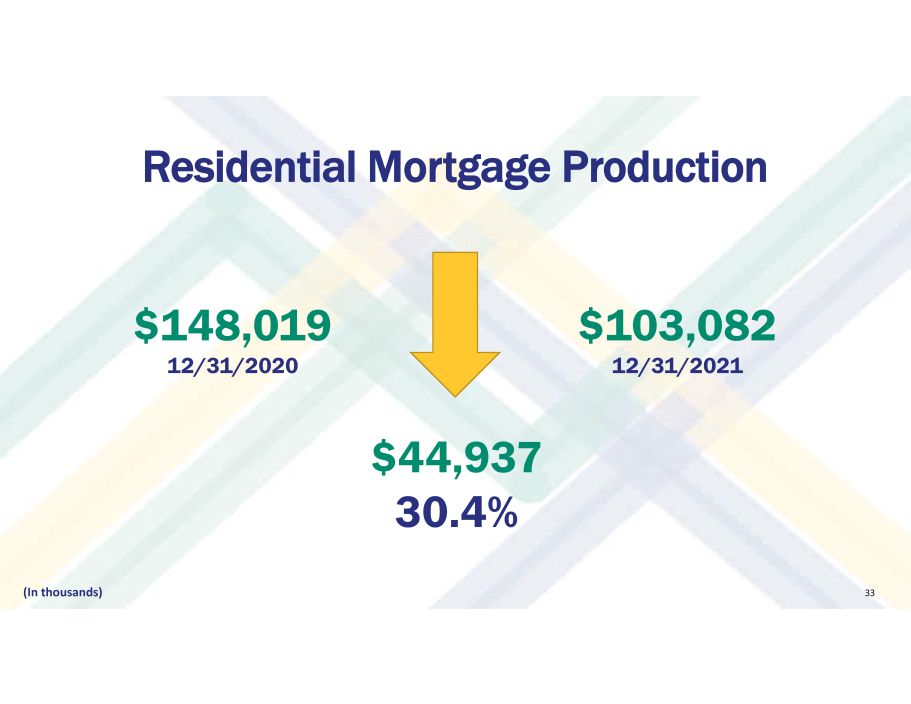
Residential Mortgage Production 33 (In thousands) $44,937 30.4% $103,082 12/31/2021 $148,019 12/31/2020

Mortgage Production Trend Year Ending: 12/31 34 $39,297 $33,883 $50,242 $148,019 $103,082 $0 $20,000 $40,000 $60,000 $80,000 $100,000 $120,000 $140,000 $160,000 2017 2018 2019 2020 2021 (In thousands, includes mortgages sold into the secondary market)

2.4% $1,059,849 12/31/2021 $1,085,554 12/31/2020 Total Balances $25,705 Commercial Loan Portfolio (In thousands) 35
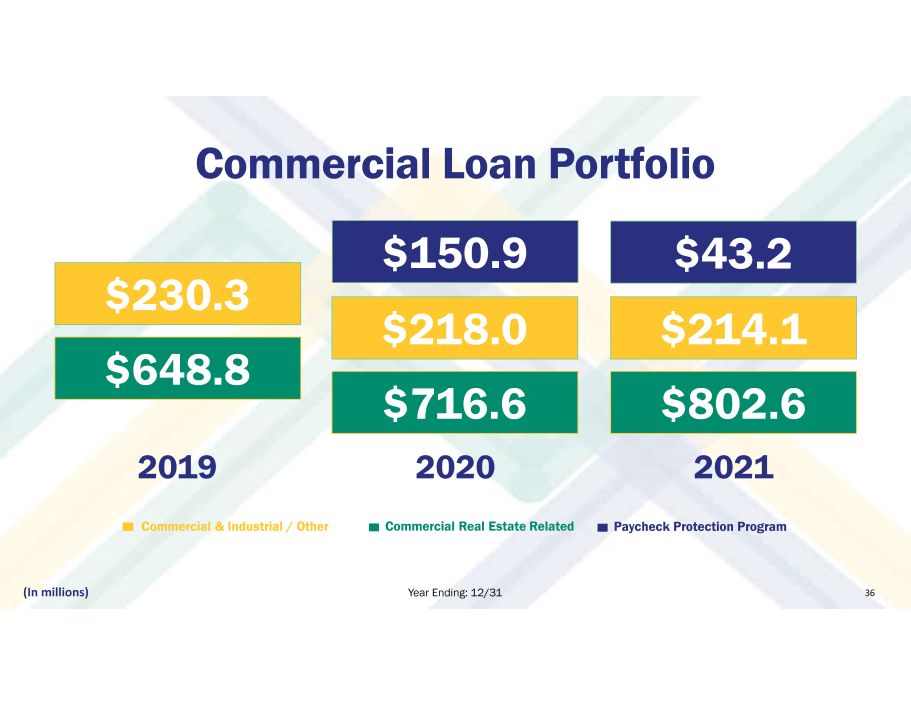
Commercial Loan Portfolio 2019 2020 2021 $802.6 $214.1 Year Ending: 12/31 Commercial & Industrial / Other Commercial Real Estate Related (In millions) 36 $648.8 $230.3 $43.2 Paycheck Protection Program $150.9 $218.0 $716.6
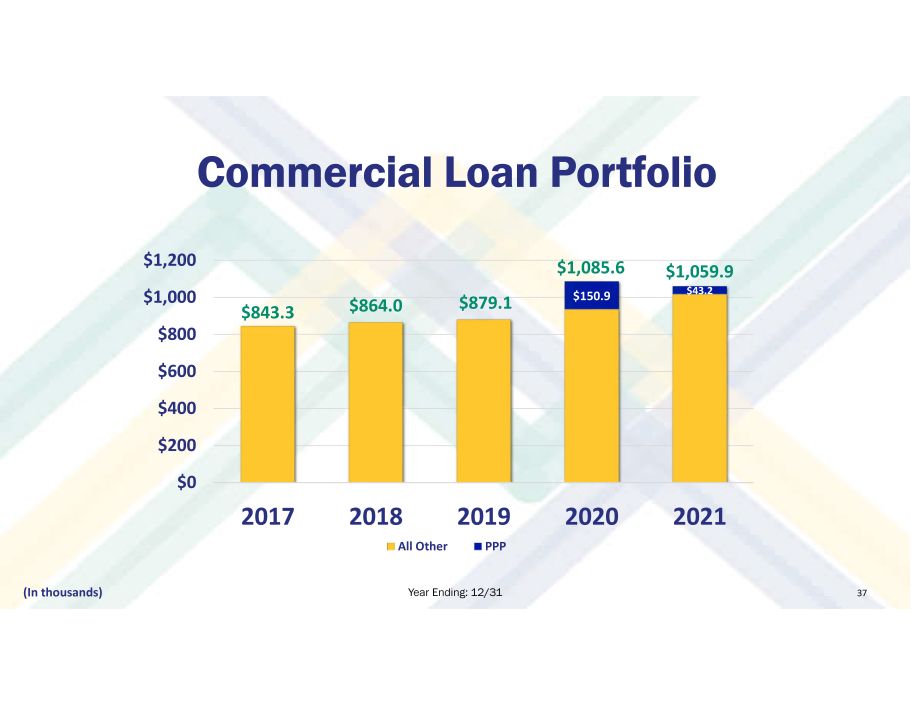
Commercial Loan Portfolio Year Ending: 12/31 37 $843.3 $864.0 $879.1 $1,085.6 $1,059.9 $150.9 $43.2 $0 $200 $400 $600 $800 $1,000 $1,200 2017 2018 2019 2020 2021 All Other PPP (In thousands )
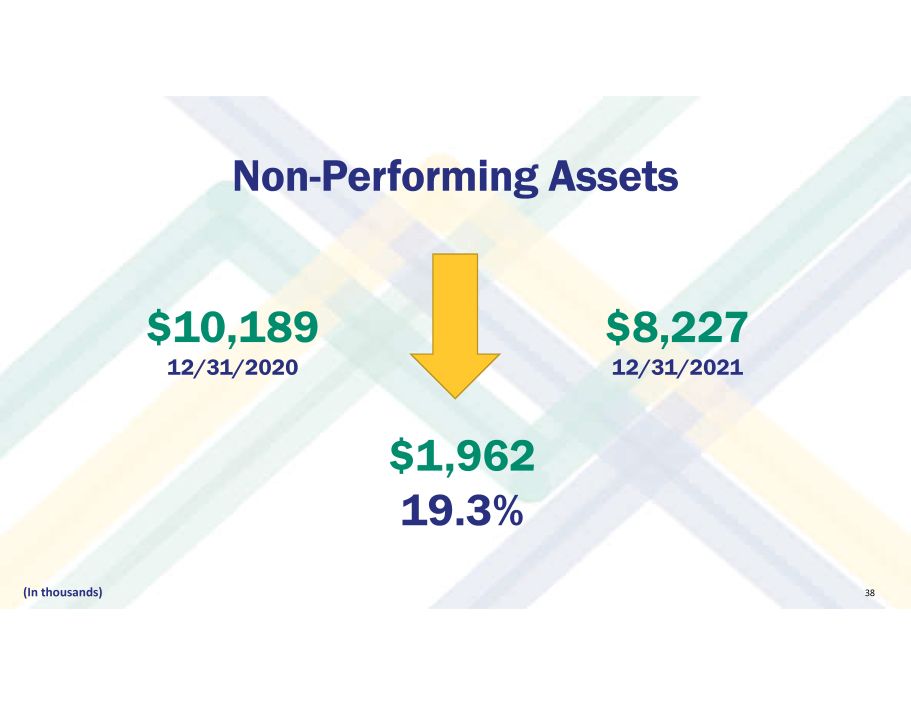
$1,962 19.3% $8,227 12/31/2021 $10,189 12/31/2020 Non - Performing Assets (In thousands) 38
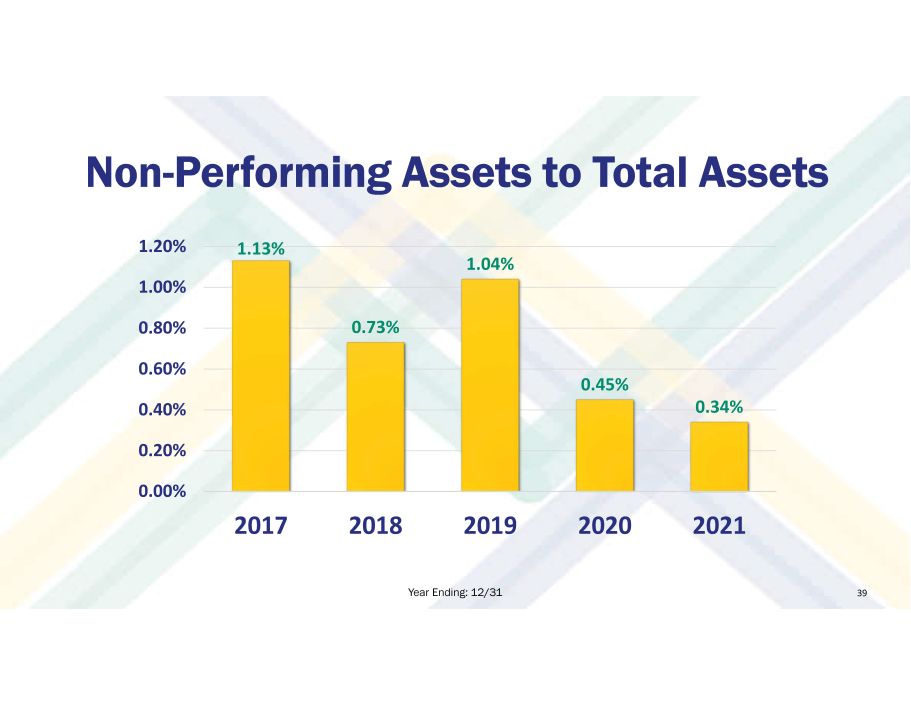
Non - Performing Assets to Total Assets Year Ending: 12/31 39 1.13% 0.73% 1.04% 0.45% 0.34% 0.00% 0.20% 0.40% 0.60% 0.80% 1.00% 1.20% 2017 2018 2019 2020 2021
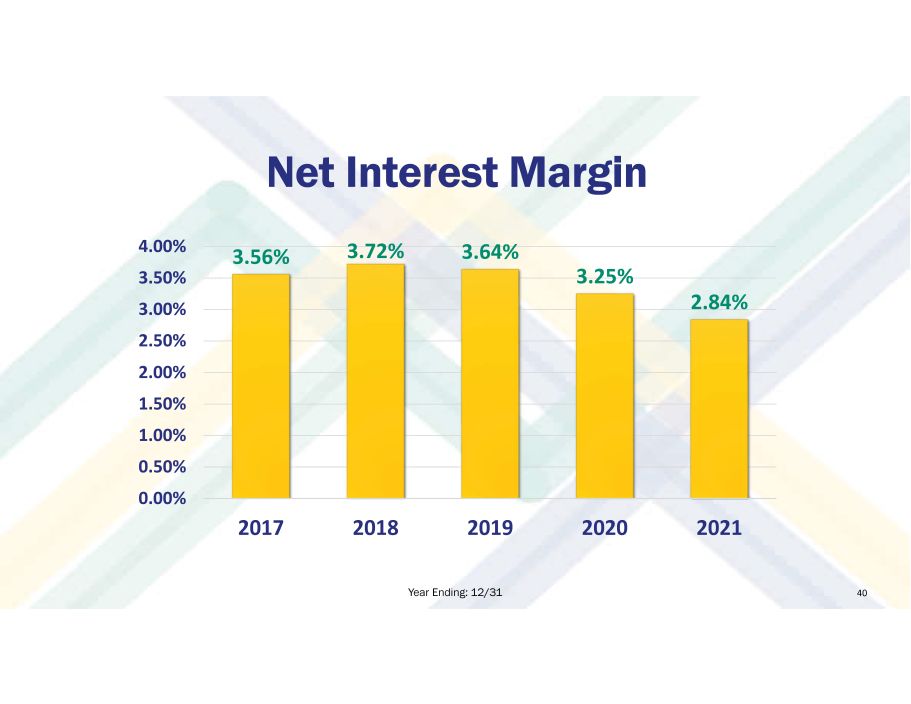
Net Interest Margin Year Ending: 12/31 40 3.56% 3.72% 3.64% 3.25% 2.84% 0.00% 0.50% 1.00% 1.50% 2.00% 2.50% 3.00% 3.50% 4.00% 2017 2018 2019 2020 2021
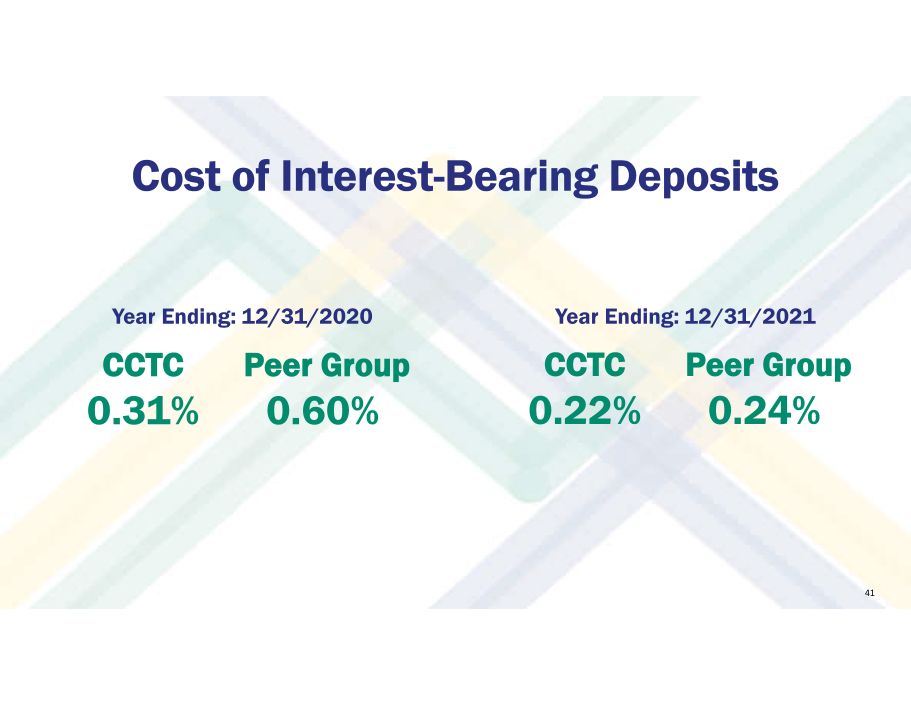
CCTC 0.22% Peer Group 0.24% Year Ending: 12/31/2020 Year Ending: 12/31/2021 Cost of Interest - Bearing Deposits 41 CCTC 0.31% Peer Group 0.60%
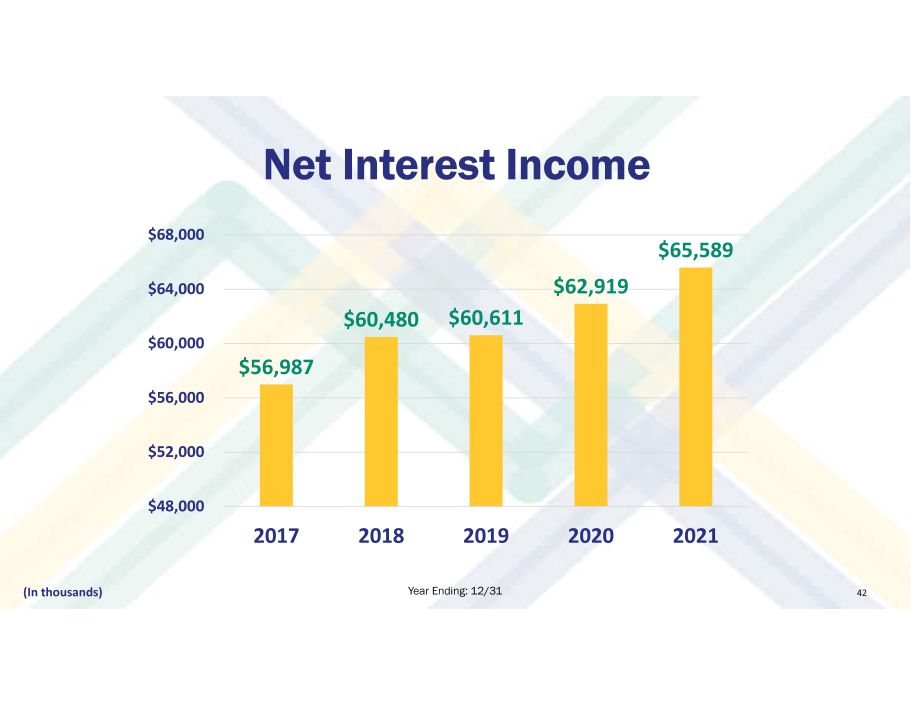
Net Interest Income (In thousands) Year Ending: 12/31 42 $56,987 $60,480 $60,611 $62,919 $65,589 $48,000 $52,000 $56,000 $60,000 $64,000 $68,000 2017 2018 2019 2020 2021
$ 2.3 Billion Assets Under Management & Administration $11.1 Million Fee Income Year Ending: 12/31/2021 Wealth Management Group 43
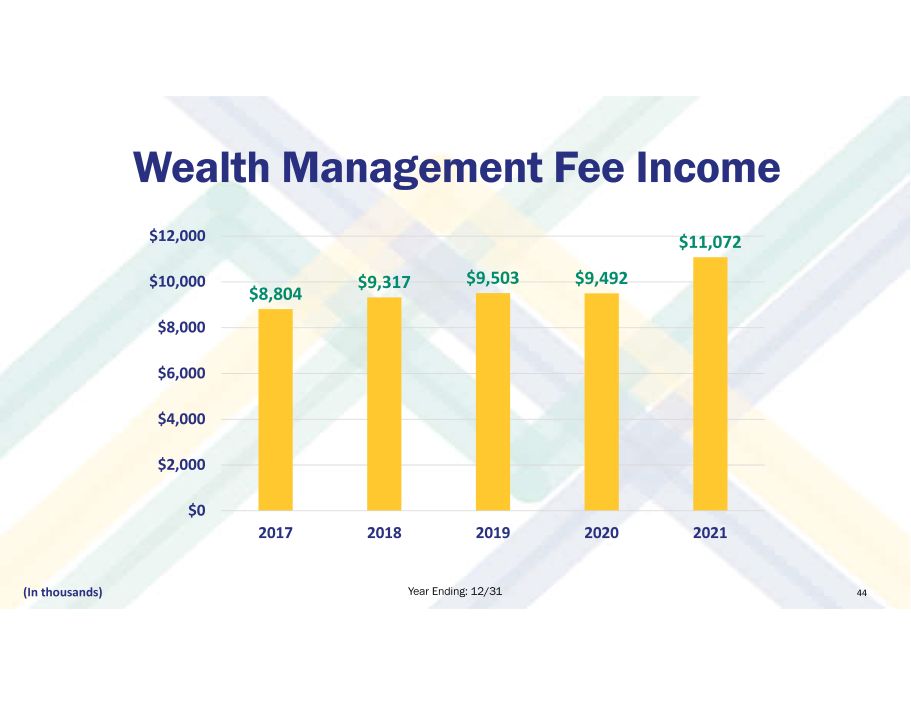
Wealth Management Fee Income (In thousands) Year Ending: 12/31 44 $8,804 $9,317 $9,503 $9,492 $11,072 $0 $2,000 $4,000 $6,000 $8,000 $10,000 $12,000 2017 2018 2019 2020 2021
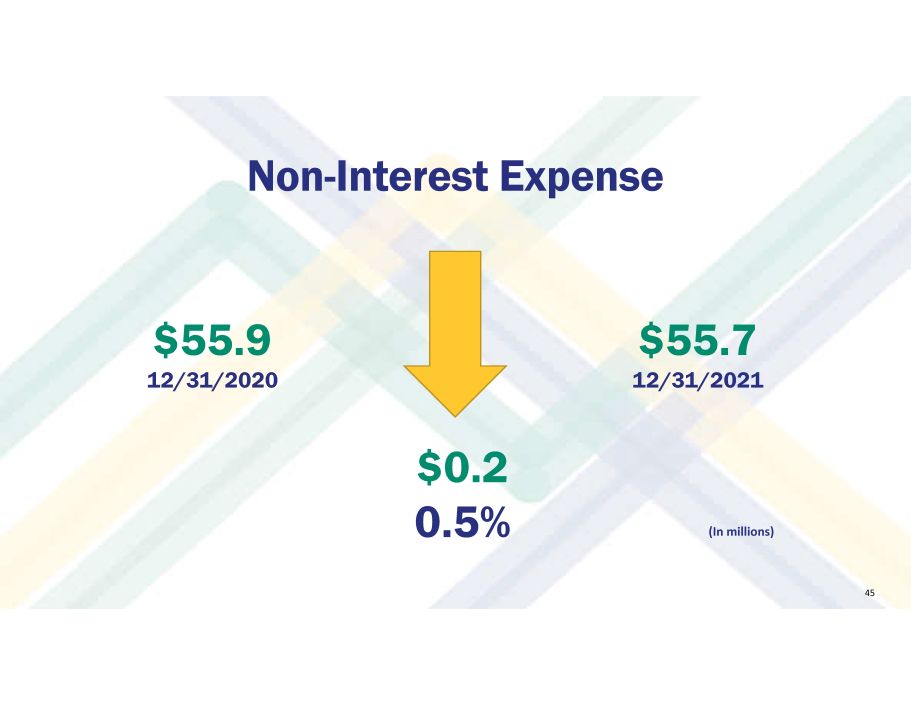
$0.2 0.5% $ 55.7 12/31/2021 $55.9 12/31/2020 Non - Interest Expense 45 (In millions)
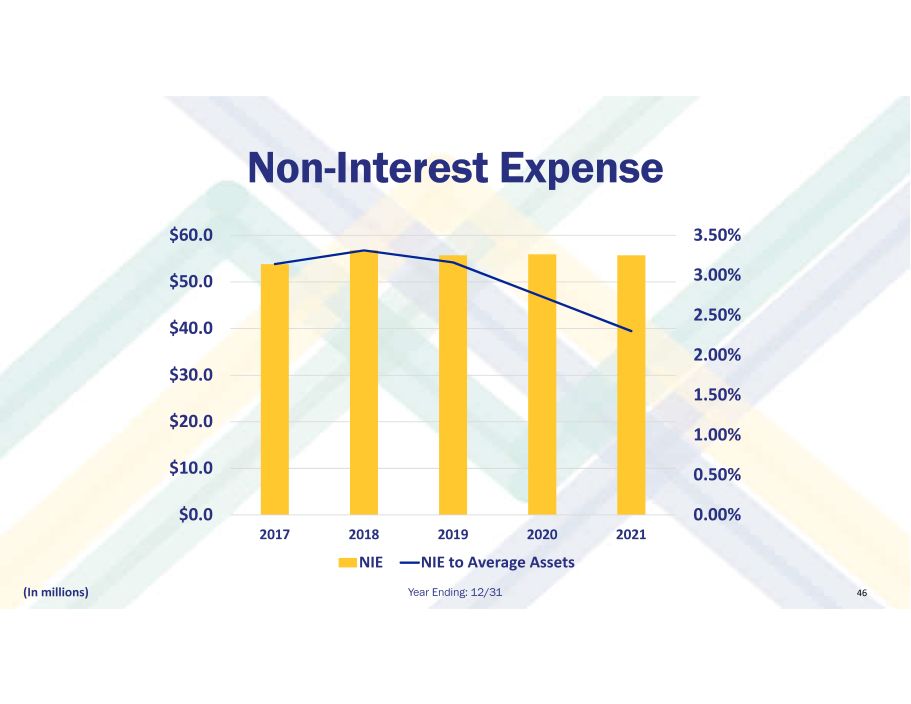
Non - Interest Expense Year Ending: 12/31 46 (In millions) 0.00% 0.50% 1.00% 1.50% 2.00% 2.50% 3.00% 3.50% $0.0 $10.0 $20.0 $30.0 $40.0 $50.0 $60.0 2017 2018 2019 2020 2021 NIE NIE to Average Assets
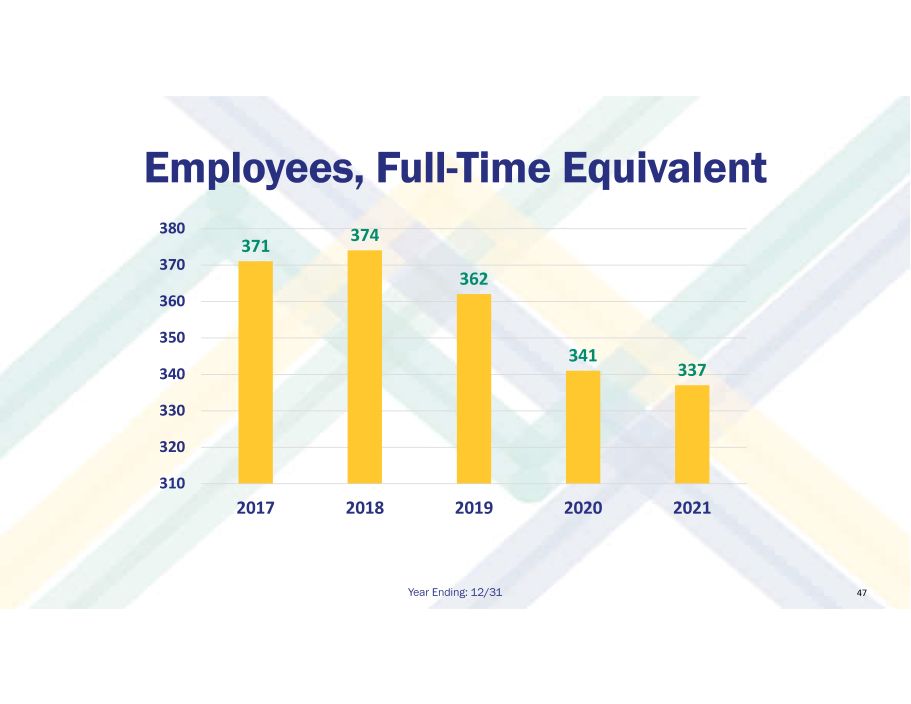
Employees, Full - Time Equivalent 47 371 374 362 341 337 310 320 330 340 350 360 370 380 2017 2018 2019 2020 2021 Year Ending: 12/31

48 Efficiency Ratio 66.6% 67.2% 68.0% 65.7% 61.7% 58.0% 59.0% 60.0% 61.0% 62.0% 63.0% 64.0% 65.0% 66.0% 67.0% 68.0% 69.0% 2017 2018 2019 2020 2021 Year Ending: 12/31

Share Repurchase Program 49 • 250,000 (5 percent) Available to Repurchase • 34,921 shares repurchased • Average cost of $38.55 per share • Increase of $0.52 to EPS since program inception (as of April 2022)
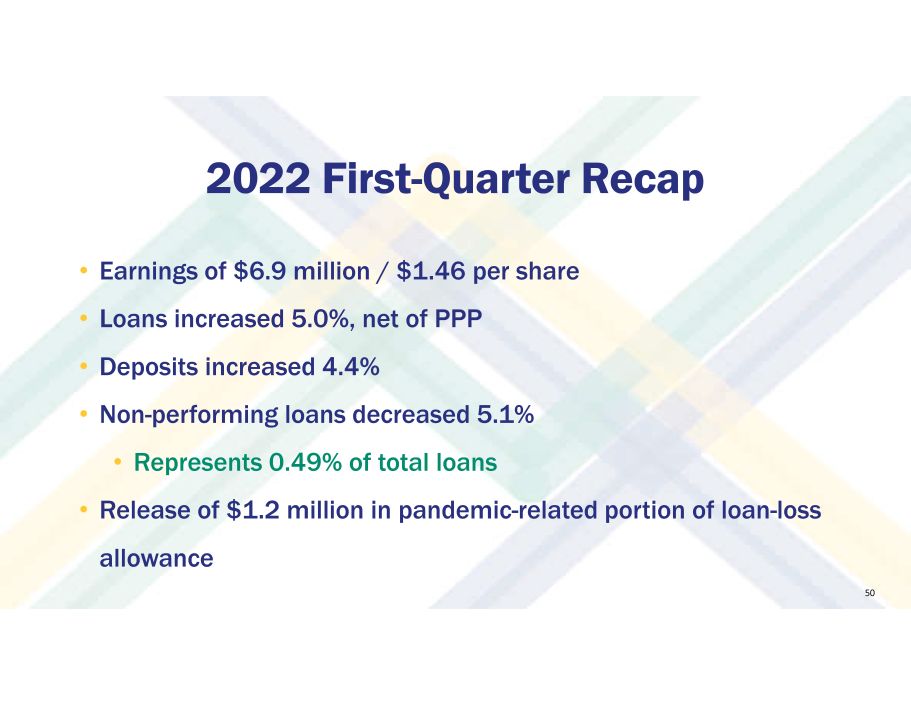
2022 First - Quarter Recap 50 • Earnings of $6.9 million / $1.46 per share • Loans increased 5.0%, net of PPP • Deposits increased 4.4% • Non - performing loans decreased 5.1% • Represents 0.49% of total loans • Release of $1.2 million in pandemic - related portion of loan - loss allowance
Market Challenges & Uncertainties 51 • COVID - 19 Pandemic • Eastern Europe • Rising Interest Rates • Inflation
• Technology & Customer Experience • Service & Distribution • Community Investment Key Initiatives & Efforts 52
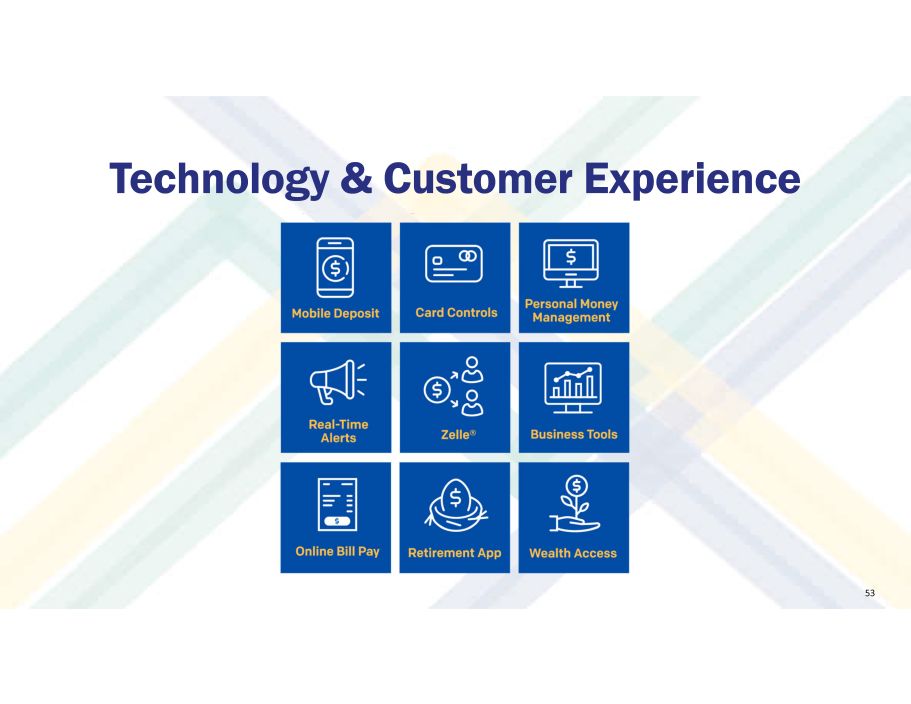
Technology & Customer Experience 53

▪ DocuSign ▪ Appointment Scheduling ▪ Real - Time Alerts ▪ Contactless Debit Cards ▪ Personal Budgeting Tools ▪ Account - to - Account Transfers ▪ Budgeting & Savings Tools Investing In Our Digital Platform 54

Service & Distribution 55
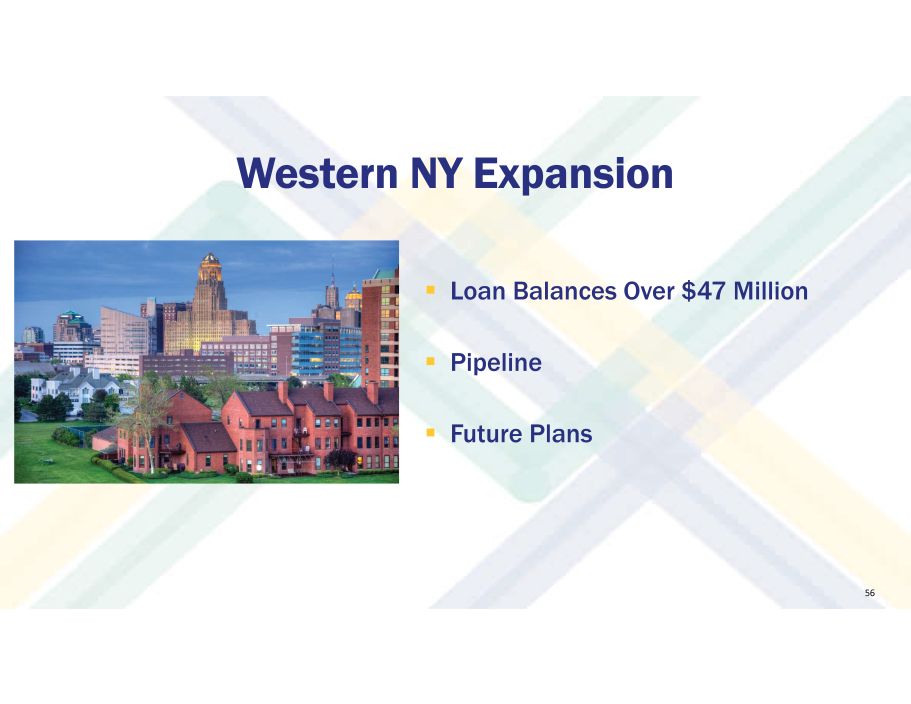
Western NY Expansion 56 ▪ Loan Balances Over $47 Million ▪ Pipeline ▪ Future Plans

Bath Office 57
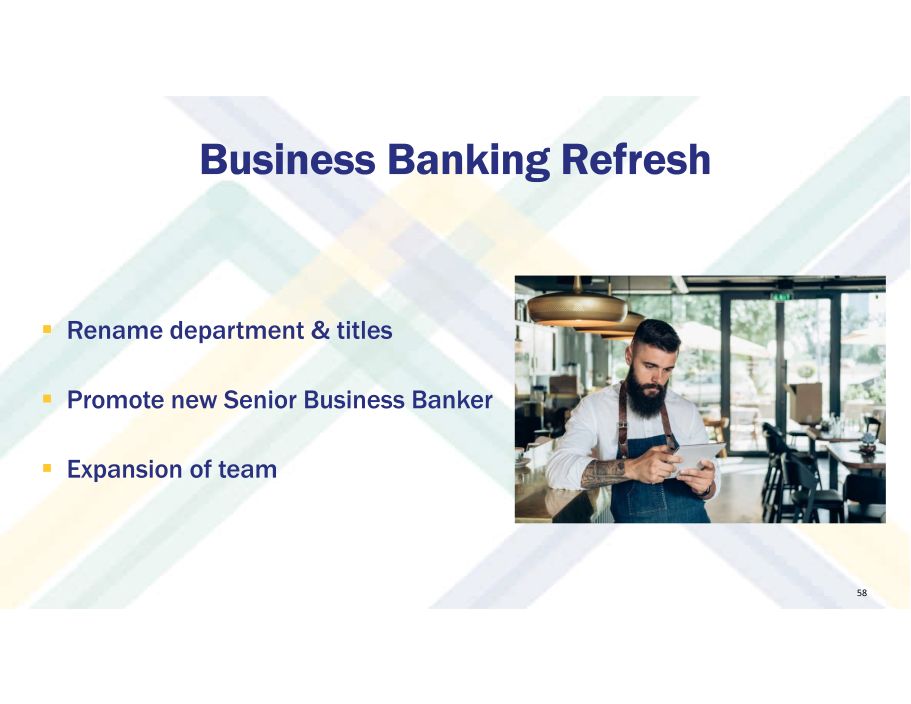
Business Banking Refresh 58 ▪ Rename department & titles ▪ Promote new Senior Business Banker ▪ Expansion of team
Corporate Responsibility Statement 59 We embrace our corporate responsibility and commit to fully supporting every community within our footprint. This responsibility requires inclusion, volunteerism, financial support, thoughtful partnerships and the responsible management of our environmental impact. The value we provide to these communities is an integral part of who we are. Our employees’ leadership and service in charitable and civic organizations is foundational to our corporate citizenship. We serve diverse communities and value a representative workforce and Board of Directors. Our community - banking mission focuses equally on all of our stakeholders and promotes the long - term sustainability of our communities.
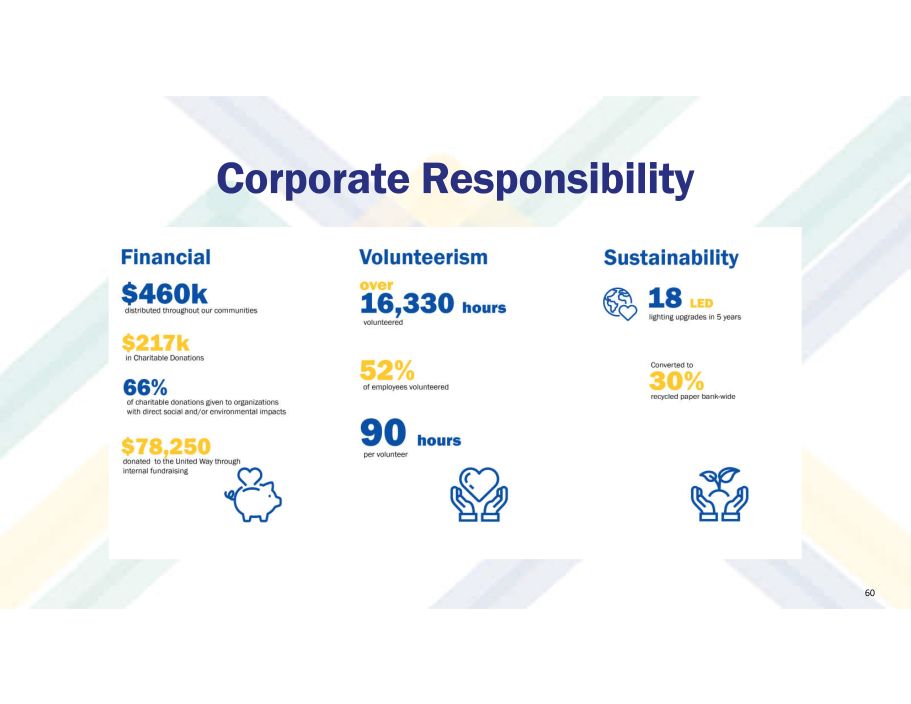
Corporate Responsibility 60

61 ▪ Supported community organizations by: ▪ Volunteering over 16,000 hours ▪ Distributing nearly $ 460,000 in donations & sponsorships ▪ Providing special corporate matches Community Support Efforts
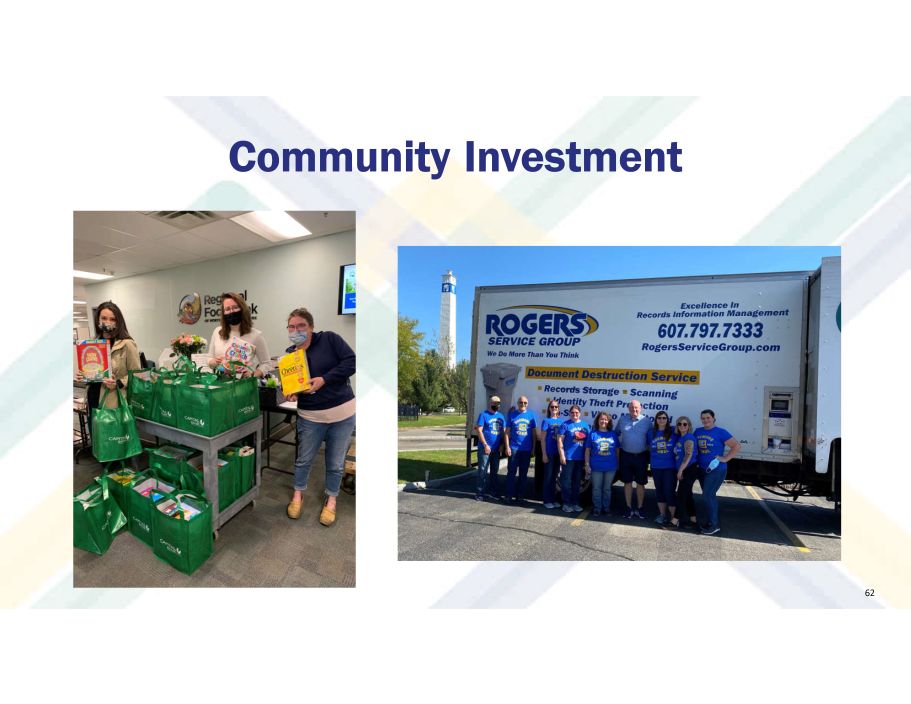
Community Investment 62

Supporting our Community 63
64
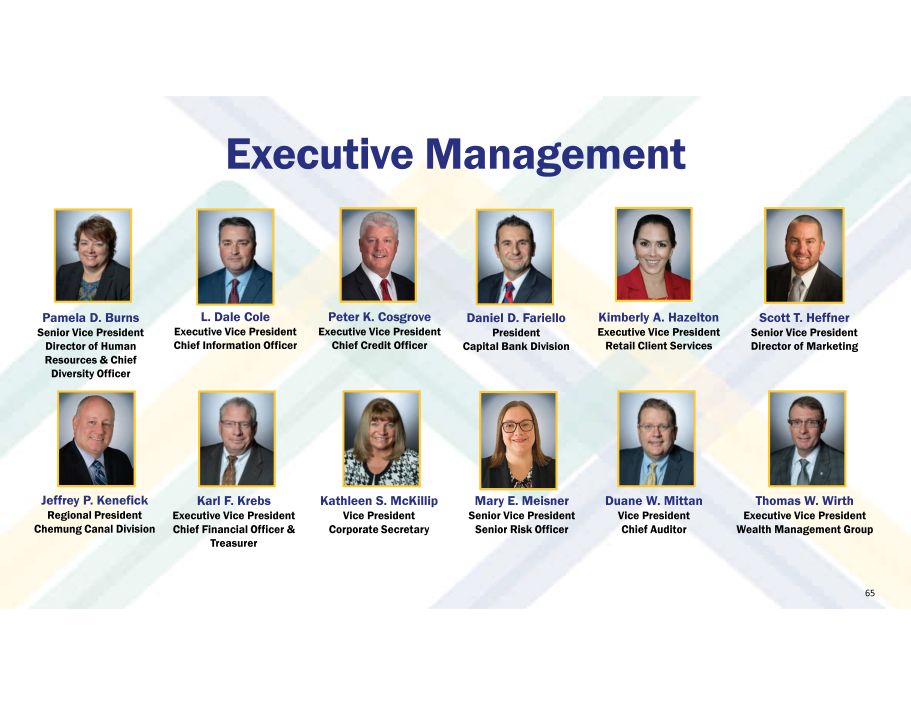
Executive Management 65 Pamela D. Burns Senior Vice President Director of Human Resources & Chief Diversity Officer L. Dale Cole Executive Vice President Chief Information Officer Peter K. Cosgrove Executive Vice President Chief Credit Officer Daniel D. Fariello President Capital Bank Division Kimberly A. Hazelton Executive Vice President Retail Client Services Scott T. Heffner Senior Vice President Director of Marketing Mary E. Meisner Senior Vice President Senior Risk Officer Kathleen S. McKillip Vice President Corporate Secretary Karl F. Krebs Executive Vice President Chief Financial Officer & Treasurer Thomas W. Wirth Executive Vice President Wealth Management Group Duane W. Mittan Vice President Chief Auditor Jeffrey P. Kenefick Regional President Chemung Canal Division
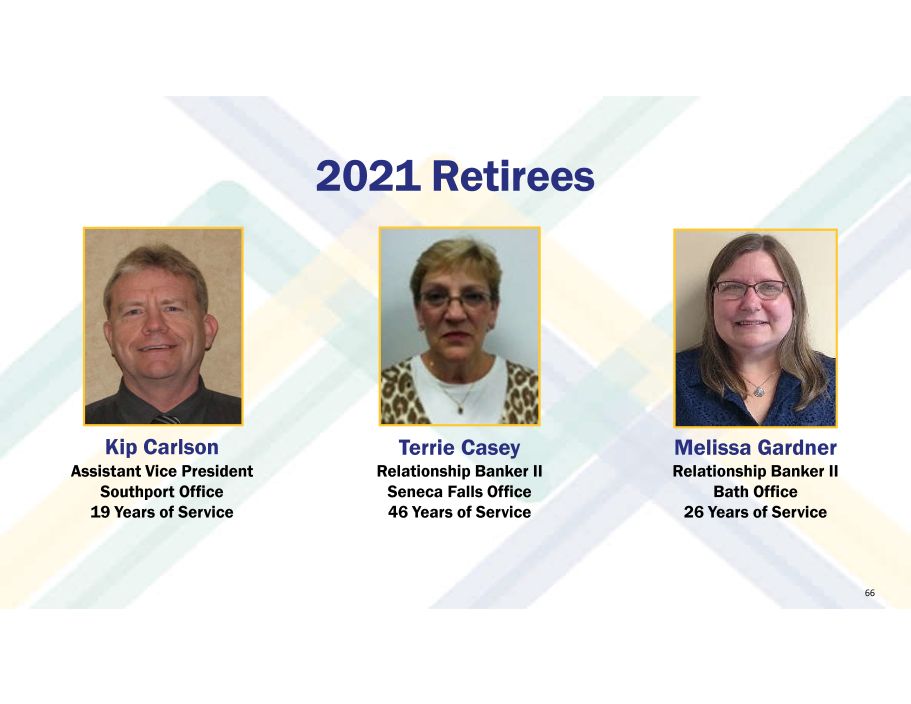
2021 Retirees Kip Carlson Assistant Vice President Southport Office 1 9 Years of Service Melissa Gardner Relationship Banker II Bath Office 26 Years of Service Terrie Casey Relationship Banker II Seneca Falls Office 46 Years of Service 66
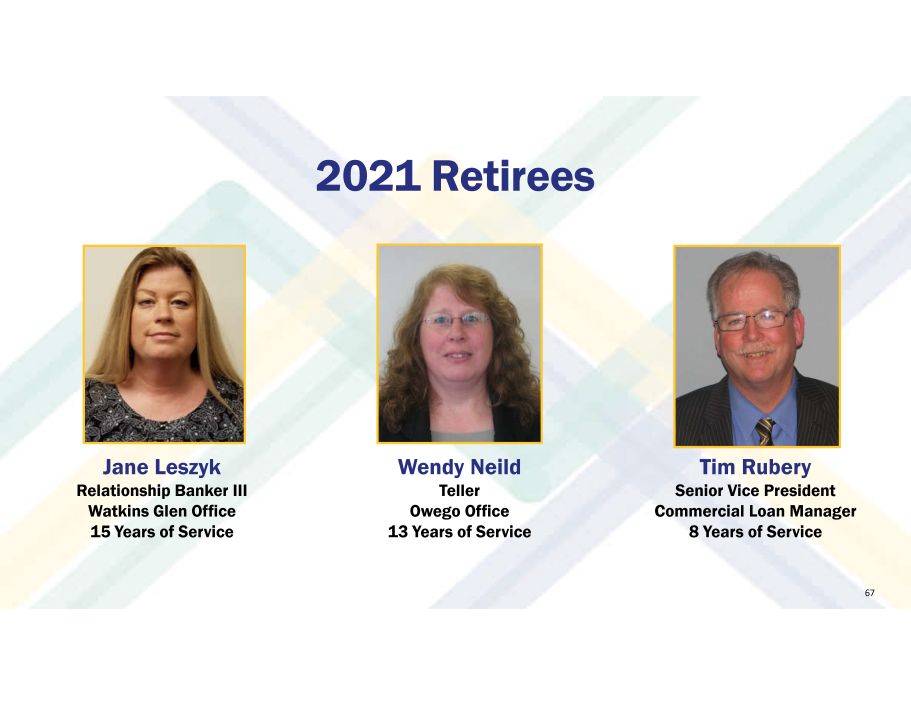
2021 Retirees Jane Leszyk Relationship Banker III Watkins Glen Office 15 Years of Service Tim Rubery Senior Vice President Commercial Loan Manager 8 Years of Service Wendy Neild Teller Owego Office 13 Years of Service 67
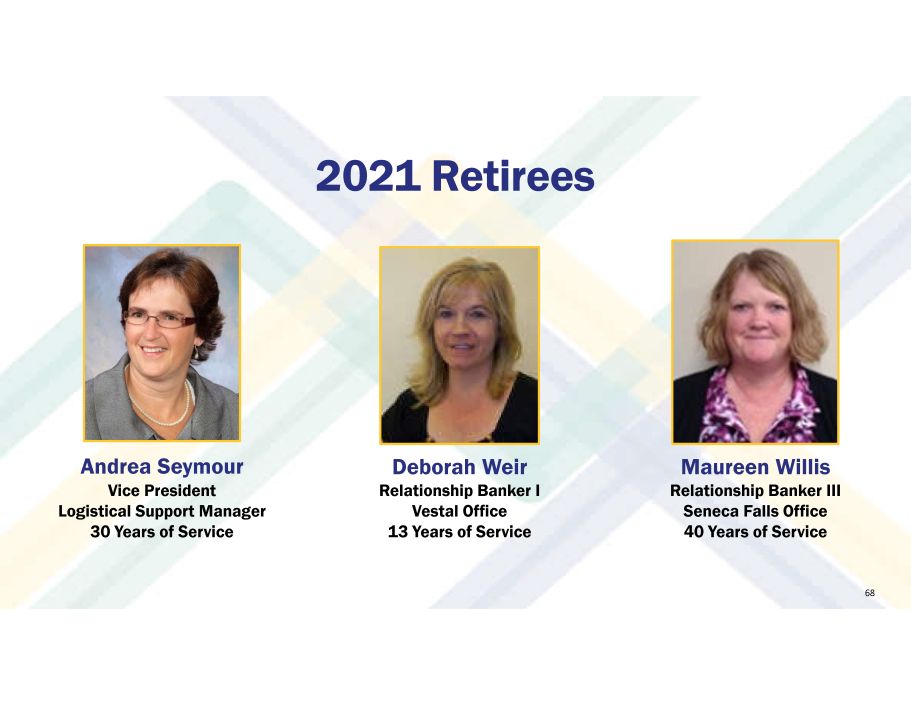
2021 Retirees Andrea Seymour Vice President L ogistical Support Manager 30 Years of Service Maureen Willis Relationship Banker III Seneca Falls Office 40 Years of Service Deborah Weir Relationship Banker I Vestal Office 13 Years of Service 68

69

70