A Leading National Supplier of a Wide Variety of
Components for RV’s and Manufactured Homes
Drew Industries (NYSE:DW)
2003

Forward Looking Statements
This presentation contains certain “forward-looking statements” within the meaning of the Private Securities
Litigation Reform Act of 1995 with respect to financial condition, results of operations, business strategies,
operating efficiencies or synergies, competitive position, growth opportunities for existing products, plans and
objectives of management, markets for the Company’s common stock and other matters. Statements in this
presentation that are not historical facts are “forward-looking statements” for the purpose of the safe harbor
provided by Section 21E of the Exchange Act and Section 27A of the Securities Act. Forward-looking statements,
including, without limitation those relating to our future business prospects, revenues, expenses and income,
wherever they occur in this presentation, are necessarily estimates reflecting the best judgment of our senior
management, at the time such statements were made, and involve a number of risks and uncertainties that could
cause actual results to differ materially from those suggested by forward-looking statements. The Company does
not undertake to update forward-looking statements to reflect circumstances or events that occur after the date the
forward-looking statements are made. You should consider forward-looking statements, therefore, in light of
various important factors, including those set forth in this presentation and the Company’s SEC filings.
There are a number of factors, many of which are beyond the Company’s control, which could cause actual results
and events to differ materially from those described in the forward-looking statements. These factors include pricing
pressures due to domestic and foreign competition, costs and availability of raw materials (particularly steel and
related components, vinyl, aluminum, glass and ABS resin), availability of retail and wholesale financing for
manufactured homes, availability and costs of labor, inventory levels of retailers and manufacturers, levels of
repossessed manufactured homes, the disposition into the market by FEMA by sale or otherwise of RVs or
manufactured homes purchased by FEMA in connection with natural disasters, changes in zoning regulations for
manufactured homes, the decline in the manufactured housing industry, the financial condition of our customers,
retention of significant customers, interest rates, oil and gasoline prices, the outcome of litigation, and adverse
weather conditions impacting retail sales. In addition, national and regional economic conditions and consumer
confidence may affect the retail sale of recreational vehicles and manufactured homes.
Page 2
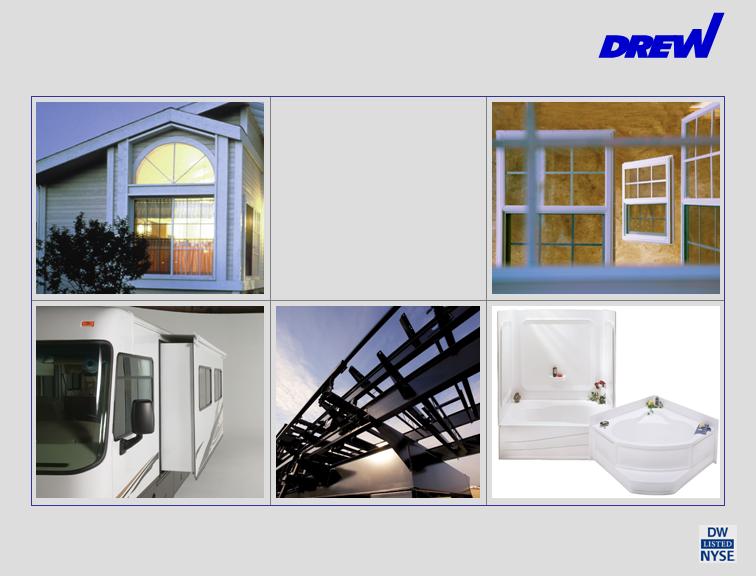
About Drew Industries
A leading national
manufacturer of
quality components
for Recreational
Vehicles (RV) and
Manufactured
Homes (MH)
Page 3
Headquartered in White
Plains, New York – 10
employees
41 manufacturing facilities in
the U.S.
Approximately 4,000
employees nationwide
Organic growth from 2001
through 6/30/07 was over
$180 million or a 10%
average annual growth,
excluding price increases,
acquisitions, and FEMA
business
Company Overview
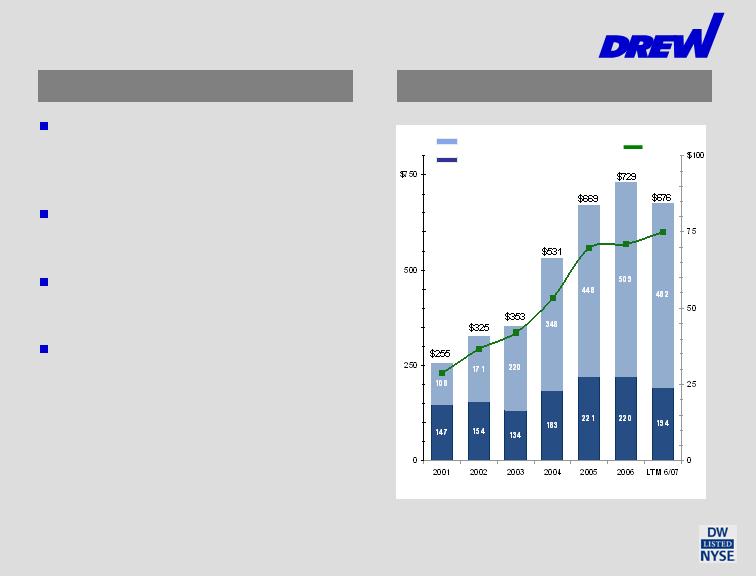
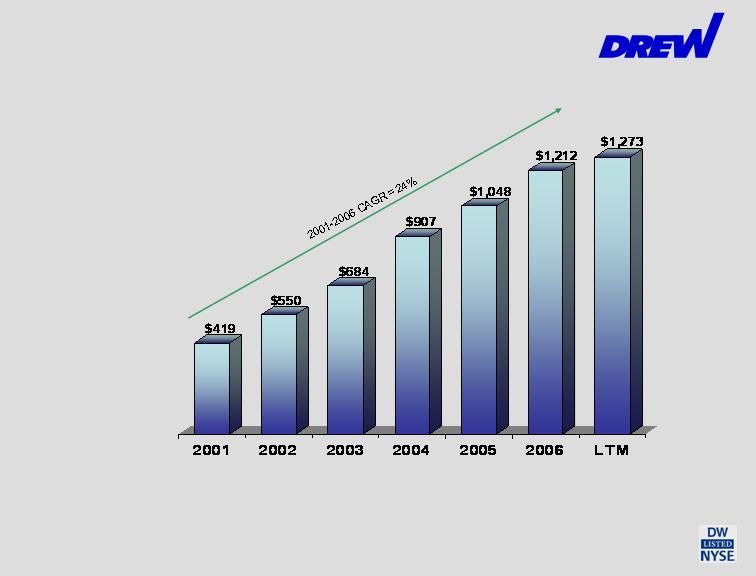
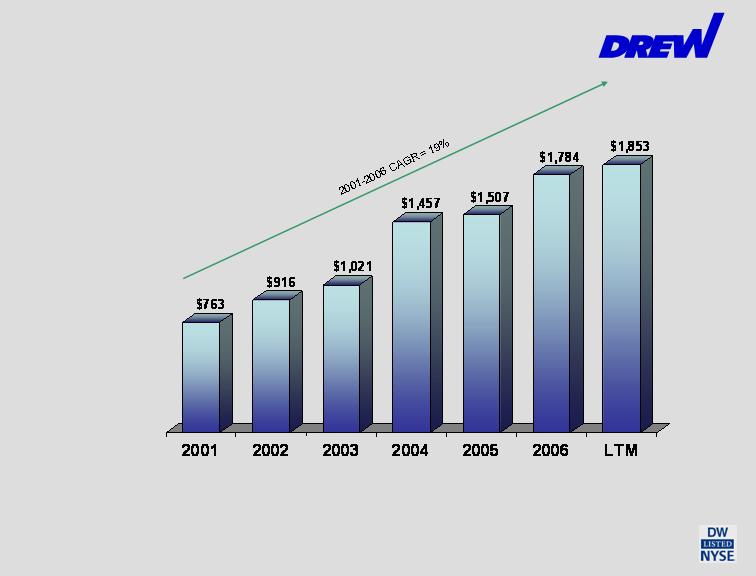
Financial Performance
Sales and EBITDA (in millions)
MH segment sales
RV segment sales
EBITDA(1)
(1)
2001- June 2007 EBIDTA CAGR = 19%. EBITDA is
operating profit plus depreciation and amortization
Page 4

Drew’s Companies
Kinro, Inc. – Acquired 1980
Aluminum windows for RVs
Doors for RVs and MHs
Aluminum and vinyl windows and screens for MHs
Bath and shower units, and sinks for MHs and RVs
Exterior panels for RVs
Lippert Components, Inc. – Acquired 1997
Chassis and chassis parts for RVs and MHs
Slide-out mechanisms and leveling devices for RVs
Axles for towable RVs, MHs and specialty trailers
Bed lifts and ramp doors for “toy-hauler” RVs
Steps for RVs
Suspension systems
Specialty trailers for boats, personal watercraft and
hauling equipment
Page 5
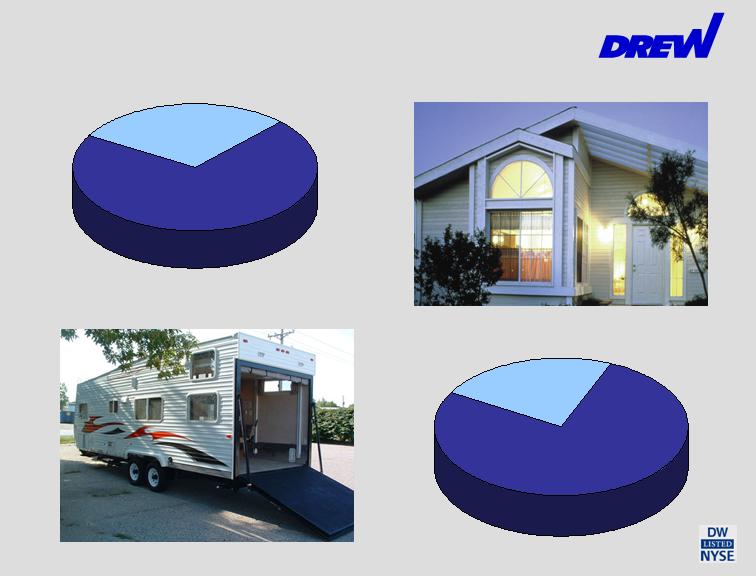
Drew’s Segments – LTM 6/30/07
MH = $16 million
23%
RV = $52 million
77%
Revenues - $676 million
90% of RV segment revenues
are for towable RVs
Segment Operating Profit - $68 million
MH = $194 million
29%
RV = $482 million
71%
Page 6
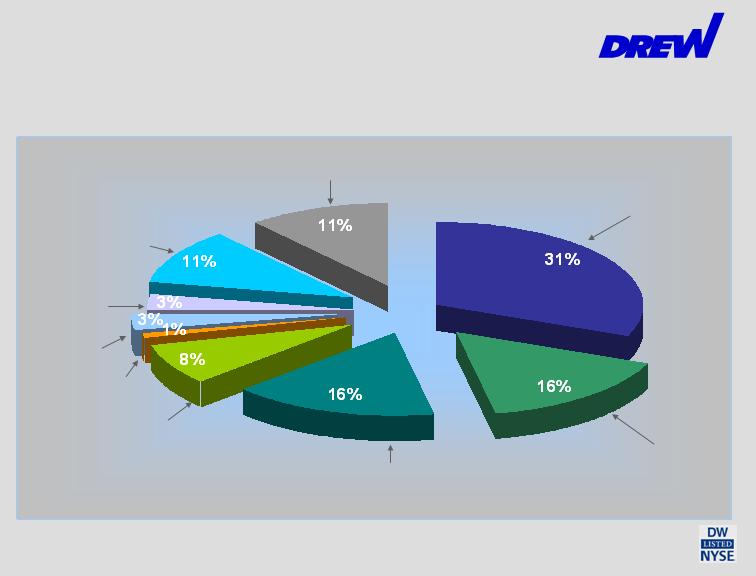
Drew’s Products
RV Chassis and Chassis Parts:
$200 million
RV Windows and Doors:
$109 million
12 Months Ended June 30, 2007
Sales - $676 million
Other: $7 million
MH and RV
Bath Products:
$23 million
Specialty
Trailers:
$20 million
RV Slide-out mechanisms:
$107 million
RV and MH Axles and
Tires: $57 million
Page 7
MH Chassis and Chassis
Parts: $76 million
MH Windows, Doors and
Screens: $77 million

Supplier to Industry Leaders
Outstanding customer service and national coverage, with 41
production facilities (more than 3 million sq. ft.), make us a key
partner with our customers.
Supply most of the Leading Producers of RVs and MHs:
Both RV and MH
Fleetwood (NYSE:FLE)
Skyline (NYSE: SKY)
RV
Coachmen (NYSE: COA)
Forest River (owned by Berkshire Hathaway)
Monaco Coach (NYSE: MNC)
Starcraft (privately owned)
Thor (NYSE:THO)
MH
Champion (NYSE: CHB)
Clayton (owned by Berkshire Hathaway)
Oakwood Homes and Southern Energy Homes
(owned by Clayton)
Palm Harbor (Nasdaq: PHHM)
Page 8

Business Strategy
Increase sales and profitability through:
Market share growth
New product introductions
Strategic acquisitions
This strategy accomplished through:
Outstanding customer service
Motivating management through profit incentives and training
programs
Maintaining highly efficient factories by optimizing production
efficiencies through state-of-the-art manufacturing technology, and
stringent cost controls
Extensive R & D efforts
Disciplined and patient acquirer
Page 9
Content Per Vehicle - RV
Peak potential is $2,500 to $2,800 per RV
(a)
Excludes sales of specialty trailers.
(b)
Excludes sales of Emergency Living Units (“ELU’s”) purchased by FEMA.
90% of RV segment sales are for Towable RVs
See Page 17 for Industry Information
Page 10
Operating
profit margin 8.6% 9.4% 11.3% 9.2% 9.6% 8.6% 10.8%
6/30/07
(a)(b)
(a)(b)
(a)
(a)
Content Per Home - MH
Peak potential is $3,300 to $3,600 per home
Operating
Profit margin 10.8% 11.0% 10.7% 10.1% 10.2% 9.5% 8.2%
See Page 21 for Industry Information
Page 11
6/30/07
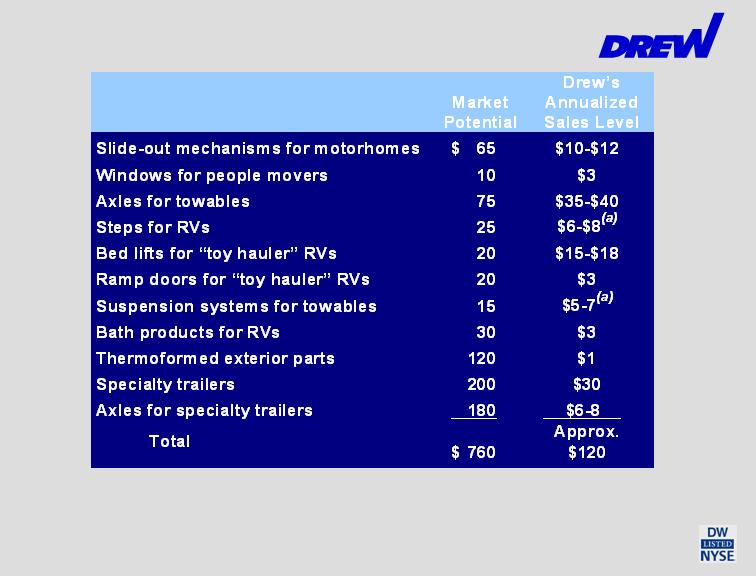
New Product Introductions
Annualized sales of these products increased from about $100 million in the
2nd quarter of 2006.
(in millions)
Page 12
(a)
Including recent acquisitions.

Acquisition Criteria
Drew is a disciplined and patient
acquirer
Target less than 6 times pro forma EBITDA
Immediately accretive
Complementary to our core RV and MH markets
Strategic
Acquisitions
Seek to acquire products or technologies that we can
introduce through our nationwide customer base and
factory network
Become a more extensive supplier to our customers
Page 13

Acquisition History
Strategic
Acquisitions
May 2004
Zieman
RV, MH and
specialty trailers.
Annual sales of over
$40 million
Each of our RV and MH acquisitions has
expanded geographic markets or
broadened product lines
July 2007
Extreme Engineering
Custom boat trailers.
Annual Sales of $12
million
2001
Better Bath
Bath and shower
products for MH.
Annual sales of
$20 million
14 Acquisitions
1980 – 2003
Including Kinro (1980)
and Lippert
Components (1997)
March 2006
Steelco
MH & RV Chassis.
Annual sales
of $8 million
May 2007
Coach Step
Electric steps
for motorhomes.
Annual sales of
$2 million
Page 14
May 2005
Venture Welding
MH Chassis. Annual
sales of $18 million
June 2006
Happijac
Bed lifts for
“toy haulers”.
Annualized sales
of $15 million
January 2007
Trailair/Equa-Flex
RV Suspension Systems.
Annual sales of $3 million

Drew’s Management Team
Highly respected and experienced
management:
Drew
Leigh Abrams, CEO, 35+ years
Fred Zinn, CFO, 25+ years
Kinro
David Webster, CEO, Chairman,
30+ years
Lippert
Jason Lippert, CEO, Chairman
12+ years
Excellent management training
and incentive programs
Innovative &
Experienced
Management
Leigh Abrams
David Webster
Page 15
Jason Lippert

Investments
Kinro and Lippert have
extensive R&D departments
Since January 1997:
Invested over $157 million in
plant and equipment
Invested nearly $179 million
for acquisitions
Invested $40 million for stock repurchases at an average
price of $5.37 per share
These investments have been accretive to earnings
Page 16
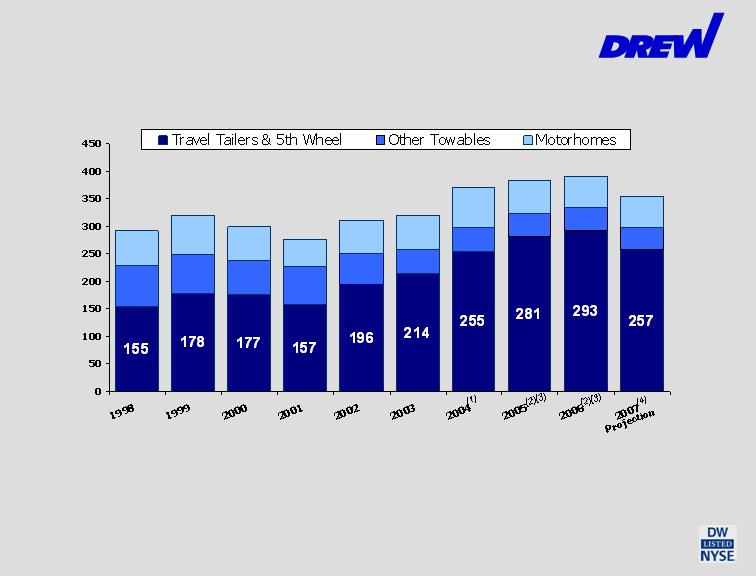
RVs - Industry Wholesale Shipments
(Thousands of Vehicles)
90% of Drew’s current RV product sales are for Travel Trailers and 5th Wheel RVs
(1)
Includes approximately 13,500 RVs purchased by FEMA for emergency housing for 2004 hurricane victims.
(2)
Excludes 38,900 ELU’s in 2005 and 31,400 ELU’s in 2006 purchased by FEMA. A total of 70,300 ELU’s were
purchased by FEMA for the period 9/05 to 4/06. The Company’s sales content per ELU was significantly less
than that of a typical travel trailer.
(3)
Starting in September 2005, about 27,000 towable RVs were purchased by FEMA from dealers which were
replaced by the dealers in 2005 and 2006.
(4)
Projection by RVIA. A portion of decline is attributable to FEMA units produced in 2006.
293
321
257
311
321
370
391
300
384
Page 17
41
57
42
56
355
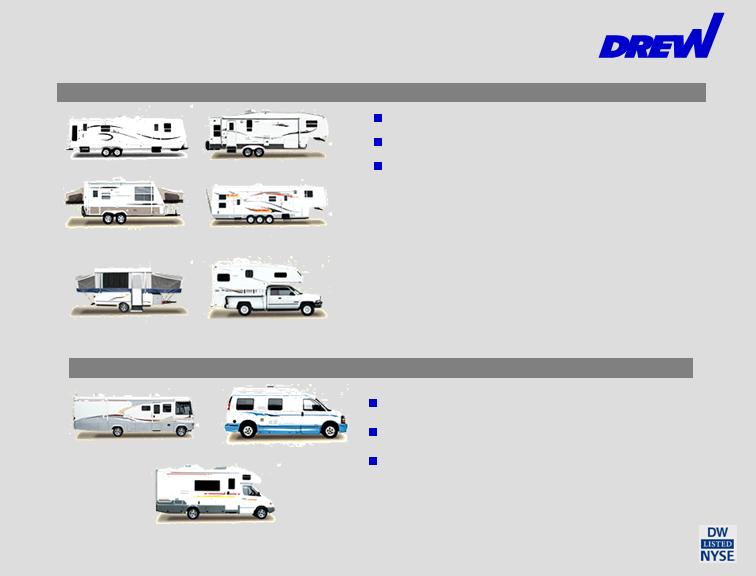
RV Market
86% of industry 2006 unit sales
50% of wholesale dollar sales
Retail cost $4,000 to $100,000
per unit. Average about $20,000
From 1998 to 2006 the travel
trailer and 5th wheel market grew
at an annual rate of
approximately 8%, compared to
a 2% annual decrease in
motorhome shipments.
14% of industry 2006 unit sales
50% of wholesale dollar sales
Retail cost $41,000 to $400,000+
per unit. Average about $100,000
TOWABLE RVS (90% of Drew’s RV revenues)
MOTORHOMES
Travel trailer with
expandable ends
Type A Motorhomes
Type B Motorhomes
Type C Motorhomes
Folding camping trailer
Travel trailer
Folding camping trailer
Sport utility RV
Fifth wheel travel trailer
Truck camper
Page 18
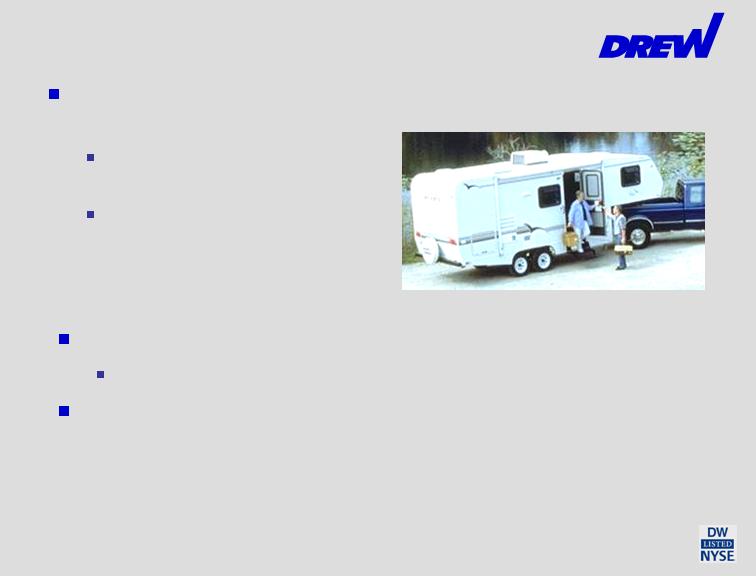
Growth In RV Market
Positive Demographic
Trends
Primary owners of RVs are
50 and over
According to census
projections, there are
expected to be 20 million
more people over 50 by 2014
Strong Growth
Prospects
Industry Advertising Campaign
Target Market 30 and over
Post 9/11 security concerns and high airline ticket
prices increase RV travel use
Fifth Wheel RV
Page 19

How RVs Are Used
Shift in U.S. culture
toward more RV-related
activities
NASCAR events
College and NFL football
games
“Toy Haulers”
More economical family
vacations
Typical RV family vacation
up to 74% less expensive
Strong Growth
Prospects
Many RVs are “parked”over the long-term
as second homes
Travel Trailer
Page 20
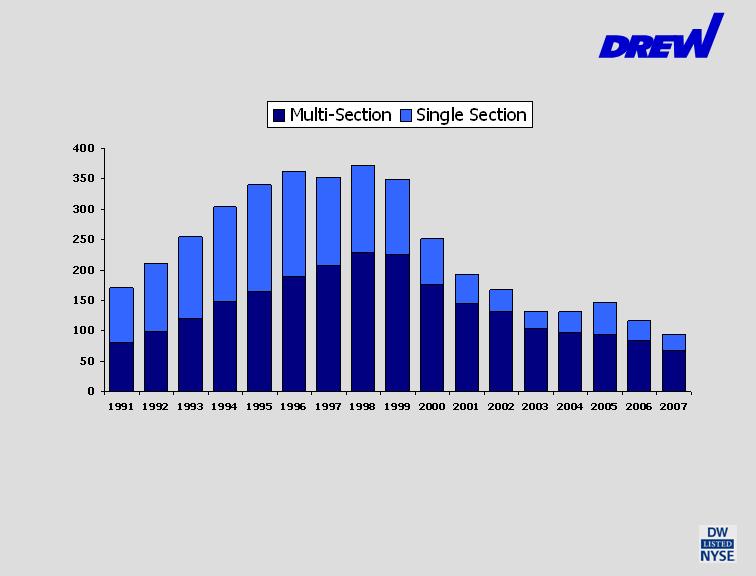
MH - Industry Production
171
211
254
304
340
363
353
373
349
(Thousands of Homes)
131
168
193
251
(1)
131
(1)
Includes approximately 3,500, 15,000 and 3,000 for 2004, 2005 and 2006, respectively,
MHs purchased by FEMA for emergency housing for hurricane victims.
(2)
Estimate by Company management.
(1)
147
(1)
117
Drew’s MH segment remained profitable every quarter since 1998.
47%
61%
59%
52%
49%
49%
47%
47%
75%
70%
65%
78%
74%
80%
72%
64%
Page 21
95
71%
Estimate (2)
Manufactured Housing (MH) Market
Cost per sq. ft. is $39 for MH vs.
$91 for site-built homes
Average retail price of $62,300
for a 1,595 sq. ft. MH
9 million manufactured homes
across the U.S.
Strong Growth
Prospects
Improved quality, appearance and safety
Studies have shown that MH built since 1995 sustain no more
damage in hurricanes than site-built homes
Industry production was down 69% from 1998 to 2006, but
Drew’s MH sales were up 13% and segment operating profit was
down only 20%
Page 22

MH: Industry Financing
Trends
Improved lending practices
Conventional financing more common than
chattel; improves collateral
Recent increase in loan applications
Recent increase in manufacturer order
backlogs
Subprime market woes could help MH
Pressure on Fannie Mac/Freddie Mac to
support MH loans
Strong Growth
Prospects
Page 23
MH: Other Favorable Factors
Baby Boomers retiring in
increasing numbers
Appropriate inventory
levels
Affordability and quality
New HUD code
Potential for rebuilding
the Gulf Coast
Strong
Growth
Prospects
Page 24
Improved industry image
Advertising campaign being developed
Berkshire investments

Drew’s Ownership and Governance
Executives and Directors currently own 11%.
Drew’s Corporate Governance Program –
ranked in the 87th percentile of all Russell 3000
Companies by Institutional Shareholder
Services.
Added to S&P SmallCap 600 Index in October
2005
Page 25
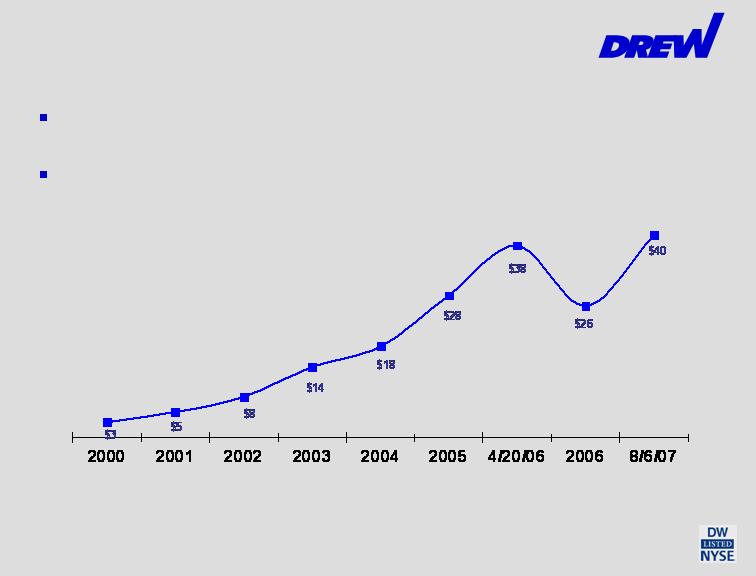
Financial Performance
The price of Drew’s common stock is nearly 14 times the price
as of December 31, 2000
Drew has 21.8 million shares outstanding and a market
capitalization of more than $850 million as of August 6, 2007
(December 31 unless noted)
Stock Price History
Drew effected a 2-for-1 stock split on 9/7/05 to holders of record on 8/19/05
Page 26

Operating Results
Year Ended December 31, (except as noted)
Financial
Performance
(1)
Excluding the estimated impact of hurricane-related sales from both 2006 and 2005, the Company
estimates that diluted EPS would have been approximately $1.33 in 2006, compared to approximately
$1.40 in 2005.
(2)
Sales during the latter part of 2006 and the first half of 2007 were negatively impacted by weakness in
both the RV and MH industries.
(3)
Adjusted for 2 for 1 stock split on 9/7/05.
(4)
EBITDA is operating profit plus depreciation and amortization (see page 37).
Page 27
($ in millions, except EPS)
2004
2005
200
6
(2)
LTM
6/07
(2)
LTM
6/07 vs
2006
Sales
$
531
$
669
$
7
29
$
676
-
7%
Operating Profit
$
44.0
$
57.7
$
55.3
$
57.4
+4%
% of Sales
8.3
%
8
.
6
%
7
.
6
%
8.5%
Net Income
$
25.1
$
33.6
$
3
1.0
$
32.7
+6%
Diluted EPS
(1
)
(3
)
$
1
.18
$
1
.56
$
1
.42
$
1.49
+5%
EBITDA
(4
)
$
53.3
$
69.7
$
71.0
$
74.7
+5%

Results By Segment
Year Ended December 31, (except as noted)
Financial
Performance
Page 28
(a)
After a charge of $1.4 million and $0.8 million for 2004 and 2005, respectively, related to legal
proceedings, net of related incentive compensation.
(b)
After a gain of $0.8 million related to the sale of closed facilities, net of related incentive compensation.
(c)
Sales during the latter part of 2006 and first half of 2007 were negatively impacted by weakness in both the
RV and MH industries.
See Form 10-K filed March 13, 2007 for a reconciliation to 2004 through 2006 consolidated results.
See page 38 for reconciliation to LTM 6/07 consolidated results.
10.8%
8.2%
8.6%
9.5%
9.6%
10.2%
9.4%
9.6%
Operating Profit as a
Percentage of Net sales
RV Segment
MH Segment
$ 52.1
$ 15.8
$ 43.9
$ 21.0 (b)
$ 43.1
$ 22.6(a)
$ 32.6
$ 17.7(a)
Operating Profit
RV Segment
MH Segment
$ 482.5
$ 193.7
$ 508.8
$ 220.4
$ 447.7
$ 221.5
$ 346.2
$ 184.7
Net Sales
RV Segment
MH Segment
LTM 6/07(c)
2006(c)
2005
2004
($ in Millions)
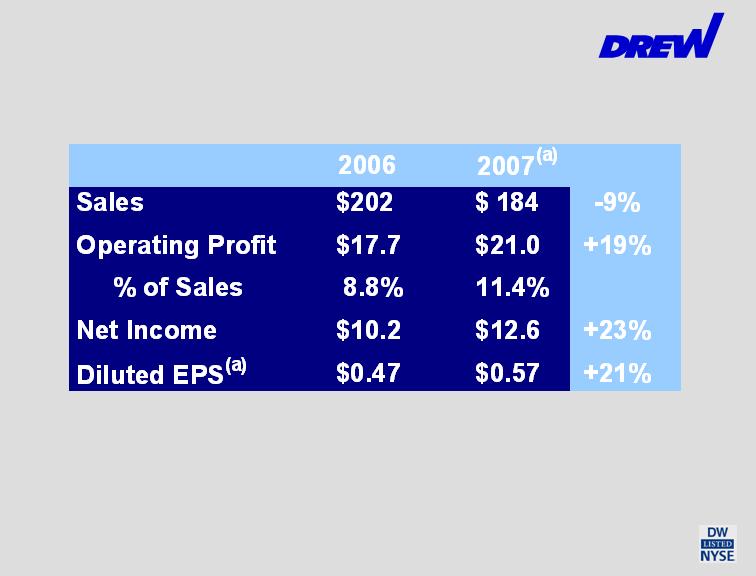
Operating Results
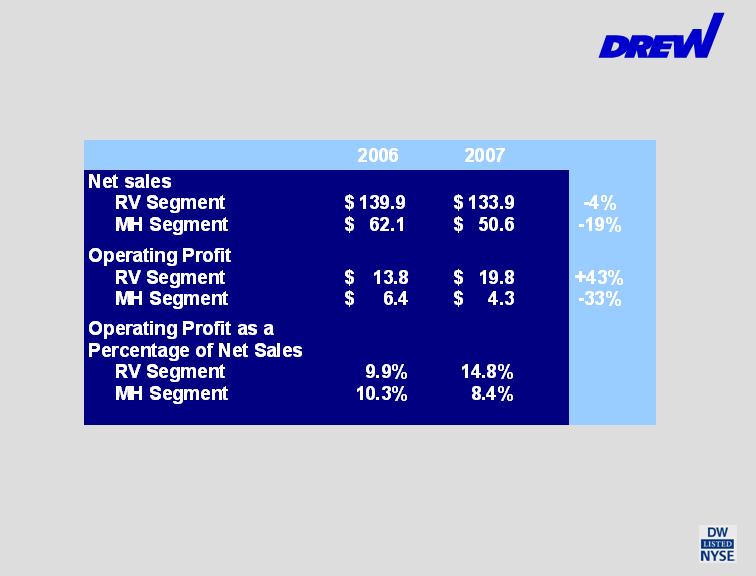
Three Months Ended June 30,
Financial
Performance
($ in millions, except EPS)
Page 29
(a)
Sales during the second quarter of 2007 were negatively impacted by weakness in both the RV
and MH industries.
Results By Segment
Three Months Ended June 30,
Financial
Performance
($ in millions)
Page 30
See Press Release dated July 31, 2007 for a reconciliation to consolidated results.
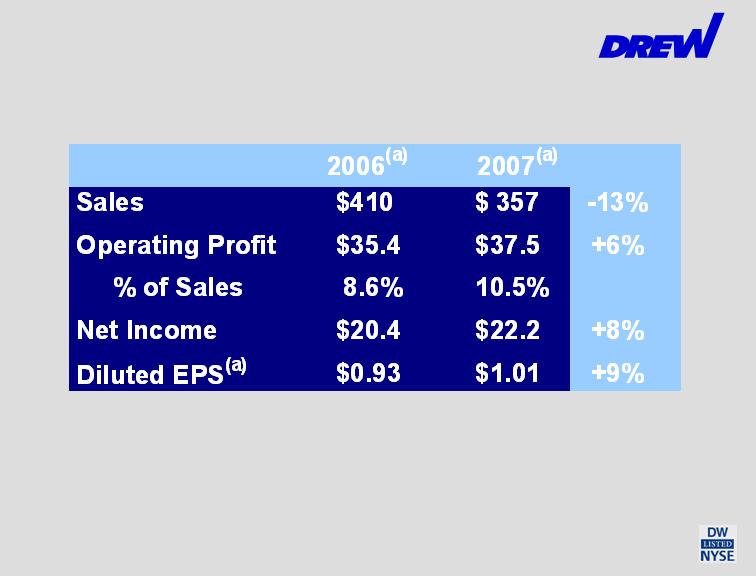
Operating Results
Six Months Ended June 30,
Financial
Performance
($ in millions, except EPS)
Page 31
(a)
Sales during the first six months of 2007 were negatively impacted by weakness in both the RV
and MH industries, while sales in the first six months of 2006 included approximately $20 million
of hurricane-related sales.
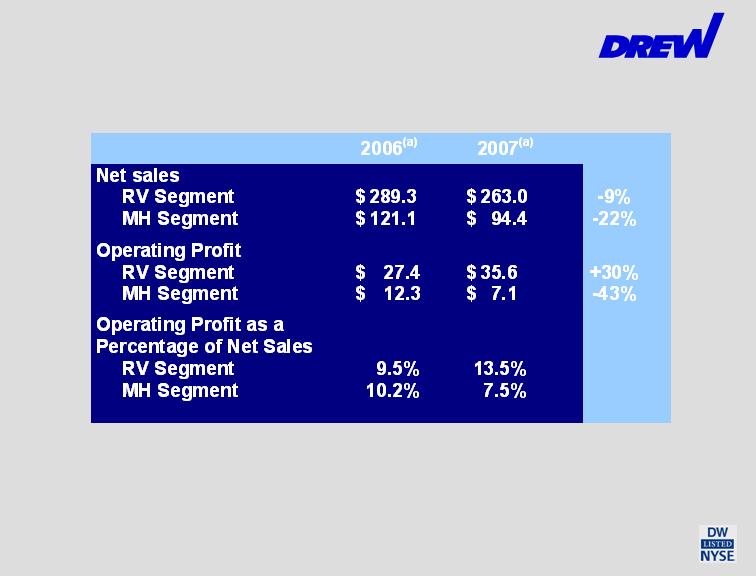
Results By Segment
Six Months Ended June 30,
Financial
Performance
($ in millions)
Page 32
See Press Release dated July 31, 2007 for a reconciliation to consolidated results.
(a)
Sales during the first six months of 2007 were negatively impacted by weakness in both the RV
and MH industries, while sales in the first six months of 2006 included approximately $20 million
of hurricane-related sales.
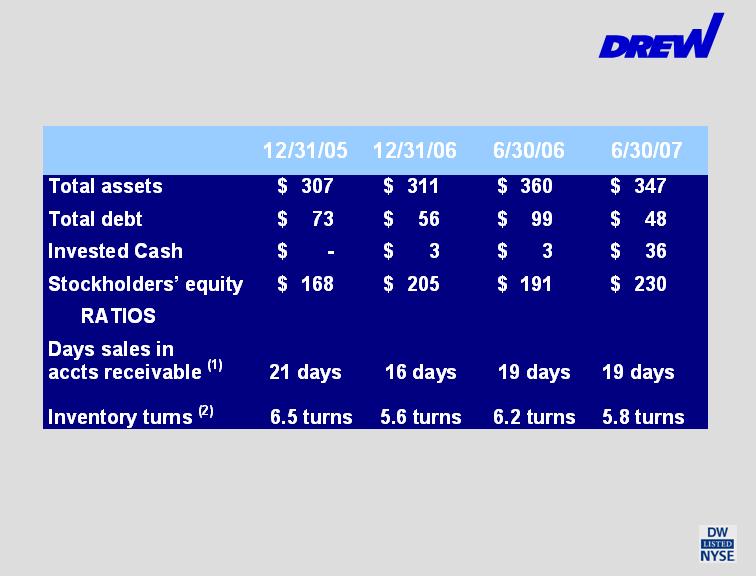
Balance Sheet
Financial
Performance
(1)
Days sales in accounts receivable is the most recent month’s net sales divided by accounts receivable, net,
at the end of the period.
(2)
Inventory turns is cost of goods sold for the last twelve months divided by average inventory for the last
twelve months.
Page 33
($ in millions)

Financial Strength
Financial
Performance
Page 34
(1) EBITDA is operating profit plus depreciation and amortization (see page 37).
12/31/04
12/31/05
12/31/06
LTM 6
/07
Return on Equity
23%
24%
16
%
16
%
Return on Assets
12%
12%
9
%
10
%
Total Debt to Equity
0.6
0.4
0.
3
0.
2
Total Debt to EBITDA
(1)
1
.3
1
.1
0.
8
0.
6

Peer Comparison
20%
13%
10.7
19.1
Spartan (SPAR)
(69%)
(4%)
28.7
N/A
Fleetwood (FLE)
16%
11%
19.0
27.4
Drew (DW)
ROE
ROA
Forward
P/E
Trailing
P/E
(1%)
1%
16.0
N/A
Monaco (MNC)
18%
11%
15.5
19.2
Thor (THO)
16.8
25.1
Winnebago (WGO)
16%
8%
Source: Capital IQ, August 7, 2007, except forward P/E, which is provided by
Thomson Financial and is based on fiscal 2007 analyst projections.
Financial
Performance
Page 35

Thank You
Analyst coverage:
Avondale Partners, LLC:
Kathryn Thompson (615) 467-5637
BB&T Capital Markets:
John Diffendal (615) 340-8284
Ferris, Baker Watts, Inc.
John T. G. Rogers (410) 659-4645
Sidoti & Company LLC:
Scott Stember (212) 453-7017
Susquehanna Financial Group, LLP:
Cheryl Cortez (312) 427-5236
For more information contact:
Leigh J. Abrams, President and CEO
914-428-9098
leigh@drewindustries.com
Fredric M. Zinn, Executive VP and CFO
914-428-9098
fred@drewindustries.com
Or visit: www.drewindustries.com
Page 36

Reconciliation of Operating Profit
to EBITDA
Financial
Performance
Page 37
($ in millions)
2001
2002
2003
2004
2005
2006
LTM
6
/07
Operating Profit
$20.3
$29.2
$34.3
$44.0
$57.7
$55.3
$57
.
4
Depreciation and
Amortization
$8.4
$7.3
$7.8
$9.3
$12.0
$15.7
$
1
7
.
3
EBITDA
$28.7
$36.5
$42.1
$53.3
$69.7
$71.0
$7
4
.
7
Capital Expenditures
$8.2
$
10.5
$5.1
$27.1
$26.1
$22.3
$
1
1
.
3

Results By Segment
Financial
Performance
Page 38
($ in millions)
Last
12
Months Ended
June 30,
2007
2006
Net sales
RV Segment
MH Segment
$
482.5
193.7
$
520.8
241.2
Total
Net Sales
$
676.2
$
762.0
Operating Profit
RV Segment
MH Segment
$
52.1
15.8
$
50.6
25.4
Total Segment
Operating Profits
67.9
76.0
Amortization of intangibles
(
3.5
)
(
1.7
)
Corporate and other
(
7.7
)
(
7.4
)
Other income
0.
7
0.
7
Total
Operating
P
rofit
$
57.4
$
67.6