2003
2003
A Leading National Supplier of a Wide Variety of
Components for RVs and Manufactured Homes
Exhibit 99.1

This presentation may contain certain “forward-looking statements” within the meaning of the Private Securities Litigation
Reform Act of 1995 with respect to financial condition, results of operations, business strategies, operating efficiencies or
synergies, competitive position, growth opportunities for existing products, plans and objectives of management, markets
for the Company’s common stock and other matters. Statements in this presentation that are not historical facts are
“forward-looking statements” for the purpose of the safe harbor provided by Section 21E of the Securities Exchange Act of
1934 and Section 27A of the Securities Act of 1933.
Forward-looking statements, including, without limitation, those relating to our future business prospects, revenues,
expenses and income, whenever they occur in this presentation, are necessarily estimates reflecting the best judgment of
our senior management at the time such statements were made, and involve a number of risks and uncertainties that
could cause actual results to differ materially from those suggested by forward-looking statements. The Company does
not undertake to update forward-looking statements to reflect circumstances or events that occur after the date the
forward-looking statements are made. You should consider forward-looking statements, therefore, in light of various
important factors as identified in this presentation and in our Form 10-K for the year ended December 31, 2008, and in our
subsequent Form 10-Qs filed with the SEC.
There are a number of factors, many of which are beyond the Company’s control, which could cause actual results and
events to differ materially from those described in the forward-looking statements. These factors include pricing pressures
due to domestic and foreign competition, costs and availability of raw materials (particularly steel and related
components, vinyl, aluminum, glass and ABS resin), availability of credit for financing the retail and wholesale purchase of
manufactured homes and recreational vehicles, availability and costs of labor, inventory levels of retailers and
manufacturers, levels of repossessed manufactured homes and RVs, the disposition into the market by FEMA, by sale or
otherwise, of RVs or manufactured homes purchased by FEMA in connection with natural disasters, changes in zoning
regulations for manufactured homes, continuing sales decline in either the RV or manufactured housing industries, the
financial condition of our customers, the financial condition of retail dealers of RVs and manufactured homes, retention of
significant customers, interest rates, oil and gasoline prices, and the outcome of litigation. In addition, national and
regional economic conditions and consumer confidence may affect the retail sale of recreational vehicles and
manufactured homes.
Forward-Looking Statements
- 2 -
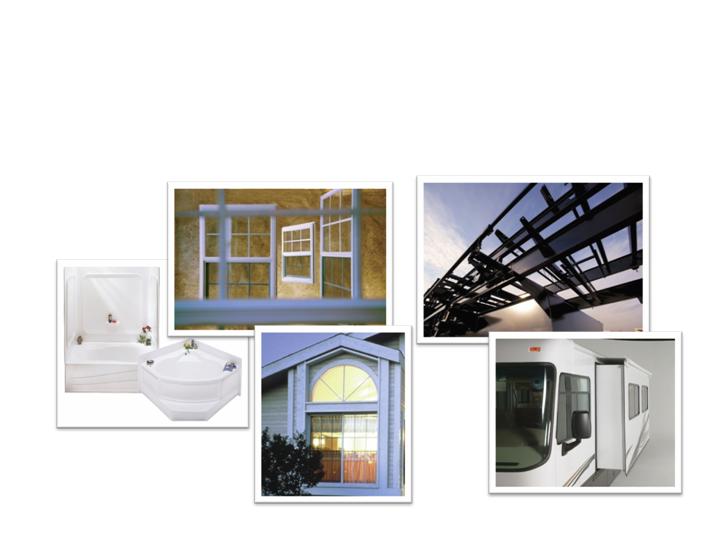
About Drew Industries
A leading national manufacturer of quality
components for Recreational Vehicles (RV) and
Manufactured Homes (MH)
- 3 -
(1)
EBITDA is operating profit plus depreciation, amortization and goodwill impairment
(see page 35).
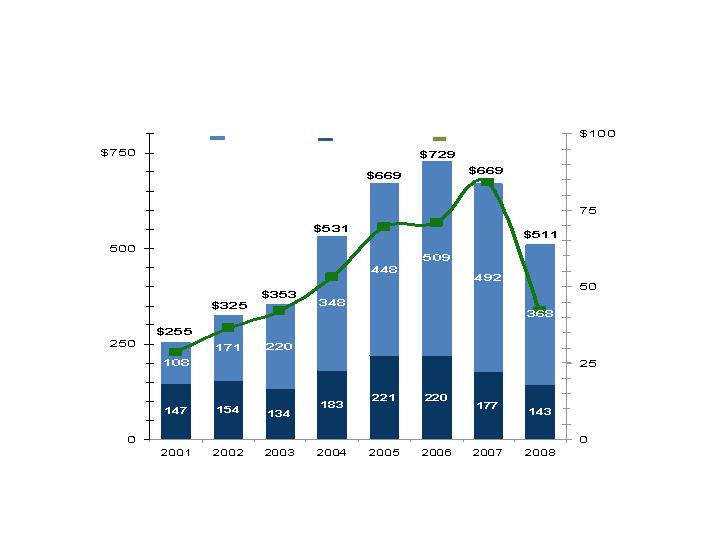
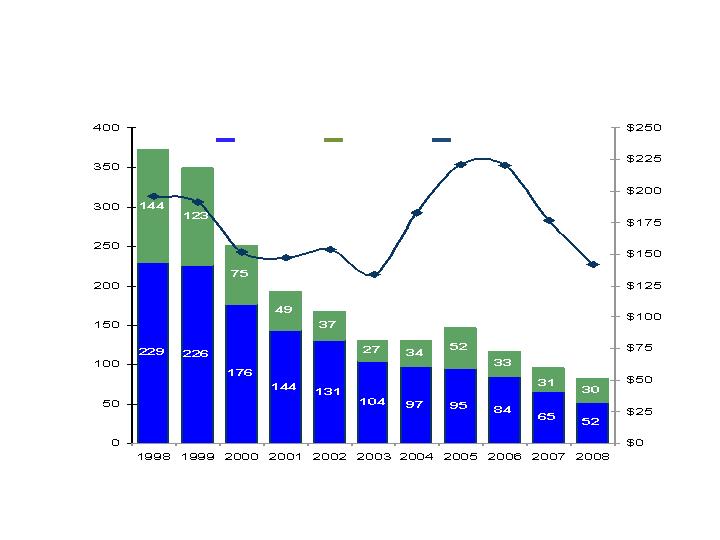
MH Segment sales
RV Segment sales
EBITDA(1)
- 4 -
Financial Performance
Sales and EBITDA (in millions)

Kinro, Inc. - Acquired 1980
Aluminum windows for RVs
Doors for RVs and MHs
Aluminum and vinyl windows and screens for MHs
Bath and shower units, and sinks for MHs and RVs
Thermoformed exterior panels for RVs
Lippert Components, Inc. - Acquired 1997
Chassis and chassis parts for RVs and MHs
RV slide-out mechanisms and solutions
Manual, electric, and hydraulic stabilizer and lifting
systems for RVs
Entry and baggage doors for RVs
Axles and suspension systems
Toy hauler RV ramp doors
Furniture and mattresses for RVs
Entry steps for RVs
Specialty trailers for boats, personal watercraft and
hauling equipment
Drew’s Companies
- 5 -

Drew’s Management Team
INNOVATIVE &
EXPERIENCED
MANAGEMENT
Jason D. Lippert, CEO, President and Chairman
of Lippert and Kinro 13+ years
LIPPERT - KINRO
Jason Lippert
Highly respected and
experienced management:
- 6 -
Leigh J. Abrams, Chairman 35+ years
Fredric M. Zinn, President and CEO
25+ years
DREW
Leigh Abrams
Fredric Zinn

Drew’s Segments – 2008
- 7 -
Revenues - $511 million
Segment Operating Profit - $40 million
MH = $11 million
28%
RV = $29 million
72%
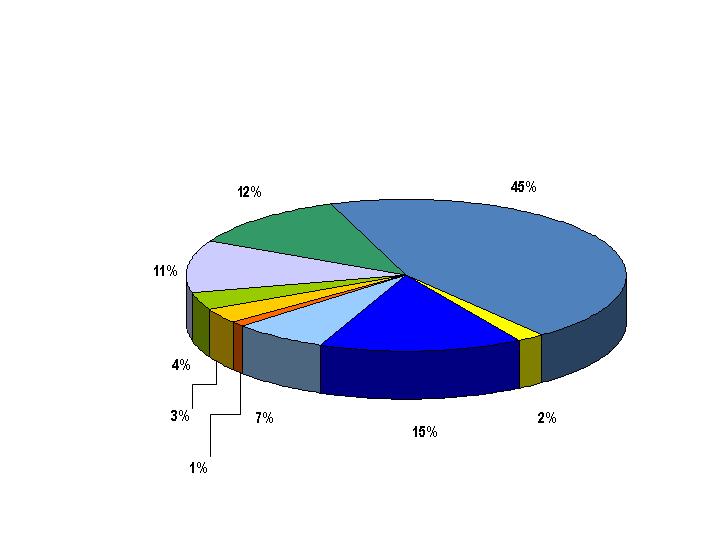
Drew’s Products
Sales - $511 million
12 Months Ended December 31, 2008
RV Chassis, Slide-outs
and Other Chassis
Parts: $228 million
RV Windows and
Doors: $79 million
Other: $3 million
MH and RV Bath
Products: $21 million
Specialty Trailers:
$14 million
RV and MH Axles and
Tires: $34 million
MH Chassis and Chassis
Parts: $57 million
MH Windows and
Screens: $63 million
- 8 -
Furniture Products:
$12 million

Supplier to Industry Leaders
Outstanding customer service and national coverage, with 29
production facilities (approximately 2.6 million sq. ft.), make us a key
partner with our customers, including:
Other than Thor and Berkshire Hathaway, no customer represents
more than 6% of consolidated net sales.
- 9 -
Forest River (owned by Berkshire Hathaway – largest customer)
Heartland Recreational Vehicles, LLC (privately owned)
Jayco/Starcraft (privately owned)
Skyline (NYSE: SKY)
Thor (NYSE: THO) – 2nd largest customer
Champion (NYSE: CHB)
Clayton (owned by Berkshire Hathaway – largest customer)
Palm Harbor (Nasdaq: PHHM)
Skyline (NYSE: SKY)
RV
MH

Economic and Market Conditions
- 10 -

Increase sales and profitability through
Market share growth
New product introductions
Strategic acquisitions
Operational efficiencies
This strategy accomplished through
Outstanding customer service
Motivating management through strong profit incentives
Low cost manufacturing:
Optimizing production efficiencies through state-of-the-art
manufacturing technology and stringent cost controls
Facility consolidations and fixed cost reductions
R & D efforts
Disciplined and patient acquirer
Business Strategy
- 11 -
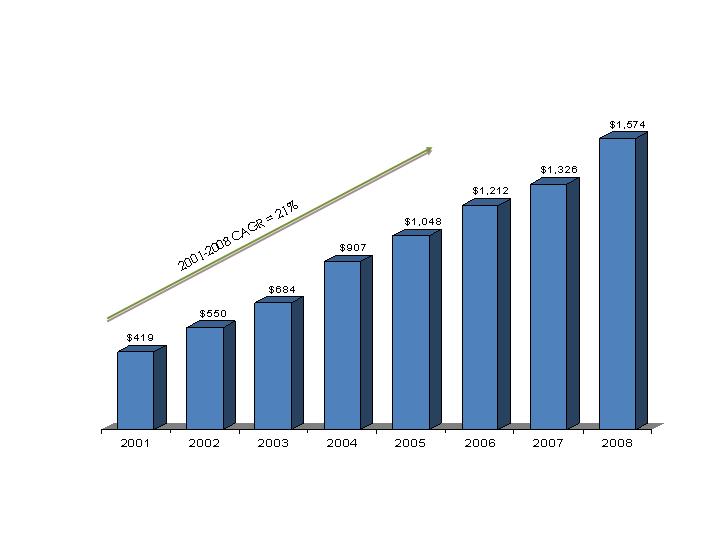
Content Per Vehicle - RV
Operating
profit margin 8.7% 10.0% 11.6% 9.8% 9.7% 8.6% 12.8% 7.8%
- 12 -
(1)
Includes historical sales for acquisitions assuming the acquisition was made at the beginning of the period.
See Page 18 for Industry Information
Peak potential is $3,500 to $3,800 per RV
90+% of RV Segment sales are for Towable RVs
(1)
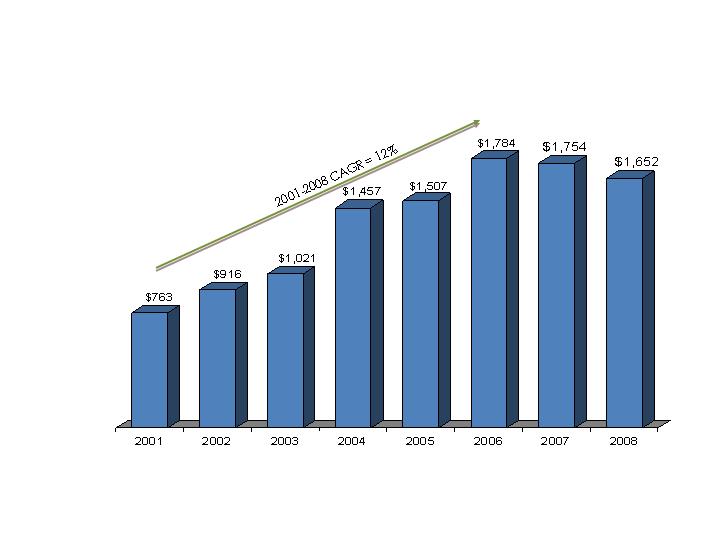
Peak potential is $3,600 to $4,000 per home
Content Per Home - MH
Operating
Profit margin 10.8% 10.9% 10.8% 10.5% 10.6% 9.1% 8.5% 7.7%
See Page 21 for Industry Information
- 13 -

Acquisitions and Product Line
Extension
- 14 -
Drew is a disciplined and patient acquirer
Replace competitors and other suppliers which have
ceased operations by acquiring their assets
Complimentary to our core RV (including specialty
trailers) and MH markets
Seek products or technologies that we can expand
through our nationwide customer base and factory
network
Become a more extensive supplier to our customers

New Product Introductions
- 15 -
Began
production of
entry doors for
RVs
Introduce RV
slide out
mechanisms
Began
Production of
axles for
towable RVs
1997
2008
2001
2000
2006
2004
2007
ACQUIRE
LIPPERT
COMPONENTS:
Primarily steel chassis
& parts for MH
ACQUIRE
BETTER BATH:
Adding thermo-
formed products
ACQUIRE
HAPPIJAC:
Adding
patented bed
lifts for RVs
ACQUIRE
EXTREME
ENGINEERING
expanding specialty
trailer product line
ACQUIRE
SEATING
TECHNOLOGY:
Adding furniture
for RVs
ACQUIRE
COACH STEP:
Adding electric
steps for motor
homes
Introduced RV
suspension
products
Expand
into steel
chassis for
towable
RVs

Investments
Kinro and Lippert
have extensive R&D
departments
Since January 1998
Invested over $155 million
in plant and equipment
Invested nearly $161 million for acquisitions
Invested $28 million for stock repurchases at
an average price of $5.85 per share through
December 31, 2008
- 16 -

88% of industry 2008 unit sales
47% of 2007 wholesale dollar
sales, or $5.5 billion
Retail cost $4,000 to $100,000 per
unit. Average about $20,000
RV Market
12% of industry 2008 unit sales
53% of 2007 wholesale dollar
sales, or $6.1 billion
Retail cost $41,000 to $400,000+
per unit. Average about $100,000
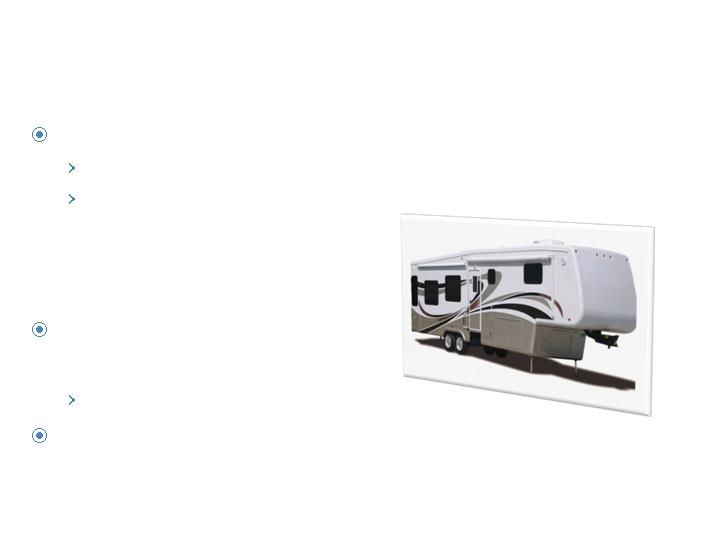
Travel trailer
Fifth wheel travel trailer
Travel trailer with
expandable ends
Folding camping trailer
Sport utility RV
“Toy Hauler”
Type C Motorhome
Truck camper
TOWABLE RVS (90+% of Drew’s RV Segment revenues)
MOTORHOMES (5% of Drew’s RV Segment revenues)
Type B Motorhome
Type A Motorhome
- 17 -
90+% of Drew’s RV product sales are for Travel Trailers and 5 th Wheel RVs
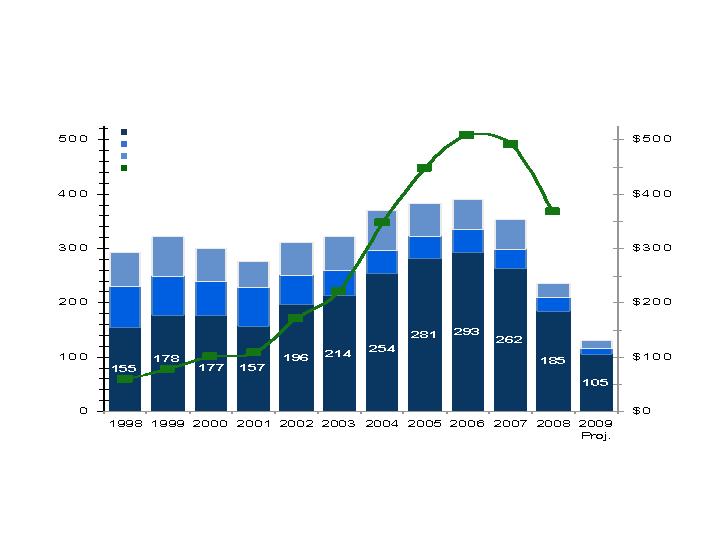
Excludes emergency living units purchased by FEMA in
2005 and 2006. Projection for 2009 is the latest published by the RVIA.
(Units in thousands, Sales in millions)
- 18 -
Travel Trailers & 5th Wheel
Other Towables
Motorhomes
Drew’s RV Sales
130
257
293
321
300
311
321
370
384
391
353
237
RVs - Industry Wholesale Shipments
Industry
Units
Drew
Sales
Positive Demographic Trends
Americans 50 and over are a prime market for RVs
According to March 2004 census projections,
there are expected to be
20 million more people
over 50 by 2014
Industry Advertising
Campaign
Target Market 25 and over
Airport security hassles and high airline ticket
prices increase RV travel use
Trends In RV Market
STRONG LONG-TERM GROWTH
PROSPECTS
- 19 -

How RVs Are Used
Shift in U.S. culture toward more RV-related
activities
College and NFL football games
NASCAR events
More economical
family vacations
Typical RV family vacation
up to 74% less expensive
Many RVs are “parked” over the long-term
as second homes
STRONG LONG-TERM GROWTH
PROSPECTS
- 20 -
- 21 -
MH – Industry Production
Drew’s MH Segment remained profitable every quarter since 1998.
Single-Section
Multi-Sections
Drew’s MH Sales
61%
65%
70%
75 %
$177
78%
80%
74%
64%
72%
63%
68%
$220
$221
$183
$134
$154
$147
$152
$191
$196
(Units in thousands, Dollars in millions)
373
349
96
82
117
147
131
131
168
193
251
Industry
Units
Drew
Sales
$142
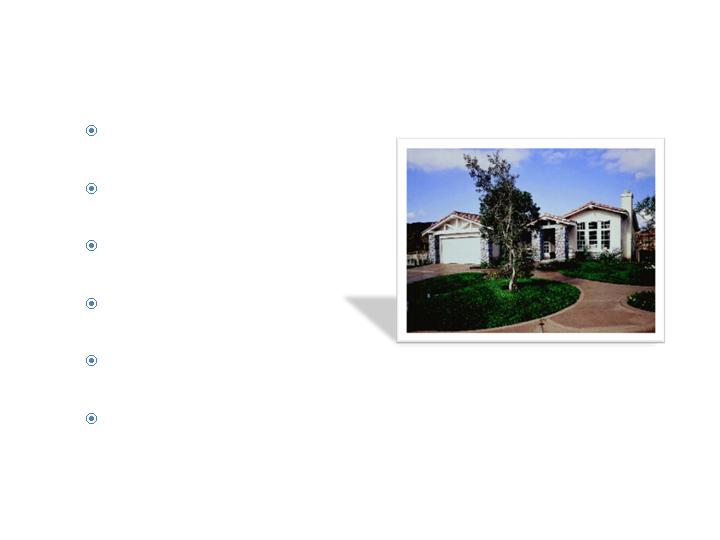
Manufactured Housing (MH) Market
Cost per sq. ft. is $40 for MH vs.
$92 for site-built homes
Average retail price of
$64,200 for a 1,600 sq. ft. MH
9 million manufactured
homes across the U.S.
Improved quality,
appearance and safety
Studies have shown that MHs built since 1995 sustain
no more damage in hurricanes than site-built homes
Industry production was down 78% from 1998 to 2008.
Drew has remained profitable in its MH segment through this
industry downturn.
- 22 -
STRONG LONG-TERM GROWTH
PROSPECTS
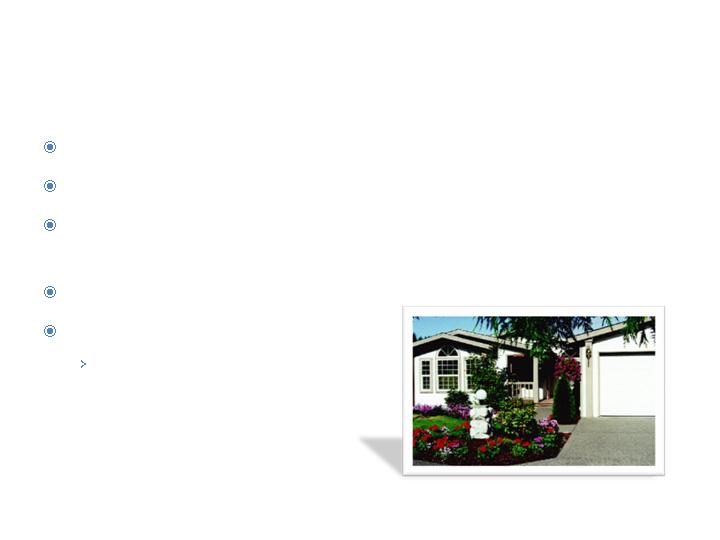
MH: Other Favorable Factors
Affordability and quality
Baby Boomers retiring in increasing numbers
Dealer and manufacturer inventory levels are
reasonable
Favorable HUD code revisions
Improved industry image
Advertising campaign may
begin in 2009
- 23 -
STRONG LONG-TERM GROWTH
PROSPECTS

MH: Industry Financing Trends
- 24 -
Improved lending practices
The American Recovery Act of 2009 authorizes a
tax credit of up to $8,000 for qualified first time
home buyers
Recently passed legislation increased FHA insured
chattel loan limits (home only) on manufactured
homes from $48,600 to $69,678
Pressure on Fannie Mae/Freddie Mac to support
MH loans
Conventional financing more common than
chattel; improves collateral
Subprime market woes could help MH
STRONG LONG-TERM GROWTH
PROSPECTS

Financial Performance
(December 31 unless noted)
- 25 -
Stock Price History
Drew has 22 million shares outstanding and a
market capitalization of approximately $137
million as of March 12, 2009
During 2008, Drew repurchased 447,400 shares of its common stock at an
aggregate of $8.3 million, or an average price of $18.58 per share

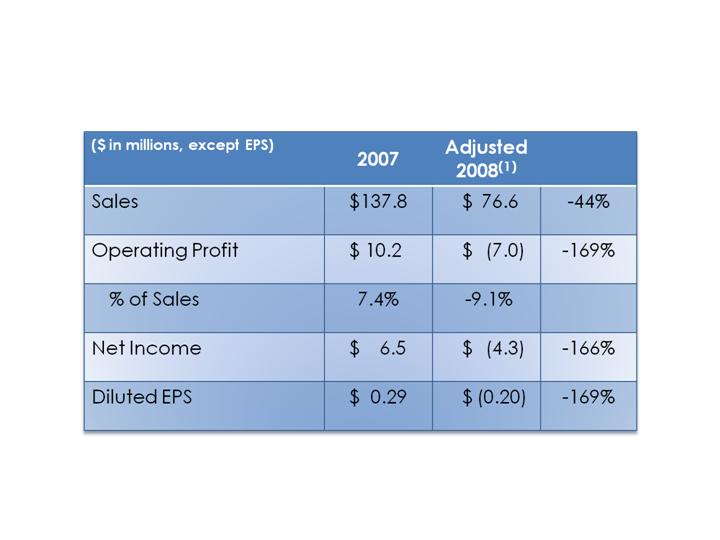
Operating Results
Year Ended December 31, (except as noted)
FINANCIAL PERFORMANCE
(1)
Sales declines due to reductions in industry-wide shipments of RVs and Manufactured Homes.
(2)
Adjusted 2008 excludes goodwill impairment and executive retirement charges (see page 36).
(3)
EBITDA is operating profit plus depreciation, amortization and goodwill impairment (see page 35).
- 26 -

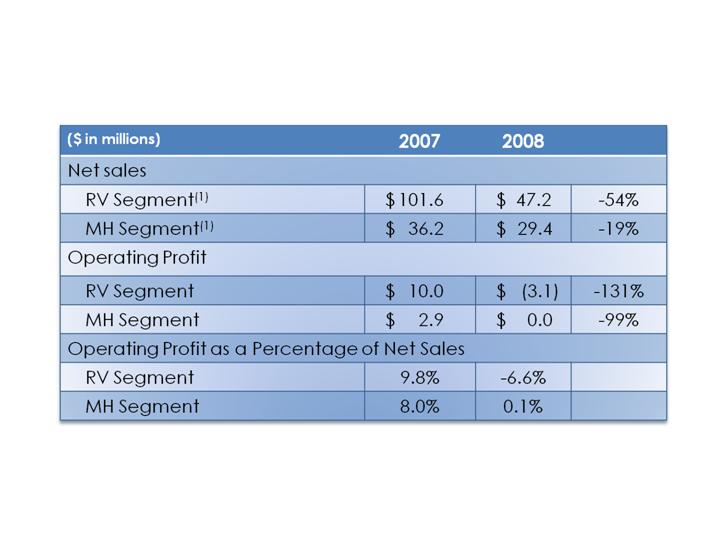
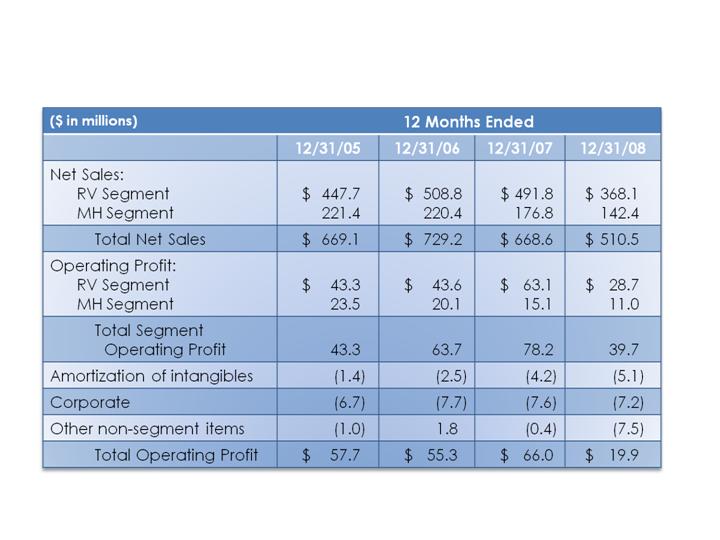
Results By Segment
(1) Sales declines due to reductions in industry-wide shipments of RVs and Manufactured Homes.
See page 37 for a reconciliation to consolidated results.
- 27 -
FINANCIAL PERFORMANCE
Operating Results
Three Months Ended December 31,
- 28 -
FINANCIAL PERFORMANCE
(1)
Excludes impairment and executive retirement charges (see page 36).
Results By Segment
Three Months Ended December 31,
See Press Release dated February 11, 2009 for a reconciliation to consolidated results.
- 29 -
FINANCIAL PERFORMANCE
(1)
Sales declines due to reductions in industry-wide shipments of RVs and Manufactured Homes.
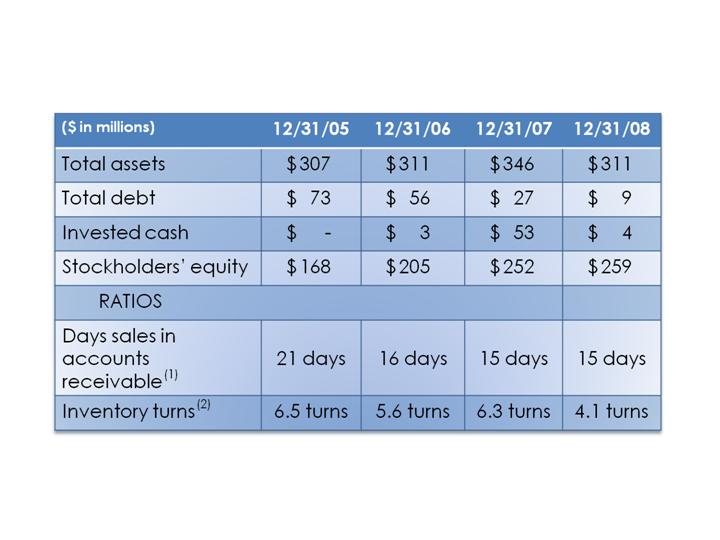
Balance Sheet
- 30 -
FINANCIAL PERFORMANCE
1)
Days sales in accounts receivable is the most recent month’s net sales divided by
accounts receivable, net, at the end of the period.
2)
Inventory turns is cost of goods sold for the last twelve months divided by average
inventory for the last twelve months.
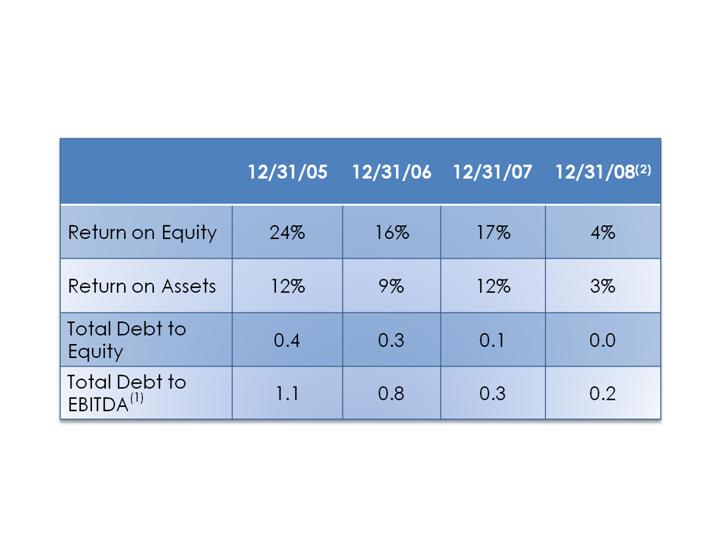
Financial Strength
(1)
EBITDA is operating profit plus depreciation, amortization and goodwill impairment (see page 35).
(2)
Includes a goodwill impairment of $5.5 million and executive retirement charges of $2.7 million.
- 31 -
FINANCIAL PERFORMANCE
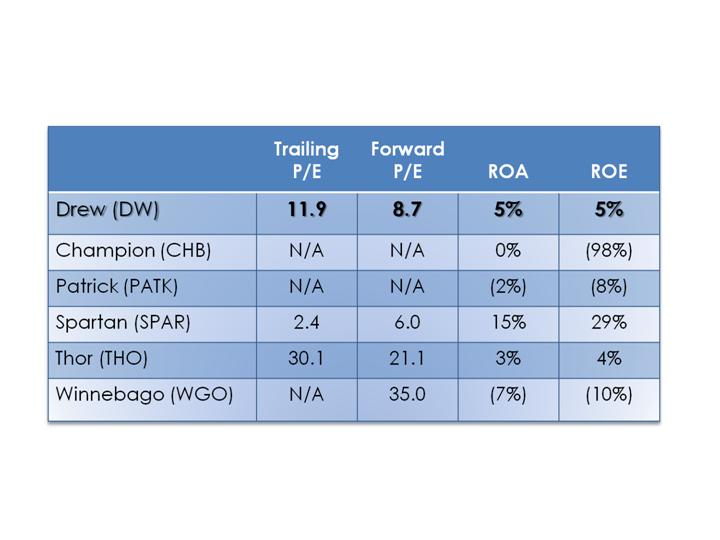
Peer comparison
Source: Capital IQ, Mach 12, 2009, data obtained from Yahoo! Finance, which is provided
by Thomson Financial and is based on fiscal 2009 analyst projections.
- 32 -
FINANCIAL PERFORMANCE

Analyst Coverage
- 33 -
Avondale Partners, LLC
Kathryn Thompson – (615) 467-5637
Sidoti & Company, LLC
Scott Stember – (212) 453-7017
CJS Securities
Torin Eastburn – (914) 287-7600
Janney Montgomery Scott LLC
John T. G. Rogers – (202) 955-4316

Thank you!
Joseph S. Giordano III
Chief Financial Officer
914-428-9098
joe@drewindustries.com
OR
VISIT OUR WEBSITE:
www.drewindustries.com
For more information contact:
- 34 -
Fredric M. Zinn
President and CEO
914-428-9098
fred@drewindustries.com
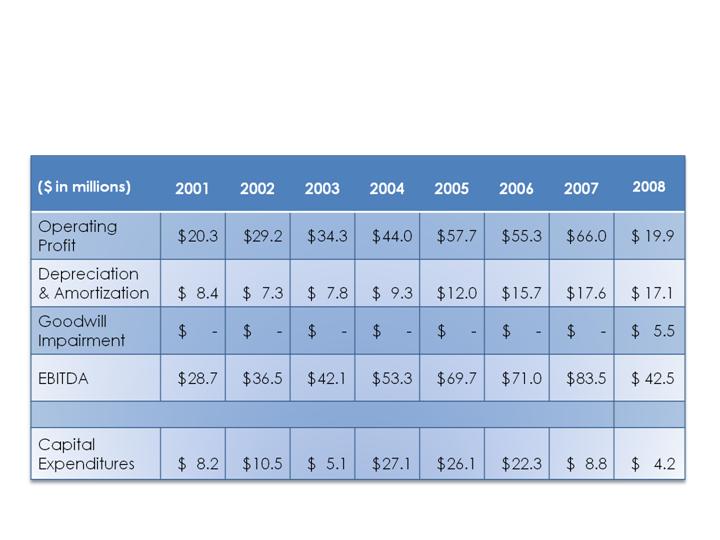
Reconciliation of Operating
Profit to EBITDA
- 35 -
FINANCIAL PERFORMANCE

Reconciliation of Adjusted
Results to Actual
FINANCIAL PERFORMANCE
(1)
Includes goodwill impairment of $5.3 million after direct impact on incentive compensation and
executive retirement charges of $2.7 million.
- 36 -
FINANCIAL PERFORMANCE
- 37 -
Other non-segment items for the twelve months ended 12/31/08 include a $5.5 million
goodwill impairment and a $2.7 million charge for executive retirement.
Reconciliation of Segment Results
to Consolidated