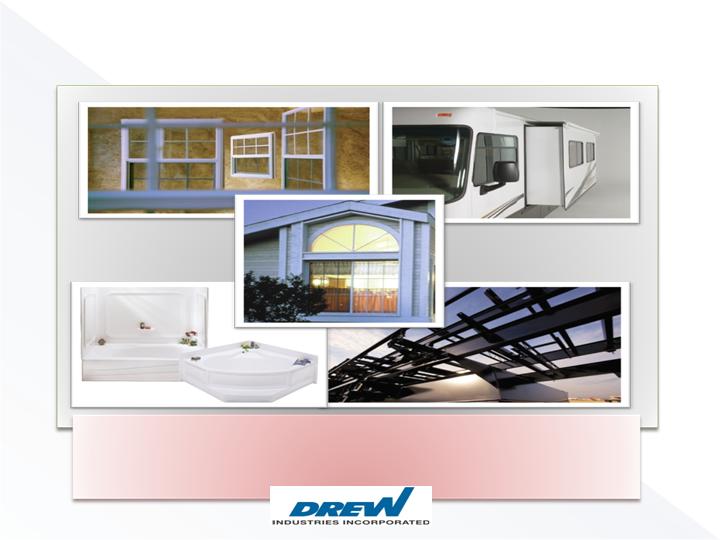
A Leading National Supplier of a Wide Variety of
Components for RV’s and Manufactured Homes
EXHIBIT 99.1
Drew Industries Incorporated
(NYSE: DW)

This presentation contains certain “forward-looking statements” within the meaning of the Private Securities Litigation
Reform Act of 1995 with respect to financial condition, results of operations, business strategies, operating efficiencies or
synergies, competitive position, growth opportunities for existing products, plans and objectives of management, markets
for the Company’s Common Stock and other matters. Statements in this presentation that are not historical facts are
“forward-looking statements” for the purpose of the safe harbor provided by Section 21E of the Securities Exchange Act of
1934 and Section 27A of the Securities Act of 1933.
Forward-looking statements, including, without limitation, those relating to our future business prospects, revenues,
expenses and income (loss), cash flow, and financial condition, whenever they occur in this presentation are necessarily
estimates reflecting the best judgment of our senior management at the time such statements were made, and involve a
number of risks and uncertainties that could cause actual results to differ materially from those suggested by forward-
looking statements. The Company does not undertake to update forward-looking statements to reflect circumstances or
events that occur after the date the forward-looking statements are made. You should consider forward-looking
statements, therefore, in light of various important factors, including those set forth in this presentation, and in our
subsequent filings with the Securities and Exchange Commission.
There are a number of factors, many of which are beyond the Company’s control, which could cause actual results and
events to differ materially from those described in the forward-looking statements. These factors include, in addition to the
matters described in this presentation, pricing pressures due to domestic and foreign competition, costs and availability of
raw materials (particularly steel and steel-based components, vinyl, aluminum, glass and ABS resin) and other
components, availability of credit for financing the retail and wholesale purchase of manufactured homes and
recreational vehicles (“RVs”), availability and costs of labor, inventory levels of retail dealers and manufacturers, levels of
repossessed manufactured homes and RVs, the disposition into the market by the Federal Emergency Management
Agency (“FEMA”), by sale or otherwise, of RVs or manufactured homes purchased by FEMA, changes in zoning regulations
for manufactured homes, sales declines in the RV or manufactured housing industries, the financial condition of our
customers, the financial condition of retail dealers of RVs and manufactured homes, retention and concentration of
significant customers, interest rates, oil and gasoline prices, and the outcome of litigation. In addition, national and
regional economic conditions and consumer confidence affect the retail sale of RVs and manufactured homes.
Forward-Looking Statements
- 1 -

SECTION I
Overview
- 2 -
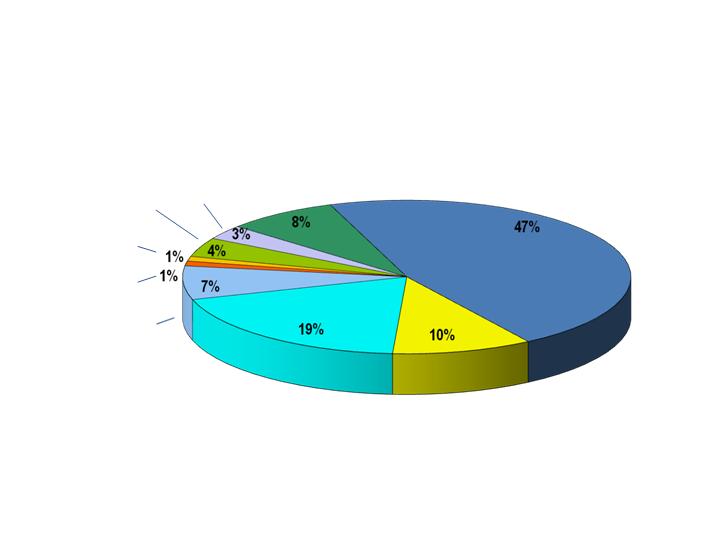
Drew’s Products – Components
for RVs and Manufactured Homes
$571 Million of Sales for the12 Months Ended September 30, 2010
RV Chassis, Slide-outs and Other
Chassis Parts:
$265 million
RV Windows and Doors:
$110 million
Other Products:
$4 million
Bath Products:
$19 million
Specialty Trailers:
$4 million
Axles and
Suspension
Products:
$38 million
MH Chassis and
Chassis Parts:
$25 million
RV Furniture:
$48 million
- 3 -
MH Windows and Doors:
$58 million
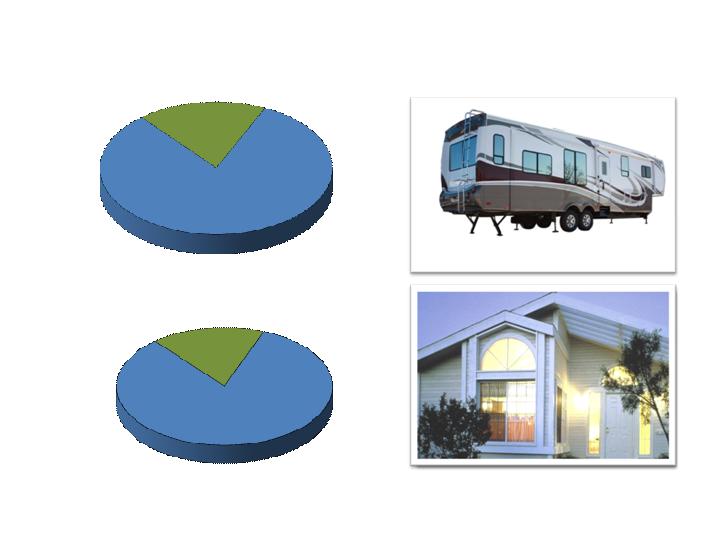
Drew’s Segments – LTM 9/2010
MH = $96 million
17%
RV = $475 million
83%
90+% for towable RVs
- 4 -
Revenues - $571 million
Segment Operating Profit - $54 million
RV = $44 million
82%
MH = $10 million
18%

(1)
EBITDA is operating profit plus depreciation, amortization and goodwill impairment (see page 37).
(2)
Includes sales related to RVs and manufactured homes purchased by FEMA of approximately $40 million in 2005,
and approximately $20 million in 2006.
MH Segment sales
RV Segment sales
EBITDA
- 5 -
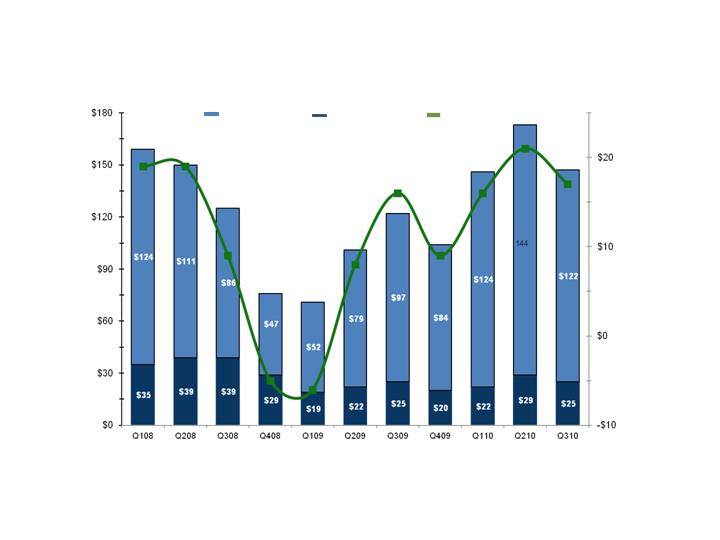
Financial Performance
Sales and EBITDA(1) (in millions)
Sales
EBITDA
(1)
EBITDA is operating profit plus depreciation, amortization and goodwill impairment (see page 38).
(2)
The Company’s operations are somewhat seasonal, as sales in the second and third quarters are traditionally
stronger than the first and fourth quarters, consistent with the industries which the Company supplies. However,
because of unusual changes in RV dealer inventories in recent quarters, and the uncertain economic
environment, seasonal industry trends may be different than in prior years.
MH Segment sales
RV Segment sales
EBITDA
- 6 -
Financial Performance – Quarterly(2)
Sales and EBITDA(1) (in millions)
Sales
EBITDA
S159
$151
$124
$77
$71
$101
$122
$105
$146
$174
$147

SECTION II
Industries
- 7 -
92% of industry 2009 unit sales
69% of 2009 wholesale dollar
sales, or $2.8 billion
Retail cost $4,000 to $100,000 per
unit. Average about $24,000
RV Market
8% of industry 2009 unit sales
31% of 2009 wholesale dollar
sales, or $1.3 billion
Retail cost $41,000 to $400,000+
per unit. Average about $131,000
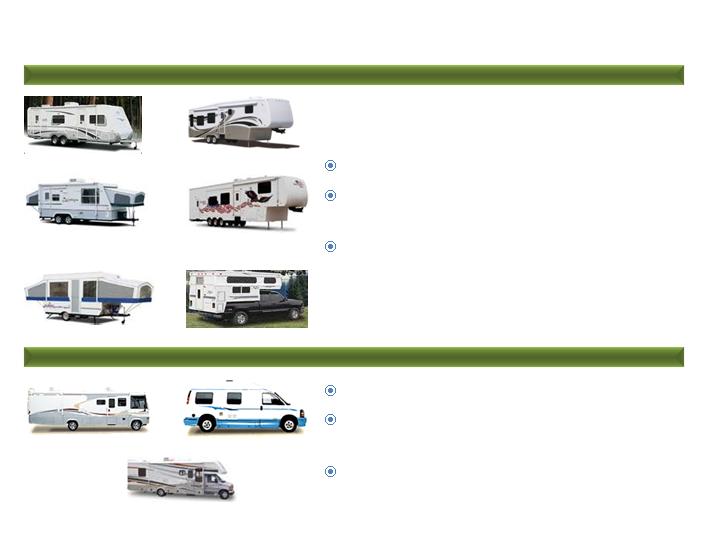
Travel trailer
Fifth-wheel travel trailer
Travel trailer with
expandable ends
Folding camping trailer
Sport utility RV
“Toy Hauler”
Type C Motorhome
Truck camper
TOWABLE RVS (90+% of Drew’s RV Segment revenues)
MOTORHOMES (3% of Drew’s RV Segment revenues)
Type B Motorhome
Type A Motorhome
- 8 -

Shift in U.S. culture toward
more RV-related activities
College and NFL football games
NASCAR events
More active, shorter, “greener”,
& family oriented vacations
More economical
family vacations
Typical RV family vacation
is less expensive
Many RVs are “parked” over
the long-term as second homes
How RVs Are Used
- 9 -
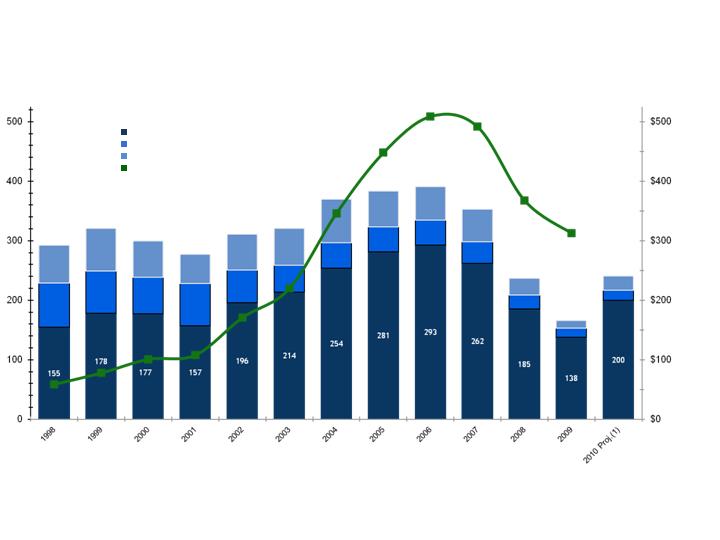
90+% of Drew’s RV product sales are for Travel Trailers and 5th Wheel RVs
(1) Projection for 2010 is the latest published by the RVIA (September 2010). During the first nine months of
2010, the industry produced 160,200 travel trailer and fifth-wheel RVs.
(Units in thousands, Sales in millions)
- 10 -
Travel Trailers & 5th Wheel
Other Towables
Motorhomes
Drew’s RV Sales
166
257
293
321
300
311
321
370
384
391
353
237
RVs - Industry Wholesale Shipments
Industry
Units
Drew’s
Sales
240
Wholesale
Retail
- 11 -
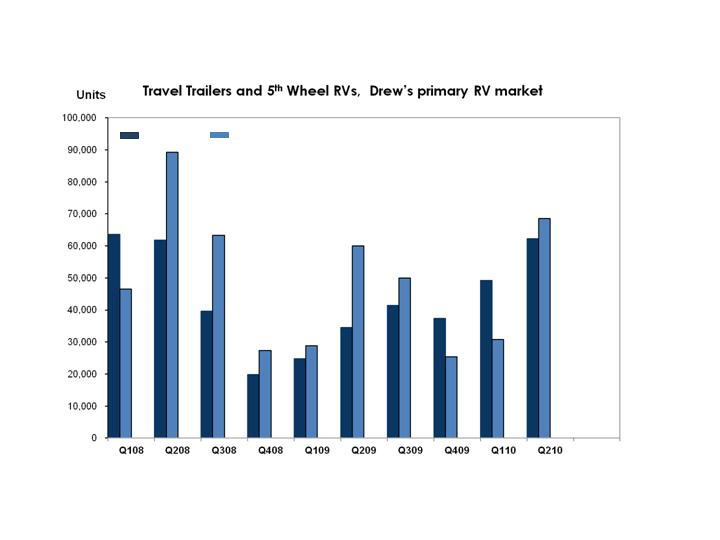
Recent RV Industry Trends
All data includes both US and Canada.
Final data for Q3 2010 is not yet available
Dealer
Inventory
Change
17,087 (27,312) (23,623) (7,439) (4,103) (25,426) (8,440) 12,070 18,446 (6,283)
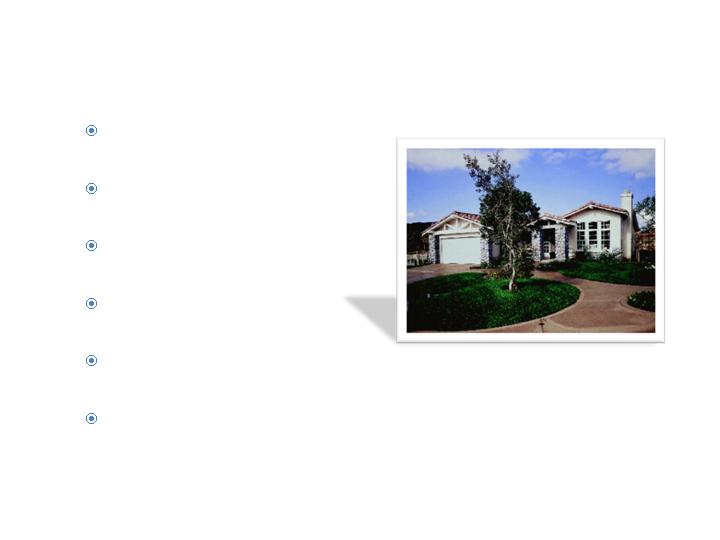
Cost per sq. ft. is $41 for MH vs.
$89 for site-built homes
Average retail price of
$64,900 for a 1,570 sq. ft. MH
9 million manufactured
homes across the U.S.
Improved quality,
appearance and safety
Studies have shown that MHs built since 1995 sustain
no more damage in hurricanes than site-built homes
Industry production was down 87% from 1998 to 2009.
Manufactured Housing (MH) Market
- 12 -

- 13 -
MH – Industry Production
Single-Section
Multi-Sections
Drew’s MH Sales
65%
70%
75 %
$177
78%
80%
74%
72%
63%
68%
$220
$221
$185
$134
$154
$147
$152
$191
$196
(Units in thousands, Dollars in millions)
373
349
96
82
117
147
131
131
168
193
Industry
Units
Drew’s
Sales
$142
50
$85
251
63%
52
60%
$96
There are no industry forecasts for the manufactured housing industry.

MH: Favorable Factors
- 14 -
INDUSTRY:
Demand
Demand for quality, affordable housing is likely to increase
Baby boomers retiring in increasing numbers
Dealer and manufacturer inventory levels are reasonable
Financial
Subprime market woes could help MH
Pre-2003, MH was 20+% of Single Family housing starts
In peak "Sub-prime era”, MH was about 8% to 11% of Single Family
housing starts
2008 to 2009, MH was about 13% of Single Family housing starts
Availability of financing is still an issue
DREW:
Drew remains profitable in MH Segment: 10.0% operating profit
margin for the 12 months ended September 30, 2010
Sales up 16% in the first 9 months of 2010 from the same period
in 2009
Increased focus on aftermarket driving sales growth
Added new product line - entry doors in late 2009

SECTION III
Strategy
- 15 -

Business Strategy
Maximize profitability and return on assets through
Strategic acquisitions
New product introductions
Market share growth
Operational efficiencies
This strategy accomplished through
Outstanding customer service
Motivating management through strong profit incentives
Low cost manufacturing:
Optimizing production efficiencies and implementing stringent
cost controls
Facility consolidations and fixed cost reductions
Working capital management
R & D efforts
Disciplined and patient acquisition philosophy
- 16 -

Acquisition Criteria
- 17 -
Drew is a disciplined and patient acquirer
Gain market share or add products from other suppliers
through asset acquisitions
Complimentary to our core RV (including specialty
trailers) and MH markets
Seek products or technologies that we can expand
through our nationwide customer base and factory
network
Become a more extensive supplier to our customers
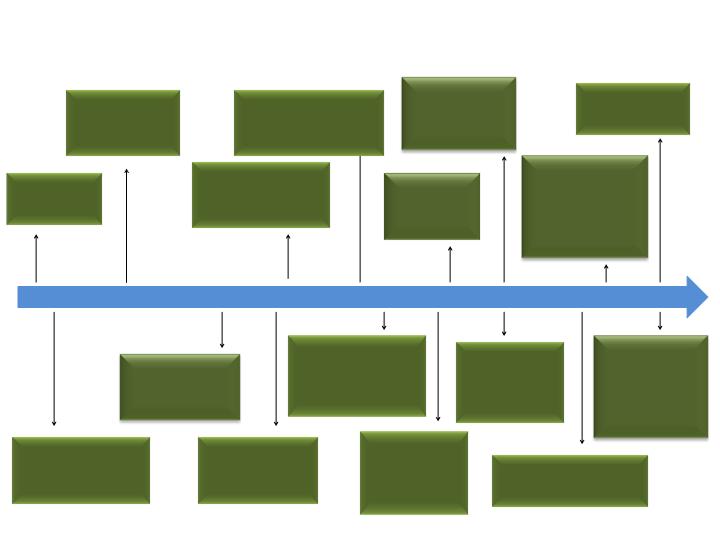
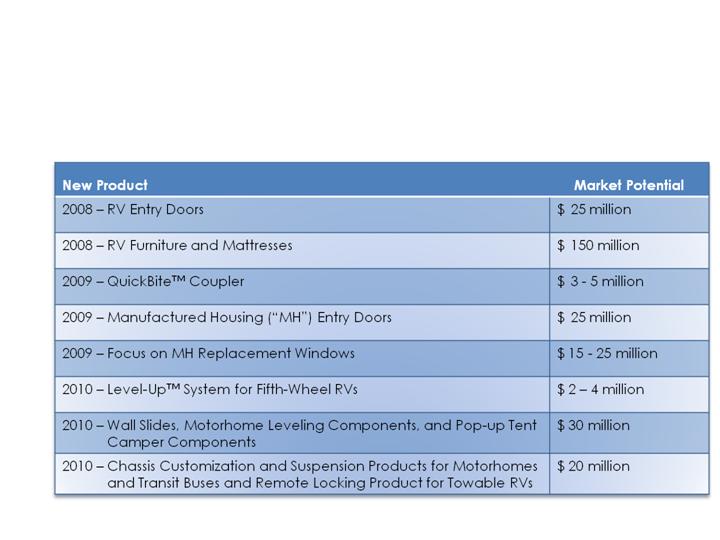
New Product Introductions
- 18 -
Began
production of
entry doors
for RVs
Introduce RV
slide-out
mechanisms
Began
Production of
axles for
towable RVs
2001 2004 2005 2006 2007 2008 2009 2010
ACQUIRE
BETTER BATH:
Adding thermo-
formed products
ACQUIRE
HAPPIJAC:
Adding patented
bed lifts for RVs
ACQUIRE
EXTREME
ENGINEERING:
Expanding specialty
trailer product line
ACQUIRE
COACH STEP:
Adding electric steps
for motorhomes
ACQUIRE
EQUA FLEX:
Adding RV
suspension products
ACQUIRE
QUICKBITE TM :
Adding a new
innovative
coupler
Began
production of
entry doors
for MH
ACQUIRE
ZIEMAN:
Adding specialty
trailers
ACQUIRE LEVEL-UP TM:
Adding leveling system
for fifth-wheel RVs
ACQUIRE
SCHWINTEK :
Adding wall-slide
mechanism and
leveling devices
for motorhomes
ACQUIRE
SELLERS:
Adding chassis
customization &
suspension for
motorhomes &
transit buses
Introduce
RVLOCK remote
locking product
ACQUIRE
SEATING
TECHNOLOGY:
Adding
furniture for RVs
What Drew Has Done -
Acquisitions and Growth
- 19 -
Content Per New Towable RV
RV Segment
operating
profit margin 8.7% 10.0% 11.6% 9.7% 9.6% 8.3% 12.2% 6.7% 5.0% 9.3%
- 20 -
See Page 10 for Industry Information
- 90+% of RV Segment sales are for Travel Trailers and Fifth-Wheel RVs
- 100% market share in existing products would yield $3,900 to $4,300 per
Towable RV
- Growth in RV “features” drives content increases
At industry production levels for the last 12 months ended September 2010, each $100 increase in
content adds $20 million in sales for Drew.

- 100% market share in existing products would yield $3,600 to $4,000 per home
- Affordability of the homes constrains content growth
Content Per New Manufactured Home
MH Segment
operating
profit margin 10.4% 10.7% 10.5% 10.4% 10.3% 8.7% 8.1% 7.2% 3.8% 10.0%
See Page 13 for Industry Information
- 21 -
Consolidated more than 35 production facilities into other
existing facilities since 2006, improving operating efficiencies
Cautiously added back $1 million of annualized fixed costs as
demand improved.
These facility consolidations, along with reductions in salaried
staff, changes in insurance, IT improvements, along with other
cost saving measures have saved us:
What Drew Has Done -
Cost Reductions
- 22 -
The majority of these cost
savings are permanent
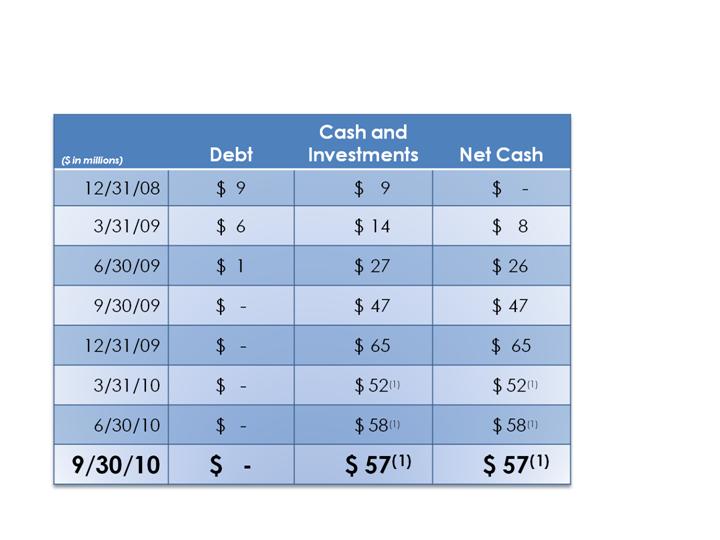
What Drew Has Done -
Strengthened Balance Sheet
- 23 -
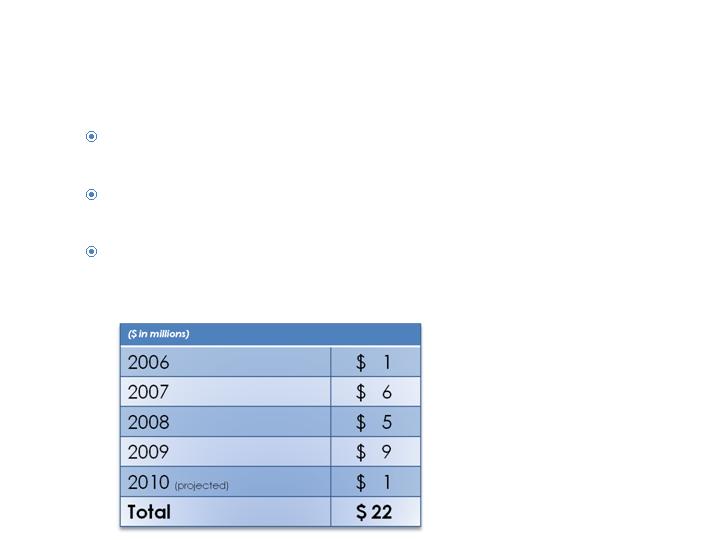
(1)
The Company completed four acquisitions in the first nine months of 2010 which utilized $22
million in cash.

SECTION IV
Operating Results
- 24 -

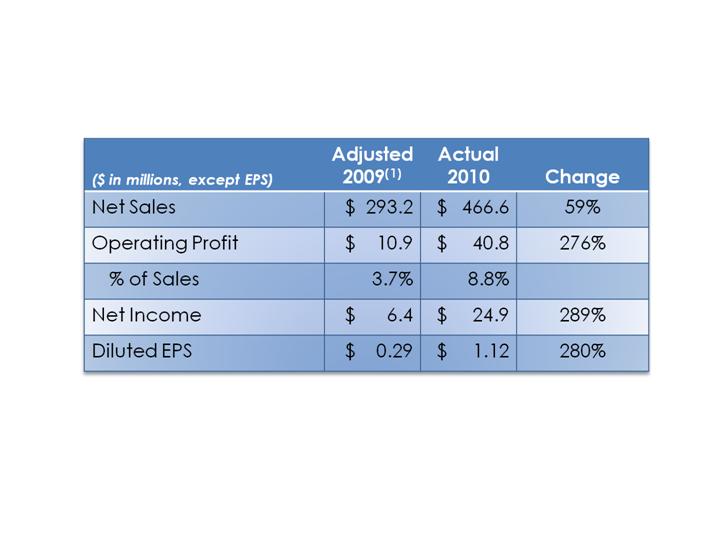
Operating Results
Three Months Ended September 30,
- 25 -
FINANCIAL PERFORMANCE
(1)
Excludes certain “extra expenses” recorded by the Company during the three months
ended September 30, 2009, resulting primarily from plant closings and staff reductions.
These expenses were largely due to the unprecedented conditions in the RV and
manufactured housing industries. Also excludes charges for goodwill impairment during the
first quarter of 2009 (see page 40).

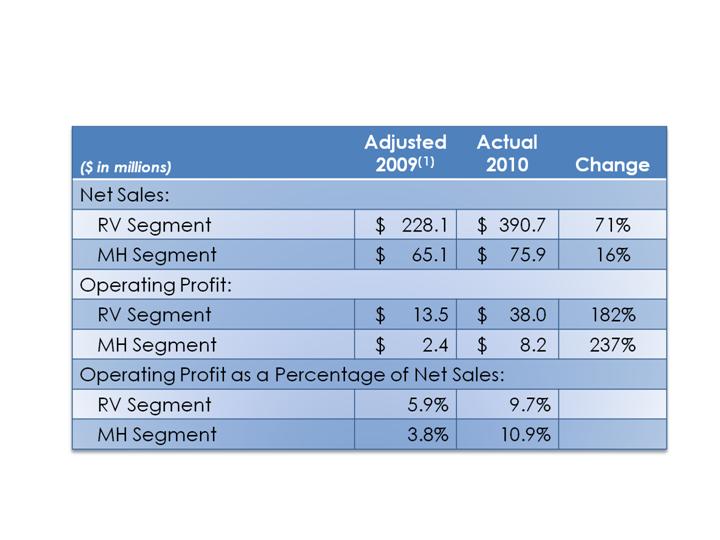
Results By Segment
Three Months Ended September 30,
- 26 -
FINANCIAL
PERFORMANCE
(1)
Excludes certain “extra expenses” recorded by the Company during the three months ended
September 30, 2009, resulting primarily from plant closings and staff reductions. These expenses
were largely due to the unprecedented conditions in the RV and manufactured housing
industries (see page 42).
(2)
Material costs were lower than historical norms In Q3 and Q4 of 2009.
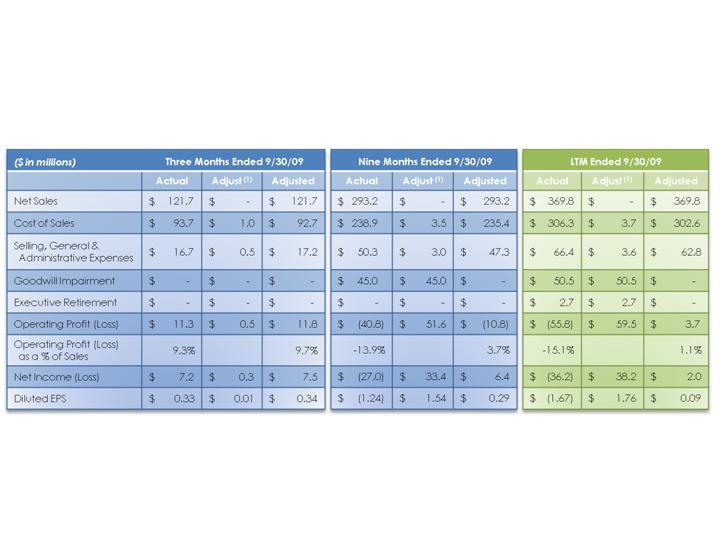
Operating Results
Nine Months Ended September 30,
- 27 -
FINANCIAL PERFORMANCE
(1)
Excludes certain “extra expenses” recorded by the Company during the nine months
ended September 30, 2009, resulting primarily from plant closings, staff reductions,
increased bad debts, and obsolete inventory and tooling. These expenses were largely due
to the unprecedented conditions in the RV and manufactured housing industries. Also
excludes charges for goodwill impairment during the first quarter of 2009 (see page 40).
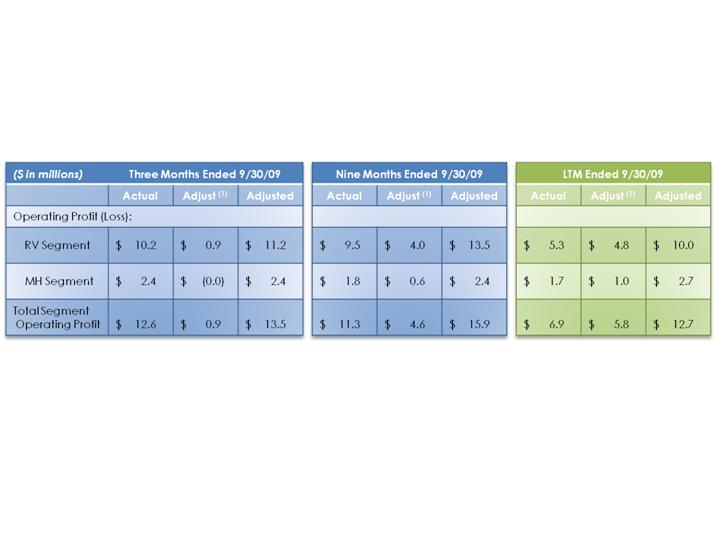
Results By Segment
Nine Months Ended September 30,
- 28 -
FINANCIAL
PERFORMANCE
(1) Excludes certain “extra expenses” recorded by the Company during the nine months ended
September 30, 2009, resulting primarily from plant closings, staff reductions, increased bad debts,
and obsolete inventory and tooling. These expenses were largely due to the unprecedented
conditions in the RV and manufactured housing industries (see page 42).
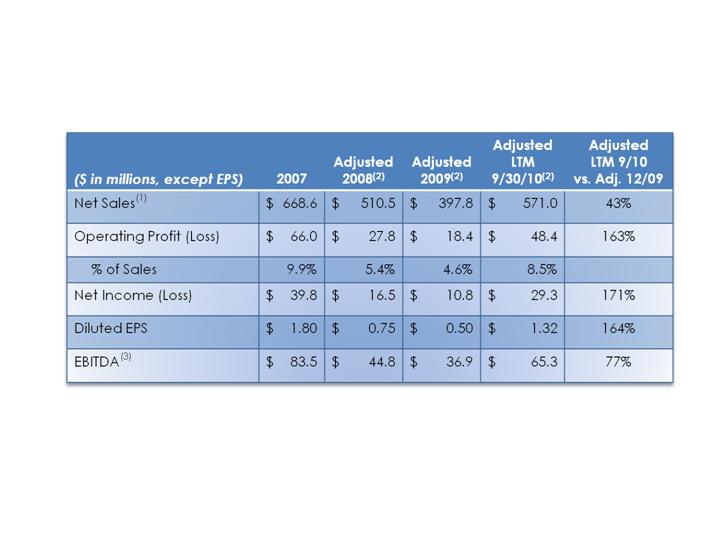
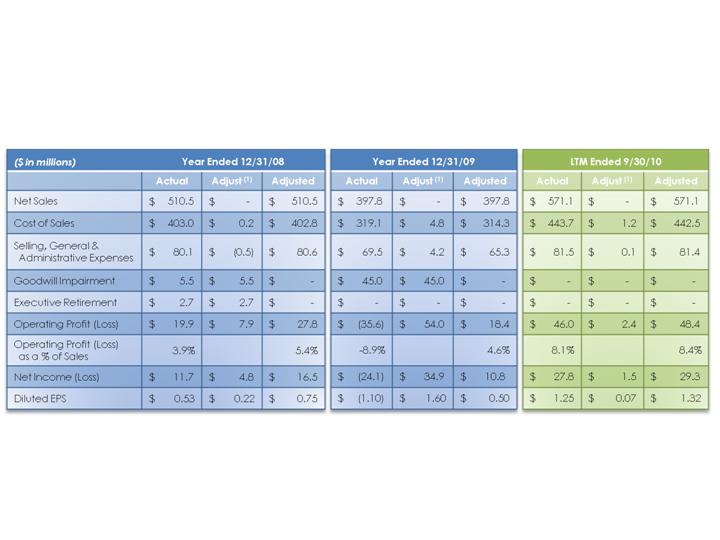
Operating Results
Year Ended December 31, (except as noted)
FINANCIAL PERFORMANCE
(1)
Sales declines in 2008 and 2009 due to reductions in industry-wide shipments of RVs and Manufactured
Homes.
(2)
Excludes certain “extra expenses” recorded by the Company during 2009 and 2008, resulting primarily from
plant closings and start-ups, staff reductions and relocations, increased bad debts and obsolete inventory
and tooling. These expenses were largely due to the unprecedented conditions in the RV and
manufactured housing industries. Also excludes charges for goodwill impairment recorded during the fourth
quarter of 2008 and the first quarter of 2009, and charges for executive retirement in the fourth quarter of
2008 (see pages 39 and 40).
(3)
EBITDA is operating profit plus depreciation, amortization and goodwill impairment (see page 37).
- 29 -

Results By Segment
(1)
Sales declines due to reductions in industry-wide shipments of RVs and Manufactured Homes.
(2)
Excludes certain “extra expenses” recorded by the Company during 2009 and 2008, resulting
primarily from plant closings and start-ups, staff reductions and relocations, increased bad debts
and obsolete inventory and tooling. These expenses were largely due to the unprecedented
conditions in the RV and manufactured housing industries (see pages 41 and 42).
- 30 -
FINANCIAL PERFORMANCE
Year Ended December 31, (except as noted)
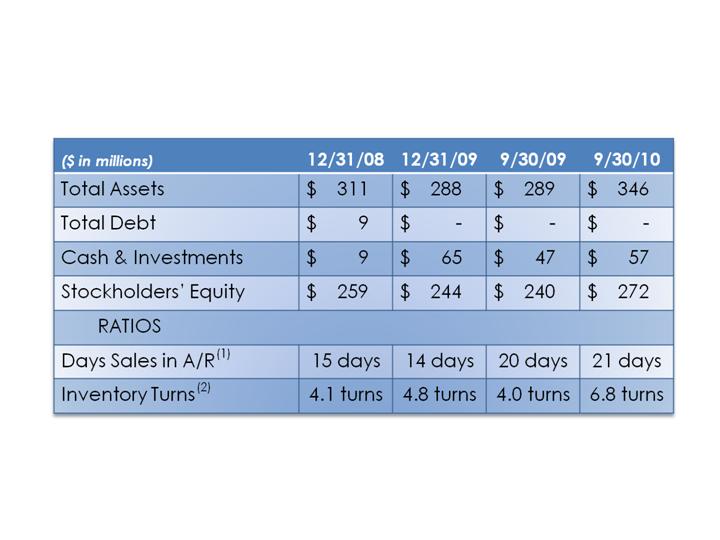
Balance Sheet
- 31 -
FINANCIAL
PERFORMANCE
(1) Days sales in A/R is the most recent month’s net sales divided by accounts receivable,
net, at the end of the period.
(2) Inventory Turns is cost of goods sold for the last twelve months divided by average
inventory for the last twelve months.

Financial Strength
(1)
EBITDA is operating profit plus depreciation, amortization and goodwill impairment (see page 35).
(2)
Excludes a goodwill impairment charge of $5.5 million ($3.4 million after tax).
(3)
Excludes a goodwill impairment charge of $45.0 million ($29.4 million after tax).
- 32 -
FINANCIAL
PERFORMANCE

Increasing RV Content
RV recovery from recession
Demographic tailwind
Exploring related industries
Affordable housing
The Future
-33-
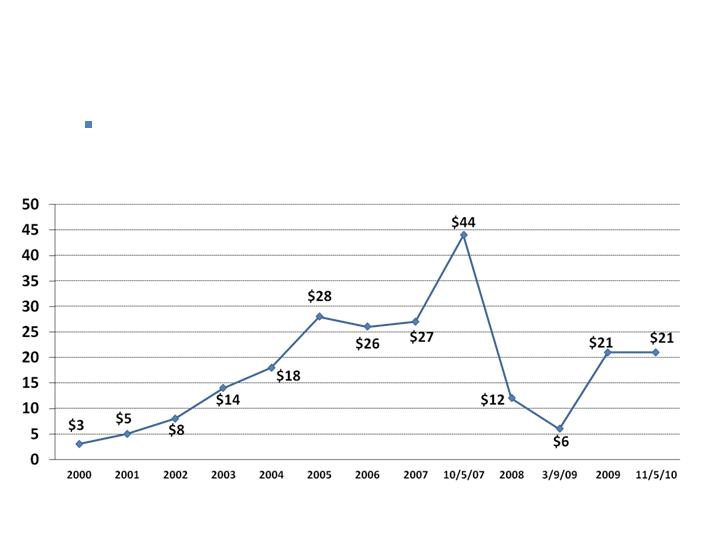
Stock Price History
Drew has 22 million shares outstanding and a
market capitalization of approximately $450
million as of November 5, 2010
(December 31, unless noted)
- 34 -

Analyst Coverage
- 35 -
CJS Securities
Torin Eastburn – (914) 287-7600
Thompson Research Group
Kathryn Thompson – (615) 891-6206
Janney Montgomery Scott LLC
Liam D. Burke – (202) 955-4305
Sidoti & Company, LLC
Scott Stember – (212) 453-7017
Avondale Partners, LLC
Bret Jordan – (617) 314-0487
Thank you!
Joseph S. Giordano III
CFO & Treasurer
914-428-9098
joe@drewindustries.com
OR
VISIT OUR WEBSITE:
www.drewindustries.com
For more information contact:
- 36 -
Fredric M. Zinn
President and CEO
914-428-9098
fred@drewindustries.com

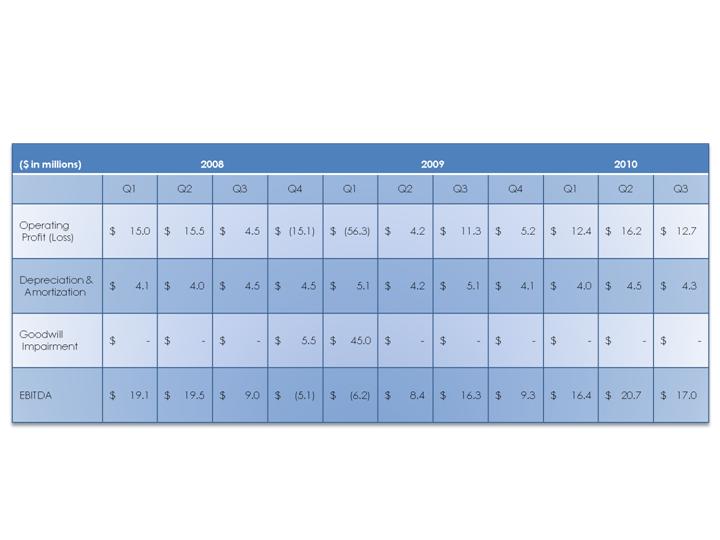
Reconciliation of Operating
Profit to EBITDA
- 37 -
FINANCIAL
PERFORMANCE
Reconciliation of Operating Profit
to EBITDA - Quarterly
- 38 -
FINANCIAL
PERFORMANCE
Reconciliation of Adjusted
Results to Actual
FINANCIAL
PERFORMANCE
(1)
During 2009 and 2008, the Company recorded “extra” expenses resulting primarily from plant closings and
start-ups, staff reductions and relocations, increased bad debts and obsolete inventory and tooling. These
expenses were largely due to the unprecedented conditions in the RV and manufactured housing industries. In
addition, the Company recorded charges for goodwill impairment during the fourth quarter of 2008 and the first
quarter of 2009, and charges for executive retirement in the fourth quarter of 2008.
- 39 -
Reconciliation of Adjusted
Results to Actual
FINANCIAL
PERFORMANCE
(1)
During 2009 and 2008, the Company recorded “extra” expenses resulting primarily from plant closings and
start-ups, staff reductions and relocations, increased bad debts and obsolete inventory and tooling. These
expenses were largely due to the unprecedented conditions in the RV and manufactured housing industries. In
addition, the Company recorded charges for goodwill impairment during the fourth quarter of 2008 and the first
quarter of 2009, and charges for executive retirement in the fourth quarter of 2008.
- 40 -

Reconciliation of Segment Adjusted
Operating Profit to Actual
FINANCIAL PERFORMANCE
(1)
During 2009 and 2008, the Company recorded “extra” expenses resulting primarily from plant closings and
start-ups, staff reductions and relocations, increased bad debts and obsolete inventory and tooling. These
expenses were largely due to the unprecedented conditions in the RV and manufactured housing industries.
- 41 -
See page 43 for a reconciliation of segment actual results to consolidated actual results.
Reconciliation of Segment Adjusted
Operating Profit to Actual
FINANCIAL PERFORMANCE
(1)
During 2009 and 2008, the Company recorded “extra” expenses resulting primarily from plant closings and
start-ups, staff reductions and relocations, increased bad debts and obsolete inventory and tooling. These
expenses were largely due to the unprecedented conditions in the RV and manufactured housing industries.
- 42 -
See page 43 for a reconciliation of segment actual results to consolidated actual results.
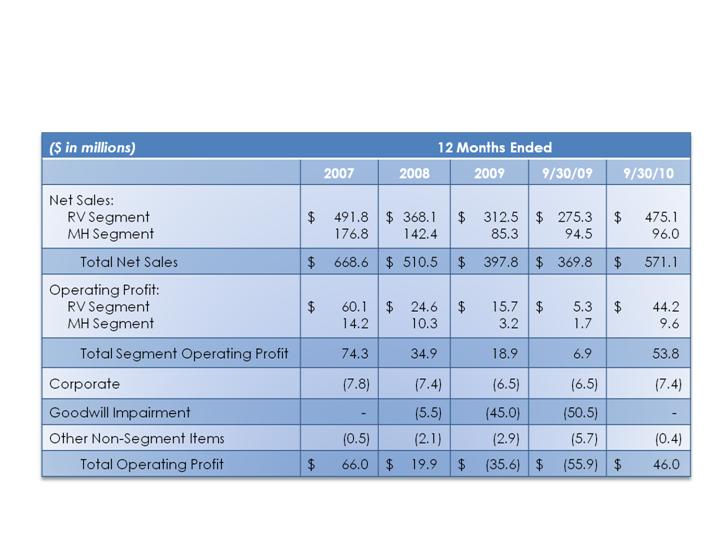
FINANCIAL PERFORMANCE
- 43 -
Reconciliation of Segment Results
to Consolidated