|
| |
|
| |
|
| |
|
| |

|
|
|
|
|
|
|
|
|
|
|
|
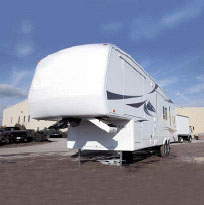
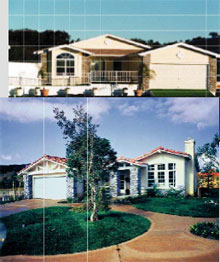
| A Leading National Supplier of a Wide Variety of Components for RV’s and Manufactured Homes |
|
|
|
|
|
|
|
| Drew Industries (NYSE:DW) | Page 1 |

|
| |
Forward Looking Statements |
| |
|
| |
|
| |
|
|
|
|
|
|
¾ | This presentation contains certain “forward-looking statements” within the meaning of the Private Securities Litigation Reform Act of 1995 with respect to financial condition, results of operations, business strategies, operating efficiencies or synergies, competitive position, growth opportunities for existing products, plans and objectives of management, markets for the Company’s common stock and other matters. Statements in this press release that are not historical facts are “forward-looking statements” for the purpose of the safe harbor provided by Section 21E of the Exchange Act and Section 27A of the Securities Act. Forward-looking statements, including, without limitation those relating to our future business prospects, revenues and income, wherever they occur in this press release, are necessarily estimates reflecting the best judgment of our senior management, at the time such statements were made, and involve a number of risks and uncertainties that could cause actual results to differ materially from those suggested by forward-looking statements. The Company does not undertake to update forward-looking statements to reflect circumstances or events that occur after the date the forward-looking statements are made. You should consider forward-looking statements, therefore, in light of various important factors, including those set forth in this presentation. |
|
|
|
|
¾ | There are a number of factors, many of which are beyond the Company’s control, which could cause actual results and events to differ materially from those described in the forward-looking statements. These factors include pricing pressures due to competition, raw material costs (particularly steel, vinyl, aluminum, glass and ABS resin), availability of retail and wholesale financing for manufactured homes, availability and costs of labor, inventory levels of retailers and manufacturers, levels of repossessed manufactured homes, the financial condition of our customers, interest rates, price and availability of gasoline, the outcome of litigation and zoning regulations affecting manufactured homes. In addition, national and regional economic conditions and consumer confidence may affect the retail sale of recreational vehicles and manufactured homes. |
|
|
|
|
|
| Page 2 |
|
| |
About Drew Industries |
| |
|
| |
|
| |
|
|
¾ | A leading national manufacturer of quality components for Recreational Vehicles (RV) and Manufactured Homes (MH) |
|
|
|
|
| Page 3 |
|
| |
Drew’s Companies |
| |
|
| |
|
| |

|
|
|
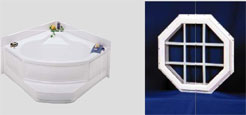
q | Kinro, Inc. – Acquired 1980 | |
| (including Better Bath) | |
| ¾ | Aluminum windows for RVs |
| ¾ | Doors for RVs |
| ¾ | Aluminum and vinyl windows and screens for MHs |
| ¾ | Bath and shower units for MHs and RVs |
|
|
|
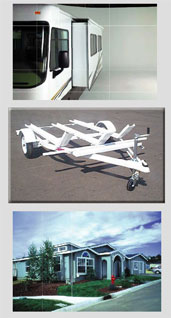
q | Lippert Components, Inc. – Acquired 1997 | |
| (including Zieman Manufacturing) | |
| ¾ | Chassis and chassis parts for RVs and MHs |
| ¾ | Slide out mechanisms for RVs |
| ¾ | Leveling devices for RVs |
| ¾ | Axles for towable RVs |
| ¾ | Steps for RVs |
| ¾ | Specialty trailers for boats, personal watercraft and equipment hauling |
|
|
|
|
| Page 4 |
|
| |
Drew’s Products |
| |
|
| |
|
| |
Sales - $621 million
12 Months Ended September 30, 2005
12 Months Ended September 30, 2005

|
|
|
|
| Page 5 |
|
| |
Drew’s Segments |
| |
|
| |
|
| |
Revenues (LTM 9/05 - $621 million)

Segment Operating Profit
(LTM 9/05 - $56 million)
|
|
|
| LTM 9/05 (last 12 months ended September 30, 2005) revenues and segment operating profit equal those results for the fourth quarter of 2004 and the first nine months of 2005. | Page 6 |
|
| |
Supplier to Industry Leaders |
| |
|
| |
|
| |
|
|
|
|
|
¾ | Outstandingcustomer service andnationalcoverage, with 48 production facilities (approximately 3.1 million sq. ft.), make us a key partner with our customers. | |||
|
|
|
|
|
¾ | Supply most of the Leading Producers of RVs and MHs: | |||
|
|
| ||
|
| Both RV and MH | ||
|
| ¾ | Fleetwood (NYSE:FLE) | |
|
| ¾ | Skyline (NYSE: SKY) | |
|
|
|
| |
|
| RV | ||
|
| ¾ | Coachmen (NYSE: COA) | |
|
| ¾ | Forest River (owned by Berkshire Hathaway) | |
|
| ¾ | Monaco Coach (NYSE: MNC) | |
|
| ¾ | Pilgrim (privately owned) | |
|
| ¾ | Thor (NYSE:THO) | |
|
|
|
| |
|
| MH | ||
|
| ¾ | Champion (NYSE: CHB) | |
|
| ¾ | Clayton (owned by Berkshire Hathaway) | |
|
|
| ¾ | Oakwood Homes (owned by Clayton) |
|
| ¾ | Palm Harbor (Nasdaq: PHHM) | |
|
|
|
|
| Page 7 |
|
|
|
|
| |
Business Strategy |
| |
|
| |
|
| |
|
|
|
¾ | Increase sales and profitability through: | |
| ¾ | Market share growth |
| ¾ | New product introductions |
| ¾ | Strategic acquisitions |
|
|
|
¾ | This strategy accomplished through: | |
| ¾ | Outstanding customer service |
| ¾ | Motivating management through profit incentives and training programs |
| ¾ | Maintaining highly efficient factories by optimizing production through state-of-the-art manufacturing technology and methods |
|
|
|
|
| Page 8 |
|
| |
Drew’s Management Team |
| |
|
| |
|
| |
|
|
|
|
|
|
¾ | Highly respected and experienced management: |
| Innovative & | ||
| ¾ | Drew | |||
|
| ¾ | Leigh Abrams, CEO, |
| |
|
| ¾ | Fred Zinn, CFO, 24+ years | ||
| ¾ | Kinro | |||
|
| ¾ | David Webster, CEO, Chairman, 30+ years | ||
| ¾ | Lippert | |||
|
| ¾ | Doug Lippert, Chairman, | ||
|
| ¾ | Jason Lippert, CEO, | ||
|
|
|
| ||
¾ | Excellent management training and incentive programs | ||||
|
|
|
|
| Page 9 |
|
| |
Content Per Vehicle - RV |
| |
|
| |
|
| |
|
|
|
¾ | Peak potential is | |
|
|
|
|
|
|
|
|
|
| Operating | 11.3% | 6.8% | 8.6% | 9.4% | 11.3% | 9.2%(a) | 8.9%(a) |
|
|
| ||||||
|
| Excludes sales of specialty trailers | ||||||
|
|
|
|
|
| (a) Margin in 2004 and 2005 impacted by increases in steel and other costs. | Page 10 |
|
| |
Content Per Home - MH |
| |
|
| |
|
| |
|
|
|
¾ | Peak potential is | |
|
|
|
|
|
|
|
|
|
| Operating | 15.5% | 9.8% | 10.8% | 11.0% | 10.7% | 10.1%(a) | 9.4%(a) |
|
|
| ||||||
|
| |||||||
|
|
(a) | Margin in 2004 and 2005 impacted by increases in steel costs and an adverse jury award in a work place injury lawsuit that affected both years. |
|
|
|
|
| Page 11 |
|
| |
New Product Introductions |
| |
|
| |
|
| |
|
|
|
Total market for new products is over $600 million | Organic Growth | |
|
|
|
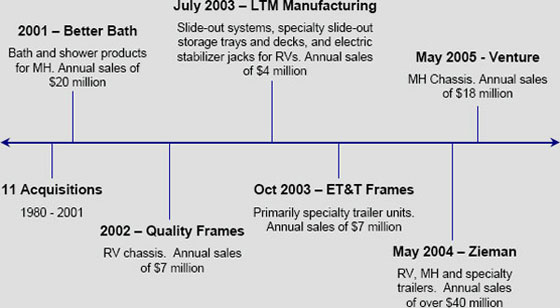
¾ | Sales of slide-out mechanisms for towable RVs introduced in 2002, grew to over $75 million in the 12 months ended September 2005. Recently introduced slide-out for motorhomes. | |
|
| |
¾ | Increased market penetration for 11 new, innovative products developed by LTM Manufacturing, which was acquired in July 2003. | |
|
| |
¾ | Expanded specialty trailer products through the May 2004 acquisition of Zieman. Consists of specialty trailers for boats, personal watercraft and equipment hauling. | |
|
| |

¾ | Zieman on West Coast. Recently expanded into Indiana. Potential to expand nationally. |
|
|
|
|
| Page 12 |
|
| |
New Product Introductions(Continued) |
| |
|
| |
|
| |
Organic Growth
|
|
|
|
| ¾ | Acquired 2 patents through the acquisition of Venture Welding, expanding our MH chassis manufacturing capabilities | |
|
| ¾ | Cold “Cambering” |
|
| ¾ | Basement Chassis |
|
|
|
|
| ¾ | Recently introduced a wide variety of RV products | |
These developments achieved through cooperation with our customers
and our extensive R&D efforts and acquisitions
|
|
|
|
| Page 13 |
|
| |
New Product Introductions |
| |
|
| |
|
| |
|
|
|
|
|
|
|
| Market |
| Current |
|
|
|
|
| ||
Slide-out mechanisms for motorhomes |
| $65 million |
| 25 | % |
|
|
|
|
|
|
Leveling devices for motorhomes |
| $65 million |
| <5 | % |
|
|
|
|
|
|
Axles for towables |
| $80 million |
| 15%-20 | % |
|
|
|
|
|
|
Steps for towables |
| $10 million |
| 30%-40 | % |
|
|
|
|
|
|
Bath products for RVs |
| $30 million |
| <5 | % |
|
|
|
|
|
|
Thermoformed exterior parts |
| $25 million |
| 0 | % |
|
|
|
|
|
|
Specialty trailers |
| $200 million |
| 15 | % |
|
|
|
|
|
|
Axles for specialty trailers |
| $150 million |
| 2 | % |
|
|
|
|
| Page 14 |
|
| |
Acquisition Criteria |
| |
|
| |
|
| |
|
|
| |
|
| Strategic | |
¾ | Complementary to our core RV and MH markets | Acquisitions |
|
|
|
| |
¾ | Target less than 6 times pro forma EBITDA |
| |
|
|
| |
¾ | Immediately accretive |
| |
|
|
| |
¾ | Seek to acquire products or technologies that we can introduce through our nationwide customer base and factory network; become a more extensive supplier to our customers |
| |
|
|
| |
¾ | Drew is adisciplined andpatient acquirer |
|
|
|
|
|
| Page 15 |
|
| |
Acquisition History |
| |
|
| |
|
| |
|
|
|
|
| Strategic |
|
Each of our RV and MH acquisitions has |
|
|
|
|
| Page 16 |
|
| |
Zieman Acquisition – May 2004 |
| |
|
| |
|
| |
|
|
|
|
|
|
|
| Strategic | |
¾ | Purchase price of $20.7 million plus assumption of $5.2 million of debt |
| Acquisitions | |
|
|
|
|
|
¾ | Zieman Operating Results: |
| ||
|
| |||
| ¾ | Immediately accretive | ||
| ¾ | Sales for 2003 of about $40 million | ||
|
| About half Specialty Trailers | ||
|
| About half RV and MH Chassis | ||
|
|
|
|
|
¾ | Expands RV and MH chassis on West Coast |
| ||
|
|
| ||
¾ | Plan to take specialty trailers nationwide | |||
|
|
|
| |
¾ | Sales for 12 months after acquisition have been over $60 million | |||

|
|
|
|
| Page 17 |
|
| |
Venture Acquisition – May 2005 |
| |
|
| |
|
| |
|
|
|
|
|
|
| Strategic | ||
¾ | Purchase price of approximately $18.5 million, or less than 6 times pro forma EBITDA | Acquisitions | ||
|
|
|
|
|
¾ | Venture Operating Results: |
| ||
|
|
|
|
|
| ¾ | Immediately accretive |
| |
| ¾ | Pro forma sales of approximately $18 million |
| |
|
| ¾ | Primarily MH chassis |
|
|
|
|
|
|
¾ | Increases market share in MH chassis |
| ||
|
|
| ||
¾ | Includes two important patents |
| ||
|
|
|
|
|
|
| ¾ | Competitive advantage |
|
|
|
|
|
|
¾ | Consolidating production to increase efficiencies |
| ||
|
|
|
|
| Page 18 |
|
| |
Investments |
| |
|
| |
|
| |
|
|
|
¾ | Kinro and Lippert have extensive R&D departments | |
|
| |
¾ | Since January 1997: | |
|
|
|
| ¾ | Invested over $115 million in plant and equipment |
| ¾ | Invested over $135 million for acquisitions |
| ¾ | Invested $40 million for stock repurchases at an average price of $5.37 per share |
|
|
|
¾ | These investments have been accretive to earnings | |
|
Innovative & |
Experienced |
Management |
|
|
|
|
|
| Page 19 |
|
| |
RVs - Industry Shipments |
| |
|
| |
|
| |
Travel Trailers and 5th Wheel RVs
(Thousands of Vehicles)
|
|
|
| (1) | Includes approximately 13,000 RVs purchased by FEMA for emergency housing for 2004 hurricane victims. |
| (2) | Includes an estimated 25,000 RVs purchased by FEMA for emergency housing for 2005 hurricane victims. |
|
|
|
|
| Page 20 |
|
| |
RV Market |
| |
|
| |
|
| |
|
|
|
|
¾ | RV Categories | Strong Growth | |
¾ | Towable RVs - 83% of industry unit sales and about 40% of industry dollar sales | Prospects | |
| ¾ | Motorhomes - 17% of industry unit sales and about 60% of industry retail dollar sales |
|
|
|
| |
| ¾ | Since 1995, the travel trailer and 5th wheel towable segment of the RV market has grown at anannual rate of nearly 9%, more than twice as fast as motorhomes | |
|
|
|
|
¾ | We currently supply primarily to towable RVs – our goal is to increase sales of motorhome products |
| |

|
|
|
|
| Page 21 |
|
| |
Growth In RV Market |
| |
|
| |
|
| |
|
|
|
|
¾ | Positive Demographic Trends | Strong Growth | |
¾ | Primary owners of RVs are 50 and over | Prospects | |
| ¾ | According to census reports, there are expected to be 20 million more people over 50 in the next 10 years |
|
¾ | Industry Advertising Campaign | ||
| ¾ | Target Market 35 and over | |
¾ | RV Vacations Strengthen Family Ties | ||
¾ | Post 9/11 Air Travel Fears |
| |
¾ | Low Interest Rates - interest often taxdeductible |
| |
|
|
|
|
| Page 22 |
|
| |
MH - Industry Production |
| |
|
| |
|
| |
(Thousands of Homes)
|
|
|
| (1) | Includes approximately 3,500 MHs purchased by FEMA for emergency shelter for 2004 hurricane victims. |
| (2) | Includes an estimated 25,000 MHs purchased by FEMA for emergency shelter for 2005 hurricane victims. |
|
|
|
|
| Page 23 |
|
| |
Manufactured Housing (MH) Market |
| |
|
| |
|
| |
|
|
¾ | 10 million manufactured homes across the U.S. |
|
|
¾ | Improved quality and image should drive MH growth |
|
|
¾ | Industry production down 65% since 1998, but Drew’s sales are down much less |
|
|
¾ | Drew’s MH segment remained profitableevery quarter since the downturn began in 1998 |
Strong Growth
Prospects
|
|
|
|
| Page 24 |
|
| |
MH: Strong Future |
| |
|
| |
|
| |
|
|
| |
¾ | Demographics - 1st time home buyers and retirees | ||
|
|
| |
¾ | Affordability: Significant cost advantage over site-built homes | ||
|
|
| |
| ¾ | MH - $36 per sq. ft. compared to $86 per sq. ft. for site-built homes | |
|
|
| |
¾ | Improved quality in conjunction with land ownership leads to home value appreciation | ||
|
|
| |
¾ | At or near bottom of downturn and headed up. | ||
Strong Growth
Prospects
|
|
|
|
| Page 25 |
|
| |
MH: Return to Growth in 2005 |
| |
|
| |
|
| |
|
|
|
|
| |
| ¾ | Signs of Improvement in the Manufactured Housing Industry | Strong Growth | ||
|
|
|
| ||
|
| ¾ | Low inventory levels at retail dealers |
| |
|
|
|
|
| |
|
| ¾ | Slowing of repossessions |
| |
|
|
|
|
| |
|
| ¾ | Improved lending practices have made new loans more secure |
| |
|
|
|
| ||
|
| ¾ | Berkshire Hathaway acquired Clayton, Oakwood and 21st Mortgage; raised more than $4 billion for MH financing |
| |
|
|
|
|
| Page 26 |
|
| |
Drew’s Ownership and Governance |
| |
|
| |
|
| |
|
|
|
|
|
|
| Innovative & |
|
|
|
|
| ¾ | Drew’s Corporate Governance Program – ranked in the 99th percentile of all Russell 3000 Companies by Institutional Shareholder Services. |
|
|
|
|
|
| ¾ | Added to S&P SmallCap 600 Index |
|
|
|
|
|
| Page 27 |
|
| |
Financial Performance |
| |
|
| |
|
| |
|
|
|
|
| Stock Price History |
| |
|
|
|
|
| ¾ | The price of Drew’s common stock is 8 times the price as of December 31, 2000 |
|
|
|
|
|
| ¾ | Drew has 21 million shares outstanding and a market capitalization of nearly $600 million |
|
|
|
|
| Drew effected a 2-for-1 stock split on 9/7/05 to holders of record on 8/19/05 | Page 28 |
|
| |
Operating Results |
| |
|
| |
|
| |
|
|
Three Months Ended September 30, | Financial |
($ in millions, except EPS) | Performance |
|
|
|
|
|
|
|
|
|
|
| ||
|
| 2004 |
| 2005(a) |
|
|
|
| ||||
|
|
|
|
|
|
|
|
|
|
| ||
Sales |
| $ | 148.8 |
| $ | 170.8 |
|
| +15 | % | ||
|
|
|
|
|
|
|
|
|
|
| ||
Operating Profit |
| $ | 13.0 |
| $ | 16.5 |
|
| +27 | % | ||
|
|
|
|
|
|
|
|
|
|
| ||
% Sales |
|
| 8.8 | % |
| 9.7 | % |
|
|
| ||
|
|
|
|
|
|
|
|
|
|
| ||
Net Income |
| $ | 7.5 |
| $ | 9.8 |
|
| +30 | % | ||
|
|
|
|
|
|
|
|
|
|
| ||
Diluted EPS(b) |
| $ | 0.35 |
| $ | 0.45 |
|
| +29 | % | ||
|
|
|
|
|
|
|
|
|
|
| ||
|
|
(a) | 2005 quarterly results were impacted by reversal of charges related to litigation that increased operating profit by $1.0 million and increased net income by $0.7 million, or $.03 per diluted share. |
(b) | Adjusted for 2 for 1 stock split on 9/7/05. |
|
|
|
|
| Page 29 |
|
| |
Operating Results |
| |
|
| |
|
| |
|
|
Nine Months Ended September 30, | Financial |
($ in millions, except EPS) | Performance |
|
|
|
|
|
|
|
|
|
|
| ||
|
| 2004 |
| 2005(a) |
|
|
|
| ||||
|
|
|
|
|
|
|
|
| ||||
Sales |
| $ | 398.5 |
| $ | 488.4 |
|
| +23 | % | ||
|
|
|
|
|
|
|
|
|
|
| ||
Operating Profit |
| $ | 37.6 |
| $ | 42.1 |
|
| +12 | % | ||
|
|
|
|
|
|
|
|
|
|
| ||
% Sales |
|
| 9.4 | % |
| 8.6 | % |
|
|
| ||
|
|
|
|
|
|
|
|
|
|
| ||
Net Income |
| $ | 21.7 |
| $ | 24.3 |
|
| +12 | % | ||
|
|
|
|
|
|
|
|
|
|
| ||
Diluted EPS(b) |
| $ | 1.02 |
| $ | 1.13 |
|
| +11 | % | ||
|
|
|
|
|
|
|
|
|
|
| ||
|
|
(a) | 2005 year to date results were impacted by charges related to litigation that reduced operating profit by $1.3 million and reduced net income by $0.6 million, or $.03 per diluted share. |
(b) | Adjusted for 2 for 1 stock split on 9/7/05. |
|
|
|
|
| Page 30 |
|
| |
Results By Segment |
| |
|
| |
|
| |
|
|
Nine Months Ended September 30, | Financial |
($ in millions) | Performance |
|
|
|
|
|
|
|
|
|
|
|
|
| 2004 |
| 2005 |
|
|
| |||
|
|
|
|
|
|
|
| |||
Net sales |
|
|
|
|
|
|
|
|
|
|
RV Segment |
| $ | 262.9 |
| $ | 329.9 |
|
| +25 | % |
MH Segment |
| $ | 135.7 |
| $ | 158.5 |
|
| +17 | % |
|
|
|
|
|
|
|
|
|
|
|
Operating Profit |
|
|
|
|
|
|
|
|
|
|
RV Segment |
| $ | 26.6 |
| $ | 31.6 | (a) |
| +19 | % |
MH Segment |
| $ | 15.5 |
| $ | 16.2 | (b) |
| +5 | % |
|
|
|
|
|
|
|
|
|
|
|
Operating Profit as a |
|
|
|
|
|
|
|
|
|
|
Percentage of Net Sales |
|
|
|
|
|
|
|
|
|
|
RV Segment |
|
| 10.1 | % |
| 9.6 | %(a) |
|
|
|
MH Segment |
|
| 11.4 | % |
| 10.3 | %(b) |
|
|
|
|
|
|
|
|
|
|
|
|
|
|
|
|
|
| |
| (a) | After $0.4 million charge related to litigation, net of reduction in incentive compensation. | Page 31 | |
(b) | After $1.3 million charge related to litigation, net of reduction in incentive compensation. | |||
See Press Release dated November 3, 2005 for a reconciliation to consolidated results. | ||||
|
| |
Results By Segment |
| |
|
| |
|
| |
|
|
Years Ended December 31, | Financial |
($ in millions) | Performance |
|
|
|
|
|
|
|
|
|
|
|
|
| 2003 |
| 2004 |
|
|
|
| ||
|
|
|
|
|
|
|
|
| ||
Net sales |
|
|
|
|
|
|
|
|
|
|
RV Segment |
| $ | 219.5 |
| $ | 347.6 |
|
| +58 | % |
MH Segment |
| $ | 133.6 |
| $ | 183.3 |
|
| +37 | % |
|
|
|
|
|
|
|
|
|
|
|
Operating Profit |
|
|
|
|
|
|
|
|
|
|
RV Segment |
| $ | 24.8 |
| $ | 31.8 |
|
| +28 | % |
MH Segment |
| $ | 14.4 |
| $ | 18.5 | (a) |
| +29 | % |
|
|
|
|
|
|
|
|
|
|
|
Operating Profit as a |
|
|
|
|
|
|
|
|
|
|
Percentage of Net Sales |
|
|
|
|
|
|
|
|
|
|
RV Segment |
|
| 11.3 | % |
| 9.2 | % |
|
|
|
MH Segment |
|
| 10.7 | % |
| 10.1 | %(a) |
|
|
|
|
|
|
|
|
|
|
|
|
|
|
See Press Release dated February 15, 2005 for a reconciliation to consolidated results.
|
|
|
| (a) | After $1.5 million charge related to litigation, net of reduction in incentive compensation. |
|
|
|
|
| Page 32 |
|
| |
Operating Results |
| |
|
| |
|
| |
|
|
Full Year Operating Results | Financial |
($ in millions, except EPS) | Performance |
|
|
|
|
|
|
|
|
|
|
|
|
| 2003 |
| 2004(1) |
| LTM 9/05 |
| |||
Sales |
| $ | 353.1 |
| $ | 530.9 |
| $ | 620.7 |
|
Operating Profit |
| $ | 34.3 |
| $ | 44.0 |
| $ | 48.4 |
|
% Sales |
|
| 9.7 | % |
| 8.3 | % |
| 7.8 | % |
Net Income(1) (4) |
| $ | 19.4 |
| $ | 25.1 |
| $ | 27.7 |
|
Diluted EPS(1)(2) (4) |
| $ | .94 |
| $ | 1.18 |
| $ | 1.29 |
|
|
|
|
|
|
|
|
|
|
|
|
EBITDA(3) |
| $ | 42.1 |
| $ | 53.3 |
| $ | 59.3 |
|
|
|
|
|
|
|
|
|
|
|
|
|
|
|
| (1) | Results in 2004 were impacted by i) a charge related to litigation that reduced net income by $.9 million, or $.04 per diluted share, and ii) severe increases in steel prices. |
| (2) | Adjusted for 2 for 1 stock split on 9/7/05. |
| (3) | EBITDA is operating profit plus depreciation and amortization. |
| (4) | Results in the LTM 9/05 were impacted by charges related to litigation that reduced net income by $1.7 million or $.08 per diluted share. |
|
|
|
|
| Page 33 |
|
| |
Operating Results |
| |
|
| |
|
| |
|
|
Reconciliation to EBITDA | Financial |
($ in millions) | Performance |
|
|
|
|
|
|
|
|
|
|
|
|
| 2003 |
| 2004 |
| LTM 9/05 | (1) | |||
Operating Profit |
| $ | 34.3 |
| $ | 44.0 |
| $ | 48.4 |
|
|
|
|
|
|
|
|
|
|
|
|
Depreciation and Amortization |
| $ | 7.8 |
| $ | 9.3 |
| $ | 10.9 |
|
|
|
|
|
|
|
|
|
|
|
|
EBITDA |
| $ | 42.1 |
| $ | 53.3 |
| $ | 59.3 |
|
|
|
|
|
|
|
|
|
|
|
|
|
|
|
| (1) | See press release dated November 3, 2005 for a reconciliation to consolidated results |
|
|
|
|
| Page 34 |
|
| |
Balance Sheet |
| |
|
| |
|
| |
|
|
| Financial |
($ in millions, except percents) | Performance |
|
|
|
|
|
|
|
|
|
|
|
|
|
|
|
|
|
|
|
|
|
|
|
|
| |||||||||
|
| 12/31/03 |
| 12/31/04 |
| 9/30/05 |
| |||||||||
|
|
|
|
|
|
|
| |||||||||
|
|
|
|
|
|
|
| |||||||||
Total assets |
|
| $ | 160 |
|
|
| $ | 238 |
|
|
| $ | 293 |
|
|
|
|
|
|
|
|
|
|
|
|
|
|
|
|
|
|
|
Total debt |
|
| $ | 42 |
|
|
| $ | 71 |
|
|
| $ | 62 |
|
|
|
|
|
|
|
|
|
|
|
|
|
|
|
|
|
|
|
Stockholders’ equity |
|
| $ | 94 |
|
|
| $ | 122 |
|
|
| $ | 153 |
|
|
|
|
|
|
|
|
|
|
|
|
|
|
|
|
|
|
|
RATIOS |
|
|
|
|
|
|
|
|
|
|
|
|
|
|
|
|
|
|
|
|
|
|
|
|
|
|
|
|
|
|
|
|
|
Days sales in |
| 19 days |
| 21 days |
| 22 days |
| |||||||||
|
|
|
|
|
|
|
|
|
|
|
|
|
|
|
|
|
Inventory turns(2) |
| 7.3 turns |
| 5.6 turns |
| 6.8 turns |
| |||||||||
|
|
|
|
|
|
|
|
|
|
|
|
|
|
|
|
|
|
|
|
|
|
|
|
|
|
|
|
|
|
|
|
|
|
|
|
(1) | Days sales in accounts receivable is the most recent month’s sales divided by accounts receivable, net, at the end of the period. |
(2) | Inventory turns is cost of goods sold for the latest quarter divided by average inventory for the quarter. |
|
|
|
|
| Page 35 |
|
| |
Financial Strength |
| |
|
| |
|
| |
|
Financial |
|
|
|
|
|
|
|
|
|
|
|
|
|
|
|
|
|
|
|
|
|
|
|
|
|
|
|
|
|
|
|
|
|
|
|
|
|
|
|
|
|
|
|
|
|
|
|
|
|
|
|
|
|
|
|
|
|
|
|
|
|
|
|
|
|
|
|
| 12/30/02 |
| 12/31/03 |
| 12/31/04 |
| LTM 9/05 |
| ||||||||||||
|
|
|
|
|
|
|
|
|
| ||||||||||||
|
|
|
|
|
|
|
|
|
|
|
|
|
|
|
|
|
|
|
|
|
|
Return on Equity(1) |
|
|
| 24 | % |
|
|
| 24 | % |
|
|
| 23 | % |
|
|
| 21 | % |
|
|
|
|
|
|
|
|
|
|
|
|
|
|
|
|
|
|
|
|
|
|
|
Return on Assets(1) |
|
|
| 11 | % |
|
|
| 13 | % |
|
|
| 12 | % |
|
|
| 10 | % |
|
|
|
|
|
|
|
|
|
|
|
|
|
|
|
|
|
|
|
|
|
|
|
Total Debt to Equity |
|
|
| 0.7 |
|
|
|
| 0.4 |
|
|
|
| 0.6 |
|
|
|
| 0.4 |
|
|
|
|
|
|
|
|
|
|
|
|
|
|
|
|
|
|
|
|
|
|
|
|
Total Debt to EBITDA(2) |
|
|
| 1.3 |
|
|
|
| 0.8 |
|
|
|
| 1.3 |
|
|
|
| 1.0 |
|
|
|
|
|
|
|
|
|
|
|
|
|
|
|
|
|
|
|
|
|
|
|
|
|
|
|
|
|
|
|
|
|
|
|
|
|
|
|
|
|
|
|
|
|
|
|
|
(1) | Based on income from continuing operations. |
(2) | EBITDA is operating profit plus depreciation and amortization. |
|
|
|
|
| Page 36 |
|
| |
Peer Comparison |
| |
|
| |
|
| |
|
Financial |
|
|
|
|
|
|
|
|
|
|
|
|
|
|
|
|
|
|
|
|
|
|
|
|
|
| Trailing |
| Forward |
| ROA |
| ROE |
| ||
|
|
|
|
|
|
|
|
|
|
|
|
|
|
|
|
|
|
|
|
|
|
|
|
Drew (DW) |
| 23.8 |
| 15.7 |
| 11 | % |
| 20 | % |
|
|
|
|
|
|
|
|
|
|
|
|
|
|
|
|
|
|
|
|
|
|
|
|
|
Fleetwood (FLE) |
| N/A |
| 12.2 |
| -3 | % |
| -53 | % |
|
|
|
|
|
|
|
|
|
|
|
|
|
Monaco (MNC) |
| 19.0 |
| 14.4 |
| 5 | % |
| 6 | % |
|
|
|
|
|
|
|
|
|
|
|
|
|
Spartan (SPAR) |
| 18.7 |
| 10.1 |
| 6 | % |
| 10 | % |
|
|
|
|
|
|
|
|
|
|
|
|
|
Thor (THO) |
| 15.4 |
| 11.7 |
| 14 | % |
| 22 | % |
|
|
|
|
|
|
|
|
|
|
|
|
|
Winnebago (WGO) |
| 15.2 |
| 10.8 |
| 15 | % |
| 30 | % |
|
|
|
|
|
|
|
|
|
|
|
|
|
|
Source: Capital IQ, November 2, 2005, except forward P/E, which is provided by |
Thomson Financial. |
|
|
|
|
| Page 37 |
|
| |
Summary |
| |
|
| |
|
| |
|
|
|
|
¾ | Why is Drew a Good Investment |
| |
|
|
|
|
| ¾ | Highly experienced and motivated management |
|
|
|
|
|
| ¾ | Outstanding customer service |
|
|
|
|
|
| ¾ | Low-cost producer |
|
|
|
|
|
| ¾ | Continued product line expansion |
|
|
|
|
|
| ¾ | History of successful strategic acquisitions |
|
|
|
|
|
| ¾ | History of strong operating profit and cash flow |
|
|
|
|
|
| ¾ | Strong Balance Sheet |
|
|
|
|
|
| ¾ | Highly experienced and motivated management |
|
|
|
|
|
| Page 38 |
|
| |
Thank You |
| |
|
| |
|
| |
|
|
|
|
|
|
¾ | Analyst coverage |
|
| ||
| ¾ | BB&T Capital Markets -John Diffendal: (615) 340-8284 |
| ||
| ¾ | Morgan Joseph - Richard Paget: (212) 218-3894 |
| ||
| ¾ | Sidoti & Company LLC – Scott Stember: (212) 453-7017 |
| ||
|
|
|
| ||
¾ | For more information contact: |
| |||
|
|
| Leigh J. Abrams, President and CEO |
|
|
|
|
| leigh@drewindustries.com |
|
|
|
|
|
|
|
|
|
|
| Fredric M. Zinn, Executive VP and CFO |
|
|
|
|
| fred@drewindustries.com |
|
|
|
|
|
|
|
|
¾ | Or visit:www@drewindustries.com |
|
| ||
|
|
|
|
| Page 39 |