UNITED STATES
SECURITIES AND EXCHANGE COMMISSION
Washington, D.C. 20549
FORM N-CSR
CERTIFIED SHAREHOLDER REPORT OF REGISTERED
MANAGEMENT INVESTMENT COMPANIES
Investment Company Act file number: 811-04236
JPMorgan Trust II
(Exact name of registrant as specified in charter)
277 Park Avenue
New York, NY 10172
(Address of principal executive offices) (Zip code)
Gregory S. Samuels
277 Park Avenue
New York, NY 10172
(Name and Address of Agent for Service)
Registrant’s telephone number, including area code: (800) 480-4111
Date of fiscal year end: June 30
Date of reporting period: July 1, 2022 through June 30, 2023
Form N-CSR is to be used by management investment companies to file reports with the Commission not later than 10 days after the transmission to stockholders of any report that is required to be transmitted to stockholders under Rule 30e-1 under the Investment Company Act of 1940 (17 CFR 270.30e-1). The Commission may use the information provided on Form N-CSR in its regulatory, disclosure review, inspection, and policymaking roles.
A registrant is required to disclose the information specified by Form N-CSR, and the Commission will make this information public. A registrant is not required to respond to the collection of information contained in Form N-CSR unless the Form displays a currently valid Office of Management and Budget (“OMB”) control number. Please direct comments concerning the accuracy of the information collection burden estimate and any suggestions for reducing the burden to Secretary, Securities and Exchange Commission, 450 Fifth Street, NW, Washington, DC 20549-0609. The OMB has reviewed this collection of information under the clearance requirements of 44 U.S.C. Section 3507.
ITEM 1. REPORTS TO STOCKHOLDERS.
a.) The following is a copy of the report transmitted to shareholders pursuant to Rule 30e-1 under the Investment Company Act of 1940 (17 CFR 270.30e-1).
b.) A copy of the notice transmitted to shareholders in reliance on Rule 30e-3 under the 1940 Act that contains disclosures specified by paragraph (c)(3) of that rule is included in the Annual Reports. Not Applicable. Notices do not incorporate disclosures from the
shareholder report.
Annual Report
J.P. Morgan Small Cap Funds
June 30, 2023
JPMorgan Small Cap Blend Fund |
JPMorgan Small Cap Equity Fund |
JPMorgan Small Cap Growth Fund |
JPMorgan Small Cap Sustainable Leaders Fund |
JPMorgan Small Cap Value Fund |
JPMorgan SMID Cap Equity Fund |
JPMorgan U.S. Small Company Fund |
CONTENTS
Investments in a Fund are not deposits or obligations of, or guaranteed or endorsed by, any bank and are not insured or guaranteed by the FDIC, the Federal Reserve Board or any other government agency. You could lose money if you sell when a Fund’s share price is lower than when you invested.
Past performance is no guarantee of future performance. The general market views expressed in this report are opinions based on market and other conditions through the end of the reporting period and are subject to change without notice. These views are not intended to predict the future performance of a Fund or the securities markets.
Prospective investors should refer to the Funds’ prospectuses for a discussion of the Funds’ investment objectives, strategies and risks. Call J.P. Morgan Funds Service Center at 1-800-480-4111 for a prospectus containing more complete information about a Fund, including management fees and other expenses. Please read it carefully before investing.
Letter to Shareholders
August 11, 2023 (Unaudited)
Dear Shareholder,
Equity markets largely delivered solid returns for the twelve months ended June 30, 2023 on the back of buoyant corporate earnings, continued economic growth and receding inflationary pressures. Even as the U.S. Federal Reserve raised interest rates in an effort to cool the economy, the unemployment rate remained below 4% and consumer and business spending was generally higher than many economists expected.
|
“Equity markets delivered strong returns during the first half of 2023, with investors who remained fully invested likely benefitting. Going forward, we believe investors may be best served by maintaining a long-term view and holding a well-diversified portfolio.” — Brian S. Shlissel
|
Among financial markets, the performance of leading equity indexes was mixed through the second half of 2022. However, the S&P 500 Index generated positive performance every month except February in the first half of 2023. Large cap growth stocks generally outperformed other sectors of the market for the twelve-months ended June 30, 2023, partly due to investor demand for shares of large information technology companies. Leading mid cap and small cap equity indexes – both growth and value - posted positive performance for the period. Notably, the collapse of three U.S. regional banks in March 2023 put pressure on equities in the broader financial sector but the responses by multiple U.S. regulatory agencies as well as leading central banks appear to have limited further volatility in the banking industry.
With the exception of its June 2023 meeting, the U.S. Federal Reserve (the “Fed”) raised benchmark interest rates at 10 consecutive meetings since commencing its tightening monetary policy in mid-March 2022, and subsequently raised rates again in July 2023. Meanwhile, U.S. inflation, as measured by the Consumer Price Index, fell from 40-year highs in mid-2022 to 3.0% in June 2023. U.S. gross domestic product (GDP) remained positive throughout the 12-month period and even rebounded to an annualized rate of 2.4% in the second quarter of 2023 from 2.0% in the first quarter. While the overall
trend in consumer spending was downward, consumption was better than economists generally expected and business fixed investment in equipment, facilities and software in the second quarter of 2023 increased at the fastest pace since the start of 2022.
Though inflation remained above the Fed’s stated target of 2% annual growth during the twelve-month period, the declining trend in price growth may allow the Fed to end its policy tightening sooner than expected. Moreover, the resiliency of the U.S. economy in the face of the highest interest rates since 2001 could allow the economy to cool without GDP tipping into negative territory or leading to wide-spread job losses.
Certainly, there are factors that remain the focus of investor concerns. The war in Ukraine has continued, without demonstrative progress toward an eventual peace settlement or even a ceasefire. Elsewhere, China’s economy is experiencing weak growth and record high unemployment, and falling prices have raised economists’ worries about the potential for a deflationary spiral in the world’s second largest economy. In the U.S., the run-up to the 2024 presidential election has the potential to increase global political and economic uncertainty.
Equity markets delivered strong returns during the first half of 2023, with investors who remained fully invested likely benefitting. Going forward, we believe investors may be best served by maintaining a long-term view and holding a well-diversified portfolio. Our suite of investment solutions seeks to provide investors with ability to build durable portfolios that can meet their financial goals.
Sincerely,
Brian S. Shlissel
President, J.P. Morgan Funds
J.P. Morgan Asset Management
1-800-480-4111 or www.jpmorganfunds.com for more information
| J.P. Morgan Small Cap Funds | |
J.P. Morgan Small Cap Funds
MARKET OVERVIEW
TWELVE MONTHS ENDED June 30, 2023 (Unaudited)
Equity markets largely generated positive returns for the twelve-month period as consumer spending, manufacturing and corporate earnings remained resilient in the face of rising interest rates and slowing economic growth. While leading equity indexes were mixed on a month-to-month basis, the overall trend was toward a rebound from the sell-off that marked the first half of 2022.
Following a sharp sell-off in August and September 2022 that coincided with U.S. Federal Reserve policy guidance on further interest rate increases, equity prices largely stabilized. Corporate earnings for both the second and third quarters of 2022 were generally better than expected given a cooling economy and slowing consumer spending. By the start of 2023, economic data showed some inflationary pressures had eased.
Across Europe, the energy crisis that followed Russia’s invasion of Ukraine in late February 2022 eased somewhat in the second half of 2022 as both the U.K. and the EU obtained alternatives to Russian energy imports and global energy prices began to recede. A political crisis in the U.K. roiled financial markets in London but the ascension of Rishi Sunak to prime minister appeared to remove some investor uncertainty by the end of 2022.
Meanwhile, leading central banks largely continued to raise interest rates during the twelve-month period. Notably, the European Central Bank initiated its monetary tightening policy in September 2022, with its first rate increase in eleven years and the largest increase in the bank’s history. The U.S. Federal Reserve declined to raise interest rates at its June 2023 meeting, though it stated it would raise rates further in 2023 as needed.
While financial market volatility receded from 2022 levels, it remained elevated in the face of investor uncertainty about interest rates. In March 2023, the financial sector was roiled by the failures of Silicon Valley Bank and First Republic Bank in the U.S., and Credit Suisse Group AG in Switzerland. In each instance, government regulators moved to prevent further contagion within the financials sector.
Within U.S. equity markets, large cap and mid cap stock generally outperformed small cap stocks and growth stocks outperformed value stocks.
| J.P. Morgan Small Cap Funds | |
JPMorgan Small Cap Blend Fund
FUND COMMENTARY
TWELVE MONTHS ENDED June 30, 2023 (Unaudited)
| |
Fund (Class A Shares, without a sales charge) * | |
| |
Net Assets as of 6/30/2023 (In Thousands) | |
INVESTMENT OBJECTIVE**
The JPMorgan Small Cap Blend Fund (the “Fund”) seeks capital growth over the long term.
WHAT WERE THE MAIN DRIVERS OF THE FUND’S PERFORMANCE?
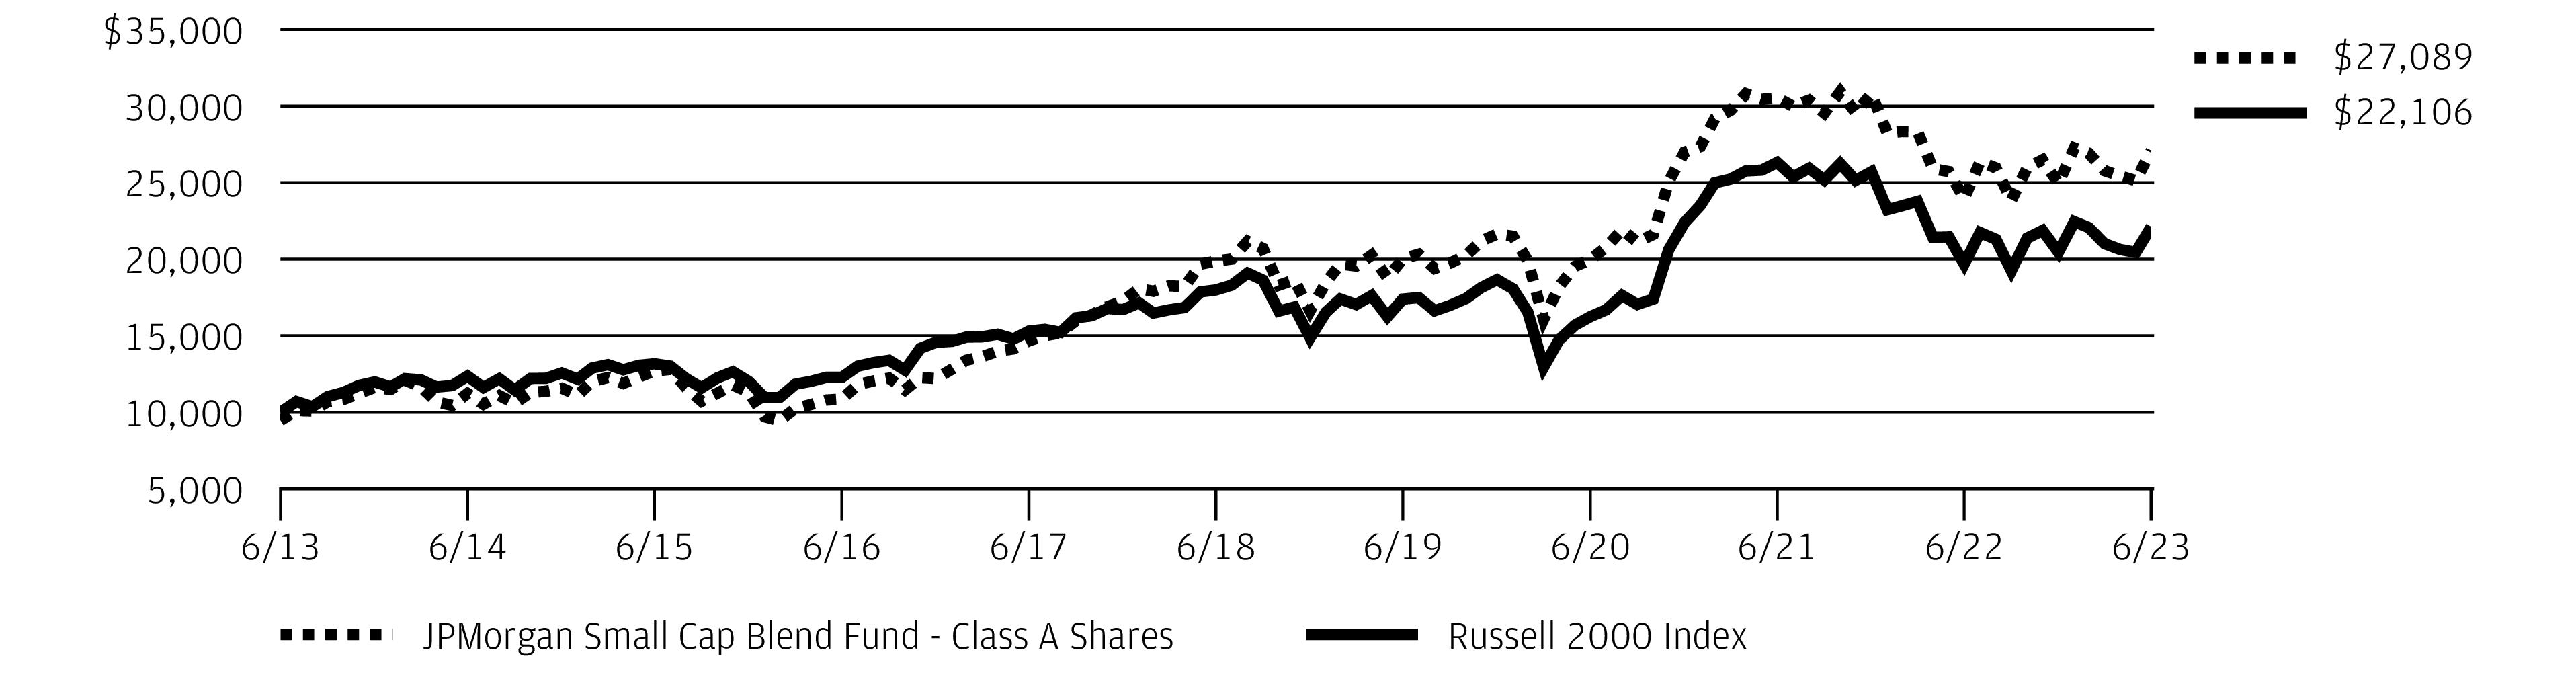
The Fund’s Class A Shares, without a sales charge, outperformed the Russell 2000 Index (the “Benchmark”) for the twelve months ended June 30, 2023.
The Fund’s security selection in the industrials and financials sectors was a leading contributor to performance relative to the Benchmark, while the Fund’s security selection in the health care and information technology sectors was a leading detractor from relative performance.
Leading individual contributors to relative performance included the Fund’s overweight positions Applied Industrial Technologies Inc., Rambus Inc. and Comfort Systems USA Inc. Shares of Applied Industrial Technologies, a distributor of industrial machinery and systems, rose after the company reported consecutive quarters of better-than-expected earnings and revenue. Shares of Rambus, a semiconductor manufacturer, rose amid a broad rally in semiconductor sector stocks in the second half of 2023. Shares of Comfort Systems USA, a provider of mechanical and electrical systems for buildings, rose after the company reported consecutive quarters of better-than-expected earnings and revenue.
Leading individual detractors from relative performance included the Fund’s overweight positions in Safety Insurance Group Inc. and Columbia Banking System , and its out-of-Benchmark position SentinelOne Inc. Shares of Safety Insurance Group. a property and casualty insurer, fell throughout the period amid investor disappointment with the company’s quarterly results. Shares of Columbia Banking System, a regional bank based in Tacoma, Wash., fell amid investor concerns about regional banks following the collapse of Silicon Valley Bank. Shares of SentinelOne, a cybersecurity provider, fell in late 2022 amid a broad slump in cybersecurity stocks and fell again in June 2023 after the company reported weaker-than-expected quarterly results and lowered its earnings forecast.
HOW WAS THE FUND POSITIONED?
The Fund’s portfolio managers utilized a bottom-up approach to stock selection, researching individual companies in an effort to construct a portfolio of companies that are attractively valued and stocks that have a history of growth. The Fund’s portfolio managers preferred to invest in high quality companies with durable franchises that, in their view, possessed the ability to generate consistent earnings. The Fund is positioned to invest in small cap companies across both
growth and value styles.
TOP TEN HOLDINGS OF THE
PORTFOLIO AS OF June 30, 2023 | PERCENT OF
TOTAL
INVESTMENTS |
| Applied Industrial Technologies, Inc. | |
| | |
| Selective Insurance Group, Inc. | |
| | |
| Super Micro Computer, Inc. | |
| | |
| | |
| | |
| | |
| | |
PORTFOLIO COMPOSITION BY SECTOR
AS OF June 30, 2023 | PERCENT OF
TOTAL
INVESTMENTS |
| |
| |
| |
| |
| |
| |
| |
| |
| |
| |
| |
| |
| J.P. Morgan Small Cap Funds | |
JPMorgan Small Cap Blend Fund
FUND COMMENTARY
TWELVE MONTHS ENDED June 30, 2023 (Unaudited) (continued)
*
The return shown is based on net asset values calculated for shareholder transactions and may differ from the return shown in the financial highlights, which reflects adjustments made to the net asset values in accordance with accounting principles generally accepted in the United States of America.
**
The adviser seeks to achieve the Fund’s objective. There can be no guarantee it will be achieved.
| J.P. Morgan Small Cap Funds | |
AVERAGE ANNUAL TOTAL RETURNS AS OF June 30, 2023
|
| Sales Charge for Class A Shares is 5.25%. |
| Assumes a 1% CDSC (contingent deferred sales charge) for the one year period and 0% CDSC thereafter. |
TEN YEAR FUND PERFORMANCE (6/30/13 TO 6/30/23)
The performance quoted is past performance and is not a guarantee of future results. Mutual funds are subject to certain market risks. Investment returns and principal value of an investment will fluctuate so that an investor’s shares, when redeemed, may be worth more or less than their original cost. Current performance may be higher or lower than the performance data shown. For up-to-date month-end performance information please call 1-800-480-4111.
Returns for Class R6 Shares prior to their inception date are based on the performance of Class I Shares. The actual returns for Class R6 Shares would have been different than those shown because Class R6 have different expenses than Class I Shares.
The graph illustrates comparative performance for $10,000 invested in Class A Shares of the JPMorgan Small Cap Blend Fund and the Russell 2000 Index from June 30, 2013 to June 30, 2023. The performance of the Fund assumes reinvestment of all dividends and capital gain distributions, if any, and includes a sales charge. The performance of the Russell 2000 Index does not reflect the deduction of expenses or a sales charge associated with a mutual fund and has been adjusted to reflect reinvestment of all dividends and capital gain distributions of the securities included in the benchmark, if applicable. The Russell 2000 Index is an unmanaged index which measures the performance of the 2000 smallest stocks (on the basis of capitalization) in the Russell 3000 Index. Investors cannot invest directly in an index.
Effective June 1, 2018, the Fund’s investment strategies changed. Although past performance is not necessarily an indication of how the Fund will perform in the future, in view of these changes, the Fund’s performance record prior to this date might be less relevant for investors considering whether to purchase shares of the Fund.
Class A Shares have a $1,000 minimum initial investment and carry a 5.25% sales charge.
Fund performance may reflect the waiver of the Fund’s fees and reimbursement of expenses for certain periods. Without these waivers and reimbursements, performance would have been lower. Also, performance shown in this section does not reflect the deduction of taxes that a shareholder would pay on Fund distributions or on gains resulting from redemptions of Fund shares.
Because Class C Shares automatically convert to Class A Shares after 8 years, the 10 year average annual total return shown above for Class C reflects Class A performance for the period after conversion.
The returns shown are based on net asset values calculated for shareholder transactions and may differ from the returns shown in the financial highlights, which reflect adjustments made to the net asset values in accordance with accounting principles generally accepted in the United States of America.
| J.P. Morgan Small Cap Funds | |
JPMorgan Small Cap Equity Fund
FUND COMMENTARY
TWELVE MONTHS ENDED June 30, 2023 (Unaudited)
| |
Fund (Class A Shares, without a sales charge) * | |
| |
Net Assets as of 6/30/2023 (In Thousands) | |
INVESTMENT OBJECTIVE**
The JPMorgan Small Cap Equity Fund (the “Fund”) seeks capital growth over the long term.
WHAT WERE THE MAIN DRIVERS OF THE FUND’S PERFORMANCE?
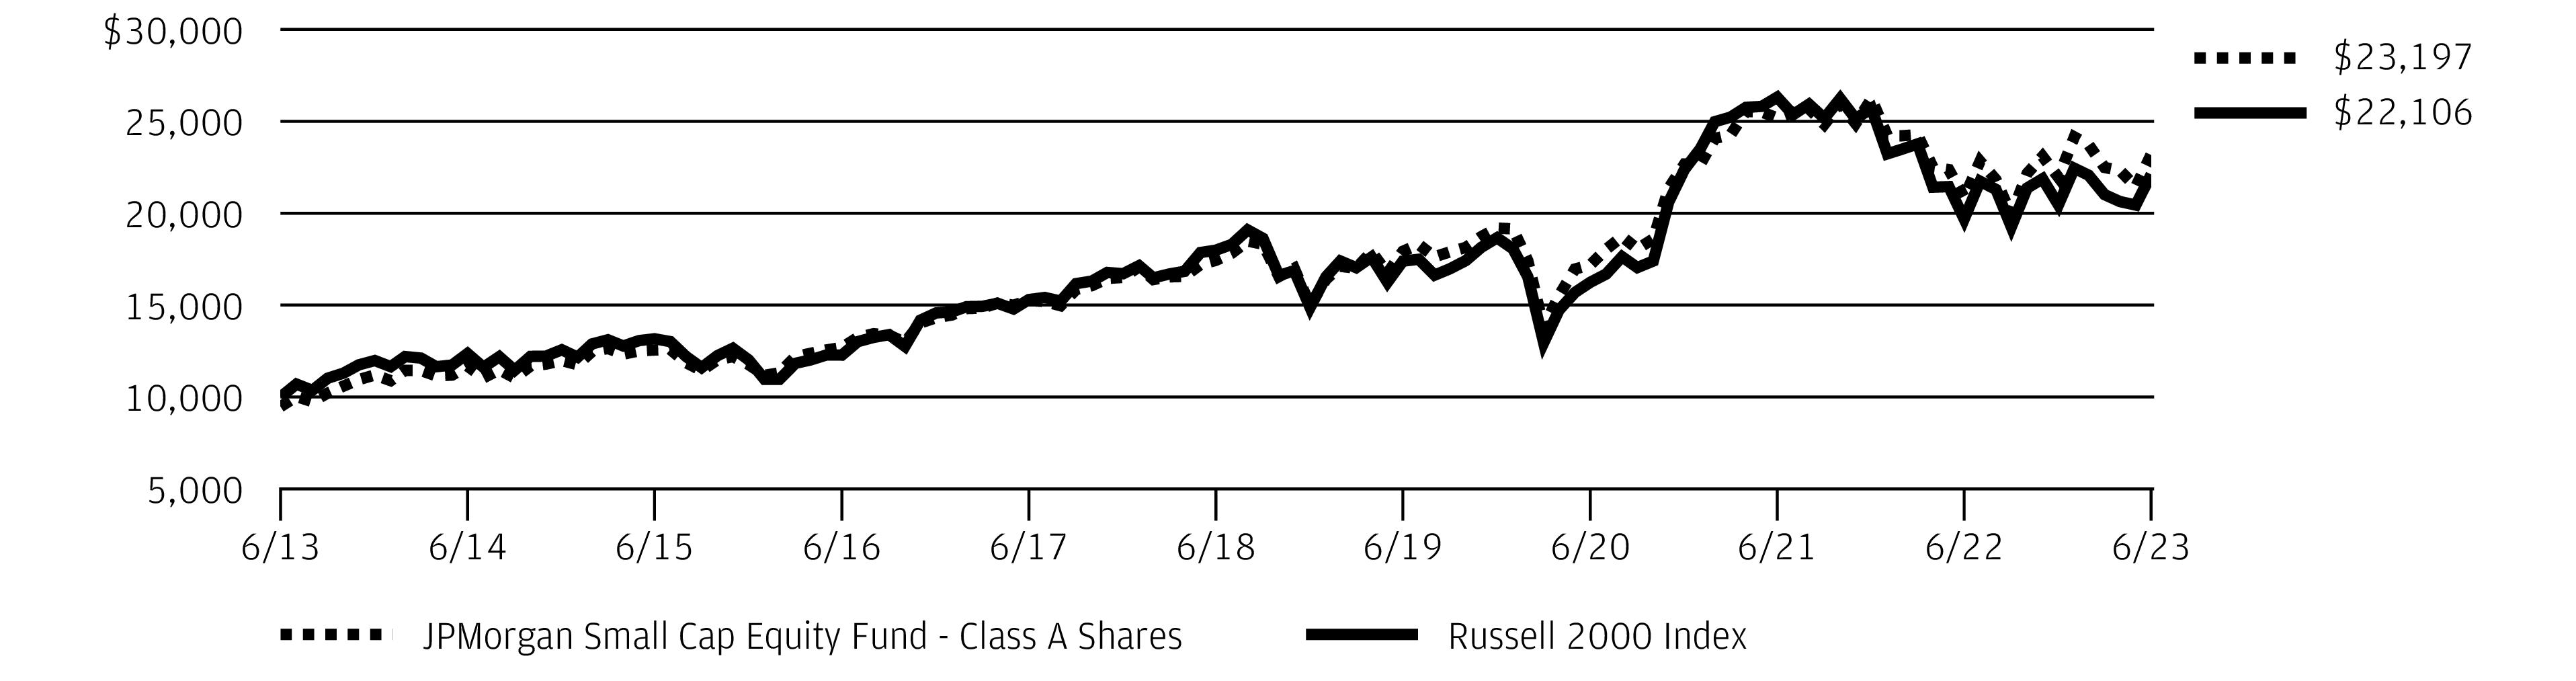
The Fund’s Class A Shares, without a sales charge, underperformed the Russell 2000 Index (the “Benchmark”) for the twelve months ended June 30, 2023.
The Fund’s security selection in the health care and consumer discretionary sectors was a leading detractor from performance relative to the Benchmark, while the Fund’s security selection and overweight position in the industrials sector and its security selection in the information technology sector were leading contributors to relative performance.
Leading individual detractors from relative performance included the Fund’s out-of-Benchmark positions in Western Alliance Bancorporation, Syneos Health Inc. and Signature Bank. Shares of Western Alliance, a regional bank based in Phoenix, Ariz., fell amid investor concerns about the financial stability of regional banks following the collapse of Silicon Valley Bank. Shares of Syneos Health, a provider of development services to the pharmaceuticals industry, fell after the company reported lower-than-expected earnings for the third quarter of 2022 and lowered its earnings forecast. Shares of Signature Bank, a regional bank based in New York City, fell ahead the company’s financial collapse and closure by U.S. regulators in March 2023.
Leading individual contributors to relative performance included the Fund’s out-of-Benchmark positions in Allegro Microsystems Inc., WillScot Mobile Mini Holdings Corp. and Lincoln Electric Holdings Inc. Shares of Allegro Microsystems, a semiconductor manufacturer rose amid a broad rally in semiconductor sector stocks in the first half of 2023, and after the company reported better-than-expected earnings and revenue for its fiscal fourth quarter. Shares of WillScot Mini Mobile Holdings, a storage and moving company, rose amid consecutive quarters of better-than-expected earnings and revenue, and a $1 billion share repurchase plan. Shares of Lincoln Electric Holdings, an industrials machinery manufacturer, rose amid consecutive quarters of better-than-expected earnings and revenue during the period.
HOW WAS THE FUND POSITIONED?
The Fund’s portfolio managers employed a bottom-up approach to stock selection, constructing portfolios based on company fundamentals and proprietary analysis. The Fund’s portfolio managers looked for companies that, in their view, had leading competitive advantages, predictable and durable business models, and sustainable free cash flow generation with
management teams committed to increasing intrinsic value.
TOP TEN HOLDINGS OF THE
PORTFOLIO AS OF June 30, 2023 | PERCENT OF
TOTAL
INVESTMENTS |
| WillScot Mobile Mini Holdings Corp. | |
| | |
| | |
| | |
| MACOM Technology Solutions Holdings, Inc. | |
| Casella Waste Systems, Inc., Class A | |
| | |
| | |
| Performance Food Group Co. | |
| | |
PORTFOLIO COMPOSITION BY SECTOR
AS OF June 30, 2023 | PERCENT OF
TOTAL
INVESTMENTS |
| |
| |
| |
| |
| |
| |
| |
| |
| |
Others (each less than 1.0%) | |
| |
*
The return shown is based on net asset values calculated for shareholder transactions and may differ from the return shown in
| J.P. Morgan Small Cap Funds | |
the financial highlights, which reflects adjustments made to the net asset values in accordance with accounting principles generally accepted in the United States of America.
**
The adviser seeks to achieve the Fund’s objective. There can be no guarantee it will be achieved.
| J.P. Morgan Small Cap Funds | |
JPMorgan Small Cap Equity Fund
FUND COMMENTARY
TWELVE MONTHS ENDED June 30, 2023 (Unaudited) (continued)
AVERAGE ANNUAL TOTAL RETURNS AS OF June 30, 2023
|
| Sales Charge for Class A Shares is 5.25%. |
| Assumes a 1% CDSC (contingent deferred sales charge) for the one year period and 0% CDSC thereafter. |
TEN YEAR FUND PERFORMANCE (6/30/13 TO 6/30/23)
The performance quoted is past performance and is not a guarantee of future results. Mutual funds are subject to certain market risks. Investment returns and principal value of an investment will fluctuate so that an investor’s shares, when redeemed, may be worth more or less than their original cost. Current performance may be higher or lower than the performance data shown. For up-to-date month-end performance information please call 1-800-480-4111.
Returns for Class R3 Shares prior to their inception date are based on the performance of Class A Shares. The actual returns of Class R3 Shares would have been similar to those shown because Class R3 Shares have similar expenses to Class A Shares at time of launch.
Returns for Class R4 Shares prior to their inception date are based on the performance of Class I Shares. The actual returns for Class R4 Shares would have been similar to those shown because Class R4 Shares have similar expenses to Class I Shares.
Returns for Class R6 Shares prior to their inception date are based on the performance of the Class R5 Shares. The actual returns of Class R6 Shares would have been different than those shown because Class R6 Shares have different expenses than Class R5 Shares.
The graph illustrates comparative performance for $10,000 invested in Class A Shares of the JPMorgan Small Cap Equity Fund and the Russell 2000 Index from June 30, 2013 to June 30, 2023. The performance of the Fund assumes
reinvestment of all dividends and capital gain distributions, if any, and includes a sales charge. The performance of the Russell 2000 Index does not reflect the deduction of expenses or a sales charge associated with a mutual fund and has been adjusted to reflect reinvestment of all dividends and capital gain distributions of the securities included in the benchmark, if applicable. The Russell 2000 Index is an unmanaged index which measures the performance of the 2000 smallest stocks (on the basis of capitalization) in the Russell 3000 Index. Investors cannot invest directly in an index.
Class A Shares have a $1,000 minimum initial investment and carry a 5.25% sales charge.
Fund performance may reflect the waiver of the Fund’s fees and reimbursement of expenses for certain periods. Without these waivers and reimbursements, performance would have been lower. Also, performance shown in this section does not reflect the deduction of taxes that a shareholder would pay on Fund distributions or on gains resulting from redemptions of Fund shares.
Because Class C Shares automatically convert to Class A Shares after 8 years, the 10 year average annual total return shown above for Class C reflects Class A performance for the period after conversion.
The returns shown are based on net asset values calculated for shareholder transactions and may differ from the returns shown in the financial highlights, which reflect adjustments made to the net asset values in accordance with accounting principles generally accepted in the United States of America.
| J.P. Morgan Small Cap Funds | |
JPMorgan Small Cap Growth Fund
FUND COMMENTARY
TWELVE MONTHS ENDED June 30, 2023 (Unaudited)
| |
Fund (Class A Shares, without a sales charge) * | |
Russell 2000 Growth Index | |
Net Assets as of 6/30/2023 (In Thousands) | |
INVESTMENT OBJECTIVE**
The JPMorgan Small Cap Growth Fund (the “Fund”) seeks long-term capital growth primarily by investing in a portfolio of equity securities of small-capitalization and emerging growth companies.
WHAT WERE THE MAIN DRIVERS OF THE FUND’S PERFORMANCE?
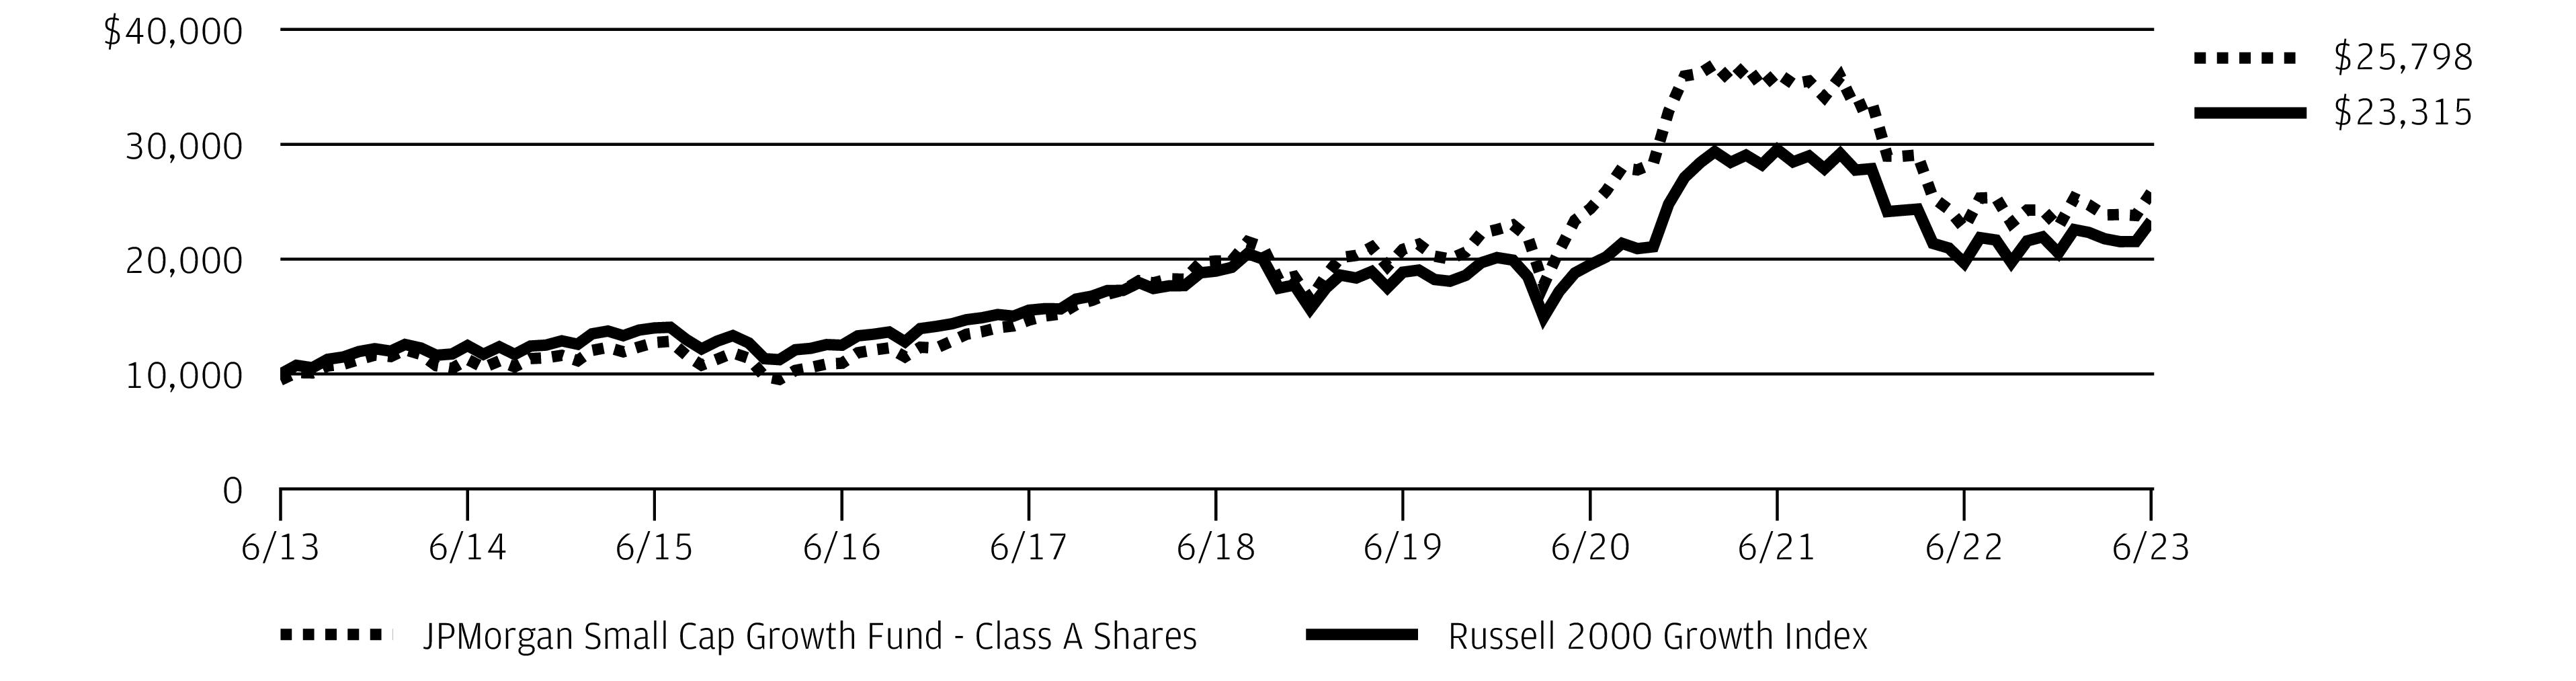
The Fund’s Class A Shares, without a sales charge, underperformed the Russell 2000 Growth Index (the “Benchmark”) for the twelve months ended June 30, 2023.
The Fund’s security selection in the health care and information technology sectors was a leading detractor from performance relative to the Benchmark, while the Fund’s security selection in the industrial and financials were leading contributors to relative performance.
Leading individual detractors from relative performance included the Fund’s out-of-Benchmark positions in Grocery Outlet Holding Corp. and SentinelOne Inc., and its overweight position in Cano Health Inc. Shares of Grocery Outlet Holding, a food retail chain operator, fell amid slower consumer spending on groceries and after the company reported lower-than-expected earnings for the fourth quarter of 2022. Shares of SentinelOne, a cybsercecurity provider, fell in late 2022 amid a broad sell-off in cybersecurity stocks and after the company reduced its earnings forecast for fiscal 2024. Shares of Cano Health, an operator of medical centers and pharmacies, fell sharply in the fourth quarter of 2022 amid news reports that CVS Pharmacy Inc. declined to make an acquisition offer for the company.
Leading individual contributors to relative performance included the Fund’s overweight positions in ACV Auctions Inc., Revance Therapeutics Inc. and ShockWave Medical Inc. Shares of AV Auctions, an online automobile marketplace, rose after the company reported better-than-expected earnings and revenue for the first quarter of 2023 and raised its earnings forecast for the full year 2023. Shares of Revance Therapeutics, a pharmaceuticals developer, rose after the company forecast strong revenue growth from its treatment for facial wrinkles and after the company reported better-than-expected results for the first quarter of 2023. Shares of ShockWave Medical, a medical device manufacturer, rose after the company reported
several quarters of better-than-expected earnings and revenue and amid news reports that the company was a likely acquisition target.
HOW WAS THE FUND POSITIONED?
The Fund’s portfolio managers utilized a bottom-up approach to stock selection, researching individual companies in an effort to construct portfolios of stocks that have strong fundamentals. The Fund’s portfolio managers preferred to invest in high quality companies with durable franchises that, in their view, possessed the ability to generate strong future earnings
growth.
TOP TEN HOLDINGS OF THE
PORTFOLIO AS OF June 30, 2023 | PERCENT OF
TOTAL
INVESTMENTS |
| Super Micro Computer, Inc. | |
| Applied Industrial Technologies, Inc. | |
| | |
| | |
| | |
| Casella Waste Systems, Inc., Class A | |
| Evolent Health, Inc., Class A | |
| Simpson Manufacturing Co., Inc. | |
| | |
| | |
PORTFOLIO COMPOSITION BY SECTOR
AS OF June 30, 2023 | PERCENT OF
TOTAL
INVESTMENTS |
| |
| |
| |
| |
| |
| |
| |
| |
| |
*
The return shown is based on net asset values calculated for shareholder transactions and may differ from the return shown in
| J.P. Morgan Small Cap Funds | |
JPMorgan Small Cap Growth Fund
FUND COMMENTARY
TWELVE MONTHS ENDED June 30, 2023 (Unaudited) (continued)
the financial highlights, which reflects adjustments made to the net asset values in accordance with accounting principles generally accepted in the United States of America.
**
The adviser seeks to achieve the Fund’s objective. There can be no guarantee it will be achieved.
| J.P. Morgan Small Cap Funds | |
AVERAGE ANNUAL TOTAL RETURNS AS OF June 30, 2023
|
| Sales Charge for Class A Shares is 5.25%. |
| Assumes a 1% CDSC (contingent deferred sales charge) for the one year period and 0% CDSC thereafter. |
TEN YEAR FUND PERFORMANCE (6/30/13 TO 6/30/23)
The performance quoted is past performance and is not a guarantee of future results. Mutual funds are subject to certain market risks. Investment returns and principal value of an investment will fluctuate so that an investor’s shares, when redeemed, may be worth more or less than their original cost. Current performance may be higher or lower than the performance data shown. For up-to-date month-end performance information please call 1-800-480-4111.
Returns for Class R3 Shares prior to their inception date are based on the performance of Class A Shares. Prior performance for Class R3 Shares has been adjusted to reflect the differences in expenses between classes.
Returns for Class R4 Shares prior to their inception date are based on the performance of Class I Shares. Prior performance for Class R4 Shares has been adjusted to reflect the differences in expenses between classes.
Returns for Class R5 Shares prior to their inception date are based on the performance of Class L Shares. The actual returns for Class R5 Shares would have been different than those shown because Class R5 Shares have different expenses than Class L Shares.
The graph illustrates comparative performance for $10,000 invested in Class A Shares of the JPMorgan Small Cap Growth Fund and the Russell 2000 Growth Index from June 30, 2013 to June 30, 2023. The performance of the Fund assumes reinvestment of all dividends and capital gain distributions, if any, and includes a sales charge. The performance of the Russell 2000 Growth Index
does not reflect the deduction of expenses or a sales charge associated with a mutual fund and has been adjusted to reflect reinvestment of all dividends and capital gain distributions of the securities included in the benchmark, if applicable. The Russell 2000 Growth Index is an unmanaged index which measures the performance of those Russell 2000 companies with higher price-to-book ratios and higher forecasted growth values. Investors cannot invest directly in an index.
Class A Shares have a $1,000 minimum initial investment and carry a 5.25% sales charge.
Fund performance may reflect the waiver of the Fund’s fees and reimbursement of expenses for certain periods. Without these waivers and reimbursements, performance would have been lower. Also, performance shown in this section does not reflect the deduction of taxes that a shareholder would pay on Fund distributions or on gains resulting from redemptions of Fund shares.
Because Class C Shares automatically convert to Class A Shares after 8 years, the 10 year average annual total return shown above for Class C reflects Class A performance for the period after conversion.
The returns shown are based on net asset values calculated for shareholder transactions and may differ from the returns shown in the financial highlights, which reflect adjustments made to the net asset values in accordance with accounting principles generally accepted in the United States of America.
| J.P. Morgan Small Cap Funds | |
JPMorgan Small Cap Sustainable Leaders Fund
FUND COMMENTARY
TWELVE MONTHS ENDED June 30, 2023 (Unaudited)
| |
| |
| |
Net Assets as of 6/30/2023 (In Thousands) | |
INVESTMENT OBJECTIVE**
The JPMorgan Small Cap Sustainable Leaders Fund (the “Fund”) seeks capital growth over the long term.
WHAT WERE THE MAIN DRIVERS OF THE FUND’S PERFORMANCE?
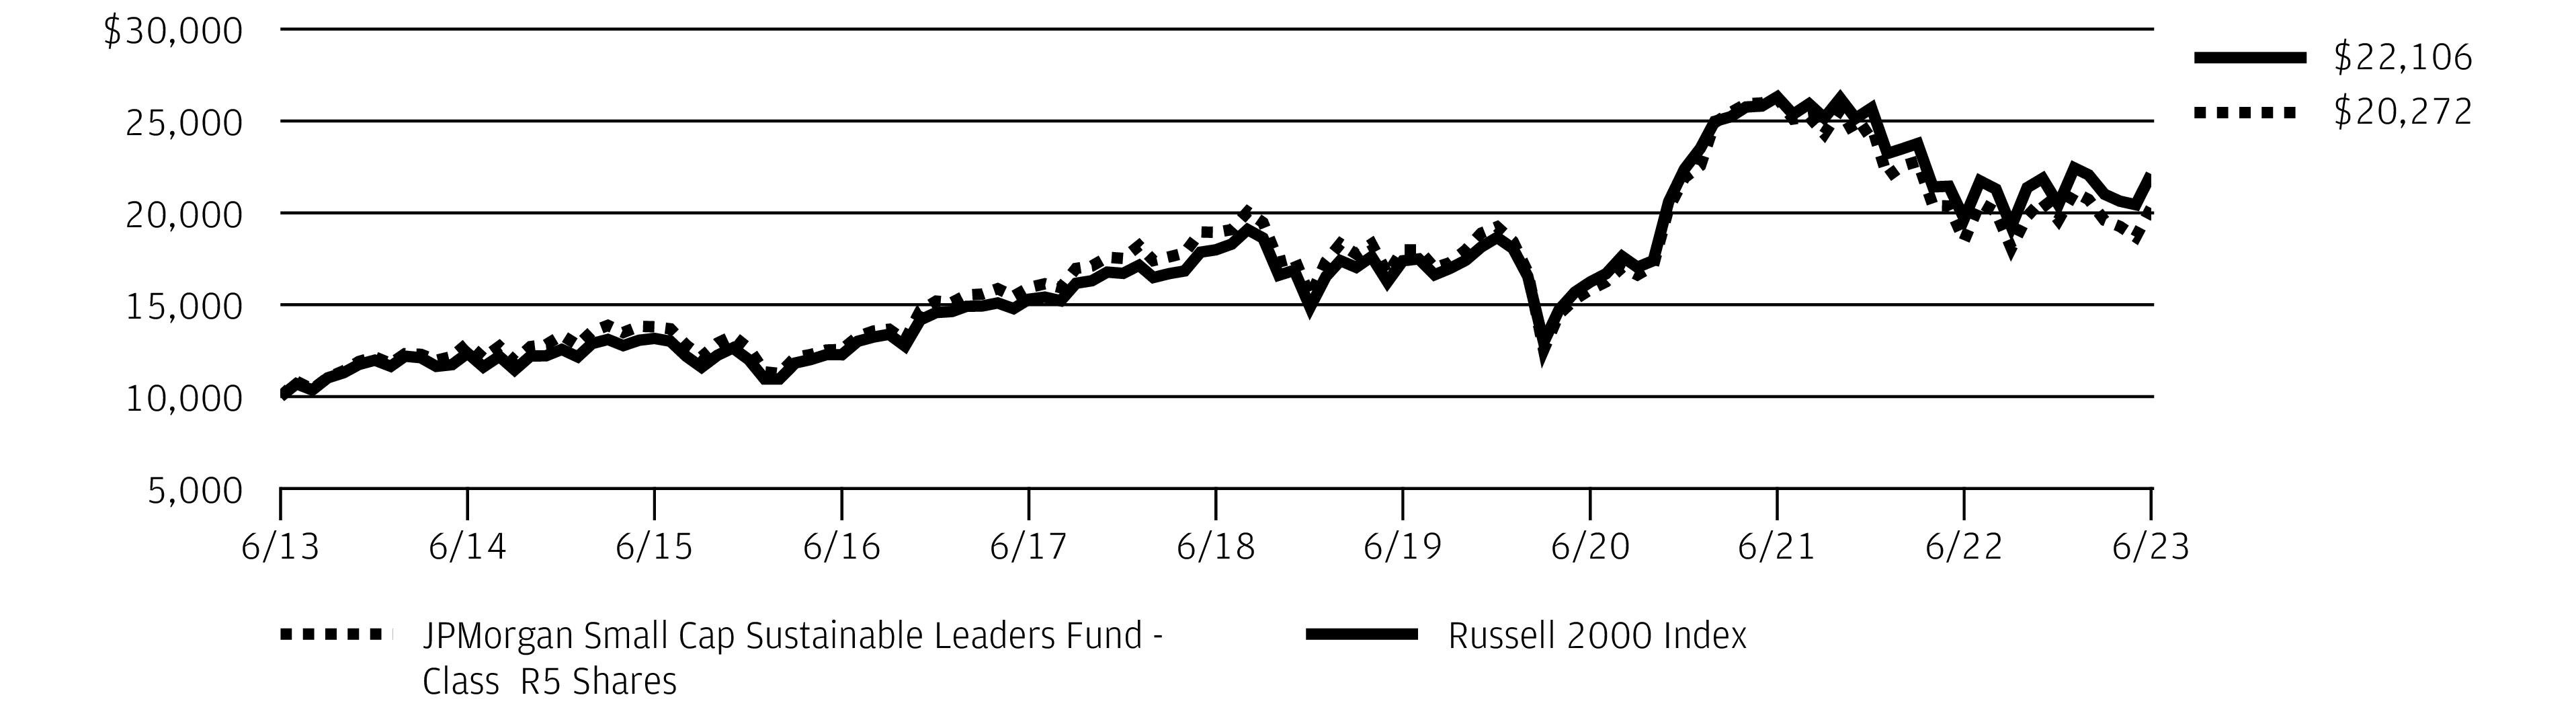
The Fund’s Class R5 Shares underperformed the Russell 2000 Index (the “Benchmark”) for the twelve months ended June 30, 2023.
The Fund’s security selection in the real estate and consumer staples sectors was a leading detractor from performance relative to the Benchmark, while the Fund’s security selection in the health care sector and its overweight position in the industrials sector was a leading contributor to relative performance.
Leading individual detractors from relative performance included the Fund’s overweight positions in MillerKnoll Inc., United Natural Foods Inc. and Unifi Inc. Shares of MillerKnoll, an office furnishings company commonly known as Herman Miller, fell in October 2022 after the company issued a weaker-than-expected earnings forecast. Shares of United Natural Foods, a food distributor, fell after the company reporter lower-than-expected earnings for its fiscal third quarter and sharply lowered its 2023 earnings forecast. Shares of Unifi, a textiles manufacturer, fell after the company reported consecutive quarters of weaker-than-expected revenue.
Leading individual contributors to relative performance included the Fund’s out-of-Benchmark position in Deckers Outdoor Corp., and its overweight position in Maxar Technologies Ltd. and Apellis Pharmaceuticals Inc. Shares of Deckers Outdoor, a footwear and apparel maker, rose amid consecutive quarters of better-than-expected earnings and revenue. Shares of Maxar Technologies, a satellite imaging and aerospace company, rose after the company agreed to be acquired by Advent International Corp. for about $6.4 billion. Shares of Apellis Pharmaceuticals, a drug development company, rose amid investor expectations for FDA review of the company’s eye-disease drug candidate and news reports that the company was a potential takeover target of larger pharmaceutical companies.
HOW WAS THE FUND POSITIONED?
In accordance with its investment process, the Fund’s portfolio managers take limited sector bets and construct the Fund so that stock selection is typically the primary driver of the Fund’s relative performance versus the Benchmark. The Fund’s portfolio managers employ a bottom-up approach to stock selection, using quantitative screening and proprietary analysis to construct a portfolio of companies that they believe are attractively valued and possess strong momentum. During the reporting period, the Fund was managed and positioned in
accordance with this investment process.
TOP TEN HOLDINGS OF THE
PORTFOLIO AS OF June 30, 2023 | PERCENT OF
TOTAL
INVESTMENTS |
| WESCO International, Inc. | |
| | |
| | |
| | |
| | |
| | |
| Apellis Pharmaceuticals, Inc. | |
| Huron Consulting Group, Inc. | |
| | |
| American States Water Co. | |
PORTFOLIO COMPOSITION BY SECTOR
AS OF June 30, 2023 | PERCENT OF
TOTAL
INVESTMENTS |
| |
| |
| |
| |
| |
| |
| |
| |
| |
| |
Others (each less than 1.0%) | |
| |
| J.P. Morgan Small Cap Funds | |
*
The return shown is based on net asset values calculated for shareholder transactions and may differ from the return shown in the financial highlights, which reflects adjustments made to the net asset values in accordance with accounting principles generally accepted in the United States of America.
**
The adviser seeks to achieve the Fund’s objective. There can be no guarantee it will be achieved.
| J.P. Morgan Small Cap Funds | |
JPMorgan Small Cap Sustainable Leaders Fund
FUND COMMENTARY
TWELVE MONTHS ENDED June 30, 2023 (Unaudited) (continued)
AVERAGE ANNUAL TOTAL RETURNS AS OF June 30, 2023
|
| Sales Charge for Class A Shares is 5.25%. |
| Assumes a 1% CDSC (contingent deferred sales charge) for the one year period and 0% CDSC thereafter. |
TEN YEAR FUND PERFORMANCE (6/30/13 TO 6/30/23)
The performance quoted is past performance and is not a guarantee of future results. Mutual funds are subject to certain market risks. Investment returns and principal value of an investment will fluctuate so that an investor’s shares, when redeemed, may be worth more or less than their original cost. Current performance may be higher or lower than the performance data shown. For up-to-date month-end performance information please call 1-800-480-4111.
Returns for Class A, Class C, Class I, Class R2, Class R3, Class R4 and Class R6 Shares prior to their inception dates are based on the performance of Class R5 Shares. The actual returns of Class A, Class C, Class I, Class R2, Class R3 and Class R4 Shares would have been lower than those shown because these classes have higher expenses than Class R5 Shares. The actual returns of the Class R6 Shares would have been different than those shown because Class R6 Shares have different expenses than Class R5 Shares.
The graph illustrates comparative performance for $10,000 invested in Class R5 Shares of the JPMorgan Small Cap Sustainable Leaders Fund and the Russell 2000 Index from June 30, 2013 to June 30, 2023. The performance of the Fund assumes reinvestment of all dividends and capital gain distributions, if any, and
does not include a sales charge. The performance of the Russell 2000 Index does not reflect the deduction of expenses or a sales charge associated with a mutual fund and has been adjusted to reflect reinvestment of all dividends and capital gain distributions of the securities included in the benchmark, if applicable. The Russell 2000 Index is an unmanaged index which measures the performance of the 2000 smallest stocks (on the basis of capitalization) in the Russell 3000 Index. Investors cannot invest directly in an index.
Class R5 Shares have no minimum initial investment.
Fund performance may reflect the waiver of the Fund’s fees and reimbursement of expenses for certain periods. Without these waivers and reimbursements, performance would have been lower. Also, performance shown in this section does not reflect the deduction of taxes that a shareholder would pay on Fund distributions or on gains resulting from redemptions of Fund shares.
The returns shown are based on net asset values calculated for shareholder transactions and may differ from the returns shown in the financial highlights, which reflect adjustments made to the net asset values in accordance with accounting principles generally accepted in the United States of America.
| J.P. Morgan Small Cap Funds | |
JPMorgan Small Cap Value Fund
FUND COMMENTARY
TWELVE MONTHS ENDED June 30, 2023 (Unaudited)
| |
| |
| |
Net Assets as of 6/30/2023 (In Thousands) | |
INVESTMENT OBJECTIVE**
The JPMorgan Small Cap Value Fund (the “Fund”) seeks long-term capital growth primarily by investing in equity securities of small-capitalization companies.
WHAT WERE THE MAIN DRIVERS OF THE FUND’S PERFORMANCE?
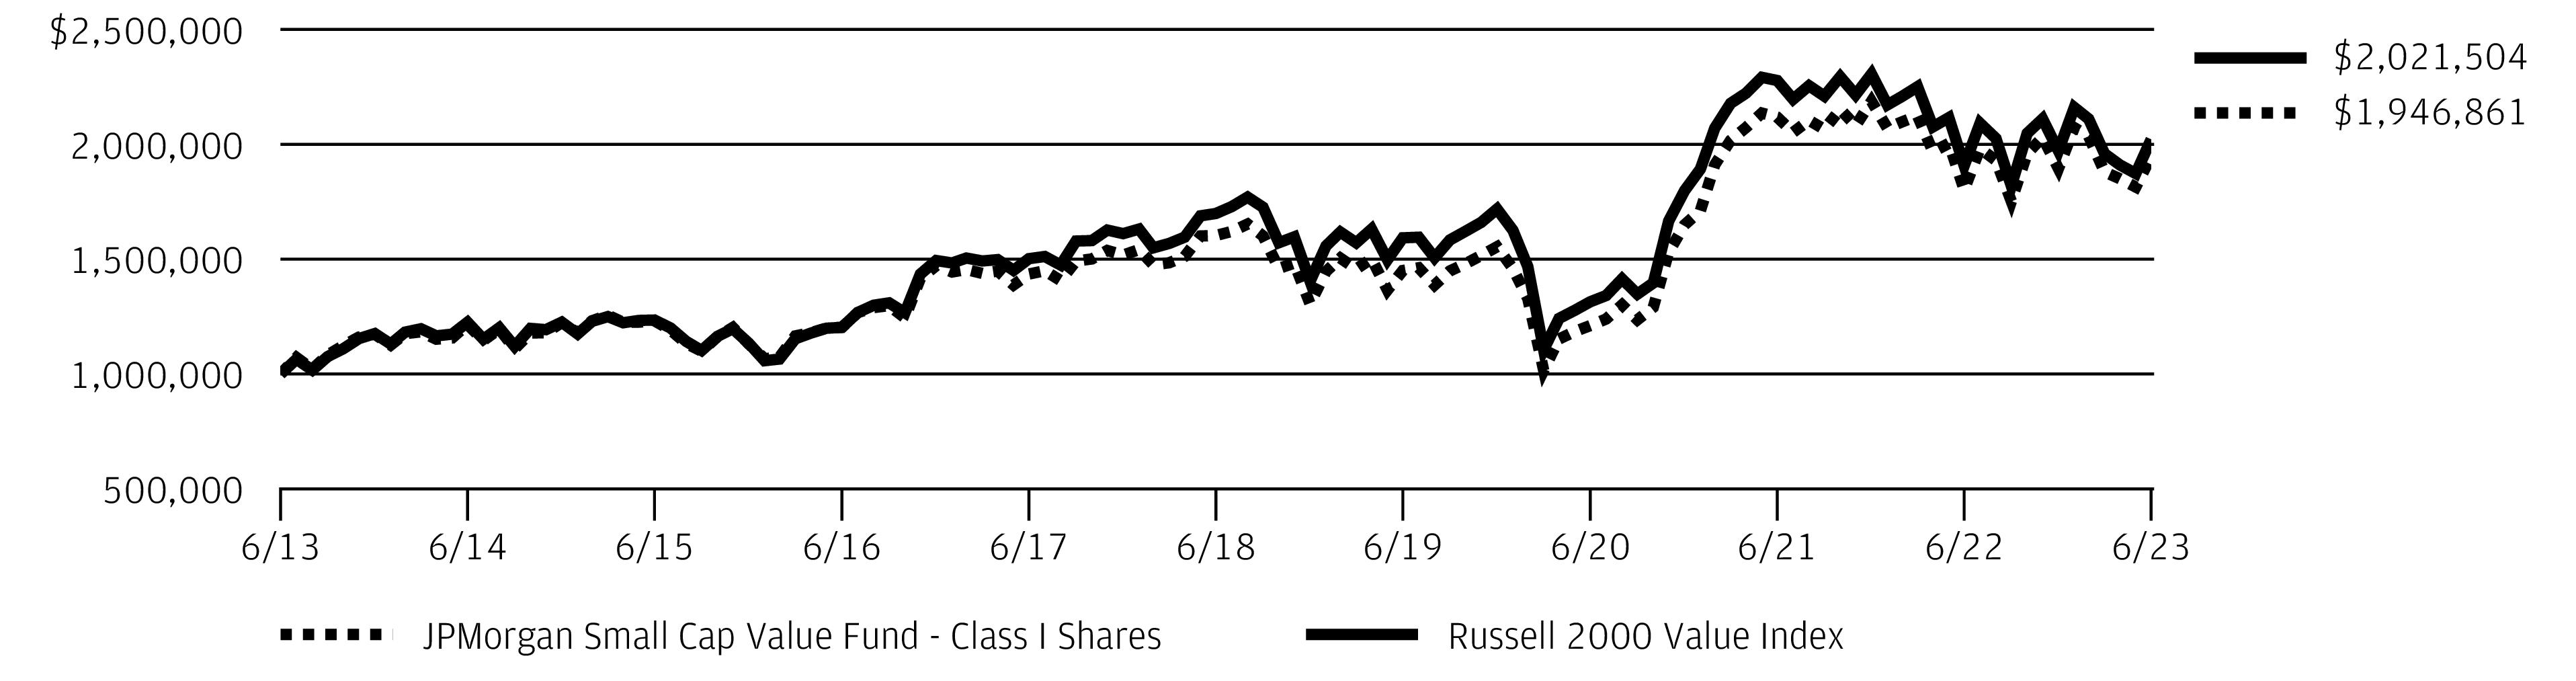
The Fund’s Class I Shares outperformed the Russell 2000 Value Index (the “Benchmark”) for the twelve months ended June 30, 2023.
The Fund’s security selection in the industrial cyclical and retail sectors was a leading contributor to performance relative to the Benchmark, while the Fund’s security selection in the energy and systems hardware sectors was a leading detractor from relative performance.
Leading individual contributors to relative performance included the Fund’s out-of-Benchmark positions in Iveric Bio Inc., MoonLake Immunotherapeutics, and its overweight position in Academy Sports & Outdoors Inc. Shares of Iveric Bio, a pharmaceuticals developer, rose after Astellas Pharma Inc. agreed to acquire the company for $5.9 million. Shares of MoonLake Immunotherapeutics, a biopharmaceuticals developer, rose after the company reported positive results from Phase II clinical trials of its treatment for skin disorders. Shares of Academy Sport & Outdoors, a sporting goods and recreational products retailer, rose after the company issued a better-than-expected profit forecast and named a new chief executive officer.
Leading individual detractors from relative performance included the Fund’s overweight positions in Community Health Systems Inc., 2U Inc. and Twist Bioscience Corp. Shares of Community Health Systems, a hospitals and health care facilities operator, fell after the company reported weaker-than-expected results and higher costs for first quarter of 2023. Shares of 2U, an online educational services provider, fell amid weaker enrollments and lower-than-expected earnings for the first quarter of 2023. Shares of Twist Bioscience, a biotechnology provider, fell after the company issued a weaker-than-expected earnings forecast.
HOW WAS THE FUND POSITIONED?
In accordance with its investment process, the Fund’s portfolio managers take limited sector bets and construct the Fund so
that stock selection is typically the primary driver of the Fund’s relative performance versus the Benchmark. The Fund’s portfolio managers use a quantitative ranking methodology to identify stocks in each sector that, in their view, trade at attractive levels. Through bottom-up fundamental research, they seek companies that they believe have attractive valuations, exhibit high earnings quality and have management teams that make effective capital deployment decisions. During the reporting period, the Fund was managed and positioned in
accordance with this investment process.
TOP TEN HOLDINGS OF THE
PORTFOLIO AS OF June 30, 2023 | PERCENT OF
TOTAL
INVESTMENTS |
| Rush Enterprises, Inc., Class A | |
| Beacon Roofing Supply, Inc. | |
| | |
| | |
| | |
| OFG Bancorp (Puerto Rico) | |
| Enova International, Inc. | |
| | |
| | |
| | |
PORTFOLIO COMPOSITION BY SECTOR
AS OF June 30, 2023 | PERCENT OF
TOTAL
INVESTMENTS |
| |
| |
| |
| |
| |
| |
| |
| |
| |
| |
| |
| |
| J.P. Morgan Small Cap Funds | |
JPMorgan Small Cap Value Fund
FUND COMMENTARY
TWELVE MONTHS ENDED June 30, 2023 (Unaudited) (continued)
*
The return shown is based on net asset values calculated for shareholder transactions and may differ from the return shown in the financial highlights, which reflects adjustments made to the net asset values in accordance with accounting principles generally accepted in the United States of America.
**
The adviser seeks to achieve the Fund’s objective. There can be no guarantee it will be achieved.
| J.P. Morgan Small Cap Funds | |
AVERAGE ANNUAL TOTAL RETURNS AS OF June 30, 2023
|
| Sales Charge for Class A Shares is 5.25%. |
| Assumes a 1% CDSC (contingent deferred sales charge) for the one year period and 0% CDSC thereafter. |
TEN YEAR FUND PERFORMANCE (6/30/13 TO 6/30/23)
The performance quoted is past performance and is not a guarantee of future results. Mutual funds are subject to certain market risks. Investment returns and principal value of an investment will fluctuate so that an investor’s shares, when redeemed, may be worth more or less than their original cost. Current performance may be higher or lower than the performance data shown. For up-to-date month-end performance information please call 1-800-480-4111.
Returns for Class R3 Shares prior to their inception date are based on the performance of Class A Shares. Prior performance for Class R3 Shares has been adjusted to reflect the differences in expenses between classes.
Returns for Class R4 Shares prior to their inception date are based on the performance of Class I Shares. Prior performance for Class R4 Shares has been adjusted to reflect the differences in expenses between classes.
The graph illustrates comparative performance for $1,000,000 invested in Class I Shares of the JPMorgan Small Cap Value Fund and the Russell 2000 Value Index from June 30, 2013 to June 30, 2023. The performance of the Fund assumes reinvestment of all dividends and capital gain distributions, if any, and does not include a sales charge. The performance of the Russell 2000 Value Index does not reflect the deduction of expenses or a sales charge associated with a mutual fund and has been adjusted to reflect reinvestment of all
dividends and capital gain distributions of the securities included in the benchmark, if applicable. The Russell 2000 Value Index is an unmanaged index which measures the performance of those Russell 2000 companies with lower price-to-book ratios and lower forecasted growth values. Investors cannot invest directly in an index.
Class I Shares have a $1,000,000 minimum initial investment.
Fund performance may reflect the waiver of the Fund’s fees and reimbursement of expenses for certain periods. Without these waivers and reimbursements, performance would have been lower. Also, performance shown in this section does not reflect the deduction of taxes that a shareholder would pay on Fund distributions or on gains resulting from redemptions of Fund shares.
Because Class C Shares automatically convert to Class A Shares after 8 years, the 10 year average annual total return shown above for Class C reflects Class A performance for the period after conversion.
The returns shown are based on net asset values calculated for shareholder transactions and may differ from the returns shown in the financial highlights, which reflect adjustments made to the net asset values in accordance with accounting principles generally accepted in the United States of America.
| J.P. Morgan Small Cap Funds | |
JPMorgan SMID Cap Equity Fund
FUND COMMENTARY
TWELVE MONTHS ENDED June 30, 2023 (Unaudited)
| |
| |
| |
Net Assets as of 6/30/2023 (In Thousands) | |
INVESTMENT OBJECTIVE**
The JPMorgan SMID Cap Equity Fund (the “Fund”) seeks long-term capital growth by investing primarily in equity securities of companies with intermediate capitalizations.
INVESTMENT PROCESS
The Fund employs a fundamental bottom-up investment process to invest in a diversified portfolio of small- to mid-cap stocks - similar to those in the Russell 2500 Index (the “Benchmark”) - and seeks to invest in companies with leading competitive advantages, predictable and durable business models and sustainable free cash flows.
WHAT WERE THE MAIN DRIVERS OF THE FUND’S PERFORMANCE?
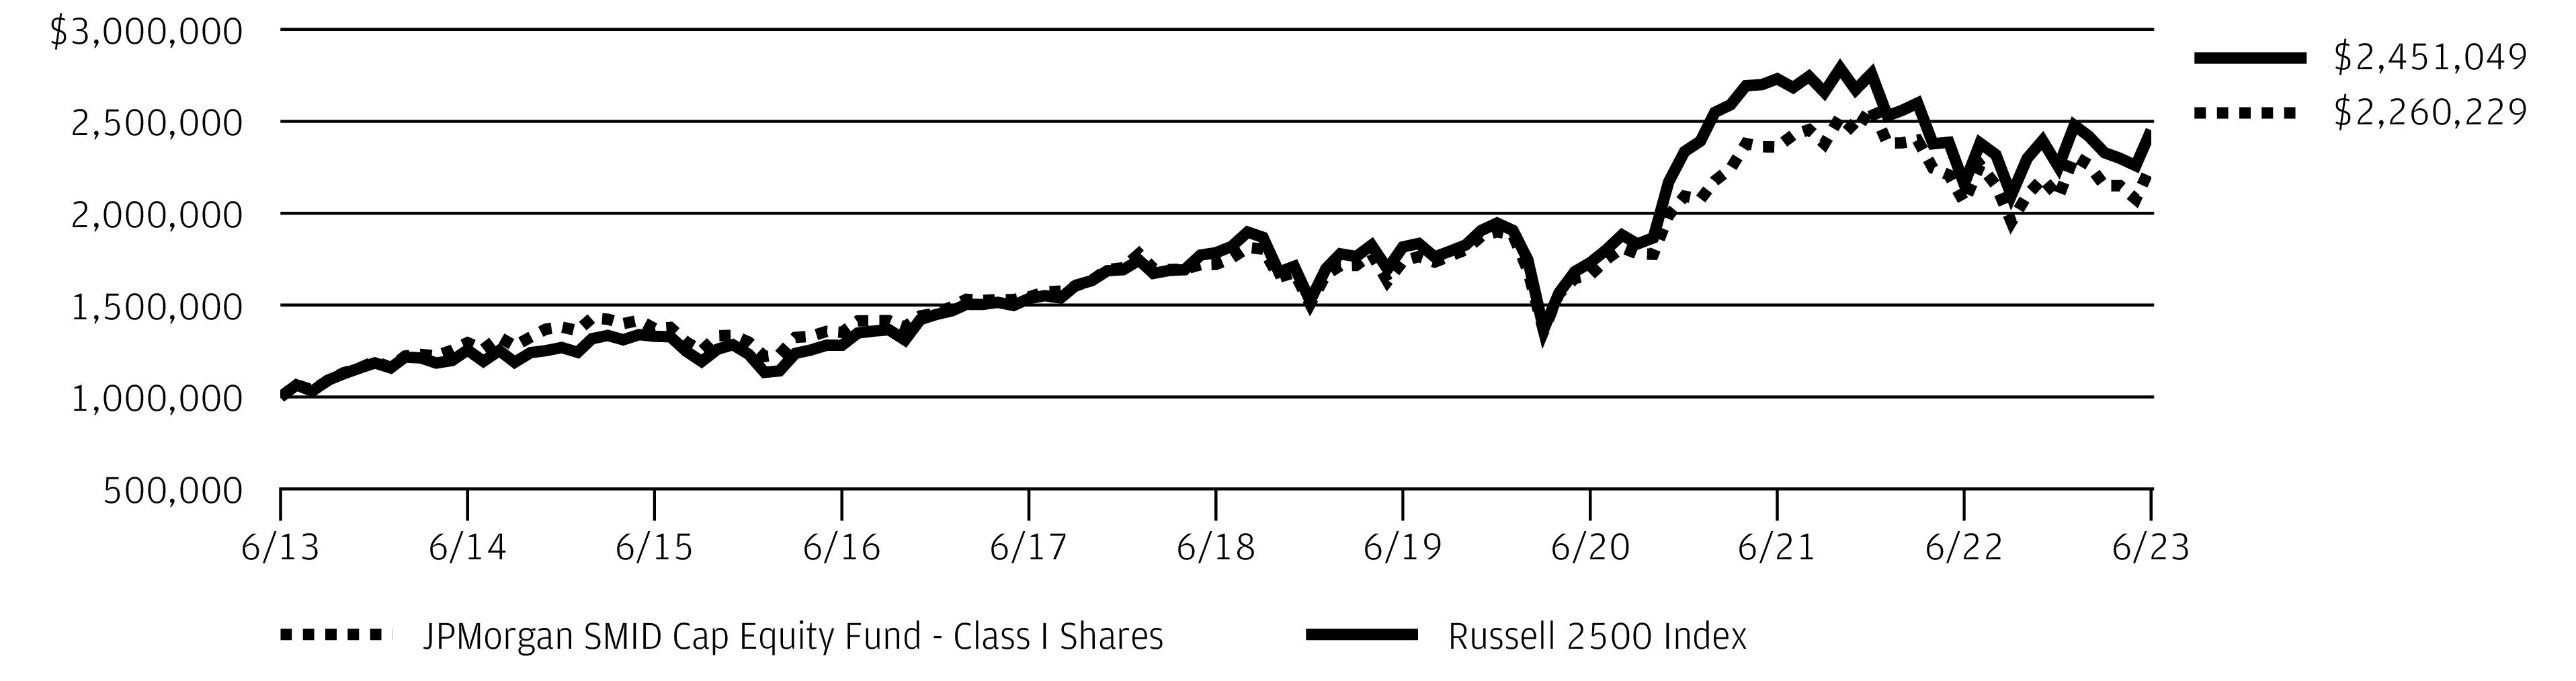
The Fund’s Class I Shares underperformed the Benchmark for the twelve months ended June 30, 2023.
The Fund’s security selection in the financials and health care sectors was a leading detractor from performance relative to the Benchmark, while the Fund’s security selection in the consumer staples sector and its underweight position in the utilities sector were leading contributors to relative performance.
Leading individual detractors from relative performance included the Fund’s out-of-Benchmark position in SVB Financial Group and its overweight positions in Catalent Inc. and Western Alliance Bancorporation. Shares of SVB Financial Group, a diversified banking company commonly known as Silicon Valley Bank, fell ahead of the bank’s collapse in March 2023 and
subsequent takeover by the U.S. Federal Deposit Insurance Corp. Shares of Catalent, a pharmaceuticals maker, fell after the company lowered its 2023 earnings forecast, citing productivity and operational problems. Shares of Western Alliance, a regional bank based in Phoenix, Ariz., fell amid investor concerns about the financial stability of regional banks following the collapse of Silicon Valley Bank.
Leading individual contributors to relative performance included the Fund’s overweight positions in Allegro Microsystems Inc., Lincoln Electric Holdings Inc. and WillScot Mobile Mini Holdings Corp. Shares of Allegro Microsystems, a semiconductor manufacturer, rose amid a broad rally in semiconductor sector stocks in the first half of 2023, and after the company reported better-than-expected earnings and revenue for its fiscal fourth quarter. Shares of Lincoln Electric Holdings, an industrials machinery manufacturer, rose amid consecutive quarters of better-than-expected earnings and revenue during the period. Shares of WillScot Mini Mobile Holdings, a storage and moving company, rose amid consecutive quarters of better-than-expected earnings and revenue, and a $1 billion share repurchase plan.
HOW WAS THE FUND POSITIONED?
The Fund’s portfolio managers employ a fundamental bottom-up investment process that seeks to invest in companies that they believe are undervalued, have leading competitive positions and predictable and durable business models. As a result of this process, the Fund’s largest allocations during the period were to the industrials and financials sectors, while the Fund’s smallest allocations were to
| J.P. Morgan Small Cap Funds | |
*
The return shown is based on net asset values calculated for shareholder transactions and may differ from the return shown in the financial highlights, which reflects adjustments made to the net asset values in accordance with accounting principles generally accepted in the United States of America.
**
The adviser seeks to achieve the Fund’s objective. There can be no guarantee it will be achieved.
the energy and basic materials sectors.
TOP TEN HOLDINGS OF THE
PORTFOLIO AS OF June 30, 2023 | PERCENT OF
TOTAL
INVESTMENTS |
| WillScot Mobile Mini Holdings Corp. | |
| | |
| | |
| | |
| | |
| | |
| | |
| LPL Financial Holdings, Inc. | |
| | |
| | |
PORTFOLIO COMPOSITION BY SECTOR
AS OF June 30, 2023 | PERCENT OF
TOTAL
INVESTMENTS |
| |
| |
| |
| |
| |
| |
| |
| |
| |
Others (each less than 1.0%) | |
| |
| J.P. Morgan Small Cap Funds | |
JPMorgan SMID Cap Equity Fund
FUND COMMENTARY
TWELVE MONTHS ENDED June 30, 2023 (Unaudited) (continued)
AVERAGE ANNUAL TOTAL RETURNS AS OF June 30, 2023
|
| Sales Charge for Class A Shares is 5.25%. |
| Assumes a 1% CDSC (contingent deferred sales charge) for the one year period and 0% CDSC thereafter. |
TEN YEAR FUND PERFORMANCE (6/30/13 TO 6/30/23)
The performance quoted is past performance and is not a guarantee of future results. Mutual funds are subject to certain market risks. Investment returns and principal value of an investment will fluctuate so that an investor’s shares, when redeemed, may be worth more or less than their original cost. Current performance may be higher or lower than the performance data shown. For up-to-date month-end performance information please call 1-800-480-4111.
Returns for Class R3 Shares prior to their inception date are based on the performance of Class A Shares. The actual returns for Class R3 Shares would have been similar to those shown because Class R3 Shares have similar expenses to those of Class A Shares.
Returns for Class R4 and Class R6 Shares prior to their inception dates are based on the performance of Class I Shares. The actual returns for Class R4 Shares would have been similar to those shown for Class I Shares because Class R4 Shares have similar expenses to Class I Shares. The actual returns for Class R6 Shares would have been different than those shown because Class R6 Shares have different expenses than Class I Shares.
The graph illustrates comparative performance for $1,000,000 invested in Class I Shares of the JPMorgan SMID Cap Equity Fund and the Russell 2500 Index from June 30, 2013 to June 30, 2023. The performance of the Fund assumes reinvestment of all dividends and capital gain distributions, if any, and does not include a sales charge. The performance of the Russell 2500 Index does not reflect the deduction of expenses or a sales charge associated with a mutual fund and has been adjusted to reflect reinvestment of all dividends and
capital gain distributions of the securities included in the benchmark, if applicable. The Russell 2500 Index measures the performance of the 2,500 smallest companies in the Russell 3000 Index. Investors cannot invest directly in an index.
Class I Shares have a $1,000,000 minimum initial investment.
Fund performance may reflect the waiver of the Fund’s fees and reimbursement of expenses for certain periods. Without these waivers and reimbursements, performance would have been lower. Also, performance shown in this section does not reflect the deduction of taxes that a shareholder would pay on Fund distributions or on gains resulting from redemptions of Fund shares.
Effective November 1, 2020, the Fund changed its investment strategies. The Fund’s past performance would have been different if the Fund were managed using the current strategies. Past performance is not necessarily an indication of how any class of the Fund will perform in the future.
Because Class C Shares automatically convert to Class A Shares after 8 years, the 10 year average annual total return shown above for Class C reflects Class A performance for the period after conversion.
The returns shown are based on net asset values calculated for shareholder transactions and may differ from the returns shown in the financial highlights, which reflect adjustments made to the net asset values in accordance with accounting principles generally accepted in the United States of America.
| J.P. Morgan Small Cap Funds | |
JPMorgan U.S. Small Company Fund
FUND COMMENTARY
TWELVE MONTHS ENDED June 30, 2023 (Unaudited)
| |
| |
| |
Net Assets as of 6/30/2023 (In Thousands) | |
INVESTMENT OBJECTIVE**
The JPMorgan U.S. Small Company Fund (the “Fund”) seeks to provide high total return from a portfolio of small company stocks.
WHAT WERE THE MAIN DRIVERS OF THE FUND’S PERFORMANCE?
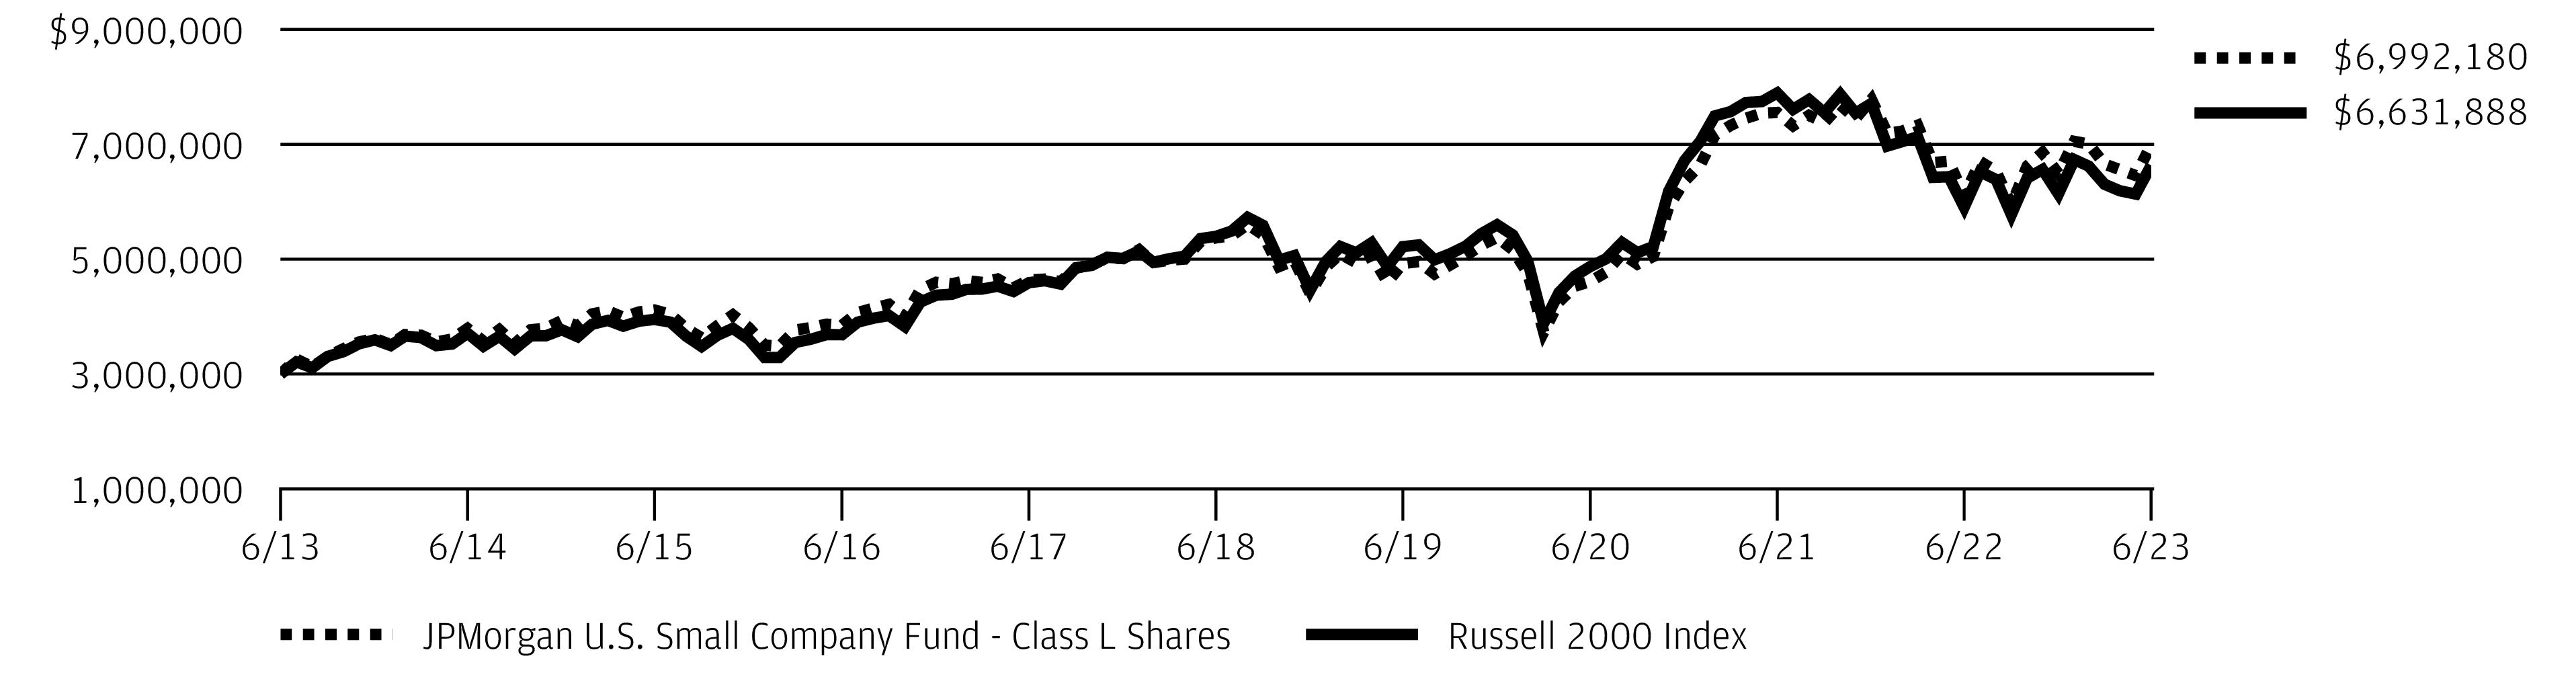
The Fund’s Class L Shares outperformed the Russell 2000 Index (the “Benchmark”) for the twelve months ended June 30, 2023.
The Fund’s security selection in the industrials sectors and consumer discretionary was a leading contributor to performance relative to the Benchmark, while the Fund’s security selection in the information technology and consumer staples sectors was a leading detractor from relative performance.
Leading individual contributors to relative performance included the Fund’s overweight positions in Reata Pharmaceuticals Inc., Catalyst Pharmaceuticals Inc. and Inspire Medical Systems Inc. Shares of Reata Pharmaceuticals, a biopharmaceuticals developer, rose sharply after U.S. Food and Drug Administration approved of the company’s treatment for Friedreich’s ataxia. Shares of Catalyst Pharmaceuticals, a biotechnology developer, rose after the company reported consecutive quarters of better-than-expected earnings and revenue and amid investor expectations that the company would become a takeover target. Shares of Inspire Medical Systems, a medical technology provider, rose after the company reported consecutive quarters of better-than-expected earnings and revenue.
Leading individual detractors from relative performance included the Fund’s overweight positions in CommScope Holding Co., MillerKnoll Inc. and Fate Therapeutics Inc. Shares of CommScope Holding, a communications equipment provider, fell amid consecutive quarters of weaker-than-expected revenue. Shares of MillerKnoll, an office furnishings company also known as Herman Miller, fell in October 2022 after the company issued a weaker-than-expected earnings forecast. Shares of Fate Therapeutics, a developer of immune therapies, fell after the company ended its collaboration agreement with Jansen Biotech Inc.
HOW WAS THE FUND POSITIONED?
In accordance with its investment process, the Fund’s portfolio managers take limited sector bets and construct the Fund so that stock selection is typically the primary driver of the Fund’s performance relative to the Benchmark. The Fund’s portfolio managers use a quantitative ranking methodology to identify stocks in each sector that, in their view, trade at attractive levels. Through bottom-up fundamental research, they seek companies that they believe have attractive valuations, exhibit high earnings quality and have management teams that make effective capital deployment decisions. During the reporting period, the Fund was managed and positioned in accordance
with this investment process.
TOP TEN HOLDINGS OF THE
PORTFOLIO AS OF June 30, 2023 | PERCENT OF
TOTAL
INVESTMENTS |
| Inspire Medical Systems, Inc. | |
| | |
| Taylor Morrison Home Corp. | |
| Beacon Roofing Supply, Inc. | |
| | |
| | |
| Comfort Systems USA, Inc. | |
| WESCO International, Inc. | |
| | |
| | |
PORTFOLIO COMPOSITION BY SECTOR
AS OF June 30, 2023 | PERCENT OF
TOTAL
INVESTMENTS |
| |
| |
| |
| |
| |
| |
| |
| |
| |
| |
| |
| |
| J.P. Morgan Small Cap Funds | |
JPMorgan U.S. Small Company Fund
FUND COMMENTARY
TWELVE MONTHS ENDED June 30, 2023 (Unaudited) (continued)
*
The return shown is based on net asset values calculated for shareholder transactions and may differ from the return shown in the financial highlights, which reflects adjustments made to the net asset values in accordance with accounting principles generally accepted in the United States of America.
**
The adviser seeks to achieve the Fund’s objective. There can be no guarantee it will be achieved.
| J.P. Morgan Small Cap Funds | |
AVERAGE ANNUAL TOTAL RETURNS AS OF June 30, 2023
|
| Sales Charge for Class A Shares is 5.25%. |
| Assumes a 1% CDSC (contingent deferred sales charge) for the one year period and 0% CDSC thereafter. |
TEN YEAR FUND PERFORMANCE (6/30/13 TO 6/30/23)
The performance quoted is past performance and is not a guarantee of future results. Mutual funds are subject to certain market risks. Investment returns and principal value of an investment will fluctuate so that an investor’s shares, when redeemed, may be worth more or less than their original cost. Current performance may be higher or lower than the performance data shown. For up-to-date month-end performance information please call 1-800-480-4111.
Returns for Class R3 Shares prior to their inception date are based on the performance of the Class A Shares. The actual returns for Class R3 Shares would have been similar to those shown because Class R3 Shares have similar expenses to Class A Shares.
Returns for Class R4 Shares prior to their inception date are based on the performance of the Class I Shares. The actual returns for Class R4 Shares would have been similar to those shown because Class R4 Shares have similar expenses to Class I Shares.
Returns for Class R5 Shares prior to their inception date are based on the performance of the Class L Shares. The actual returns of Class R5 Shares would have been similar to those shown because Class R5 Shares have similar expenses to Class L Shares.
The graph illustrates comparative performance for $3,000,000 invested in Class L Shares of the JPMorgan U.S. Small Company Fund and the Russell 2000 Index from June 30, 2013 to June 30, 2023. The performance of the Fund
assumes reinvestment of all dividends and capital gain distributions, if any, and does not include a sales charge. The performance of the Russell 2000 Index does not reflect the deduction of expenses associated with a mutual fund and has been adjusted to reflect reinvestment of all dividends and capital gain distributions of the securities included in the benchmark, if applicable. The Russell 2000 Index is an unmanaged index which measures the performance of the 2000 smallest stocks (on the basis of capitalization) in the Russell 3000 Index. Investors cannot invest directly in an index.
Class L Shares have a $3,000,000 minimum initial investment.
Fund performance may reflect the waiver of the Fund’s fees and reimbursement of expenses for certain periods. Without these waivers and reimbursements, performance would have been lower. Also, performance shown in this section does not reflect the deduction of taxes that a shareholder would pay on Fund distributions or on gains resulting from redemptions of Fund shares.
Because Class C Shares automatically convert to Class A Shares after 8 years, the 10 year average annual total return shown above for Class C reflects Class A performance for the period after conversion.
The returns shown are based on net asset values calculated for shareholder transactions and may differ from the returns shown in the financial highlights, which reflect adjustments made to the net asset values in accordance with accounting principles generally accepted in the United States of America.
| J.P. Morgan Small Cap Funds | |
JPMorgan Small Cap Blend Fund
SCHEDULE OF PORTFOLIO INVESTMENTS
AS OF June 30, 2023
| | |
|
Aerospace & Defense — 1.2% |
| | |
| | |
| | |
| | |
Automobile Components — 1.0% |
Atmus Filtration Technologies, Inc. * (a) | | |
Fox Factory Holding Corp. * | | |
| | |
| | |
| | |
|
Winnebago Industries, Inc. (a) | | |
|
| | |
| | |
| | |
Columbia Banking System, Inc. | | |
| | |
First Commonwealth Financial Corp. | | |
First Financial Bankshares, Inc. | | |
| | |
| | |
| | |
| | |
| | |
| | |
Pinnacle Financial Partners, Inc. | | |
| | |
Simmons First National Corp., Class A | | |
| | |
| | |
| | |
| | |
|
| | |
|
| | |
ADC Therapeutics SA (Switzerland) * (a) | | |
Agios Pharmaceuticals, Inc. * | | |
| | |
Allogene Therapeutics, Inc. * (a) | | |
| | |
|
Biotechnology — continued |
Amicus Therapeutics, Inc. * | | |
Apellis Pharmaceuticals, Inc. * | | |
Arrowhead Pharmaceuticals, Inc. * | | |
Atara Biotherapeutics, Inc. * | | |
Blueprint Medicines Corp. * | | |
Coherus Biosciences, Inc. * | | |
| | |
Halozyme Therapeutics, Inc. * | | |
Heron Therapeutics, Inc. * (a) | | |
| | |
PMV Pharmaceuticals, Inc. * (a) | | |
| | |
Relay Therapeutics, Inc. * | | |
REVOLUTION Medicines, Inc. * | | |
Sage Therapeutics, Inc. * | | |
Twist Bioscience Corp. * (a) | | |
Verve Therapeutics, Inc. * | | |
| | |
|
Global-e Online Ltd. (Israel) * | | |
|
| | |
Advanced Drainage Systems, Inc. | | |
| | |
| | |
| | |
Simpson Manufacturing Co., Inc. | | |
| | |
| | |
|
Donnelley Financial Solutions, Inc. * | | |
| | |
Hamilton Lane, Inc., Class A | | |
LPL Financial Holdings, Inc. | | |
Virtus Investment Partners, Inc. | | |
| | |
|
| | |
Diversey Holdings Ltd. * (a) | | |
| | |
| | |
SEE NOTES TO FINANCIAL STATEMENTS.
| J.P. Morgan Small Cap Funds | |
| | |
Common Stocks — continued |
|
| | |
| | |
| | |
Commercial Services & Supplies — 2.5% |
ACV Auctions, Inc., Class A * | | |
| | |
Casella Waste Systems, Inc., Class A * | | |
| | |
| | |
Communications Equipment — 0.5% |
| | |
| | |
| | |
Construction & Engineering — 2.2% |
Comfort Systems USA, Inc. | | |
| | |
| | |
| | |
| | |
Consumer Staples Distribution & Retail — 0.9% |
Chefs' Warehouse, Inc. (The) * | | |
Grocery Outlet Holding Corp. * | | |
Performance Food Group Co. * | | |
| | |
Diversified Consumer Services — 0.4% |
Bright Horizons Family Solutions, Inc. * | | |
Diversified Telecommunication Services — 0.2% |
Iridium Communications, Inc. | | |
Electric Utilities — 0.4% |
Portland General Electric Co. | | |
Electrical Equipment — 1.5% |
Bloom Energy Corp., Class A * (a) | | |
NEXTracker, Inc., Class A * (a) | | |
Shoals Technologies Group, Inc., Class A * | | |
| | |
Electronic Equipment, Instruments & Components — 2.6% |
| | |
Insight Enterprises, Inc. * | | |
| | |
| | |
| | |
|
Electronic Equipment, Instruments & Components — continued |
| | |
| | |
Vishay Intertechnology, Inc. | | |
| | |
Energy Equipment & Services — 1.9% |
| | |
| | |
| | |
TechnipFMC plc (United Kingdom) * | | |
| | |
Financial Services — 1.9% |
| | |
PennyMac Financial Services, Inc. | | |
| | |
| | |
| | |
|
| | |
| | |
| | |
| | |
|
Chesapeake Utilities Corp. | | |
| | |
Southwest Gas Holdings, Inc. | | |
| | |
Ground Transportation — 1.2% |
| | |
| | |
| | |
Health Care Equipment & Supplies — 3.2% |
| | |
Establishment Labs Holdings, Inc. (Costa Rica) * (a) | | |
| | |
iRhythm Technologies, Inc. * | | |
| | |
Shockwave Medical, Inc. * | | |
Utah Medical Products, Inc. | | |
| | |
SEE NOTES TO FINANCIAL STATEMENTS.
| J.P. Morgan Small Cap Funds | |
JPMorgan Small Cap Blend Fund
SCHEDULE OF PORTFOLIO INVESTMENTS
AS OF June 30, 2023 (continued)
| | |
Common Stocks — continued |
Health Care Providers & Services — 3.6% |
Acadia Healthcare Co., Inc. * | | |
| | |
| | |
| | |
| | |
| | |
| | |
| | |
| | |
Health Care Technology — 0.7% |
Evolent Health, Inc., Class A * | | |
Hotel & Resort REITs — 0.5% |
| | |
Sunstone Hotel Investors, Inc. | | |
| | |
Hotels, Restaurants & Leisure — 4.1% |
Bloomin' Brands, Inc. (a) | | |
| | |
| | |
| | |
| | |
Life Time Group Holdings, Inc. * | | |
Marriott Vacations Worldwide Corp. | | |
Papa John's International, Inc. | | |
Planet Fitness, Inc., Class A * | | |
Six Flags Entertainment Corp. * | | |
| | |
| | |
Household Durables — 1.4% |
| | |
| | |
| | |
| | |
| | |
| | |
|
Plymouth Industrial REIT, Inc. | | |
Rexford Industrial Realty, Inc. | | |
| | |
| | |
| | |
|
|
Kinsale Capital Group, Inc. | | |
Safety Insurance Group, Inc. | | |
Selective Insurance Group, Inc. | | |
| | |
Interactive Media & Services — 0.8% |
| | |
| | |
| | |
|
DigitalOcean Holdings, Inc. * (a) | | |
| | |
| | |
Life Sciences Tools & Services — 0.0% ^ |
| | |
|
| | |
Chart Industries, Inc. * (a) | | |
| | |
| | |
John Bean Technologies Corp. | | |
| | |
Lincoln Electric Holdings, Inc. | | |
| | |
Watts Water Technologies, Inc., Class A | | |
| | |
|
| | |
John Wiley & Sons, Inc., Class A | | |
| | |
Mortgage Real Estate Investment Trusts (REITs) — 0.2% |
| | |
|
| | |
|
| | |
Highwoods Properties, Inc. | | |
| | |
Oil, Gas & Consumable Fuels — 2.2% |
| | |
| | |
SEE NOTES TO FINANCIAL STATEMENTS.
| J.P. Morgan Small Cap Funds | |
| | |
Common Stocks — continued |
Oil, Gas & Consumable Fuels — continued |
| | |
| | |
| | |
| | |
Personal Care Products — 1.4% |
Edgewell Personal Care Co. | | |
| | |
| | |
| | |
|
| | |
Intra-Cellular Therapies, Inc. * | | |
Prestige Consumer Healthcare, Inc. * | | |
Revance Therapeutics, Inc. * | | |
| | |
Professional Services — 1.8% |
| | |
ExlService Holdings, Inc. * | | |
| | |
| | |
| | |
|
American Homes 4 Rent, Class A | | |
| | |
| | |
|
| | |
| | |
| | |
Semiconductors & Semiconductor Equipment — 2.8% |
Allegro MicroSystems, Inc. (Japan) * | | |
| | |
| | |
Credo Technology Group Holding Ltd. * | | |
MKS Instruments, Inc. (a) | | |
| | |
| | |
| | |
| | |
| | |
|
|
| | |
| | |
Clear Secure, Inc., Class A (a) | | |
Confluent, Inc., Class A * | | |
| | |
| | |
| | |
| | |
| | |
| | |
HashiCorp, Inc., Class A * | | |
| | |
| | |
SentinelOne, Inc., Class A * (a) | | |
Smartsheet, Inc., Class A * | | |
| | |
| | |
|
| | |
| | |
| | |
|
Burlington Stores, Inc. * | | |
Floor & Decor Holdings, Inc., Class A * (a) | | |
| | |
Lithia Motors, Inc., Class A | | |
National Vision Holdings, Inc. * | | |
Petco Health & Wellness Co., Inc. * (a) | | |
| | |
| | |
Technology Hardware, Storage & Peripherals — 1.0% |
Super Micro Computer, Inc. * | | |
Textiles, Apparel & Luxury Goods — 1.3% |
| | |
| | |
| | |
| | |
| | |
Trading Companies & Distributors — 4.4% |
| | |
Applied Industrial Technologies, Inc. | | |
SEE NOTES TO FINANCIAL STATEMENTS.
| J.P. Morgan Small Cap Funds | |
JPMorgan Small Cap Blend Fund
SCHEDULE OF PORTFOLIO INVESTMENTS
AS OF June 30, 2023 (continued)
| | |
Common Stocks — continued |
Trading Companies & Distributors — continued |
Beacon Roofing Supply, Inc. * | | |
| | |
Rush Enterprises, Inc., Class A | | |
SiteOne Landscape Supply, Inc. * | | |
WESCO International, Inc. | | |
| | |
|
American States Water Co. | | |
Total Common Stocks
(Cost $1,115,222) | | |
Short-Term Investments — 6.2% |
Investment Companies — 2.3% |
JPMorgan Prime Money Market Fund Class IM Shares, 5.23% (b) (c)
(Cost $29,695) | | |
Investment of Cash Collateral from Securities Loaned — 3.9% |
JPMorgan Securities Lending Money Market Fund Agency SL Class Shares, 5.29% (b) (c) | | |
JPMorgan U.S. Government Money Market Fund Class IM Shares, 5.05% (b) (c) | | |
Total Investment of Cash Collateral from Securities Loaned
(Cost $50,734) | | |
Total Short-Term Investments
(Cost $80,429) | | |
Total Investments — 103.9%
(Cost $1,195,651) | | |
Liabilities in Excess of Other Assets — (3.9)% | | |
| | |
Percentages indicated are based on net assets. |
| |
| Real Estate Investment Trust |
| Amount rounds to less than 0.1% of net assets. |
| Non-income producing security. | |
| The security or a portion of this security is on loan at June 30, 2023. The total value of securities on loan at June 30, 2023 is $49,439. | |
| Investment in an affiliated fund, which is registered under the Investment Company Act of 1940, as amended, and is advised by J.P. Morgan Investment Management Inc. | |
| The rate shown is the current yield as of June 30, 2023. | |
SEE NOTES TO FINANCIAL STATEMENTS.
| J.P. Morgan Small Cap Funds | |
JPMorgan Small Cap Equity Fund
SCHEDULE OF PORTFOLIO INVESTMENTS
AS OF June 30, 2023
| | |
|
Aerospace & Defense — 0.9% |
| | |
Automobile Components — 1.0% |
| | |
|
| | |
Commerce Bancshares, Inc. (a) | | |
Cullen/Frost Bankers, Inc. (a) | | |
| | |
| | |
First Interstate BancSystem, Inc., Class A | | |
ServisFirst Bancshares, Inc. (a) | | |
| | |
| | |
|
| | |
|
| | |
| | |
Simpson Manufacturing Co., Inc. | | |
| | |
|
AssetMark Financial Holdings, Inc. * | | |
| | |
Moelis & Co., Class A (a) | | |
| | |
StepStone Group, Inc., Class A | | |
| | |
|
Axalta Coating Systems Ltd. * | | |
Perimeter Solutions SA * (a) | | |
| | |
| | |
Commercial Services & Supplies — 8.4% |
| | |
Casella Waste Systems, Inc., Class A * | | |
Driven Brands Holdings, Inc. * | | |
| | |
RB Global, Inc. (Canada) (a) | | |
| | |
|
Commercial Services & Supplies — continued |
| | |
| | |
| | |
Construction & Engineering — 1.7% |
WillScot Mobile Mini Holdings Corp. * | | |
Consumer Staples Distribution & Retail — 3.6% |
BJ's Wholesale Club Holdings, Inc. * | | |
Casey's General Stores, Inc. | | |
Performance Food Group Co. * | | |
| | |
Containers & Packaging — 1.4% |
| | |
Diversified Consumer Services — 1.4% |
Bright Horizons Family Solutions, Inc. * | | |
Electric Utilities — 1.2% |
Portland General Electric Co. | | |
Electrical Equipment — 1.1% |
| | |
Shoals Technologies Group, Inc., Class A * | | |
| | |
Electronic Equipment, Instruments & Components — 3.4% |
| | |
| | |
| | |
| | |
| | |
Financial Services — 1.4% |
| | |
|
| | |
| | |
| | |
Ground Transportation — 2.4% |
Knight-Swift Transportation Holdings, Inc. | | |
| | |
| | |
| | |
Health Care Equipment & Supplies — 3.9% |
Envista Holdings Corp. * (a) | | |
SEE NOTES TO FINANCIAL STATEMENTS.
| J.P. Morgan Small Cap Funds | |
JPMorgan Small Cap Equity Fund
SCHEDULE OF PORTFOLIO INVESTMENTS
AS OF June 30, 2023 (continued)
| | |
Common Stocks — continued |
Health Care Equipment & Supplies — continued |
| | |
| | |
| | |
| | |
Health Care Providers & Services — 6.1% |
| | |
| | |
| | |
| | |
| | |
| | |
Health Care Technology — 1.3% |
| | |
Definitive Healthcare Corp. * (a) | | |
| | |
Hotel & Resort REITs — 1.1% |
Ryman Hospitality Properties, Inc. | | |
Hotels, Restaurants & Leisure — 3.0% |
Monarch Casino & Resort, Inc. | | |
Planet Fitness, Inc., Class A * | | |
| | |
| | |
|
EastGroup Properties, Inc. | | |
|
Kinsale Capital Group, Inc. | | |
| | |
| | |
|
Acushnet Holdings Corp. (a) | | |
| | |
| | |
Life Sciences Tools & Services — 0.9% |
| | |
| | |
| | |
|
| | |
Gates Industrial Corp. plc * | | |
| | |
|
|
Hillman Solutions Corp. * | | |
Lincoln Electric Holdings, Inc. (a) | | |
| | |
| | |
| | |
|
| | |
Oil, Gas & Consumable Fuels — 0.8% |
| | |
Passenger Airlines — 0.8% |
| | |
Professional Services — 2.7% |
| | |
| | |
| | |
| | |
Real Estate Management & Development — 0.7% |
Cushman & Wakefield plc * | | |
|
| | |
Semiconductors & Semiconductor Equipment — 3.8% |
Allegro MicroSystems, Inc. (Japan) * | | |
MACOM Technology Solutions Holdings, Inc. * | | |
| | |
| | |
|
Clearwater Analytics Holdings, Inc., Class A * (a) | | |
| | |
Guidewire Software, Inc. * | | |
| | |
| | |
| | |
| | |
|
| | |
| | |
| | |
|
| | |
SEE NOTES TO FINANCIAL STATEMENTS.
| J.P. Morgan Small Cap Funds | |
| | |
Common Stocks — continued |
Specialty Retail — continued |
National Vision Holdings, Inc. * | | |
Savers Value Village, Inc. * | | |
| | |
Textiles, Apparel & Luxury Goods — 0.7% |
| | |
Trading Companies & Distributors — 1.7% |
Applied Industrial Technologies, Inc. | | |
Core & Main, Inc., Class A * (a) | | |
| | |
Total Common Stocks
(Cost $4,290,909) | | |
Short-Term Investments — 8.1% |
Investment Companies — 2.8% |
JPMorgan Prime Money Market Fund Class IM Shares, 5.23% (b) (c)
(Cost $162,010) | | |
Investment of Cash Collateral from Securities Loaned — 5.3% |
JPMorgan Securities Lending Money Market Fund Agency SL Class Shares, 5.29% (b) (c) | | |
JPMorgan U.S. Government Money Market Fund Class IM Shares, 5.05% (b) (c) | | |
Total Investment of Cash Collateral from Securities Loaned
(Cost $309,031) | | |
Total Short-Term Investments
(Cost $471,041) | | |
Total Investments — 105.1%
(Cost $4,761,950) | | |
Liabilities in Excess of Other Assets — (5.1)% | | |
| | |
Percentages indicated are based on net assets. |
| |
| Real Estate Investment Trust |
| Non-income producing security. |
| The security or a portion of this security is on loan at June 30, 2023. The total value of securities on loan at June 30, 2023 is $301,326. |
| Investment in an affiliated fund, which is registered under the Investment Company Act of 1940, as amended, and is advised by J.P. Morgan Investment Management Inc. |
| The rate shown is the current yield as of June 30, 2023. |
SEE NOTES TO FINANCIAL STATEMENTS.
| J.P. Morgan Small Cap Funds | |
JPMorgan Small Cap Growth Fund
SCHEDULE OF PORTFOLIO INVESTMENTS
AS OF June 30, 2023
| | |
|
Aerospace & Defense — 1.3% |
| | |
Automobile Components — 1.2% |
Fox Factory Holding Corp. * | | |
| | |
| | |
|
Winnebago Industries, Inc. (a) | | |
|
First Financial Bankshares, Inc. | | |
Pinnacle Financial Partners, Inc. | | |
| | |
|
| | |
ADC Therapeutics SA (Switzerland) * (a) | | |
Agios Pharmaceuticals, Inc. * | | |
| | |
Allogene Therapeutics, Inc. * (a) | | |
Amicus Therapeutics, Inc. * | | |
Apellis Pharmaceuticals, Inc. * | | |
Arrowhead Pharmaceuticals, Inc. * | | |
Atara Biotherapeutics, Inc. * | | |
Blueprint Medicines Corp. * | | |
Coherus Biosciences, Inc. * (a) | | |
| | |
Halozyme Therapeutics, Inc. * | | |
Heron Therapeutics, Inc. * (a) | | |
| | |
PMV Pharmaceuticals, Inc. * (a) | | |
| | |
Relay Therapeutics, Inc. * | | |
REVOLUTION Medicines, Inc. * | | |
Sage Therapeutics, Inc. * | | |
| | |
Verve Therapeutics, Inc. * (a) | | |
| | |
|
Global-e Online Ltd. (Israel) * | | |
|
| | |
| | |
|
Building Products — continued |
Advanced Drainage Systems, Inc. | | |
Simpson Manufacturing Co., Inc. | | |
| | |
|
| | |
Hamilton Lane, Inc., Class A | | |
| | |
Commercial Services & Supplies — 4.1% |
ACV Auctions, Inc., Class A * | | |
Casella Waste Systems, Inc., Class A * | | |
| | |
| | |
Communications Equipment — 0.3% |
| | |
Construction & Engineering — 3.0% |
| | |
| | |
| | |
| | |
Consumer Staples Distribution & Retail — 1.8% |
Chefs' Warehouse, Inc. (The) * | | |
Grocery Outlet Holding Corp. * | | |
Performance Food Group Co. * | | |
| | |
Diversified Consumer Services — 0.8% |
Bright Horizons Family Solutions, Inc. * | | |
Electrical Equipment — 3.0% |
Bloom Energy Corp., Class A * (a) | | |
NEXTracker, Inc., Class A * (a) | | |
Shoals Technologies Group, Inc., Class A * | | |
| | |
Electronic Equipment, Instruments & Components — 0.6% |
| | |
Energy Equipment & Services — 2.4% |
| | |
TechnipFMC plc (United Kingdom) * | | |
| | |
SEE NOTES TO FINANCIAL STATEMENTS.
| J.P. Morgan Small Cap Funds | |
| | |
Common Stocks — continued |
Financial Services — 1.6% |
| | |
| | |
| | |
|
| | |
Ground Transportation — 1.2% |
| | |
Health Care Equipment & Supplies — 5.5% |
| | |
Establishment Labs Holdings, Inc. (Costa Rica) * (a) | | |
| | |
iRhythm Technologies, Inc. * | | |
| | |
Shockwave Medical, Inc. * | | |
| | |
Health Care Providers & Services — 2.5% |
Acadia Healthcare Co., Inc. * | | |
| | |
| | |
| | |
| | |
Health Care Technology — 1.5% |
Evolent Health, Inc., Class A * | | |
Hotels, Restaurants & Leisure — 6.3% |
| | |
| | |
Life Time Group Holdings, Inc. * (a) | | |
Marriott Vacations Worldwide Corp. | | |
Papa John's International, Inc. | | |
Planet Fitness, Inc., Class A * | | |
Six Flags Entertainment Corp. * | | |
| | |
| | |
Household Durables — 1.2% |
| | |
| | |
| | |
|
| | |
| | |
|
|
Kinsale Capital Group, Inc. | | |
|
DigitalOcean Holdings, Inc. * (a) | | |
| | |
| | |
Life Sciences Tools & Services — 0.1% |
| | |
|
Chart Industries, Inc. * (a) | | |
| | |
John Bean Technologies Corp. | | |
| | |
Oil, Gas & Consumable Fuels — 2.0% |
| | |
| | |
| | |
| | |
Personal Care Products — 1.0% |
| | |
|
| | |
Intra-Cellular Therapies, Inc. * | | |
Revance Therapeutics, Inc. * | | |
| | |
Professional Services — 2.9% |
ExlService Holdings, Inc. * | | |
| | |
| | |
| | |
Semiconductors & Semiconductor Equipment — 3.9% |
Allegro MicroSystems, Inc. (Japan) * | | |
Credo Technology Group Holding Ltd. * (a) | | |
MKS Instruments, Inc. (a) | | |
| | |
| | |
| | |
|
| | |
| | |
Clear Secure, Inc., Class A (a) | | |
SEE NOTES TO FINANCIAL STATEMENTS.
| J.P. Morgan Small Cap Funds | |
JPMorgan Small Cap Growth Fund
SCHEDULE OF PORTFOLIO INVESTMENTS
AS OF June 30, 2023 (continued)
| | |
Common Stocks — continued |
|
Confluent, Inc., Class A * | | |
| | |
| | |
| | |
| | |
| | |
Gitlab, Inc., Class A * (a) | | |
HashiCorp, Inc., Class A * | | |
| | |
| | |
SentinelOne, Inc., Class A * (a) | | |
Smartsheet, Inc., Class A * | | |
| | |
| | |
|
| | |
|
Burlington Stores, Inc. * | | |
Floor & Decor Holdings, Inc., Class A * (a) | | |
Lithia Motors, Inc., Class A (a) | | |
National Vision Holdings, Inc. * (a) | | |
Petco Health & Wellness Co., Inc. * (a) | | |
| | |
Technology Hardware, Storage & Peripherals — 1.9% |
Super Micro Computer, Inc. * | | |
Trading Companies & Distributors — 5.5% |
| | |
Applied Industrial Technologies, Inc. | | |
Rush Enterprises, Inc., Class A | | |
SiteOne Landscape Supply, Inc. * (a) | | |
WESCO International, Inc. | | |
| | |
Total Common Stocks
(Cost $3,498,393) | | |
| | |
Short-Term Investments — 8.7% |
Investment Companies — 1.5% |
JPMorgan Prime Money Market Fund Class IM Shares, 5.23% (b) (c)
(Cost $62,311) | | |
Investment of Cash Collateral from Securities Loaned — 7.2% |
JPMorgan Securities Lending Money Market Fund Agency SL Class Shares, 5.29% (b) (c) | | |
JPMorgan U.S. Government Money Market Fund Class IM Shares, 5.05% (b) (c) | | |
Total Investment of Cash Collateral from Securities Loaned
(Cost $286,978) | | |
Total Short-Term Investments
(Cost $349,289) | | |
Total Investments — 108.1%
(Cost $3,847,682) | | |
Liabilities in Excess of Other Assets — (8.1)% | | |
| | |
Percentages indicated are based on net assets. |
| |
| Real Estate Investment Trust |
| Non-income producing security. |
| The security or a portion of this security is on loan at June 30, 2023. The total value of securities on loan at June 30, 2023 is $280,844. |
| Investment in an affiliated fund, which is registered under the Investment Company Act of 1940, as amended, and is advised by J.P. Morgan Investment Management Inc. |
| The rate shown is the current yield as of June 30, 2023. |
SEE NOTES TO FINANCIAL STATEMENTS.
| J.P. Morgan Small Cap Funds | |
JPMorgan Small Cap Sustainable Leaders Fund
SCHEDULE OF PORTFOLIO INVESTMENTS
AS OF June 30, 2023
| | |
|
Automobile Components — 2.5% |
| | |
|
Amalgamated Financial Corp. | | |
| | |
| | |
| | |
| | |
|
Apellis Pharmaceuticals, Inc. * | | |
Fate Therapeutics, Inc. * | | |
Halozyme Therapeutics, Inc. * | | |
| | |
Sarepta Therapeutics, Inc. * | | |
| | |
|
| | |
Advanced Drainage Systems, Inc. | | |
| | |
| | |
|
| | |
|
| | |
Commercial Services & Supplies — 4.1% |
| | |
| | |
| | |
| | |
| | |
Consumer Staples Distribution & Retail — 2.3% |
Sprouts Farmers Market, Inc. * | | |
United Natural Foods, Inc. * | | |
| | |
Diversified Consumer Services — 0.8% |
| | |
|
Alexander & Baldwin, Inc. | | |
Electric Utilities — 2.0% |
Portland General Electric Co. | | |
| | |
|
Electrical Equipment — 2.7% |
| | |
Bloom Energy Corp., Class A * | | |
| | |
| | |
NEXTracker, Inc., Class A * | | |
| | |
| | |
Electronic Equipment, Instruments & Components — 4.1% |
| | |
| | |
| | |
|
| | |
Darling Ingredients, Inc. * | | |
| | |
| | |
Health Care Equipment & Supplies — 2.0% |
Shockwave Medical, Inc. * | | |
Health Care Providers & Services — 5.8% |
AMN Healthcare Services, Inc. * | | |
| | |
| | |
| | |
| | |
Health Care Technology — 2.6% |
| | |
| | |
| | |
Hotels, Restaurants & Leisure — 0.2% |
Sweetgreen, Inc., Class A * | | |
Household Durables — 3.7% |
| | |
| | |
| | |
Independent Power and Renewable Electricity Producers — 0.2% |
Sunnova Energy International, Inc. * | | |
|
Rexford Industrial Realty, Inc. | | |
SEE NOTES TO FINANCIAL STATEMENTS.
| J.P. Morgan Small Cap Funds | |
JPMorgan Small Cap Sustainable Leaders Fund
SCHEDULE OF PORTFOLIO INVESTMENTS
AS OF June 30, 2023 (continued)
| | |
Common Stocks — continued |
|
CNO Financial Group, Inc. | | |
| | |
| | |
Interactive Media & Services — 2.2% |
| | |
| | |
| | |
Life Sciences Tools & Services — 0.5% |
| | |
Singular Genomics Systems, Inc. * | | |
| | |
|
| | |
| | |
| | |
|
| | |
| | |
Schnitzer Steel Industries, Inc., Class A | | |
| | |
Mortgage Real Estate Investment Trusts (REITs) — 1.1% |
Hannon Armstrong Sustainable Infrastructure Capital, Inc. | | |
|
Hudson Pacific Properties, Inc. | | |
| | |
| | |
| | |
Oil, Gas & Consumable Fuels — 0.6% |
Clean Energy Fuels Corp. * | | |
Personal Care Products — 0.1% |
| | |
Professional Services — 4.8% |
Huron Consulting Group, Inc. * | | |
| | |
| | |
Real Estate Management & Development — 0.7% |
Cushman & Wakefield plc * | | |
| | |
|
Semiconductors & Semiconductor Equipment — 2.8% |
| | |
| | |
| | |
|
| | |
| | |
| | |
| | |
| | |
|
| | |
|
Rent the Runway, Inc., Class A * | | |
| | |
Warby Parker, Inc., Class A * | | |
| | |
Textiles, Apparel & Luxury Goods — 6.6% |
Allbirds, Inc., Class A * | | |
| | |
| | |
| | |
| | |
| | |
Trading Companies & Distributors — 3.0% |
WESCO International, Inc. | | |
|
American States Water Co. | | |
Total Common Stocks
(Cost $63,179) | | |
| | |
|
|
Contra Aduro Biotech I ‡ *
(Cost $108) | | |
SEE NOTES TO FINANCIAL STATEMENTS.
| J.P. Morgan Small Cap Funds | |
| | |
Short-Term Investments — 1.6% |
Investment Companies — 1.6% |
JPMorgan Prime Money Market Fund Class IM Shares, 5.23% (a) (b)
(Cost $906) | | |
Total Investments — 100.6%
(Cost $64,193) | | |
Liabilities in Excess of Other Assets — (0.6)% | | |
| | |
Percentages indicated are based on net assets. |
Amounts presented as a dash ("-") represent amounts that round to less than a thousand. |
| |
| Real Estate Investment Trust |
| Amount rounds to less than 0.1% of net assets. |
| Value determined using significant unobservable inputs. | |
| Non-income producing security. | |
| Investment in an affiliated fund, which is registered under the Investment Company Act of 1940, as amended, and is advised by J.P. Morgan Investment Management Inc. | |
| The rate shown is the current yield as of June 30, 2023. | |
SEE NOTES TO FINANCIAL STATEMENTS.
| J.P. Morgan Small Cap Funds | |
JPMorgan Small Cap Value Fund
SCHEDULE OF PORTFOLIO INVESTMENTS
AS OF June 30, 2023
| | |
|
Aerospace & Defense — 0.2% |
| | |
Air Freight & Logistics — 0.7% |
Hub Group, Inc., Class A * | | |
Radiant Logistics, Inc. * | | |
| | |
Automobile Components — 0.1% |
| | |
|
| | |
| | |
| | |
| | |
| | |
Bank of NT Butterfield & Son Ltd. (The) (Bermuda) | | |
| | |
| | |
Business First Bancshares, Inc. | | |
| | |
| | |
Capital City Bank Group, Inc. | | |
Capstar Financial Holdings, Inc. | | |
| | |
Central Pacific Financial Corp. | | |
Columbia Banking System, Inc. | | |
Community Trust Bancorp, Inc. | | |
| | |
Customers Bancorp, Inc. * | | |
| | |
| | |
Enterprise Financial Services Corp. | | |
Equity Bancshares, Inc., Class A | | |
Financial Institutions, Inc. | | |
| | |
First BanCorp (Puerto Rico) | | |
First Bancshares, Inc. (The) | | |
First Citizens BancShares, Inc., Class A | | |
First Commonwealth Financial Corp. | | |
| | |
| | |
First Interstate BancSystem, Inc., Class A | | |
| | |
| | |
| | |
|
|
| | |
| | |
| | |
| | |
HomeTrust Bancshares, Inc. | | |
| | |
| | |
| | |
| | |
Midland States Bancorp, Inc. | | |
| | |
National Bank Holdings Corp., Class A | | |
OceanFirst Financial Corp. | | |
OFG Bancorp (Puerto Rico) | | |
| | |
| | |
Orrstown Financial Services, Inc. | | |
| | |
Peapack-Gladstone Financial Corp. | | |
| | |
Pinnacle Financial Partners, Inc. | | |
Popular, Inc. (Puerto Rico) | | |
| | |
| | |
| | |
Seacoast Banking Corp. of Florida | | |
| | |
| | |
South Plains Financial, Inc. | | |
Southside Bancshares, Inc. | | |
| | |
| | |
| | |
United Community Banks, Inc. | | |
| | |
| | |
| | |
| | |
| | |
|
| | |
|
| | |
SEE NOTES TO FINANCIAL STATEMENTS.
| J.P. Morgan Small Cap Funds | |
| | |
Common Stocks — continued |
Biotechnology — continued |
Agios Pharmaceuticals, Inc. * | | |
Akero Therapeutics, Inc. * | | |
Allogene Therapeutics, Inc. * (a) | | |
| | |
| | |
Avidity Biosciences, Inc. * | | |
BioCryst Pharmaceuticals, Inc. * (a) | | |
| | |
| | |
| | |
| | |
Fate Therapeutics, Inc. * | | |
| | |
| | |
Iovance Biotherapeutics, Inc. * | | |
Kezar Life Sciences, Inc. * | | |
Kymera Therapeutics, Inc. * | | |
Lexicon Pharmaceuticals, Inc. * (a) | | |
| | |
Mersana Therapeutics, Inc. * | | |
MoonLake Immunotherapeutics * (a) | | |
Prothena Corp. plc (Ireland) * | | |
Relay Therapeutics, Inc. * | | |
SpringWorks Therapeutics, Inc. * | | |
Syndax Pharmaceuticals, Inc. * | | |
| | |
| | |
| | |
|
Gibraltar Industries, Inc. * | | |
Resideo Technologies, Inc. * | | |
| | |
| | |
|
AssetMark Financial Holdings, Inc. * | | |
| | |
| | |
| | |
Victory Capital Holdings, Inc., Class A | | |
Virtus Investment Partners, Inc. | | |
| | |
| | |
|
|
| | |
| | |
| | |
| | |
Minerals Technologies, Inc. | | |
Sensient Technologies Corp. | | |
| | |
| | |
Commercial Services & Supplies — 0.9% |
| | |
| | |
Heritage-Crystal Clean, Inc. * | | |
| | |
Communications Equipment — 0.3% |
| | |
| | |
| | |
Construction & Engineering — 1.7% |
| | |
| | |
Comfort Systems USA, Inc. | | |
| | |
| | |
| | |
| | |
Construction Materials — 0.1% |
Summit Materials, Inc., Class A * | | |
|
Encore Capital Group, Inc. * | | |
Enova International, Inc. * | | |
| | |
| | |
| | |
| | |
| | |
| | |
Consumer Staples Distribution & Retail — 0.9% |
| | |
BJ's Wholesale Club Holdings, Inc. * | | |
SEE NOTES TO FINANCIAL STATEMENTS.
| J.P. Morgan Small Cap Funds | |
JPMorgan Small Cap Value Fund
SCHEDULE OF PORTFOLIO INVESTMENTS
AS OF June 30, 2023 (continued)
| | |
Common Stocks — continued |
Consumer Staples Distribution & Retail — continued |
Sprouts Farmers Market, Inc. * | | |
United Natural Foods, Inc. * | | |
| | |
Containers & Packaging — 0.3% |
| | |
| | |
| | |
| | |
Diversified Consumer Services — 0.5% |
| | |
Laureate Education, Inc., Class A | | |
| | |
| | |
|
Alexander & Baldwin, Inc. | | |
American Assets Trust, Inc. | | |
Armada Hoffler Properties, Inc. | | |
Broadstone Net Lease, Inc. | | |
Essential Properties Realty Trust, Inc. | | |
| | |
Diversified Telecommunication Services — 0.7% |
| | |
EchoStar Corp., Class A * | | |
Liberty Latin America Ltd., Class A (Puerto Rico) * | | |
Liberty Latin America Ltd., Class C (Puerto Rico) * (a) | | |
| | |
Electric Utilities — 1.4% |
| | |
| | |
Portland General Electric Co. | | |
| | |
Electrical Equipment — 1.2% |
| | |
| | |
| | |
Electronic Equipment, Instruments & Components — 1.9% |
| | |
Benchmark Electronics, Inc. | | |
| | |
| | |
|
Electronic Equipment, Instruments & Components — continued |
| | |
| | |
| | |
Energy Equipment & Services — 1.8% |
| | |
Expro Group Holdings NV * | | |
| | |
| | |
NexTier Oilfield Solutions, Inc. * | | |
| | |
Oil States International, Inc. * | | |
Patterson-UTI Energy, Inc. | | |
Select Water Solutions, Inc. | | |
| | |
Financial Services — 4.5% |
| | |
Jackson Financial, Inc., Class A | | |
| | |
| | |
NMI Holdings, Inc., Class A * | | |
PennyMac Financial Services, Inc. | | |
| | |
| | |
StoneCo Ltd., Class A (Brazil) * (a) | | |
Waterstone Financial, Inc. | | |
| | |
|
Darling Ingredients, Inc. * | | |
| | |
John B Sanfilippo & Son, Inc. | | |
| | |
|
Chesapeake Utilities Corp. | | |
New Jersey Resources Corp. | | |
Northwest Natural Holding Co. | | |
| | |
Southwest Gas Holdings, Inc. | | |
| | |
| | |
Ground Transportation — 0.6% |
| | |
SEE NOTES TO FINANCIAL STATEMENTS.
| J.P. Morgan Small Cap Funds | |
| | |
Common Stocks — continued |
Health Care Equipment & Supplies — 1.7% |
Alphatec Holdings, Inc. * | | |
| | |
| | |
| | |
| | |
Health Care Providers & Services — 1.1% |
| | |
Fulgent Genetics, Inc. * (a) | | |
| | |
| | |
| | |
| | |
|
| | |
Community Healthcare Trust, Inc. | | |
Global Medical REIT, Inc. | | |
| | |
Sabra Health Care REIT, Inc. | | |
| | |
Health Care Technology — 1.1% |
Evolent Health, Inc., Class A * | | |
| | |
| | |
| | |
| | |
Hotel & Resort REITs — 1.8% |
Apple Hospitality REIT, Inc. | | |
DiamondRock Hospitality Co. | | |
| | |
Ryman Hospitality Properties, Inc. | | |
Xenia Hotels & Resorts, Inc. | | |
| | |
Hotels, Restaurants & Leisure — 2.6% |
| | |
Bluegreen Vacations Holding Corp. (a) | | |
| | |
Full House Resorts, Inc. * | | |
International Game Technology plc | | |
| | |
Marriott Vacations Worldwide Corp. | | |
| | |
|
Hotels, Restaurants & Leisure — continued |
Papa John's International, Inc. | | |
SeaWorld Entertainment, Inc. * | | |
| | |
Household Durables — 3.5% |
| | |
| | |
| | |
Taylor Morrison Home Corp. * | | |
| | |
| | |
Household Products — 0.6% |
Central Garden & Pet Co., Class A * | | |
Independent Power and Renewable Electricity Producers — 0.5% |
| | |
Clearway Energy, Inc., Class C | | |
| | |
|
First Industrial Realty Trust, Inc. | | |
Innovative Industrial Properties, Inc. (a) | | |
| | |
Plymouth Industrial REIT, Inc. | | |
| | |
| | |
| | |
|
American Equity Investment Life Holding Co. | | |
CNO Financial Group, Inc. | | |
| | |
James River Group Holdings Ltd. | | |
| | |
Selective Insurance Group, Inc. | | |
Skyward Specialty Insurance Group, Inc. * | | |
| | |
Interactive Media & Services — 0.2% |
| | |
| | |
| | |
SEE NOTES TO FINANCIAL STATEMENTS.
| J.P. Morgan Small Cap Funds | |
JPMorgan Small Cap Value Fund
SCHEDULE OF PORTFOLIO INVESTMENTS
AS OF June 30, 2023 (continued)
| | |
Common Stocks — continued |
|
Information Services Group, Inc. | | |
| | |
| | |
|
Topgolf Callaway Brands Corp. * | | |
Life Sciences Tools & Services — 0.3% |
Pacific Biosciences of California, Inc. * | | |
|
| | |
| | |
Albany International Corp., Class A | | |
| | |
Luxfer Holdings plc (United Kingdom) | | |
| | |
| | |
| | |
Marine Transportation — 0.4% |
| | |
Safe Bulkers, Inc. (Greece) | | |
| | |
|
AMC Networks, Inc., Class A * | | |
Entravision Communications Corp., Class A | | |
| | |
John Wiley & Sons, Inc., Class A | | |
| | |
| | |
| | |
|
Alpha Metallurgical Resources, Inc. | | |
| | |
| | |
| | |
| | |
| | |
| | |
Schnitzer Steel Industries, Inc., Class A | | |
| | |
| | |
| | |
| | |
|
Mortgage Real Estate Investment Trusts (REITs) — 2.0% |
Ares Commercial Real Estate Corp. (a) | | |
Blackstone Mortgage Trust, Inc., Class A (a) | | |
| | |
Ellington Financial, Inc. (a) | | |
Hannon Armstrong Sustainable Infrastructure Capital, Inc. (a) | | |
KKR Real Estate Finance Trust, Inc. | | |
| | |
| | |
PennyMac Mortgage Investment Trust | | |
| | |
| | |
|
| | |
| | |
| | |
| | |
| | |
|
| | |
Corporate Office Properties Trust | | |
| | |
Piedmont Office Realty Trust, Inc., Class A | | |
| | |
Oil, Gas & Consumable Fuels — 5.5% |
| | |
| | |
California Resources Corp. | | |
| | |
| | |
| | |
| | |
| | |
| | |
| | |
| | |
International Seaways, Inc. | | |
| | |
| | |
| | |
Par Pacific Holdings, Inc. * | | |
PBF Energy, Inc., Class A | | |
SEE NOTES TO FINANCIAL STATEMENTS.
| J.P. Morgan Small Cap Funds | |
| | |
Common Stocks — continued |
Oil, Gas & Consumable Fuels — continued |
| | |
REX American Resources Corp. * | | |
| | |
Teekay Tankers Ltd., Class A (Canada) | | |
| | |
| | |
Paper & Forest Products — 0.1% |
| | |
Passenger Airlines — 0.8% |
Hawaiian Holdings, Inc. * | | |
| | |
| | |
Personal Care Products — 0.6% |
| | |
Edgewell Personal Care Co. | | |
| | |
| | |
|
ANI Pharmaceuticals, Inc. * | | |
Intra-Cellular Therapies, Inc. * | | |
NGM Biopharmaceuticals, Inc. * | | |
| | |
Professional Services — 0.3% |
Heidrick & Struggles International, Inc. | | |
| | |
| | |
Real Estate Management & Development — 0.6% |
| | |
|
Independence Realty Trust, Inc. | | |
| | |
| | |
|
| | |
| | |
| | |
| | |
| | |
| | |
Phillips Edison & Co., Inc. | | |
| | |
|
|
Retail Opportunity Investments Corp. | | |
| | |
| | |
Urstadt Biddle Properties, Inc., Class A | | |
| | |
Semiconductors & Semiconductor Equipment — 2.1% |
ACM Research, Inc., Class A * | | |
| | |
| | |
| | |
Veeco Instruments, Inc. * | | |
| | |
|
| | |
C3.ai, Inc., Class A * (a) | | |
E2open Parent Holdings, Inc. * | | |
| | |
LiveRamp Holdings, Inc. * | | |
Marathon Digital Holdings, Inc. * (a) | | |
| | |
Riot Platforms, Inc. * (a) | | |
| | |
| | |
| | |
|
| | |
|
Academy Sports & Outdoors, Inc. | | |
Asbury Automotive Group, Inc. * | | |
| | |
| | |
Sally Beauty Holdings, Inc. * | | |
| | |
| | |
Technology Hardware, Storage & Peripherals — 0.3% |
| | |
Textiles, Apparel & Luxury Goods — 0.2% |
G-III Apparel Group Ltd. * | | |
Trading Companies & Distributors — 5.0% |
Beacon Roofing Supply, Inc. * | | |
BlueLinx Holdings, Inc. * | | |
SEE NOTES TO FINANCIAL STATEMENTS.
| J.P. Morgan Small Cap Funds | |
JPMorgan Small Cap Value Fund
SCHEDULE OF PORTFOLIO INVESTMENTS
AS OF June 30, 2023 (continued)
| | |
Common Stocks — continued |
Trading Companies & Distributors — continued |
| | |
| | |
| | |
| | |
| | |
Rush Enterprises, Inc., Class A | | |
| | |
| | |
WESCO International, Inc. | | |
| | |
|
American States Water Co. | | |
Wireless Telecommunication Services — 0.2% |
| | |
Total Common Stocks
(Cost $1,259,535) | | |
Short-Term Investments — 4.5% |
Investment Companies — 2.1% |
JPMorgan Prime Money Market Fund Class IM Shares, 5.23% (b) (c)
(Cost $28,798) | | |
Investment of Cash Collateral from Securities Loaned — 2.4% |
JPMorgan Securities Lending Money Market Fund Agency SL Class Shares, 5.29% (b) (c) | | |
| | |
|
Investment of Cash Collateral from Securities Loaned — continued |
JPMorgan U.S. Government Money Market Fund Class IM Shares, 5.05% (b) (c) | | |
Total Investment of Cash Collateral from Securities Loaned
(Cost $34,084) | | |
Total Short-Term Investments
(Cost $62,882) | | |
Total Investments — 102.7%
(Cost $1,322,417) | | |
Liabilities in Excess of Other Assets — (2.7)% | | |
| | |
Percentages indicated are based on net assets. |
| |
| Real Estate Investment Trust |
| Non-income producing security. |
| The security or a portion of this security is on loan at June 30, 2023. The total value of securities on loan at June 30, 2023 is $33,531. |
| Investment in an affiliated fund, which is registered under the Investment Company Act of 1940, as amended, and is advised by J.P. Morgan Investment Management Inc. |
| The rate shown is the current yield as of June 30, 2023. |
Futures contracts outstanding as of June 30, 2023 (amounts in thousands, except number of contracts):
| | | | | VALUE AND
UNREALIZED
APPRECIATION
(DEPRECIATION) ($) |
| | | | | |
Russell 2000 E-Mini Index | | | | | |
SEE NOTES TO FINANCIAL STATEMENTS.
| J.P. Morgan Small Cap Funds | |
JPMorgan SMID Cap Equity Fund
SCHEDULE OF PORTFOLIO INVESTMENTS
AS OF June 30, 2023
| | |
|
Aerospace & Defense — 0.7% |
| | |
Automobile Components — 0.8% |
| | |
|
Commerce Bancshares, Inc. | | |
Cullen/Frost Bankers, Inc. (a) | | |
First Interstate BancSystem, Inc., Class A | | |
ServisFirst Bancshares, Inc. | | |
| | |
| | |
|
Fortune Brands Innovations, Inc. | | |
| | |
Lennox International, Inc. | | |
Simpson Manufacturing Co., Inc. | | |
| | |
|
Cboe Global Markets, Inc. | | |
| | |
FactSet Research Systems, Inc. | | |
LPL Financial Holdings, Inc. | | |
| | |
| | |
StepStone Group, Inc., Class A | | |
| | |
|
Axalta Coating Systems Ltd. * | | |
| | |
| | |
Commercial Services & Supplies — 6.0% |
Driven Brands Holdings, Inc. * | | |
| | |
| | |
| | |
| | |
| | |
Construction & Engineering — 1.6% |
WillScot Mobile Mini Holdings Corp. * | | |
Consumer Staples Distribution & Retail — 3.6% |
BJ's Wholesale Club Holdings, Inc. * | | |
| | |
|
Consumer Staples Distribution & Retail — continued |
Casey's General Stores, Inc. | | |
Performance Food Group Co. * | | |
| | |
Containers & Packaging — 2.2% |
| | |
| | |
| | |
|
| | |
| | |
| | |
Diversified Consumer Services — 1.3% |
Bright Horizons Family Solutions, Inc. * | | |
Electrical Equipment — 0.9% |
| | |
Electronic Equipment, Instruments & Components — 1.1% |
| | |
Financial Services — 2.8% |
Jack Henry & Associates, Inc. | | |
| | |
| | |
|
Lamb Weston Holdings, Inc. | | |
|
| | |
Ground Transportation — 2.3% |
Knight-Swift Transportation Holdings, Inc. | | |
| | |
| | |
| | |
Health Care Equipment & Supplies — 3.8% |
| | |
| | |
| | |
| | |
| | |
Health Care Providers & Services — 5.0% |
| | |
| | |
SEE NOTES TO FINANCIAL STATEMENTS.
| J.P. Morgan Small Cap Funds | |
JPMorgan SMID Cap Equity Fund
SCHEDULE OF PORTFOLIO INVESTMENTS
AS OF June 30, 2023 (continued)
| | |
Common Stocks — continued |
Health Care Providers & Services — continued |
| | |
Molina Healthcare, Inc. * | | |
| | |
Health Care Technology — 1.0% |
| | |
Definitive Healthcare Corp. * (a) | | |
| | |
Hotel & Resort REITs — 0.8% |
Ryman Hospitality Properties, Inc. | | |
Hotels, Restaurants & Leisure — 3.3% |
Planet Fitness, Inc., Class A * | | |
| | |
| | |
| | |
Household Products — 0.8% |
Reynolds Consumer Products, Inc. | | |
|
EastGroup Properties, Inc. | | |
|
| | |
Kinsale Capital Group, Inc. | | |
| | |
| | |
|
| | |
Life Sciences Tools & Services — 1.3% |
West Pharmaceutical Services, Inc. | | |
|
| | |
Hillman Solutions Corp. * | | |
| | |
Lincoln Electric Holdings, Inc. | | |
| | |
| | |
| | |
| | |
Oil, Gas & Consumable Fuels — 0.7% |
| | |
| | |
|
Passenger Airlines — 0.8% |
| | |
|
| | |
Professional Services — 4.4% |
Broadridge Financial Solutions, Inc. | | |
| | |
SS&C Technologies Holdings, Inc. | | |
| | |
| | |
Real Estate Management & Development — 0.6% |
Cushman & Wakefield plc * | | |
|
Mid-America Apartment Communities, Inc. | | |
|
| | |
Semiconductors & Semiconductor Equipment — 4.3% |
Allegro MicroSystems, Inc. (Japan) * | | |
| | |
| | |
| | |
| | |
|
| | |
Clearwater Analytics Holdings, Inc., Class A * | | |
| | |
Guidewire Software, Inc. * | | |
Manhattan Associates, Inc. * | | |
| | |
| | |
Tyler Technologies, Inc. * | | |
| | |
|
| | |
| | |
| | |
|
Burlington Stores, Inc. * | | |
Textiles, Apparel & Luxury Goods — 0.5% |
| | |
SEE NOTES TO FINANCIAL STATEMENTS.
| J.P. Morgan Small Cap Funds | |
| | |
Common Stocks — continued |
Trading Companies & Distributors — 0.4% |
Core & Main, Inc., Class A * | | |
Total Common Stocks
(Cost $288,938) | | |
Short-Term Investments — 3.5% |
Investment Companies — 2.6% |
JPMorgan Prime Money Market Fund Class IM Shares, 5.23% (b) (c)
(Cost $8,885) | | |
Investment of Cash Collateral from Securities Loaned — 0.9% |
JPMorgan U.S. Government Money Market Fund Class IM Shares, 5.05% (b) (c)
(Cost $3,028) | | |
Total Short-Term Investments
(Cost $11,913) | | |
Total Investments — 100.7%
(Cost $300,851) | | |
Liabilities in Excess of Other Assets — (0.7)% | | |
| | |
Percentages indicated are based on net assets. |
| |
| Real Estate Investment Trust |
| Non-income producing security. |
| The security or a portion of this security is on loan at June 30, 2023. The total value of securities on loan at June 30, 2023 is $2,863. |
| Investment in an affiliated fund, which is registered under the Investment Company Act of 1940, as amended, and is advised by J.P. Morgan Investment Management Inc. |
| The rate shown is the current yield as of June 30, 2023. |
SEE NOTES TO FINANCIAL STATEMENTS.
| J.P. Morgan Small Cap Funds | |
JPMorgan U.S. Small Company Fund
SCHEDULE OF PORTFOLIO INVESTMENTS
AS OF June 30, 2023
| | |
|
Aerospace & Defense — 0.3% |
| | |
Air Freight & Logistics — 0.7% |
| | |
Hub Group, Inc., Class A * | | |
Radiant Logistics, Inc. * | | |
| | |
Automobile Components — 0.8% |
American Axle & Manufacturing Holdings, Inc. * | | |
| | |
| | |
| | |
| | |
|
| | |
| | |
| | |
| | |
Bank of NT Butterfield & Son Ltd. (The) (Bermuda) | | |
| | |
Business First Bancshares, Inc. | | |
| | |
Capital City Bank Group, Inc. | | |
Central Pacific Financial Corp. | | |
Coastal Financial Corp. * | | |
Columbia Banking System, Inc. | | |
| | |
Customers Bancorp, Inc. * | | |
| | |
Dime Community Bancshares, Inc. | | |
| | |
Enterprise Financial Services Corp. | | |
Equity Bancshares, Inc., Class A | | |
Financial Institutions, Inc. | | |
| | |
First BanCorp (Puerto Rico) | | |
First Bancshares, Inc. (The) | | |
First Citizens BancShares, Inc., Class A | | |
First Commonwealth Financial Corp. | | |
| | |
| | |
First Interstate BancSystem, Inc., Class A | | |
| | |
| | |
|
|
First Mid Bancshares, Inc. | | |
| | |
| | |
| | |
HomeTrust Bancshares, Inc. | | |
| | |
| | |
MidWestOne Financial Group, Inc. | | |
| | |
OceanFirst Financial Corp. | | |
OFG Bancorp (Puerto Rico) | | |
| | |
| | |
| | |
Peapack-Gladstone Financial Corp. | | |
| | |
Pinnacle Financial Partners, Inc. | | |
Popular, Inc. (Puerto Rico) | | |
| | |
| | |
Seacoast Banking Corp. of Florida | | |
South Plains Financial, Inc. | | |
Southside Bancshares, Inc. | | |
| | |
| | |
| | |
United Community Banks, Inc. | | |
| | |
| | |
| | |
| | |
| | |
|
Coca-Cola Consolidated, Inc. | | |
| | |
| | |
|
| | |
ACADIA Pharmaceuticals, Inc. * | | |
| | |
| | |
| | |
Allogene Therapeutics, Inc. * | | |
SEE NOTES TO FINANCIAL STATEMENTS.
| J.P. Morgan Small Cap Funds | |
| | |
Common Stocks — continued |
Biotechnology — continued |
Amicus Therapeutics, Inc. * | | |
Arrowhead Pharmaceuticals, Inc. * | | |
Atara Biotherapeutics, Inc. * | | |
Beam Therapeutics, Inc. * (b) | | |
| | |
| | |
Blueprint Medicines Corp. * | | |
Bridgebio Pharma, Inc. * (b) | | |
Catalyst Pharmaceuticals, Inc. * | | |
Chinook Therapeutics, Inc. * | | |
Coherus Biosciences, Inc. * (b) | | |
Decibel Therapeutics, Inc. * | | |
Enanta Pharmaceuticals, Inc. * | | |
Fate Therapeutics, Inc. * | | |
| | |
| | |
| | |
Intellia Therapeutics, Inc. * | | |
| | |
Kymera Therapeutics, Inc. * | | |
Madrigal Pharmaceuticals, Inc. * | | |
| | |
| | |
OmniAb Operations, Inc. ‡ * | | |
PMV Pharmaceuticals, Inc. * | | |
Point Biopharma Global, Inc. * (b) | | |
Protagonist Therapeutics, Inc. * | | |
Prothena Corp. plc (Ireland) * | | |
| | |
Relay Therapeutics, Inc. * | | |
| | |
REVOLUTION Medicines, Inc. * | | |
Sage Therapeutics, Inc. * | | |
Sana Biotechnology, Inc. * (b) | | |
SpringWorks Therapeutics, Inc. * (b) | | |
| | |
Syndax Pharmaceuticals, Inc. * | | |
Travere Therapeutics, Inc. * | | |
| | |
Tyra Biosciences, Inc. * (b) | | |
| | |
| | |
|
Biotechnology — continued |
| | |
Y-mAbs Therapeutics, Inc. * (b) | | |
| | |
|
| | |
Gibraltar Industries, Inc. * | | |
| | |
Resideo Technologies, Inc. * | | |
| | |
| | |
|
AssetMark Financial Holdings, Inc. * | | |
| | |
Donnelley Financial Solutions, Inc. * | | |
| | |
Focus Financial Partners, Inc., Class A * | | |
| | |
PJT Partners, Inc., Class A | | |
| | |
| | |
Victory Capital Holdings, Inc., Class A | | |
Virtus Investment Partners, Inc. | | |
| | |
|
| | |
| | |
| | |
| | |
| | |
| | |
| | |
Minerals Technologies, Inc. | | |
| | |
| | |
| | |
Commercial Services & Supplies — 1.9% |
| | |
| | |
Heritage-Crystal Clean, Inc. * | | |
SEE NOTES TO FINANCIAL STATEMENTS.
| J.P. Morgan Small Cap Funds | |
JPMorgan U.S. Small Company Fund
SCHEDULE OF PORTFOLIO INVESTMENTS
AS OF June 30, 2023 (continued)
| | |
Common Stocks — continued |
Commercial Services & Supplies — continued |
| | |
| | |
| | |
Communications Equipment — 0.6% |
| | |
| | |
| | |
| | |
Construction & Engineering — 3.4% |
| | |
| | |
Comfort Systems USA, Inc. | | |
| | |
| | |
| | |
| | |
Sterling Infrastructure, Inc. * | | |
| | |
Construction Materials — 0.0% ^ |
Summit Materials, Inc., Class A * | | |
|
Enova International, Inc. * | | |
| | |
| | |
| | |
Consumer Staples Distribution & Retail — 1.4% |
| | |
BJ's Wholesale Club Holdings, Inc. * | | |
| | |
Sprouts Farmers Market, Inc. * | | |
United Natural Foods, Inc. * | | |
| | |
Containers & Packaging — 0.3% |
| | |
| | |
| | |
Diversified Consumer Services — 0.2% |
| | |
|
Armada Hoffler Properties, Inc. | | |
| | |
|
Diversified REITs — continued |
Broadstone Net Lease, Inc. | | |
Essential Properties Realty Trust, Inc. | | |
| | |
Diversified Telecommunication Services — 0.8% |
EchoStar Corp., Class A * | | |
Iridium Communications, Inc. | | |
Liberty Latin America Ltd., Class C (Puerto Rico) * (b) | | |
| | |
| | |
Electric Utilities — 0.9% |
| | |
| | |
Portland General Electric Co. | | |
| | |
Electrical Equipment — 1.8% |
Allied Motion Technologies, Inc. | | |
| | |
Bloom Energy Corp., Class A * (b) | | |
| | |
NEXTracker, Inc., Class A * (b) | | |
| | |
Electronic Equipment, Instruments & Components — 1.6% |
| | |
Benchmark Electronics, Inc. | | |
| | |
Insight Enterprises, Inc. * | | |
| | |
| | |
| | |
Energy Equipment & Services — 1.8% |
| | |
Expro Group Holdings NV * | | |
| | |
| | |
NexTier Oilfield Solutions, Inc. * | | |
| | |
Oceaneering International, Inc. * | | |
Oil States International, Inc. * | | |
Patterson-UTI Energy, Inc. | | |
SEE NOTES TO FINANCIAL STATEMENTS.
| J.P. Morgan Small Cap Funds | |
| | |
Common Stocks — continued |
Energy Equipment & Services — continued |
Select Water Solutions, Inc. | | |
Weatherford International plc * | | |
| | |
|
Lions Gate Entertainment Corp., Class A * | | |
Financial Services — 3.4% |
| | |
EVERTEC, Inc. (Puerto Rico) | | |
| | |
International Money Express, Inc. * | | |
Jackson Financial, Inc., Class A | | |
| | |
| | |
NMI Holdings, Inc., Class A * | | |
PennyMac Financial Services, Inc. | | |
| | |
| | |
| | |
| | |
|
Darling Ingredients, Inc. * | | |
| | |
John B Sanfilippo & Son, Inc. | | |
| | |
| | |
|
Chesapeake Utilities Corp. | | |
New Jersey Resources Corp. | | |
Northwest Natural Holding Co. | | |
| | |
| | |
Ground Transportation — 0.5% |
| | |
Health Care Equipment & Supplies — 3.7% |
Alphatec Holdings, Inc. * | | |
| | |
| | |
| | |
| | |
| | |
Inspire Medical Systems, Inc. * | | |
| | |
|
Health Care Equipment & Supplies — continued |
Lantheus Holdings, Inc. * | | |
Merit Medical Systems, Inc. * | | |
| | |
Shockwave Medical, Inc. * | | |
| | |
Treace Medical Concepts, Inc. * | | |
| | |
Health Care Providers & Services — 2.7% |
AMN Healthcare Services, Inc. * | | |
Cross Country Healthcare, Inc. * | | |
| | |
| | |
National HealthCare Corp. | | |
| | |
Option Care Health, Inc. * | | |
| | |
| | |
| | |
| | |
|
| | |
Community Healthcare Trust, Inc. | | |
Global Medical REIT, Inc. | | |
| | |
| | |
Health Care Technology — 0.7% |
| | |
| | |
| | |
| | |
Hotel & Resort REITs — 1.1% |
Apple Hospitality REIT, Inc. | | |
DiamondRock Hospitality Co. | | |
| | |
Ryman Hospitality Properties, Inc. | | |
Xenia Hotels & Resorts, Inc. | | |
| | |
Hotels, Restaurants & Leisure — 3.1% |
| | |
Bluegreen Vacations Holding Corp. | | |
| | |
SEE NOTES TO FINANCIAL STATEMENTS.
| J.P. Morgan Small Cap Funds | |
JPMorgan U.S. Small Company Fund
SCHEDULE OF PORTFOLIO INVESTMENTS
AS OF June 30, 2023 (continued)
| | |
Common Stocks — continued |
Hotels, Restaurants & Leisure — continued |
| | |
| | |
| | |
Hilton Grand Vacations, Inc. * | | |
Marriott Vacations Worldwide Corp. | | |
SeaWorld Entertainment, Inc. * | | |
| | |
| | |
Household Durables — 2.9% |
| | |
| | |
| | |
| | |
| | |
Taylor Morrison Home Corp. * | | |
| | |
| | |
Household Products — 0.4% |
Central Garden & Pet Co., Class A * | | |
Independent Power and Renewable Electricity Producers — 0.3% |
| | |
Clearway Energy, Inc., Class C | | |
| | |
|
First Industrial Realty Trust, Inc. | | |
Innovative Industrial Properties, Inc. | | |
| | |
Plymouth Industrial REIT, Inc. | | |
| | |
| | |
| | |
|
American Equity Investment Life Holding Co. | | |
BRP Group, Inc., Class A * | | |
| | |
James River Group Holdings Ltd. | | |
Kinsale Capital Group, Inc. | | |
| | |
| | |
Skyward Specialty Insurance Group, Inc. * | | |
| | |
| | |
|
Interactive Media & Services — 0.6% |
| | |
| | |
| | |
| | |
|
Information Services Group, Inc. | | |
| | |
Squarespace, Inc., Class A * | | |
| | |
|
Acushnet Holdings Corp. (b) | | |
Life Sciences Tools & Services — 0.6% |
Adaptive Biotechnologies Corp. * | | |
| | |
| | |
| | |
| | |
| | |
|
Albany International Corp., Class A | | |
Luxfer Holdings plc (United Kingdom) | | |
| | |
| | |
Watts Water Technologies, Inc., Class A | | |
| | |
Marine Transportation — 0.3% |
Eagle Bulk Shipping, Inc. (b) | | |
| | |
Safe Bulkers, Inc. (Greece) (b) | | |
| | |
|
| | |
Integral Ad Science Holding Corp. * | | |
John Wiley & Sons, Inc., Class A | | |
| | |
| | |
| | |
|
Alpha Metallurgical Resources, Inc. | | |
| | |
SEE NOTES TO FINANCIAL STATEMENTS.
| J.P. Morgan Small Cap Funds | |
| | |
Common Stocks — continued |
Metals & Mining — continued |
| | |
| | |
| | |
| | |
| | |
Schnitzer Steel Industries, Inc., Class A | | |
| | |
| | |
Mortgage Real Estate Investment Trusts (REITs) — 0.7% |
Blackstone Mortgage Trust, Inc., Class A (b) | | |
| | |
Ellington Financial, Inc. (b) | | |
Hannon Armstrong Sustainable Infrastructure Capital, Inc. (b) | | |
KKR Real Estate Finance Trust, Inc. | | |
| | |
| | |
PennyMac Mortgage Investment Trust | | |
| | |
|
| | |
| | |
| | |
|
| | |
Corporate Office Properties Trust | | |
| | |
Piedmont Office Realty Trust, Inc., Class A | | |
| | |
Oil, Gas & Consumable Fuels — 3.5% |
| | |
California Resources Corp. | | |
| | |
| | |
| | |
| | |
| | |
| | |
| | |
Magnolia Oil & Gas Corp., Class A | | |
| | |
| | |
| | |
|
Oil, Gas & Consumable Fuels — continued |
| | |
PBF Energy, Inc., Class A | | |
| | |
| | |
REX American Resources Corp. * | | |
| | |
Teekay Tankers Ltd., Class A (Canada) | | |
| | |
Paper & Forest Products — 0.1% |
| | |
Passenger Airlines — 0.4% |
| | |
| | |
| | |
Personal Care Products — 1.9% |
| | |
Edgewell Personal Care Co. | | |
| | |
| | |
| | |
USANA Health Sciences, Inc. * | | |
| | |
|
Aclaris Therapeutics, Inc. * | | |
Amneal Pharmaceuticals, Inc. * | | |
| | |
Axsome Therapeutics, Inc. * (b) | | |
Esperion Therapeutics, Inc. * | | |
Longboard Pharmaceuticals, Inc. * | | |
NGM Biopharmaceuticals, Inc. * | | |
Reata Pharmaceuticals, Inc., Class A * (b) | | |
| | |
Professional Services — 2.2% |
CACI International, Inc., Class A * | | |
| | |
Heidrick & Struggles International, Inc. | | |
| | |
| | |
| | |
| | |
| | |
SEE NOTES TO FINANCIAL STATEMENTS.
| J.P. Morgan Small Cap Funds | |
JPMorgan U.S. Small Company Fund
SCHEDULE OF PORTFOLIO INVESTMENTS
AS OF June 30, 2023 (continued)
| | |
Common Stocks — continued |
Real Estate Management & Development — 0.1% |
| | |
|
| | |
|
| | |
| | |
Phillips Edison & Co., Inc. (b) | | |
Retail Opportunity Investments Corp. | | |
| | |
| | |
| | |
Semiconductors & Semiconductor Equipment — 3.8% |
ACM Research, Inc., Class A * | | |
| | |
Axcelis Technologies, Inc. * | | |
| | |
| | |
MACOM Technology Solutions Holdings, Inc. * | | |
| | |
| | |
| | |
| | |
| | |
| | |
Silicon Laboratories, Inc. * | | |
SMART Global Holdings, Inc. * | | |
Ultra Clean Holdings, Inc. * | | |
Veeco Instruments, Inc. * | | |
| | |
|
| | |
| | |
| | |
| | |
| | |
Braze, Inc., Class A * (b) | | |
C3.ai, Inc., Class A * (b) | | |
Clear Secure, Inc., Class A (b) | | |
CommVault Systems, Inc. * | | |
| | |
| | |
LiveRamp Holdings, Inc. * | | |
| | |
|
|
MicroStrategy, Inc., Class A * (b) | | |
| | |
| | |
| | |
| | |
Riot Platforms, Inc. * (b) | | |
Sprout Social, Inc., Class A * (b) | | |
| | |
| | |
| | |
| | |
| | |
|
National Storage Affiliates Trust | | |
| | |
| | |
|
| | |
Abercrombie & Fitch Co., Class A * | | |
Asbury Automotive Group, Inc. * | | |
Boot Barn Holdings, Inc. * | | |
| | |
Lithia Motors, Inc., Class A | | |
| | |
| | |
| | |
| | |
Technology Hardware, Storage & Peripherals — 0.7% |
| | |
Super Micro Computer, Inc. * | | |
| | |
Textiles, Apparel & Luxury Goods — 0.9% |
| | |
| | |
| | |
Trading Companies & Distributors — 4.3% |
Beacon Roofing Supply, Inc. * | | |
BlueLinx Holdings, Inc. * | | |
| | |
| | |
| | |
SEE NOTES TO FINANCIAL STATEMENTS.
| J.P. Morgan Small Cap Funds | |
| | |
Common Stocks — continued |
Trading Companies & Distributors — continued |
| | |
| | |
Rush Enterprises, Inc., Class A | | |
| | |
| | |
WESCO International, Inc. | | |
| | |
|
American States Water Co. | | |
Wireless Telecommunication Services — 0.1% |
| | |
Total Common Stocks
(Cost $816,007) | | |
Short-Term Investments — 5.1% |
Investment Companies — 1.6% |
JPMorgan Prime Money Market Fund Class IM Shares, 5.23% (c) (d)
(Cost $14,703) | | |
Investment of Cash Collateral from Securities Loaned — 3.5% |
JPMorgan Securities Lending Money Market Fund Agency SL Class Shares, 5.29% (c) (d) | | |
JPMorgan U.S. Government Money Market Fund Class IM Shares, 5.05% (c) (d) | | |
Total Investment of Cash Collateral from Securities Loaned
(Cost $32,807) | | |
Total Short-Term Investments
(Cost $47,510) | | |
Total Investments — 103.9%
(Cost $863,517) | | |
Liabilities in Excess of Other Assets — (3.9)% | | |
| | |
Percentages indicated are based on net assets. |
Amounts presented as a dash ("-") represent amounts that round to less than a thousand. |
| |
| Real Estate Investment Trust |
| Amount rounds to less than 0.1% of net assets. |
| Value determined using significant unobservable inputs. | |
| Non-income producing security. | |
| Security exempt from registration pursuant to Regulation S under the Securities Act of 1933, as amended. Regulation S applies to securities offerings that are made outside of the United States and do not involve direct selling efforts in the United States and as such may have restrictions on resale. | |
| The security or a portion of this security is on loan at June 30, 2023. The total value of securities on loan at June 30, 2023 is $32,149. | |
| Investment in an affiliated fund, which is registered under the Investment Company Act of 1940, as amended, and is advised by J.P. Morgan Investment Management Inc. | |
| The rate shown is the current yield as of June 30, 2023. | |
SEE NOTES TO FINANCIAL STATEMENTS.
| J.P. Morgan Small Cap Funds | |
JPMorgan U.S. Small Company Fund
SCHEDULE OF PORTFOLIO INVESTMENTS
AS OF June 30, 2023 (continued)
Futures contracts outstanding as of June 30, 2023 (amounts in thousands, except number of contracts):
| | | | | VALUE AND
UNREALIZED
APPRECIATION
(DEPRECIATION) ($) |
| | | | | |
Russell 2000 E-Mini Index | | | | | |
SEE NOTES TO FINANCIAL STATEMENTS.
| J.P. Morgan Small Cap Funds | |
STATEMENTS OF ASSETS AND LIABILITIES
AS OF June 30, 2023
(Amounts in thousands, except per share amounts)
| JPMorgan
Small Cap
Blend Fund | JPMorgan
Small Cap
Equity Fund | |
| | | |
Investments in non-affiliates, at value | | | |
Investments in affiliates, at value | | | |
Investments of cash collateral received from securities loaned, at value (See Note 2.C.) | | | |
| | | |
| | | |
| | | |
Investment securities sold | | | |
| | | |
Dividends from non-affiliates | | | |
Dividends from affiliates | | | |
Securities lending income (See Note 2.C.) | | | |
| | | |
| | | |
| | | |
| | | |
Investment securities purchased | | | |
Collateral received on securities loaned (See Note 2.C.) | | | |
| | | |
| | | |
| | | |
| | | |
| | | |
| | | |
Custodian and accounting fees | | | |
Trustees’ and Chief Compliance Officer’s fees | | | |
| | | |
| | | |
| | | |
(a)
Amount rounds to less than one thousand.
SEE NOTES TO FINANCIAL STATEMENTS.
| J.P. Morgan Small Cap Funds | |
STATEMENTS OF ASSETS AND LIABILITIES
AS OF June 30, 2023 (continued)
(Amounts in thousands, except per share amounts)
| JPMorgan Small Cap Blend Fund | JPMorgan Small Cap Equity Fund | |
| | | |
| | | |
Total distributable earnings (loss) | | | |
| | | |
| | | |
| | | |
| | | |
| | | |
| | | |
| | | |
| | | |
| | | |
| | | |
| | | |
| | | |
Outstanding units of beneficial interest (shares)
($0.0001 par value; unlimited number of shares authorized): | | | |
| | | |
| | | |
| | | |
| | | |
| | | |
| | | |
| | | |
| | | |
| | | |
| | | |
Class A — Redemption price per share | | | |
Class C — Offering price per share (b) | | | |
Class I — Offering and redemption price per share | | | |
Class L — Offering and redemption price per share | | | |
Class R2 — Offering and redemption price per share | | | |
Class R3 — Offering and redemption price per share | | | |
Class R4 — Offering and redemption price per share | | | |
Class R5 — Offering and redemption price per share | | | |
Class R6 — Offering and redemption price per share | | | |
Class A maximum sales charge | | | |
Class A maximum public offering price per share
[net asset value per share/(100% – maximum sales charge)] | | | |
Cost of investments in non-affiliates | | | |
Cost of investments in affiliates | | | |
Investment securities on loan, at value (See Note 2.C.) | | | |
Cost of investment of cash collateral (See Note 2.C.) | | | |
(a)
Per share amounts may not recalculate due to rounding of net assets and/or shares outstanding.
(b)
Redemption price for Class C Shares varies based upon length of time the shares are held.
SEE NOTES TO FINANCIAL STATEMENTS.
| J.P. Morgan Small Cap Funds | |
| JPMorgan
Small Cap
Sustainable Leaders
Fund | JPMorgan
Small Cap
Value Fund | JPMorgan
SMID Cap
Equity Fund | |
| | | | |
Investments in non-affiliates, at value | | | | |
Investments in affiliates, at value | | | | |
Investments of cash collateral received from securities loaned, at value (See Note 2.C.) | | | | |
| | | | |
Deposits at broker for futures contracts | | | | |
| | | | |
Investment securities sold | | | | |
| | | | |
Dividends from non-affiliates | | | | |
Dividends from affiliates | | | | |
Securities lending income (See Note 2.C.) | | | | |
Variation margin on futures contracts | | | | |
| | | | |
| | | | |
| | | | |
| | | | |
Investment securities purchased | | | | |
Collateral received on securities loaned (See Note 2.C.) | | | | |
| | | | |
| | | | |
| | | | |
| | | | |
| | | | |
| | | | |
Custodian and accounting fees | | | | |
Trustees’ and Chief Compliance Officer’s fees | | | | |
| | | | |
| | | | |
| | | | |
(a)
Amount rounds to less than one thousand.
SEE NOTES TO FINANCIAL STATEMENTS.
| J.P. Morgan Small Cap Funds | |
STATEMENTS OF ASSETS AND LIABILITIES
AS OF June 30, 2023 (continued)
(Amounts in thousands, except per share amounts)
| JPMorgan Small Cap Sustainable Leaders Fund | JPMorgan Small Cap Value Fund | JPMorgan SMID Cap Equity Fund | |
| | | | |
| | | | |
Total distributable earnings (loss) | | | | |
| | | | |
| | | | |
| | | | |
| | | | |
| | | | |
| | | | |
| | | | |
| | | | |
| | | | |
| | | | |
| | | | |
| | | | |
Outstanding units of beneficial interest (shares)
($0.0001 par value; unlimited number of shares authorized): | | | | |
| | | | |
| | | | |
| | | | |
| | | | |
| | | | |
| | | | |
| | | | |
| | | | |
| | | | |
| | | | |
Class A — Redemption price per share | | | | |
Class C — Offering price per share (b) | | | | |
Class I — Offering and redemption price per share | | | | |
Class L — Offering and redemption price per share | | | | |
Class R2 — Offering and redemption price per share | | | | |
Class R3 — Offering and redemption price per share | | | | |
Class R4 — Offering and redemption price per share | | | | |
Class R5 — Offering and redemption price per share | | | | |
Class R6 — Offering and redemption price per share | | | | |
Class A maximum sales charge | | | | |
Class A maximum public offering price per share
[net asset value per share/(100% – maximum sales charge)] | | | | |
Cost of investments in non-affiliates | | | | |
Cost of investments in affiliates | | | | |
Investment securities on loan, at value | | | | |
Cost of investment of cash collateral (See Note 2.C.) | | | | |
(a)
Per share amounts may not recalculate due to rounding of net assets and/or shares outstanding.
(b)
Redemption price for Class C Shares varies based upon length of time the shares are held.
SEE NOTES TO FINANCIAL STATEMENTS.
| J.P. Morgan Small Cap Funds | |
STATEMENTS OF OPERATIONS
FOR THE YEAR ENDED June 30, 2023
(Amounts in thousands)
| JPMorgan
Small Cap
Blend Fund | JPMorgan
Small Cap
Equity Fund | |
| | | |
Interest income from non-affiliates | | | |
Interest income from affiliates | | | |
Dividend income from non-affiliates | | | |
Dividend income from affiliates | | | |
Income from securities lending (net) (See Note 2.C.) | | | |
| | | |
| | | |
| | | |
| | | |
| | | |
| | | |
| | | |
| | | |
| | | |
| | | |
| | | |
| | | |
| | | |
| | | |
| | | |
| | | |
| | | |
| | | |
Custodian and accounting fees | | | |
Interest expense to affiliates | | | |
| | | |
Trustees’ and Chief Compliance Officer’s fees | | | |
Printing and mailing costs | | | |
Registration and filing fees | | | |
Transfer agency fees (See Note 2.G.) | | | |
| | | |
| | | |
| | | |
Less expense reimbursements | | | |
| | | |
Net investment income (loss) | | | |
(a)
Amount rounds to less than one thousand.
SEE NOTES TO FINANCIAL STATEMENTS.
| J.P. Morgan Small Cap Funds | |
STATEMENTS OF OPERATIONS
FOR THE YEAR ENDED June 30, 2023 (continued)
(Amounts in thousands)
| JPMorgan Small Cap Blend Fund | JPMorgan Small Cap Equity Fund | |
REALIZED/UNREALIZED GAINS (LOSSES): | | | |
Net realized gain (loss) on transactions from: | | | |
Investments in non-affiliates | | | |
Investments in affiliates | | | |
| | | |
Change in net unrealized appreciation/depreciation on: | | | |
Investments in non-affiliates | | | |
Investments in affiliates | | | |
Change in net unrealized appreciation/depreciation | | | |
Net realized/unrealized gains (losses) | | | |
Change in net assets resulting from operations | | | |
SEE NOTES TO FINANCIAL STATEMENTS.
| J.P. Morgan Small Cap Funds | |
| JPMorgan
Small Cap
Sustainable Leaders
Fund | JPMorgan
Small Cap
Value Fund | JPMorgan
SMID Cap
Equity Fund | |
| | | | |
Interest income from non-affiliates | | | | |
Interest income from affiliates | | | | |
Dividend income from non-affiliates | | | | |
Dividend income from affiliates | | | | |
Income from securities lending (net) (See Note 2.C.) | | | | |
| | | | |
| | | | |
| | | | |
| | | | |
| | | | |
| | | | |
| | | | |
| | | | |
| | | | |
| | | | |
| | | | |
| | | | |
| | | | |
| | | | |
| | | | |
| | | | |
| | | | |
| | | | |
Custodian and accounting fees | | | | |
Interest expense to affiliates | | | | |
| | | | |
Trustees’ and Chief Compliance Officer’s fees | | | | |
Printing and mailing costs | | | | |
Registration and filing fees | | | | |
Transfer agency fees (See Note 2.G.) | | | | |
| | | | |
| | | | |
| | | | |
Less expense reimbursements | | | | |
| | | | |
Net investment income (loss) | | | | |
(a)
Amount rounds to less than one thousand.
SEE NOTES TO FINANCIAL STATEMENTS.
| J.P. Morgan Small Cap Funds | |
STATEMENTS OF OPERATIONS
FOR THE YEAR ENDED June 30, 2023 (continued)
(Amounts in thousands)
| JPMorgan Small Cap Sustainable Leaders Fund | JPMorgan Small Cap Value Fund | JPMorgan SMID Cap Equity Fund | |
REALIZED/UNREALIZED GAINS (LOSSES): | | | | |
Net realized gain (loss) on transactions from: | | | | |
Investments in non-affiliates | | | | |
Investments in affiliates | | | | |
| | | | |
| | | | |
Change in net unrealized appreciation/depreciation on: | | | | |
Investments in non-affiliates | | | | |
Investments in affiliates | | | | |
| | | | |
Change in net unrealized appreciation/depreciation | | | | |
Net realized/unrealized gains (losses) | | | | |
Change in net assets resulting from operations | | | | |
(a)
Amount rounds to less than one thousand.
SEE NOTES TO FINANCIAL STATEMENTS.
| J.P. Morgan Small Cap Funds | |
STATEMENTS OF CHANGES IN NET ASSETS
FOR THE PERIODS INDICATED
(Amounts in thousands)
| JPMorgan Small
Cap Blend Fund | JPMorgan Small Cap Equity Fund |
| | | | |
CHANGE IN NET ASSETS RESULTING FROM OPERATIONS: | | | | |
Net investment income (loss) | | | | |
| | | | |
Change in net unrealized appreciation/depreciation | | | | |
Change in net assets resulting from operations | | | | |
DISTRIBUTIONS TO SHAREHOLDERS: | | | | |
| | | | |
| | | | |
| | | | |
| | | | |
| | | | |
| | | | |
| | | | |
| | | | |
Total distributions to shareholders | | | | |
| | | | |
Change in net assets resulting from capital transactions | | | | |
| | | | |
| | | | |
| | | | |
| | | | |
SEE NOTES TO FINANCIAL STATEMENTS.
| J.P. Morgan Small Cap Funds | |
STATEMENTS OF CHANGES IN NET ASSETS
FOR THE PERIODS INDICATED (continued)
(Amounts in thousands)
| JPMorgan Small Cap Growth Fund | JPMorgan Small Cap Sustainable Leaders Fund |
| | | | |
CHANGE IN NET ASSETS RESULTING FROM OPERATIONS: | | | | |
Net investment income (loss) | | | | |
| | | | |
Change in net unrealized appreciation/depreciation | | | | |
Change in net assets resulting from operations | | | | |
DISTRIBUTIONS TO SHAREHOLDERS: | | | | |
| | | | |
| | | | |
| | | | |
| | | | |
| | | | |
| | | | |
| | | | |
| | | | |
| | | | |
Total distributions to shareholders | | | | |
| | | | |
Change in net assets resulting from capital transactions | | | | |
| | | | |
| | | | |
| | | | |
| | | | |
SEE NOTES TO FINANCIAL STATEMENTS.
| J.P. Morgan Small Cap Funds | |
| JPMorgan Small Cap Value Fund | JPMorgan SMID Cap Equity Fund |
| | | | |
CHANGE IN NET ASSETS RESULTING FROM OPERATIONS: | | | | |
Net investment income (loss) | | | | |
| | | | |
Change in net unrealized appreciation/depreciation | | | | |
Change in net assets resulting from operations | | | | |
DISTRIBUTIONS TO SHAREHOLDERS: | | | | |
| | | | |
| | | | |
| | | | |
| | | | |
| | | | |
| | | | |
| | | | |
| | | | |
Total distributions to shareholders | | | | |
| | | | |
Change in net assets resulting from capital transactions | | | | |
| | | | |
| | | | |
| | | | |
| | | | |
SEE NOTES TO FINANCIAL STATEMENTS.
| J.P. Morgan Small Cap Funds | |
STATEMENTS OF CHANGES IN NET ASSETS
FOR THE PERIODS INDICATED (continued)
(Amounts in thousands)
| JPMorgan U.S. Small Company Fund |
| | |
CHANGE IN NET ASSETS RESULTING FROM OPERATIONS: | | |
Net investment income (loss) | | |
| | |
Change in net unrealized appreciation/depreciation | | |
Change in net assets resulting from operations | | |
DISTRIBUTIONS TO SHAREHOLDERS: | | |
| | |
| | |
| | |
| | |
| | |
| | |
| | |
| | |
| | |
Total distributions to shareholders | | |
| | |
Change in net assets resulting from capital transactions | | |
| | |
| | |
| | |
| | |
SEE NOTES TO FINANCIAL STATEMENTS.
| J.P. Morgan Small Cap Funds | |
| JPMorgan Small
Cap Blend Fund | JPMorgan Small Cap Equity Fund |
| | | | |
| | | | |
| | | | |
Proceeds from shares issued | | | | |
| | | | |
| | | | |
Change in net assets resulting from Class A capital transactions | | | | |
| | | | |
Proceeds from shares issued | | | | |
| | | | |
| | | | |
Change in net assets resulting from Class C capital transactions | | | | |
| | | | |
Proceeds from shares issued | | | | |
| | | | |
| | | | |
Change in net assets resulting from Class I capital transactions | | | | |
| | | | |
Proceeds from shares issued | | | | |
| | | | |
| | | | |
Change in net assets resulting from Class R2 capital transactions | | | | |
| | | | |
Proceeds from shares issued | | | | |
| | | | |
| | | | |
Change in net assets resulting from Class R3 capital transactions | | | | |
| | | | |
Proceeds from shares issued | | | | |
| | | | |
| | | | |
Change in net assets resulting from Class R4 capital transactions | | | | |
| | | | |
Proceeds from shares issued | | | | |
| | | | |
| | | | |
Change in net assets resulting from Class R5 capital transactions | | | | |
SEE NOTES TO FINANCIAL STATEMENTS.
| J.P. Morgan Small Cap Funds | |
STATEMENTS OF CHANGES IN NET ASSETS
FOR THE PERIODS INDICATED (continued)
(Amounts in thousands)
| JPMorgan Small Cap Blend Fund | JPMorgan Small Cap Equity Fund |
| | | | |
CAPITAL TRANSACTIONS: (continued) | | | | |
| | | | |
Proceeds from shares issued | | | | |
| | | | |
| | | | |
Change in net assets resulting from Class R6 capital transactions | | | | |
Total change in net assets resulting from capital transactions | | | | |
| | | | |
| | | | |
| | | | |
| | | | |
| | | | |
| | | | |
| | | | |
| | | | |
| | | | |
| | | | |
| | | | |
| | | | |
| | | | |
| | | | |
| | | | |
| | | | |
| | | | |
| | | | |
| | | | |
| | | | |
Change in Class R2 Shares | | | | |
| | | | |
| | | | |
| | | | |
| | | | |
Change in Class R3 Shares | | | | |
| | | | |
| | | | |
| | | | |
| | | | |
Change in Class R4 Shares | | | | |
SEE NOTES TO FINANCIAL STATEMENTS.
| J.P. Morgan Small Cap Funds | |
| JPMorgan Small Cap Blend Fund | JPMorgan Small Cap Equity Fund |
| | | | |
SHARE TRANSACTIONS: (continued) | | | | |
| | | | |
| | | | |
| | | | |
| | | | |
Change in Class R5 Shares | | | | |
| | | | |
| | | | |
| | | | |
| | | | |
Change in Class R6 Shares | | | | |
SEE NOTES TO FINANCIAL STATEMENTS.
| J.P. Morgan Small Cap Funds | |
STATEMENTS OF CHANGES IN NET ASSETS
FOR THE PERIODS INDICATED (continued)
(Amounts in thousands)
| JPMorgan Small Cap Growth Fund | JPMorgan Small Cap Sustainable Leaders Fund |
| | | | |
| | | | |
| | | | |
Proceeds from shares issued | | | | |
| | | | |
| | | | |
Change in net assets resulting from Class A capital transactions | | | | |
| | | | |
Proceeds from shares issued | | | | |
| | | | |
| | | | |
Change in net assets resulting from Class C capital transactions | | | | |
| | | | |
Proceeds from shares issued | | | | |
| | | | |
| | | | |
Change in net assets resulting from Class I capital transactions | | | | |
| | | | |
Proceeds from shares issued | | | | |
| | | | |
| | | | |
Change in net assets resulting from Class L capital transactions | | | | |
| | | | |
Proceeds from shares issued | | | | |
| | | | |
| | | | |
Change in net assets resulting from Class R2 capital transactions | | | | |
| | | | |
Proceeds from shares issued | | | | |
| | | | |
| | | | |
Change in net assets resulting from Class R3 capital transactions | | | | |
| | | | |
Proceeds from shares issued | | | | |
| | | | |
| | | | |
Change in net assets resulting from Class R4 capital transactions | | | | |
SEE NOTES TO FINANCIAL STATEMENTS.
| J.P. Morgan Small Cap Funds | |
| JPMorgan Small Cap Growth Fund | JPMorgan Small Cap Sustainable Leaders Fund |
| | | | |
CAPITAL TRANSACTIONS: (continued) | | | | |
| | | | |
Proceeds from shares issued | | | | |
| | | | |
| | | | |
Change in net assets resulting from Class R5 capital transactions | | | | |
| | | | |
Proceeds from shares issued | | | | |
| | | | |
| | | | |
Change in net assets resulting from Class R6 capital transactions | | | | |
Total change in net assets resulting from capital transactions | | | | |
| | | | |
| | | | |
| | | | |
| | | | |
| | | | |
| | | | |
| | | | |
| | | | |
| | | | |
| | | | |
| | | | |
| | | | |
| | | | |
| | | | |
| | | | |
| | | | |
| | | | |
| | | | |
| | | | |
| | | | |
| | | | |
(a)
Amount rounds to less than one thousand.
SEE NOTES TO FINANCIAL STATEMENTS.
| J.P. Morgan Small Cap Funds | |
STATEMENTS OF CHANGES IN NET ASSETS
FOR THE PERIODS INDICATED (continued)
(Amounts in thousands)
| JPMorgan Small Cap Growth Fund | JPMorgan Small Cap Sustainable Leaders Fund |
| | | | |
SHARE TRANSACTIONS: (continued) | | | | |
| | | | |
| | | | |
| | | | |
| | | | |
Change in Class R2 Shares | | | | |
| | | | |
| | | | |
| | | | |
| | | | |
Change in Class R3 Shares | | | | |
| | | | |
| | | | |
| | | | |
| | | | |
Change in Class R4 Shares | | | | |
| | | | |
| | | | |
| | | | |
| | | | |
Change in Class R5 Shares | | | | |
| | | | |
| | | | |
| | | | |
| | | | |
Change in Class R6 Shares | | | | |
SEE NOTES TO FINANCIAL STATEMENTS.
| J.P. Morgan Small Cap Funds | |
| JPMorgan Small Cap Value Fund | JPMorgan SMID Cap Equity Fund |
| | | | |
| | | | |
| | | | |
Proceeds from shares issued | | | | |
| | | | |
| | | | |
Change in net assets resulting from Class A capital transactions | | | | |
| | | | |
Proceeds from shares issued | | | | |
| | | | |
| | | | |
Change in net assets resulting from Class C capital transactions | | | | |
| | | | |
Proceeds from shares issued | | | | |
| | | | |
| | | | |
Change in net assets resulting from Class I capital transactions | | | | |
| | | | |
Proceeds from shares issued | | | | |
| | | | |
| | | | |
Change in net assets resulting from Class R2 capital transactions | | | | |
| | | | |
Proceeds from shares issued | | | | |
| | | | |
| | | | |
Change in net assets resulting from Class R3 capital transactions | | | | |
| | | | |
Proceeds from shares issued | | | | |
| | | | |
| | | | |
Change in net assets resulting from Class R4 capital transactions | | | | |
| | | | |
Proceeds from shares issued | | | | |
| | | | |
| | | | |
Change in net assets resulting from Class R5 capital transactions | | | | |
SEE NOTES TO FINANCIAL STATEMENTS.
| J.P. Morgan Small Cap Funds | |
STATEMENTS OF CHANGES IN NET ASSETS
FOR THE PERIODS INDICATED (continued)
(Amounts in thousands)
| JPMorgan Small Cap Value Fund | JPMorgan SMID Cap Equity Fund |
| | | | |
CAPITAL TRANSACTIONS: (continued) | | | | |
| | | | |
Proceeds from shares issued | | | | |
| | | | |
| | | | |
Change in net assets resulting from Class R6 capital transactions | | | | |
Total change in net assets resulting from capital transactions | | | | |
| | | | |
| | | | |
| | | | |
| | | | |
| | | | |
| | | | |
| | | | |
| | | | |
| | | | |
| | | | |
| | | | |
| | | | |
| | | | |
| | | | |
| | | | |
| | | | |
| | | | |
| | | | |
| | | | |
| | | | |
Change in Class R2 Shares | | | | |
| | | | |
| | | | |
| | | | |
| | | | |
Change in Class R3 Shares | | | | |
| | | | |
| | | | |
| | | | |
| | | | |
Change in Class R4 Shares | | | | |
(a)
Amount rounds to less than one thousand.
SEE NOTES TO FINANCIAL STATEMENTS.
| J.P. Morgan Small Cap Funds | |
| JPMorgan Small Cap Value Fund | JPMorgan SMID Cap Equity Fund |
| | | | |
SHARE TRANSACTIONS: (continued) | | | | |
| | | | |
| | | | |
| | | | |
| | | | |
Change in Class R5 Shares | | | | |
| | | | |
| | | | |
| | | | |
| | | | |
Change in Class R6 Shares | | | | |
SEE NOTES TO FINANCIAL STATEMENTS.
| J.P. Morgan Small Cap Funds | |
STATEMENTS OF CHANGES IN NET ASSETS
FOR THE PERIODS INDICATED (continued)
(Amounts in thousands)
| JPMorgan U.S. Small Company Fund |
| | |
| | |
| | |
Proceeds from shares issued | | |
| | |
| | |
Change in net assets resulting from Class A capital transactions | | |
| | |
Proceeds from shares issued | | |
| | |
| | |
Change in net assets resulting from Class C capital transactions | | |
| | |
Proceeds from shares issued | | |
| | |
| | |
Change in net assets resulting from Class I capital transactions | | |
| | |
Proceeds from shares issued | | |
| | |
| | |
Change in net assets resulting from Class L capital transactions | | |
| | |
Proceeds from shares issued | | |
| | |
| | |
Change in net assets resulting from Class R2 capital transactions | | |
| | |
Proceeds from shares issued | | |
| | |
| | |
Change in net assets resulting from Class R3 capital transactions | | |
| | |
Proceeds from shares issued | | |
| | |
| | |
Change in net assets resulting from Class R4 capital transactions | | |
| | |
Proceeds from shares issued | | |
| | |
| | |
Change in net assets resulting from Class R5 capital transactions | | |
SEE NOTES TO FINANCIAL STATEMENTS.
| J.P. Morgan Small Cap Funds | |
| JPMorgan U.S. Small Company Fund |
| | |
CAPITAL TRANSACTIONS: (continued) | | |
| | |
Proceeds from shares issued | | |
| | |
| | |
Change in net assets resulting from Class R6 capital transactions | | |
Total change in net assets resulting from capital transactions | | |
| | |
| | |
| | |
| | |
| | |
| | |
| | |
| | |
| | |
| | |
| | |
| | |
| | |
| | |
| | |
| | |
| | |
| | |
| | |
| | |
| | |
| | |
| | |
| | |
| | |
Change in Class R2 Shares | | |
| | |
| | |
| | |
| | |
Change in Class R3 Shares | | |
SEE NOTES TO FINANCIAL STATEMENTS.
| J.P. Morgan Small Cap Funds | |
STATEMENTS OF CHANGES IN NET ASSETS
FOR THE PERIODS INDICATED (continued)
(Amounts in thousands)
| JPMorgan U.S. Small Company Fund |
| | |
SHARE TRANSACTIONS: (continued) | | |
| | |
| | |
| | |
| | |
Change in Class R4 Shares | | |
| | |
| | |
| | |
| | |
Change in Class R5 Shares | | |
| | |
| | |
| | |
| | |
Change in Class R6 Shares | | |
SEE NOTES TO FINANCIAL STATEMENTS.
| J.P. Morgan Small Cap Funds | |
THIS PAGE IS INTENTIONALLY LEFT BLANK
FINANCIAL HIGHLIGHTS
FOR THE PERIODS INDICATED
| Per share operating performance |
| | | |
| Net asset
value,
beginning
of period | Net
investment
income
(loss)(b) | Net realized
and unrealized
gains
(losses) on
investments | Total from
investment
operations | | | |
JPMorgan Small Cap Blend Fund | | | | | | | |
| | | | | | | |
| | | | | | | |
| | | | | | | |
| | | | | | | |
| | | | | | | |
| | | | | | | |
| | | | | | | |
| | | | | | | |
| | | | | | | |
| | | | | | | |
| | | | | | | |
| | | | | | | |
| | | | | | | |
| | | | | | | |
| | | | | | | |
| | | | | | | |
| | | | | | | |
| | | | | | | |
| | | | | | | |
| | | | | | | |
| | | | | | | |
| | | | | | | |
| | | | | | | |
July 2, 2018 (g) through June 30, 2019 | | | | | | | |
|
| Annualized for periods less than one year, unless otherwise noted. |
| Calculated based upon average shares outstanding. |
| Not annualized for periods less than one year. |
| Includes adjustments in accordance with accounting principles generally accepted in the United States of America and as such, the net asset values for financial reporting purposes and the returns based upon those net asset values may differ from the net asset values and returns for shareholder transactions. |
| Includes interest expense, if applicable, each of which is less than 0.005% unless otherwise noted. |
| Amount rounds to less than $0.005. |
| Commencement of offering of class of shares. |
SEE NOTES TO FINANCIAL STATEMENTS.
| J.P. Morgan Small Cap Funds | |
| |
| | | Ratios to average net assets(a) |
Net asset
value,
end of
period | Total return
(excludes
sales charge)(c)(d) | Net assets,
end of
period
(000's) | | Net
investment
income
(loss) | Expenses without
waivers and reimbursements | |
| | | | | | |
| | | | | | |
| | | | | | |
| | | | | | |
| | | | | | |
| | | | | | |
| | | | | | |
| | | | | | |
| | | | | | |
| | | | | | |
| | | | | | |
| | | | | | |
| | | | | | |
| | | | | | |
| | | | | | |
| | | | | | |
| | | | | | |
| | | | | | |
| | | | | | |
| | | | | | |
| | | | | | |
| | | | | | |
| | | | | | |
| | | | | | |
| | | | | | |
SEE NOTES TO FINANCIAL STATEMENTS.
| J.P. Morgan Small Cap Funds | |
FINANCIAL HIGHLIGHTS
FOR THE PERIODS INDICATED
| Per share operating performance |
| | | |
| Net asset
value,
beginning
of period | Net
investment
income
(loss)(a) | Net realized
and unrealized
gains
(losses) on
investments | Total from
investment
operations | | | |
JPMorgan Small Cap Equity Fund | | | | | | | |
| | | | | | | |
| | | | | | | |
| | | | | | | |
| | | | | | | |
| | | | | | | |
| | | | | | | |
| | | | | | | |
| | | | | | | |
| | | | | | | |
| | | | | | | |
| | | | | | | |
| | | | | | | |
| | | | | | | |
| | | | | | | |
| | | | | | | |
| | | | | | | |
| | | | | | | |
| | | | | | | |
| | | | | | | |
| | | | | | | |
| | | | | | | |
| | | | | | | |
| | | | | | | |
| | | | | | | |
| | | | | | | |
| | | | | | | |
| | | | | | | |
| | | | | | | |
| | | | | | | |
| | | | | | | |
| | | | | | | |
| | | | | | | |
| | | | | | | |
| | | | | | | |
| | | | | | | |
| | | | | | | |
| | | | | | | |
| | | | | | | |
| | | | | | | |
| | | | | | | |
| | | | | | | |
| | | | | | | |
| | | | | | | |
| | | | | | | |
| | | | | | | |
| | | | | | | |
| | | | | | | |
| | | | | | | |
|
| Calculated based upon average shares outstanding. |
| Includes adjustments in accordance with accounting principles generally accepted in the United States of America and as such, the net asset values for financial reporting purposes and the returns based upon those net asset values may differ from the net asset values and returns for shareholder transactions. |
| Includes interest expense, if applicable, each of which is less than 0.005% unless otherwise noted. |
| Amount rounds to less than $0.005. |
| Amount rounds to less than 0.005%. |
SEE NOTES TO FINANCIAL STATEMENTS.
| J.P. Morgan Small Cap Funds | |
| |
| | | Ratios to average net assets |
Net asset
value,
end of
period | Total return
(excludes
sales charge)(b) | Net assets,
end of
period
(000's) | | Net
investment
income
(loss) | Expenses without
waivers and reimbursements | |
| | | | | | |
| | | | | | |
| | | | | | |
| | | | | | |
| | | | | | |
| | | | | | |
| | | | | | |
| | | | | | |
| | | | | | |
| | | | | | |
| | | | | | |
| | | | | | |
| | | | | | |
| | | | | | |
| | | | | | |
| | | | | | |
| | | | | | |
| | | | | | |
| | | | | | |
| | | | | | |
| | | | | | |
| | | | | | |
| | | | | | |
| | | | | | |
| | | | | | |
| | | | | | |
| | | | | | |
| | | | | | |
| | | | | | |
| | | | | | |
| | | | | | |
| | | | | | |
| | | | | | |
| | | | | | |
| | | | | | |
| | | | | | |
| | | | | | |
| | | | | | |
| | | | | | |
| | | | | | |
| | | | | | |
| | | | | | |
| | | | | | |
| | | | | | |
| | | | | | |
| | | | | | |
| | | | | | |
| | | | | | |
| | | | | | |
SEE NOTES TO FINANCIAL STATEMENTS.
| J.P. Morgan Small Cap Funds | |
FINANCIAL HIGHLIGHTS
FOR THE PERIODS INDICATED
| Per share operating performance |
| | | |
| Net asset
value,
beginning
of period | Net
investment
income
(loss)(a) | Net realized
and unrealized
gains
(losses) on
investments | Total from
investment
operations | | | |
JPMorgan Small Cap Growth Fund | | | | | | | |
| | | | | | | |
| | | | | | | |
| | | | | | | |
| | | | | | | |
| | | | | | | |
| | | | | | | |
| | | | | | | |
| | | | | | | |
| | | | | | | |
| | | | | | | |
| | | | | | | |
| | | | | | | |
| | | | | | | |
| | | | | | | |
| | | | | | | |
| | | | | | | |
| | | | | | | |
| | | | | | | |
| | | | | | | |
| | | | | | | |
| | | | | | | |
| | | | | | | |
| | | | | | | |
| | | | | | | |
| | | | | | | |
| | | | | | | |
| | | | | | | |
| | | | | | | |
| | | | | | | |
| | | | | | | |
| | | | | | | |
| | | | | | | |
| | | | | | | |
| | | | | | | |
| | | | | | | |
| | | | | | | |
| | | | | | | |
| | | | | | | |
| | | | | | | |
| | | | | | | |
| | | | | | | |
| | | | | | | |
SEE NOTES TO FINANCIAL STATEMENTS.
| J.P. Morgan Small Cap Funds | |
| |
| | | Ratios to average net assets |
Net asset
value,
end of
period | Total return
(excludes
sales charge)(b) | Net assets,
end of
period
(000's) | | Net
investment
income
(loss) | Expenses without
waivers and reimbursements | |
| | | | | | |
| | | | | | |
| | | | | | |
| | | | | | |
| | | | | | |
| | | | | | |
| | | | | | |
| | | | | | |
| | | | | | |
| | | | | | |
| | | | | | |
| | | | | | |
| | | | | | |
| | | | | | |
| | | | | | |
| | | | | | |
| | | | | | |
| | | | | | |
| | | | | | |
| | | | | | |
| | | | | | |
| | | | | | |
| | | | | | |
| | | | | | |
| | | | | | |
| | | | | | |
| | | | | | |
| | | | | | |
| | | | | | |
| | | | | | |
| | | | | | |
| | | | | | |
| | | | | | |
| | | | | | |
| | | | | | |
| | | | | | |
| | | | | | |
| | | | | | |
| | | | | | |
| | | | | | |
| | | | | | |
| | | | | | |
| | | | | | |
SEE NOTES TO FINANCIAL STATEMENTS.
| J.P. Morgan Small Cap Funds | |
FINANCIAL HIGHLIGHTS
FOR THE PERIODS INDICATED (continued)
| Per share operating performance |
| | | |
| Net asset
value,
beginning
of period | Net
investment
income
(loss)(a) | Net realized
and unrealized
gains
(losses) on
investments | Total from
investment
operations | | | |
JPMorgan Small Cap Growth Fund (continued) | | | | | | | |
| | | | | | | |
| | | | | | | |
| | | | | | | |
| | | | | | | |
| | | | | | | |
| | | | | | | |
| | | | | | | |
| | | | | | | |
| | | | | | | |
| | | | | | | |
| | | | | | | |
| | | | | | | |
|
| Calculated based upon average shares outstanding. |
| Includes adjustments in accordance with accounting principles generally accepted in the United States of America and as such, the net asset values for financial reporting purposes and the returns based upon those net asset values may differ from the net asset values and returns for shareholder transactions. |
| Includes interest expense, if applicable, each of which is less than 0.005% unless otherwise noted. |
SEE NOTES TO FINANCIAL STATEMENTS.
| J.P. Morgan Small Cap Funds | |
| |
| | | Ratios to average net assets |
Net asset
value,
end of
period | Total return
(excludes
sales charge)(b) | Net assets,
end of
period
(000's) | | Net
investment
income
(loss) | Expenses without
waivers and reimbursements | |
|
| | | | | | |
| | | | | | |
| | | | | | |
| | | | | | |
| | | | | | |
| | | | | | |
| | | | | | |
| | | | | | |
| | | | | | |
| | | | | | |
| | | | | | |
| | | | | | |
SEE NOTES TO FINANCIAL STATEMENTS.
| J.P. Morgan Small Cap Funds | |
FINANCIAL HIGHLIGHTS
FOR THE PERIODS INDICATED
| Per share operating performance |
| | | |
| Net asset
value,
beginning
of period | Net
investment
income
(loss)(a) | Net realized
and unrealized
gains
(losses) on
investments | Total from
investment
operations | | | |
JPMorgan Small Cap Sustainable Leaders Fund | | | | | | | |
| | | | | | | |
| | | | | | | |
| | | | | | | |
| | | | | | | |
| | | | | | | |
| | | | | | | |
| | | | | | | |
| | | | | | | |
| | | | | | | |
| | | | | | | |
| | | | | | | |
| | | | | | | |
| | | | | | | |
| | | | | | | |
| | | | | | | |
| | | | | | | |
| | | | | | | |
| | | | | | | |
| | | | | | | |
| | | | | | | |
| | | | | | | |
| | | | | | | |
| | | | | | | |
| | | | | | | |
| | | | | | | |
| | | | | | | |
| | | | | | | |
| | | | | | | |
| | | | | | | |
| | | | | | | |
| | | | | | | |
| | | | | | | |
| | | | | | | |
| | | | | | | |
| | | | | | | |
| | | | | | | |
| | | | | | | |
| | | | | | | |
| | | | | | | |
| | | | | | | |
| | | | | | | |
| | | | | | | |
| | | | | | | |
| | | | | | | |
| | | | | | | |
| | | | | | | |
| | | | | | | |
| | | | | | | |
|
| Calculated based upon average shares outstanding. |
| Includes adjustments in accordance with accounting principles generally accepted in the United States of America and as such, the net asset values for financial reporting purposes and the returns based upon those net asset values may differ from the net asset values and returns for shareholder transactions. |
| Includes interest expense, if applicable, each of which is less than 0.005% unless otherwise noted. |
| Amount rounds to less than $0.005. |
SEE NOTES TO FINANCIAL STATEMENTS.
| J.P. Morgan Small Cap Funds | |
| |
| | | Ratios to average net assets |
Net asset
value,
end of
period | Total return
(excludes
sales charge)(b) | Net assets,
end of
period
(000's) | | Net
investment
income
(loss) | Expenses without
waivers and reimbursements | |
| | | | | | |
| | | | | | |
| | | | | | |
| | | | | | |
| | | | | | |
| | | | | | |
| | | | | | |
| | | | | | |
| | | | | | |
| | | | | | |
| | | | | | |
| | | | | | |
| | | | | | |
| | | | | | |
| | | | | | |
| | | | | | |
| | | | | | |
| | | | | | |
| | | | | | |
| | | | | | |
| | | | | | |
| | | | | | |
| | | | | | |
| | | | | | |
| | | | | | |
| | | | | | |
| | | | | | |
| | | | | | |
| | | | | | |
| | | | | | |
| | | | | | |
| | | | | | |
| | | | | | |
| | | | | | |
| | | | | | |
| | | | | | |
| | | | | | |
| | | | | | |
| | | | | | |
| | | | | | |
| | | | | | |
| | | | | | |
| | | | | | |
| | | | | | |
| | | | | | |
| | | | | | |
| | | | | | |
| | | | | | |
| | | | | | |
SEE NOTES TO FINANCIAL STATEMENTS.
| J.P. Morgan Small Cap Funds | |
FINANCIAL HIGHLIGHTS
FOR THE PERIODS INDICATED
| Per share operating performance |
| | | |
| Net asset
value,
beginning
of period | Net
investment
income
(loss)(a) | Net realized
and unrealized
gains
(losses) on
investments | Total from
investment
operations | | | |
JPMorgan Small Cap Value Fund | | | | | | | |
| | | | | | | |
| | | | | | | |
| | | | | | | |
| | | | | | | |
| | | | | | | |
| | | | | | | |
| | | | | | | |
| | | | | | | |
| | | | | | | |
| | | | | | | |
| | | | | | | |
| | | | | | | |
| | | | | | | |
| | | | | | | |
| | | | | | | |
| | | | | | | |
| | | | | | | |
| | | | | | | |
| | | | | | | |
| | | | | | | |
| | | | | | | |
| | | | | | | |
| | | | | | | |
| | | | | | | |
| | | | | | | |
| | | | | | | |
| | | | | | | |
| | | | | | | |
| | | | | | | |
| | | | | | | |
| | | | | | | |
| | | | | | | |
| | | | | | | |
| | | | | | | |
| | | | | | | |
| | | | | | | |
| | | | | | | |
| | | | | | | |
| | | | | | | |
| | | | | | | |
| | | | | | | |
| | | | | | | |
| | | | | | | |
| | | | | | | |
| | | | | | | |
| | | | | | | |
| | | | | | | |
| | | | | | | |
|
| Calculated based upon average shares outstanding. |
| Includes adjustments in accordance with accounting principles generally accepted in the United States of America and as such, the net asset values for financial reporting purposes and the returns based upon those net asset values may differ from the net asset values and returns for shareholder transactions. |
| Includes interest expense, if applicable, each of which is less than 0.005% unless otherwise noted. |
SEE NOTES TO FINANCIAL STATEMENTS.
| J.P. Morgan Small Cap Funds | |
| |
| | | Ratios to average net assets |
Net asset
value,
end of
period | Total return
(excludes
sales charge)(b) | Net assets,
end of
period
(000's) | | Net
investment
income
(loss) | Expenses without
waivers and reimbursements | |
| | | | | | |
| | | | | | |
| | | | | | |
| | | | | | |
| | | | | | |
| | | | | | |
| | | | | | |
| | | | | | |
| | | | | | |
| | | | | | |
| | | | | | |
| | | | | | |
| | | | | | |
| | | | | | |
| | | | | | |
| | | | | | |
| | | | | | |
| | | | | | |
| | | | | | |
| | | | | | |
| | | | | | |
| | | | | | |
| | | | | | |
| | | | | | |
| | | | | | |
| | | | | | |
| | | | | | |
| | | | | | |
| | | | | | |
| | | | | | |
| | | | | | |
| | | | | | |
| | | | | | |
| | | | | | |
| | | | | | |
| | | | | | |
| | | | | | |
| | | | | | |
| | | | | | |
| | | | | | |
| | | | | | |
| | | | | | |
| | | | | | |
| | | | | | |
| | | | | | |
| | | | | | |
| | | | | | |
| | | | | | |
| | | | | | |
SEE NOTES TO FINANCIAL STATEMENTS.
| J.P. Morgan Small Cap Funds | |
FINANCIAL HIGHLIGHTS
FOR THE PERIODS INDICATED
| Per share operating performance |
| | | |
| Net asset
value,
beginning
of period | Net
investment
income
(loss)(a) | Net realized
and unrealized
gains
(losses) on
investments | Total from
investment
operations | | | |
JPMorgan SMID Cap Equity Fund | | | | | | | |
| | | | | | | |
| | | | | | | |
| | | | | | | |
| | | | | | | |
| | | | | | | |
| | | | | | | |
| | | | | | | |
| | | | | | | |
| | | | | | | |
| | | | | | | |
| | | | | | | |
| | | | | | | |
| | | | | | | |
| | | | | | | |
| | | | | | | |
| | | | | | | |
| | | | | | | |
| | | | | | | |
| | | | | | | |
| | | | | | | |
| | | | | | | |
| | | | | | | |
| | | | | | | |
| | | | | | | |
| | | | | | | |
| | | | | | | |
| | | | | | | |
| | | | | | | |
| | | | | | | |
| | | | | | | |
| | | | | | | |
| | | | | | | |
| | | | | | | |
| | | | | | | |
| | | | | | | |
| | | | | | | |
|
| Calculated based upon average shares outstanding. |
| Includes adjustments in accordance with accounting principles generally accepted in the United States of America and as such, the net asset values for financial reporting purposes and the returns based upon those net asset values may differ from the net asset values and returns for shareholder transactions. |
| Includes interest expense, if applicable, each of which is less than 0.005% unless otherwise noted. |
| Amount rounds to less than $0.005. |
| Amount rounds to less than 0.005%. |
SEE NOTES TO FINANCIAL STATEMENTS.
| J.P. Morgan Small Cap Funds | |
| |
| | | Ratios to average net assets |
Net asset
value,
end of
period | Total return
(excludes
sales charge)(b) | Net assets,
end of
period
(000's) | | Net
investment
income
(loss) | Expenses without
waivers and reimbursements | |
| | | | | | |
| | | | | | |
| | | | | | |
| | | | | | |
| | | | | | |
| | | | | | |
| | | | | | |
| | | | | | |
| | | | | | |
| | | | | | |
| | | | | | |
| | | | | | |
| | | | | | |
| | | | | | |
| | | | | | |
| | | | | | |
| | | | | | |
| | | | | | |
| | | | | | |
| | | | | | |
| | | | | | |
| | | | | | |
| | | | | | |
| | | | | | |
| | | | | | |
| | | | | | |
| | | | | | |
| | | | | | |
| | | | | | |
| | | | | | |
| | | | | | |
| | | | | | |
| | | | | | |
| | | | | | |
| | | | | | |
| | | | | | |
| | | | | | |
SEE NOTES TO FINANCIAL STATEMENTS.
| J.P. Morgan Small Cap Funds | |
FINANCIAL HIGHLIGHTS
FOR THE PERIODS INDICATED
| Per share operating performance |
| | | |
| Net asset
value,
beginning
of period | Net
investment
income
(loss)(a) | Net realized
and unrealized
gains
(losses) on
investments | Total from
investment
operations | | | |
JPMorgan U.S. Small Company Fund | | | | | | | |
| | | | | | | |
| | | | | | | |
| | | | | | | |
| | | | | | | |
| | | | | | | |
| | | | | | | |
| | | | | | | |
| | | | | | | |
| | | | | | | |
| | | | | | | |
| | | | | | | |
| | | | | | | |
| | | | | | | |
| | | | | | | |
| | | | | | | |
| | | | | | | |
| | | | | | | |
| | | | | | | |
| | | | | | | |
| | | | | | | |
| | | | | | | |
| | | | | | | |
| | | | | | | |
| | | | | | | |
| | | | | | | |
| | | | | | | |
| | | | | | | |
| | | | | | | |
| | | | | | | |
| | | | | | | |
| | | | | | | |
| | | | | | | |
| | | | | | | |
| | | | | | | |
| | | | | | | |
| | | | | | | |
| | | | | | | |
| | | | | | | |
| | | | | | | |
| | | | | | | |
| | | | | | | |
| | | | | | | |
SEE NOTES TO FINANCIAL STATEMENTS.
| J.P. Morgan Small Cap Funds | |
| |
| | | Ratios to average net assets |
Net asset
value,
end of
period | Total return
(excludes
sales charge)(b) | Net assets,
end of
period
(000's) | | Net
investment
income
(loss) | Expenses without
waivers and reimbursements | |
| | | | | | |
| | | | | | |
| | | | | | |
| | | | | | |
| | | | | | |
| | | | | | |
| | | | | | |
| | | | | | |
| | | | | | |
| | | | | | |
| | | | | | |
| | | | | | |
| | | | | | |
| | | | | | |
| | | | | | |
| | | | | | |
| | | | | | |
| | | | | | |
| | | | | | |
| | | | | | |
| | | | | | |
| | | | | | |
| | | | | | |
| | | | | | |
| | | | | | |
| | | | | | |
| | | | | | |
| | | | | | |
| | | | | | |
| | | | | | |
| | | | | | |
| | | | | | |
| | | | | | |
| | | | | | |
| | | | | | |
| | | | | | |
| | | | | | |
| | | | | | |
| | | | | | |
| | | | | | |
| | | | | | |
| | | | | | |
| | | | | | |
SEE NOTES TO FINANCIAL STATEMENTS.
| J.P. Morgan Small Cap Funds | |
FINANCIAL HIGHLIGHTS
FOR THE PERIODS INDICATED (continued)
| Per share operating performance |
| | | |
| Net asset
value,
beginning
of period | Net
investment
income
(loss)(a) | Net realized
and unrealized
gains
(losses) on
investments | Total from
investment
operations | | | |
JPMorgan U.S. Small Company Fund (continued) | | | | | | | |
| | | | | | | |
| | | | | | | |
| | | | | | | |
| | | | | | | |
| | | | | | | |
| | | | | | | |
| | | | | | | |
| | | | | | | |
| | | | | | | |
| | | | | | | |
| | | | | | | |
| | | | | | | |
|
| Calculated based upon average shares outstanding. |
| Includes adjustments in accordance with accounting principles generally accepted in the United States of America and as such, the net asset values for financial reporting purposes and the returns based upon those net asset values may differ from the net asset values and returns for shareholder transactions. |
| Includes interest expense, if applicable, each of which is less than 0.005% unless otherwise noted. |
| Amount rounds to less than $0.005. |
SEE NOTES TO FINANCIAL STATEMENTS.
| J.P. Morgan Small Cap Funds | |
| |
| | | Ratios to average net assets |
Net asset
value,
end of
period | Total return
(excludes
sales charge)(b) | Net assets,
end of
period
(000's) | | Net
investment
income
(loss) | Expenses without
waivers and reimbursements | |
|
| | | | | | |
| | | | | | |
| | | | | | |
| | | | | | |
| | | | | | |
| | | | | | |
| | | | | | |
| | | | | | |
| | | | | | |
| | | | | | |
| | | | | | |
| | | | | | |
SEE NOTES TO FINANCIAL STATEMENTS.
| J.P. Morgan Small Cap Funds | |
NOTES TO FINANCIAL STATEMENTS
AS OF June 30, 2023
(Dollar values in thousands)
1. Organization
JPMorgan Trust I (“JPM I") and JPMorgan Trust II (“JPM II") (collectively, the “Trusts”) were formed on November 12, 2004, as Delaware statutory trusts, pursuant to Declarations of Trust dated November 5, 2004 and are registered under the Investment Company Act of 1940, as amended (the “1940 Act”), as open-end management investment companies.
The following are 7 separate funds of the Trusts (each, a "Fund" and collectively, the "Funds") covered by this report:
| | | Diversification Classification |
JPMorgan Small Cap Blend Fund | Class A, Class C, Class I and Class R6 | | |
JPMorgan Small Cap Equity Fund | Class A, Class C, Class I, Class R2, Class R3, Class R4, Class R5 and Class R6 | | |
JPMorgan Small Cap Growth Fund | Class A, Class C, Class I, Class L, Class R2, Class R3, Class R4, Class R5 and Class R6 | | |
JPMorgan Small Cap Sustainable Leaders Fund | Class A, Class C, Class I, Class R2, Class R3, Class R4, Class R5 and Class R6 | | |
JPMorgan Small Cap Value Fund | Class A, Class C, Class I, Class R2, Class R3, Class R4, Class R5 and Class R6 | | |
JPMorgan SMID Cap Equity Fund | Class A, Class C, Class I, Class R3, Class R4 and Class R6 | | |
JPMorgan U.S. Small Company Fund | Class A, Class C, Class I, Class L, Class R2, Class R3, Class R4, Class R5 and Class R6 | | |
The investment objective of JPMorgan Small Cap Blend Fund (“Small Cap Blend Fund”), JPMorgan Small Cap Equity Fund (“Small Cap Equity Fund”) and JPMorgan Small Cap Sustainable Leaders Fund (“Small Cap Sustainable Leaders Fund”) is to seek capital growth over the long term.
The investment objective of JPMorgan Small Cap Growth Fund (“Small Cap Growth Fund”) is to seek long-term capital growth primarily by investing in a portfolio of equity securities of small-capitalization and emerging growth companies.
The investment objective of JPMorgan Small Cap Value Fund (“Small Cap Value Fund”) is to seek long-term capital growth primarily by investing in equity securities of small-capitalization companies.
The investment objective of JPMorgan SMID Cap Equity Fund (“SMID Cap Equity Fund”) is to seek long-term capital growth by investing primarily in equity securities of companies with intermediate capitalizations.
The investment objective of JPMorgan U.S. Small Company Fund (“U.S. Small Company Fund”) is to seek to provide high total return from a portfolio of small company stocks.
Class L Shares of Small Cap Growth Fund and U.S. Small Company Fund are publicly offered on a limited basis. Investors are not eligible to purchase Class L Shares of the U.S. Small Company Fund unless they meet certain requirements as described in the U.S. Small Company Fund's prospectus.
Prior to October, 28, 2022, share classes of Small Cap Equity Fund were publicly offered on a limited basis. Investors were not eligible to purchase shares of the Small Cap Equity Fund unless they met certain requirements as described in the Small Cap Equity Fund's prospectus.
Class A Shares generally provide for a front-end sales charge while Class C Shares provide for a contingent deferred sales charge ("CDSC"). No sales charges are assessed with respect to Class I, Class L, Class R2, Class R3, Class R4, Class R5 and Class R6 Shares. Certain Class A Shares, for which front-end sales charges have been waived, may be subject to a CDSC as described in the Funds' prospectus. Class C Shares automatically convert to Class A Shares after eight years. All classes of shares have equal rights as to earnings, assets and voting privileges, except that each class may bear different transfer agency, distribution and service fees and each class has exclusive voting rights with respect to its distribution plan and shareholder servicing agreements.
J.P. Morgan Investment Management Inc. (“JPMIM”), an indirect, wholly-owned subsidiary of JPMorgan Chase & Co. (“JPMorgan”), acts as adviser (the “Adviser”) and administrator (the “Administrator”) to the Funds.
2. Significant Accounting Policies
The following is a summary of significant accounting policies followed by the Funds in the preparation of their financial statements. The Funds are investment companies and, accordingly, follow the investment company accounting and reporting guidance of the Financial Accounting Standards Board (“FASB”) Accounting Standards Codification Topic 946 — Investment Companies, which is part of U.S. generally accepted accounting principles (“GAAP”). The preparation of financial statements in conformity with GAAP requires management to make estimates and assumptions that affect (i) the reported amounts of assets and liabilities, (ii) disclosure of contingent assets and liabilities at the date of the financial statements, and (iii) the reported amounts of increases and decreases in net assets from operations during the reporting period. Actual results could differ from those estimates.
| J.P. Morgan Small Cap Funds | |
A. Valuation of Investments — Investments are valued in accordance with GAAP and the Funds' valuation policies set forth by, and under the supervision and responsibility of, the Boards of Trustees of the Trusts (the "Boards"), which established the following approach to valuation, as described more fully below: (i) investments for which market quotations are readily available shall be valued at their market value and (ii) all other investments for which market quotations are not readily available shall be valued at their fair value as determined in good faith by the Boards.
Under Section 2(a)(41) of the 1940 Act, the Boards are required to determine fair value for securities that do not have readily available market quotations. Under SEC Rule 2a-5 (Good Faith Determinations of Fair Value), the Boards may designate the performance of these fair valuation determinations to a valuation designee. The Boards have designated the Adviser as the “Valuation Designee” to perform fair valuation determinations for the Funds on behalf of the Boards subject to appropriate oversight by the Boards. The Adviser, as Valuation Designee, leverages the J.P. Morgan Asset Management Americas Valuation Committee (“AVC”) to help oversee and carry out the policies for the valuation of investments held in the Funds. The Adviser, as Valuation Designee, remains responsible for the valuation determinations.
This oversight by the AVC includes monitoring the appropriateness of fair values based on results of ongoing valuation oversight including, but not limited to, consideration of macro or security specific events, market events, and pricing vendor and broker due diligence. The Administrator is responsible for discussing and assessing the potential impacts to the fair values on an ongoing basis, and, at least on a quarterly basis, with the AVC and the Boards.
A market-based approach is primarily used to value the Funds' investments. Investments for which market quotations are not readily available are fair valued using prices supplied by approved affiliated and/or unaffiliated pricing vendors or third party broker-dealers (collectively referred to as “Pricing Services”) or may be internally fair valued using methods set forth by the valuation policies approved by the Boards. This may include the use of related or comparable assets or liabilities, recent transactions, market multiples, book values and other relevant information for the investment. An income-based valuation approach may be used in which the anticipated future cash flows of the investment are discounted to calculate the fair value. Discounts may also be applied due to the nature or duration of any restrictions on the disposition of the investments. Valuations may be based upon current market prices of securities that are comparable in coupon, rating, maturity and industry. It is possible that the estimated values may differ significantly from the values that would have been used had a ready market for the investments existed, and such differences could be material.
Equities and other exchange-traded instruments are valued at the last sale price or official market closing price on the primary exchange on which the instrument is traded before the net asset values (“NAV”) of the Funds are calculated on a valuation date.
Investments in open-end investment companies (“Underlying Funds”) are valued at each Underlying Fund’s NAV per share as of the report date.
Futures contracts are generally valued on the basis of available market quotations.
Valuations reflected in this report are as of the report date. As a result, changes in valuation due to market events and/or issuer-related events after the report date and prior to issuance of the report are not reflected herein.
The various inputs that are used in determining the valuation of the Funds' investments are summarized into the three broad levels listed below.
•
Level 1 — Unadjusted inputs using quoted prices in active markets for identical investments.
•
Level 2 — Other significant observable inputs including, but not limited to, quoted prices for similar investments, inputs other than quoted prices that are observable for investments (such as interest rates, prepayment speeds, credit risk, etc.) or other market corroborated inputs.
•
Level 3 — Significant inputs based on the best information available in the circumstances, to the extent observable inputs are not available (including the Funds' assumptions in determining the fair value of investments).
A financial instrument’s level within the fair value hierarchy is based on the lowest level of any input, both individually and in the aggregate, that is significant to the fair value measurement. The inputs or methodology used for valuing instruments are not necessarily an indication of the risk associated with investing in those instruments.
The following tables represent each valuation input as presented on the Schedules of Portfolio Investments ("SOIs"):
| | | | |
| | Level 2
Other significant
observable inputs | Level 3
Significant
unobservable inputs | |
Total Investments in Securities (a) | | | | |
|
| Please refer to the SOI for specifics of portfolio holdings. |
| J.P. Morgan Small Cap Funds | |
NOTES TO FINANCIAL STATEMENTS
AS OF June 30, 2023 (continued)
(Dollar values in thousands)
| | | | |
| | Level 2
Other significant
observable inputs | Level 3
Significant
unobservable inputs | |
Total Investments in Securities (a) | | | | |
|
| Please refer to the SOI for specifics of portfolio holdings. |
| | | | |
| | Level 2
Other significant
observable inputs | Level 3
Significant
unobservable inputs | |
Total Investments in Securities (a) | | | | |
|
| Please refer to the SOI for specifics of portfolio holdings. |
Small Cap Sustainable Leaders Fund | | | | |
| | Level 2
Other significant
observable inputs | Level 3
Significant
unobservable inputs | |
Investments in Securities | | | | |
| | | | |
| | | | |
| | | | |
| | | | |
Total Investments in Securities | | | | |
|
| Amount rounds to less than one thousand. |
| | | | |
| | Level 2
Other significant
observable inputs | Level 3
Significant
unobservable inputs | |
Total Investments in Securities (a) | | | | |
Appreciation in Other Financial Instruments | | | | |
| | | | |
|
| Please refer to the SOI for specifics of portfolio holdings. |
| | | | |
| | Level 2
Other significant
observable inputs | Level 3
Significant
unobservable inputs | |
Total Investments in Securities (a) | | | | |
|
| Please refer to the SOI for specifics of portfolio holdings. |
| J.P. Morgan Small Cap Funds | |
| | | | |
| | Level 2
Other significant
observable inputs | Level 3
Significant
unobservable inputs | |
Investments in Securities | | | | |
| | | | |
| | | | |
| | | | |
| | | | |
| | | | |
| | | | |
| | | | |
| | | | |
| | | | |
| | | | |
Commercial Services & Supplies | | | | |
| | | | |
Construction & Engineering | | | | |
| | | | |
| | | | |
Consumer Staples Distribution & Retail | | | | |
| | | | |
Diversified Consumer Services | | | | |
| | | | |
Diversified Telecommunication Services | | | | |
| | | | |
| | | | |
Electronic Equipment, Instruments & Components | | | | |
Energy Equipment & Services | | | | |
| | | | |
| | | | |
| | | | |
| | | | |
| | | | |
Health Care Equipment & Supplies | | | | |
Health Care Providers & Services | | | | |
| | | | |
| | | | |
| | | | |
Hotels, Restaurants & Leisure | | | | |
| | | | |
| | | | |
Independent Power and Renewable Electricity Producers | | | | |
| | | | |
| | | | |
Interactive Media & Services | | | | |
| | | | |
| | | | |
Life Sciences Tools & Services | | | | |
| | | | |
| | | | |
| | | | |
| | | | |
| J.P. Morgan Small Cap Funds | |
NOTES TO FINANCIAL STATEMENTS
AS OF June 30, 2023 (continued)
(Dollar values in thousands)
U.S. Small Company Fund (continued) | | | | |
| | Level 2 Other significant observable inputs | Level 3 Significant unobservable inputs | |
Mortgage Real Estate Investment Trusts (REITs) | | | | |
| | | | |
| | | | |
Oil, Gas & Consumable Fuels | | | | |
| | | | |
| | | | |
| | | | |
| | | | |
| | | | |
Real Estate Management & Development | | | | |
| | | | |
| | | | |
Semiconductors & Semiconductor Equipment | | | | |
| | | | |
| | | | |
| | | | |
Technology Hardware, Storage & Peripherals | | | | |
Textiles, Apparel & Luxury Goods | | | | |
Trading Companies & Distributors | | | | |
| | | | |
Wireless Telecommunication Services | | | | |
| | | | |
| | | | |
| | | | |
Investment of Cash Collateral from Securities Loaned | | | | |
Total Short-Term Investments | | | | |
Total Investments in Securities | | | | |
Appreciation in Other Financial Instruments | | | | |
| | | | |
|
| Amount rounds to less than one thousand. |
B. Restricted Securities — Certain securities held by the Funds may be subject to legal or contractual restrictions on resale. Restricted securities generally are resold in transactions exempt from registration under the Securities Act of 1933, as amended (the “Securities Act”). Disposal of these securities may involve time-consuming negotiations and expense. Prompt sale at the current valuation may be difficult and could adversely affect the NAVs of the Funds.
As of June 30, 2023, the Funds had no investments in restricted securities other than securities sold to the Funds under Rule 144A and/or Regulation S under the Securities Act.
| J.P. Morgan Small Cap Funds | |
C. Securities Lending — The Funds are authorized to engage in securities lending in order to generate additional income. The Funds are able to lend to approved borrowers. Citibank N.A. (“Citibank”) serves as lending agent for the Funds, pursuant to a Securities Lending Agency Agreement (the “Securities Lending Agency Agreement”). Securities loaned are collateralized by cash equal to at least 100% of the market value plus accrued interest on the securities lent, which is invested in the Class IM Shares of the JPMorgan U.S. Government Money Market Fund and the Agency SL Class Shares of the JPMorgan Securities Lending Money Market Fund. The Funds retain the interest earned on cash collateral investments but are required to pay the borrower a rebate for the use of the cash collateral. In cases where the lent security is of high value to borrowers, there may be a negative rebate (i.e., a net payment from the borrower to the Funds). Upon termination of a loan, the Funds are required to return to the borrower an amount equal to the cash collateral, plus any rebate owed to the borrowers. The remaining maturities of the securities lending transactions are considered overnight and continuous. Loans are subject to termination by the Funds or the borrower at any time.
The net income earned on the securities lending (after payment of rebates and Citibank’s fee) is included on the Statements of Operations as Income from securities lending (net). The Funds also receive payments from the borrower during the period of the loan, equivalent to dividends and interest earned on the securities loaned, which are recorded as Dividend or Interest income, respectively, on the Statements of Operations.
Under the Securities Lending Agency Agreement, Citibank marks to market the loaned securities on a daily basis. In the event the cash received from the borrower is less than 102% of the value of the loaned securities (105% for loans of non-U.S. securities), Citibank requests additional cash from the borrower so as to maintain a collateralization level of at least 102% of the value of the loaned securities plus accrued interest (105% for loans of non-U.S. securities), subject to certain de minimis amounts.
The value of securities out on loan is recorded as an asset on the Statements of Assets and Liabilities. The value of the cash collateral received is recorded as a liability on the Statements of Assets and Liabilities and details of collateral investments are disclosed on the SOIs.
The Funds bear the risk of loss associated with the collateral investments and are not entitled to additional collateral from the borrower to cover any such losses. To the extent that the value of the collateral investments declines below the amount owed to a borrower, the Funds may incur losses that exceed the amount they earned on lending the security. Upon termination of a loan, the Funds may use leverage (borrow money) to repay the borrower for cash collateral posted if the Adviser does not believe that it is prudent to sell the collateral investments to fund the payment of this liability. Securities lending activity is subject to master netting arrangements.
The following table presents for each lending Fund, the value of the securities on loan with Citibank, net of amounts available for offset under the master netting arrangements and any related collateral received or posted by the Funds as of June 30, 2023.
| Investment Securities
on Loan, at value,
Presented on the
Statements of Assets
and Liabilities | Cash Collateral
Posted by Borrower* | Net Amount Due
to Counterparty
(not less than zero) |
| | | |
| | | |
| | | |
| | | |
| | | |
| | | |
|
| Collateral posted reflects the value of securities on loan and does not include any additional amounts received from the borrower. |
Securities lending also involves counterparty risks, including the risk that the loaned securities may not be returned in a timely manner or at all. Subject to certain conditions, Citibank has agreed to indemnify the Funds from losses resulting from a borrower’s failure to return a loaned security.
| J.P. Morgan Small Cap Funds | |
NOTES TO FINANCIAL STATEMENTS
AS OF June 30, 2023 (continued)
(Dollar values in thousands)
JPMIM voluntarily waived investment advisory fees charged to the Funds to reduce the impact of the cash collateral investment in the JPMorgan U.S. Government Money Market Fund from 0.13% to 0.06%. For the year ended June 30, 2023, JPMIM waived fees associated with the Funds' investment in the JPMorgan U.S. Government Money Market Fund as follows:
| |
| |
| |
Small Cap Sustainable Leaders Fund | |
| |
| |
| |
|
| Amount rounds to less than one thousand. |
The above waiver is included in the determination of earnings on cash collateral investment and in the calculation of Citibank’s compensation and is included on the Statements of Operations as Income from securities lending (net).
D. Investment Transactions with Affiliates — The Funds invested in Underlying Funds advised by the Adviser. An issuer which is under common control with a Fund may be considered an affiliate. For the purposes of the financial statements, the Funds assume the issuers listed in the tables below to be affiliated issuers. The Underlying Funds’ distributions may be reinvested into such Underlying Funds. Reinvestment amounts are included in the purchases at cost amounts in the tables below.
|
For the year ended June 30, 2023 |
| | | | | Change in
Unrealized
Appreciation/
(Depreciation) | | | | Capital Gain
Distributions |
JPMorgan Prime Money Market Fund Class IM Shares, 5.23% (a) (b) | | | | | | | | | |
JPMorgan Securities Lending Money Market Fund Agency SL Class Shares, 5.29% (a) (b) | | | | | | | | | |
JPMorgan U.S. Government Money Market Fund Class IM Shares, 5.05% (a) (b) | | | | | | | | | |
| | | | | | | | | |
|
| Investment in an affiliated fund, which is registered under the Investment Company Act of 1940, as amended, and is advised by J.P. Morgan Investment Management Inc. |
| The rate shown is the current yield as of June 30, 2023. |
| Amount is included on the Statements of Operations as Income from securities lending (net) (after payments of rebates and Citibank’s fee). |
|
For the year ended June 30, 2023 |
| | | | | Change in
Unrealized
Appreciation/
(Depreciation) | | | | Capital Gain
Distributions |
JPMorgan Prime Money Market Fund Class IM Shares, 5.23% (a) (b) | | | | | | | | | |
| J.P. Morgan Small Cap Funds | |
Small Cap Equity Fund (continued) |
For the year ended June 30, 2023 |
| | | | | Change in Unrealized Appreciation/ (Depreciation) | | | | Capital Gain Distributions |
JPMorgan Securities Lending Money Market Fund Agency SL Class Shares, 5.29% (a) (b) | | | | | | | | | |
JPMorgan U.S. Government Money Market Fund Class IM Shares, 5.05% (a) (b) | | | | | | | | | |
| | | | | | | | | |
|
| Investment in an affiliated fund, which is registered under the Investment Company Act of 1940, as amended, and is advised by J.P. Morgan Investment Management Inc. |
| The rate shown is the current yield as of June 30, 2023. |
| Amount is included on the Statements of Operations as Income from securities lending (net) (after payments of rebates and Citibank’s fee). |
|
For the year ended June 30, 2023 |
| | | | | Change in
Unrealized
Appreciation/
(Depreciation) | | | | Capital Gain
Distributions |
JPMorgan Prime Money Market Fund Class IM Shares, 5.23% (a) (b) | | | | | | | | | |
JPMorgan Securities Lending Money Market Fund Agency SL Class Shares, 5.29% (a) (b) | | | | | | | | | |
JPMorgan U.S. Government Money Market Fund Class IM Shares, 5.05% (a) (b) | | | | | | | | | |
| | | | | | | | | |
|
| Investment in an affiliated fund, which is registered under the Investment Company Act of 1940, as amended, and is advised by J.P. Morgan Investment Management Inc. |
| The rate shown is the current yield as of June 30, 2023. |
| Amount is included on the Statements of Operations as Income from securities lending (net) (after payments of rebates and Citibank’s fee). |
Small Cap Sustainable Leaders Fund |
For the year ended June 30, 2023 |
| | | | | Change in
Unrealized
Appreciation/
(Depreciation) | | | | Capital Gain
Distributions |
JPMorgan Prime Money Market Fund Class IM Shares, 5.23% (a) (b) | | | | | | | | | |
JPMorgan Securities Lending Money Market Fund Agency SL Class Shares, 5.29% (a) (b) | | | | | | | | | |
JPMorgan U.S. Government Money Market Fund Class IM Shares, 5.05% (a) (b) | | | | | | | | | |
| | | | | | | | | |
|
| Investment in an affiliated fund, which is registered under the Investment Company Act of 1940, as amended, and is advised by J.P. Morgan Investment Management Inc. |
| The rate shown is the current yield as of June 30, 2023. |
| Amount rounds to less than one thousand. |
| Amount is included on the Statements of Operations as Income from securities lending (net) (after payments of rebates and Citibank’s fee). |
| J.P. Morgan Small Cap Funds | |
NOTES TO FINANCIAL STATEMENTS
AS OF June 30, 2023 (continued)
(Dollar values in thousands)
|
For the year ended June 30, 2023 |
| | | | | Change in
Unrealized
Appreciation/
(Depreciation) | | | | Capital Gain
Distributions |
JPMorgan Prime Money Market Fund Class IM Shares, 5.23% (a) (b) | | | | | | | | | |
JPMorgan Securities Lending Money Market Fund Agency SL Class Shares, 5.29% (a) (b) | | | | | | | | | |
JPMorgan U.S. Government Money Market Fund Class IM Shares, 5.05% (a) (b) | | | | | | | | | |
| | | | | | | | | |
|
| Investment in an affiliated fund, which is registered under the Investment Company Act of 1940, as amended, and is advised by J.P. Morgan Investment Management Inc. |
| The rate shown is the current yield as of June 30, 2023. |
| Amount is included on the Statements of Operations as Income from securities lending (net) (after payments of rebates and Citibank’s fee). |
|
For the year ended June 30, 2023 |
| | | | | Change in
Unrealized
Appreciation/
(Depreciation) | | | | Capital Gain
Distributions |
JPMorgan Prime Money Market Fund Class IM Shares, 5.23% (a) (b) | | | | | | | | | |
JPMorgan U.S. Government Money Market Fund Class IM Shares, 5.05% (a) (b) | | | | | | | | | |
| | | | | | | | | |
|
| Investment in an affiliated fund, which is registered under the Investment Company Act of 1940, as amended, and is advised by J.P. Morgan Investment Management Inc. |
| The rate shown is the current yield as of June 30, 2023. |
| Amount rounds to less than one thousand. |
| Amount is included on the Statements of Operations as Income from securities lending (net) (after payments of rebates and Citibank’s fee). |
|
For the year ended June 30, 2023 |
| | | | | Change in
Unrealized
Appreciation/
(Depreciation) | | | | Capital Gain
Distributions |
JPMorgan Prime Money Market Fund Class IM Shares, 5.23% (a) (b) | | | | | | | | | |
JPMorgan Securities Lending Money Market Fund Agency SL Class Shares, 5.29% (a) (b) | | | | | | | | | |
JPMorgan U.S. Government Money Market Fund Class IM Shares, 5.05% (a) (b) | | | | | | | | | |
| | | | | | | | | |
|
| Investment in an affiliated fund, which is registered under the Investment Company Act of 1940, as amended, and is advised by J.P. Morgan Investment Management Inc. |
| The rate shown is the current yield as of June 30, 2023. |
| Amount is included on the Statements of Operations as Income from securities lending (net) (after payments of rebates and Citibank’s fee). |
| J.P. Morgan Small Cap Funds | |
E. Futures Contracts — Small Cap Value Fund and U.S. Small Company Fund used index futures contracts to gain or reduce exposure to the stock market, or maintain liquidity or minimize transaction costs. The Funds also purchased futures contracts to invest incoming cash in the market or sold futures in response to cash outflows, thereby simulating an invested position in the underlying index while maintaining a cash balance for liquidity.
Futures contracts provide for the delayed delivery of the underlying instrument at a fixed price or are settled for a cash amount based on the change in the value of the underlying instrument at a specific date in the future. Upon entering into a futures contract, the Funds are required to deposit with the broker, cash or securities in an amount equal to a certain percentage of the contract amount, which is referred to as the initial margin deposit. Subsequent payments, referred to as variation margin, are made or received by the Funds periodically and are based on changes in the market value of open futures contracts. Changes in the market value of open futures contracts are recorded as Change in net unrealized appreciation/depreciation on futures contracts on the Statements of Operations. Realized gains or losses, representing the difference between the value of the contract at the time it was opened and the value at the time it was closed, are reported on the Statements of Operations at the closing or expiration of the futures contract. Securities deposited as initial margin are designated on the SOIs, while cash deposited, which is considered restricted, is recorded on the Statements of Assets and Liabilities. A receivable from and/or a payable to brokers for the daily variation margin is also recorded on the Statements of Assets and Liabilities.
The use of futures contracts exposes the Funds to equity price risk. The Funds may be subject to the risk that the change in the value of the futures contract may not correlate perfectly with the underlying instrument. Use of long futures contracts subjects the Funds to risk of loss in excess of the amounts shown on the Statements of Assets and Liabilities, up to the notional amount of the futures contracts. Use of short futures contracts subjects the Funds to unlimited risk of loss. The Funds may enter into futures contracts only on exchanges or boards of trade. The exchange or board of trade acts as the counterparty to each futures transaction; therefore, the Funds' credit risk is limited to failure of the exchange or board of trade. Under some circumstances, futures exchanges may establish daily limits on the amount that the price of a futures contract can vary from the previous day’s settlement price, which could effectively prevent liquidation of positions.
The Funds' futures contracts are not subject to master netting arrangements (the right to close out all transactions traded with a counterparty and net amounts owed or due across transactions).
The table below discloses the volume of the Funds' futures contracts activity during the year ended June 30, 2023:
| | |
| | |
Average Notional Balance Long | | |
Ending Notional Balance Long | | |
F. Security Transactions and Investment Income — Investment transactions are accounted for on the trade date (the date the order to buy or sell is executed). Securities gains and losses are calculated on a specifically identified cost basis.
Interest income is determined on the basis of coupon interest accrued using the effective interest method, which adjusts for amortization of premiums and accretion of discounts.
Dividend income is recorded on the ex-dividend date or when a Fund first learns of the dividend.
To the extent such information is publicly available, the Funds record distributions received in excess of income earned from underlying investments as a reduction of cost of investments and/or realized gain. Such amounts are based on estimates if actual amounts are not available and actual amounts of income, realized gain and return of capital may differ from the estimated amounts. The Funds adjust the estimated amounts of the components of distributions (and consequently their net investment income) as necessary, once the issuers provide information about the actual composition of the distributions.
G. Allocation of Income and Expenses— Expenses directly attributable to a Fund are charged directly to that Fund, while the expenses attributable to more than one fund of the Trusts are allocated among the applicable funds. Investment income, realized and unrealized gains and losses and expenses, other than class-specific expenses, are allocated daily to each class of shares based upon the proportion of net assets of each class at the beginning of each day.
Transfer agency fees are class-specific expenses. The amount of the transfer agency fees charged to each share class of the Funds for the year ended June 30, 2023 are as follows:
| J.P. Morgan Small Cap Funds | |
NOTES TO FINANCIAL STATEMENTS
AS OF June 30, 2023 (continued)
(Dollar values in thousands)
| | | | | | | | | | |
| | | | | | | | | | |
| | | | | | | | | | |
Small Cap Sustainable Leaders Fund | | | | | | | | | | |
| | | | | | | | | | |
| | | | | | | | | | |
| | | | | | | | | | |
| | | | | | | | | | |
| | | | | | | | | | |
| | | | | | | | | | |
| | | | | | | | | | |
|
| Amount rounds to less than one thousand. |
H. Federal Income Taxes — Each Fund is treated as a separate taxable entity for Federal income tax purposes. Each Fund's policy is to comply with the provisions of the Internal Revenue Code (the “Code”) applicable to regulated investment companies and to distribute to shareholders all of its distributable net investment income and net realized capital gains on investments. Accordingly, no provision for Federal income tax is necessary. Management has reviewed the Funds' tax positions for all open tax years and has determined that as of June 30, 2023, no liability for Federal income tax is required in the Funds' financial statements for net unrecognized tax benefits. However, management’s conclusions may be subject to future review based on changes in, or the interpretation of, the accounting standards or tax laws and regulations. Each Fund's Federal tax returns for the prior three fiscal years remain subject to examination by the Internal Revenue Service.
I. Distributions to Shareholders — Distributions from net investment income, if any, are generally declared and paid at least annually, except for Small Cap Value Fund, for which distributions are generally declared and paid at least quarterly. Distributions are declared separately for each class. No class has preferential dividend rights; differences in per share rates are due to differences in separate class expenses. Net realized capital gains, if any, are distributed by each Fund at least annually. The amount of distributions from net investment income and net realized capital gains is determined in accordance with Federal income tax regulations, which may differ from GAAP. To the extent these “book/tax” differences are permanent in nature (i.e., that they result from other than timing of recognition — “temporary differences”), such amounts are reclassified within the capital accounts based on their Federal tax basis treatment.
The following amounts were reclassified within the capital accounts:
| | Accumulated
undistributed
(distributions in
excess of)
net investment
income | Accumulated
net realized
gains (losses) |
| | | |
| | | |
| | | |
Small Cap Sustainable Leaders Fund | | | |
| | | |
| | | |
| | | |
The reclassifications for the Funds relate primarily to tax adjustments on certain investments and redesignation of dividends.
3. Fees and Other Transactions with Affiliates
A. Investment Advisory Fee — Pursuant to an Investment Advisory Agreement, the Adviser manages the investments of each Fund and for such services is paid a fee. The investment advisory fee is accrued daily and paid monthly at an annual rate based on each Fund's respective average daily net assets. The annual rate for each Fund is as follows:
| J.P. Morgan Small Cap Funds | |
| |
| |
Small Cap Sustainable Leaders Fund | |
| |
| |
| |
The Adviser waived investment advisory fees and/or reimbursed expenses as outlined in Note 3.F.
B. Administration Fee — Pursuant to an Administration Agreement, the Administrator provides certain administration services to each Fund. In consideration of these services, the Administrator receives a fee accrued daily and paid monthly at an annual rate of 0.075% of the first $10 billion of each Fund's respective average daily net assets, plus 0.050% of each Fund's respective average daily net assets between $10 billion and $20 billion, plus 0.025% of each Fund's respective average daily net assets between $20 billion and $25 billion, plus 0.010% of each Fund's respective average daily net assets in excess of $25 billion. For the year ended June 30, 2023, the effective rate was 0.075% of each Fund's average daily net assets, notwithstanding any fee waivers and/or expense reimbursements.
The Administrator waived administration fees as outlined in Note 3.F.
JPMorgan Chase Bank, N.A. ("JPMCB"), a wholly-owned subsidiary of JPMorgan, serves as the Funds' sub-administrator (the “Sub-administrator”). For its services as Sub-administrator, JPMCB receives a portion of the fees payable to the Administrator.
C. Distribution Fees — Pursuant to a Distribution Agreement, JPMorgan Distribution Services, Inc. (“JPMDS”), an indirect, wholly-owned subsidiary of JPMorgan, serves as each Fund's principal underwriter and promotes and arranges for the sale of each Fund's shares.
The Boards have adopted a Distribution Plan (the “Distribution Plan”) for Class A , Class C, Class R2 and Class R3 Shares of the Funds, as applicable, pursuant to Rule 12b-1 under the 1940 Act. Class I, Class L, Class R4, Class R5 and Class R6 Shares of the Funds do not charge a distribution fee. The Distribution Plan provides that each Fund shall pay, with respect to the applicable share classes, distribution fees, including payments to JPMDS, at annual rates of the average daily net assets as shown in the table below:
| | | | |
| | | | |
| | | | |
| | | | |
Small Cap Sustainable Leaders Fund | | | | |
| | | | |
| | | | |
| | | | |
In addition, JPMDS is entitled to receive the front-end sales charges from purchases of Class A Shares and the CDSC from redemptions of Class C Shares and certain Class A Shares for which front-end sales charges have been waived. For the year ended June 30, 2023, JPMDS retained the following:
| | |
| | |
| | |
| | |
Small Cap Sustainable Leaders Fund | | |
| | |
| | |
| | |
|
| Amount rounds to less than one thousand. |
| J.P. Morgan Small Cap Funds | |
NOTES TO FINANCIAL STATEMENTS
AS OF June 30, 2023 (continued)
(Dollar values in thousands)
D. Service Fees — The Trusts, on behalf of the Funds, have entered into a Shareholder Servicing Agreement with JPMDS under which JPMDS provides certain support services to fund shareholders. For performing these services, JPMDS receives a fee with respect to all share classes, except Class R6 Shares which do not charge a service fee, that is accrued daily and paid monthly equal to a percentage of the average daily net assets as shown in the table below:
| | | | | | | | |
| | | | | | | | |
| | | | | | | | |
| | | | | | | | |
Small Cap Sustainable Leaders Fund | | | | | | | | |
| | | | | | | | |
| | | | | | | | |
| | | | | | | | |
JPMDS has entered into shareholder services contracts with affiliated and unaffiliated financial intermediaries who provide shareholder services and other related services to their clients or customers who invest in the Funds. Pursuant to such contracts, JPMDS will pay all or a portion of such fees earned to financial intermediaries for performing such services.
JPMDS waived service fees as outlined in Note 3.F.
E. Custodian and Accounting Fees — JPMCB provides portfolio custody and accounting services to the Funds. For performing these services, the Funds pay JPMCB transaction and asset-based fees that vary according to the number of transactions and positions, plus out-of-pocket expenses. The amounts paid directly to JPMCB by the Funds for custody and accounting services are included in Custodian and accounting fees on the Statements of Operations.
Interest income earned on cash balances at the custodian, if any, is included in Interest income from affiliates on the Statements of Operations.
Interest expense paid to the custodian related to cash overdrafts, if any, is included in Interest expense to affiliates on the Statements of Operations.
F. Waivers and Reimbursements —The Adviser, Administrator and/or JPMDS have contractually agreed to waive fees and/or reimburse the Funds to the extent that total annual operating expenses (excluding acquired fund fees and expenses other than certain money market fund fees as described below, dividend and interest expenses related to short sales, interest, taxes, expenses related to litigation and potential litigation, expenses related to trustee elections and extraordinary expenses) exceed the percentages of the Funds' respective average daily net assets as shown in the table below:
| | | | | | | | | |
| | | | | | | | | |
| | | | | | | | | |
| | | | | | | | | |
Small Cap Sustainable Leaders Fund | | | | | | | | | |
| | | | | | | | | |
| | | | | | | | | |
| | | | | | | | | |
|
| Prior to November 1, 2022, there was no contractual expense limitation in place for Class A, Class R5 and Class R6 and the contractual expense limitation was 1.74% and 0.99% for Class C and Class I, respectively. |
| Prior to November 1, 2022, the contractual expense limitation was 1.14%, 1.64%, 0.89%, 1.14%, 0.89% and 0.64% for Class A, Class C, Class I, Class R3, Class R4 and Class R6, respectively. |
| Prior to November 1, 2022, there was no contractual expense limitation for Class A, Class C and Class I. |
Except as noted above, the expense limitation agreements were in effect for the year ended June 30, 2023 and the contractual expense limitation percentages in the table above are in place until at least October 31, 2024.
| J.P. Morgan Small Cap Funds | |
For the year ended June 30, 2023, the Funds' service providers waived fees and/or reimbursed expenses for each of the Funds as follows. None of these parties expect the Funds to repay any such waived fees and/or reimbursed expenses in future years.
| | |
| | | | | Contractual
Reimbursements |
| | | | | |
| | | | | |
| | | | | |
Small Cap Sustainable Leaders Fund | | | | | |
| | | | | |
| | | | | |
| | | | | |
Additionally, the Funds may invest in one or more money market funds advised by the Adviser (affiliated money market funds). The Adviser, Administrator and/or JPMDS, as shareholder servicing agent, have contractually agreed to waive fees and/or reimburse expenses in an amount sufficient to offset the respective net fees each collects from the affiliated money market fund on the applicable Fund's investment in such affiliated money market fund, except for investments of securities lending cash collateral. None of these parties expect the Funds to repay any such waived fees and/or reimbursed expenses in future years.
The amounts of these waivers resulting from investments in these money market funds for the year ended June 30, 2023 were as follows:
| |
| |
| |
| |
Small Cap Sustainable Leaders Fund | |
| |
| |
| |
JPMIM voluntarily agreed to reimburse the Funds for the Trustee Fees paid to one of the interested Trustees. For the year ended June 30, 2023, the amount of these reimbursements were as follows:
| |
| |
| |
| |
Small Cap Sustainable Leaders Fund | |
| |
| |
| |
G. Other — Certain officers of the Trusts are affiliated with the Adviser, the Administrator and JPMDS. Such officers, with the exception of the Chief Compliance Officer, receive no compensation from the Funds for serving in their respective roles.
The Boards designated and appointed a Chief Compliance Officer to the Funds pursuant to Rule 38a-1 under the 1940 Act. Each Fund, along with affiliated funds, makes reimbursement payments, on a pro-rata basis, to the Administrator for a portion of the fees associated with the office of the Chief Compliance Officer. Such fees are included in Trustees’ and Chief Compliance Officer’s fees on the Statements of Operations.
The Trusts adopted a Trustee Deferred Compensation Plan (the “Plan”) which allows the independent Trustees to defer the receipt of all or a portion of compensation related to performance of their duties as Trustees. The deferred fees are invested in various J.P. Morgan Funds until distribution in accordance with the Plan.
During the year ended June 30, 2023, Small Cap Blend Fund, Small Cap Growth Fund, Small Cap Sustainable Leaders Fund, Small Cap Value Fund and U.S. Small Company Fund purchased securities from an underwriting syndicate in which the principal underwriter or members of the syndicate were affiliated with the Adviser.
| J.P. Morgan Small Cap Funds | |
NOTES TO FINANCIAL STATEMENTS
AS OF June 30, 2023 (continued)
(Dollar values in thousands)
The Securities and Exchange Commission ("SEC") has granted an exemptive order permitting the Funds to engage in principal transactions with J.P. Morgan Securities LLC, an affiliated broker, involving taxable money market instruments, subject to certain conditions.
4. Investment Transactions
During the year ended June 30, 2023, purchases and sales of investments (excluding short-term investments and transfers in-kind) were as follows:
| Purchases
(excluding
U.S. Government) | Sales
(excluding
U.S. Government) |
| | |
| | |
| | |
Small Cap Sustainable Leaders Fund | | |
| | |
| | |
| | |
During the year ended June 30, 2023, there were no purchases or sales of U.S. Government securities.
5. Federal Income Tax Matters
For Federal income tax purposes, the estimated cost and unrealized appreciation (depreciation) in value of investments held at June 30, 2023 were as follows:
| | Gross
Unrealized
Appreciation | Gross
Unrealized
Depreciation | Net Unrealized
Appreciation
(Depreciation) |
| | | | |
| | | | |
| | | | |
Small Cap Sustainable Leaders Fund | | | | |
| | | | |
| | | | |
| | | | |
The difference between book and tax basis appreciation (depreciation) on investments is primarily attributed to certain derivatives, tax adjustments on certain investments and wash sale loss deferrals.
The tax character of distributions paid during the year ended June 30, 2023 was as follows:
| | Net
Long-Term
Capital Gains | |
| | | |
| | | |
| | | |
Small Cap Sustainable Leaders Fund | | | |
| | | |
| | | |
| | | |
|
| Short-term gain distributions are treated as ordinary income for income tax purposes. |
| J.P. Morgan Small Cap Funds | |
The tax character of distributions paid during the year ended June 30, 2022 was as follows:
| | Net
Long-Term
Capital Gains | |
| | | |
| | | |
| | | |
Small Cap Sustainable Leaders Fund | | | |
| | | |
| | | |
| | | |
|
| Short-term gain distributions are treated as ordinary income for income tax purposes. |
As of June 30, 2023, the estimated components of net assets (excluding paid-in-capital) on a tax basis were as follows:
| Current
Distributable
Ordinary
Income | Current
Distributable
Long-Term
Capital Gain
(Tax Basis Capital
Loss Carryover) | Unrealized
Appreciation
(Depreciation) |
| | | |
| | | |
| | | |
Small Cap Sustainable Leaders Fund | | | |
| | | |
| | | |
| | | |
The cumulative timing differences primarily consist of certain derivatives, tax adjustments on certain investments, post-October capital loss deferrals and wash sale loss deferrals.
As of June 30, 2023, the following Funds had net capital loss carryforwards which are available to offset future realized gains:
| Capital Loss Carryforward Character |
| | |
| | |
| | |
Small Cap Sustainable Leaders Fund | | |
| | |
| J.P. Morgan Small Cap Funds | |
NOTES TO FINANCIAL STATEMENTS
AS OF June 30, 2023 (continued)
(Dollar values in thousands)
Net capital losses (gains) and specified ordinary losses incurred after October 31 and late year ordinary losses incurred after December 31 and within the taxable year are deemed to arise on the first business day of the Funds' next taxable year. For the year ended June 30, 2023, the following Funds deferred to July 1, 2023 the following net capital losses (gains), specified ordinary losses and late year ordinary losses of:
| Net Capital Losses (Gains) | Late Year Ordinary Loss Deferral |
| | |
| | | |
| | | |
| | | |
Small Cap Sustainable Leaders Fund | | | |
| | | |
| | | |
| | | |
6. Borrowings
The Funds rely upon an exemptive order granted by the SEC (the “Order”) permitting the establishment and operation of an Interfund Lending Facility (the “Facility”). The Facility allows the Funds to directly lend and borrow money to or from any other fund relying upon the Order at rates beneficial to both the borrowing and lending funds. Advances under the Facility are taken primarily for temporary or emergency purposes, including the meeting of redemption requests that otherwise might require the untimely disposition of securities, and are subject to each Fund's borrowing restrictions. The interfund loan rate is determined, as specified in the Order, by averaging the current repurchase agreement rate and the current bank loan rate. The Order was granted to JPM II and may be relied upon by the Funds because the Funds and the series of JPM II are all investment companies in the same “group of investment companies” (as defined in Section 12(d)(1)(G) of the 1940 Act).
The Funds had no borrowings outstanding from another fund, or loans outstanding to another fund, during the year ended June 30, 2023.
The Trusts and JPMCB have entered into a financing arrangement. Under this arrangement, JPMCB provides an unsecured, uncommitted credit facility in the aggregate amount of $100 million to certain of the J.P. Morgan Funds, including the Funds. Advances under the arrangement are taken primarily for temporary or emergency purposes, including the meeting of redemption requests that otherwise might require the untimely disposition of securities, and are subject to each Fund's borrowing restrictions. Interest on borrowings is payable at a rate determined by JPMCB at the time of borrowing. This agreement has been extended until October 30, 2023.
The Funds had no borrowings outstanding from the unsecured, uncommitted credit facility during the year ended June 30, 2023.
The Trusts, along with certain other trusts for J.P. Morgan Funds (“Borrowers”), have entered into a joint syndicated senior unsecured revolving credit facility totaling $1.5 billion (“Credit Facility”) with various lenders and The Bank of New York Mellon, as administrative agent for the lenders. This Credit Facility provides a source of funds to the Borrowers for temporary and emergency purposes, including the meeting of redemption requests that otherwise might require the untimely disposition of securities. Under the terms of the Credit Facility, a borrowing fund must have a minimum of $25 million in adjusted net asset value and not exceed certain adjusted net asset coverage ratios prior to and during the time in which any borrowings are outstanding. If a fund does not comply with the aforementioned requirements, the fund must remediate within three business days with respect to the $25 million minimum adjusted net asset value or within one business day with respect to certain asset coverage ratios or the administrative agent at the request of, or with the consent of, the lenders may terminate the Credit Facility and declare any outstanding borrowings to be due and payable immediately.
Interest associated with any borrowing under the Credit Facility is charged to the borrowing fund at a rate of interest equal to 1.00% (the "Applicable Margin"), plus the greater on the day of the borrowing, of the federal funds effective rate, or the Adjusted Daily Simple SOFR Rate. Prior to August 9, 2022, interest associated with any borrowing under the Credit Facility was charged to the borrowing fund at a rate of interest equal to the Applicable Margin, plus the greater of the federal funds effective rate or one month London Interbank Offered Rate ("LIBOR"). Effective August 8, 2023, the Credit Facility was amended and restated for a term of 364 days, unless extended.
The Funds did not utilize the Credit Facility during the year ended June 30, 2023.
7. Risks, Concentrations and Indemnifications
In the normal course of business, the Funds enter into contracts that contain a variety of representations which provide general indemnifications. Each Fund's maximum exposure under these arrangements is unknown. The amount of exposure would depend on future claims that may be brought against each Fund. However, based on experience, the Funds expect the risk of loss to be remote.
| J.P. Morgan Small Cap Funds | |
As of June 30, 2023, the Funds had individual shareholder and/or affiliated omnibus accounts each owning more than 10% of the respective Fund's outstanding shares as follows:
| Number of
Individual Shareholder
and/or Affiliated
Omnibus Accounts | | Number of
Individual Shareholder
and/or Non-Affiliated
Omnibus Accounts | |
| | | | |
| | | | |
| | | | |
Small Cap Sustainable Leaders Fund | | | | |
| | | | |
| | | | |
| | | | |
As of June 30, 2023, J.P. Morgan Investor Funds and JPMorgan SmartRetirement Funds, which are affiliated fund of funds, each owned in the aggregate, shares representing more than 10% of the net assets of the Funds as follows:
| | JPMorgan
SmartRetirement
Funds |
| | |
Significant shareholder transactions by these shareholders may impact the Funds' performance and liquidity.
Because the Funds invest in Real Estate Investment Trusts ("REITs"), the Funds may be subject to certain risks similar to those associated with direct investments in real estate. REITs may be affected by changes in the value of their underlying properties and by defaults by tenants. REITs depend generally on their ability to generate cash flow to make distributions to shareholders, and certain REITs have self-liquidation provisions by which mortgages held may be paid in full and distributions of capital returns may be made at any time.
The Funds invest in companies with relatively small market capitalizations. Investments in companies with relatively small market capitalizations may involve greater risk than is usually associated with stocks of larger companies. These securities may have limited marketability and may be subject to more abrupt or erratic movements in price than securities of companies with larger capitalizations.
LIBOR was a leading floating rate benchmark used in loans, notes, derivatives and other instruments or investments. As a result of benchmark reforms, publication of most LIBOR settings has ceased. Some LIBOR settings continue to be published but only on a temporary, synthetic and non-representative basis. Regulated entities have generally ceased entering into new LIBOR contracts in connection with regulatory guidance or prohibitions. Public and private sector actors have worked to establish alternative reference rates to be used in place of LIBOR. There is no assurance that any such alternative reference rate will be similar to or produce the same value or economic equivalence as LIBOR or that it will have the same volume or liquidity as did LIBOR which may affect the value, volatility, liquidity or return on certain of the Funds' loans, notes, derivatives and other instruments or investments comprising some or all of the Funds' investments and result in costs incurred in connection with changing reference rates used for positions, closing out positions and entering into new trades. Certain of the Funds' investments may have transitioned from LIBOR or will transition from LIBOR in the future. The transition from LIBOR to alternative reference rates may result in operational issues for the Funds or their investments. No assurances can be given as to the impact of the LIBOR transition (and the timing of any such impact) on the Funds and their investments.
The Funds are subject to infectious disease epidemics/pandemics risk. For example, the outbreak of COVID-19 has negatively affected economies, markets and individual companies throughout the world, including those in which the Funds invest. The effects of this, or any future, pandemic to public health and business and market conditions may have a significant negative impact on the performance of a Fund’s investments, increase a Fund’s volatility, exacerbate other pre-existing political, social and economic risks to the Funds and negatively impact broad segments of businesses and populations. In addition, governments, their regulatory agencies, or self-regulatory organizations have taken or may take actions in response to the pandemic that affect the instruments in which the Funds invest, or the issuers of such instruments, in ways that could have a significant negative impact on a Fund’s investment performance. The ultimate impact of any pandemic and the extent to which the associated conditions and governmental responses impact a Fund will also depend on future developments, which are highly uncertain, difficult to accurately predict and subject to frequent changes.
| J.P. Morgan Small Cap Funds | |
REPORT OF INDEPENDENT REGISTERED PUBLIC ACCOUNTING FIRM
To the Board of Trustees of JPMorgan Trust I and JPMorgan Trust II and Shareholders of JPMorgan Small Cap Blend Fund, JPMorgan Small Cap Equity Fund, JPMorgan Small Cap Growth Fund, JPMorgan Small Cap Sustainable Leaders Fund, JPMorgan Small Cap Value Fund, JPMorgan SMID Cap Equity Fund and JPMorgan U.S. Small Company Fund
Opinions on the Financial Statements
We have audited the accompanying statements of assets and liabilities, including the schedules of portfolio investments, of JPMorgan Small Cap Blend Fund, JPMorgan Small Cap Equity Fund, JPMorgan Small Cap Sustainable Leaders Fund and JPMorgan U.S. Small Company Fund (four of the funds constituting JPMorgan Trust I) and JPMorgan Small Cap Growth Fund, JPMorgan Small Cap Value Fund and JPMorgan SMID Cap Equity Fund (three of the funds constituting JPMorgan Trust II) (hereafter collectively referred to as the "Funds") as of June 30, 2023, the related statements of operations for the year ended June 30, 2023, the statements of changes in net assets for each of the two years in the period ended June 30, 2023, including the related notes, and the financial highlights for each of the periods indicated therein (collectively referred to as the “financial statements”). In our opinion, the financial statements present fairly, in all material respects, the financial position of each of the Funds as of June 30, 2023, the results of each of their operations for the year then ended, the changes in each of their net assets for each of the two years in the period ended June 30, 2023 and each of the financial highlights for each of the periods indicated therein in conformity with accounting principles generally accepted in the United States of America.
Basis for Opinions
These financial statements are the responsibility of the Funds’ management. Our responsibility is to express an opinion on the Funds’ financial statements based on our audits. We are a public accounting firm registered with the Public Company Accounting Oversight Board (United States) (PCAOB) and are required to be independent with respect to the Funds in accordance with the U.S. federal securities laws and the applicable rules and regulations of the Securities and Exchange Commission and the PCAOB.
We conducted our audits of these financial statements in accordance with the standards of the PCAOB. Those standards require that we plan and perform the audit to obtain reasonable assurance about whether the financial statements are free of material misstatement, whether due to error or fraud.
Our audits included performing procedures to assess the risks of material misstatement of the financial statements, whether due to error or fraud, and performing procedures that respond to those risks. Such procedures included examining, on a test basis, evidence regarding the amounts and disclosures in the financial statements. Our audits also included evaluating the accounting principles used and significant estimates made by management, as well as evaluating the overall presentation of the financial statements. Our procedures included confirmation of securities owned as of June 30, 2023 by correspondence with the custodian, transfer agent and brokers; when replies were not received from brokers, we performed other auditing procedures. We believe that our audits provide a reasonable basis for our opinions.
/s/PricewaterhouseCoopers LLP
New York, New York
August 24, 2023
We have served as the auditor of one or more investment companies in the JPMorgan Funds complex since 1993.
| J.P. Morgan Small Cap Funds | |
The Funds' Statement of Additional Information includes additional information about the Funds' Trustees and is available, without charge, upon request by calling 1-800-480-4111 or on the J.P. Morgan Funds’ website at www.jpmorganfunds.com.
Name (Year of Birth);
Positions With
the Funds (1) | Principal Occupation
During Past 5 Years | Number of
Funds in Fund
Complex Overseen
by Trustee (2) | Other Directorships Held
During the Past 5 Years |
| |
John F. Finn (1947); Chair
since 2020; Trustee since 1998. | Chairman, Gardner, Inc. (supply chain management company serving industrial and consumer markets) (serving in various roles 1974-present). | | Director, Greif, Inc. (GEF) (industrial package products and services) (2007-present); Trustee, Columbus Association for the Performing Arts (1988-present). |
Stephen P. Fisher (1959);
Trustee since 2018. | Retired; Chairman and Chief Executive Officer, NYLIFE Distributors LLC (registered broker-dealer) (serving in various roles 2008-2013); Chairman, NYLIM Service Company LLC (transfer agent) (2008-2017); New York Life Investment Management LLC (registered investment adviser) (serving in various roles 2005-2017); Chairman, IndexIQ Advisors LLC (registered investment adviser for ETFs) (2014-2017); President, MainStay VP Funds Trust (2007-2017), MainStay DefinedTerm Municipal Opportunities Fund (2011-2017) and MainStay Funds Trust (2007-2017) (registered investment companies). | | Honors Program Advisory Board Member, The Zicklin School of Business, Baruch College, The City University of New York (2017-present). |
Gary L. French (1951);
Trustee since 2014. | Real Estate Investor (2011-2020); Investment management industry Consultant and Expert Witness (2011-present); Senior Consultant for The Regulatory Fundamentals Group LLC (2011-2017). | | Independent Trustee, The China Fund, Inc. (2013-2019); Exchange Traded Concepts Trust II (2012-2014); Exchange Traded Concepts Trust I (2011-2014). |
Kathleen M. Gallagher (1958);
Trustee since 2018. | Retired; Chief Investment Officer — Benefit Plans, Ford Motor Company (serving in various roles 1985-2016). | | Non- Executive Director, Legal & General Investment Management (Holdings) (2018-present); Non-Executive Director, Legal & General Investment Management America (U.S. Holdings) (financial services and insurance) (2017-present); Advisory Board Member, State Street Global Advisors Total Portfolio Solutions (2017-present); Member, Client Advisory Council, Financial Engines, LLC (registered investment adviser) (2011-2016); Director, Ford Pension Funds Investment Management Ltd. (2007-2016). |
Robert J. Grassi (1957);
Trustee since 2014. | Sole Proprietor, Academy Hills Advisors LLC (2012-present); Pension Director, Corning Incorporated (2002-2012). | | |
| J.P. Morgan Small Cap Funds | |
TRUSTEES
(Unaudited) (continued)
Name (Year of Birth); Positions With the Funds (1) | Principal Occupation During Past 5 Years | Number of Funds in Fund Complex Overseen by Trustee (2) | Other Directorships Held During the Past 5 Years |
Independent Trustees (continued) | |
Frankie D. Hughes (1952);
Trustee since 2008. | President, Ashland Hughes Properties (property management) (2014-present); President and Chief Investment Officer, Hughes Capital Management, Inc. (fixed income asset management) (1993-2014). | | |
Raymond Kanner (1953);
Trustee since 2017. | Retired; Managing Director and Chief Investment Officer, IBM Retirement Funds (2007-2016). | | Advisory Board Member, Penso Advisors, LLC (2020-present); Advisory Board Member, Los Angeles Capital (2018-present); Advisory Board Member, State Street Global Advisors Total Portfolio Solutions (2017- present); Acting Executive Director, Committee on Investment of Employee Benefit Assets (CIEBA) (2016-2017); Advisory Board Member, Betterment for Business (robo advisor) (2016- 2017); Advisory Board Member, BlueStar Indexes (index creator) (2013-2017); Director, Emerging Markets Growth Fund (registered investment company) (1997-2016); Member, Russell Index Client Advisory Board (2001-2015). |
Thomas P. Lemke (1954);
Trustee since 2014. | | | (1) Independent Trustee of Advisors’ Inner Circle III fund platform, consisting of the following: (i) the Advisors’ Inner Circle Fund III, (ii) the Gallery Trust, (iii) the Schroder Series Trust, (iv) the Delaware Wilshire Private Markets Fund (since 2020), (v) Chiron Capital Allocation Fund Ltd., and (vi) formerly the Winton Diversified Opportunities Fund (2014-2018); and (2) Independent Trustee of the Symmetry Panoramic Trust (since 2018). |
Lawrence R. Maffia (1950);
Trustee since 2014. | Retired; Director and President, ICI Mutual Insurance Company (2006-2013). | | Director, ICI Mutual Insurance Company (1999-2013). |
Mary E. Martinez (1960); Vice
Chair since 2021; Trustee since 2013. | Associate, Special Properties, a Christie’s International Real Estate Affiliate (2010-present); Managing Director, Bank of America (asset management) (2007-2008); Chief Operating Officer, U.S. Trust Asset Management, U.S. Trust Company (asset management) (2003-2007); President, Excelsior Funds (registered investment companies) (2004-2005). | | |
Marilyn McCoy (1948);
Trustee since 1999. | Retired; Vice President of Administration and Planning, Northwestern University (1985-2023). | | |
| J.P. Morgan Small Cap Funds | |
Name (Year of Birth); Positions With the Funds (1) | Principal Occupation During Past 5 Years | Number of Funds in Fund Complex Overseen by Trustee (2) | Other Directorships Held During the Past 5 Years |
Independent Trustees (continued) | |
Dr. Robert A. Oden, Jr. (1946); Trustee
since 1997. | Retired; President, Carleton College (2002-2010); President, Kenyon College (1995-2002). | | Trustee, The Coldwater Conservation Fund (2017-present); Trustee, American Museum of Fly Fishing (2013-present); Trustee and Vice Chair, Trout Unlimited (2017-2021); Trustee, Dartmouth- Hitchcock Medical Center (2011-2020). |
Marian U. Pardo* (1946);
Trustee since 2013. | Managing Director and Founder, Virtual Capital Management LLC (investment consulting) (2007-present); Managing Director, Credit Suisse Asset Management (portfolio manager) (2003-2006). | | Board Chair and Member, Board of Governors, Columbus Citizens Foundation (not-for-profit supporting philanthropic and cultural programs) (2006-present). |
Emily A. Youssouf (1951);
Trustee since 2014. | Adjunct Professor (2011-present) and Clinical Professor (2009-2011), NYU Schack Institute of Real Estate; Board Member and Member of the Audit Committee (2013–present), Chair of Finance Committee (2019-present), Member of Related Parties Committee (2013-2018) and Member of the Enterprise Risk Committee (2015-2018), PennyMac Financial Services, Inc.; Board Member (2005-2018), Chair of Capital Committee (2006-2016), Chair of Audit Committee (2005-2018), Member of Finance Committee (2005-2018) and Chair of IT Committee (2016-2018), NYC Health and Hospitals Corporation. | | Trustee, NYC School Construction Authority (2009-present); Board Member, NYS Job Development Authority (2008-present); Trustee and Chair of the Audit Committee of the Transit Center Foundation (2015-2019). |
| |
Robert F. Deutsch** (1957);
Trustee since 2014. | Retired; Head of ETF Business for JPMorgan Asset Management (2013-2017); Head of Global Liquidity Business for JPMorgan Asset Management (2003-2013). | | Treasurer and Director of the JUST Capital Foundation (2017-present). |
Nina O. Shenker** (1957);
Trustee since 2022. | Vice Chair (2017-2021), General Counsel and Managing Director (2008-2016), Associate General Counsel and Managing Director (2004-2008), J.P. Morgan Asset & Wealth Management. | | Director and Member of Legal and Human Resources Subcommittees, American Jewish Joint Distribution Committee (2018-present). |
|
| The year shown is the first year in which a Trustee became a member of any of the following: the JPMorgan Mutual Fund Board, the JPMorgan ETF Board, the heritage J.P. Morgan Funds or the heritage One Group Mutual Funds. Trustees serve an indefinite term, until resignation, retirement, removal or death. The Boards' current retirement policy sets retirement at the end of the calendar year in which the Trustee attains the age of 75, provided that any Board member who was a member of the JPMorgan Mutual Fund Board prior to January 1, 2022 and was born prior to January 1, 1950 shall retire from the Board at the end of the calendar year in which the Trustee attains the age of 78. |
| A Fund Complex means two or more registered investment companies that hold themselves out to investors as related companies for purposes of investment and investor services or have a common investment adviser or have an investment adviser that is an affiliated person of the investment adviser of any of the other registered investment companies. The J.P. Morgan Funds Complex for which the Board of Trustees serves currently includes nine registered investment companies (176 J.P. Morgan Funds). |
| In connection with prior employment with JPMorgan Chase, Ms. Pardo was the recipient of non-qualified pension plan payments from JPMorgan Chase in the amount of approximately $2,055 per month, which she irrevocably waived effective January 1, 2013, and deferred compensation payments from JPMorgan Chase in the amount of approximately $7,294 per year, which ended in January 2013. In addition, Ms. Pardo receives payments from a fully-funded qualified plan, which is not an obligation of JPMorgan Chase. |
| J.P. Morgan Small Cap Funds | |
TRUSTEES
(Unaudited) (continued)
| Designation as an “Interested Trustee” is based on prior employment by the Adviser or an affiliate of the Adviser or interests in a control person of the Adviser. |
| The contact address for each of the Trustees is 277 Park Avenue, New York, NY 10172. |
| J.P. Morgan Small Cap Funds | |
Name (Year of Birth),
Positions Held with
the Trusts (Since) | Principal Occupations During Past 5 Years |
Brian S. Shlissel (1964),
President and Principal Executive
Officer (2016) | Managing Director and Chief Administrative Officer for J.P. Morgan pooled vehicles, J.P. Morgan Investment Management Inc. since 2014. |
Timothy J. Clemens (1975),
Treasurer and Principal Financial
Officer (2018) | Managing Director, J.P. Morgan Investment Management Inc. Mr. Clemens has been with J.P. Morgan Investment Management Inc. since 2013. |
Gregory S. Samuels (1980),
Secretary (2019) (formerly Assistant
Secretary 2010-2019) | Managing Director and Assistant General Counsel, JPMorgan Chase & Co. Mr. Samuels has been with JPMorgan Chase & Co. since 2010. |
Stephen M. Ungerman (1953),
Chief Compliance Officer (2005) | Managing Director, JPMorgan Chase & Co. Mr. Ungerman has been with JPMorgan Chase & Co. since 2000. |
Kiesha Astwood-Smith (1973),
Assistant Secretary (2021) | Vice President and Assistant General Counsel, JPMorgan Chase & Co. since June 2021; Senior Director and Counsel, Equitable Financial Life Insurance Company (formerly, AXA Equitable Life Insurance Company) from September 2015 through June 2021. |
Matthew Beck (1988),
Assistant Secretary (2021)* | Vice President and Assistant General Counsel, JPMorgan Chase & Co. since May 2021; Senior Legal Counsel, Ultimus Fund Solutions from May 2018 through May 2021; General Counsel, The Nottingham Company from April 2014 through May 2018. |
Elizabeth A. Davin (1964),
Assistant Secretary (2005)* | Executive Director and Assistant General Counsel, JPMorgan Chase & Co. Ms. Davin has been with JPMorgan Chase & Co. (formerly Bank One Corporation) since 2004. |
Jessica K. Ditullio (1962)
Assistant Secretary (2005)* | Executive Director and Assistant General Counsel, JPMorgan Chase & Co. Ms. Ditullio has been with JPMorgan Chase & Co. (formerly Bank One Corporation) since 1990. |
Anthony Geron (1971),
Assistant Secretary (2018) | Vice President and Assistant General Counsel, JPMorgan Chase & Co. since September 2018; Lead Director and Counsel, AXA Equitable Life Insurance Company from 2015 to 2018 and Senior Director and Counsel, AXA Equitable Life Insurance Company from 2014 to 2015. |
Carmine Lekstutis (1980),
Assistant Secretary (2011) | Executive Director and Assistant General Counsel, JPMorgan Chase & Co. Mr. Lekstutis has been with JPMorgan Chase & Co. since 2011. |
Max Vogel (1990),
Assistant Secretary (2021) | Vice President and Assistant General Counsel, JPMorgan Chase & Co. since June 2021; Associate, Proskauer Rose LLP (law firm) from March 2017 to June 2021. |
Zachary E. Vonnegut-Gabovitch
(1986),
Assistant Secretary (2017) | Executive Director and Assistant General Counsel, JPMorgan Chase & Co. Mr. Vonnegut-Gabovitch has been with JPMorgan Chase & Co. since September 2016. |
Frederick J. Cavaliere (1978),
Assistant Treasurer (2023)** | Executive Director, J.P. Morgan Investment Management Inc. Mr. Cavaliere has been with JPMorgan Chase & Co. since May 2006. |
Michael M. D’Ambrosio (1969),
Assistant Treasurer (2012) | Managing Director, J.P. Morgan Investment Management Inc. Mr. D’Ambrosio has been with J.P. Morgan Investment Management Inc. since 2012. |
Aleksandr Fleytekh (1972),
Assistant Treasurer (2019) | Executive Director, J.P. Morgan Investment Management Inc. Mr. Fleytekh has been with J.P. Morgan Investment Management Inc. since February 2012. |
Shannon Gaines (1977),
Assistant Treasurer (2018)* | Executive Director, J.P. Morgan Investment Management Inc. Mr. Gaines has been with J.P. Morgan Investment Management Inc. since January 2014. |
Jeffrey D. House (1972),
Assistant Treasurer (2017)* | Vice President, J.P. Morgan Investment Management Inc. since July 2006. |
Michael Mannarino (1985),
Assistant Treasurer (2020) | Vice President, J.P. Morgan Investment Management Inc. since 2014. |
Joseph Parascondola (1963),
Assistant Treasurer (2011)** | Executive Director, J.P. Morgan Investment Management Inc. Mr. Parascondola has been with J.P. Morgan Investment Management Inc. since 2006. |
| J.P. Morgan Small Cap Funds | |
OFFICERS
(Unaudited) (continued)
Name (Year of Birth), Positions Held with the Trusts (Since) | Principal Occupations During Past 5 Years |
Gillian I. Sands (1969),
Assistant Treasurer (2012) | Executive Director, J.P. Morgan Investment Management Inc. Ms. Sands has been with J.P. Morgan Investment Management Inc. since 2012. |
|
The contact address for each of the officers, unless otherwise noted, is 277 Park Avenue, New York, NY 10172. |
| The contact address for the officer is 1111 Polaris Parkway, Columbus, OH 43240. |
| The contact address for the officer is 575 Washington Boulevard, Jersey City, NJ 07310. |
| J.P. Morgan Small Cap Funds | |
SCHEDULE OF SHAREHOLDER EXPENSES
(Unaudited)
Hypothetical $1,000 Investment
As a shareholder of the Funds, you incur two types of costs: (1) transaction costs, including sales charges (loads) on purchase payments and (2) ongoing costs, including investment advisory fees, administration fees, distribution fees and other Fund expenses. The examples below are intended to help you understand your ongoing costs (in dollars) of investing in the Funds (not including expenses of the Underlying Funds) and to compare these ongoing costs with the ongoing costs of investing in other mutual funds. The examples assume that you had a $1,000 investment in each Class at the beginning of the reporting period, January 1, 2023, and continued to hold your shares at the end of the reporting period, June 30, 2023.
Actual Expenses
For each Class of each Fund in the table below, the first line provides information about actual account values and actual expenses. You may use the information in this line, together with the amount you invested, to estimate the expenses that you paid over the period. Simply divide your account value by $1,000 (for example, an $8,600 account value divided by $1,000 = 8.6), then multiply the result by the number in the first line of each Class under the heading titled “Expenses Paid During the Period” to estimate the expenses you paid on your account during this period.
Hypothetical Example for Comparison Purposes
The second line of each Class in the table below provides information about hypothetical account values and hypothetical expenses based on the Class’ actual expense ratio and an assumed rate of return of 5% per year before expenses, which is not the Class’ actual return. The hypothetical account values and expenses may not be used to estimate the actual ending account balance or expenses you paid for the period. You may use this information to compare the ongoing costs of investing in the Class of the Funds and other funds. To do so, compare this 5% hypothetical example with the 5% hypothetical examples that appear in the shareholder reports of the other funds. Please note that the expenses shown in the table are meant to highlight your ongoing costs only and do not reflect any transaction costs, such as sales charges (loads) or redemption fees, and expenses of the Underlying Funds. Therefore, the second line for each Class in the table is useful in comparing ongoing costs only, and will not help you determine the relative total costs of owning different funds. In addition, if these transaction costs were included, your costs would have been higher. The examples also assume all dividends and distributions have been reinvested.
| Beginning
Account Value
January 1, 2023 | Ending
Account Value
June 30, 2023 | Expenses
Paid During
the Period* | |
JPMorgan Small Cap Blend Fund | | | | |
| | | | |
| | | | |
| | | | |
| | | | |
| | | | |
| | | | |
| | | | |
| | | | |
| | | | |
| | | | |
| | | | |
| | | | |
JPMorgan Small Cap Equity Fund | | | | |
| | | | |
| | | | |
| | | | |
| | | | |
| | | | |
| | | | |
| | | | |
| | | | |
| | | | |
| | | | |
| | | | |
| | | | |
| J.P. Morgan Small Cap Funds | |
SCHEDULE OF SHAREHOLDER EXPENSES
(Unaudited) (continued)
Hypothetical $1,000 Investment
| Beginning Account Value January 1, 2023 | Ending Account Value June 30, 2023 | Expenses Paid During the Period* | |
JPMorgan Small Cap Equity Fund (continued) | | | | |
| | | | |
| | | | |
| | | | |
| | | | |
| | | | |
| | | | |
| | | | |
| | | | |
| | | | |
| | | | |
| | | | |
| | | | |
JPMorgan Small Cap Growth Fund | | | | |
| | | | |
| | | | |
| | | | |
| | | | |
| | | | |
| | | | |
| | | | |
| | | | |
| | | | |
| | | | |
| | | | |
| | | | |
| | | | |
| | | | |
| | | | |
| | | | |
| | | | |
| | | | |
| | | | |
| | | | |
| | | | |
| | | | |
| | | | |
| | | | |
| | | | |
| | | | |
| | | | |
JPMorgan Small Cap Sustainable Leaders Fund | | | | |
| | | | |
| | | | |
| | | | |
| | | | |
| | | | |
| | | | |
| | | | |
| | | | |
| | | | |
| J.P. Morgan Small Cap Funds | |
| Beginning Account Value January 1, 2023 | Ending Account Value June 30, 2023 | Expenses Paid During the Period* | |
JPMorgan Small Cap Sustainable Leaders Fund (continued) | | | | |
| | | | |
| | | | |
| | | | |
| | | | |
| | | | |
| | | | |
| | | | |
| | | | |
| | | | |
| | | | |
| | | | |
| | | | |
| | | | |
| | | | |
| | | | |
JPMorgan Small Cap Value Fund | | | | |
| | | | |
| | | | |
| | | | |
| | | | |
| | | | |
| | | | |
| | | | |
| | | | |
| | | | |
| | | | |
| | | | |
| | | | |
| | | | |
| | | | |
| | | | |
| | | | |
| | | | |
| | | | |
| | | | |
| | | | |
| | | | |
| | | | |
| | | | |
| | | | |
JPMorgan SMID Cap Equity Fund | | | | |
| | | | |
| | | | |
| | | | |
| | | | |
| | | | |
| | | | |
| | | | |
| | | | |
| | | | |
| J.P. Morgan Small Cap Funds | |
SCHEDULE OF SHAREHOLDER EXPENSES
(Unaudited) (continued)
Hypothetical $1,000 Investment
| Beginning Account Value January 1, 2023 | Ending Account Value June 30, 2023 | Expenses Paid During the Period* | |
JPMorgan SMID Cap Equity Fund (continued) | | | | |
| | | | |
| | | | |
| | | | |
| | | | |
| | | | |
| | | | |
| | | | |
| | | | |
| | | | |
JPMorgan U.S. Small Company Fund | | | | |
| | | | |
| | | | |
| | | | |
| | | | |
| | | | |
| | | | |
| | | | |
| | | | |
| | | | |
| | | | |
| | | | |
| | | | |
| | | | |
| | | | |
| | | | |
| | | | |
| | | | |
| | | | |
| | | | |
| | | | |
| | | | |
| | | | |
| | | | |
| | | | |
| | | | |
| | | | |
| | | | |
|
| Expenses are equal to each Class’ respective annualized net expense ratio, multiplied by the average account value over the period, multiplied by 181/365 (to reflect the one-half year period). |
| J.P. Morgan Small Cap Funds | |
LIQUIDITY RISK MANAGEMENT PROGRAM
(Unaudited)
Each of the Funds covered in this report has adopted the J.P. Morgan Funds and J.P. Morgan Exchange-Traded Funds Amended and Restated Liquidity Risk Management Program (the “Program”) under Rule 22e-4 under the Investment Company Act of 1940, as amended (the “Liquidity Rule”). The Program seeks to assess, manage and review each Fund’s Liquidity Risk. “Liquidity Risk” is defined as the risk that a fund could not meet requests to redeem shares issued by the fund without significant dilution of remaining investors’ interests in the fund. Pursuant to an exemptive order (the “Exemptive Order”) from the Securities and Exchange Commission, the Program permits the Funds to use liquidity definitions and classification methodologies that differ from the requirements under the Liquidity Rule in some respects. Among other things, the Liquidity Rule requires that a written report be provided to the Board of Trustees (the “Board”) on an annual basis that addresses the operation of the Program and assesses the adequacy and effectiveness of its implementation, including the operation of any Highly Liquid Investment Minimum (“HLIM”), where applicable, and any material changes to the Program.
The Board has appointed J.P. Morgan Asset Management’s Liquidity Risk Forum to be the program administrator for the Program (the “Program Administrator”). In addition to regular reporting at each of its quarterly meetings, on February 7, 2023, the Board reviewed the Program Administrator’s annual written report (the “Report”) concerning the operation of the Program for the period from January 1, 2022 through December 31, 2022 (the “Program Reporting Period”). The Report addressed the operation of the Program and assessed its adequacy and effectiveness of implementation, including, where applicable, the operation of a Fund’s HLIM. There were no material changes to the Program during the Program Reporting Period.
The Report summarized the operation of the Program and the information and factors considered by the Program Administrator in assessing whether the Program has been adequately and effectively implemented with respect to each Fund. Such information and factors included, among other things: (1) the liquidity risk framework used to assess, manage, and periodically review each Fund’s Liquidity Risk and the results of this assessment; (2) the methodology and inputs for classifying the investments of a Fund into one of the required liquidity categories that reflect an estimate of the liquidity of those investments under current market conditions; (3) whether a Fund invested primarily in “Highly Liquid Investments” (as defined or modified under the Program), as well as whether an HLIM should be established for a Fund (and, for Funds that have adopted an HLIM, whether the HLIM continues to be appropriate or whether a Fund has invested below its HLIM) and the procedures for monitoring for any HLIM; (4) whether a Fund invested more than 15% of its assets in “Illiquid Investments” (as defined or modified under the Program) and the procedures for monitoring for this limit; and (5) specific liquidity events arising during the Program Reporting Period. The Report further summarized the conditions of the Exemptive Order and whether all applicable Funds were in compliance with the terms of the Exemptive Order.
Based on this review, the Report concluded that: (1) the Program continues to be reasonably designed to effectively assess and manage each Fund’s Liquidity Risk; and (2) the Program has been adequately and effectively implemented with respect to each Fund during the Program Reporting Period.
| J.P. Morgan Small Cap Funds | |
TAX LETTER
(Unaudited)
(Dollar values in thousands)
Certain tax information for the J.P. Morgan Funds is required to be provided to shareholders based upon the income and distributions for the taxable year ended June 30, 2023. The information and distributions reported in this letter may differ from the information and taxable distributions reported to the shareholders for the calendar year ending December 31, 2023. The information necessary to complete your income tax returns for the calendar year ending December 31, 2023 will be provided under separate cover.
Dividends Received Deduction (DRD)
Each Fund listed below had the following percentage, or maximum allowable percentage, of ordinary income distributions eligible for the dividends received deduction for corporate shareholders for the fiscal year ended June 30, 2023:
| Dividends
Received
Deduction |
JPMorgan Small Cap Blend Fund | |
JPMorgan Small Cap Equity Fund | |
JPMorgan Small Cap Sustainable Leaders Fund | |
JPMorgan Small Cap Value Fund | |
JPMorgan SMID Cap Equity Fund | |
JPMorgan U.S. Small Company Fund | |
Long Term Capital Gain
Each Fund listed below distributed the following amount, or maximum allowable amount, of long-term capital gain dividends for the fiscal year ended June 30, 2023:
| Long-Term
Capital Gain
Distribution |
JPMorgan Small Cap Blend Fund | |
JPMorgan Small Cap Equity Fund | |
JPMorgan Small Cap Growth Fund | |
JPMorgan Small Cap Value Fund | |
JPMorgan SMID Cap Equity Fund | |
JPMorgan U.S. Small Company Fund | |
Qualified Dividend Income (QDI)
Each Fund listed below had the following amount, or maximum allowable amount, of ordinary income distributions treated as qualified dividends for the fiscal year ended June 30, 2023:
| |
JPMorgan Small Cap Blend Fund | |
JPMorgan Small Cap Equity Fund | |
JPMorgan Small Cap Sustainable Leaders Fund | |
JPMorgan Small Cap Value Fund | |
JPMorgan SMID Cap Equity Fund | |
JPMorgan U.S. Small Company Fund | |
| WHAT DOES J.P. MORGAN FUNDS DO WITH YOUR PERSONAL INFORMATION? |
| Financial companies choose how they share your personal information. Federal law gives consumers the right to limit some but not all sharing. Federal law also requires us to tell you how we collect, share, and protect your personal information. Please read this notice carefully to understand what we do. |
| The types of personal information we collect and share depend on the product or service you have with us. This information can include: |
| ○Social Security number and account balances |
| ○transaction history and account transactions |
| ○checking account information and wire transfer instructions |
| When you are no longer our customer, we continue to share your information as described in this notice. |
| All financial companies need to share customers’ personal information to run their everyday business. In the section below, we list the reasons financial companies can share their customers’ personal information; the reasons J.P. Morgan Funds chooses to share; and whether you can limit this sharing. |
Reasons we can share your personal information | Does J.P. Morgan
Funds share? | Can you limit this
sharing? |
For our everyday business purposes — such as to process your transactions, maintain your account(s), respond to court orders and legal investigations, or report to credit bureaus | | |
For marketing purposes — to offer our products and services to you | | |
For joint marketing with other financial companies | | |
For our affiliates’ everyday business purposes — information about your transactions and experiences | | |
For our affiliates’ everyday business purposes — information about your creditworthiness | | |
For nonaffiliates to market to you | | |
Questions? Call 1-800-480-4111 or go to www.jpmorganfunds.com | |
|
Who is providing this notice? | |
|
How does J.P. Morgan Funds protect my personal information? | To protect your personal information from unauthorized access and use, we use security measures that comply with federal law. These measures include computer safeguards and secured files and buildings. We authorize our employees to access your information only when they need it to do their work and we require companies that work for us to protect your information. |
|
How does J.P. Morgan Funds collect my personal information? | We collect your personal information, for example, when you: |
○open an account or provide contact information |
○give us your account information or pay us by check |
|
We also collect your personal information from others, such as credit bureaus, affiliates and other companies. |
|
Why can’t I limit all sharing? | Federal law gives you the right to limit only: |
○sharing for affiliates’ everyday business purposes – information about your creditworthiness |
○affiliates from using your information to market to you |
○sharing for nonaffiliates to market to you |
State laws and individual companies may give you additional rights to limit sharing. |
|
| Companies related by common ownership or control. They can be financial and nonfinancial companies. |
| ○J.P. Morgan Funds does not share with our affiliates. |
|
| Companies not related by common ownership or control. They can be financial and nonfinancial companies. |
| ○J.P. Morgan Funds does not share with nonaffiliates so they can market to you. |
|
| A formal agreement between nonaffiliated financial companies that together market financial products or services to you. |
| ○J.P. Morgan Funds doesn’t jointly market. |
J.P. Morgan Funds are distributed by JPMorgan Distribution Services, Inc., which is an affiliate of JPMorgan Chase & Co. Affiliates of JPMorgan Chase & Co. receive fees for providing various services to the Funds.
Contact JPMorgan Distribution Services, Inc. at 1-800-480-4111 for a fund prospectus. You can also visit us at www.jpmorganfunds.com. Investors should carefully consider the investment objectives and risk as well as charges and expenses of the mutual fund before investing. The prospectus contains this and other information about the mutual fund. Read the prospectus carefully before investing.
Investors may obtain information about the Securities Investor Protection Corporation (SIPC), including the SIPC brochure, by visiting www.sipc.org or by calling SIPC at 202-371-8300.
Each Fund files a complete schedule of its fund holdings for the first and third quarters of its fiscal year with the SEC as an exhibit to its report on Form N-PORT. The Funds' Form N-PORT reports are available on the SEC’s website at http://www.sec.gov. Each Fund's quarterly holdings can be found by visiting the J.P. Morgan Funds’ website at www.jpmorganfunds.com.
A description of each Fund's policies and procedures with respect to the disclosure of each Fund's holdings is available in the prospectuses and Statement of Additional Information.
A copy of proxy policies and procedures is available without charge upon request by calling 1-800-480-4111 and on the Funds' website at www.jpmorganfunds.com. A description of such policies and procedures is on the SEC’s website at www.sec.gov. The Trustees have delegated the authority to vote proxies for securities owned by the Funds to the Adviser. A copy of the Funds' voting record for the most recent 12-month period ended June 30 is available on the SEC’s website at www.sec.gov or at the Funds' website at www.jpmorganfunds.com no later than August 31 of each year. The Funds' proxy voting record will include, among other things, a brief description of the matter voted on for each fund security, and will state how each vote was cast, for example, for or against the proposal.
J.P. Morgan Asset Management is the brand name for the asset management business of JPMorgan Chase & Co. and its affiliates worldwide.
© JPMorgan Chase & Co., 2023. All rights reserved. June 2023.
AN-SC-623
Annual Report
J.P. Morgan Mid Cap/Multi-Cap Funds
June 30, 2023
JPMorgan Growth Advantage Fund |
JPMorgan Mid Cap Equity Fund |
JPMorgan Mid Cap Growth Fund |
JPMorgan Mid Cap Value Fund |
JPMorgan Value Advantage Fund |
CONTENTS
Investments in a Fund are not deposits or obligations of, or guaranteed or endorsed by, any bank and are not insured or guaranteed by the FDIC, the Federal Reserve Board or any other government agency. You could lose money if you sell when a Fund’s share price is lower than when you invested.
Past performance is no guarantee of future performance. The general market views expressed in this report are opinions based on market and other conditions through the end of the reporting period and are subject to change without notice. These views are not intended to predict the future performance of a Fund or the securities markets.
Prospective investors should refer to the Funds’ prospectuses for a discussion of the Funds’ investment objectives, strategies and risks. Call J.P. Morgan Funds Service Center at 1-800-480-4111 for a prospectus containing more complete information about a Fund, including management fees and other expenses. Please read it carefully before investing.
Letter to Shareholders
August 11, 2023 (Unaudited)
Dear Shareholder,
Equity markets largely delivered solid returns for the twelve months ended June 30, 2023 on the back of buoyant corporate earnings, continued economic growth and receding inflationary pressures. Even as the U.S. Federal Reserve raised interest rates in an effort to cool the economy, the unemployment rate remained below 4% and consumer and business spending was generally higher than many economists expected.
|
“Equity markets delivered strong returns during the first half of 2023, with investors who remained fully invested likely benefitting. Going forward, we believe investors may be best served by maintaining a long-term view and holding a well-diversified portfolio.” — Brian S. Shlissel
|
Among financial markets, the performance of leading equity indexes was mixed through the second half of 2022. However, the S&P 500 Index generated positive performance every month except February in the first half of 2023. Large cap growth stocks generally outperformed other sectors of the market for the twelve-months ended June 30, 2023, partly due to investor demand for shares of large information technology companies. Leading mid cap and small cap equity indexes – both growth and value - posted positive performance for the period. Notably, the collapse of three U.S. regional banks in March 2023 put pressure on equities in the broader financial sector but the responses by multiple U.S. regulatory agencies as well as leading central banks appear to have limited further volatility in the banking industry.
With the exception of its June 2023 meeting, the U.S. Federal Reserve (the “Fed”) raised benchmark interest rates at 10 consecutive meetings since commencing its tightening monetary policy in mid-March 2022, and subsequently raised rates again in July 2023. Meanwhile, U.S. inflation, as measured by the Consumer Price Index, fell from 40-year highs in mid-2022 to 3.0% in June 2023. U.S. gross domestic product (GDP) remained positive throughout the 12-month period and even rebounded to an annualized rate of 2.4% in the second quarter of 2023 from 2.0% in the first quarter. While the overall
trend in consumer spending was downward, consumption was better than economists generally expected and business fixed investment in equipment, facilities and software in the second quarter of 2023 increased at the fastest pace since the start of 2022.
Though inflation remained above the Fed’s stated target of 2% annual growth during the twelve-month period, the declining trend in price growth may allow the Fed to end its policy tightening sooner than expected. Moreover, the resiliency of the U.S. economy in the face of the highest interest rates since 2001 could allow the economy to cool without GDP tipping into negative territory or leading to wide-spread job losses.
Certainly, there are factors that remain the focus of investor concerns. The war in Ukraine has continued, without demonstrative progress toward an eventual peace settlement or even a ceasefire. Elsewhere, China’s economy is experiencing weak growth and record high unemployment, and falling prices have raised economists’ worries about the potential for a deflationary spiral in the world’s second largest economy. In the U.S., the run-up to the 2024 presidential election has the potential to increase global political and economic uncertainty.
Equity markets delivered strong returns during the first half of 2023, with investors who remained fully invested likely benefitting. Going forward, we believe investors may be best served by maintaining a long-term view and holding a well-diversified portfolio. Our suite of investment solutions seeks to provide investors with ability to build durable portfolios that can meet their financial goals.
Sincerely,
Brian S. Shlissel
President, J.P. Morgan Funds
J.P. Morgan Asset Management
1-800-480-4111 or www.jpmorganfunds.com for more information
| J.P. Morgan Mid Cap/Multi-Cap Funds | |
J.P. Morgan Mid Cap/Multi-Cap Funds
MARKET OVERVIEW
TWELVE MONTHS ENDED June 30, 2023 (Unaudited)
Equity markets largely generated positive returns for the twelve-month period as consumer spending, manufacturing and corporate earnings remained resilient in the face of rising interest rates and slowing economic growth. While leading equity indexes were mixed on a month-to-month basis, the overall trend was toward a rebound from the sell-off that marked the first half of 2022.
Following a sharp sell-off in August and September 2022 that coincided with U.S. Federal Reserve policy guidance on further interest rate increases, equity prices largely stabilized. Corporate earnings for both the second and third quarters of 2022 were generally better than expected given a cooling economy and slowing consumer spending. By the start of 2023, economic data showed some inflationary pressures had eased.
Across Europe, the energy crisis that followed Russia’s invasion of Ukraine in late February 2022 eased somewhat in the second half of 2022 as both the U.K. and the EU obtained alternatives to Russian energy imports and global energy prices began to recede. A political crisis in the U.K. roiled financial markets in London but the ascension of Rishi Sunak to prime minister appeared to remove some investor uncertainty by the end of 2022.
Meanwhile, leading central banks largely continued to raise interest rates during the twelve-month period. Notably, the European Central Bank initiated its monetary tightening policy in September 2022, with its first rate increase in eleven years and the largest increase in the bank’s history. The U.S. Federal Reserve declined to raise interest rates at its June 2023 meeting, though it stated it would raise rates further in 2023 as needed.
While financial market volatility receded from 2022 levels, it remained elevated in the face of investor uncertainty about interest rates. In March 2023, the financial sector was roiled by the failures of Silicon Valley Bank and First Republic Bank in the U.S., and Credit Suisse Group AG in Switzerland. In each instance, government regulators moved to prevent further contagion within the financials sector.
| J.P. Morgan Mid Cap/Multi-Cap Funds | |
JPMorgan Growth Advantage Fund
FUND COMMENTARY
TWELVE MONTHS ENDED June 30, 2023 (Unaudited)
| |
Fund (Class A Shares, without a sales charge) * | |
Russell 3000 Growth Index | |
Net Assets as of 6/30/2023 (In Thousands) | |
INVESTMENT OBJECTIVE **
The JPMorgan Growth Advantage Fund (the “Fund”) seeks to provide long-term capital growth.
WHAT WERE THE MAIN DRIVERS OF THE FUND’S PERFORMANCE?
The Fund’s Class A Shares, without a sales charge, underperformed the Russell 3000 Growth Index (the “Benchmark”) for the twelve months ended June 30, 2023.
The Fund’s security selection in the financials and information technology sectors was a leading detractor from performance relative to the Benchmark, while the Fund’s security selection in the industrials and health care sectors was a leading contributor to relative performance.
Leading individual detractors from relative performance included the Fund’s overweight positions in Catalent Inc., Zoom Video Communications Inc. and its out-of-Benchmark position in First Republic Bank. Shares of Catalent, a pharmaceuticals maker, fell after the company lowered its 2023 earnings forecast, citing productivity and operational problems. Shares of Zoom Video Communications, a video conferencing service provider, fell amid investor concerns about the growth outlook for the company’s core business. Shares of First Republic Bank, a regional bank based in San Francisco, Calif., fell as the company neared collapse before U.S. regulators arranged its acquisition by JPMorgan Chase & Co.
Leading individual contributors to relative performance included the Fund’s overweight positions in Horizon Therapeutics PLC, Nvidia Corp. and Exact Sciences Corp. Shares of Horizon Therapeutics PLC, a pharmaceuticals developer based in Ireland, rose after the company agreed to be acquired by Amgen Inc. Shares of Nvidia, a semiconductor manufacturer, rose amid investor expectations for rising demand for the company’s artificial intelligence technology. Shares of Exact Sciences, a developer of cancer screening and medical diagnostics, rose after the company raised its 2023 earnings forecasts and amid better-than-expected quarterly results during the period.
HOW WAS THE FUND POSITIONED?
The Fund’s portfolio managers utilized a bottom-up approach to stock selection, researching individual companies across
market capitalizations in an effort to construct portfolios of stocks that have strong fundamentals. The Fund’s portfolio managers sought to invest in high quality companies with durable franchises that, in their view, possessed the ability to
generate strong future earnings growth.
TOP TEN HOLDINGS OF THE
PORTFOLIO AS OF June 30, 2023 | PERCENT OF
TOTAL
INVESTMENTS |
| | |
| | |
| | |
| | |
| | |
| Meta Platforms, Inc., Class A | |
| Mastercard, Inc., Class A | |
| | |
| | |
| | |
PORTFOLIO COMPOSITION BY SECTOR
AS OF June 30, 2023 | PERCENT OF
TOTAL
INVESTMENTS |
| |
| |
| |
| |
| |
| |
| |
| |
Others (each less than 1.0%) | |
| |
*
The return shown is based on net asset values calculated for shareholder transactions and may differ from the return shown in the financial highlights, which reflects adjustments made to the net asset values in accordance with accounting principles generally accepted in the United States of America.
**
The adviser seeks to achieve the Fund’s objective. There can be no guarantee it will be achieved.
| J.P. Morgan Mid Cap/Multi-Cap Funds | |
JPMorgan Growth Advantage Fund
FUND COMMENTARY
TWELVE MONTHS ENDED June 30, 2023 (Unaudited) (continued)
AVERAGE ANNUAL TOTAL RETURNS AS OF June 30, 2023
|
| Sales Charge for Class A Shares is 5.25%. |
| Assumes a 1% CDSC (contingent deferred sales charge) for the one year period and 0% CDSC thereafter. |
TEN YEAR FUND PERFORMANCE (6/30/13 TO 6/30/23)
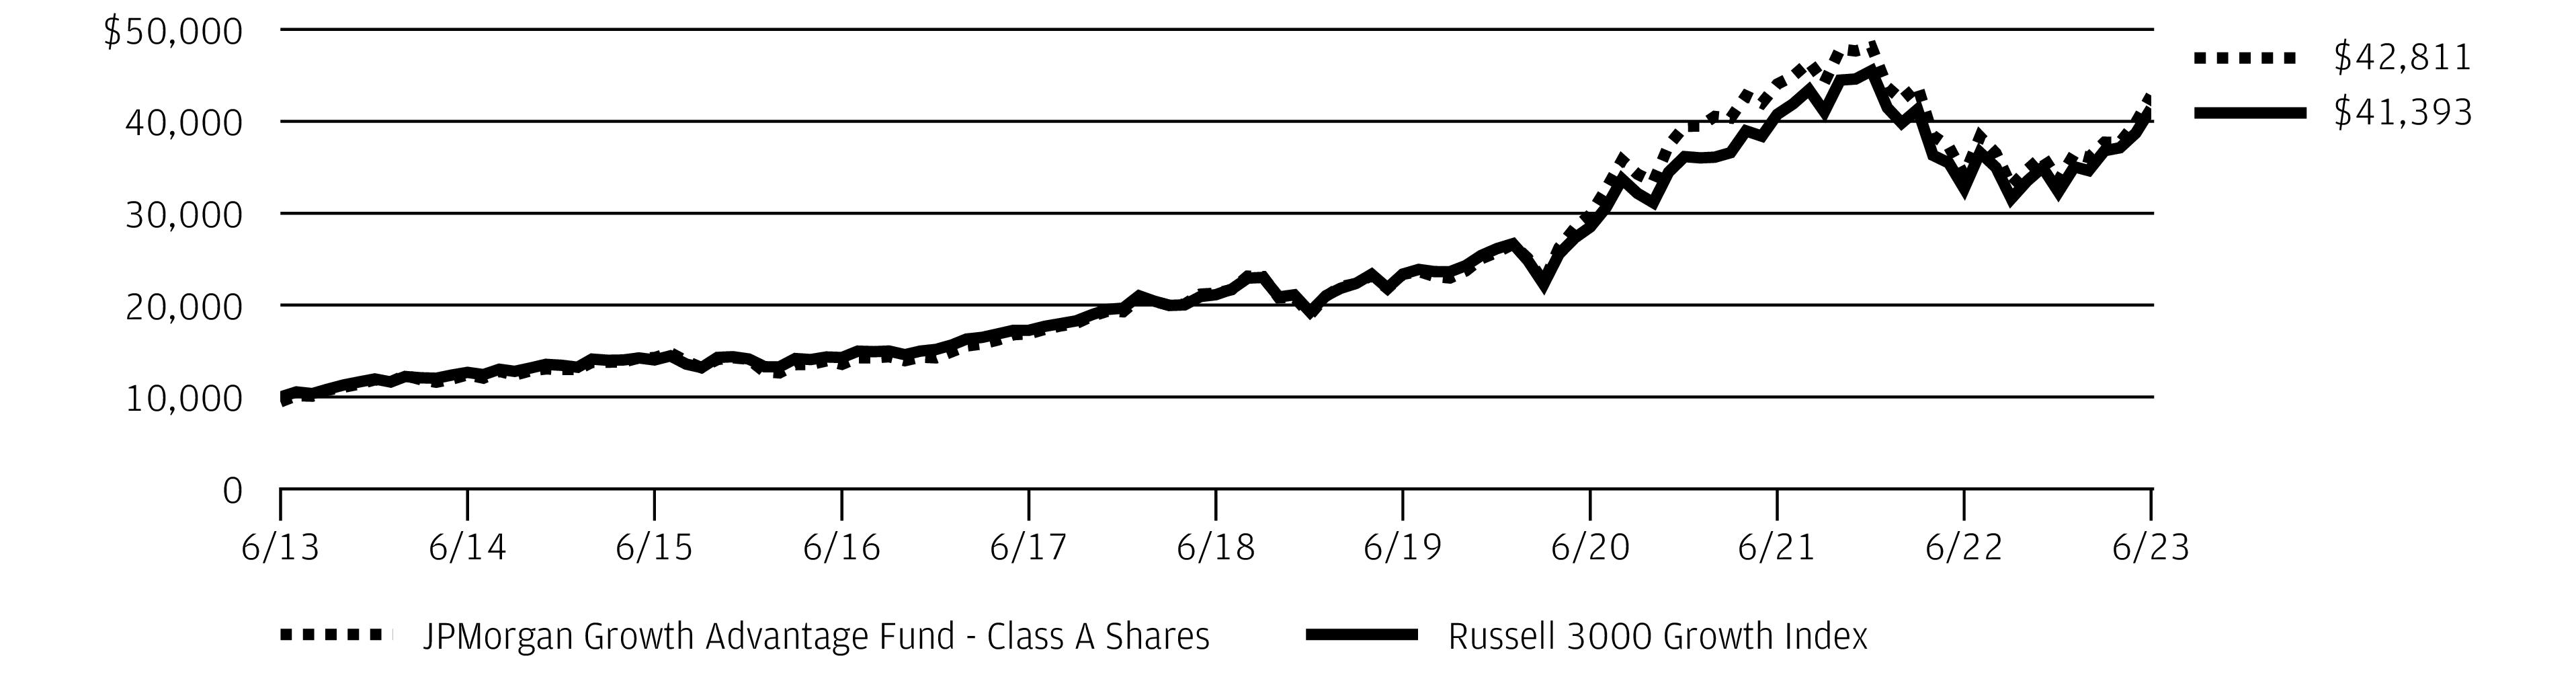
The performance quoted is past performance and is not a guarantee of future results. Mutual funds are subject to certain market risks. Investment returns and principal value of an investment will fluctuate so that an investor’s shares, when redeemed, may be worth more or less than their original cost. Current performance may be higher or lower than the performance data shown. For up-to-date month-end performance information please call 1-800-480-4111.
Returns for Class R2 and Class R3 Shares prior to their inception dates are based on the performance of Class A Shares. The actual returns for Class R2 Shares would have been lower than those shown because Class R2 Shares have higher expenses than Class A Shares. The actual returns for Class R3 Shares would have been similar to those shown because Class R3 Shares have similar expenses to Class A Shares.
Returns for Class R4 Shares prior to their inception dates are based on the performance of Class I Shares. The actual returns of Class R4 Shares would have been different than those shown because Class R4 Shares have different expenses to Class I Shares.
Returns for Class R6 Shares prior to their inception date are based on the performance of Class R5 Shares. The actual returns of Class R6 Shares would have been different than those shown because Class R6 Shares have different expenses than Class R5 and Class I Shares.
The graph illustrates comparative performance for $10,000 invested in Class A Shares of the JPMorgan Growth Advantage Fund and the Russell 3000 Growth Index from June 30, 2013 to June 30, 2023. The performance of the Fund
assumes reinvestment of all dividends and capital gain distributions, if any, and includes a sales charge. The performance of the Russell 3000 Growth Index does not reflect the deduction of expenses or a sales charge associated with a mutual fund and has been adjusted to reflect reinvestment of all dividends and capital gain distributions of the securities included in the benchmark, if applicable. The Russell 3000 Growth Index is an unmanaged index which measures the performance of those Russell 3000 companies (largest 3000 U.S. companies) with higher price-to-book ratios and higher forecasted growth values. Investors cannot invest directly in an index.
Class A Shares have a $1,000 minimum initial investment and carry a 5.25% sales charge.
Fund performance may reflect the waiver of the Fund’s fees and reimbursement of expenses for certain periods. Without these waivers and reimbursements, performance would have been lower. Also, performance shown in this section does not reflect the deduction of taxes that a shareholder would pay on Fund distributions or on gains resulting from redemptions of Fund shares.
Because Class C Shares automatically convert to Class A Shares after 8 years, the 10 year average annual total return shown above for Class C reflects Class A performance for the period after conversion.
The returns shown are based on net asset values calculated for shareholder transactions and may differ from the returns shown in the financial highlights, which reflect adjustments made to the net asset values in accordance with accounting principles generally accepted in the United States of America.
| J.P. Morgan Mid Cap/Multi-Cap Funds | |
JPMorgan Mid Cap Equity Fund
FUND COMMENTARY
TWELVE MONTHS ENDED June 30, 2023 (Unaudited)
| |
| |
| |
Net Assets as of 6/30/2023 (In Thousands) | |
INVESTMENT OBJECTIVE **
The JPMorgan Mid Cap Equity Fund (the “Fund”) seeks long-term capital growth.
WHAT WERE THE MAIN DRIVERS OF THE FUND’S PERFORMANCE?
The Fund’s Class I Shares underperformed the Russell Midcap Index (the “Benchmark”) for the twelve months ended June 30, 2023.
The Fund’s security selection in the consumer discretionary and utilities sectors was a leading detractor from performance relative to the Benchmark, while the Fund’s security selection in the health care and materials sectors was a leading contributor to relative performance.
Leading individual detractors from relative performance included the Fund’s overweight positions in Newell Brands Inc., M&T Bank Corp. and Jazz Pharmaceuticals PLC. Shares of Newell Brands, a consumer housewares manufacturer, fell after the company reported weaker-than-expected sales forecasts, reduced its quarterly dividend and reported lower-than-expected earnings for the first quarter of 2023. Shares of M&T Bank, a regional bank based in Buffalo, N.Y., fell amid volatility in the regional banking sector following the failure of Silicon Valley Bank in March 2023. Shares of Jazz Pharmaceuticals, a drug development company, fell after the company reported lower-than-expected earnings and revenue for the first quarter of 2023.
Leading individual contributors to relative performance included the Fund’s overweight positions in Hubbell Inc., Jabil Inc. and MongoDB Inc. Shares of Hubbell, an electrical components and equipment manufacturer, rose after the company reported better-than-expected earnings and revenue for the first quarter of 2023. Shares of Jabil, a provider of electronics manufacturing services, rose after the company reported better-than-expected earnings and revenue for its fiscal third quarter. Shares of MongoDB, a data base and internet services provider, rose after the company reported better-than-expected earnings and revenue for the first quarter of 2023, and amid investor expectations the company would benefit from increased demand for artificial intelligence technologies.
HOW WAS THE FUND POSITIONED?
The Fund’s portfolio managers employed a bottom-up approach to stock selection, constructing a portfolio based on company fundamentals, quantitative screening and proprietary fundamental analysis. The Fund’s portfolio managers sought to identify dominant franchises with predictable business models they deemed capable of achieving, in their view, sustained growth, as well as undervalued companies with the potential to
grow their intrinsic value per share.
TOP TEN HOLDINGS OF THE
PORTFOLIO AS OF June 30, 2023 | PERCENT OF
TOTAL
INVESTMENTS |
| | |
| | |
| Ameriprise Financial, Inc. | |
| | |
| | |
| Raymond James Financial, Inc. | |
| | |
| | |
| | |
| | |
PORTFOLIO COMPOSITION BY SECTOR
AS OF June 30, 2023 | PERCENT OF
TOTAL
INVESTMENTS |
| |
| |
| |
| |
| |
| |
| |
| |
| |
| |
| |
| |
*
The return shown is based on net asset values calculated for shareholder transactions and may differ from the return shown in
| J.P. Morgan Mid Cap/Multi-Cap Funds | |
JPMorgan Mid Cap Equity Fund
FUND COMMENTARY
TWELVE MONTHS ENDED June 30, 2023 (Unaudited) (continued)
the financial highlights, which reflects adjustments made to the net asset values in accordance with accounting principles generally accepted in the United States of America.
**
The adviser seeks to achieve the Fund’s objective. There can be no guarantee it will be achieved.
| J.P. Morgan Mid Cap/Multi-Cap Funds | |
AVERAGE ANNUAL TOTAL RETURNS AS OF June 30, 2023
|
| Sales Charge for Class A Shares is 5.25%. |
| Assumes a 1% CDSC (contingent deferred sales charge) for the one year period and 0% CDSC thereafter. |
TEN YEAR FUND PERFORMANCE (6/30/13 TO 6/30/23)
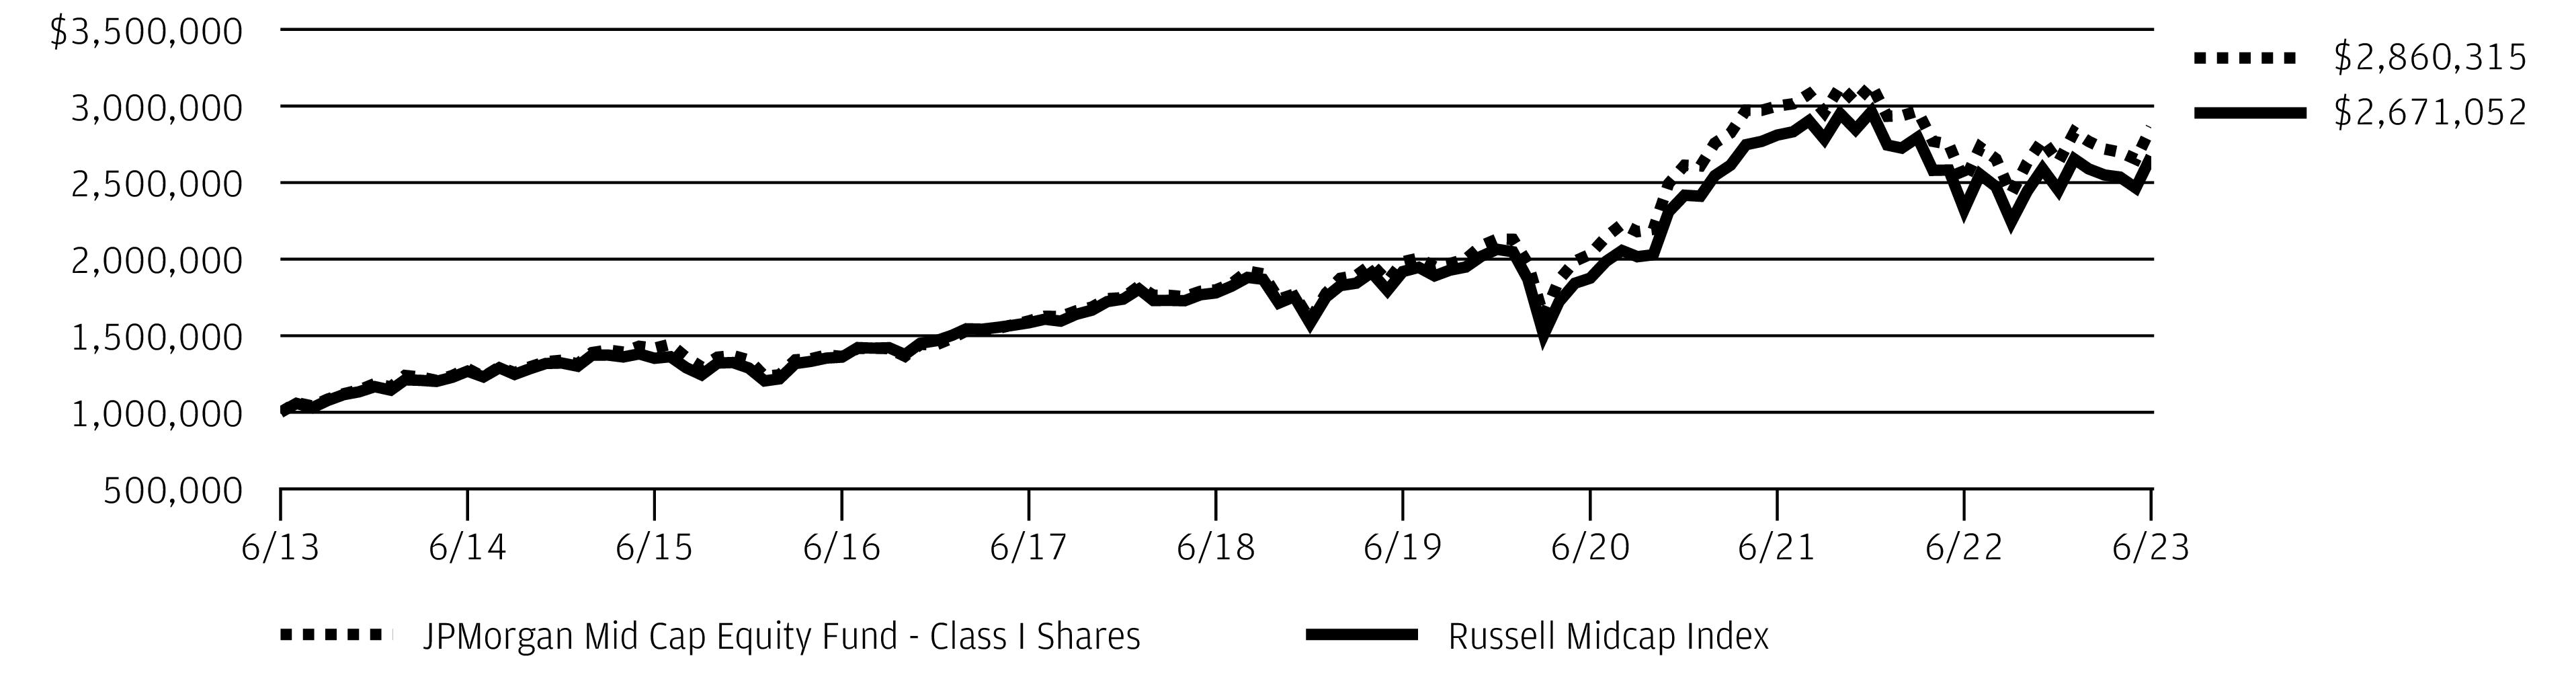
The performance quoted is past performance and is not a guarantee of future results. Mutual funds are subject to certain market risks. Investment returns and principal value of an investment will fluctuate so that an investor’s shares, when redeemed, may be worth more or less than their original cost. Current performance may be higher or lower than the performance data shown. For up-to-date month-end performance information please call 1-800-480-4111.
Returns for Class R2 Shares prior to their inception date are based on the performance of Class A Shares. The actual returns of Class R2 Shares would have been lower than those shown because Class R2 Shares have higher expenses than Class A Shares.
Returns for Class R5 and Class R6 Shares prior to their inception date are based on the performance of Class I Shares. The actual returns of Class R5 and Class R6 Shares would have been different than those shown because Class R5 and Class R6 Shares have different expenses than Class I Shares.
The graph illustrates comparative performance for $1,000,000 invested in the Class I Shares of JPMorgan Mid Cap Equity Fund and the Russell Midcap Index from June 30, 2013 to June 30, 2023. The performance of the Fund assumes reinvestment of all dividends and capital gain distributions, if any, and does not include a sales charge. The performance of the Russell Midcap Index does not
reflect the deduction of expenses or a sales charge associated with a mutual fund and has been adjusted to reflect reinvestment of all dividends and capital gain distributions of the securities included in the bench mark, if applicable. The Russell Midcap Index is an unmanaged index which measures the performance of the 800 smallest companies in the Russell 1000 Index. Investors cannot invest directly in an index.
Class I Shares have a $1,000,000 minimum initial investment.
Fund performance may reflect the waiver of the Fund’s fees and reimbursement of expenses for certain periods. Without these waivers and reimbursements, performance would have been lower. Also, performance shown in this section does not reflect the deduction of taxes that a shareholder would pay on Fund distributions or on gains resulting from redemptions of Fund shares.
Because Class C Shares automatically convert to Class A Shares after 8 years, the 10 year average annual total return shown above for Class C reflects Class A performance for the period after conversion.
The returns shown are based on net asset values calculated for shareholder transactions and may differ from the returns shown in the financial highlights, which reflect adjustments made to the net asset values in accordance with accounting principles generally accepted in the United States of America.
| J.P. Morgan Mid Cap/Multi-Cap Funds | |
JPMorgan Mid Cap Growth Fund
FUND COMMENTARY
TWELVE MONTHS ENDED June 30, 2023 (Unaudited)
| |
| |
Russell Midcap Growth Index | |
Net Assets as of 6/30/2023 (In Thousands) | |
INVESTMENT OBJECTIVE **
The JPMorgan Mid Cap Growth Fund (the “Fund”) seeks growth of capital.
WHAT WERE THE MAIN DRIVERS OF THE FUND’S PERFORMANCE?
The Fund’s Class I Shares underperformed the Russell Midcap Growth Index (the “Benchmark”) for the twelve months ended June 30, 2023.
The Fund’s security selection in the financials and consumer discretionary sectors was a leading detractor from performance relative to the Benchmark, while the Fund’s security selection in the industrials sector and its underweight position in the materials sector were leading contributors to relative performance.
Leading individual detractors from relative performance included the Fund’s overweight position in Catalent Inc., and its out-of-Benchmark positions in First Republic Bank and Centene Corp. Shares of Catalent, a pharmaceuticals maker, fell after the company lowered its 2023 earnings forecast, citing productivity and operational problems. Shares of First Republic Bank, a regional bank based in San Francisco, Calif., fell as the company neared collapse before U.S. regulators arranged its takeover by JPMorgan Chase & Co. Shares of Centene, a managed health care provider, fell after the company lowered its forecast for 2024 results amid rising costs.
Leading individual contributors to relative performance included the Fund’s overweight positions in Exact Sciences Corp., Horizon Therapeutics PLC and Royal Caribbean Cruises Ltd. Shares of Exact Sciences, a developer of cancer screening and medical diagnostics, rose after the company raised its 2023 earnings forecasts and amid better-than-expected quarterly results during the period. Shares of Horizon Therapeutics PLC, a pharmaceuticals developer based in Ireland, rose after the company agreed to be acquired by Amgen Inc. Shares of Royal Caribbean Cruises, a cruise ship operator, rose amid strong growth in bookings during the second half of the period.
HOW WAS THE FUND POSITIONED?
The Fund’s portfolio managers utilized a bottom-up approach to stock selection, researching individual companies in an effort
to construct a portfolio of stocks that have strong fundamentals. The Fund’s portfolio managers sought to invest in high quality companies with durable franchises that, in their view, possessed the ability to generate strong future earnings
growth.
TOP TEN HOLDINGS OF THE
PORTFOLIO AS OF June 30, 2023 | PERCENT OF
TOTAL
INVESTMENTS |
| | |
| | |
| | |
| | |
| Trade Desk, Inc. (The), Class A | |
| | |
| | |
| | |
| | |
| | |
PORTFOLIO COMPOSITION BY SECTOR
AS OF June 30, 2023 | PERCENT OF
TOTAL
INVESTMENTS |
| |
| |
| |
| |
| |
| |
| |
Others (each less than 1.0%) | |
| |
*
The return shown is based on net asset values calculated for shareholder transactions and may differ from the return shown in the financial highlights, which reflects adjustments made to the net asset values in accordance with accounting principles generally accepted in the United States of America.
**
The adviser seeks to achieve the Fund’s objective. There can be no guarantee it will be achieved.
| J.P. Morgan Mid Cap/Multi-Cap Funds | |
AVERAGE ANNUAL TOTAL RETURNS AS OF June 30, 2023
|
| Sales Charge for Class A Shares is 5.25%. |
| Assumes a 1% CDSC (contingent deferred sales charge) for the one year period and 0% CDSC thereafter. |
TEN YEAR FUND PERFORMANCE (6/30/13 TO 6/30/23)
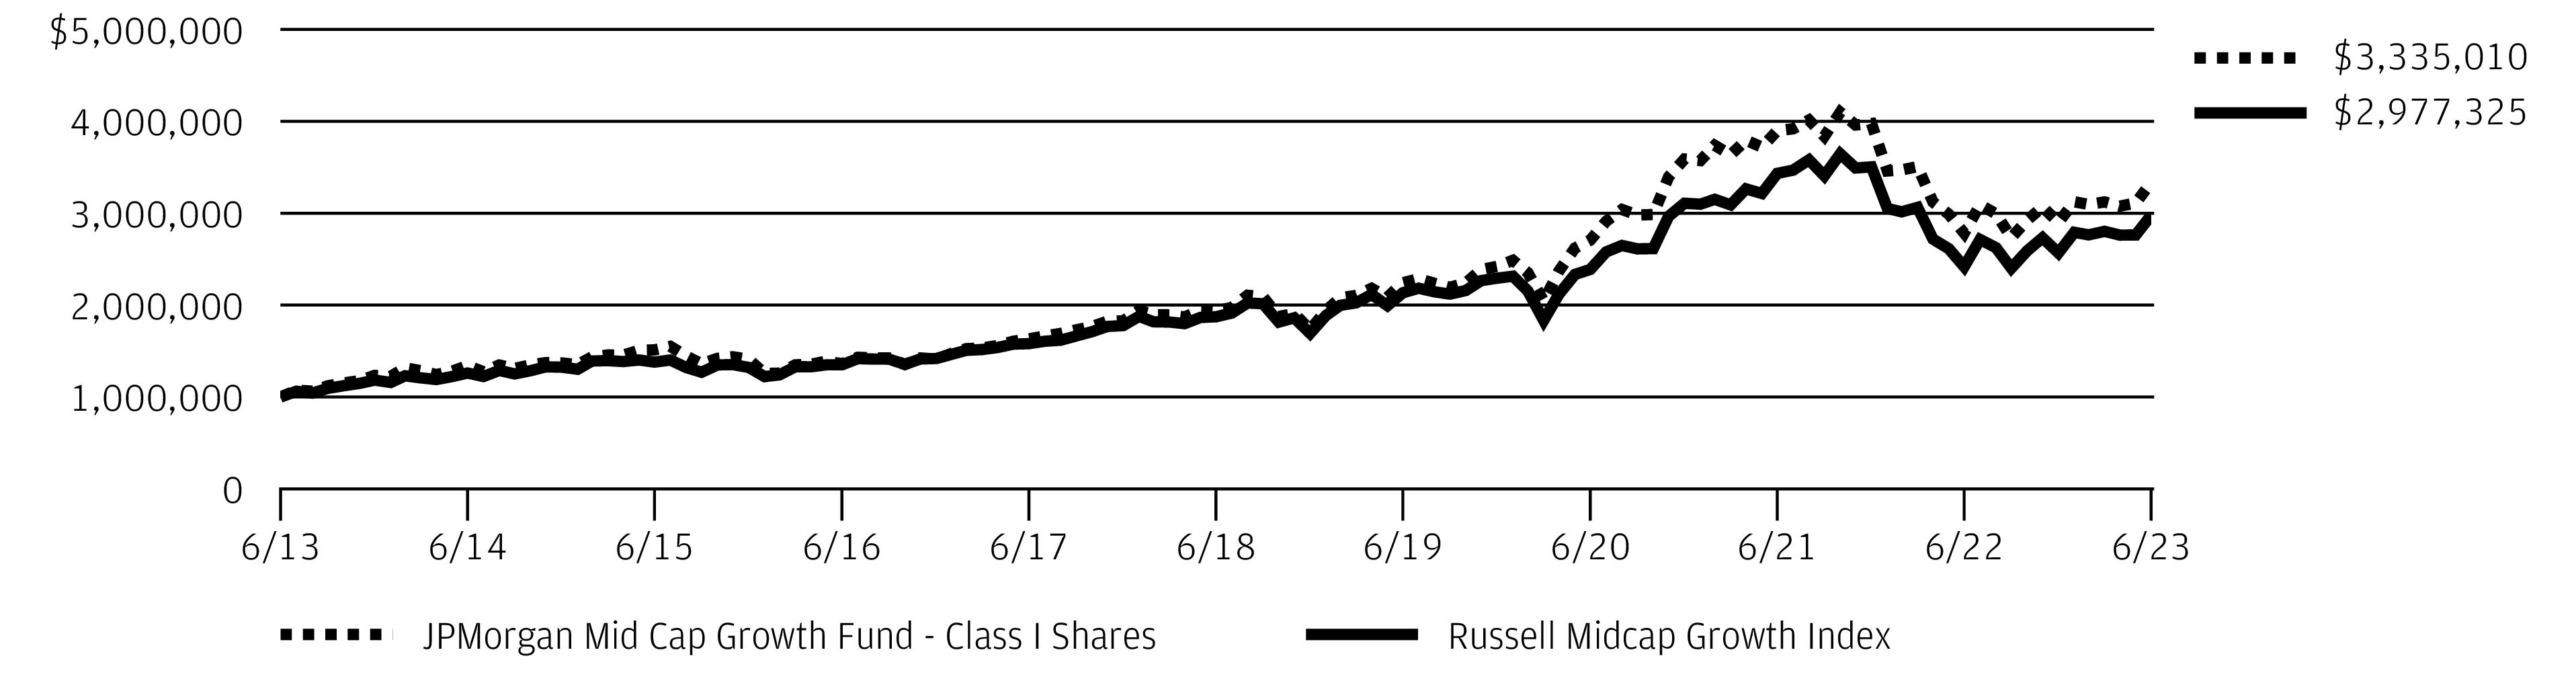
The performance quoted is past performance and is not a guarantee of future results. Mutual funds are subject to certain market risks. Investment returns and principal value of an investment will fluctuate so that an investor’s shares, when redeemed, may be worth more or less than their original cost. Current performance may be higher or lower than the performance data shown. For up-to-date month-end performance information please call 1-800-480-4111.
Returns for the Class R3 and Class R4 Shares prior to their inception dates are based on the performance of Class I Shares. Prior performance for Class R3 and Class R4 Shares has been adjusted to reflect the differences in expenses between classes.
The graph illustrates comparative performance for $1,000,000 invested in Class I Shares of the JPMorgan Mid Cap Growth Fund and the Russell Midcap Growth Index from June 30, 2013 to June 30, 2023. The performance of the Fund assumes reinvestment of all dividends and capital gain distributions, if any, and does not include a sales charge. The performance of the Russell Midcap Growth Index does not reflect the deduction of expenses or a sales charge associated with a mutual fund and has been adjusted to reflect reinvestment of all dividends and capital gain distributions of the securities
included in the benchmark, if applicable. The Russell Midcap Growth Index is an unmanaged index which measures the performance of those Russell Midcap companies with higher price-to-book ratios and higher forecasted growth values. Investors cannot invest directly in an index.
Class I Shares have a $1,000,000 minimum initial investment.
Fund performance may reflect the waiver of the Fund’s fees and reimbursement of expenses for certain periods. Without these waivers and reimbursements, performance would have been lower. Also, performance shown in this section does not reflect the deduction of taxes that a shareholder would pay on Fund distributions or on gains resulting from redemptions of Fund shares.
Because Class C Shares automatically convert to Class A Shares after 8 years, the 10 year average annual total return shown above for Class C reflects Class A performance for the period after conversion.
The returns shown are based on net asset values calculated for shareholder transactions and may differ from the returns shown in the financial highlights, which reflect adjustments made to the net asset values in accordance with accounting principles generally accepted in the United States of America.
| J.P. Morgan Mid Cap/Multi-Cap Funds | |
JPMorgan Mid Cap Value Fund
FUND COMMENTARY
TWELVE MONTHS ENDED June 30, 2023 (Unaudited)
| |
| |
Russell Midcap Value Index | |
Net Assets as of 6/30/2023 (In Thousands) | |
INVESTMENT OBJECTIVE**
The JPMorgan Mid Cap Value Fund (the “Fund”) seeks growth from capital appreciation.
WHAT WERE THE MAIN DRIVERS OF THE FUND’S PERFORMANCE?
The Fund’s Class L Shares underperformed the Russell Midcap Value Index (the “Benchmark”) for the twelve months ended June 30, 2023.
The Fund’s security selection in the consumer discretionary and utilities sectors was a leading detractor from performance relative to the Benchmark, while the Fund’s security selection in the financials and information technology sectors was a leading contributor to relative performance.
Leading individual detractors from relative performance included the Fund’s overweight positions in Newell Brands Inc., M&T Bank Corp. and Liberty Broadband Corp. Shares of Newel Brands, a consumer housewares manufacturer, fell after the company issued weaker-than-expected sales forecasts, reduced its quarterly dividend and reported lower-than-expected earnings for the first quarter of 2023. Shares of M&T Bank, a regional bank based in Buffalo, N.Y., fell amid volatility in the regional banking sector following the failure of Silicon Valley Bank in March 2023. Shares of Liberty Broadband, a cable and satellite TV provider, fell after the company reported consecutive quarters of lower-than-expected earnings and revenue.
Leading individual contributors to relative performance included the Fund’s overweight positions in Hubbell Inc., Lincoln Electric Holdings Inc. and First Citizens BancShares Inc.
Shares of Hubbell, an electrical components and equipment manufacturer, rose after the company reported better-than-expected earnings and revenue for the first quarter of 2023. Shares of Lincoln Electric Holdings, an industrials machinery manufacturer, rose amid consecutive quarters of better-than-expected earnings and revenue during the period. Shares of First Citizens BancShares, a diversified banking company, rose after the company reported better-than-expected earnings and revenue for the first quarter of 2023, following its acquisition of failed Silicon Valley Bank.
HOW WAS THE FUND POSITIONED?
The Fund’s portfolio managers utilized a bottom-up approach to stock selection and sought to identify durable franchises possessing the ability to generate, in their view, sustainable
levels of free cash flow.
TOP TEN HOLDINGS OF THE
PORTFOLIO AS OF June 30, 2023 | PERCENT OF
TOTAL
INVESTMENTS |
| Ameriprise Financial, Inc. | |
| | |
| | |
| | |
| | |
| | |
| Martin Marietta Materials, Inc. | |
| | |
| | |
| | |
PORTFOLIO COMPOSITION BY SECTOR
AS OF June 30, 2023 | PERCENT OF
TOTAL
INVESTMENTS |
| |
| |
| |
| |
| |
| |
| |
| |
| |
| |
| |
| |
*
The return shown is based on net asset values calculated for shareholder transactions and may differ from the return shown in
| J.P. Morgan Mid Cap/Multi-Cap Funds | |
the financial highlights, which reflects adjustments made to the net asset values in accordance with accounting principles generally accepted in the United States of America.
**
The adviser seeks to achieve the Fund’s objective. There can be no guarantee it will be achieved.
| J.P. Morgan Mid Cap/Multi-Cap Funds | |
JPMorgan Mid Cap Value Fund
FUND COMMENTARY
TWELVE MONTHS ENDED June 30, 2023 (Unaudited) (continued)
AVERAGE ANNUAL TOTAL RETURNS AS OF June 30, 2023
|
| Sales Charge for Class A Shares is 5.25%. |
| Assumes a 1% CDSC (contingent deferred sales charge) for the one year period and 0% CDSC thereafter. |
TEN YEAR FUND PERFORMANCE (6/30/13 TO 6/30/23)
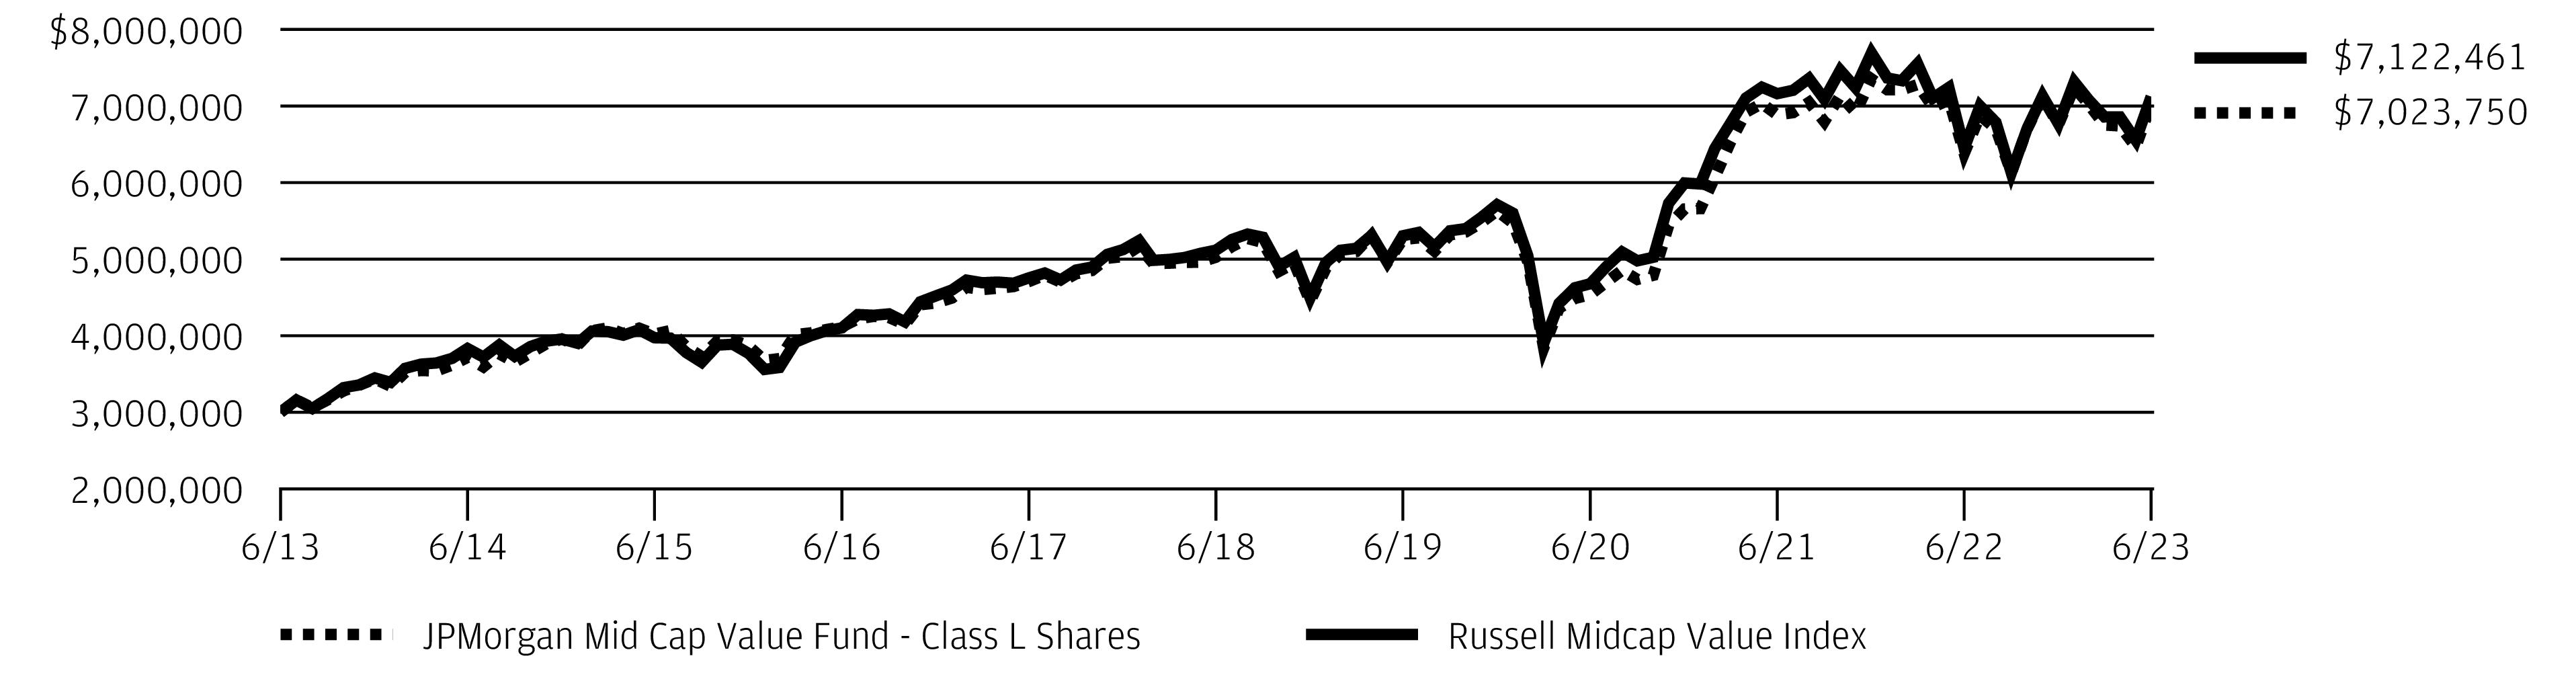
The performance quoted is past performance and is not a guarantee of future results. Mutual funds are subject to certain market risks. Investment returns and principal value of an investment will fluctuate so that an investor’s shares, when redeemed, may be worth more or less than their original cost. Current performance may be higher or lower than the performance data shown. For up-to-date month-end performance information please call 1-800-480-4111.
Returns for Class R3 Shares prior to their inception dates are based on the performance of Class A Shares. The actual returns of Class R3 Shares would have been lower than those shown because Class R3 Shares have higher expenses than Class A Shares.
Returns for the Class R4 Shares prior to their inception date are based on the performance of Class I Shares. The actual returns of Class R4 Shares would have been lower because Class R4 Shares have higher expenses than Class I Shares.
Returns for the Class R5 and R6 Shares prior to their inception date are based on the performance of Class L Shares. The actual returns of Class R5 Shares would have been lower than those shown because Class R5 Shares have higher expenses than Class L Shares. The actual returns for Class R6 Shares would have been different than those shown because Class R6 Shares have different expenses to Class L Shares.
The graph illustrates comparative performance for $3,000,000 invested in Class L Shares of the JPMorgan Mid Cap Value Fund and the Russell Midcap
Value Index from June 30, 2013 to June 30, 2023. The performance of the Fund assumes reinvestment of all dividends and capital gain distributions, if any, and does not include a sales charge. The performance of the Russell Mid-cap Value Index does not reflect the deduction of expenses or a sales charge associated with a mutual fund and has been adjusted to reflect reinvestment of all dividends and capital gain distributions of the securities included in the benchmark, if applicable. The Russell Midcap Value Index is an unmanaged index which measures the performance of those Russell Midcap companies with lower price-to-book ratios and lower forecasted growth values. Investors cannot invest directly in an index.
Class L Shares have a $3,000,000 minimum initial investment.
Fund performance may reflect the waiver of the Fund’s fees and reimbursement of expenses for certain periods. Without these waivers and reimbursements, performance would have been lower. Also, performance shown in this section does not reflect the deduction of taxes that a shareholder would pay on Fund distributions or on gains resulting from redemptions of Fund shares.
Because Class C Shares automatically convert to Class A Shares after 8 years, the 10 year average annual total return shown above for Class C reflects Class A performance for the period after conversion.
The returns shown are based on net asset values calculated for shareholder transactions and may differ from the returns shown in the financial highlights, which reflect adjustments made to the net asset values in accordance with accounting principles generally accepted in the United States of America.
| J.P. Morgan Mid Cap/Multi-Cap Funds | |
JPMorgan Value Advantage Fund
FUND COMMENTARY
TWELVE MONTHS ENDED June 30, 2023 (Unaudited)
| |
| |
| |
Net Assets as of 6/30/2023 (In Thousands) | |
INVESTMENT OBJECTIVE**
The JPMorgan Value Advantage Fund (the “Fund”) seeks to provide long-term total return from a combination of income and capital gains.
WHAT WERE THE MAIN DRIVERS OF THE FUND’S PERFORMANCE?
The Fund’s Class L Shares underperformed the Russell 3000 Value Index (the “Benchmark”) for the twelve months ended June 30, 2023.
The Fund’s security selection in the financials and industrials sectors was a leading detractor from performance relative to the Benchmark, while the Fund’s security selection in the health care and utilities sectors was a leading contributor to relative performance.
Leading individual detractors from relative performance included the Fund’s overweight positions in M&T Bank Corp. and Newell Brands Inc., and its out-of-Benchmark position in AbbVie Inc. Shares of M&T Bank, a regional bank based in Buffalo, N.Y., fell amid volatility in the regional banking sector following the failure of Silicon Valley Bank in March 2023. Shares of Newell Brands, a consumer housewares manufacturer, fell after the company issued weaker-than-expected sales forecasts, reduced its quarterly dividend and reported lower-than-expected earnings for the first quarter of 2023. Shares of AbbVie, a pharmaceuticals developer, fell amid increased competition from generic drug makers for the company’s immunosuppressant drug, Humira.
Leading individual contributors to relative performance included the Fund’s underweight position in Pfizer Inc., and its overweight positions in Martin Marietta Materials Inc. and Dick’s Sporting Goods Inc. Shares of Pfizer, a pharmaceuticals manufacturer not held in the fund, fell amid investor concerns that the U.S. Federal Trade Commission could seek to block the company’s planned $43 billion acquisition of Seagen Inc. and investor concerns about lower drug prices under new U.S. Medicare program rules. Shares of Martin Marietta Materials, a construction materials provider, rose amid consecutive quarters of better-than-expected earnings and revenue during the period. Shares of Dick’s Sporting Goods, a recreational products and apparel retail chain, rose amid
consecutive quarters of better-than-expected earnings and revenue during the period.
HOW WAS THE FUND POSITIONED?
The Fund’s portfolio managers utilized a bottom-up approach to stock selection and sought to identify durable franchises possessing the ability to generate, in the portfolio managers’
view, significant levels of free cash flow.
TOP TEN HOLDINGS OF THE
PORTFOLIO AS OF June 30, 2023 | PERCENT OF
TOTAL
INVESTMENTS |
| Berkshire Hathaway, Inc., Class B | |
| Capital One Financial Corp. | |
| | |
| | |
| | |
| | |
| | |
| | |
| | |
| | |
PORTFOLIO COMPOSITION BY SECTOR
AS OF June 30, 2023 | PERCENT OF
TOTAL
INVESTMENTS |
| |
| |
| |
| |
| |
| |
| |
| |
| |
| |
| |
| |
*
The return shown is based on net asset values calculated for shareholder transactions and may differ from the return shown in
| J.P. Morgan Mid Cap/Multi-Cap Funds | |
JPMorgan Value Advantage Fund
FUND COMMENTARY
TWELVE MONTHS ENDED June 30, 2023 (Unaudited) (continued)
the financial highlights, which reflects adjustments made to the net asset values in accordance with accounting principles generally accepted in the United States of America.
**
The adviser seeks to achieve the Fund’s objective. There can be no guarantee it will be achieved.
| J.P. Morgan Mid Cap/Multi-Cap Funds | |
AVERAGE ANNUAL TOTAL RETURNS AS OF June 30, 2023
|
| Sales Charge for Class A Shares is 5.25%. |
| Assumes a 1% CDSC (contingent deferred sales charge) for the one year period and 0% CDSC thereafter. |
TEN YEAR FUND PERFORMANCE (6/30/13 TO 6/30/23)
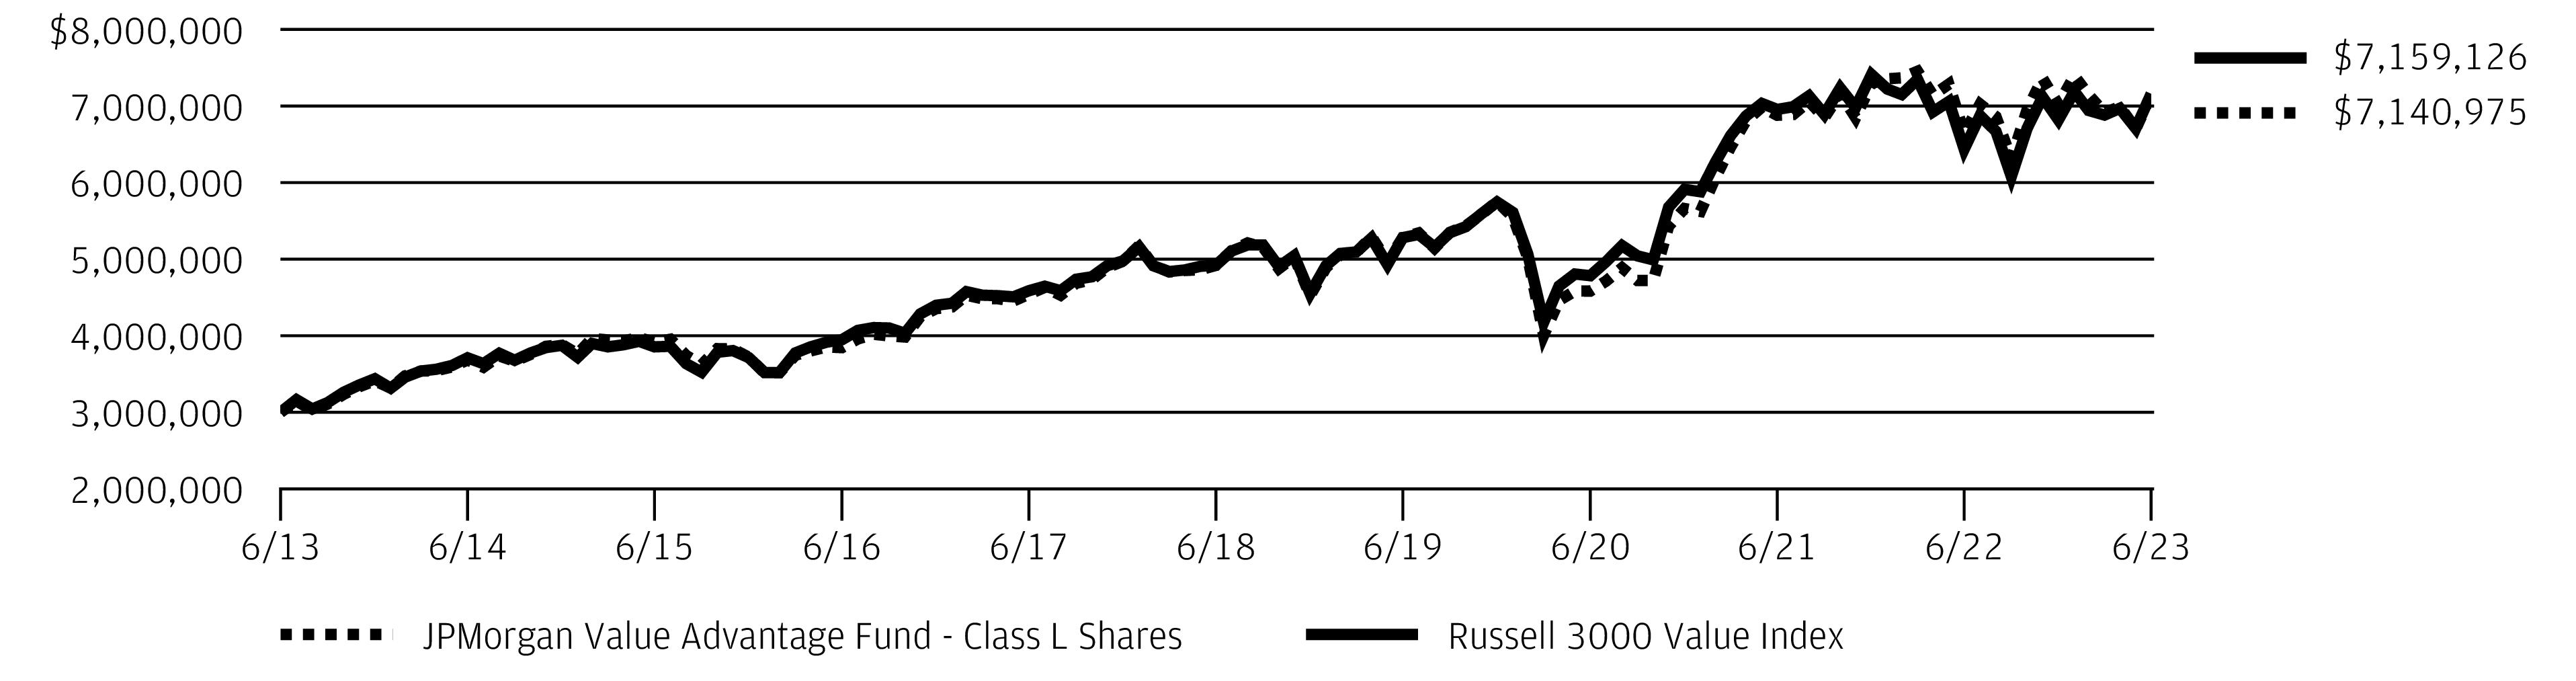
The performance quoted is past performance and is not a guarantee of future results. Mutual funds are subject to certain market risks. Investment returns and principal value of an investment will fluctuate so that an investor’s shares, when redeemed, may be worth more or less than their original cost. Current performance may be higher or lower than the performance data shown. For up-to-date month-end performance information please call 1-800-480-4111.
Returns for Class R2 and Class R3 Shares prior to their inception date are based on the performance of Class A Shares. The actual returns of Class R2 Shares would have been lower than those shown because Class R2 Shares have higher expenses than Class A Shares. Returns for Class R3 Shares would have been similar to those shown because Class R3 Shares have similar expenses to Class A Shares.
Returns for the Class R4 Shares prior to their inception date are based on the performance of Class I Shares. The actual returns of Class R4 Shares would have been similar to those shown because Class R4 Shares have similar expenses to Class I Shares.
Returns for the Class R5 and Class R6 Shares prior to their inception date are based on the performance of Class L Shares. The actual returns for Class R5 and Class R6 Shares would have been different than those shown because Class R5 and Class R6 Shares have different expenses to Class L Shares.
The graph illustrates comparative performance for $3,000,000 invested in Class L Shares of the JPMorgan Value Advantage Fund and the Russell 3000
Value Index from June 30, 2013 to June 30, 2023. The performance of the Fund assumes reinvestment of all dividends and capital gain distributions, if any, and does not include a sales charge. The performance of the Russell 3000 Value Index does not reflect the deduction of expenses or a sales charge associated with a mutual fund and has been adjusted to reflect reinvestment of all dividends and capital gain distributions of the securities included in the benchmark, if applicable. The Russell 3000 Value Index is an unmanaged index which measures the performance of those Russell 3000 companies (largest 3000 U.S. companies) with lower price-to-book ratios and lower forecasted growth values. Investors cannot invest directly in an index.
Class L Shares have a $3,000,000 minimum initial investment.
Fund performance may reflect the waiver of the Fund’s fees and reimbursement of expenses for certain periods. Without these waivers and reimbursements, performance would have been lower. Also, performance shown in this section does not reflect the deduction of taxes that a shareholder would pay on Fund distributions or on gains resulting from redemptions of Fund shares.
Because Class C Shares automatically convert to Class A Shares after 8 years, the 10 year average annual total return shown above for Class C reflects Class A performance for the period after conversion.
The returns shown are based on net asset values calculated for shareholder transactions and may differ from the returns shown in the financial highlights, which reflect adjustments made to the net asset values in accordance with accounting principles generally accepted in the United States of America.
| J.P. Morgan Mid Cap/Multi-Cap Funds | |
JPMorgan Growth Advantage Fund
SCHEDULE OF PORTFOLIO INVESTMENTS
AS OF June 30, 2023
| | |
|
|
| | |
|
Constellation Brands, Inc., Class A | | |
|
Alnylam Pharmaceuticals, Inc. * | | |
| | |
| | |
Regeneron Pharmaceuticals, Inc. * | | |
| | |
|
| | |
|
| | |
|
| | |
| | |
| | |
| | |
Commercial Services & Supplies — 1.4% |
| | |
Communications Equipment — 0.4% |
| | |
Construction & Engineering — 2.0% |
| | |
| | |
| | |
Electrical Equipment — 2.0% |
| | |
| | |
| | |
Electronic Equipment, Instruments & Components — 1.2% |
| | |
Keysight Technologies, Inc. * | | |
| | |
Energy Equipment & Services — 0.7% |
TechnipFMC plc (United Kingdom) * | | |
| | |
|
|
| | |
Take-Two Interactive Software, Inc. * | | |
| | |
Financial Services — 3.3% |
Mastercard, Inc., Class A | | |
Ground Transportation — 1.6% |
Old Dominion Freight Line, Inc. | | |
Uber Technologies, Inc. * | | |
| | |
Health Care Equipment & Supplies — 3.7% |
| | |
| | |
| | |
Intuitive Surgical, Inc. * | | |
| | |
Health Care Providers & Services — 1.4% |
| | |
Hotels, Restaurants & Leisure — 1.9% |
| | |
Hilton Worldwide Holdings, Inc. | | |
| | |
Household Durables — 0.5% |
| | |
|
| | |
Interactive Media & Services — 8.5% |
Alphabet, Inc., Class C * | | |
Meta Platforms, Inc., Class A * | | |
| | |
|
| | |
Snowflake, Inc., Class A * | | |
| | |
Life Sciences Tools & Services — 1.1% |
Mettler-Toledo International, Inc. * | | |
Thermo Fisher Scientific, Inc. | | |
| | |
SEE NOTES TO FINANCIAL STATEMENTS.
| J.P. Morgan Mid Cap/Multi-Cap Funds | |
| | |
Common Stocks — continued |
|
| | |
| | |
| | |
|
Trade Desk, Inc. (The), Class A * | | |
|
| | |
Oil, Gas & Consumable Fuels — 1.4% |
| | |
| | |
| | |
Personal Care Products — 0.5% |
Estee Lauder Cos., Inc. (The), Class A | | |
|
| | |
Royalty Pharma plc, Class A | | |
| | |
Professional Services — 0.6% |
| | |
Semiconductors & Semiconductor Equipment — 9.5% |
Advanced Micro Devices, Inc. * | | |
| | |
| | |
| | |
| | |
SolarEdge Technologies, Inc. * | | |
| | |
|
Cadence Design Systems, Inc. * | | |
Confluent, Inc., Class A * | | |
Crowdstrike Holdings, Inc., Class A * | | |
HashiCorp, Inc., Class A * | | |
| | |
| | |
| | |
| | |
|
|
| | |
Palo Alto Networks, Inc. * | | |
| | |
| | |
| | |
| | |
|
| | |
| | |
| | |
| | |
Technology Hardware, Storage & Peripherals — 8.9% |
| | |
Textiles, Apparel & Luxury Goods — 0.6% |
Lululemon Athletica, Inc. * | | |
Trading Companies & Distributors — 0.4% |
| | |
Total Common Stocks
(Cost $8,686,358) | | |
Short-Term Investments — 1.4% |
Investment Companies — 1.4% |
JPMorgan Prime Money Market Fund Class IM Shares, 5.23% (a) (b)
(Cost $228,999) | | |
Total Investments — 100.2%
(Cost $8,915,357) | | |
Liabilities in Excess of Other Assets — (0.2)% | | |
| | |
Percentages indicated are based on net assets. |
| Non-income producing security. |
| Investment in an affiliated fund, which is registered under the Investment Company Act of 1940, as amended, and is advised by J.P. Morgan Investment Management Inc. |
| The rate shown is the current yield as of June 30, 2023. |
SEE NOTES TO FINANCIAL STATEMENTS.
| J.P. Morgan Mid Cap/Multi-Cap Funds | |
JPMorgan Mid Cap Equity Fund
SCHEDULE OF PORTFOLIO INVESTMENTS
AS OF June 30, 2023
| | |
|
Aerospace & Defense — 0.4% |
| | |
|
Citizens Financial Group, Inc. | | |
| | |
First Citizens BancShares, Inc., Class A | | |
Huntington Bancshares, Inc. | | |
| | |
| | |
| | |
|
Constellation Brands, Inc., Class A | | |
| | |
| | |
|
Alnylam Pharmaceuticals, Inc. * | | |
Apellis Pharmaceuticals, Inc. * | | |
| | |
| | |
| | |
Neurocrine Biosciences, Inc. * | | |
Sarepta Therapeutics, Inc. * | | |
| | |
| | |
|
| | |
|
| | |
Fortune Brands Innovations, Inc. | | |
| | |
| | |
|
Ameriprise Financial, Inc. | | |
| | |
FactSet Research Systems, Inc. | | |
LPL Financial Holdings, Inc. | | |
| | |
| | |
| | |
Raymond James Financial, Inc. | | |
| | |
| | |
| | |
|
Capital Markets — continued |
T. Rowe Price Group, Inc. (a) | | |
Tradeweb Markets, Inc., Class A | | |
| | |
|
| | |
| | |
| | |
Commercial Services & Supplies — 1.6% |
| | |
| | |
| | |
| | |
Communications Equipment — 0.6% |
| | |
| | |
| | |
Construction & Engineering — 1.3% |
| | |
| | |
| | |
| | |
Construction Materials — 1.0% |
Martin Marietta Materials, Inc. | | |
|
Discover Financial Services | | |
Consumer Staples Distribution & Retail — 1.1% |
| | |
| | |
| | |
Containers & Packaging — 1.6% |
| | |
Packaging Corp. of America | | |
| | |
| | |
|
| | |
| | |
| | |
| | |
SEE NOTES TO FINANCIAL STATEMENTS.
| J.P. Morgan Mid Cap/Multi-Cap Funds | |
| | |
Common Stocks — continued |
Diversified Consumer Services — 0.3% |
Bright Horizons Family Solutions, Inc. * | | |
|
| | |
Electric Utilities — 2.0% |
| | |
| | |
| | |
| | |
Electrical Equipment — 3.3% |
| | |
| | |
| | |
| | |
Electronic Equipment, Instruments & Components — 4.0% |
| | |
| | |
| | |
Keysight Technologies, Inc. * | | |
Teledyne Technologies, Inc. * | | |
Zebra Technologies Corp., Class A * | | |
| | |
Energy Equipment & Services — 0.3% |
TechnipFMC plc (United Kingdom) * | | |
|
Take-Two Interactive Software, Inc. * | | |
Financial Services — 1.9% |
FleetCor Technologies, Inc. * | | |
| | |
| | |
| | |
| | |
| | |
|
| | |
|
| | |
Ground Transportation — 1.0% |
JB Hunt Transport Services, Inc. | | |
| | |
|
Ground Transportation — continued |
Old Dominion Freight Line, Inc. | | |
Uber Technologies, Inc. * | | |
| | |
Health Care Equipment & Supplies — 4.7% |
| | |
| | |
| | |
Globus Medical, Inc., Class A * | | |
| | |
IDEXX Laboratories, Inc. * | | |
| | |
| | |
Shockwave Medical, Inc. * | | |
Zimmer Biomet Holdings, Inc. | | |
| | |
Health Care Providers & Services — 4.5% |
Acadia Healthcare Co., Inc. * | | |
| | |
| | |
| | |
Laboratory Corp. of America Holdings | | |
| | |
| | |
Universal Health Services, Inc., Class B | | |
| | |
|
| | |
Hotel & Resort REITs — 0.2% |
Host Hotels & Resorts, Inc. | | |
Hotels, Restaurants & Leisure — 2.9% |
| | |
Chipotle Mexican Grill, Inc. * | | |
| | |
| | |
| | |
Hilton Worldwide Holdings, Inc. | | |
| | |
Royal Caribbean Cruises Ltd. * | | |
| | |
Household Durables — 1.1% |
| | |
SEE NOTES TO FINANCIAL STATEMENTS.
| J.P. Morgan Mid Cap/Multi-Cap Funds | |
JPMorgan Mid Cap Equity Fund
SCHEDULE OF PORTFOLIO INVESTMENTS
AS OF June 30, 2023 (continued)
| | |
Common Stocks — continued |
Household Durables — continued |
| | |
Mohawk Industries, Inc. * | | |
| | |
| | |
Household Products — 0.3% |
| | |
|
Rexford Industrial Realty, Inc. | | |
|
Arch Capital Group Ltd. * | | |
| | |
| | |
Hartford Financial Services Group, Inc. (The) | | |
| | |
| | |
RenaissanceRe Holdings Ltd. (Bermuda) | | |
| | |
| | |
Interactive Media & Services — 0.6% |
| | |
|
| | |
| | |
Snowflake, Inc., Class A * | | |
| | |
Life Sciences Tools & Services — 2.3% |
10X Genomics, Inc., Class A * | | |
Agilent Technologies, Inc. | | |
| | |
Mettler-Toledo International, Inc. * | | |
West Pharmaceutical Services, Inc. | | |
| | |
|
| | |
| | |
| | |
| | |
Lincoln Electric Holdings, Inc. | | |
| | |
| | |
| | |
|
|
| | |
| | |
| | |
|
Liberty Media Corp.-Liberty SiriusXM, Class C * | | |
Trade Desk, Inc. (The), Class A * | | |
| | |
|
| | |
|
| | |
| | |
| | |
| | |
|
Boston Properties, Inc. (a) | | |
Oil, Gas & Consumable Fuels — 2.8% |
| | |
| | |
| | |
| | |
Williams Cos., Inc. (The) | | |
| | |
Passenger Airlines — 0.3% |
| | |
|
Jazz Pharmaceuticals plc * | | |
Royalty Pharma plc, Class A | | |
| | |
Professional Services — 0.9% |
| | |
| | |
| | |
Real Estate Management & Development — 0.6% |
CBRE Group, Inc., Class A * | | |
|
American Homes 4 Rent, Class A | | |
AvalonBay Communities, Inc. | | |
Essex Property Trust, Inc. | | |
SEE NOTES TO FINANCIAL STATEMENTS.
| J.P. Morgan Mid Cap/Multi-Cap Funds | |
| | |
Common Stocks — continued |
Residential REITs — continued |
Mid-America Apartment Communities, Inc. | | |
| | |
| | |
|
Brixmor Property Group, Inc. | | |
Federal Realty Investment Trust | | |
| | |
| | |
| | |
Semiconductors & Semiconductor Equipment — 2.5% |
| | |
| | |
| | |
Microchip Technology, Inc. | | |
Monolithic Power Systems, Inc. | | |
| | |
| | |
SolarEdge Technologies, Inc. * (a) | | |
| | |
| | |
|
Cadence Design Systems, Inc. * | | |
Confluent, Inc., Class A * (a) | | |
Crowdstrike Holdings, Inc., Class A * | | |
| | |
| | |
HashiCorp, Inc., Class A * | | |
| | |
Palo Alto Networks, Inc. * (a) | | |
Procore Technologies, Inc. * | | |
| | |
| | |
Zoom Video Communications, Inc., Class A * | | |
| | |
|
| | |
| | |
| | |
|
| | |
| | |
| | |
|
Specialty Retail — continued |
| | |
Burlington Stores, Inc. * | | |
Floor & Decor Holdings, Inc., Class A * (a) | | |
| | |
| | |
| | |
Textiles, Apparel & Luxury Goods — 2.0% |
| | |
Lululemon Athletica, Inc. * | | |
| | |
| | |
| | |
Trading Companies & Distributors — 0.3% |
| | |
Total Common Stocks
(Cost $2,614,540) | | |
Short-Term Investments — 5.2% |
Investment Companies — 3.5% |
JPMorgan Prime Money Market Fund Class IM Shares, 5.23% (b) (c)
(Cost $124,087) | | |
Investment of Cash Collateral from Securities Loaned — 1.7% |
JPMorgan Securities Lending Money Market Fund Agency SL Class Shares, 5.29% (b) (c) | | |
JPMorgan U.S. Government Money Market Fund Class IM Shares, 5.05% (b) (c) | | |
Total Investment of Cash Collateral from Securities Loaned
(Cost $60,880) | | |
Total Short-Term Investments
(Cost $184,967) | | |
Total Investments — 102.8%
(Cost $2,799,507) | | |
Liabilities in Excess of Other Assets — (2.8)% | | |
| | |
Percentages indicated are based on net assets. |
| |
| Real Estate Investment Trust |
| Non-income producing security. |
SEE NOTES TO FINANCIAL STATEMENTS.
| J.P. Morgan Mid Cap/Multi-Cap Funds | |
JPMorgan Mid Cap Equity Fund
SCHEDULE OF PORTFOLIO INVESTMENTS
AS OF June 30, 2023 (continued)
| The security or a portion of this security is on loan at June 30, 2023. The total value of securities on loan at June 30, 2023 is $60,096. |
| Investment in an affiliated fund, which is registered under the Investment Company Act of 1940, as amended, and is advised by J.P. Morgan Investment Management Inc. |
| The rate shown is the current yield as of June 30, 2023. |
SEE NOTES TO FINANCIAL STATEMENTS.
| J.P. Morgan Mid Cap/Multi-Cap Funds | |
JPMorgan Mid Cap Growth Fund
SCHEDULE OF PORTFOLIO INVESTMENTS
AS OF June 30, 2023
| | |
|
Aerospace & Defense — 1.1% |
| | |
|
Constellation Brands, Inc., Class A | | |
|
Alnylam Pharmaceuticals, Inc. * | | |
Apellis Pharmaceuticals, Inc. * | | |
| | |
| | |
| | |
Neurocrine Biosciences, Inc. * | | |
Sarepta Therapeutics, Inc. * | | |
| | |
| | |
|
| | |
|
| | |
|
| | |
FactSet Research Systems, Inc. | | |
LPL Financial Holdings, Inc. | | |
| | |
| | |
Raymond James Financial, Inc. | | |
| | |
Tradeweb Markets, Inc., Class A (a) | | |
| | |
Commercial Services & Supplies — 3.9% |
| | |
| | |
| | |
| | |
Communications Equipment — 0.4% |
| | |
Construction & Engineering — 3.4% |
| | |
| | |
| | |
| | |
| | |
|
|
| | |
Diversified Consumer Services — 0.8% |
Bright Horizons Family Solutions, Inc. * | | |
Electrical Equipment — 2.3% |
| | |
| | |
| | |
Electronic Equipment, Instruments & Components — 2.9% |
| | |
Keysight Technologies, Inc. * | | |
Teledyne Technologies, Inc. * | | |
Zebra Technologies Corp., Class A * | | |
| | |
Energy Equipment & Services — 0.8% |
TechnipFMC plc (United Kingdom) * | | |
|
Take-Two Interactive Software, Inc. * | | |
Financial Services — 1.1% |
| | |
| | |
| | |
Ground Transportation — 2.4% |
JB Hunt Transport Services, Inc. | | |
Old Dominion Freight Line, Inc. | | |
Uber Technologies, Inc. * | | |
| | |
Health Care Equipment & Supplies — 9.0% |
| | |
| | |
| | |
| | |
IDEXX Laboratories, Inc. * | | |
| | |
| | |
Shockwave Medical, Inc. * | | |
| | |
Health Care Providers & Services — 2.8% |
Acadia Healthcare Co., Inc. * | | |
SEE NOTES TO FINANCIAL STATEMENTS.
| J.P. Morgan Mid Cap/Multi-Cap Funds | |
JPMorgan Mid Cap Growth Fund
SCHEDULE OF PORTFOLIO INVESTMENTS
AS OF June 30, 2023 (continued)
| | |
Common Stocks — continued |
Health Care Providers & Services — continued |
| | |
| | |
| | |
Hotels, Restaurants & Leisure — 4.8% |
| | |
Chipotle Mexican Grill, Inc. * | | |
| | |
Hilton Worldwide Holdings, Inc. | | |
| | |
Royal Caribbean Cruises Ltd. * (a) | | |
| | |
Household Durables — 1.0% |
| | |
| | |
| | |
|
| | |
| | |
| | |
|
| | |
Snowflake, Inc., Class A * | | |
| | |
Life Sciences Tools & Services — 5.7% |
10X Genomics, Inc., Class A * | | |
Agilent Technologies, Inc. | | |
| | |
Mettler-Toledo International, Inc. * | | |
West Pharmaceutical Services, Inc. | | |
| | |
|
| | |
| | |
| | |
| | |
|
Trade Desk, Inc. (The), Class A * | | |
|
| | |
| | |
|
Oil, Gas & Consumable Fuels — 2.9% |
| | |
| | |
| | |
|
Jazz Pharmaceuticals plc * | | |
Royalty Pharma plc, Class A | | |
| | |
Professional Services — 2.3% |
| | |
| | |
| | |
Semiconductors & Semiconductor Equipment — 6.0% |
| | |
| | |
| | |
Monolithic Power Systems, Inc. | | |
| | |
| | |
SolarEdge Technologies, Inc. * | | |
| | |
| | |
|
Cadence Design Systems, Inc. * | | |
Confluent, Inc., Class A * (a) | | |
Crowdstrike Holdings, Inc., Class A * (a) | | |
| | |
| | |
HashiCorp, Inc., Class A * | | |
| | |
Palo Alto Networks, Inc. * (a) | | |
Procore Technologies, Inc. * | | |
| | |
| | |
Zoom Video Communications, Inc., Class A * | | |
| | |
|
| | |
Burlington Stores, Inc. * | | |
Floor & Decor Holdings, Inc., Class A * (a) | | |
SEE NOTES TO FINANCIAL STATEMENTS.
| J.P. Morgan Mid Cap/Multi-Cap Funds | |
| | |
Common Stocks — continued |
Specialty Retail — continued |
| | |
| | |
| | |
Textiles, Apparel & Luxury Goods — 0.7% |
Lululemon Athletica, Inc. * | | |
Trading Companies & Distributors — 0.7% |
| | |
Total Common Stocks
(Cost $7,239,916) | | |
Short-Term Investments — 3.1% |
Investment Companies — 1.4% |
JPMorgan Prime Money Market Fund Class IM Shares, 5.23% (b) (c)
(Cost $128,771) | | |
Investment of Cash Collateral from Securities Loaned — 1.7% |
JPMorgan Securities Lending Money Market Fund Agency SL Class Shares, 5.29% (b) (c) | | |
JPMorgan U.S. Government Money Market Fund Class IM Shares, 5.05% (b) (c) | | |
Total Investment of Cash Collateral from Securities Loaned
(Cost $160,993) | | |
Total Short-Term Investments
(Cost $289,764) | | |
Total Investments — 101.6%
(Cost $7,529,680) | | |
Liabilities in Excess of Other Assets — (1.6)% | | |
| | |
Percentages indicated are based on net assets. |
| Non-income producing security. |
| The security or a portion of this security is on loan at June 30, 2023. The total value of securities on loan at June 30, 2023 is $158,735. |
| Investment in an affiliated fund, which is registered under the Investment Company Act of 1940, as amended, and is advised by J.P. Morgan Investment Management Inc. |
| The rate shown is the current yield as of June 30, 2023. |
SEE NOTES TO FINANCIAL STATEMENTS.
| J.P. Morgan Mid Cap/Multi-Cap Funds | |
JPMorgan Mid Cap Value Fund
SCHEDULE OF PORTFOLIO INVESTMENTS
AS OF June 30, 2023
| | |
|
|
Citizens Financial Group, Inc. | | |
| | |
First Citizens BancShares, Inc., Class A | | |
Huntington Bancshares, Inc. | | |
| | |
Regions Financial Corp. (a) | | |
| | |
|
Constellation Brands, Inc., Class A | | |
| | |
| | |
|
| | |
Fortune Brands Innovations, Inc. | | |
| | |
|
Ameriprise Financial, Inc. | | |
| | |
Raymond James Financial, Inc. | | |
| | |
T. Rowe Price Group, Inc. (a) | | |
| | |
|
| | |
| | |
| | |
Communications Equipment — 0.8% |
| | |
Construction Materials — 1.6% |
Martin Marietta Materials, Inc. | | |
|
Discover Financial Services | | |
Consumer Staples Distribution & Retail — 1.8% |
| | |
| | |
| | |
Containers & Packaging — 2.6% |
| | |
| | |
|
Containers & Packaging — continued |
Packaging Corp. of America | | |
| | |
| | |
|
| | |
| | |
| | |
|
| | |
Electric Utilities — 3.3% |
| | |
| | |
| | |
| | |
Electrical Equipment — 4.0% |
| | |
| | |
| | |
| | |
Electronic Equipment, Instruments & Components — 4.8% |
| | |
| | |
| | |
Teledyne Technologies, Inc. * | | |
Zebra Technologies Corp., Class A * | | |
| | |
|
Take-Two Interactive Software, Inc. * | | |
Financial Services — 2.4% |
FleetCor Technologies, Inc. * | | |
| | |
| | |
| | |
|
| | |
|
| | |
SEE NOTES TO FINANCIAL STATEMENTS.
| J.P. Morgan Mid Cap/Multi-Cap Funds | |
| | |
Common Stocks — continued |
Health Care Equipment & Supplies — 1.7% |
Globus Medical, Inc., Class A * | | |
Zimmer Biomet Holdings, Inc. | | |
| | |
Health Care Providers & Services — 5.6% |
| | |
| | |
Laboratory Corp. of America Holdings | | |
| | |
Universal Health Services, Inc., Class B | | |
| | |
|
| | |
Hotel & Resort REITs — 0.4% |
Host Hotels & Resorts, Inc. (a) | | |
Hotels, Restaurants & Leisure — 1.7% |
| | |
| | |
| | |
Household Durables — 1.1% |
Mohawk Industries, Inc. * | | |
| | |
| | |
Household Products — 0.5% |
| | |
|
Rexford Industrial Realty, Inc. | | |
|
Arch Capital Group Ltd. * | | |
| | |
Hartford Financial Services Group, Inc. (The) | | |
| | |
RenaissanceRe Holdings Ltd. (Bermuda) | | |
| | |
| | |
Interactive Media & Services — 1.1% |
| | |
|
| | |
| | |
|
|
| | |
| | |
| | |
Lincoln Electric Holdings, Inc. | | |
| | |
| | |
| | |
| | |
|
Liberty Media Corp.-Liberty SiriusXM, Class C * | | |
|
| | |
|
| | |
| | |
| | |
| | |
|
Boston Properties, Inc. (a) | | |
Oil, Gas & Consumable Fuels — 2.7% |
| | |
| | |
Williams Cos., Inc. (The) | | |
| | |
Passenger Airlines — 0.5% |
| | |
|
Jazz Pharmaceuticals plc * | | |
Real Estate Management & Development — 0.9% |
CBRE Group, Inc., Class A * | | |
|
American Homes 4 Rent, Class A | | |
AvalonBay Communities, Inc. | | |
Essex Property Trust, Inc. | | |
Mid-America Apartment Communities, Inc. | | |
| | |
| | |
|
Brixmor Property Group, Inc. | | |
Federal Realty Investment Trust (a) | | |
SEE NOTES TO FINANCIAL STATEMENTS.
| J.P. Morgan Mid Cap/Multi-Cap Funds | |
JPMorgan Mid Cap Value Fund
SCHEDULE OF PORTFOLIO INVESTMENTS
AS OF June 30, 2023 (continued)
| | |
Common Stocks — continued |
|
| | |
| | |
| | |
Semiconductors & Semiconductor Equipment — 0.2% |
Microchip Technology, Inc. | | |
|
| | |
| | |
| | |
|
| | |
| | |
| | |
| | |
Textiles, Apparel & Luxury Goods — 3.0% |
| | |
| | |
| | |
| | |
Total Common Stocks
(Cost $8,301,772) | | |
Short-Term Investments — 2.9% |
Investment Companies — 1.9% |
JPMorgan Prime Money Market Fund Class IM Shares, 5.23% (b) (c)
(Cost $251,453) | | |
| | |
|
Investment of Cash Collateral from Securities Loaned — 1.0% |
JPMorgan Securities Lending Money Market Fund Agency SL Class Shares, 5.29% (b) (c) | | |
JPMorgan U.S. Government Money Market Fund Class IM Shares, 5.05% (b) (c) | | |
Total Investment of Cash Collateral from Securities Loaned
(Cost $138,184) | | |
Total Short-Term Investments
(Cost $389,637) | | |
Total Investments — 100.6%
(Cost $8,691,409) | | |
Liabilities in Excess of Other Assets — (0.6)% | | |
| | |
Percentages indicated are based on net assets. |
| |
| Real Estate Investment Trust |
| Non-income producing security. |
| The security or a portion of this security is on loan at June 30, 2023. The total value of securities on loan at June 30, 2023 is $136,587. |
| Investment in an affiliated fund, which is registered under the Investment Company Act of 1940, as amended, and is advised by J.P. Morgan Investment Management Inc. |
| The rate shown is the current yield as of June 30, 2023. |
SEE NOTES TO FINANCIAL STATEMENTS.
| J.P. Morgan Mid Cap/Multi-Cap Funds | |
JPMorgan Value Advantage Fund
SCHEDULE OF PORTFOLIO INVESTMENTS
AS OF June 30, 2023
| | |
|
Aerospace & Defense — 2.3% |
| | |
| | |
Raytheon Technologies Corp. | | |
| | |
Air Freight & Logistics — 0.8% |
| | |
|
| | |
| | |
Citizens Financial Group, Inc. | | |
Cullen/Frost Bankers, Inc. | | |
First Citizens BancShares, Inc., Class A | | |
| | |
PNC Financial Services Group, Inc. (The) | | |
Regions Financial Corp. (a) | | |
| | |
| | |
|
| | |
|
| | |
Regeneron Pharmaceuticals, Inc. * | | |
Vertex Pharmaceuticals, Inc. * | | |
| | |
|
| | |
Fortune Brands Innovations, Inc. | | |
| | |
|
Charles Schwab Corp. (The) | | |
| | |
| | |
T. Rowe Price Group, Inc. | | |
| | |
|
Axalta Coating Systems Ltd. * | | |
Communications Equipment — 0.5% |
| | |
| | |
|
Construction Materials — 1.8% |
Martin Marietta Materials, Inc. | | |
| | |
| | |
|
| | |
Capital One Financial Corp. | | |
| | |
Consumer Staples Distribution & Retail — 0.9% |
Albertsons Cos., Inc., Class A | | |
| | |
| | |
Containers & Packaging — 1.7% |
Packaging Corp. of America | | |
| | |
| | |
| | |
Diversified Telecommunication Services — 0.5% |
Verizon Communications, Inc. | | |
Electric Utilities — 2.9% |
| | |
| | |
| | |
| | |
| | |
| | |
Electrical Equipment — 0.8% |
| | |
Electronic Equipment, Instruments & Components — 0.9% |
| | |
| | |
| | |
Financial Services — 4.5% |
Berkshire Hathaway, Inc., Class B * | | |
FleetCor Technologies, Inc. * | | |
| | |
| | |
SEE NOTES TO FINANCIAL STATEMENTS.
| J.P. Morgan Mid Cap/Multi-Cap Funds | |
JPMorgan Value Advantage Fund
SCHEDULE OF PORTFOLIO INVESTMENTS
AS OF June 30, 2023 (continued)
| | |
Common Stocks — continued |
|
| | |
Post Holdings, Inc. * (a) | | |
| | |
Ground Transportation — 1.0% |
| | |
| | |
| | |
Health Care Equipment & Supplies — 1.1% |
| | |
Zimmer Biomet Holdings, Inc. | | |
| | |
Health Care Providers & Services — 6.0% |
| | |
| | |
| | |
| | |
| | |
Laboratory Corp. of America Holdings | | |
| | |
| | |
|
| | |
Hotel & Resort REITs — 0.4% |
Apple Hospitality REIT, Inc. | | |
Hotels, Restaurants & Leisure — 1.4% |
| | |
| | |
| | |
Household Durables — 1.0% |
Mohawk Industries, Inc. * | | |
| | |
| | |
Household Products — 1.5% |
| | |
Procter & Gamble Co. (The) | | |
| | |
Industrial Conglomerates — 0.7% |
Honeywell International, Inc. | | |
| | |
|
|
EastGroup Properties, Inc. | | |
|
| | |
| | |
Fairfax Financial Holdings Ltd. (Canada) | | |
Hartford Financial Services Group, Inc. (The) | | |
| | |
| | |
Travelers Cos., Inc. (The) | | |
| | |
| | |
Interactive Media & Services — 2.2% |
Alphabet, Inc., Class C * | | |
| | |
Meta Platforms, Inc., Class A * | | |
| | |
|
International Business Machines Corp. | | |
|
| | |
| | |
| | |
| | |
| | |
|
Liberty Broadband Corp., Class C * | | |
Liberty Media Corp.-Liberty SiriusXM, Class C * | | |
Nexstar Media Group, Inc. | | |
| | |
|
| | |
Public Service Enterprise Group, Inc. | | |
| | |
Oil, Gas & Consumable Fuels — 7.9% |
| | |
| | |
| | |
| | |
| | |
SEE NOTES TO FINANCIAL STATEMENTS.
| J.P. Morgan Mid Cap/Multi-Cap Funds | |
| | |
Common Stocks — continued |
Oil, Gas & Consumable Fuels — continued |
| | |
Williams Cos., Inc. (The) | | |
| | |
Personal Care Products — 0.4% |
| | |
|
| | |
| | |
| | |
| | |
Professional Services — 0.3% |
| | |
Real Estate Management & Development — 1.0% |
CBRE Group, Inc., Class A * | | |
|
American Homes 4 Rent, Class A | | |
Mid-America Apartment Communities, Inc. | | |
| | |
|
Brixmor Property Group, Inc. | | |
Federal Realty Investment Trust | | |
| | |
| | |
Semiconductors & Semiconductor Equipment — 2.3% |
| | |
NXP Semiconductors NV (China) | | |
| | |
| | |
|
Lamar Advertising Co., Class A | | |
| | |
| | |
| | |
| | |
|
| | |
| | |
| | |
Dick's Sporting Goods, Inc. | | |
| | |
| | |
|
Specialty Retail — continued |
| | |
| | |
| | |
Textiles, Apparel & Luxury Goods — 1.1% |
| | |
| | |
| | |
|
Philip Morris International, Inc. | | |
Wireless Telecommunication Services — 0.4% |
| | |
Total Common Stocks
(Cost $6,170,630) | | |
Short-Term Investments — 4.5% |
Investment Companies — 3.7% |
JPMorgan Prime Money Market Fund Class IM Shares, 5.23% (b) (c)
(Cost $331,120) | | |
Investment of Cash Collateral from Securities Loaned — 0.8% |
JPMorgan Securities Lending Money Market Fund Agency SL Class Shares, 5.29% (b) (c) | | |
JPMorgan U.S. Government Money Market Fund Class IM Shares, 5.05% (b) (c) | | |
Total Investment of Cash Collateral from Securities Loaned
(Cost $76,529) | | |
Total Short-Term Investments
(Cost $407,649) | | |
Total Investments — 101.3%
(Cost $6,578,279) | | |
Liabilities in Excess of Other Assets — (1.3)% | | |
| | |
Percentages indicated are based on net assets. |
| |
| Real Estate Investment Trust |
| Non-income producing security. |
| The security or a portion of this security is on loan at June 30, 2023. The total value of securities on loan at June 30, 2023 is $75,059. |
SEE NOTES TO FINANCIAL STATEMENTS.
| J.P. Morgan Mid Cap/Multi-Cap Funds | |
JPMorgan Value Advantage Fund
SCHEDULE OF PORTFOLIO INVESTMENTS
AS OF June 30, 2023 (continued)
| Investment in an affiliated fund, which is registered under the Investment Company Act of 1940, as amended, and is advised by J.P. Morgan Investment Management Inc. |
| The rate shown is the current yield as of June 30, 2023. |
SEE NOTES TO FINANCIAL STATEMENTS.
| J.P. Morgan Mid Cap/Multi-Cap Funds | |
STATEMENTS OF ASSETS AND LIABILITIES
AS OF June 30, 2023
(Amounts in thousands, except per share amounts)
| JPMorgan
Growth
Advantage Fund | JPMorgan
Mid Cap
Equity Fund | |
| | | |
Investments in non-affiliates, at value | | | |
Investments in affiliates, at value | | | |
Investments of cash collateral received from securities loaned, at value (See Note 2.B.) | | | |
| | | |
| | | |
Investment securities sold | | | |
| | | |
Dividends from non-affiliates | | | |
Dividends from affiliates | | | |
Securities lending income (See Note 2.B.) | | | |
| | | |
| | | |
| | | |
| | | |
Investment securities purchased | | | |
Collateral received on securities loaned (See Note 2.B.) | | | |
| | | |
| | | |
| | | |
| | | |
| | | |
| | | |
Custodian and accounting fees | | | |
Trustees’ and Chief Compliance Officer’s fees | | | |
| | | |
| | | |
| | | |
(a)
Amount rounds to less than one thousand.
SEE NOTES TO FINANCIAL STATEMENTS.
| J.P. Morgan Mid Cap/Multi-Cap Funds | |
STATEMENTS OF ASSETS AND LIABILITIES
AS OF June 30, 2023 (continued)
(Amounts in thousands, except per share amounts)
| JPMorgan Growth Advantage Fund | JPMorgan Mid Cap Equity Fund | |
| | | |
| | | |
Total distributable earnings (loss) | | | |
| | | |
| | | |
| | | |
| | | |
| | | |
| | | |
| | | |
| | | |
| | | |
| | | |
| | | |
Outstanding units of beneficial interest (shares)
($0.0001 par value; unlimited number of shares authorized): | | | |
| | | |
| | | |
| | | |
| | | |
| | | |
| | | |
| | | |
| | | |
| | | |
Class A — Redemption price per share | | | |
Class C — Offering price per share (b) | | | |
Class I — Offering and redemption price per share | | | |
Class R2 — Offering and redemption price per share | | | |
Class R3 — Offering and redemption price per share | | | |
Class R4 — Offering and redemption price per share | | | |
Class R5 — Offering and redemption price per share | | | |
Class R6 — Offering and redemption price per share | | | |
Class A maximum sales charge | | | |
Class A maximum public offering price per share
[net asset value per share/(100% – maximum sales charge)] | | | |
Cost of investments in non-affiliates | | | |
Cost of investments in affiliates | | | |
Investment securities on loan, at value (See Note 2.B.) | | | |
Cost of investment of cash collateral (See Note 2.B.) | | | |
(a)
Per share amounts may not recalculate due to rounding of net assets and/or shares outstanding.
(b)
Redemption price for Class C Shares varies based upon length of time the shares are held.
SEE NOTES TO FINANCIAL STATEMENTS.
| J.P. Morgan Mid Cap/Multi-Cap Funds | |
| JPMorgan
Mid Cap
Value Fund | |
| | |
Investments in non-affiliates, at value | | |
Investments in affiliates, at value | | |
Investments of cash collateral received from securities loaned, at value (See Note 2.B.) | | |
| | |
| | |
Investment securities sold | | |
| | |
Dividends from non-affiliates | | |
Dividends from affiliates | | |
Securities lending income (See Note 2.B.) | | |
| | |
| | |
| | |
Investment securities purchased | | |
Collateral received on securities loaned (See Note 2.B.) | | |
| | |
| | |
| | |
| | |
| | |
| | |
Custodian and accounting fees | | |
Trustees’ and Chief Compliance Officer’s fees | | |
| | |
| | |
| | |
(a)
Amount rounds to less than one thousand.
SEE NOTES TO FINANCIAL STATEMENTS.
| J.P. Morgan Mid Cap/Multi-Cap Funds | |
STATEMENTS OF ASSETS AND LIABILITIES
AS OF June 30, 2023 (continued)
(Amounts in thousands, except per share amounts)
| JPMorgan Mid Cap Value Fund | |
| | |
| | |
Total distributable earnings (loss) | | |
| | |
| | |
| | |
| | |
| | |
| | |
| | |
| | |
| | |
| | |
| | |
| | |
Outstanding units of beneficial interest (shares)
($0.0001 par value; unlimited number of shares authorized): | | |
| | |
| | |
| | |
| | |
| | |
| | |
| | |
| | |
| | |
| | |
Class A — Redemption price per share | | |
Class C — Offering price per share (b) | | |
Class I — Offering and redemption price per share | | |
Class L — Offering and redemption price per share | | |
Class R2 — Offering and redemption price per share | | |
Class R3 — Offering and redemption price per share | | |
Class R4 — Offering and redemption price per share | | |
Class R5 — Offering and redemption price per share | | |
Class R6 — Offering and redemption price per share | | |
Class A maximum sales charge | | |
Class A maximum public offering price per share
[net asset value per share/(100% – maximum sales charge)] | | |
Cost of investments in non-affiliates | | |
Cost of investments in affiliates | | |
Investment securities on loan, at value (See Note 2.B.) | | |
Cost of investment of cash collateral (See Note 2.B.) | | |
(a)
Per share amounts may not recalculate due to rounding of net assets and/or shares outstanding.
(b)
Redemption price for Class C Shares varies based upon length of time the shares are held.
SEE NOTES TO FINANCIAL STATEMENTS.
| J.P. Morgan Mid Cap/Multi-Cap Funds | |
STATEMENTS OF OPERATIONS
FOR THE YEAR ENDED June 30, 2023
(Amounts in thousands)
| JPMorgan
Growth
Advantage Fund | JPMorgan
Mid Cap
Equity Fund | JPMorgan
Mid Cap
Growth Fund |
| | | |
Interest income from affiliates | | | |
Dividend income from non-affiliates | | | |
Dividend income from affiliates | | | |
Income from securities lending (net) (See Note 2.B.) | | | |
| | | |
| | | |
| | | |
| | | |
| | | |
| | | |
| | | |
| | | |
| | | |
| | | |
| | | |
| | | |
| | | |
| | | |
| | | |
| | | |
| | | |
Custodian and accounting fees | | | |
Interest expense to affiliates | | | |
| | | |
Trustees’ and Chief Compliance Officer’s fees | | | |
Printing and mailing costs | | | |
Registration and filing fees | | | |
Transfer agency fees (See Note 2.F.) | | | |
| | | |
| | | |
| | | |
Less expense reimbursements | | | |
| | | |
Net investment income (loss) | | | |
SEE NOTES TO FINANCIAL STATEMENTS.
| J.P. Morgan Mid Cap/Multi-Cap Funds | |
STATEMENTS OF OPERATIONS
FOR THE YEAR ENDED June 30, 2023 (continued)
(Amounts in thousands)
| JPMorgan Growth Advantage Fund | JPMorgan Mid Cap Equity Fund | JPMorgan Mid Cap Growth Fund |
REALIZED/UNREALIZED GAINS (LOSSES): | | | |
Net realized gain (loss) on transactions from: | | | |
Investments in non-affiliates | | | |
Investments in affiliates | | | |
Foreign currency transactions | | | |
| | | |
Change in net unrealized appreciation/depreciation on: | | | |
Investments in non-affiliates | | | |
Investments in affiliates | | | |
Foreign currency translations | | | |
Change in net unrealized appreciation/depreciation | | | |
Net realized/unrealized gains (losses) | | | |
Change in net assets resulting from operations | | | |
SEE NOTES TO FINANCIAL STATEMENTS.
| J.P. Morgan Mid Cap/Multi-Cap Funds | |
| JPMorgan
Mid Cap
Value Fund | |
| | |
Interest income from affiliates | | |
Dividend income from non-affiliates | | |
Dividend income from affiliates | | |
Income from securities lending (net) (See Note 2.B.) | | |
| | |
| | |
| | |
| | |
| | |
| | |
| | |
| | |
| | |
| | |
| | |
| | |
| | |
| | |
| | |
| | |
| | |
| | |
Custodian and accounting fees | | |
| | |
Trustees’ and Chief Compliance Officer’s fees | | |
Printing and mailing costs | | |
Registration and filing fees | | |
Transfer agency fees (See Note 2.F.) | | |
| | |
| | |
| | |
Less expense reimbursements | | |
| | |
Net investment income (loss) | | |
(a)
Amount rounds to less than one thousand.
SEE NOTES TO FINANCIAL STATEMENTS.
| J.P. Morgan Mid Cap/Multi-Cap Funds | |
STATEMENTS OF OPERATIONS
FOR THE YEAR ENDED June 30, 2023 (continued)
(Amounts in thousands)
| JPMorgan Mid Cap Value Fund | |
REALIZED/UNREALIZED GAINS (LOSSES): | | |
Net realized gain (loss) on transactions from: | | |
Investments in non-affiliates | | |
Investments in affiliates | | |
| | |
Change in net unrealized appreciation/depreciation on: | | |
Investments in non-affiliates | | |
Investments in affiliates | | |
Change in net unrealized appreciation/depreciation | | |
Net realized/unrealized gains (losses) | | |
Change in net assets resulting from operations | | |
SEE NOTES TO FINANCIAL STATEMENTS.
| J.P. Morgan Mid Cap/Multi-Cap Funds | |
STATEMENTS OF CHANGES IN NET ASSETS
FOR THE PERIODS INDICATED
(Amounts in thousands)
| JPMorgan Growth Advantage Fund | JPMorgan Mid Cap Equity Fund |
| | | | |
CHANGE IN NET ASSETS RESULTING FROM OPERATIONS: | | | | |
Net investment income (loss) | | | | |
| | | | |
Change in net unrealized appreciation/depreciation | | | | |
Change in net assets resulting from operations | | | | |
DISTRIBUTIONS TO SHAREHOLDERS: | | | | |
| | | | |
| | | | |
| | | | |
| | | | |
| | | | |
| | | | |
| | | | |
| | | | |
Total distributions to shareholders | | | | |
| | | | |
Change in net assets resulting from capital transactions | | | | |
| | | | |
| | | | |
| | | | |
| | | | |
SEE NOTES TO FINANCIAL STATEMENTS.
| J.P. Morgan Mid Cap/Multi-Cap Funds | |
STATEMENTS OF CHANGES IN NET ASSETS
FOR THE PERIODS INDICATED (continued)
(Amounts in thousands)
| JPMorgan Mid Cap Growth Fund | JPMorgan Mid Cap Value Fund |
| | | | |
CHANGE IN NET ASSETS RESULTING FROM OPERATIONS: | | | | |
Net investment income (loss) | | | | |
| | | | |
Change in net unrealized appreciation/depreciation | | | | |
Change in net assets resulting from operations | | | | |
DISTRIBUTIONS TO SHAREHOLDERS: | | | | |
| | | | |
| | | | |
| | | | |
| | | | |
| | | | |
| | | | |
| | | | |
| | | | |
| | | | |
Total distributions to shareholders | | | | |
| | | | |
Change in net assets resulting from capital transactions | | | | |
| | | | |
| | | | |
| | | | |
| | | | |
SEE NOTES TO FINANCIAL STATEMENTS.
| J.P. Morgan Mid Cap/Multi-Cap Funds | |
| JPMorgan Value Advantage Fund |
| | |
CHANGE IN NET ASSETS RESULTING FROM OPERATIONS: | | |
Net investment income (loss) | | |
| | |
Change in net unrealized appreciation/depreciation | | |
Change in net assets resulting from operations | | |
DISTRIBUTIONS TO SHAREHOLDERS: | | |
| | |
| | |
| | |
| | |
| | |
| | |
| | |
| | |
| | |
Total distributions to shareholders | | |
| | |
Change in net assets resulting from capital transactions | | |
| | |
| | |
| | |
| | |
SEE NOTES TO FINANCIAL STATEMENTS.
| J.P. Morgan Mid Cap/Multi-Cap Funds | |
STATEMENTS OF CHANGES IN NET ASSETS
FOR THE PERIODS INDICATED (continued)
(Amounts in thousands)
| JPMorgan Growth Advantage Fund | JPMorgan Mid Cap Equity Fund |
| | | | |
| | | | |
| | | | |
Proceeds from shares issued | | | | |
| | | | |
| | | | |
Change in net assets resulting from Class A capital transactions | | | | |
| | | | |
Proceeds from shares issued | | | | |
| | | | |
| | | | |
Change in net assets resulting from Class C capital transactions | | | | |
| | | | |
Proceeds from shares issued | | | | |
| | | | |
| | | | |
Change in net assets resulting from Class I capital transactions | | | | |
| | | | |
Proceeds from shares issued | | | | |
| | | | |
| | | | |
Change in net assets resulting from Class R2 capital transactions | | | | |
| | | | |
Proceeds from shares issued | | | | |
| | | | |
| | | | |
Change in net assets resulting from Class R3 capital transactions | | | | |
| | | | |
Proceeds from shares issued | | | | |
| | | | |
| | | | |
Change in net assets resulting from Class R4 capital transactions | | | | |
| | | | |
Proceeds from shares issued | | | | |
| | | | |
| | | | |
Change in net assets resulting from Class R5 capital transactions | | | | |
SEE NOTES TO FINANCIAL STATEMENTS.
| J.P. Morgan Mid Cap/Multi-Cap Funds | |
| JPMorgan Growth Advantage Fund | JPMorgan Mid Cap Equity Fund |
| | | | |
CAPITAL TRANSACTIONS: (continued) | | | | |
| | | | |
Proceeds from shares issued | | | | |
| | | | |
| | | | |
Change in net assets resulting from Class R6 capital transactions | | | | |
Total change in net assets resulting from capital transactions | | | | |
| | | | |
| | | | |
| | | | |
| | | | |
| | | | |
| | | | |
| | | | |
| | | | |
| | | | |
| | | | |
| | | | |
| | | | |
| | | | |
| | | | |
| | | | |
| | | | |
| | | | |
| | | | |
| | | | |
| | | | |
Change in Class R2 Shares | | | | |
| | | | |
| | | | |
| | | | |
| | | | |
Change in Class R3 Shares | | | | |
| | | | |
| | | | |
| | | | |
| | | | |
Change in Class R4 Shares | | | | |
(a)
Amount rounds to less than one thousand.
SEE NOTES TO FINANCIAL STATEMENTS.
| J.P. Morgan Mid Cap/Multi-Cap Funds | |
STATEMENTS OF CHANGES IN NET ASSETS
FOR THE PERIODS INDICATED (continued)
(Amounts in thousands)
| JPMorgan Growth Advantage Fund | JPMorgan Mid Cap Equity Fund |
| | | | |
SHARE TRANSACTIONS: (continued) | | | | |
| | | | |
| | | | |
| | | | |
| | | | |
Change in Class R5 Shares | | | | |
| | | | |
| | | | |
| | | | |
| | | | |
Change in Class R6 Shares | | | | |
(a)
Amount rounds to less than one thousand.
SEE NOTES TO FINANCIAL STATEMENTS.
| J.P. Morgan Mid Cap/Multi-Cap Funds | |
| JPMorgan Mid Cap Growth Fund | JPMorgan Mid Cap Value Fund |
| | | | |
| | | | |
| | | | |
Proceeds from shares issued | | | | |
| | | | |
| | | | |
Change in net assets resulting from Class A capital transactions | | | | |
| | | | |
Proceeds from shares issued | | | | |
| | | | |
| | | | |
Change in net assets resulting from Class C capital transactions | | | | |
| | | | |
Proceeds from shares issued | | | | |
| | | | |
| | | | |
Change in net assets resulting from Class I capital transactions | | | | |
| | | | |
Proceeds from shares issued | | | | |
| | | | |
| | | | |
Change in net assets resulting from Class L capital transactions | | | | |
| | | | |
Proceeds from shares issued | | | | |
| | | | |
| | | | |
Change in net assets resulting from Class R2 capital transactions | | | | |
| | | | |
Proceeds from shares issued | | | | |
| | | | |
| | | | |
Change in net assets resulting from Class R3 capital transactions | | | | |
| | | | |
Proceeds from shares issued | | | | |
| | | | |
| | | | |
Change in net assets resulting from Class R4 capital transactions | | | | |
| | | | |
Proceeds from shares issued | | | | |
| | | | |
| | | | |
Change in net assets resulting from Class R5 capital transactions | | | | |
SEE NOTES TO FINANCIAL STATEMENTS.
| J.P. Morgan Mid Cap/Multi-Cap Funds | |
STATEMENTS OF CHANGES IN NET ASSETS
FOR THE PERIODS INDICATED (continued)
(Amounts in thousands)
| JPMorgan Mid Cap Growth Fund | JPMorgan Mid Cap Value Fund |
| | | | |
CAPITAL TRANSACTIONS: (continued) | | | | |
| | | | |
Proceeds from shares issued | | | | |
| | | | |
| | | | |
Change in net assets resulting from Class R6 capital transactions | | | | |
Total change in net assets resulting from capital transactions | | | | |
| | | | |
| | | | |
| | | | |
| | | | |
| | | | |
| | | | |
| | | | |
| | | | |
| | | | |
| | | | |
| | | | |
| | | | |
| | | | |
| | | | |
| | | | |
| | | | |
| | | | |
| | | | |
| | | | |
| | | | |
| | | | |
| | | | |
| | | | |
| | | | |
| | | | |
Change in Class R2 Shares | | | | |
| | | | |
| | | | |
| | | | |
| | | | |
Change in Class R3 Shares | | | | |
SEE NOTES TO FINANCIAL STATEMENTS.
| J.P. Morgan Mid Cap/Multi-Cap Funds | |
| JPMorgan Mid Cap Growth Fund | JPMorgan Mid Cap Value Fund |
| | | | |
SHARE TRANSACTIONS: (continued) | | | | |
| | | | |
| | | | |
| | | | |
| | | | |
Change in Class R4 Shares | | | | |
| | | | |
| | | | |
| | | | |
| | | | |
Change in Class R5 Shares | | | | |
| | | | |
| | | | |
| | | | |
| | | | |
Change in Class R6 Shares | | | | |
SEE NOTES TO FINANCIAL STATEMENTS.
| J.P. Morgan Mid Cap/Multi-Cap Funds | |
STATEMENTS OF CHANGES IN NET ASSETS
FOR THE PERIODS INDICATED (continued)
(Amounts in thousands)
| JPMorgan Value Advantage Fund |
| | |
| | |
| | |
Proceeds from shares issued | | |
| | |
| | |
Change in net assets resulting from Class A capital transactions | | |
| | |
Proceeds from shares issued | | |
| | |
| | |
Change in net assets resulting from Class C capital transactions | | |
| | |
Proceeds from shares issued | | |
| | |
| | |
Change in net assets resulting from Class I capital transactions | | |
| | |
Proceeds from shares issued | | |
| | |
| | |
Change in net assets resulting from Class L capital transactions | | |
| | |
Proceeds from shares issued | | |
| | |
| | |
Change in net assets resulting from Class R2 capital transactions | | |
| | |
Proceeds from shares issued | | |
| | |
| | |
Change in net assets resulting from Class R3 capital transactions | | |
| | |
Proceeds from shares issued | | |
| | |
| | |
Change in net assets resulting from Class R4 capital transactions | | |
SEE NOTES TO FINANCIAL STATEMENTS.
| J.P. Morgan Mid Cap/Multi-Cap Funds | |
| JPMorgan Value Advantage Fund |
| | |
CAPITAL TRANSACTIONS: (continued) | | |
| | |
Proceeds from shares issued | | |
| | |
| | |
Change in net assets resulting from Class R5 capital transactions | | |
| | |
Proceeds from shares issued | | |
| | |
| | |
Change in net assets resulting from Class R6 capital transactions | | |
Total change in net assets resulting from capital transactions | | |
| | |
| | |
| | |
| | |
| | |
| | |
| | |
| | |
| | |
| | |
| | |
| | |
| | |
| | |
| | |
| | |
| | |
| | |
| | |
| | |
| | |
| | |
| | |
| | |
| | |
Change in Class R2 Shares | | |
(a)
Amount rounds to less than one thousand.
SEE NOTES TO FINANCIAL STATEMENTS.
| J.P. Morgan Mid Cap/Multi-Cap Funds | |
STATEMENTS OF CHANGES IN NET ASSETS
FOR THE PERIODS INDICATED (continued)
(Amounts in thousands)
| JPMorgan Value Advantage Fund |
| | |
SHARE TRANSACTIONS: (continued) | | |
| | |
| | |
| | |
| | |
Change in Class R3 Shares | | |
| | |
| | |
| | |
| | |
Change in Class R4 Shares | | |
| | |
| | |
| | |
| | |
Change in Class R5 Shares | | |
| | |
| | |
| | |
| | |
Change in Class R6 Shares | | |
(a)
Amount rounds to less than one thousand.
SEE NOTES TO FINANCIAL STATEMENTS.
| J.P. Morgan Mid Cap/Multi-Cap Funds | |
THIS PAGE IS INTENTIONALLY LEFT BLANK
FINANCIAL HIGHLIGHTS
FOR THE PERIODS INDICATED
| Per share operating performance |
| | | |
| Net asset
value,
beginning
of period | Net
investment
income
(loss)(a) | Net realized
and unrealized
gains
(losses) on
investments | Total from
investment
operations | | | |
JPMorgan Growth Advantage Fund | | | | | | | |
| | | | | | | |
| | | | | | | |
| | | | | | | |
| | | | | | | |
| | | | | | | |
| | | | | | | |
| | | | | | | |
| | | | | | | |
| | | | | | | |
| | | | | | | |
| | | | | | | |
| | | | | | | |
| | | | | | | |
| | | | | | | |
| | | | | | | |
| | | | | | | |
| | | | | | | |
| | | | | | | |
| | | | | | | |
| | | | | | | |
| | | | | | | |
| | | | | | | |
| | | | | | | |
| | | | | | | |
| | | | | | | |
| | | | | | | |
| | | | | | | |
| | | | | | | |
| | | | | | | |
| | | | | | | |
| | | | | | | |
| | | | | | | |
| | | | | | | |
| | | | | | | |
| | | | | | | |
| | | | | | | |
| | | | | | | |
| | | | | | | |
| | | | | | | |
| | | | | | | |
| | | | | | | |
| | | | | | | |
| | | | | | | |
| | | | | | | |
| | | | | | | |
| | | | | | | |
| | | | | | | |
| | | | | | | |
|
| Calculated based upon average shares outstanding. |
| Includes adjustments in accordance with accounting principles generally accepted in the United States of America and as such, the net asset values for financial reporting purposes and the returns based upon those net asset values may differ from the net asset values and returns for shareholder transactions. |
| Includes interest expense, if applicable, each of which is less than 0.005% unless otherwise noted. |
SEE NOTES TO FINANCIAL STATEMENTS.
| J.P. Morgan Mid Cap/Multi-Cap Funds | |
| |
| | | Ratios to average net assets |
Net asset
value,
end of
period | Total return
(excludes
sales charge)(b) | Net assets,
end of
period
(000's) | | Net
investment
income
(loss) | Expenses without
waivers and reimbursements | |
| | | | | | |
| | | | | | |
| | | | | | |
| | | | | | |
| | | | | | |
| | | | | | |
| | | | | | |
| | | | | | |
| | | | | | |
| | | | | | |
| | | | | | |
| | | | | | |
| | | | | | |
| | | | | | |
| | | | | | |
| | | | | | |
| | | | | | |
| | | | | | |
| | | | | | |
| | | | | | |
| | | | | | |
| | | | | | |
| | | | | | |
| | | | | | |
| | | | | | |
| | | | | | |
| | | | | | |
| | | | | | |
| | | | | | |
| | | | | | |
| | | | | | |
| | | | | | |
| | | | | | |
| | | | | | |
| | | | | | |
| | | | | | |
| | | | | | |
| | | | | | |
| | | | | | |
| | | | | | |
| | | | | | |
| | | | | | |
| | | | | | |
| | | | | | |
| | | | | | |
| | | | | | |
| | | | | | |
| | | | | | |
| | | | | | |
SEE NOTES TO FINANCIAL STATEMENTS.
| J.P. Morgan Mid Cap/Multi-Cap Funds | |
FINANCIAL HIGHLIGHTS
FOR THE PERIODS INDICATED
| Per share operating performance |
| | | |
| Net asset
value,
beginning
of period | Net
investment
income
(loss)(a) | Net realized
and unrealized
gains
(losses) on
investments | Total from
investment
operations | | | |
JPMorgan Mid Cap Equity Fund | | | | | | | |
| | | | | | | |
| | | | | | | |
| | | | | | | |
| | | | | | | |
| | | | | | | |
| | | | | | | |
| | | | | | | |
| | | | | | | |
| | | | | | | |
| | | | | | | |
| | | | | | | |
| | | | | | | |
| | | | | | | |
| | | | | | | |
| | | | | | | |
| | | | | | | |
| | | | | | | |
| | | | | | | |
| | | | | | | |
| | | | | | | |
| | | | | | | |
| | | | | | | |
| | | | | | | |
| | | | | | | |
| | | | | | | |
| | | | | | | |
| | | | | | | |
| | | | | | | |
| | | | | | | |
| | | | | | | |
| | | | | | | |
| | | | | | | |
| | | | | | | |
| | | | | | | |
| | | | | | | |
| | | | | | | |
|
| Calculated based upon average shares outstanding. |
| Includes adjustments in accordance with accounting principles generally accepted in the United States of America and as such, the net asset values for financial reporting purposes and the returns based upon those net asset values may differ from the net asset values and returns for shareholder transactions. |
| Includes interest expense, if applicable, each of which is less than 0.005% unless otherwise noted. |
SEE NOTES TO FINANCIAL STATEMENTS.
| J.P. Morgan Mid Cap/Multi-Cap Funds | |
| |
| | | Ratios to average net assets |
Net asset
value,
end of
period | Total return
(excludes
sales charge)(b) | Net assets,
end of
period
(000's) | | Net
investment
income
(loss) | Expenses without
waivers and reimbursements | |
| | | | | | |
| | | | | | |
| | | | | | |
| | | | | | |
| | | | | | |
| | | | | | |
| | | | | | |
| | | | | | |
| | | | | | |
| | | | | | |
| | | | | | |
| | | | | | |
| | | | | | |
| | | | | | |
| | | | | | |
| | | | | | |
| | | | | | |
| | | | | | |
| | | | | | |
| | | | | | |
| | | | | | |
| | | | | | |
| | | | | | |
| | | | | | |
| | | | | | |
| | | | | | |
| | | | | | |
| | | | | | |
| | | | | | |
| | | | | | |
| | | | | | |
| | | | | | |
| | | | | | |
| | | | | | |
| | | | | | |
| | | | | | |
| | | | | | |
SEE NOTES TO FINANCIAL STATEMENTS.
| J.P. Morgan Mid Cap/Multi-Cap Funds | |
FINANCIAL HIGHLIGHTS
FOR THE PERIODS INDICATED
| Per share operating performance |
| | | |
| Net asset
value,
beginning
of period | Net
investment
income
(loss)(a) | Net realized
and unrealized
gains
(losses) on
investments | Total from
investment
operations | | | |
JPMorgan Mid Cap Growth Fund | | | | | | | |
| | | | | | | |
| | | | | | | |
| | | | | | | |
| | | | | | | |
| | | | | | | |
| | | | | | | |
| | | | | | | |
| | | | | | | |
| | | | | | | |
| | | | | | | |
| | | | | | | |
| | | | | | | |
| | | | | | | |
| | | | | | | |
| | | | | | | |
| | | | | | | |
| | | | | | | |
| | | | | | | |
| | | | | | | |
| | | | | | | |
| | | | | | | |
| | | | | | | |
| | | | | | | |
| | | | | | | |
| | | | | | | |
| | | | | | | |
| | | | | | | |
| | | | | | | |
| | | | | | | |
| | | | | | | |
| | | | | | | |
| | | | | | | |
| | | | | | | |
| | | | | | | |
| | | | | | | |
| | | | | | | |
| | | | | | | |
| | | | | | | |
| | | | | | | |
| | | | | | | |
| | | | | | | |
| | | | | | | |
| | | | | | | |
| | | | | | | |
| | | | | | | |
| | | | | | | |
| | | | | | | |
| | | | | | | |
|
| Calculated based upon average shares outstanding. |
| Includes adjustments in accordance with accounting principles generally accepted in the United States of America and as such, the net asset values for financial reporting purposes and the returns based upon those net asset values may differ from the net asset values and returns for shareholder transactions. |
| Includes interest expense, if applicable, each of which is less than 0.005% unless otherwise noted. |
SEE NOTES TO FINANCIAL STATEMENTS.
| J.P. Morgan Mid Cap/Multi-Cap Funds | |
| |
| | | Ratios to average net assets |
Net asset
value,
end of
period | | Net assets,
end of
period
(000's) | | Net
investment
income
(loss) | Expenses without
waivers and reimbursements | |
| | | | | | |
| | | | | | |
| | | | | | |
| | | | | | |
| | | | | | |
| | | | | | |
| | | | | | |
| | | | | | |
| | | | | | |
| | | | | | |
| | | | | | |
| | | | | | |
| | | | | | |
| | | | | | |
| | | | | | |
| | | | | | |
| | | | | | |
| | | | | | |
| | | | | | |
| | | | | | |
| | | | | | |
| | | | | | |
| | | | | | |
| | | | | | |
| | | | | | |
| | | | | | |
| | | | | | |
| | | | | | |
| | | | | | |
| | | | | | |
| | | | | | |
| | | | | | |
| | | | | | |
| | | | | | |
| | | | | | |
| | | | | | |
| | | | | | |
| | | | | | |
| | | | | | |
| | | | | | |
| | | | | | |
| | | | | | |
| | | | | | |
| | | | | | |
| | | | | | |
| | | | | | |
| | | | | | |
| | | | | | |
| | | | | | |
SEE NOTES TO FINANCIAL STATEMENTS.
| J.P. Morgan Mid Cap/Multi-Cap Funds | |
FINANCIAL HIGHLIGHTS
FOR THE PERIODS INDICATED
| Per share operating performance |
| | | |
| Net asset
value,
beginning
of period | Net
investment
income
(loss)(a) | Net realized
and unrealized
gains
(losses) on
investments | Total from
investment
operations | | | |
JPMorgan Mid Cap Value Fund | | | | | | | |
| | | | | | | |
| | | | | | | |
| | | | | | | |
| | | | | | | |
| | | | | | | |
| | | | | | | |
| | | | | | | |
| | | | | | | |
| | | | | | | |
| | | | | | | |
| | | | | | | |
| | | | | | | |
| | | | | | | |
| | | | | | | |
| | | | | | | |
| | | | | | | |
| | | | | | | |
| | | | | | | |
| | | | | | | |
| | | | | | | |
| | | | | | | |
| | | | | | | |
| | | | | | | |
| | | | | | | |
| | | | | | | |
| | | | | | | |
| | | | | | | |
| | | | | | | |
| | | | | | | |
| | | | | | | |
| | | | | | | |
| | | | | | | |
| | | | | | | |
| | | | | | | |
| | | | | | | |
| | | | | | | |
| | | | | | | |
| | | | | | | |
| | | | | | | |
| | | | | | | |
| | | | | | | |
| | | | | | | |
SEE NOTES TO FINANCIAL STATEMENTS.
| J.P. Morgan Mid Cap/Multi-Cap Funds | |
| |
| | | Ratios to average net assets |
Net asset
value,
end of
period | Total return
(excludes
sales charge)(b) | Net assets,
end of
period
(000's) | | Net
investment
income
(loss) | Expenses without
waivers and reimbursements | |
| | | | | | |
| | | | | | |
| | | | | | |
| | | | | | |
| | | | | | |
| | | | | | |
| | | | | | |
| | | | | | |
| | | | | | |
| | | | | | |
| | | | | | |
| | | | | | |
| | | | | | |
| | | | | | |
| | | | | | |
| | | | | | |
| | | | | | |
| | | | | | |
| | | | | | |
| | | | | | |
| | | | | | |
| | | | | | |
| | | | | | |
| | | | | | |
| | | | | | |
| | | | | | |
| | | | | | |
| | | | | | |
| | | | | | |
| | | | | | |
| | | | | | |
| | | | | | |
| | | | | | |
| | | | | | |
| | | | | | |
| | | | | | |
| | | | | | |
| | | | | | |
| | | | | | |
| | | | | | |
| | | | | | |
| | | | | | |
| | | | | | |
SEE NOTES TO FINANCIAL STATEMENTS.
| J.P. Morgan Mid Cap/Multi-Cap Funds | |
FINANCIAL HIGHLIGHTS
FOR THE PERIODS INDICATED (continued)
| Per share operating performance |
| | | |
| Net asset
value,
beginning
of period | Net
investment
income
(loss)(a) | Net realized
and unrealized
gains
(losses) on
investments | Total from
investment
operations | | | |
JPMorgan Mid Cap Value Fund (continued) | | | | | | | |
| | | | | | | |
| | | | | | | |
| | | | | | | |
| | | | | | | |
| | | | | | | |
| | | | | | | |
| | | | | | | |
| | | | | | | |
| | | | | | | |
| | | | | | | |
| | | | | | | |
| | | | | | | |
|
| Calculated based upon average shares outstanding. |
| Includes adjustments in accordance with accounting principles generally accepted in the United States of America and as such, the net asset values for financial reporting purposes and the returns based upon those net asset values may differ from the net asset values and returns for shareholder transactions. |
| Includes interest expense, if applicable, each of which is less than 0.005% unless otherwise noted. |
SEE NOTES TO FINANCIAL STATEMENTS.
| J.P. Morgan Mid Cap/Multi-Cap Funds | |
| |
| | | Ratios to average net assets |
Net asset
value,
end of
period | Total return
(excludes
sales charge)(b) | Net assets,
end of
period
(000's) | | Net
investment
income
(loss) | Expenses without
waivers and reimbursements | |
|
| | | | | | |
| | | | | | |
| | | | | | |
| | | | | | |
| | | | | | |
| | | | | | |
| | | | | | |
| | | | | | |
| | | | | | |
| | | | | | |
| | | | | | |
| | | | | | |
SEE NOTES TO FINANCIAL STATEMENTS.
| J.P. Morgan Mid Cap/Multi-Cap Funds | |
FINANCIAL HIGHLIGHTS
FOR THE PERIODS INDICATED
| Per share operating performance |
| | | |
| Net asset
value,
beginning
of period | Net
investment
income
(loss)(a) | Net realized
and unrealized
gains
(losses) on
investments | Total from
investment
operations | | | |
JPMorgan Value Advantage Fund | | | | | | | |
| | | | | | | |
| | | | | | | |
| | | | | | | |
| | | | | | | |
| | | | | | | |
| | | | | | | |
| | | | | | | |
| | | | | | | |
| | | | | | | |
| | | | | | | |
| | | | | | | |
| | | | | | | |
| | | | | | | |
| | | | | | | |
| | | | | | | |
| | | | | | | |
| | | | | | | |
| | | | | | | |
| | | | | | | |
| | | | | | | |
| | | | | | | |
| | | | | | | |
| | | | | | | |
| | | | | | | |
| | | | | | | |
| | | | | | | |
| | | | | | | |
| | | | | | | |
| | | | | | | |
| | | | | | | |
| | | | | | | |
| | | | | | | |
| | | | | | | |
| | | | | | | |
| | | | | | | |
| | | | | | | |
| | | | | | | |
| | | | | | | |
| | | | | | | |
| | | | | | | |
| | | | | | | |
| | | | | | | |
SEE NOTES TO FINANCIAL STATEMENTS.
| J.P. Morgan Mid Cap/Multi-Cap Funds | |
| |
| | | Ratios to average net assets |
Net asset
value,
end of
period | Total return
(excludes
sales charge)(b) | Net assets,
end of
period
(000's) | | Net
investment
income
(loss) | Expenses without
waivers and reimbursements | |
| | | | | | |
| | | | | | |
| | | | | | |
| | | | | | |
| | | | | | |
| | | | | | |
| | | | | | |
| | | | | | |
| | | | | | |
| | | | | | |
| | | | | | |
| | | | | | |
| | | | | | |
| | | | | | |
| | | | | | |
| | | | | | |
| | | | | | |
| | | | | | |
| | | | | | |
| | | | | | |
| | | | | | |
| | | | | | |
| | | | | | |
| | | | | | |
| | | | | | |
| | | | | | |
| | | | | | |
| | | | | | |
| | | | | | |
| | | | | | |
| | | | | | |
| | | | | | |
| | | | | | |
| | | | | | |
| | | | | | |
| | | | | | |
| | | | | | |
| | | | | | |
| | | | | | |
| | | | | | |
| | | | | | |
| | | | | | |
| | | | | | |
SEE NOTES TO FINANCIAL STATEMENTS.
| J.P. Morgan Mid Cap/Multi-Cap Funds | |
FINANCIAL HIGHLIGHTS
FOR THE PERIODS INDICATED (continued)
| Per share operating performance |
| | | |
| Net asset
value,
beginning
of period | Net
investment
income
(loss)(a) | Net realized
and unrealized
gains
(losses) on
investments | Total from
investment
operations | | | |
JPMorgan Value Advantage Fund (continued) | | | | | | | |
| | | | | | | |
| | | | | | | |
| | | | | | | |
| | | | | | | |
| | | | | | | |
| | | | | | | |
| | | | | | | |
| | | | | | | |
| | | | | | | |
| | | | | | | |
| | | | | | | |
| | | | | | | |
|
| Calculated based upon average shares outstanding. |
| Includes adjustments in accordance with accounting principles generally accepted in the United States of America and as such, the net asset values for financial reporting purposes and the returns based upon those net asset values may differ from the net asset values and returns for shareholder transactions. |
| Includes interest expense, if applicable, each of which is less than 0.005% unless otherwise noted. |
SEE NOTES TO FINANCIAL STATEMENTS.
| J.P. Morgan Mid Cap/Multi-Cap Funds | |
| |
| | | Ratios to average net assets |
Net asset
value,
end of
period | Total return
(excludes
sales charge)(b) | Net assets,
end of
period
(000's) | | Net
investment
income
(loss) | Expenses without
waivers and reimbursements | |
|
| | | | | | |
| | | | | | |
| | | | | | |
| | | | | | |
| | | | | | |
| | | | | | |
| | | | | | |
| | | | | | |
| | | | | | |
| | | | | | |
| | | | | | |
| | | | | | |
SEE NOTES TO FINANCIAL STATEMENTS.
| J.P. Morgan Mid Cap/Multi-Cap Funds | |
NOTES TO FINANCIAL STATEMENTS
AS OF June 30, 2023
(Dollar values in thousands)
1. Organization
JPMorgan Trust I (“JPM I") and JPMorgan Trust II (“JPM II") (collectively, the “Trusts”) were formed on November 12, 2004, as Delaware statutory trusts, pursuant to Declarations of Trust dated November 5, 2004 and are registered under the Investment Company Act of 1940, as amended (the “1940 Act”), as open-end management investment companies.
J.P. Morgan Mutual Fund Investment Trust (“JPMMFIT”) was organized as a Massachusetts business trust on September 23, 1997, as an open-end management investment company.
J.P. Morgan Fleming Mutual Fund Group, Inc. (“JPMFMFG,” and with JPM I, JPM II and JPMMFIT, collectively, the “Trusts”) was organized as a Maryland corporation on August 19, 1997, as an open-end management investment company.
The following are 5 separate funds of the Trusts (each, a "Fund" and collectively, the "Funds") covered by this report:
| | | Diversification Classification |
JPMorgan Growth Advantage Fund | Class A, Class C, Class I, Class R2, Class R3, Class R4, Class R5 and Class R6 | | |
JPMorgan Mid Cap Equity Fund | Class A, Class C, Class I, Class R2, Class R5 and Class R6 | | |
JPMorgan Mid Cap Growth Fund | Class A, Class C, Class I, Class R2, Class R3, Class R4, Class R5 and Class R6 | | |
JPMorgan Mid Cap Value Fund | Class A, Class C, Class I, Class L, Class R2, Class R3, Class R4, Class R5 and Class R6 | | |
JPMorgan Value Advantage Fund | Class A, Class C, Class I, Class L, Class R2, Class R3, Class R4, Class R5 and Class R6 | | |
The investment objective of JPMorgan Growth Advantage Fund (“Growth Advantage Fund”) and JPMorgan Mid Cap Equity Fund (“Mid Cap Equity Fund”) is to seek to provide long-term capital growth.
The investment objective of JPMorgan Mid Cap Growth Fund (“Mid Cap Growth Fund”) is to seek growth of capital.
The investment objective of JPMorgan Mid Cap Value Fund (“Mid Cap Value Fund”) is to seek growth from capital appreciation.
The investment objective of JPMorgan Value Advantage Fund (“Value Advantage Fund”) is to seek to provide long-term total return from a combination of income and capital gains.
Class L Shares of Mid Cap Value Fund and Value Advantage Fund are publicly offered on a limited basis. Investors are not eligible to purchase Class L Shares of the Funds unless they meet certain requirements as described in the Funds’ prospectus.
Class A Shares generally provide for a front-end sales charge while Class C Shares provide for a contingent deferred sales charge ("CDSC"). No sales charges are assessed with respect to Class I, Class L, Class R2, Class R3, Class R4, Class R5 and Class R6 Shares. Certain Class A Shares, for which front-end sales charges have been waived, may be subject to a CDSC as described in the Funds' prospectus. Class C Shares automatically convert to Class A Shares after eight years. All classes of shares have equal rights as to earnings, assets and voting privileges, except that each class may bear different transfer agency, distribution and service fees and each class has exclusive voting rights with respect to its distribution plan and shareholder servicing agreements.
J.P. Morgan Investment Management Inc. (“JPMIM”), an indirect, wholly-owned subsidiary of JPMorgan Chase & Co. (“JPMorgan”), acts as adviser (the “Adviser”) and administrator (the “Administrator”) to the Funds.
2. Significant Accounting Policies
The following is a summary of significant accounting policies followed by the Funds in the preparation of their financial statements. The Funds are investment companies and, accordingly, follow the investment company accounting and reporting guidance of the Financial Accounting Standards Board (“FASB”) Accounting Standards Codification Topic 946 — Investment Companies, which is part of U.S. generally accepted accounting principles (“GAAP”). The preparation of financial statements in conformity with GAAP requires management to make estimates and assumptions that affect (i) the reported amounts of assets and liabilities, (ii) disclosure of contingent assets and liabilities at the date of the financial statements, and (iii) the reported amounts of increases and decreases in net assets from operations during the reporting period. Actual results could differ from those estimates.
| J.P. Morgan Mid Cap/Multi-Cap Funds | |
A. Valuation of Investments — Investments are valued in accordance with GAAP and the Funds' valuation policies set forth by, and under the supervision and responsibility of, the Boards of Trustees of the Trusts (the "Boards"), which established the following approach to valuation, as described more fully below: (i) investments for which market quotations are readily available shall be valued at their market value and (ii) all other investments for which market quotations are not readily available shall be valued at their fair value as determined in good faith by the Boards.
Under Section 2(a)(41) of the 1940 Act, the Boards are required to determine fair value for securities that do not have readily available market quotations. Under SEC Rule 2a-5 (Good Faith Determinations of Fair Value), the Boards may designate the performance of these fair valuation determinations to a valuation designee. The Boards have designated the Adviser as the “Valuation Designee” to perform fair valuation determinations for the Funds on behalf of the Boards subject to appropriate oversight by the Boards. The Adviser, as Valuation Designee, leverages the J.P. Morgan Asset Management Americas Valuation Committee (“AVC”) to help oversee and carry out the policies for the valuation of investments held in the Funds. The Adviser, as Valuation Designee, remains responsible for the valuation determinations.
This oversight by the AVC includes monitoring the appropriateness of fair values based on results of ongoing valuation oversight including, but not limited to, consideration of macro or security specific events, market events, and pricing vendor and broker due diligence. The Administrator is responsible for discussing and assessing the potential impacts to the fair values on an ongoing basis, and, at least on a quarterly basis, with the AVC and the Boards.
Equities and other exchange-traded instruments are valued at the last sale price or official market closing price on the primary exchange on which the instrument is traded before the net asset values (“NAV”) of the Funds are calculated on a valuation date.
Investments in open-end investment companies (“Underlying Funds”) are valued at each Underlying Fund’s NAV per share as of the report date.
Valuations reflected in this report are as of the report date. As a result, changes in valuation due to market events and/or issuer-related events after the report date and prior to issuance of the report are not reflected herein.
The various inputs that are used in determining the valuation of the Funds' investments are summarized into the three broad levels listed below.
•
Level 1 — Unadjusted inputs using quoted prices in active markets for identical investments.
•
Level 2 — Other significant observable inputs including, but not limited to, quoted prices for similar investments, inputs other than quoted prices that are observable for investments (such as interest rates, prepayment speeds, credit risk, etc.) or other market corroborated inputs.
•
Level 3 — Significant inputs based on the best information available in the circumstances, to the extent observable inputs are not available (including the Funds' assumptions in determining the fair value of investments).
A financial instrument’s level within the fair value hierarchy is based on the lowest level of any input, both individually and in the aggregate, that is significant to the fair value measurement. The inputs or methodology used for valuing instruments are not necessarily an indication of the risk associated with investing in those instruments.
The following tables represent each valuation input as presented on the Schedules of Portfolio Investments ("SOIs"):
| | | | |
| | Level 2
Other significant
observable inputs | Level 3
Significant
unobservable inputs | |
Total Investments in Securities (a) | | | | |
|
| Please refer to the SOI for specifics of portfolio holdings. |
| | | | |
| | Level 2
Other significant
observable inputs | Level 3
Significant
unobservable inputs | |
Total Investments in Securities (a) | | | | |
|
| Please refer to the SOI for specifics of portfolio holdings. |
| J.P. Morgan Mid Cap/Multi-Cap Funds | |
NOTES TO FINANCIAL STATEMENTS
AS OF June 30, 2023 (continued)
(Dollar values in thousands)
| | | | |
| | Level 2
Other significant
observable inputs | Level 3
Significant
unobservable inputs | |
Total Investments in Securities (a) | | | | |
|
| Please refer to the SOI for specifics of portfolio holdings. |
| | | | |
| | Level 2
Other significant
observable inputs | Level 3
Significant
unobservable inputs | |
Total Investments in Securities (a) | | | | |
|
| Please refer to the SOI for specifics of portfolio holdings. |
| | | | |
| | Level 2
Other significant
observable inputs | Level 3
Significant
unobservable inputs | |
Total Investments in Securities (a) | | | | |
|
| Please refer to the SOI for specifics of portfolio holdings. |
B. Securities Lending — The Funds are authorized to engage in securities lending in order to generate additional income. The Funds are able to lend to approved borrowers. Citibank N.A. (“Citibank”) serves as lending agent for the Funds, pursuant to a Securities Lending Agency Agreement (the “Securities Lending Agency Agreement”). Securities loaned are collateralized by cash equal to at least 100% of the market value plus accrued interest on the securities lent, which is invested in the Class IM Shares of the JPMorgan U.S. Government Money Market Fund and the Agency SL Class Shares of the JPMorgan Securities Lending Money Market Fund. The Funds retain the interest earned on cash collateral investments but are required to pay the borrower a rebate for the use of the cash collateral. In cases where the lent security is of high value to borrowers, there may be a negative rebate (i.e., a net payment from the borrower to the Funds). Upon termination of a loan, the Funds are required to return to the borrower an amount equal to the cash collateral, plus any rebate owed to the borrowers. The remaining maturities of the securities lending transactions are considered overnight and continuous. Loans are subject to termination by the Funds or the borrower at any time.
The net income earned on the securities lending (after payment of rebates and Citibank’s fee) is included on the Statements of Operations as Income from securities lending (net). The Funds also receive payments from the borrower during the period of the loan, equivalent to dividends and interest earned on the securities loaned, which are recorded as Dividend or Interest income, respectively, on the Statements of Operations.
Under the Securities Lending Agency Agreement, Citibank marks to market the loaned securities on a daily basis. In the event the cash received from the borrower is less than 102% of the value of the loaned securities (105% for loans of non-U.S. securities), Citibank requests additional cash from the borrower so as to maintain a collateralization level of at least 102% of the value of the loaned securities plus accrued interest (105% for loans of non-U.S. securities), subject to certain de minimis amounts.
The value of securities out on loan is recorded as an asset on the Statements of Assets and Liabilities. The value of the cash collateral received is recorded as a liability on the Statements of Assets and Liabilities and details of collateral investments are disclosed on the SOIs.
The Funds bear the risk of loss associated with the collateral investments and are not entitled to additional collateral from the borrower to cover any such losses. To the extent that the value of the collateral investments declines below the amount owed to a borrower, the Funds may incur losses that exceed the amount they earned on lending the security. Upon termination of a loan, the Funds may use leverage (borrow money) to repay the borrower for cash collateral posted if the Adviser does not believe that it is prudent to sell the collateral investments to fund the payment of this liability. Securities lending activity is subject to master netting arrangements.
| J.P. Morgan Mid Cap/Multi-Cap Funds | |
The following table presents for each lending Fund, the value of the securities on loan with Citibank, net of amounts available for offset under the master netting arrangements and any related collateral received or posted by the Funds as of June 30, 2023.
| Investment Securities
on Loan, at value,
Presented on the
Statements of Assets
and Liabilities | Cash Collateral
Posted by Borrower* | Net Amount Due
to Counterparty
(not less than zero) |
| | | |
| | | |
| | | |
| | | |
|
| Collateral posted reflects the value of securities on loan and does not include any additional amounts received from the borrower. |
Securities lending also involves counterparty risks, including the risk that the loaned securities may not be returned in a timely manner or at all. Subject to certain conditions, Citibank has agreed to indemnify the Funds from losses resulting from a borrower’s failure to return a loaned security.
JPMIM voluntarily waived investment advisory fees charged to the Funds to reduce the impact of the cash collateral investment in the JPMorgan U.S. Government Money Market Fund from 0.13% to 0.06%. For the year ended June 30, 2023, JPMIM waived fees associated with the Funds' investment in the JPMorgan U.S. Government Money Market Fund as follows:
The above waiver is included in the determination of earnings on cash collateral investment and in the calculation of Citibank’s compensation and is included on the Statements of Operations as Income from securities lending (net).
Growth Advantage Fund did not have any securities out on loan at June 30, 2023.
C. Investment Transactions with Affiliates — The Funds invested in Underlying Funds advised by the Adviser. An issuer which is under common control with a Fund may be considered an affiliate. For the purposes of the financial statements, the Funds assume the issuers listed in the tables below to be affiliated issuers. The Underlying Funds’ distributions may be reinvested into such Underlying Funds. Reinvestment amounts are included in the purchases at cost amounts in the tables below.
|
For the year ended June 30, 2023 |
| | | | | Change in
Unrealized
Appreciation/
(Depreciation) | | | | Capital Gain
Distributions |
JPMorgan Prime Money Market Fund Class IM Shares, 5.23% (a) (b) | | | | | | | | | |
JPMorgan Securities Lending Money Market Fund Agency SL Class Shares, 5.29% (a) (b) | | | | | | | | | |
JPMorgan U.S. Government Money Market Fund Class IM Shares, 5.05% (a) (b) | | | | | | | | | |
| | | | | | | | | |
|
| Investment in an affiliated fund, which is registered under the Investment Company Act of 1940, as amended, and is advised by J.P. Morgan Investment Management Inc. |
| The rate shown is the current yield as of June 30, 2023. |
| Amount rounds to less than one thousand. |
| Amount is included on the Statements of Operations as Income from securities lending (net) (after payments of rebates and Citibank’s fee). |
| J.P. Morgan Mid Cap/Multi-Cap Funds | |
NOTES TO FINANCIAL STATEMENTS
AS OF June 30, 2023 (continued)
(Dollar values in thousands)
|
For the year ended June 30, 2023 |
| | | | | Change in
Unrealized
Appreciation/
(Depreciation) | | | | Capital Gain
Distributions |
JPMorgan Prime Money Market Fund Class IM Shares, 5.23% (a) (b) | | | | | | | | | |
JPMorgan Securities Lending Money Market Fund Agency SL Class Shares, 5.29% (a) (b) | | | | | | | | | |
JPMorgan U.S. Government Money Market Fund Class IM Shares, 5.05% (a) (b) | | | | | | | | | |
| | | | | | | | | |
|
| Investment in an affiliated fund, which is registered under the Investment Company Act of 1940, as amended, and is advised by J.P. Morgan Investment Management Inc. |
| The rate shown is the current yield as of June 30, 2023. |
| Amount rounds to less than one thousand. |
| Amount is included on the Statements of Operations as Income from securities lending (net) (after payments of rebates and Citibank’s fee). |
|
For the year ended June 30, 2023 |
| | | | | Change in
Unrealized
Appreciation/
(Depreciation) | | | | Capital Gain
Distributions |
JPMorgan Prime Money Market Fund Class IM Shares, 5.23% (a) (b) | | | | | | | | | |
JPMorgan Securities Lending Money Market Fund Agency SL Class Shares, 5.29% (a) (b) | | | | | | | | | |
JPMorgan U.S. Government Money Market Fund Class IM Shares, 5.05% (a) (b) | | | | | | | | | |
| | | | | | | | | |
|
| Investment in an affiliated fund, which is registered under the Investment Company Act of 1940, as amended, and is advised by J.P. Morgan Investment Management Inc. |
| The rate shown is the current yield as of June 30, 2023. |
| Amount is included on the Statements of Operations as Income from securities lending (net) (after payments of rebates and Citibank’s fee). |
|
For the year ended June 30, 2023 |
| | | | | Change in
Unrealized
Appreciation/
(Depreciation) | | | | Capital Gain
Distributions |
JPMorgan Prime Money Market Fund Class IM Shares, 5.23% (a) (b) | | | | | | | | | |
JPMorgan Securities Lending Money Market Fund Agency SL Class Shares, 5.29% (a) (b) | | | | | | | | | |
JPMorgan U.S. Government Money Market Fund Class IM Shares, 5.05% (a) (b) | | | | | | | | | |
| | | | | | | | | |
|
| Investment in an affiliated fund, which is registered under the Investment Company Act of 1940, as amended, and is advised by J.P. Morgan Investment Management Inc. |
| J.P. Morgan Mid Cap/Multi-Cap Funds | |
| The rate shown is the current yield as of June 30, 2023. |
| Amount is included on the Statements of Operations as Income from securities lending (net) (after payments of rebates and Citibank’s fee). |
|
For the year ended June 30, 2023 |
| | | | | Change in
Unrealized
Appreciation/
(Depreciation) | | | | Capital Gain
Distributions |
JPMorgan Prime Money Market Fund Class IM Shares, 5.23% (a) (b) | | | | | | | | | |
JPMorgan Securities Lending Money Market Fund Agency SL Class Shares, 5.29% (a) (b) | | | | | | | | | |
JPMorgan U.S. Government Money Market Fund Class IM Shares, 5.05% (a) (b) | | | | | | | | | |
| | | | | | | | | |
|
| Investment in an affiliated fund, which is registered under the Investment Company Act of 1940, as amended, and is advised by J.P. Morgan Investment Management Inc. |
| The rate shown is the current yield as of June 30, 2023. |
| Amount is included on the Statements of Operations as Income from securities lending (net) (after payments of rebates and Citibank’s fee). |
D. Foreign Currency Translation — The books and records of the Funds are maintained in U.S. dollars. Foreign currency amounts are translated into U.S. dollars at the prevailing exchange rates of such currencies against the U.S. dollar. The market value of investment securities and other assets and liabilities are translated at the exchange rate as of the valuation date. Purchases and sales of investment securities, income and expenses are translated at the exchange rate prevailing on the respective dates of such transactions.
The Funds do not isolate the effect of changes in foreign exchange rates from changes in market prices on securities held. Accordingly, such changes are included within Change in net unrealized appreciation/depreciation on investments in non-affiliates on the Statements of Operations.
Reported realized foreign currency gains and losses arise from the disposition of foreign currency, currency gains or losses realized between the trade and settlement dates on securities transactions, and the difference between the amounts of dividends, interest and foreign withholding taxes recorded on each Fund's books on the transaction date and the U.S. dollar equivalent of the amounts actually received or paid. These reported realized foreign currency gains and losses are included in Net realized gain (loss) on foreign currency transactions on the Statements of Operations. Unrealized foreign currency gains and losses arise from changes (due to changes in exchange rates) in the value of foreign currency and other assets and liabilities denominated in foreign currencies, which are held at year end and are included in Change in net unrealized appreciation/depreciation on foreign currency translations on the Statements of Operations.
E. Security Transactions and Investment Income — Investment transactions are accounted for on the trade date (the date the order to buy or sell is executed). Securities gains and losses are calculated on a specifically identified cost basis.
Dividend income is recorded on the ex-dividend date or when a Fund first learns of the dividend.
To the extent such information is publicly available, the Funds record distributions received in excess of income earned from underlying investments as a reduction of cost of investments and/or realized gain. Such amounts are based on estimates if actual amounts are not available and actual amounts of income, realized gain and return of capital may differ from the estimated amounts. The Funds adjust the estimated amounts of the components of distributions (and consequently their net investment income) as necessary, once the issuers provide information about the actual composition of the distributions.
| J.P. Morgan Mid Cap/Multi-Cap Funds | |
NOTES TO FINANCIAL STATEMENTS
AS OF June 30, 2023 (continued)
(Dollar values in thousands)
F. Allocation of Income and Expenses— Expenses directly attributable to a Fund are charged directly to that Fund, while the expenses attributable to more than one fund of the Trusts are allocated among the applicable funds. Investment income, realized and unrealized gains and losses and expenses, other than class-specific expenses, are allocated daily to each class of shares based upon the proportion of net assets of each class at the beginning of each day.
Transfer agency fees are class-specific expenses. The amount of the transfer agency fees charged to each share class of the Funds for the year ended June 30, 2023 are as follows:
|
| Amount rounds to less than one thousand. |
G. Federal Income Taxes — Each Fund is treated as a separate taxable entity for Federal income tax purposes. Each Fund's policy is to comply with the provisions of the Internal Revenue Code (the “Code”) applicable to regulated investment companies and to distribute to shareholders all of its distributable net investment income and net realized capital gains on investments. Accordingly, no provision for Federal income tax is necessary. Management has reviewed the Funds' tax positions for all open tax years and has determined that as of June 30, 2023, no liability for Federal income tax is required in the Funds' financial statements for net unrecognized tax benefits. However, management’s conclusions may be subject to future review based on changes in, or the interpretation of, the accounting standards or tax laws and regulations. Each Fund's Federal tax returns for the prior three fiscal years remain subject to examination by the Internal Revenue Service.
H. Distributions to Shareholders — Distributions from net investment income, if any, are generally declared and paid at least annually and are declared separately for each class. No class has preferential dividend rights; differences in per share rates are due to differences in separate class expenses. Net realized capital gains, if any, are distributed by each Fund at least annually. The amount of distributions from net investment income and net realized capital gains is determined in accordance with Federal income tax regulations, which may differ from GAAP. To the extent these “book/tax” differences are permanent in nature (i.e., that they result from other than timing of recognition — “temporary differences”), such amounts are reclassified within the capital accounts based on their Federal tax basis treatment.
The following amounts were reclassified within the capital accounts:
| | Accumulated
undistributed
(distributions in
excess of)
net investment
income | Accumulated
net realized
gains (losses) |
| | | |
| | | |
| | | |
| | | |
| | | |
The reclassifications for the Funds relate primarily to tax adjustments on certain investments and tax equalization.
| J.P. Morgan Mid Cap/Multi-Cap Funds | |
3. Fees and Other Transactions with Affiliates
A. Investment Advisory Fee — Pursuant to an Investment Advisory Agreement, the Adviser manages the investments of each Fund and for such services is paid a fee. The investment advisory fee is accrued daily and paid monthly at an annual rate based on each Fund's respective average daily net assets. The annual rate for each Fund is as follows:
The Adviser waived investment advisory fees and/or reimbursed expenses as outlined in Note 3.F.
B. Administration Fee — Pursuant to an Administration Agreement, the Administrator provides certain administration services to each Fund. In consideration of these services, the Administrator receives a fee accrued daily and paid monthly at an annual rate of 0.075% of the first $10 billion of each Fund's respective average daily net assets, plus 0.050% of each Fund's respective average daily net assets between $10 billion and $20 billion, plus 0.025% of each Fund's respective average daily net assets between $20 billion and $25 billion, plus 0.010% of each Fund's respective average daily net assets in excess of $25 billion. For the year ended June 30, 2023, the effective rate was 0.070% of each Fund's average daily net assets, notwithstanding any fee waivers and/or expense reimbursements.
The Administrator waived administration fees as outlined in Note 3.F.
JPMorgan Chase Bank, N.A. ("JPMCB"), a wholly-owned subsidiary of JPMorgan, serves as the Funds' sub-administrator (the “Sub-administrator”). For its services as Sub-administrator, JPMCB receives a portion of the fees payable to the Administrator.
C. Distribution Fees — Pursuant to a Distribution Agreement, JPMorgan Distribution Services, Inc. (“JPMDS”), an indirect, wholly-owned subsidiary of JPMorgan, serves as each Fund's principal underwriter and promotes and arranges for the sale of each Fund's shares.
The Boards have adopted a Distribution Plan (the “Distribution Plan”) for Class A, Class C, Class R2 and Class R3 Shares of the Funds, as applicable, pursuant to Rule 12b-1 under the 1940 Act. Class I, Class L, Class R4, Class R5 and Class R6 Shares of the Funds do not charge a distribution fee. The Distribution Plan provides that each Fund shall pay, with respect to the applicable share classes, distribution fees, including payments to JPMDS, at annual rates of the average daily net assets as shown in the table below:
In addition, JPMDS is entitled to receive the front-end sales charges from purchases of Class A Shares and the CDSC from redemptions of Class C Shares and certain Class A Shares for which front-end sales charges have been waived. For the year ended June 30, 2023, JPMDS retained the following:
|
| Amount rounds to less than one thousand. |
| J.P. Morgan Mid Cap/Multi-Cap Funds | |
NOTES TO FINANCIAL STATEMENTS
AS OF June 30, 2023 (continued)
(Dollar values in thousands)
D. Service Fees — The Trusts, on behalf of the Funds, have entered into a Shareholder Servicing Agreement with JPMDS under which JPMDS provides certain support services to fund shareholders. For performing these services, JPMDS receives a fee with respect to all share classes, except Class R6 Shares which do not charge a service fee, that is accrued daily and paid monthly equal to a percentage of the average daily net assets as shown in the table below:
JPMDS has entered into shareholder services contracts with affiliated and unaffiliated financial intermediaries who provide shareholder services and other related services to their clients or customers who invest in the Funds. Pursuant to such contracts, JPMDS will pay all or a portion of such fees earned to financial intermediaries for performing such services.
JPMDS waived service fees as outlined in Note 3.F.
E. Custodian and Accounting Fees — JPMCB provides portfolio custody and accounting services to the Funds. For performing these services, the Funds pay JPMCB transaction and asset-based fees that vary according to the number of transactions and positions, plus out-of-pocket expenses. The amounts paid directly to JPMCB by the Funds for custody and accounting services are included in Custodian and accounting fees on the Statements of Operations.
Interest income earned on cash balances at the custodian, if any, is included in Interest income from affiliates on the Statements of Operations.
Interest expense paid to the custodian related to cash overdrafts, if any, is included in Interest expense to affiliates on the Statements of Operations.
F. Waivers and Reimbursements —The Adviser, Administrator and/or JPMDS have contractually agreed to waive fees and/or reimburse the Funds to the extent that total annual operating expenses (excluding acquired fund fees and expenses other than certain money market fund fees as described below, dividend and interest expenses related to short sales, interest, taxes, expenses related to litigation and potential litigation, expenses related to trustee elections and extraordinary expenses) exceed the percentages of the Funds' respective average daily net assets as shown in the table below:
The expense limitation agreements were in effect for the year ended June 30, 2023 and are in place until at least October 31, 2024.
For the year ended June 30, 2023, the Funds' service providers waived fees and/or reimbursed expenses for each of the Funds as follows. None of these parties expect the Funds to repay any such waived fees and/or reimbursed expenses in future years.
| | |
| | | | | Contractual
Reimbursements |
| | | | | |
| | | | | |
| | | | | |
| | | | | |
| | | | | |
Additionally, the Funds may invest in one or more money market funds advised by the Adviser (affiliated money market funds). The Adviser, Administrator and/or JPMDS, as shareholder servicing agent, have contractually agreed to waive fees and/or reimburse expenses in an amount sufficient to offset the respective net fees each collects from the affiliated money market fund on the applicable Fund's investment in such affiliated money market fund, except for investments of securities lending cash collateral. None of these parties expect the Funds to repay any such waived fees and/or reimbursed expenses in future years.
| J.P. Morgan Mid Cap/Multi-Cap Funds | |
The amounts of these waivers resulting from investments in these money market funds for the year ended June 30, 2023 were as follows:
JPMIM voluntarily agreed to reimburse the Funds for the Trustee Fees paid to one of the interested Trustees. For the year ended June 30, 2023, the amount of these reimbursements were as follows:
G. Other — Certain officers of the Trusts are affiliated with the Adviser, the Administrator and JPMDS. Such officers, with the exception of the Chief Compliance Officer, receive no compensation from the Funds for serving in their respective roles.
The Boards designated and appointed a Chief Compliance Officer to the Funds pursuant to Rule 38a-1 under the 1940 Act. Each Fund, along with affiliated funds, makes reimbursement payments, on a pro-rata basis, to the Administrator for a portion of the fees associated with the office of the Chief Compliance Officer. Such fees are included in Trustees’ and Chief Compliance Officer’s fees on the Statements of Operations.
The Trusts adopted a Trustee Deferred Compensation Plan (the “Plan”) which allows the independent Trustees to defer the receipt of all or a portion of compensation related to performance of their duties as Trustees. The deferred fees are invested in various J.P. Morgan Funds until distribution in accordance with the Plan.
During the year ended June 30, 2023, Value Advantage Fund purchased securities from an underwriting syndicate in which the principal underwriter or members of the syndicate were affiliated with the Adviser.
The Securities and Exchange Commission ("SEC") has granted an exemptive order permitting the Funds to engage in principal transactions with J.P. Morgan Securities LLC, an affiliated broker, involving taxable money market instruments, subject to certain conditions.
4. Investment Transactions
During the year ended June 30, 2023, purchases and sales of investments (excluding short-term investments) were as follows:
| Purchases
(excluding
U.S. Government) | Sales
(excluding
U.S. Government) |
| | |
| | |
| | |
| | |
| | |
During the year ended June 30, 2023, there were no purchases or sales of U.S. Government securities.
| J.P. Morgan Mid Cap/Multi-Cap Funds | |
NOTES TO FINANCIAL STATEMENTS
AS OF June 30, 2023 (continued)
(Dollar values in thousands)
5. Federal Income Tax Matters
For Federal income tax purposes, the estimated cost and unrealized appreciation (depreciation) in value of investments held at June 30, 2023 were as follows:
| | Gross
Unrealized
Appreciation | Gross
Unrealized
Depreciation | Net Unrealized
Appreciation
(Depreciation) |
| | | | |
| | | | |
| | | | |
| | | | |
| | | | |
The difference between book and tax basis appreciation (depreciation) on investments is primarily attributed to tax adjustments on certain investments and wash sale loss deferrals.
The tax character of distributions paid during the year ended June 30, 2023 was as follows:
| | Net
Long-Term
Capital Gains | |
| | | |
| | | |
| | | |
| | | |
| | | |
|
| Short-term gain distributions are treated as ordinary income for income tax purposes. |
The tax character of distributions paid during the year ended June 30, 2022 was as follows:
| | Net
Long-Term
Capital Gains | |
| | | |
| | | |
| | | |
| | | |
| | | |
|
| Short-term gain distributions are treated as ordinary income for income tax purposes. |
As of June 30, 2023, the estimated components of net assets (excluding paid-in-capital) on a tax basis were as follows:
| Current
Distributable
Ordinary
Income | Current
Distributable
Long-Term
Capital Gain
(Tax Basis Capital
Loss Carryover) | Unrealized
Appreciation
(Depreciation) |
| | | |
| | | |
| | | |
| | | |
| | | |
| J.P. Morgan Mid Cap/Multi-Cap Funds | |
The cumulative timing differences primarily consist of tax adjustments on certain investments, post-October capital loss deferrals, wash sale loss deferrals and ordinary loss deferrals.
As of June 30, 2023, the following Funds had net capital loss carryforwards which are available to offset future realized gains:
| Capital Loss Carryforward Character |
| | |
| | |
| | |
Net capital losses (gains) and specified ordinary losses incurred after October 31 and late year ordinary losses incurred after December 31 and within the taxable year are deemed to arise on the first business day of the Funds' next taxable year. For the year ended June 30, 2023, the following Funds deferred to July 1, 2023 the following net capital losses (gains), specified ordinary losses and late year ordinary losses of:
| Net Capital Losses (Gains) | | Late Year Ordinary Loss Deferral |
| | |
| | | | |
| | | | |
| | | | |
| | | | |
6. Borrowings
The Funds rely upon an exemptive order granted by the SEC (the “Order”) permitting the establishment and operation of an Interfund Lending Facility (the “Facility”). The Facility allows the Funds to directly lend and borrow money to or from any other fund relying upon the Order at rates beneficial to both the borrowing and lending funds. Advances under the Facility are taken primarily for temporary or emergency purposes, including the meeting of redemption requests that otherwise might require the untimely disposition of securities, and are subject to each Fund's borrowing restrictions. The interfund loan rate is determined, as specified in the Order, by averaging the current repurchase agreement rate and the current bank loan rate. The Order was granted to JPM II and may be relied upon by the Funds because the Funds and the series of JPM II are all investment companies in the same “group of investment companies” (as defined in Section 12(d)(1)(G) of the 1940 Act).
The Funds had no borrowings outstanding from another fund, or loans outstanding to another fund, during the year ended June 30, 2023.
The Trusts and JPMCB have entered into a financing arrangement. Under this arrangement, JPMCB provides an unsecured, uncommitted credit facility in the aggregate amount of $100 million to certain of the J.P. Morgan Funds, including the Funds. Advances under the arrangement are taken primarily for temporary or emergency purposes, including the meeting of redemption requests that otherwise might require the untimely disposition of securities, and are subject to each Fund's borrowing restrictions. Interest on borrowings is payable at a rate determined by JPMCB at the time of borrowing. This agreement has been extended until October 30, 2023.
The Funds had no borrowings outstanding from the unsecured, uncommitted credit facility during the year ended June 30, 2023.
The Trusts, along with certain other trusts for J.P. Morgan Funds (“Borrowers”), have entered into a joint syndicated senior unsecured revolving credit facility totaling $1.5 billion (“Credit Facility”) with various lenders and The Bank of New York Mellon, as administrative agent for the lenders. This Credit Facility provides a source of funds to the Borrowers for temporary and emergency purposes, including the meeting of redemption requests that otherwise might require the untimely disposition of securities. Under the terms of the Credit Facility, a borrowing fund must have a minimum of $25 million in adjusted net asset value and not exceed certain adjusted net asset coverage ratios prior to and during the time in which any borrowings are outstanding. If a fund does not comply with the aforementioned requirements, the fund must remediate within three business days with respect to the $25 million minimum adjusted net asset value or within one business day with respect to certain asset coverage ratios or the administrative agent at the request of, or with the consent of, the lenders may terminate the Credit Facility and declare any outstanding borrowings to be due and payable immediately.
Interest associated with any borrowing under the Credit Facility is charged to the borrowing fund at a rate of interest equal to 1.00% (the "Applicable Margin"), plus the greater on the day of the borrowing, of the federal funds effective rate, or the Adjusted Daily Simple SOFR Rate. Prior to August 9, 2022, interest associated with any borrowing under the Credit Facility was charged to the borrowing fund at a rate of interest equal to the Applicable Margin, plus the greater of the federal funds effective rate or one month London Interbank Offered Rate ("LIBOR"). Effective August 8, 2023, the Credit Facility was amended and restated for a term of 364 days, unless extended.
The Funds did not utilize the Credit Facility during the year ended June 30, 2023.
| J.P. Morgan Mid Cap/Multi-Cap Funds | |
NOTES TO FINANCIAL STATEMENTS
AS OF June 30, 2023 (continued)
(Dollar values in thousands)
7. Risks, Concentrations and Indemnifications
In the normal course of business, the Funds enter into contracts that contain a variety of representations which provide general indemnifications. Each Fund's maximum exposure under these arrangements is unknown. The amount of exposure would depend on future claims that may be brought against each Fund. However, based on experience, the Funds expect the risk of loss to be remote.
As of June 30, 2023, the Funds had individual shareholders and/or non-affiliated omnibus accounts each owning more than 10% of the respective Fund's outstanding shares as follows:
| Number of
Individual Shareholder
and/or Affiliated
Omnibus Accounts | | Number of
Individual Shareholder
and/or Non-Affiliated
Omnibus Accounts | |
| | | | |
| | | | |
| | | | |
| | | | |
| | | | |
Significant shareholder transactions by these shareholders may impact the Funds' performance and liquidity.
As of June 30, 2023, the Funds owned in the aggregate, shares representing more than 10% of the net assets of the following Underlying Funds:
| JPMorgan
SmartRetirement
Funds |
| |
| |
Because Mid Cap Equity Fund, Mid Cap Value Fund and Value Advantage Fund invest in Real Estate Investment Trusts (“REITs”), the Funds may be subject to certain risks similar to those associated with direct investments in real estate. REITs may be affected by changes in the value of their underlying properties and by defaults by tenants. REITs depend generally on their ability to generate cash flow to make distributions to shareholders, and certain REITs have self-liquidation provisions by which mortgages held may be paid in full and distributions of capital returns may be made at any time.
LIBOR was a leading floating rate benchmark used in loans, notes, derivatives and other instruments or investments. As a result of benchmark reforms, publication of most LIBOR settings has ceased. Some LIBOR settings continue to be published but only on a temporary, synthetic and non-representative basis. Regulated entities have generally ceased entering into new LIBOR contracts in connection with regulatory guidance or prohibitions. Public and private sector actors have worked to establish alternative reference rates to be used in place of LIBOR. There is no assurance that any such alternative reference rate will be similar to or produce the same value or economic equivalence as LIBOR or that it will have the same volume or liquidity as did LIBOR which may affect the value, volatility, liquidity or return on certain of the Funds' loans, notes, derivatives and other instruments or investments comprising some or all of the Funds' investments and result in costs incurred in connection with changing reference rates used for positions, closing out positions and entering into new trades. Certain of the Funds' investments may have transitioned from LIBOR or will transition from LIBOR in the future. The transition from LIBOR to alternative reference rates may result in operational issues for the Funds or their investments. No assurances can be given as to the impact of the LIBOR transition (and the timing of any such impact) on the Funds and their investments.
The Funds are subject to infectious disease epidemics/pandemics risk. For example, the outbreak of COVID-19 negatively affected economies, markets and individual companies throughout the world, including those in which the Funds invest. The effects of this, or any future, pandemic to public health and business and market conditions may have a significant negative impact on the performance of a Fund's investments, increase a Fund's volatility, exacerbate other pre-existing political, social and economic risks to the Funds and negatively impact broad segments of businesses and populations. In addition, governments, their regulatory agencies, or self-regulatory organizations have taken or may take actions in response to a pandemic that affect the instruments in which the Funds invest, or the issuers of such instruments, in ways that could have a significant negative impact on a Fund’s investment performance. The ultimate impact of any pandemic and the extent to which the associated conditions and governmental responses impact a Fund will also depend on future developments, which are highly uncertain, difficult to accurately predict and subject to frequent changes.
| J.P. Morgan Mid Cap/Multi-Cap Funds | |
REPORT OF INDEPENDENT REGISTERED PUBLIC ACCOUNTING FIRM
To the Board of Trustees of J.P. Morgan Mutual Fund Investment Trust, J.P. Morgan Fleming Mutual Fund Group, Inc., JPMorgan Trust I and JPMorgan Trust II and Shareholders of JPMorgan Growth Advantage Fund, JPMorgan Mid Cap Equity Fund, JPMorgan Mid Cap Growth Fund, JPMorgan Mid Cap Value Fund and JPMorgan Value Advantage Fund
Opinions on the Financial Statements
We have audited the accompanying statements of assets and liabilities, including the schedules of portfolio investments, of JPMorgan Growth Advantage Fund (constituting J.P. Morgan Mutual Fund Investment Trust), JPMorgan Mid Cap Value Fund (constituting J.P. Morgan Fleming Mutual Fund Group, Inc.), JPMorgan Mid Cap Equity Fund and JPMorgan Value Advantage Fund (two of the funds constituting JPMorgan Trust I) and JPMorgan Mid Cap Growth Fund (one of the funds constituting JPMorgan Trust II) (hereafter collectively referred to as the "Funds") as of June 30, 2023, the related statements of operations for the year ended June 30, 2023, the statements of changes in net assets for each of the two years in the period ended June 30, 2023, including the related notes, and the financial highlights for each of the five years in the period ended June 30, 2023 (collectively referred to as the “financial statements”). In our opinion, the financial statements present fairly, in all material respects, the financial position of each of the Funds as of June 30, 2023, the results of each of their operations for the year then ended, the changes in each of their net assets for each of the two years in the period ended June 30, 2023 and each of the financial highlights for each of the five years in the period ended June 30, 2023 in conformity with accounting principles generally accepted in the United States of America.
Basis for Opinions
These financial statements are the responsibility of the Funds’ management. Our responsibility is to express an opinion on the Funds’ financial statements based on our audits. We are a public accounting firm registered with the Public Company Accounting Oversight Board (United States) (PCAOB) and are required to be independent with respect to the Funds in accordance with the U.S. federal securities laws and the applicable rules and regulations of the Securities and Exchange Commission and the PCAOB.
We conducted our audits of these financial statements in accordance with the standards of the PCAOB. Those standards require that we plan and perform the audit to obtain reasonable assurance about whether the financial statements are free of material misstatement, whether due to error or fraud.
Our audits included performing procedures to assess the risks of material misstatement of the financial statements, whether due to error or fraud, and performing procedures that respond to those risks. Such procedures included examining, on a test basis, evidence regarding the amounts and disclosures in the financial statements. Our audits also included evaluating the accounting principles used and significant estimates made by management, as well as evaluating the overall presentation of the financial statements. Our procedures included confirmation of securities owned as of June 30, 2023 by correspondence with the custodian, transfer agent and brokers; when replies were not received from brokers, we performed other auditing procedures. We believe that our audits provide a reasonable basis for our opinions.
/s/ PricewaterhouseCoopers LLP
New York, New York
August 24, 2023
We have served as the auditor of one or more investment companies in the JPMorgan Funds complex since 1993.
| J.P. Morgan Mid Cap/Multi-Cap Funds | |
The Funds' Statement of Additional Information includes additional information about the Funds' Trustees and is available, without charge, upon request by calling 1-800-480-4111 or on the J.P. Morgan Funds’ website at www.jpmorganfunds.com.
Name (Year of Birth);
Positions With
the Funds (1) | Principal Occupation
During Past 5 Years | Number of
Funds in Fund
Complex Overseen
by Trustee (2) | Other Directorships Held
During the Past 5 Years |
| |
John F. Finn (1947); Chair
since 2020; Trustee since 1998. | Chairman, Gardner, Inc. (supply chain management company serving industrial and consumer markets) (serving in various roles 1974-present). | | Director, Greif, Inc. (GEF) (industrial package products and services) (2007-present); Trustee, Columbus Association for the Performing Arts (1988-present). |
Stephen P. Fisher (1959);
Trustee since 2018. | Retired; Chairman and Chief Executive Officer, NYLIFE Distributors LLC (registered broker-dealer) (serving in various roles 2008-2013); Chairman, NYLIM Service Company LLC (transfer agent) (2008-2017); New York Life Investment Management LLC (registered investment adviser) (serving in various roles 2005-2017); Chairman, IndexIQ Advisors LLC (registered investment adviser for ETFs) (2014-2017); President, MainStay VP Funds Trust (2007-2017), MainStay DefinedTerm Municipal Opportunities Fund (2011-2017) and MainStay Funds Trust (2007-2017) (registered investment companies). | | Honors Program Advisory Board Member, The Zicklin School of Business, Baruch College, The City University of New York (2017-present). |
Gary L. French (1951);
Trustee since 2014. | Real Estate Investor (2011-2020); Investment management industry Consultant and Expert Witness (2011-present); Senior Consultant for The Regulatory Fundamentals Group LLC (2011-2017). | | Independent Trustee, The China Fund, Inc. (2013-2019); Exchange Traded Concepts Trust II (2012-2014); Exchange Traded Concepts Trust I (2011-2014). |
Kathleen M. Gallagher (1958);
Trustee since 2018. | Retired; Chief Investment Officer — Benefit Plans, Ford Motor Company (serving in various roles 1985-2016). | | Non- Executive Director, Legal & General Investment Management (Holdings) (2018-present); Non-Executive Director, Legal & General Investment Management America (U.S. Holdings) (financial services and insurance) (2017-present); Advisory Board Member, State Street Global Advisors Total Portfolio Solutions (2017-present); Member, Client Advisory Council, Financial Engines, LLC (registered investment adviser) (2011-2016); Director, Ford Pension Funds Investment Management Ltd. (2007-2016). |
Robert J. Grassi (1957);
Trustee since 2014. | Sole Proprietor, Academy Hills Advisors LLC (2012-present); Pension Director, Corning Incorporated (2002-2012). | | |
| J.P. Morgan Mid Cap/Multi-Cap Funds | |
Name (Year of Birth); Positions With the Funds (1) | Principal Occupation During Past 5 Years | Number of Funds in Fund Complex Overseen by Trustee (2) | Other Directorships Held During the Past 5 Years |
Independent Trustees (continued) | |
Frankie D. Hughes (1952);
Trustee since 2008. | President, Ashland Hughes Properties (property management) (2014-present); President and Chief Investment Officer, Hughes Capital Management, Inc. (fixed income asset management) (1993-2014). | | |
Raymond Kanner (1953);
Trustee since 2017. | Retired; Managing Director and Chief Investment Officer, IBM Retirement Funds (2007-2016). | | Advisory Board Member, Penso Advisors, LLC (2020-present); Advisory Board Member, Los Angeles Capital (2018-present); Advisory Board Member, State Street Global Advisors Total Portfolio Solutions (2017- present); Acting Executive Director, Committee on Investment of Employee Benefit Assets (CIEBA) (2016-2017); Advisory Board Member, Betterment for Business (robo advisor) (2016- 2017); Advisory Board Member, BlueStar Indexes (index creator) (2013-2017); Director, Emerging Markets Growth Fund (registered investment company) (1997-2016); Member, Russell Index Client Advisory Board (2001-2015). |
Thomas P. Lemke (1954);
Trustee since 2014. | | | (1) Independent Trustee of Advisors’ Inner Circle III fund platform, consisting of the following: (i) the Advisors’ Inner Circle Fund III, (ii) the Gallery Trust, (iii) the Schroder Series Trust, (iv) the Delaware Wilshire Private Markets Fund (since 2020), (v) Chiron Capital Allocation Fund Ltd., and (vi) formerly the Winton Diversified Opportunities Fund (2014-2018); and (2) Independent Trustee of the Symmetry Panoramic Trust (since 2018). |
Lawrence R. Maffia (1950);
Trustee since 2014. | Retired; Director and President, ICI Mutual Insurance Company (2006-2013). | | Director, ICI Mutual Insurance Company (1999-2013). |
Mary E. Martinez (1960); Vice
Chair since 2021; Trustee since 2013. | Associate, Special Properties, a Christie’s International Real Estate Affiliate (2010-present); Managing Director, Bank of America (asset management) (2007-2008); Chief Operating Officer, U.S. Trust Asset Management, U.S. Trust Company (asset management) (2003-2007); President, Excelsior Funds (registered investment companies) (2004-2005). | | |
Marilyn McCoy (1948);
Trustee since 1999. | Retired; Vice President of Administration and Planning, Northwestern University (1985-2023). | | |
| J.P. Morgan Mid Cap/Multi-Cap Funds | |
TRUSTEES
(Unaudited) (continued)
Name (Year of Birth); Positions With the Funds (1) | Principal Occupation During Past 5 Years | Number of Funds in Fund Complex Overseen by Trustee (2) | Other Directorships Held During the Past 5 Years |
Independent Trustees (continued) | |
Dr. Robert A. Oden, Jr. (1946); Trustee
since 1997. | Retired; President, Carleton College (2002-2010); President, Kenyon College (1995-2002). | | Trustee, The Coldwater Conservation Fund (2017-present); Trustee, American Museum of Fly Fishing (2013-present); Trustee and Vice Chair, Trout Unlimited (2017-2021); Trustee, Dartmouth- Hitchcock Medical Center (2011-2020). |
Marian U. Pardo* (1946);
Trustee since 2013. | Managing Director and Founder, Virtual Capital Management LLC (investment consulting) (2007-present); Managing Director, Credit Suisse Asset Management (portfolio manager) (2003-2006). | | Board Chair and Member, Board of Governors, Columbus Citizens Foundation (not-for-profit supporting philanthropic and cultural programs) (2006-present). |
Emily A. Youssouf (1951);
Trustee since 2014. | Adjunct Professor (2011-present) and Clinical Professor (2009-2011), NYU Schack Institute of Real Estate; Board Member and Member of the Audit Committee (2013–present), Chair of Finance Committee (2019-present), Member of Related Parties Committee (2013-2018) and Member of the Enterprise Risk Committee (2015-2018), PennyMac Financial Services, Inc.; Board Member (2005-2018), Chair of Capital Committee (2006-2016), Chair of Audit Committee (2005-2018), Member of Finance Committee (2005-2018) and Chair of IT Committee (2016-2018), NYC Health and Hospitals Corporation. | | Trustee, NYC School Construction Authority (2009-present); Board Member, NYS Job Development Authority (2008-present); Trustee and Chair of the Audit Committee of the Transit Center Foundation (2015-2019). |
| |
Robert F. Deutsch** (1957);
Trustee since 2014. | Retired; Head of ETF Business for JPMorgan Asset Management (2013-2017); Head of Global Liquidity Business for JPMorgan Asset Management (2003-2013). | | Treasurer and Director of the JUST Capital Foundation (2017-present). |
Nina O. Shenker** (1957);
Trustee since 2022. | Vice Chair (2017-2021), General Counsel and Managing Director (2008-2016), Associate General Counsel and Managing Director (2004-2008), J.P. Morgan Asset & Wealth Management. | | Director and Member of Legal and Human Resources Subcommittees, American Jewish Joint Distribution Committee (2018-present). |
|
| The year shown is the first year in which a Trustee became a member of any of the following: the JPMorgan Mutual Fund Board, the JPMorgan ETF Board, the heritage J.P. Morgan Funds or the heritage One Group Mutual Funds. Trustees serve an indefinite term, until resignation, retirement, removal or death. The Boards' current retirement policy sets retirement at the end of the calendar year in which the Trustee attains the age of 75, provided that any Board member who was a member of the JPMorgan Mutual Fund Board prior to January 1, 2022 and was born prior to January 1, 1950 shall retire from the Board at the end of the calendar year in which the Trustee attains the age of 78. |
| A Fund Complex means two or more registered investment companies that hold themselves out to investors as related companies for purposes of investment and investor services or have a common investment adviser or have an investment adviser that is an affiliated person of the investment adviser of any of the other registered investment companies. The J.P. Morgan Funds Complex for which the Board of Trustees serves currently includes nine registered investment companies (176 J.P. Morgan Funds). |
| In connection with prior employment with JPMorgan Chase, Ms. Pardo was the recipient of non-qualified pension plan payments from JPMorgan Chase in the amount of approximately $2,055 per month, which she irrevocably waived effective January 1, 2013, and deferred compensation payments from JPMorgan Chase in the amount of approximately $7,294 per year, which ended in January 2013. In addition, Ms. Pardo receives payments from a fully-funded qualified plan, which is not an obligation of JPMorgan Chase. |
| J.P. Morgan Mid Cap/Multi-Cap Funds | |
| Designation as an “Interested Trustee” is based on prior employment by the Adviser or an affiliate of the Adviser or interests in a control person of the Adviser. |
| The contact address for each of the Trustees is 277 Park Avenue, New York, NY 10172. |
| J.P. Morgan Mid Cap/Multi-Cap Funds | |
Name (Year of Birth),
Positions Held with
the Trusts (Since) | Principal Occupations During Past 5 Years |
Brian S. Shlissel (1964),
President and Principal Executive
Officer (2016) | Managing Director and Chief Administrative Officer for J.P. Morgan pooled vehicles, J.P. Morgan Investment Management Inc. since 2014. |
Timothy J. Clemens (1975),
Treasurer and Principal Financial
Officer (2018) | Managing Director, J.P. Morgan Investment Management Inc. Mr. Clemens has been with J.P. Morgan Investment Management Inc. since 2013. |
Gregory S. Samuels (1980),
Secretary (2019) (formerly Assistant
Secretary 2010-2019) | Managing Director and Assistant General Counsel, JPMorgan Chase & Co. Mr. Samuels has been with JPMorgan Chase & Co. since 2010. |
Stephen M. Ungerman (1953),
Chief Compliance Officer (2005) | Managing Director, JPMorgan Chase & Co. Mr. Ungerman has been with JPMorgan Chase & Co. since 2000. |
Kiesha Astwood-Smith (1973),
Assistant Secretary (2021) | Vice President and Assistant General Counsel, JPMorgan Chase & Co. since June 2021; Senior Director and Counsel, Equitable Financial Life Insurance Company (formerly, AXA Equitable Life Insurance Company) from September 2015 through June 2021. |
Matthew Beck (1988),
Assistant Secretary (2021)* | Vice President and Assistant General Counsel, JPMorgan Chase & Co. since May 2021; Senior Legal Counsel, Ultimus Fund Solutions from May 2018 through May 2021; General Counsel, The Nottingham Company from April 2014 through May 2018. |
Elizabeth A. Davin (1964),
Assistant Secretary (2005)* | Executive Director and Assistant General Counsel, JPMorgan Chase & Co. Ms. Davin has been with JPMorgan Chase & Co. (formerly Bank One Corporation) since 2004. |
Jessica K. Ditullio (1962)
Assistant Secretary (2005)* | Executive Director and Assistant General Counsel, JPMorgan Chase & Co. Ms. Ditullio has been with JPMorgan Chase & Co. (formerly Bank One Corporation) since 1990. |
Anthony Geron (1971),
Assistant Secretary (2018) | Vice President and Assistant General Counsel, JPMorgan Chase & Co. since September 2018; Lead Director and Counsel, AXA Equitable Life Insurance Company from 2015 to 2018 and Senior Director and Counsel, AXA Equitable Life Insurance Company from 2014 to 2015. |
Carmine Lekstutis (1980),
Assistant Secretary (2011) | Executive Director and Assistant General Counsel, JPMorgan Chase & Co. Mr. Lekstutis has been with JPMorgan Chase & Co. since 2011. |
Max Vogel (1990),
Assistant Secretary (2021) | Vice President and Assistant General Counsel, JPMorgan Chase & Co. since June 2021; Associate, Proskauer Rose LLP (law firm) from March 2017 to June 2021. |
Zachary E. Vonnegut-Gabovitch
(1986),
Assistant Secretary (2017) | Executive Director and Assistant General Counsel, JPMorgan Chase & Co. Mr. Vonnegut-Gabovitch has been with JPMorgan Chase & Co. since September 2016. |
Frederick J. Cavaliere (1978),
Assistant Treasurer (2023)** | Executive Director, J.P. Morgan Investment Management Inc. Mr. Cavaliere has been with JPMorgan Chase & Co. since May 2006. |
Michael M. D’Ambrosio (1969),
Assistant Treasurer (2012) | Managing Director, J.P. Morgan Investment Management Inc. Mr. D’Ambrosio has been with J.P. Morgan Investment Management Inc. since 2012. |
Aleksandr Fleytekh (1972),
Assistant Treasurer (2019) | Executive Director, J.P. Morgan Investment Management Inc. Mr. Fleytekh has been with J.P. Morgan Investment Management Inc. since February 2012. |
Shannon Gaines (1977),
Assistant Treasurer (2018)* | Executive Director, J.P. Morgan Investment Management Inc. Mr. Gaines has been with J.P. Morgan Investment Management Inc. since January 2014. |
Jeffrey D. House (1972),
Assistant Treasurer (2017)* | Vice President, J.P. Morgan Investment Management Inc. since July 2006. |
Michael Mannarino (1985),
Assistant Treasurer (2020) | Vice President, J.P. Morgan Investment Management Inc. since 2014. |
Joseph Parascondola (1963),
Assistant Treasurer (2011)** | Executive Director, J.P. Morgan Investment Management Inc. Mr. Parascondola has been with J.P. Morgan Investment Management Inc. since 2006. |
| J.P. Morgan Mid Cap/Multi-Cap Funds | |
Name (Year of Birth), Positions Held with the Trusts (Since) | Principal Occupations During Past 5 Years |
Gillian I. Sands (1969),
Assistant Treasurer (2012) | Executive Director, J.P. Morgan Investment Management Inc. Ms. Sands has been with J.P. Morgan Investment Management Inc. since 2012. |
|
The contact address for each of the officers, unless otherwise noted, is 277 Park Avenue, New York, NY 10172. |
| The contact address for the officer is 1111 Polaris Parkway, Columbus, OH 43240. |
| The contact address for the officer is 575 Washington Boulevard, Jersey City, NJ 07310. |
| J.P. Morgan Mid Cap/Multi-Cap Funds | |
SCHEDULE OF SHAREHOLDER EXPENSES
(Unaudited)
Hypothetical $1,000 Investment
As a shareholder of the Funds, you incur two types of costs: (1) transaction costs, including sales charges (loads) on purchase payments and (2) ongoing costs, including investment advisory fees, administration fees, distribution fees and other Fund expenses. The examples below are intended to help you understand your ongoing costs (in dollars) of investing in the Funds (not including expenses of the Underlying Funds) and to compare these ongoing costs with the ongoing costs of investing in other mutual funds. The examples assume that you had a $1,000 investment in each Class at the beginning of the reporting period, January 1, 2023, and continued to hold your shares at the end of the reporting period, June 30, 2023.
Actual Expenses
For each Class of each Fund in the table below, the first line provides information about actual account values and actual expenses. You may use the information in this line, together with the amount you invested, to estimate the expenses that you paid over the period. Simply divide your account value by $1,000 (for example, an $8,600 account value divided by $1,000 = 8.6), then multiply the result by the number in the first line of each Class under the heading titled “Expenses Paid During the Period” to estimate the expenses you paid on your account during this period.
Hypothetical Example for Comparison Purposes
The second line of each Class in the table below provides information about hypothetical account values and hypothetical expenses based on the Class’ actual expense ratio and an assumed rate of return of 5% per year before expenses, which is not the Class’ actual return. The hypothetical account values and expenses may not be used to estimate the actual ending account balance or expenses you paid for the period. You may use this information to compare the ongoing costs of investing in the Class of the Funds and other funds. To do so, compare this 5% hypothetical example with the 5% hypothetical examples that appear in the shareholder reports of the other funds. Please note that the expenses shown in the table are meant to highlight your ongoing costs only and do not reflect any transaction costs, such as sales charges (loads) or redemption fees, and expenses of the Underlying Funds. Therefore, the second line for each Class in the table is useful in comparing ongoing costs only, and will not help you determine the relative total costs of owning different funds. In addition, if these transaction costs were included, your costs would have been higher. The examples also assume all dividends and distributions have been reinvested.
| Beginning
Account Value
January 1, 2023 | Ending
Account Value
June 30, 2023 | Expenses
Paid During
the Period* | |
JPMorgan Growth Advantage Fund | | | | |
| | | | |
| | | | |
| | | | |
| | | | |
| | | | |
| | | | |
| | | | |
| | | | |
| | | | |
| | | | |
| | | | |
| | | | |
| | | | |
| | | | |
| | | | |
| | | | |
| | | | |
| | | | |
| | | | |
| | | | |
| | | | |
| | | | |
| | | | |
| | | | |
| J.P. Morgan Mid Cap/Multi-Cap Funds | |
| Beginning Account Value January 1, 2023 | Ending Account Value June 30, 2023 | Expenses Paid During the Period* | |
JPMorgan Mid Cap Equity Fund | | | | |
| | | | |
| | | | |
| | | | |
| | | | |
| | | | |
| | | | |
| | | | |
| | | | |
| | | | |
| | | | |
| | | | |
| | | | |
| | | | |
| | | | |
| | | | |
| | | | |
| | | | |
| | | | |
JPMorgan Mid Cap Growth Fund | | | | |
| | | | |
| | | | |
| | | | |
| | | | |
| | | | |
| | | | |
| | | | |
| | | | |
| | | | |
| | | | |
| | | | |
| | | | |
| | | | |
| | | | |
| | | | |
| | | | |
| | | | |
| | | | |
| | | | |
| | | | |
| | | | |
| | | | |
| | | | |
| | | | |
JPMorgan Mid Cap Value Fund | | | | |
| | | | |
| | | | |
| | | | |
| | | | |
| | | | |
| | | | |
| J.P. Morgan Mid Cap/Multi-Cap Funds | |
SCHEDULE OF SHAREHOLDER EXPENSES
(Unaudited) (continued)
Hypothetical $1,000 Investment
| Beginning Account Value January 1, 2023 | Ending Account Value June 30, 2023 | Expenses Paid During the Period* | |
JPMorgan Mid Cap Value Fund (continued) | | | | |
| | | | |
| | | | |
| | | | |
| | | | |
| | | | |
| | | | |
| | | | |
| | | | |
| | | | |
| | | | |
| | | | |
| | | | |
| | | | |
| | | | |
| | | | |
| | | | |
| | | | |
| | | | |
| | | | |
| | | | |
| | | | |
JPMorgan Value Advantage Fund | | | | |
| | | | |
| | | | |
| | | | |
| | | | |
| | | | |
| | | | |
| | | | |
| | | | |
| | | | |
| | | | |
| | | | |
| | | | |
| | | | |
| | | | |
| | | | |
| | | | |
| | | | |
| | | | |
| | | | |
| | | | |
| | | | |
| | | | |
| | | | |
| | | | |
| | | | |
| | | | |
| | | | |
|
| Expenses are equal to each Class’ respective annualized net expense ratio, multiplied by the average account value over the period, multiplied by 181/365 (to reflect the one-half year period). |
| J.P. Morgan Mid Cap/Multi-Cap Funds | |
LIQUIDITY RISK MANAGEMENT PROGRAM
(Unaudited)
Each of the Funds covered in this report has adopted the J.P. Morgan Funds and J.P. Morgan Exchange-Traded Funds Amended and Restated Liquidity Risk Management Program (the “Program”) under Rule 22e-4 under the Investment Company Act of 1940, as amended (the “Liquidity Rule”). The Program seeks to assess, manage and review each Fund’s Liquidity Risk. “Liquidity Risk” is defined as the risk that a fund could not meet requests to redeem shares issued by the fund without significant dilution of remaining investors’ interests in the fund. Pursuant to an exemptive order (the “Exemptive Order”) from the Securities and Exchange Commission, the Program permits the Funds to use liquidity definitions and classification methodologies that differ from the requirements under the Liquidity Rule in some respects. Among other things, the Liquidity Rule requires that a written report be provided to the Board of Trustees (the “Board”) on an annual basis that addresses the operation of the Program and assesses the adequacy and effectiveness of its implementation, including the operation of any Highly Liquid Investment Minimum (“HLIM”), where applicable, and any material changes to the Program.
The Board has appointed J.P. Morgan Asset Management’s Liquidity Risk Forum to be the program administrator for the Program (the “Program Administrator”). In addition to regular reporting at each of its quarterly meetings, on February 7, 2023, the Board reviewed the Program Administrator’s annual written report (the ���Report”) concerning the operation of the Program for the period from January 1, 2022 through December 31, 2022 (the “Program Reporting Period”). The Report addressed the operation of the Program and assessed its adequacy and effectiveness of implementation, including, where applicable, the operation of a Fund’s HLIM. There were no material changes to the Program during the Program Reporting Period.
The Report summarized the operation of the Program and the information and factors considered by the Program Administrator in assessing whether the Program has been adequately and effectively implemented with respect to each Fund. Such information and factors included, among other things: (1) the liquidity risk framework used to assess, manage, and periodically review each Fund’s Liquidity Risk and the results of this assessment; (2) the methodology and inputs for classifying the investments of a Fund into one of the required liquidity categories that reflect an estimate of the liquidity of those investments under current market conditions; (3) whether a Fund invested primarily in “Highly Liquid Investments” (as defined or modified under the Program), as well as whether an HLIM should be established for a Fund (and, for Funds that have adopted an HLIM, whether the HLIM continues to be appropriate or whether a Fund has invested below its HLIM) and the procedures for monitoring for any HLIM; (4) whether a Fund invested more than 15% of its assets in “Illiquid Investments” (as defined or modified under the Program) and the procedures for monitoring for this limit; and (5) specific liquidity events arising during the Program Reporting Period. The Report further summarized the conditions of the Exemptive Order and whether all applicable Funds were in compliance with the terms of the Exemptive Order.
Based on this review, the Report concluded that: (1) the Program continues to be reasonably designed to effectively assess and manage each Fund’s Liquidity Risk; and (2) the Program has been adequately and effectively implemented with respect to each Fund during the Program Reporting Period.
| J.P. Morgan Mid Cap/Multi-Cap Funds | |
TAX LETTER
(Unaudited)
(Dollar values in thousands)
Certain tax information for the J.P. Morgan Funds is required to be provided to shareholders based upon the Funds' income and distributions for the taxable year ended June 30, 2023. The information and distributions reported in this letter may differ from the information and taxable distributions reported to the shareholders for the calendar year ending December 31, 2023. The information necessary to complete your income tax returns for the calendar year ending December 31, 2023 will be provided under separate cover.
Dividends Received Deduction (DRD)
Each Fund listed below had the following percentage, or maximum allowable percentage, of ordinary income distributions eligible for the dividends received deduction for corporate shareholders for the fiscal year ended June 30, 2023:
| Dividends
Received
Deduction |
JPMorgan Mid Cap Equity Fund | |
JPMorgan Mid Cap Value Fund | |
JPMorgan Value Advantage Fund | |
Long Term Capital Gain
Each Fund listed below distributed the following amount, or maximum allowable amount, of long-term capital gain dividends for the fiscal year ended June 30, 2023:
| Long-Term
Capital Gain
Distribution |
JPMorgan Growth Advantage Fund | |
JPMorgan Mid Cap Equity Fund | |
JPMorgan Mid Cap Growth Fund | |
JPMorgan Mid Cap Value Fund | |
JPMorgan Value Advantage Fund | |
Qualified Dividend Income (QDI)
Each Fund listed below had the following amount, or maximum allowable amount, of ordinary income distributions treated as qualified dividends for the fiscal year ended June 30, 2023:
| |
JPMorgan Mid Cap Equity Fund | |
JPMorgan Mid Cap Value Fund | |
JPMorgan Value Advantage Fund | |
Section 199A Income
The following Funds had the following amount, or maximum allowable amount, of ordinary income distributions treated as 199A dividends for the fiscal year ended June 30, 2022.
| |
JPMorgan Mid Cap Value Fund | |
| J.P. Morgan Mid Cap/Multi-Cap Funds | |
| WHAT DOES J.P. MORGAN FUNDS DO WITH YOUR PERSONAL INFORMATION? |
| Financial companies choose how they share your personal information. Federal law gives consumers the right to limit some but not all sharing. Federal law also requires us to tell you how we collect, share, and protect your personal information. Please read this notice carefully to understand what we do. |
| The types of personal information we collect and share depend on the product or service you have with us. This information can include: |
| ○Social Security number and account balances |
| ○transaction history and account transactions |
| ○checking account information and wire transfer instructions |
| When you are no longer our customer, we continue to share your information as described in this notice. |
| All financial companies need to share customers’ personal information to run their everyday business. In the section below, we list the reasons financial companies can share their customers’ personal information; the reasons J.P. Morgan Funds chooses to share; and whether you can limit this sharing. |
Reasons we can share your personal information | Does J.P. Morgan
Funds share? | Can you limit this
sharing? |
For our everyday business purposes — such as to process your transactions, maintain your account(s), respond to court orders and legal investigations, or report to credit bureaus | | |
For marketing purposes — to offer our products and services to you | | |
For joint marketing with other financial companies | | |
For our affiliates’ everyday business purposes — information about your transactions and experiences | | |
For our affiliates’ everyday business purposes — information about your creditworthiness | | |
For nonaffiliates to market to you | | |
Questions? Call 1-800-480-4111 or go to www.jpmorganfunds.com | |
|
Who is providing this notice? | |
|
How does J.P. Morgan Funds protect my personal information? | To protect your personal information from unauthorized access and use, we use security measures that comply with federal law. These measures include computer safeguards and secured files and buildings. We authorize our employees to access your information only when they need it to do their work and we require companies that work for us to protect your information. |
|
How does J.P. Morgan Funds collect my personal information? | We collect your personal information, for example, when you: |
○open an account or provide contact information |
○give us your account information or pay us by check |
|
We also collect your personal information from others, such as credit bureaus, affiliates and other companies. |
|
Why can’t I limit all sharing? | Federal law gives you the right to limit only: |
○sharing for affiliates’ everyday business purposes – information about your creditworthiness |
○affiliates from using your information to market to you |
○sharing for nonaffiliates to market to you |
State laws and individual companies may give you additional rights to limit sharing. |
|
| Companies related by common ownership or control. They can be financial and nonfinancial companies. |
| ○J.P. Morgan Funds does not share with our affiliates. |
|
| Companies not related by common ownership or control. They can be financial and nonfinancial companies. |
| ○J.P. Morgan Funds does not share with nonaffiliates so they can market to you. |
|
| A formal agreement between nonaffiliated financial companies that together market financial products or services to you. |
| ○J.P. Morgan Funds doesn’t jointly market. |
THIS PAGE IS INTENTIONALLY LEFT BLANK
THIS PAGE IS INTENTIONALLY LEFT BLANK
J.P. Morgan Funds are distributed by JPMorgan Distribution Services, Inc., which is an affiliate of JPMorgan Chase & Co. Affiliates of JPMorgan Chase & Co. receive fees for providing various services to the Funds.
Contact JPMorgan Distribution Services, Inc. at 1-800-480-4111 for a fund prospectus. You can also visit us at www.jpmorganfunds.com. Investors should carefully consider the investment objectives and risk as well as charges and expenses of the mutual fund before investing. The prospectus contains this and other information about the mutual fund. Read the prospectus carefully before investing.
Investors may obtain information about the Securities Investor Protection Corporation (SIPC), including the SIPC brochure, by visiting www.sipc.org or by calling SIPC at 202-371-8300.
Each Fund files a complete schedule of its fund holdings for the first and third quarters of its fiscal year with the SEC as an exhibit to its report on Form N-PORT. The Funds' Form N-PORT reports are available on the SEC’s website at http://www.sec.gov. Each Fund's quarterly holdings can be found by visiting the J.P. Morgan Funds’ website at www.jpmorganfunds.com.
A description of each Fund's policies and procedures with respect to the disclosure of each Fund's holdings is available in the prospectuses and Statement of Additional Information.
A copy of proxy policies and procedures is available without charge upon request by calling 1-800-480-4111 and on the Funds' website at www.jpmorganfunds.com. A description of such policies and procedures is on the SEC’s website at www.sec.gov. The Trustees have delegated the authority to vote proxies for securities owned by the Funds to the Adviser. A copy of the Funds' voting record for the most recent 12-month period ended June 30 is available on the SEC’s website at www.sec.gov or at the Funds' website at www.jpmorganfunds.com no later than August 31 of each year. The Funds' proxy voting record will include, among other things, a brief description of the matter voted on for each fund security, and will state how each vote was cast, for example, for or against the proposal.
J.P. Morgan Asset Management is the brand name for the asset management business of JPMorgan Chase & Co. and its affiliates worldwide.
© JPMorgan Chase & Co., 2023. All rights reserved. June 2023.
AN-MC-623
Annual Report
J.P. Morgan Large Cap Funds
June 30, 2023
JPMorgan Equity Income Fund |
JPMorgan Equity Index Fund |
JPMorgan Equity Premium Income Fund |
JPMorgan Hedged Equity Fund |
JPMorgan Hedged Equity 2 Fund |
JPMorgan Hedged Equity 3 Fund |
JPMorgan Large Cap Growth Fund |
JPMorgan Large Cap Value Fund |
JPMorgan U.S. Applied Data Science Value Fund |
JPMorgan U.S. Equity Fund |
JPMorgan U.S. GARP Equity Fund |
JPMorgan U.S. Large Cap Core Plus Fund |
JPMorgan U.S. Research Enhanced Equity Fund |
JPMorgan U.S. Sustainable Leaders Fund |
|
CONTENTS
Investments in a Fund are not deposits or obligations of, or guaranteed or endorsed by, any bank and are not insured or guaranteed by the FDIC, the Federal Reserve Board or any other government agency. You could lose money if you sell when a Fund’s share price is lower than when you invested.
Past performance is no guarantee of future performance. The general market views expressed in this report are opinions based on market and other conditions through the end of the reporting period and are subject to change without notice. These views are not intended to predict the future performance of a Fund or the securities markets.
Prospective investors should refer to the Funds’ prospectuses for a discussion of the Funds’ investment objectives, strategies and risks. Call J.P. Morgan Funds Service Center at 1-800-480-4111 for a prospectus containing more complete information about a Fund, including management fees and other expenses. Please read it carefully before investing.
Letter to Shareholders
August 11, 2023 (Unaudited)
Dear Shareholder,
Equity markets largely delivered solid returns for the twelve months ended June 30, 2023 on the back of buoyant corporate earnings, continued economic growth and receding inflationary pressures. Even as the U.S. Federal Reserve raised interest rates in an effort to cool the economy, the unemployment rate remained below 4% and consumer and business spending was generally higher than many economists expected.
|
“Equity markets delivered strong returns during the first half of 2023, with investors who remained fully invested likely benefitting. Going forward, we believe investors may be best served by maintaining a long-term view and holding a well-diversified portfolio.” — Brian S. Shlissel
|
Among financial markets, the performance of leading equity indexes was mixed through the second half of 2022. However, the S&P 500 Index generated positive performance every month except February in the first half of 2023. Large cap growth stocks generally outperformed other sectors of the market for the twelve-months ended June 30, 2023, partly due to investor demand for shares of large information technology companies. Leading mid cap and small cap equity indexes – both growth and value - posted positive performance for the period. Notably, the collapse of three U.S. regional banks in March 2023 put pressure on equities in the broader financial sector but the responses by multiple U.S. regulatory agencies as well as leading central banks appear to have limited further volatility in the banking industry.
With the exception of its June 2023 meeting, the U.S. Federal Reserve (the “Fed”) raised benchmark interest rates at 10 consecutive meetings since commencing its tightening monetary policy in mid-March 2022, and subsequently raised rates again in July 2023. Meanwhile, U.S. inflation, as measured by the Consumer Price Index, fell from 40-year highs in mid-2022 to 3.0% in June 2023. U.S. gross domestic product (GDP) remained positive throughout the 12-month period and even rebounded to an annualized rate of 2.4% in the second quarter of 2023 from 2.0% in the first quarter. While the overall
trend in consumer spending was downward, consumption was better than economists generally expected and business fixed investment in equipment, facilities and software in the second quarter of 2023 increased at the fastest pace since the start of 2022.
Though inflation remained above the Fed’s stated target of 2% annual growth during the twelve-month period, the declining trend in price growth may allow the Fed to end its policy tightening sooner than expected. Moreover, the resiliency of the U.S. economy in the face of the highest interest rates since 2001 could allow the economy to cool without GDP tipping into negative territory or leading to wide-spread job losses.
Certainly, there are factors that remain the focus of investor concerns. The war in Ukraine has continued, without demonstrative progress toward an eventual peace settlement or even a ceasefire. Elsewhere, China’s economy is experiencing weak growth and record high unemployment, and falling prices have raised economists’ worries about the potential for a deflationary spiral in the world’s second largest economy. In the U.S., the run-up to the 2024 presidential election has the potential to increase global political and economic uncertainty.
Equity markets delivered strong returns during the first half of 2023, with investors who remained fully invested likely benefitting. Going forward, we believe investors may be best served by maintaining a long-term view and holding a well-diversified portfolio. Our suite of investment solutions seeks to provide investors with ability to build durable portfolios that can meet their financial goals.
Sincerely,
Brian S. Shlissel
President, J.P. Morgan Funds
J.P. Morgan Asset Management
1-800-480-4111 or www.jpmorganfunds.com for more information
| J.P. Morgan Large Cap Funds | |
J.P. Morgan Large Cap Funds
MARKET OVERVIEW
TWELVE MONTHS ENDED June 30, 2023 (Unaudited)
Equity markets largely generated positive returns for the twelve-month period as consumer spending, manufacturing and corporate earnings remained resilient in the face of rising interest rates and slowing economic growth. While leading equity indexes were mixed on a month-to-month basis, the overall trend was toward a rebound from the sell-off that marked the first half of 2022.
Following a sharp sell-off in August and September 2022 that coincided with U.S. Federal Reserve policy guidance on further interest rate increases, equity prices largely stabilized. Corporate earnings for both the second and third quarters of 2022 were generally better than expected given a cooling economy and slowing consumer spending. By the start of 2023, economic data showed some inflationary pressures had eased.
Meanwhile, leading central banks largely continued to raise interest rates during the twelve-month period. Notably, the
European Central Bank initiated its monetary tightening policy in September 2022, with its first rate increase in eleven years and the largest increase in the bank’s history. The U.S. Federal Reserve declined to raise interest rates at its June 2023 meeting, though it stated it would raise rates further in 2023 as needed.
While financial market volatility receded from 2022 levels, it remained elevated in the face of investor uncertainty about interest rates. In March 2023, the financial sector was roiled by the failures of Silicon Valley Bank and First Republic Bank in the U.S., and Credit Suisse Group AG in Switzerland. In each instance, government regulators moved to prevent further contagion within the financials sector.
Within U.S. equity markets, large cap and mid cap stock generally outperformed small cap stocks and growth stocks outperformed value stocks.
| J.P. Morgan Large Cap Funds | |
JPMorgan Equity Income Fund
FUND COMMENTARY
TWELVE MONTHS ENDED June 30, 2023 (Unaudited)
| |
| |
| |
Net Assets as of 6/30/2023 (In Thousands) | |
INVESTMENT OBJECTIVE**
The JPMorgan Equity Income Fund (the “Fund”) seeks capital appreciation and current income.
WHAT WERE THE MAIN DRIVERS OF THE FUND’S PERFORMANCE?
The Fund’s Class I Shares underperformed the Russell 1000 Value Index (the “Benchmark”) for the twelve months ended June 30, 2023.
The Fund’s security selection in the financials and industrials sectors was a leading detractor from performance relative to the Benchmark, while the Fund’s security selection in the information technology and materials sectors was a leading contributor to relative performance.
Leading individual detractors from relative performance included the Fund’s underweight position in Meta Platforms Inc. and its overweight positions in Advance Auto Parts Inc. and Bristol-Meyers Squibb Co. Shares of Meta Platforms, operator of Facebook and other social media businesses that was not held in the Fund, rose amid investor demand for large cap technology stocks during the second half of the period. Shares of Advance Auto Parts, an automotive parts and services chain, fell sharply in May 2023 after the company reported lower-than-expected earnings and revenue for the first quarter of 2023, lowered its forecast for earnings and reduced its quarterly dividend. Shares of Bristol-Myers Squibb, a pharmaceuticals manufacturer, fell amid lower-than-expected revenue for the first quarter of 2023 and investor expectations for lower drug prices under new Medicare program rules.
Leading individual contributors to relative performance included the Fund’s out-of-Benchmark positions in TJX Cos. and NXP Semiconductors NV, and its overweight position in Analog Devices Inc. Shares of TJX, an operator of discount retail apparel and home products chains, rose after reporting consecutive quarters of better-than-expected earnings or revenues and amid investor expectations that lower-cost retailers would have an advantage in an inflationary economy. Shares of NXP Semiconductors, a semiconductor manufacturer, rose after the company reported better-than-expected earnings and revenue for the first quarter of 2023. Shares of Analog Devices, a semiconductor manufacturer, rose after the company reported better-than-expected earnings and revenue for its fiscal second quarter.
HOW WAS THE FUND POSITIONED?
The Fund’s portfolio managers’ focus remained on stock selection, as they believed that quality companies trading at attractive valuations had the greatest potential to outperform in the long term. As the Fund aimed to purchase stocks with above average dividend yields, the research process seeks to identify companies with predictable and durable business models deemed capable of generating sustainable free cash
flow.
TOP TEN HOLDINGS OF THE
PORTFOLIO AS OF June 30, 2023 | PERCENT OF
TOTAL
INVESTMENTS |
| | |
| | |
| Raytheon Technologies Corp. | |
| | |
| | |
| Air Products and Chemicals, Inc. | |
| | |
| | |
| Philip Morris International, Inc. | |
| | |
PORTFOLIO COMPOSITION BY SECTOR
AS OF June 30, 2023 | PERCENT OF
TOTAL
INVESTMENTS |
| |
| |
| |
| |
| |
| |
| |
| |
| |
| |
| |
| |
*
The return shown is based on net asset values calculated for shareholder transactions and may differ from the return shown in
| J.P. Morgan Large Cap Funds | |
JPMorgan Equity Income Fund
FUND COMMENTARY
TWELVE MONTHS ENDED June 30, 2023 (Unaudited) (continued)
the financial highlights, which reflects adjustments made to the net asset values in accordance with accounting principles generally accepted in the United States of America.
**
The adviser seeks to achieve the Fund’s objective. There can be no guarantee it will be achieved.
| J.P. Morgan Large Cap Funds | |
AVERAGE ANNUAL TOTAL RETURNS AS OF June 30, 2023
|
| Sales Charge for Class A Shares is 5.25%. |
| Assumes a 1% CDSC (contingent deferred sales charge) for the one year period and 0% CDSC thereafter. |
TEN YEAR FUND PERFORMANCE (6/30/13 TO 6/30/23)
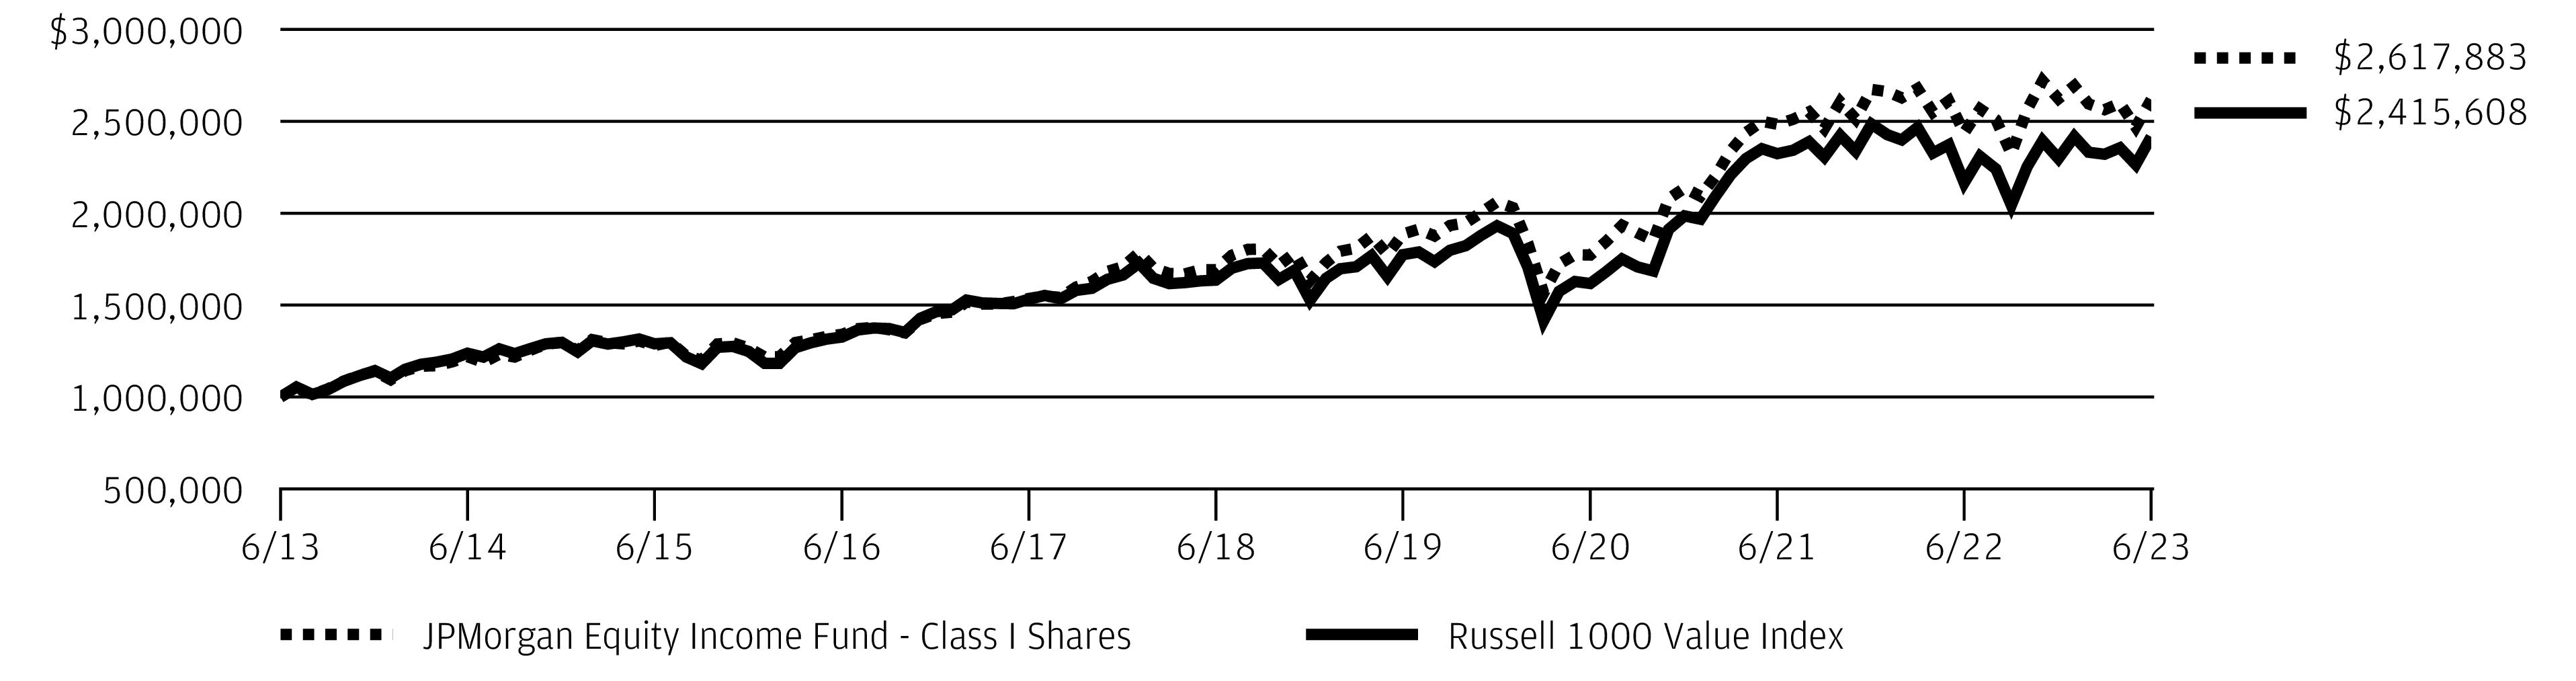
The performance quoted is past performance and is not a guarantee of future results. Mutual funds are subject to certain market risks. Investment returns and principal value of an investment will fluctuate so that an investor’s shares, when redeemed, may be worth more or less than their original cost. Current performance may be higher or lower than the performance data shown. For up-to-date month-end performance information please call 1-800-480-4111.
Returns for Class R4 Shares prior to their inception date are based on the performance of Class I Shares. The actual returns for Class R4 Shares would have been similar to those shown because Class R4 Shares had similar expenses to Class I Shares.
Returns for Class R3 Shares prior to their inception date are based on the performance of Class A Shares. The actual returns for Class R3 Shares would have been similar to those shown because Class R3 Shares currently have the same expenses as Class A Shares.
Returns for Class R6 Shares prior to their inception date are based on the performance of Class R5 Shares. The actual returns for Class R6 Shares would have been different than those shown because Class R6 Shares have different expenses than Class R5 Shares.
The graph illustrates comparative performance for $1,000,000 invested in Class I Shares of the JPMorgan Equity Income Fund and the Russell 1000 Value Index from June 30, 2013 to June 30, 2023. The performance of the Fund
assumes reinvestment of all dividends and capital gain distributions, if any, and does not include a sales charge. The performance of the Russell 1000 Value Index does not reflect the deduction of expenses or a sales charge associated with a mutual fund and has been adjusted to reflect reinvestment of all dividends and capital gain distributions of the securities included in the bench mark, if applicable. The Russell 1000 Value Index is an unmanaged index which measures the performance of those Russell 1000 companies with lower price-to-book ratios and lower forecasted growth values. Investors cannot invest directly in an index.
Class I Shares have a $1,000,000 minimum initial investment.
Fund performance may reflect the waiver of the Fund’s fees and reimbursement of expenses for certain periods. Without these waivers and reimbursements, performance would have been lower. Also, performance shown in this section does not reflect the deduction of taxes that a shareholder would pay on Fund distributions or on gains resulting from redemptions of Fund shares.
Because Class C Shares automatically convert to Class A Shares after 8 years, the 10 year average annual total return shown above for Class C reflects Class A Performance for the period after conversion.
The returns shown are based on net asset values calculated for shareholder transactions and may differ from the returns shown in the financial highlights, which reflect adjustments made to the net asset values in accordance with accounting principles generally accepted in the United States of America.
| J.P. Morgan Large Cap Funds | |
JPMorgan Equity Index Fund
FUND COMMENTARY
TWELVE MONTHS ENDED June 30, 2023 (Unaudited)
| |
| |
| |
Net Assets as of 6/30/2023 (In Thousands) | |
INVESTMENT OBJECTIVE**
The JPMorgan Equity Index Fund (the “Fund”) seeks investment results that correspond to the aggregate price and dividend performance of securities in the S&P 500 Index (the “Benchmark”).
WHAT WERE THE MAIN DRIVERS OF THE FUND’S PERFORMANCE?
For the twelve months ended June 30, 2023, the Fund’s Class I Shares largely performed in line with the Benchmark, before considering the effect of Fund fees and expenses. This was consistent with the Fund’s investment objective and indexing strategy, as the Fund looks to generate returns that are comparable to those of the Benchmark.
Leading U.S. equity indexes provided positive returns for the period, amid cooling inflation, buoyant consumer demand and low unemployment. For the twelve-month period, the information technology and consumer discretionary sectors were leading contributors to performance for the Fund and the Benchmark, while the utilities and real estate sectors were the sole detractors from performance.
HOW WAS THE FUND POSITIONED?
Regardless of the market outlook, the Fund was managed in strict conformity with a full index replication strategy and aimed to hold the same stocks in nearly the same proportions
as those found in the Benchmark.
TOP TEN HOLDINGS OF THE
PORTFOLIO AS OF June 30, 2023 | PERCENT OF
TOTAL
INVESTMENTS |
| | |
| | |
| | |
| | |
| | |
| | |
| Meta Platforms, Inc., Class A | |
| | |
| Berkshire Hathaway, Inc., Class B | |
| | |
PORTFOLIO COMPOSITION BY SECTOR
AS OF June 30, 2023 | PERCENT OF
TOTAL
INVESTMENTS |
| |
| |
| |
| |
| |
| |
| |
| |
| |
| |
| |
| |
*
The return shown is based on net asset values calculated for shareholder transactions and may differ from the return shown in the financial highlights, which reflects adjustments made to the net asset values in accordance with accounting principles generally accepted in the United States of America.
**
The adviser seeks to achieve the Fund’s objective. There can be no guarantee it will be achieved.
| J.P. Morgan Large Cap Funds | |
AVERAGE ANNUAL TOTAL RETURNS AS OF June 30, 2023
|
| Sales Charge for Class A Shares is 5.25%. |
| Assumes a 1% CDSC (contingent deferred sales charge) for the one year period and 0% CDSC thereafter. |
TEN YEAR FUND PERFORMANCE (6/30/13 TO 6/30/23)
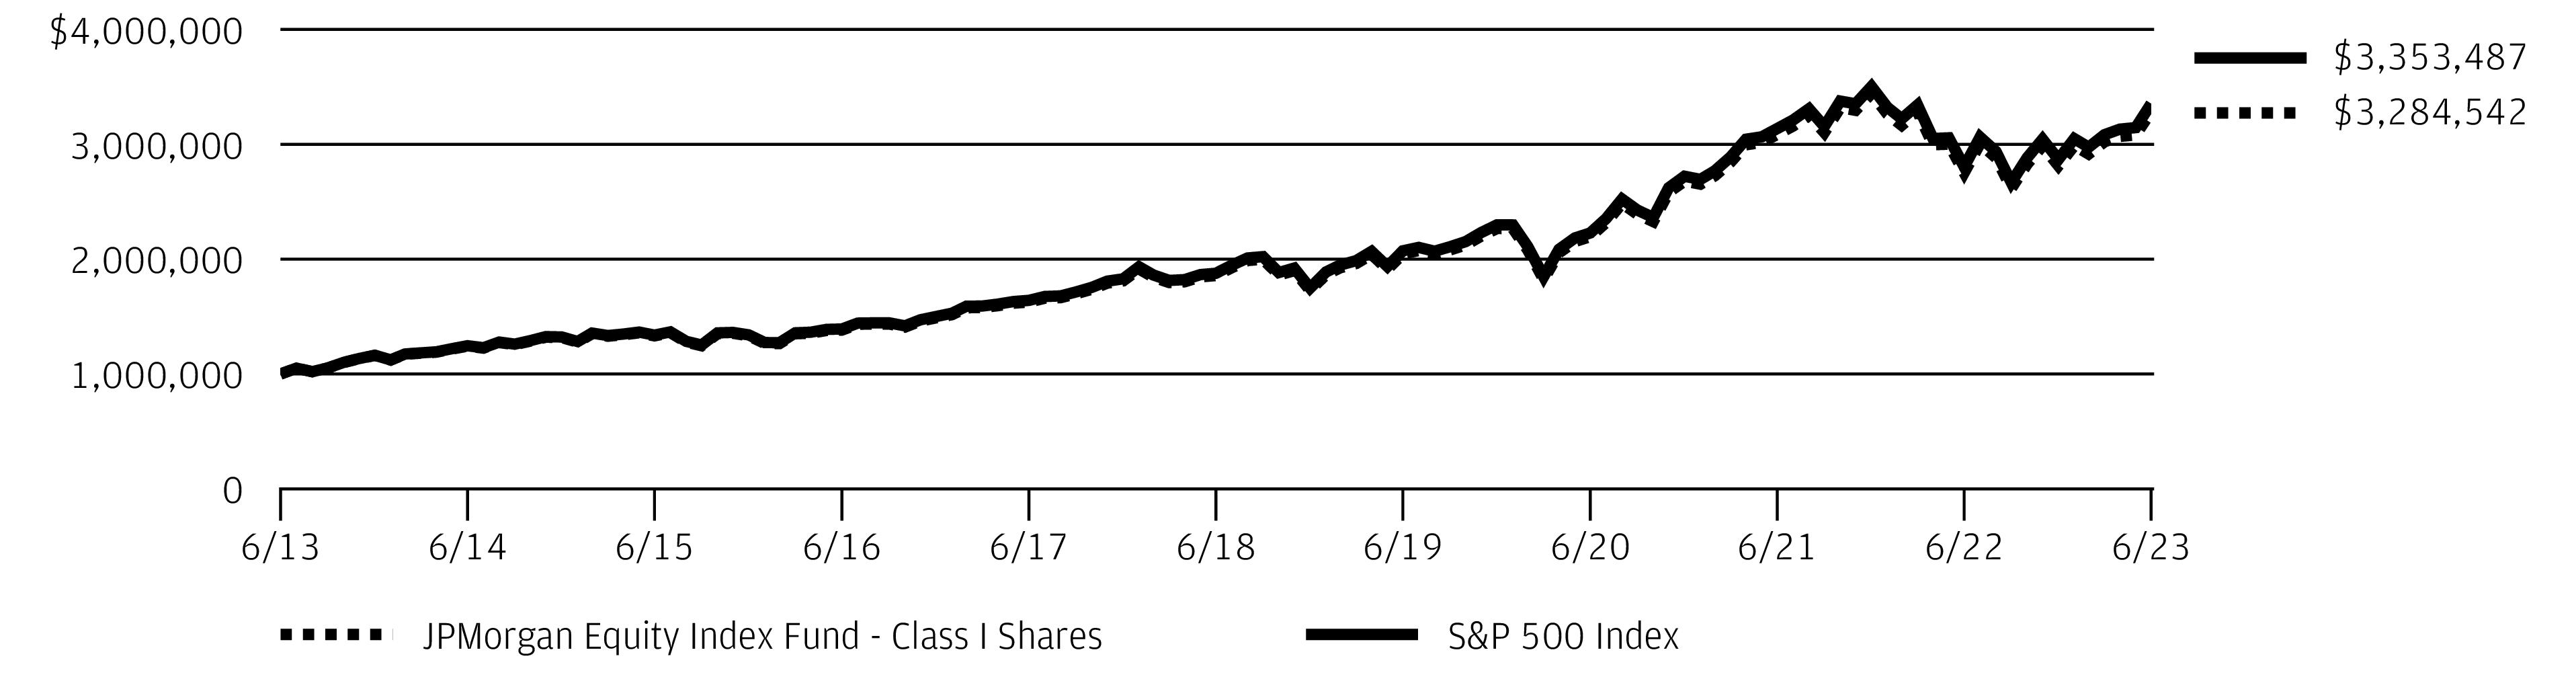
The performance quoted is past performance and is not a guarantee of future results. Mutual funds are subject to certain market risks. Investment returns and principal value of an investment will fluctuate so that an investor’s shares, when redeemed, may be worth more or less than their original cost. Current performance may be higher or lower than the performance data shown. For up-to-date month-end performance information please call 1-800-480-4111.
Returns for Class R6 Shares prior to their inception date are based on the performance of Class I Shares. The actual returns for Class R6 Shares would have been different than those shown because Class R6 Shares have different expenses than Class I Shares.
The graph illustrates comparative performance for $1,000,000 invested in Class I Shares of the JPMorgan Equity Index Fund and the S&P 500 Index from June 30, 2013 to June 30, 2023. The performance of the Fund assumes reinvestment of all dividends and capital gain distributions, if any, and does not include a sales charge. The performance of the S&P 500 Index does not reflect the deduction of expenses or a sales charge associated with a mutual fund and has been adjusted to reflect reinvestment of all dividends and capital gain distributions of the securities included in the benchmark, if applicable. The S&P
500 Index is an unmanaged index generally representative of the performance of large companies in the U.S. stock market. Investors cannot invest directly in an index.
Class I Shares have a $1,000,000 minimum initial investment.
Fund performance may reflect the waiver of the Fund’s fees and reimbursement of expenses for certain periods. Without these waivers and reimbursements, performance would have been lower. Also, performance shown in this section does not reflect the deduction of taxes that a shareholder would pay on Fund distributions or on gains resulting from redemptions of Fund shares.
Because Class C Shares automatically convert to Class A Shares after 8 years, the 10 year average annual total return shown above for Class C reflects Class A Performance for the period after conversion.
The returns shown are based on net asset values calculated for shareholder transactions and may differ from the returns shown in the financial highlights, which reflect adjustments made to the net asset values in accordance with accounting principles generally accepted in the United States of America.
| J.P. Morgan Large Cap Funds | |
JPMorgan Equity Premium Income Fund
FUND COMMENTARY
TWELVE MONTHS ENDED June 30, 2023 (Unaudited)
| |
| |
| |
ICE BofAML 3-Month US Treasury Bill Index | |
Net Assets as of 6/30/2023 (In Thousands) | |
INVESTMENT OBJECTIVE**
The JPMorgan Equity Premium Income Fund (the “Fund”) seeks current income while maintaining prospects for capital appreciation.
WHAT WERE THE MAIN DRIVERS OF THE FUND’S PERFORMANCE?
The Fund’s Class I Shares underperformed the S&P 500 Index (the “Benchmark”) and outperformed the ICE BofA 3-Month U.S. Treasury Bill Index for the twelve months ended June 30, 2023.
The Fund’s underweight position and security selection in the information technology sector and its overweight position in the utilities sector were leading detractors from performance relative to the Benchmark, while the Fund’s security selection in the materials and consumer discretionary sectors was a leading contributor to relative performance.
Leading individual detractors from performance relative to the Benchmark included the Fund’s underweight position in Nvidia Corp., and its overweight positions in Texas Instruments Inc. and U.S. Bancorp. Shares of Nvidia, a semiconductor manufacturer not held in the Fund, rose amid investor expectations for rising demand for the company’s artificial intelligence technology. Shares of Texas Instruments, a semiconductor manufacturer, fell after the company issued a weaker-than-expected earnings forecast for the second quarter of 2023. Shares of U.S. Bancorp, a diversified bank based in Minneapolis, Minn., fell amid a broad decline in regional banks following the collapse of Silicon Valley Bank and First Republic Bank in early March 2023.
Leading individual contributors to performance relative to the Benchmark included the Fund’s underweight position in Pfizer Inc. and its overweight positions in Old Dominion Freight Line Inc. and Eaton Corp. Shares of Pfizer, a pharmaceuticals manufacturer not held in the fund, fell amid investor concerns that the U.S. Federal Trade Commission could seek to block the company’s planned $43 billion acquisition of Seagen Inc. and investor concerns about lower drug prices under new U.S. Medicare program rules. Shares of Old Dominion, a trucking and logistics company, rose after the company reported better-than-expected earnings and revenue for 2022 and amid investor expectations that the company would benefit from a potential bankruptcy filing by rival trucking company
Yellow Corp. Shares of Eaton, an electrical components and equipment manufacturer, rose amid consecutive quarters of better-than-expected earnings and revenue.
HOW WAS THE FUND POSITIONED?
The Fund seeks to generate income through a combination of selling options, investing in large cap stocks and delivering monthly income from associated option premiums and stock dividends. The Fund’s portfolio managers employed a proprietary research process designed to identify what they believed were overvalued and undervalued stocks with
attractive risk/return characteristics.
TOP TEN HOLDINGS OF THE
PORTFOLIO AS OF June 30, 2023 | PERCENT OF
TOTAL
INVESTMENTS |
| | |
| | |
| | |
| Mastercard, Inc., Class A | |
| | |
| | |
| | |
| | |
| | |
| | |
PORTFOLIO COMPOSITION BY SECTOR
AS OF June 30, 2023 | PERCENT OF
TOTAL
INVESTMENTS |
| |
| |
| |
| |
| |
| |
| |
| |
| |
| |
| |
| |
| |
| J.P. Morgan Large Cap Funds | |
*
The return shown is based on net asset values calculated for shareholder transactions and may differ from the return shown in the financial highlights, which reflects adjustments made to the net asset values in accordance with accounting principles generally accepted in the United States of America.
**
The adviser seeks to achieve the Fund’s objective. There can be no guarantee it will be achieved.
***
Equity-Linked Notes that are linked to the S&P 500 Index.
| J.P. Morgan Large Cap Funds | |
JPMorgan Equity Premium Income Fund
FUND COMMENTARY
TWELVE MONTHS ENDED June 30, 2023 (Unaudited) (continued)
AVERAGE ANNUAL TOTAL RETURNS AS OF June 30, 2023
|
| Sales Charge for Class A Shares is 5.25%. |
| Assumes a 1% CDSC (contingent deferred sales charge) for the one year period and 0% CDSC thereafter. |
LIFE OF FUND PERFORMANCE (8/31/18 TO 6/30/23)

The performance quoted is past performance and is not a guarantee of future results. Mutual funds are subject to certain market risks. Investment returns and principal value of an investment will fluctuate so that an investor’s shares, when redeemed, may be worth more or less than their original cost. Current performance may be higher or lower than the performance data shown. For up-to-date month-end performance information please call 1-800-480-4111.
The Fund commenced operations on August 31, 2018.
The graph illustrates comparative performance for $1,000,000 invested in Class I Shares of the JPMorgan Equity Premium Income Fund, the S&P 500 Index and the ICE BofAML 3-Month US Treasury Bill Index from August 31, 2018 to June 30, 2023. The performance of the Fund assumes reinvestment of all dividends and capital gain distributions, if any, and does not include a sales charge. The performance of the S&P 500 Index and the ICE BofAML 3-Month US Treasury Bill Index does not reflect the deduction of expenses or a sales charge associated with a mutual fund and approximates the minimum possible dividend reinvestment of the securities included in the benchmarks, if applicable. These expenses are not identical to the expenses incurred by the Fund. The S&P 500 Index is an unmanaged index generally representative of the performance of large companies in the U.S. stock market. The ICE BofAML 3-Month US Treasury Bill Index is comprised of a single issue purchased at the
beginning of the month and held for a full month. Each month the ICE BofAML 3-Month US Treasury Bill Index is rebalanced and the issue selected is the outstanding Treasury Bill that matures closest to, but not beyond, 3 months from the rebalancing date. Investors cannot invest directly in an index.
Class I Shares have a $1,000,000 minimum initial investment.
Subsequent to the inception date of the Fund and through April 7, 2019, the Fund did not experience any shareholder activity. If such shareholder activity had occurred, the Fund’s performance may have been impacted.
Fund performance may reflect the waiver of the Fund’s fees and reimbursement of expenses for certain periods since the inception date. Without these waivers and reimbursements, performance would have been lower. Also, performance shown in this section does not reflect the deduction of taxes that a shareholder would pay on Fund distributions or on gains resulting from redemptions of Fund shares.
The returns shown are based on net asset values calculated for shareholder transactions and may differ from the returns shown in the financial highlights, which reflect adjustments made to the net asset values in accordance with accounting principles generally accepted in the United States of America.
| J.P. Morgan Large Cap Funds | |
JPMorgan Hedged Equity Fund
FUND COMMENTARY
TWELVE MONTHS ENDED June 30, 2023 (Unaudited)
| |
| |
| |
Net Assets as of 6/30/2023 (In Thousands) | |
INVESTMENT OBJECTIVE**
The JPMorgan Hedged Equity Fund (the “Fund”) seeks to provide capital appreciation.
WHAT WERE THE MAIN DRIVERS OF THE FUND’S PERFORMANCE?
The Fund’s Class I Shares underperformed the S&P 500 Index (the “Benchmark”) for the twelve months ended June 30, 2023.
The Fund’s security selection in the financials and the health services & systems sectors was a leading detractor from performance relative to the Benchmark, while the Fund’s security selection in the retail and media sectors was a leading contributor to relative performance.
Leading individual detractors from relative performance included the Fund’s underweight positions in JPMorgan Chase & Co. and Nvidia Corp., and its overweight position in U.S. Bancorp. Shares of JPMorgan Chase, a banking and financial services company that the Fund is prohibited from holding because it is an affiliate, rose amid consecutive quarters of better-than-expected earnings and revenue and investor preference for large, diversified financial services companies amid volatility in the banking sector in the first half of 2023. Shares of Nvidia, a semiconductor manufacturer , rose amid investor expectations for rising demand for the company’s artificial intelligence technology. Shares of U.S. Bancorp, a diversified bank based in Minneapolis, Minn., fell amid a broad decline in regional banks following the collapse of Silicon Valley Bank and First Republic Bank in early March 2023.
Leading individual contributors to relative performance included the Fund’s underweight positions in Pfizer Inc. and Intel Corp., and its overweight position in Chipotle Mexican Grill Inc. Shares of Pfizer, a pharmaceuticals manufacturer not held in the fund, fell amid investor concerns that the U.S. Federal Trade Commission could seek to block the company’s planned $43 billion acquisition of Seagen Inc. and investor concerns about lower drug prices under new U.S. Medicare program rules. Shares of Intel, a semiconductor manufacturer not held in the Fund, fell after the company reported lower-than-expected results for the fourth quarter and full year 2022. Shares of Chipotle Mexican Grill, a fast-food restaurant chain, rose after the company reported better-than-expected earnings, revenue and comparable-store sales for the first quarter of 2023.
HOW WAS THE FUND POSITIONED?
The Fund used an enhanced index strategy that invests primarily in common stocks of large capitalization U.S. companies, while systematically purchasing and selling exchange-traded index put options and selling exchange-traded index call options. The options overlay is known as a Put/Spread Collar strategy. The combination of the diversified portfolio of equity securities, downside protection from index put options and income from index call options provided the Fund with a portion of the returns associated with equity market investments while exposing the Fund to less risk than
traditional long-only equity strategies.
TOP TEN HOLDINGS OF THE
PORTFOLIO AS OF June 30, 2023 | PERCENT OF
TOTAL
INVESTMENTS |
| | |
| | |
| | |
| | |
| Meta Platforms, Inc., Class A | |
| | |
| | |
| | |
| | |
| Mastercard, Inc., Class A | |
PORTFOLIO COMPOSITION BY SECTOR
AS OF June 30, 2023 | PERCENT OF
TOTAL
INVESTMENTS |
| |
| |
| |
| |
| |
| |
| |
| |
| |
| |
| |
Others (each less than 1.0%) | |
| |
| J.P. Morgan Large Cap Funds | |
JPMorgan Hedged Equity Fund
FUND COMMENTARY
TWELVE MONTHS ENDED June 30, 2023 (Unaudited) (continued)
*
The return shown is based on net asset values calculated for shareholder transactions and may differ from the return shown in the financial highlights, which reflects adjustments made to the net asset values in accordance with accounting principles generally accepted in the United States of America.
**
The adviser seeks to achieve the Fund’s objective. There can be no guarantee it will be achieved.
| J.P. Morgan Large Cap Funds | |
AVERAGE ANNUAL TOTAL RETURNS AS OF June 30, 2023
|
| Sales Charge for Class A Shares is 5.25%. |
| Assumes a 1% CDSC (contingent deferred sales charge) for the one year period and 0% CDSC thereafter. |
LIFE OF FUND PERFORMANCE (12/13/13 TO 6/30/23)
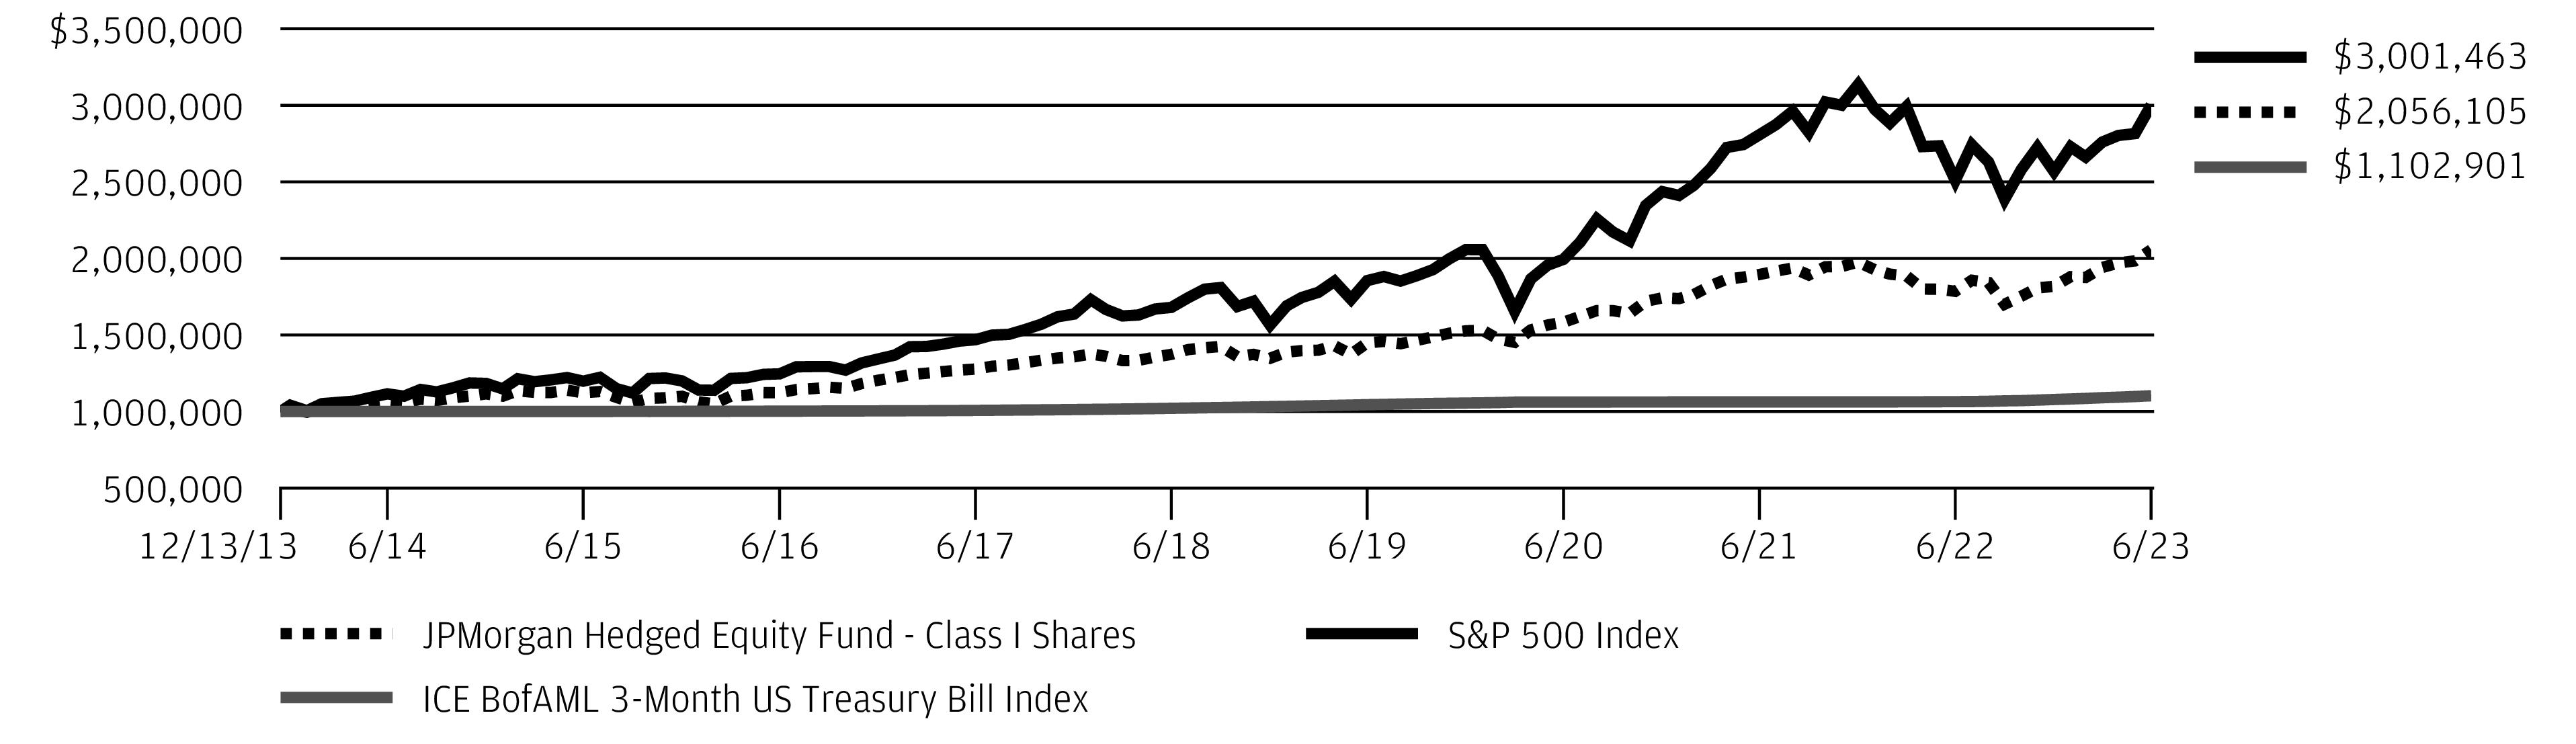
The performance quoted is past performance and is not a guarantee of future results. Mutual funds are subject to certain market risks. Investment returns and principal value of an investment will fluctuate so that an investor’s shares, when redeemed, may be worth more or less than their original cost. Current performance may be higher or lower than the performance data shown. For up-to-date month-end performance information please call 1-800-480-4111.
The Fund commenced operations on December 13, 2013.
The graph illustrates comparative performance for $1,000,000 invested in Class I Shares of the JPMorgan Hedged Equity Fund, the S&P 500 Index and the ICE BofAML 3-Month US Treasury Bill Index from December 13, 2013 to June 30, 2023. The performance of the Fund assumes reinvestment of all dividends and capital gain distributions, if any, and does not include a sales charge. The performance of the S&P 500 Index and the ICE BofAML 3-Month US Treasury Bill Index does not reflect the deduction of expenses or a sales charge associated with a mutual fund and approximates the minimum possible dividend reinvestment of the securities included in the benchmarks, if applicable. The S&P 500 Index is an unmanaged index generally representative of the performance of large companies in the U.S. stock market. The ICE BofAML 3-Month US Treasury Bill Index is comprised of a single issue purchased
at the beginning of the month and held for a full month. Each month the ICE BofAML 3-Month US Treasury Bill Index is rebalanced and the issue selected is the outstanding Treasury Bill that matures closest to, but not beyond, 3 months from the rebalancing date. Investors cannot invest directly in an index.
Class I Shares have a $1,000,000 minimum initial investment.
Subsequent to the inception date of the Fund and through May 30, 2014, the Fund did not experience any shareholder activity. If such shareholder activity had occurred, the Fund’s performance may have been impacted.
Fund performance may reflect the waiver of the Fund’s fees and reimbursement of expenses for certain periods since the inception date. Without these waivers and reimbursements, performance would have been lower. Also, performance shown in this section does not reflect the deduction of taxes that a shareholder would pay on Fund distributions or on gains resulting from redemptions of Fund shares.
The returns shown are based on net asset values calculated for shareholder transactions and may differ from the returns shown in the financial highlights, which reflect adjustments made to the net asset values in accordance with accounting principles generally accepted in the United States of America.
| J.P. Morgan Large Cap Funds | |
JPMorgan Hedged Equity 2 Fund
FUND COMMENTARY
TWELVE MONTHS ENDED June 30, 2023 (Unaudited)
| |
| |
| |
Net Assets as of 6/30/2023 (In Thousands) | |
INVESTMENT OBJECTIVE**
The JPMorgan Hedged Equity 2 Fund (the “Fund”) seeks to provide capital appreciation.
WHAT WERE THE MAIN DRIVERS OF THE FUND’S PERFORMANCE?
The Fund’s Class I Shares underperformed the S&P 500 Index (the “Benchmark”) for the twelve months ended June 30, 2023.
The Fund’s security selection in the health services & systems sector and the industrial cyclical sector was a leading detractor from performance relative to the Benchmark, while the Fund’s security selection in the retail and media sectors was a leading contributor to relative performance.
Leading individual detractors from relative performance included the Fund’s underweight positions in JPMorgan Chase & Co. and Nvidia Corp., and its overweight position U.S. Bancorp. Shares of JPMorgan Chase, a banking and financial services company that the Fund is prohibited from holding because it is an affiliate, rose amid consecutive quarters of better-than-expected earnings and revenue and investor preference for large, diversified financial services companies amid volatility in the banking sector in the first half of 2023. Shares of Nvidia, a semiconductor manufacturer , rose amid investor expectations for rising demand for the company’s artificial intelligence technology. Shares of U.S. Bancorp, a diversified bank based in Minneapolis, Minn., fell amid a broad decline in regional banks following the collapse of Silicon Valley Bank and First Republic Bank in early March 2023.
Leading individual contributors to relative performance included the Fund’s underweight positions in Pfizer Inc. and Intel Corp., and its overweight position in Chipotle Mexican Grill Inc. Shares of Pfizer, a pharmaceuticals manufacturer not held in the fund, fell amid investor concerns that the U.S. Federal Trade Commission could seek to block the company’s planned $43 billion acquisition of Seagen Inc. and investor concerns about lower drug prices under new U.S. Medicare program rules. Shares of Intel, a semiconductor manufacturer not held in the Fund, fell after the company reported lower-than-expected results for the fourth quarter and full year 2022. Shares of Chipotle Mexican Grill, a fast-food restaurant chain, rose after the company reported better-than-expected earnings, revenue and comparable-store sales for the first quarter of 2023.
HOW WAS THE FUND POSITIONED?
The Fund used an enhanced index strategy that invests primarily in common stocks of large capitalization U.S. companies, while systematically purchasing and selling exchange-traded index put options and selling exchange-traded index call options. The options overlay is known as a Put/Spread Collar strategy. The combination of the diversified portfolio of equity securities, downside protection from index put options and income from index call options provided the Fund with a portion of the returns associated with equity market investments while exposing the Fund to less risk than
traditional long-only equity strategies.
TOP TEN HOLDINGS OF THE
PORTFOLIO AS OF June 30, 2023 | PERCENT OF
TOTAL
INVESTMENTS |
| | |
| | |
| | |
| | |
| Meta Platforms, Inc., Class A | |
| | |
| | |
| | |
| | |
| Mastercard, Inc., Class A | |
PORTFOLIO COMPOSITION BY SECTOR
AS OF June 30, 2023 | PERCENT OF
TOTAL
INVESTMENTS |
| |
| |
| |
| |
| |
| |
| |
| |
| |
| |
| |
Others (each less than 1.0%) | |
| |
| J.P. Morgan Large Cap Funds | |
*
The return shown is based on net asset values calculated for shareholder transactions and may differ from the return shown in the financial highlights, which reflects adjustments made to the net asset values in accordance with accounting principles generally accepted in the United States of America.
**
The adviser seeks to achieve the Fund’s objective. There can be no guarantee it will be achieved.
| J.P. Morgan Large Cap Funds | |
JPMorgan Hedged Equity 2 Fund
FUND COMMENTARY
TWELVE MONTHS ENDED June 30, 2023 (Unaudited) (continued)
AVERAGE ANNUAL TOTAL RETURNS AS OF June 30, 2023
|
| Sales Charge for Class A Shares is 5.25%. |
| Assumes a 1% CDSC (contingent deferred sales charge) for the one year period and 0% CDSC thereafter. |
LIFE OF FUND PERFORMANCE (2/26/21 TO 6/30/23)
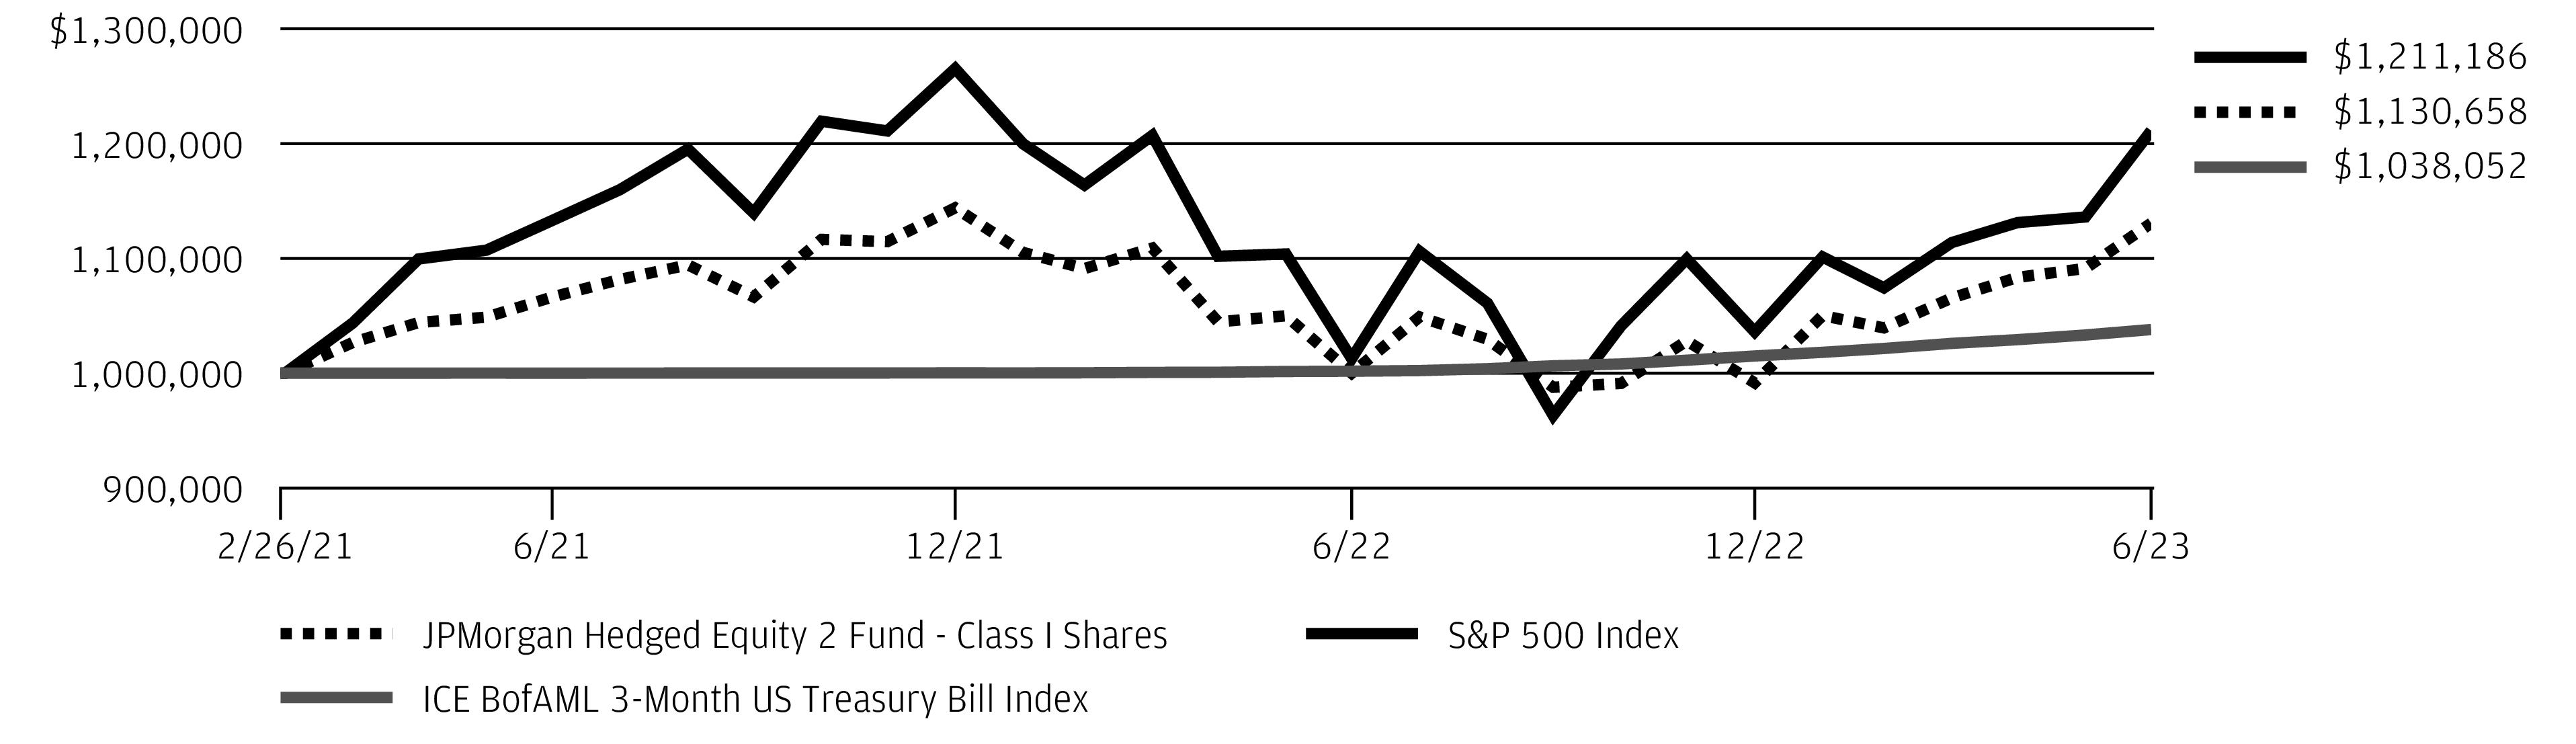
The performance quoted is past performance and is not a guarantee of future results. Mutual funds are subject to certain market risks. Investment returns and principal value of an investment will fluctuate so that an investor’s shares, when redeemed, may be worth more or less than their original cost. Current performance may be higher or lower than the performance data shown. For up-to-date month-end performance information please call 1-800-480-4111.
The Fund commenced operations on February 26, 2021.
The graph illustrates comparative performance for $1,000,000 invested in Class I Shares of the JPMorgan Hedged Equity 2 Fund and the S&P 500 Index from February 26, 2021 to June 30, 2023. The performance of the Fund assumes reinvestment of all dividends and capital gain distributions, if any, and does not include a sales charge. The performance of the S&P 500 Index does not reflect the deduction of expenses or a sales charge associated with a mutual fund and approximates the minimum possible dividend reinvestment of
the securities included in the benchmarks, if applicable. The S&P 500 Index is an unmanaged index generally representative of the performance of large companies in the U.S. stock market. Investors cannot invest directly in an index.
Class I Shares have a $1,000,000 minimum initial investment.
Fund performance may reflect the waiver of the Fund’s fees and reimbursement of expenses for certain periods since the inception date. Without these waivers and reimbursements, performance would have been lower. Also, performance shown in this section does not reflect the deduction of taxes that a shareholder would pay on Fund distributions or on gains resulting from redemptions of Fund shares.
The returns shown are based on net asset values calculated for shareholder transactions and may differ from the returns shown in the financial highlights, which reflect adjustments made to the net asset values in accordance with accounting principles generally accepted in the United States of America.
| J.P. Morgan Large Cap Funds | |
JPMorgan Hedged Equity 3 Fund
FUND COMMENTARY
TWELVE MONTHS ENDED June 30, 2023 (Unaudited)
| |
| |
| |
Net Assets as of 6/30/2023 (In Thousands) | |
INVESTMENT OBJECTIVE**
The JPMorgan Hedged Equity 3 Fund (the “Fund”) seeks to provide capital appreciation.
WHAT WERE THE MAIN DRIVERS OF THE FUND’S PERFORMANCE?
The Fund’s Class I Shares underperformed the S&P 500 Index (the “Benchmark”) for the twelve months ended June 30, 2023.
The Fund’s security selection in the financials and the health services & systems sectors was a leading detractor from performance relative to the Benchmark, while the Fund’s security selection in the retail and media sectors was a leading contributor to relative performance.
Leading individual detractors from relative performance included the Fund’s underweight positions in JPMorgan Chase & Co. and Nvidia Corp., and its overweight position in U.S. Bancorp. Shares of JPMorgan Chase, a banking and financial services company that the Fund is prohibited from holding because it is an affiliate, rose amid consecutive quarters of better-than-expected earnings and revenue and investor preference for large, diversified financial services companies amid volatility in the banking sector in the first half of 2023. Shares of Nvidia, a semiconductor manufacturer , rose amid investor expectations for rising demand for the company’s artificial intelligence technology. Shares of U.S. Bancorp, a diversified bank based in Minneapolis, Minn., fell amid a broad decline in regional banks following the collapse of Silicon Valley Bank and First Republic Bank in early March 2023.
Leading individual contributors to relative performance included the Fund’s underweight positions in Pfizer Inc. and Intel Corp., and its overweight position in Chipotle Mexican Grill Inc. Shares of Pfizer, a pharmaceuticals manufacturer not held in the fund, fell amid investor concerns that the U.S. Federal Trade Commission could seek to block the company’s planned $43 billion acquisition of Seagen Inc. and investor concerns about lower drug prices under new U.S. Medicare program rules. Shares of Intel, a semiconductor manufacturer not held in the Fund, fell after the company reported lower-than-expected results for the fourth quarter and full year 2022. Shares of Chipotle Mexican Grill, a fast-food restaurant chain, rose after the company reported better-than-expected earnings, revenue and comparable-store sales for the first quarter of 2023.
HOW WAS THE FUND POSITIONED?
The Fund used an enhanced index strategy that invests primarily in common stocks of large capitalization U.S. companies, while systematically purchasing and selling exchange-traded index put options and selling exchange-traded index call options. The options overlay is known as a Put/Spread Collar strategy. The combination of the diversified portfolio of equity securities, downside protection from index put options and income from index call options provided the Fund with a portion of the returns associated with equity market investments while exposing the Fund to less risk than
traditional long-only equity strategies.
TOP TEN HOLDINGS OF THE
PORTFOLIO AS OF June 30, 2023 | PERCENT OF
TOTAL
INVESTMENTS |
| | |
| | |
| | |
| | |
| Meta Platforms, Inc., Class A | |
| | |
| | |
| | |
| | |
| Mastercard, Inc., Class A | |
PORTFOLIO COMPOSITION BY SECTOR
AS OF June 30, 2023 | PERCENT OF
TOTAL
INVESTMENTS |
| |
| |
| |
| |
| |
| |
| |
| |
| |
| |
| |
Others (each less than 1.0%) | |
| |
| J.P. Morgan Large Cap Funds | |
JPMorgan Hedged Equity 3 Fund
FUND COMMENTARY
TWELVE MONTHS ENDED June 30, 2023 (Unaudited) (continued)
*
The return shown is based on net asset values calculated for shareholder transactions and may differ from the return shown in the financial highlights, which reflects adjustments made to the net asset values in accordance with accounting principles generally accepted in the United States of America.
**
The adviser seeks to achieve the Fund’s objective. There can be no guarantee it will be achieved.
| J.P. Morgan Large Cap Funds | |
AVERAGE ANNUAL TOTAL RETURNS AS OF June 30, 2023
|
| Sales Charge for Class A Shares is 5.25%. |
| Assumes a 1% CDSC (contingent deferred sales charge) for the one year period and 0% CDSC thereafter. |
LIFE OF FUND PERFORMANCE (2/26/21 TO 6/30/23)

The performance quoted is past performance and is not a guarantee of future results. Mutual funds are subject to certain market risks. Investment returns and principal value of an investment will fluctuate so that an investor’s shares, when redeemed, may be worth more or less than their original cost. Current performance may be higher or lower than the performance data shown. For up-to-date month-end performance information please call 1-800-480-4111.
The Fund commenced operations on February 26, 2021.
The graph illustrates comparative performance for $1,000,000 invested in Class I Shares of the JPMorgan Hedged Equity 3 Fund and the S&P 500 Index from February 26, 2021 to June 30, 2023. The performance of the Fund assumes reinvestment of all dividends and capital gain distributions, if any, and does not include a sales charge. The performance of the S&P 500 Index does not reflect the deduction of expenses or a sales charge associated with a mutual fund and approximates the minimum possible dividend reinvestment of
the securities included in the benchmarks, if applicable. The S&P 500 Index is an unmanaged index generally representative of the performance of large companies in the U.S. stock market. Investors cannot invest directly in an index.
Class I Shares have a $1,000,000 minimum initial investment.
Fund performance may reflect the waiver of the Fund’s fees and reimbursement of expenses for certain periods since the inception date. Without these waivers and reimbursements, performance would have been lower. Also, performance shown in this section does not reflect the deduction of taxes that a shareholder would pay on Fund distributions or on gains resulting from redemptions of Fund shares.
The returns shown are based on net asset values calculated for shareholder transactions and may differ from the returns shown in the financial highlights, which reflect adjustments made to the net asset values in accordance with accounting principles generally accepted in the United States of America.
| J.P. Morgan Large Cap Funds | |
JPMorgan Large Cap Growth Fund
FUND COMMENTARY
TWELVE MONTHS ENDED June 30, 2023 (Unaudited)
| |
| |
Russell 1000 Growth Index | |
Net Assets as of 6/30/2023 (In Thousands) | |
INVESTMENT OBJECTIVE**
The JPMorgan Large Cap Growth Fund (the “Fund”) seeks long-term capital appreciation.
WHAT WERE THE MAIN DRIVERS OF THE FUND’S PERFORMANCE?
The Fund’s Class I Shares underperformed the Russell 1000 Growth Index (the “Benchmark”) for the twelve months ended June 30, 2023.
The Fund’s security selection in the financials sector and its underweight position in the information technology sector were leading detractors from performance relative to the Benchmark, while the Fund’s security selection in the communications services and health care sectors was a leading contributor to relative performance.
Leading individual detractors from relative performance included the Fund’s overweight positions in SVB Financial and Charles Schwab Corp. and its underweight position in Apple Inc. Shares of SVB Financial Group, a diversified banking company, fell ahead of the bank’s collapse in March 2023 and subsequent takeover by the U.S. Federal Deposit Insurance Corp. Shares of Charles Schwab, an investment banking and brokerage company, fell amid a broad sell-off in banking stocks amid the failure of several U.S. regional banks in March 2023. Shares of Apple, a diversified information technology provider, rose amid consecutive quarters of better-than-expected earnings and revenue during the period and growth in iPhone revenue.
Leading individual contributors to relative performance included the Fund’s overweight positions in Meta Platforms, HCA Healthcare Inc. and Oracle Corp. Shares of Meta Platforms, operator of Facebook and other social media businesses, rose amid investor demand for large cap technology stocks during the second half of the period. Shares of HCA Healthcare, a hospitals and medical services company, rose as investors sought value in the wake of a broad sell-off in hospital operator stocks in the first half of the period. Shares of Oracle, a systems software provider, rose after the company reported better-than-expected earnings and revenue for its fiscal fourth quarter amid surging growth in its cloud computing business.
HOW WAS THE FUND POSITIONED?
The Fund’s portfolio managers utilized a bottom-up approach to stock selection, rigorously researching individual companies in an effort to construct portfolios of stocks that have strong fundamentals and positive price momentum. The Fund’s portfolio managers sought to invest in companies with attractive fundamentals that, in their view, possessed the potential to significantly exceed expectations for a prolonged
period of time.
TOP TEN HOLDINGS OF THE
PORTFOLIO AS OF June 30, 2023 | PERCENT OF
TOTAL
INVESTMENTS |
| | |
| | |
| | |
| | |
| | |
| Meta Platforms, Inc., Class A | |
| | |
| | |
| | |
| | |
PORTFOLIO COMPOSITION BY SECTOR
AS OF June 30, 2023 | PERCENT OF
TOTAL
INVESTMENTS |
| |
| |
| |
| |
| |
| |
| |
| |
| |
| |
*
The return shown is based on net asset values calculated for shareholder transactions and may differ from the return shown in
| J.P. Morgan Large Cap Funds | |
the financial highlights, which reflects adjustments made to the net asset values in accordance with accounting principles generally accepted in the United States of America.
**
The adviser seeks to achieve the Fund’s objective. There can be no guarantee it will be achieved.
| J.P. Morgan Large Cap Funds | |
JPMorgan Large Cap Growth Fund
FUND COMMENTARY
TWELVE MONTHS ENDED June 30, 2023 (Unaudited) (continued)
AVERAGE ANNUAL TOTAL RETURNS AS OF June 30, 2023
|
| Sales Charge for Class A Shares is 5.25%. |
| Assumes a 1% CDSC (contingent deferred sales charge) for the one year period and 0% CDSC thereafter. |
TEN YEAR FUND PERFORMANCE (6/30/13 TO 6/30/23)
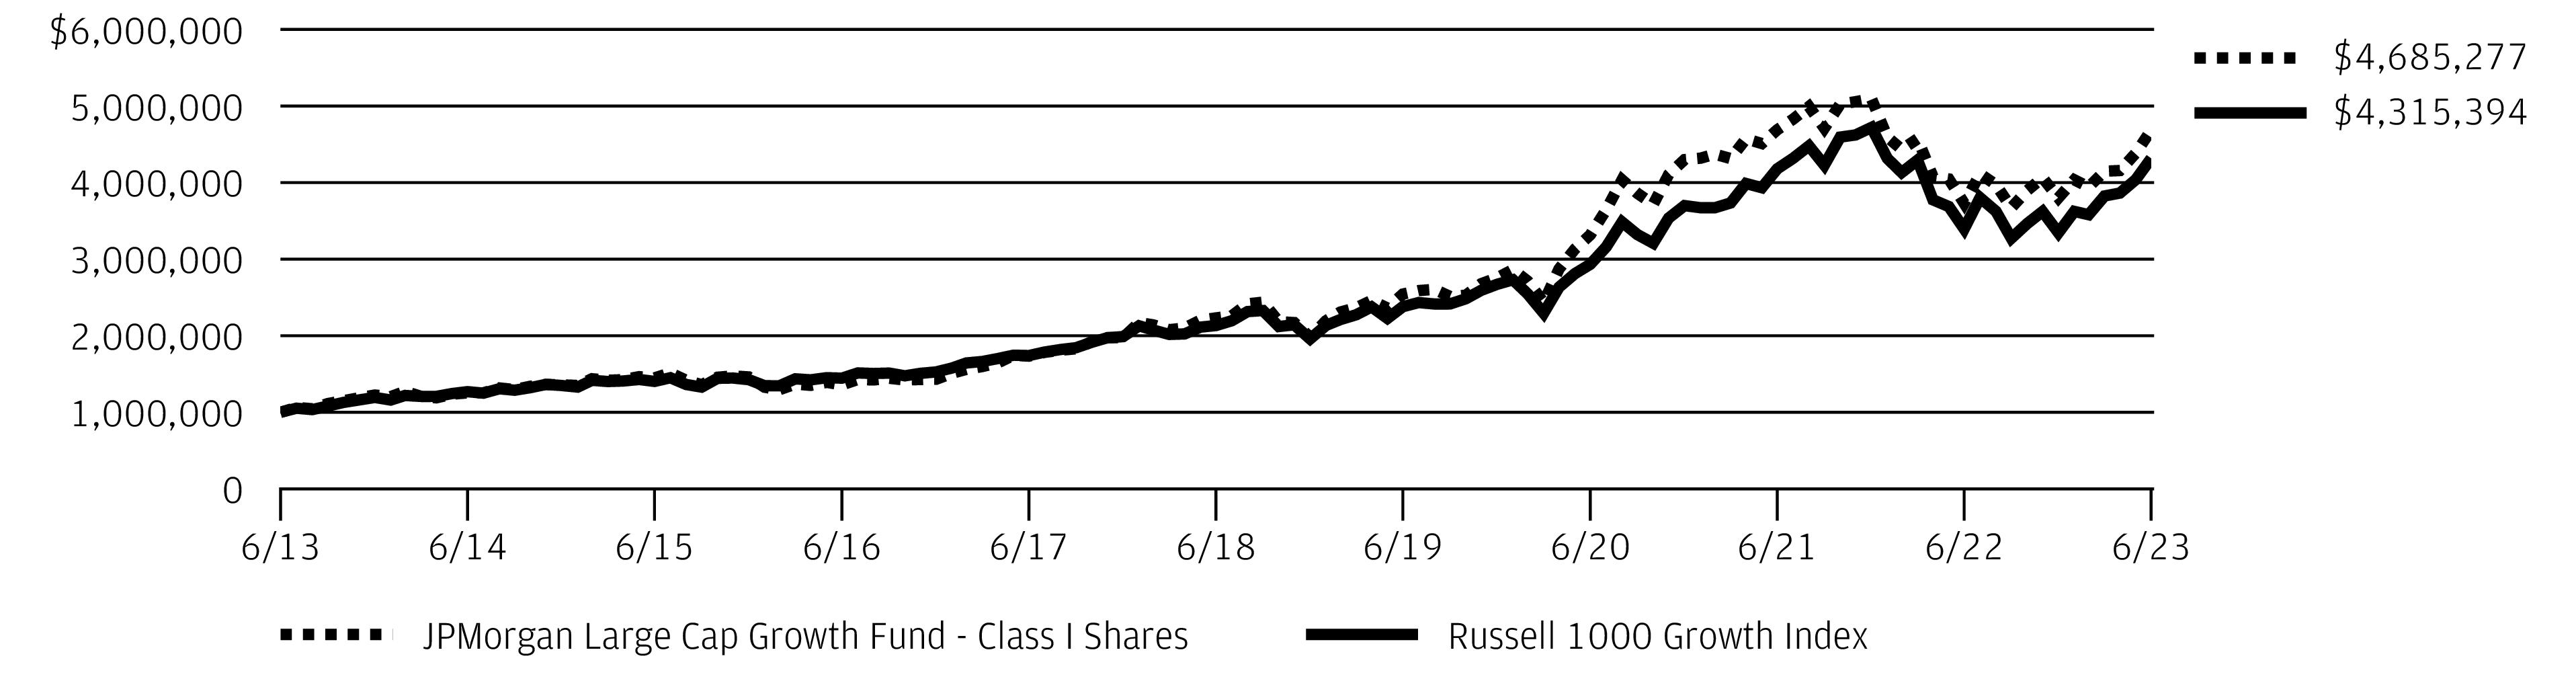
The performance quoted is past performance and is not a guarantee of future results. Mutual funds are subject to certain market risks. Investment returns and principal value of an investment will fluctuate so that an investor’s shares, when redeemed, may be worth more or less than their original cost. Current performance may be higher or lower than the performance data shown. For up-to-date month-end performance information please call 1-800-480-4111.
Returns for Class R3 and Class R4 Shares prior to their inception dates are based on the performance of Class I Shares. With respect to Class R3 Shares, prior class performance has been adjusted to reflect the differences in expenses between classes. The actual returns of Class R4 Shares would have been similar to those shown because Class R4 Shares had similar expenses to Class I Shares.
The graph illustrates comparative performance for $1,000,000 invested in Class I Shares of the JPMorgan Large Cap Growth Fund and the Russell 1000 Growth Index from June 30, 2013 to June 30, 2023. The performance of the Fund assumes reinvestment of all dividends and capital gain distributions, if any, and does not include a sales charge. The performance of the Russell 1000 Growth Index does not reflect the deduction of expenses or a sales charge associated with a mutual fund and has been adjusted to reflect reinvestment of
all dividends and capital gain distributions of the securities included in the benchmark, if applicable. The Russell 1000 Growth Index is an unmanaged index which measures the performance of those Russell 1000 companies with higher price-to-book ratios and higher forecasted growth values. Investors cannot invest directly in an index.
Class I Shares have a $1,000,000 minimum initial investment.
Fund performance may reflect the waiver of the Fund’s fees and reimbursement of expenses for certain periods. Without these waivers and reimbursements, performance would have been lower. Also, performance shown in this section does not reflect the deduction of taxes that a shareholder would pay on Fund distributions or on gains resulting from redemptions of Fund shares.
Because Class C Shares automatically convert to Class A Shares after 8 years, the 10 year average annual total return shown above for Class C reflects Class A Performance for the period after conversion.
The returns shown are based on net asset values calculated for shareholder transactions and may differ from the returns shown in the financial highlights, which reflect adjustments made to the net asset values in accordance with accounting principles generally accepted in the United States of America.
| J.P. Morgan Large Cap Funds | |
JPMorgan Large Cap Value Fund
FUND COMMENTARY
TWELVE MONTHS ENDED June 30, 2023 (Unaudited)
| |
| |
| |
Net Assets as of 6/30/2023 (In Thousands) | |
INVESTMENT OBJECTIVE**
The JPMorgan Large Cap Value Fund (the “Fund”) seeks capital appreciation with the incidental goal of achieving current income by investing primarily in equity securities.
WHAT WERE THE MAIN DRIVERS OF THE FUND’S PERFORMANCE?
The Fund’s Class I Shares outperformed the Russell 1000 Value Index (the “Benchmark”) for the twelve months ended June 30, 2023.
The Fund’s security selection in the consumer discretionary sector and consumer staples sectors was a leading contributor to performance relative to the Benchmark, while the Fund’s security selection in the financials sector and its security selection and overweight position in the health care sector were leading detractors from relative performance.
Leading individual contributors to relative performance included the Fund’s overweight positions in Regeneron Pharmaceuticals Inc., Royal Caribbean Cruises Ltd. and Cardinal Health Inc. Shares of Regeneron Pharmaceuticals, a drug development company, rose following positive results from clinical trials of its Eylea treatment for eye diseases and its Dupixent drug for respiratory diseases. Shares of Royal Caribbean Cruises, a cruise ship operator, rose amid strong growth in bookings during the second half of the period. Shares of Cardinal Health, a pharmaceuticals and health care products distributor, rose amid consecutive quarters of better-than-expected earnings and revenue during the period.
Leading individual detractors from relative performance included the Fund’s underweight position in JP Morgan Chase & Co., its overweight position in Centene Corp. and its out-of-Benchmark position in Charter Communications Inc. Shares of JPMorgan Chase, a banking and financial services company that the Fund is prohibited from holding because it is an affiliate, rose amid consecutive quarters of better-than-expected earnings and revenue and investor preference for large, diversified financial services companies amid volatility in the banking sector in the first half of 2023. Shares of Centene, a managed health care provider, fell after the company lowered its forecast for 2024 results amid rising costs. Shares of Charter Communications, a provider of broadband and cable TV services, fell amid slowing subscriber growth and
lower-than-expected earnings for the fourth quarter of 2022 and the first quarter of 2023.
HOW WAS THE FUND POSITIONED?
The Fund’s portfolio manager combined a bottom-up fundamental approach to security selection with a systematic valuation process. Overall, the Fund’s portfolio manager looked to take advantage of mispriced stocks that he believed
appeared attractive relative to their fair value.
TOP TEN HOLDINGS OF THE
PORTFOLIO AS OF June 30, 2023 | PERCENT OF
TOTAL
INVESTMENTS |
| | |
| | |
| | |
| | |
| Berkshire Hathaway, Inc., Class B | |
| Charter Communications, Inc., Class A | |
| Raytheon Technologies Corp. | |
| | |
| | |
| | |
PORTFOLIO COMPOSITION BY SECTOR
AS OF June 30, 2023 | PERCENT OF
TOTAL
INVESTMENTS |
| |
| |
| |
| |
| |
| |
| |
| |
| |
| |
| |
| |
*
The return shown is based on net asset values calculated for shareholder transactions and may differ from the return shown in
| J.P. Morgan Large Cap Funds | |
JPMorgan Large Cap Value Fund
FUND COMMENTARY
TWELVE MONTHS ENDED June 30, 2023 (Unaudited) (continued)
the financial highlights, which reflects adjustments made to the net asset values in accordance with accounting principles generally accepted in the United States of America.
**
The adviser seeks to achieve the Fund’s objective. There can be no guarantee it will be achieved.
| J.P. Morgan Large Cap Funds | |
AVERAGE ANNUAL TOTAL RETURNS AS OF June 30, 2023
|
| Sales Charge for Class A Shares is 5.25%. |
| Assumes a 1% CDSC (contingent deferred sales charge) for the one year period and 0% CDSC thereafter. |
TEN YEAR FUND PERFORMANCE (6/30/13 TO 6/30/23)
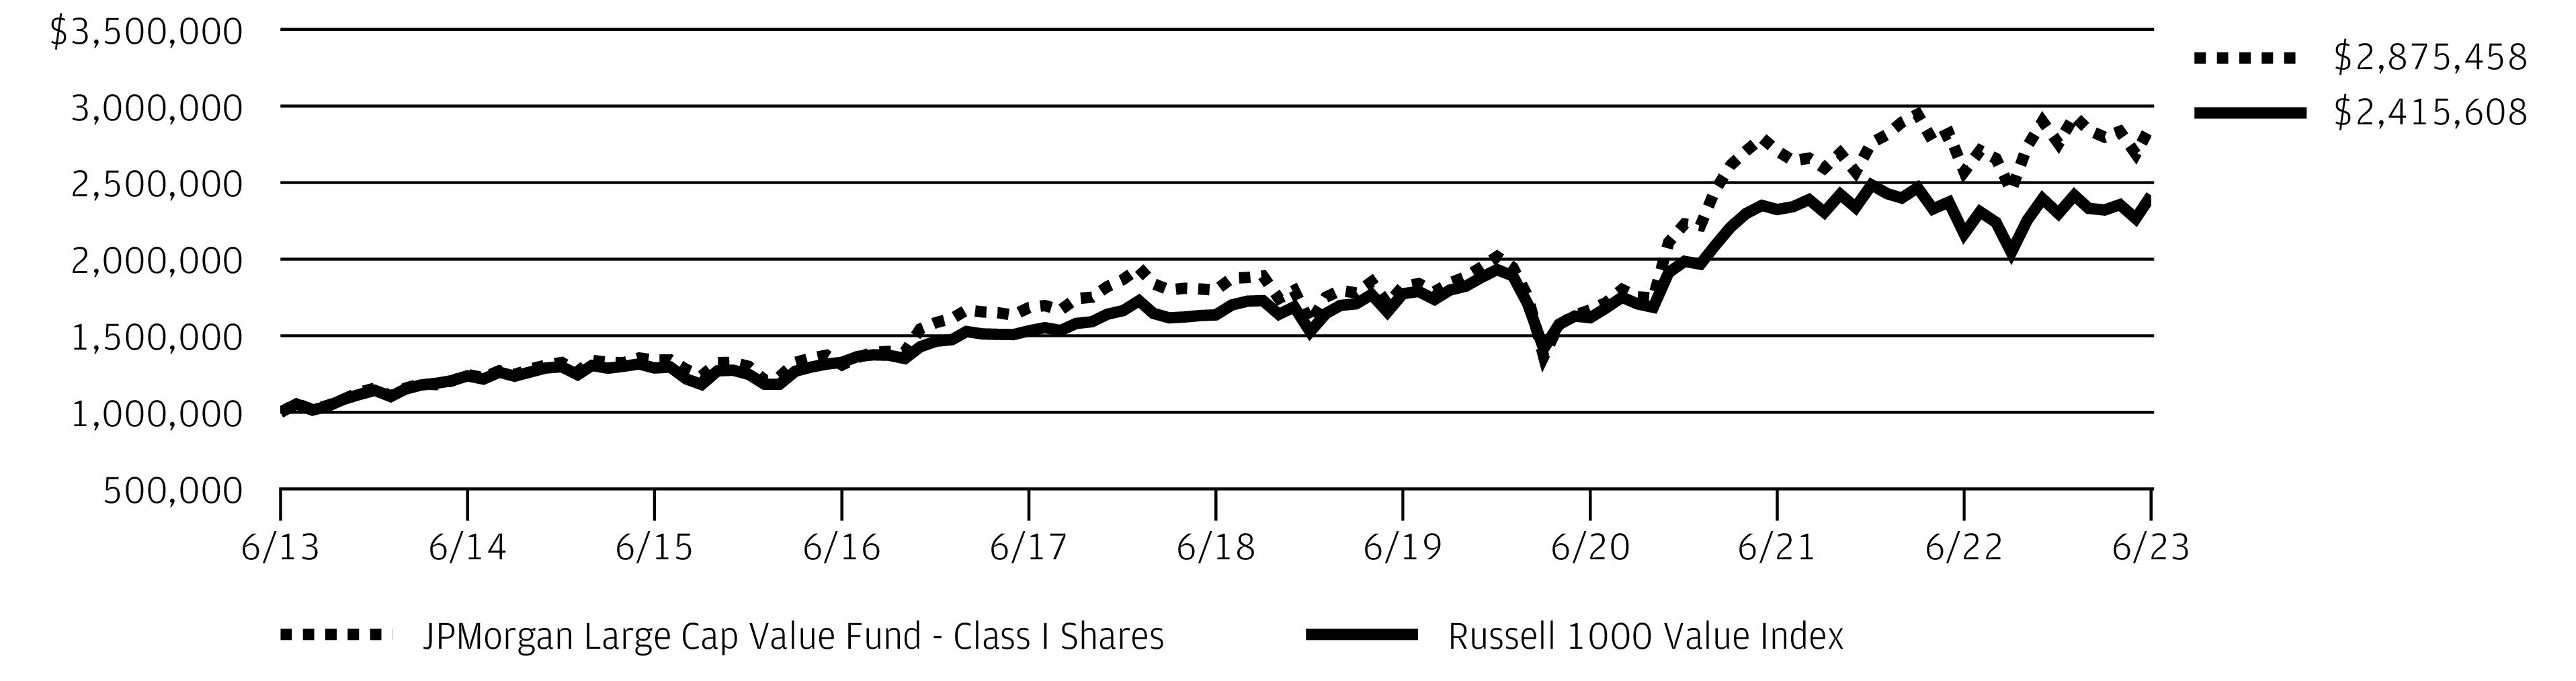
The performance quoted is past performance and is not a guarantee of future results. Mutual funds are subject to certain market risks. Investment returns and principal value of an investment will fluctuate so that an investor’s shares, when redeemed, may be worth more or less than their original cost. Current performance may be higher or lower than the performance data shown. For up-to-date month-end performance information please call 1-800-480-4111.
Returns for Class R3 Shares prior to their inception date are based on the performance of Class A Shares. The actual returns of Class R3 Shares would have been different than those shown because Class R3 Shares have different expenses than Class A Shares.
Returns for Class R4 Shares prior to their inception date are based on the performance of Class I Shares. The actual returns for Class R4 Shares would have been similar to those shown because Class R4 Shares have similar expenses than Class I Shares.
The graph illustrates comparative performance for $1,000,000 invested in Class I Shares of the JPMorgan Large Cap Value Fund and the Russell 1000 Value Index from June 30, 2013 to June 30, 2023. The performance of the Fund assumes reinvestment of all dividends and capital gain distributions, if any, and does not include a sales charge. The performance of the Russell 1000 Value Index does not reflect the deduction of expenses or a sales charge associated
with a mutual fund and has been adjusted to reflect reinvestment of all dividends and capital gain distributions of the securities included in the benchmark, if applicable. The Russell 1000 Value Index is an unmanaged index which measures the performance of those Russell 1000 companies with lower price-to-book ratios and lower forecasted growth values. Investors cannot invest directly in an index.
Class I Shares have a $1,000,000 minimum initial investment.
Fund performance may reflect the waiver of the Fund’s fees and reimbursement of expenses for certain periods. Without these waivers and reimbursements, performance would have been lower. Also, performance shown in this section does not reflect the deduction of taxes that a shareholder would pay on Fund distributions or on gains resulting from redemptions of Fund shares.
Because Class C Shares automatically convert to Class A Shares after 8 years, the 10 year average annual total return shown above for Class C reflects Class A performance for the period after conversion.
The returns shown are based on net asset values calculated for shareholder transactions and may differ from the returns shown in the financial highlights, which reflect adjustments made to the net asset values in accordance with accounting principles generally accepted in the United States of America.
| J.P. Morgan Large Cap Funds | |
JPMorgan U.S. Applied Data Science Value Fund
FUND COMMENTARY
TWELVE MONTHS ENDED June 30, 2023 (Unaudited)
| |
| |
| |
Net Assets as of 6/30/2023 (In Thousands) | |
INVESTMENT OBJECTIVE**
The JPMorgan U.S. Applied Data Science Value Fund (the “Fund”) seeks to provide long-term capital appreciation.
WHAT WERE THE MAIN DRIVERS OF THE FUND’S PERFORMANCE?
The Fund’s Class I Shares underperformed the Russell 1000 Value Index (the “Benchmark”) for the twelve months ended June 30, 2023.
The Fund’s security selection in the financials and consumer staples sectors was a leading detractor from performance relative to the Benchmark, while the Fund’s security selection in the materials and real estate sectors was a leading contributor to relative performance.
Leading individual detractors from relative performance included the Fund’s underweight positions in JPMorgan Chase & Co. and General Electric Co., and its out-of-Benchmark position in Charter Communications Inc. Shares of JPMorgan Chase, a banking and financial services company that the Fund is prohibited from holding because it is an affiliate, rose amid consecutive quarters of better-than-expected earnings and revenue and investor preference for large, diversified financial services companies amid volatility in the banking sector in the first half of 2023. Shares of General Electric, an industrial conglomerate, rose after the company reported consecutive quarters of better-than-expected earnings and raised its 2023 earnings forecast. Shares of Charter Communications, a provider of broadband and cable TV services, fell amid slowing subscriber growth and lower-than-expected earnings for the fourth quarter of 2022 and the first quarter of 2023.
Leading individual contributors to relative performance included the Fund’s overweight positions in Eaton Corp. and Vertex Pharmaceuticals Inc., and its underweight position in Pfizer Inc. Shares of Eaton, an electrical components and equipment manufacturer, rose amid consecutive quarters of better-than-expected earnings and revenue. Shares of Vertex Pharmaceuticals, a drug development company, rose after the company reported better-than-expected earnings and revenue for the fourth quarter of 2022 and the first quarter of 2023. Shares of Pfizer, a pharmaceuticals manufacturer, fell amid investor concerns that the U.S. Federal Trade Commission could seek to block the company’s planned $43 billion acquisition of Seagen Inc. and investor concerns about lower drug prices under new U.S. Medicare program rules.
HOW WAS THE FUND POSITIONED?
During the period, the Fund’s portfolio managers employed a data science driven investment approach that combines research, data insights and risk management. The portfolio managers utilize proprietary techniques to process, analyze and combine a wide variety of data sources, including a multi-decade history of proprietary fundamental research,
company fundamentals and alternative data.
TOP TEN HOLDINGS OF THE
PORTFOLIO AS OF June 30, 2023 | PERCENT OF
TOTAL
INVESTMENTS |
| | |
| | |
| | |
| | |
| | |
| | |
| | |
| Berkshire Hathaway, Inc., Class B | |
| | |
| | |
PORTFOLIO COMPOSITION BY SECTOR
AS OF June 30, 2023 | PERCENT OF
TOTAL
INVESTMENTS |
| |
| |
| |
| |
| |
| |
| |
| |
| |
| |
| |
| |
*
The return shown is based on net asset values calculated for shareholder transactions and may differ from the return shown in
| J.P. Morgan Large Cap Funds | |
the financial highlights, which reflects adjustments made to the net asset values in accordance with accounting principles generally accepted in the United States of America.
**
The adviser seeks to achieve the Fund’s objective. There can be no guarantee it will be achieved.
| J.P. Morgan Large Cap Funds | |
JPMorgan U.S. Applied Data Science Value Fund
FUND COMMENTARY
TWELVE MONTHS ENDED June 30, 2023 (Unaudited) (continued)
AVERAGE ANNUAL TOTAL RETURNS AS OF June 30, 2023
|
| Sales Charge for Class A Shares is 5.25%. |
| Assumes a 1% CDSC (contingent deferred sales charge) for the one year period and 0% CDSC thereafter. |
TEN YEAR FUND PERFORMANCE (6/30/13 TO 6/30/23)

The performance quoted is past performance and is not a guarantee of future results. Mutual funds are subject to certain market risks. Investment returns and principal value of an investment will fluctuate so that an investor’s shares, when redeemed, may be worth more or less than their original cost. Current performance may be higher or lower than the performance data shown. For up-to-date month-end performance information please call 1-800-480-4111.
The graph illustrates comparative performance for $1,000,000 invested in Class I Shares of the JPMorgan U.S. Applied Data Science Value Fund and the Russell 1000 Value Index from June 30, 2013 to June 30, 2023. The performance of the Fund assumes reinvestment of all dividends and capital gain distributions, if any, and does not include a sales charge. The performance of the Russell 1000 Value Index does not reflect the deduction of expenses or a sales charge associated with a mutual fund and has been adjusted to reflect reinvestment of all dividends and capital gain distributions of the securities included in the benchmark, if applicable. The Russell 1000 Value Index is an unmanaged index which measures the performance of those Russell 1000
companies with lower price-to-book ratios and lower forecasted growth values. Investors cannot invest directly in an index.
Class I Shares have a $1,000,000 minimum initial investment.
Fund performance may reflect the waiver of the Fund’s fees and reimbursement of expenses for certain periods. Without these waivers and reimbursements, performance would have been lower. Also, performance shown in this section does not reflect the deduction of taxes that a shareholder would pay on Fund distributions or on gains resulting from redemptions of Fund shares.
Because Class C Shares automatically convert to Class A Shares after 8 years, the 10 year average annual total return shown above for Class C reflects Class A performance for the period after conversion.
The returns shown are based on net asset values calculated for shareholder transactions and may differ from the returns shown in the financial highlights, which reflect adjustments made to the net asset values in accordance with accounting principles generally accepted in the United States of America.
| J.P. Morgan Large Cap Funds | |
JPMorgan U.S. Equity Fund
FUND COMMENTARY
TWELVE MONTHS ENDED June 30, 2023 (Unaudited)
| |
| |
| |
Net Assets as of 6/30/2023 (In Thousands) | |
INVESTMENT OBJECTIVE**
The JPMorgan U.S. Equity Fund (the “Fund”) seeks to provide high total return from a portfolio of selected equity securities.
WHAT WERE THE MAIN DRIVERS OF THE FUND’S PERFORMANCE?
The Fund’s Class L Shares underperformed the S&P 500 Index (the “Benchmark”) for the twelve months ended June 30, 2023.
The Fund’s security selection in the big banks & brokers, commodities and the autos & energy sectors was a leading detractor from performance relative to the Benchmark, while the Fund’s security selection in the industrial cyclical, software & services and the financial/business services sectors was a leading contributor to relative performance.
Leading individual detractors from relative performance included the Fund’s overweight positions in Truist Financial Corp., Bristol-Myers Squibb Co. and AbbVie Inc. Shares of Truist Financial, a regional bank, fell amid volatility in the regional banking sector following the collapse of Silicon Valley Bank and First Republic Bank in March 2023. Shares of Bristol-Myers Squibb, a pharmaceuticals manufacturer, fell amid lower-than-expected revenue for the first quarter of 2023 and investor expectations for lower drug prices under new Medicare program rules. Shares of AbbVie, a pharmaceuticals developer, fell amid increased competition from generic drug makers for the company’s immunosuppressant drug, Humira.
Leading individual contributors to relative performance included the Fund’s overweight positions in Eaton Corp. and NXP Semiconductors NV, and its out-of-Benchmark position in Uber Technologies Inc. Shares of Eaton, an electrical components and equipment manufacturer, rose amid consecutive quarters of better-than-expected earnings and revenue. Shares NXP Semiconductors, a semiconductor manufacturer, rose after the company reported better-than-expected earnings and revenue for the first quarter of 2023. Shares of Uber Technologies, a ride-sharing platform provider, rose after the company reported better-than-expected earnings and revenue for the first quarter of 2023, and forecast growth in bookings for the full year 2023.
HOW WAS THE FUND POSITIONED?
The Fund’s portfolio managers employed a bottom-up fundamental approach to stock selection, researching companies to determine what they believed to be their
underlying value and potential for future earnings growth.
TOP TEN HOLDINGS OF THE
PORTFOLIO AS OF June 30, 2023 | PERCENT OF
TOTAL
INVESTMENTS |
| | |
| | |
| | |
| | |
| NXP Semiconductors NV (China) | |
| | |
| | |
| | |
| | |
| Mastercard, Inc., Class A | |
PORTFOLIO COMPOSITION BY SECTOR
AS OF June 30, 2023 | PERCENT OF
TOTAL
INVESTMENTS |
| |
| |
| |
| |
| |
| |
| |
| |
| |
| |
| |
| |
*
The return shown is based on net asset values calculated for shareholder transactions and may differ from the return shown in
| J.P. Morgan Large Cap Funds | |
JPMorgan U.S. Equity Fund
FUND COMMENTARY
TWELVE MONTHS ENDED June 30, 2023 (Unaudited) (continued)
the financial highlights, which reflects adjustments made to the net asset values in accordance with accounting principles generally accepted in the United States of America.
**
The adviser seeks to achieve the Fund’s objective. There can be no guarantee it will be achieved.
| J.P. Morgan Large Cap Funds | |
AVERAGE ANNUAL TOTAL RETURNS AS OF June 30, 2023
|
| Sales Charge for Class A Shares is 5.25%. |
| Assumes a 1% CDSC (contingent deferred sales charge) for the one year period and 0% CDSC thereafter. |
TEN YEAR FUND PERFORMANCE (6/30/13 TO 6/30/23)
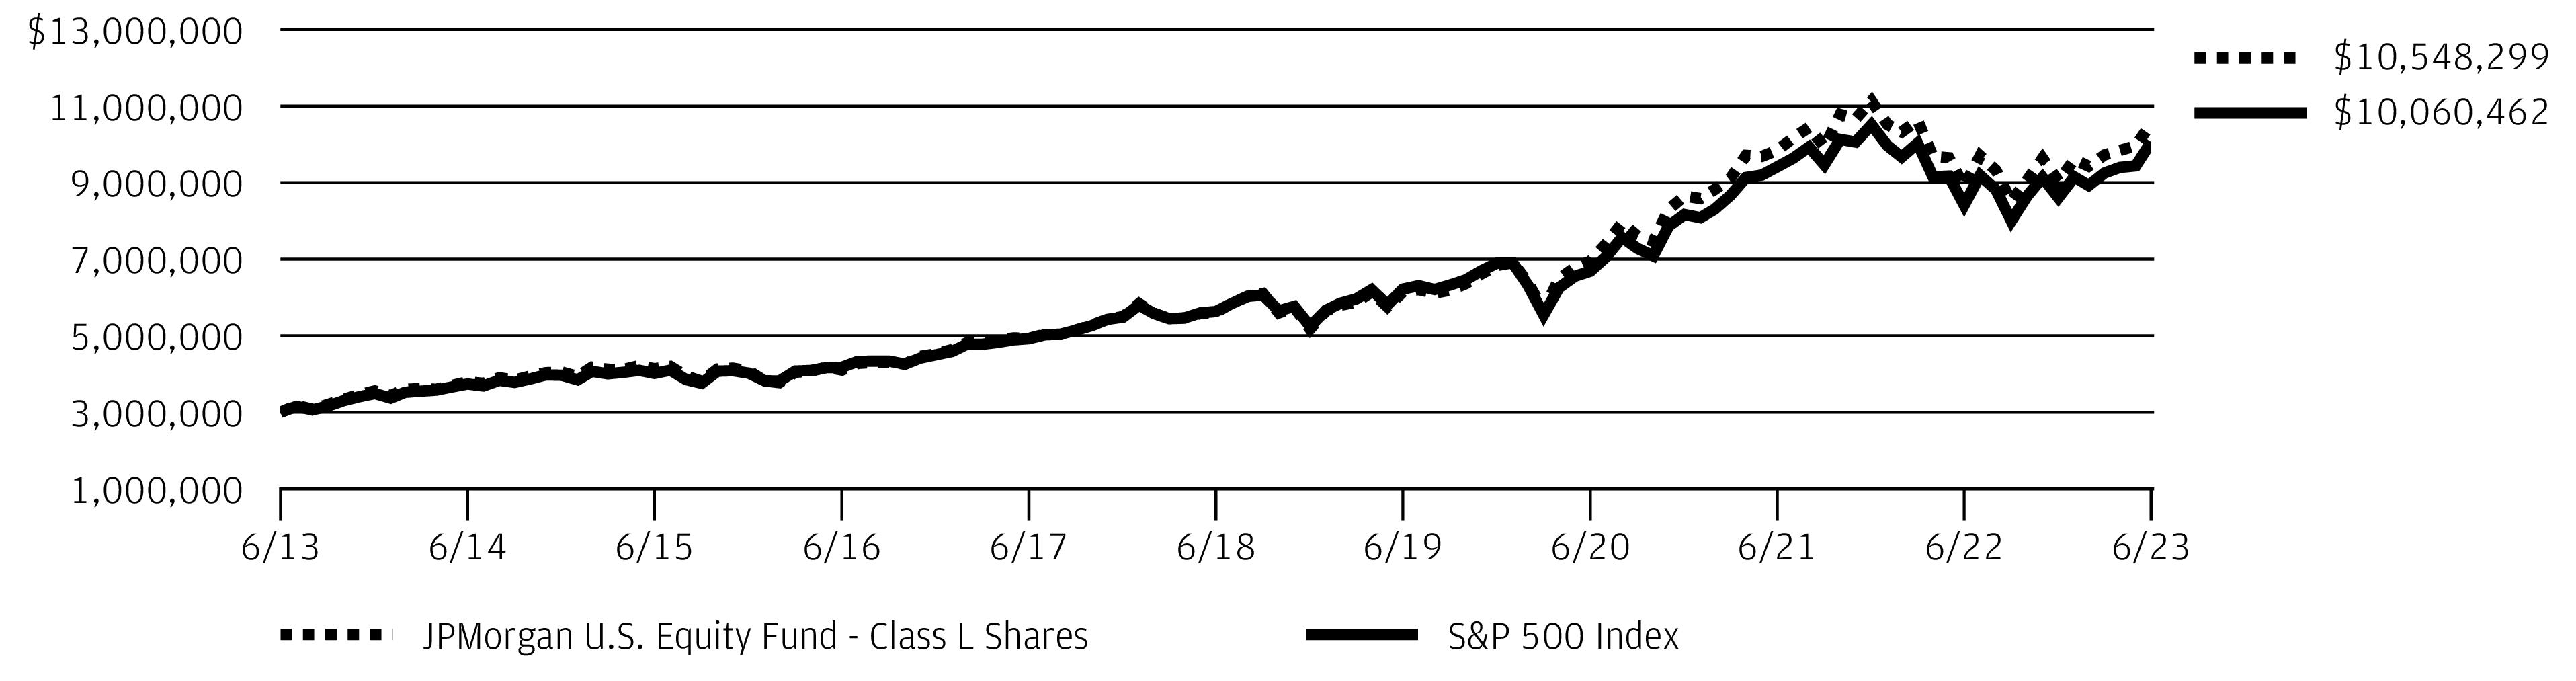
The performance quoted is past performance and is not a guarantee of future results. Mutual funds are subject to certain market risks. Investment returns and principal value of an investment will fluctuate so that an investor’s shares, when redeemed, may be worth more or less than their original cost. Current performance may be higher or lower than the performance data shown. For up-to-date month-end performance information please call 1-800-480-4111.
Returns for Class R3 Shares prior to their inception date are based on the performance of Class A Shares. The actual returns of Class R3 Shares would have been similar to those shown because Class R3 Shares have similar expenses to Class A Shares.
Returns for Class R4 Shares prior to their inception date are based on the performance of Class I Shares. The actual returns for Class R4 Shares would have been similar to those shown because Class R4 Shares have similar expenses than Class I Shares.
The graph illustrates comparative performance for $3,000,000 invested in Class L Shares of the JPMorgan U.S. Equity Fund and the S&P 500 Index from June 30, 2013 to June 30, 2023. The performance of the Fund assumes reinvestment of all dividends and capital gain distributions, if any, and does not include a sales charge. The performance of the S&P 500 Index does not reflect
the deduction of expenses or a sales charge associated with a mutual fund and has been adjusted to reflect reinvestment of all dividends and capital gain distributions of the securities included in the benchmark, if applicable. The S&P 500 Index is an unmanaged index generally representative of the performance of large companies in the U.S. stock market. Investors cannot invest directly in an index.
Class L Shares have a $3,000,000 minimum initial investment.
Fund performance may reflect the waiver of the Fund’s fees and reimbursement of expenses for certain periods. Without these waivers and reimbursements, performance would have been lower. Also, performance shown in this section does not reflect the deduction of taxes that a shareholder would pay on Fund distributions or on gains resulting from redemptions of Fund shares.
Because Class C Shares automatically convert to Class A Shares after 8 years, the 10 year average annual total return shown above for Class C reflects Class A performance for the period after conversion.
The returns shown are based on net asset values calculated for shareholder transactions and may differ from the returns shown in the financial highlights, which reflect adjustments made to the net asset values in accordance with accounting principles generally accepted in the United States of America.
| J.P. Morgan Large Cap Funds | |
JPMorgan U.S. GARP Equity Fund
FUND COMMENTARY
TWELVE MONTHS ENDED June 30, 2023 (Unaudited)
| |
| |
Russell 1000 Growth Index | |
Net Assets as of 6/30/2023 (In Thousands) | |
INVESTMENT OBJECTIVE**
The JPMorgan U.S. GARP Equity Fund (the “Fund”) seeks to provide long-term capital growth.
WHAT WERE THE MAIN DRIVERS OF THE FUND’S PERFORMANCE?
The Fund’s Class I Shares underperformed the Russell 1000 Growth Index (the “Benchmark”) for the twelve months ended June 30, 2023.
The Fund’s security selection in the information technology and health care sectors was a leading detractor from performance relative to the Benchmark, while the Fund’s security selection in the communication services and consumer staples sectors was a leading contributor to relative performance.
Leading individual detractors from relative performance included the Fund’s out-of-Benchmark position in Seagate Technology Holdings PLC, its underweight position in Nvidia Corp. and its overweight position in Qualcomm Inc. Shares of Seagate Technology Holdings, an information technology hardware, storage and services provider, fell after the company reported lower-than-expected earnings and revenue for its fiscal third quarter and issued a weaker-than-expected earnings forecast. Shares of Nvidia, a semiconductor manufacturer, rose amid investor expectations for rising demand for the company’s artificial intelligence technology. Shares of Qualcomm, a semiconductor manufacturer, fell after the company reported lower-than-expected earnings for its fiscal second quarter and issued a weaker-than-expected forecast for the fiscal third quarter.
Leading individual contributors to relative performance included the Fund’s overweight positions in Netflix Inc. and Meta Platforms Inc., and its out-of-Benchmark position in Boston Scientific Corp. Shares of Netflix, an entertainment services and content provider, rose as investment analysts generally responded positively to the company’s advertising and subscriptions growth. Shares of Meta Platforms, operator of Facebook and other social media businesses, rose amid investor demand for large cap technology stocks during the second half of the period. Shares of Boston Scientific, a medical devices manufacturer, rose after the company reported better-than-expected earnings for the first quarter of 2023.
HOW WAS THE FUND POSITIONED?
The Fund’s managers sought growth companies that they believed had attractive relative valuations, high quality
characteristics and strong momentum.
TOP TEN HOLDINGS OF THE
PORTFOLIO AS OF June 30, 2023 | PERCENT OF
TOTAL
INVESTMENTS |
| | |
| | |
| | |
| | |
| Meta Platforms, Inc., Class A | |
| Mastercard, Inc., Class A | |
| | |
| | |
| | |
| | |
PORTFOLIO COMPOSITION BY SECTOR
AS OF June 30, 2023 | PERCENT OF
TOTAL
INVESTMENTS |
| |
| |
| |
| |
| |
| |
| |
| |
| |
Others (each less than 1.0%) | |
| |
*
The return shown is based on net asset values calculated for shareholder transactions and may differ from the return shown in the financial highlights, which reflects adjustments made to the net asset values in accordance with accounting principles generally accepted in the United States of America.
**
The adviser seeks to achieve the Fund’s objective. There can be no guarantee it will be achieved.
| J.P. Morgan Large Cap Funds | |
AVERAGE ANNUAL TOTAL RETURNS AS OF June 30, 2023
|
| Sales Charge for Class A Shares is 5.25%. |
| Assumes a 1% CDSC (contingent deferred sales charge) for the one year period and 0% CDSC thereafter. |
TEN YEAR FUND PERFORMANCE (6/30/13 TO 6/30/23)
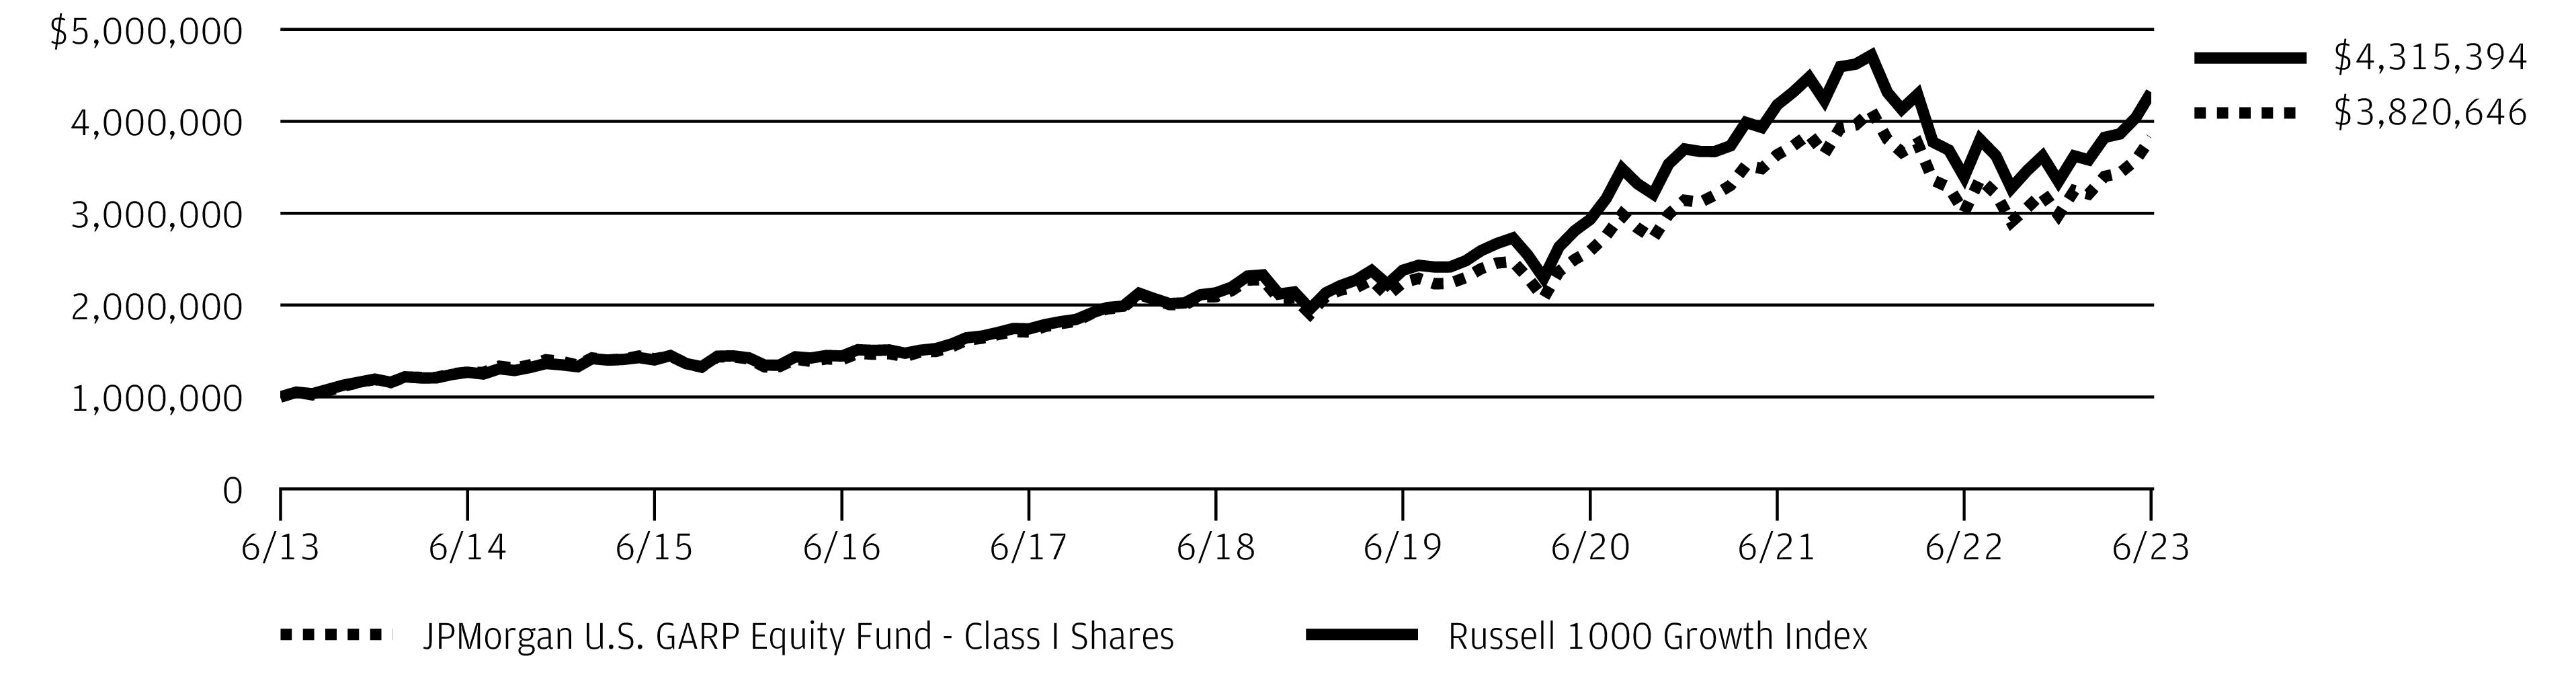
The performance quoted is past performance and is not a guarantee of future results. Mutual funds are subject to certain market risks. Investment returns and principal value of an investment will fluctuate so that an investor’s shares, when redeemed, may be worth more or less than their original cost. Current performance may be higher or lower than the performance data shown. For up-to-date month-end performance information please call 1-800-480-4111.
Returns for Class R6 Shares prior to their inception date are based on the performance of Class R5 Shares. The actual returns for Class R6 Shares would have been different than those shown because Class R6 Shares have different expenses than Class R5 Shares.
The graph illustrates comparative performance for $1,000,000 invested in Class I Shares of the JPMorgan U.S. GARP Equity Fund and the Russell 1000 Growth Index, from June 30, 2013 to June 30, 2023. The performance of the Fund assumes reinvestment of all dividends and capital gain distributions, if any, and does not include a sales charge. The performance of the Russell 1000 Growth Index does not reflect the deduction of expenses or a sales charge associated with a mutual fund and has been adjusted to reflect reinvestment of all dividends and capital gain distributions of the securities included in the
benchmark, if applicable. The Russell 1000 Growth Index is an unmanaged index which measures the performance of those Russell 1000 companies with higher price-to-book ratios and higher forecasted growth values. Investors cannot invest directly in an index.
Class I Shares have a $1,000,000 minimum initial investment.
Fund performance may reflect the waiver of the Fund’s fees and reimbursement of expenses for certain periods. Without these waivers and reimbursements, performance would have been lower. Also, performance shown in this section does not reflect the deduction of taxes that a shareholder would pay on Fund distributions or on gains resulting from redemptions of Fund shares.
Because Class C Shares automatically convert to Class A Shares after 8 years, the 10 year average annual total return shown above for Class C reflects Class A performance for the period after conversion.
The returns shown are based on net asset values calculated for shareholder transactions and may differ from the returns shown in the financial highlights, which reflect adjustments made to the net asset values in accordance with accounting principles generally accepted in the United States of America.
| J.P. Morgan Large Cap Funds | |
JPMorgan U.S. Large Cap Core Plus Fund
FUND COMMENTARY
TWELVE MONTHS ENDED June 30, 2023 (Unaudited)
| |
| |
| |
Net Assets as of 6/30/2023 (In Thousands) | |
INVESTMENT OBJECTIVE**
The JPMorgan U.S. Large Cap Core Plus Fund (the “Fund”) seeks to provide a high total return from a portfolio of selected equity securities.
WHAT WERE THE MAIN DRIVERS OF THE FUND’S PERFORMANCE?
The Fund’s Class I Shares outperformed the S&P 500 Index (the “Benchmark”) for the twelve months ended June 30, 2023.
The Fund’s security selection in the media and retail sectors was a leading contributor to performance relative to the Benchmark, while the Fund’s security selection in the health services & systems sector and the consumer cyclical sector was a leading detractor from relative performance.
Leading individual contributors to relative performance included the Fund’s overweight positions in Meta Platforms Inc. and Boston Scientific Co, and its short position in Intel Corp. Shares of Meta Platforms, operator of Facebook and other social media businesses that was not held in the Fund, rose amid investor demand for large cap technology stocks during the second half of the period. Shares of Boston Scientific, a medical devices manufacturer, rose after the company reported better-than-expected earnings for the first quarter of 2023. Shares of Intel, a semiconductor manufacturer, fell after the company reported lower-than-expected results for the fourth quarter and full year 2022.
Leading individual detractors from relative performance included the Fund’s overweight position in Seagate Technology Holdings PLC, its short position in General Electric Co. and its underweight position in J.P. Morgan Chase & Co. Shares of Seagate Technology Holdings, an information technology hardware, storage and services provider, fell after the company reported lower-than-expected earnings and revenue for its fiscal third quarter and issued a weaker-than-expected earnings
forecast. Shares of General Electric, an industrial conglomerate, rose after the company reported consecutive quarters of better-than-expected earnings and raised its 2023 earnings forecast. Shares of JPMorgan Chase, a banking and financial services company that the Fund is prohibited from holding because it is an affiliate, rose amid consecutive quarters of better-than-expected earnings and revenue and investor preference for large, diversified financial services companies amid volatility in the banking sector in the first half of 2023.
HOW WAS THE FUND POSITIONED?
The Fund’s portfolio managers employed a bottom-up fundamental approach to stock selection, researching companies to determine their underlying value and potential for future earnings growth. Overall, the Fund’s portfolio managers aimed to take advantage of mispriced stocks that appeared attractive relative to fair value for long positions and looked for overvalued stocks in which to take short positions. The long-to-short exposure ratio at the end of the reporting
period was 123% to 23%.
TOP TEN LONG POSITIONS OF THE
PORTFOLIO AS OF June 30, 2023 | PERCENT OF
TOTAL
INVESTMENTS |
| | |
| | |
| | |
| | |
| | |
| Meta Platforms, Inc., Class A | |
| NXP Semiconductors NV (China) | |
| Mastercard, Inc., Class A | |
| | |
| | |
| J.P. Morgan Large Cap Funds | |
TOP TEN SHORT POSITIONS OF THE
PORTFOLIO AS OF June 30, 2023 | PERCENT OF
TOTAL
INVESTMENTS |
| Microchip Technology, Inc. | |
| | |
| Hewlett Packard Enterprise Co. | |
| Interpublic Group of Cos., Inc. (The) | |
| | |
| Stanley Black & Decker, Inc. | |
| | |
| | |
| | |
| | |
LONG POSITION PORTFOLIO COMPOSITION
BY SECTOR AS OF June 30, 2023 | PERCENT OF
TOTAL
INVESTMENTS |
| |
| |
| |
| |
| |
| |
| |
| |
| |
| |
| |
| |
SHORT POSITION PORTFOLIO COMPOSITION
BY SECTOR AS OF June 30, 2023 | PERCENT OF
TOTAL
INVESTMENTS |
| |
| |
| |
| |
| |
| |
| |
| |
| |
| |
| |
*
The return shown is based on net asset values calculated for shareholder transactions and may differ from the return shown in the financial highlights, which reflects adjustments made to the net asset values in accordance with accounting principles generally accepted in the United States of America.
**
The adviser seeks to achieve the Fund’s objective. There can be no guarantee it will be achieved.
| J.P. Morgan Large Cap Funds | |
JPMorgan U.S. Large Cap Core Plus Fund
FUND COMMENTARY
TWELVE MONTHS ENDED June 30, 2023 (Unaudited) (continued)
AVERAGE ANNUAL TOTAL RETURNS AS OF June 30, 2023
|
| Sales Charge for Class A Shares is 5.25%. |
| Assumes a 1% CDSC (contingent deferred sales charge) for the one year period and 0% CDSC thereafter. |
TEN YEAR FUND PERFORMANCE (6/30/13 TO 6/30/23)
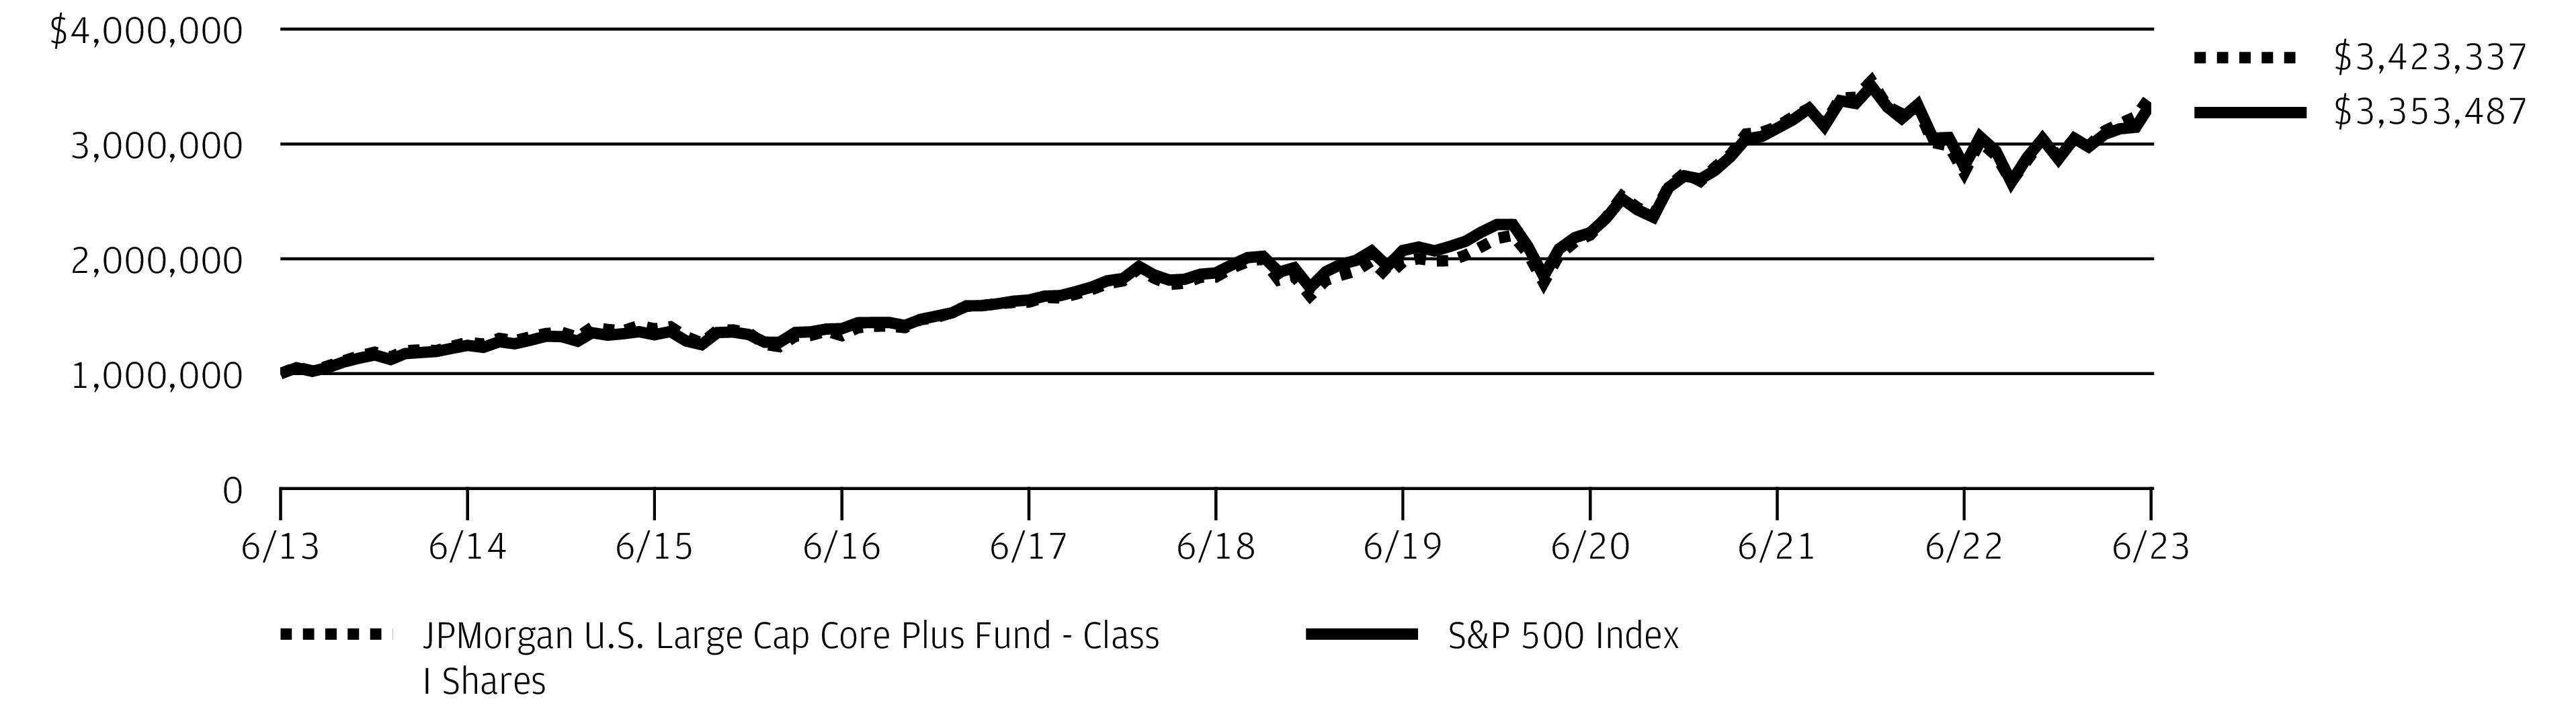
The performance quoted is past performance and is not a guarantee of future results. Mutual funds are subject to certain market risks. Investment returns and principal value of an investment will fluctuate so that an investor’s shares, when redeemed, may be worth more or less than their original cost. Current performance may be higher or lower than the performance data shown. For up-to-date month-end performance information please call 1-800-480-4111.
Returns for Class R6 Shares prior to its inception date are based on the performance of Class R5 Shares. The actual returns of Class R6 Shares would have been different than those shown because Class R6 Shares have different expenses than Class R5 Shares.
The graph illustrates comparative performance for $1,000,000 invested in Class I Shares of the JPMorgan U.S. Large Cap Core Plus Fund and the S&P 500 Index from June 30, 2013 to June 30, 2023. The performance of the Fund assumes reinvestment of all dividends and capital gain distributions, if any, and does not include a sales charge. The performance of the S&P 500 Index does not reflect the deduction of expenses or a sales charge associated with a mutual fund and has been adjusted to reflect reinvestment of all dividends and capital gain distributions of the securities included in the benchmark, if
applicable. The S&P 500 Index is an unmanaged index generally representative of the performance of large companies in the U.S. stock market. Investors cannot invest directly in an index.
Class I Shares have a $1,000,000 minimum initial investment.
Fund performance may reflect the waiver of the Fund’s fees and reimbursement of expenses for certain periods. Without these waivers and reimbursements, performance would have been lower. Also, performance shown in this section does not reflect the deduction of taxes that a shareholder would pay on Fund distributions or on gains resulting from redemptions of Fund shares.
Because Class C Shares automatically convert to Class A Shares after 8 years, the 10 year average annual total return shown above for Class C reflects Class A performance for the period after conversion.
The returns shown are based on net asset values calculated for shareholder transactions and may differ from the returns shown in the financial highlights, which reflect adjustments made to the net asset values in accordance with accounting principles generally accepted in the United States of America.
| J.P. Morgan Large Cap Funds | |
JPMorgan U.S. Research Enhanced Equity Fund
FUND COMMENTARY
TWELVE MONTHS ENDED June 30, 2023 (Unaudited)
| |
| |
| |
Net Assets as of 6/30/2023 (In Thousands) | |
INVESTMENT OBJECTIVE**
The JPMorgan U.S. Research Enhanced Equity Fund (the “Fund”) seeks to provide a consistently high total return from a broadly diversified portfolio of equity securities with risk characteristics similar to the S&P 500 Index (the “Benchmark”).
WHAT WERE THE MAIN DRIVERS OF THE FUND’S PERFORMANCE?
The Fund’s Class I Shares outperformed the Benchmark for the twelve months ended June 30, 2023.
The Fund’s security selection in the consumer discretionary and industrials sectors was a leading detractor from performance relative to the Benchmark, while the Fund’s security selection in the financials and health care sectors was a leading contributor to relative performance.
Leading individual contributors to relative performance included the Fund’s underweight positions in Pfizer Inc. and Intel Corp., and its overweight position in Chipotle Mexican Grill Inc. Shares of Pfizer, a pharmaceuticals manufacturer not held in the fund, fell amid investor concerns that the U.S. Federal Trade Commission could seek to block the company’s planned $43 billion acquisition of Seagen Inc. and investor concerns about lower drug prices under new U.S. Medicare program rules. Shares of Intel, a semiconductor manufacturer not held in the Fund, fell after the company reported lower-than-expected results for the fourth quarter and full year 2022. Shares of Chipotle Mexican Grill, a fast-food restaurant chain, rose after the company reported better-than-expected earnings, revenue and comparable-store sales for the first quarter of 2023.
Leading individual detractors from relative performance included the Fund’s underweight positions in JPMorgan Chase & Co. and Nvidia Corp., and its overweight position in US Bancorp. Shares of JPMorgan Chase, a banking and financial services company that the Fund is prohibited from holding because it is an affiliate, rose amid consecutive quarters of better-than-expected earnings and revenue and investor preference for large, diversified financial services companies amid volatility in the banking sector in the first half of 2023. Shares of Nvidia, a semiconductor manufacturer not held in the Fund, rose amid investor expectations for rising demand for the company’s artificial intelligence technology. Shares of U.S. Bancorp, a
diversified bank based in Minneapolis, Minn., fell amid a broad decline in regional banks following the collapse of Silicon Valley Bank and First Republic Bank in early March 2023.
HOW WAS THE FUND POSITIONED?
The Fund’s portfolio managers attempted to construct the portfolio so that stock selection was the principal source of potential excess return. The Fund’s portfolio managers sought investment opportunities in companies that they believed were
attractive based on valuation and strong fundamentals.
TOP TEN HOLDINGS OF THE
PORTFOLIO AS OF June 30, 2023 | PERCENT OF
TOTAL
INVESTMENTS |
| | |
| | |
| | |
| | |
| Meta Platforms, Inc., Class A | |
| | |
| | |
| | |
| | |
| Mastercard, Inc., Class A | |
PORTFOLIO COMPOSITION BY SECTOR
AS OF June 30, 2023 | PERCENT OF
TOTAL
INVESTMENTS |
| |
| |
| |
| |
| |
| |
| |
| |
| |
| |
| |
| |
*
The return shown is based on net asset values calculated for shareholder transactions and may differ from the return shown in
| J.P. Morgan Large Cap Funds | |
JPMorgan U.S. Research Enhanced Equity Fund
FUND COMMENTARY
TWELVE MONTHS ENDED June 30, 2023 (Unaudited) (continued)
the financial highlights, which reflects adjustments made to the net asset values in accordance with accounting principles generally accepted in the United States of America.
**
The adviser seeks to achieve the Fund’s objective. There can be no guarantee it will be achieved.
| J.P. Morgan Large Cap Funds | |
AVERAGE ANNUAL TOTAL RETURNS AS OF June 30, 2023
|
| Sales Charge for Class A Shares is 5.25%. |
TEN YEAR FUND PERFORMANCE (6/30/13 TO 6/30/23)
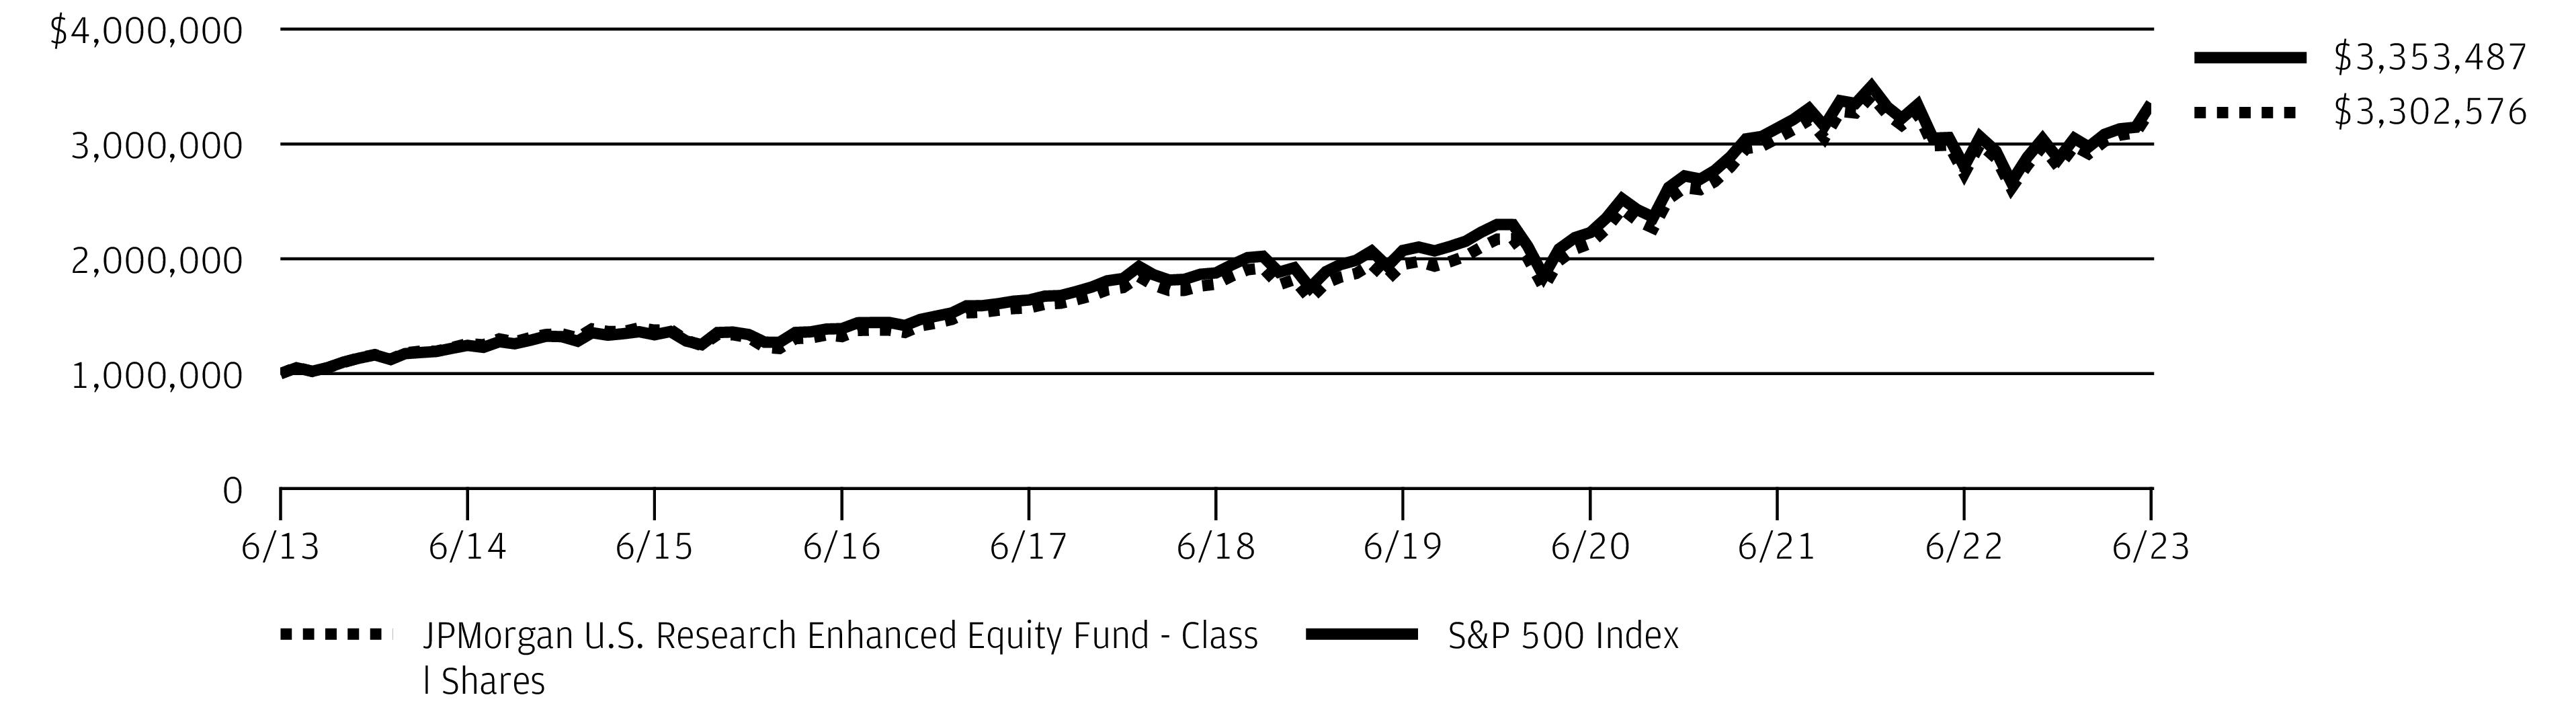
The performance quoted is past performance and is not a guarantee of future results. Mutual funds are subject to certain market risks. Investment returns and principal value of an investment will fluctuate so that an investor’s shares, when redeemed, may be worth more or less than their original cost. Current performance may be higher or lower than the performance data shown. For up-to-date month-end performance information please call 1-800-480-4111.
The graph illustrates comparative performance for $1,000,000 invested in Class I Shares of the JPMorgan U.S. Research Enhanced Equity Fund and the S&P 500 Index from June 30, 2013 to June 30, 2023. The performance of the Fund assumes reinvestment of all dividends and capital gain distributions, if any, and does not include a sales charge. The performance of the S&P 500 Index does not reflect the deduction of expenses or a sales charge associated with a mutual fund and has been adjusted to reflect reinvestment of all dividends and capital gain distributions of the securities included in the
benchmark, if applicable. The S&P 500 Index is an unmanaged index generally representative of the performance of large companies in the U.S. stock market. Investors cannot invest directly in an index.
Class I Shares have a $1,000,000 minimum initial investment.
Fund performance may reflect the waiver of the Fund’s fees and reimbursement of expenses for certain periods. Without these waivers and reimbursements, performance would have been lower. Also, performance shown in this section does not reflect the deduction of taxes that a shareholder would pay on Fund distributions or on gains resulting from redemptions of Fund shares.
The returns shown are based on net asset values calculated for shareholder transactions and may differ from the returns shown in the financial highlights, which reflect adjustments made to the net asset values in accordance with accounting principles generally accepted in the United States of America.
| J.P. Morgan Large Cap Funds | |
JPMorgan U.S. Sustainable Leaders Fund
FUND COMMENTARY
TWELVE MONTHS ENDED June 30, 2023 (Unaudited)
| |
| |
| |
Net Assets as of 6/30/2023 (In Thousands) | |
INVESTMENT OBJECTIVE**
The JPMorgan U.S. Sustainable Leaders Fund (the “Fund”) seeks to provide long-term capital appreciation.
WHAT WERE THE MAIN DRIVERS OF THE FUND’S PERFORMANCE?
The Fund’s Class I Shares underperformed the S&P 500 Index (the “Benchmark”) for the twelve months ended June 30, 2023.
The Fund’s security selection in the financials and communication services sectors was a leading detractor from performance relative to the Benchmark, while the Fund’s security selection in the industrials and health care sectors was a leading contributor to relative performance.
Leading individual detractors from relative performance relative included the Fund’s overweight positions in SVB Financial Group and Texas Instruments Inc., and its underweight position in Meta Platforms Inc. Shares of SVB Financial Group, a diversified banking company, fell ahead of the bank’s collapse in March 2023 and subsequent takeover by the U.S. Federal Deposit Insurance Corp. Shares of Texas Instruments, a semiconductor manufacturer, fell after the company issued a weaker-than-expected earnings forecast for the second quarter of 2023. Shares of Meta Platforms, operator of Facebook and other social media businesses that was not held in the Fund, rose amid investor demand for large cap technology stocks during the second half of the period.
Leading individual contributors to relative performance included the Fund’s overweight positions in Boston Scientific Corp. and Eaton Corp., and its underweight position in Pfizer Inc. Shares of Boston Scientific, a medical devices manufacturer, rose after the company reported better-than-expected earnings for the first quarter of 2023. Shares of Eaton, an electrical components and equipment manufacturer, rose amid consecutive quarters of better-than-expected earnings and revenue. Shares of Pfizer, a pharmaceuticals manufacturer not held in the Fund, fell amid investor concerns that the U.S. Federal Trade Commission could seek to block the company’s planned $43 billion acquisition of Seagen Inc. and investor concerns about lower drug prices under new U.S. Medicare program rules.
HOW WAS THE FUND POSITIONED?
During the period, the Fund employed a proprietary scoring methodology to invest in companies that the Fund’s portfolio managers believed have attractive environmental, social and governance characteristics and potential for long-term capital appreciation. The Fund’s positioning during the period was a
result of that process.
TOP TEN HOLDINGS OF THE
PORTFOLIO AS OF June 30, 2023 | PERCENT OF
TOTAL
INVESTMENTS |
| | |
| | |
| | |
| Mastercard, Inc., Class A | |
| | |
| | |
| | |
| | |
| | |
| Thermo Fisher Scientific, Inc. | |
PORTFOLIO COMPOSITION BY SECTOR
AS OF June 30, 2023 | PERCENT OF
TOTAL
INVESTMENTS |
| |
| |
| |
| |
| |
| |
| |
| |
| |
| |
| |
| |
*
The return shown is based on net asset values calculated for shareholder transactions and may differ from the return shown in
| J.P. Morgan Large Cap Funds | |
the financial highlights, which reflects adjustments made to the net asset values in accordance with accounting principles generally accepted in the United States of America.
**
The adviser seeks to achieve the Fund’s objective. There can be no guarantee it will be achieved.
| J.P. Morgan Large Cap Funds | |
JPMorgan U.S. Sustainable Leaders Fund
FUND COMMENTARY
TWELVE MONTHS ENDED June 30, 2023 (Unaudited) (continued)
AVERAGE ANNUAL TOTAL RETURNS AS OF June 30, 2023
|
| Sales Charge for Class A Shares is 5.25%. |
| Assumes a 1% CDSC (contingent deferred sales charge) for the one year period and 0% CDSC thereafter. |
TEN YEAR FUND PERFORMANCE (6/30/13 TO 6/30/23)
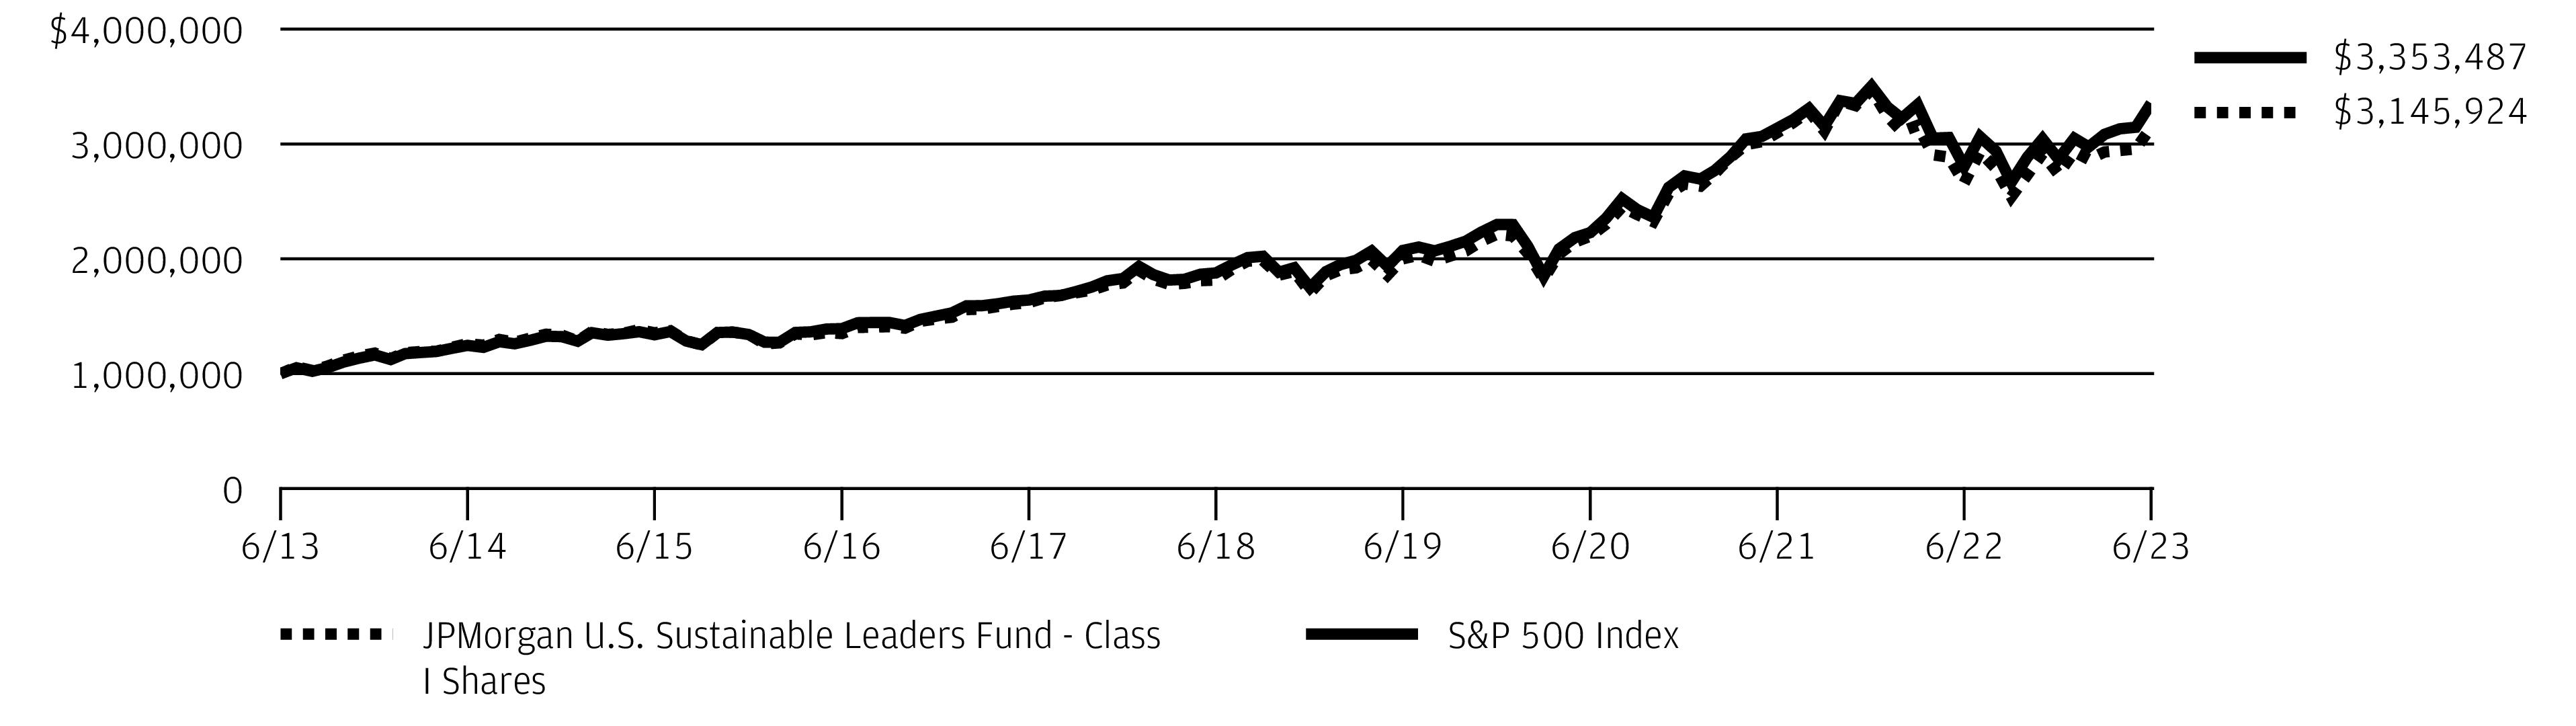
The performance quoted is past performance and is not a guarantee of future results. Mutual funds are subject to certain market risks. Investment returns and principal value of an investment will fluctuate so that an investor’s shares, when redeemed, may be worth more or less than their original cost. Current performance may be higher or lower than the performance data shown. For up-to-date month-end performance information please call 1-800-480-4111.
Returns for Class R6 Shares prior to their inception date are based on the performance of Class I Shares. The actual returns of Class R6 Shares would have been different than those shown because Class R6 Shares have different expenses than Class I Shares.
The graph illustrates comparative performance for $1,000,000 invested in Class I Shares of the JPMorgan U.S. Sustainable Leaders Fund and the S&P 500 Index from June 30, 2013 to June 30, 2023. The performance of the Fund assumes reinvestment of all dividends and capital gain distributions, if any, and does not include a sales charge. The performance of the S&P 500 Index does not reflect the deduction of expenses or a sales charge associated with a mutual fund and has been adjusted to reflect reinvestment of all dividends and capital gain distributions of the securities included in the benchmark, if applicable. The S&P 500 Index is an unmanaged index generally representative of the performance of large companies in the U.S. stock market. Investors cannot invest directly in an index.
Class I Shares have a $1,000,000 minimum initial investment.
Fund performance may reflect the waiver of the Fund’s fees and reimbursement of expenses for certain periods. Without these waivers and reimbursements, performance would have been lower. Also, performance shown in this section does not reflect the deduction of taxes that a shareholder would pay on Fund distributions or on gains resulting from redemptions of Fund shares.
Effective November 1, 2016, the Fund changed its investment strategies. Although past performance is not necessarily an indication of how the Fund will perform in the future, in view of these changes, the Fund’s performance record prior to this date might be less relevant for investors considering whether to purchase shares of the Fund.
Because Class C Shares automatically convert to Class A Shares after 8 years, the 10 year average annual total return shown above for Class C reflects Class A performance for the period after conversion.
The returns shown are based on net asset values calculated for shareholder transactions and may differ from the returns shown in the financial highlights, which reflect adjustments made to the net asset values in accordance with accounting principles generally accepted in the United States of America.
| J.P. Morgan Large Cap Funds | |
FUND COMMENTARY
TWELVE MONTHS ENDED June 30, 2023 (Unaudited)
| |
Fund (Class A Shares, without a sales charge) * | |
| |
Net Assets as of 6/30/2023 (In Thousands) | |
INVESTMENT OBJECTIVE**
The JPMorgan U.S. Value Fund (the “Fund”) seeks to provide capital growth over the long term.
WHAT WERE THE MAIN DRIVERS OF THE FUND’S PERFORMANCE?
The Fund’s Class A Shares, without a sales charge, outperformed the Russell 1000 Value Index (the “Benchmark”) for the twelve months ended June 30, 2023.
The Fund’s security selection in the information technology and materials sectors was a leading contributor to performance relative to the Benchmark, while the Fund’s security selection in the financials and industrials sectors was a leading detractor from relative performance.
Leading individual contributors to relative performance included the Fund’s out-of-Benchmark position in TJX Cos., and its overweight positions in Axalta Coating Systems Ltd. and Vulcan Materials Co. Shares of TJX, an operator of discount retail apparel and home products chains, rose after reporting consecutive quarters of better-than-expected earnings or revenues and amid investor expectations that lower-cost retailers would have an advantage in an inflationary economy. Shares of Axalta Coating Systems, a specialty chemicals manufacturer, rose after the company reported better-than-expected results for the first quarter of 2023 and forecast better-than-expected revenue growth for the second quarter of 2023. Shares of Vulcan Materials, a construction materials manufacturer, rose after the company reported better-than-expected earnings and revenue for the first quarter of 2023.
Leading individual detractors from relative performance included the Fund’s out-of-Benchmark position in Dollar General Corp., its underweight position in JPMorgan Chase & Co. and its overweight position in Bristol-Myers Squibb Co. Shares of Dollar General, a discount retail chain, fell after the company reported lower-than-expected earnings and revenue for the first quarter of 2023 and lowered its earnings forecast. Shares of JPMorgan Chase, a banking and financial services company that the Fund is prohibited from holding because it is an affiliate, rose amid consecutive quarters of better-than-expected earnings and revenue and investor preference for large, diversified financial services companies amid volatility in
the banking sector in the first half of 2023. Shares of Bristol-Myers Squibb, a pharmaceuticals manufacturer, fell amid lower-than-expected revenue for the first quarter of 2023 and investor expectations for lower drug prices under new Medicare program rules.
HOW WAS THE FUND POSITIONED?
The Fund’s portfolio managers focused on stock selection and aimed to invest in undervalued companies with durable franchises, strong management and the ability to grow their intrinsic value per share. The portfolio managers employed a bottom-up approach to security selection and fundamental
research.
TOP TEN HOLDINGS OF THE
PORTFOLIO AS OF June 30, 2023 | PERCENT OF
TOTAL
INVESTMENTS |
| | |
| | |
| | |
| Berkshire Hathaway, Inc., Class B | |
| | |
| Air Products and Chemicals, Inc. | |
| | |
| | |
| Axalta Coating Systems Ltd. | |
| | |
PORTFOLIO COMPOSITION BY SECTOR
AS OF June 30, 2023 | PERCENT OF
TOTAL
INVESTMENTS |
| |
| |
| |
| |
| |
| |
| |
| |
| |
| |
| |
| |
| J.P. Morgan Large Cap Funds | |
FUND COMMENTARY
TWELVE MONTHS ENDED June 30, 2023 (Unaudited) (continued)
*
The return shown is based on net asset values calculated for shareholder transactions and may differ from the return shown in the financial highlights, which reflects adjustments made to the net asset values in accordance with accounting principles generally accepted in the United States of America.
**
The adviser seeks to achieve the Fund’s objective. There can be no guarantee it will be achieved.
| J.P. Morgan Large Cap Funds | |
AVERAGE ANNUAL TOTAL RETURNS AS OF June 30, 2023
|
| Sales Charge for Class A Shares is 5.25%. |
| Assumes a 1% CDSC (contingent deferred sales charge) for the one year period and 0% CDSC thereafter. |
TEN YEAR FUND PERFORMANCE (6/30/13 TO 6/30/23)
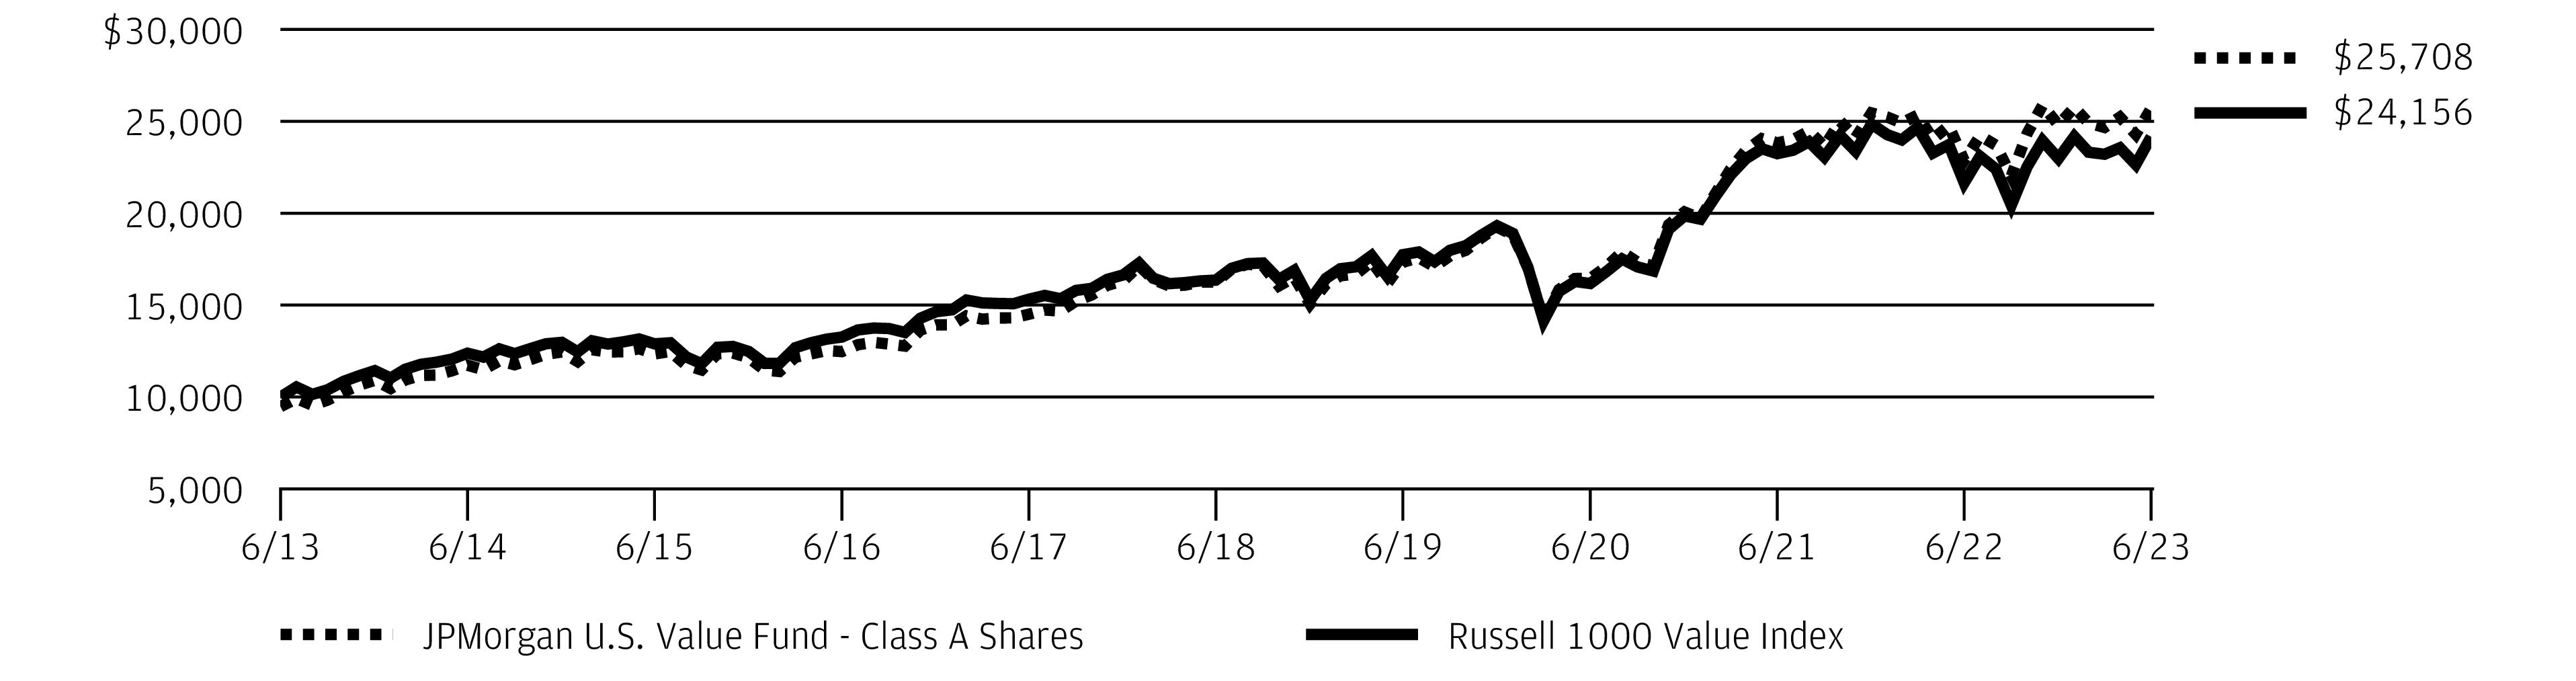
The performance quoted is past performance and is not a guarantee of future results. Mutual funds are subject to certain market risks. Investment returns and principal value of an investment will fluctuate so that an investor’s shares, when redeemed, may be worth more or less than their original cost. Current performance may be higher or lower than the performance data shown. For up-to-date month-end performance information please call 1-800-480-4111.
Returns for Class R2 Shares prior to their inception date are based on the performance of Class A Shares. The actual returns of Class R2 Shares would have been lower than those shown because Class R2 Shares have higher expenses than Class A Shares.
Returns for Class R3 Shares prior to their inception date are based on the performance of the Class A Shares. The actual returns of Class R3 Shares would have been similar to those shown because Class R3 Shares have similar expenses to Class A Shares.
Returns for Class R4 Shares prior to their inception date are based on the performance of the Class I Shares. The actual returns of Class R4 Shares would have been similar to those shown because Class R4 Shares have similar expenses to Class I Shares.
Returns for Class R5 and Class R6 Shares prior to their inception date are based on the performance of Class I Shares. The actual returns of Class R5 and Class R6 Shares would have been different than those shown because Class R5 and Class R6 Shares have different expenses than Class I Shares.
The graph illustrates comparative performance for $10,000 invested in Class A Shares of the JPMorgan U.S. Value Fund and the Russell 1000 Value Index from
June 30, 2013 to June 30, 2023. The performance of the Fund assumes reinvestment of all dividends and capital gain distributions, if any, and includes a sales charge. The performance of the Russell 1000 Value Index does not reflect the deduction of expenses or a sales charge associated with a mutual fund and has been adjusted to reflect reinvestment of all dividends and capital gain distributions of the securities included in the benchmarks, if applicable. The Russell 1000 Value Index is an unmanaged index, which measures the performance of those Russell 1000 companies with lower price-to-book ratios and lower forecasted growth values. Investors cannot invest directly in an index.
Class A Shares have a $1,000 minimum initial investment and carry a 5.25% sales charge.
Fund performance may reflect the waiver of the Fund’s fees and reimbursement of expenses for certain periods. Without these waivers and reimbursements, performance would have been lower. Also, performance shown in this section does not reflect the deduction of taxes that a shareholder would pay on Fund distributions or on gains resulting from redemptions of Fund shares.
Because Class C Shares automatically convert to Class A Shares after 8 years, the 10 year average annual total return shown above for Class C reflects Class A performance for the period after conversion.
The returns shown are based on net asset values calculated for shareholder transactions and may differ from the returns shown in the financial highlights, which reflect adjustments made to the net asset values in accordance with accounting principles generally accepted in the United States of America.
| J.P. Morgan Large Cap Funds | |
JPMorgan Equity Income Fund
SCHEDULE OF PORTFOLIO INVESTMENTS
AS OF June 30, 2023
| | |
|
Aerospace & Defense — 5.3% |
| | |
| | |
Raytheon Technologies Corp. | | |
| | |
Air Freight & Logistics — 1.6% |
United Parcel Service, Inc., Class B | | |
|
| | |
| | |
PNC Financial Services Group, Inc. (The) | | |
| | |
| | |
| | |
|
| | |
| | |
| | |
|
| | |
| | |
| | |
|
| | |
Charles Schwab Corp. (The) | | |
| | |
| | |
| | |
T. Rowe Price Group, Inc. | | |
| | |
|
Air Products and Chemicals, Inc. | | |
| | |
| | |
Commercial Services & Supplies — 1.0% |
| | |
|
| | |
Capital One Financial Corp. | | |
| | |
| | |
|
Consumer Staples Distribution & Retail — 2.8% |
| | |
| | |
| | |
Diversified Telecommunication Services — 0.6% |
Verizon Communications, Inc. | | |
Electric Utilities — 2.5% |
| | |
| | |
| | |
Electrical Equipment — 1.2% |
| | |
Electronic Equipment, Instruments & Components — 0.7% |
| | |
|
Mondelez International, Inc., Class A | | |
Ground Transportation — 1.7% |
| | |
Health Care Equipment & Supplies — 3.2% |
| | |
| | |
| | |
| | |
Health Care Providers & Services — 5.4% |
| | |
| | |
| | |
| | |
| | |
|
| | |
Hotels, Restaurants & Leisure — 2.5% |
| | |
| | |
| | |
Household Products — 1.4% |
Procter & Gamble Co. (The) | | |
|
| | |
SEE NOTES TO FINANCIAL STATEMENTS.
| J.P. Morgan Large Cap Funds | |
| | |
Common Stocks — continued |
|
| | |
| | |
Hartford Financial Services Group, Inc. (The) | | |
Marsh & McLennan Cos., Inc. | | |
| | |
| | |
| | |
|
| | |
International Business Machines Corp. | | |
| | |
|
| | |
| | |
| | |
| | |
|
| | |
|
| | |
| | |
Public Service Enterprise Group, Inc. | | |
| | |
|
Alexandria Real Estate Equities, Inc. | | |
| | |
| | |
Oil, Gas & Consumable Fuels — 8.5% |
| | |
| | |
| | |
| | |
| | |
|
| | |
| | |
| | |
| | |
| | |
| | |
| | |
|
|
AvalonBay Communities, Inc. | | |
Semiconductors & Semiconductor Equipment — 5.0% |
| | |
| | |
NXP Semiconductors NV (China) | | |
| | |
| | |
|
| | |
|
| | |
| | |
| | |
| | |
| | |
| | |
Technology Hardware, Storage & Peripherals — 0.9% |
| | |
Seagate Technology Holdings plc | | |
| | |
|
Philip Morris International, Inc. | | |
Total Common Stocks
(Cost $33,493,801) | | |
Short-Term Investments — 2.0% |
Investment Companies — 2.0% |
JPMorgan Prime Money Market Fund Class IM Shares, 5.23% (a) (b)
(Cost $951,325) | | |
Total Investments — 100.2%
(Cost $34,445,126) | | |
Liabilities in Excess of Other Assets — (0.2)% | | |
| | |
Percentages indicated are based on net assets. |
SEE NOTES TO FINANCIAL STATEMENTS.
| J.P. Morgan Large Cap Funds | |
JPMorgan Equity Income Fund
SCHEDULE OF PORTFOLIO INVESTMENTS
AS OF June 30, 2023 (continued)
| |
| Real Estate Investment Trust |
| Investment in an affiliated fund, which is registered under the Investment Company Act of 1940, as amended, and is advised by J.P. Morgan Investment Management Inc. |
| The rate shown is the current yield as of June 30, 2023. |
SEE NOTES TO FINANCIAL STATEMENTS.
| J.P. Morgan Large Cap Funds | |
JPMorgan Equity Index Fund
SCHEDULE OF PORTFOLIO INVESTMENTS
AS OF June 30, 2023
| | |
|
Aerospace & Defense — 1.7% |
| | |
| | |
| | |
| | |
Huntington Ingalls Industries, Inc. | | |
L3Harris Technologies, Inc. | | |
| | |
| | |
Raytheon Technologies Corp. | | |
| | |
| | |
| | |
Air Freight & Logistics — 0.6% |
CH Robinson Worldwide, Inc. | | |
Expeditors International of Washington, Inc. | | |
| | |
United Parcel Service, Inc., Class B | | |
| | |
Automobile Components — 0.1% |
| | |
| | |
| | |
|
| | |
| | |
| | |
| | |
|
| | |
| | |
Citizens Financial Group, Inc. | | |
| | |
| | |
Huntington Bancshares, Inc. | | |
| | |
| | |
| | |
PNC Financial Services Group, Inc. (The) | | |
| | |
| | |
| | |
| | |
|
|
| | |
| | |
| | |
|
Brown-Forman Corp., Class B | | |
| | |
Constellation Brands, Inc., Class A | | |
| | |
Molson Coors Beverage Co., Class B | | |
| | |
| | |
| | |
|
| | |
| | |
| | |
| | |
| | |
| | |
Regeneron Pharmaceuticals, Inc. * | | |
Vertex Pharmaceuticals, Inc. * | | |
| | |
|
| | |
| | |
| | |
| | |
|
| | |
| | |
| | |
Johnson Controls International plc | | |
| | |
| | |
| | |
|
Ameriprise Financial, Inc. | | |
Bank of New York Mellon Corp. (The) | | |
| | |
Cboe Global Markets, Inc. | | |
Charles Schwab Corp. (The) | | |
SEE NOTES TO FINANCIAL STATEMENTS.
JPMorgan Equity Index Fund
SCHEDULE OF PORTFOLIO INVESTMENTS
AS OF June 30, 2023 (continued)
| | |
Common Stocks — continued |
Capital Markets — continued |
| | |
FactSet Research Systems, Inc. | | |
Franklin Resources, Inc. (b) | | |
Goldman Sachs Group, Inc. (The) | | |
Intercontinental Exchange, Inc. | | |
| | |
MarketAxess Holdings, Inc. | | |
| | |
| | |
| | |
| | |
| | |
Raymond James Financial, Inc. | | |
| | |
| | |
T. Rowe Price Group, Inc. | | |
| | |
|
Air Products and Chemicals, Inc. | | |
| | |
| | |
CF Industries Holdings, Inc. | | |
| | |
| | |
| | |
| | |
| | |
| | |
International Flavors & Fragrances, Inc. | | |
| | |
LyondellBasell Industries NV, Class A | | |
| | |
| | |
Sherwin-Williams Co. (The) | | |
| | |
Commercial Services & Supplies — 0.5% |
| | |
| | |
| | |
| | |
| | |
| | |
| | |
|
Communications Equipment — 0.9% |
| | |
| | |
| | |
| | |
| | |
| | |
Construction & Engineering — 0.1% |
| | |
Construction Materials — 0.2% |
Martin Marietta Materials, Inc. | | |
| | |
| | |
|
| | |
Capital One Financial Corp. | | |
Discover Financial Services | | |
| | |
| | |
Consumer Staples Distribution & Retail — 1.8% |
| | |
| | |
| | |
| | |
| | |
| | |
Walgreens Boots Alliance, Inc. | | |
| | |
| | |
Containers & Packaging — 0.2% |
| | |
| | |
| | |
| | |
Packaging Corp. of America | | |
| | |
| | |
| | |
|
| | |
SEE NOTES TO FINANCIAL STATEMENTS.
| | |
Common Stocks — continued |
|
| | |
| | |
| | |
Diversified Telecommunication Services — 0.7% |
| | |
Verizon Communications, Inc. | | |
| | |
Electric Utilities — 1.7% |
| | |
American Electric Power Co., Inc. | | |
Constellation Energy Corp. | | |
| | |
| | |
| | |
| | |
| | |
| | |
| | |
| | |
| | |
| | |
Pinnacle West Capital Corp. | | |
| | |
| | |
| | |
| | |
Electrical Equipment — 0.6% |
| | |
| | |
| | |
| | |
Rockwell Automation, Inc. | | |
| | |
Electronic Equipment, Instruments & Components — 0.6% |
| | |
| | |
| | |
Keysight Technologies, Inc. * | | |
| | |
Teledyne Technologies, Inc. * | | |
| | |
|
Electronic Equipment, Instruments & Components — continued |
| | |
Zebra Technologies Corp., Class A * | | |
| | |
Energy Equipment & Services — 0.4% |
| | |
| | |
| | |
| | |
|
Activision Blizzard, Inc. * | | |
| | |
Live Nation Entertainment, Inc. * | | |
| | |
Take-Two Interactive Software, Inc. * | | |
| | |
Warner Bros Discovery, Inc. * | | |
| | |
Financial Services — 4.2% |
Berkshire Hathaway, Inc., Class B * | | |
Fidelity National Information Services, Inc. | | |
| | |
FleetCor Technologies, Inc. * | | |
| | |
Jack Henry & Associates, Inc. | | |
Mastercard, Inc., Class A | | |
| | |
| | |
| | |
|
Archer-Daniels-Midland Co. | | |
| | |
| | |
| | |
| | |
| | |
| | |
| | |
| | |
| | |
Lamb Weston Holdings, Inc. | | |
McCormick & Co., Inc. (Non-Voting) (b) | | |
SEE NOTES TO FINANCIAL STATEMENTS.
JPMorgan Equity Index Fund
SCHEDULE OF PORTFOLIO INVESTMENTS
AS OF June 30, 2023 (continued)
| | |
Common Stocks — continued |
Food Products — continued |
Mondelez International, Inc., Class A | | |
Tyson Foods, Inc., Class A | | |
| | |
|
| | |
Ground Transportation — 0.8% |
| | |
JB Hunt Transport Services, Inc. | | |
| | |
Old Dominion Freight Line, Inc. | | |
| | |
| | |
Health Care Equipment & Supplies — 2.9% |
| | |
| | |
Baxter International, Inc. | | |
| | |
Boston Scientific Corp. * | | |
| | |
| | |
| | |
Edwards Lifesciences Corp. * | | |
GE HealthCare Technologies, Inc. | | |
| | |
IDEXX Laboratories, Inc. * | | |
| | |
Intuitive Surgical, Inc. * | | |
| | |
| | |
| | |
| | |
| | |
Zimmer Biomet Holdings, Inc. | | |
| | |
Health Care Providers & Services — 2.9% |
| | |
| | |
| | |
| | |
| | |
| | |
| | |
| | |
|
Health Care Providers & Services — continued |
| | |
| | |
| | |
Laboratory Corp. of America Holdings | | |
| | |
Molina Healthcare, Inc. * | | |
| | |
| | |
Universal Health Services, Inc., Class B | | |
| | |
|
Healthpeak Properties, Inc. | | |
| | |
| | |
| | |
Hotel & Resort REITs — 0.0% ^ |
Host Hotels & Resorts, Inc. | | |
Hotels, Restaurants & Leisure — 2.1% |
| | |
Caesars Entertainment, Inc. * | | |
| | |
Chipotle Mexican Grill, Inc. * | | |
| | |
| | |
| | |
Hilton Worldwide Holdings, Inc. | | |
| | |
Marriott International, Inc., Class A | | |
| | |
MGM Resorts International | | |
Norwegian Cruise Line Holdings Ltd. * (b) | | |
Royal Caribbean Cruises Ltd. * | | |
| | |
| | |
| | |
| | |
Household Durables — 0.4% |
| | |
| | |
| | |
Mohawk Industries, Inc. * | | |
| | |
SEE NOTES TO FINANCIAL STATEMENTS.
| | |
Common Stocks — continued |
Household Durables — continued |
| | |
| | |
| | |
| | |
Household Products — 1.4% |
Church & Dwight Co., Inc. | | |
| | |
| | |
| | |
Procter & Gamble Co. (The) | | |
| | |
Independent Power and Renewable Electricity Producers — 0.0% ^ |
| | |
Industrial Conglomerates — 0.8% |
| | |
| | |
Honeywell International, Inc. | | |
| | |
|
| | |
|
| | |
| | |
American International Group, Inc. | | |
| | |
Arch Capital Group Ltd. * | | |
| | |
| | |
| | |
| | |
Cincinnati Financial Corp. | | |
| | |
| | |
Hartford Financial Services Group, Inc. (The) | | |
| | |
| | |
Marsh & McLennan Cos., Inc. | | |
| | |
Principal Financial Group, Inc. | | |
| | |
Prudential Financial, Inc. | | |
| | |
|
|
Travelers Cos., Inc. (The) | | |
| | |
| | |
| | |
Interactive Media & Services — 5.3% |
Alphabet, Inc., Class A * | | |
Alphabet, Inc., Class C * | | |
| | |
Meta Platforms, Inc., Class A * | | |
| | |
|
| | |
Akamai Technologies, Inc. * | | |
Cognizant Technology Solutions Corp., Class A | | |
| | |
| | |
| | |
International Business Machines Corp. | | |
| | |
| | |
Leisure Products — 0.0% ^ |
| | |
Life Sciences Tools & Services — 1.6% |
Agilent Technologies, Inc. | | |
Bio-Rad Laboratories, Inc., Class A * | | |
| | |
Charles River Laboratories International, Inc. * | | |
| | |
| | |
| | |
Mettler-Toledo International, Inc. * | | |
| | |
Thermo Fisher Scientific, Inc. | | |
| | |
West Pharmaceutical Services, Inc. | | |
| | |
|
| | |
| | |
| | |
| | |
SEE NOTES TO FINANCIAL STATEMENTS.
JPMorgan Equity Index Fund
SCHEDULE OF PORTFOLIO INVESTMENTS
AS OF June 30, 2023 (continued)
| | |
Common Stocks — continued |
|
| | |
| | |
Illinois Tool Works, Inc. | | |
| | |
| | |
| | |
| | |
| | |
| | |
| | |
Stanley Black & Decker, Inc. | | |
Westinghouse Air Brake Technologies Corp. | | |
| | |
| | |
|
Charter Communications, Inc., Class A * | | |
| | |
| | |
| | |
Interpublic Group of Cos., Inc. (The) | | |
| | |
| | |
| | |
Paramount Global, Class B (b) | | |
| | |
|
| | |
| | |
| | |
| | |
| | |
|
| | |
| | |
| | |
Consolidated Edison, Inc. | | |
| | |
| | |
| | |
Public Service Enterprise Group, Inc. | | |
| | |
|
Multi-Utilities — continued |
| | |
| | |
| | |
|
Alexandria Real Estate Equities, Inc. | | |
| | |
| | |
Oil, Gas & Consumable Fuels — 3.7% |
| | |
| | |
| | |
| | |
| | |
| | |
| | |
| | |
| | |
| | |
| | |
| | |
| | |
Occidental Petroleum Corp. | | |
| | |
| | |
Pioneer Natural Resources Co. (b) | | |
| | |
| | |
Williams Cos., Inc. (The) | | |
| | |
Passenger Airlines — 0.2% |
| | |
American Airlines Group, Inc. * | | |
| | |
| | |
United Airlines Holdings, Inc. * | | |
| | |
Personal Care Products — 0.1% |
Estee Lauder Cos., Inc. (The), Class A | | |
|
| | |
| | |
SEE NOTES TO FINANCIAL STATEMENTS.
| | |
Common Stocks — continued |
Pharmaceuticals — continued |
| | |
| | |
| | |
| | |
| | |
| | |
| | |
| | |
Professional Services — 0.8% |
Automatic Data Processing, Inc. | | |
Broadridge Financial Solutions, Inc. | | |
Ceridian HCM Holding, Inc. * | | |
| | |
| | |
| | |
| | |
| | |
| | |
Robert Half International, Inc. | | |
Verisk Analytics, Inc. (b) | | |
| | |
Real Estate Management & Development — 0.1% |
CBRE Group, Inc., Class A * | | |
|
AvalonBay Communities, Inc. | | |
| | |
| | |
Essex Property Trust, Inc. | | |
| | |
Mid-America Apartment Communities, Inc. | | |
| | |
| | |
|
Federal Realty Investment Trust | | |
| | |
| | |
| | |
Simon Property Group, Inc. | | |
| | |
Semiconductors & Semiconductor Equipment — 7.3% |
Advanced Micro Devices, Inc. * | | |
| | |
|
Semiconductors & Semiconductor Equipment — continued |
| | |
| | |
| | |
| | |
| | |
| | |
| | |
| | |
Microchip Technology, Inc. | | |
| | |
Monolithic Power Systems, Inc. | | |
| | |
NXP Semiconductors NV (China) | | |
| | |
| | |
| | |
| | |
SolarEdge Technologies, Inc. * | | |
| | |
| | |
| | |
|
| | |
| | |
| | |
Cadence Design Systems, Inc. * | | |
| | |
| | |
| | |
| | |
| | |
| | |
Palo Alto Networks, Inc. * (b) | | |
| | |
| | |
| | |
| | |
| | |
Tyler Technologies, Inc. * | | |
| | |
|
| | |
| | |
SEE NOTES TO FINANCIAL STATEMENTS.
JPMorgan Equity Index Fund
SCHEDULE OF PORTFOLIO INVESTMENTS
AS OF June 30, 2023 (continued)
| | |
Common Stocks — continued |
Specialized REITs — continued |
Digital Realty Trust, Inc. (b) | | |
| | |
Extra Space Storage, Inc. | | |
| | |
| | |
| | |
| | |
| | |
| | |
|
| | |
| | |
| | |
| | |
| | |
| | |
| | |
O'Reilly Automotive, Inc. * | | |
| | |
| | |
| | |
| | |
| | |
Technology Hardware, Storage & Peripherals — 7.9% |
| | |
Hewlett Packard Enterprise Co. | | |
| | |
| | |
Seagate Technology Holdings plc | | |
| | |
| | |
Textiles, Apparel & Luxury Goods — 0.4% |
| | |
| | |
| | |
| | |
| | |
|
| | |
Philip Morris International, Inc. | | |
| | |
| | |
|
Trading Companies & Distributors — 0.3% |
| | |
| | |
| | |
| | |
|
American Water Works Co., Inc. | | |
Wireless Telecommunication Services — 0.2% |
| | |
Total Common Stocks
(Cost $3,630,221) | | |
| | |
|
Health Care Equipment & Supplies — 0.0% ^ |
ABIOMED, Inc., CVR ‡ *
(Cost $10) | | |
| | |
Short-Term Investments — 1.9% |
Investment Companies — 0.3% |
JPMorgan U.S. Government Money Market Fund Class Institutional Shares, 4.97% (c) (d)
(Cost $27,916) | | |
Investment of Cash Collateral from Securities Loaned — 1.6% |
JPMorgan Securities Lending Money Market Fund Agency SL Class Shares, 5.29% (c) (d) | | |
JPMorgan U.S. Government Money Market Fund Class IM Shares, 5.05% (c) (d) | | |
Total Investment of Cash Collateral from Securities Loaned
(Cost $124,693) | | |
Total Short-Term Investments
(Cost $152,609) | | |
Total Investments — 101.5%
(Cost $3,782,840) | | |
Liabilities in Excess of Other Assets — (1.5)% | | |
| | |
Percentages indicated are based on net assets. |
SEE NOTES TO FINANCIAL STATEMENTS.
| |
| |
| Real Estate Investment Trust |
| Amount rounds to less than 0.1% of net assets. |
| Value determined using significant unobservable inputs. | |
| Non-income producing security. | |
| Investment in affiliate. This security is included in an index in which the Fund, as an index fund, tracks. | |
| The security or a portion of this security is on loan at June 30, 2023. The total value of securities on loan at June 30, 2023 is $123,854. | |
| Investment in an affiliated fund, which is registered under the Investment Company Act of 1940, as amended, and is advised by J.P. Morgan Investment Management Inc. | |
| The rate shown is the current yield as of June 30, 2023. | |
Futures contracts outstanding as of June 30, 2023 (amounts in thousands, except number of contracts):
| | | | | VALUE AND
UNREALIZED
APPRECIATION
(DEPRECIATION) ($) |
| | | | | |
| | | | | |
SEE NOTES TO FINANCIAL STATEMENTS.
JPMorgan Equity Premium Income Fund
SCHEDULE OF PORTFOLIO INVESTMENTS
AS OF June 30, 2023
| | |
|
Aerospace & Defense — 1.6% |
| | |
Raytheon Technologies Corp. | | |
| | |
| | |
Air Freight & Logistics — 1.6% |
| | |
United Parcel Service, Inc., Class B | | |
| | |
|
| | |
|
| | |
Constellation Brands, Inc., Class A | | |
| | |
| | |
| | |
|
| | |
| | |
Regeneron Pharmaceuticals, Inc. * | | |
Vertex Pharmaceuticals, Inc. * | | |
| | |
|
| | |
|
| | |
|
| | |
Intercontinental Exchange, Inc. | | |
Raymond James Financial, Inc. | | |
| | |
| | |
|
Air Products and Chemicals, Inc. | | |
| | |
| | |
LyondellBasell Industries NV, Class A | | |
| | |
| | |
| | |
|
Communications Equipment — 0.2% |
| | |
|
| | |
Consumer Staples Distribution & Retail — 2.0% |
| | |
| | |
| | |
Containers & Packaging — 0.2% |
| | |
Electric Utilities — 2.1% |
| | |
| | |
| | |
| | |
Electrical Equipment — 1.3% |
| | |
Electronic Equipment, Instruments & Components — 0.6% |
Keysight Technologies, Inc. * | | |
|
| | |
Financial Services — 5.1% |
Berkshire Hathaway, Inc., Class B * | | |
FleetCor Technologies, Inc. * | | |
Jack Henry & Associates, Inc. | | |
Mastercard, Inc., Class A | | |
| | |
| | |
|
| | |
Mondelez International, Inc., Class A | | |
| | |
Ground Transportation — 2.7% |
| | |
| | |
Old Dominion Freight Line, Inc. | | |
| | |
| | |
Health Care Equipment & Supplies — 0.3% |
Boston Scientific Corp. * | | |
SEE NOTES TO FINANCIAL STATEMENTS.
| J.P. Morgan Large Cap Funds | |
| | |
Common Stocks — continued |
Health Care Providers & Services — 2.5% |
| | |
| | |
| | |
| | |
| | |
Hotels, Restaurants & Leisure — 3.3% |
| | |
Chipotle Mexican Grill, Inc. * | | |
| | |
| | |
| | |
Household Products — 3.4% |
| | |
| | |
Procter & Gamble Co. (The) | | |
| | |
Industrial Conglomerates — 1.3% |
Honeywell International, Inc. | | |
|
| | |
|
| | |
| | |
Travelers Cos., Inc. (The) | | |
| | |
Interactive Media & Services — 2.2% |
Alphabet, Inc., Class A * | | |
Meta Platforms, Inc., Class A * | | |
| | |
|
| | |
Cognizant Technology Solutions Corp., Class A | | |
| | |
| | |
Life Sciences Tools & Services — 1.4% |
| | |
Thermo Fisher Scientific, Inc. | | |
| | |
| | |
|
|
| | |
| | |
| | |
| | |
|
Charter Communications, Inc., Class A * | | |
| | |
| | |
|
| | |
| | |
| | |
Public Service Enterprise Group, Inc. | | |
| | |
| | |
Oil, Gas & Consumable Fuels — 2.4% |
| | |
| | |
| | |
| | |
| | |
Personal Care Products — 0.0% ^ |
| | |
|
| | |
| | |
| | |
| | |
| | |
Professional Services — 0.2% |
Automatic Data Processing, Inc. | | |
Booz Allen Hamilton Holding Corp. | | |
| | |
|
| | |
| | |
| | |
Semiconductors & Semiconductor Equipment — 4.3% |
| | |
ASML Holding NV (Registered), NYRS (Netherlands) | | |
SEE NOTES TO FINANCIAL STATEMENTS.
| J.P. Morgan Large Cap Funds | |
JPMorgan Equity Premium Income Fund
SCHEDULE OF PORTFOLIO INVESTMENTS
AS OF June 30, 2023 (continued)
| | |
Common Stocks — continued |
Semiconductors & Semiconductor Equipment — continued |
NXP Semiconductors NV (China) | | |
| | |
| | |
|
| | |
Cadence Design Systems, Inc. * | | |
| | |
| | |
| | |
| | |
| | |
|
| | |
| | |
| | |
| | |
|
| | |
| | |
| | |
O'Reilly Automotive, Inc. * | | |
| | |
| | |
| | |
Technology Hardware, Storage & Peripherals — 0.2% |
| | |
Textiles, Apparel & Luxury Goods — 0.2% |
| | |
|
| | |
Philip Morris International, Inc. | | |
| | |
Wireless Telecommunication Services — 0.2% |
| | |
Total Common Stocks
(Cost $4,541,987) | | |
| | |
Equity-Linked Notes — 13.3% |
Barclays Bank plc, ELN, 44.00%, 7/12/2023, (linked to S&P 500 Index) (United Kingdom) (b) | | |
BNP Paribas, ELN, 39.10%, 7/17/2023, (linked to S&P 500 Index) (b) | | |
BNP Paribas, ELN, 40.39%, 8/4/2023, (linked to S&P 500 Index) (b) | | |
BNP Paribas, ELN, 42.16%, 8/7/2023, (linked to S&P 500 Index) (b) | | |
BNP Paribas, ELN, 43.03%, 7/31/2023, (linked to S&P 500 Index) (b) | | |
BofA Finance LLC, ELN, 38.80%, 7/18/2023, (linked to S&P 500 Index) (b) | | |
BofA Finance LLC, ELN, 40.10%, 7/14/2023, (linked to S&P 500 Index) (b) | | |
BofA Finance LLC, ELN, 40.90%, 7/28/2023, (linked to S&P 500 Index) (b) | | |
GS Finance Corp., ELN, 44.60%, 7/10/2023, (linked to S&P 500 Index) (b) | | |
GS Finance Corp., ELN, 45.85%, 7/11/2023, (linked to S&P 500 Index) (b) | | |
National Bank of Canada, ELN, 41.60%, 7/24/2023, (linked to S&P 500 Index) (b) | | |
Royal Bank of Canada, ELN, 41.27%, 8/1/2023, (linked to S&P 500 Index) (Canada) (b) | | |
Royal Bank of Canada, ELN, 42.13%, 8/8/2023, (linked to S&P 500 Index) (Canada) (b) | | |
Royal Bank of Canada, ELN, 42.31%, 7/21/2023, (linked to S&P 500 Index) (Canada) (b) | | |
Royal Bank of Canada, ELN, 45.51%, 7/25/2023, (linked to S&P 500 Index) (Canada) (b) | | |
Total Equity-Linked Notes
(Cost $815,972) | | |
| | |
Short-Term Investments — 3.2% |
Investment Companies — 2.0% |
JPMorgan Prime Money Market Fund Class IM Shares, 5.23% (c) (d)
(Cost $113,862) | | |
Investment of Cash Collateral from Securities Loaned — 1.2% |
JPMorgan Securities Lending Money Market Fund Agency SL Class Shares, 5.29% (c) (d) | | |
SEE NOTES TO FINANCIAL STATEMENTS.
| J.P. Morgan Large Cap Funds | |
| | |
Short-Term Investments — continued |
Investment of Cash Collateral from Securities Loaned — continued |
JPMorgan U.S. Government Money Market Fund Class IM Shares, 5.05% (c) (d) | | |
Total Investment of Cash Collateral from Securities Loaned
(Cost $69,783) | | |
Total Short-Term Investments
(Cost $183,645) | | |
Total Investments — 102.3%
(Cost $5,541,604) | | |
Liabilities in Excess of Other Assets — (2.3)% | | |
| | |
Percentages indicated are based on net assets. |
| |
| |
| |
| Real Estate Investment Trust |
| Amount rounds to less than 0.1% of net assets. |
| Non-income producing security. | |
| The security or a portion of this security is on loan at June 30, 2023. The total value of securities on loan at June 30, 2023 is $69,297. | |
| Securities exempt from registration under Rule 144A or section 4(a)(2), of the Securities Act of 1933, as amended. | |
| Investment in an affiliated fund, which is registered under the Investment Company Act of 1940, as amended, and is advised by J.P. Morgan Investment Management Inc. | |
| The rate shown is the current yield as of June 30, 2023. | |
Futures contracts outstanding as of June 30, 2023 (amounts in thousands, except number of contracts):
| | | | | VALUE AND
UNREALIZED
APPRECIATION
(DEPRECIATION) ($) |
| | | | | |
| | | | | |
SEE NOTES TO FINANCIAL STATEMENTS.
| J.P. Morgan Large Cap Funds | |
JPMorgan Hedged Equity Fund
SCHEDULE OF PORTFOLIO INVESTMENTS
AS OF June 30, 2023
| | |
|
Aerospace & Defense — 1.3% |
| | |
Raytheon Technologies Corp. | | |
| | |
| | |
Air Freight & Logistics — 1.1% |
| | |
United Parcel Service, Inc., Class B (a) | | |
| | |
Automobile Components — 0.2% |
| | |
|
| | |
|
| | |
| | |
| | |
| | |
| | |
| | |
| | |
|
| | |
Constellation Brands, Inc., Class A | | |
| | |
| | |
| | |
|
| | |
| | |
BioMarin Pharmaceutical, Inc. * | | |
Neurocrine Biosciences, Inc. * | | |
Regeneron Pharmaceuticals, Inc. * | | |
Sarepta Therapeutics, Inc. * | | |
Vertex Pharmaceuticals, Inc. * | | |
| | |
|
| | |
| | |
|
|
| | |
| | |
| | |
|
Charles Schwab Corp. (The) | | |
| | |
Intercontinental Exchange, Inc. | | |
| | |
Raymond James Financial, Inc. | | |
| | |
| | |
| | |
|
Air Products and Chemicals, Inc. | | |
| | |
| | |
| | |
LyondellBasell Industries NV, Class A | | |
| | |
| | |
Commercial Services & Supplies — 0.2% |
| | |
Communications Equipment — 0.2% |
| | |
|
| | |
Consumer Staples Distribution & Retail — 1.0% |
Costco Wholesale Corp. (a) | | |
|
| | |
Diversified Telecommunication Services — 0.1% |
| | |
Electric Utilities — 1.3% |
| | |
| | |
| | |
Electrical Equipment — 0.7% |
| | |
SEE NOTES TO FINANCIAL STATEMENTS.
| J.P. Morgan Large Cap Funds | |
| | |
Common Stocks — continued |
Electronic Equipment, Instruments & Components — 0.2% |
| | |
Keysight Technologies, Inc. * | | |
| | |
Energy Equipment & Services — 0.1% |
| | |
|
| | |
Financial Services — 4.3% |
Berkshire Hathaway, Inc., Class B * (a) | | |
FleetCor Technologies, Inc. * | | |
Mastercard, Inc., Class A (a) | | |
| | |
| | |
|
Mondelez International, Inc., Class A (a) | | |
Ground Transportation — 0.9% |
| | |
Norfolk Southern Corp. (a) | | |
Uber Technologies, Inc. * | | |
| | |
| | |
Health Care Equipment & Supplies — 2.5% |
| | |
Baxter International, Inc. | | |
Boston Scientific Corp. * (a) | | |
| | |
Intuitive Surgical, Inc. * | | |
| | |
| | |
| | |
| | |
Health Care Providers & Services — 2.8% |
| | |
| | |
| | |
| | |
| | |
UnitedHealth Group, Inc. (a) | | |
| | |
| | |
|
|
| | |
Hotels, Restaurants & Leisure — 2.8% |
Booking Holdings, Inc. * (a) | | |
Chipotle Mexican Grill, Inc. * | | |
| | |
| | |
Marriott International, Inc., Class A | | |
| | |
Royal Caribbean Cruises Ltd. * | | |
| | |
| | |
Household Durables — 0.3% |
| | |
| | |
| | |
| | |
Household Products — 1.3% |
Church & Dwight Co., Inc. | | |
| | |
Procter & Gamble Co. (The) (a) | | |
| | |
Industrial Conglomerates — 1.1% |
Honeywell International, Inc. (a) | | |
|
| | |
|
| | |
| | |
| | |
Progressive Corp. (The) (a) | | |
Travelers Cos., Inc. (The) | | |
| | |
Interactive Media & Services — 5.4% |
Alphabet, Inc., Class A * (a) | | |
Alphabet, Inc., Class C * (a) | | |
Meta Platforms, Inc., Class A * (a) | | |
| | |
SEE NOTES TO FINANCIAL STATEMENTS.
| J.P. Morgan Large Cap Funds | |
JPMorgan Hedged Equity Fund
SCHEDULE OF PORTFOLIO INVESTMENTS
AS OF June 30, 2023 (continued)
| | |
Common Stocks — continued |
|
| | |
Cognizant Technology Solutions Corp., Class A | | |
| | |
Life Sciences Tools & Services — 1.4% |
| | |
Thermo Fisher Scientific, Inc. (a) | | |
| | |
|
| | |
| | |
| | |
| | |
| | |
|
Charter Communications, Inc., Class A * (a) | | |
Comcast Corp., Class A (a) | | |
| | |
|
| | |
| | |
| | |
|
| | |
| | |
| | |
| | |
Public Service Enterprise Group, Inc. | | |
| | |
Oil, Gas & Consumable Fuels — 3.8% |
| | |
| | |
| | |
| | |
| | |
| | |
| | |
Passenger Airlines — 0.2% |
| | |
| | |
| | |
| | |
|
Personal Care Products — 0.0% ^ |
| | |
|
Bristol-Myers Squibb Co. (a) | | |
| | |
| | |
| | |
| | |
Professional Services — 0.3% |
Booz Allen Hamilton Holding Corp. | | |
| | |
| | |
|
Equity LifeStyle Properties, Inc. | | |
| | |
| | |
| | |
Semiconductors & Semiconductor Equipment — 7.7% |
Advanced Micro Devices, Inc. * (a) | | |
| | |
| | |
| | |
| | |
NXP Semiconductors NV (China) | | |
| | |
| | |
Texas Instruments, Inc. (a) | | |
| | |
|
| | |
Cadence Design Systems, Inc. * | | |
| | |
| | |
| | |
| | |
| | |
| | |
| | |
SEE NOTES TO FINANCIAL STATEMENTS.
| J.P. Morgan Large Cap Funds | |
| | |
Common Stocks — continued |
|
| | |
| | |
| | |
|
| | |
| | |
| | |
Burlington Stores, Inc. * | | |
Home Depot, Inc. (The) (a) | | |
| | |
O'Reilly Automotive, Inc. * | | |
| | |
| | |
| | |
Technology Hardware, Storage & Peripherals — 7.8% |
| | |
Seagate Technology Holdings plc | | |
| | |
Textiles, Apparel & Luxury Goods — 0.5% |
| | |
|
| | |
Philip Morris International, Inc. | | |
| | |
Wireless Telecommunication Services — 0.2% |
| | |
Total Common Stocks
(Cost $10,058,702) | | |
| | |
|
Put Options Purchased — 0.9% |
| | |
9/29/2023 at USD 4,210.00 , European Style | | |
| | |
|
|
Notional Amount: USD 15,852,699 | | |
Counterparty: Exchange-Traded *
(Cost $149,537) | | |
| | |
Short-Term Investments — 1.2% |
Investment Companies — 1.2% |
JPMorgan U.S. Government Money Market Fund Class Institutional Shares, 4.97% (b) (c)
(Cost $185,159) | | |
Total Investments — 98.7%
(Cost $10,393,398) | | |
Other Assets Less Liabilities — 1.3% | | |
| | |
Percentages indicated are based on net assets. |
| |
| Real Estate Investment Trust |
| Amount rounds to less than 0.1% of net assets. |
| Non-income producing security. | |
| All or a portion of the security is segregated for options written. | |
| Investment in an affiliated fund, which is registered under the Investment Company Act of 1940, as amended, and is advised by J.P. Morgan Investment Management Inc. | |
| The rate shown is the current yield as of June 30, 2023. | |
SEE NOTES TO FINANCIAL STATEMENTS.
| J.P. Morgan Large Cap Funds | |
JPMorgan Hedged Equity Fund
SCHEDULE OF PORTFOLIO INVESTMENTS
AS OF June 30, 2023 (continued)
Futures contracts outstanding as of June 30, 2023 (amounts in thousands, except number of contracts):
| | | | | VALUE AND
UNREALIZED
APPRECIATION
(DEPRECIATION) ($) |
| | | | | |
| | | | | |
Written Call Options Contracts as of June 30, 2023 (amounts in thousands, except number of contracts):
|
| | | | | | |
| | | | | | |
Written Put Options Contracts as of June 30, 2023 (amounts in thousands, except number of contracts):
|
| | | | | | |
| | | | | | |
Total Written Options Contracts (Premiums Received $141,736) | |
SEE NOTES TO FINANCIAL STATEMENTS.
| J.P. Morgan Large Cap Funds | |
JPMorgan Hedged Equity 2 Fund
SCHEDULE OF PORTFOLIO INVESTMENTS
AS OF June 30, 2023
| | |
|
Aerospace & Defense — 1.3% |
| | |
Raytheon Technologies Corp. | | |
| | |
| | |
Air Freight & Logistics — 1.2% |
| | |
United Parcel Service, Inc., Class B | | |
| | |
Automobile Components — 0.2% |
| | |
|
| | |
|
| | |
| | |
| | |
| | |
| | |
| | |
| | |
|
| | |
Constellation Brands, Inc., Class A | | |
| | |
| | |
| | |
|
| | |
| | |
BioMarin Pharmaceutical, Inc. * | | |
Neurocrine Biosciences, Inc. * | | |
Regeneron Pharmaceuticals, Inc. * | | |
Sarepta Therapeutics, Inc. * | | |
Vertex Pharmaceuticals, Inc. * | | |
| | |
|
| | |
| | |
|
|
| | |
| | |
| | |
|
Charles Schwab Corp. (The) | | |
| | |
Intercontinental Exchange, Inc. | | |
| | |
Raymond James Financial, Inc. | | |
| | |
| | |
| | |
|
Air Products and Chemicals, Inc. | | |
| | |
| | |
| | |
LyondellBasell Industries NV, Class A | | |
| | |
| | |
Commercial Services & Supplies — 0.2% |
| | |
Communications Equipment — 0.2% |
| | |
|
| | |
Consumer Staples Distribution & Retail — 1.0% |
| | |
|
| | |
Diversified Telecommunication Services — 0.1% |
| | |
Electric Utilities — 1.3% |
| | |
| | |
| | |
Electrical Equipment — 0.7% |
| | |
SEE NOTES TO FINANCIAL STATEMENTS.
| J.P. Morgan Large Cap Funds | |
JPMorgan Hedged Equity 2 Fund
SCHEDULE OF PORTFOLIO INVESTMENTS
AS OF June 30, 2023 (continued)
| | |
Common Stocks — continued |
Electronic Equipment, Instruments & Components — 0.2% |
| | |
Keysight Technologies, Inc. * | | |
| | |
Energy Equipment & Services — 0.2% |
| | |
|
| | |
Financial Services — 4.5% |
Berkshire Hathaway, Inc., Class B * | | |
FleetCor Technologies, Inc. * | | |
Mastercard, Inc., Class A (a) | | |
| | |
| | |
|
Mondelez International, Inc., Class A | | |
Ground Transportation — 1.0% |
| | |
| | |
Uber Technologies, Inc. * | | |
| | |
| | |
Health Care Equipment & Supplies — 2.6% |
| | |
Baxter International, Inc. | | |
Boston Scientific Corp. * | | |
| | |
Intuitive Surgical, Inc. * | | |
| | |
| | |
| | |
| | |
Health Care Providers & Services — 2.9% |
| | |
| | |
| | |
| | |
| | |
UnitedHealth Group, Inc. (a) | | |
| | |
| | |
|
|
| | |
Hotels, Restaurants & Leisure — 2.9% |
| | |
Chipotle Mexican Grill, Inc. * | | |
| | |
| | |
Marriott International, Inc., Class A | | |
| | |
Royal Caribbean Cruises Ltd. * | | |
| | |
| | |
Household Durables — 0.3% |
| | |
| | |
| | |
| | |
Household Products — 1.4% |
Church & Dwight Co., Inc. | | |
| | |
Procter & Gamble Co. (The) | | |
| | |
Industrial Conglomerates — 1.2% |
Honeywell International, Inc. | | |
|
| | |
|
| | |
| | |
| | |
| | |
Travelers Cos., Inc. (The) | | |
| | |
Interactive Media & Services — 5.6% |
Alphabet, Inc., Class A * (a) | | |
Alphabet, Inc., Class C * | | |
Meta Platforms, Inc., Class A * (a) | | |
| | |
SEE NOTES TO FINANCIAL STATEMENTS.
| J.P. Morgan Large Cap Funds | |
| | |
Common Stocks — continued |
|
| | |
Cognizant Technology Solutions Corp., Class A | | |
| | |
Life Sciences Tools & Services — 1.5% |
| | |
Thermo Fisher Scientific, Inc. | | |
| | |
|
| | |
| | |
| | |
| | |
| | |
|
Charter Communications, Inc., Class A * | | |
| | |
| | |
|
| | |
| | |
| | |
|
| | |
| | |
| | |
| | |
Public Service Enterprise Group, Inc. | | |
| | |
Oil, Gas & Consumable Fuels — 4.0% |
| | |
| | |
| | |
| | |
| | |
| | |
| | |
Passenger Airlines — 0.3% |
| | |
| | |
| | |
| | |
|
Personal Care Products — 0.0% ^ |
| | |
|
| | |
| | |
| | |
| | |
| | |
Professional Services — 0.3% |
Booz Allen Hamilton Holding Corp. | | |
| | |
| | |
|
Equity LifeStyle Properties, Inc. | | |
| | |
| | |
| | |
Semiconductors & Semiconductor Equipment — 8.1% |
Advanced Micro Devices, Inc. * | | |
| | |
| | |
| | |
| | |
NXP Semiconductors NV (China) | | |
| | |
| | |
| | |
| | |
|
| | |
Cadence Design Systems, Inc. * | | |
| | |
| | |
| | |
| | |
| | |
| | |
| | |
SEE NOTES TO FINANCIAL STATEMENTS.
| J.P. Morgan Large Cap Funds | |
JPMorgan Hedged Equity 2 Fund
SCHEDULE OF PORTFOLIO INVESTMENTS
AS OF June 30, 2023 (continued)
| | |
Common Stocks — continued |
|
| | |
| | |
| | |
|
| | |
| | |
| | |
Burlington Stores, Inc. * | | |
| | |
| | |
O'Reilly Automotive, Inc. * | | |
| | |
| | |
| | |
Technology Hardware, Storage & Peripherals — 8.2% |
| | |
Seagate Technology Holdings plc | | |
| | |
Textiles, Apparel & Luxury Goods — 0.5% |
| | |
|
| | |
Philip Morris International, Inc. | | |
| | |
Wireless Telecommunication Services — 0.3% |
| | |
Total Common Stocks
(Cost $4,054,912) | | |
| | |
|
Put Options Purchased — 0.1% |
| | |
7/31/2023 at USD 3,945.00 , European Style | | |
| | |
|
|
Notional Amount: USD 4,757,901 | | |
Counterparty: Exchange-Traded *
(Cost $65,416) | | |
| | |
Short-Term Investments — 1.9% |
Investment Companies — 1.9% |
JPMorgan U.S. Government Money Market Fund Class IM Shares, 5.05% (b) (c)
(Cost $87,650) | | |
Total Investments — 103.1%
(Cost $4,207,978) | | |
Liabilities in Excess of Other Assets — (3.1)% | | |
| | |
Percentages indicated are based on net assets. |
| |
| Real Estate Investment Trust |
| Amount rounds to less than 0.1% of net assets. |
| Non-income producing security. | |
| All or a portion of the security is segregated for options written. | |
| Investment in an affiliated fund, which is registered under the Investment Company Act of 1940, as amended, and is advised by J.P. Morgan Investment Management Inc. | |
| The rate shown is the current yield as of June 30, 2023. | |
SEE NOTES TO FINANCIAL STATEMENTS.
| J.P. Morgan Large Cap Funds | |
Futures contracts outstanding as of June 30, 2023 (amounts in thousands, except number of contracts):
| | | | | VALUE AND
UNREALIZED
APPRECIATION
(DEPRECIATION) ($) |
| | | | | |
| | | | | |
Written Call Options Contracts as of June 30, 2023 (amounts in thousands, except number of contracts):
|
| | | | | | |
| | | | | | |
Written Put Options Contracts as of June 30, 2023 (amounts in thousands, except number of contracts):
|
| | | | | | |
| | | | | | |
Total Written Options Contracts (Premiums Received $66,342) | |
SEE NOTES TO FINANCIAL STATEMENTS.
| J.P. Morgan Large Cap Funds | |
JPMorgan Hedged Equity 3 Fund
SCHEDULE OF PORTFOLIO INVESTMENTS
AS OF June 30, 2023
| | |
|
Aerospace & Defense — 1.3% |
| | |
Raytheon Technologies Corp. | | |
| | |
| | |
Air Freight & Logistics — 1.2% |
| | |
United Parcel Service, Inc., Class B | | |
| | |
Automobile Components — 0.2% |
| | |
|
| | |
|
| | |
| | |
| | |
| | |
| | |
| | |
| | |
|
| | |
Constellation Brands, Inc., Class A | | |
| | |
| | |
| | |
|
| | |
| | |
BioMarin Pharmaceutical, Inc. * | | |
Neurocrine Biosciences, Inc. * | | |
Regeneron Pharmaceuticals, Inc. * | | |
Sarepta Therapeutics, Inc. * | | |
Vertex Pharmaceuticals, Inc. * | | |
| | |
|
| | |
| | |
|
|
| | |
| | |
| | |
|
Charles Schwab Corp. (The) | | |
| | |
Intercontinental Exchange, Inc. | | |
| | |
Raymond James Financial, Inc. | | |
| | |
| | |
| | |
|
Air Products and Chemicals, Inc. | | |
| | |
| | |
| | |
LyondellBasell Industries NV, Class A | | |
| | |
| | |
Commercial Services & Supplies — 0.2% |
| | |
Communications Equipment — 0.2% |
| | |
|
| | |
Consumer Staples Distribution & Retail — 1.1% |
| | |
|
| | |
Diversified Telecommunication Services — 0.1% |
| | |
Electric Utilities — 1.3% |
| | |
| | |
| | |
Electrical Equipment — 0.7% |
| | |
SEE NOTES TO FINANCIAL STATEMENTS.
| J.P. Morgan Large Cap Funds | |
| | |
Common Stocks — continued |
Electronic Equipment, Instruments & Components — 0.2% |
| | |
Keysight Technologies, Inc. * | | |
| | |
Energy Equipment & Services — 0.2% |
| | |
|
| | |
Financial Services — 4.6% |
Berkshire Hathaway, Inc., Class B * | | |
FleetCor Technologies, Inc. * | | |
Mastercard, Inc., Class A (a) | | |
| | |
| | |
|
Mondelez International, Inc., Class A | | |
Ground Transportation — 1.0% |
| | |
| | |
Uber Technologies, Inc. * | | |
| | |
| | |
Health Care Equipment & Supplies — 2.7% |
| | |
Baxter International, Inc. | | |
Boston Scientific Corp. * | | |
| | |
Intuitive Surgical, Inc. * | | |
| | |
| | |
| | |
| | |
Health Care Providers & Services — 3.0% |
| | |
| | |
| | |
| | |
| | |
UnitedHealth Group, Inc. (a) | | |
| | |
| | |
|
|
| | |
Hotels, Restaurants & Leisure — 3.0% |
| | |
Chipotle Mexican Grill, Inc. * | | |
| | |
| | |
Marriott International, Inc., Class A | | |
| | |
Royal Caribbean Cruises Ltd. * | | |
| | |
| | |
Household Durables — 0.3% |
| | |
| | |
| | |
| | |
Household Products — 1.4% |
Church & Dwight Co., Inc. | | |
| | |
Procter & Gamble Co. (The) | | |
| | |
Industrial Conglomerates — 1.2% |
Honeywell International, Inc. | | |
|
| | |
|
| | |
| | |
| | |
| | |
Travelers Cos., Inc. (The) | | |
| | |
Interactive Media & Services — 5.7% |
Alphabet, Inc., Class A * (a) | | |
Alphabet, Inc., Class C * | | |
Meta Platforms, Inc., Class A * (a) | | |
| | |
SEE NOTES TO FINANCIAL STATEMENTS.
| J.P. Morgan Large Cap Funds | |
JPMorgan Hedged Equity 3 Fund
SCHEDULE OF PORTFOLIO INVESTMENTS
AS OF June 30, 2023 (continued)
| | |
Common Stocks — continued |
|
| | |
Cognizant Technology Solutions Corp., Class A | | |
| | |
Life Sciences Tools & Services — 1.5% |
| | |
Thermo Fisher Scientific, Inc. | | |
| | |
|
| | |
| | |
| | |
| | |
| | |
|
Charter Communications, Inc., Class A * | | |
| | |
| | |
|
| | |
| | |
| | |
|
| | |
| | |
| | |
| | |
Public Service Enterprise Group, Inc. | | |
| | |
Oil, Gas & Consumable Fuels — 4.1% |
| | |
| | |
| | |
| | |
| | |
| | |
| | |
Passenger Airlines — 0.3% |
| | |
| | |
| | |
| | |
|
Personal Care Products — 0.0% ^ |
| | |
|
| | |
| | |
| | |
| | |
| | |
Professional Services — 0.3% |
Booz Allen Hamilton Holding Corp. | | |
| | |
| | |
|
Equity LifeStyle Properties, Inc. | | |
| | |
| | |
| | |
Semiconductors & Semiconductor Equipment — 8.2% |
Advanced Micro Devices, Inc. * | | |
| | |
| | |
| | |
| | |
NXP Semiconductors NV (China) | | |
| | |
| | |
| | |
| | |
|
| | |
Cadence Design Systems, Inc. * | | |
| | |
| | |
| | |
| | |
| | |
| | |
| | |
SEE NOTES TO FINANCIAL STATEMENTS.
| J.P. Morgan Large Cap Funds | |
| | |
Common Stocks — continued |
|
| | |
| | |
| | |
|
| | |
| | |
| | |
Burlington Stores, Inc. * | | |
| | |
| | |
O'Reilly Automotive, Inc. * | | |
| | |
| | |
| | |
Technology Hardware, Storage & Peripherals — 8.4% |
| | |
Seagate Technology Holdings plc | | |
| | |
Textiles, Apparel & Luxury Goods — 0.5% |
| | |
|
| | |
Philip Morris International, Inc. | | |
| | |
Wireless Telecommunication Services — 0.3% |
| | |
Total Common Stocks
(Cost $2,047,884) | | |
| | |
|
Put Options Purchased — 0.3% |
| | |
8/31/2023 at USD 3,960.00 , European Style | | |
| | |
|
|
Notional Amount: USD 2,436,138 | | |
Counterparty: Exchange-Traded *
(Cost $33,264) | | |
| | |
Short-Term Investments — 0.9% |
Investment Companies — 0.9% |
JPMorgan U.S. Government Money Market Fund Class IM Shares, 5.05% (b) (c)
(Cost $22,478) | | |
Total Investments — 104.6%
(Cost $2,103,626) | | |
Liabilities in Excess of Other Assets — (4.6)% | | |
| | |
Percentages indicated are based on net assets. |
| |
| Real Estate Investment Trust |
| Amount rounds to less than 0.1% of net assets. |
| Non-income producing security. | |
| All or a portion of the security is segregated for options written. | |
| Investment in an affiliated fund, which is registered under the Investment Company Act of 1940, as amended, and is advised by J.P. Morgan Investment Management Inc. | |
| The rate shown is the current yield as of June 30, 2023. | |
SEE NOTES TO FINANCIAL STATEMENTS.
| J.P. Morgan Large Cap Funds | |
JPMorgan Hedged Equity 3 Fund
SCHEDULE OF PORTFOLIO INVESTMENTS
AS OF June 30, 2023 (continued)
Futures contracts outstanding as of June 30, 2023 (amounts in thousands, except number of contracts):
| | | | | VALUE AND
UNREALIZED
APPRECIATION
(DEPRECIATION) ($) |
| | | | | |
| | | | | |
Written Call Options Contracts as of June 30, 2023 (amounts in thousands, except number of contracts):
|
| | | | | | |
| | | | | | |
Written Put Options Contracts as of June 30, 2023 (amounts in thousands, except number of contracts):
|
| | | | | | |
| | | | | | |
Total Written Options Contracts (Premiums Received $32,552) | |
SEE NOTES TO FINANCIAL STATEMENTS.
| J.P. Morgan Large Cap Funds | |
JPMorgan Large Cap Growth Fund
SCHEDULE OF PORTFOLIO INVESTMENTS
AS OF June 30, 2023
| | |
|
Aerospace & Defense — 0.7% |
| | |
|
| | |
|
| | |
|
| | |
Alnylam Pharmaceuticals, Inc. * | | |
| | |
| | |
Regeneron Pharmaceuticals, Inc. * | | |
Sarepta Therapeutics, Inc. * | | |
| | |
| | |
|
| | |
| | |
MercadoLibre, Inc. (Brazil) * | | |
| | |
|
| | |
|
| | |
Charles Schwab Corp. (The) | | |
| | |
| | |
| | |
|
Sherwin-Williams Co. (The) | | |
Consumer Staples Distribution & Retail — 0.3% |
| | |
Electrical Equipment — 0.6% |
Rockwell Automation, Inc. | | |
Electronic Equipment, Instruments & Components — 0.9% |
| | |
|
| | |
Financial Services — 2.0% |
| | |
| | |
|
Financial Services — continued |
Mastercard, Inc., Class A | | |
| | |
| | |
Ground Transportation — 1.7% |
Uber Technologies, Inc. * | | |
Health Care Equipment & Supplies — 2.9% |
| | |
| | |
Intuitive Surgical, Inc. * | | |
| | |
Health Care Providers & Services — 2.5% |
| | |
| | |
| | |
Hotels, Restaurants & Leisure — 3.4% |
| | |
Chipotle Mexican Grill, Inc. * | | |
Marriott International, Inc., Class A | | |
| | |
| | |
Interactive Media & Services — 9.0% |
Alphabet, Inc., Class C * | | |
Meta Platforms, Inc., Class A * | | |
| | |
|
Cognizant Technology Solutions Corp., Class A | | |
| | |
Shopify, Inc., Class A (Canada) * | | |
| | |
Life Sciences Tools & Services — 0.2% |
Thermo Fisher Scientific, Inc. | | |
|
| | |
|
Trade Desk, Inc. (The), Class A * | | |
|
| | |
SEE NOTES TO FINANCIAL STATEMENTS.
| J.P. Morgan Large Cap Funds | |
JPMorgan Large Cap Growth Fund
SCHEDULE OF PORTFOLIO INVESTMENTS
AS OF June 30, 2023 (continued)
| | |
Common Stocks — continued |
Oil, Gas & Consumable Fuels — 1.1% |
| | |
| | |
| | |
Personal Care Products — 0.2% |
Estee Lauder Cos., Inc. (The), Class A | | |
|
| | |
Professional Services — 0.3% |
| | |
Semiconductors & Semiconductor Equipment — 10.5% |
Advanced Micro Devices, Inc. * | | |
ASML Holding NV (Registered), NYRS (Netherlands) | | |
| | |
| | |
| | |
| | |
| | |
|
| | |
| | |
| | |
| | |
| | |
| | |
| | |
| | |
| | |
| | |
|
|
| | |
| | |
| | |
Technology Hardware, Storage & Peripherals — 10.8% |
| | |
Textiles, Apparel & Luxury Goods — 0.4% |
| | |
Total Common Stocks
(Cost $40,687,704) | | |
Short-Term Investments — 3.2% |
Investment Companies — 3.2% |
JPMorgan Prime Money Market Fund Class IM Shares, 5.23% (a) (b)
(Cost $1,980,493) | | |
Total Investments — 99.4%
(Cost $42,668,197) | | |
Other Assets Less Liabilities — 0.6% | | |
| | |
Percentages indicated are based on net assets. |
| Non-income producing security. |
| Investment in an affiliated fund, which is registered under the Investment Company Act of 1940, as amended, and is advised by J.P. Morgan Investment Management Inc. |
| The rate shown is the current yield as of June 30, 2023. |
SEE NOTES TO FINANCIAL STATEMENTS.
| J.P. Morgan Large Cap Funds | |
JPMorgan Large Cap Value Fund
SCHEDULE OF PORTFOLIO INVESTMENTS
AS OF June 30, 2023
| | |
|
Aerospace & Defense — 3.3% |
| | |
Raytheon Technologies Corp. | | |
| | |
|
| | |
| | |
Citizens Financial Group, Inc. | | |
| | |
| | |
PNC Financial Services Group, Inc. (The) | | |
| | |
| | |
| | |
| | |
|
| | |
|
| | |
| | |
BioMarin Pharmaceutical, Inc. * | | |
Regeneron Pharmaceuticals, Inc. * | | |
Sarepta Therapeutics, Inc. * | | |
| | |
|
| | |
| | |
| | |
|
| | |
|
| | |
| | |
| | |
| | |
Consumer Staples Distribution & Retail — 2.7% |
BJ's Wholesale Club Holdings, Inc. * | | |
Performance Food Group Co. * | | |
| | |
| | |
| | |
|
Electric Utilities — 2.2% |
| | |
Electrical Equipment — 0.7% |
| | |
|
Endeavor Group Holdings, Inc., Class A * | | |
Financial Services — 6.0% |
Berkshire Hathaway, Inc., Class B * | | |
Fidelity National Information Services, Inc. | | |
| | |
| | |
| | |
|
Mondelez International, Inc., Class A | | |
|
| | |
Ground Transportation — 0.6% |
Knight-Swift Transportation Holdings, Inc. | | |
Uber Technologies, Inc. * | | |
| | |
Health Care Equipment & Supplies — 1.3% |
Baxter International, Inc. | | |
| | |
| | |
Health Care Providers & Services — 6.1% |
| | |
| | |
| | |
| | |
| | |
|
| | |
Hotels, Restaurants & Leisure — 2.0% |
| | |
| | |
| | |
| | |
Household Durables — 0.6% |
| | |
SEE NOTES TO FINANCIAL STATEMENTS.
| J.P. Morgan Large Cap Funds | |
JPMorgan Large Cap Value Fund
SCHEDULE OF PORTFOLIO INVESTMENTS
AS OF June 30, 2023 (continued)
| | |
Common Stocks — continued |
Industrial Conglomerates — 2.0% |
Honeywell International, Inc. | | |
|
| | |
| | |
Travelers Cos., Inc. (The) | | |
| | |
| | |
Interactive Media & Services — 1.2% |
Meta Platforms, Inc., Class A * | | |
|
| | |
| | |
| | |
|
Charter Communications, Inc., Class A * | | |
| | |
| | |
|
| | |
|
| | |
| | |
| | |
Public Service Enterprise Group, Inc. | | |
| | |
Oil, Gas & Consumable Fuels — 7.8% |
| | |
| | |
| | |
| | |
| | |
| | |
Pioneer Natural Resources Co. | | |
| | |
Passenger Airlines — 1.5% |
| | |
| | |
| | |
Personal Care Products — 0.2% |
| | |
| | |
|
|
| | |
| | |
| | |
|
Mid-America Apartment Communities, Inc. | | |
| | |
| | |
Semiconductors & Semiconductor Equipment — 3.1% |
| | |
NXP Semiconductors NV (China) | | |
| | |
| | |
| | |
| | |
|
| | |
| | |
| | |
|
Digital Realty Trust, Inc. | | |
|
| | |
| | |
| | |
Technology Hardware, Storage & Peripherals — 0.4% |
Seagate Technology Holdings plc | | |
Textiles, Apparel & Luxury Goods — 0.4% |
| | |
|
Philip Morris International, Inc. | | |
Trading Companies & Distributors — 1.3% |
WESCO International, Inc. | | |
Total Common Stocks
(Cost $3,075,045) | | |
Short-Term Investments — 2.9% |
Investment Companies — 2.6% |
JPMorgan Prime Money Market Fund Class IM Shares, 5.23% (b) (c)
(Cost $89,626) | | |
SEE NOTES TO FINANCIAL STATEMENTS.
| J.P. Morgan Large Cap Funds | |
| | |
Short-Term Investments — continued |
Investment of Cash Collateral from Securities Loaned — 0.3% |
JPMorgan Securities Lending Money Market Fund Agency SL Class Shares, 5.29% (b) (c) | | |
JPMorgan U.S. Government Money Market Fund Class IM Shares, 5.05% (b) (c) | | |
Total Investment of Cash Collateral from Securities Loaned
(Cost $10,831) | | |
Total Short-Term Investments
(Cost $100,457) | | |
Total Investments — 101.1%
(Cost $3,175,502) | | |
Liabilities in Excess of Other Assets — (1.1)% | | |
| | |
Percentages indicated are based on net assets. |
| |
| Real Estate Investment Trust |
| Non-income producing security. |
| The security or a portion of this security is on loan at June 30, 2023. The total value of securities on loan at June 30, 2023 is $11,139. |
| Investment in an affiliated fund, which is registered under the Investment Company Act of 1940, as amended, and is advised by J.P. Morgan Investment Management Inc. |
| The rate shown is the current yield as of June 30, 2023. |
SEE NOTES TO FINANCIAL STATEMENTS.
| J.P. Morgan Large Cap Funds | |
JPMorgan U.S. Applied Data Science Value Fund
SCHEDULE OF PORTFOLIO INVESTMENTS
AS OF June 30, 2023
| | |
|
Aerospace & Defense — 1.6% |
| | |
Raytheon Technologies Corp. | | |
| | |
Air Freight & Logistics — 0.8% |
| | |
Automobile Components — 0.6% |
| | |
|
| | |
| | |
Citizens Financial Group, Inc. | | |
| | |
PNC Financial Services Group, Inc. (The) | | |
| | |
| | |
|
| | |
|
| | |
Regeneron Pharmaceuticals, Inc. * | | |
Vertex Pharmaceuticals, Inc. * | | |
| | |
|
Johnson Controls International plc | | |
| | |
| | |
|
| | |
| | |
| | |
T. Rowe Price Group, Inc. | | |
| | |
|
Axalta Coating Systems Ltd. * | | |
| | |
| | |
| | |
Communications Equipment — 0.5% |
| | |
| | |
|
|
| | |
Capital One Financial Corp. | | |
| | |
Consumer Staples Distribution & Retail — 1.1% |
| | |
| | |
| | |
Containers & Packaging — 0.7% |
| | |
Diversified Telecommunication Services — 1.5% |
Verizon Communications, Inc. | | |
Electric Utilities — 3.8% |
Constellation Energy Corp. | | |
| | |
| | |
| | |
Electrical Equipment — 2.3% |
| | |
|
| | |
Financial Services — 3.4% |
Berkshire Hathaway, Inc., Class B * | | |
| | |
FleetCor Technologies, Inc. * | | |
Mastercard, Inc., Class A | | |
| | |
|
Mondelez International, Inc., Class A | | |
Tyson Foods, Inc., Class A | | |
| | |
Ground Transportation — 2.9% |
| | |
| | |
Uber Technologies, Inc. * | | |
| | |
Health Care Equipment & Supplies — 2.2% |
| | |
| | |
| | |
SEE NOTES TO FINANCIAL STATEMENTS.
| J.P. Morgan Large Cap Funds | |
| | |
Common Stocks — continued |
Health Care Providers & Services — 4.2% |
| | |
| | |
| | |
| | |
| | |
|
| | |
Hotel & Resort REITs — 0.5% |
Host Hotels & Resorts, Inc. | | |
Hotels, Restaurants & Leisure — 0.8% |
| | |
| | |
| | |
Household Durables — 0.4% |
| | |
Household Products — 1.7% |
Procter & Gamble Co. (The) | | |
Spectrum Brands Holdings, Inc. | | |
| | |
Industrial Conglomerates — 1.3% |
Honeywell International, Inc. | | |
|
| | |
|
| | |
Travelers Cos., Inc. (The) | | |
| | |
Interactive Media & Services — 0.8% |
Meta Platforms, Inc., Class A * | | |
|
| | |
Cognizant Technology Solutions Corp., Class A | | |
| | |
Life Sciences Tools & Services — 1.2% |
Agilent Technologies, Inc. | | |
| | |
| | |
|
| | |
| | |
|
|
| | |
| | |
| | |
|
Charter Communications, Inc., Class A * | | |
| | |
| | |
|
| | |
| | |
Public Service Enterprise Group, Inc. | | |
| | |
Oil, Gas & Consumable Fuels — 8.4% |
| | |
| | |
| | |
| | |
| | |
Pioneer Natural Resources Co. | | |
| | |
|
| | |
| | |
Jazz Pharmaceuticals plc * | | |
| | |
| | |
| | |
| | |
Professional Services — 0.7% |
Booz Allen Hamilton Holding Corp. | | |
SS&C Technologies Holdings, Inc. | | |
| | |
Real Estate Management & Development — 0.7% |
CBRE Group, Inc., Class A * | | |
Semiconductors & Semiconductor Equipment — 3.8% |
Advanced Micro Devices, Inc. * | | |
| | |
NXP Semiconductors NV (China) | | |
| | |
| | |
SEE NOTES TO FINANCIAL STATEMENTS.
| J.P. Morgan Large Cap Funds | |
JPMorgan U.S. Applied Data Science Value Fund
SCHEDULE OF PORTFOLIO INVESTMENTS
AS OF June 30, 2023 (continued)
| | |
Common Stocks — continued |
|
| | |
|
Digital Realty Trust, Inc. | | |
|
| | |
| | |
O'Reilly Automotive, Inc. * | | |
| | |
Textiles, Apparel & Luxury Goods — 0.7% |
| | |
|
Philip Morris International, Inc. | | |
Total Common Stocks
(Cost $149,122) | | |
Short-Term Investments — 1.7% |
Investment Companies — 1.7% |
JPMorgan Prime Money Market Fund Class IM Shares, 5.23% (a) (b)
(Cost $2,951) | | |
Total Investments — 99.2%
(Cost $152,073) | | |
Other Assets Less Liabilities — 0.8% | | |
| | |
Percentages indicated are based on net assets. |
| |
| Real Estate Investment Trust |
| Non-income producing security. |
| Investment in an affiliated fund, which is registered under the Investment Company Act of 1940, as amended, and is advised by J.P. Morgan Investment Management Inc. |
| The rate shown is the current yield as of June 30, 2023. |
Futures contracts outstanding as of June 30, 2023 (amounts in thousands, except number of contracts):
| | | | | VALUE AND
UNREALIZED
APPRECIATION
(DEPRECIATION) ($) |
| | | | | |
| | | | | |
SEE NOTES TO FINANCIAL STATEMENTS.
| J.P. Morgan Large Cap Funds | |
JPMorgan U.S. Equity Fund
SCHEDULE OF PORTFOLIO INVESTMENTS
AS OF June 30, 2023
| | |
|
Aerospace & Defense — 2.0% |
Northrop Grumman Corp. (a) | | |
|
| | |
|
| | |
| | |
| | |
| | |
|
| | |
|
| | |
| | |
Regeneron Pharmaceuticals, Inc. * | | |
Vertex Pharmaceuticals, Inc. * | | |
| | |
|
| | |
|
| | |
|
Ameriprise Financial, Inc. | | |
| | |
| | |
| | |
|
| | |
| | |
| | |
Construction Materials — 0.7% |
| | |
|
| | |
Consumer Staples Distribution & Retail — 0.9% |
| | |
Diversified Telecommunication Services — 0.8% |
Verizon Communications, Inc. | | |
| | |
|
Electric Utilities — 4.3% |
| | |
| | |
| | |
Electrical Equipment — 2.5% |
| | |
Energy Equipment & Services — 2.2% |
| | |
Financial Services — 2.6% |
Mastercard, Inc., Class A | | |
Ground Transportation — 2.9% |
| | |
Uber Technologies, Inc. * | | |
| | |
Health Care Providers & Services — 3.2% |
| | |
Hotels, Restaurants & Leisure — 2.3% |
| | |
|
| | |
|
| | |
Interactive Media & Services — 5.3% |
Alphabet, Inc., Class A * | | |
Meta Platforms, Inc., Class A * | | |
| | |
|
| | |
Life Sciences Tools & Services — 0.8% |
| | |
|
| | |
Oil, Gas & Consumable Fuels — 3.0% |
| | |
Pioneer Natural Resources Co. | | |
| | |
|
| | |
SEE NOTES TO FINANCIAL STATEMENTS.
| J.P. Morgan Large Cap Funds | |
JPMorgan U.S. Equity Fund
SCHEDULE OF PORTFOLIO INVESTMENTS
AS OF June 30, 2023 (continued)
| | |
Common Stocks — continued |
Semiconductors & Semiconductor Equipment — 8.1% |
Advanced Micro Devices, Inc. * | | |
ASML Holding NV (Registered), NYRS (Netherlands) | | |
| | |
NXP Semiconductors NV (China) (a) | | |
| | |
|
| | |
| | |
| | |
| | |
|
| | |
| | |
| | |
Technology Hardware, Storage & Peripherals — 6.3% |
| | |
Seagate Technology Holdings plc | | |
| | |
Total Common Stocks
(Cost $15,255,918) | | |
Short-Term Investments — 1.2% |
Investment Companies — 1.0% |
JPMorgan Prime Money Market Fund Class IM Shares, 5.23% (b) (c)
(Cost $223,991) | | |
| | |
|
Investment of Cash Collateral from Securities Loaned — 0.2% |
JPMorgan Securities Lending Money Market Fund Agency SL Class Shares, 5.29% (b) (c) | | |
JPMorgan U.S. Government Money Market Fund Class IM Shares, 5.05% (b) (c) | | |
Total Investment of Cash Collateral from Securities Loaned
(Cost $43,872) | | |
Total Short-Term Investments
(Cost $267,863) | | |
Total Investments — 101.2%
(Cost $15,523,781) | | |
Liabilities in Excess of Other Assets — (1.2)% | | |
| | |
Percentages indicated are based on net assets. |
| |
| |
| Real Estate Investment Trust |
| Non-income producing security. |
| The security or a portion of this security is on loan at June 30, 2023. The total value of securities on loan at June 30, 2023 is $43,674. |
| Investment in an affiliated fund, which is registered under the Investment Company Act of 1940, as amended, and is advised by J.P. Morgan Investment Management Inc. |
| The rate shown is the current yield as of June 30, 2023. |
SEE NOTES TO FINANCIAL STATEMENTS.
| J.P. Morgan Large Cap Funds | |
JPMorgan U.S. GARP Equity Fund
SCHEDULE OF PORTFOLIO INVESTMENTS
AS OF June 30, 2023
| | |
|
Aerospace & Defense — 0.4% |
| | |
|
| | |
|
| | |
| | |
| | |
| | |
|
| | |
Neurocrine Biosciences, Inc. * | | |
Regeneron Pharmaceuticals, Inc. * | | |
Sarepta Therapeutics, Inc. * | | |
Vertex Pharmaceuticals, Inc. * | | |
| | |
|
| | |
|
| | |
| | |
| | |
|
Ameriprise Financial, Inc. | | |
Charles Schwab Corp. (The) | | |
| | |
| | |
|
| | |
Commercial Services & Supplies — 1.0% |
| | |
Construction & Engineering — 0.4% |
| | |
Consumer Staples Distribution & Retail — 1.3% |
| | |
| | |
| | |
Electric Utilities — 0.4% |
| | |
| | |
|
Electronic Equipment, Instruments & Components — 0.4% |
Keysight Technologies, Inc. * | | |
|
| | |
Take-Two Interactive Software, Inc. * | | |
| | |
Financial Services — 3.7% |
Mastercard, Inc., Class A | | |
| | |
| | |
|
| | |
Ground Transportation — 1.3% |
| | |
Uber Technologies, Inc. * | | |
| | |
Health Care Equipment & Supplies — 0.7% |
Boston Scientific Corp. * | | |
Health Care Providers & Services — 3.5% |
| | |
| | |
| | |
| | |
| | |
Hotels, Restaurants & Leisure — 3.7% |
| | |
Chipotle Mexican Grill, Inc. * | | |
| | |
Hilton Worldwide Holdings, Inc. | | |
| | |
| | |
| | |
Industrial Conglomerates — 0.6% |
Honeywell International, Inc. | | |
|
| | |
|
Arch Capital Group Ltd. * | | |
SEE NOTES TO FINANCIAL STATEMENTS.
| J.P. Morgan Large Cap Funds | |
JPMorgan U.S. GARP Equity Fund
SCHEDULE OF PORTFOLIO INVESTMENTS
AS OF June 30, 2023 (continued)
| | |
Common Stocks — continued |
|
| | |
Travelers Cos., Inc. (The) | | |
| | |
Interactive Media & Services — 8.8% |
Alphabet, Inc., Class A * | | |
Alphabet, Inc., Class C * | | |
Meta Platforms, Inc., Class A * | | |
| | |
|
| | |
Life Sciences Tools & Services — 2.6% |
Agilent Technologies, Inc. | | |
| | |
Thermo Fisher Scientific, Inc. | | |
| | |
|
| | |
| | |
| | |
| | |
|
Charter Communications, Inc., Class A * | | |
|
| | |
Oil, Gas & Consumable Fuels — 0.7% |
| | |
| | |
| | |
|
| | |
Professional Services — 0.7% |
Booz Allen Hamilton Holding Corp. | | |
Semiconductors & Semiconductor Equipment — 9.1% |
Advanced Micro Devices, Inc. * | | |
ASML Holding NV (Registered), NYRS (Netherlands) | | |
| | |
| | |
NXP Semiconductors NV (China) | | |
| | |
| | |
|
Semiconductors & Semiconductor Equipment — continued |
Taiwan Semiconductor Manufacturing Co. Ltd., ADR (Taiwan) | | |
| | |
| | |
| | |
|
| | |
| | |
Cadence Design Systems, Inc. * | | |
| | |
| | |
| | |
| | |
| | |
Palo Alto Networks, Inc. * | | |
| | |
| | |
| | |
|
| | |
| | |
| | |
|
| | |
Burlington Stores, Inc. * | | |
| | |
O'Reilly Automotive, Inc. * | | |
| | |
| | |
Technology Hardware, Storage & Peripherals — 11.7% |
| | |
Pure Storage, Inc., Class A * | | |
Seagate Technology Holdings plc | | |
| | |
Textiles, Apparel & Luxury Goods — 0.5% |
| | |
|
Philip Morris International, Inc. | | |
SEE NOTES TO FINANCIAL STATEMENTS.
| J.P. Morgan Large Cap Funds | |
| | |
Common Stocks — continued |
Trading Companies & Distributors — 0.4% |
| | |
Total Common Stocks
(Cost $635,067) | | |
Short-Term Investments — 1.1% |
Investment Companies — 1.1% |
JPMorgan Prime Money Market Fund Class IM Shares, 5.23% (a) (b)
(Cost $12,864) | | |
Total Investments — 99.9%
(Cost $647,931) | | |
Other Assets Less Liabilities — 0.1% | | |
| | |
Percentages indicated are based on net assets. |
| |
| American Depositary Receipt |
| |
| Real Estate Investment Trust |
| Non-income producing security. |
| Investment in an affiliated fund, which is registered under the Investment Company Act of 1940, as amended, and is advised by J.P. Morgan Investment Management Inc. |
| The rate shown is the current yield as of June 30, 2023. |
Futures contracts outstanding as of June 30, 2023 (amounts in thousands, except number of contracts):
| | | | | VALUE AND
UNREALIZED
APPRECIATION
(DEPRECIATION) ($) |
| | | | | |
| | | | | |
SEE NOTES TO FINANCIAL STATEMENTS.
| J.P. Morgan Large Cap Funds | |
JPMorgan U.S. Large Cap Core Plus Fund
SCHEDULE OF PORTFOLIO INVESTMENTS
AS OF June 30, 2023
| | |
|
|
Aerospace & Defense — 3.0% |
| | |
Northrop Grumman Corp. (a) | | |
Raytheon Technologies Corp. | | |
| | |
| | |
Air Freight & Logistics — 0.6% |
United Parcel Service, Inc., Class B | | |
|
| | |
| | |
| | |
| | |
|
| | |
Constellation Brands, Inc., Class A | | |
| | |
| | |
| | |
|
| | |
| | |
BioMarin Pharmaceutical, Inc. * | | |
Regeneron Pharmaceuticals, Inc. * | | |
Sarepta Therapeutics, Inc. * | | |
Vertex Pharmaceuticals, Inc. * | | |
| | |
|
| | |
|
| | |
|
Charles Schwab Corp. (The) | | |
| | |
Goldman Sachs Group, Inc. (The) | | |
| | |
Raymond James Financial, Inc. | | |
| | |
| | |
|
Air Products and Chemicals, Inc. | | |
| | |
| | |
Commercial Services & Supplies — 0.4% |
| | |
| | |
|
|
Communications Equipment — 0.2% |
| | |
| | |
| | |
Construction Materials — 0.4% |
Martin Marietta Materials, Inc. | | |
|
| | |
Consumer Staples Distribution & Retail — 1.0% |
| | |
|
| | |
Electric Utilities — 1.4% |
| | |
| | |
| | |
| | |
Electrical Equipment — 1.4% |
| | |
Electronic Equipment, Instruments & Components — 0.7% |
| | |
Keysight Technologies, Inc. * | | |
| | |
Energy Equipment & Services — 0.5% |
| | |
| | |
| | |
|
Endeavor Group Holdings, Inc., Class A * | | |
| | |
| | |
Financial Services — 5.3% |
Berkshire Hathaway, Inc., Class B * | | |
| | |
| | |
FleetCor Technologies, Inc. * | | |
Jack Henry & Associates, Inc. | | |
Mastercard, Inc., Class A (a) | | |
| | |
| | |
|
| | |
Mondelez International, Inc., Class A (a) | | |
| | |
Ground Transportation — 2.3% |
| | |
Norfolk Southern Corp. (a) | | |
SEE NOTES TO FINANCIAL STATEMENTS.
| J.P. Morgan Large Cap Funds | |
| | |
Long Positions — continued |
Common Stocks — continued |
Ground Transportation — continued |
Old Dominion Freight Line, Inc. | | |
Uber Technologies, Inc. * | | |
| | |
| | |
Health Care Equipment & Supplies — 3.8% |
| | |
Baxter International, Inc. | | |
Boston Scientific Corp. * (a) | | |
Intuitive Surgical, Inc. * | | |
| | |
Zimmer Biomet Holdings, Inc. | | |
| | |
Health Care Providers & Services — 3.6% |
| | |
| | |
UnitedHealth Group, Inc. (a) | | |
| | |
Hotels, Restaurants & Leisure — 4.8% |
| | |
Chipotle Mexican Grill, Inc. * | | |
Hilton Worldwide Holdings, Inc. | | |
| | |
| | |
| | |
Household Products — 0.8% |
Church & Dwight Co., Inc. | | |
Procter & Gamble Co. (The) (a) | | |
| | |
Industrial Conglomerates — 1.4% |
Honeywell International, Inc. (a) | | |
|
| | |
|
| | |
| | |
| | |
Progressive Corp. (The) (a) | | |
Travelers Cos., Inc. (The) | | |
| | |
Interactive Media & Services — 7.0% |
Alphabet, Inc., Class C * | | |
Alphabet, Inc., Class A * (a) | | |
Meta Platforms, Inc., Class A * (a) | | |
| | |
|
Cognizant Technology Solutions Corp., Class A | | |
| | |
|
|
Life Sciences Tools & Services — 1.6% |
| | |
Thermo Fisher Scientific, Inc. (a) | | |
| | |
|
| | |
| | |
| | |
| | |
|
Charter Communications, Inc., Class A * (a) | | |
Comcast Corp., Class A (a) | | |
Liberty Media Corp.-Liberty SiriusXM, Class A * | | |
| | |
|
| | |
|
| | |
| | |
| | |
Public Service Enterprise Group, Inc. | | |
| | |
Oil, Gas & Consumable Fuels — 4.8% |
| | |
| | |
| | |
| | |
| | |
| | |
| | |
| | |
Personal Care Products — 0.6% |
Estee Lauder Cos., Inc. (The), Class A | | |
| | |
| | |
|
Bristol-Myers Squibb Co. (a) | | |
| | |
| | |
| | |
Professional Services — 0.5% |
Booz Allen Hamilton Holding Corp. | | |
|
Equity LifeStyle Properties, Inc. | | |
| | |
| | |
Semiconductors & Semiconductor Equipment — 12.8% |
Advanced Micro Devices, Inc. * | | |
SEE NOTES TO FINANCIAL STATEMENTS.
| J.P. Morgan Large Cap Funds | |
JPMorgan U.S. Large Cap Core Plus Fund
SCHEDULE OF PORTFOLIO INVESTMENTS
AS OF June 30, 2023 (continued)
| | |
Long Positions — continued |
Common Stocks — continued |
Semiconductors & Semiconductor Equipment — continued |
| | |
| | |
| | |
Monolithic Power Systems, Inc. | | |
| | |
NXP Semiconductors NV (China) | | |
| | |
| | |
Taiwan Semiconductor Manufacturing Co. Ltd., ADR (Taiwan) | | |
| | |
| | |
| | |
|
| | |
| | |
| | |
| | |
| | |
| | |
| | |
|
Digital Realty Trust, Inc. | | |
| | |
| | |
|
| | |
| | |
Burlington Stores, Inc. * | | |
| | |
O'Reilly Automotive, Inc. * (a) | | |
| | |
| | |
Technology Hardware, Storage & Peripherals — 6.8% |
| | |
Dell Technologies, Inc., Class C | | |
Seagate Technology Holdings plc | | |
| | |
Textiles, Apparel & Luxury Goods — 0.2% |
| | |
Wireless Telecommunication Services — 0.4% |
| | |
Total Common Stocks
(Cost $940,177) | | |
| | |
|
Short-Term Investments — 2.2% |
Investment Companies — 2.2% |
JPMorgan Prime Money Market Fund Class IM Shares, 5.23% (b) (c)(Cost $30,659) | | |
Total Long Positions
(Cost $970,836) | | |
Short Positions — (22.8)% |
|
Aerospace & Defense — (1.0)% |
| | |
| | |
Huntington Ingalls Industries, Inc. | | |
| | |
Air Freight & Logistics — (0.4)% |
CH Robinson Worldwide, Inc. | | |
Expeditors International of Washington, Inc. | | |
| | |
|
| | |
|
Huntington Bancshares, Inc. | | |
PNC Financial Services Group, Inc. (The) | | |
| | |
| | |
|
| | |
| | |
| | |
| | |
Broadline Retail — (0.3)% |
| | |
Building Products — (0.8)% |
| | |
| | |
Johnson Controls International plc | | |
Lennox International, Inc. | | |
| | |
|
| | |
Coinbase Global, Inc., Class A * | | |
FactSet Research Systems, Inc. | | |
| | |
LPL Financial Holdings, Inc. | | |
| | |
| | |
| | |
T. Rowe Price Group, Inc. | | |
| | |
SEE NOTES TO FINANCIAL STATEMENTS.
| J.P. Morgan Large Cap Funds | |
| | |
Short Positions — continued |
Common Stocks — continued |
Communications Equipment — (0.9)% |
| | |
Consumer Finance — (0.2)% |
Capital One Financial Corp. | | |
| | |
| | |
Consumer Staples Distribution & Retail — (0.7)% |
| | |
| | |
Walgreens Boots Alliance, Inc. | | |
| | |
Containers & Packaging — (0.2)% |
| | |
Diversified Telecommunication Services — (0.3)% |
| | |
Verizon Communications, Inc. | | |
| | |
Electric Utilities — (1.3)% |
American Electric Power Co., Inc. | | |
| | |
| | |
| | |
| | |
| | |
| | |
Electrical Equipment — (0.3)% |
| | |
Energy Equipment & Services — (0.1)% |
| | |
|
| | |
| | |
Warner Bros Discovery, Inc. * | | |
| | |
Financial Services — (1.0)% |
| | |
Apollo Global Management, Inc. | | |
Corebridge Financial, Inc. | | |
| | |
| | |
| | |
| | |
|
| | |
| | |
| | |
| | |
|
|
Food Products — continued |
| | |
| | |
| | |
|
| | |
Ground Transportation — (0.1)% |
JB Hunt Transport Services, Inc. | | |
| | |
| | |
Health Care Equipment & Supplies — (0.1)% |
Edwards Lifesciences Corp. * | | |
Health Care Providers & Services — (0.3)% |
| | |
| | |
| | |
Household Durables — (0.1)% |
Mohawk Industries, Inc. * | | |
Industrial Conglomerates — (0.2)% |
| | |
|
| | |
| | |
| | |
Marsh & McLennan Cos., Inc. | | |
Prudential Financial, Inc. | | |
| | |
| | |
|
| | |
International Business Machines Corp. | | |
Shopify, Inc. (Canada), Class A * | | |
| | |
Life Sciences Tools & Services — (0.6)% |
Agilent Technologies, Inc. | | |
| | |
| | |
| | |
|
| | |
| | |
Illinois Tool Works, Inc. | | |
Stanley Black & Decker, Inc. | | |
| | |
|
| | |
SEE NOTES TO FINANCIAL STATEMENTS.
| J.P. Morgan Large Cap Funds | |
JPMorgan U.S. Large Cap Core Plus Fund
SCHEDULE OF PORTFOLIO INVESTMENTS
AS OF June 30, 2023 (continued)
| | |
Short Positions — continued |
Common Stocks — continued |
|
Interpublic Group of Cos., Inc. (The) | | |
Paramount Global, Class B | | |
| | |
|
| | |
| | |
| | |
Oil, Gas & Consumable Fuels — (0.7)% |
| | |
| | |
| | |
| | |
| | |
| | |
|
| | |
| | |
| | |
Professional Services — (0.7)% |
Ceridian HCM Holding, Inc. * | | |
| | |
| | |
| | |
| | |
| | |
|
| | |
Simon Property Group, Inc. | | |
| | |
Semiconductors & Semiconductor Equipment — (2.0)% |
| | |
| | |
Microchip Technology, Inc. | | |
| | |
| | |
Specialized REITs — (0.4)% |
Extra Space Storage, Inc. | | |
| | |
| | |
| | |
|
|
Specialty Retail — (0.5)% |
| | |
| | |
| | |
Technology Hardware, Storage & Peripherals — (1.1)% |
Hewlett Packard Enterprise Co. | | |
| | |
| | |
| | |
Textiles, Apparel & Luxury Goods — (0.1)% |
| | |
Trading Companies & Distributors — (0.3)% |
| | |
Total Common Stocks
(Proceeds $(348,979)) | | |
Total Short Positions
(Proceeds $(348,979)) | | |
Total Investments — 100.3%
(Cost $621,857) | | |
Liabilities in Excess of Other Assets — (0.3)% | | |
| | |
Percentages indicated are based on net assets. |
Amounts presented as a dash ("-") represent amounts that round to less than a thousand. |
| |
| American Depositary Receipt |
| Real Estate Investment Trust |
| Amount rounds to less than 0.1% of net assets. |
| Non-income producing security. | |
| All or a portion of this security is segregated as collateral for short sales. The total value of securities segregated as collateral is $444,378. | |
| Investment in an affiliated fund, which is registered under the Investment Company Act of 1940, as amended, and is advised by J.P. Morgan Investment Management Inc. | |
| The rate shown is the current yield as of June 30, 2023. | |
SEE NOTES TO FINANCIAL STATEMENTS.
| J.P. Morgan Large Cap Funds | |
Futures contracts outstanding as of June 30, 2023 (amounts in thousands, except number of contracts):
| | | | | VALUE AND
UNREALIZED
APPRECIATION
(DEPRECIATION) ($) |
| | | | | |
| | | | | |
SEE NOTES TO FINANCIAL STATEMENTS.
| J.P. Morgan Large Cap Funds | |
JPMorgan U.S. Research Enhanced Equity Fund
SCHEDULE OF PORTFOLIO INVESTMENTS
AS OF June 30, 2023
| | |
|
Aerospace & Defense — 1.3% |
| | |
Raytheon Technologies Corp. | | |
| | |
| | |
Air Freight & Logistics — 1.2% |
| | |
United Parcel Service, Inc., Class B | | |
| | |
Automobile Components — 0.2% |
| | |
|
| | |
|
| | |
| | |
| | |
| | |
| | |
| | |
| | |
|
| | |
Constellation Brands, Inc., Class A | | |
| | |
| | |
| | |
|
| | |
| | |
BioMarin Pharmaceutical, Inc. * | | |
Neurocrine Biosciences, Inc. * | | |
Regeneron Pharmaceuticals, Inc. * | | |
Sarepta Therapeutics, Inc. * | | |
Vertex Pharmaceuticals, Inc. * | | |
| | |
|
| | |
| | |
|
|
| | |
| | |
| | |
|
Charles Schwab Corp. (The) | | |
| | |
Intercontinental Exchange, Inc. | | |
| | |
Raymond James Financial, Inc. | | |
| | |
| | |
| | |
|
Air Products and Chemicals, Inc. | | |
| | |
| | |
| | |
LyondellBasell Industries NV, Class A | | |
| | |
| | |
Commercial Services & Supplies — 0.2% |
| | |
Communications Equipment — 0.2% |
| | |
|
| | |
Consumer Staples Distribution & Retail — 1.0% |
| | |
|
| | |
Diversified Telecommunication Services — 0.1% |
| | |
Electric Utilities — 1.3% |
| | |
| | |
| | |
Electrical Equipment — 0.7% |
| | |
SEE NOTES TO FINANCIAL STATEMENTS.
| J.P. Morgan Large Cap Funds | |
| | |
Common Stocks — continued |
Electronic Equipment, Instruments & Components — 0.2% |
| | |
Keysight Technologies, Inc. * | | |
| | |
Energy Equipment & Services — 0.2% |
| | |
|
| | |
Financial Services — 4.4% |
Berkshire Hathaway, Inc., Class B * | | |
FleetCor Technologies, Inc. * | | |
Mastercard, Inc., Class A | | |
| | |
| | |
|
Mondelez International, Inc., Class A | | |
Ground Transportation — 0.9% |
| | |
| | |
Uber Technologies, Inc. * | | |
| | |
| | |
Health Care Equipment & Supplies — 2.6% |
| | |
Baxter International, Inc. | | |
Boston Scientific Corp. * | | |
| | |
Intuitive Surgical, Inc. * | | |
| | |
| | |
| | |
| | |
Health Care Providers & Services — 2.9% |
| | |
| | |
| | |
| | |
| | |
| | |
| | |
| | |
|
|
| | |
Hotels, Restaurants & Leisure — 2.9% |
| | |
Chipotle Mexican Grill, Inc. * | | |
| | |
| | |
Marriott International, Inc., Class A | | |
| | |
Royal Caribbean Cruises Ltd. * | | |
| | |
| | |
Household Durables — 0.3% |
| | |
| | |
| | |
| | |
Household Products — 1.3% |
Church & Dwight Co., Inc. | | |
| | |
Procter & Gamble Co. (The) | | |
| | |
Industrial Conglomerates — 1.1% |
Honeywell International, Inc. | | |
|
| | |
|
| | |
| | |
| | |
| | |
Travelers Cos., Inc. (The) | | |
| | |
Interactive Media & Services — 5.5% |
Alphabet, Inc., Class A * | | |
Alphabet, Inc., Class C * | | |
Meta Platforms, Inc., Class A * | | |
| | |
SEE NOTES TO FINANCIAL STATEMENTS.
| J.P. Morgan Large Cap Funds | |
JPMorgan U.S. Research Enhanced Equity Fund
SCHEDULE OF PORTFOLIO INVESTMENTS
AS OF June 30, 2023 (continued)
| | |
Common Stocks — continued |
|
| | |
Cognizant Technology Solutions Corp., Class A | | |
| | |
Life Sciences Tools & Services — 1.4% |
| | |
Thermo Fisher Scientific, Inc. | | |
| | |
|
| | |
| | |
| | |
| | |
| | |
|
Charter Communications, Inc., Class A * | | |
| | |
| | |
|
| | |
| | |
| | |
|
| | |
| | |
| | |
| | |
Public Service Enterprise Group, Inc. | | |
| | |
Oil, Gas & Consumable Fuels — 3.9% |
| | |
| | |
| | |
| | |
| | |
| | |
| | |
Passenger Airlines — 0.3% |
| | |
| | |
| | |
| | |
|
Personal Care Products — 0.0% ^ |
| | |
|
| | |
| | |
| | |
| | |
| | |
Professional Services — 0.3% |
Booz Allen Hamilton Holding Corp. | | |
| | |
| | |
|
Equity LifeStyle Properties, Inc. | | |
| | |
| | |
| | |
Semiconductors & Semiconductor Equipment — 7.9% |
Advanced Micro Devices, Inc. * | | |
| | |
| | |
| | |
| | |
NXP Semiconductors NV (China) | | |
| | |
| | |
| | |
| | |
|
| | |
Cadence Design Systems, Inc. * | | |
| | |
| | |
| | |
| | |
| | |
| | |
| | |
SEE NOTES TO FINANCIAL STATEMENTS.
| J.P. Morgan Large Cap Funds | |
| | |
Common Stocks — continued |
|
| | |
| | |
| | |
|
| | |
| | |
| | |
Burlington Stores, Inc. * | | |
| | |
| | |
O'Reilly Automotive, Inc. * | | |
| | |
| | |
| | |
Technology Hardware, Storage & Peripherals — 8.0% |
| | |
Seagate Technology Holdings plc | | |
| | |
Textiles, Apparel & Luxury Goods — 0.5% |
| | |
|
| | |
Philip Morris International, Inc. | | |
| | |
| | |
|
Wireless Telecommunication Services — 0.3% |
| | |
Total Common Stocks
(Cost $4,811,175) | | |
Short-Term Investments — 1.1% |
Investment Companies — 1.1% |
JPMorgan Prime Money Market Fund Class IM Shares, 5.23% (a) (b)
(Cost $82,056) | | |
Total Investments — 100.0%
(Cost $4,893,231) | | |
Liabilities in Excess of Other Assets — (0.0)% ^ | | |
| | |
Percentages indicated are based on net assets. |
| |
| Real Estate Investment Trust |
| Amount rounds to less than 0.1% of net assets. |
| Non-income producing security. | |
| Investment in an affiliated fund, which is registered under the Investment Company Act of 1940, as amended, and is advised by J.P. Morgan Investment Management Inc. | |
| The rate shown is the current yield as of June 30, 2023. | |
Futures contracts outstanding as of June 30, 2023 (amounts in thousands, except number of contracts):
| | | | | VALUE AND
UNREALIZED
APPRECIATION
(DEPRECIATION) ($) |
| | | | | |
| | | | | |
SEE NOTES TO FINANCIAL STATEMENTS.
| J.P. Morgan Large Cap Funds | |
JPMorgan U.S. Sustainable Leaders Fund
SCHEDULE OF PORTFOLIO INVESTMENTS
AS OF June 30, 2023
| | |
|
Automobile Components — 0.8% |
| | |
|
| | |
|
| | |
| | |
| | |
| | |
|
| | |
Regeneron Pharmaceuticals, Inc. * | | |
Vertex Pharmaceuticals, Inc. * | | |
| | |
|
| | |
|
| | |
| | |
| | |
|
Charles Schwab Corp. (The) | | |
| | |
| | |
| | |
| | |
|
| | |
| | |
| | |
Commercial Services & Supplies — 1.2% |
| | |
Consumer Staples Distribution & Retail — 2.8% |
| | |
| | |
| | |
Containers & Packaging — 0.8% |
| | |
Diversified Telecommunication Services — 0.9% |
Verizon Communications, Inc. | | |
| | |
|
Electric Utilities — 3.3% |
| | |
| | |
| | |
| | |
Electrical Equipment — 1.7% |
| | |
Energy Equipment & Services — 1.6% |
| | |
|
| | |
| | |
| | |
Financial Services — 3.6% |
Mastercard, Inc., Class A | | |
|
| | |
Ground Transportation — 1.1% |
| | |
Health Care Equipment & Supplies — 2.8% |
Boston Scientific Corp. * | | |
| | |
| | |
Health Care Providers & Services — 2.7% |
| | |
|
| | |
|
Marsh & McLennan Cos., Inc. | | |
| | |
| | |
Travelers Cos., Inc. (The) | | |
| | |
Interactive Media & Services — 4.1% |
Alphabet, Inc., Class A * | | |
|
| | |
Life Sciences Tools & Services — 4.2% |
Agilent Technologies, Inc. | | |
SEE NOTES TO FINANCIAL STATEMENTS.
| J.P. Morgan Large Cap Funds | |
| | |
Common Stocks — continued |
Life Sciences Tools & Services — continued |
| | |
Thermo Fisher Scientific, Inc. | | |
| | |
|
| | |
| | |
| | |
|
Charter Communications, Inc., Class A * | | |
|
| | |
Personal Care Products — 0.6% |
Estee Lauder Cos., Inc. (The), Class A | | |
|
| | |
| | |
| | |
| | |
Semiconductors & Semiconductor Equipment — 7.1% |
Advanced Micro Devices, Inc. * | | |
| | |
| | |
NXP Semiconductors NV (China) | | |
SolarEdge Technologies, Inc. * | | |
| | |
| | |
|
| | |
| | |
Cadence Design Systems, Inc. * | | |
| | |
| | |
| | |
Palo Alto Networks, Inc. * | | |
| | |
| | |
|
| | |
| | |
|
Specialized REITs — continued |
| | |
| | |
| | |
|
| | |
| | |
| | |
| | |
| | |
Technology Hardware, Storage & Peripherals — 7.8% |
| | |
Seagate Technology Holdings plc | | |
| | |
Total Common Stocks
(Cost $139,712) | | |
Short-Term Investments — 0.8% |
Investment Companies — 0.8% |
JPMorgan Prime Money Market Fund Class IM Shares, 5.23% (a) (b)
(Cost $1,493) | | |
Total Investments — 100.0%
(Cost $141,205) | | |
Liabilities in Excess of Other Assets — (0.0)% ^ | | |
| | |
Percentages indicated are based on net assets. |
| |
| Real Estate Investment Trust |
| Amount rounds to less than 0.1% of net assets. |
| Non-income producing security. | |
| Investment in an affiliated fund, which is registered under the Investment Company Act of 1940, as amended, and is advised by J.P. Morgan Investment Management Inc. | |
| The rate shown is the current yield as of June 30, 2023. | |
SEE NOTES TO FINANCIAL STATEMENTS.
| J.P. Morgan Large Cap Funds | |
JPMorgan U.S. Sustainable Leaders Fund
SCHEDULE OF PORTFOLIO INVESTMENTS
AS OF June 30, 2023 (continued)
Futures contracts outstanding as of June 30, 2023 (amounts in thousands, except number of contracts):
| | | | | VALUE AND
UNREALIZED
APPRECIATION
(DEPRECIATION) ($) |
| | | | | |
S&P 500 E-Mini ESG Equity Index | | | | | |
SEE NOTES TO FINANCIAL STATEMENTS.
| J.P. Morgan Large Cap Funds | |
SCHEDULE OF PORTFOLIO INVESTMENTS
AS OF June 30, 2023
| | |
|
Aerospace & Defense — 3.8% |
| | |
| | |
Raytheon Technologies Corp. | | |
| | |
Air Freight & Logistics — 1.6% |
United Parcel Service, Inc., Class B | | |
|
| | |
| | |
Citizens Financial Group, Inc. | | |
| | |
PNC Financial Services Group, Inc. (The) | | |
| | |
| | |
| | |
| | |
|
| | |
| | |
| | |
|
| | |
| | |
| | |
Vertex Pharmaceuticals, Inc. * | | |
| | |
|
| | |
|
| | |
Charles Schwab Corp. (The) | | |
Goldman Sachs Group, Inc. (The) | | |
| | |
| | |
T. Rowe Price Group, Inc. | | |
| | |
|
Air Products and Chemicals, Inc. | | |
Axalta Coating Systems Ltd. * | | |
| | |
| | |
|
Commercial Services & Supplies — 1.0% |
| | |
Construction Materials — 1.4% |
| | |
|
| | |
Capital One Financial Corp. | | |
| | |
Consumer Staples Distribution & Retail — 1.9% |
| | |
| | |
| | |
Containers & Packaging — 0.5% |
| | |
Electric Utilities — 2.5% |
| | |
| | |
| | |
| | |
Electrical Equipment — 1.2% |
| | |
|
| | |
Financial Services — 2.1% |
Berkshire Hathaway, Inc., Class B * | | |
|
Mondelez International, Inc., Class A | | |
Ground Transportation — 1.3% |
| | |
Health Care Equipment & Supplies — 3.8% |
| | |
Boston Scientific Corp. * | | |
| | |
Zimmer Biomet Holdings, Inc. | | |
| | |
Health Care Providers & Services — 4.6% |
| | |
| | |
| | |
SEE NOTES TO FINANCIAL STATEMENTS.
| J.P. Morgan Large Cap Funds | |
SCHEDULE OF PORTFOLIO INVESTMENTS
AS OF June 30, 2023 (continued)
| | |
Common Stocks — continued |
Health Care Providers & Services — continued |
| | |
Universal Health Services, Inc., Class B | | |
| | |
|
| | |
Hotel & Resort REITs — 0.5% |
Host Hotels & Resorts, Inc. | | |
Hotels, Restaurants & Leisure — 1.8% |
| | |
| | |
| | |
Household Products — 1.2% |
Procter & Gamble Co. (The) | | |
|
| | |
Hartford Financial Services Group, Inc. (The) | | |
| | |
Marsh & McLennan Cos., Inc. | | |
| | |
Prudential Financial, Inc. | | |
| | |
Interactive Media & Services — 2.6% |
Alphabet, Inc., Class C * | | |
Meta Platforms, Inc., Class A * | | |
| | |
|
International Business Machines Corp. | | |
|
| | |
| | |
| | |
|
| | |
|
| | |
Public Service Enterprise Group, Inc. | | |
| | |
Oil, Gas & Consumable Fuels — 8.3% |
| | |
| | |
|
Oil, Gas & Consumable Fuels — continued |
| | |
| | |
| | |
| | |
Passenger Airlines — 0.7% |
| | |
|
| | |
| | |
| | |
| | |
| | |
| | |
|
AvalonBay Communities, Inc. | | |
Semiconductors & Semiconductor Equipment — 5.9% |
Advanced Micro Devices, Inc. * | | |
| | |
NXP Semiconductors NV (China) | | |
| | |
| | |
| | |
|
| | |
|
| | |
| | |
| | |
O'Reilly Automotive, Inc. * | | |
| | |
| | |
Technology Hardware, Storage & Peripherals — 0.4% |
| | |
Textiles, Apparel & Luxury Goods — 0.8% |
| | |
|
Philip Morris International, Inc. | | |
SEE NOTES TO FINANCIAL STATEMENTS.
| J.P. Morgan Large Cap Funds | |
| | |
Common Stocks — continued |
Wireless Telecommunication Services — 0.5% |
| | |
Total Common Stocks
(Cost $3,939,199) | | |
Short-Term Investments — 3.7% |
Investment Companies — 3.7% |
JPMorgan Prime Money Market Fund Class IM Shares, 5.23% (a) (b)
(Cost $173,626) | | |
Total Investments — 102.1%
(Cost $4,112,825) | | |
Liabilities in Excess of Other Assets — (2.1)% | | |
| | |
Percentages indicated are based on net assets. |
| |
| Real Estate Investment Trust |
| Non-income producing security. |
| Investment in an affiliated fund, which is registered under the Investment Company Act of 1940, as amended, and is advised by J.P. Morgan Investment Management Inc. |
| The rate shown is the current yield as of June 30, 2023. |
SEE NOTES TO FINANCIAL STATEMENTS.
| J.P. Morgan Large Cap Funds | |
STATEMENTS OF ASSETS AND LIABILITIES
AS OF June 30, 2023
(Amounts in thousands, except per share amounts)
| JPMorgan
Equity Income
Fund | | JPMorgan
Equity Premium
Income Fund | |
| | | | |
Investments in non-affiliates, at value | | | | |
Investments in affiliates, at value | | | | |
Investments of cash collateral received from securities loaned, at value (See Note 2.C.) | | | | |
Options purchased, at value | | | | |
| | | | |
Deposits at broker for futures contracts | | | | |
| | | | |
Investment securities sold | | | | |
| | | | |
Interest from non-affiliates | | | | |
Dividends from non-affiliates | | | | |
Dividends from affiliates | | | | |
Securities lending income (See Note 2.C.) | | | | |
Variation margin on futures contracts | | | | |
| | | | |
| | | | |
| | | | |
| | | | |
| | | | |
| | | | |
Investment securities purchased | | | | |
Collateral received on securities loaned (See Note 2.C.) | | | | |
| | | | |
Outstanding options written, at fair value | | | | |
| | | | |
| | | | |
| | | | |
| | | | |
| | | | |
Custodian and accounting fees | | | | |
Trustees’ and Chief Compliance Officer’s fees | | | | |
| | | | |
| | | | |
| | | | |
(a)
Amount rounds to less than one thousand.
SEE NOTES TO FINANCIAL STATEMENTS.
| J.P. Morgan Large Cap Funds | |
| JPMorgan Equity Income Fund | | JPMorgan Equity Premium Income Fund | |
| | | | |
| | | | |
Total distributable earnings (loss) | | | | |
| | | | |
| | | | |
| | | | |
| | | | |
| | | | |
| | | | |
| | | | |
| | | | |
| | | | |
| | | | |
| | | | |
Outstanding units of beneficial interest (shares)
($0.0001 par value; unlimited number of shares authorized): | | | | |
| | | | |
| | | | |
| | | | |
| | | | |
| | | | |
| | | | |
| | | | |
| | | | |
| | | | |
Class A — Redemption price per share | | | | |
Class C — Offering price per share (b) | | | | |
Class I — Offering and redemption price per share | | | | |
Class R2 — Offering and redemption price per share | | | | |
Class R3 — Offering and redemption price per share | | | | |
Class R4 — Offering and redemption price per share | | | | |
Class R5 — Offering and redemption price per share | | | | |
Class R6 — Offering and redemption price per share | | | | |
Class A maximum sales charge | | | | |
Class A maximum public offering price per share
[net asset value per share/(100% – maximum sales charge)] | | | | |
Cost of investments in non-affiliates | | | | |
Cost of investments in affiliates | | | | |
Cost of options purchased | | | | |
Investment securities on loan, at value (See Note 2.C.) | | | | |
Cost of investment of cash collateral (See Note 2.C.) | | | | |
Premiums received from options written | | | | |
(a)
Per share amounts may not recalculate due to rounding of net assets and/or shares outstanding.
(b)
Redemption price for Class C Shares varies based upon length of time the shares are held.
SEE NOTES TO FINANCIAL STATEMENTS.
| J.P. Morgan Large Cap Funds | |
STATEMENTS OF ASSETS AND LIABILITIES
AS OF June 30, 2023 (continued)
(Amounts in thousands, except per share amounts)
| JPMorgan
Hedged
Equity 2 Fund | JPMorgan
Hedged
Equity 3 Fund | JPMorgan
Large Cap
Growth Fund | |
| | | | |
Investments in non-affiliates, at value | | | | |
Investments in affiliates, at value | | | | |
Investments of cash collateral received from securities loaned, at value (See Note 2.C.) | | | | |
Options purchased, at value | | | | |
Restricted cash for exchange-traded options | | | | |
| | | | |
Foreign currency, at value | | | | |
Deposits at broker for futures contracts | | | | |
| | | | |
| | | | |
Investment securities sold | | | | |
| | | | |
Dividends from non-affiliates | | | | |
Dividends from affiliates | | | | |
Securities lending income (See Note 2.C.) | | | | |
Variation margin on futures contracts | | | | |
| | | | |
| | | | |
| | | | |
| | | | |
Investment securities purchased | | | | |
Collateral received on securities loaned (See Note 2.C.) | | | | |
| | | | |
Outstanding options written, at fair value | | | | |
| | | | |
| | | | |
| | | | |
| | | | |
| | | | |
Custodian and accounting fees | | | | |
Trustees’ and Chief Compliance Officer’s fees | | | | |
| | | | |
| | | | |
| | | | |
(a)
Amount rounds to less than one thousand.
SEE NOTES TO FINANCIAL STATEMENTS.
| J.P. Morgan Large Cap Funds | |
| JPMorgan Hedged Equity 2 Fund | JPMorgan Hedged Equity 3 Fund | JPMorgan Large Cap Growth Fund | |
| | | | |
| | | | |
Total distributable earnings (loss) | | | | |
| | | | |
| | | | |
| | | | |
| | | | |
| | | | |
| | | | |
| | | | |
| | | | |
| | | | |
| | | | |
| | | | |
Outstanding units of beneficial interest (shares)
($0.0001 par value; unlimited number of shares authorized): | | | | |
| | | | |
| | | | |
| | | | |
| | | | |
| | | | |
| | | | |
| | | | |
| | | | |
| | | | |
Class A — Redemption price per share | | | | |
Class C — Offering price per share (b) | | | | |
Class I — Offering and redemption price per share | | | | |
Class R2 — Offering and redemption price per share | | | | |
Class R3 — Offering and redemption price per share | | | | |
Class R4 — Offering and redemption price per share | | | | |
Class R5 — Offering and redemption price per share | | | | |
Class R6 — Offering and redemption price per share | | | | |
Class A maximum sales charge | | | | |
Class A maximum public offering price per share
[net asset value per share/(100% – maximum sales charge)] | | | | |
Cost of investments in non-affiliates | | | | |
Cost of investments in affiliates | | | | |
Cost of options purchased | | | | |
| | | | |
Investment securities on loan, at value (See Note 2.C.) | | | | |
Cost of investment of cash collateral (See Note 2.C.) | | | | |
Premiums received from options written | | | | |
(a)
Per share amounts may not recalculate due to rounding of net assets and/or shares outstanding.
(b)
Redemption price for Class C Shares varies based upon length of time the shares are held.
SEE NOTES TO FINANCIAL STATEMENTS.
| J.P. Morgan Large Cap Funds | |
STATEMENTS OF ASSETS AND LIABILITIES
AS OF June 30, 2023 (continued)
(Amounts in thousands, except per share amounts)
| JPMorgan
U.S. Applied
Data Science
Value Fund | | JPMorgan
U.S. GARP
Equity Fund | JPMorgan
U.S. Large
Cap Core
|
| | | | |
Investments in non-affiliates, at value | | | | |
Investments in affiliates, at value | | | | |
Investments of cash collateral received from securities loaned, at value (See Note 2.C.) | | | | |
| | | | |
Deposits at broker for futures contracts | | | | |
| | | | |
Investment securities sold | | | | |
| | | | |
Dividends from non-affiliates | | | | |
Dividends from affiliates | | | | |
Securities lending income (See Note 2.C.) | | | | |
Variation margin on futures contracts | | | | |
| | | | |
| | | | |
| | | | |
Securities sold short, at value | | | | |
Dividend expense to non-affiliates on securities sold short | | | | |
Investment securities purchased | | | | |
Interest expense to non-affiliates on securities sold short | | | | |
Collateral received on securities loaned (See Note 2.C.) | | | | |
| | | | |
| | | | |
| | | | |
| | | | |
| | | | |
| | | | |
Custodian and accounting fees | | | | |
Trustees’ and Chief Compliance Officer’s fees | | | | |
| | | | |
| | | | |
| | | | |
(a)
Amount rounds to less than one thousand.
SEE NOTES TO FINANCIAL STATEMENTS.
| J.P. Morgan Large Cap Funds | |
| JPMorgan U.S. Applied Data Science Value Fund | | JPMorgan U.S. GARP Equity Fund | JPMorgan U.S. Large Cap Core |
| | | | |
| | | | |
Total distributable earnings (loss) | | | | |
| | | | |
| | | | |
| | | | |
| | | | |
| | | | |
| | | | |
| | | | |
| | | | |
| | | | |
| | | | |
| | | | |
| | | | |
Outstanding units of beneficial interest (shares)
($0.0001 par value; unlimited number of shares authorized): | | | | |
| | | | |
| | | | |
| | | | |
| | | | |
| | | | |
| | | | |
| | | | |
| | | | |
| | | | |
| | | | |
Class A — Redemption price per share | | | | |
Class C — Offering price per share (b) | | | | |
Class I — Offering and redemption price per share | | | | |
Class L — Offering and redemption price per share | | | | |
Class R2 — Offering and redemption price per share | | | | |
Class R3 — Offering and redemption price per share | | | | |
Class R4 — Offering and redemption price per share | | | | |
Class R5 — Offering and redemption price per share | | | | |
Class R6 — Offering and redemption price per share | | | | |
Class A maximum sales charge | | | | |
Class A maximum public offering price per share
[net asset value per share/(100% – maximum sales charge)] | | | | |
Cost of investments in non-affiliates | | | | |
Cost of investments in affiliates | | | | |
Investment securities on loan, at value (See Note 2.C.) | | | | |
Cost of investment of cash collateral (See Note 2.C.) | | | | |
Proceeds from securities sold short | | | | |
(a)
Per share amounts may not recalculate due to rounding of net assets and/or shares outstanding.
(b)
Redemption price for Class C Shares varies based upon length of time the shares are held.
SEE NOTES TO FINANCIAL STATEMENTS.
| J.P. Morgan Large Cap Funds | |
STATEMENTS OF ASSETS AND LIABILITIES
AS OF June 30, 2023 (continued)
(Amounts in thousands, except per share amounts)
| JPMorgan
U.S. Research
Enhanced
Equity Fund | JPMorgan
U.S. Sustainable
Leaders Fund | |
| | | |
Investments in non-affiliates, at value | | | |
Investments in affiliates, at value | | | |
| | | |
Deposits at broker for futures contracts | | | |
| | | |
Investment securities sold | | | |
| | | |
Dividends from non-affiliates | | | |
Dividends from affiliates | | | |
Securities lending income (See Note 2.C.) | | | |
Variation margin on futures contracts | | | |
| | | |
| | | |
| | | |
Investment securities purchased | | | |
| | | |
| | | |
| | | |
| | | |
| | | |
| | | |
Custodian and accounting fees | | | |
Trustees’ and Chief Compliance Officer’s fees | | | |
| | | |
| | | |
| | | |
(a)
Amount rounds to less than one thousand.
SEE NOTES TO FINANCIAL STATEMENTS.
| J.P. Morgan Large Cap Funds | |
| JPMorgan U.S. Research Enhanced Equity Fund | JPMorgan U.S. Sustainable Leaders Fund | |
| | | |
| | | |
Total distributable earnings (loss) | | | |
| | | |
| | | |
| | | |
| | | |
| | | |
| | | |
| | | |
| | | |
| | | |
| | | |
| | | |
Outstanding units of beneficial interest (shares)
($0.0001 par value; unlimited number of shares authorized): | | | |
| | | |
| | | |
| | | |
| | | |
| | | |
| | | |
| | | |
| | | |
| | | |
Class A — Redemption price per share | | | |
Class C — Offering price per share (b) | | | |
Class I — Offering and redemption price per share | | | |
Class R2 — Offering and redemption price per share | | | |
Class R3 — Offering and redemption price per share | | | |
Class R4 — Offering and redemption price per share | | | |
Class R5 — Offering and redemption price per share | | | |
Class R6 — Offering and redemption price per share | | | |
Class A maximum sales charge | | | |
Class A maximum public offering price per share
[net asset value per share/(100% – maximum sales charge)] | | | |
Cost of investments in non-affiliates | | | |
Cost of investments in affiliates | | | |
(a)
Per share amounts may not recalculate due to rounding of net assets and/or shares outstanding.
(b)
Redemption price for Class C Shares varies based upon length of time the shares are held.
SEE NOTES TO FINANCIAL STATEMENTS.
| J.P. Morgan Large Cap Funds | |
STATEMENTS OF OPERATIONS
FOR THE YEAR ENDED June 30, 2023
(Amounts in thousands)
| JPMorgan
Equity Income
Fund | | JPMorgan
Equity Premium
Income Fund | |
| | | | |
Interest income from non-affiliates | | | | |
Interest income from affiliates | | | | |
Dividend income from non-affiliates | | | | |
Dividend income from affiliates | | | | |
Income from securities lending (net) (See Note 2.C.) | | | | |
| | | | |
| | | | |
| | | | |
| | | | |
| | | | |
| | | | |
| | | | |
| | | | |
| | | | |
| | | | |
| | | | |
| | | | |
| | | | |
| | | | |
| | | | |
| | | | |
| | | | |
Custodian and accounting fees | | | | |
Interest expense to affiliates | | | | |
| | | | |
Trustees’ and Chief Compliance Officer’s fees | | | | |
Printing and mailing costs | | | | |
Registration and filing fees | | | | |
Transfer agency fees (See Note 2.L.) | | | | |
| | | | |
| | | | |
| | | | |
Less expense reimbursements | | | | |
| | | | |
Net investment income (loss) | | | | |
(a)
Amount rounds to less than one thousand.
SEE NOTES TO FINANCIAL STATEMENTS.
| J.P. Morgan Large Cap Funds | |
| JPMorgan Equity Income Fund | | JPMorgan Equity Premium Income Fund | |
REALIZED/UNREALIZED GAINS (LOSSES): | | | | |
Net realized gain (loss) on transactions from: | | | | |
Investments in non-affiliates | | | | |
Investments in affiliates | | | | |
| | | | |
| | | | |
| | | | |
| | | | |
Change in net unrealized appreciation/depreciation on: | | | | |
Investments in non-affiliates | | | | |
Investments in affiliates | | | | |
| | | | |
| | | | |
| | | | |
Change in net unrealized appreciation/depreciation | | | | |
Net realized/unrealized gains (losses) | | | | |
Change in net assets resulting from operations | | | | |
SEE NOTES TO FINANCIAL STATEMENTS.
| J.P. Morgan Large Cap Funds | |
STATEMENTS OF OPERATIONS
FOR THE YEAR ENDED June 30, 2023 (continued)
(Amounts in thousands)
| JPMorgan
Hedged
Equity 2 Fund | JPMorgan
Hedged
Equity 3 Fund | JPMorgan
Large Cap
Growth Fund | |
| | | | |
Interest income from non-affiliates | | | | |
Interest income from affiliates | | | | |
Dividend income from non-affiliates | | | | |
Dividend income from affiliates | | | | |
Income from securities lending (net) (See Note 2.C.) | | | | |
| | | | |
| | | | |
| | | | |
| | | | |
| | | | |
| | | | |
| | | | |
| | | | |
| | | | |
| | | | |
| | | | |
| | | | |
| | | | |
| | | | |
| | | | |
| | | | |
| | | | |
Custodian and accounting fees | | | | |
Interest expense to affiliates | | | | |
| | | | |
Trustees’ and Chief Compliance Officer’s fees | | | | |
Printing and mailing costs | | | | |
Registration and filing fees | | | | |
Transfer agency fees (See Note 2.L.) | | | | |
| | | | |
| | | | |
| | | | |
Less expense reimbursements | | | | |
| | | | |
Net investment income (loss) | | | | |
(a)
Amount rounds to less than one thousand.
SEE NOTES TO FINANCIAL STATEMENTS.
| J.P. Morgan Large Cap Funds | |
| JPMorgan Hedged Equity 2 Fund | JPMorgan Hedged Equity 3 Fund | JPMorgan Large Cap Growth Fund | |
REALIZED/UNREALIZED GAINS (LOSSES): | | | | |
Net realized gain (loss) on transactions from: | | | | |
Investments in non-affiliates | | | | |
Investments in affiliates | | | | |
| | | | |
| | | | |
Foreign currency transactions | | | | |
| | | | |
| | | | |
Change in net unrealized appreciation/depreciation on: | | | | |
Investments in non-affiliates | | | | |
Investments in affiliates | | | | |
| | | | |
| | | | |
| | | | |
Change in net unrealized appreciation/depreciation | | | | |
Net realized/unrealized gains (losses) | | | | |
Change in net assets resulting from operations | | | | |
SEE NOTES TO FINANCIAL STATEMENTS.
| J.P. Morgan Large Cap Funds | |
STATEMENTS OF OPERATIONS
FOR THE YEAR ENDED June 30, 2023 (continued)
(Amounts in thousands)
| JPMorgan
U.S. Applied
Data Science
Value Fund | | JPMorgan
U.S. GARP
Equity Fund | JPMorgan
U.S. Large
Cap Core
|
| | | | |
Interest income from non-affiliates | | | | |
Interest income from affiliates | | | | |
Dividend income from non-affiliates | | | | |
Dividend income from affiliates | | | | |
Income from securities lending (net) (See Note 2.C.) | | | | |
| | | | |
| | | | |
| | | | |
| | | | |
| | | | |
| | | | |
| | | | |
| | | | |
| | | | |
| | | | |
| | | | |
| | | | |
| | | | |
| | | | |
| | | | |
| | | | |
| | | | |
| | | | |
Custodian and accounting fees | | | | |
Interest expense to affiliates | | | | |
| | | | |
Trustees’ and Chief Compliance Officer’s fees | | | | |
Printing and mailing costs | | | | |
Registration and filing fees | | | | |
Transfer agency fees (See Note 2.L.) | | | | |
Dividend expense to non-affiliates on securities sold short | | | | |
Interest expense to non-affiliates on securities sold short | | | | |
| | | | |
| | | | |
| | | | |
Less expense reimbursements | | | | |
| | | | |
Net investment income (loss) | | | | |
(a)
Amount rounds to less than one thousand.
SEE NOTES TO FINANCIAL STATEMENTS.
| J.P. Morgan Large Cap Funds | |
| JPMorgan U.S. Applied Data Science Value Fund | | JPMorgan U.S. GARP Equity Fund | JPMorgan U.S. Large Cap Core |
REALIZED/UNREALIZED GAINS (LOSSES): | | | | |
Net realized gain (loss) on transactions from: | | | | |
Investments in non-affiliates | | | | |
Investments in affiliates | | | | |
| | | | |
| | | | |
| | | | |
Change in net unrealized appreciation/depreciation on: | | | | |
Investments in non-affiliates | | | | |
Investments in affiliates | | | | |
| | | | |
| | | | |
Change in net unrealized appreciation/depreciation | | | | |
Net realized/unrealized gains (losses) | | | | |
Change in net assets resulting from operations | | | | |
(a)
Amount rounds to less than one thousand.
SEE NOTES TO FINANCIAL STATEMENTS.
| J.P. Morgan Large Cap Funds | |
STATEMENTS OF OPERATIONS
FOR THE YEAR ENDED June 30, 2023 (continued)
(Amounts in thousands)
| JPMorgan
U.S. Research
Enhanced
Equity Fund | JPMorgan
U.S. Sustainable
Leaders Fund | |
| | | |
Interest income from non-affiliates | | | |
Dividend income from non-affiliates | | | |
Dividend income from affiliates | | | |
Income from securities lending (net) (See Note 2.C.) | | | |
| | | |
| | | |
| | | |
| | | |
| | | |
| | | |
| | | |
| | | |
| | | |
| | | |
| | | |
| | | |
| | | |
| | | |
| | | |
| | | |
| | | |
Custodian and accounting fees | | | |
| | | |
Trustees’ and Chief Compliance Officer’s fees | | | |
Printing and mailing costs | | | |
Registration and filing fees | | | |
Transfer agency fees (See Note 2.L.) | | | |
| | | |
| | | |
| | | |
Less expense reimbursements | | | |
| | | |
Net investment income (loss) | | | |
(a)
Amount rounds to less than one thousand.
SEE NOTES TO FINANCIAL STATEMENTS.
| J.P. Morgan Large Cap Funds | |
| JPMorgan U.S. Research Enhanced Equity Fund | JPMorgan U.S. Sustainable Leaders Fund | |
REALIZED/UNREALIZED GAINS (LOSSES): | | | |
Net realized gain (loss) on transactions from: | | | |
Investments in non-affiliates | | | |
Investments in affiliates | | | |
| | | |
| | | |
Change in net unrealized appreciation/depreciation on: | | | |
Investments in non-affiliates | | | |
Investments in affiliates | | | |
| | | |
Foreign currency translations | | | |
Change in net unrealized appreciation/depreciation | | | |
Net realized/unrealized gains (losses) | | | |
Change in net assets resulting from operations | | | |
(a)
Amount rounds to less than one thousand.
SEE NOTES TO FINANCIAL STATEMENTS.
| J.P. Morgan Large Cap Funds | |
STATEMENTS OF CHANGES IN NET ASSETS
FOR THE PERIODS INDICATED
(Amounts in thousands)
| JPMorgan Equity Income Fund | JPMorgan Equity Index Fund |
| | | | |
CHANGE IN NET ASSETS RESULTING FROM OPERATIONS: | | | | |
Net investment income (loss) | | | | |
| | | | |
Change in net unrealized appreciation/depreciation | | | | |
Change in net assets resulting from operations | | | | |
DISTRIBUTIONS TO SHAREHOLDERS: | | | | |
| | | | |
| | | | |
| | | | |
| | | | |
| | | | |
| | | | |
| | | | |
| | | | |
Total distributions to shareholders | | | | |
| | | | |
Change in net assets resulting from capital transactions | | | | |
| | | | |
| | | | |
| | | | |
| | | | |
SEE NOTES TO FINANCIAL STATEMENTS.
| J.P. Morgan Large Cap Funds | |
| JPMorgan Equity Premium
Income Fund | JPMorgan Hedged Equity Fund |
| | | | |
CHANGE IN NET ASSETS RESULTING FROM OPERATIONS: | | | | |
Net investment income (loss) | | | | |
| | | | |
Change in net unrealized appreciation/depreciation | | | | |
Change in net assets resulting from operations | | | | |
DISTRIBUTIONS TO SHAREHOLDERS: | | | | |
| | | | |
| | | | |
| | | | |
| | | | |
| | | | |
Total distributions to shareholders | | | | |
| | | | |
Change in net assets resulting from capital transactions | | | | |
| | | | |
| | | | |
| | | | |
| | | | |
SEE NOTES TO FINANCIAL STATEMENTS.
| J.P. Morgan Large Cap Funds | |
STATEMENTS OF CHANGES IN NET ASSETS
FOR THE PERIODS INDICATED (continued)
(Amounts in thousands)
| JPMorgan Hedged Equity 2 Fund | JPMorgan Hedged Equity 3 Fund |
| | | | |
CHANGE IN NET ASSETS RESULTING FROM OPERATIONS: | | | | |
Net investment income (loss) | | | | |
| | | | |
Change in net unrealized appreciation/depreciation | | | | |
Change in net assets resulting from operations | | | | |
DISTRIBUTIONS TO SHAREHOLDERS: | | | | |
| | | | |
| | | | |
| | | | |
| | | | |
| | | | |
Total distributions to shareholders | | | | |
| | | | |
Change in net assets resulting from capital transactions | | | | |
| | | | |
| | | | |
| | | | |
| | | | |
SEE NOTES TO FINANCIAL STATEMENTS.
| J.P. Morgan Large Cap Funds | |
| JPMorgan Large Cap Growth Fund | JPMorgan Large Cap Value Fund |
| | | | |
CHANGE IN NET ASSETS RESULTING FROM OPERATIONS: | | | | |
Net investment income (loss) | | | | |
| | | | |
Change in net unrealized appreciation/depreciation | | | | |
Change in net assets resulting from operations | | | | |
DISTRIBUTIONS TO SHAREHOLDERS: | | | | |
| | | | |
| | | | |
| | | | |
| | | | |
| | | | |
| | | | |
| | | | |
| | | | |
Total distributions to shareholders | | | | |
| | | | |
Change in net assets resulting from capital transactions | | | | |
| | | | |
| | | | |
| | | | |
| | | | |
SEE NOTES TO FINANCIAL STATEMENTS.
| J.P. Morgan Large Cap Funds | |
STATEMENTS OF CHANGES IN NET ASSETS
FOR THE PERIODS INDICATED (continued)
(Amounts in thousands)
| JPMorgan U.S. Applied Data Science Value Fund | JPMorgan U.S. Equity Fund |
| | | | |
CHANGE IN NET ASSETS RESULTING FROM OPERATIONS: | | | | |
Net investment income (loss) | | | | |
| | | | |
Change in net unrealized appreciation/depreciation | | | | |
Change in net assets resulting from operations | | | | |
DISTRIBUTIONS TO SHAREHOLDERS: | | | | |
| | | | |
| | | | |
| | | | |
| | | | |
| | | | |
| | | | |
| | | | |
| | | | |
| | | | |
Total distributions to shareholders | | | | |
| | | | |
Change in net assets resulting from capital transactions | | | | |
| | | | |
| | | | |
| | | | |
| | | | |
SEE NOTES TO FINANCIAL STATEMENTS.
| J.P. Morgan Large Cap Funds | |
| JPMorgan U.S. GARP Equity Fund | JPMorgan U.S. Large Cap Core Plus Fund |
| | | | |
CHANGE IN NET ASSETS RESULTING FROM OPERATIONS: | | | | |
Net investment income (loss) | | | | |
| | | | |
Change in net unrealized appreciation/depreciation | | | | |
Change in net assets resulting from operations | | | | |
DISTRIBUTIONS TO SHAREHOLDERS: | | | | |
| | | | |
| | | | |
| | | | |
| | | | |
| | | | |
| | | | |
Total distributions to shareholders | | | | |
| | | | |
Change in net assets resulting from capital transactions | | | | |
| | | | |
| | | | |
| | | | |
| | | | |
SEE NOTES TO FINANCIAL STATEMENTS.
| J.P. Morgan Large Cap Funds | |
STATEMENTS OF CHANGES IN NET ASSETS
FOR THE PERIODS INDICATED (continued)
(Amounts in thousands)
| JPMorgan U.S. Research
Enhanced Equity Fund | JPMorgan U.S. Sustainable Leaders Fund |
| | | | |
CHANGE IN NET ASSETS RESULTING FROM OPERATIONS: | | | | |
Net investment income (loss) | | | | |
| | | | |
Change in net unrealized appreciation/depreciation | | | | |
Change in net assets resulting from operations | | | | |
DISTRIBUTIONS TO SHAREHOLDERS: | | | | |
| | | | |
| | | | |
| | | | |
| | | | |
Total distributions to shareholders | | | | |
| | | | |
Change in net assets resulting from capital transactions | | | | |
| | | | |
| | | | |
| | | | |
| | | | |
SEE NOTES TO FINANCIAL STATEMENTS.
| J.P. Morgan Large Cap Funds | |
| |
| | |
CHANGE IN NET ASSETS RESULTING FROM OPERATIONS: | | |
Net investment income (loss) | | |
| | |
Change in net unrealized appreciation/depreciation | | |
Change in net assets resulting from operations | | |
DISTRIBUTIONS TO SHAREHOLDERS: | | |
| | |
| | |
| | |
| | |
| | |
| | |
| | |
| | |
Total distributions to shareholders | | |
| | |
Change in net assets resulting from capital transactions | | |
| | |
| | |
| | |
| | |
SEE NOTES TO FINANCIAL STATEMENTS.
| J.P. Morgan Large Cap Funds | |
STATEMENTS OF CHANGES IN NET ASSETS
FOR THE PERIODS INDICATED (continued)
(Amounts in thousands)
| JPMorgan Equity Income Fund | JPMorgan Equity Index Fund |
| | | | |
| | | | |
| | | | |
Proceeds from shares issued | | | | |
| | | | |
| | | | |
Change in net assets resulting from Class A capital transactions | | | | |
| | | | |
Proceeds from shares issued | | | | |
| | | | |
| | | | |
Change in net assets resulting from Class C capital transactions | | | | |
| | | | |
Proceeds from shares issued | | | | |
| | | | |
| | | | |
Change in net assets resulting from Class I capital transactions | | | | |
| | | | |
Proceeds from shares issued | | | | |
| | | | |
| | | | |
Change in net assets resulting from Class R2 capital transactions | | | | |
| | | | |
Proceeds from shares issued | | | | |
| | | | |
| | | | |
Change in net assets resulting from Class R3 capital transactions | | | | |
| | | | |
Proceeds from shares issued | | | | |
| | | | |
| | | | |
Change in net assets resulting from Class R4 capital transactions | | | | |
| | | | |
Proceeds from shares issued | | | | |
| | | | |
| | | | |
Change in net assets resulting from Class R5 capital transactions | | | | |
SEE NOTES TO FINANCIAL STATEMENTS.
| J.P. Morgan Large Cap Funds | |
| JPMorgan Equity Income Fund | JPMorgan Equity Index Fund |
| | | | |
CAPITAL TRANSACTIONS: (continued) | | | | |
| | | | |
Proceeds from shares issued | | | | |
| | | | |
| | | | |
Change in net assets resulting from Class R6 capital transactions | | | | |
Total change in net assets resulting from capital transactions | | | | |
| | | | |
| | | | |
| | | | |
| | | | |
| | | | |
| | | | |
| | | | |
| | | | |
| | | | |
| | | | |
| | | | |
| | | | |
| | | | |
| | | | |
| | | | |
| | | | |
| | | | |
| | | | |
| | | | |
| | | | |
Change in Class R2 Shares | | | | |
| | | | |
| | | | |
| | | | |
| | | | |
Change in Class R3 Shares | | | | |
| | | | |
| | | | |
| | | | |
| | | | |
Change in Class R4 Shares | | | | |
SEE NOTES TO FINANCIAL STATEMENTS.
| J.P. Morgan Large Cap Funds | |
STATEMENTS OF CHANGES IN NET ASSETS
FOR THE PERIODS INDICATED (continued)
(Amounts in thousands)
| JPMorgan Equity Income Fund | JPMorgan Equity Index Fund |
| | | | |
SHARE TRANSACTIONS: (continued) | | | | |
| | | | |
| | | | |
| | | | |
| | | | |
Change in Class R5 Shares | | | | |
| | | | |
| | | | |
| | | | |
| | | | |
Change in Class R6 Shares | | | | |
SEE NOTES TO FINANCIAL STATEMENTS.
| J.P. Morgan Large Cap Funds | |
| JPMorgan Equity Premium
Income Fund | JPMorgan Hedged Equity Fund |
| | | | |
| | | | |
| | | | |
Proceeds from shares issued | | | | |
| | | | |
| | | | |
Change in net assets resulting from Class A capital transactions | | | | |
| | | | |
Proceeds from shares issued | | | | |
| | | | |
| | | | |
Change in net assets resulting from Class C capital transactions | | | | |
| | | | |
Proceeds from shares issued | | | | |
| | | | |
| | | | |
Change in net assets resulting from Class I capital transactions | | | | |
| | | | |
Proceeds from shares issued | | | | |
| | | | |
| | | | |
Change in net assets resulting from Class R5 capital transactions | | | | |
| | | | |
Proceeds from shares issued | | | | |
| | | | |
| | | | |
Change in net assets resulting from Class R6 capital transactions | | | | |
Total change in net assets resulting from capital transactions | | | | |
| | | | |
| | | | |
| | | | |
| | | | |
| | | | |
| | | | |
| | | | |
| | | | |
| | | | |
| | | | |
| | | | |
SEE NOTES TO FINANCIAL STATEMENTS.
| J.P. Morgan Large Cap Funds | |
STATEMENTS OF CHANGES IN NET ASSETS
FOR THE PERIODS INDICATED (continued)
(Amounts in thousands)
| JPMorgan Equity Premium Income Fund | JPMorgan Hedged Equity Fund |
| | | | |
SHARE TRANSACTIONS: (continued) | | | | |
| | | | |
| | | | |
| | | | |
| | | | |
| | | | |
| | | | |
| | | | |
| | | | |
| | | | |
Change in Class R5 Shares | | | | |
| | | | |
| | | | |
| | | | |
| | | | |
Change in Class R6 Shares | | | | |
SEE NOTES TO FINANCIAL STATEMENTS.
| J.P. Morgan Large Cap Funds | |
| JPMorgan Hedged Equity 2 Fund | JPMorgan Hedged Equity 3 Fund |
| | | | |
| | | | |
| | | | |
Proceeds from shares issued | | | | |
| | | | |
| | | | |
Change in net assets resulting from Class A capital transactions | | | | |
| | | | |
Proceeds from shares issued | | | | |
| | | | |
| | | | |
Change in net assets resulting from Class C capital transactions | | | | |
| | | | |
Proceeds from shares issued | | | | |
| | | | |
| | | | |
Change in net assets resulting from Class I capital transactions | | | | |
| | | | |
Proceeds from shares issued | | | | |
| | | | |
| | | | |
Change in net assets resulting from Class R5 capital transactions | | | | |
| | | | |
Proceeds from shares issued | | | | |
| | | | |
| | | | |
Change in net assets resulting from Class R6 capital transactions | | | | |
Total change in net assets resulting from capital transactions | | | | |
| | | | |
| | | | |
| | | | |
| | | | |
| | | | |
| | | | |
| | | | |
| | | | |
| | | | |
| | | | |
| | | | |
SEE NOTES TO FINANCIAL STATEMENTS.
| J.P. Morgan Large Cap Funds | |
STATEMENTS OF CHANGES IN NET ASSETS
FOR THE PERIODS INDICATED (continued)
(Amounts in thousands)
| JPMorgan Hedged Equity 2 Fund | JPMorgan Hedged Equity 3 Fund |
| | | | |
SHARE TRANSACTIONS: (continued) | | | | |
| | | | |
| | | | |
| | | | |
| | | | |
| | | | |
| | | | |
| | | | |
| | | | |
| | | | |
Change in Class R5 Shares | | | | |
| | | | |
| | | | |
| | | | |
| | | | |
Change in Class R6 Shares | | | | |
SEE NOTES TO FINANCIAL STATEMENTS.
| J.P. Morgan Large Cap Funds | |
| JPMorgan Large Cap Growth Fund | JPMorgan Large Cap Value Fund |
| | | | |
| | | | |
| | | | |
Proceeds from shares issued | | | | |
| | | | |
| | | | |
Change in net assets resulting from Class A capital transactions | | | | |
| | | | |
Proceeds from shares issued | | | | |
| | | | |
| | | | |
Change in net assets resulting from Class C capital transactions | | | | |
| | | | |
Proceeds from shares issued | | | | |
| | | | |
| | | | |
Change in net assets resulting from Class I capital transactions | | | | |
| | | | |
Proceeds from shares issued | | | | |
| | | | |
| | | | |
Change in net assets resulting from Class R2 capital transactions | | | | |
| | | | |
Proceeds from shares issued | | | | |
| | | | |
| | | | |
Change in net assets resulting from Class R3 capital transactions | | | | |
| | | | |
Proceeds from shares issued | | | | |
| | | | |
| | | | |
Change in net assets resulting from Class R4 capital transactions | | | | |
| | | | |
Proceeds from shares issued | | | | |
| | | | |
| | | | |
Change in net assets resulting from Class R5 capital transactions | | | | |
SEE NOTES TO FINANCIAL STATEMENTS.
| J.P. Morgan Large Cap Funds | |
STATEMENTS OF CHANGES IN NET ASSETS
FOR THE PERIODS INDICATED (continued)
(Amounts in thousands)
| JPMorgan Large Cap Growth Fund | JPMorgan Large Cap Value Fund |
| | | | |
CAPITAL TRANSACTIONS: (continued) | | | | |
| | | | |
Proceeds from shares issued | | | | |
| | | | |
| | | | |
Change in net assets resulting from Class R6 capital transactions | | | | |
Total change in net assets resulting from capital transactions | | | | |
| | | | |
| | | | |
| | | | |
| | | | |
| | | | |
| | | | |
| | | | |
| | | | |
| | | | |
| | | | |
| | | | |
| | | | |
| | | | |
| | | | |
| | | | |
| | | | |
| | | | |
| | | | |
| | | | |
| | | | |
Change in Class R2 Shares | | | | |
| | | | |
| | | | |
| | | | |
| | | | |
Change in Class R3 Shares | | | | |
| | | | |
| | | | |
| | | | |
| | | | |
Change in Class R4 Shares | | | | |
SEE NOTES TO FINANCIAL STATEMENTS.
| J.P. Morgan Large Cap Funds | |
| JPMorgan Large Cap Growth Fund | JPMorgan Large Cap Value Fund |
| | | | |
SHARE TRANSACTIONS: (continued) | | | | |
| | | | |
| | | | |
| | | | |
| | | | |
Change in Class R5 Shares | | | | |
| | | | |
| | | | |
| | | | |
| | | | |
Change in Class R6 Shares | | | | |
SEE NOTES TO FINANCIAL STATEMENTS.
| J.P. Morgan Large Cap Funds | |
STATEMENTS OF CHANGES IN NET ASSETS
FOR THE PERIODS INDICATED (continued)
(Amounts in thousands)
| JPMorgan U.S. Applied Data Science Value Fund | JPMorgan U.S. Equity Fund |
| | | | |
| | | | |
| | | | |
Proceeds from shares issued | | | | |
| | | | |
| | | | |
Change in net assets resulting from Class A capital transactions | | | | |
| | | | |
Proceeds from shares issued | | | | |
| | | | |
| | | | |
Change in net assets resulting from Class C capital transactions | | | | |
| | | | |
Proceeds from shares issued | | | | |
| | | | |
| | | | |
Change in net assets resulting from Class I capital transactions | | | | |
| | | | |
Proceeds from shares issued | | | | |
| | | | |
| | | | |
Change in net assets resulting from Class L capital transactions | | | | |
| | | | |
Proceeds from shares issued | | | | |
| | | | |
| | | | |
Change in net assets resulting from Class R2 capital transactions | | | | |
| | | | |
Proceeds from shares issued | | | | |
| | | | |
| | | | |
Change in net assets resulting from Class R3 capital transactions | | | | |
| | | | |
Proceeds from shares issued | | | | |
| | | | |
| | | | |
Change in net assets resulting from Class R4 capital transactions | | | | |
SEE NOTES TO FINANCIAL STATEMENTS.
| J.P. Morgan Large Cap Funds | |
| JPMorgan U.S. Applied Data Science Value Fund | JPMorgan U.S. Equity Fund |
| | | | |
CAPITAL TRANSACTIONS: (continued) | | | | |
| | | | |
Proceeds from shares issued | | | | |
| | | | |
| | | | |
Change in net assets resulting from Class R5 capital transactions | | | | |
| | | | |
Proceeds from shares issued | | | | |
| | | | |
| | | | |
Change in net assets resulting from Class R6 capital transactions | | | | |
Total change in net assets resulting from capital transactions | | | | |
| | | | |
| | | | |
| | | | |
| | | | |
| | | | |
| | | | |
| | | | |
| | | | |
| | | | |
| | | | |
| | | | |
| | | | |
| | | | |
| | | | |
| | | | |
| | | | |
| | | | |
| | | | |
| | | | |
| | | | |
| | | | |
| | | | |
| | | | |
| | | | |
| | | | |
Change in Class R2 Shares | | | | |
SEE NOTES TO FINANCIAL STATEMENTS.
| J.P. Morgan Large Cap Funds | |
STATEMENTS OF CHANGES IN NET ASSETS
FOR THE PERIODS INDICATED (continued)
(Amounts in thousands)
| JPMorgan U.S. Applied Data Science Value Fund | JPMorgan U.S. Equity Fund |
| | | | |
SHARE TRANSACTIONS: (continued) | | | | |
| | | | |
| | | | |
| | | | |
| | | | |
Change in Class R3 Shares | | | | |
| | | | |
| | | | |
| | | | |
| | | | |
Change in Class R4 Shares | | | | |
| | | | |
| | | | |
| | | | |
| | | | |
Change in Class R5 Shares | | | | |
| | | | |
| | | | |
| | | | |
| | | | |
Change in Class R6 Shares | | | | |
SEE NOTES TO FINANCIAL STATEMENTS.
| J.P. Morgan Large Cap Funds | |
| JPMorgan U.S. GARP Equity Fund | JPMorgan U.S. Large Cap Core Plus Fund |
| | | | |
| | | | |
| | | | |
Proceeds from shares issued | | | | |
| | | | |
| | | | |
Change in net assets resulting from Class A capital transactions | | | | |
| | | | |
Proceeds from shares issued | | | | |
| | | | |
| | | | |
Change in net assets resulting from Class C capital transactions | | | | |
| | | | |
Proceeds from shares issued | | | | |
| | | | |
| | | | |
Change in net assets resulting from Class I capital transactions | | | | |
| | | | |
Proceeds from shares issued | | | | |
| | | | |
| | | | |
Change in net assets resulting from Class R2 capital transactions | | | | |
| | | | |
Proceeds from shares issued | | | | |
| | | | |
| | | | |
Change in net assets resulting from Class R5 capital transactions | | | | |
| | | | |
Proceeds from shares issued | | | | |
| | | | |
| | | | |
Change in net assets resulting from Class R6 capital transactions | | | | |
Total change in net assets resulting from capital transactions | | | | |
| | | | |
| | | | |
| | | | |
| | | | |
| | | | |
| | | | |
SEE NOTES TO FINANCIAL STATEMENTS.
| J.P. Morgan Large Cap Funds | |
STATEMENTS OF CHANGES IN NET ASSETS
FOR THE PERIODS INDICATED (continued)
(Amounts in thousands)
| JPMorgan U.S. GARP Equity Fund | JPMorgan U.S. Large Cap Core Plus Fund |
| | | | |
SHARE TRANSACTIONS: (continued) | | | | |
| | | | |
| | | | |
| | | | |
| | | | |
| | | | |
| | | | |
| | | | |
| | | | |
| | | | |
| | | | |
| | | | |
| | | | |
| | | | |
| | | | |
Change in Class R2 Shares | | | | |
| | | | |
| | | | |
| | | | |
| | | | |
Change in Class R5 Shares | | | | |
| | | | |
| | | | |
| | | | |
| | | | |
Change in Class R6 Shares | | | | |
SEE NOTES TO FINANCIAL STATEMENTS.
| J.P. Morgan Large Cap Funds | |
| JPMorgan U.S. Research
Enhanced Equity Fund | JPMorgan U.S. Sustainable Leaders Fund |
| | | | |
| | | | |
| | | | |
Proceeds from shares issued | | | | |
| | | | |
| | | | |
Change in net assets resulting from Class A capital transactions | | | | |
| | | | |
Proceeds from shares issued | | | | |
| | | | |
| | | | |
Change in net assets resulting from Class C capital transactions | | | | |
| | | | |
Proceeds from shares issued | | | | |
| | | | |
| | | | |
Change in net assets resulting from Class I capital transactions | | | | |
| | | | |
Proceeds from shares issued | | | | |
| | | | |
| | | | |
Change in net assets resulting from Class R6 capital transactions | | | | |
Total change in net assets resulting from capital transactions | | | | |
| | | | |
| | | | |
| | | | |
| | | | |
| | | | |
| | | | |
| | | | |
| | | | |
| | | | |
| | | | |
| | | | |
| | | | |
| | | | |
| | | | |
| | | | |
| | | | |
(a)
Amount rounds to less than one thousand.
SEE NOTES TO FINANCIAL STATEMENTS.
| J.P. Morgan Large Cap Funds | |
STATEMENTS OF CHANGES IN NET ASSETS
FOR THE PERIODS INDICATED (continued)
(Amounts in thousands)
| JPMorgan U.S. Research Enhanced Equity Fund | JPMorgan U.S. Sustainable Leaders Fund |
| | | | |
SHARE TRANSACTIONS: (continued) | | | | |
| | | | |
| | | | |
| | | | |
| | | | |
Change in Class R6 Shares | | | | |
SEE NOTES TO FINANCIAL STATEMENTS.
| J.P. Morgan Large Cap Funds | |
| |
| | |
| | |
| | |
Proceeds from shares issued | | |
| | |
| | |
Change in net assets resulting from Class A capital transactions | | |
| | |
Proceeds from shares issued | | |
| | |
| | |
Change in net assets resulting from Class C capital transactions | | |
| | |
Proceeds from shares issued | | |
| | |
| | |
Change in net assets resulting from Class I capital transactions | | |
| | |
Proceeds from shares issued | | |
| | |
| | |
Change in net assets resulting from Class R2 capital transactions | | |
| | |
Proceeds from shares issued | | |
| | |
| | |
Change in net assets resulting from Class R3 capital transactions | | |
| | |
Proceeds from shares issued | | |
| | |
| | |
Change in net assets resulting from Class R4 capital transactions | | |
| | |
Proceeds from shares issued | | |
| | |
| | |
Change in net assets resulting from Class R5 capital transactions | | |
SEE NOTES TO FINANCIAL STATEMENTS.
| J.P. Morgan Large Cap Funds | |
STATEMENTS OF CHANGES IN NET ASSETS
FOR THE PERIODS INDICATED (continued)
(Amounts in thousands)
| |
| | |
CAPITAL TRANSACTIONS: (continued) | | |
| | |
Proceeds from shares issued | | |
| | |
| | |
Change in net assets resulting from Class R6 capital transactions | | |
Total change in net assets resulting from capital transactions | | |
| | |
| | |
| | |
| | |
| | |
| | |
| | |
| | |
| | |
| | |
| | |
| | |
| | |
| | |
| | |
| | |
| | |
| | |
| | |
| | |
Change in Class R2 Shares | | |
| | |
| | |
| | |
| | |
Change in Class R3 Shares | | |
| | |
| | |
| | |
| | |
Change in Class R4 Shares | | |
SEE NOTES TO FINANCIAL STATEMENTS.
| J.P. Morgan Large Cap Funds | |
| |
| | |
SHARE TRANSACTIONS: (continued) | | |
| | |
| | |
| | |
| | |
Change in Class R5 Shares | | |
| | |
| | |
| | |
| | |
Change in Class R6 Shares | | |
SEE NOTES TO FINANCIAL STATEMENTS.
| J.P. Morgan Large Cap Funds | |
STATEMENT OF CASH FLOWS
FOR THE YEAR ENDED June 30, 2023
(Amounts in thousands)
| JPMorgan
U.S. Large
Cap Core
Plus Fund |
INCREASE (DECREASE) IN CASH | |
Cash flows provided (used) by operating activities: | |
Net increase in net assets resulting from operations | |
Adjustments to reconcile net increase/decrease in net assets resulting
from operations to net cash provided (used) by operating activities: | |
Purchases of investment securities | |
Proceeds from disposition of investment securities | |
Covers of investment securities sold short | |
Proceeds from investment securities sold short | |
Purchases of short-term investments — affiliates, net | |
Change in unrealized (appreciation)/depreciation on investments in non-affiliates | |
Change in unrealized (appreciation)/depreciation on investment securities sold short | |
Net realized (gain)/loss on investments in non-affiliates | |
Net realized (gain)/loss on investments in affiliates | |
Net realized (gain)/loss on securities sold short | |
Increase in dividends receivable from affiliates | |
Decrease in dividends receivable from non-affiliates | |
Increase in variation margin receivable | |
Decrease in dividend expense payable to non-affiliates on securities sold short | |
Decrease in interest expense payable to non-affiliates on securities sold short | |
Decrease in due to broker for securities sold short | |
Decrease in investment advisory fees payable | |
Decrease in administration fees payable | |
Decrease in distribution fees payable | |
Decrease in service fees payable | |
Increase in custodian and accounting fees payable | |
Decrease in other accrued expenses payable | |
Net cash provided (used) by operating activities | |
Cash flows provided (used) by financing activities: | |
Proceeds from shares issued | |
Payment for shares redeemed | |
Cash distributions paid to shareholders (net of reinvestments $338,113) | |
Net cash provided (used) by financing activities | |
| |
Net increase (decrease) in unrestricted and restricted cash, foreign currency and deposits at broker | |
Restricted and unrestricted cash and foreign currency at beginning of period | |
Restricted and unrestricted cash and foreign currency at end of period | |
Supplemental disclosure of cash flow information:For the period ended June 30, 2023 the Fund paid approximately $2,130 in interest expense.
For purposes of reporting the Statement of Cash Flows, the Fund considers all cash accounts that are not subject to withdrawal restrictions or penalties to be cash equivalents.
SEE NOTES TO FINANCIAL STATEMENTS.
| J.P. Morgan Large Cap Funds | |
Reconciliation of restricted and unrestricted cash and foreign currency at the end of period to the Statements of Assets and Liabilities:
| JPMorgan
U.S. Large
Cap Core
Plus Fund | JPMorgan
U.S. Large
Cap Core
Plus Fund |
| | |
| | |
Foreign currency, at value | | |
| | |
| | |
| | |
SEE NOTES TO FINANCIAL STATEMENTS.
| J.P. Morgan Large Cap Funds | |
FINANCIAL HIGHLIGHTS
FOR THE PERIODS INDICATED
| Per share operating performance |
| | | |
| Net asset
value,
beginning
of period | Net
investment
income
(loss)(a) | Net realized
and unrealized
gains
(losses) on
investments | Total from
investment
operations | | | |
JPMorgan Equity Income Fund | | | | | | | |
| | | | | | | |
| | | | | | | |
| | | | | | | |
| | | | | | | |
| | | | | | | |
| | | | | | | |
| | | | | | | |
| | | | | | | |
| | | | | | | |
| | | | | | | |
| | | | | | | |
| | | | | | | |
| | | | | | | |
| | | | | | | |
| | | | | | | |
| | | | | | | |
| | | | | | | |
| | | | | | | |
| | | | | | | |
| | | | | | | |
| | | | | | | |
| | | | | | | |
| | | | | | | |
| | | | | | | |
| | | | | | | |
| | | | | | | |
| | | | | | | |
| | | | | | | |
| | | | | | | |
| | | | | | | |
| | | | | | | |
| | | | | | | |
| | | | | | | |
| | | | | | | |
| | | | | | | |
| | | | | | | |
| | | | | | | |
| | | | | | | |
| | | | | | | |
| | | | | | | |
| | | | | | | |
| | | | | | | |
| | | | | | | |
| | | | | | | |
| | | | | | | |
| | | | | | | |
| | | | | | | |
| | | | | | | |
|
| Calculated based upon average shares outstanding. |
| Includes adjustments in accordance with accounting principles generally accepted in the United States of America and as such, the net asset values for financial reporting purposes and the returns based upon those net asset values may differ from the net asset values and returns for shareholder transactions. |
| Includes interest expense, if applicable, each of which is less than 0.005% unless otherwise noted. |
SEE NOTES TO FINANCIAL STATEMENTS.
| J.P. Morgan Large Cap Funds | |
| |
| | | Ratios to average net assets |
Net asset
value,
end of
period | Total return
(excludes
sales charge)(b) | Net assets,
end of
period
(000's) | | Net
investment
income
(loss) | Expenses without
waivers and reimbursements | |
| | | | | | |
| | | | | | |
| | | | | | |
| | | | | | |
| | | | | | |
| | | | | | |
| | | | | | |
| | | | | | |
| | | | | | |
| | | | | | |
| | | | | | |
| | | | | | |
| | | | | | |
| | | | | | |
| | | | | | |
| | | | | | |
| | | | | | |
| | | | | | |
| | | | | | |
| | | | | | |
| | | | | | |
| | | | | | |
| | | | | | |
| | | | | | |
| | | | | | |
| | | | | | |
| | | | | | |
| | | | | | |
| | | | | | |
| | | | | | |
| | | | | | |
| | | | | | |
| | | | | | |
| | | | | | |
| | | | | | |
| | | | | | |
| | | | | | |
| | | | | | |
| | | | | | |
| | | | | | |
| | | | | | |
| | | | | | |
| | | | | | |
| | | | | | |
| | | | | | |
| | | | | | |
| | | | | | |
| | | | | | |
| | | | | | |
SEE NOTES TO FINANCIAL STATEMENTS.
| J.P. Morgan Large Cap Funds | |
FINANCIAL HIGHLIGHTS
FOR THE PERIODS INDICATED
| Per share operating performance |
| | | |
| Net asset
value,
beginning
of period | Net
investment
income
(loss)(a) | Net realized
and unrealized
gains
(losses) on
investments | Total from
investment
operations | | | |
JPMorgan Equity Index Fund | | | | | | | |
| | | | | | | |
| | | | | | | |
| | | | | | | |
| | | | | | | |
| | | | | | | |
| | | | | | | |
| | | | | | | |
| | | | | | | |
| | | | | | | |
| | | | | | | |
| | | | | | | |
| | | | | | | |
| | | | | | | |
| | | | | | | |
| | | | | | | |
| | | | | | | |
| | | | | | | |
| | | | | | | |
| | | | | | | |
| | | | | | | |
| | | | | | | |
| | | | | | | |
| | | | | | | |
| | | | | | | |
|
| Calculated based upon average shares outstanding. |
| Includes adjustments in accordance with accounting principles generally accepted in the United States of America and as such, the net asset values for financial reporting purposes and the returns based upon those net asset values may differ from the net asset values and returns for shareholder transactions. |
| Includes interest expense, if applicable, each of which is less than 0.005% unless otherwise noted. |
| Net expenses for Class R6 Shares are 0.045% for the year ended June 30, 2023, 0.045% for the year ended June 30, 2022, 0.044% for the year ended June 30, 2021, 0.044% for the year ended June 30, 2020 and 0.043% for the year ended June 30, 2019. |
SEE NOTES TO FINANCIAL STATEMENTS.
| J.P. Morgan Large Cap Funds | |
| |
| | | Ratios to average net assets |
Net asset
value,
end of
period | Total return
(excludes
sales charge)(b) | Net assets,
end of
period
(000's) | | Net
investment
income
(loss) | Expenses without
waivers and reimbursements | |
| | | | | | |
| | | | | | |
| | | | | | |
| | | | | | |
| | | | | | |
| | | | | | |
| | | | | | |
| | | | | | |
| | | | | | |
| | | | | | |
| | | | | | |
| | | | | | |
| | | | | | |
| | | | | | |
| | | | | | |
| | | | | | |
| | | | | | |
| | | | | | |
| | | | | | |
| | | | | | |
| | | | | | |
| | | | | | |
| | | | | | |
| | | | | | |
| | | | | | |
SEE NOTES TO FINANCIAL STATEMENTS.
| J.P. Morgan Large Cap Funds | |
FINANCIAL HIGHLIGHTS
FOR THE PERIODS INDICATED
| Per share operating performance |
| | | |
| Net asset
value,
beginning
of period | Net
investment
income
(loss)(b) | Net realized
and unrealized
gains
(losses) on
investments | Total from
investment
operations | | Net asset
value,
end of
period |
JPMorgan Equity Premium Income Fund | | | | | | |
| | | | | | |
| | | | | | |
| | | | | | |
| | | | | | |
| | | | | | |
August 31, 2018 (f) through June 30, 2019 | | | | | | |
| | | | | | |
| | | | | | |
| | | | | | |
| | | | | | |
| | | | | | |
August 31, 2018 (f) through June 30, 2019 | | | | | | |
| | | | | | |
| | | | | | |
| | | | | | |
| | | | | | |
| | | | | | |
August 31, 2018 (f) through June 30, 2019 | | | | | | |
| | | | | | |
| | | | | | |
| | | | | | |
| | | | | | |
| | | | | | |
August 31, 2018 (f) through June 30, 2019 | | | | | | |
| | | | | | |
| | | | | | |
| | | | | | |
| | | | | | |
| | | | | | |
August 31, 2018 (f) through June 30, 2019 | | | | | | |
|
| Annualized for periods less than one year, unless otherwise noted. |
| Calculated based upon average shares outstanding. |
| Not annualized for periods less than one year. |
| Includes adjustments in accordance with accounting principles generally accepted in the United States of America and as such, the net asset values for financial reporting purposes and the returns based upon those net asset values may differ from the net asset values and returns for shareholder transactions. |
| Includes interest expense, if applicable, each of which is less than 0.005% unless otherwise noted. |
| Commencement of operations. |
| Certain non-recurring expenses incurred by the Fund were not annualized for the period indicated. |
SEE NOTES TO FINANCIAL STATEMENTS.
| J.P. Morgan Large Cap Funds | |
|
| | Ratios to average net assets(a) |
Total return
(excludes
sales charge)(c)(d) | Net assets,
end of
period
(000's) | | Net
investment
income
(loss) | Expenses without
waivers and reimbursements | |
| | | | | |
| | | | | |
| | | | | |
| | | | | |
| | | | | |
| | | | | |
| | | | | |
| | | | | |
| | | | | |
| | | | | |
| | | | | |
| | | | | |
| | | | | |
| | | | | |
| | | | | |
| | | | | |
| | | | | |
| | | | | |
| | | | | |
| | | | | |
| | | | | |
| | | | | |
| | | | | |
| | | | | |
| | | | | |
| | | | | |
| | | | | |
| | | | | |
| | | | | |
| | | | | |
| | | | | |
SEE NOTES TO FINANCIAL STATEMENTS.
| J.P. Morgan Large Cap Funds | |
FINANCIAL HIGHLIGHTS
FOR THE PERIODS INDICATED
| Per share operating performance |
| | | |
| Net asset
value,
beginning
of period | Net
investment
income
(loss)(a) | Net realized
and unrealized
gains
(losses) on
investments | Total from
investment
operations | | Net asset
value,
end of
period |
JPMorgan Hedged Equity Fund | | | | | | |
| | | | | | |
| | | | | | |
| | | | | | |
| | | | | | |
| | | | | | |
| | | | | | |
| | | | | | |
| | | | | | |
| | | | | | |
| | | | | | |
| | | | | | |
| | | | | | |
| | | | | | |
| | | | | | |
| | | | | | |
| | | | | | |
| | | | | | |
| | | | | | |
| | | | | | |
| | | | | | |
| | | | | | |
| | | | | | |
| | | | | | |
| | | | | | |
| | | | | | |
| | | | | | |
| | | | | | |
| | | | | | |
| | | | | | |
| | | | | | |
|
| Calculated based upon average shares outstanding. |
| Includes adjustments in accordance with accounting principles generally accepted in the United States of America and as such, the net asset values for financial reporting purposes and the returns based upon those net asset values may differ from the net asset values and returns for shareholder transactions. |
| Includes interest expense, if applicable, each of which is less than 0.005% unless otherwise noted. |
SEE NOTES TO FINANCIAL STATEMENTS.
| J.P. Morgan Large Cap Funds | |
|
| | Ratios to average net assets |
Total return
(excludes
sales charge)(b) | Net assets,
end of
period
(000's) | | Net
investment
income
(loss) | Expenses without
waivers and reimbursements | |
| | | | | |
| | | | | |
| | | | | |
| | | | | |
| | | | | |
| | | | | |
| | | | | |
| | | | | |
| | | | | |
| | | | | |
| | | | | |
| | | | | |
| | | | | |
| | | | | |
| | | | | |
| | | | | |
| | | | | |
| | | | | |
| | | | | |
| | | | | |
| | | | | |
| | | | | |
| | | | | |
| | | | | |
| | | | | |
| | | | | |
| | | | | |
| | | | | |
| | | | | |
| | | | | |
| | | | | |
SEE NOTES TO FINANCIAL STATEMENTS.
| J.P. Morgan Large Cap Funds | |
FINANCIAL HIGHLIGHTS
FOR THE PERIODS INDICATED
| Per share operating performance |
| | | |
| Net asset
value,
beginning
of period | Net
investment
income
(loss)(b) | Net realized
and unrealized
gains
(losses) on
investments | Total from
investment
operations | | | |
JPMorgan Hedged Equity 2 Fund | | | | | | | |
| | | | | | | |
| | | | | | | |
| | | | | | | |
February 26, 2021 (f) through June 30, 2021 | | | | | | | |
| | | | | | | |
| | | | | | | |
| | | | | | | |
February 26, 2021 (f) through June 30, 2021 | | | | | | | |
| | | | | | | |
| | | | | | | |
| | | | | | | |
February 26, 2021 (f) through June 30, 2021 | | | | | | | |
| | | | | | | |
| | | | | | | |
| | | | | | | |
February 26, 2021 (f) through June 30, 2021 | | | | | | | |
| | | | | | | |
| | | | | | | |
| | | | | | | |
February 26, 2021 (f) through June 30, 2021 | | | | | | | |
|
| Annualized for periods less than one year, unless otherwise noted. |
| Calculated based upon average shares outstanding. |
| Not annualized for periods less than one year. |
| Includes adjustments in accordance with accounting principles generally accepted in the United States of America and as such, the net asset values for financial reporting purposes and the returns based upon those net asset values may differ from the net asset values and returns for shareholder transactions. |
| Includes interest expense, if applicable, each of which is less than 0.005% unless otherwise noted. |
| Commencement of operations. |
| Certain non-recurring expenses incurred by the Fund were not annualized for the period indicated. |
| Amount rounds to less than $0.005. |
SEE NOTES TO FINANCIAL STATEMENTS.
| J.P. Morgan Large Cap Funds | |
| |
| | | Ratios to average net assets(a) |
Net asset
value,
end of
period | Total return
(excludes
sales charge)(c)(d) | Net assets,
end of
period
(000's) | | Net
investment
income
(loss) | Expenses without
waivers and reimbursements | |
| | | | | | |
| | | | | | |
| | | | | | |
| | | | | | |
| | | | | | |
| | | | | | |
| | | | | | |
| | | | | | |
| | | | | | |
| | | | | | |
| | | | | | |
| | | | | | |
| | | | | | |
| | | | | | |
| | | | | | |
| | | | | | |
| | | | | | |
| | | | | | |
| | | | | | |
| | | | | | |
| | | | | | |
SEE NOTES TO FINANCIAL STATEMENTS.
| J.P. Morgan Large Cap Funds | |
FINANCIAL HIGHLIGHTS
FOR THE PERIODS INDICATED
| Per share operating performance |
| | | |
| Net asset
value,
beginning
of period | Net
investment
income
(loss)(b) | Net realized
and unrealized
gains
(losses) on
investments | Total from
investment
operations | | | |
JPMorgan Hedged Equity 3 Fund | | | | | | | |
| | | | | | | |
| | | | | | | |
| | | | | | | |
February 26, 2021 (f) through June 30, 2021 | | | | | | | |
| | | | | | | |
| | | | | | | |
| | | | | | | |
February 26, 2021 (f) through June 30, 2021 | | | | | | | |
| | | | | | | |
| | | | | | | |
| | | | | | | |
February 26, 2021 (f) through June 30, 2021 | | | | | | | |
| | | | | | | |
| | | | | | | |
| | | | | | | |
February 26, 2021 (f) through June 30, 2021 | | | | | | | |
| | | | | | | |
| | | | | | | |
| | | | | | | |
February 26, 2021 (f) through June 30, 2021 | | | | | | | |
|
| Annualized for periods less than one year, unless otherwise noted. |
| Calculated based upon average shares outstanding. |
| Not annualized for periods less than one year. |
| Includes adjustments in accordance with accounting principles generally accepted in the United States of America and as such, the net asset values for financial reporting purposes and the returns based upon those net asset values may differ from the net asset values and returns for shareholder transactions. |
| Includes interest expense, if applicable, each of which is less than 0.005% unless otherwise noted. |
| Commencement of operations. |
| Certain non-recurring expenses incurred by the Fund were not annualized for the period indicated. |
| Amount rounds to less than $0.005. |
SEE NOTES TO FINANCIAL STATEMENTS.
| J.P. Morgan Large Cap Funds | |
| |
| | | Ratios to average net assets(a) |
Net asset
value,
end of
period | Total return
(excludes
sales charge)(c)(d) | Net assets,
end of
period
(000's) | | Net
investment
income
(loss) | Expenses without
waivers and reimbursements | |
| | | | | | |
| | | | | | |
| | | | | | |
| | | | | | |
| | | | | | |
| | | | | | |
| | | | | | |
| | | | | | |
| | | | | | |
| | | | | | |
| | | | | | |
| | | | | | |
| | | | | | |
| | | | | | |
| | | | | | |
| | | | | | |
| | | | | | |
| | | | | | |
| | | | | | |
| | | | | | |
| | | | | | |
SEE NOTES TO FINANCIAL STATEMENTS.
| J.P. Morgan Large Cap Funds | |
FINANCIAL HIGHLIGHTS
FOR THE PERIODS INDICATED
| Per share operating performance |
| | | |
| Net asset
value,
beginning
of period | Net
investment
income
(loss)(a) | Net realized
and unrealized
gains
(losses) on
investments | Total from
investment
operations | | | |
JPMorgan Large Cap Growth Fund | | | | | | | |
| | | | | | | |
| | | | | | | |
| | | | | | | |
| | | | | | | |
| | | | | | | |
| | | | | | | |
| | | | | | | |
| | | | | | | |
| | | | | | | |
| | | | | | | |
| | | | | | | |
| | | | | | | |
| | | | | | | |
| | | | | | | |
| | | | | | | |
| | | | | | | |
| | | | | | | |
| | | | | | | |
| | | | | | | |
| | | | | | | |
| | | | | | | |
| | | | | | | |
| | | | | | | |
| | | | | | | |
| | | | | | | |
| | | | | | | |
| | | | | | | |
| | | | | | | |
| | | | | | | |
| | | | | | | |
| | | | | | | |
| | | | | | | |
| | | | | | | |
| | | | | | | |
| | | | | | | |
| | | | | | | |
| | | | | | | |
| | | | | | | |
| | | | | | | |
| | | | | | | |
| | | | | | | |
| | | | | | | |
| | | | | | | |
| | | | | | | |
| | | | | | | |
| | | | | | | |
| | | | | | | |
| | | | | | | |
|
| Calculated based upon average shares outstanding. |
| Includes adjustments in accordance with accounting principles generally accepted in the United States of America and as such, the net asset values for financial reporting purposes and the returns based upon those net asset values may differ from the net asset values and returns for shareholder transactions. |
| Includes interest expense, if applicable, each of which is less than 0.005% unless otherwise noted. |
SEE NOTES TO FINANCIAL STATEMENTS.
| J.P. Morgan Large Cap Funds | |
| |
| | | Ratios to average net assets |
Net asset
value,
end of
period | Total return
(excludes
sales charge)(b) | Net assets,
end of
period
(000's) | | Net
investment
income
(loss) | Expenses without
waivers and reimbursements | |
| | | | | | |
| | | | | | |
| | | | | | |
| | | | | | |
| | | | | | |
| | | | | | |
| | | | | | |
| | | | | | |
| | | | | | |
| | | | | | |
| | | | | | |
| | | | | | |
| | | | | | |
| | | | | | |
| | | | | | |
| | | | | | |
| | | | | | |
| | | | | | |
| | | | | | |
| | | | | | |
| | | | | | |
| | | | | | |
| | | | | | |
| | | | | | |
| | | | | | |
| | | | | | |
| | | | | | |
| | | | | | |
| | | | | | |
| | | | | | |
| | | | | | |
| | | | | | |
| | | | | | |
| | | | | | |
| | | | | | |
| | | | | | |
| | | | | | |
| | | | | | |
| | | | | | |
| | | | | | |
| | | | | | |
| | | | | | |
| | | | | | |
| | | | | | |
| | | | | | |
| | | | | | |
| | | | | | |
| | | | | | |
| | | | | | |
SEE NOTES TO FINANCIAL STATEMENTS.
| J.P. Morgan Large Cap Funds | |
FINANCIAL HIGHLIGHTS
FOR THE PERIODS INDICATED
| Per share operating performance |
| | | |
| Net asset
value,
beginning
of period | Net
investment
income
(loss)(b) | Net realized
and unrealized
gains
(losses) on
investments | Total from
investment
operations | | | |
JPMorgan Large Cap Value Fund | | | | | | | |
| | | | | | | |
| | | | | | | |
| | | | | | | |
| | | | | | | |
| | | | | | | |
| | | | | | | |
| | | | | | | |
| | | | | | | |
| | | | | | | |
| | | | | | | |
| | | | | | | |
| | | | | | | |
| | | | | | | |
| | | | | | | |
| | | | | | | |
| | | | | | | |
| | | | | | | |
| | | | | | | |
| | | | | | | |
| | | | | | | |
| | | | | | | |
| | | | | | | |
| | | | | | | |
| | | | | | | |
| | | | | | | |
| | | | | | | |
| | | | | | | |
| | | | | | | |
| | | | | | | |
October 1, 2018 (g) through June 30, 2019 | | | | | | | |
| | | | | | | |
| | | | | | | |
| | | | | | | |
| | | | | | | |
| | | | | | | |
October 1, 2018 (g) through June 30, 2019 | | | | | | | |
| | | | | | | |
| | | | | | | |
| | | | | | | |
| | | | | | | |
| | | | | | | |
| | | | | | | |
| | | | | | | |
| | | | | | | |
| | | | | | | |
| | | | | | | |
| | | | | | | |
| | | | | | | |
|
| Annualized for periods less than one year, unless otherwise noted. |
| Calculated based upon average shares outstanding. |
| Not annualized for periods less than one year. |
| Includes adjustments in accordance with accounting principles generally accepted in the United States of America and as such, the net asset values for financial reporting purposes and the returns based upon those net asset values may differ from the net asset values and returns for shareholder transactions. |
| Includes interest expense, if applicable, each of which is less than 0.005% unless otherwise noted. |
| Amount rounds to less than $0.005. |
| Commencement of offering of class of shares. |
SEE NOTES TO FINANCIAL STATEMENTS.
| J.P. Morgan Large Cap Funds | |
| |
| | | Ratios to average net assets(a) |
Net asset
value,
end of
period | Total return
(excludes
sales charge)(c)(d) | Net assets,
end of
period
(000's) | | Net
investment
income
(loss) | Expenses without
waivers and reimbursements | |
| | | | | | |
| | | | | | |
| | | | | | |
| | | | | | |
| | | | | | |
| | | | | | |
| | | | | | |
| | | | | | |
| | | | | | |
| | | | | | |
| | | | | | |
| | | | | | |
| | | | | | |
| | | | | | |
| | | | | | |
| | | | | | |
| | | | | | |
| | | | | | |
| | | | | | |
| | | | | | |
| | | | | | |
| | | | | | |
| | | | | | |
| | | | | | |
| | | | | | |
| | | | | | |
| | | | | | |
| | | | | | |
| | | | | | |
| | | | | | |
| | | | | | |
| | | | | | |
| | | | | | |
| | | | | | |
| | | | | | |
| | | | | | |
| | | | | | |
| | | | | | |
| | | | | | |
| | | | | | |
| | | | | | |
| | | | | | |
| | | | | | |
| | | | | | |
| | | | | | |
| | | | | | |
| | | | | | |
| | | | | | |
| | | | | | |
SEE NOTES TO FINANCIAL STATEMENTS.
| J.P. Morgan Large Cap Funds | |
FINANCIAL HIGHLIGHTS
FOR THE PERIODS INDICATED
| Per share operating performance |
| | | |
| Net asset
value,
beginning
of period | Net
investment
income
(loss)(a) | Net realized
and unrealized
gains
(losses) on
investments | Total from
investment
operations | | | |
JPMorgan U.S. Applied Data Science Value Fund | | | | | | | |
| | | | | | | |
| | | | | | | |
| | | | | | | |
| | | | | | | |
| | | | | | | |
| | | | | | | |
| | | | | | | |
| | | | | | | |
| | | | | | | |
| | | | | | | |
| | | | | | | |
| | | | | | | |
| | | | | | | |
| | | | | | | |
| | | | | | | |
| | | | | | | |
| | | | | | | |
| | | | | | | |
| | | | | | | |
| | | | | | | |
| | | | | | | |
| | | | | | | |
| | | | | | | |
| | | | | | | |
| | | | | | | |
| | | | | | | |
| | | | | | | |
| | | | | | | |
| | | | | | | |
| | | | | | | |
| | | | | | | |
| | | | | | | |
| | | | | | | |
| | | | | | | |
| | | | | | | |
| | | | | | | |
|
| Calculated based upon average shares outstanding. |
| Includes adjustments in accordance with accounting principles generally accepted in the United States of America and as such, the net asset values for financial reporting purposes and the returns based upon those net asset values may differ from the net asset values and returns for shareholder transactions. |
| Includes interest expense, if applicable, each of which is less than 0.005% unless otherwise noted. |
| Reflects special dividends paid out during the year by several of the Fund’s holdings. Had the Fund not received the special dividends, the net investment income (loss) per share would have been $0.46, $0.30, $0.53, $0.38, $0.57 and $0.60 for Class A, Class C, Class I, Class R2, Class R5 and Class R6 Shares, respectively, and the net investment income (loss) ratio would have been 1.56%, 1.05%, 1.70%, 1.30%, 1.85% and 2.04% for Class A, Class C, Class I, Class R2, Class R5 and Class R6 Shares, respectively. |
SEE NOTES TO FINANCIAL STATEMENTS.
| J.P. Morgan Large Cap Funds | |
| |
| | | Ratios to average net assets |
Net asset
value,
end of
period | Total return
(excludes
sales charge)(b) | Net assets,
end of
period
(000's) | | Net
investment
income
(loss) | Expenses without
waivers and reimbursements | |
| | | | | | |
| | | | | | |
| | | | | | |
| | | | | | |
| | | | | | |
| | | | | | |
| | | | | | |
| | | | | | |
| | | | | | |
| | | | | | |
| | | | | | |
| | | | | | |
| | | | | | |
| | | | | | |
| | | | | | |
| | | | | | |
| | | | | | |
| | | | | | |
| | | | | | |
| | | | | | |
| | | | | | |
| | | | | | |
| | | | | | |
| | | | | | |
| | | | | | |
| | | | | | |
| | | | | | |
| | | | | | |
| | | | | | |
| | | | | | |
| | | | | | |
| | | | | | |
| | | | | | |
| | | | | | |
| | | | | | |
| | | | | | |
| | | | | | |
SEE NOTES TO FINANCIAL STATEMENTS.
| J.P. Morgan Large Cap Funds | |
FINANCIAL HIGHLIGHTS
FOR THE PERIODS INDICATED
| Per share operating performance |
| | | |
| Net asset
value,
beginning
of period | Net
investment
income
(loss)(a) | Net realized
and unrealized
gains
(losses) on
investments | Total from
investment
operations | | | |
JPMorgan U.S. Equity Fund | | | | | | | |
| | | | | | | |
| | | | | | | |
| | | | | | | |
| | | | | | | |
| | | | | | | |
| | | | | | | |
| | | | | | | |
| | | | | | | |
| | | | | | | |
| | | | | | | |
| | | | | | | |
| | | | | | | |
| | | | | | | |
| | | | | | | |
| | | | | | | |
| | | | | | | |
| | | | | | | |
| | | | | | | |
| | | | | | | |
| | | | | | | |
| | | | | | | |
| | | | | | | |
| | | | | | | |
| | | | | | | |
| | | | | | | |
| | | | | | | |
| | | | | | | |
| | | | | | | |
| | | | | | | |
| | | | | | | |
| | | | | | | |
| | | | | | | |
| | | | | | | |
| | | | | | | |
| | | | | | | |
| | | | | | | |
| | | | | | | |
| | | | | | | |
| | | | | | | |
| | | | | | | |
| | | | | | | |
| | | | | | | |
SEE NOTES TO FINANCIAL STATEMENTS.
| J.P. Morgan Large Cap Funds | |
| |
| | | Ratios to average net assets |
Net asset
value,
end of
period | Total return
(excludes
sales charge)(b) | Net assets,
end of
period
(000's) | | Net
investment
income
(loss) | Expenses without
waivers and reimbursements | |
| | | | | | |
| | | | | | |
| | | | | | |
| | | | | | |
| | | | | | |
| | | | | | |
| | | | | | |
| | | | | | |
| | | | | | |
| | | | | | |
| | | | | | |
| | | | | | |
| | | | | | |
| | | | | | |
| | | | | | |
| | | | | | |
| | | | | | |
| | | | | | |
| | | | | | |
| | | | | | |
| | | | | | |
| | | | | | |
| | | | | | |
| | | | | | |
| | | | | | |
| | | | | | |
| | | | | | |
| | | | | | |
| | | | | | |
| | | | | | |
| | | | | | |
| | | | | | |
| | | | | | |
| | | | | | |
| | | | | | |
| | | | | | |
| | | | | | |
| | | | | | |
| | | | | | |
| | | | | | |
| | | | | | |
| | | | | | |
| | | | | | |
SEE NOTES TO FINANCIAL STATEMENTS.
| J.P. Morgan Large Cap Funds | |
FINANCIAL HIGHLIGHTS
FOR THE PERIODS INDICATED (continued)
| Per share operating performance |
| | | |
| Net asset
value,
beginning
of period | Net
investment
income
(loss)(a) | Net realized
and unrealized
gains
(losses) on
investments | Total from
investment
operations | | | |
JPMorgan U.S. Equity Fund (continued) | | | | | | | |
| | | | | | | |
| | | | | | | |
| | | | | | | |
| | | | | | | |
| | | | | | | |
| | | | | | | |
| | | | | | | |
| | | | | | | |
| | | | | | | |
| | | | | | | |
| | | | | | | |
| | | | | | | |
|
| Calculated based upon average shares outstanding. |
| Includes adjustments in accordance with accounting principles generally accepted in the United States of America and as such, the net asset values for financial reporting purposes and the returns based upon those net asset values may differ from the net asset values and returns for shareholder transactions. |
| Includes interest expense, if applicable, each of which is less than 0.005% unless otherwise noted. |
SEE NOTES TO FINANCIAL STATEMENTS.
| J.P. Morgan Large Cap Funds | |
| |
| | | Ratios to average net assets |
Net asset
value,
end of
period | Total return
(excludes
sales charge)(b) | Net assets,
end of
period
(000's) | | Net
investment
income
(loss) | Expenses without
waivers and reimbursements | |
|
| | | | | | |
| | | | | | |
| | | | | | |
| | | | | | |
| | | | | | |
| | | | | | |
| | | | | | |
| | | | | | |
| | | | | | |
| | | | | | |
| | | | | | |
| | | | | | |
SEE NOTES TO FINANCIAL STATEMENTS.
| J.P. Morgan Large Cap Funds | |
FINANCIAL HIGHLIGHTS
FOR THE PERIODS INDICATED
| Per share operating performance |
| | | |
| Net asset
value,
beginning
of period | Net
investment
income
(loss)(a) | Net realized
and unrealized
gains
(losses) on
investments | Total from
investment
operations | | | |
JPMorgan U.S. GARP Equity Fund | | | | | | | |
| | | | | | | |
| | | | | | | |
| | | | | | | |
| | | | | | | |
| | | | | | | |
| | | | | | | |
| | | | | | | |
| | | | | | | |
| | | | | | | |
| | | | | | | |
| | | | | | | |
| | | | | | | |
| | | | | | | |
| | | | | | | |
| | | | | | | |
| | | | | | | |
| | | | | | | |
| | | | | | | |
| | | | | | | |
| | | | | | | |
| | | | | | | |
| | | | | | | |
| | | | | | | |
| | | | | | | |
| | | | | | | |
| | | | | | | |
| | | | | | | |
| | | | | | | |
| | | | | | | |
| | | | | | | |
| | | | | | | |
| | | | | | | |
| | | | | | | |
| | | | | | | |
| | | | | | | |
| | | | | | | |
|
| Calculated based upon average shares outstanding. |
| Includes adjustments in accordance with accounting principles generally accepted in the United States of America and as such, the net asset values for financial reporting purposes and the returns based upon those net asset values may differ from the net asset values and returns for shareholder transactions. |
| Includes interest expense, if applicable, each of which is less than 0.005% unless otherwise noted. |
| Reflects special dividends paid out during the year by several of the Fund’s holdings. Had the Fund not received the special dividends, the net investment income (loss) per share would have been $0.27, $(0.01), $0.41, $0.13, $0.49 and $0.55 for Class A, Class C, Class I, Class R2, Class R5 and Class R6 Shares, respectively, and the net investment income (loss) ratio would have been 0.48%, (0.02)%, 0.73%, 0.23%, 0.88% and 0.99% for Class A, Class C, Class I, Class R2, Class R5 and Class R6 Shares, respectively. |
SEE NOTES TO FINANCIAL STATEMENTS.
| J.P. Morgan Large Cap Funds | |
| |
| | | Ratios to average net assets |
Net asset
value,
end of
period | Total return
(excludes
sales charge)(b) | Net assets,
end of
period
(000's) | | Net
investment
income
(loss) | Expenses without
waivers and reimbursements | |
| | | | | | |
| | | | | | |
| | | | | | |
| | | | | | |
| | | | | | |
| | | | | | |
| | | | | | |
| | | | | | |
| | | | | | |
| | | | | | |
| | | | | | |
| | | | | | |
| | | | | | |
| | | | | | |
| | | | | | |
| | | | | | |
| | | | | | |
| | | | | | |
| | | | | | |
| | | | | | |
| | | | | | |
| | | | | | |
| | | | | | |
| | | | | | |
| | | | | | |
| | | | | | |
| | | | | | |
| | | | | | |
| | | | | | |
| | | | | | |
| | | | | | |
| | | | | | |
| | | | | | |
| | | | | | |
| | | | | | |
| | | | | | |
| | | | | | |
SEE NOTES TO FINANCIAL STATEMENTS.
| J.P. Morgan Large Cap Funds | |
FINANCIAL HIGHLIGHTS
FOR THE PERIODS INDICATED
| Per share operating performance |
| | | |
| Net asset
value,
beginning
of period | Net
investment
income
(loss)(a) | Net realized
and unrealized
gains
(losses) on
investments | Total from
investment
operations | | | |
JPMorgan U.S. Large Cap Core Plus Fund | | | | | | | |
| | | | | | | |
| | | | | | | |
| | | | | | | |
| | | | | | | |
| | | | | | | |
| | | | | | | |
| | | | | | | |
| | | | | | | |
| | | | | | | |
| | | | | | | |
| | | | | | | |
| | | | | | | |
| | | | | | | |
| | | | | | | |
| | | | | | | |
| | | | | | | |
| | | | | | | |
| | | | | | | |
| | | | | | | |
| | | | | | | |
| | | | | | | |
| | | | | | | |
| | | | | | | |
| | | | | | | |
| | | | | | | |
| | | | | | | |
| | | | | | | |
| | | | | | | |
| | | | | | | |
| | | | | | | |
| | | | | | | |
| | | | | | | |
| | | | | | | |
| | | | | | | |
| | | | | | | |
| | | | | | | |
|
| Calculated based upon average shares outstanding. |
| Includes adjustments in accordance with accounting principles generally accepted in the United States of America and as such, the net asset values for financial reporting purposes and the returns based upon those net asset values may differ from the net asset values and returns for shareholder transactions. |
| Includes interest expense, if applicable, each of which is less than 0.005% unless otherwise noted. |
| |
| | | | | |
Net expenses (excluding dividend and interest expense for securities sold short) | | | | | |
| | | | | |
| | | | | |
| | | | | |
| | | | | |
| | | | | |
| | | | | |
Expenses without waivers and reimbursements (excluding dividend and interest expense for securities sold short) | | | | | |
| | | | | |
| | | | | |
| | | | | |
| | | | | |
| | | | | |
| | | | | |
|
| Interest expense on securities sold short is 0.14%. |
| Interest expense on securities sold short is 0.62%. |
| Interest expense on securities sold short is 0.16%. |
| Amount rounds to less than $0.005. |
SEE NOTES TO FINANCIAL STATEMENTS.
| J.P. Morgan Large Cap Funds | |
| |
| | | Ratios to average net assets |
Net asset
value,
end of
period | Total return
(excludes
sales charge)(b) | Net assets,
end of
period
(000's) | Net
expenses
(including dividend
and interest expense
for securities sold
short)(c)(d) | Net
investment
income
(loss) | Expenses without
waivers and reimbursements
(including dividend
and interest expense
for securities sold
short)(d) | Portfolio
turnover rate
(excluding securities
sold short) | Portfolio
turnover rate
(including securities
sold short) |
| | | | | | | |
| | | | | | | |
| | | | | | | |
| | | | | | | |
| | | | | | | |
| | | | | | | |
| | | | | | | |
| | | | | | | |
| | | | | | | |
| | | | | | | |
| | | | | | | |
| | | | | | | |
| | | | | | | |
| | | | | | | |
| | | | | | | |
| | | | | | | |
| | | | | | | |
| | | | | | | |
| | | | | | | |
| | | | | | | |
| | | | | | | |
| | | | | | | |
| | | | | | | |
| | | | | | | |
| | | | | | | |
| | | | | | | |
| | | | | | | |
| | | | | | | |
| | | | | | | |
| | | | | | | |
| | | | | | | |
| | | | | | | |
| | | | | | | |
| | | | | | | |
| | | | | | | |
| | | | | | | |
| | | | | | | |
SEE NOTES TO FINANCIAL STATEMENTS.
| J.P. Morgan Large Cap Funds | |
FINANCIAL HIGHLIGHTS
FOR THE PERIODS INDICATED
| Per share operating performance |
| | | |
| Net asset
value,
beginning
of period | Net
investment
income
(loss)(a) | Net realized
and unrealized
gains
(losses) on
investments | Total from
investment
operations | | | |
JPMorgan U.S. Research Enhanced Equity Fund | | | | | | | |
| | | | | | | |
| | | | | | | |
| | | | | | | |
| | | | | | | |
| | | | | | | |
| | | | | | | |
| | | | | | | |
| | | | | | | |
| | | | | | | |
| | | | | | | |
| | | | | | | |
| | | | | | | |
| | | | | | | |
| | | | | | | |
| | | | | | | |
| | | | | | | |
| | | | | | | |
| | | | | | | |
|
| Calculated based upon average shares outstanding. |
| Includes adjustments in accordance with accounting principles generally accepted in the United States of America and as such, the net asset values for financial reporting purposes and the returns based upon those net asset values may differ from the net asset values and returns for shareholder transactions. |
| Includes interest expense, if applicable, each of which is less than 0.005% unless otherwise noted. |
SEE NOTES TO FINANCIAL STATEMENTS.
| J.P. Morgan Large Cap Funds | |
| |
| | | Ratios to average net assets |
Net asset
value,
end of
period | Total return
(excludes
sales charge)(b) | Net assets,
end of
period
(000's) | | Net
investment
income
(loss) | Expenses without
waivers and reimbursements | |
| | | | | | |
| | | | | | |
| | | | | | |
| | | | | | |
| | | | | | |
| | | | | | |
| | | | | | |
| | | | | | |
| | | | | | |
| | | | | | |
| | | | | | |
| | | | | | |
| | | | | | |
| | | | | | |
| | | | | | |
| | | | | | |
| | | | | | |
| | | | | | |
| | | | | | |
SEE NOTES TO FINANCIAL STATEMENTS.
| J.P. Morgan Large Cap Funds | |
FINANCIAL HIGHLIGHTS
FOR THE PERIODS INDICATED
| Per share operating performance |
| | | |
| Net asset
value,
beginning
of period | Net
investment
income
(loss)(b) | Net realized
and unrealized
gains
(losses) on
investments | Total from
investment
operations | | | |
JPMorgan U.S. Sustainable Leaders Fund | | | | | | | |
| | | | | | | |
| | | | | | | |
| | | | | | | |
| | | | | | | |
| | | | | | | |
| | | | | | | |
| | | | | | | |
| | | | | | | |
| | | | | | | |
| | | | | | | |
| | | | | | | |
| | | | | | | |
| | | | | | | |
| | | | | | | |
| | | | | | | |
| | | | | | | |
| | | | | | | |
| | | | | | | |
| | | | | | | |
| | | | | | | |
| | | | | | | |
September 30, 2020 (f) through June 30, 2021 | | | | | | | |
|
| Annualized for periods less than one year, unless otherwise noted. |
| Calculated based upon average shares outstanding. |
| Not annualized for periods less than one year. |
| Includes adjustments in accordance with accounting principles generally accepted in the United States of America and as such, the net asset values for financial reporting purposes and the returns based upon those net asset values may differ from the net asset values and returns for shareholder transactions. |
| Includes interest expense, if applicable, each of which is less than 0.005% unless otherwise noted. |
| Commencement of offering of class of shares. |
SEE NOTES TO FINANCIAL STATEMENTS.
| J.P. Morgan Large Cap Funds | |
| |
| | | Ratios to average net assets(a) |
Net asset
value,
end of
period | Total return
(excludes
sales charge)(c)(d) | Net assets,
end of
period
(000's) | | Net
investment
income
(loss) | Expenses without
waivers and reimbursements | |
| | | | | | |
| | | | | | |
| | | | | | |
| | | | | | |
| | | | | | |
| | | | | | |
| | | | | | |
| | | | | | |
| | | | | | |
| | | | | | |
| | | | | | |
| | | | | | |
| | | | | | |
| | | | | | |
| | | | | | |
| | | | | | |
| | | | | | |
| | | | | | |
| | | | | | |
| | | | | | |
| | | | | | |
| | | | | | |
| | | | | | |
SEE NOTES TO FINANCIAL STATEMENTS.
| J.P. Morgan Large Cap Funds | |
FINANCIAL HIGHLIGHTS
FOR THE PERIODS INDICATED
| Per share operating performance |
| | | |
| Net asset
value,
beginning
of period | Net
investment
income
(loss)(a) | Net realized
and unrealized
gains
(losses) on
investments | Total from
investment
operations | | | |
| | | | | | | |
| | | | | | | |
| | | | | | | |
| | | | | | | |
| | | | | | | |
| | | | | | | |
| | | | | | | |
| | | | | | | |
| | | | | | | |
| | | | | | | |
| | | | | | | |
| | | | | | | |
| | | | | | | |
| | | | | | | |
| | | | | | | |
| | | | | | | |
| | | | | | | |
| | | | | | | |
| | | | | | | |
| | | | | | | |
| | | | | | | |
| | | | | | | |
| | | | | | | |
| | | | | | | |
| | | | | | | |
| | | | | | | |
| | | | | | | |
| | | | | | | |
| | | | | | | |
| | | | | | | |
| | | | | | | |
| | | | | | | |
| | | | | | | |
| | | | | | | |
| | | | | | | |
| | | | | | | |
| | | | | | | |
| | | | | | | |
| | | | | | | |
| | | | | | | |
| | | | | | | |
| | | | | | | |
| | | | | | | |
| | | | | | | |
| | | | | | | |
| | | | | | | |
| | | | | | | |
| | | | | | | |
| | | | | | | |
|
| Calculated based upon average shares outstanding. |
| Includes adjustments in accordance with accounting principles generally accepted in the United States of America and as such, the net asset values for financial reporting purposes and the returns based upon those net asset values may differ from the net asset values and returns for shareholder transactions. |
| Includes interest expense, if applicable, each of which is less than 0.005% unless otherwise noted. |
SEE NOTES TO FINANCIAL STATEMENTS.
| J.P. Morgan Large Cap Funds | |
| |
| | | Ratios to average net assets |
Net asset
value,
end of
period | Total return
(excludes
sales charge)(b) | Net assets,
end of
period
(000's) | | Net
investment
income
(loss) | Expenses without
waivers and reimbursements | |
| | | | | | |
| | | | | | |
| | | | | | |
| | | | | | |
| | | | | | |
| | | | | | |
| | | | | | |
| | | | | | |
| | | | | | |
| | | | | | |
| | | | | | |
| | | | | | |
| | | | | | |
| | | | | | |
| | | | | | |
| | | | | | |
| | | | | | |
| | | | | | |
| | | | | | |
| | | | | | |
| | | | | | |
| | | | | | |
| | | | | | |
| | | | | | |
| | | | | | |
| | | | | | |
| | | | | | |
| | | | | | |
| | | | | | |
| | | | | | |
| | | | | | |
| | | | | | |
| | | | | | |
| | | | | | |
| | | | | | |
| | | | | | |
| | | | | | |
| | | | | | |
| | | | | | |
| | | | | | |
| | | | | | |
| | | | | | |
| | | | | | |
| | | | | | |
| | | | | | |
| | | | | | |
| | | | | | |
| | | | | | |
| | | | | | |
SEE NOTES TO FINANCIAL STATEMENTS.
| J.P. Morgan Large Cap Funds | |
NOTES TO FINANCIAL STATEMENTS
AS OF June 30, 2023
(Dollar values in thousands)
1. Organization
JPMorgan Trust I (“JPM I”), JPMorgan Trust II (“JPM II”) and JPMorgan Trust IV (“JPM IV”) (collectively, the “Trusts”) were formed on November 12, 2004 for JPM I and JPM II and November 11, 2015 for JPM IV, as Delaware statutory trusts, pursuant to Declarations of Trust dated November 5, 2004 and November 11, 2015, respectively, and are registered under the Investment Company Act of 1940, as amended (the “1940 Act”), as open-end management investment companies.
The following are 15 separate funds of the Trusts (each, a "Fund" and collectively, the "Funds") covered by this report:
| | | Diversification Classification |
JPMorgan Equity Income Fund | Class A, Class C, Class I, Class R2, Class R3, Class R4, Class R5 and Class R6 | | |
JPMorgan Equity Index Fund | Class A, Class C, Class I and Class R6 | | |
JPMorgan Equity Premium Income Fund | Class A, Class C, Class I, Class R5 and Class R6 | | |
JPMorgan Hedged Equity Fund | Class A, Class C, Class I, Class R5 and Class R6 | | |
JPMorgan Hedged Equity 2 Fund | Class A, Class C, Class I, Class R5 and Class R6 | | |
JPMorgan Hedged Equity 3 Fund | Class A, Class C, Class I, Class R5 and Class R6 | | |
JPMorgan Large Cap Growth Fund | Class A, Class C, Class I, Class R2, Class R3, Class R4, Class R5 and Class R6 | | |
JPMorgan Large Cap Value Fund | Class A, Class C, Class I, Class R2, Class R3, Class R4, Class R5 and Class R6 | | |
JPMorgan U.S. Applied Data Science Value Fund
| Class A, Class C, Class I, Class R2, Class R5 and Class R6 | | |
JPMorgan U.S. Equity Fund | Class A, Class C, Class I, Class L, Class R2, Class R3, Class R4, Class R5 and Class R6 | | |
JPMorgan U.S. GARP Equity Fund | Class A, Class C, Class I, Class R2, Class R5 and Class R6 | | |
JPMorgan U.S. Large Cap Core Plus Fund | Class A, Class C, Class I, Class R2, Class R5 and Class R6 | | |
JPMorgan U.S. Research Enhanced Equity Fund | Class A, Class I and Class R6 | | |
JPMorgan U.S. Sustainable Leaders Fund | Class A, Class C, Class I and Class R6 | | |
| Class A, Class C, Class I, Class R2, Class R3, Class R4, Class R5 and Class R6 | | |
The investment objective of JPMorgan Equity Income Fund (“Equity Income Fund”) is to seek capital appreciation and current income.
The investment objective of JPMorgan Equity Index Fund ("Equity Index Fund") is to seek investment results that correspond to the aggregate price and dividend performance of securities in the Standard & Poor's 500 Composite Stock Price Index.
The investment objective of JPMorgan Equity Premium Income Fund (“Equity Premium Income Fund”) is to seek current income while maintaining prospects for capital appreciation.
The investment objective of JPMorgan Hedged Equity Fund (“Hedged Equity Fund”), JPMorgan Hedged Equity 2 Fund (“Hedged Equity 2 Fund”) and JPMorgan Hedged Equity 3 Fund (“Hedged Equity 3 Fund”) is to seek to provide capital appreciation.
The investment objective of JPMorgan Large Cap Growth Fund ("Large Cap Growth Fund") is to seek long-term capital appreciation.
The investment objective of JPMorgan Large Cap Value Fund (“Large Cap Value Fund”) is to seek capital appreciation with the incidental goal of achieving current income by investing primarily in equity securities.
The investment objective of JPMorgan U.S. Applied Data Science Value Fund (“U.S. Applied Data Science Value Fund”) and JPMorgan U.S. Sustainable Leaders Fund (“U.S. Sustainable Leaders Fund”) is to seek to provide long-term capital appreciation.
The investment objective of JPMorgan U.S. Equity Fund (“U.S. Equity Fund”) and JPMorgan U.S. Large Cap Core Plus Fund ("U.S. Large Cap Core Plus Fund") is to seek to provide high total return from a portfolio of selected equity securities.
The investment objective of JPMorgan U.S. GARP Equity Fund (“U.S. GARP Equity Fund”) is to seek to provide long-term capital growth.
The investment objective of JPMorgan U.S. Research Enhanced Equity Fund (“U.S. Research Enhanced Equity Fund”) is to seek to provide a consistently high total return from a broadly diversified portfolio of equity securities with risk characteristics similar to the Standard and Poor’s 500 Composite Stock Price Index.
The investment objective of JPMorgan U.S. Value Fund (“U.S. Value Fund”) is to seek to provide capital growth over the long-term and to earn income from dividends.
| J.P. Morgan Large Cap Funds | |
Class L Shares of U.S. Equity Fund and Class A Shares of U.S. Research Enhanced Equity Fund are publicly offered on a limited basis. Investors are not eligible to purchase Class L Shares of the Funds unless they meet certain requirements as described in the Funds’ prospectus.
Prior to February 17, 2023, all share classes of Hedged Equity Fund were publicly offered on a limited basis. Investors were not eligible to purchase shares of Hedged Equity Fund unless they met certain requirements as described in the Fund's prospectuses.
JPMorgan Equity Income Fund is offered on a limited basis. Investors are not eligible to purchase shares of the Fund unless they meet certain requirements as described in the Fund’s prospectuses.
Class A Shares generally provide for a front-end sales charge while Class C Shares provide for a contingent deferred sales charge ("CDSC"). No sales charges are assessed with respect to Class I, Class L, Class R2, Class R3, Class R4, Class R5 and Class R6 Shares. Certain Class A Shares, for which front-end sales charges have been waived, may be subject to a CDSC as described in the Funds' prospectus. Class C Shares automatically convert to Class A Shares after eight years. All classes of shares have equal rights as to earnings, assets and voting privileges, except that each class may bear different transfer agency, distribution and service fees and each class has exclusive voting rights with respect to its distribution plan and shareholder servicing agreements.
J.P. Morgan Investment Management Inc. (“JPMIM”), an indirect, wholly-owned subsidiary of JPMorgan Chase & Co. (“JPMorgan”), acts as adviser (the “Adviser”) and administrator (the “Administrator”) to the Funds.
2. Significant Accounting Policies
The following is a summary of significant accounting policies followed by the Funds in the preparation of their financial statements. The Funds are investment companies and, accordingly, follow the investment company accounting and reporting guidance of the Financial Accounting Standards Board (“FASB”) Accounting Standards Codification Topic 946 — Investment Companies, which is part of U.S. generally accepted accounting principles (“GAAP”). The preparation of financial statements in conformity with GAAP requires management to make estimates and assumptions that affect (i) the reported amounts of assets and liabilities, (ii) disclosure of contingent assets and liabilities at the date of the financial statements, and (iii) the reported amounts of increases and decreases in net assets from operations during the reporting period. Actual results could differ from those estimates.
A. Valuation of Investments — Investments are valued in accordance with GAAP and the Funds' valuation policies set forth by, and under the supervision and responsibility of, the Boards of Trustees of the Trusts (the "Boards"), which established the following approach to valuation, as described more fully below: (i) investments for which market quotations are readily available shall be valued at their market value and (ii) all other investments for which market quotations are not readily available shall be valued at their fair value as determined in good faith by the Boards.
Under Section 2(a)(41) of the 1940 Act, the Boards are required to determine fair value for securities that do not have readily available market quotations. Under SEC Rule 2a-5 (Good Faith Determinations of Fair Value), the Boards may designate the performance of these fair valuation determinations to a valuation designee. The Boards have designated the Adviser as the “Valuation Designee” to perform fair valuation determinations for the Funds on behalf of the Boards subject to appropriate oversight by the Boards. The Adviser, as Valuation Designee, leverages the J.P. Morgan Asset Management Americas Valuation Committee (“AVC”) to help oversee and carry out the policies for the valuation of investments held in the Funds. The Adviser, as Valuation Designee, remains responsible for the valuation determinations.
This oversight by the AVC includes monitoring the appropriateness of fair values based on results of ongoing valuation oversight including, but not limited to, consideration of macro or security specific events, market events, and pricing vendor and broker due diligence. The Administrator is responsible for discussing and assessing the potential impacts to the fair values on an ongoing basis, and, at least on a quarterly basis, with the AVC and the Boards.
A market-based approach is primarily used to value the Funds' investments. Investments for which market quotations are not readily available are fair valued using prices supplied by approved affiliated and/or unaffiliated pricing vendors or third party broker-dealers (collectively referred to as “Pricing Services”) or may be internally fair valued using methods set forth by the valuation policies approved by the Boards. This may include the use of related or comparable assets or liabilities, recent transactions, market multiples, book values and other relevant information for the investment. An income-based valuation approach may be used in which the anticipated future cash flows of the investment are discounted to calculate the fair value. Discounts may also be applied due to the nature or duration of any restrictions on the disposition of the investments. Valuations may be based upon current market prices of securities that are comparable in coupon, rating, maturity and industry. It is possible that the estimated values may differ significantly from the values that would have been used had a ready market for the investments existed, and such differences could be material.
Fixed income instruments are valued based on prices received from approved affiliated and unaffiliated pricing vendors or third party broker-dealers (collectively referred to as “Pricing Services”). The Pricing Services use multiple valuation techniques to determine the valuation of fixed income instruments. In instances where sufficient market activity exists, the Pricing Services may utilize a market-based approach through which trades or quotes from market makers are used to determine the valuation of these instruments. In instances where sufficient market activity may not exist, the Pricing Services also utilize proprietary valuation models which may consider market transactions in comparable securities and the various relationships between securities in determining fair value and/or market characteristics in order to estimate the relevant cash flows, which are then discounted to calculate the fair values.
| J.P. Morgan Large Cap Funds | |
NOTES TO FINANCIAL STATEMENTS
AS OF June 30, 2023 (continued)
(Dollar values in thousands)
Equities and other exchange-traded instruments are valued at the last sale price or official market closing price on the primary exchange on which the instrument is traded before the net asset values (“NAV”) of the Funds are calculated on a valuation date.
Investments in open-end investment companies (“Underlying Funds”) are valued at each Underlying Fund’s NAV per share as of the report date.
Futures contracts and options are generally valued on the basis of available market quotations.
Valuations reflected in this report are as of the report date. As a result, changes in valuation due to market events and/or issuer-related events after the report date and prior to issuance of the report are not reflected herein.
The various inputs that are used in determining the valuation of the Funds' investments are summarized into the three broad levels listed below.
•
Level 1 — Unadjusted inputs using quoted prices in active markets for identical investments.
•
Level 2 — Other significant observable inputs including, but not limited to, quoted prices for similar investments, inputs other than quoted prices that are observable for investments (such as interest rates, prepayment speeds, credit risk, etc.) or other market corroborated inputs.
•
Level 3 — Significant inputs based on the best information available in the circumstances, to the extent observable inputs are not available (including the Funds' assumptions in determining the fair value of investments).
A financial instrument’s level within the fair value hierarchy is based on the lowest level of any input, both individually and in the aggregate, that is significant to the fair value measurement. The inputs or methodology used for valuing instruments are not necessarily an indication of the risk associated with investing in those instruments.
The following tables represent each valuation input as presented on the Schedules of Portfolio Investments ("SOIs"):
| | | | |
| | Level 2
Other significant
observable inputs | Level 3
Significant
unobservable inputs | |
Total Investments in Securities (a) | | | | |
|
| Please refer to the SOI for specifics of portfolio holdings. |
| | | | |
| | Level 2
Other significant
observable inputs | Level 3
Significant
unobservable inputs | |
Investments in Securities | | | | |
| | | | |
| | | | |
| | | | |
| | | | |
Investment of Cash Collateral from Securities Loaned | | | | |
Total Short-Term Investments | | | | |
Total Investments in Securities | | | | |
Appreciation in Other Financial Instruments | | | | |
| | | | |
Equity Premium Income Fund | | | | |
| | Level 2
Other significant
observable inputs | Level 3
Significant
unobservable inputs | |
Investments in Securities | | | | |
| | | | |
| | | | |
| | | | |
| | | | |
| J.P. Morgan Large Cap Funds | |
Equity Premium Income Fund (continued) | | | | |
| | Level 2 Other significant observable inputs | Level 3 Significant unobservable inputs | |
Investment of Cash Collateral from Securities Loaned | | | | |
Total Short-Term Investments | | | | |
Total Investments in Securities | | | | |
Appreciation in Other Financial Instruments | | | | |
| | | | |
| | | | |
| | Level 2
Other significant
observable inputs | Level 3
Significant
unobservable inputs | |
Total Investments in Securities (a) | | | | |
Appreciation in Other Financial Instruments | | | | |
| | | | |
Depreciation in Other Financial Instruments | | | | |
| | | | |
| | | | |
| | | | |
Total Net Appreciation/ Depreciation in Other
Financial Instruments | | | | |
|
| Please refer to the SOI for specifics of portfolio holdings. |
| | | | |
| | Level 2
Other significant
observable inputs | Level 3
Significant
unobservable inputs | |
Total Investments in Securities (a) | | | | |
Appreciation in Other Financial Instruments | | | | |
| | | | |
| J.P. Morgan Large Cap Funds | |
NOTES TO FINANCIAL STATEMENTS
AS OF June 30, 2023 (continued)
(Dollar values in thousands)
Hedged Equity 3 Fund (continued) | | | | |
| | Level 2 Other significant observable inputs | Level 3 Significant unobservable inputs | |
Depreciation in Other Financial Instruments | | | | |
| | | | |
| | | | |
| | | | |
Total Net Appreciation/ Depreciation in Other
Financial Instruments | | | | |
|
| Please refer to the SOI for specifics of portfolio holdings. |
| | | | |
| | Level 2
Other significant
observable inputs | Level 3
Significant
unobservable inputs | |
Total Investments in Securities (a) | | | | |
|
| Please refer to the SOI for specifics of portfolio holdings. |
| | | | |
| | Level 2
Other significant
observable inputs | Level 3
Significant
unobservable inputs | |
Total Investments in Securities (a) | | | | |
|
| Please refer to the SOI for specifics of portfolio holdings. |
U.S. Applied Data Science Value Fund | | | | |
| | Level 2
Other significant
observable inputs | Level 3
Significant
unobservable inputs | |
Total Investments in Securities (a) | | | | |
Appreciation in Other Financial Instruments | | | | |
| | | | |
|
| Please refer to the SOI for specifics of portfolio holdings. |
| | | | |
| | Level 2
Other significant
observable inputs | Level 3
Significant
unobservable inputs | |
Total Investments in Securities (a) | | | | |
|
| Please refer to the SOI for specifics of portfolio holdings. |
| | | | |
| | Level 2
Other significant
observable inputs | Level 3
Significant
unobservable inputs | |
Total Investments in Securities (a) | | | | |
| J.P. Morgan Large Cap Funds | |
U.S. GARP Equity Fund (continued) | | | | |
| | Level 2 Other significant observable inputs | Level 3 Significant unobservable inputs | |
Appreciation in Other Financial Instruments | | | | |
| | | | |
|
| Please refer to the SOI for specifics of portfolio holdings. |
U.S. Large Cap Core Plus Fund | | | | |
| | Level 2
Other significant
observable inputs | Level 3
Significant
unobservable inputs | |
Total Investments in Securities (a) | | | | |
Total Liabilities in Securities Sold Short (a) | | | | |
Appreciation in Other Financial Instruments | | | | |
| | | | |
|
| Please refer to the SOI for specifics of portfolio holdings. |
U.S. Research Enhanced Equity Fund | | | | |
| | Level 2
Other significant
observable inputs | Level 3
Significant
unobservable inputs | |
Total Investments in Securities (a) | | | | |
Appreciation in Other Financial Instruments | | | | |
| | | | |
|
| Please refer to the SOI for specifics of portfolio holdings. |
U.S. Sustainable Leaders Fund | | | | |
| | Level 2
Other significant
observable inputs | Level 3
Significant
unobservable inputs | |
Total Investments in Securities (a) | | | | |
Appreciation in Other Financial Instruments | | | | |
| | | | |
|
| Please refer to the SOI for specifics of portfolio holdings. |
| | | | |
| | Level 2
Other significant
observable inputs | Level 3
Significant
unobservable inputs | |
Total Investments in Securities (a) | | | | |
|
| Please refer to the SOI for specifics of portfolio holdings. |
| J.P. Morgan Large Cap Funds | |
NOTES TO FINANCIAL STATEMENTS
AS OF June 30, 2023 (continued)
(Dollar values in thousands)
B. Restricted Securities — Certain securities held by the Funds may be subject to legal or contractual restrictions on resale. Restricted securities generally are resold in transactions exempt from registration under the Securities Act of 1933, as amended (the “Securities Act”). Disposal of these securities may involve time-consuming negotiations and expense. Prompt sale at the current valuation may be difficult and could adversely affect the NAVs of the Funds.
As of June 30, 2023, the Funds had no investments in restricted securities other than securities sold to the Funds under Rule 144A and/or Regulation S under the Securities Act.
C. Securities Lending — The Funds are authorized to engage in securities lending in order to generate additional income. The Funds are able to lend to approved borrowers. Citibank N.A. (“Citibank”) serves as lending agent for the Funds, pursuant to a Securities Lending Agency Agreement (the “Securities Lending Agency Agreement”). Securities loaned are collateralized by cash equal to at least 100% of the market value plus accrued interest on the securities lent, which is invested in the Class IM Shares of the JPMorgan U.S. Government Money Market Fund, the Class IM Shares of the JPMorgan Prime Money Market Fund, and the Agency SL Class Shares of the JPMorgan Securities Lending Money Market Fund. The Funds retain the interest earned on cash collateral investments but are required to pay the borrower a rebate for the use of the cash collateral. In cases where the lent security is of high value to borrowers, there may be a negative rebate (i.e., a net payment from the borrower to the Funds). Upon termination of a loan, the Funds are required to return to the borrower an amount equal to the cash collateral, plus any rebate owed to the borrowers. The remaining maturities of the securities lending transactions are considered overnight and continuous. Loans are subject to termination by the Funds or the borrower at any time.
The net income earned on the securities lending (after payment of rebates and Citibank’s fee) is included on the Statements of Operations as Income from securities lending (net). The Funds also receive payments from the borrower during the period of the loan, equivalent to dividends and interest earned on the securities loaned, which are recorded as Dividend or Interest income, respectively, on the Statements of Operations.
Under the Securities Lending Agency Agreement, Citibank marks to market the loaned securities on a daily basis. In the event the cash received from the borrower is less than 102% of the value of the loaned securities (105% for loans of non-U.S. securities), Citibank requests additional cash from the borrower so as to maintain a collateralization level of at least 102% of the value of the loaned securities plus accrued interest (105% for loans of non-U.S. securities), subject to certain de minimis amounts.
The value of securities out on loan is recorded as an asset on the Statements of Assets and Liabilities. The value of the cash collateral received is recorded as a liability on the Statements of Assets and Liabilities and details of collateral investments are disclosed on the SOIs.
The Funds bear the risk of loss associated with the collateral investments and are not entitled to additional collateral from the borrower to cover any such losses. To the extent that the value of the collateral investments declines below the amount owed to a borrower, the Funds may incur losses that exceed the amount they earned on lending the security. Upon termination of a loan, the Funds may use leverage (borrow money) to repay the borrower for cash collateral posted if the Adviser does not believe that it is prudent to sell the collateral investments to fund the payment of this liability. Securities lending activity is subject to master netting arrangements.
The following table presents for each lending Fund, the value of the securities on loan with Citibank, net of amounts available for offset under the master netting arrangements and any related collateral received or posted by the Funds as of June 30, 2023.
| Investment Securities
on Loan, at value,
Presented on the
Statements of Assets
and Liabilities | Cash Collateral
Posted by Borrower* | Net Amount Due
to Counterparty
(not less than zero) |
| | | |
Equity Premium Income Fund | | | |
| | | |
| | | |
|
| Collateral posted reflects the value of securities on loan and does not include any additional amounts received from the borrower. |
| Subsequent to June 30, 2023, additional collateral was received. |
Securities lending also involves counterparty risks, including the risk that the loaned securities may not be returned in a timely manner or at all. Subject to certain conditions, Citibank has agreed to indemnify the Funds from losses resulting from a borrower’s failure to return a loaned security.
| J.P. Morgan Large Cap Funds | |
JPMIM voluntarily waived investment advisory fees charged to the Funds to reduce the impact of the cash collateral investment in the JPMorgan U.S. Government Money Market Fund from 0.13% to 0.06%. For the year ended June 30, 2023, JPMIM waived fees associated with the Funds' investment in the JPMorgan U.S. Government Money Market Fund as follows:
| |
| |
Equity Premium Income Fund | |
| |
| |
U.S. Applied Data Science Value Fund | |
| |
| |
U.S. Sustainable Leaders Fund | |
|
| Amount rounds to less than one thousand. |
The above waiver is included in the determination of earnings on cash collateral investment and in the calculation of Citibank’s compensation and is included on the Statements of Operations as Income from securities lending (net).
Equity Income Fund, Hedged Equity Fund, Hedged Equity 2 Fund, Hedged Equity 3 Fund, Large Cap Growth Fund, U.S. Applied Data Science Value Fund, U.S. GARP Equity Fund, U.S. Large Cap Core Plus Fund, U.S. Research Enhanced Equity Fund. U.S. Sustainable Leaders Fund and U.S. Value Fund did not have any securities out on loan at June 30, 2023. Hedged Equity Fund, Hedged Equity 2 Fund, Hedged Equity 3 Fund, U.S. Large Cap Core Plus Fund, U.S. Research Enhanced Equity Fund and U.S. Value Fund did not lend out any securities during the year ended June 30, 2023.
D. Investment Transactions with Affiliates — The Funds invested in Underlying Funds advised by the Adviser. An issuer which is under common control with a Fund may be considered an affiliate. For the purposes of the financial statements, the Funds assume the issuers listed in the tables below to be affiliated issuers. The Underlying Funds’ distributions may be reinvested into such Underlying Funds. Reinvestment amounts are included in the purchases at cost amounts in the tables below.
|
For the year ended June 30, 2023 |
| | | | | Change in
Unrealized
Appreciation/
(Depreciation) | | | | Capital Gain
Distributions |
JPMorgan Prime Money Market Fund Class IM Shares, 5.23% (a) (b) | | | | | | | | | |
JPMorgan Securities Lending Money Market Fund Agency SL Class Shares, 5.29% (a) (b) | | | | | | | | | |
JPMorgan U.S. Government Money Market Fund Class IM Shares, 5.05% (a) (b) | | | | | | | | | |
| | | | | | | | | |
|
| Investment in an affiliated fund, which is registered under the Investment Company Act of 1940, as amended, and is advised by J.P. Morgan Investment Management Inc. |
| The rate shown is the current yield as of June 30, 2023. |
| Amount is included on the Statements of Operations as Income from securities lending (net) (after payments of rebates and Citibank’s fee). |
|
For the year ended June 30, 2023 |
| | | | | Change in
Unrealized
Appreciation/
(Depreciation) | | | | Capital Gain
Distributions |
| | | | | | | | | |
JPMorgan Securities Lending Money Market Fund Agency SL Class Shares, 5.29% (b) (c) | | | | | | | | | |
| J.P. Morgan Large Cap Funds | |
NOTES TO FINANCIAL STATEMENTS
AS OF June 30, 2023 (continued)
(Dollar values in thousands)
Equity Index Fund (continued) |
For the year ended June 30, 2023 |
| | | | | Change in Unrealized Appreciation/ (Depreciation) | | | | Capital Gain Distributions |
JPMorgan U.S. Government Money Market Fund Class IM Shares, 5.05% (b) (c) | | | | | | | | | |
JPMorgan U.S. Government Money Market Fund Class Institutional Shares, 4.97% (b) (c) | | | | | | | | | |
| | | | | | | | | |
|
| Investment in affiliate. This security is included in an index in which the Fund, as an index fund, tracks. |
| Investment in an affiliated fund, which is registered under the Investment Company Act of 1940, as amended, and is advised by J.P. Morgan Investment Management Inc. |
| The rate shown is the current yield as of June 30, 2023. |
| Amount is included on the Statements of Operations as Income from securities lending (net) (after payments of rebates and Citibank’s fee). |
Equity Premium Income Fund |
For the year ended June 30, 2023 |
| | | | | Change in
Unrealized
Appreciation/
(Depreciation) | | | | Capital Gain
Distributions |
JPMorgan Prime Money Market Fund Class IM Shares, 5.23% (a) (b) | | | | | | | | | |
JPMorgan Securities Lending Money Market Fund Agency SL Class Shares, 5.29% (a) (b) | | | | | | | | | |
JPMorgan U.S. Government Money Market Fund Class IM Shares, 5.05% (a) (b) | | | | | | | | | |
| | | | | | | | | |
|
| Investment in an affiliated fund, which is registered under the Investment Company Act of 1940, as amended, and is advised by J.P. Morgan Investment Management Inc. |
| The rate shown is the current yield as of June 30, 2023. |
| Amount is included on the Statements of Operations as Income from securities lending (net) (after payments of rebates and Citibank’s fee). |
|
For the year ended June 30, 2023 |
| | | | | Change in
Unrealized
Appreciation/
(Depreciation) | | | | Capital Gain
Distributions |
JPMorgan U.S. Government Money Market Fund Class Institutional Shares, 4.97% (a) (b) | | | | | | | | | |
|
| Investment in an affiliated fund, which is registered under the Investment Company Act of 1940, as amended, and is advised by J.P. Morgan Investment Management Inc. |
| The rate shown is the current yield as of June 30, 2023. |
| J.P. Morgan Large Cap Funds | |
|
For the year ended June 30, 2023 |
| | | | | Change in
Unrealized
Appreciation/
(Depreciation) | | | | Capital Gain
Distributions |
JPMorgan U.S. Government Money Market Fund Class IM Shares, 5.05% (a) (b) | | | | | | | | | |
|
| Investment in an affiliated fund, which is registered under the Investment Company Act of 1940, as amended, and is advised by J.P. Morgan Investment Management Inc. |
| The rate shown is the current yield as of June 30, 2023. |
|
For the year ended June 30, 2023 |
| | | | | Change in
Unrealized
Appreciation/
(Depreciation) | | | | Capital Gain
Distributions |
JPMorgan Prime Money Market Fund Class IM Shares, 5.23% (a) (b) | | | | | | | | | |
JPMorgan Securities Lending Money Market Fund Agency SL Class Shares, 5.29% (a) (b) | | | | | | | | | |
JPMorgan U.S. Government Money Market Fund Class IM Shares, 5.05% (a) (b) | | | | | | | | | |
| | | | | | | | | |
|
| Investment in an affiliated fund, which is registered under the Investment Company Act of 1940, as amended, and is advised by J.P. Morgan Investment Management Inc. |
| The rate shown is the current yield as of June 30, 2023. |
| Amount is included on the Statements of Operations as Income from securities lending (net) (after payments of rebates and Citibank’s fee). |
|
For the year ended June 30, 2023 |
| | | | | Change in
Unrealized
Appreciation/
(Depreciation) | | | | Capital Gain
Distributions |
JPMorgan Prime Money Market Fund Class IM Shares, 5.23% (a) (b) | | | | | | | | | |
| J.P. Morgan Large Cap Funds | |
NOTES TO FINANCIAL STATEMENTS
AS OF June 30, 2023 (continued)
(Dollar values in thousands)
Large Cap Value Fund (continued) |
For the year ended June 30, 2023 |
| | | | | Change in Unrealized Appreciation/ (Depreciation) | | | | Capital Gain Distributions |
JPMorgan Securities Lending Money Market Fund Agency SL Class Shares, 5.29% (a) (b) | | | | | | | | | |
JPMorgan U.S. Government Money Market Fund Class IM Shares, 5.05% (a) (b) | | | | | | | | | |
| | | | | | | | | |
|
| Investment in an affiliated fund, which is registered under the Investment Company Act of 1940, as amended, and is advised by J.P. Morgan Investment Management Inc. |
| The rate shown is the current yield as of June 30, 2023. |
| Amount is included on the Statements of Operations as Income from securities lending (net) (after payments of rebates and Citibank’s fee). |
U.S. Applied Data Science Value Fund |
For the year ended June 30, 2023 |
| | | | | Change in
Unrealized
Appreciation/
(Depreciation) | | | | Capital Gain
Distributions |
JPMorgan Prime Money Market Fund Class IM Shares, 5.23% (a) (b) | | | | | | | | | |
JPMorgan Securities Lending Money Market Fund Agency SL Class Shares, 5.29% (a) (b) | | | | | | | | | |
JPMorgan U.S. Government Money Market Fund Class IM Shares, 5.05% (a) (b) | | | | | | | | | |
| | | | | | | | | |
|
| Investment in an affiliated fund, which is registered under the Investment Company Act of 1940, as amended, and is advised by J.P. Morgan Investment Management Inc. |
| The rate shown is the current yield as of June 30, 2023. |
| Amount rounds to less than one thousand. |
| Amount is included on the Statements of Operations as Income from securities lending (net) (after payments of rebates and Citibank’s fee). |
|
For the year ended June 30, 2023 |
| | | | | Change in
Unrealized
Appreciation/
(Depreciation) | | | | Capital Gain
Distributions |
JPMorgan Prime Money Market Fund Class IM Shares, 5.23% (a) (b) | | | | | | | | | |
JPMorgan Securities Lending Money Market Fund Agency SL Class Shares, 5.29% (a) (b) | | | | | | | | | |
JPMorgan U.S. Government Money Market Fund Class IM Shares, 5.05% (a) (b) | | | | | | | | | |
| | | | | | | | | |
|
| Investment in an affiliated fund, which is registered under the Investment Company Act of 1940, as amended, and is advised by J.P. Morgan Investment Management Inc. |
| The rate shown is the current yield as of June 30, 2023. |
| Amount rounds to less than one thousand. |
| J.P. Morgan Large Cap Funds | |
| Amount is included on the Statements of Operations as Income from securities lending (net) (after payments of rebates and Citibank’s fee). |
|
For the year ended June 30, 2023 |
| | | | | Change in
Unrealized
Appreciation/
(Depreciation) | | | | Capital Gain
Distributions |
JPMorgan Prime Money Market Fund Class IM Shares, 5.23% (a) (b) | | | | | | | | | |
JPMorgan U.S. Government Money Market Fund Class IM Shares, 5.05% (a) (b) | | | | | | | | | |
| | | | | | | | | |
|
| Investment in an affiliated fund, which is registered under the Investment Company Act of 1940, as amended, and is advised by J.P. Morgan Investment Management Inc. |
| The rate shown is the current yield as of June 30, 2023. |
| Amount is included on the Statements of Operations as Income from securities lending (net) (after payments of rebates and Citibank’s fee). |
U.S. Large Cap Core Plus Fund |
For the year ended June 30, 2023 |
| | | | | Change in
Unrealized
Appreciation/
(Depreciation) | | | | Capital Gain
Distributions |
JPMorgan Prime Money Market Fund Class IM Shares, 5.23% (a) (b) | | | | | | | | | |
|
| Investment in an affiliated fund, which is registered under the Investment Company Act of 1940, as amended, and is advised by J.P. Morgan Investment Management Inc. |
| The rate shown is the current yield as of June 30, 2023. |
| Amount rounds to less than one thousand. |
U.S. Research Enhanced Equity Fund |
For the year ended June 30, 2023 |
| | | | | Change in
Unrealized
Appreciation/
(Depreciation) | | | | Capital Gain
Distributions |
JPMorgan Prime Money Market Fund Class IM Shares, 5.23% (a) (b) | | | | | | | | | |
|
| Investment in an affiliated fund, which is registered under the Investment Company Act of 1940, as amended, and is advised by J.P. Morgan Investment Management Inc. |
| The rate shown is the current yield as of June 30, 2023. |
| J.P. Morgan Large Cap Funds | |
NOTES TO FINANCIAL STATEMENTS
AS OF June 30, 2023 (continued)
(Dollar values in thousands)
U.S. Sustainable Leaders Fund |
For the year ended June 30, 2023 |
| | | | | Change in
Unrealized
Appreciation/
(Depreciation) | | | | Capital Gain
Distributions |
JPMorgan Prime Money Market Fund Class IM Shares, 5.23% (a) (b) | | | | | | | | | |
JPMorgan U.S. Government Money Market Fund Class IM Shares, 5.05% (a) (b) | | | | | | | | | |
| | | | | | | | | |
|
| Investment in an affiliated fund, which is registered under the Investment Company Act of 1940, as amended, and is advised by J.P. Morgan Investment Management Inc. |
| The rate shown is the current yield as of June 30, 2023. |
| Amount rounds to less than one thousand. |
| Amount is included on the Statements of Operations as Income from securities lending (net) (after payments of rebates and Citibank’s fee). |
|
For the year ended June 30, 2023 |
| | | | | Change in
Unrealized
Appreciation/
(Depreciation) | | | | Capital Gain
Distributions |
JPMorgan Prime Money Market Fund Class IM Shares, 5.23% (a) (b) | | | | | | | | | |
JPMorgan Securities Lending Money Market Fund Agency SL Class Shares, 5.29% (a) (b) | | | | | | | | | |
JPMorgan U.S. Government Money Market Fund Class IM Shares, 5.05% (a) (b) | | | | | | | | | |
| | | | | | | | | |
|
| Investment in an affiliated fund, which is registered under the Investment Company Act of 1940, as amended, and is advised by J.P. Morgan Investment Management Inc. |
| The rate shown is the current yield as of June 30, 2023. |
| Amount rounds to less than one thousand. |
| Amount is included on the Statements of Operations as Income from securities lending (net) (after payments of rebates and Citibank’s fee). |
E. Foreign Currency Translation — The books and records of the Funds are maintained in U.S. dollars. Foreign currency amounts are translated into U.S. dollars at the prevailing exchange rates of such currencies against the U.S. dollar. The market value of investment securities and other assets and liabilities are translated at the exchange rate as of the valuation date. Purchases and sales of investment securities, income and expenses are translated at the exchange rate prevailing on the respective dates of such transactions.
The Funds do not isolate the effect of changes in foreign exchange rates from changes in market prices on securities held. Accordingly, such changes are included within Change in net unrealized appreciation/depreciation on investments in non-affiliates on the Statements of Operations.
Reported realized foreign currency gains and losses arise from the disposition of foreign currency, currency gains or losses realized between the trade and settlement dates on securities transactions, and the difference between the amounts of dividends, interest and foreign withholding taxes recorded on each Fund's books on the transaction date and the U.S. dollar equivalent of the amounts actually received or paid. These reported realized foreign currency gains and losses are included in Net realized gain (loss) on foreign currency transactions on the Statements of Operations. Unrealized foreign currency gains and losses arise from changes (due to changes in exchange rates) in the value of foreign currency and other assets and liabilities denominated in foreign currencies, which are held at year end and are included in Change in net unrealized appreciation/depreciation on foreign currency translations on the Statements of Operations.
| J.P. Morgan Large Cap Funds | |
F. Options— Hedged Equity Fund, Hedged Equity 2 Fund and Hedged Equity 3 Fund purchased and sold (“wrote”) put and call options on various instruments including options on indices to manage and hedge interest rate risks within their portfolios and also to gain long or short exposure to the underlying instrument, index, currency or rate. A purchaser of a put option has the right, but not the obligation, to sell the underlying instrument at an agreed upon price (“strike price”) to the option seller. A purchaser of a call option has the right, but not the obligation, to purchase the underlying instrument at the strike price from the option seller.
Options Purchased— Premiums paid by the Funds for options purchased are included on the Statements of Assets and Liabilities as Options purchased. The option is adjusted daily to reflect the current market value of the option and the change is recorded as Change in net unrealized appreciation/depreciation on options purchased on the Statements of Operations. If the option is allowed to expire, the Funds will lose the entire premium they paid and record a realized loss for the premium amount. Premiums paid for options purchased which are exercised or closed are added to the amounts paid or offset against the proceeds on the underlying investment transaction to determine the realized gain (loss) or cost basis of the underlying investment.
Options Written— Premiums received by the Funds for options written are included on the Statements of Assets and Liabilities as a liability. The amount of the liability is adjusted daily to reflect the current market value of the option written and the change in market value is recorded as Change in net unrealized appreciation/depreciation on options written on the Statements of Operations. Premiums received from options written that expire are treated as realized gains. If a written option is closed, the Funds record a realized gain or loss on options written based on whether the cost of the closing transaction exceeds the premium received. If a call option is exercised by the option buyer, the premium received by the Funds is added to the proceeds from the sale of the underlying security to the option buyer and compared to the cost of the closing transaction to determine whether there has been a realized gain or loss. If a put option is exercised by an option buyer, the premium received by the option seller reduces the cost basis of the purchased security.
The Funds pledge collateral to the counterparty in the form of securities for options written. Securities designated as collateral are denoted on the SOIs.
Written uncovered call options subject the Funds to unlimited risk of loss. Written covered call options limit the upside potential of a security above the strike price. Written put options subject the Funds to risk of loss if the value of the security declines below the exercise price minus the put premium.
The Funds are not subject to credit risk on options written as the counterparty has already performed its obligation by paying the premium at the inception of the contract.
The Funds’ exchange-traded option contracts are not subject to master netting arrangements (the right to close out all transactions traded with a counterparty and net amounts owed or due across transactions).
G. Futures Contracts — Equity Index Fund, Equity Premium Income Fund, Hedged Equity Fund, Hedged Equity 2 Fund, Hedged Equity 3 Fund, U.S. Applied Data Science Value Fund, U.S. Equity Fund, U.S. GARP Equity Fund, U.S. Large Cap Core Plus Fund, U.S. Research Enhanced Equity Fund and U.S. Sustainable Leaders Fund used index futures contracts to gain or reduce exposure to the stock market, or maintain liquidity or minimize transaction costs. The Funds also purchased futures contracts to invest incoming cash in the market or sold futures in response to cash outflows, thereby simulating an invested position in the underlying index while maintaining a cash balance for liquidity.
Futures contracts provide for the delayed delivery of the underlying instrument at a fixed price or are settled for a cash amount based on the change in the value of the underlying instrument at a specific date in the future. Upon entering into a futures contract, the Funds are required to deposit with the broker, cash or securities in an amount equal to a certain percentage of the contract amount, which is referred to as the initial margin deposit. Subsequent payments, referred to as variation margin, are made or received by the Funds periodically and are based on changes in the market value of open futures contracts. Changes in the market value of open futures contracts are recorded as Change in net unrealized appreciation/depreciation on futures contracts on the Statements of Operations. Realized gains or losses, representing the difference between the value of the contract at the time it was opened and the value at the time it was closed, are reported on the Statements of Operations at the closing or expiration of the futures contract. Securities deposited as initial margin are designated on the SOIs, while cash deposited, which is considered restricted, is recorded on the Statements of Assets and Liabilities. A receivable from and/or a payable to brokers for the daily variation margin is also recorded on the Statements of Assets and Liabilities.
The use of futures contracts exposes the Funds to equity price risk. The Funds may be subject to the risk that the change in the value of the futures contract may not correlate perfectly with the underlying instrument. Use of long futures contracts subjects the Funds to risk of loss in excess of the amounts shown on the Statements of Assets and Liabilities, up to the notional amount of the futures contracts. Use of short futures contracts subjects the Funds to unlimited risk of loss. The Funds may enter into futures contracts only on exchanges or boards of trade. The exchange or board of trade acts as the counterparty to each futures transaction; therefore, the Funds' credit risk is limited to failure of the exchange or board of trade. Under some circumstances, futures exchanges may establish daily limits on the amount that the price of a futures contract can vary from the previous day’s settlement price, which could effectively prevent liquidation of positions.
The Funds' futures contracts are not subject to master netting arrangements (the right to close out all transactions traded with a counterparty and net amounts owed or due across transactions).
| J.P. Morgan Large Cap Funds | |
NOTES TO FINANCIAL STATEMENTS
AS OF June 30, 2023 (continued)
(Dollar values in thousands)
H. Summary of Derivatives Information
Derivatives Volume
The table below discloses the volume of the Funds' options and futures contracts activity during the year ended June 30, 2023. Please refer to the tables in the Summary of Derivatives Information for derivative-related gains and losses associated with volume activity (amounts in thousands, except number of contracts):
| | Equity Premium
Income Fund |
| | |
Average Notional Balance Long | | |
Average Notional Balance Short | | |
Ending Notional Balance Long | | |
| | | |
| | | |
Average Notional Balance Long | | | |
Ending Notional Balance Long | | | |
| | | |
Average Number of Contracts Purchased | | | |
Average Number of Contracts Written | | | |
Ending Number of Contracts Purchased | | | |
Ending Number of Contracts Written | | | |
| U.S.
Applied Data
Science
Value Fund | | |
| | | |
Average Notional Balance Long | | | |
Ending Notional Balance Long | | | |
| U.S.
Large Cap
Core Plus
Fund | U.S.
Research
Enhanced
Equity
Fund | U.S.
Sustainable
Leaders
Fund |
| | | |
Average Notional Balance Long | | | |
Ending Notional Balance Long | | | |
The Funds' derivatives contracts held at June 30, 2023 are not accounted for as hedging instruments under GAAP.
I. Equity-Linked Notes — Equity Premium Income Fund invested in Equity-Linked Notes (“ELNs”). These are hybrid instruments which combine both debt and equity characteristics into a single note form. ELNs' values are linked to the performance of an underlying index. ELNs are unsecured debt obligations of an issuer and may not be publicly listed or traded on an exchange. ELNs are valued daily, under procedures adopted by the Board, based on values provided by an approved pricing source. These notes have a coupon which is accrued and recorded as interest income on the Statements of Operations. Changes in the market value of ELNs are recorded as Change in net unrealized appreciation or depreciation on the Statements of Operations. The Fund realizes a gain or loss when an ELN is sold or matures, which is recorded as Net realized gain (loss) on transactions from investments in non-affiliates on the Statements of Operations.
As of June 30, 2023, Equity Premium Income Fund had outstanding ELNs as listed on the SOIs.
J. Short Sales — U.S. Large Cap Core Plus Fund engaged in short sales as part of its normal investment activities. In a short sale, the Fund sells securities it does not own in anticipation of a decline in the market value of those securities. In order to deliver securities to the purchaser, the Fund borrows securities from a broker. To close out a short position, the Fund delivers the same securities to the broker.
The Fund is required to pledge cash or securities to the broker as collateral for the securities sold short. Collateral requirements are calculated daily based on the current market value of the short positions. Cash collateral deposited with the broker is recorded as Deposits at broker for securities sold short, while cash collateral deposited at the Fund's custodian for the benefit of the broker is recorded as Restricted cash for securities sold short on the Statements of Assets and Liabilities. Securities segregated as collateral are denoted on the SOIs. The Fund may receive or pay the net of
| J.P. Morgan Large Cap Funds | |
the following amounts: (i) a portion of the income from the investment of cash collateral; (ii) the broker’s fee on the borrowed securities (calculated daily based upon the market value of each borrowed security and a variable rate that is dependent on availability of the security); and (iii) a financing charge for the difference between the market value of the short position and cash collateral deposited with the broker. The net amounts of income or fees are included as interest income or interest expense on securities sold short on the Statements of Operations.
The Fund is obligated to pay the broker dividends declared on short positions when a position is open on the record date. Dividends on short positions are reported on ex-dividend date on the Statements of Operations as Dividend expense on securities sold short. The Fund is obligated to pay the broker interest accrued on short positions while the position is outstanding. Interest expense on short positions is reported as Interest expense to non-affiliates on securities sold short on the Statements of Operations. Liabilities for securities sold short are reported at market value on the Statements of Assets and Liabilities and the change in market value is recorded as Change in net unrealized appreciation/depreciation on the Statements of Operations. Short sale transactions may result in unlimited losses as the security’s price increases and the short position loses value. There is no upward limit on the price a borrowed security could attain. The Fund is also subject to risk of loss if the broker were to fail to perform its obligations under the contractual terms.
The Fund will record a realized loss if the price of the borrowed security increases between the date of the short sale and the date on which the Fund replaces the borrowed security. The Fund will record a realized gain if the price of the borrowed security declines between those dates.
As of June 30, 2023, U.S. Large Cap Core Plus Fund had outstanding short sales as listed on their SOIs.
K. Security Transactions and Investment Income — Investment transactions are accounted for on the trade date (the date the order to buy or sell is executed). Securities gains and losses are calculated on a specifically identified cost basis.
Interest income and interest expense on securities sold short, if any, is determined on the basis of coupon interest accrued using the effective interest method, which adjusts for amortization of premiums and accretion of discounts.
Dividend income and dividend expense on securities sold short, if any, is recorded on the ex-dividend date or when the Funds first learn of the dividend.
To the extent such information is publicly available, the Funds record distributions received in excess of income earned from underlying investments as a reduction of cost of investments and/or realized gain. Such amounts are based on estimates if actual amounts are not available and actual amounts of income, realized gain and return of capital may differ from the estimated amounts. The Funds adjust the estimated amounts of the components of distributions (and consequently their net investment income) as necessary, once the issuers provide information about the actual composition of the distributions.
L. Allocation of Income and Expenses— Expenses directly attributable to a Fund are charged directly to that Fund, while the expenses attributable to more than one fund of the Trusts are allocated among the applicable funds. Investment income, realized and unrealized gains and losses and expenses, other than class-specific expenses, are allocated daily to each class of shares based upon the proportion of net assets of each class at the beginning of each day.
Transfer agency fees are class-specific expenses. The amount of the transfer agency fees charged to each share class of the Funds for the year ended June 30, 2023 are as follows:
| | | | | | | | | | |
| | | | | | | | | | |
| | | | | | | | | | |
| | | | | | | | | | |
| | | | | | | | | | |
Equity Premium Income Fund | | | | | | | | | | |
| | | | | | | | | | |
| | | | | | | | | | |
| | | | | | | | | | |
| | | | | | | | | | |
| | | | | | | | | | |
| | | | | | | | | | |
| | | | | | | | | | |
| | | | | | | | | | |
| | | | | | | | | | |
| | | | | | | | | | |
| | | | | | | | | | |
| J.P. Morgan Large Cap Funds | |
NOTES TO FINANCIAL STATEMENTS
AS OF June 30, 2023 (continued)
(Dollar values in thousands)
| | | | | | | | | | |
U.S. Applied Data Science Value Fund | | | | | | | | | | |
| | | | | | | | | | |
| | | | | | | | | | |
| | | | | | | | | | |
| | | | | | | | | | |
| | | | | | | | | | |
U.S. Large Cap Core Plus Fund | | | | | | | | | | |
| | | | | | | | | | |
U.S. Research Enhanced Equity Fund | | | | | | | | | | |
| | | | | | | | | | |
U.S. Sustainable Leaders Fund | | | | | | | | | | |
| | | | | | | | | | |
| | | | | | | | | | |
| | | | | | | | | | |
|
| Amount rounds to less than one thousand. |
| J.P. Morgan Large Cap Funds | |
M. Federal Income Taxes — Each Fund is treated as a separate taxable entity for Federal income tax purposes. Each Fund's policy is to comply with the provisions of the Internal Revenue Code (the “Code”) applicable to regulated investment companies and to distribute to shareholders all of its distributable net investment income and net realized capital gains on investments. Accordingly, no provision for Federal income tax is necessary. Management has reviewed the Funds' tax positions for all open tax years and has determined that as of June 30, 2023, no liability for Federal income tax is required in the Funds' financial statements for net unrecognized tax benefits. However, management’s conclusions may be subject to future review based on changes in, or the interpretation of, the accounting standards or tax laws and regulations. Each Fund's Federal tax returns for the prior three fiscal years, or since inception if shorter, remain subject to examination by the Internal Revenue Service.
N. Distributions to Shareholders — Distributions from net investment income, if any, are generally declared and paid at least quarterly, except for Large Cap Growth Fund, U.S. GARP Equity Fund, U.S. Large Cap Core Plus Fund and U.S. Sustainable Leaders Fund, for which distributions are generally declared and paid at least annually, Equity Income Fund, for which distributions are generally declared and paid at least monthly, and Equity Premium Income Fund, for which distributions are generally declared daily and paid at least monthly. Distributions are declared separately for each class. No class has preferential dividend rights; differences in per share rates are due to differences in separate class expenses. Net realized capital gains, if any, are distributed by each Fund at least annually. The amount of distributions from net investment income and net realized capital gains is determined in accordance with Federal income tax regulations, which may differ from GAAP. To the extent these “book/tax” differences are permanent in nature (i.e., that they result from other than timing of recognition — “temporary differences”), such amounts are reclassified within the capital accounts based on their Federal tax basis treatment.
The following amounts were reclassified within the capital accounts:
| | Accumulated
undistributed
(distributions in
excess of)
net investment
income | Accumulated
net realized
gains (losses) |
| | | |
| | | |
Equity Premium Income Fund | | | |
| | | |
| | | |
| | | |
| | | |
| | | |
U.S. Applied Data Science Value Fund | | | |
| | | |
U.S. Large Cap Core Plus Fund | | | |
U.S. Research Enhanced Equity Fund | | | |
U.S. Sustainable Leaders Fund | | | |
| | | |
The reclassifications for the Funds relate primarily to tax adjustments on certain investments and tax equalization.
3. Fees and Other Transactions with Affiliates
A. Investment Advisory Fee — Pursuant to an Investment Advisory Agreement, the Adviser manages the investments of each Fund and for such services is paid a fee. The investment advisory fee is accrued daily and paid monthly at an annual rate based on each Fund's respective average daily net assets. The annual rate for each Fund is as follows:
| |
| |
| |
Equity Premium Income Fund | |
| |
| |
| |
| |
| |
| J.P. Morgan Large Cap Funds | |
NOTES TO FINANCIAL STATEMENTS
AS OF June 30, 2023 (continued)
(Dollar values in thousands)
| |
U.S. Applied Data Science Value Fund | |
| |
| |
U.S. Large Cap Core Plus Fund | |
U.S. Research Enhanced Equity Fund | |
U.S. Sustainable Leaders Fund | |
| |
The Adviser waived investment advisory fees and/or reimbursed expenses as outlined in Note 3.F.
B. Administration Fee — Pursuant to an Administration Agreement, the Administrator provides certain administration services to each Fund. In consideration of these services, the Administrator receives a fee accrued daily and paid monthly at an annual rate of 0.075% of the first $10 billion of each Fund's respective average daily net assets, plus 0.050% of each Fund's respective average daily net assets between $10 billion and $20 billion, plus 0.025% of each Fund's respective average daily net assets between $20 billion and $25 billion, plus 0.01% of each Fund's respective average daily net assets in excess of $25 billion. For the year ended June 30, 2023, the effective annualized rate for Equity Income Fund, Equity Index Fund, Equity Premium Income Fund, Hedged Equity Fund, Hedged Equity 2 Fund, Hedged Equity 3 Fund, Large Cap Growth Fund, Large Cap Value Fund, U.S. Applied Data Science Value Fund, U.S. Equity Fund, U.S. GARP Equity Fund, U.S. Large Cap Core Plus Fund, U.S. Research Enhanced Equity Fund, U.S. Sustainable Leaders Fund and U.S. Value Fund was 0.03%, 0.075%, 0.075%, 0.07%, 0.075%, 0.075%, 0.04%, 0.075%, 0.075%, 0.06%, 0.075%, 0.075%, 0.075%, 0.075% and 0.075%, respectively, of each Fund’s average daily net assets, notwithstanding any fee waivers and/or expense reimbursements.
The Administrator waived administration fees as outlined in Note 3.F.
JPMorgan Chase Bank, N.A. ("JPMCB"), a wholly-owned subsidiary of JPMorgan, serves as the Funds' sub-administrator (the “Sub-administrator”). For its services as Sub-administrator, JPMCB receives a portion of the fees payable to the Administrator.
C. Distribution Fees — Pursuant to a Distribution Agreement, JPMorgan Distribution Services, Inc. (“JPMDS”), an indirect, wholly-owned subsidiary of JPMorgan, serves as each Fund's principal underwriter and promotes and arranges for the sale of each Fund's shares.
The Boards have adopted a Distribution Plan (the “Distribution Plan”) for Class A, Class C, Class R2 and Class R3 Shares of the Funds, as applicable, pursuant to Rule 12b-1 under the 1940 Act. Class I, Class L, Class R4, Class R5 and Class R6 Shares of the Funds do not charge a distribution fee. The Distribution Plan provides that each Fund shall pay, with respect to the applicable share classes, distribution fees, including payments to JPMDS, at annual rates of the average daily net assets as shown in the table below:
| | | | |
| | | | |
| | | | |
Equity Premium Income Fund | | | | |
| | | | |
| | | | |
| | | | |
| | | | |
| | | | |
U.S. Applied Data Science Value Fund | | | | |
| | | | |
| | | | |
U.S. Large Cap Core Plus Fund | | | | |
U.S. Research Enhanced Equity Fund | | | | |
U.S. Sustainable Leaders Fund | | | | |
| | | | |
In addition, JPMDS is entitled to receive the front-end sales charges from purchases of Class A Shares and the CDSC from redemptions of Class C Shares and certain Class A Shares for which front-end sales charges have been waived. For the year ended June 30, 2023, JPMDS retained the following:
| J.P. Morgan Large Cap Funds | |
| | |
Equity Premium Income Fund | | |
| | |
| | |
| | |
| | |
| | |
U.S. Applied Data Science Value Fund | | |
| | |
| | |
U.S. Large Cap Core Plus Fund | | |
U.S. Research Enhanced Equity Fund | | |
U.S. Sustainable Leaders Fund | | |
| | |
|
| Amount rounds to less than one thousand. |
D. Service Fees — The Trusts, on behalf of the Funds, have entered into a Shareholder Servicing Agreement with JPMDS under which JPMDS provides certain support services to fund shareholders. For performing these services, JPMDS receives a fee with respect to all share classes, except Class R6 Shares which do not charge a service fee, that is accrued daily and paid monthly equal to a percentage of the average daily net assets as shown in the table below:
| | | | | | | | |
| | | | | | | | |
| | | | | | | | |
Equity Premium Income Fund | | | | | | | | |
| | | | | | | | |
| | | | | | | | |
| | | | | | | | |
| | | | | | | | |
| | | | | | | | |
U.S. Applied Data Science Value Fund | | | | | | | | |
| | | | | | | | |
| | | | | | | | |
U.S. Large Cap Core Plus Fund | | | | | | | | |
U.S. Research Enhanced Equity Fund | | | | | | | | |
U.S. Sustainable Leaders Fund | | | | | | | | |
| | | | | | | | |
JPMDS has entered into shareholder services contracts with affiliated and unaffiliated financial intermediaries who provide shareholder services and other related services to their clients or customers who invest in the Funds. Pursuant to such contracts, JPMDS will pay all or a portion of such fees earned to financial intermediaries for performing such services.
JPMDS waived service fees as outlined in Note 3.F.
E. Custodian and Accounting Fees — JPMCB provides portfolio custody and accounting services to the Funds. For performing these services, the Funds pay JPMCB transaction and asset-based fees that vary according to the number of transactions and positions, plus out-of-pocket expenses. The amounts paid directly to JPMCB by the Funds for custody and accounting services are included in Custodian and accounting fees on the Statements of Operations.
Interest income earned on cash balances at the custodian, if any, is included in Interest income from affiliates on the Statements of Operations.
Interest expense paid to the custodian related to cash overdrafts, if any, is included in Interest expense to affiliates on the Statements of Operations.
| J.P. Morgan Large Cap Funds | |
NOTES TO FINANCIAL STATEMENTS
AS OF June 30, 2023 (continued)
(Dollar values in thousands)
F. Waivers and Reimbursements —The Adviser, Administrator and/or JPMDS have contractually agreed to waive fees and/or reimburse the Funds to the extent that total annual operating expenses (excluding acquired fund fees and expenses other than certain money market fund fees as described below, dividend and interest expenses related to short sales, interest, taxes, expenses related to litigation and potential litigation, expenses related to trustee elections and extraordinary expenses) exceed the percentages of the Funds' respective average daily net assets as shown in the table below:
| | | | | | | | |
| | | | | | | | |
Equity Premium Income Fund | | | | | | | | |
| | | | | | | | |
| | | | | | | | |
| | | | | | | | |
| | | | | | | | |
| | | | | | | | |
U.S. Applied Data Science Value Fund | | | | | | | | |
| | | | | | | | |
| | | | | | | | |
U.S. Large Cap Core Plus Fund | | | | | | | | |
U.S. Research Enhanced Equity Fund | | | | | | | | |
U.S. Sustainable Leaders Fund | | | | | | | | |
| | | | | | | | |
|
| Effective November 1, 2022, the contractual expense limitations changed from 1.10%, 1.60%, 0.85%, 1.45%, 0.80% and 0.70% for Class A, Class C, Class I, Class R2, Class R5 and Class R6 Shares, respectively. |
The expense limitation agreements were in effect for the year ended June 30, 2023 and the contractual expense limitation percentages in the table above are in place until at least October 31, 2024.
For the year ended June 30, 2023, the Funds' service providers waived fees and/or reimbursed expenses for each of the Funds as follows. None of these parties expect the Funds to repay any such waived fees and/or reimbursed expenses in future years.
| | |
| | | | | Contractual
Reimbursements |
| | | | | |
| | | | | |
Equity Premium Income Fund | | | | | |
| | | | | |
| | | | | |
| | | | | |
| | | | | |
U.S. Applied Data Science Value Fund | | | | | |
| | | | | |
| | | | | |
U.S. Large Cap Core Plus Fund | | | | | |
U.S. Research Enhanced Equity Fund | | | | | |
U.S. Sustainable Leaders Fund | | | | | |
| | | | | |
For the year ended June 30, 2023, the Hedged Equity Fund's service providers did not have any waived fees or reimbursed expenses.
| J.P. Morgan Large Cap Funds | |
Additionally, the Funds may invest in one or more money market funds advised by the Adviser (affiliated money market funds). The Adviser, Administrator and/or JPMDS, as shareholder servicing agent, have contractually agreed to waive fees and/or reimburse expenses in an amount sufficient to offset the respective net fees each collects from the affiliated money market fund on the applicable Fund’s investment in such affiliated money market fund, except for investments of securities lending cash collateral. None of these parties expect the Funds to repay any such waived fees and/ or reimbursed expenses in future years.
The amounts of these waivers resulting from investments in these money market funds for the year ended June 30, 2023 were as follows:
| |
| |
| |
Equity Premium Income Fund | |
| |
| |
| |
| |
| |
U.S. Applied Data Science Value Fund | |
| |
| |
U.S. Large Cap Core Plus Fund | |
U.S. Research Enhanced Equity Fund | |
U.S. Sustainable Leaders Fund | |
| |
JPMIM voluntarily agreed to reimburse the Funds for the Trustee Fees paid to one of the interested Trustees. For the year ended June 30, 2023, the amount of these reimbursements were as follows:
| |
| |
| |
Equity Premium Income Fund | |
| |
| |
| |
| |
| |
U.S. Applied Data Science Value Fund | |
| |
| |
U.S. Large Cap Core Plus Fund | |
U.S. Research Enhanced Equity Fund | |
U.S. Sustainable Leaders Fund | |
| |
G. Other — Certain officers of the Trusts are affiliated with the Adviser, the Administrator and JPMDS. Such officers, with the exception of the Chief Compliance Officer, receive no compensation from the Funds for serving in their respective roles.
The Boards designated and appointed a Chief Compliance Officer to the Funds pursuant to Rule 38a-1 under the 1940 Act. Each Fund, along with affiliated funds, makes reimbursement payments, on a pro-rata basis, to the Administrator for a portion of the fees associated with the office of the Chief Compliance Officer. Such fees are included in Trustees’ and Chief Compliance Officer’s fees on the Statements of Operations.
The Trusts adopted a Trustee Deferred Compensation Plan (the “Plan”) which allows the independent Trustees to defer the receipt of all or a portion of compensation related to performance of their duties as Trustees. The deferred fees are invested in various J.P. Morgan Funds until distribution in accordance with the Plan.
| J.P. Morgan Large Cap Funds | |
NOTES TO FINANCIAL STATEMENTS
AS OF June 30, 2023 (continued)
(Dollar values in thousands)
During the year ended June 30, 2023, Equity Premium Income Fund, Hedged Equity Fund, Hedged Equity 2 Fund, Hedged Equity 3 Fund, Large Cap Value Fund, U.S. Large Cap Core Plus Fund and U.S. Research Enhanced Equity Fund purchased securities from an underwriting syndicate in which the principal underwriter or members of the syndicate were affiliated with the Adviser.
4. Investment Transactions
During the year ended June 30, 2023, purchases and sales of investments (excluding short-term investments) were as follows:
| Purchases
(excluding
U.S. Government) | Sales
(excluding
U.S. Government) | | Covers on
Securities
Sold Short |
| | | | |
| | | | |
Equity Premium Income Fund | | | | |
| | | | |
| | | | |
| | | | |
| | | | |
| | | | |
U.S. Applied Data Science Value Fund | | | | |
| | | | |
| | | | |
U.S. Large Cap Core Plus Fund | | | | |
U.S. Research Enhanced Equity Fund | | | | |
U.S. Sustainable Leaders Fund | | | | |
| | | | |
5. Federal Income Tax Matters
For Federal income tax purposes, the estimated cost and unrealized appreciation (depreciation) in value of investments held at June 30, 2023 were as follows:
| | Gross
Unrealized
Appreciation | Gross
Unrealized
Depreciation | Net Unrealized
Appreciation
(Depreciation) |
| | | | |
| | | | |
Equity Premium Income Fund | | | | |
| | | | |
| | | | |
| | | | |
| | | | |
| | | | |
U.S. Applied Data Science Value Fund | | | | |
| | | | |
| | | | |
U.S. Large Cap Core Plus Fund * | | | | |
U.S. Research Enhanced Equity Fund | | | | |
U.S. Sustainable Leaders Fund | | | | |
| | | | |
|
| The tax cost includes the proceeds from short sales which may result in a net negative cost. |
The difference between book and tax basis appreciation (depreciation) on investments is primarily attributed to certain derivatives and wash sale loss deferrals.
| J.P. Morgan Large Cap Funds | |
The tax character of distributions paid during the year ended June 30, 2023 was as follows:
| | Net
Long-Term
Capital Gains | |
| | | |
| | | |
Equity Premium Income Fund | | | |
| | | |
| | | |
| | | |
| | | |
| | | |
U.S. Applied Data Science Value Fund | | | |
| | | |
| | | |
U.S. Large Cap Core Plus Fund | | | |
U.S. Research Enhanced Equity Fund | | | |
U.S. Sustainable Leaders Fund | | | |
| | | |
|
| Short-term gain distributions are treated as ordinary income for income tax purposes. |
The tax character of distributions paid during the year ended June 30, 2022 was as follows:
| | Net
Long-Term
Capital Gains | |
| | | |
| | | |
Equity Premium Income Fund | | | |
| | | |
| | | |
| | | |
| | | |
| | | |
U.S. Applied Data Science Value Fund | | | |
| | | |
| | | |
U.S. Large Cap Core Plus Fund | | | |
U.S. Research Enhanced Equity Fund | | | |
U.S. Sustainable Leaders Fund | | | |
| | | |
|
| Short-term gain distributions are treated as ordinary income for income tax purposes. |
| J.P. Morgan Large Cap Funds | |
NOTES TO FINANCIAL STATEMENTS
AS OF June 30, 2023 (continued)
(Dollar values in thousands)
As of June 30, 2023, the estimated components of net assets (excluding paid-in-capital) on a tax basis were as follows:
| Current
Distributable
Ordinary
Income | Current
Distributable
Long-Term
Capital Gain
(Tax Basis Capital
Loss Carryover) | Unrealized
Appreciation
(Depreciation) |
| | | |
| | | |
Equity Premium Income Fund | | | |
| | | |
| | | |
| | | |
| | | |
| | | |
U.S. Applied Data Science Value Fund | | | |
| | | |
| | | |
U.S. Large Cap Core Plus Fund | | | |
U.S. Research Enhanced Equity Fund | | | |
U.S. Sustainable Leaders Fund | | | |
| | | |
The cumulative timing differences primarily consist of certain derivatives, post-October capital loss deferrals and wash sale loss deferrals.
As of June 30, 2023, the following Funds had net capital loss carryforwards which are available to offset future realized gains:
| Capital Loss Carryforward Character |
| | |
| | |
Equity Premium Income Fund | | |
| | |
| | |
| | |
| | |
| | |
U.S. Sustainable Leaders Fund | | |
| | |
| J.P. Morgan Large Cap Funds | |
Net capital losses (gains) and specified ordinary losses incurred after October 31 and late year ordinary losses incurred after December 31 and within the taxable year are deemed to arise on the first business day of the Funds' next taxable year. For the year ended June 30, 2023, the following Funds deferred to July 1, 2023 the following net capital losses (gains), specified ordinary losses and late year ordinary losses of:
| Net Capital Losses (Gains) |
| | |
| | |
| | |
Equity Premium Income Fund | | |
| | |
| | |
| | |
| | |
| | |
U.S. Large Cap Core Plus Fund | | |
U.S. Research Enhanced Equity Fund | | |
U.S. Sustainable Leaders Fund | | |
| | |
6. Borrowings
The Funds rely upon an exemptive order granted by the SEC (the “Order”) permitting the establishment and operation of an Interfund Lending Facility (the “Facility”). The Facility allows the Funds to directly lend and borrow money to or from any other fund relying upon the Order at rates beneficial to both the borrowing and lending funds. Advances under the Facility are taken primarily for temporary or emergency purposes, including the meeting of redemption requests that otherwise might require the untimely disposition of securities, and are subject to each Fund's borrowing restrictions. The interfund loan rate is determined, as specified in the Order, by averaging the current repurchase agreement rate and the current bank loan rate. The Order was granted to JPM II and may be relied upon by the Funds because the Funds and the series of JPM II are all investment companies in the same “group of investment companies” (as defined in Section 12(d)(1)(G) of the 1940 Act).
The Funds had no borrowings outstanding from another fund as of June 30, 2023. Average borrowings from the Facility for the year ended June 30, 2023, were as follows:
The Trusts and JPMCB have entered into a financing arrangement. Under this arrangement, JPMCB provides an unsecured, uncommitted credit facility in the aggregate amount of $100 million to certain of the J.P. Morgan Funds, including the Funds. Advances under the arrangement are taken primarily for temporary or emergency purposes, including the meeting of redemption requests that otherwise might require the untimely disposition of securities, and are subject to each Fund's borrowing restrictions. Interest on borrowings is payable at a rate determined by JPMCB at the time of borrowing. This agreement has been extended until October 30, 2023.
The Funds had no borrowings outstanding from the unsecured, uncommitted credit facility during the year ended June 30, 2023.
The Trusts, along with certain other trusts for J.P. Morgan Funds (“Borrowers”), have entered into a joint syndicated senior unsecured revolving credit facility totaling $1.5 billion (“Credit Facility”) with various lenders and The Bank of New York Mellon, as administrative agent for the lenders. This Credit Facility provides a source of funds to the Borrowers for temporary and emergency purposes, including the meeting of redemption requests that otherwise might require the untimely disposition of securities. Under the terms of the Credit Facility, a borrowing fund must have a minimum of $25 million in adjusted net asset value and not exceed certain adjusted net asset coverage ratios prior to and during the time in which any borrowings are outstanding. If a fund does not comply with the aforementioned requirements, the fund must remediate within three business days with respect to the $25 million minimum adjusted net asset value or within one business day with respect to certain asset coverage ratios or the administrative agent at the request of, or with the consent of, the lenders may terminate the Credit Facility and declare any outstanding borrowings to be due and payable immediately.
Interest associated with any borrowing under the Credit Facility is charged to the borrowing fund at a rate of interest equal to 1.00% (the "Applicable Margin"), plus the greater on the day of the borrowing, of the federal funds effective rate, or the Adjusted Daily Simple SOFR Rate. Prior to August 9, 2022, interest associated with any borrowing under the Credit Facility was charged to the borrowing fund at a rate of interest equal to the Applicable
| J.P. Morgan Large Cap Funds | |
NOTES TO FINANCIAL STATEMENTS
AS OF June 30, 2023 (continued)
(Dollar values in thousands)
Margin, plus the greater of the federal funds effective rate or one month London Interbank Offered Rate ("LIBOR"). Effective August 8, 2023, the Credit Facility was amended and restated for a term of 364 days, unless extended.
The Funds did not utilize the Credit Facility during the year ended June 30, 2023.
7. Risks, Concentrations and Indemnifications
In the normal course of business, the Funds enter into contracts that contain a variety of representations which provide general indemnifications. Each Fund's maximum exposure under these arrangements is unknown. The amount of exposure would depend on future claims that may be brought against each Fund. However, based on experience, the Funds expect the risk of loss to be remote.
As of June 30, 2023, the Funds had individual shareholder and/or omnibus accounts each owning more than 10% of the respective Fund's outstanding shares as follows:
| Number of
Individual Shareholder
and/or Affiliated
Omnibus Accounts | | Number of
Individual Shareholder
and/or Non-Affiliated
Omnibus Accounts | |
| | | | |
| | | | |
Equity Premium Income Fund | | | | |
| | | | |
| | | | |
| | | | |
| | | | |
| | | | |
U.S. Applied Data Science Value Fund | | | | |
| | | | |
| | | | |
U.S. Large Cap Core Plus Fund | | | | |
U.S. Research Enhanced Equity Fund | | | | |
U.S. Sustainable Leaders Fund | | | | |
| | | | |
As of June 30, 2023, J.P. Morgan Investor Funds, JPMorgan SmartRetirement Funds and JPMorgan SmartRetirement Blend Funds, which are affiliated fund of funds, each owned in the aggregate, shares representing more than 10% of the net assets of the Funds as follows:
| | JPMorgan
SmartRetirement
Funds | JPMorgan
SmartRetirement
Blend Funds |
| | | |
| | | |
| | | |
| | | |
U.S. Research Enhanced Equity Fund | | | |
Equity Premium Income Fund’s investments in ELNs entail varying degrees of risks. The Fund is subject to loss of their full principal amount. In addition, the ELNs are subject to a stated maximum return which may limit the payment at maturity. The Fund may also be exposed to additional risks associated with structured notes including: counterparty credit risk related to the issuer’s ability to make payment at maturity; liquidity risk related to a lack of liquid market for these notes, preventing the Fund from trading or selling the notes easily; and a greater degree of market risk than other types of debt securities because the investor bears the risk associated with the underlying financial instruments.
LIBOR was a leading floating rate benchmark used in loans, notes, derivatives and other instruments or investments. As a result of benchmark reforms, publication of most LIBOR settings has ceased. Some LIBOR settings continue to be published but only on a temporary, synthetic and non-representative basis. Regulated entities have generally ceased entering into new LIBOR contracts in connection with regulatory guidance or prohibitions. Public and private sector actors have worked to establish alternative reference rates to be used in place of LIBOR. There is no assurance that any such alternative reference rate will be similar to or produce the same value or economic equivalence as LIBOR or that it will have the same volume or liquidity as did LIBOR which may affect the value, volatility, liquidity or return on certain of the Funds' loans, notes, derivatives and
| J.P. Morgan Large Cap Funds | |
other instruments or investments comprising some or all of the Funds' investments and result in costs incurred in connection with changing reference rates used for positions, closing out positions and entering into new trades. Certain of the Funds' investments may have transitioned from LIBOR or will transition from LIBOR in the future. The transition from LIBOR to alternative reference rates may result in operational issues for the Funds or their investments. No assurances can be given as to the impact of the LIBOR transition (and the timing of any such impact) on the Funds and their investments.
The Funds are subject to infectious disease epidemics/pandemics risk. For example, the outbreak of COVID-19 negatively affected economies, markets and individual companies throughout the world, including those in which the Funds invest. The effects of this, or any future, pandemic to public health and business and market conditions may have a significant negative impact on the performance of a Fund's investments, increase a Fund's volatility, exacerbate other pre-existing political, social and economic risks to the Funds and negatively impact broad segments of businesses and populations. In addition, governments, their regulatory agencies, or self-regulatory organizations have taken or may take actions in response to a pandemic that affect the instruments in which the Funds invest, or the issuers of such instruments, in ways that could have a significant negative impact on a Fund’s investment performance. The ultimate impact of any pandemic and the extent to which the associated conditions and governmental responses impact a Fund will also depend on future developments, which are highly uncertain, difficult to accurately predict and subject to frequent changes.
| J.P. Morgan Large Cap Funds | |
REPORT OF INDEPENDENT REGISTERED PUBLIC ACCOUNTING FIRM
To the Board of Trustees of JPMorgan Trust I, JPMorgan Trust II and JPMorgan Trust IV and Shareholders of JPMorgan Equity Income Fund, JPMorgan Equity Index Fund, JPMorgan Equity Premium Income Fund, JPMorgan Hedged Equity Fund, JPMorgan Hedged Equity 2 Fund, JPMorgan Hedged Equity 3 Fund, JPMorgan Large Cap Growth Fund, JPMorgan Large Cap Value Fund, JPMorgan U.S. Applied Data Science Value Fund, JPMorgan U.S. Equity Fund, JPMorgan U.S. GARP Equity Fund, JPMorgan U.S. Large Cap Core Plus Fund, JPMorgan U.S. Research Enhanced Equity Fund, JPMorgan U.S. Sustainable Leaders Fund and JPMorgan U.S. Value Fund
Opinions on the Financial Statements
We have audited the accompanying statements of assets and liabilities, including the schedules of portfolio investments, of JPMorgan Hedged Equity Fund, JPMorgan U.S. Applied Data Science Value Fund, JPMorgan U.S. Equity Fund, JPMorgan U.S. GARP Equity Fund, JPMorgan U.S. Large Cap Core Plus Fund, JPMorgan U.S. Research Enhanced Equity Fund, JPMorgan U.S. Sustainable Leaders Fund and JPMorgan U.S. Value Fund (eight of the funds constituting JPMorgan Trust I), JPMorgan Equity Income Fund, JPMorgan Equity Index Fund, JPMorgan Large Cap Growth Fund and JPMorgan Large Cap Value Fund (four of the funds constituting JPMorgan Trust II) and JPMorgan Equity Premium Income Fund, JPMorgan Hedged Equity 2 Fund and JPMorgan Hedged Equity 3 Fund (three of the funds constituting JPMorgan Trust IV) (hereafter collectively referred to as the “Funds”) as of June 30, 2023, the related statements of operations and cash flows for JPMorgan U.S. Large Cap Core Plus Fund for the year ended June 30, 2023, the statements of changes in net assets for each of the two years in the period ended June 30, 2023, including the related notes, and the financial highlights for each of the periods indicated therein (collectively referred to as the “financial statements”). In our opinion, the financial statements present fairly, in all material respects, the financial position of each of the Funds as of June 30, 2023, the results of each of their operations and its cash flows for JPMorgan U.S. Large Cap Core Plus Fund for the year then ended, the changes in each of their net assets for each of the two years in the period ended June 30, 2023 and each of the financial highlights for each of the periods indicated therein in conformity with accounting principles generally accepted in the United States of America.
Basis for Opinions
These financial statements are the responsibility of the Funds’ management. Our responsibility is to express an opinion on the Funds’ financial statements based on our audits. We are a public accounting firm registered with the Public Company Accounting Oversight Board (United States) (PCAOB) and are required to be independent with respect to the Funds in accordance with the U.S. federal securities laws and the applicable rules and regulations of the Securities and Exchange Commission and the PCAOB.
We conducted our audits of these financial statements in accordance with the standards of the PCAOB. Those standards require that we plan and perform the audit to obtain reasonable assurance about whether the financial statements are free of material misstatement, whether due to error or fraud.
Our audits included performing procedures to assess the risks of material misstatement of the financial statements, whether due to error or fraud, and performing procedures that respond to those risks. Such procedures included examining, on a test basis, evidence regarding the amounts and disclosures in the financial statements. Our audits also included evaluating the accounting principles used and significant estimates made by management, as well as evaluating the overall presentation of the financial statements. Our procedures included confirmation of securities owned as of June 30, 2023 by correspondence with the custodian, transfer agent and brokers; when replies were not received from brokers, we performed other auditing procedures. We believe that our audits provide a reasonable basis for our opinions.
/s/ PricewaterhouseCoopers LLP
New York, New York
August 24, 2023
We have served as the auditor of one or more investment companies in the JPMorgan Funds complex since 1993.
| J.P. Morgan Large Cap Funds | |
The Funds' Statement of Additional Information includes additional information about the Funds' Trustees and is available, without charge, upon request by calling 1-800-480-4111 or on the J.P. Morgan Funds’ website at www.jpmorganfunds.com.
Name (Year of Birth);
Positions With
the Funds (1) | Principal Occupation
During Past 5 Years | Number of
Funds in Fund
Complex Overseen
by Trustee (2) | Other Directorships Held
During the Past 5 Years |
| |
John F. Finn (1947); Chair
since 2020; Trustee since 1998. | Chairman, Gardner, Inc. (supply chain management company serving industrial and consumer markets) (serving in various roles 1974-present). | | Director, Greif, Inc. (GEF) (industrial package products and services) (2007-present); Trustee, Columbus Association for the Performing Arts (1988-present). |
Stephen P. Fisher (1959);
Trustee since 2018. | Retired; Chairman and Chief Executive Officer, NYLIFE Distributors LLC (registered broker-dealer) (serving in various roles 2008-2013); Chairman, NYLIM Service Company LLC (transfer agent) (2008-2017); New York Life Investment Management LLC (registered investment adviser) (serving in various roles 2005-2017); Chairman, IndexIQ Advisors LLC (registered investment adviser for ETFs) (2014-2017); President, MainStay VP Funds Trust (2007-2017), MainStay DefinedTerm Municipal Opportunities Fund (2011-2017) and MainStay Funds Trust (2007-2017) (registered investment companies). | | Honors Program Advisory Board Member, The Zicklin School of Business, Baruch College, The City University of New York (2017-present). |
Gary L. French (1951);
Trustee since 2014. | Real Estate Investor (2011-2020); Investment management industry Consultant and Expert Witness (2011-present); Senior Consultant for The Regulatory Fundamentals Group LLC (2011-2017). | | Independent Trustee, The China Fund, Inc. (2013-2019); Exchange Traded Concepts Trust II (2012-2014); Exchange Traded Concepts Trust I (2011-2014). |
Kathleen M. Gallagher (1958);
Trustee since 2018. | Retired; Chief Investment Officer — Benefit Plans, Ford Motor Company (serving in various roles 1985-2016). | | Non- Executive Director, Legal & General Investment Management (Holdings) (2018-present); Non-Executive Director, Legal & General Investment Management America (U.S. Holdings) (financial services and insurance) (2017-present); Advisory Board Member, State Street Global Advisors Total Portfolio Solutions (2017-present); Member, Client Advisory Council, Financial Engines, LLC (registered investment adviser) (2011-2016); Director, Ford Pension Funds Investment Management Ltd. (2007-2016). |
Robert J. Grassi (1957);
Trustee since 2014. | Sole Proprietor, Academy Hills Advisors LLC (2012-present); Pension Director, Corning Incorporated (2002-2012). | | |
| J.P. Morgan Large Cap Funds | |
TRUSTEES
(Unaudited) (continued)
Name (Year of Birth); Positions With the Funds (1) | Principal Occupation During Past 5 Years | Number of Funds in Fund Complex Overseen by Trustee (2) | Other Directorships Held During the Past 5 Years |
Independent Trustees (continued) | |
Frankie D. Hughes (1952);
Trustee since 2008. | President, Ashland Hughes Properties (property management) (2014-present); President and Chief Investment Officer, Hughes Capital Management, Inc. (fixed income asset management) (1993-2014). | | |
Raymond Kanner (1953);
Trustee since 2017. | Retired; Managing Director and Chief Investment Officer, IBM Retirement Funds (2007-2016). | | Advisory Board Member, Penso Advisors, LLC (2020-present); Advisory Board Member, Los Angeles Capital (2018-present); Advisory Board Member, State Street Global Advisors Total Portfolio Solutions (2017- present); Acting Executive Director, Committee on Investment of Employee Benefit Assets (CIEBA) (2016-2017); Advisory Board Member, Betterment for Business (robo advisor) (2016- 2017); Advisory Board Member, BlueStar Indexes (index creator) (2013-2017); Director, Emerging Markets Growth Fund (registered investment company) (1997-2016); Member, Russell Index Client Advisory Board (2001-2015). |
Thomas P. Lemke (1954);
Trustee since 2014. | | | (1) Independent Trustee of Advisors’ Inner Circle III fund platform, consisting of the following: (i) the Advisors’ Inner Circle Fund III, (ii) the Gallery Trust, (iii) the Schroder Series Trust, (iv) the Delaware Wilshire Private Markets Fund (since 2020), (v) Chiron Capital Allocation Fund Ltd., and (vi) formerly the Winton Diversified Opportunities Fund (2014-2018); and (2) Independent Trustee of the Symmetry Panoramic Trust (since 2018). |
Lawrence R. Maffia (1950);
Trustee since 2014. | Retired; Director and President, ICI Mutual Insurance Company (2006-2013). | | Director, ICI Mutual Insurance Company (1999-2013). |
Mary E. Martinez (1960); Vice
Chair since 2021; Trustee since 2013. | Associate, Special Properties, a Christie’s International Real Estate Affiliate (2010-present); Managing Director, Bank of America (asset management) (2007-2008); Chief Operating Officer, U.S. Trust Asset Management, U.S. Trust Company (asset management) (2003-2007); President, Excelsior Funds (registered investment companies) (2004-2005). | | |
Marilyn McCoy (1948);
Trustee since 1999. | Retired; Vice President of Administration and Planning, Northwestern University (1985-2023). | | |
| J.P. Morgan Large Cap Funds | |
Name (Year of Birth); Positions With the Funds (1) | Principal Occupation During Past 5 Years | Number of Funds in Fund Complex Overseen by Trustee (2) | Other Directorships Held During the Past 5 Years |
Independent Trustees (continued) | |
Dr. Robert A. Oden, Jr. (1946); Trustee
since 1997. | Retired; President, Carleton College (2002-2010); President, Kenyon College (1995-2002). | | Trustee, The Coldwater Conservation Fund (2017-present); Trustee, American Museum of Fly Fishing (2013-present); Trustee and Vice Chair, Trout Unlimited (2017-2021); Trustee, Dartmouth- Hitchcock Medical Center (2011-2020). |
Marian U. Pardo* (1946);
Trustee since 2013. | Managing Director and Founder, Virtual Capital Management LLC (investment consulting) (2007-present); Managing Director, Credit Suisse Asset Management (portfolio manager) (2003-2006). | | Board Chair and Member, Board of Governors, Columbus Citizens Foundation (not-for-profit supporting philanthropic and cultural programs) (2006-present). |
Emily A. Youssouf (1951);
Trustee since 2014. | Adjunct Professor (2011-present) and Clinical Professor (2009-2011), NYU Schack Institute of Real Estate; Board Member and Member of the Audit Committee (2013–present), Chair of Finance Committee (2019-present), Member of Related Parties Committee (2013-2018) and Member of the Enterprise Risk Committee (2015-2018), PennyMac Financial Services, Inc.; Board Member (2005-2018), Chair of Capital Committee (2006-2016), Chair of Audit Committee (2005-2018), Member of Finance Committee (2005-2018) and Chair of IT Committee (2016-2018), NYC Health and Hospitals Corporation. | | Trustee, NYC School Construction Authority (2009-present); Board Member, NYS Job Development Authority (2008-present); Trustee and Chair of the Audit Committee of the Transit Center Foundation (2015-2019). |
| |
Robert F. Deutsch** (1957);
Trustee since 2014. | Retired; Head of ETF Business for JPMorgan Asset Management (2013-2017); Head of Global Liquidity Business for JPMorgan Asset Management (2003-2013). | | Treasurer and Director of the JUST Capital Foundation (2017-present). |
Nina O. Shenker** (1957);
Trustee since 2022. | Vice Chair (2017-2021), General Counsel and Managing Director (2008-2016), Associate General Counsel and Managing Director (2004-2008), J.P. Morgan Asset & Wealth Management. | | Director and Member of Legal and Human Resources Subcommittees, American Jewish Joint Distribution Committee (2018-present). |
|
| The year shown is the first year in which a Trustee became a member of any of the following: the JPMorgan Mutual Fund Board, the JPMorgan ETF Board, the heritage J.P. Morgan Funds or the heritage One Group Mutual Funds. Trustees serve an indefinite term, until resignation, retirement, removal or death. The Boards' current retirement policy sets retirement at the end of the calendar year in which the Trustee attains the age of 75, provided that any Board member who was a member of the JPMorgan Mutual Fund Board prior to January 1, 2022 and was born prior to January 1, 1950 shall retire from the Board at the end of the calendar year in which the Trustee attains the age of 78. |
| A Fund Complex means two or more registered investment companies that hold themselves out to investors as related companies for purposes of investment and investor services or have a common investment adviser or have an investment adviser that is an affiliated person of the investment adviser of any of the other registered investment companies. The J.P. Morgan Funds Complex for which the Board of Trustees serves currently includes nine registered investment companies (176 J.P. Morgan Funds). |
| In connection with prior employment with JPMorgan Chase, Ms. Pardo was the recipient of non-qualified pension plan payments from JPMorgan Chase in the amount of approximately $2,055 per month, which she irrevocably waived effective January 1, 2013, and deferred compensation payments from JPMorgan Chase in the amount of approximately $7,294 per year, which ended in January 2013. In addition, Ms. Pardo receives payments from a fully-funded qualified plan, which is not an obligation of JPMorgan Chase. |
| J.P. Morgan Large Cap Funds | |
TRUSTEES
(Unaudited) (continued)
| Designation as an “Interested Trustee” is based on prior employment by the Adviser or an affiliate of the Adviser or interests in a control person of the Adviser. |
| The contact address for each of the Trustees is 277 Park Avenue, New York, NY 10172. |
| J.P. Morgan Large Cap Funds | |
Name (Year of Birth),
Positions Held with
the Trusts (Since) | Principal Occupations During Past 5 Years |
Brian S. Shlissel (1964),
President and Principal Executive
Officer (2016) | Managing Director and Chief Administrative Officer for J.P. Morgan pooled vehicles, J.P. Morgan Investment Management Inc. since 2014. |
Timothy J. Clemens (1975),
Treasurer and Principal Financial
Officer (2018) | Managing Director, J.P. Morgan Investment Management Inc. Mr. Clemens has been with J.P. Morgan Investment Management Inc. since 2013. |
Gregory S. Samuels (1980),
Secretary (2019) (formerly Assistant
Secretary 2010-2019) | Managing Director and Assistant General Counsel, JPMorgan Chase & Co. Mr. Samuels has been with JPMorgan Chase & Co. since 2010. |
Stephen M. Ungerman (1953),
Chief Compliance Officer (2005) | Managing Director, JPMorgan Chase & Co. Mr. Ungerman has been with JPMorgan Chase & Co. since 2000. |
Kiesha Astwood-Smith (1973),
Assistant Secretary (2021) | Vice President and Assistant General Counsel, JPMorgan Chase & Co. since June 2021; Senior Director and Counsel, Equitable Financial Life Insurance Company (formerly, AXA Equitable Life Insurance Company) from September 2015 through June 2021. |
Matthew Beck (1988),
Assistant Secretary (2021)* | Vice President and Assistant General Counsel, JPMorgan Chase & Co. since May 2021; Senior Legal Counsel, Ultimus Fund Solutions from May 2018 through May 2021; General Counsel, The Nottingham Company from April 2014 through May 2018. |
Elizabeth A. Davin (1964),
Assistant Secretary (2005)* | Executive Director and Assistant General Counsel, JPMorgan Chase & Co. Ms. Davin has been with JPMorgan Chase & Co. (formerly Bank One Corporation) since 2004. |
Jessica K. Ditullio (1962)
Assistant Secretary (2005)* | Executive Director and Assistant General Counsel, JPMorgan Chase & Co. Ms. Ditullio has been with JPMorgan Chase & Co. (formerly Bank One Corporation) since 1990. |
Anthony Geron (1971),
Assistant Secretary (2018) | Vice President and Assistant General Counsel, JPMorgan Chase & Co. since September 2018; Lead Director and Counsel, AXA Equitable Life Insurance Company from 2015 to 2018 and Senior Director and Counsel, AXA Equitable Life Insurance Company from 2014 to 2015. |
Carmine Lekstutis (1980),
Assistant Secretary (2011) | Executive Director and Assistant General Counsel, JPMorgan Chase & Co. Mr. Lekstutis has been with JPMorgan Chase & Co. since 2011. |
Max Vogel (1990),
Assistant Secretary (2021) | Vice President and Assistant General Counsel, JPMorgan Chase & Co. since June 2021; Associate, Proskauer Rose LLP (law firm) from March 2017 to June 2021. |
Zachary E. Vonnegut-Gabovitch
(1986),
Assistant Secretary (2017) | Executive Director and Assistant General Counsel, JPMorgan Chase & Co. Mr. Vonnegut-Gabovitch has been with JPMorgan Chase & Co. since September 2016. |
Frederick J. Cavaliere (1978),
Assistant Treasurer (2023)** | Executive Director, J.P. Morgan Investment Management Inc. Mr. Cavaliere has been with JPMorgan Chase & Co. since May 2006. |
Michael M. D’Ambrosio (1969),
Assistant Treasurer (2012) | Managing Director, J.P. Morgan Investment Management Inc. Mr. D’Ambrosio has been with J.P. Morgan Investment Management Inc. since 2012. |
Aleksandr Fleytekh (1972),
Assistant Treasurer (2019) | Executive Director, J.P. Morgan Investment Management Inc. Mr. Fleytekh has been with J.P. Morgan Investment Management Inc. since February 2012. |
Shannon Gaines (1977),
Assistant Treasurer (2018)* | Executive Director, J.P. Morgan Investment Management Inc. Mr. Gaines has been with J.P. Morgan Investment Management Inc. since January 2014. |
Jeffrey D. House (1972),
Assistant Treasurer (2017)* | Vice President, J.P. Morgan Investment Management Inc. since July 2006. |
Michael Mannarino (1985),
Assistant Treasurer (2020) | Vice President, J.P. Morgan Investment Management Inc. since 2014. |
Joseph Parascondola (1963),
Assistant Treasurer (2011)** | Executive Director, J.P. Morgan Investment Management Inc. Mr. Parascondola has been with J.P. Morgan Investment Management Inc. since 2006. |
| J.P. Morgan Large Cap Funds | |
OFFICERS
(Unaudited) (continued)
Name (Year of Birth), Positions Held with the Trusts (Since) | Principal Occupations During Past 5 Years |
Gillian I. Sands (1969),
Assistant Treasurer (2012) | Executive Director, J.P. Morgan Investment Management Inc. Ms. Sands has been with J.P. Morgan Investment Management Inc. since 2012. |
|
The contact address for each of the officers, unless otherwise noted, is 277 Park Avenue, New York, NY 10172. |
| The contact address for the officer is 1111 Polaris Parkway, Columbus, OH 43240. |
| The contact address for the officer is 575 Washington Boulevard, Jersey City, NJ 07310. |
| J.P. Morgan Large Cap Funds | |
SCHEDULE OF SHAREHOLDER EXPENSES
(Unaudited)
Hypothetical $1,000 Investment
As a shareholder of the Funds, you incur two types of costs: (1) transaction costs, including sales charges (loads) on purchase payments and (2) ongoing costs, including investment advisory fees, administration fees, distribution fees and other Fund expenses. The examples below are intended to help you understand your ongoing costs (in dollars) of investing in the Funds (not including expenses of the Underlying Funds) and to compare these ongoing costs with the ongoing costs of investing in other mutual funds. The examples assume that you had a $1,000 investment in each Class at the beginning of the reporting period, January 1, 2023, and continued to hold your shares at the end of the reporting period, June 30, 2023.
Actual Expenses
For each Class of each Fund in the table below, the first line provides information about actual account values and actual expenses. You may use the information in this line, together with the amount you invested, to estimate the expenses that you paid over the period. Simply divide your account value by $1,000 (for example, an $8,600 account value divided by $1,000 = 8.6), then multiply the result by the number in the first line of each Class under the heading titled “Expenses Paid During the Period” to estimate the expenses you paid on your account during this period.
Hypothetical Example for Comparison Purposes
The second line of each Class in the table below provides information about hypothetical account values and hypothetical expenses based on the Class’ actual expense ratio and an assumed rate of return of 5% per year before expenses, which is not the Class’ actual return. The hypothetical account values and expenses may not be used to estimate the actual ending account balance or expenses you paid for the period. You may use this information to compare the ongoing costs of investing in the Class of the Funds and other funds. To do so, compare this 5% hypothetical example with the 5% hypothetical examples that appear in the shareholder reports of the other funds. Please note that the expenses shown in the table are meant to highlight your ongoing costs only and do not reflect any transaction costs, such as sales charges (loads) or redemption fees, and expenses of the Underlying Funds. Therefore, the second line for each Class in the table is useful in comparing ongoing costs only, and will not help you determine the relative total costs of owning different funds. In addition, if these transaction costs were included, your costs would have been higher. The examples also assume all dividends and distributions have been reinvested.
| Beginning
Account Value
January 1, 2023 | Ending
Account Value
June 30, 2023 | Expenses
Paid During
the Period* | |
JPMorgan Equity Income Fund | | | | |
| | | | |
| | | | |
| | | | |
| | | | |
| | | | |
| | | | |
| | | | |
| | | | |
| | | | |
| | | | |
| | | | |
| | | | |
| | | | |
| | | | |
| | | | |
| | | | |
| | | | |
| | | | |
| | | | |
| | | | |
| | | | |
| | | | |
| | | | |
| | | | |
| J.P. Morgan Large Cap Funds | |
SCHEDULE OF SHAREHOLDER EXPENSES
(Unaudited) (continued)
Hypothetical $1,000 Investment
| Beginning Account Value January 1, 2023 | Ending Account Value June 30, 2023 | Expenses Paid During the Period* | |
JPMorgan Equity Index Fund | | | | |
| | | | |
| | | | |
| | | | |
| | | | |
| | | | |
| | | | |
| | | | |
| | | | |
| | | | |
| | | | |
| | | | |
| | | | |
JPMorgan Equity Premium Income Fund | | | | |
| | | | |
| | | | |
| | | | |
| | | | |
| | | | |
| | | | |
| | | | |
| | | | |
| | | | |
| | | | |
| | | | |
| | | | |
| | | | |
| | | | |
| | | | |
JPMorgan Hedged Equity Fund | | | | |
| | | | |
| | | | |
| | | | |
| | | | |
| | | | |
| | | | |
| | | | |
| | | | |
| | | | |
| | | | |
| | | | |
| | | | |
| | | | |
| | | | |
| | | | |
JPMorgan Hedged Equity 2 Fund | | | | |
| | | | |
| | | | |
| | | | |
| | | | |
| | | | |
| | | | |
| J.P. Morgan Large Cap Funds | |
| Beginning Account Value January 1, 2023 | Ending Account Value June 30, 2023 | Expenses Paid During the Period* | |
JPMorgan Hedged Equity 2 Fund (continued) | | | | |
| | | | |
| | | | |
| | | | |
| | | | |
| | | | |
| | | | |
| | | | |
| | | | |
| | | | |
JPMorgan Hedged Equity 3 Fund | | | | |
| | | | |
| | | | |
| | | | |
| | | | |
| | | | |
| | | | |
| | | | |
| | | | |
| | | | |
| | | | |
| | | | |
| | | | |
| | | | |
| | | | |
| | | | |
JPMorgan Large Cap Growth Fund | | | | |
| | | | |
| | | | |
| | | | |
| | | | |
| | | | |
| | | | |
| | | | |
| | | | |
| | | | |
| | | | |
| | | | |
| | | | |
| | | | |
| | | | |
| | | | |
| | | | |
| | | | |
| | | | |
| | | | |
| | | | |
| | | | |
| | | | |
| | | | |
| | | | |
| J.P. Morgan Large Cap Funds | |
SCHEDULE OF SHAREHOLDER EXPENSES
(Unaudited) (continued)
Hypothetical $1,000 Investment
| Beginning Account Value January 1, 2023 | Ending Account Value June 30, 2023 | Expenses Paid During the Period* | |
JPMorgan Large Cap Value Fund | | | | |
| | | | |
| | | | |
| | | | |
| | | | |
| | | | |
| | | | |
| | | | |
| | | | |
| | | | |
| | | | |
| | | | |
| | | | |
| | | | |
| | | | |
| | | | |
| | | | |
| | | | |
| | | | |
| | | | |
| | | | |
| | | | |
| | | | |
| | | | |
| | | | |
JPMorgan U.S. Applied Data Science Value Fund | | | | |
| | | | |
| | | | |
| | | | |
| | | | |
| | | | |
| | | | |
| | | | |
| | | | |
| | | | |
| | | | |
| | | | |
| | | | |
| | | | |
| | | | |
| | | | |
| | | | |
| | | | |
| | | | |
JPMorgan U.S. Equity Fund | | | | |
| | | | |
| | | | |
| | | | |
| | | | |
| | | | |
| | | | |
| J.P. Morgan Large Cap Funds | |
| Beginning Account Value January 1, 2023 | Ending Account Value June 30, 2023 | Expenses Paid During the Period* | |
JPMorgan U.S. Equity Fund (continued) | | | | |
| | | | |
| | | | |
| | | | |
| | | | |
| | | | |
| | | | |
| | | | |
| | | | |
| | | | |
| | | | |
| | | | |
| | | | |
| | | | |
| | | | |
| | | | |
| | | | |
| | | | |
| | | | |
| | | | |
| | | | |
| | | | |
JPMorgan U.S. GARP Equity Fund | | | | |
| | | | |
| | | | |
| | | | |
| | | | |
| | | | |
| | | | |
| | | | |
| | | | |
| | | | |
| | | | |
| | | | |
| | | | |
| | | | |
| | | | |
| | | | |
| | | | |
| | | | |
| | | | |
JPMorgan U.S. Large Cap Core Plus Fund | | | | |
| | | | |
| | | | |
| | | | |
| | | | |
| | | | |
| | | | |
| | | | |
| | | | |
| | | | |
| J.P. Morgan Large Cap Funds | |
SCHEDULE OF SHAREHOLDER EXPENSES
(Unaudited) (continued)
Hypothetical $1,000 Investment
| Beginning Account Value January 1, 2023 | Ending Account Value June 30, 2023 | Expenses Paid During the Period* | |
JPMorgan U.S. Large Cap Core Plus Fund (continued) | | | | |
| | | | |
| | | | |
| | | | |
| | | | |
| | | | |
| | | | |
| | | | |
| | | | |
| | | | |
JPMorgan U.S. Research Enhanced Equity Fund | | | | |
| | | | |
| | | | |
| | | | |
| | | | |
| | | | |
| | | | |
| | | | |
| | | | |
| | | | |
JPMorgan U.S. Sustainable Leaders Fund | | | | |
| | | | |
| | | | |
| | | | |
| | | | |
| | | | |
| | | | |
| | | | |
| | | | |
| | | | |
| | | | |
| | | | |
| | | | |
| | | | |
| | | | |
| | | | |
| | | | |
| | | | |
| | | | |
| | | | |
| | | | |
| | | | |
| | | | |
| | | | |
| | | | |
| | | | |
| | | | |
| | | | |
| | | | |
| | | | |
| | | | |
| | | | |
| J.P. Morgan Large Cap Funds | |
| Beginning Account Value January 1, 2023 | Ending Account Value June 30, 2023 | Expenses Paid During the Period* | |
JPMorgan U.S. Value Fund (continued) | | | | |
| | | | |
| | | | |
| | | | |
| | | | |
| | | | |
| | | | |
|
| Expenses are equal to each Class’ respective annualized net expense ratio, multiplied by the average account value over the period, multiplied by 181/365 (to reflect the one-half year period). |
| J.P. Morgan Large Cap Funds | |
LIQUIDITY RISK MANAGEMENT PROGRAM
(Unaudited)
Each of the Funds covered in this report has adopted the J.P. Morgan Funds and J.P. Morgan Exchange-Traded Funds Amended and Restated Liquidity Risk Management Program (the “Program”) under Rule 22e-4 under the Investment Company Act of 1940, as amended (the “Liquidity Rule”). The Program seeks to assess, manage and review each Fund’s Liquidity Risk. “Liquidity Risk” is defined as the risk that a fund could not meet requests to redeem shares issued by the fund without significant dilution of remaining investors’ interests in the fund. Pursuant to an exemptive order (the “Exemptive Order”) from the Securities and Exchange Commission, the Program permits the Funds to use liquidity definitions and classification methodologies that differ from the requirements under the Liquidity Rule in some respects. Among other things, the Liquidity Rule requires that a written report be provided to the Board of Trustees (the “Board”) on an annual basis that addresses the operation of the Program and assesses the adequacy and effectiveness of its implementation, including the operation of any Highly Liquid Investment Minimum (“HLIM”), where applicable, and any material changes to the Program.
The Board has appointed J.P. Morgan Asset Management’s Liquidity Risk Forum to be the program administrator for the Program (the “Program Administrator”). In addition to regular reporting at each of its quarterly meetings, on February 7, 2023, the Board reviewed the Program Administrator’s annual written report (the “Report”) concerning the operation of the Program for the period from January 1, 2022 through December 31, 2022 (the “Program Reporting Period”). The Report addressed the operation of the Program and assessed its adequacy and effectiveness of implementation, including, where applicable, the operation of a Fund’s HLIM. There were no material changes to the Program during the Program Reporting Period.
The Report summarized the operation of the Program and the information and factors considered by the Program Administrator in assessing whether the Program has been adequately and effectively implemented with respect to each Fund. Such information and factors included, among other things: (1) the liquidity risk framework used to assess, manage, and periodically review each Fund’s Liquidity Risk and the results of this assessment; (2) the methodology and inputs for classifying the investments of a Fund into one of the required liquidity categories that reflect an estimate of the liquidity of those investments under current market conditions; (3) whether a Fund invested primarily in “Highly Liquid Investments” (as defined or modified under the Program), as well as whether an HLIM should be established for a Fund (and, for Funds that have adopted an HLIM, whether the HLIM continues to be appropriate or whether a Fund has invested below its HLIM) and the procedures for monitoring for any HLIM; (4) whether a Fund invested more than 15% of its assets in “Illiquid Investments” (as defined or modified under the Program) and the procedures for monitoring for this limit; and (5) specific liquidity events arising during the Program Reporting Period. The Report further summarized the conditions of the Exemptive Order and whether all applicable Funds were in compliance with the terms of the Exemptive Order.
Based on this review, the Report concluded that: (1) the Program continues to be reasonably designed to effectively assess and manage each Fund’s Liquidity Risk; and (2) the Program has been adequately and effectively implemented with respect to each Fund during the Program Reporting Period.
| J.P. Morgan Large Cap Funds | |
TAX LETTER
(Unaudited)
(Dollar values in thousands)
Certain tax information for the J.P. Morgan Funds is required to be provided to shareholders based upon the Funds' income and distributions for the taxable year ended June 30, 2023. The information and distributions reported in this letter may differ from the information and taxable distributions reported to the shareholders for the calendar year ending December 31, 2023. The information necessary to complete your income tax returns for the calendar year ending December 31, 2023 will be provided under separate cover.
Dividends Received Deduction (DRD)
Each Fund listed below had the following percentage, or maximum allowable percentage, of ordinary income distributions eligible for the dividends received deduction for corporate shareholders for the fiscal year ended June 30, 2023:
| Dividends
Received
Deduction |
JPMorgan Equity Income Fund | |
JPMorgan Equity Index Fund | |
JPMorgan Equity Premium Income Fund | |
JPMorgan Hedged Equity Fund | |
JPMorgan Hedged Equity 2 Fund | |
JPMorgan Hedged Equity 3 Fund | |
JPMorgan Large Cap Growth Fund | |
JPMorgan Large Cap Value Fund | |
JPMorgan U.S. Applied Data Science Value Fund | |
JPMorgan U.S. Equity Fund | |
JPMorgan U.S. GARP Equity Fund | |
JPMorgan U.S. Large Cap Core Plus Fund | |
JPMorgan U.S. Research Enhanced Equity Fund | |
JPMorgan U.S. Sustainable Leaders Fund | |
| |
Long Term Capital Gain
Each Fund listed below distributed the following amount, or maximum allowable amount, of long-term capital gain dividends for the fiscal year ended June 30, 2023:
| Long-Term
Capital Gain
Distribution |
JPMorgan Equity Income Fund | |
JPMorgan Equity Index Fund | |
JPMorgan Hedged Equity 2 Fund | |
JPMorgan Hedged Equity 3 Fund | |
JPMorgan Large Cap Growth Fund | |
JPMorgan Large Cap Value Fund | |
JPMorgan U.S. Applied Data Science Value Fund | |
JPMorgan U.S. Equity Fund | |
JPMorgan U.S. GARP Equity Fund | |
| Long-Term Capital Gain Distribution |
JPMorgan U.S. Large Cap Core Plus Fund | |
JPMorgan U.S. Research Enhanced Equity Fund | |
| |
Qualified Dividend Income (QDI)
Each Fund listed below had the following amount, or maximum allowable amount, of ordinary income distributions treated as qualified dividends for the fiscal year ended June 30, 2023:
| |
JPMorgan Equity Income Fund | |
JPMorgan Equity Index Fund | |
JPMorgan Equity Premium Income Fund | |
JPMorgan Hedged Equity Fund | |
JPMorgan Hedged Equity 2 Fund | |
JPMorgan Hedged Equity 3 Fund | |
JPMorgan Large Cap Growth Fund | |
JPMorgan Large Cap Value Fund | |
JPMorgan U.S. Applied Data Science Value Fund | |
JPMorgan U.S. Equity Fund | |
JPMorgan U.S. GARP Equity Fund | |
JPMorgan U.S. Large Cap Core Plus Fund | |
JPMorgan U.S. Research Enhanced Equity Fund | |
JPMorgan U.S. Sustainable Leaders Fund | |
| |
| J.P. Morgan Large Cap Funds | |
| WHAT DOES J.P. MORGAN FUNDS DO WITH YOUR PERSONAL INFORMATION? |
| Financial companies choose how they share your personal information. Federal law gives consumers the right to limit some but not all sharing. Federal law also requires us to tell you how we collect, share, and protect your personal information. Please read this notice carefully to understand what we do. |
| The types of personal information we collect and share depend on the product or service you have with us. This information can include: |
| ○Social Security number and account balances |
| ○transaction history and account transactions |
| ○checking account information and wire transfer instructions |
| When you are no longer our customer, we continue to share your information as described in this notice. |
| All financial companies need to share customers’ personal information to run their everyday business. In the section below, we list the reasons financial companies can share their customers’ personal information; the reasons J.P. Morgan Funds chooses to share; and whether you can limit this sharing. |
Reasons we can share your personal information | Does J.P. Morgan
Funds share? | Can you limit this
sharing? |
For our everyday business purposes — such as to process your transactions, maintain your account(s), respond to court orders and legal investigations, or report to credit bureaus | | |
For marketing purposes — to offer our products and services to you | | |
For joint marketing with other financial companies | | |
For our affiliates’ everyday business purposes — information about your transactions and experiences | | |
For our affiliates’ everyday business purposes — information about your creditworthiness | | |
For nonaffiliates to market to you | | |
Questions? Call 1-800-480-4111 or go to www.jpmorganfunds.com | |
|
Who is providing this notice? | |
|
How does J.P. Morgan Funds protect my personal information? | To protect your personal information from unauthorized access and use, we use security measures that comply with federal law. These measures include computer safeguards and secured files and buildings. We authorize our employees to access your information only when they need it to do their work and we require companies that work for us to protect your information. |
|
How does J.P. Morgan Funds collect my personal information? | We collect your personal information, for example, when you: |
○open an account or provide contact information |
○give us your account information or pay us by check |
|
We also collect your personal information from others, such as credit bureaus, affiliates and other companies. |
|
Why can’t I limit all sharing? | Federal law gives you the right to limit only: |
○sharing for affiliates’ everyday business purposes – information about your creditworthiness |
○affiliates from using your information to market to you |
○sharing for nonaffiliates to market to you |
State laws and individual companies may give you additional rights to limit sharing. |
|
| Companies related by common ownership or control. They can be financial and nonfinancial companies. |
| ○J.P. Morgan Funds does not share with our affiliates. |
|
| Companies not related by common ownership or control. They can be financial and nonfinancial companies. |
| ○J.P. Morgan Funds does not share with nonaffiliates so they can market to you. |
|
| A formal agreement between nonaffiliated financial companies that together market financial products or services to you. |
| ○J.P. Morgan Funds doesn’t jointly market. |
THIS PAGE IS INTENTIONALLY LEFT BLANK
THIS PAGE IS INTENTIONALLY LEFT BLANK
THIS PAGE IS INTENTIONALLY LEFT BLANK
J.P. Morgan Funds are distributed by JPMorgan Distribution Services, Inc., which is an affiliate of JPMorgan Chase & Co. Affiliates of JPMorgan Chase & Co. receive fees for providing various services to the Funds.
Contact JPMorgan Distribution Services, Inc. at 1-800-480-4111 for a fund prospectus. You can also visit us at www.jpmorganfunds.com. Investors should carefully consider the investment objectives and risk as well as charges and expenses of the mutual fund before investing. The prospectus contains this and other information about the mutual fund. Read the prospectus carefully before investing.
Investors may obtain information about the Securities Investor Protection Corporation (SIPC), including the SIPC brochure, by visiting www.sipc.org or by calling SIPC at 202-371-8300.
Each Fund files a complete schedule of its fund holdings for the first and third quarters of its fiscal year with the SEC as an exhibit to its report on Form N-PORT. The Funds' Form N-PORT reports are available on the SEC’s website at http://www.sec.gov. Each Fund's quarterly holdings can be found by visiting the J.P. Morgan Funds’ website at www.jpmorganfunds.com.
A description of each Fund's policies and procedures with respect to the disclosure of each Fund's holdings is available in the prospectuses and Statement of Additional Information.
A copy of proxy policies and procedures is available without charge upon request by calling 1-800-480-4111 and on the Funds' website at www.jpmorganfunds.com. A description of such policies and procedures is on the SEC’s website at www.sec.gov. The Trustees have delegated the authority to vote proxies for securities owned by the Funds to the Adviser. A copy of the Funds' voting record for the most recent 12-month period ended June 30 is available on the SEC’s website at www.sec.gov or at the Funds' website at www.jpmorganfunds.com no later than August 31 of each year. The Funds' proxy voting record will include, among other things, a brief description of the matter voted on for each fund security, and will state how each vote was cast, for example, for or against the proposal.
J.P. Morgan Asset Management is the brand name for the asset management business of JPMorgan Chase & Co. and its affiliates worldwide.
© JPMorgan Chase & Co., 2023. All rights reserved. June 2023.
AN-LCE-623
Annual Report
J.P. Morgan Investor Funds
June 30, 2023
JPMorgan Investor Balanced Fund |
JPMorgan Investor Conservative Growth Fund |
JPMorgan Investor Growth Fund |
JPMorgan Investor Growth & Income Fund |
CONTENTS
Investments in a Fund are not deposits or obligations of, or guaranteed or endorsed by, any bank and are not insured or guaranteed by the FDIC, the Federal Reserve Board or any other government agency. You could lose money if you sell when a Fund’s share price is lower than when you invested.
Past performance is no guarantee of future performance. The general market views expressed in this report are opinions based on market and other conditions through the end of the reporting period and are subject to change without notice. These views are not intended to predict the future performance of a Fund or the securities markets.
Prospective investors should refer to the Funds’ prospectuses for a discussion of the Funds’ investment objectives, strategies and risks. Call J.P. Morgan Funds Service Center at 1-800-480-4111 for a prospectus containing more complete information about a Fund, including management fees and other expenses. Please read it carefully before investing.
Letter to Shareholders
August 11, 2023 (Unaudited)
Dear Shareholder,
Equity markets largely delivered solid returns for the twelve months ended June 30, 2023 on the back of buoyant corporate earnings, continued economic growth and receding inflationary pressures. Even as the U.S. Federal Reserve raised interest rates in an effort to cool the economy, the unemployment rate remained below 4% and consumer and business spending was generally higher than many economists expected.
|
“Equity markets delivered strong returns during the first half of 2023, with investors who remained fully invested likely benefitting. Going forward, we believe investors may be best served by maintaining a long-term view and holding a well-diversified portfolio.” — Brian S. Shlissel
|
Among financial markets, the performance of leading equity indexes was mixed through the second half of 2022. However, the S&P 500 Index generated positive performance every month except February in the first half of 2023. Large cap growth stocks generally outperformed other sectors of the market for the twelve-months ended June 30, 2023, partly due to investor demand for shares of large information technology companies. Leading mid cap and small cap equity indexes – both growth and value - posted positive performance for the period. Notably, the collapse of three U.S. regional banks in March 2023 put pressure on equities in the broader financial sector but the responses by multiple U.S. regulatory agencies as well as leading central banks appear to have limited further volatility in the banking industry.
With the exception of its June 2023 meeting, the U.S. Federal Reserve (the “Fed”) raised benchmark interest rates at 10 consecutive meetings since commencing its tightening monetary policy in mid-March 2022, and subsequently raised rates again in July 2023. Meanwhile, U.S. inflation, as measured by the Consumer Price Index, fell from 40-year highs in mid-2022 to 3.0% in June 2023. U.S. gross domestic product (GDP) remained positive throughout the 12-month period and even rebounded to an annualized rate of 2.4% in the second quarter of 2023 from 2.0% in the first quarter. While the overall
trend in consumer spending was downward, consumption was better than economists generally expected and business fixed investment in equipment, facilities and software in the second quarter of 2023 increased at the fastest pace since the start of 2022.
Though inflation remained above the Fed’s stated target of 2% annual growth during the twelve-month period, the declining trend in price growth may allow the Fed to end its policy tightening sooner than expected. Moreover, the resiliency of the U.S. economy in the face of the highest interest rates since 2001 could allow the economy to cool without GDP tipping into negative territory or leading to wide-spread job losses.
Certainly, there are factors that remain the focus of investor concerns. The war in Ukraine has continued, without demonstrative progress toward an eventual peace settlement or even a ceasefire. Elsewhere, China’s economy is experiencing weak growth and record high unemployment, and falling prices have raised economists’ worries about the potential for a deflationary spiral in the world’s second largest economy. In the U.S., the run-up to the 2024 presidential election has the potential to increase global political and economic uncertainty.
Equity markets delivered strong returns during the first half of 2023, with investors who remained fully invested likely benefitting. Going forward, we believe investors may be best served by maintaining a long-term view and holding a well-diversified portfolio. Our suite of investment solutions seeks to provide investors with ability to build durable portfolios that can meet their financial goals.
Sincerely,
Brian S. Shlissel
President, J.P. Morgan Funds
J.P. Morgan Asset Management
1-800-480-4111 or www.jpmorganfunds.com for more information
| J.P. Morgan Investor Funds | |
J.P. Morgan Investor Funds
FUND FACTS
TWELVE MONTHS ENDED June 30, 2023 (Unaudited)
| Fund Return
(With
sales charge)* | Fund Return
(Without
sales charge)* | Bloomberg Barclays U.S.
Intermediate Aggregate
Index Return
(Broad-Based Fixed
Income Benchmark) | Russell 3000
Index Return
(Broad-Based
Equity Benchmark) | MSCI EAFE Index
(net of foreign
withholding
taxes) | Fund Net
Assets as of June 30, 2023 (In thousands) |
JPMorgan Investor Balanced Fund, Class A | | | | | | |
JPMorgan Investor Conservative Growth Fund, Class A | | | | | | |
JPMorgan Investor Growth Fund, Class A | | | | | | |
JPMorgan Investor Growth & Income Fund, Class A | | | | | | |
| The return shown is based on net asset values calculated for shareholder transactions and may differ from the return shown in the financial highlights, which reflects adjustments made to the net asset values in accordance with accounting principles generally accepted in the United States of America. |
JPMorgan Investor Balanced Fund
PORTFOLIO COMPOSITION BY ASSET CLASS
AS OF June 30, 2023 | PERCENT OF
TOTAL
INVESTMENTS |
| |
| |
| |
| |
| |
JPMorgan Investor Conservative Growth Fund
PORTFOLIO COMPOSITION BY ASSET CLASS
AS OF June 30, 2023 | PERCENT OF
TOTAL
INVESTMENTS |
| |
| |
| |
| |
| |
JPMorgan Investor Growth Fund
PORTFOLIO COMPOSITION BY ASSET CLASS
AS OF June 30, 2023 | PERCENT OF
TOTAL
INVESTMENTS |
| |
| |
| |
| |
| |
JPMorgan Investor Growth & Income Fund
PORTFOLIO COMPOSITION BY ASSET CLASS
AS OF June 30, 2023 | PERCENT OF
TOTAL
INVESTMENTS |
| |
| |
| |
| |
| |
| J.P. Morgan Investor Funds | |
J.P. Morgan Investor Funds
FUNDS COMMENTARY
TWELVE MONTHS ENDED June 30, 2023 (Unaudited)
INVESTMENT OBJECTIVES*
The JPMorgan Investor Balanced Fund seeks high total return consistent with the preservation of capital by investing primarily in a diversified group of mutual funds within the same group of investment companies that invest primarily in equity and fixed income securities.
The JPMorgan Investor Conservative Growth Fund seeks income and capital appreciation by investing primarily in a diversified group of mutual funds within the same group of investment companies that invest primarily in fixed income and equity securities.
The JPMorgan Investor Growth Fund seeks long-term capital appreciation by investing primarily in a diversified group of mutual funds within the same group of investment companies that invest primarily in equity securities.
The JPMorgan Investor Growth & Income Fund seeks long-term capital appreciation and growth of income by investing primarily in a diversified group of mutual funds within the same group of investment companies that invest primarily in equity securities.
HOW DID THE MARKET PERFORM?
Equity markets largely generated positive returns for the twelve-month period as consumer spending, manufacturing and corporate earnings remained resilient in the face of rising interest rates and slowing economic growth. While leading equity indexes were mixed on a month-to-month basis, the overall trend was toward a rebound from the sell-off that marked the first half of 2022.
Fixed-income markets generally underperformed developed markets equity. High yield debt (also known as junk bonds) and emerging markets debt provided positive returns for the period, while corporate bonds and sovereign debt had mixed returns.
Following a sharp sell-off in August and September 2022 that coincided with U.S. Federal Reserve policy guidance on further interest rate increases, equity prices largely stabilized. Corporate earnings for both the second and third quarters of 2022 were generally better than expected given a cooling economy and slowing consumer spending. By the start of 2023, economic data showed some inflationary pressures had eased.
Across Europe, the energy crisis that followed Russia’s invasion of Ukraine in late February 2022 eased somewhat in the second half of 2022 as both the U.K. and the EU obtained alternatives to Russian energy imports and global energy prices began to recede. A political crisis in the U.K. roiled financial markets in London but the ascension of Rishi Sunak to prime minister appeared to remove some investor uncertainty by the end of 2023.
Meanwhile, leading central banks largely continued to raise
interest rates during the twelve-month period. Notably, the European Central Bank initiated its monetary tightening policy in September 2022, with its first rate increase in eleven years and the largest increase in the bank’s history. The U.S. Federal Reserve declined to raise interest rates at its June 2023 meeting, though it stated it would raise rates further in 2023 as needed.
While financial market volatility receded from 2022 levels, it remained elevated in the face of investor uncertainty about interest rates. In March 2023, the financial sector was roiled by the failures of Silicon Valley Bank and First Republic Bank in the U.S., and Credit Suisse Group AG in Switzerland. In each instance, government regulators moved to prevent further contagion within the financials sector.
WHAT WERE THE MAIN DRIVERS OF THE FUNDS' PERFORMANCE?
In accordance with their model allocations, each of the JPMorgan Investor Funds (the “Investor Funds”) allocated its assets among fixed income, equity and alternative investments.
For the twelve months ended June 30, 2023, each of the Investor Funds’ Class A Shares outperformed the Bloomberg U.S. Intermediate Aggregate Index, the Investor Funds’ broad based fixed income benchmark, mainly due to the Investor Funds’ exposure to equities.
Each of the Investor Funds underperformed the Russell 3000 Index, the Investor Funds’ broad based U.S. equity benchmark, mainly due to the Fund’s allocation to international equities and fixed income. Each of the Investor Funds underperformed the MSCI EAFE Index, a broad global equity index, largely due to their allocations to U.S. fixed income.
HOW WERE THE FUNDS POSITIONED?
Each Investor Fund invested in underlying JPMorgan Funds (“underlying funds”). The underlying funds invest in fixed income securities, equities and other alternative fixed income and equity strategies, such as below investment grade, high yield bonds and real estate investment trusts. Among equities, the underlying funds in which the Investor Funds invested were allocated among large-cap, mid-cap, small-cap and international stocks. The Investor Funds’ portfolio managers made investments for each Investor Fund based on an evaluation of three components: underlying fund selection, tactical asset allocation and strategic asset allocation. The portfolio managers determined the strategic weight for each asset class in the Investor Funds by making investments that they believed would perform well over the long term and maintaining a level of volatility similar to that of each Investor Fund’s composite benchmark. At June 30, 2023, the Investor
| J.P. Morgan Investor Funds | |
J.P. Morgan Investor Funds
FUNDS COMMENTARY
TWELVE MONTHS ENDED June 30, 2023 (Unaudited) (continued)
*
The adviser seeks to achieve the Portfolio’s objective. There can be no guarantee it will be achieved.
Funds’ portfolio managers maintained a relative underweight position in equity and an overweight position in fixed income.
| J.P. Morgan Investor Funds | |
JPMorgan Investor Balanced Fund
FUND COMMENTARY
TWELVE MONTHS ENDED June 30, 2023 (Unaudited)
AVERAGE ANNUAL TOTAL RETURNS AS OF June 30, 2023
|
| Sales Charge for Class A Shares is 4.50%. |
| Assumes a 1% CDSC (contingent deferred sales charge) for the one year period and 0% CDSC thereafter. |
TEN YEAR FUND PERFORMANCE (6/30/13 TO 6/30/23)
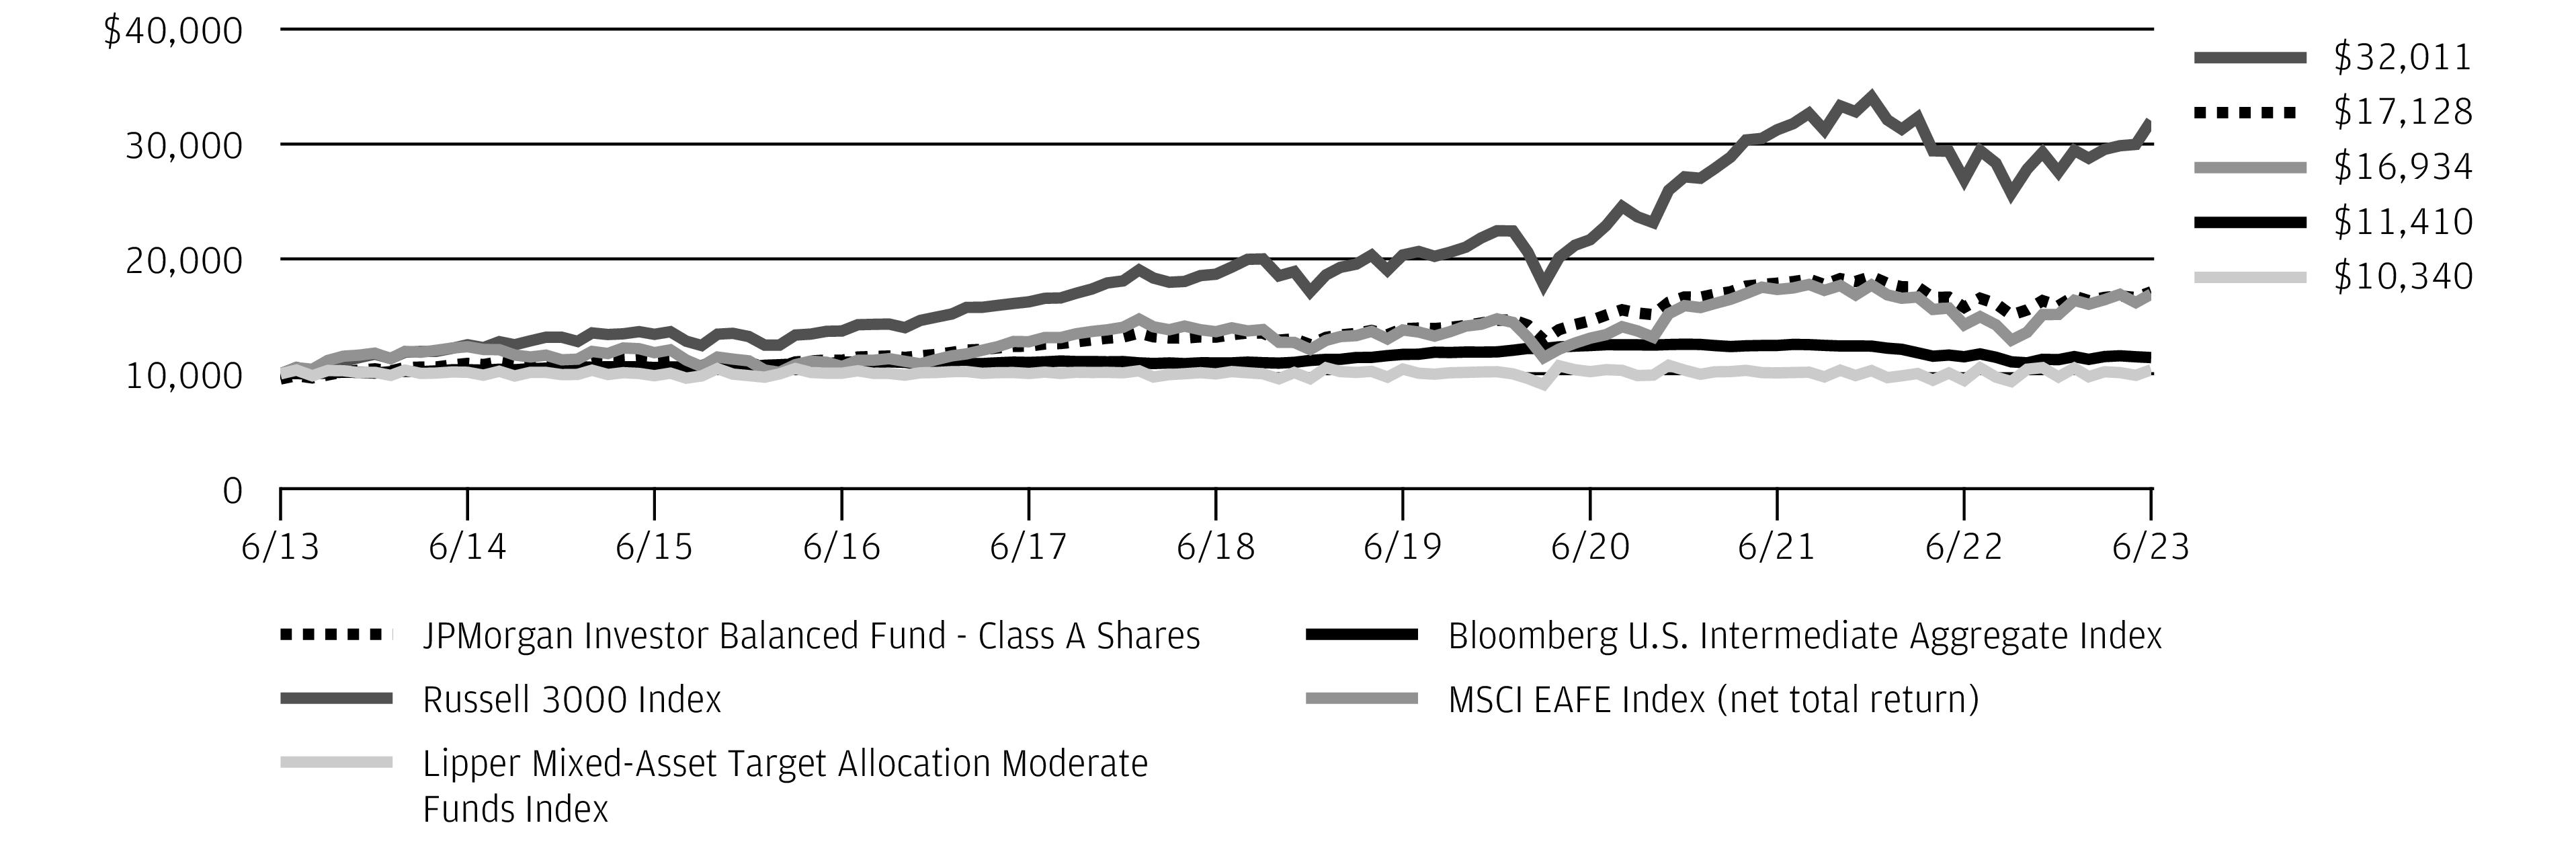
The performance quoted is past performance and is not a guarantee of future results. Mutual funds are subject to certain market risks. Investment returns and principal value of an investment will fluctuate so that an investor’s shares, when redeemed, may be worth more or less than their original cost. Current performance may be higher or lower than the performance data shown. For up-to-date month-end performance information please call 1-800-480-4111.
Returns for Class R6 Shares prior to its inception date are based on the performance of Class I Shares. The actual returns for Class R6 Shares would have been different than those shown because Class R6 Shares have different expenses than Class I Shares.
The graph illustrates comparative performance for $10,000 invested in Class A Shares of the JPMorgan Investor Balanced Fund, the Bloomberg U.S. Intermediate Aggregate Index, the Russell 3000 Index, the MSCI EAFE Index (net total return) and the Lipper Mixed-Asset Target Allocation Moderate Funds Index from June 30, 2013 to June 30, 2023. The performance of the Fund assumes reinvestment of all dividends and capital gain distributions, if any, and includes a sales charge. The performance of the broad-based securities indices and the MSCI EAFE Index (net total return) does not reflect the deduction of expenses or a sales charge associated with a mutual fund and has been adjusted to reflect reinvestment of all dividends and capital gain distributions of the securities included in the benchmark, if applicable. The performance of the Lipper Mixed-Asset Target Allocation Moderate Funds Index, which is not a broad-based securities index, includes expenses associated with a mutual fund, such as investment management fees. These expenses are not identical to the expenses incurred by the Fund. The Bloomberg U.S. Intermediate Aggregate Index is an unmanaged index comprised of U.S. Government, mortgage,
corporate, and asset-backed securities with maturities of one to 10 years. The Russell 3000 Index is an unmanaged index which measures the performance of the 3,000 largest U.S. companies based on total market capitalization, which represents approximately 98% of the investable U.S. equity market. The MSCI EAFE Index (net total return) is a free float-adjusted market capitalization weighted index that is designed to measure the equity market performance of developed markets, excluding the U.S. and Canada. The Lipper Mixed-Asset Target Allocation Moderate Funds Index consists of funds that by portfolio practice maintain a mix of between 40% to 60% equity securities, with the remainder invested in bonds, cash and cash equivalents. Investors cannot invest directly in an index.
Class A Shares have a $500 minimum initial investment and carry a 4.50% sales charge.
Fund performance may reflect the waiver of the Fund’s fees and reimbursement of expenses for certain periods. Without these waivers and reimbursements, performance would have been lower. Also, performance shown in this section does not reflect the deduction of taxes that a shareholder would pay on Fund distributions or on gains resulting from redemptions of Fund shares.
Because Class C Shares automatically convert to Class A Shares after 8 years, the 10 year average annual total return shown above for Class C reflects Class A performance for the period after conversion.
The returns shown are based on net asset values calculated for shareholder transactions and may differ from the returns shown in the financial highlights, which reflect adjustments made to the net asset values in accordance with accounting principles generally accepted in the United States of America.
JPMorgan Investor Conservative Growth Fund
FUND COMMENTARY
TWELVE MONTHS ENDED June 30, 2023 (Unaudited)
AVERAGE ANNUAL TOTAL RETURNS AS OF June 30, 2023
|
| Sales Charge for Class A Shares is 4.50%. |
| Assumes a 1% CDSC (contingent deferred sales charge) for the one year period and 0% CDSC thereafter. |
TEN YEAR FUND PERFORMANCE (6/30/13 TO 6/30/23)
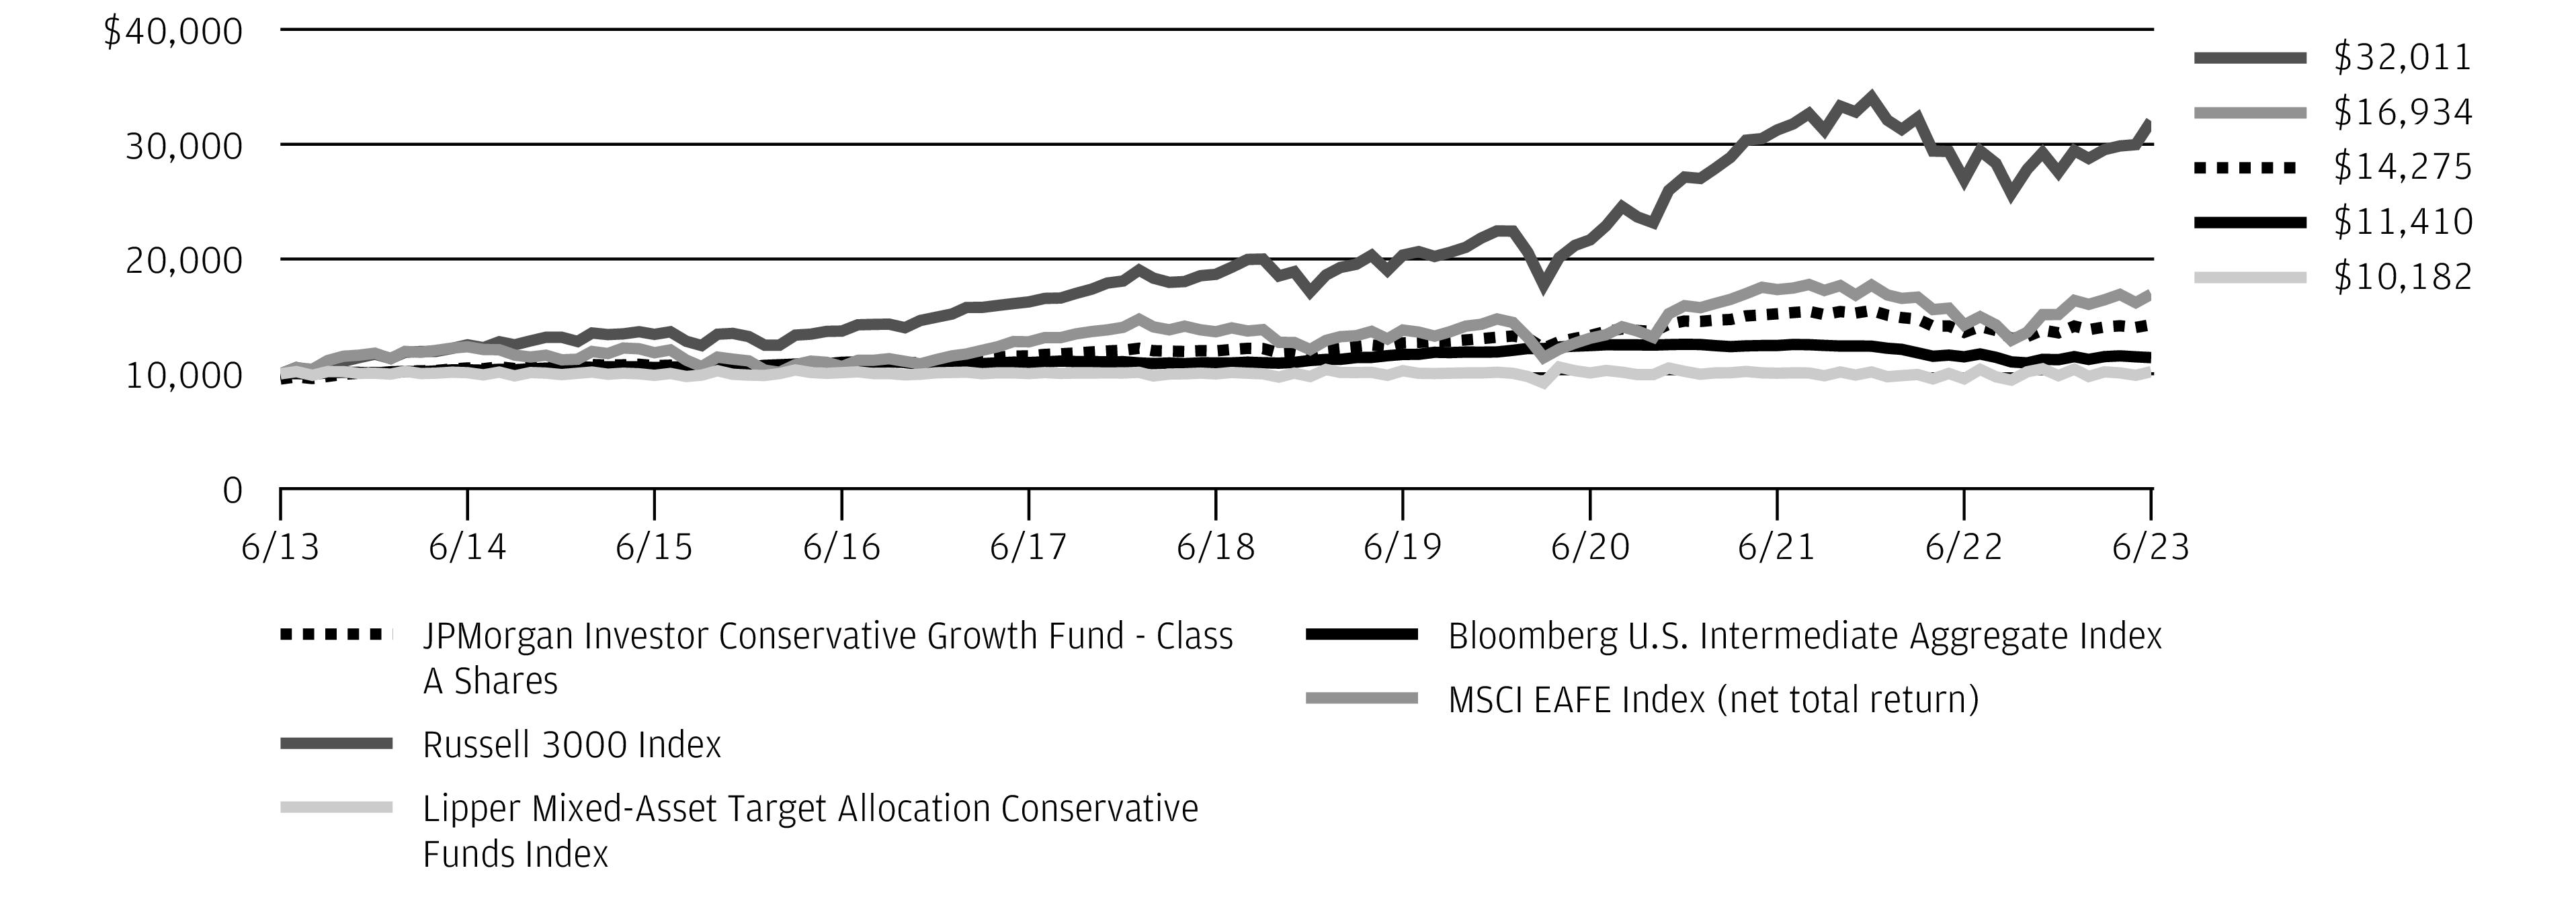
The performance quoted is past performance and is not a guarantee of future results. Mutual funds are subject to certain market risks. Investment returns and principal value of an investment will fluctuate so that an investor’s shares, when redeemed, may be worth more or less than their original cost. Current performance may be higher or lower than the performance data shown. For up-to-date month-end performance information please call 1-800-480-4111.
Returns for Class R6 Shares prior to its inception date are based on the performance of Class I Shares. The actual returns for Class R6 Shares would have been different than those shown because Class R6 Shares have different expenses than Class I Shares.
The graph illustrates comparative performance for $10,000 invested in Class A Shares of the JPMorgan Investor Conservative Growth Fund, the Bloomberg U.S. Intermediate Aggregate Index, the Russell 3000 Index, the MSCI EAFE Index (net total return) and the Lipper Mixed-Asset Target Allocation Conservative Funds Index from June 30, 2013 to June 30, 2023. The performance of the Fund assumes reinvestment of all dividends and capital gain distributions, if any, and includes a sales charge. The performance of the broad-based securities indices and the MSCI EAFE Index (net total return) does not reflect the deduction of expenses or a sales charge associated with a mutual fund and has been adjusted to reflect reinvestment of all dividends and capital gain distributions of the securities included in the benchmark, if applicable. The performance of the Lipper Mixed-Asset Target Allocation Conservative Funds Index, which is not a broad-based securities index, includes expenses associated with a mutual fund, such as investment management fees. These expenses are not identical to the expenses incurred by the Fund. The Bloomberg U.S. Intermediate Aggregate Index is an unmanaged index comprised of U.S. Government, mortgage, corporate, and asset-backed
securities with maturities of one to 10 years. The Russell 3000 Index is an unmanaged index which measures the performance of the 3,000 largest U.S. companies based on total market capitalization, which represents approximately 98% of the investable U.S. equity market. The MSCI EAFE Index (net total return) is a free float-adjusted market capitalization weighted index that is designed to measure the equity market performance of developed markets, excluding the U.S. and Canada. The Lipper Mixed-Asset Target Allocation Conservative Funds Index consists of funds that by portfolio practice maintain a mix of between 20% to 40% equity securities, with the remainder invested in bonds, cash and cash equivalents. Investors cannot invest directly in an index.
Class A Shares have a $500 minimum initial investment and carry a 4.50% sales charge.
Fund performance may reflect the waiver of the Fund’s fees and reimbursement of expenses for certain periods. Without these waivers and reimbursements, performance would have been lower. Also, performance shown in this section does not reflect the deduction of taxes that a shareholder would pay on Fund distributions or on gains resulting from redemptions of Fund shares.
Because Class C Shares automatically convert to Class A Shares after 8 years, the 10 year average annual total return shown above for Class C reflects Class A performance for the period after conversion.
The returns shown are based on net asset values calculated for shareholder transactions and may differ from the returns shown in the financial highlights, which reflect adjustments made to the net asset values in accordance with accounting principles generally accepted in the United States of America.
JPMorgan Investor Growth Fund
FUND COMMENTARY
TWELVE MONTHS ENDED June 30, 2023 (Unaudited)
AVERAGE ANNUAL TOTAL RETURNS AS OF June 30, 2023
|
| Sales Charge for Class A Shares is 4.50%. |
| Assumes a 1% CDSC (contingent deferred sales charge) for the one year period and 0% CDSC thereafter. |
TEN YEAR FUND PERFORMANCE (6/30/13 TO 6/30/23)
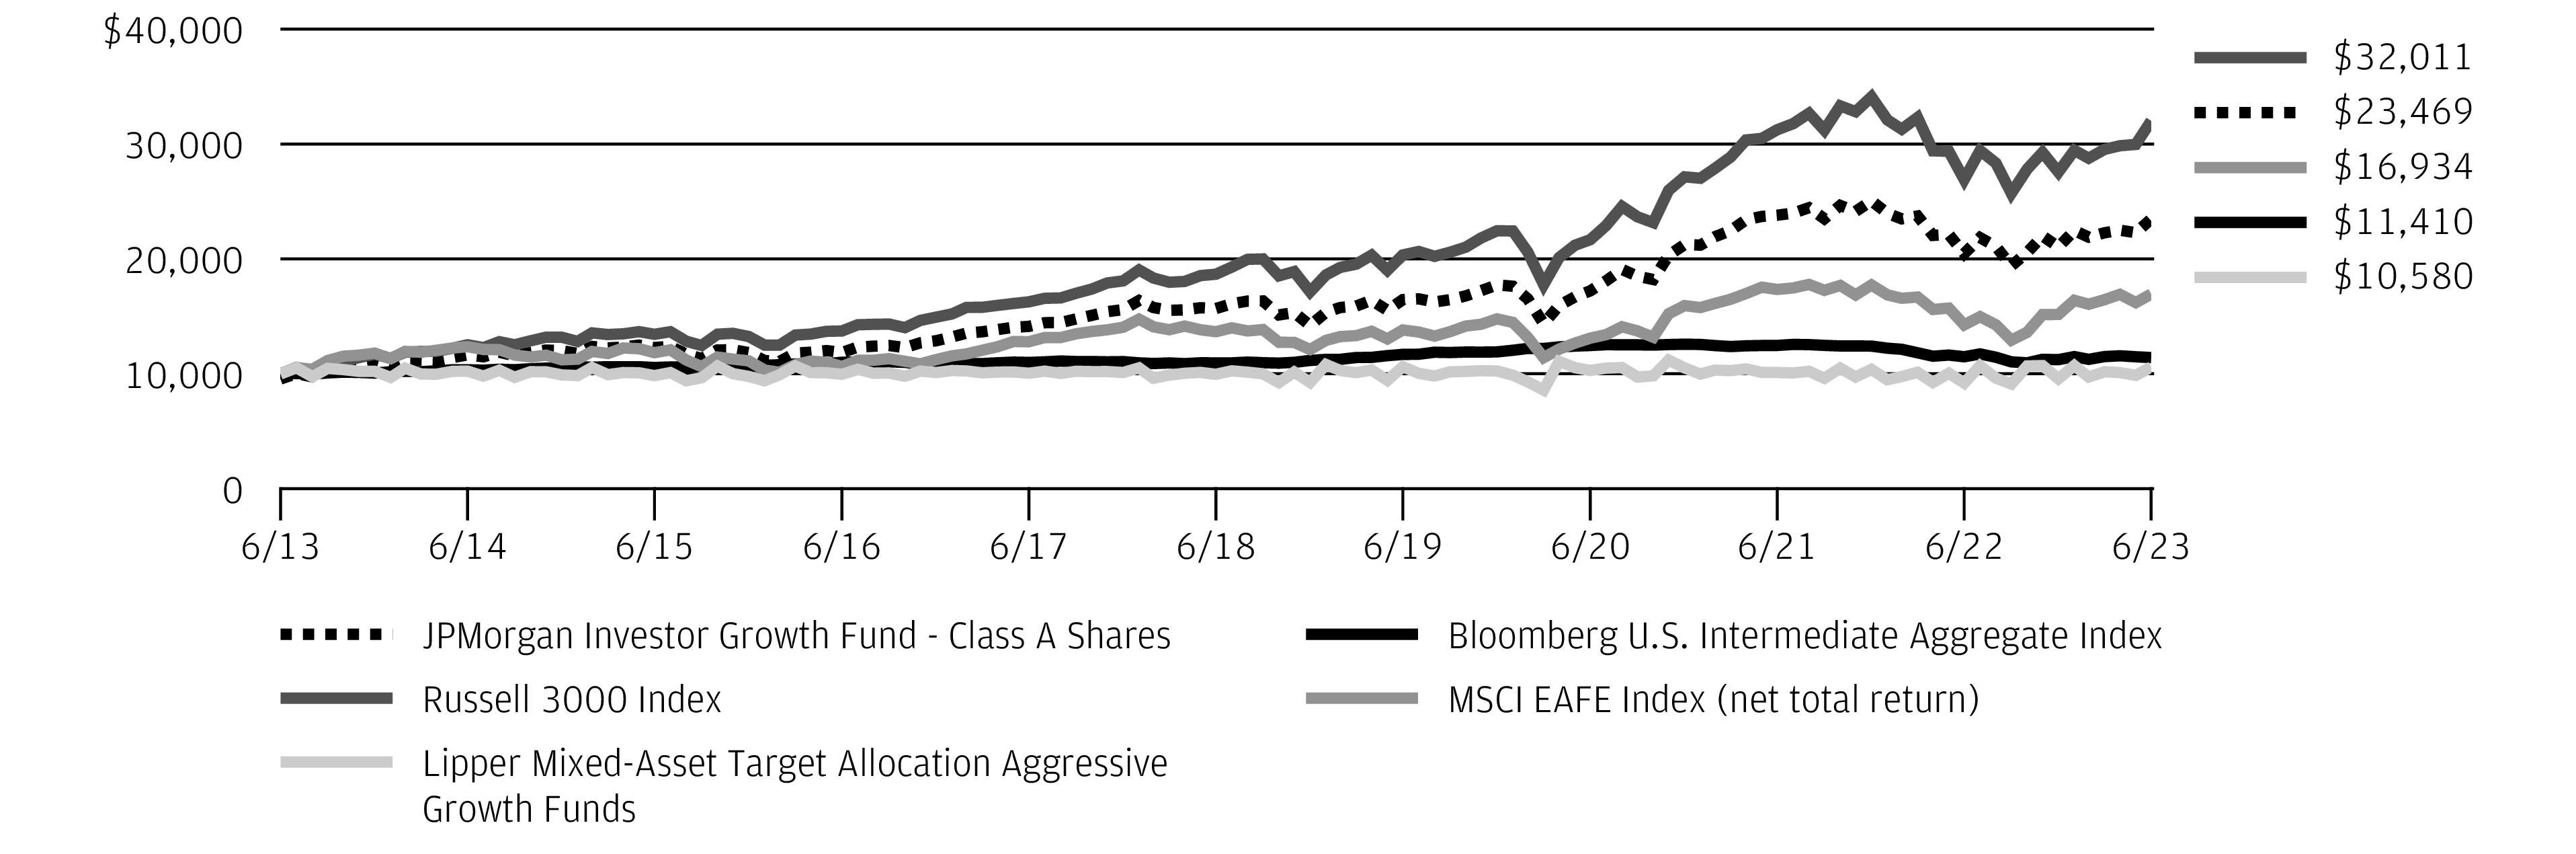
The performance quoted is past performance and is not a guarantee of future results. Mutual funds are subject to certain market risks. Investment returns and principal value of an investment will fluctuate so that an investor’s shares, when redeemed, may be worth more or less than their original cost. Current performance may be higher or lower than the performance data shown. For up-to-date month-end performance information please call 1-800-480-4111.
Returns for Class R6 Shares prior to their inception date are based on the performance of Class I Shares. The actual returns for Class R6 Shares would have been different than those shown because Class R6 Shares have different expenses than Class I Shares.
The graph illustrates comparative performance for $10,000 invested in Class A Shares of the JPMorgan Investor Growth Fund, the Bloomberg U.S. Intermediate Aggregate Index, the Russell 3000 Index, the MSCI EAFE Index (net total return) and the Lipper Mixed-Asset Target Allocation Conservative Funds Index from June 30, 2013 to June 30, 2023. The performance of the Fund assumes reinvestment of all dividends and capital gain distributions, if any, and includes a sales charge. The performance of the broad-based securities indices and the MSCI EAFE Index (net total return) does not reflect the deduction of expenses or a sales charge associated with a mutual fund and has been adjusted to reflect reinvestment of all dividends and capital gain distributions of the securities included in the benchmark, if applicable. The performance of the Lipper Mixed-Asset Target Allocation Conservative Funds Index, which is not a broad-based securities index, includes expenses associated with a mutual fund, such as investment management fees. These expenses are not identical to the expenses incurred by the Fund. The Bloomberg U.S. Intermediate Aggregate Index is an unmanaged index comprised of U.S. Government, mortgage,
corporate, and asset-backed securities with maturities of one to 10 years. The Russell 3000 Index is an unmanaged index which measures the performance of the 3,000 largest U.S. companies based on total market capitalization, which represents approximately 98% of the investable U.S. equity market. The MSCI EAFE Index (net total return) is a free float-adjusted market capitalization weighted index that is designed to measure the equity market performance of developed markets, excluding the U.S. and Canada. The Lipper Mixed-Asset Target Allocation Conservative Funds Index consists of funds that by portfolio practice maintain a mix of between 20% to 40% equity securities, with the remainder invested in bonds, cash and cash equivalents. Investors cannot invest directly in an index.
Class A Shares have a $500 minimum initial investment and carry a 4.50% sales charge.
Fund performance may reflect the waiver of the Fund’s fees and reimbursement of expenses for certain periods. Without these waivers and reimbursements, performance would have been lower. Also, performance shown in this section does not reflect the deduction of taxes that a shareholder would pay on Fund distributions or on gains resulting from redemptions of Fund shares.
Because Class C Shares automatically convert to Class A Shares after 8 years, the 10 year average annual total return shown above for Class C reflects Class A performance for the period after conversion.
The returns shown are based on net asset values calculated for shareholder transactions and may differ from the returns shown in the financial highlights, which reflect adjustments made to the net asset values in accordance with accounting principles generally accepted in the United States of America.
JPMorgan Investor Growth & Income Fund
FUND COMMENTARY
TWELVE MONTHS ENDED June 30, 2023 (Unaudited)
AVERAGE ANNUAL TOTAL RETURNS AS OF June 30, 2023
|
| Sales Charge for Class A Shares is 4.50%. |
| Assumes a 1% CDSC (contingent deferred sales charge) for the one year period and 0% CDSC thereafter. |
TEN YEAR FUND PERFORMANCE (6/30/13 TO 6/30/23)
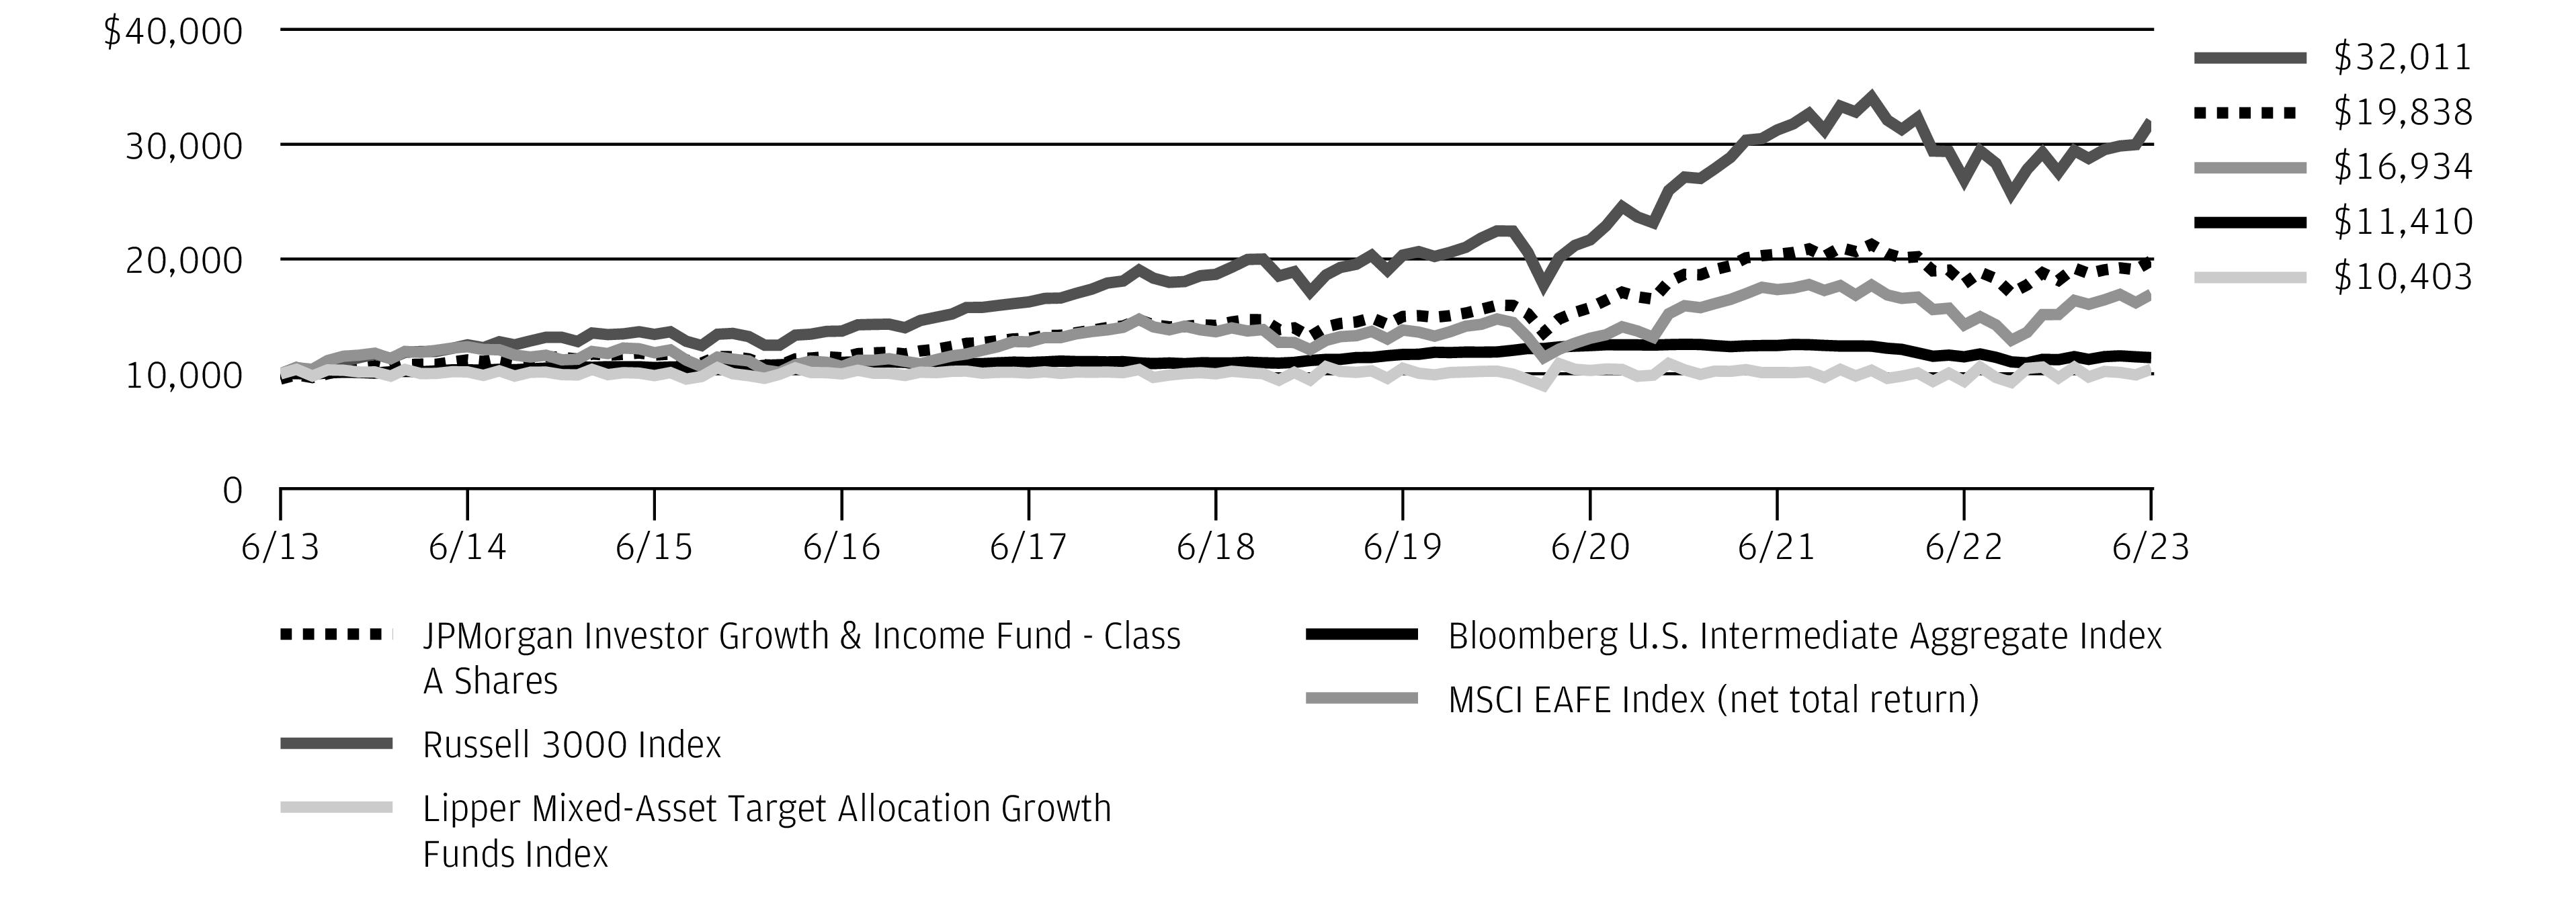
The performance quoted is past performance and is not a guarantee of future results. Mutual funds are subject to certain market risks. Investment returns and principal value of an investment will fluctuate so that an investor’s shares, when redeemed, may be worth more or less than their original cost. Current performance may be higher or lower than the performance data shown. For up-to-date month-end performance information please call 1-800-480-4111.
Returns for Class R6 Shares prior to its inception date are based on the performance of Class I Shares. The actual returns for Class R6 Shares would have been different than those shown because Class R6 Shares have different expenses than Class I Shares.
The graph illustrates comparative performance for $10,000 invested in Class A Shares of the JPMorgan Investor Growth & Income Fund, the Bloomberg U.S. Intermediate Aggregate Index, the Russell 3000 Index, the MSCI EAFE Index (net total return) and the Lipper Mixed-Asset Target Allocation Growth Funds Index from June 30, 2013 to June 30, 2023. The performance of the Fund assumes reinvestment of all dividends and capital gain distributions, if any, and includes a sales charge. The performance of the broadbased securities indices and the MSCI EAFE Index (net total return) does not reflect the deduction of expenses or a sales charge associated with a mutual fund and has been adjusted to reflect reinvestment of all dividends and capital gain distributions of the securities included in the benchmark, if applicable. The performance of the Lipper Mixed-Asset Target Allocation Growth Funds Index, which is not a broad-based securities index, includes expenses associated with a mutual fund, such as investment management fees. These expenses are not identical to the expenses incurred by the Fund. The Bloomberg U.S. Intermediate Aggregate Index is an unmanaged index comprised of U.S. Government, mortgage,
corporate, and asset-backed securities with maturities of one to 10 years. The Russell 3000 Index is an unmanaged index which measures the performance of the 3,000 largest U.S. companies based on total market capitalization, which represents approximately 98% of the investable U.S. equity market. The MSCI EAFE Index (net total return) is a free float-adjusted market capitalization weighted index that is designed to measure the equity market performance of developed markets, excluding the U.S. and Canada. The Lipper Mixed-Asset Target Allocation Growth Funds Index consists of funds that by portfolio practice maintain a mix of between 60% to 80% equity securities, with the remainder invested in bonds, cash and cash equivalents. Investors cannot invest directly in an index.
Class A Shares have a $500 minimum initial investment and carry a 4.50% sales charge.
Fund performance may reflect the waiver of the Fund’s fees and reimbursement of expenses for certain periods. Without these waivers and reimbursements, performance would have been lower. Also, performance shown in this section does not reflect the deduction of taxes that a shareholder would pay on Fund distributions or on gains resulting from redemptions of Fund shares. Because Class C Shares automatically convert to Class A Shares after 8 years, the 10 year average annual total return shown above for Class C reflects Class A performance for the period after conversion.
The returns shown are based on net asset values calculated for shareholder transactions and may differ from the returns shown in the financial highlights, which reflect adjustments made to the net asset values in accordance with accounting principles generally accepted in the United States of America.
JPMorgan Investor Balanced Fund
SCHEDULE OF PORTFOLIO INVESTMENTS
AS OF June 30, 2023
| | |
Investment Companies — 89.8% |
Alternative Assets — 0.8% |
JPMorgan Unconstrained Debt Fund Class R6 Shares (a) | | |
|
JPMorgan Core Bond Fund Class R6 Shares (a) | | |
JPMorgan Core Plus Bond Fund Class R6 Shares (a) | | |
JPMorgan Emerging Markets Debt Fund Class R6 Shares (a) | | |
JPMorgan High Yield Fund Class R6 Shares (a) | | |
JPMorgan Income Fund Class R6 Shares (a) | | |
JPMorgan Limited Duration Bond Fund Class R6 Shares (a) | | |
JPMorgan Short Duration Core Plus Fund Class R6 Shares (a) | | |
| | |
International Equity — 6.6% |
JPMorgan Emerging Markets Equity Fund Class R6 Shares (a) | | |
JPMorgan Emerging Markets Research Enhanced Equity Fund Class R6 Shares (a) | | |
JPMorgan Europe Dynamic Fund Class R6 Shares (a) | | |
JPMorgan International Equity Fund Class R6 Shares (a) | | |
Total International Equity | | |
|
JPMorgan Equity Income Fund Class R6 Shares (a) | | |
JPMorgan Large Cap Growth Fund Class R6 Shares (a) | | |
JPMorgan Large Cap Value Fund Class R6 Shares (a) | | |
JPMorgan Mid Cap Growth Fund Class R6 Shares * (a) | | |
JPMorgan Small Cap Equity Fund Class R6 Shares (a) | | |
JPMorgan Small Cap Value Fund Class R6 Shares (a) | | |
JPMorgan U.S. Equity Fund Class R6 Shares (a) | | |
JPMorgan U.S. GARP Equity Fund Class R6 Shares (a) | | |
JPMorgan U.S. Research Enhanced Equity Fund Class R6 Shares (a) | | |
JPMorgan Value Advantage Fund Class R6 Shares (a) | | |
| | |
Total Investment Companies
(Cost $4,098,017) | | |
| | |
Exchange-Traded Funds — 9.2% |
Alternative Assets — 0.3% |
JPMorgan Realty Income ETF (a) | | |
International Equity — 5.5% |
JPMorgan International Research Enhanced Equity ETF (a) | | |
|
JPMorgan Market Expansion Enhanced Equity ETF (a) | | |
Total Exchange-Traded Funds
(Cost $382,560) | | |
Short-Term Investments — 1.1% |
Investment Companies — 1.1% |
JPMorgan U.S. Government Money Market Fund Class IM Shares, 5.05% (a) (b)
(Cost $58,666) | | |
Total Investments — 100.1%
(Cost $4,539,243) | | |
Liabilities in Excess of Other Assets — (0.1)% | | |
| | |
Percentages indicated are based on net assets. |
| Non-income producing security. |
| Investment in an affiliated fund, which is registered under the Investment Company Act of 1940, as amended, and is advised by J.P. Morgan Investment Management Inc. |
| The rate shown is the current yield as of June 30, 2023. |
Detailed information about investment portfolios of the underlying funds and ETFs can be found in shareholder reports filed with the Securities and Exchange Commission (SEC) by each such underlying fund semi-annually on Form N-CSR and in portfolio holdings filed quarterly on Form N-PORT, and are available for download from both the SEC’s as well as each respective underlying fund’s website. Detailed information about underlying J.P. Morgan Funds can also be found at www.jpmorganfunds.com or by calling 1-800-480-4111.
SEE NOTES TO FINANCIAL STATEMENTS.
| J.P. Morgan Investor Funds | |
JPMorgan Investor Conservative Growth Fund
SCHEDULE OF PORTFOLIO INVESTMENTS
AS OF June 30, 2023
| | |
Investment Companies — 93.8% |
Alternative Assets — 1.0% |
JPMorgan Unconstrained Debt Fund Class R6 Shares (a) | | |
|
JPMorgan Core Bond Fund Class R6 Shares (a) | | |
JPMorgan Core Plus Bond Fund Class R6 Shares (a) | | |
JPMorgan Emerging Markets Debt Fund Class R6 Shares (a) | | |
JPMorgan Government Bond Fund Class R6 Shares (a) | | |
JPMorgan High Yield Fund Class R6 Shares (a) | | |
JPMorgan Income Fund Class R6 Shares (a) | | |
JPMorgan Limited Duration Bond Fund Class R6 Shares (a) | | |
JPMorgan Short Duration Core Plus Fund Class R6 Shares (a) | | |
| | |
International Equity — 4.3% |
JPMorgan Emerging Markets Equity Fund Class R6 Shares (a) | | |
JPMorgan Emerging Markets Research Enhanced Equity Fund Class R6 Shares (a) | | |
JPMorgan Europe Dynamic Fund Class R6 Shares (a) | | |
JPMorgan International Equity Fund Class R6 Shares (a) | | |
Total International Equity | | |
|
JPMorgan Equity Income Fund Class R6 Shares (a) | | |
JPMorgan Large Cap Growth Fund Class R6 Shares (a) | | |
JPMorgan Large Cap Value Fund Class R6 Shares (a) | | |
JPMorgan Mid Cap Growth Fund Class R6 Shares * (a) | | |
JPMorgan Small Cap Equity Fund Class R6 Shares (a) | | |
JPMorgan Small Cap Value Fund Class R6 Shares (a) | | |
JPMorgan U.S. Equity Fund Class R6 Shares (a) | | |
JPMorgan U.S. GARP Equity Fund Class R6 Shares (a) | | |
JPMorgan U.S. Research Enhanced Equity Fund Class R6 Shares (a) | | |
JPMorgan Value Advantage Fund Class R6 Shares (a) | | |
| | |
Total Investment Companies
(Cost $3,693,545) | | |
| | |
Exchange-Traded Funds — 5.4% |
Alternative Assets — 0.1% |
JPMorgan Realty Income ETF (a) | | |
International Equity — 3.9% |
JPMorgan International Research Enhanced Equity ETF (a) | | |
|
JPMorgan Market Expansion Enhanced Equity ETF (a) | | |
Total Exchange-Traded Funds
(Cost $170,386) | | |
Short-Term Investments — 1.0% |
Investment Companies — 1.0% |
JPMorgan U.S. Government Money Market Fund Class IM Shares, 5.05% (a) (b)
(Cost $40,895) | | |
Total Investments — 100.2%
(Cost $3,904,826) | | |
Liabilities in Excess of Other Assets — (0.2)% | | |
| | |
Percentages indicated are based on net assets. |
| Non-income producing security. |
| Investment in an affiliated fund, which is registered under the Investment Company Act of 1940, as amended, and is advised by J.P. Morgan Investment Management Inc. |
| The rate shown is the current yield as of June 30, 2023. |
Detailed information about investment portfolios of the underlying funds and ETFs can be found in shareholder reports filed with the Securities and Exchange Commission (SEC) by each such underlying fund semi-annually on Form N-CSR and in portfolio holdings filed quarterly on Form N-PORT, and are available for download from both the SEC’s as well as each respective underlying fund’s website. Detailed information about underlying J.P. Morgan Funds can also be found at www.jpmorganfunds.com or by calling 1-800-480-4111.
SEE NOTES TO FINANCIAL STATEMENTS.
| J.P. Morgan Investor Funds | |
JPMorgan Investor Growth Fund
SCHEDULE OF PORTFOLIO INVESTMENTS
AS OF June 30, 2023
| | |
Investment Companies — 84.9% |
|
JPMorgan Core Bond Fund Class R6 Shares (a) | | |
JPMorgan Core Plus Bond Fund Class R6 Shares (a) | | |
JPMorgan Emerging Markets Debt Fund Class R6 Shares (a) | | |
JPMorgan High Yield Fund Class R6 Shares (a) | | |
JPMorgan Income Fund Class R6 Shares (a) | | |
| | |
International Equity — 14.8% |
JPMorgan Emerging Markets Equity Fund Class R6 Shares (a) | | |
JPMorgan Emerging Markets Research Enhanced Equity Fund Class R6 Shares (a) | | |
JPMorgan Europe Dynamic Fund Class R6 Shares (a) | | |
JPMorgan International Equity Fund Class R6 Shares (a) | | |
JPMorgan International Focus Fund Class R6 Shares (a) | | |
Total International Equity | | |
|
JPMorgan Equity Income Fund Class R6 Shares (a) | | |
JPMorgan Large Cap Growth Fund Class R6 Shares (a) | | |
JPMorgan Large Cap Value Fund Class R6 Shares (a) | | |
JPMorgan Mid Cap Growth Fund Class R6 Shares * (a) | | |
JPMorgan Small Cap Equity Fund Class R6 Shares (a) | | |
JPMorgan Small Cap Value Fund Class R6 Shares (a) | | |
JPMorgan U.S. Equity Fund Class R6 Shares (a) | | |
JPMorgan U.S. GARP Equity Fund Class R6 Shares (a) | | |
JPMorgan U.S. Research Enhanced Equity Fund Class R6 Shares (a) | | |
JPMorgan Value Advantage Fund Class R6 Shares (a) | | |
| | |
Total Investment Companies
(Cost $2,904,549) | | |
Exchange-Traded Funds — 13.3% |
Alternative Assets — 0.4% |
JPMorgan Realty Income ETF (a) | | |
| | |
|
International Equity — 8.0% |
JPMorgan International Research Enhanced Equity ETF (a) | | |
|
JPMorgan Market Expansion Enhanced Equity ETF (a) | | |
Total Exchange-Traded Funds
(Cost $539,741) | | |
Short-Term Investments — 1.8% |
Investment Companies — 1.8% |
JPMorgan U.S. Government Money Market Fund Class IM Shares, 5.05% (a) (b)
(Cost $80,034) | | |
Total Investments — 100.0%
(Cost $3,524,324) | | |
Liabilities in Excess of Other Assets — (0.0)% ^ | | |
| | |
Percentages indicated are based on net assets. |
| Amount rounds to less than 0.1% of net assets. |
| Non-income producing security. | |
| Investment in an affiliated fund, which is registered under the Investment Company Act of 1940, as amended, and is advised by J.P. Morgan Investment Management Inc. | |
| The rate shown is the current yield as of June 30, 2023. | |
Detailed information about investment portfolios of the underlying funds and ETFs can be found in shareholder reports filed with the Securities and Exchange Commission (SEC) by each such underlying fund semi-annually on Form N-CSR and in portfolio holdings filed quarterly on Form N-PORT, and are available for download from both the SEC’s as well as each respective underlying fund’s website. Detailed information about underlying J.P. Morgan Funds can also be found at www.jpmorganfunds.com or by calling 1-800-480-4111.
SEE NOTES TO FINANCIAL STATEMENTS.
| J.P. Morgan Investor Funds | |
JPMorgan Investor Growth & Income Fund
SCHEDULE OF PORTFOLIO INVESTMENTS
AS OF June 30, 2023
| | |
Investment Companies — 88.8% |
|
JPMorgan Core Bond Fund Class R6 Shares (a) | | |
JPMorgan Core Plus Bond Fund Class R6 Shares (a) | | |
JPMorgan Emerging Markets Debt Fund Class R6 Shares (a) | | |
JPMorgan High Yield Fund Class R6 Shares (a) | | |
JPMorgan Income Fund Class R6 Shares (a) | | |
JPMorgan Limited Duration Bond Fund Class R6 Shares (a) | | |
JPMorgan Short Duration Core Plus Fund Class R6 Shares (a) | | |
| | |
International Equity — 10.0% |
JPMorgan Emerging Markets Equity Fund Class R6 Shares (a) | | |
JPMorgan Emerging Markets Research Enhanced Equity Fund Class R6 Shares (a) | | |
JPMorgan Europe Dynamic Fund Class R6 Shares (a) | | |
JPMorgan International Equity Fund Class R6 Shares (a) | | |
JPMorgan International Focus Fund Class R6 Shares (a) | | |
Total International Equity | | |
|
JPMorgan Equity Income Fund Class R6 Shares (a) | | |
JPMorgan Large Cap Growth Fund Class R6 Shares (a) | | |
JPMorgan Large Cap Value Fund Class R6 Shares (a) | | |
JPMorgan Mid Cap Growth Fund Class R6 Shares * (a) | | |
JPMorgan Small Cap Equity Fund Class R6 Shares (a) | | |
JPMorgan Small Cap Value Fund Class R6 Shares (a) | | |
JPMorgan U.S. Equity Fund Class R6 Shares (a) | | |
JPMorgan U.S. GARP Equity Fund Class R6 Shares (a) | | |
JPMorgan U.S. Research Enhanced Equity Fund Class R6 Shares (a) | | |
JPMorgan Value Advantage Fund Class R6 Shares (a) | | |
| | |
Total Investment Companies
(Cost $2,912,110) | | |
| | |
Exchange-Traded Funds — 10.0% |
Alternative Assets — 0.3% |
JPMorgan Realty Income ETF (a) | | |
International Equity — 5.7% |
JPMorgan International Research Enhanced Equity ETF (a) | | |
|
JPMorgan Market Expansion Enhanced Equity ETF (a) | | |
Total Exchange-Traded Funds
(Cost $341,035) | | |
Short-Term Investments — 1.3% |
Investment Companies — 1.3% |
JPMorgan U.S. Government Money Market Fund Class IM Shares, 5.05% (a) (b)
(Cost $51,543) | | |
Total Investments — 100.1%
(Cost $3,304,688) | | |
Liabilities in Excess of Other Assets — (0.1)% | | |
| | |
Percentages indicated are based on net assets. |
| Non-income producing security. |
| Investment in an affiliated fund, which is registered under the Investment Company Act of 1940, as amended, and is advised by J.P. Morgan Investment Management Inc. |
| The rate shown is the current yield as of June 30, 2023. |
Detailed information about investment portfolios of the underlying funds and ETFs can be found in shareholder reports filed with the Securities and Exchange Commission (SEC) by each such underlying fund semi-annually on Form N-CSR and in portfolio holdings filed quarterly on Form N-PORT, and are available for download from both the SEC’s as well as each respective underlying fund’s website. Detailed information about underlying J.P. Morgan Funds can also be found at www.jpmorganfunds.com or by calling 1-800-480-4111.
SEE NOTES TO FINANCIAL STATEMENTS.
| J.P. Morgan Investor Funds | |
STATEMENTS OF ASSETS AND LIABILITIES
AS OF June 30, 2023
(Amounts in thousands, except per share amounts)
| JPMorgan
Investor
Balanced Fund | JPMorgan
Investor
Conservative
Growth Fund | JPMorgan
Investor
Growth
Fund | |
| | | | |
Investments in affiliates, at value | | | | |
| | | | |
| | | | |
| | | | |
Dividends from affiliates | | | | |
| | | | |
| | | | |
| | | | |
| | | | |
Investment securities purchased | | | | |
| | | | |
| | | | |
| | | | |
| | | | |
| | | | |
Custodian and accounting fees | | | | |
Trustees’ and Chief Compliance Officer’s fees | | | | |
| | | | |
| | | | |
| | | | |
(a)
Amount rounds to less than one thousand.
SEE NOTES TO FINANCIAL STATEMENTS.
| J.P. Morgan Investor Funds | |
STATEMENTS OF ASSETS AND LIABILITIES
AS OF June 30, 2023 (continued)
(Amounts in thousands, except per share amounts)
| JPMorgan Investor Balanced Fund | JPMorgan Investor Conservative Growth Fund | JPMorgan Investor Growth Fund | |
| | | | |
| | | | |
Total distributable earnings (loss) | | | | |
| | | | |
| | | | |
| | | | |
| | | | |
| | | | |
| | | | |
| | | | |
Outstanding units of beneficial interest (shares)
($0.0001 par value; unlimited number of shares authorized): | | | | |
| | | | |
| | | | |
| | | | |
| | | | |
| | | | |
Class A — Redemption price per share | | | | |
Class C — Offering price per share (b) | | | | |
Class I — Offering and redemption price per share | | | | |
Class R6 — Offering and redemption price per share | | | | |
Class A maximum sales charge | | | | |
Class A maximum public offering price per share
[net asset value per share/(100% – maximum sales charge)] | | | | |
Cost of investments in affiliates | | | | |
(a)
Per share amounts may not recalculate due to rounding of net assets and/or shares outstanding.
(b)
Redemption price for Class C Shares varies based upon length of time the shares are held.
SEE NOTES TO FINANCIAL STATEMENTS.
| J.P. Morgan Investor Funds | |
STATEMENTS OF OPERATIONS
FOR THE YEAR ENDED June 30, 2023
(Amounts in thousands)
| JPMorgan
Investor
Balanced Fund | JPMorgan
Investor
Conservative
Growth Fund | JPMorgan
Investor
Growth
Fund | |
| | | | |
Interest income from affiliates | | | | |
Dividend income from affiliates | | | | |
| | | | |
| | | | |
| | | | |
| | | | |
| | | | |
| | | | |
| | | | |
| | | | |
| | | | |
| | | | |
Custodian and accounting fees | | | | |
| | | | |
Trustees’ and Chief Compliance Officer’s fees | | | | |
Printing and mailing costs | | | | |
Registration and filing fees | | | | |
Transfer agency fees (See Note 2.D.) | | | | |
| | | | |
| | | | |
| | | | |
Less expense reimbursements | | | | |
| | | | |
Net investment income (loss) | | | | |
REALIZED/UNREALIZED GAINS (LOSSES): | | | | |
Net realized gain (loss) on transactions from investments in affiliates | | | | |
Distribution of capital gains received from investment company affiliates | | | | |
Change in net unrealized appreciation/depreciation on investments in affiliates | | | | |
Net realized/unrealized gains (losses) | | | | |
Change in net assets resulting from operations | | | | |
(a)
Amount rounds to less than one thousand.
SEE NOTES TO FINANCIAL STATEMENTS.
| J.P. Morgan Investor Funds | |
STATEMENTS OF CHANGES IN NET ASSETS
FOR THE PERIODS INDICATED
(Amounts in thousands)
| JPMorgan Investor Balanced Fund | JPMorgan Investor Conservative
Growth Fund |
| | | | |
CHANGE IN NET ASSETS RESULTING FROM OPERATIONS: | | | | |
Net investment income (loss) | | | | |
Net realized gain (loss) on investments in affiliates | | | | |
Distributions of capital gains received from investment company affiliates | | | | |
Change in net unrealized appreciation/depreciation of investments in affiliates | | | | |
Change in net assets resulting from operations | | | | |
DISTRIBUTIONS TO SHAREHOLDERS: | | | | |
| | | | |
| | | | |
| | | | |
| | | | |
Total distributions to shareholders | | | | |
| | | | |
Change in net assets resulting from capital transactions | | | | |
| | | | |
| | | | |
| | | | |
| | | | |
SEE NOTES TO FINANCIAL STATEMENTS.
| J.P. Morgan Investor Funds | |
| JPMorgan Investor Growth Fund | JPMorgan Investor Growth &
Income Fund |
| | | | |
CHANGE IN NET ASSETS RESULTING FROM OPERATIONS: | | | | |
Net investment income (loss) | | | | |
Net realized gain (loss) on investments in affiliates | | | | |
Distributions of capital gains received from investment company affiliates | | | | |
Change in net unrealized appreciation/depreciation of investments in affiliates | | | | |
Change in net assets resulting from operations | | | | |
DISTRIBUTIONS TO SHAREHOLDERS: | | | | |
| | | | |
| | | | |
| | | | |
| | | | |
Total distributions to shareholders | | | | |
| | | | |
Change in net assets resulting from capital transactions | | | | |
| | | | |
| | | | |
| | | | |
| | | | |
SEE NOTES TO FINANCIAL STATEMENTS.
| J.P. Morgan Investor Funds | |
STATEMENTS OF CHANGES IN NET ASSETS
FOR THE PERIODS INDICATED (continued)
(Amounts in thousands)
| JPMorgan Investor Balanced Fund | JPMorgan Investor Conservative
Growth Fund |
| | | | |
| | | | |
| | | | |
Proceeds from shares issued | | | | |
| | | | |
| | | | |
Change in net assets resulting from Class A capital transactions | | | | |
| | | | |
Proceeds from shares issued | | | | |
| | | | |
| | | | |
Change in net assets resulting from Class C capital transactions | | | | |
| | | | |
Proceeds from shares issued | | | | |
| | | | |
| | | | |
Change in net assets resulting from Class I capital transactions | | | | |
| | | | |
Proceeds from shares issued | | | | |
| | | | |
| | | | |
Change in net assets resulting from Class R6 capital transactions | | | | |
Total change in net assets resulting from capital transactions | | | | |
| | | | |
| | | | |
| | | | |
| | | | |
| | | | |
| | | | |
| | | | |
| | | | |
| | | | |
| | | | |
| | | | |
| | | | |
| | | | |
| | | | |
| | | | |
| | | | |
SEE NOTES TO FINANCIAL STATEMENTS.
| J.P. Morgan Investor Funds | |
| JPMorgan Investor Balanced Fund | JPMorgan Investor Conservative Growth Fund |
| | | | |
SHARE TRANSACTIONS: (continued) | | | | |
| | | | |
| | | | |
| | | | |
| | | | |
Change in Class R6 Shares | | | | |
SEE NOTES TO FINANCIAL STATEMENTS.
| J.P. Morgan Investor Funds | |
STATEMENTS OF CHANGES IN NET ASSETS
FOR THE PERIODS INDICATED (continued)
(Amounts in thousands)
| JPMorgan Investor Growth Fund | JPMorgan Investor Growth &
Income Fund |
| | | | |
| | | | |
| | | | |
Proceeds from shares issued | | | | |
| | | | |
| | | | |
Change in net assets resulting from Class A capital transactions | | | | |
| | | | |
Proceeds from shares issued | | | | |
| | | | |
| | | | |
Change in net assets resulting from Class C capital transactions | | | | |
| | | | |
Proceeds from shares issued | | | | |
| | | | |
| | | | |
Change in net assets resulting from Class I capital transactions | | | | |
| | | | |
Proceeds from shares issued | | | | |
| | | | |
| | | | |
Change in net assets resulting from Class R6 capital transactions | | | | |
Total change in net assets resulting from capital transactions | | | | |
| | | | |
| | | | |
| | | | |
| | | | |
| | | | |
| | | | |
| | | | |
| | | | |
| | | | |
| | | | |
| | | | |
| | | | |
| | | | |
| | | | |
| | | | |
| | | | |
SEE NOTES TO FINANCIAL STATEMENTS.
| J.P. Morgan Investor Funds | |
| JPMorgan Investor Growth Fund | JPMorgan Investor Growth & Income Fund |
| | | | |
SHARE TRANSACTIONS: (continued) | | | | |
| | | | |
| | | | |
| | | | |
| | | | |
Change in Class R6 Shares | | | | |
SEE NOTES TO FINANCIAL STATEMENTS.
| J.P. Morgan Investor Funds | |
FINANCIAL HIGHLIGHTS
FOR THE PERIODS INDICATED
| Per share operating performance |
| | | |
| Net asset
value,
beginning
of period | Net
investment
income
(loss)(a)(b) | Net realized
and unrealized
gains
(losses) on
investments | Total from
investment
operations | | | |
JPMorgan Investor Balanced Fund | | | | | | | |
| | | | | | | |
| | | | | | | |
| | | | | | | |
| | | | | | | |
| | | | | | | |
| | | | | | | |
| | | | | | | |
| | | | | | | |
| | | | | | | |
| | | | | | | |
| | | | | | | |
| | | | | | | |
| | | | | | | |
| | | | | | | |
| | | | | | | |
| | | | | | | |
| | | | | | | |
| | | | | | | |
| | | | | | | |
| | | | | | | |
| | | | | | | |
| | | | | | | |
| | | | | | | |
| | | | | | | |
|
| Net investment income (loss) is affected by the timing of distributions from Underlying Funds. |
| Calculated based upon average shares outstanding. |
| Includes adjustments in accordance with accounting principles generally accepted in the United States of America and as such, the net asset values for financial reporting purposes and the returns based upon those net asset values may differ from the net asset values and returns for shareholder transactions. |
| Includes interest expense, if applicable, each of which is less than 0.005% unless otherwise noted. |
| Does not include expenses of Underlying Funds. |
SEE NOTES TO FINANCIAL STATEMENTS.
| J.P. Morgan Investor Funds | |
| |
| | | Ratios to average net assets |
Net asset
value,
end of
period | Total return
(excludes
sales charge)(c) | Net assets,
end of
period
(000's) | | Net
investment
income
(loss) | Expenses without
waivers and reimbursements(e) | |
| | | | | | |
| | | | | | |
| | | | | | |
| | | | | | |
| | | | | | |
| | | | | | |
| | | | | | |
| | | | | | |
| | | | | | |
| | | | | | |
| | | | | | |
| | | | | | |
| | | | | | |
| | | | | | |
| | | | | | |
| | | | | | |
| | | | | | |
| | | | | | |
| | | | | | |
| | | | | | |
| | | | | | |
| | | | | | |
| | | | | | |
| | | | | | |
| | | | | | |
SEE NOTES TO FINANCIAL STATEMENTS.
| J.P. Morgan Investor Funds | |
FINANCIAL HIGHLIGHTS
FOR THE PERIODS INDICATED
| Per share operating performance |
| | | |
| Net asset
value,
beginning
of period | Net
investment
income
(loss)(a)(b) | Net realized
and unrealized
gains
(losses) on
investments | Total from
investment
operations | | | |
JPMorgan Investor Conservative Growth Fund | | | | | | | |
| | | | | | | |
| | | | | | | |
| | | | | | | |
| | | | | | | |
| | | | | | | |
| | | | | | | |
| | | | | | | |
| | | | | | | |
| | | | | | | |
| | | | | | | |
| | | | | | | |
| | | | | | | |
| | | | | | | |
| | | | | | | |
| | | | | | | |
| | | | | | | |
| | | | | | | |
| | | | | | | |
| | | | | | | |
| | | | | | | |
| | | | | | | |
| | | | | | | |
| | | | | | | |
| | | | | | | |
|
| Net investment income (loss) is affected by the timing of distributions from Underlying Funds. |
| Calculated based upon average shares outstanding. |
| Includes adjustments in accordance with accounting principles generally accepted in the United States of America and as such, the net asset values for financial reporting purposes and the returns based upon those net asset values may differ from the net asset values and returns for shareholder transactions. |
| Includes interest expense, if applicable, each of which is less than 0.005% unless otherwise noted. |
| Does not include expenses of Underlying Funds. |
SEE NOTES TO FINANCIAL STATEMENTS.
| J.P. Morgan Investor Funds | |
| |
| | | Ratios to average net assets |
Net asset
value,
end of
period | Total return
(excludes
sales charge)(c) | Net assets,
end of
period
(000's) | | Net
investment
income
(loss) | Expenses without
waivers and reimbursements(e) | |
| | | | | | |
| | | | | | |
| | | | | | |
| | | | | | |
| | | | | | |
| | | | | | |
| | | | | | |
| | | | | | |
| | | | | | |
| | | | | | |
| | | | | | |
| | | | | | |
| | | | | | |
| | | | | | |
| | | | | | |
| | | | | | |
| | | | | | |
| | | | | | |
| | | | | | |
| | | | | | |
| | | | | | |
| | | | | | |
| | | | | | |
| | | | | | |
| | | | | | |
SEE NOTES TO FINANCIAL STATEMENTS.
| J.P. Morgan Investor Funds | |
FINANCIAL HIGHLIGHTS
FOR THE PERIODS INDICATED
| Per share operating performance |
| | | |
| Net asset
value,
beginning
of period | Net
investment
income
(loss)(a)(b) | Net realized
and unrealized
gains
(losses) on
investments | Total from
investment
operations | | | |
JPMorgan Investor Growth Fund | | | | | | | |
| | | | | | | |
| | | | | | | |
| | | | | | | |
| | | | | | | |
| | | | | | | |
| | | | | | | |
| | | | | | | |
| | | | | | | |
| | | | | | | |
| | | | | | | |
| | | | | | | |
| | | | | | | |
| | | | | | | |
| | | | | | | |
| | | | | | | |
| | | | | | | |
| | | | | | | |
| | | | | | | |
| | | | | | | |
| | | | | | | |
| | | | | | | |
| | | | | | | |
| | | | | | | |
| | | | | | | |
|
| Net investment income (loss) is affected by the timing of distributions from Underlying Funds. |
| Calculated based upon average shares outstanding. |
| Includes adjustments in accordance with accounting principles generally accepted in the United States of America and as such, the net asset values for financial reporting purposes and the returns based upon those net asset values may differ from the net asset values and returns for shareholder transactions. |
| Includes interest expense, if applicable, each of which is less than 0.005% unless otherwise noted. |
| Does not include expenses of Underlying Funds. |
SEE NOTES TO FINANCIAL STATEMENTS.
| J.P. Morgan Investor Funds | |
| |
| | | Ratios to average net assets |
Net asset
value,
end of
period | Total return
(excludes
sales charge)(c) | Net assets,
end of
period
(000's) | | Net
investment
income
(loss) | Expenses without
waivers and reimbursements(e) | |
| | | | | | |
| | | | | | |
| | | | | | |
| | | | | | |
| | | | | | |
| | | | | | |
| | | | | | |
| | | | | | |
| | | | | | |
| | | | | | |
| | | | | | |
| | | | | | |
| | | | | | |
| | | | | | |
| | | | | | |
| | | | | | |
| | | | | | |
| | | | | | |
| | | | | | |
| | | | | | |
| | | | | | |
| | | | | | |
| | | | | | |
| | | | | | |
| | | | | | |
SEE NOTES TO FINANCIAL STATEMENTS.
| J.P. Morgan Investor Funds | |
FINANCIAL HIGHLIGHTS
FOR THE PERIODS INDICATED
| Per share operating performance |
| | | |
| Net asset
value,
beginning
of period | Net
investment
income
(loss)(a)(b) | Net realized
and unrealized
gains
(losses) on
investments | Total from
investment
operations | | | |
JPMorgan Investor Growth & Income Fund | | | | | | | |
| | | | | | | |
| | | | | | | |
| | | | | | | |
| | | | | | | |
| | | | | | | |
| | | | | | | |
| | | | | | | |
| | | | | | | |
| | | | | | | |
| | | | | | | |
| | | | | | | |
| | | | | | | |
| | | | | | | |
| | | | | | | |
| | | | | | | |
| | | | | | | |
| | | | | | | |
| | | | | | | |
| | | | | | | |
| | | | | | | |
| | | | | | | |
| | | | | | | |
| | | | | | | |
| | | | | | | |
|
| Net investment income (loss) is affected by the timing of distributions from Underlying Funds. |
| Calculated based upon average shares outstanding. |
| Includes adjustments in accordance with accounting principles generally accepted in the United States of America and as such, the net asset values for financial reporting purposes and the returns based upon those net asset values may differ from the net asset values and returns for shareholder transactions. |
| Includes interest expense, if applicable, each of which is less than 0.005% unless otherwise noted. |
| Does not include expenses of Underlying Funds. |
SEE NOTES TO FINANCIAL STATEMENTS.
| J.P. Morgan Investor Funds | |
| |
| | | Ratios to average net assets |
Net asset
value,
end of
period | Total return
(excludes
sales charge)(c) | Net assets,
end of
period
(000's) | | Net
investment
income
(loss) | Expenses without
waivers and reimbursements(e) | |
| | | | | | |
| | | | | | |
| | | | | | |
| | | | | | |
| | | | | | |
| | | | | | |
| | | | | | |
| | | | | | |
| | | | | | |
| | | | | | |
| | | | | | |
| | | | | | |
| | | | | | |
| | | | | | |
| | | | | | |
| | | | | | |
| | | | | | |
| | | | | | |
| | | | | | |
| | | | | | |
| | | | | | |
| | | | | | |
| | | | | | |
| | | | | | |
| | | | | | |
SEE NOTES TO FINANCIAL STATEMENTS.
| J.P. Morgan Investor Funds | |
NOTES TO FINANCIAL STATEMENTS
AS OF June 30, 2023
(Dollar values in thousands)
1. Organization
JPMorgan Trust II (the “Trust”) was formed on November 12, 2004, as a Delaware statutory trust, pursuant to a Declaration of Trust dated November 5, 2004 and is registered under the Investment Company Act of 1940, as amended (the “1940 Act”), as an open-end management investment company.
The following are 4 separate funds of the Trust (each, a "Fund" and collectively, the "Funds") covered by this report:
| | Diversification Classification |
JPMorgan Investor Balanced Fund | Class A, Class C, Class I and Class R6 | |
JPMorgan Investor Conservative Growth Fund | Class A, Class C, Class I and Class R6 | |
JPMorgan Investor Growth Fund | Class A, Class C, Class I and Class R6 | |
JPMorgan Investor Growth & Income Fund | Class A, Class C, Class I and Class R6 | |
The investment objective of JPMorgan Investor Balanced Fund (“Investor Balanced Fund”) is to seek high total return consistent with the preservation of capital by investing primarily in a diversified group of mutual funds within the same group of investment companies that invest primarily in equity and fixed income securities.
The investment objective of JPMorgan Investor Conservative Growth Fund (“Investor Conservative Growth Fund”) is to seek income and capital appreciation by investing primarily in a diversified group of mutual funds within the same group of investment companies that invest primarily in fixed income and equity securities.
The investment objective of JPMorgan Investor Growth Fund (“Investor Growth Fund”) is to seek long-term capital appreciation by investing primarily in a diversified group of mutual funds within the same group of investment companies that invest primarily in equity securities.
The investment objective of JPMorgan Investor Growth & Income Fund (“Investor Growth & Income Fund”) is to seek long-term capital appreciation and growth of income by investing primarily in a diversified group of mutual funds within the same group of investment companies that invest primarily in equity securities.
Class A Shares generally provide for a front-end sales charge while Class C Shares provide for a contingent deferred sales charge ("CDSC"). No sales charges are assessed with respect to Class I and Class R6 shares. Certain Class A Shares, for which front-end sales charges have been waived, may be subject to a CDSC as described in the Funds' prospectus. Class C Shares automatically convert to Class A Shares after eight years. All classes of shares have equal rights as to earnings, assets and voting privileges, except that each class may bear different transfer agency, distribution and service fees and each class has exclusive voting rights with respect to its distribution plan and shareholder servicing agreements.
J.P. Morgan Investment Management Inc. (“JPMIM”), an indirect, wholly-owned subsidiary of JPMorgan Chase & Co. (“JPMorgan”), acts as adviser (the “Adviser”) and administrator (the “Administrator”) to the Funds.
2. Significant Accounting Policies
The following is a summary of significant accounting policies followed by the Funds in the preparation of their financial statements. The Funds are investment companies and, accordingly, follow the investment company accounting and reporting guidance of the Financial Accounting Standards Board (“FASB”) Accounting Standards Codification Topic 946 — Investment Companies, which is part of U.S. generally accepted accounting principles (“GAAP”). The preparation of financial statements in conformity with GAAP requires management to make estimates and assumptions that affect (i) the reported amounts of assets and liabilities, (ii) disclosure of contingent assets and liabilities at the date of the financial statements, and (iii) the reported amounts of increases and decreases in net assets from operations during the reporting period. Actual results could differ from those estimates.
A. Valuation of Investments — Investments are valued in accordance with GAAP and the Funds' valuation policies set forth by, and under the supervision and responsibility of, the Board of Trustees of the Trust (the "Board"), which established the following approach to valuation, as described more fully below: (i) investments for which market quotations are readily available shall be valued at their market value and (ii) all other investments for which market quotations are not readily available shall be valued at their fair value as determined in good faith by the Board.
Under Section 2(a)(41) of the 1940 Act, the Board is required to determine fair value for securities that do not have readily available market quotations. Under SEC Rule 2a-5 (Good Faith Determinations of Fair Value), the Board may designate the performance of these fair valuation determinations to a valuation designee. The Board has designated the Adviser as the “Valuation Designee” to perform fair valuation determinations for the Funds on behalf of the Board subject to appropriate oversight by the Board. The Adviser, as Valuation Designee, leverages the J.P. Morgan Asset Management Americas Valuation Committee (“AVC”) to help oversee and carry out the policies for the valuation of investments held in the Funds. The Adviser, as Valuation Designee, remains responsible for the valuation determinations.
| J.P. Morgan Investor Funds | |
This oversight by the AVC includes monitoring the appropriateness of fair values based on results of ongoing valuation oversight including, but not limited to, consideration of macro or security specific events, market events, and pricing vendor and broker due diligence. The Administrator is responsible for discussing and assessing the potential impacts to the fair values on an ongoing basis, and, at least on a quarterly basis, with the AVC and the Board.
Investments in open-end investment companies, excluding exchange-traded funds (“ETFs”) (“Underlying Funds”), are valued at each Underlying Fund’s net asset value ("NAV") per share as of the report date.
Valuations reflected in this report are as of the report date. As a result, changes in valuation due to market events and/or issuer-related events after the report date and prior to issuance of the report are not reflected herein.
The various inputs that are used in determining the valuation of the Funds' investments are summarized into the three broad levels listed below.
•
Level 1 — Unadjusted inputs using quoted prices in active markets for identical investments.
•
Level 2 — Other significant observable inputs including, but not limited to, quoted prices for similar investments, inputs other than quoted prices that are observable for investments (such as interest rates, prepayment speeds, credit risk, etc.) or other market corroborated inputs.
•
Level 3 — Significant inputs based on the best information available in the circumstances, to the extent observable inputs are not available (including the Funds' assumptions in determining the fair value of investments).
A financial instrument’s level within the fair value hierarchy is based on the lowest level of any input, both individually and in the aggregate, that is significant to the fair value measurement. The inputs or methodology used for valuing instruments are not necessarily an indication of the risk associated with investing in those instruments.
The following tables represent each valuation input as presented on the Schedules of Portfolio Investments ("SOIs"):
| | | | |
| | Level 2
Other significant
observable inputs | Level 3
Significant
unobservable inputs | |
Total Investments in Securities (a) | | | | |
|
| Please refer to the SOI for specifics of portfolio holdings. |
Investor Conservative Growth Fund | | | | |
| | Level 2
Other significant
observable inputs | Level 3
Significant
unobservable inputs | |
Total Investments in Securities (a) | | | | |
|
| Please refer to the SOI for specifics of portfolio holdings. |
| | | | |
| | Level 2
Other significant
observable inputs | Level 3
Significant
unobservable inputs | |
Total Investments in Securities (a) | | | | |
|
| Please refer to the SOI for specifics of portfolio holdings. |
Investor Growth & Income Fund | | | | |
| | Level 2
Other significant
observable inputs | Level 3
Significant
unobservable inputs | |
Total Investments in Securities (a) | | | | |
|
| Please refer to the SOI for specifics of portfolio holdings. |
| J.P. Morgan Investor Funds | |
NOTES TO FINANCIAL STATEMENTS
AS OF June 30, 2023 (continued)
(Dollar values in thousands)
B. Investment Transactions with Affiliates — The Funds invested in Underlying Funds and ETFs advised by the Adviser. An issuer which is under common control with a Fund may be considered an affiliate. For the purposes of the financial statements, the Funds assume the issuers listed in the tables below to be affiliated issuers. The Underlying Funds’ and ETFs' distributions may be reinvested into such Underlying Funds and ETFs. Reinvestment amounts are included in the purchases at cost amounts in the tables below.
|
For the year ended June 30, 2023 |
| | | | | Change in
Unrealized
Appreciation/
(Depreciation) | | | | Capital Gain
Distributions |
JPMorgan Core Bond Fund Class R6 Shares (a) | | | | | | | | | |
JPMorgan Core Plus Bond Fund Class R6 Shares (a) | | | | | | | | | |
JPMorgan Emerging Markets Debt Fund Class R6 Shares (a) | | | | | | | | | |
JPMorgan Emerging Markets Equity Fund Class R6 Shares (a) | | | | | | | | | |
JPMorgan Emerging Markets Research Enhanced Equity Fund Class R6 Shares (a) | | | | | | | | | |
JPMorgan Equity Income Fund Class R6 Shares (a) | | | | | | | | | |
JPMorgan Europe Dynamic Fund Class R6 Shares (a) | | | | | | | | | |
JPMorgan High Yield Fund Class R6 Shares (a) | | | | | | | | | |
JPMorgan Income Fund Class R6 Shares (a) | | | | | | | | | |
JPMorgan International Equity Fund Class R6 Shares (a) | | | | | | | | | |
JPMorgan International Research Enhanced Equity ETF (a) | | | | | | | | | |
JPMorgan Large Cap Growth Fund Class R6 Shares (a) | | | | | | | | | |
JPMorgan Large Cap Value Fund Class R6 Shares (a) | | | | | | | | | |
JPMorgan Limited Duration Bond Fund Class R6 Shares (a) | | | | | | | | | |
JPMorgan Market Expansion Enhanced Equity ETF (a) | | | | | | | | | |
JPMorgan Mid Cap Growth Fund Class R6 Shares (a) * | | | | | | | | | |
JPMorgan Realty Income ETF (a) | | | | | | | | | |
JPMorgan Short Duration Core Plus Fund Class R6 Shares (a) | | | | | | | | | |
JPMorgan Small Cap Equity Fund Class R6 Shares (a) | | | | | | | | | |
JPMorgan Small Cap Value Fund Class R6 Shares (a) | | | | | | | | | |
JPMorgan U.S. Equity Fund Class R6 Shares (a) | | | | | | | | | |
JPMorgan U.S. GARP Equity Fund Class R6 Shares (a) | | | | | | | | | |
JPMorgan U.S. Government Money Market Fund Class IM Shares, 5.05% (a) (b) | | | | | | | | | |
JPMorgan U.S. Research Enhanced Equity Fund Class R6 Shares (a) | | | | | | | | | |
| J.P. Morgan Investor Funds | |
Investor Balanced Fund (continued) |
For the year ended June 30, 2023 |
| | | | | Change in Unrealized Appreciation/ (Depreciation) | | | | Capital Gain Distributions |
JPMorgan Unconstrained Debt Fund Class R6 Shares (a) | | | | | | | | | |
JPMorgan Value Advantage Fund Class R6 Shares (a) | | | | | | | | | |
| | | | | | | | | |
|
| Investment in an affiliated fund, which is registered under the Investment Company Act of 1940, as amended, and is advised by J.P. Morgan Investment Management Inc. |
| The rate shown is the current yield as of June 30, 2023. |
| Non-income producing security. |
Investor Conservative Growth Fund |
For the year ended June 30, 2023 |
| | | | | Change in
Unrealized
Appreciation/
(Depreciation) | | | | Capital Gain
Distributions |
JPMorgan Core Bond Fund Class R6 Shares (a) | | | | | | | | | |
JPMorgan Core Plus Bond Fund Class R6 Shares (a) | | | | | | | | | |
JPMorgan Emerging Markets Debt Fund Class R6 Shares (a) | | | | | | | | | |
JPMorgan Emerging Markets Equity Fund Class R6 Shares (a) | | | | | | | | | |
JPMorgan Emerging Markets Research Enhanced Equity Fund Class R6 Shares (a) | | | | | | | | | |
JPMorgan Equity Income Fund Class R6 Shares (a) | | | | | | | | | |
JPMorgan Europe Dynamic Fund Class R6 Shares (a) | | | | | | | | | |
JPMorgan Government Bond Fund Class R6 Shares (a) | | | | | | | | | |
JPMorgan High Yield Fund Class R6 Shares (a) | | | | | | | | | |
JPMorgan Income Fund Class R6 Shares (a) | | | | | | | | | |
JPMorgan International Equity Fund Class R6 Shares (a) | | | | | | | | | |
JPMorgan International Research Enhanced Equity ETF (a) | | | | | | | | | |
JPMorgan Large Cap Growth Fund Class R6 Shares (a) | | | | | | | | | |
JPMorgan Large Cap Value Fund Class R6 Shares (a) | | | | | | | | | |
JPMorgan Limited Duration Bond Fund Class R6 Shares (a) | | | | | | | | | |
JPMorgan Market Expansion Enhanced Equity ETF (a) | | | | | | | | | |
JPMorgan Mid Cap Growth Fund Class R6 Shares (a) * | | | | | | | | | |
JPMorgan Realty Income ETF (a) | | | | | | | | | |
JPMorgan Short Duration Core Plus Fund Class R6 Shares (a) | | | | | | | | | |
| J.P. Morgan Investor Funds | |
NOTES TO FINANCIAL STATEMENTS
AS OF June 30, 2023 (continued)
(Dollar values in thousands)
Investor Conservative Growth Fund (continued) |
For the year ended June 30, 2023 |
| | | | | Change in Unrealized Appreciation/ (Depreciation) | | | | Capital Gain Distributions |
JPMorgan Small Cap Equity Fund Class R6 Shares (a) | | | | | | | | | |
JPMorgan Small Cap Value Fund Class R6 Shares (a) | | | | | | | | | |
JPMorgan U.S. Equity Fund Class R6 Shares (a) | | | | | | | | | |
JPMorgan U.S. GARP Equity Fund Class R6 Shares (a) | | | | | | | | | |
JPMorgan U.S. Government Money Market Fund Class IM Shares, 5.05% (a) (b) | | | | | | | | | |
JPMorgan U.S. Research Enhanced Equity Fund Class R6 Shares (a) | | | | | | | | | |
JPMorgan Unconstrained Debt Fund Class R6 Shares (a) | | | | | | | | | |
JPMorgan Value Advantage Fund Class R6 Shares (a) | | | | | | | | | |
| | | | | | | | | |
|
| Investment in an affiliated fund, which is registered under the Investment Company Act of 1940, as amended, and is advised by J.P. Morgan Investment Management Inc. |
| The rate shown is the current yield as of June 30, 2023. |
| Non-income producing security. |
|
For the year ended June 30, 2023 |
| | | | | Change in
Unrealized
Appreciation/
(Depreciation) | | | | Capital Gain
Distributions |
JPMorgan Core Bond Fund Class R6 Shares (a) | | | | | | | | | |
JPMorgan Core Plus Bond Fund Class R6 Shares (a) | | | | | | | | | |
JPMorgan Emerging Markets Debt Fund Class R6 Shares (a) | | | | | | | | | |
JPMorgan Emerging Markets Equity Fund Class R6 Shares (a) | | | | | | | | | |
JPMorgan Emerging Markets Research Enhanced Equity Fund Class R6 Shares (a) | | | | | | | | | |
JPMorgan Equity Income Fund Class R6 Shares (a) | | | | | | | | | |
JPMorgan Europe Dynamic Fund Class R6 Shares (a) | | | | | | | | | |
JPMorgan High Yield Fund Class R6 Shares (a) | | | | | | | | | |
JPMorgan Income Fund Class R6 Shares (a) | | | | | | | | | |
JPMorgan International Equity Fund Class R6 Shares (a) | | | | | | | | | |
JPMorgan International Focus Fund Class R6 Shares (a) | | | | | | | | | |
JPMorgan International Research Enhanced Equity ETF (a) | | | | | | | | | |
JPMorgan Large Cap Growth Fund Class R6 Shares (a) | | | | | | | | | |
| J.P. Morgan Investor Funds | |
Investor Growth Fund (continued) |
For the year ended June 30, 2023 |
| | | | | Change in Unrealized Appreciation/ (Depreciation) | | | | Capital Gain Distributions |
JPMorgan Large Cap Value Fund Class R6 Shares (a) | | | | | | | | | |
JPMorgan Market Expansion Enhanced Equity ETF (a) | | | | | | | | | |
JPMorgan Mid Cap Growth Fund Class R6 Shares (a) * | | | | | | | | | |
JPMorgan Realty Income ETF (a) | | | | | | | | | |
JPMorgan Small Cap Equity Fund Class R6 Shares (a) | | | | | | | | | |
JPMorgan Small Cap Value Fund Class R6 Shares (a) | | | | | | | | | |
JPMorgan U.S. Equity Fund Class R6 Shares (a) | | | | | | | | | |
JPMorgan U.S. GARP Equity Fund Class R6 Shares (a) | | | | | | | | | |
JPMorgan U.S. Government Money Market Fund Class IM Shares, 5.05% (a) (b) | | | | | | | | | |
JPMorgan U.S. Research Enhanced Equity Fund Class R6 Shares (a) | | | | | | | | | |
JPMorgan Value Advantage Fund Class R6 Shares (a) | | | | | | | | | |
| | | | | | | | | |
|
| Investment in an affiliated fund, which is registered under the Investment Company Act of 1940, as amended, and is advised by J.P. Morgan Investment Management Inc. |
| The rate shown is the current yield as of June 30, 2023. |
| Non-income producing security. |
Investor Growth & Income Fund |
For the year ended June 30, 2023 |
| | | | | Change in
Unrealized
Appreciation/
(Depreciation) | | | | Capital Gain
Distributions |
JPMorgan Core Bond Fund Class R6 Shares (a) | | | | | | | | | |
JPMorgan Core Plus Bond Fund Class R6 Shares (a) | | | | | | | | | |
JPMorgan Emerging Markets Debt Fund Class R6 Shares (a) | | | | | | | | | |
JPMorgan Emerging Markets Equity Fund Class R6 Shares (a) | | | | | | | | | |
JPMorgan Emerging Markets Research Enhanced Equity Fund Class R6 Shares (a) | | | | | | | | | |
JPMorgan Equity Income Fund Class R6 Shares (a) | | | | | | | | | |
JPMorgan Europe Dynamic Fund Class R6 Shares (a) | | | | | | | | | |
JPMorgan High Yield Fund Class R6 Shares (a) | | | | | | | | | |
JPMorgan Income Fund Class R6 Shares (a) | | | | | | | | | |
JPMorgan International Equity Fund Class R6 Shares (a) | | | | | | | | | |
JPMorgan International Focus Fund Class R6 Shares (a) | | | | | | | | | |
| J.P. Morgan Investor Funds | |
NOTES TO FINANCIAL STATEMENTS
AS OF June 30, 2023 (continued)
(Dollar values in thousands)
Investor Growth & Income Fund (continued) |
For the year ended June 30, 2023 |
| | | | | Change in Unrealized Appreciation/ (Depreciation) | | | | Capital Gain Distributions |
JPMorgan International Research Enhanced Equity ETF (a) | | | | | | | | | |
JPMorgan Large Cap Growth Fund Class R6 Shares (a) | | | | | | | | | |
JPMorgan Large Cap Value Fund Class R6 Shares (a) | | | | | | | | | |
JPMorgan Limited Duration Bond Fund Class R6 Shares (a) | | | | | | | | | |
JPMorgan Market Expansion Enhanced Equity ETF (a) | | | | | | | | | |
JPMorgan Mid Cap Growth Fund Class R6 Shares (a) * | | | | | | | | | |
JPMorgan Realty Income ETF (a) | | | | | | | | | |
JPMorgan Short Duration Core Plus Fund Class R6 Shares (a) | | | | | | | | | |
JPMorgan Small Cap Equity Fund Class R6 Shares (a) | | | | | | | | | |
JPMorgan Small Cap Value Fund Class R6 Shares (a) | | | | | | | | | |
JPMorgan Strategic Income Opportunities Fund Class R6 Shares (a) | | | | | | | | | |
JPMorgan U.S. Equity Fund Class R6 Shares (a) | | | | | | | | | |
JPMorgan U.S. GARP Equity Fund Class R6 Shares (a) | | | | | | | | | |
JPMorgan U.S. Government Money Market Fund Class IM Shares, 5.05% (a) (b) | | | | | | | | | |
JPMorgan U.S. Research Enhanced Equity Fund Class R6 Shares (a) | | | | | | | | | |
JPMorgan Value Advantage Fund Class R6 Shares (a) | | | | | | | | | |
| | | | | | | | | |
|
| Investment in an affiliated fund, which is registered under the Investment Company Act of 1940, as amended, and is advised by J.P. Morgan Investment Management Inc. |
| The rate shown is the current yield as of June 30, 2023. |
| Non-income producing security. |
C. Security Transactions and Investment Income— Investment transactions are accounted for on the trade date (the date the order to buy or sell is executed). Securities gains and losses are calculated on a specifically identified cost basis. Distributions of net investment income and realized capital gains from the Underlying Funds and ETFs are recorded on the ex-dividend date.
D. Allocation of Income and Expenses— Expenses directly attributable to a Fund are charged directly to that Fund, while the expenses attributable to more than one fund of the Trust are allocated among the applicable funds. Investment income, realized and unrealized gains and losses and expenses, other than class-specific expenses, are allocated daily to each class of shares based upon the proportion of net assets of each class at the beginning of each day.
Transfer agency fees are class-specific expenses. The amount of the transfer agency fees charged to each share class of the Funds for the year ended June 30, 2023 are as follows:
| J.P. Morgan Investor Funds | |
| | | | | |
Investor Conservative Growth Fund | | | | | |
| | | | | |
| | | | | |
| | | | | |
Investor Growth & Income Fund | | | | | |
| | | | | |
The Funds invested in Underlying Funds and ETFs and, as a result bear a portion of the expenses incurred by these Underlying Funds and ETFs. These expenses are not reflected in the expenses shown on the Statements of Operations and are not included in the ratios to average net assets shown in the Financial Highlights. Certain expenses of affiliated Underlying Funds and ETFs are waived as described in Note 3.F.
E. Federal Income Taxes — Each Fund is treated as a separate taxable entity for Federal income tax purposes. Each Fund's policy is to comply with the provisions of the Internal Revenue Code (the “Code”) applicable to regulated investment companies and to distribute to shareholders all of its distributable net investment income and net realized capital gains on investments. Accordingly, no provision for Federal income tax is necessary. Management has reviewed the Funds' tax positions for all open tax years and has determined that as of June 30, 2023, no liability for Federal income tax is required in the Funds' financial statements for net unrecognized tax benefits. However, management’s conclusions may be subject to future review based on changes in, or the interpretation of, the accounting standards or tax laws and regulations. Each Fund's Federal tax returns for the prior three fiscal years remain subject to examination by the Internal Revenue Service.
F. Distributions to Shareholders— Distributions from net investment income, if any, are generally declared and paid at least quarterly, except for Investor Conservative Growth Fund, for which distributions are generally declared and paid at least monthly. Distributions are declared separately for each class. No class has preferential dividend rights; differences in per share rates are due to differences in separate class expenses. Net realized capital gains, if any, are distributed by each Fund at least annually. The amount of distributions from net investment income and net realized capital gains is determined in accordance with Federal income tax regulations, which may differ from GAAP. To the extent these “book/tax” differences are permanent in nature (i.e., that they result from other than timing of recognition — “temporary differences”), such amounts are reclassified within the capital accounts based on their Federal tax basis treatment.
The following amounts were reclassified within the capital accounts:
| | Accumulated
undistributed
(distributions in
excess of)
net investment
income | Accumulated
net realized
gains (losses) |
| | | |
Investor Conservative Growth Fund | | | |
| | | |
Investor Growth & Income Fund | | | |
The reclassifications for the Funds relate primarily to tax adjustments on certain investments and redesignation of dividends.
3. Fees and Other Transactions with Affiliates
A. Investment Advisory Fee — Pursuant to an Investment Advisory Agreement, the Adviser manages the investments of each Fund and for such services is paid a fee. The investment advisory fee is accrued daily and paid monthly at an annual rate of 0.05% of the Funds' average daily net assets.
The Adviser waived investment advisory fees and/or reimbursed expenses as outlined in Note 3.F.
B. Administration Fee — Pursuant to an Administration Agreement, the Administrator provides certain administration services to each Fund. The Administrator does not receive a fee for these services.
JPMorgan Chase Bank, N.A. ("JPMCB"), a wholly-owned subsidiary of JPMorgan, serves as the Funds' sub-administrator (the “Sub-administrator”). For its services as Sub-administrator, JPMCB receives a portion of the fees payable to the Administrator.
| J.P. Morgan Investor Funds | |
NOTES TO FINANCIAL STATEMENTS
AS OF June 30, 2023 (continued)
(Dollar values in thousands)
C. Distribution Fees — Pursuant to a Distribution Agreement, JPMorgan Distribution Services, Inc. (“JPMDS”), an indirect, wholly-owned subsidiary of JPMorgan, serves as each Fund's principal underwriter and promotes and arranges for the sale of each Fund's shares.
The Board has adopted a Distribution Plan (the “Distribution Plan”) for Class A and Class C Shares of the Funds, as applicable, pursuant to Rule 12b-1 under the 1940 Act. Class I and Class R6 Shares of the Funds do not charge a distribution fee. The Distribution Plan provides that each Fund shall pay, with respect to the applicable share classes, distribution fees, including payments to JPMDS, at annual rates of the average daily net assets as shown in the table below:
In addition, JPMDS is entitled to receive the front-end sales charges from purchases of Class A Shares and the CDSC from redemptions of Class C Shares and certain Class A Shares for which front-end sales charges have been waived. For the year ended June 30, 2023, JPMDS retained the following:
| | |
| | |
Investor Conservative Growth Fund | | |
| | |
Investor Growth & Income Fund | | |
D. Service Fees — The Trust, on behalf of the Funds, has entered into a Shareholder Servicing Agreement with JPMDS under which JPMDS provides certain support services to fund shareholders. For performing these services, JPMDS receives a fee with respect to all share classes, except Class R6 Shares which do not charge a service fee, that is accrued daily and paid monthly equal to a percentage of the average daily net assets as shown in the table below:
JPMDS has entered into shareholder services contracts with affiliated and unaffiliated financial intermediaries who provide shareholder services and other related services to their clients or customers who invest in the Funds. Pursuant to such contracts, JPMDS will pay all or a portion of such fees earned to financial intermediaries for performing such services.
JPMDS waived service fees as outlined in Note 3.F.
E. Custodian and Accounting Fees — JPMCB provides portfolio custody and accounting services to the Funds. For performing these services, the Funds pay JPMCB transaction and asset-based fees that vary according to the number of transactions and positions, plus out-of-pocket expenses. The amounts paid directly to JPMCB by the Funds for custody and accounting services are included in Custodian and accounting fees on the Statements of Operations.
Interest income earned on cash balances at the custodian, if any, is included in Interest income from affiliates on the Statements of Operations.
Interest expense paid to the custodian related to cash overdrafts, if any, is included in Interest expense to affiliates on the Statements of Operations.
F. Waivers and Reimbursements —The Adviser, Administrator and/or JPMDS have contractually agreed to waive fees and/or reimburse the Funds to the extent that total annual operating expenses (excluding acquired fund fees and expenses other than certain money market fund fees as described below, dividend and interest expenses related to short sales, interest, taxes, expenses related to litigation and potential litigation, expenses related to trustee elections and extraordinary expenses) exceed the percentages of the Funds' respective average daily net assets as shown in the table below:
| | | | |
JPMorgan Investor Balanced Fund | | | | |
JPMorgan Investor Conservative Growth Fund | | | | |
JPMorgan Investor Growth Fund | | | | |
JPMorgan Investor Growth & Income Fund | | | | |
The expense limitation agreements were in effect for the year ended June 30, 2023 and the contractual expense limitation percentages in the table above are in place until at least October 31, 2024.
The Underlying Funds may impose separate advisory and service fees. To avoid charging a service fee at an effective rate above 0.25% for Class A, Class C and Class I Shares, JPMDS will waive service fees with respect to the Funds in an amount equal to the weighted average pro-rata amount of
| J.P. Morgan Investor Funds | |
service fees charged by the Underlying Funds up to 0.25% for Class A, Class C and Class I Shares. These waivers may be in addition to any waivers required to meet the Funds’ contractual expense limitations, but will not exceed the Funds’ service fees.
For the year ended June 30, 2023, the Funds' service providers waived fees and/or reimbursed expenses for each of the Funds as follows. None of these parties expect the Funds to repay any such waived fees and/or reimbursed expenses in future years.
| |
| | | |
| | | |
Investor Conservative Growth Fund | | | |
| | | |
Investor Growth & Income Fund | | | |
Additionally, the Funds may invest in one or more money market funds advised by the Adviser (affiliated money market funds). The Adviser, Administrator and/or JPMDS, as shareholder servicing agent, have contractually agreed to waive fees and/or reimburse expenses in an amount sufficient to offset the respective net fees each collects from the affiliated money market fund on the applicable Fund’s investment in such affiliated money market fund, except for investments of securities lending cash collateral. None of these parties expect the Funds to repay any such waived fees and/ or reimbursed expenses in future years.
The amounts of these waivers resulting from investments in these money market funds for the year ended June 30, 2023 were as follows:
| |
| |
Investor Conservative Growth Fund | |
| |
Investor Growth & Income Fund | |
JPMIM voluntarily agreed to reimburse the Funds for the Trustee Fees paid to one of the interested Trustees. For the year ended June 30, 2023, the amount of these reimbursements were as follows:
| |
| |
Investor Conservative Growth Fund | |
| |
Investor Growth & Income Fund | |
G. Other — Certain officers of the Trust are affiliated with the Adviser, the Administrator and JPMDS. Such officers, with the exception of the Chief Compliance Officer, receive no compensation from the Funds for serving in their respective roles.
The Board designated and appointed a Chief Compliance Officer to the Funds pursuant to Rule 38a-1 under the 1940 Act. Each Fund, along with affiliated funds, makes reimbursement payments, on a pro-rata basis, to the Administrator for a portion of the fees associated with the office of the Chief Compliance Officer. Such fees are included in Trustees’ and Chief Compliance Officer’s fees on the Statements of Operations.
The Trust adopted a Trustee Deferred Compensation Plan (the “Plan”) which allows the independent Trustees to defer the receipt of all or a portion of compensation related to performance of their duties as Trustees. The deferred fees are invested in various J.P. Morgan Funds until distribution in accordance with the Plan.
4. Investment Transactions
During the year ended June 30, 2023, purchases and sales of investments (excluding short-term investments) were as follows:
| Purchases
(excluding
U.S. Government) | Sales
(excluding
U.S. Government) |
| | |
Investor Conservative Growth Fund | | |
| | |
Investor Growth & Income Fund | | |
| J.P. Morgan Investor Funds | |
NOTES TO FINANCIAL STATEMENTS
AS OF June 30, 2023 (continued)
(Dollar values in thousands)
During the year ended June 30, 2023, there were no purchases or sales of U.S. Government securities.
5. Federal Income Tax Matters
For Federal income tax purposes, the estimated cost and unrealized appreciation (depreciation) in value of investments held at June 30, 2023 were as follows:
| | Gross
Unrealized
Appreciation | Gross
Unrealized
Depreciation | Net Unrealized
Appreciation
(Depreciation) |
| | | | |
Investor Conservative Growth Fund | | | | |
| | | | |
Investor Growth & Income Fund | | | | |
The difference between book and tax basis appreciation (depreciation) on investments is primarily attributed to wash sale loss deferrals.
The tax character of distributions paid during the year ended June 30, 2023 was as follows:
| | Net
Long-Term
Capital Gains | |
| | | |
Investor Conservative Growth Fund | | | |
| | | |
Investor Growth & Income Fund | | | |
|
| Short-term gain distributions are treated as ordinary income for income tax purposes. |
The tax character of distributions paid during the year ended June 30, 2022 was as follows:
| | Net
Long-Term
Capital Gains | |
| | | |
Investor Conservative Growth Fund | | | |
| | | |
Investor Growth & Income Fund | | | |
|
| Short-term gain distributions are treated as ordinary income for income tax purposes. |
As of June 30, 2023, the estimated components of net assets (excluding paid-in-capital) on a tax basis were as follows:
| Current
Distributable
Ordinary
Income | Current
Distributable
Long-Term
Capital Gain
(Tax Basis Capital
Loss Carryover) | Unrealized
Appreciation
(Depreciation) |
| | | |
Investor Conservative Growth Fund | | | |
| | | |
Investor Growth & Income Fund | | | |
The cumulative timing differences primarily consist of post-October capital loss deferrals and wash sale loss deferrals.
As of June 30, 2023, the Funds did not have any net capital loss carryforwards.
| J.P. Morgan Investor Funds | |
Net capital losses (gains) incurred after October 31 and within the taxable year are deemed to arise on the first business day of the Funds' next taxable year. For the year ended June 30, 2023, the following Funds deferred to July 1, 2023 the following net capital losses (gains):
| Net Capital Losses (Gains) |
| |
Investor Conservative Growth Fund | |
| |
Investor Growth & Income Fund | |
6. Borrowings
The Funds rely upon an exemptive order granted by the SEC (the “Order”) permitting the establishment and operation of an Interfund Lending Facility (the “Facility”). The Facility allows the Funds to directly lend and borrow money to or from any other fund relying upon the Order at rates beneficial to both the borrowing and lending funds. Advances under the Facility are taken primarily for temporary or emergency purposes, including the meeting of redemption requests that otherwise might require the untimely disposition of securities, and are subject to each Fund's borrowing restrictions. The interfund loan rate is determined, as specified in the Order, by averaging the current repurchase agreement rate and the current bank loan rate. The Order was granted to the Trust and may be relied upon by the Funds because the Funds and the series of the Trust are all investment companies in the same “group of investment companies” (as defined in Section 12(d)(1)(G) of the 1940 Act).
The Funds had no borrowings outstanding from another fund, or loans outstanding to another fund, during the year ended June 30, 2023.
The Trust and JPMCB have entered into a financing arrangement. Under this arrangement, JPMCB provides an unsecured, uncommitted credit facility in the aggregate amount of $100 million to certain of the J.P. Morgan Funds, including the Funds. Advances under the arrangement are taken primarily for temporary or emergency purposes, including the meeting of redemption requests that otherwise might require the untimely disposition of securities, and are subject to each Fund's borrowing restrictions. Interest on borrowings is payable at a rate determined by JPMCB at the time of borrowing. This agreement has been extended until October 30, 2023.
The Funds had no borrowings outstanding from the unsecured, uncommitted credit facility during the year ended June 30, 2023.
The Trust, along with certain other trusts for J.P. Morgan Funds (“Borrowers”), have entered into a joint syndicated senior unsecured revolving credit facility totaling $1.5 billion (“Credit Facility”) with various lenders and The Bank of New York Mellon, as administrative agent for the lenders. This Credit Facility provides a source of funds to the Borrowers for temporary and emergency purposes, including the meeting of redemption requests that otherwise might require the untimely disposition of securities. Under the terms of the Credit Facility, a borrowing fund must have a minimum of $25 million in adjusted net asset value and not exceed certain adjusted net asset coverage ratios prior to and during the time in which any borrowings are outstanding. If a fund does not comply with the aforementioned requirements, the fund must remediate within three business days with respect to the $25 million minimum adjusted net asset value or within one business day with respect to certain asset coverage ratios or the administrative agent at the request of, or with the consent of, the lenders may terminate the Credit Facility and declare any outstanding borrowings to be due and payable immediately.
Interest associated with any borrowing under the Credit Facility is charged to the borrowing fund at a rate of interest equal to 1.00% (the "Applicable Margin"), plus the greater on the day of the borrowing, of the federal funds effective rate, or the Adjusted Daily Simple SOFR Rate. Prior to August 9, 2022, interest associated with any borrowing under the Credit Facility was charged to the borrowing fund at a rate of interest equal to the Applicable Margin, plus the greater of the federal funds effective rate or one month London Interbank Offered Rate ("LIBOR"). Effective August 8, 2023, the Credit Facility was amended and restated for a term of 364 days, unless extended.
The Funds did not utilize the Credit Facility during the year ended June 30, 2023.
7. Risks, Concentrations and Indemnifications
In the normal course of business, the Funds enter into contracts that contain a variety of representations which provide general indemnifications. Each Fund's maximum exposure under these arrangements is unknown. The amount of exposure would depend on future claims that may be brought against each Fund. However, based on experience, the Funds expect the risk of loss to be remote.
| J.P. Morgan Investor Funds | |
NOTES TO FINANCIAL STATEMENTS
AS OF June 30, 2023 (continued)
(Dollar values in thousands)
As of June 30, 2023, the Funds had individual shareholder and/or omnibus accounts each owning more than 10% of the respective Fund's outstanding shares as follows:
| Number of
Individual Shareholder
and/or Affiliated
Omnibus Accounts | | Number of
Individual Shareholder
and/or Non-Affiliated
Omnibus Accounts | |
| | | | |
Investor Conservative Growth Fund | | | | |
| | | | |
Investor Growth & Income Fund | | | | |
Significant shareholder transactions by these shareholders may impact the Funds' performance and liquidity.
As of June 30, 2023, the Funds owned in the aggregate, shares representing more than 10% of the net assets of the following Underlying Funds:
| |
JPMorgan Market Expansion Enhanced Equity ETF | |
JPMorgan U.S. GARP Equity Fund | |
JPMorgan Limited Duration Bond Fund | |
JPMorgan Europe Dynamic Fund | |
JPMorgan Large Cap Value Fund | |
JPMorgan Emerging Markets Debt Fund | |
JPMorgan International Research Enhanced Equity ETF | |
JPMorgan Emerging Markets Research Enhanced Equity Fund | |
JPMorgan Small Cap Value Fund | |
JPMorgan International Focus Fund | |
JPMorgan U.S. Research Enhanced Equity Fund | |
JPMorgan Realty Income ETF | |
Because of the Funds’ investments in Underlying Funds and ETFs, the Funds indirectly pay a portion of the expenses incurred by the Underlying Funds and ETFs. As a result, the cost of investing in the Funds may be higher than the cost of investing in a mutual fund that invests directly in individual securities and financial instruments. The Funds are also subject to certain risks related to the Underlying Funds’ and ETFs’ investments in securities and financial instruments such as fixed income securities, including high yield, asset-backed and mortgage-related securities, equity securities, foreign and emerging markets securities, commodities and real estate securities. These securities are subject to risks specific to their structure, sector or market.
The Funds invest in ETFs. ETFs are pooled investment vehicles whose ownership interests are purchased and sold on a securities exchange. ETFs may be structured as investment companies, depositary receipts or other pooled investment vehicles and may be passively or actively managed. Passively managed ETFs generally seek to track the performance of a particular market index, including broad-based market indices, as well as indices relating to particular sectors, markets, regions or industries. Actively managed ETFs do not seek to track the performance of a particular market index. The price movement of an index-based ETF may not track the underlying index and may result in a loss. In addition, ETFs may trade at a price below or above their NAV (also known as a discount or premium, respectively).
In addition, the Underlying Funds and ETFs may use derivative instruments in connection with their individual investment strategies including futures contracts, forward foreign currency exchange contracts, options, swaps and other derivatives, which are also subject to specific risks related to their structure, sector or market and may be riskier than investments in other types of securities.
Specific risks and concentrations present in the Underlying Funds and ETFs are disclosed within their individual financial statements and registration statements, as appropriate.
Derivatives may be riskier than other types of investments because they may be more sensitive to changes in economic and market conditions and could result in losses that significantly exceed the Funds’ original investment. Derivatives also expose the Funds to counterparty risk (the risk that the derivative counterparty will not fulfill its contractual obligations), including credit risk of the derivative counterparty. The possible lack of a liquid secondary market for derivatives and the resulting inability of the Funds to sell or otherwise close a derivatives position could expose the Funds to losses.
The Funds are subject to infectious disease epidemics/pandemics risk. For example, the outbreak of COVID-19 negatively affected economies, markets and individual companies throughout the world, including those in which the Funds invest. The effects of this, or any future, pandemic to
| J.P. Morgan Investor Funds | |
public health and business and market conditions may have a significant negative impact on the performance of a Fund's investments, increase a Fund's volatility, exacerbate other pre-existing political, social and economic risks to the Funds and negatively impact broad segments of businesses and populations. In addition, governments, their regulatory agencies, or self-regulatory organizations have taken or may take actions in response to a pandemic that affect the instruments in which the Funds invest, or the issuers of such instruments, in ways that could have a significant negative impact on a Fund’s investment performance. The ultimate impact of any pandemic and the extent to which the associated conditions and governmental responses impact a Fund will also depend on future developments, which are highly uncertain, difficult to accurately predict and subject to frequent changes.
| J.P. Morgan Investor Funds | |
REPORT OF INDEPENDENT REGISTERED PUBLIC ACCOUNTING FIRM
To the Board of Trustees of JPMorgan Trust II and Shareholders of JPMorgan Investor Balanced Fund, JPMorgan Investor Conservative Growth Fund, JPMorgan Investor Growth Fund and JPMorgan Investor Growth & Income Fund
Opinions on the Financial Statements
We have audited the accompanying statements of assets and liabilities, including the schedules of portfolio investments, of JPMorgan Investor Balanced Fund, JPMorgan Investor Conservative Growth Fund, JPMorgan Investor Growth Fund and JPMorgan Investor Growth & Income Fund (four of the funds constituting JPMorgan Trust II, hereafter collectively referred to as the “Funds”) as of June 30, 2023, the related statements of operations for the year ended June 30, 2023, the statements of changes in net assets for each of the two years in the period ended June 30, 2023, including the related notes, and the financial highlights for each of the five years in the period ended June 30, 2023 (collectively referred to as the “financial statements”). In our opinion, the financial statements present fairly, in all material respects, the financial position of each of the Funds as of June 30, 2023, the results of each of their operations for the year then ended, the changes in each of their net assets for each of the two years in the period ended June 30, 2023 and each of the financial highlights for each of the five years in the period ended June 30, 2023 in conformity with accounting principles generally accepted in the United States of America.
Basis for Opinions
These financial statements are the responsibility of the Funds’ management. Our responsibility is to express an opinion on the Funds’ financial statements based on our audits. We are a public accounting firm registered with the Public Company Accounting Oversight Board (United States) (PCAOB) and are required to be independent with respect to the Funds in accordance with the U.S. federal securities laws and the applicable rules and regulations of the Securities and Exchange Commission and the PCAOB.
We conducted our audits of these financial statements in accordance with the standards of the PCAOB. Those standards require that we plan and perform the audit to obtain reasonable assurance about whether the financial statements are free of material misstatement, whether due to error or fraud.
Our audits included performing procedures to assess the risks of material misstatement of the financial statements, whether due to error or fraud, and performing procedures that respond to those risks. Such procedures included examining, on a test basis, evidence regarding the amounts and disclosures in the financial statements. Our audits also included evaluating the accounting principles used and significant estimates made by management, as well as evaluating the overall presentation of the financial statements. Our procedures included confirmation of securities owned as of June 30, 203 by correspondence with the transfer agent and brokers; when replies were not received from brokers, we performed other auditing procedures. We believe that our audits provide a reasonable basis for our opinions.
/s/ PricewaterhouseCoopers LLP
New York, New York
August 24, 2023
We have served as the auditor of one or more investment companies in the JPMorgan Funds complex since 1993.
| J.P. Morgan Investor Funds | |
The Funds' Statement of Additional Information includes additional information about the Funds' Trustees and is available, without charge, upon request by calling 1-800-480-4111 or on the J.P. Morgan Funds’ website at www.jpmorganfunds.com.
Name (Year of Birth);
Positions With
the Funds (1) | Principal Occupation
During Past 5 Years | Number of
Funds in Fund
Complex Overseen
by Trustee (2) | Other Directorships Held
During the Past 5 Years |
| |
John F. Finn (1947); Chair
since 2020; Trustee since 1998. | Chairman, Gardner, Inc. (supply chain management company serving industrial and consumer markets) (serving in various roles 1974-present). | | Director, Greif, Inc. (GEF) (industrial package products and services) (2007-present); Trustee, Columbus Association for the Performing Arts (1988-present). |
Stephen P. Fisher (1959);
Trustee since 2018. | Retired; Chairman and Chief Executive Officer, NYLIFE Distributors LLC (registered broker-dealer) (serving in various roles 2008-2013); Chairman, NYLIM Service Company LLC (transfer agent) (2008-2017); New York Life Investment Management LLC (registered investment adviser) (serving in various roles 2005-2017); Chairman, IndexIQ Advisors LLC (registered investment adviser for ETFs) (2014-2017); President, MainStay VP Funds Trust (2007-2017), MainStay DefinedTerm Municipal Opportunities Fund (2011-2017) and MainStay Funds Trust (2007-2017) (registered investment companies). | | Honors Program Advisory Board Member, The Zicklin School of Business, Baruch College, The City University of New York (2017-present). |
Gary L. French (1951);
Trustee since 2014. | Real Estate Investor (2011-2020); Investment management industry Consultant and Expert Witness (2011-present); Senior Consultant for The Regulatory Fundamentals Group LLC (2011-2017). | | Independent Trustee, The China Fund, Inc. (2013-2019); Exchange Traded Concepts Trust II (2012-2014); Exchange Traded Concepts Trust I (2011-2014). |
Kathleen M. Gallagher (1958);
Trustee since 2018. | Retired; Chief Investment Officer — Benefit Plans, Ford Motor Company (serving in various roles 1985-2016). | | Non- Executive Director, Legal & General Investment Management (Holdings) (2018-present); Non-Executive Director, Legal & General Investment Management America (U.S. Holdings) (financial services and insurance) (2017-present); Advisory Board Member, State Street Global Advisors Total Portfolio Solutions (2017-present); Member, Client Advisory Council, Financial Engines, LLC (registered investment adviser) (2011-2016); Director, Ford Pension Funds Investment Management Ltd. (2007-2016). |
Robert J. Grassi (1957);
Trustee since 2014. | Sole Proprietor, Academy Hills Advisors LLC (2012-present); Pension Director, Corning Incorporated (2002-2012). | | |
| J.P. Morgan Investor Funds | |
TRUSTEES
(Unaudited) (continued)
Name (Year of Birth); Positions With the Funds (1) | Principal Occupation During Past 5 Years | Number of Funds in Fund Complex Overseen by Trustee (2) | Other Directorships Held During the Past 5 Years |
Independent Trustees (continued) | |
Frankie D. Hughes (1952);
Trustee since 2008. | President, Ashland Hughes Properties (property management) (2014-present); President and Chief Investment Officer, Hughes Capital Management, Inc. (fixed income asset management) (1993-2014). | | |
Raymond Kanner (1953);
Trustee since 2017. | Retired; Managing Director and Chief Investment Officer, IBM Retirement Funds (2007-2016). | | Advisory Board Member, Penso Advisors, LLC (2020-present); Advisory Board Member, Los Angeles Capital (2018-present); Advisory Board Member, State Street Global Advisors Total Portfolio Solutions (2017- present); Acting Executive Director, Committee on Investment of Employee Benefit Assets (CIEBA) (2016-2017); Advisory Board Member, Betterment for Business (robo advisor) (2016- 2017); Advisory Board Member, BlueStar Indexes (index creator) (2013-2017); Director, Emerging Markets Growth Fund (registered investment company) (1997-2016); Member, Russell Index Client Advisory Board (2001-2015). |
Thomas P. Lemke (1954);
Trustee since 2014. | | | (1) Independent Trustee of Advisors’ Inner Circle III fund platform, consisting of the following: (i) the Advisors’ Inner Circle Fund III, (ii) the Gallery Trust, (iii) the Schroder Series Trust, (iv) the Delaware Wilshire Private Markets Fund (since 2020), (v) Chiron Capital Allocation Fund Ltd., and (vi) formerly the Winton Diversified Opportunities Fund (2014-2018); and (2) Independent Trustee of the Symmetry Panoramic Trust (since 2018). |
Lawrence R. Maffia (1950);
Trustee since 2014. | Retired; Director and President, ICI Mutual Insurance Company (2006-2013). | | Director, ICI Mutual Insurance Company (1999-2013). |
Mary E. Martinez (1960); Vice
Chair since 2021; Trustee since 2013. | Associate, Special Properties, a Christie’s International Real Estate Affiliate (2010-present); Managing Director, Bank of America (asset management) (2007-2008); Chief Operating Officer, U.S. Trust Asset Management, U.S. Trust Company (asset management) (2003-2007); President, Excelsior Funds (registered investment companies) (2004-2005). | | |
Marilyn McCoy (1948);
Trustee since 1999. | Retired; Vice President of Administration and Planning, Northwestern University (1985-2023). | | |
| J.P. Morgan Investor Funds | |
Name (Year of Birth); Positions With the Funds (1) | Principal Occupation During Past 5 Years | Number of Funds in Fund Complex Overseen by Trustee (2) | Other Directorships Held During the Past 5 Years |
Independent Trustees (continued) | |
Dr. Robert A. Oden, Jr. (1946); Trustee
since 1997. | Retired; President, Carleton College (2002-2010); President, Kenyon College (1995-2002). | | Trustee, The Coldwater Conservation Fund (2017-present); Trustee, American Museum of Fly Fishing (2013-present); Trustee and Vice Chair, Trout Unlimited (2017-2021); Trustee, Dartmouth- Hitchcock Medical Center (2011-2020). |
Marian U. Pardo* (1946);
Trustee since 2013. | Managing Director and Founder, Virtual Capital Management LLC (investment consulting) (2007-present); Managing Director, Credit Suisse Asset Management (portfolio manager) (2003-2006). | | Board Chair and Member, Board of Governors, Columbus Citizens Foundation (not-for-profit supporting philanthropic and cultural programs) (2006-present). |
Emily A. Youssouf (1951);
Trustee since 2014. | Adjunct Professor (2011-present) and Clinical Professor (2009-2011), NYU Schack Institute of Real Estate; Board Member and Member of the Audit Committee (2013–present), Chair of Finance Committee (2019-present), Member of Related Parties Committee (2013-2018) and Member of the Enterprise Risk Committee (2015-2018), PennyMac Financial Services, Inc.; Board Member (2005-2018), Chair of Capital Committee (2006-2016), Chair of Audit Committee (2005-2018), Member of Finance Committee (2005-2018) and Chair of IT Committee (2016-2018), NYC Health and Hospitals Corporation. | | Trustee, NYC School Construction Authority (2009-present); Board Member, NYS Job Development Authority (2008-present); Trustee and Chair of the Audit Committee of the Transit Center Foundation (2015-2019). |
| |
Robert F. Deutsch** (1957);
Trustee since 2014. | Retired; Head of ETF Business for JPMorgan Asset Management (2013-2017); Head of Global Liquidity Business for JPMorgan Asset Management (2003-2013). | | Treasurer and Director of the JUST Capital Foundation (2017-present). |
Nina O. Shenker** (1957);
Trustee since 2022. | Vice Chair (2017-2021), General Counsel and Managing Director (2008-2016), Associate General Counsel and Managing Director (2004-2008), J.P. Morgan Asset & Wealth Management. | | Director and Member of Legal and Human Resources Subcommittees, American Jewish Joint Distribution Committee (2018-present). |
|
| The year shown is the first year in which a Trustee became a member of any of the following: the JPMorgan Mutual Fund Board, the JPMorgan ETF Board, the heritage J.P. Morgan Funds or the heritage One Group Mutual Funds. Trustees serve an indefinite term, until resignation, retirement, removal or death. The Board's current retirement policy sets retirement at the end of the calendar year in which the Trustee attains the age of 75, provided that any Board member who was a member of the JPMorgan Mutual Fund Board prior to January 1, 2022 and was born prior to January 1, 1950 shall retire from the Board at the end of the calendar year in which the Trustee attains the age of 78. |
| A Fund Complex means two or more registered investment companies that hold themselves out to investors as related companies for purposes of investment and investor services or have a common investment adviser or have an investment adviser that is an affiliated person of the investment adviser of any of the other registered investment companies. The J.P. Morgan Funds Complex for which the Board of Trustees serves currently includes nine registered investment companies (176 J.P. Morgan Funds). |
| In connection with prior employment with JPMorgan Chase, Ms. Pardo was the recipient of non-qualified pension plan payments from JPMorgan Chase in the amount of approximately $2,055 per month, which she irrevocably waived effective January 1, 2013, and deferred compensation payments from JPMorgan Chase in the amount of approximately $7,294 per year, which ended in January 2013. In addition, Ms. Pardo receives payments from a fully-funded qualified plan, which is not an obligation of JPMorgan Chase. |
| J.P. Morgan Investor Funds | |
TRUSTEES
(Unaudited) (continued)
| Designation as an “Interested Trustee” is based on prior employment by the Adviser or an affiliate of the Adviser or interests in a control person of the Adviser. |
| The contact address for each of the Trustees is 277 Park Avenue, New York, NY 10172. |
| J.P. Morgan Investor Funds | |
Name (Year of Birth),
Positions Held with
the Trusts (Since) | Principal Occupations During Past 5 Years |
Brian S. Shlissel (1964),
President and Principal Executive
Officer (2016) | Managing Director and Chief Administrative Officer for J.P. Morgan pooled vehicles, J.P. Morgan Investment Management Inc. since 2014. |
Timothy J. Clemens (1975),
Treasurer and Principal Financial
Officer (2018) | Managing Director, J.P. Morgan Investment Management Inc. Mr. Clemens has been with J.P. Morgan Investment Management Inc. since 2013. |
Gregory S. Samuels (1980),
Secretary (2019) (formerly Assistant
Secretary 2010-2019) | Managing Director and Assistant General Counsel, JPMorgan Chase & Co. Mr. Samuels has been with JPMorgan Chase & Co. since 2010. |
Stephen M. Ungerman (1953),
Chief Compliance Officer (2005) | Managing Director, JPMorgan Chase & Co. Mr. Ungerman has been with JPMorgan Chase & Co. since 2000. |
Kiesha Astwood-Smith (1973),
Assistant Secretary (2021) | Vice President and Assistant General Counsel, JPMorgan Chase & Co. since June 2021; Senior Director and Counsel, Equitable Financial Life Insurance Company (formerly, AXA Equitable Life Insurance Company) from September 2015 through June 2021. |
Matthew Beck (1988),
Assistant Secretary (2021)* | Vice President and Assistant General Counsel, JPMorgan Chase & Co. since May 2021; Senior Legal Counsel, Ultimus Fund Solutions from May 2018 through May 2021; General Counsel, The Nottingham Company from April 2014 through May 2018. |
Elizabeth A. Davin (1964),
Assistant Secretary (2005)* | Executive Director and Assistant General Counsel, JPMorgan Chase & Co. Ms. Davin has been with JPMorgan Chase & Co. (formerly Bank One Corporation) since 2004. |
Jessica K. Ditullio (1962)
Assistant Secretary (2005)* | Executive Director and Assistant General Counsel, JPMorgan Chase & Co. Ms. Ditullio has been with JPMorgan Chase & Co. (formerly Bank One Corporation) since 1990. |
Anthony Geron (1971),
Assistant Secretary (2018) | Vice President and Assistant General Counsel, JPMorgan Chase & Co. since September 2018; Lead Director and Counsel, AXA Equitable Life Insurance Company from 2015 to 2018 and Senior Director and Counsel, AXA Equitable Life Insurance Company from 2014 to 2015. |
Carmine Lekstutis (1980),
Assistant Secretary (2011) | Executive Director and Assistant General Counsel, JPMorgan Chase & Co. Mr. Lekstutis has been with JPMorgan Chase & Co. since 2011. |
Max Vogel (1990),
Assistant Secretary (2021) | Vice President and Assistant General Counsel, JPMorgan Chase & Co. since June 2021; Associate, Proskauer Rose LLP (law firm) from March 2017 to June 2021. |
Zachary E. Vonnegut-Gabovitch
(1986),
Assistant Secretary (2017) | Executive Director and Assistant General Counsel, JPMorgan Chase & Co. Mr. Vonnegut-Gabovitch has been with JPMorgan Chase & Co. since September 2016. |
Frederick J. Cavaliere (1978),
Assistant Treasurer (2023)** | Executive Director, J.P. Morgan Investment Management Inc. Mr. Cavaliere has been with JPMorgan Chase & Co. since May 2006. |
Michael M. D’Ambrosio (1969),
Assistant Treasurer (2012) | Managing Director, J.P. Morgan Investment Management Inc. Mr. D’Ambrosio has been with J.P. Morgan Investment Management Inc. since 2012. |
Aleksandr Fleytekh (1972),
Assistant Treasurer (2019) | Executive Director, J.P. Morgan Investment Management Inc. Mr. Fleytekh has been with J.P. Morgan Investment Management Inc. since February 2012. |
Shannon Gaines (1977),
Assistant Treasurer (2018)* | Executive Director, J.P. Morgan Investment Management Inc. Mr. Gaines has been with J.P. Morgan Investment Management Inc. since January 2014. |
Jeffrey D. House (1972),
Assistant Treasurer (2017)* | Vice President, J.P. Morgan Investment Management Inc. since July 2006. |
Michael Mannarino (1985),
Assistant Treasurer (2020) | Vice President, J.P. Morgan Investment Management Inc. since 2014. |
Joseph Parascondola (1963),
Assistant Treasurer (2011)** | Executive Director, J.P. Morgan Investment Management Inc. Mr. Parascondola has been with J.P. Morgan Investment Management Inc. since 2006. |
| J.P. Morgan Investor Funds | |
OFFICERS
(Unaudited) (continued)
Name (Year of Birth), Positions Held with the Trusts (Since) | Principal Occupations During Past 5 Years |
Gillian I. Sands (1969),
Assistant Treasurer (2012) | Executive Director, J.P. Morgan Investment Management Inc. Ms. Sands has been with J.P. Morgan Investment Management Inc. since 2012. |
|
The contact address for each of the officers, unless otherwise noted, is 277 Park Avenue, New York, NY 10172. |
| The contact address for the officer is 1111 Polaris Parkway, Columbus, OH 43240. |
| The contact address for the officer is 575 Washington Boulevard, Jersey City, NJ 07310. |
| J.P. Morgan Investor Funds | |
SCHEDULE OF SHAREHOLDER EXPENSES
(Unaudited)
Hypothetical $1,000 Investment
As a shareholder of the Funds, you incur two types of costs: (1) transaction costs, including sales charges (loads) on purchase payments and (2) ongoing costs, including investment advisory fees, administration fees, distribution fees and other Fund expenses. The examples below are intended to help you understand your ongoing costs (in dollars) of investing in the Funds (not including expenses of the Underlying Funds) and to compare these ongoing costs with the ongoing costs of investing in other mutual funds. The examples assume that you had a $1,000 investment in each Class at the beginning of the reporting period, January 1, 2023, and continued to hold your shares at the end of the reporting period, June 30, 2023.
Actual Expenses
For each Class of each Fund in the table below, the first line provides information about actual account values and actual expenses. You may use the information in this line, together with the amount you invested, to estimate the expenses that you paid over the period. Simply divide your account value by $1,000 (for example, an $8,600 account value divided by $1,000 = 8.6), then multiply the result by the number in the first line of each Class under the heading titled “Expenses Paid During the Period” to estimate the expenses you paid on your account during this period.
Hypothetical Example for Comparison Purposes
The second line of each Class in the table below provides information about hypothetical account values and hypothetical expenses based on the Class’ actual expense ratio and an assumed rate of return of 5% per year before expenses, which is not the Class’ actual return. The hypothetical account values and expenses may not be used to estimate the actual ending account balance or expenses you paid for the period. You may use this information to compare the ongoing costs of investing in the Class of the Funds and other funds. To do so, compare this 5% hypothetical example with the 5% hypothetical examples that appear in the shareholder reports of the other funds. Please note that the expenses shown in the table are meant to highlight your ongoing costs only and do not reflect any transaction costs, such as sales charges (loads) or redemption fees, and expenses of the Underlying Funds. Therefore, the second line for each Class in the table is useful in comparing ongoing costs only, and will not help you determine the relative total costs of owning different funds. In addition, if these transaction costs were included, your costs would have been higher. The examples also assume all dividends and distributions have been reinvested.
| Beginning
Account Value
January 1, 2023 | Ending
Account Value
June 30, 2023 | Expenses
Paid During
the Period* | |
JPMorgan Investor Balanced Fund | | | | |
| | | | |
| | | | |
| | | | |
| | | | |
| | | | |
| | | | |
| | | | |
| | | | |
| | | | |
| | | | |
| | | | |
| | | | |
JPMorgan Investor Conservative Growth Fund | | | | |
| | | | |
| | | | |
| | | | |
| | | | |
| | | | |
| | | | |
| | | | |
| | | | |
| | | | |
| | | | |
| | | | |
| | | | |
| J.P. Morgan Investor Funds | |
SCHEDULE OF SHAREHOLDER EXPENSES
(Unaudited) (continued)
Hypothetical $1,000 Investment
| Beginning Account Value January 1, 2023 | Ending Account Value June 30, 2023 | Expenses Paid During the Period* | |
JPMorgan Investor Growth Fund | | | | |
| | | | |
| | | | |
| | | | |
| | | | |
| | | | |
| | | | |
| | | | |
| | | | |
| | | | |
| | | | |
| | | | |
| | | | |
JPMorgan Investor Growth & Income Fund | | | | |
| | | | |
| | | | |
| | | | |
| | | | |
| | | | |
| | | | |
| | | | |
| | | | |
| | | | |
| | | | |
| | | | |
| | | | |
|
| Expenses are equal to each Class’ respective annualized net expense ratio, multiplied by the average account value over the period, multiplied by 181/365 (to reflect the one-half year period). |
| J.P. Morgan Investor Funds | |
LIQUIDITY RISK MANAGEMENT PROGRAM
(Unaudited)
Each of the Funds covered in this report has adopted the J.P. Morgan Funds and J.P. Morgan Exchange-Traded Funds Amended and Restated Liquidity Risk Management Program (the “Program”) under Rule 22e-4 under the Investment Company Act of 1940, as amended (the “Liquidity Rule”). The Program seeks to assess, manage and review each Fund’s Liquidity Risk. “Liquidity Risk” is defined as the risk that a fund could not meet requests to redeem shares issued by the fund without significant dilution of remaining investors’ interests in the fund. Pursuant to an exemptive order (the “Exemptive Order”) from the Securities and Exchange Commission, the Program permits the Funds to use liquidity definitions and classification methodologies that differ from the requirements under the Liquidity Rule in some respects. Among other things, the Liquidity Rule requires that a written report be provided to the Board of Trustees (the “Board”) on an annual basis that addresses the operation of the Program and assesses the adequacy and effectiveness of its implementation, including the operation of any Highly Liquid Investment Minimum (“HLIM”), where applicable, and any material changes to the Program.
The Board has appointed J.P. Morgan Asset Management’s Liquidity Risk Forum to be the program administrator for the Program (the “Program Administrator”). In addition to regular reporting at each of its quarterly meetings, on February 7, 2023, the Board reviewed the Program Administrator’s annual written report (the “Report”) concerning the operation of the Program for the period from January 1, 2022 through December 31, 2022 (the “Program Reporting Period”). The Report addressed the operation of the Program and assessed its adequacy and effectiveness of implementation, including, where applicable, the operation of a Fund’s HLIM. There were no material changes to the Program during the Program Reporting Period.
The Report summarized the operation of the Program and the information and factors considered by the Program Administrator in assessing whether the Program has been adequately and effectively implemented with respect to each Fund. Such information and factors included, among other things: (1) the liquidity risk framework used to assess, manage, and periodically review each Fund’s Liquidity Risk and the results of this assessment; (2) the methodology and inputs for classifying the investments of a Fund into one of the required liquidity categories that reflect an estimate of the liquidity of those investments under current market conditions; (3) whether a Fund invested primarily in “Highly Liquid Investments” (as defined or modified under the Program), as well as whether an HLIM should be established for a Fund (and, for Funds that have adopted an HLIM, whether the HLIM continues to be appropriate or whether a Fund has invested below its HLIM) and the procedures for monitoring for any HLIM; (4) whether a Fund invested more than 15% of its assets in “Illiquid Investments” (as defined or modified under the Program) and the procedures for monitoring for this limit; and (5) specific liquidity events arising during the Program Reporting Period. The Report further summarized the conditions of the Exemptive Order and whether all applicable Funds were in compliance with the terms of the Exemptive Order.
Based on this review, the Report concluded that: (1) the Program continues to be reasonably designed to effectively assess and manage each Fund’s Liquidity Risk; and (2) the Program has been adequately and effectively implemented with respect to each Fund during the Program Reporting Period.
| J.P. Morgan Investor Funds | |
TAX LETTER
(Unaudited)
(Dollar values in thousands)
Certain tax information for the J.P. Morgan Funds is required to be provided to shareholders based upon the Funds' income and distributions for the taxable year ended June 30, 2023. The information and distributions reported in this letter may differ from the information and taxable distributions reported to the shareholders for the calendar year ending December 31, 2023. The information necessary to complete your income tax returns for the calendar year ending December 31, 2023 will be provided under separate cover.
Dividends Received Deduction (DRD)
Each Fund listed below had the following percentage, or maximum allowable percentage, of ordinary income distributions eligible for the dividends received deduction for corporate shareholders for the fiscal year ended June 30, 2023:
| Dividends
Received
Deduction |
JPMorgan Investor Balanced Fund | |
JPMorgan Investor Conservative Growth Fund | |
JPMorgan Investor Growth Fund | |
JPMorgan Investor Growth & Income Fund | |
Long Term Capital Gain
Each Fund listed below distributed the following amount, or maximum allowable amount, of long-term capital gain dividends for the fiscal year ended June 30, 2023:
| Long-Term
Capital Gain
Distribution |
JPMorgan Investor Balanced Fund | |
JPMorgan Investor Conservative Growth Fund | |
JPMorgan Investor Growth Fund | |
JPMorgan Investor Growth & Income Fund | |
Qualified Dividend Income (QDI)
Each Fund listed below had the following amount, or maximum allowable amount, of ordinary income distributions treated as qualified dividends for the fiscal year ended June 30, 2023:
| |
JPMorgan Investor Balanced Fund | |
JPMorgan Investor Conservative Growth Fund | |
JPMorgan Investor Growth Fund | |
JPMorgan Investor Growth & Income Fund | |
Foreign Source Income and Foreign Tax Credit Pass Through
For the fiscal year ended June 30, 2023, the following Funds intend to elect to pass through to shareholders taxes paid to foreign countries. Gross income and foreign tax expenses cannot be quantified until Underlying Funds complete reporting for the calendar year in progress. Amounts for the fiscal year ended June 30, 2023 will be disclosed in the semi-annual report for the period ended December 31, 2023.
| J.P. Morgan Investor Funds | |
| WHAT DOES J.P. MORGAN FUNDS DO WITH YOUR PERSONAL INFORMATION? |
| Financial companies choose how they share your personal information. Federal law gives consumers the right to limit some but not all sharing. Federal law also requires us to tell you how we collect, share, and protect your personal information. Please read this notice carefully to understand what we do. |
| The types of personal information we collect and share depend on the product or service you have with us. This information can include: |
| ○Social Security number and account balances |
| ○transaction history and account transactions |
| ○checking account information and wire transfer instructions |
| When you are no longer our customer, we continue to share your information as described in this notice. |
| All financial companies need to share customers’ personal information to run their everyday business. In the section below, we list the reasons financial companies can share their customers’ personal information; the reasons J.P. Morgan Funds chooses to share; and whether you can limit this sharing. |
Reasons we can share your personal information | Does J.P. Morgan
Funds share? | Can you limit this
sharing? |
For our everyday business purposes — such as to process your transactions, maintain your account(s), respond to court orders and legal investigations, or report to credit bureaus | | |
For marketing purposes — to offer our products and services to you | | |
For joint marketing with other financial companies | | |
For our affiliates’ everyday business purposes — information about your transactions and experiences | | |
For our affiliates’ everyday business purposes — information about your creditworthiness | | |
For nonaffiliates to market to you | | |
Questions? Call 1-800-480-4111 or go to www.jpmorganfunds.com | |
|
Who is providing this notice? | |
|
How does J.P. Morgan Funds protect my personal information? | To protect your personal information from unauthorized access and use, we use security measures that comply with federal law. These measures include computer safeguards and secured files and buildings. We authorize our employees to access your information only when they need it to do their work and we require companies that work for us to protect your information. |
|
How does J.P. Morgan Funds collect my personal information? | We collect your personal information, for example, when you: |
○open an account or provide contact information |
○give us your account information or pay us by check |
|
We also collect your personal information from others, such as credit bureaus, affiliates and other companies. |
|
Why can’t I limit all sharing? | Federal law gives you the right to limit only: |
○sharing for affiliates’ everyday business purposes – information about your creditworthiness |
○affiliates from using your information to market to you |
○sharing for nonaffiliates to market to you |
State laws and individual companies may give you additional rights to limit sharing. |
|
| Companies related by common ownership or control. They can be financial and nonfinancial companies. |
| ○J.P. Morgan Funds does not share with our affiliates. |
|
| Companies not related by common ownership or control. They can be financial and nonfinancial companies. |
| ○J.P. Morgan Funds does not share with nonaffiliates so they can market to you. |
|
| A formal agreement between nonaffiliated financial companies that together market financial products or services to you. |
| ○J.P. Morgan Funds doesn’t jointly market. |
J.P. Morgan Funds are distributed by JPMorgan Distribution Services, Inc., which is an affiliate of JPMorgan Chase & Co. Affiliates of JPMorgan Chase & Co. receive fees for providing various services to the funds.
Contact JPMorgan Distribution Services, Inc. at 1-800-480-4111 for a fund prospectus. You can also visit us at www.jpmorganfunds.com. Investors should carefully consider the investment objectives and risk as well as charges and expenses of the mutual fund before investing. The prospectus contains this and other information about the mutual fund. Read the prospectus carefully before investing.
Investors may obtain information about the Securities Investor Protection Corporation (SIPC), including the SIPC brochure, by visiting www.sipc.org or by calling SIPC at 202-371-8300.
Each Fund files a complete schedule of its fund holdings for the first and third quarters of its fiscal year with the SEC as an exhibit to its report on Form N-PORT. The Funds' Form N-PORT reports are available on the SEC’s website at http://www.sec.gov. Each Fund's quarterly holdings can be found by visiting the J.P. Morgan Funds’ website at www.jpmorganfunds.com.
A description of each Fund's policies and procedures with respect to the disclosure of each Fund's holdings is available in the prospectuses and Statement of Additional Information.
A copy of proxy policies and procedures is available without charge upon request by calling 1-800-480-4111 and on the Funds' website at www.jpmorganfunds.com. A description of such policies and procedures is on the SEC’s website at www.sec.gov. The Trustees have delegated the authority to vote proxies for securities owned by the Funds to the Adviser. A copy of the Funds' voting record for the most recent 12-month period ended June 30 is available on the SEC’s website at www.sec.gov or at the Funds' website at www.jpmorganfunds.com no later than August 31 of each year. The Funds' proxy voting record will include, among other things, a brief description of the matter voted on for each fund security, and will state how each vote was cast, for example, for or against the proposal.
J.P. Morgan Asset Management is the brand name for the asset management business of JPMorgan Chase & Co. and its affiliates worldwide.
© JPMorgan Chase & Co., 2023. All rights reserved. June 2023.
AN-INV-623
ITEM 2. CODE OF ETHICS.
Disclose whether, as of the end of the period covered by the report, the registrant has adopted a code of ethics that applies to the registrant’s principal executive officer, principal financial officer, principal accounting officer or controller, or persons performing similar functions, regardless of whether these individuals are employed by the registrant or a third party. If the registrant has not adopted such a code of ethics, explain why it has not done so.
The registrant must briefly describe the nature of any amendment, during the period covered by the report, to a provision of its code of ethics that applies to the registrant’s principal executive officer, principal financial officer, principal accounting officer or controller, or persons performing similar functions, regardless of whether these individuals are employed by the registrant or a third party, and that relates to any element of the code of ethics definition enumerated in paragraph (b) of this Item. The registrant must file a copy of any such amendment as an exhibit pursuant to Item 13(a)(1), unless the registrant has elected to satisfy paragraph (f) of this Item by positing its code of ethics on its website pursuant to paragraph (f)(2) of this Item, or by undertaking to provide its code of ethics to any person without charge, upon request, pursuant to paragraph (f)(3) of this Item.
If the registrant has, during the period covered by the report, granted a waiver, including an implicit waiver, from a provision of the code of ethics that applies to the registrant’s principal executive officer, principal financial officer, principal accounting officer or controller, or persons performing similar functions, regardless of whether these individuals are employed by the registrant or third party, that relates to one or more items set forth in paragraph (b) of this Item, the registrant must briefly describe the nature of the waiver, the name of the person to whom the waiver was granted, and the date of the waiver.
The Registrant has adopted a code of ethics that applies to the Registrant’s principal executive officer and principal financial officer. There were no amendments to the code of ethics or waivers granted with respect to the code of ethics in the period covered by the report.
ITEM 3. AUDIT COMMITTEE FINANCIAL EXPERT.
(a) (1) Disclose that the registrant’s board of directors has determined that the registrant either:
(i) Has at least one audit committee financial expert serving on its audit committee; or
(ii) Does not have an audit committee financial expert serving on its audit committee.
The Registrant’s Board of Trustees has determined that the Registrant has at least one audit committee financial expert serving on its audit committee. The Securities and Exchange Commission has stated that the designation or identification of a person as an audit committee financial expert pursuant to this Item 3 of Form N-CSR does not impose on such person any duties, obligations or liabilities that are greater than the duties, obligations and liabilities imposed on such person as a member of the Audit Committee and the Board of Trustees in the absence of such designation or identification.
(2) If the registrant provides the disclosure required by paragraph (a)(1)(i) of this Item, it must disclose the name of the audit committee financial expert and whether that person is “independent.” In order to be considered “independent” for purposes of this Item, a member of an audit committee may not, other than in his or her capacity as a member of the audit committee, the board of directors, or any other board committee:
(i) Accept directly or indirectly any consulting, advisory, or other compensatory fee from the issuer; or
(ii) Be an “interested person” of the investment company as defined in Section 2(a)(19) of the Act (15 U.S.C. 80a-2(a)(19)).
The Audit committee financial experts are Gary L. French, Kathleen M. Gallagher, Raymond Kanner and Lawrence R. Maffia, each of whom is not an “interested person” of the Registrant and is also “independent” as defined by the U.S. Securities and Exchange Commission for the purposes of the audit committee financial expert determination.
(3) If the registrant provides the disclosure required by paragraph (a)(1)(ii) of this Item, it must explain why it does not have an audit committee financial expert.
Not applicable.
ITEM 4. PRINCIPAL ACCOUNTANT FEES AND SERVICES.
(a) Disclose, under the caption Audit Fees, the aggregate fees billed for each of the last two fiscal years for professional services rendered by the principal accountant for the audit of the registrant’s annual financial statements or services that are normally provided by the accountant in connection with statutory and regulatory filings or engagements for those fiscal years.
AUDIT FEES
2023 – $344,725
2022 – $344,577
(b) Disclose, under the caption Audit-Related Fees, the aggregate fees billed in each of the last two fiscal years for assurance and related services by the principal accountant that are reasonably related to the performance of the audit of the registrant’s financial statements and are not reported under paragraph (a) of this Item. Registrants shall describe the nature of the services comprising the fees disclosed under this category.
AUDIT-RELATED FEES
2023 – $43,952
2022 – $43,952
Audit-related fees consists of security count procedures performed as required under Rule 17f-2 of the Investment Company Act of 1940 during the Registrant’s fiscal year.
(c) Disclose, under the caption Tax Fees, the aggregate fees billed in each of the last two fiscal years for professional services rendered by the principal accountant for tax compliance, tax advice, and tax planning. Registrants shall describe the nature of the services comprising the fees disclosed under this category.
TAX FEES
2023 – $121,875
2022 – $121,876
The tax fees consist of fees billed in connection with preparing the federal regulated investment company income tax returns for the Registrant for the tax years ended June 30, 2023 and 2022, respectively.
For the last fiscal year, no tax fees were required to be approved pursuant to paragraph (c)(7)(ii) of Rule 2-01 of Regulation S-X.
(d) Disclose, under the caption All Other Fees, the aggregate fees billed in each of the last two fiscal years for products and services provided by the principal accountant, other than the services reported in paragraphs (a) through (c) of this Item. Registrants shall describe the nature of the services comprising the fees disclosed under this category.
ALL OTHER FEES
2023 – Not applicable
2022 – Not applicable
(e) (1) Disclose the audit committee’s pre-approval policies and procedures described in paragraph (c)(7) of Rule 2-01 of Regulation S-X.
Pursuant to the Registrant’s Audit Committee Charter and written policies and procedures for the pre-approval of audit and non-audit services (the “Pre-approval Policy”), the Audit Committee pre-approves all audit and non-audit services performed by the Registrant’s independent public registered accounting firm for the Registrant. In addition, the Audit Committee pre-approves the auditor’s engagement for non-audit services with the Registrant’s investment adviser (not including a sub-adviser whose role is primarily portfolio management and is sub-contracted or overseen by another investment adviser) and any Service Affiliate in accordance with paragraph (c)(7)(ii) of Rule 2-01 of Regulation S-X, if the engagement relates directly to the operations and financial reporting of the Registrant. Proposed services may be pre-approved either 1) without consideration of specific case-by-case services or 2) require the specific pre-approval of the Audit Committee. Therefore, initially the Pre-approval Policy listed a number of audit and non-audit services that have been approved by the Audit Committee, or which were not subject to pre-approval under the transition provisions of Sarbanes-Oxley Act of 2002 (the
“Pre-approval List”). The Audit Committee annually reviews and pre-approves the services included on the Pre-approval List that may be provided by the independent public registered accounting firm without obtaining additional specific pre-approval of individual services from the Audit Committee. The Audit Committee adds to, or subtracts from, the list of general pre-approved services from time to time, based on subsequent determinations. All other audit and non-audit services not on the Pre-approval List must be specifically pre-approved by the Audit Committee.
One or more members of the Audit Committee may be appointed as the Committee’s delegate for the purposes of considering whether to approve such services. Any pre-approvals granted by the delegate will be reported, for informational purposes only, to the Audit Committee at its next scheduled meeting. The Audit Committee’s responsibilities to pre-approve services performed by the independent public registered accounting firm are not delegated to management.
(2) Disclose the percentage of services described in each of paragraphs (b) through (d) of this Item that were approved by the audit committee pursuant to paragraph (c)(7)(i)(C) of Rule 2-01 of Regulation S-X.
2023 – 0.0%
2022 – 0.0%
(f) If greater than 50 percent, disclose the percentage of hours expended on the principal accountant’s engagement to audit the registrant’s financial statements for the most recent fiscal year that were attributed to work performed by persons other than the principal accountant’s full-time, permanent employees.
Not applicable - Less than 50%.
(g) Disclose the aggregate non-audit fees billed by the registrant’s accountant for services rendered to the registrant, and rendered to the registrant’s investment adviser (not including any sub-adviser whose role is primarily portfolio management and is subcontracted with or overseen by another investment adviser), and any entity controlling, controlled by, or under common control with the adviser that provides ongoing services to the registrant for each of the last two fiscal years of the registrant.
The aggregate non-audit fees billed by the independent registered public accounting firm for services rendered to the Registrant, and rendered to Service Affiliates, for the last two calendar year ends were:
2022 - $31.8 million
2021 - $30.7 million
(h) Disclose whether the registrant’s audit committee of the board of directors has considered whether the provision of non-audit services that were rendered to the registrant’s investment adviser (not including any subadviser whose role is primarily portfolio management and is subcontracted with or overseen by another investment adviser), and any entity controlling, controlled by, or under common control with the investment adviser that provides ongoing services to the registrant that were not pre-approved pursuant to paragraph (c)(7)(ii) of Rule 2-01 of Regulation S-X is compatible with maintaining the principal accountant’s independence.
The Registrant’s Audit Committee has considered whether the provision of the non-audit services that were rendered to Service Affiliates that were not pre-approved (not requiring pre-approval) is compatible with maintaining the independent public registered accounting firm’s independence. All services provided by the independent public registered accounting firm to the Registrant or to Service Affiliates that were required to be pre-approved were pre-approved as required.
(i) A registrant identified by the Commission pursuant to Section 104(i)(2)(A) of the Sarbanes-Oxley Act of 2002 (15 U.S.C. 7214(i)(2)(A)), as having retained, for the preparation of the audit report on its financial statements included in the Form NCSR, a registered public accounting firm that has a branch or office that is located in a foreign jurisdiction and that the Public Company Accounting Oversight Board has determined it is unable to inspect or investigate completely because of a position taken by an authority in the foreign jurisdiction must electronically submit to the Commission on a supplemental basis documentation that establishes that the registrant is not owned or controlled by a governmental entity in the foreign jurisdiction. The registrant must submit this documentation on or before the due date for this form. A registrant that is owned or controlled by a foreign governmental entity is not required to submit such documentation.
Not applicable.
(j) A registrant that is a foreign issuer, as defined in 17 CFR 240.3b-4, identified by the Commission pursuant to Section 104(i)(2)(A) of the Sarbanes-Oxley Act of 2002 (15 U.S.C. 7214(i)(2)(A)), as having retained, for the preparation of the audit report on its financial statements included in the Form N-CSR, a registered public accounting firm that has a branch or office that is located in a foreign jurisdiction and that the Public Company Accounting Oversight Board has determined it is unable to inspect or investigate completely because of a position taken by an authority in the foreign jurisdiction, for each year in which the registrant is so identified, must
provide the below disclosures. Also, any such identified foreign issuer that uses a variable-interest entity or any similar structure that results in additional foreign entities being consolidated in the financial statements of the registrant is required to provide the below disclosures for itself and its consolidated foreign operating entity or entities. A registrant must disclose:
| | (1) | That, for the immediately preceding annual financial statement period, a registered public accounting firm that the PCAOB was unable to inspect or investigate completely, because of a position taken by an authority in the foreign jurisdiction, issued an audit report for the registrant; |
| | (2) | The percentage of shares of the registrant owned by governmental entities in the foreign jurisdiction in which the registrant is incorporated or otherwise organized; |
| | (3) | Whether governmental entities in the applicable foreign jurisdiction with respect to that registered public accounting firm have a controlling financial interest with respect to the registrant; |
| | (4) | The name of each official of the Chinese Communist Party who is a member of the board of directors of the registrant or the operating entity with respect to the registrant; and |
| | (5) | Whether the articles of incorporation of the registrant (or equivalent organizing document) contains any charter of the Chinese Communist Party, including the text of any such charter. |
Not applicable.
ITEM 5. AUDIT COMMITTEE OF LISTED REGISTRANTS.
(a) If the registrant is a listed issuer as defined in Rule 10A-3 under the Exchange Act (17CFR 240.10A-3), state whether or not the registrant has a separately-designated standing audit committee established in accordance with Section 3(a)(58)(A) of the Exchange Act (15 U.S.C. 78c(a)(58)(A)). If the registrant has such a committee, however designated, identify each committee member. If the entire board of directors is acting as the registrant’s audit committee as specified in Section 3(a)(58)(B) of the Exchange Act (15 U.S.C. 78c(a)(58)(B)), so state.
(b) If applicable, provide the disclosure required by Rule 10A-3(d) under the Exchange Act (17CFR 240.10A-3(d)) regarding an exemption from the listing standards for all audit committees.
Not applicable.
ITEM 6. INVESTMENTS.
File Schedule I – Investments in securities of unaffiliated issuers as of the close of the reporting period as set forth in Section 210.12-12 of Regulation S-X, unless the schedule is included as part of the report to shareholders filed under Item 1 of this Form.
Included in Item 1.
ITEM 7. DISCLOSURE OF PROXY VOTING POLICIES AND PROCEDURES FOR CLOSED-END MANAGEMENT INVESTMENT COMPANIES.
Not applicable.
ITEM 8. PORTFOLIO MANAGERS OF CLOSED-END MANAGEMENT INVESTMENT COMPANIES.
Not applicable.
ITEM 9. PURCHASE OF EQUITY SECURITIES BY CLOSED-END MANAGEMENT INVESTMENT COMPANY AND AFFILIATED PURCHASERS.
Not applicable.
ITEM 10. SUBMISSION OF MATTERS TO A VOTE OF SECURITY HOLDERS.
Describe any material changes to the procedures by which shareholders may recommend nominees to the registrant’s board of directors, where those changes were implemented after the registrant last provided disclosure in response to the requirements of Item 7(d)(2)(ii)(G) of Schedule 14A (17 CFR 240.14a-101), or this Item.
No material changes to report.
ITEM 11. CONTROLS AND PROCEDURES.
(a) Disclose the conclusions of the registrant’s principal executive and principal financial officers, or persons performing similar functions, regarding the effectiveness of the registrant’s disclosure controls and procedures (as defined in Rule 30a-3(c) under the Act (17 CFR 270.30a-3(c))) as of a date within 90 days of the filing date of the report that includes the disclosure required by this paragraph, based on the evaluation of these controls and procedures required by Rule 30a-3(b) under the Act (17 CFR 270.30a-3(b)) and Rules 13a-15(b) or 15d-15(b) under the Exchange Act (17 CFR 240.13a-15(b) or 240.15d-15(b)).
The Registrant’s principal executive and principal financial officers have concluded, based on their evaluation of the Registrant’s disclosure controls and procedures as of a date within 90 days of the filing date of this report, that the Registrant’s disclosure controls and procedures are reasonably designed to ensure that information required to be disclosed by the Registrant on Form N-CSR is recorded, processed, summarized and reported within the required time periods and that information required to be disclosed by the Registrant in the reports that it files or submits on Form N-CSR is accumulated and communicated to the Registrant’s management, including its principal executive and principal financial officers, as appropriate to allow timely decisions regarding required disclosure.
(b) Disclose any change in the registrant’s internal control over financial reporting (as defined in Rule 30a-3(d) under the Act (17 CFR 270.30a-3(d)) that occurred during the period covered by this report that has materially affected, or is reasonably likely to materially affect, the registrant’s internal control over financial reporting.
There were no changes in the Registrant’s internal control over financial reporting that occurred during the period covered by this report that have materially affected, or are reasonably likely to materially affect, the Registrant’s internal control over financial reporting.
ITEM 12. DISCLOSURE OF SECURITIES LENDING ACTIVITIES FOR CLOSED-END MANAGEMENT INVESTMENT COMPANIES.
Not applicable.
ITEM 13. EXHIBITS.
| | (a) | File the exhibits listed below as part of this Form. Letter or number the exhibits in the sequence indicated. |
(1) Any code of ethics, or amendment thereto, that is the subject of the disclosure required by Item 2, to the extent that the registrant intends to satisfy the Item 2 requirements through filing of an exhibit.
Code of Ethics applicable to its Principal Executive and Principal Financial Officers pursuant to Section 406 of the Sarbanes-Oxley Act of 2002 attached hereto.
(2) A separate certification for each principal executive officer and principal financial officer of the registrant as required by Rule 30a-2(a) under the Act (17 CFR 270.30a-2), exactly as set forth below:
Certifications pursuant to Rule 30a-2(a) under the Investment Company Act of 1940 are attached hereto.
(1) Any written solicitation to purchase securities under Rule 23c-1 under the Act (17 CFR 270.23c-1) sent or given during the period covered by the report by or on behalf of the registrant to 10 or more persons.
Not applicable.
(2) Change in the registrant’s independent public accountant. Provide the information called for by Item 4 of Form 8-K under the Exchange Act (17 CFR 249.308). Unless otherwise specified by Item 4, or related to and necessary for a complete understanding of information not previously disclosed, the information should relate to events occurring during the reporting period.
Not applicable.
| | (b) | A separate or combined certification for each principal executive officer and principal officer of the registrant as required by Rule 30a-2(b) under the Act of 1940. |
Certifications pursuant to Rule 30a-2(b) under the Investment Company Act of 1940 are attached hereto.
SIGNATURES
Pursuant to the requirements of the Securities Exchange Act of 1934 and the Investment Company Act of 1940, the registrant has duly caused this report to be signed on its behalf by the undersigned, thereunto duly authorized.
JPMorgan Trust II
| | |
| By: | | /s/ Brian S. Shlissel |
| | Brian S. Shlissel |
| | President and Principal Executive Officer |
| | September 1, 2023 |
Pursuant to the requirements of the Securities Exchange Act of 1934 and the Investment Company Act of 1940, this report has been signed below by the following persons on behalf of the registrant and in the capacities and on the dates indicated.
| | |
| By: | | /s/ Brian S. Shlissel |
| | Brian S. Shlissel |
| | President and Principal Executive Officer |
| | September 1, 2023 |
| |
| By: | | /s/ Timothy J. Clemens |
| | Timothy J. Clemens |
| | Treasurer and Principal Financial Officer |
| | September 1, 2023 |