UNITED STATES
SECURITIES AND EXCHANGE COMMISSION
Washington, D.C. 20549
FORM N-CSR
CERTIFIED SHAREHOLDER REPORT OF REGISTERED
MANAGEMENT INVESTMENT COMPANIES
Investment Company Act file number: 811-04236
JPMorgan Trust II
(Exact name of registrant as specified in charter)
277 Park Avenue
New York, NY 10172
(Address of principal executive offices) (Zip code)
Gregory S. Samuels
277 Park Avenue
New York, NY 10172
(Name and Address of Agent for Service)
Registrant’s telephone number, including area code: (800) 480-4111
Date of fiscal year end: June 30
Date of reporting period: July 1, 2023 through December 31, 2023
Form N-CSR is to be used by management investment companies to file reports with the Commission not later than 10 days after the transmission to stockholders of any report that is required to be transmitted to stockholders under Rule 30e-1 under the Investment Company Act of 1940 (17 CFR 270.30e-1). The Commission may use the information provided on Form N-CSR in its regulatory, disclosure review, inspection, and policymaking roles.
A registrant is required to disclose the information specified by Form N-CSR, and the Commission will make this information public. A registrant is not required to respond to the collection of information contained in Form N-CSR unless the Form displays a currently valid Office of Management and Budget (“OMB”) control number. Please direct comments concerning the accuracy of the information collection burden estimate and any suggestions for reducing the burden to Secretary, Securities and Exchange Commission, 450 Fifth Street, NW, Washington, DC 20549-0609. The OMB has reviewed this collection of information under the clearance requirements of 44 U.S.C. Section 3507.
ITEM 1. REPORTS TO STOCKHOLDERS.
a.) The following is a copy of the report transmitted to shareholders pursuant to Rule 30e-1 under the Investment Company Act of 1940 (17 CFR 270.30e-1).
b.) A copy of the notice transmitted to shareholders in reliance on Rule 30e-3 under the 1940 Act that contains disclosures specified by paragraph (c)(3) of that rule is included in the Annual Report. Not Applicable. Notices do not incorporate disclosures from the shareholder reports.
Semi-Annual Report
J.P. Morgan Small Cap Funds
December 31, 2023 (Unaudited)
JPMorgan Small Cap Blend Fund |
JPMorgan Small Cap Equity Fund |
JPMorgan Small Cap Growth Fund |
JPMorgan Small Cap Sustainable Leaders Fund |
JPMorgan Small Cap Value Fund |
JPMorgan SMID Cap Equity Fund |
JPMorgan U.S. Small Company Fund |
CONTENTS
Investments in a Fund are not deposits or obligations of, or guaranteed or endorsed by, any bank and are not insured or guaranteed by the FDIC, the Federal Reserve Board or any other government agency. You could lose money if you sell when a Fund’s share price is lower than when you invested.
Past performance is no guarantee of future performance. The general market views expressed in this report are opinions based on market and other conditions through the end of the reporting period and are subject to change without notice. These views are not intended to predict the future performance of a Fund or the securities markets.
Prospective investors should refer to the Funds’ prospectuses for a discussion of the Funds’ investment objectives, strategies and risks. Call J.P. Morgan Funds Service Center at 1-800-480-4111 for a prospectus containing more complete information about a Fund, including management fees and other expenses. Please read it carefully before investing.
Letter to ShareholdersFebruary 7, 2024 (Unaudited)
Dear Shareholder,
U.S. equity markets surged through the end of 2023 and into early 2024 as the risk of economic recession receded and the prospect of lower interest rates drove investor optimism. Globally, financial markets largely generated positive returns, despite heightened geopolitical tensions and signs of economic weakness across Europe and China.
|
“Investors appear to have begun 2024 with a positive outlook, with the U.S. economy and its financial markets leading global growth.” — Brian S. Shlissel
|
Inflation pressures eased sufficiently during the second half of 2023 to allow the U.S. Federal Reserve (the “Fed”) to hold the benchmark discount interest rate at 5.25% at its June 2023 meeting, ending a string of 10 consecutive interest rate increases. The Fed raised rates once more in July 2023, then held the benchmark rate at 5.50% for the remainder of the 2023.
In the face of elevated interest rates, the U.S. economy proved surprisingly resilient and largely led developed markets in growth through the end of 2023. Gross domestic product outpaced economists’ consensus expectations with a 4.9% jump in the third quarter and estimated growth of 3.3% in the fourth quarter. Though the U.S. economy continued to expand, inflation data indicated that the Fed’s efforts to cool the domestic economy appeared to be effective.
Certain other measures of the U.S. economy showed little sign of weakness. Consumer spending remained elevated in the second half of 2023 and rose month-to-month to reach approximately $709.9 billion in retail sales in December 2023. The unemployment rate settled at 3.7% in the final two months of 2023 as approximately 333,000 jobs were added in December alone. Further, an estimated 353,000 jobs were added in January 2024, approximately double the increase anticipated by certain economists.
Both equity and bond markets in the U.S. performed well, buoyed by the overall strength shown by the U.S. economy and the apparent turn in Fed policy. Stronger-than-expected consumer spending and corporate earnings, as well as investor expectations for artificial-intelligence-driven productivity gains bolstered demand for equities in recent months. Certain leading U.S. equity indexes returned more than 9% in November and in excess of 5% in December 2023. In January 2024, the S&P 500 Index reached six new closing highs and surpassed 4,800 points for the first time. However, equity market gains were not broadly spread: The largest 10 stocks in the S&P 500 Index comprised approximately 90% of the index’s price gains for all of 2023.
While U.S. financial markets largely appeared to withstand increased geopolitical tensions in 2023, the potential for the conflicts in Ukraine and Israel to expand in intensity and geography may threaten global economic growth and increase market volatility. Additionally, the Fed may be forced to change policy should the strength of U.S. economy recede or the downward trend in inflation were to reverse.
Investors appear to have begun 2024 with a positive outlook, with the U.S. economy and its financial markets leading global growth. While risks to the growth outlook remain, we believe investors who hold a well-diversified portfolio over the long term should be positioned to benefit from positive economic trends.
Our suite of investment solutions seeks to provide investors with the ability to build durable portfolios that meet their financial goals, regardless of macroeconomic and geopolitical uncertainties.
Sincerely,
Brian S. Shlissel
President, J.P. Morgan Funds
J.P. Morgan Asset Management
1-800-480-4111 or www.jpmorganfunds.com for more information
| J.P. Morgan Small Cap Funds | |
J.P. Morgan Small Cap Funds
MARKET OVERVIEWSIX MONTHS ENDED December 31, 2023 (Unaudited)
U.S. equity markets largely rallied in the final two months of 2023, rebounding from three months of declines to generate positive returns for the six month period. Investor demand for large cap stocks in the technology and communications sectors was a leading driver of equity market returns. Bond markets generally provided positive returns but underperformed equity markets.
After raising its policy benchmark interest rates by 0.25% in July 2023, the U.S. Federal Reserve (the “Fed”) declined to raise rates further at its next three meetings for the year. More importantly for investors, the central bank stated in December 2023 that it could begin to lower interest rates in the first half of 2024, if inflationary pressures continued to recede.
While the U.S. economic growth showed signs of slowing in mid-2023, third-quarter gross domestic product exceeded economists’ consensus expectations with a 4.9% increase. Growth was largely driven by resilient consumer spending and inventory building by businesses. The unemployment rate in the U.S. remained historically low at 3.8% for most of the six-month period before settling at 3.7% in December 2023. The data and the outlook for interest rates fed investor expectations that the U.S. could avoid an economic recession in 2024.
U.S. equities generally outperformed both international developed markets and emerging markets equities for the period. Overall, gains in U.S. markets were led by large capitalization stocks in the technology and communications sectors, particularly the so-called Magnificent Seven: Apple Inc., Amazon.com Inc., Alphabet Inc., Meta Platforms Inc., Microsoft Corp., Nvidia Corp. and Tesla Inc. At the end of 2023, the 10 largest companies in the S&P 500 Index accounted for 31.2% of the index’s total market capitalization. Notably, only within small cap stocks did value outperform growth for the period.
Investor expectations that the Fed and private sector banks could begin to lower their interest rates sparked a broad rally in U.S. fixed income markets in the final two months of 2023. Overall, lower quality bonds, high yield bonds (also known a junk bonds) and emerging markets debt outperformed U.S. Treasury bonds and higher quality U.S. corporate debt.
| J.P. Morgan Small Cap Funds | |
JPMorgan Small Cap Blend Fund
FUND COMMENTARYSIX MONTHS ENDED December 31, 2023 (Unaudited)
| |
Fund (Class A Shares, without a sales charge) * | |
| |
Net Assets as of 12/31/2023 (In Thousands) | |
INVESTMENT OBJECTIVE**
The JPMorgan Small Cap Blend Fund (the “Fund”) seeks capital growth over the long term.
WHAT WERE THE MAIN DRIVERS OF THE FUND’S PERFORMANCE?
The Fund’s Class A Shares, without a sales charge, underperformed the Russell 2000 Index (the “Benchmark”) for the six months ended December 31, 2023.
The Fund’s security selection in the consumer discretionary and health care sectors was a leading detractor from performance relative to the Benchmark, while the Fund’s security selection in the information technology and materials sectors was a leading contributor to relative performance.
Leading individual detractors from relative performance included the Fund’s overweight position in Revance Therapeutics Inc. and its out-of-Benchmark positions in Petco Health and Wellness Co. and Confluent Inc. Shares of Revance Therapeutics, a pharmaceutical cosmetics developer, fell after the company reported lower-than-expected earnings and revenue for the third quarter of 2023. Shares of Petco Health and Wellness, a pet products chain, fell after the company reported lower-than-expected earnings for the third quarter of 2023. Shares of Confluent, a software developer, fell sharply after the company issued a weaker than expected earnings forecast.
Leading individual contributors to relative performance included the Fund’s out-of-Benchmark position in SentinelOne Inc. and its overweight positions in Twist Bioscience Corp. and Independent Bank Corp. Shares of SentinelOne, a data security technology provider, rose after the company reported better-than-expected earnings and revenue for the third quarter of 2023 and raised its full year 2023 earnings forecast. Shares of Twist Bioscience, a biotechnology developer, rose after the company reported consecutive quarters of better-than-expected earnings and revenue. Shares of Independent Bank, a regional bank based in Grand Rapids, Michigan, rose after reporting consecutive quarters of better-than-expected earnings and revenue and amid investor expectations that regional banks would benefit from lower interest rates in 2024.
HOW WAS THE FUND POSITIONED?
The Fund’s portfolio managers utilized a bottom-up approach to stock selection, researching individual companies in an effort to construct a portfolio of companies that are attractively valued and stocks that have a history of growth. The Fund’s portfolio managers preferred to invest in high quality companies with durable franchises that, in their view, possessed the ability to generate consistent earnings. The Fund is positioned to invest in small cap companies across both
growth and value styles.
TOP TEN HOLDINGS OF THE
PORTFOLIO AS OF December 31, 2023 | PERCENT OF
TOTAL
INVESTMENTS |
| Applied Industrial Technologies, Inc. | |
| | |
| Comfort Systems USA, Inc. | |
| Super Micro Computer, Inc. | |
| Selective Insurance Group, Inc. | |
| Simpson Manufacturing Co., Inc. | |
| | |
| | |
| PennyMac Financial Services, Inc. | |
| Evolent Health, Inc., Class A | |
PORTFOLIO COMPOSITION BY SECTOR
AS OF December 31, 2023 | PERCENT OF
TOTAL
INVESTMENTS |
| |
| |
| |
| |
| |
| |
| |
| |
| |
| |
| |
Others (each less than 1.0%) | |
| |
| J.P. Morgan Small Cap Funds | |
JPMorgan Small Cap Blend Fund
FUND COMMENTARYSIX MONTHS ENDED December 31, 2023 (Unaudited) (continued)
*
The return shown is based on net asset values calculated for shareholder transactions and may differ from the return shown in the financial highlights, which reflects adjustments made to the net asset values in accordance with accounting principles generally accepted in the United States of America.
**
The adviser seeks to achieve the Fund’s objective. There can be no guarantee it will be achieved.
| J.P. Morgan Small Cap Funds | |
AVERAGE ANNUAL TOTAL RETURNS AS OF December 31, 2023
|
| |
| Sales Charge for Class A Shares is 5.25%. |
| Assumes a 1% CDSC (contingent deferred sales charge) for the 6 month and one year periods and 0% CDSC thereafter. |
TEN YEAR FUND PERFORMANCE (12/31/13 TO 12/31/23)
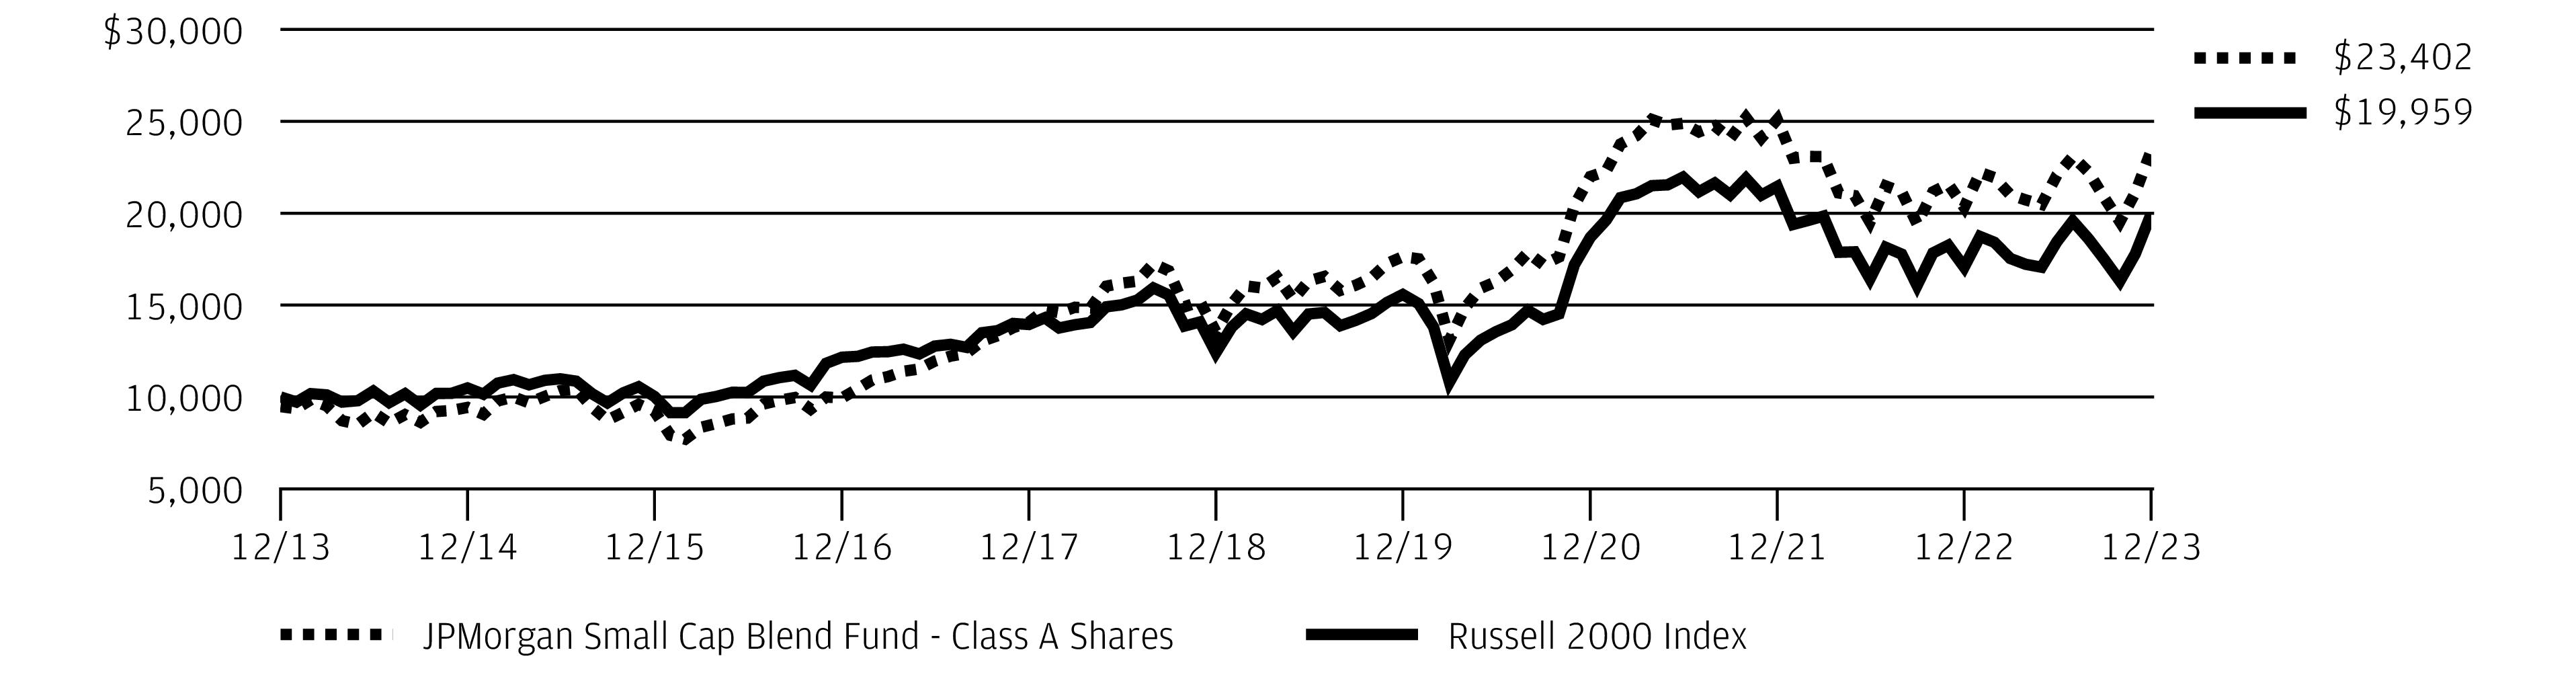
The performance quoted is past performance and is not a guarantee of future results. Mutual funds are subject to certain market risks. Investment returns and principal value of an investment will fluctuate so that an investor’s shares, when redeemed, may be worth more or less than their original cost. Current performance may be higher or lower than the performance data shown. Updated performance information is available by visiting www.jpmorganfunds.com or by calling 1-800-480-4111.
Returns for Class R6 Shares prior to their inception date are based on the performance of Class I Shares. The actual returns for Class R6 Shares would have been different than those shown because Class R6 have different expenses than Class I Shares.
The graph illustrates comparative performance for $10,000 invested in Class A Shares of the JPMorgan Small Cap Blend Fund and the Russell 2000 Index from December 31, 2013 to December 31, 2023. The performance of the Fund assumes reinvestment of all dividends and capital gain distributions, if any, and includes a sales charge. The performance of the Russell 2000 Index does not reflect the deduction of expenses or a sales charge associated with a mutual fund and has been adjusted to reflect reinvestment of all dividends and capital gain distributions of the securities included in the benchmark, if applicable. The Russell 2000 Index is an unmanaged index which measures the performance of the 2000 smallest stocks (on the basis of capitalization) in the Russell 3000 Index. Investors cannot invest directly in an index.
Effective June 1, 2018, the Fund’s investment strategies changed. Although past performance is not necessarily an indication of how the Fund will perform in
the future, in view of these changes, the Fund’s performance record prior to this date might be less relevant for investors considering whether to purchase shares of the Fund.
Class A Shares have a $1,000 minimum initial investment and carry a 5.25% sales charge.
Fund performance may reflect the waiver of the Fund’s fees and reimbursement of expenses for certain periods. Without these waivers and reimbursements, performance would have been lower. Also, performance shown in this section does not reflect the deduction of taxes that a shareholder would pay on Fund distributions or on gains resulting from redemptions of Fund shares.
Because Class C Shares automatically convert to Class A Shares after 8 years, the 10 year average annual total return shown above for Class C Shares reflects Class A Share's performance for the period after conversion.
The returns shown are based on net asset values calculated for shareholder transactions and may differ from the returns shown in the financial highlights, which reflect adjustments made to the net asset values in accordance with accounting principles generally accepted in the United States of America.
Frank Russell Company is the source and owner of the Russell Index data contained or reflected in this material and all trademarks and copyrights related thereto. Frank Russell Company is not responsible for the formatting or configuration of this material or for any inaccuracy in the adviser's presentation thereof.
| J.P. Morgan Small Cap Funds | |
JPMorgan Small Cap Equity Fund
FUND COMMENTARYSIX MONTHS ENDED December 31, 2023 (Unaudited)
| |
Fund (Class A Shares, without a sales charge) * | |
| |
Net Assets as of 12/31/2023 (In Thousands) | |
INVESTMENT OBJECTIVE**
The JPMorgan Small Cap Equity Fund (the “Fund”) seeks capital growth over the long term.
WHAT WERE THE MAIN DRIVERS OF THE FUND’S PERFORMANCE?
The Fund’s Class A Shares, without a sales charge, underperformed the Russell 2000 Index (the “Benchmark”) for the six months ended December 31, 2023.
The Fund’s security selection in the consumer discretionary and health care sectors was a leading detractor from performance relative to the Benchmark, while the Fund’s security selection in the consumer staples sector and industrials sectors were leading contributors to relative performance.
Leading individual detractors from relative performance included the Fund’s out-of-Benchmark positions in ICU Medical and Driven Brands Holdings Inc., and its overweight position in Agiliti Inc. Shares of ICU Medical, a medical devices manufacturer, fell after the company reported lower-than-expected revenue for the second quarter of 2023 and a decline in revenue for the third quarter of 2023. Shares of Driven Brands Holdings, an automotive parts and services provider, fell after the company sharply lowered its earnings forecast during the period. Shares of Agiliti, a provider of management technology and services to the health care industry, fell after the company reported lower-than-expected earnings for the second quarter of 2023.
Leading individual contributors to relative performance included the Fund’s overweight positions in Macom Technology Solutions Holdings Inc. and Simpson Manufacturing Co., and its out-of-Benchmark position in Evercore Inc. Shares of Macom Technology Solutions, a semiconductor manufacturer, rose after the company reported better-than-expected earnings for the third quarter of 2023 amid increased demand for artificial intelligence technologies. Shares of Simpson Manufacturing, a construction products maker, rose after the company reported consecutive quarters of better-than-expected earnings and revenue. Shares of Evercore, an investment banking and brokerage firm, rose after the company reported better-than-expected earnings and revenue for the third quarter of 2023.
HOW WAS THE FUND POSITIONED?
The Fund’s portfolio managers employed a bottom-up approach to stock selection, constructing portfolios based on company fundamentals and proprietary analysis. The Fund’s portfolio managers looked for companies that, in their view, had leading competitive advantages, predictable and durable business models, and sustainable free cash flow generation with
management teams committed to increasing intrinsic value.
TOP TEN HOLDINGS OF THE
PORTFOLIO AS OF December 31, 2023 | PERCENT OF
TOTAL
INVESTMENTS |
| WillScot Mobile Mini Holdings Corp. | |
| MACOM Technology Solutions Holdings, Inc. | |
| | |
| Performance Food Group Co. | |
| | |
| | |
| | |
| | |
| | |
| Casella Waste Systems, Inc., Class A | |
PORTFOLIO COMPOSITION BY SECTOR
AS OF December 31, 2023 | PERCENT OF
TOTAL
INVESTMENTS |
| |
| |
| |
| |
| |
| |
| |
| |
| |
| |
| |
*
The return shown is based on net asset values calculated for shareholder transactions and may differ from the return shown in
| J.P. Morgan Small Cap Funds | |
the financial highlights, which reflects adjustments made to the net asset values in accordance with accounting principles generally accepted in the United States of America.
**
The adviser seeks to achieve the Fund’s objective. There can be no guarantee it will be achieved.
| J.P. Morgan Small Cap Funds | |
JPMorgan Small Cap Equity Fund
FUND COMMENTARYSIX MONTHS ENDED December 31, 2023 (Unaudited) (continued)
AVERAGE ANNUAL TOTAL RETURNS AS OF December 31, 2023
|
| |
| Sales Charge for Class A Shares is 5.25%. |
| Assumes a 1% CDSC (contingent deferred sales charge) for the 6 month and one year periods and 0% CDSC thereafter. |
TEN YEAR FUND PERFORMANCE (12/31/13 TO 12/31/23)

The performance quoted is past performance and is not a guarantee of future results. Mutual funds are subject to certain market risks. Investment returns and principal value of an investment will fluctuate so that an investor’s shares, when redeemed, may be worth more or less than their original cost. Current performance may be higher or lower than the performance data shown. Updated performance information is available by visiting www.jpmorganfunds.com or by calling 1-800-480-4111.
Returns for Class R3 Shares prior to their inception date are based on the performance of Class A Shares. The actual returns of Class R3 Shares would have been similar to those shown because Class R3 Shares have similar expenses to Class A Shares at time of launch.
Returns for Class R4 Shares prior to their inception date are based on the performance of Class I Shares. The actual returns for Class R4 Shares would have been similar to those shown because Class R4 Shares have similar expenses to Class I Shares.
Returns for Class R6 Shares prior to their inception date are based on the performance of the Class R5 Shares. The actual returns of Class R6 Shares would have been different than those shown because Class R6 Shares have different expenses than Class R5 Shares.
The graph illustrates comparative performance for $10,000 invested in Class A Shares of the JPMorgan Small Cap Equity Fund and the Russell 2000 Index from December 31, 2013 to December 31, 2023. The performance of the Fund assumes reinvestment of all dividends and capital gain distributions, if any, and
includes a sales charge. The performance of the Russell 2000 Index does not reflect the deduction of expenses or a sales charge associated with a mutual fund and has been adjusted to reflect reinvestment of all dividends and capital gain distributions of the securities included in the benchmark, if applicable. The Russell 2000 Index is an unmanaged index which measures the performance of the 2000 smallest stocks (on the basis of capitalization) in the Russell 3000 Index. Investors cannot invest directly in an index.
Class A Shares have a $1,000 minimum initial investment and carry a 5.25% sales charge.
Fund performance may reflect the waiver of the Fund’s fees and reimbursement of expenses for certain periods. Without these waivers and reimbursements, performance would have been lower. Also, performance shown in this section does not reflect the deduction of taxes that a shareholder would pay on Fund distributions or on gains resulting from redemptions of Fund shares.
Because Class C Shares automatically convert to Class A Shares after 8 years, the 10 year average annual total return shown above for Class C Shares reflects Class A Share's performance for the period after conversion.
The returns shown are based on net asset values calculated for shareholder transactions and may differ from the returns shown in the financial highlights, which reflect adjustments made to the net asset values in accordance with accounting principles generally accepted in the United States of America.
Frank Russell Company is the source and owner of the Russell Index data contained or reflected in this material and all trademarks and copyrights related
| J.P. Morgan Small Cap Funds | |
thereto. Frank Russell Company is not responsible for the formatting or configuration of this material or for any inaccuracy in the adviser's presentation thereof.
| J.P. Morgan Small Cap Funds | |
JPMorgan Small Cap Growth Fund
FUND COMMENTARYSIX MONTHS ENDED December 31, 2023 (Unaudited)
| |
Fund (Class A Shares, without a sales charge) * | |
Russell 2000 Growth Index | |
Net Assets as of 12/31/2023 (In Thousands) | |
INVESTMENT OBJECTIVE**
The JPMorgan Small Cap Growth Fund (the “Fund”) seeks long-term capital growth primarily by investing in a portfolio of equity securities of small-capitalization and emerging growth companies.
WHAT WERE THE MAIN DRIVERS OF THE FUND’S PERFORMANCE?
The Fund’s Class A Shares, without a sales charge, underperformed the Russell 2000 Growth Index (the “Benchmark”) for the six months ended December 31, 2023.
The Fund’s security selection in the health care and consumer discretionary sectors was a leading detractor from performance relative to the Benchmark, while the Fund’s underweight position in the telecommunications sector and security selection in the technology sector were leading contributors to relative performance.
Leading individual detractors from relative performance included the Fund’s overweight positions in Outset Medical Inc. and Revance Therapeutics Inc., and its out-of-Benchmark position in Petco Health and Wellness Co. Shares of Outset Medical, a maker of kidney dialysis systems, fell after the company lowered its 2023 revenue forecast and reported lower-than-expected earnings for the third quarter of 2023. Shares of Revance Therapeutics, a pharmaceutical cosmetics developer, fell after the company reported lower-than-expected earnings and revenue for the third quarter of 2023. Shares of Petco Health and Wellness, a pet products chain, fell after the company reported lower-than-expected earnings for the third quarter of 2023.
Leading individual contributors to relative performance included the Fund’s out-of-Benchmark positions in Twist Bioscience Corp., SentinelOne Inc. and Elastic NV. Shares of Twist Bioscience, a biotechnology developer, rose after the company reported consecutive quarters of better-than-expected earnings and revenue. Shares of SentinelOne, a data security technology provider, rose after the company reported better-than-expected earnings and revenue for the third quarter of 2023 and raised its full year 2023 earnings forecast. Shares of Elastic, a data storage software developer, rose after the company reported better-than-expected earnings and
revenue for its fiscal second quarter and issued a stronger-than-expected earnings forecast.
HOW WAS THE FUND POSITIONED?
The Fund’s portfolio managers utilized a bottom-up approach to stock selection, researching individual companies in an effort to construct portfolios of stocks that have strong fundamentals.
The Fund’s portfolio managers preferred to invest in high quality companies with durable franchises that, in their view, possessed the ability to generate strong future earnings
growth.
TOP TEN HOLDINGS OF THE
PORTFOLIO AS OF December 31, 2023 | PERCENT OF
TOTAL
INVESTMENTS |
| Super Micro Computer, Inc. | |
| Simpson Manufacturing Co., Inc. | |
| Applied Industrial Technologies, Inc. | |
| Evolent Health, Inc., Class A | |
| | |
| | |
| Casella Waste Systems, Inc., Class A | |
| Amicus Therapeutics, Inc. | |
| | |
| | |
PORTFOLIO COMPOSITION BY SECTOR
AS OF December 31, 2023 | PERCENT OF
TOTAL
INVESTMENTS |
| |
| |
| |
| |
| |
| |
| |
| |
| |
*
The return shown is based on net asset values calculated for shareholder transactions and may differ from the return shown in
| J.P. Morgan Small Cap Funds | |
the financial highlights, which reflects adjustments made to the net asset values in accordance with accounting principles generally accepted in the United States of America.
**
The adviser seeks to achieve the Fund’s objective. There can be no guarantee it will be achieved.
| J.P. Morgan Small Cap Funds | |
JPMorgan Small Cap Growth Fund
FUND COMMENTARYSIX MONTHS ENDED December 31, 2023 (Unaudited) (continued)
AVERAGE ANNUAL TOTAL RETURNS AS OF December 31, 2023
|
| |
| Sales Charge for Class A Shares is 5.25%. |
| Assumes a 1% CDSC (contingent deferred sales charge) for the 6 month and one year periods and 0% CDSC thereafter. |
TEN YEAR FUND PERFORMANCE (12/31/13 TO 12/31/23)
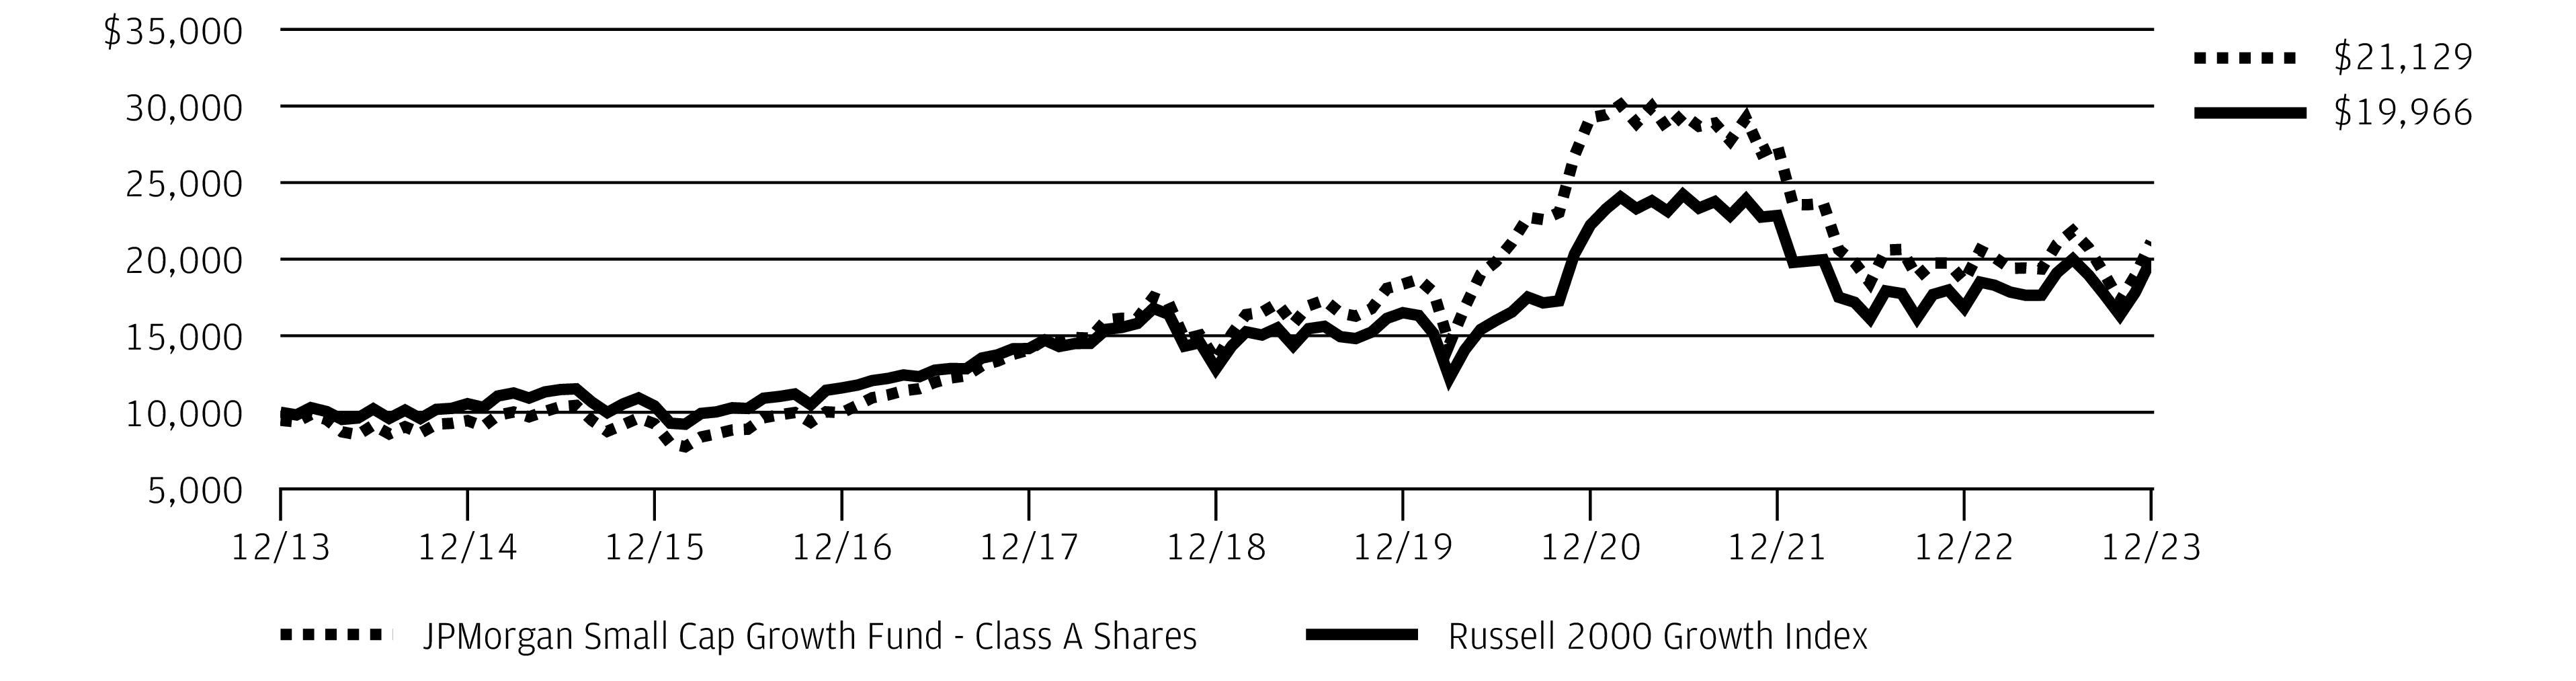
The performance quoted is past performance and is not a guarantee of future results. Mutual funds are subject to certain market risks. Investment returns and principal value of an investment will fluctuate so that an investor’s shares, when redeemed, may be worth more or less than their original cost. Current performance may be higher or lower than the performance data shown. Updated performance information is available by visiting www.jpmorganfunds.com or by calling 1-800-480-4111.
Returns for Class R3 Shares prior to their inception date are based on the performance of Class A Shares. Prior performance for Class R3 Shares has been adjusted to reflect the differences in expenses between classes.
Returns for Class R4 Shares prior to their inception date are based on the performance of Class I Shares. Prior performance for Class R4 Shares has been adjusted to reflect the differences in expenses between classes.
Returns for Class R5 Shares prior to their inception date are based on the performance of Class L Shares. The actual returns for Class R5 Shares would have been different than those shown because Class R5 Shares have different expenses than Class L Shares.
The graph illustrates comparative performance for $10,000 invested in Class A Shares of the JPMorgan Small Cap Growth Fund and the Russell 2000 Growth Index from December 31, 2013 to December 31, 2023. The performance of the Fund assumes reinvestment of all dividends and capital gain distributions, if any, and includes a sales charge. The performance of the Russell 2000 Growth
Index does not reflect the deduction of expenses or a sales charge associated with a mutual fund and has been adjusted to reflect reinvestment of all dividends and capital gain distributions of the securities included in the benchmark, if applicable. The Russell 2000 Growth Index is an unmanaged index which measures the performance of those Russell 2000 companies with higher price-to-book ratios and higher forecasted growth values. Investors cannot invest directly in an index.
Class A Shares have a $1,000 minimum initial investment and carry a 5.25% sales charge.
Fund performance may reflect the waiver of the Fund’s fees and reimbursement of expenses for certain periods. Without these waivers and reimbursements, performance would have been lower. Also, performance shown in this section does not reflect the deduction of taxes that a shareholder would pay on Fund distributions or on gains resulting from redemptions of Fund shares.
Because Class C Shares automatically convert to Class A Shares after 8 years, the 10 year average annual total return shown above for Class C Shares reflects Class A Share's performance for the period after conversion.
The returns shown are based on net asset values calculated for shareholder transactions and may differ from the returns shown in the financial highlights, which reflect adjustments made to the net asset values in accordance with accounting principles generally accepted in the United States of America.
| J.P. Morgan Small Cap Funds | |
Frank Russell Company is the source and owner of the Russell Index data contained or reflected in this material and all trademarks and copyrights related thereto. Frank Russell Company is not responsible for the formatting or configuration of this material or for any inaccuracy in the adviser's presentation thereof.
| J.P. Morgan Small Cap Funds | |
JPMorgan Small Cap Sustainable Leaders Fund
FUND COMMENTARYSIX MONTHS ENDED December 31, 2023 (Unaudited)
| |
| |
| |
Net Assets as of 12/31/2023 (In Thousands) | |
INVESTMENT OBJECTIVE**
The JPMorgan Small Cap Sustainable Leaders Fund (the “Fund”) seeks capital growth over the long term.
WHAT WERE THE MAIN DRIVERS OF THE FUND’S PERFORMANCE?
The Fund’s Class R5 Shares underperformed the Russell 2000 Index (the “Benchmark”) for the six months ended December 31, 2023.
The Fund’s security selection in the pharmaceuticals sector and its overweight position in the health services & systems sector were leading detractors from performance relative to the Benchmark. The Fund’s security selection in the consumer cyclical and industrial cyclical sectors was a leading contributor to relative performance.
Leading individual detractors from relative performance included the Fund’s overweight positions in Outset Medical Inc. and Shrodinger Inc., and its out-of-Benchmark position in Darling Ingredients Inc. Shares of Outset Medical, a maker of kidney dialysis systems, fell after the company lowered its 2023 revenue forecast and reported lower-than-expected earnings for the third quarter of 2023. Shares of Schrodinger, a maker of pharmaceutical development technology, fell after the company reported consecutive quarters of lower-than-expected earnings. Shares of Darling Ingredients, an agricultural products and services provider, fell after the company reported consecutive quarters of lower-than-expected earnings and revenue.
Leading individual contributors to relative performance included the Fund’s overweight positions in Amalgamated Financial Corp. and MillerKnoll Inc., and its out-of-Benchmark position in Deckers Outdoor Corp. Shares of Amalgamated Financial, a New York State regional bank, rose after the company reported better-than-expected earnings for the third quarter of 2023, and amid investor expectations that regional bank would benefit from lower interest rates in 2024. Shares of MillerKnoll, an office services and supplies provider, rose after reporting consecutive quarters of better-than-expected earnings and revenue. Shares of Deckers Outdoor, a footwear and apparel designer, rose after the company reported better-than-expected earnings and revenue for the second quarter of 2023 and issued an upbeat earnings forecast for the full year 2023.
HOW WAS THE FUND POSITIONED?
In accordance with its investment process, the Fund’s portfolio managers take limited sector bets and construct the Fund so that stock selection is typically the primary driver of the Fund’s relative performance versus the Benchmark. The Fund’s portfolio managers employ a bottom-up approach to stock selection, using quantitative screening and proprietary analysis to construct a portfolio of companies that they believe are attractively valued and possess strong momentum. During the reporting period, the Fund was managed and positioned in
accordance with this investment process.
TOP TEN HOLDINGS OF THE
PORTFOLIO AS OF December 31, 2023 | PERCENT OF
TOTAL
INVESTMENTS |
| | |
| | |
| WESCO International, Inc. | |
| Amalgamated Financial Corp. | |
| | |
| CNO Financial Group, Inc. | |
| | |
| Huron Consulting Group, Inc. | |
| | |
| | |
PORTFOLIO COMPOSITION BY SECTOR
AS OF December 31, 2023 | PERCENT OF
TOTAL
INVESTMENTS |
| |
| |
| |
| |
| |
| |
| |
| |
| |
| |
Others (each less than 1.0%) | |
| |
| J.P. Morgan Small Cap Funds | |
*
The return shown is based on net asset values calculated for shareholder transactions and may differ from the return shown in the financial highlights, which reflects adjustments made to the net asset values in accordance with accounting principles generally accepted in the United States of America.
**
The adviser seeks to achieve the Fund’s objective. There can be no guarantee it will be achieved.
| J.P. Morgan Small Cap Funds | |
JPMorgan Small Cap Sustainable Leaders Fund
FUND COMMENTARYSIX MONTHS ENDED December 31, 2023 (Unaudited) (continued)
AVERAGE ANNUAL TOTAL RETURNS AS OF December 31, 2023
|
| |
| Sales Charge for Class A Shares is 5.25%. |
| Assumes a 1% CDSC (contingent deferred sales charge) for the 6 month and one year periods and 0% CDSC thereafter. |
TEN YEAR FUND PERFORMANCE (12/31/13 TO 12/31/23)
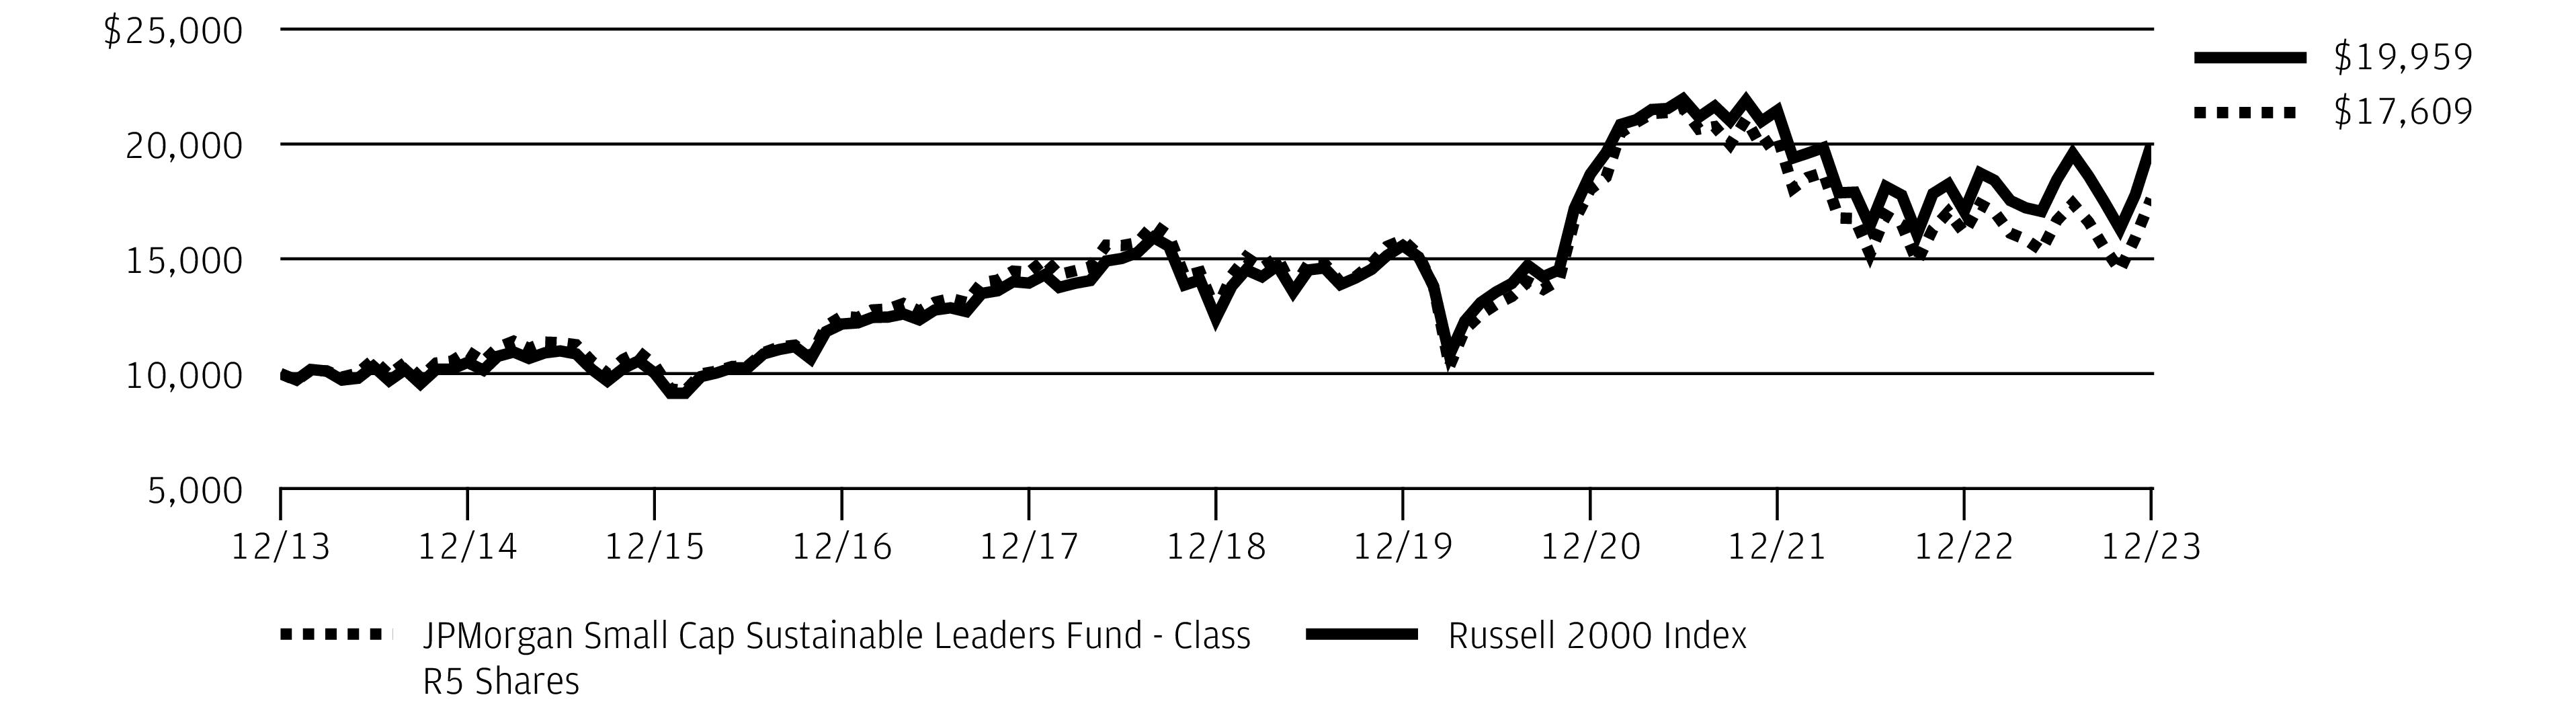
The performance quoted is past performance and is not a guarantee of future results. Mutual funds are subject to certain market risks. Investment returns and principal value of an investment will fluctuate so that an investor’s shares, when redeemed, may be worth more or less than their original cost. Current performance may be higher or lower than the performance data shown. Updated performance information is available by visiting www.jpmorganfunds.com or by calling 1-800-480-4111.
Returns for Class A, Class C, Class I, Class R2, Class R3, Class R4 and Class R6 Shares prior to their inception dates are based on the performance of Class R5 Shares. The actual returns of Class A, Class C, Class I, Class R2, Class R3 and Class R4 Shares would have been lower than those shown because these classes have higher expenses than Class R5 Shares. The actual returns of the Class R6 Shares would have been different than those shown because Class R6 Shares have different expenses than Class R5 Shares.
The graph illustrates comparative performance for $10,000 invested in Class R5 Shares of the JPMorgan Small Cap Sustainable Leaders Fund and the Russell 2000 Index from December 31, 2013 to December 31, 2023. The performance of the Fund assumes reinvestment of all dividends and capital gain distributions, if any, and does not include a sales charge. The performance of the Russell 2000 Index does not reflect the deduction of expenses or a sales charge associated with a mutual fund and has been adjusted to reflect reinvestment of all dividends and capital gain distributions of the securities included in the
benchmark, if applicable. The Russell 2000 Index is an unmanaged index which measures the performance of the 2000 smallest stocks (on the basis of capitalization) in the Russell 3000 Index. Investors cannot invest directly in an index.
Class R5 Shares have no minimum initial investment.
Fund performance may reflect the waiver of the Fund’s fees and reimbursement of expenses for certain periods. Without these waivers and reimbursements, performance would have been lower. Also, performance shown in this section does not reflect the deduction of taxes that a shareholder would pay on Fund distributions or on gains resulting from redemptions of Fund shares.
The returns shown are based on net asset values calculated for shareholder transactions and may differ from the returns shown in the financial highlights, which reflect adjustments made to the net asset values in accordance with accounting principles generally accepted in the United States of America.
Frank Russell Company is the source and owner of the Russell Index data contained or reflected in this material and all trademarks and copyrights related thereto. Frank Russell Company is not responsible for the formatting or configuration of this material or for any inaccuracy in the adviser's presentation thereof.
| J.P. Morgan Small Cap Funds | |
JPMorgan Small Cap Value Fund
FUND COMMENTARYSIX MONTHS ENDED December 31, 2023 (Unaudited)
| |
| |
| |
Net Assets as of 12/31/2023 (In Thousands) | |
INVESTMENT OBJECTIVE**
The JPMorgan Small Cap Value Fund (the “Fund”) seeks long-term capital growth primarily by investing in equity securities of small-capitalization companies.
WHAT WERE THE MAIN DRIVERS OF THE FUND’S PERFORMANCE?
The Fund’s Class I Shares underperformed the Russell 2000 Value Index (the “Benchmark”) for the six months ended December 31, 2023.
The Fund’s security selection in the pharmaceuticals and software & services sectors was a leading detractor from performance relative to the Benchmark, while the Fund’s security selection in the industrial cyclical and media sectors was a leading detractor from relative performance.
Leading individual detractors from relative performance included the Fund’s underweight position in Reata Pharmaceuticals Inc., its out-of-Benchmark position in Prothena Corp. and its overweight position in Enova International Inc. Shares of Reata Pharmaceuticals, a drug discovery and development company not held by the Fund, rose ahead of the company’s acquisition by Biogen Inc. Shares of Prothena, a biotechnology developer, fell after the company reported lower-than-expected earnings and revenue for the second quarter of 2023. Shares of Enova International, a consumer lender and financial services provider, fell after the company reported lower-than-expected earnings for the third quarter of 2023.
Leading individual contributors to relative performance included the Fund’s overweight positions in Bluegreen Vacations Holding Corp. and Customers Bancorp Inc., and its out-of-Benchmark position in RxSight Inc. Shares of Bluegreen Vacations, a seller of resorts ownership and management services, rose after it agreed to be acquired by Hilton Grand Vacations. Shares of Customers Bancorp, a Pennsylvania retail bank, rose after the company reported better-than-expected earnings and revenue for the third quarter of 2023 and amid investor expectations that regional banks would benefit from lower interest rates in 2024. Shares of RxSight, a manufacturer of ophthalmic medical devices, rose after the company reported consecutive quarters of better-than-expected earnings and revenue.
HOW WAS THE FUND POSITIONED?
In accordance with its investment process, the Fund’s portfolio managers take limited sector bets and construct the Fund so that stock selection is typically the primary driver of the Fund’s relative performance versus the Benchmark. The Fund’s portfolio managers use a quantitative ranking methodology to identify stocks in each sector that, in their view, trade at attractive levels. Through bottom-up fundamental research, they seek companies that they believe have attractive valuations, exhibit high earnings quality and have management teams that make effective capital deployment decisions. During the reporting period, the Fund was managed and positioned in
accordance with this investment process.
TOP TEN HOLDINGS OF THE
PORTFOLIO AS OF December 31, 2023 | PERCENT OF
TOTAL
INVESTMENTS |
| | |
| OFG Bancorp (Puerto Rico) | |
| First BanCorp (Puerto Rico) | |
| Rush Enterprises, Inc., Class A | |
| | |
| | |
| | |
| | |
| | |
| | |
PORTFOLIO COMPOSITION BY SECTOR
AS OF December 31, 2023 | PERCENT OF
TOTAL
INVESTMENTS |
| |
| |
| |
| |
| |
| |
| |
| |
| |
| |
| |
| |
| J.P. Morgan Small Cap Funds | |
JPMorgan Small Cap Value Fund
FUND COMMENTARYSIX MONTHS ENDED December 31, 2023 (Unaudited) (continued)
*
The return shown is based on net asset values calculated for shareholder transactions and may differ from the return shown in the financial highlights, which reflects adjustments made to the net asset values in accordance with accounting principles generally accepted in the United States of America.
**
The adviser seeks to achieve the Fund’s objective. There can be no guarantee it will be achieved.
| J.P. Morgan Small Cap Funds | |
AVERAGE ANNUAL TOTAL RETURNS AS OF December 31, 2023
|
| |
| Sales Charge for Class A Shares is 5.25%. |
| Assumes a 1% CDSC (contingent deferred sales charge) for the 6 month and one year periods and 0% CDSC thereafter. |
TEN YEAR FUND PERFORMANCE (12/31/13 TO 12/31/23)
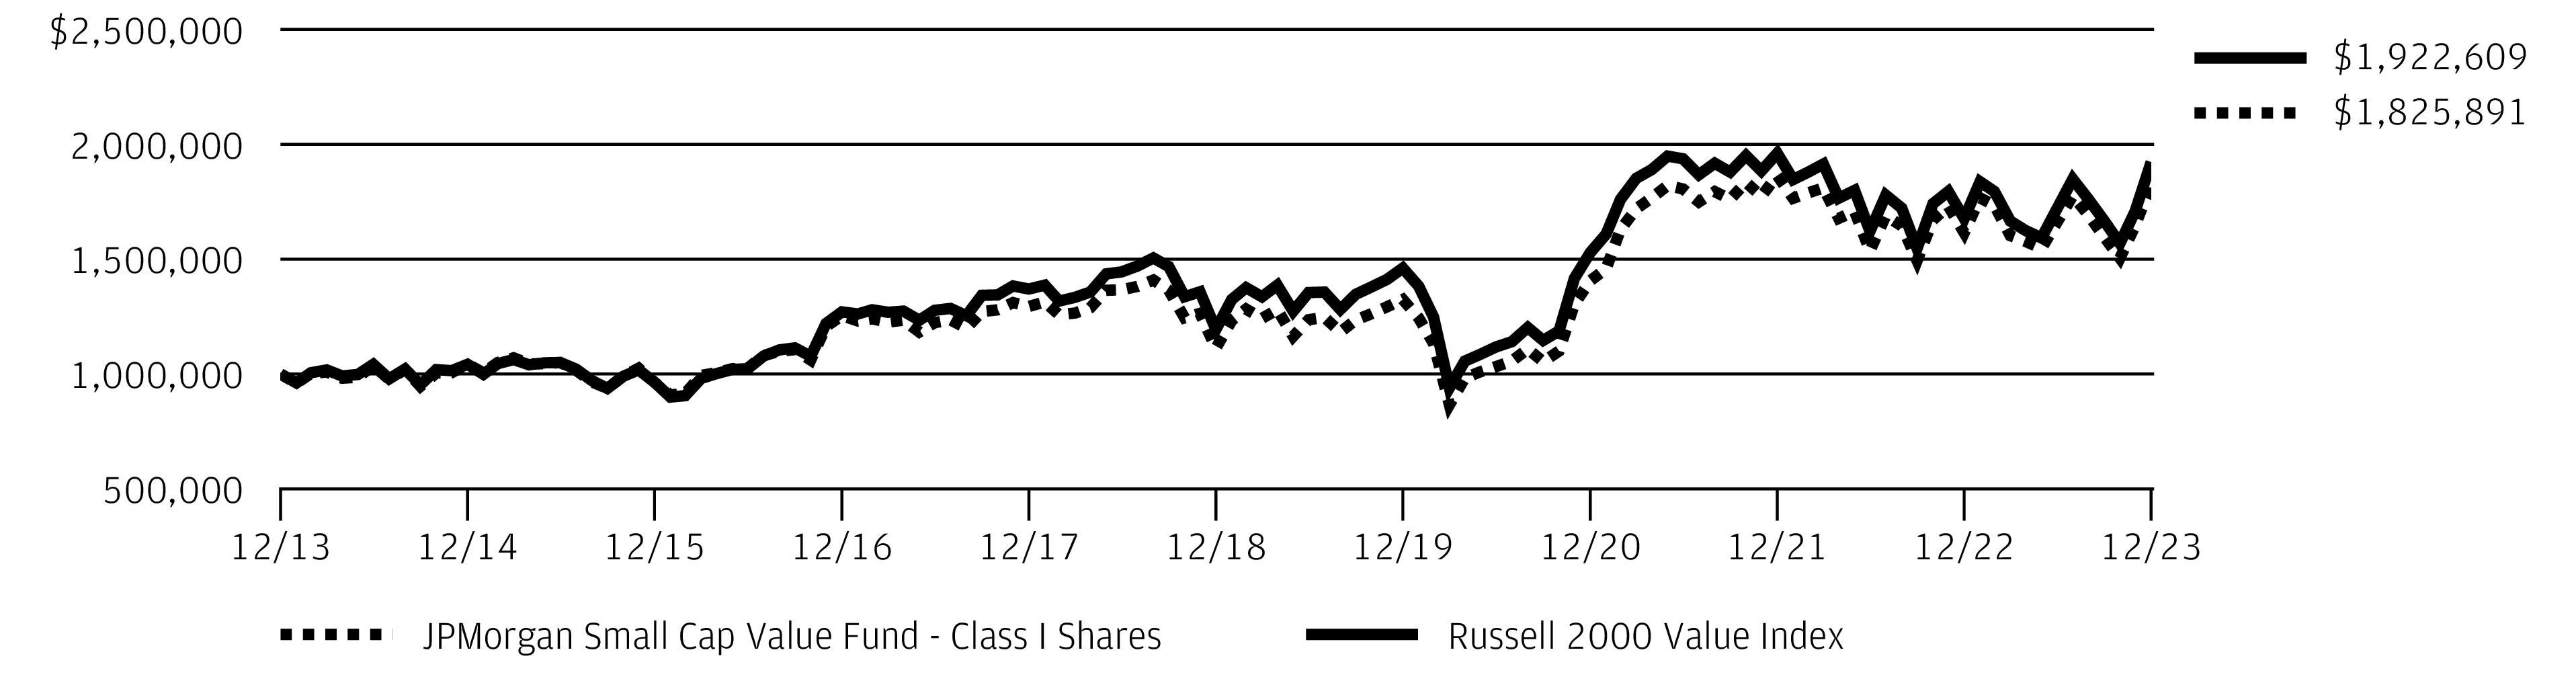
The performance quoted is past performance and is not a guarantee of future results. Mutual funds are subject to certain market risks. Investment returns and principal value of an investment will fluctuate so that an investor’s shares, when redeemed, may be worth more or less than their original cost. Current performance may be higher or lower than the performance data shown. Updated performance information is available by visiting www.jpmorganfunds.com or by calling 1-800-480-4111.
Returns for Class R3 Shares prior to their inception date are based on the performance of Class A Shares. Prior performance for Class R3 Shares has been adjusted to reflect the differences in expenses between classes.
Returns for Class R4 Shares prior to their inception date are based on the performance of Class I Shares. Prior performance for Class R4 Shares has been adjusted to reflect the differences in expenses between classes.
The graph illustrates comparative performance for $1,000,000 invested in Class I Shares of the JPMorgan Small Cap Value Fund and the Russell 2000 Value Index from December 31, 2013 to December 31, 2023. The performance of the Fund assumes reinvestment of all dividends and capital gain distributions, if any, and does not include a sales charge. The performance of the Russell 2000 Value Index does not reflect the deduction of expenses or a sales charge associated with a mutual fund and has been adjusted to reflect reinvestment of all dividends and capital gain distributions of the securities included in the benchmark, if applicable. The Russell 2000 Value Index is an unmanaged index which measures the performance of those Russell 2000 companies with lower
price-to-book ratios and lower forecasted growth values. Investors cannot invest directly in an index.
Class I Shares have a $1,000,000 minimum initial investment.
Fund performance may reflect the waiver of the Fund’s fees and reimbursement of expenses for certain periods. Without these waivers and reimbursements, performance would have been lower. Also, performance shown in this section does not reflect the deduction of taxes that a shareholder would pay on Fund distributions or on gains resulting from redemptions of Fund shares.
Because Class C Shares automatically convert to Class A Shares after 8 years, the 10 year average annual total return shown above for Class C Shares reflects Class A Share's performance for the period after conversion.
The returns shown are based on net asset values calculated for shareholder transactions and may differ from the returns shown in the financial highlights, which reflect adjustments made to the net asset values in accordance with accounting principles generally accepted in the United States of America.
Frank Russell Company is the source and owner of the Russell Index data contained or reflected in this material and all trademarks and copyrights related thereto. Frank Russell Company is not responsible for the formatting or configuration of this material or for any inaccuracy in the adviser's presentation thereof.
| J.P. Morgan Small Cap Funds | |
JPMorgan SMID Cap Equity Fund
FUND COMMENTARYSIX MONTHS ENDED December 31, 2023 (Unaudited)
| |
| |
| |
Net Assets as of 12/31/2023 (In Thousands) | |
INVESTMENT OBJECTIVE**
The JPMorgan SMID Cap Equity Fund (the “Fund”) seeks long-term capital growth by investing primarily in equity securities of companies with intermediate capitalizations.
INVESTMENT PROCESS
The Fund employs a fundamental bottom-up investment process to invest in a diversified portfolio of small- to mid-cap stocks - similar to those in the Russell 2500 Index (the “Benchmark”) – and seeks to invest in companies with leading competitive advantages, predictable and durable business models and sustainable free cash flows.
WHAT WERE THE MAIN DRIVERS OF THE FUND’S PERFORMANCE?
The Fund’s Class I Shares underperformed the Benchmark for the six months ended December 31, 2023.
The Fund’s security selection in the industrials and consumer discretionary sectors was a leading detractor from performance relative to the Benchmark, while the Fund’s overweight position in the financials sector and its security selection in the basic materials sector were leading contributors to relative performance.
Leading individual detractors from relative performance included the Fund’s overweight positions in Driven Brands Holdings Inc., ICU Medical Inc. and Cognex Corp. Shares of Driven Brands Holdings, an automotive parts and services provider, fell after the company sharply lowered its earnings forecast during the period. Shares of ICU Medical, a medical devices manufacturer, fell after the company reported
lower-than-expected revenue for the second quarter of 2023 and a decline in revenue for the third quarter of 2023. Shares of Cognex, an electronic equipment and instruments manufacturer, fell after the company reported a decline in revenue for the second quarter of 2023.
Leading individual contributors to relative performance included the Fund’s overweight positions in Simpson Manufacturing Co., RBC Bearings Inc. and ServisFirst Bancshares Inc.
Shares of Simpson Manufacturing, a construction products maker, rose after the company reported consecutive quarters of better-than-expected earnings and revenue. Shares of RBC Bearings, an industrial machinery and components manufacturer, rose after the company reported better-than-expected earnings during the period. Shares of ServisFirst Bancshares, an Alabama regional bank, rose after the company reported consecutive quarters of better-than-expected earnings and amid investor expectations that regional banks would benefit from lower interest rates in 2024.
HOW WAS THE FUND POSITIONED?
The Fund’s portfolio managers employ a fundamental bottom-up investment process that seeks to invest in companies that they believe are undervalued, have leading competitive positions and predictable and durable business models. As a result of this process, the Fund’s largest allocations during the period were to the industrials and financials sectors, while the Fund’s smallest allocations were to the energy and basic materials sectors. The Fund had no
holdings in the telecommunications sector.
| J.P. Morgan Small Cap Funds | |
*
The return shown is based on net asset values calculated for shareholder transactions and may differ from the return shown in the financial highlights, which reflects adjustments made to the net asset values in accordance with accounting principles generally accepted in the United States of America.
**
The adviser seeks to achieve the Fund’s objective. There can be no guarantee it will be achieved.
TOP TEN HOLDINGS OF THE
PORTFOLIO AS OF December 31, 2023 | PERCENT OF
TOTAL
INVESTMENTS |
| WillScot Mobile Mini Holdings Corp. | |
| | |
| | |
| | |
| | |
| | |
| Performance Food Group Co. | |
| | |
| BJ's Wholesale Club Holdings, Inc. | |
| | |
PORTFOLIO COMPOSITION BY SECTOR
AS OF December 31, 2023 | PERCENT OF
TOTAL
INVESTMENTS |
| |
| |
| |
| |
| |
| |
| |
| |
| |
| |
| |
| J.P. Morgan Small Cap Funds | |
JPMorgan SMID Cap Equity Fund
FUND COMMENTARYSIX MONTHS ENDED December 31, 2023 (Unaudited) (continued)
AVERAGE ANNUAL TOTAL RETURNS AS OF December 31, 2023
|
| |
| Sales Charge for Class A Shares is 5.25%. |
| Assumes a 1% CDSC (contingent deferred sales charge) for the 6 month and one year periods and 0% CDSC thereafter. |
TEN YEAR FUND PERFORMANCE (12/31/13 TO 12/31/23)
The performance quoted is past performance and is not a guarantee of future results. Mutual funds are subject to certain market risks. Investment returns and principal value of an investment will fluctuate so that an investor’s shares, when redeemed, may be worth more or less than their original cost. Current performance may be higher or lower than the performance data shown. Updated performance information is available by visiting www.jpmorganfunds.com or by calling 1-800-480-4111.
Returns for Class R3 Shares prior to their inception date are based on the performance of Class A Shares. The actual returns for Class R3 Shares would have been similar to those shown because Class R3 Shares have similar expenses to those of Class A Shares.
Returns for Class R4 and Class R6 Shares prior to their inception dates are based on the performance of Class I Shares. The actual returns for Class R4 Shares would have been similar to those shown for Class I Shares because Class R4 Shares have similar expenses to Class I Shares. The actual returns for Class R6 Shares would have been different than those shown because Class R6 Shares have different expenses than Class I Shares.
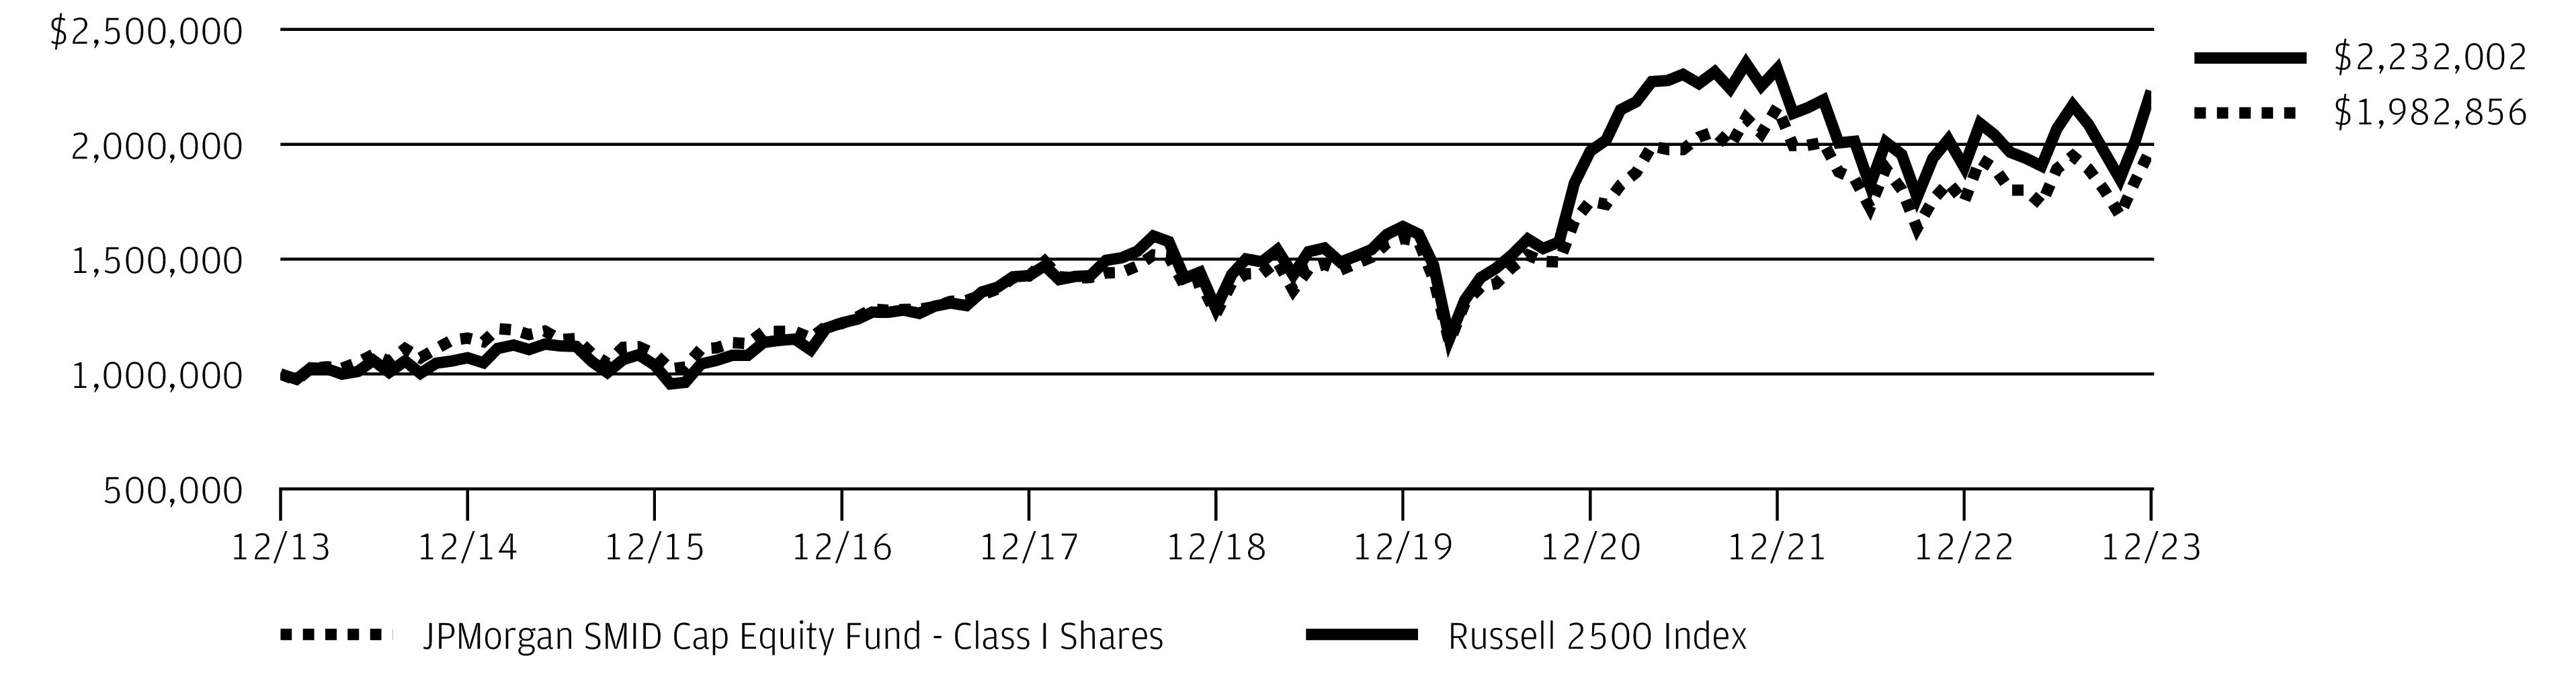
The graph illustrates comparative performance for $1,000,000 invested in Class I Shares of the JPMorgan SMID Cap Equity Fund and the Russell 2500 Index from December 31, 2013 to December 31, 2023. The performance of the Fund assumes reinvestment of all dividends and capital gain distributions, if any, and does not include a sales charge. The performance of the Russell 2500 Index does not reflect the deduction of expenses or a sales charge associated with a mutual fund and has been adjusted to reflect reinvestment of all dividends and capital gain distributions of the securities included in the benchmark, if applicable. The Russell 2500 Index measures the performance of
the 2,500 smallest companies in the Russell 3000 Index. Investors cannot invest directly in an index.
Class I Shares have a $1,000,000 minimum initial investment.
Fund performance may reflect the waiver of the Fund’s fees and reimbursement of expenses for certain periods. Without these waivers and reimbursements, performance would have been lower. Also, performance shown in this section does not reflect the deduction of taxes that a shareholder would pay on Fund distributions or on gains resulting from redemptions of Fund shares.
Effective November 1, 2020, the Fund changed its investment strategies. The Fund’s past performance would have been different if the Fund were managed using the current strategies. Past performance is not necessarily an indication of how any class of the Fund will perform in the future.
Because Class C Shares automatically convert to Class A Shares after 8 years, the 10 year average annual total return shown above for Class C Shares reflects Class A Share's performance for the period after conversion.
The returns shown are based on net asset values calculated for shareholder transactions and may differ from the returns shown in the financial highlights, which reflect adjustments made to the net asset values in accordance with accounting principles generally accepted in the United States of America.
Frank Russell Company is the source and owner of the Russell Index data contained or reflected in this material and all trademarks and copyrights related thereto. Frank Russell Company is not responsible for the formatting or configuration of this material or for any inaccuracy in the adviser's presentation thereof.
| J.P. Morgan Small Cap Funds | |
JPMorgan U.S. Small Company Fund
FUND COMMENTARYSIX MONTHS ENDED December 31, 2023 (Unaudited)
| |
| |
| |
Net Assets as of 12/31/2023 (In Thousands) | |
INVESTMENT OBJECTIVE**
The JPMorgan U.S. Small Company Fund (the “Fund”) seeks to provide high total return from a portfolio of small company stocks.
WHAT WERE THE MAIN DRIVERS OF THE FUND’S PERFORMANCE?
The Fund’s Class L Shares underperformed the Russell 2000 Index (the “Benchmark”) for the six months ended December 31, 2023.
The Fund’s security selection in the pharmaceuticals and finance sectors was a leading detractor from performance relative to the Benchmark, while the Fund’s security selection in the industrial cyclical and semiconductors sectors was a leading contributor to relative performance.
Leading individual detractors from relative performance included the Fund’s out-of-Benchmark position in Inspire Medical Systems Inc. and its overweight positions in Acelyrin Inc. and International Money Express Inc. Shares of Inspire Medical Systems, a medical device manufacturer, fell amid investor concerns that new weight-loss drugs would reduce demand for the company’s sleep apnea prevention devices. Shares of Acelyrin, a biotechnology developer, fell after the company’s inflammatory disease drug candidate failed in late-stage clinical trials. Shares of International Money Express, a payments processing service provider, fell after the company reported lower-than-expected earnings and revenue for the second quarter of 2023.
Leading individual contributors to relative performance included the Fund’s overweight positions in Bluegreen Vacations Holding Corp. and Immunovant Inc., and its out-of-Benchmark position in Medpace Holdings Inc. Shares of Bluegreen Vacations, a seller of resort ownership and management services, rose after it agreed to be acquired by Hilton Grand Vacations. Shares of Immunovant, a biopharmaceuticals developer, rose amid positive research results for its autoimmune disease drug candidate. Shares of Medpace Holdings, a provider of clinical drug and medical devices development services, rose after the company reported consecutive quarters of better-than-expected earnings and revenue.
HOW WAS THE FUND POSITIONED?
In accordance with its investment process, the Fund’s portfolio managers take limited sector bets and construct the Fund so that stock selection is typically the primary driver of the Fund’s performance relative to the Benchmark. The Fund’s portfolio managers use a quantitative ranking methodology to identify stocks in each sector that, in their view, trade at attractive levels. Through bottom-up fundamental research, they seek companies that they believe have attractive valuations, exhibit high earnings quality and have management teams that make effective capital deployment decisions. During the reporting period, the Fund was managed and positioned in accordance
with this investment process.
TOP TEN HOLDINGS OF THE
PORTFOLIO AS OF December 31, 2023 | PERCENT OF
TOTAL
INVESTMENTS |
| Super Micro Computer, Inc. | |
| Comfort Systems USA, Inc. | |
| | |
| | |
| | |
| | |
| First BanCorp (Puerto Rico) | |
| Watts Water Technologies, Inc., Class A | |
| Taylor Morrison Home Corp., Class A | |
| | |
PORTFOLIO COMPOSITION BY SECTOR
AS OF December 31, 2023 | PERCENT OF
TOTAL
INVESTMENTS |
| |
| |
| |
| |
| |
| |
| |
| |
| |
| |
| |
| |
| J.P. Morgan Small Cap Funds | |
JPMorgan U.S. Small Company Fund
FUND COMMENTARYSIX MONTHS ENDED December 31, 2023 (Unaudited) (continued)
*
The return shown is based on net asset values calculated for shareholder transactions and may differ from the return shown in the financial highlights, which reflects adjustments made to the net asset values in accordance with accounting principles generally accepted in the United States of America.
**
The adviser seeks to achieve the Fund’s objective. There can be no guarantee it will be achieved.
| J.P. Morgan Small Cap Funds | |
AVERAGE ANNUAL TOTAL RETURNS AS OF December 31, 2023
|
| |
| Sales Charge for Class A Shares is 5.25%. |
| Assumes a 1% CDSC (contingent deferred sales charge) for the 6 month and one year periods and 0% CDSC thereafter. |
TEN YEAR FUND PERFORMANCE (12/31/13 TO 12/31/23)
The performance quoted is past performance and is not a guarantee of future results. Mutual funds are subject to certain market risks. Investment returns and principal value of an investment will fluctuate so that an investor’s shares, when redeemed, may be worth more or less than their original cost. Current performance may be higher or lower than the performance data shown. Updated performance information is available by visiting www.jpmorganfunds.com or by calling 1-800-480-4111.
Returns for Class R3 Shares prior to their inception date are based on the performance of the Class A Shares. The actual returns for Class R3 Shares would have been similar to those shown because Class R3 Shares have similar expenses to Class A Shares.
Returns for Class R4 Shares prior to their inception date are based on the performance of the Class I Shares. The actual returns for Class R4 Shares would have been similar to those shown because Class R4 Shares have similar expenses to Class I Shares.
Returns for Class R5 Shares prior to their inception date are based on the performance of the Class L Shares. The actual returns of Class R5 Shares would have been similar to those shown because Class R5 Shares have similar expenses to Class L Shares.
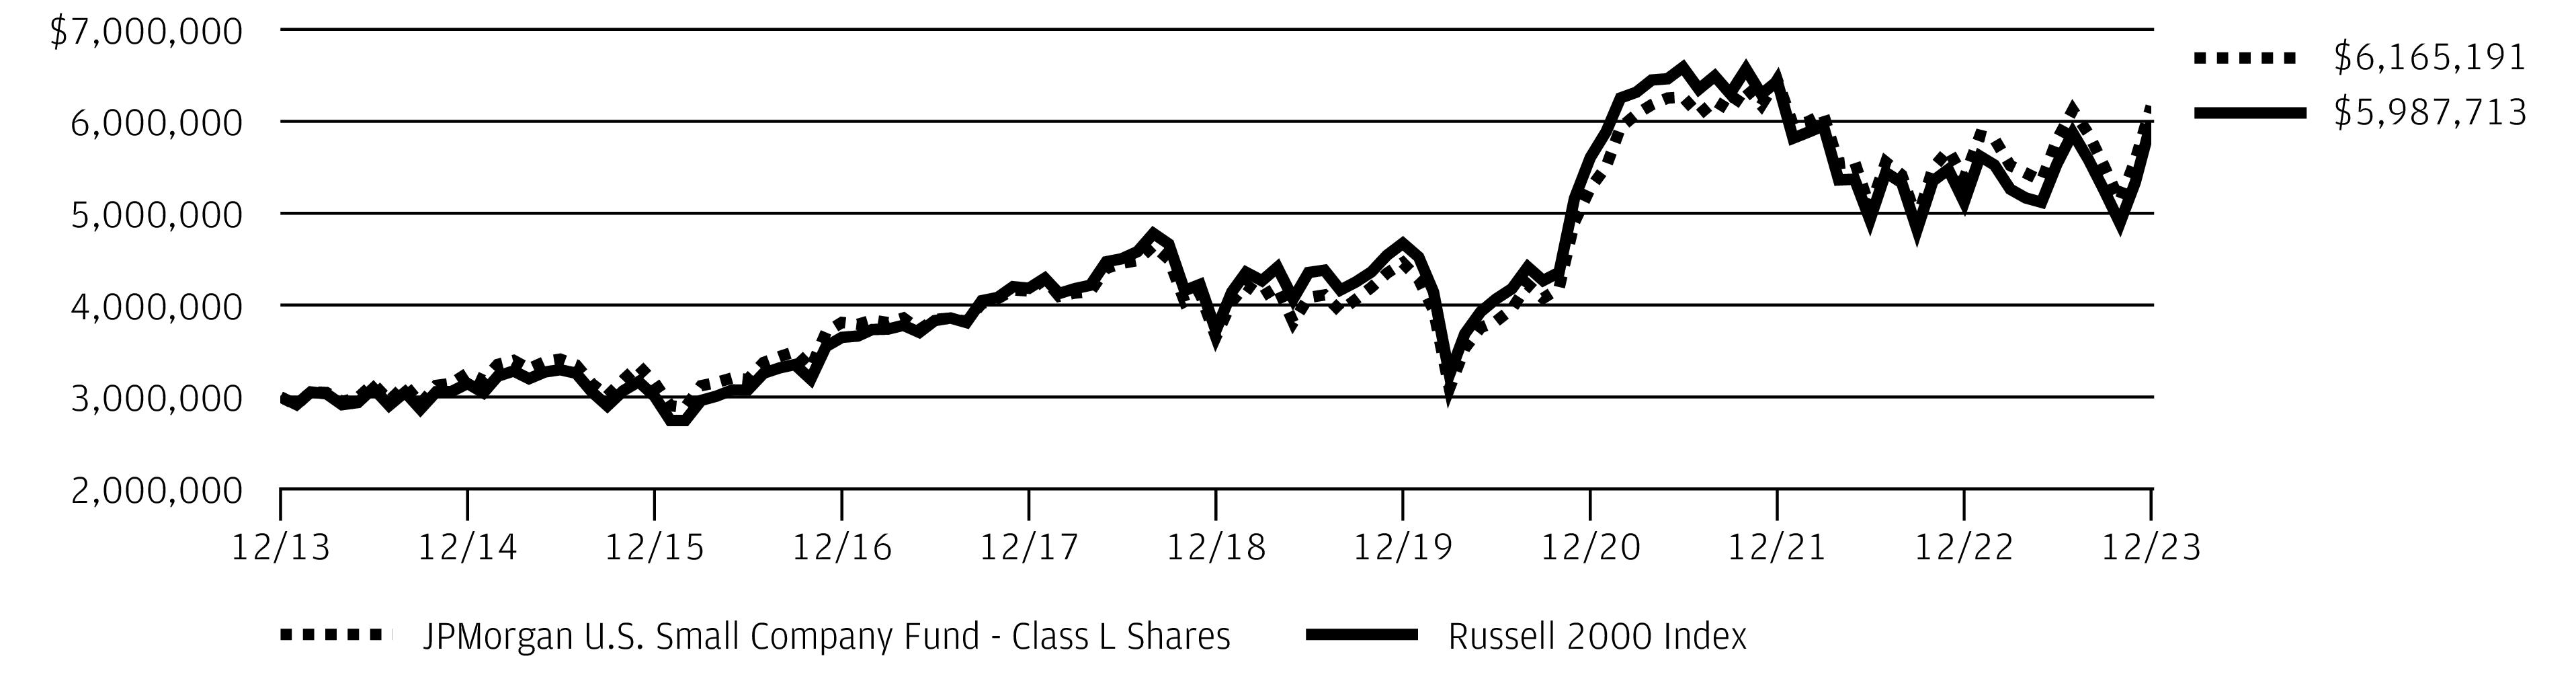
The graph illustrates comparative performance for $3,000,000 invested in Class L Shares of the JPMorgan U.S. Small Company Fund and the Russell 2000 Index from December 31, 2013 to December 31, 2023. The performance of the
Fund assumes reinvestment of all dividends and capital gain distributions, if any, and does not include a sales charge. The performance of the Russell 2000 Index does not reflect the deduction of expenses associated with a mutual fund and has been adjusted to reflect reinvestment of all dividends and capital gain distributions of the securities included in the benchmark, if applicable. The Russell 2000 Index is an unmanaged index which measures the performance of the 2000 smallest stocks (on the basis of capitalization) in the Russell 3000 Index. Investors cannot invest directly in an index.
Class L Shares have a $3,000,000 minimum initial investment.
Fund performance may reflect the waiver of the Fund’s fees and reimbursement of expenses for certain periods. Without these waivers and reimbursements, performance would have been lower. Also, performance shown in this section does not reflect the deduction of taxes that a shareholder would pay on Fund distributions or on gains resulting from redemptions of Fund shares.
Because Class C Shares automatically convert to Class A Shares after 8 years, the 10 year average annual total return shown above for Class C Shares reflects Class A Share's performance for the period after conversion.
The returns shown are based on net asset values calculated for shareholder transactions and may differ from the returns shown in the financial highlights, which reflect adjustments made to the net asset values in accordance with accounting principles generally accepted in the United States of America.
| J.P. Morgan Small Cap Funds | |
JPMorgan U.S. Small Company Fund
FUND COMMENTARYSIX MONTHS ENDED December 31, 2023 (Unaudited) (continued)
Frank Russell Company is the source and owner of the Russell Index data contained or reflected in this material and all trademarks and copyrights related thereto. Frank Russell Company is not responsible for the formatting or configuration of this material or for any inaccuracy in the adviser's presentation thereof.
| J.P. Morgan Small Cap Funds | |
JPMorgan Small Cap Blend Fund
SCHEDULE OF PORTFOLIO INVESTMENTSAS OF December 31, 2023 (Unaudited)
| | |
|
Aerospace & Defense — 1.2% |
| | |
| | |
| | |
| | |
Automobile Components — 1.2% |
Atmus Filtration Technologies, Inc. * (a) | | |
| | |
| | |
| | |
| | |
|
Winnebago Industries, Inc. (a) | | |
|
| | |
| | |
| | |
Columbia Banking System, Inc. | | |
| | |
First Commonwealth Financial Corp. | | |
First Financial Bankshares, Inc. | | |
| | |
| | |
| | |
| | |
| | |
| | |
Pinnacle Financial Partners, Inc. | | |
| | |
| | |
Simmons First National Corp., Class A | | |
| | |
| | |
| | |
| | |
|
| | |
|
| | |
Agios Pharmaceuticals, Inc. * | | |
| | |
Allogene Therapeutics, Inc. * (a) | | |
| | |
|
Biotechnology — continued |
Amicus Therapeutics, Inc. * | | |
Apellis Pharmaceuticals, Inc. * (a) | | |
Arrowhead Pharmaceuticals, Inc. * | | |
Blueprint Medicines Corp. * | | |
Halozyme Therapeutics, Inc. * | | |
| | |
PMV Pharmaceuticals, Inc. * | | |
| | |
Relay Therapeutics, Inc. * | | |
REVOLUTION Medicines, Inc. * | | |
Sage Therapeutics, Inc. * | | |
Twist Bioscience Corp. * (a) | | |
| | |
Verve Therapeutics, Inc. * (a) | | |
| | |
|
Global-e Online Ltd. (Israel) * (a) | | |
|
| | |
Advanced Drainage Systems, Inc. | | |
| | |
| | |
| | |
Simpson Manufacturing Co., Inc. | | |
| | |
| | |
|
Donnelley Financial Solutions, Inc. * | | |
| | |
Hamilton Lane, Inc., Class A | | |
LPL Financial Holdings, Inc. | | |
Virtus Investment Partners, Inc. | | |
| | |
|
| | |
| | |
| | |
| | |
| | |
| | |
SEE NOTES TO FINANCIAL STATEMENTS.
| J.P. Morgan Small Cap Funds | |
JPMorgan Small Cap Blend Fund
SCHEDULE OF PORTFOLIO INVESTMENTSAS OF December 31, 2023 (Unaudited) (continued)
| | |
Common Stocks — continued |
Commercial Services & Supplies — 1.7% |
ACV Auctions, Inc., Class A * | | |
Casella Waste Systems, Inc., Class A * | | |
| | |
| | |
Communications Equipment — 0.2% |
| | |
Construction & Engineering — 2.0% |
Comfort Systems USA, Inc. | | |
| | |
| | |
| | |
| | |
Consumer Staples Distribution & Retail — 1.0% |
Chefs' Warehouse, Inc. (The) * | | |
Grocery Outlet Holding Corp. * | | |
Performance Food Group Co. * | | |
| | |
Diversified Consumer Services — 0.4% |
Bright Horizons Family Solutions, Inc. * | | |
Diversified Telecommunication Services — 0.5% |
Iridium Communications, Inc. | | |
Electric Utilities — 0.4% |
Portland General Electric Co. | | |
Electrical Equipment — 1.3% |
Bloom Energy Corp., Class A * (a) | | |
NEXTracker, Inc., Class A * (a) | | |
Shoals Technologies Group, Inc., Class A * | | |
| | |
| | |
Electronic Equipment, Instruments & Components — 2.4% |
Insight Enterprises, Inc. * (a) | | |
| | |
| | |
| | |
| | |
Vishay Intertechnology, Inc. | | |
| | |
Energy Equipment & Services — 2.2% |
| | |
| | |
| | |
|
Energy Equipment & Services — continued |
| | |
TechnipFMC plc (United Kingdom) | | |
Weatherford International plc * | | |
| | |
Financial Services — 2.5% |
AvidXchange Holdings, Inc. * | | |
| | |
PennyMac Financial Services, Inc. (a) | | |
| | |
| | |
| | |
|
| | |
| | |
| | |
|
Chesapeake Utilities Corp. | | |
| | |
Southwest Gas Holdings, Inc. | | |
| | |
Ground Transportation — 0.8% |
| | |
| | |
| | |
Health Care Equipment & Supplies — 2.2% |
Alphatec Holdings, Inc. * | | |
| | |
Establishment Labs Holdings, Inc. (Costa Rica) * (a) | | |
| | |
iRhythm Technologies, Inc. * (a) | | |
| | |
Shockwave Medical, Inc. * | | |
Utah Medical Products, Inc. | | |
| | |
Health Care Providers & Services — 2.8% |
Acadia Healthcare Co., Inc. * | | |
| | |
| | |
| | |
SEE NOTES TO FINANCIAL STATEMENTS.
| J.P. Morgan Small Cap Funds | |
| | |
Common Stocks — continued |
Health Care Providers & Services — continued |
| | |
| | |
| | |
|
| | |
Health Care Technology — 0.8% |
Evolent Health, Inc., Class A * (a) | | |
Hotel & Resort REITs — 0.5% |
| | |
Sunstone Hotel Investors, Inc. | | |
| | |
Hotels, Restaurants & Leisure — 3.6% |
| | |
| | |
| | |
| | |
Jack in the Box, Inc. (a) | | |
Life Time Group Holdings, Inc. * | | |
Marriott Vacations Worldwide Corp. | | |
Papa John's International, Inc. (a) | | |
Planet Fitness, Inc., Class A * | | |
Six Flags Entertainment Corp. * | | |
Texas Roadhouse, Inc., Class A | | |
| | |
Household Durables — 1.7% |
| | |
| | |
| | |
| | |
| | |
| | |
|
Plymouth Industrial REIT, Inc. | | |
| | |
| | |
|
Safety Insurance Group, Inc. | | |
Selective Insurance Group, Inc. | | |
| | |
| | |
|
Interactive Media & Services — 0.6% |
| | |
| | |
| | |
|
DigitalOcean Holdings, Inc. * (a) | | |
| | |
| | |
Life Sciences Tools & Services — 0.2% |
| | |
|
| | |
Chart Industries, Inc. * (a) | | |
| | |
| | |
| | |
John Bean Technologies Corp. | | |
| | |
| | |
| | |
Watts Water Technologies, Inc., Class A | | |
| | |
|
John Wiley & Sons, Inc., Class A | | |
Mortgage Real Estate Investment Trusts (REITs) — 0.2% |
| | |
|
| | |
|
| | |
Highwoods Properties, Inc. | | |
| | |
Oil, Gas & Consumable Fuels — 3.2% |
| | |
CNX Resources Corp. * (a) | | |
Equitrans Midstream Corp. | | |
Magnolia Oil & Gas Corp., Class A (a) | | |
| | |
| | |
| | |
SEE NOTES TO FINANCIAL STATEMENTS.
| J.P. Morgan Small Cap Funds | |
JPMorgan Small Cap Blend Fund
SCHEDULE OF PORTFOLIO INVESTMENTSAS OF December 31, 2023 (Unaudited) (continued)
| | |
Common Stocks — continued |
Personal Care Products — 1.4% |
Edgewell Personal Care Co. | | |
| | |
| | |
| | |
|
| | |
Intra-Cellular Therapies, Inc. * | | |
Prestige Consumer Healthcare, Inc. * | | |
Revance Therapeutics, Inc. * (a) | | |
| | |
Professional Services — 1.6% |
| | |
ExlService Holdings, Inc. * | | |
| | |
| | |
Verra Mobility Corp., Class A * | | |
| | |
|
American Homes 4 Rent, Class A | | |
| | |
| | |
|
| | |
| | |
| | |
Semiconductors & Semiconductor Equipment — 3.9% |
Allegro MicroSystems, Inc. (Japan) * | | |
| | |
Axcelis Technologies, Inc. * | | |
| | |
Credo Technology Group Holding Ltd. * | | |
MACOM Technology Solutions Holdings, Inc. * | | |
| | |
| | |
| | |
| | |
| | |
| | |
|
Appfolio, Inc., Class A * | | |
| | |
| | |
|
|
| | |
Clear Secure, Inc., Class A (a) | | |
Confluent, Inc., Class A * | | |
| | |
| | |
| | |
| | |
| | |
HashiCorp, Inc., Class A * | | |
| | |
| | |
PowerSchool Holdings, Inc., Class A * (a) | | |
SentinelOne, Inc., Class A * | | |
Smartsheet, Inc., Class A * | | |
| | |
| | |
| | |
|
| | |
|
Burlington Stores, Inc. * | | |
Floor & Decor Holdings, Inc., Class A * (a) | | |
| | |
Lithia Motors, Inc., Class A | | |
| | |
| | |
Technology Hardware, Storage & Peripherals — 1.0% |
Super Micro Computer, Inc. * (a) | | |
Textiles, Apparel & Luxury Goods — 1.7% |
| | |
| | |
| | |
| | |
| | |
Trading Companies & Distributors — 4.7% |
| | |
Applied Industrial Technologies, Inc. | | |
Beacon Roofing Supply, Inc. * | | |
| | |
| | |
Rush Enterprises, Inc., Class A | | |
SEE NOTES TO FINANCIAL STATEMENTS.
| J.P. Morgan Small Cap Funds | |
| | |
Common Stocks — continued |
Trading Companies & Distributors — continued |
SiteOne Landscape Supply, Inc. * (a) | | |
WESCO International, Inc. | | |
| | |
|
American States Water Co. | | |
Total Common Stocks
(Cost $1,124,262) | | |
| | |
|
Call Options Purchased — 0.1% |
| | |
1/19/2024 at USD 70.00 , American Style | | |
Notional Amount: USD 2,679 | | |
Counterparty: Exchange-Traded * | | |
2/16/2024 at USD 70.00 , American Style | | |
Notional Amount: USD 1,786 | | |
Counterparty: Exchange-Traded * | | |
1/19/2024 at USD 80.00 , American Style | | |
Notional Amount: USD 6,250 | | |
Counterparty: Exchange-Traded * | | |
2/16/2024 at USD 80.00 , American Style | | |
Notional Amount: USD 2,679 | | |
Counterparty: Exchange-Traded * | | |
Total Call Options Purchased
(Cost $323) | | |
| | |
Short-Term Investments — 9.9% |
Investment Companies — 2.6% |
JPMorgan Prime Money Market Fund Class IM Shares, 5.51% (b) (c)
(Cost $37,445) | | |
| | |
|
Investment of Cash Collateral from Securities Loaned — 7.3% |
JPMorgan Securities Lending Money Market Fund Agency SL Class Shares, 5.56% (b) (c) | | |
JPMorgan U.S. Government Money Market Fund Class IM Shares, 5.30% (b) (c) | | |
Total Investment of Cash Collateral from Securities Loaned
(Cost $103,036) | | |
Total Short-Term Investments
(Cost $140,481) | | |
Total Investments — 107.1%
(Cost $1,265,066) | | |
Liabilities in Excess of Other Assets — (7.1)% | | |
| | |
Percentages indicated are based on net assets. |
| |
| |
| Real Estate Investment Trust |
| Standard & Poor's Depositary Receipt |
| |
| Non-income producing security. |
| The security or a portion of this security is on loan at December 31, 2023. The total value of securities on loan at December 31, 2023 is $98,903. |
| Investment in an affiliated fund, which is registered under the Investment Company Act of 1940, as amended, and is advised by J.P. Morgan Investment Management Inc. |
| The rate shown is the current yield as of December 31, 2023. |
SEE NOTES TO FINANCIAL STATEMENTS.
| J.P. Morgan Small Cap Funds | |
JPMorgan Small Cap Equity Fund
SCHEDULE OF PORTFOLIO INVESTMENTSAS OF December 31, 2023 (Unaudited)
| | |
|
Aerospace & Defense — 0.8% |
| | |
Automobile Components — 1.0% |
| | |
|
| | |
Commerce Bancshares, Inc. (a) | | |
Cullen/Frost Bankers, Inc. | | |
| | |
| | |
First Interstate BancSystem, Inc., Class A | | |
ServisFirst Bancshares, Inc. (a) | | |
| | |
| | |
|
| | |
|
Savers Value Village, Inc. * (a) | | |
|
AZEK Co., Inc. (The), Class A * | | |
Hayward Holdings, Inc. * (a) | | |
Janus International Group, Inc. * | | |
Simpson Manufacturing Co., Inc. | | |
| | |
|
AssetMark Financial Holdings, Inc. * | | |
| | |
Moelis & Co., Class A (a) | | |
| | |
StepStone Group, Inc., Class A | | |
| | |
|
Axalta Coating Systems Ltd. * | | |
| | |
Perimeter Solutions SA * (a) | | |
Quaker Chemical Corp. (a) | | |
| | |
Commercial Services & Supplies — 7.0% |
Casella Waste Systems, Inc., Class A * | | |
Driven Brands Holdings, Inc. * | | |
| | |
| | |
|
Commercial Services & Supplies — continued |
| | |
| | |
| | |
| | |
Construction & Engineering — 1.7% |
WillScot Mobile Mini Holdings Corp. * | | |
Consumer Staples Distribution & Retail — 4.3% |
BJ's Wholesale Club Holdings, Inc. * | | |
Casey's General Stores, Inc. | | |
Performance Food Group Co. * | | |
| | |
Containers & Packaging — 1.4% |
| | |
Diversified Consumer Services — 1.3% |
Bright Horizons Family Solutions, Inc. * (a) | | |
Electric Utilities — 1.1% |
Portland General Electric Co. | | |
Electrical Equipment — 1.0% |
Generac Holdings, Inc. * (a) | | |
Shoals Technologies Group, Inc., Class A * | | |
| | |
Electronic Equipment, Instruments & Components — 4.4% |
| | |
| | |
| | |
| | |
| | |
| | |
Financial Services — 1.5% |
| | |
|
| | |
| | |
| | |
Ground Transportation — 2.1% |
Knight-Swift Transportation Holdings, Inc. | | |
| | |
| | |
SEE NOTES TO FINANCIAL STATEMENTS.
| J.P. Morgan Small Cap Funds | |
| | |
Common Stocks — continued |
Health Care Equipment & Supplies — 3.4% |
| | |
| | |
| | |
| | |
| | |
Health Care Providers & Services — 5.4% |
| | |
| | |
| | |
| | |
| | |
| | |
Health Care Technology — 0.7% |
| | |
Hotel & Resort REITs — 1.2% |
Ryman Hospitality Properties, Inc. | | |
Hotels, Restaurants & Leisure — 3.1% |
Monarch Casino & Resort, Inc. | | |
Planet Fitness, Inc., Class A * | | |
| | |
| | |
|
EastGroup Properties, Inc. | | |
|
Kinsale Capital Group, Inc. | | |
| | |
| | |
|
Acushnet Holdings Corp. (a) | | |
| | |
| | |
Life Sciences Tools & Services — 0.7% |
| | |
|
| | |
Hillman Solutions Corp. * | | |
Lincoln Electric Holdings, Inc. (a) | | |
| | |
| | |
| | |
| | |
|
|
Northwestern Energy Group, Inc. | | |
Oil, Gas & Consumable Fuels — 1.5% |
| | |
| | |
| | |
Professional Services — 3.0% |
First Advantage Corp. (a) | | |
| | |
Verra Mobility Corp., Class A * | | |
| | |
Real Estate Management & Development — 1.0% |
Cushman & Wakefield plc * (a) | | |
|
| | |
Semiconductors & Semiconductor Equipment — 3.9% |
Allegro MicroSystems, Inc. (Japan) * | | |
MACOM Technology Solutions Holdings, Inc. * | | |
| | |
| | |
|
Clearwater Analytics Holdings, Inc., Class A * | | |
| | |
Guidewire Software, Inc. * | | |
| | |
| | |
| | |
| | |
|
| | |
Trading Companies & Distributors — 2.1% |
Applied Industrial Technologies, Inc. | | |
Core & Main, Inc., Class A * | | |
| | |
Total Common Stocks
(Cost $3,656,256) | | |
Short-Term Investments — 9.9% |
Investment Companies — 4.2% |
JPMorgan Prime Money Market Fund Class IM Shares, 5.51% (b) (c)
(Cost $227,576) | | |
SEE NOTES TO FINANCIAL STATEMENTS.
| J.P. Morgan Small Cap Funds | |
JPMorgan Small Cap Equity Fund
SCHEDULE OF PORTFOLIO INVESTMENTSAS OF December 31, 2023 (Unaudited) (continued)
| | |
Short-Term Investments — continued |
Investment of Cash Collateral from Securities Loaned — 5.7% |
JPMorgan Securities Lending Money Market Fund Agency SL Class Shares, 5.56% (b) (c) | | |
JPMorgan U.S. Government Money Market Fund Class IM Shares, 5.30% (b) (c) | | |
Total Investment of Cash Collateral from Securities Loaned
(Cost $309,096) | | |
Total Short-Term Investments
(Cost $536,672) | | |
Total Investments — 106.1%
(Cost $4,192,928) | | |
Liabilities in Excess of Other Assets — (6.1)% | | |
| | |
Percentages indicated are based on net assets. |
| |
| Real Estate Investment Trust |
| Non-income producing security. |
| The security or a portion of this security is on loan at December 31, 2023. The total value of securities on loan at December 31, 2023 is $297,559. |
| Investment in an affiliated fund, which is registered under the Investment Company Act of 1940, as amended, and is advised by J.P. Morgan Investment Management Inc. |
| The rate shown is the current yield as of December 31, 2023. |
SEE NOTES TO FINANCIAL STATEMENTS.
| J.P. Morgan Small Cap Funds | |
JPMorgan Small Cap Growth Fund
SCHEDULE OF PORTFOLIO INVESTMENTSAS OF December 31, 2023 (Unaudited)
| | |
|
Aerospace & Defense — 1.3% |
| | |
Automobile Components — 1.5% |
| | |
| | |
| | |
|
Winnebago Industries, Inc. (a) | | |
|
First Financial Bankshares, Inc. | | |
Pinnacle Financial Partners, Inc. | | |
| | |
|
| | |
Agios Pharmaceuticals, Inc. * | | |
| | |
Allogene Therapeutics, Inc. * (a) | | |
Amicus Therapeutics, Inc. * (a) | | |
Apellis Pharmaceuticals, Inc. * (a) | | |
Arrowhead Pharmaceuticals, Inc. * (a) | | |
Blueprint Medicines Corp. * | | |
Halozyme Therapeutics, Inc. * (a) | | |
| | |
PMV Pharmaceuticals, Inc. * | | |
| | |
Relay Therapeutics, Inc. * | | |
REVOLUTION Medicines, Inc. * (a) | | |
Sage Therapeutics, Inc. * (a) | | |
Twist Bioscience Corp. * (a) | | |
| | |
Verve Therapeutics, Inc. * (a) | | |
| | |
|
Global-e Online Ltd. (Israel) * (a) | | |
|
| | |
Advanced Drainage Systems, Inc. | | |
Simpson Manufacturing Co., Inc. | | |
| | |
| | |
|
|
| | |
Hamilton Lane, Inc., Class A | | |
| | |
Commercial Services & Supplies — 3.5% |
ACV Auctions, Inc., Class A * | | |
Casella Waste Systems, Inc., Class A * | | |
| | |
| | |
Communications Equipment — 0.4% |
| | |
Construction & Engineering — 2.9% |
Comfort Systems USA, Inc. | | |
| | |
| | |
| | |
| | |
Consumer Staples Distribution & Retail — 2.0% |
Chefs' Warehouse, Inc. (The) * | | |
Grocery Outlet Holding Corp. * | | |
Performance Food Group Co. * | | |
| | |
Diversified Consumer Services — 0.8% |
Bright Horizons Family Solutions, Inc. * | | |
Electrical Equipment — 2.5% |
Bloom Energy Corp., Class A * (a) | | |
NEXTracker, Inc., Class A * (a) | | |
Shoals Technologies Group, Inc., Class A * | | |
| | |
| | |
Electronic Equipment, Instruments & Components — 0.7% |
| | |
Energy Equipment & Services — 2.1% |
| | |
TechnipFMC plc (United Kingdom) | | |
| | |
Financial Services — 2.6% |
AvidXchange Holdings, Inc. * (a) | | |
| | |
SEE NOTES TO FINANCIAL STATEMENTS.
| J.P. Morgan Small Cap Funds | |
JPMorgan Small Cap Growth Fund
SCHEDULE OF PORTFOLIO INVESTMENTSAS OF December 31, 2023 (Unaudited) (continued)
| | |
Common Stocks — continued |
Financial Services — continued |
PennyMac Financial Services, Inc. (a) | | |
| | |
| | |
|
| | |
Ground Transportation — 0.6% |
| | |
Health Care Equipment & Supplies — 3.8% |
Alphatec Holdings, Inc. * | | |
| | |
Establishment Labs Holdings, Inc. (Costa Rica) * (a) | | |
Inari Medical, Inc. * (a) | | |
iRhythm Technologies, Inc. * (a) | | |
Outset Medical, Inc. * (a) | | |
Shockwave Medical, Inc. * | | |
| | |
Health Care Providers & Services — 1.9% |
Acadia Healthcare Co., Inc. * | | |
| | |
| | |
| | |
Health Care Technology — 1.7% |
Evolent Health, Inc., Class A * (a) | | |
Hotels, Restaurants & Leisure — 5.8% |
| | |
| | |
Life Time Group Holdings, Inc. * (a) | | |
Marriott Vacations Worldwide Corp. | | |
Papa John's International, Inc. (a) | | |
Planet Fitness, Inc., Class A * | | |
Six Flags Entertainment Corp. * (a) | | |
Texas Roadhouse, Inc., Class A | | |
| | |
Household Durables — 1.3% |
| | |
| | |
| | |
|
| | |
| | |
|
|
DigitalOcean Holdings, Inc. * (a) | | |
| | |
| | |
|
Chart Industries, Inc. * (a) | | |
| | |
John Bean Technologies Corp. | | |
| | |
Oil, Gas & Consumable Fuels — 1.8% |
| | |
Matador Resources Co. (a) | | |
| | |
| | |
Personal Care Products — 1.4% |
| | |
|
| | |
Intra-Cellular Therapies, Inc. * | | |
Revance Therapeutics, Inc. * (a) | | |
| | |
Professional Services — 2.0% |
ExlService Holdings, Inc. * | | |
| | |
| | |
| | |
Semiconductors & Semiconductor Equipment — 5.1% |
Allegro MicroSystems, Inc. (Japan) * | | |
Axcelis Technologies, Inc. * | | |
Credo Technology Group Holding Ltd. * | | |
MACOM Technology Solutions Holdings, Inc. * | | |
| | |
| | |
Power Integrations, Inc. (a) | | |
| | |
| | |
|
Appfolio, Inc., Class A * | | |
| | |
| | |
Clear Secure, Inc., Class A (a) | | |
SEE NOTES TO FINANCIAL STATEMENTS.
| J.P. Morgan Small Cap Funds | |
| | |
Common Stocks — continued |
|
Confluent, Inc., Class A * | | |
| | |
| | |
| | |
| | |
| | |
HashiCorp, Inc., Class A * | | |
| | |
| | |
PowerSchool Holdings, Inc., Class A * (a) | | |
SentinelOne, Inc., Class A * | | |
Smartsheet, Inc., Class A * | | |
| | |
| | |
| | |
|
| | |
|
Burlington Stores, Inc. * | | |
Floor & Decor Holdings, Inc., Class A * (a) | | |
Lithia Motors, Inc., Class A (a) | | |
| | |
Technology Hardware, Storage & Peripherals — 2.1% |
Super Micro Computer, Inc. * (a) | | |
Trading Companies & Distributors — 6.3% |
| | |
Applied Industrial Technologies, Inc. | | |
| | |
Rush Enterprises, Inc., Class A | | |
SiteOne Landscape Supply, Inc. * (a) | | |
WESCO International, Inc. | | |
| | |
Total Common Stocks
(Cost $2,968,597) | | |
| | |
Short-Term Investments — 7.9% |
Investment Companies — 0.6% |
JPMorgan Prime Money Market Fund Class IM Shares, 5.51% (b) (c)
(Cost $22,498) | | |
Investment of Cash Collateral from Securities Loaned — 7.3% |
JPMorgan Securities Lending Money Market Fund Agency SL Class Shares, 5.56% (b) (c) | | |
JPMorgan U.S. Government Money Market Fund Class IM Shares, 5.30% (b) (c) | | |
Total Investment of Cash Collateral from Securities Loaned
(Cost $275,880) | | |
Total Short-Term Investments
(Cost $298,378) | | |
Total Investments — 107.2%
(Cost $3,266,975) | | |
Liabilities in Excess of Other Assets — (7.2)% | | |
| | |
Percentages indicated are based on net assets. |
| |
| Real Estate Investment Trust |
| Non-income producing security. |
| The security or a portion of this security is on loan at December 31, 2023. The total value of securities on loan at December 31, 2023 is $263,521. |
| Investment in an affiliated fund, which is registered under the Investment Company Act of 1940, as amended, and is advised by J.P. Morgan Investment Management Inc. |
| The rate shown is the current yield as of December 31, 2023. |
SEE NOTES TO FINANCIAL STATEMENTS.
| J.P. Morgan Small Cap Funds | |
JPMorgan Small Cap Sustainable Leaders Fund
SCHEDULE OF PORTFOLIO INVESTMENTSAS OF December 31, 2023 (Unaudited)
| | |
|
Automobile Components — 2.1% |
| | |
|
Amalgamated Financial Corp. | | |
Berkshire Hills Bancorp, Inc. | | |
| | |
| | |
| | |
| | |
|
Apellis Pharmaceuticals, Inc. * | | |
Fate Therapeutics, Inc. * | | |
Halozyme Therapeutics, Inc. * | | |
| | |
Sarepta Therapeutics, Inc. * | | |
| | |
|
| | |
Advanced Drainage Systems, Inc. | | |
AZEK Co., Inc. (The), Class A * | | |
| | |
|
| | |
|
| | |
Commercial Services & Supplies — 5.1% |
| | |
| | |
| | |
| | |
| | |
Consumer Staples Distribution & Retail — 2.0% |
Sprouts Farmers Market, Inc. * | | |
United Natural Foods, Inc. * | | |
| | |
Diversified Consumer Services — 0.6% |
| | |
|
Alexander & Baldwin, Inc. | | |
Electric Utilities — 1.8% |
Portland General Electric Co. | | |
| | |
|
Electrical Equipment — 2.4% |
| | |
Bloom Energy Corp., Class A * | | |
| | |
| | |
NEXTracker, Inc., Class A * | | |
| | |
| | |
Electronic Equipment, Instruments & Components — 4.1% |
| | |
| | |
| | |
|
Darling Ingredients, Inc. * | | |
| | |
| | |
Health Care Equipment & Supplies — 1.4% |
| | |
Shockwave Medical, Inc. * | | |
| | |
Health Care Providers & Services — 5.2% |
AMN Healthcare Services, Inc. * | | |
| | |
| | |
| | |
| | |
Health Care Technology — 1.9% |
| | |
| | |
| | |
Hotels, Restaurants & Leisure — 0.2% |
Sweetgreen, Inc., Class A * | | |
Household Durables — 4.1% |
| | |
| | |
| | |
Independent Power and Renewable Electricity Producers — 0.1% |
Sunnova Energy International, Inc. * | | |
|
Rexford Industrial Realty, Inc. | | |
SEE NOTES TO FINANCIAL STATEMENTS.
| J.P. Morgan Small Cap Funds | |
| | |
Common Stocks — continued |
|
CNO Financial Group, Inc. | | |
| | |
| | |
Interactive Media & Services — 2.5% |
| | |
| | |
| | |
Life Sciences Tools & Services — 0.6% |
| | |
Singular Genomics Systems, Inc. * | | |
| | |
|
| | |
| | |
| | |
|
| | |
| | |
Schnitzer Steel Industries, Inc., Class A | | |
| | |
Mortgage Real Estate Investment Trusts (REITs) — 1.3% |
Hannon Armstrong Sustainable Infrastructure Capital, Inc. | | |
|
Hudson Pacific Properties, Inc. | | |
| | |
| | |
| | |
Oil, Gas & Consumable Fuels — 0.4% |
Clean Energy Fuels Corp. * | | |
Professional Services — 4.3% |
Huron Consulting Group, Inc. * | | |
| | |
| | |
Real Estate Management & Development — 0.8% |
Cushman & Wakefield plc * | | |
Semiconductors & Semiconductor Equipment — 2.3% |
| | |
| | |
| | |
| | |
|
|
| | |
| | |
| | |
| | |
| | |
|
| | |
|
| | |
Warby Parker, Inc., Class A * | | |
| | |
Textiles, Apparel & Luxury Goods — 6.9% |
| | |
| | |
| | |
| | |
| | |
Trading Companies & Distributors — 2.8% |
WESCO International, Inc. | | |
|
American States Water Co. | | |
Total Common Stocks
(Cost $39,104) | | |
| | |
|
|
Contra Aduro Biotech I ‡ *
(Cost $108) | | |
| | |
Short-Term Investments — 0.9% |
Investment Companies — 0.9% |
JPMorgan Prime Money Market Fund Class IM Shares, 5.51% (a) (b)
(Cost $345) | | |
Total Investments — 100.1%
(Cost $39,557) | | |
Liabilities in Excess of Other Assets — (0.1)% | | |
| | |
SEE NOTES TO FINANCIAL STATEMENTS.
| J.P. Morgan Small Cap Funds | |
JPMorgan Small Cap Sustainable Leaders Fund
SCHEDULE OF PORTFOLIO INVESTMENTSAS OF December 31, 2023 (Unaudited) (continued)
Percentages indicated are based on net assets. |
Amounts presented as a dash ("-") represent amounts that round to less than a thousand. |
| |
| Real Estate Investment Trust |
| Amount rounds to less than 0.1% of net assets. |
| Value determined using significant unobservable inputs. | |
| Non-income producing security. | |
| Investment in an affiliated fund, which is registered under the Investment Company Act of 1940, as amended, and is advised by J.P. Morgan Investment Management Inc. | |
| The rate shown is the current yield as of December 31, 2023. | |
SEE NOTES TO FINANCIAL STATEMENTS.
| J.P. Morgan Small Cap Funds | |
JPMorgan Small Cap Value Fund
SCHEDULE OF PORTFOLIO INVESTMENTSAS OF December 31, 2023 (Unaudited)
| | |
|
Aerospace & Defense — 0.7% |
Archer Aviation, Inc., Class A * (a) | | |
| | |
| | |
| | |
Air Freight & Logistics — 0.7% |
Hub Group, Inc., Class A * | | |
Radiant Logistics, Inc. * | | |
| | |
Automobile Components — 0.5% |
| | |
| | |
| | |
|
| | |
Amalgamated Financial Corp. | | |
| | |
| | |
| | |
| | |
Bank of NT Butterfield & Son Ltd. (The) (Bermuda) | | |
| | |
| | |
| | |
Business First Bancshares, Inc. | | |
| | |
Capital City Bank Group, Inc. | | |
Capstar Financial Holdings, Inc. (a) | | |
Central Pacific Financial Corp. | | |
| | |
Columbia Banking System, Inc. | | |
Community Trust Bancorp, Inc. | | |
| | |
CrossFirst Bankshares, Inc. * | | |
Customers Bancorp, Inc. * | | |
| | |
| | |
Enterprise Financial Services Corp. | | |
Equity Bancshares, Inc., Class A | | |
Financial Institutions, Inc. | | |
First BanCorp (Puerto Rico) (a) | | |
First Bancshares, Inc. (The) | | |
First Citizens BancShares, Inc., Class A | | |
| | |
|
|
First Commonwealth Financial Corp. | | |
| | |
| | |
First Mid Bancshares, Inc. | | |
| | |
| | |
Heartland Financial USA, Inc. | | |
| | |
| | |
HomeTrust Bancshares, Inc. | | |
| | |
Live Oak Bancshares, Inc. | | |
| | |
| | |
Midland States Bancorp, Inc. | | |
| | |
National Bank Holdings Corp., Class A | | |
OceanFirst Financial Corp. | | |
OFG Bancorp (Puerto Rico) | | |
| | |
| | |
Orrstown Financial Services, Inc. | | |
| | |
Peapack-Gladstone Financial Corp. | | |
| | |
Pinnacle Financial Partners, Inc. | | |
Popular, Inc. (Puerto Rico) | | |
| | |
| | |
| | |
| | |
| | |
South Plains Financial, Inc. | | |
Southside Bancshares, Inc. | | |
| | |
| | |
| | |
| | |
| | |
| | |
| | |
| | |
SEE NOTES TO FINANCIAL STATEMENTS.
| J.P. Morgan Small Cap Funds | |
JPMorgan Small Cap Value Fund
SCHEDULE OF PORTFOLIO INVESTMENTSAS OF December 31, 2023 (Unaudited) (continued)
| | |
Common Stocks — continued |
|
| | |
| | |
| | |
|
| | |
|
| | |
Agios Pharmaceuticals, Inc. * | | |
Allogene Therapeutics, Inc. * (a) | | |
| | |
Avidity Biosciences, Inc. * | | |
| | |
| | |
| | |
Dynavax Technologies Corp. * | | |
Fate Therapeutics, Inc. * | | |
| | |
Iovance Biotherapeutics, Inc. * (a) | | |
Kymera Therapeutics, Inc. * | | |
Lexicon Pharmaceuticals, Inc. * (a) | | |
| | |
Prothena Corp. plc (Ireland) * | | |
REVOLUTION Medicines, Inc. * | | |
SpringWorks Therapeutics, Inc. * (a) | | |
Syndax Pharmaceuticals, Inc. * | | |
| | |
|
Savers Value Village, Inc. * (a) | | |
|
Gibraltar Industries, Inc. * | | |
| | |
Resideo Technologies, Inc. * | | |
| | |
| | |
|
AssetMark Financial Holdings, Inc. * | | |
| | |
| | |
| | |
| | |
| | |
| | |
|
Capital Markets — continued |
Victory Capital Holdings, Inc., Class A | | |
Virtus Investment Partners, Inc. | | |
| | |
|
| | |
| | |
| | |
| | |
| | |
| | |
Commercial Services & Supplies — 0.6% |
| | |
| | |
| | |
Communications Equipment — 0.3% |
| | |
| | |
| | |
Construction & Engineering — 1.5% |
| | |
| | |
Comfort Systems USA, Inc. | | |
| | |
| | |
| | |
Construction Materials — 0.2% |
Summit Materials, Inc., Class A * | | |
|
Encore Capital Group, Inc. * (a) | | |
Enova International, Inc. * | | |
| | |
| | |
| | |
| | |
Consumer Staples Distribution & Retail — 0.8% |
| | |
Sprouts Farmers Market, Inc. * | | |
United Natural Foods, Inc. * | | |
| | |
SEE NOTES TO FINANCIAL STATEMENTS.
| J.P. Morgan Small Cap Funds | |
| | |
Common Stocks — continued |
Containers & Packaging — 0.3% |
| | |
| | |
| | |
| | |
Diversified Consumer Services — 1.0% |
Adtalem Global Education, Inc. * | | |
Laureate Education, Inc., Class A | | |
| | |
| | |
| | |
|
Alexander & Baldwin, Inc. | | |
American Assets Trust, Inc. | | |
Armada Hoffler Properties, Inc. | | |
Broadstone Net Lease, Inc. | | |
Essential Properties Realty Trust, Inc. | | |
| | |
Diversified Telecommunication Services — 0.5% |
| | |
EchoStar Corp., Class A * | | |
Liberty Latin America Ltd., Class A (Puerto Rico) * | | |
Liberty Latin America Ltd., Class C (Puerto Rico) * | | |
| | |
Electric Utilities — 1.4% |
| | |
| | |
Portland General Electric Co. | | |
| | |
Electrical Equipment — 1.4% |
| | |
| | |
| | |
Electronic Equipment, Instruments & Components — 2.1% |
Benchmark Electronics, Inc. | | |
| | |
| | |
| | |
| | |
| | |
| | |
|
Energy Equipment & Services — 1.8% |
| | |
| | |
Liberty Energy, Inc., Class A | | |
| | |
Oil States International, Inc. * | | |
Patterson-UTI Energy, Inc. | | |
Select Water Solutions, Inc. | | |
| | |
Financial Services — 4.8% |
| | |
| | |
Federal Agricultural Mortgage Corp., Class C | | |
Jackson Financial, Inc., Class A | | |
| | |
| | |
NMI Holdings, Inc., Class A * | | |
PennyMac Financial Services, Inc. (a) | | |
| | |
Repay Holdings Corp., Class A * (a) | | |
StoneCo Ltd., Class A (Brazil) * (a) | | |
| | |
|
Cal-Maine Foods, Inc. (a) | | |
Darling Ingredients, Inc. * | | |
| | |
Fresh Del Monte Produce, Inc. | | |
John B Sanfilippo & Son, Inc. | | |
Simply Good Foods Co. (The) * | | |
| | |
|
Chesapeake Utilities Corp. | | |
New Jersey Resources Corp. | | |
Northwest Natural Holding Co. | | |
| | |
Southwest Gas Holdings, Inc. | | |
| | |
| | |
Ground Transportation — 0.6% |
| | |
Health Care Equipment & Supplies — 1.5% |
Alphatec Holdings, Inc. * | | |
SEE NOTES TO FINANCIAL STATEMENTS.
| J.P. Morgan Small Cap Funds | |
JPMorgan Small Cap Value Fund
SCHEDULE OF PORTFOLIO INVESTMENTSAS OF December 31, 2023 (Unaudited) (continued)
| | |
Common Stocks — continued |
Health Care Equipment & Supplies — continued |
Inari Medical, Inc. * (a) | | |
| | |
| | |
| | |
Health Care Providers & Services — 0.8% |
| | |
Fulgent Genetics, Inc. * (a) | | |
| | |
| | |
| | |
|
| | |
Community Healthcare Trust, Inc. | | |
Global Medical REIT, Inc. | | |
Sabra Health Care REIT, Inc. | | |
| | |
Health Care Technology — 0.6% |
Evolent Health, Inc., Class A * | | |
| | |
| | |
Hotel & Resort REITs — 1.5% |
Apple Hospitality REIT, Inc. (a) | | |
DiamondRock Hospitality Co. | | |
| | |
Ryman Hospitality Properties, Inc. | | |
Xenia Hotels & Resorts, Inc. | | |
| | |
Hotels, Restaurants & Leisure — 1.3% |
Bluegreen Vacations Holding Corp., Class A (a) | | |
Full House Resorts, Inc. * | | |
International Game Technology plc | | |
| | |
SeaWorld Entertainment, Inc. * | | |
| | |
Household Durables — 2.9% |
Green Brick Partners, Inc. * | | |
| | |
| | |
| | |
| | |
|
Household Durables — continued |
Taylor Morrison Home Corp., Class A * | | |
| | |
| | |
Household Products — 0.4% |
Central Garden & Pet Co., Class A * | | |
Independent Power and Renewable Electricity Producers — 0.4% |
Clearway Energy, Inc., Class A (a) | | |
Clearway Energy, Inc., Class C (a) | | |
| | |
|
First Industrial Realty Trust, Inc. | | |
Innovative Industrial Properties, Inc. (a) | | |
Plymouth Industrial REIT, Inc. | | |
| | |
| | |
| | |
|
American Equity Investment Life Holding Co. * | | |
CNO Financial Group, Inc. | | |
| | |
James River Group Holdings Ltd. | | |
| | |
Skyward Specialty Insurance Group, Inc. * (a) | | |
| | |
Interactive Media & Services — 0.2% |
| | |
| | |
| | |
|
Information Services Group, Inc. | | |
| | |
| | |
|
| | |
|
| | |
Albany International Corp., Class A | | |
| | |
Luxfer Holdings plc (United Kingdom) | | |
Mueller Industries, Inc. (a) | | |
SEE NOTES TO FINANCIAL STATEMENTS.
| J.P. Morgan Small Cap Funds | |
| | |
Common Stocks — continued |
|
| | |
Titan International, Inc. * | | |
| | |
Marine Transportation — 0.6% |
| | |
Safe Bulkers, Inc. (Greece) | | |
| | |
|
AMC Networks, Inc., Class A * (a) | | |
Entravision Communications Corp., Class A | | |
| | |
John Wiley & Sons, Inc., Class A | | |
| | |
| | |
| | |
|
Alpha Metallurgical Resources, Inc. (a) | | |
| | |
| | |
| | |
| | |
| | |
| | |
Schnitzer Steel Industries, Inc., Class A | | |
| | |
| | |
| | |
Mortgage Real Estate Investment Trusts (REITs) — 1.4% |
Blackstone Mortgage Trust, Inc., Class A (a) | | |
Brightspire Capital, Inc., Class A | | |
| | |
Ellington Financial, Inc. (a) | | |
KKR Real Estate Finance Trust, Inc. | | |
| | |
| | |
PennyMac Mortgage Investment Trust (a) | | |
| | |
| | |
|
| | |
| | |
|
Multi-Utilities — continued |
Northwestern Energy Group, Inc. | | |
| | |
| | |
|
| | |
| | |
| | |
Easterly Government Properties, Inc., Class A | | |
| | |
Hudson Pacific Properties, Inc. | | |
SL Green Realty Corp. (a) | | |
| | |
Oil, Gas & Consumable Fuels — 6.9% |
California Resources Corp. | | |
| | |
Civitas Resources, Inc. (a) | | |
CNX Resources Corp. * (a) | | |
| | |
| | |
| | |
| | |
| | |
| | |
International Seaways, Inc. | | |
Magnolia Oil & Gas Corp., Class A (a) | | |
| | |
| | |
| | |
Par Pacific Holdings, Inc. * | | |
PBF Energy, Inc., Class A | | |
| | |
REX American Resources Corp. * | | |
| | |
Teekay Tankers Ltd., Class A (Canada) | | |
Uranium Energy Corp. * (a) | | |
| | |
| | |
Passenger Airlines — 0.8% |
| | |
Joby Aviation, Inc. * (a) | | |
| | |
| | |
SEE NOTES TO FINANCIAL STATEMENTS.
| J.P. Morgan Small Cap Funds | |
JPMorgan Small Cap Value Fund
SCHEDULE OF PORTFOLIO INVESTMENTSAS OF December 31, 2023 (Unaudited) (continued)
| | |
Common Stocks — continued |
Personal Care Products — 1.0% |
| | |
Edgewell Personal Care Co. | | |
| | |
Nature's Sunshine Products, Inc. * | | |
| | |
|
ANI Pharmaceuticals, Inc. * | | |
Intra-Cellular Therapies, Inc. * | | |
Prestige Consumer Healthcare, Inc. * | | |
| | |
Professional Services — 1.1% |
| | |
Barrett Business Services, Inc. | | |
Heidrick & Struggles International, Inc. | | |
| | |
| | |
Real Estate Management & Development — 0.5% |
| | |
Opendoor Technologies, Inc. * | | |
| | |
|
Independence Realty Trust, Inc. | | |
| | |
| | |
| | |
|
| | |
InvenTrust Properties Corp. | | |
| | |
Phillips Edison & Co., Inc. (a) | | |
| | |
Retail Opportunity Investments Corp. | | |
| | |
| | |
| | |
| | |
Semiconductors & Semiconductor Equipment — 1.4% |
ACM Research, Inc., Class A * | | |
| | |
| | |
|
Semiconductors & Semiconductor Equipment — continued |
Ultra Clean Holdings, Inc. * | | |
Veeco Instruments, Inc. * | | |
| | |
|
| | |
LiveRamp Holdings, Inc. * | | |
| | |
| | |
| | |
| | |
|
| | |
|
Abercrombie & Fitch Co., Class A * | | |
Academy Sports & Outdoors, Inc. | | |
Asbury Automotive Group, Inc. * | | |
| | |
| | |
| | |
| | |
| | |
| | |
| | |
| | |
Textiles, Apparel & Luxury Goods — 0.4% |
G-III Apparel Group Ltd. * | | |
Trading Companies & Distributors — 3.9% |
Beacon Roofing Supply, Inc. * | | |
BlueLinx Holdings, Inc. * | | |
| | |
| | |
| | |
Hudson Technologies, Inc. * | | |
| | |
Rush Enterprises, Inc., Class A | | |
| | |
WESCO International, Inc. | | |
| | |
|
American States Water Co. | | |
SEE NOTES TO FINANCIAL STATEMENTS.
| J.P. Morgan Small Cap Funds | |
| | |
Common Stocks — continued |
Wireless Telecommunication Services — 0.2% |
| | |
Telephone and Data Systems, Inc. | | |
| | |
Total Common Stocks
(Cost $1,151,267) | | |
Short-Term Investments — 10.6% |
Investment Companies — 3.0% |
JPMorgan Prime Money Market Fund Class IM Shares, 5.51% (b) (c)
(Cost $43,668) | | |
Investment of Cash Collateral from Securities Loaned — 7.6% |
JPMorgan Securities Lending Money Market Fund Agency SL Class Shares, 5.56% (b) (c) | | |
JPMorgan U.S. Government Money Market Fund Class IM Shares, 5.30% (b) (c) | | |
Total Investment of Cash Collateral from Securities Loaned
(Cost $111,594) | | |
Total Short-Term Investments
(Cost $155,262) | | |
Total Investments — 108.4%
(Cost $1,306,529) | | |
Liabilities in Excess of Other Assets — (8.4)% | | |
| | |
Percentages indicated are based on net assets. |
| |
| Real Estate Investment Trust |
| Non-income producing security. |
| The security or a portion of this security is on loan at December 31, 2023. The total value of securities on loan at December 31, 2023 is $107,113. |
| Investment in an affiliated fund, which is registered under the Investment Company Act of 1940, as amended, and is advised by J.P. Morgan Investment Management Inc. |
| The rate shown is the current yield as of December 31, 2023. |
Futures contracts outstanding as of December 31, 2023 (amounts in thousands, except number of contracts):
| | | | | VALUE AND
UNREALIZED
APPRECIATION
(DEPRECIATION) ($) |
| | | | | |
Russell 2000 E-Mini Index | | | | | |
SEE NOTES TO FINANCIAL STATEMENTS.
| J.P. Morgan Small Cap Funds | |
JPMorgan SMID Cap Equity Fund
SCHEDULE OF PORTFOLIO INVESTMENTSAS OF December 31, 2023 (Unaudited)
| | |
|
Aerospace & Defense — 1.1% |
| | |
Automobile Components — 0.7% |
| | |
|
Commerce Bancshares, Inc. | | |
Cullen/Frost Bankers, Inc. | | |
First Interstate BancSystem, Inc., Class A | | |
ServisFirst Bancshares, Inc. | | |
| | |
| | |
|
Fortune Brands Innovations, Inc. | | |
| | |
Lennox International, Inc. | | |
Simpson Manufacturing Co., Inc. | | |
| | |
|
AssetMark Financial Holdings, Inc. * | | |
Cboe Global Markets, Inc. | | |
| | |
FactSet Research Systems, Inc. | | |
LPL Financial Holdings, Inc. | | |
MarketAxess Holdings, Inc. | | |
| | |
| | |
StepStone Group, Inc., Class A | | |
| | |
|
Axalta Coating Systems Ltd. * | | |
| | |
| | |
Commercial Services & Supplies — 5.9% |
Driven Brands Holdings, Inc. * | | |
| | |
| | |
| | |
| | |
| | |
Construction & Engineering — 1.7% |
WillScot Mobile Mini Holdings Corp. * | | |
| | |
|
Consumer Staples Distribution & Retail — 4.3% |
BJ's Wholesale Club Holdings, Inc. * | | |
Casey's General Stores, Inc. | | |
Performance Food Group Co. * | | |
| | |
Containers & Packaging — 2.2% |
| | |
| | |
| | |
|
| | |
| | |
| | |
Diversified Consumer Services — 1.1% |
Bright Horizons Family Solutions, Inc. * | | |
Electrical Equipment — 0.7% |
Shoals Technologies Group, Inc., Class A * | | |
Electronic Equipment, Instruments & Components — 1.2% |
| | |
Financial Services — 2.9% |
Jack Henry & Associates, Inc. | | |
| | |
| | |
|
Lamb Weston Holdings, Inc. | | |
|
| | |
Ground Transportation — 2.0% |
Knight-Swift Transportation Holdings, Inc. | | |
| | |
| | |
Health Care Equipment & Supplies — 4.0% |
| | |
| | |
| | |
| | |
| | |
Health Care Providers & Services — 4.9% |
| | |
| | |
SEE NOTES TO FINANCIAL STATEMENTS.
| J.P. Morgan Small Cap Funds | |
| | |
Common Stocks — continued |
Health Care Providers & Services — continued |
| | |
Molina Healthcare, Inc. * | | |
| | |
Health Care Technology — 0.6% |
| | |
Hotel & Resort REITs — 0.9% |
Ryman Hospitality Properties, Inc. | | |
Hotels, Restaurants & Leisure — 3.3% |
Planet Fitness, Inc., Class A * | | |
| | |
| | |
| | |
Household Products — 0.8% |
Reynolds Consumer Products, Inc. | | |
|
EastGroup Properties, Inc. | | |
|
| | |
Kinsale Capital Group, Inc. | | |
| | |
| | |
|
| | |
Life Sciences Tools & Services — 1.0% |
West Pharmaceutical Services, Inc. | | |
|
Hillman Solutions Corp. * | | |
| | |
Lincoln Electric Holdings, Inc. | | |
| | |
| | |
| | |
| | |
Oil, Gas & Consumable Fuels — 1.5% |
| | |
| | |
| | |
Professional Services — 5.1% |
Broadridge Financial Solutions, Inc. | | |
| | |
|
Professional Services — continued |
| | |
Paylocity Holding Corp. * | | |
SS&C Technologies Holdings, Inc. | | |
| | |
| | |
Real Estate Management & Development — 0.8% |
Cushman & Wakefield plc * | | |
|
Mid-America Apartment Communities, Inc. | | |
|
| | |
Semiconductors & Semiconductor Equipment — 4.2% |
Allegro MicroSystems, Inc. (Japan) * | | |
| | |
| | |
| | |
| | |
|
Clearwater Analytics Holdings, Inc., Class A * | | |
Guidewire Software, Inc. * | | |
Manhattan Associates, Inc. * | | |
| | |
Tyler Technologies, Inc. * | | |
| | |
|
| | |
|
Burlington Stores, Inc. * | | |
Trading Companies & Distributors — 1.0% |
Core & Main, Inc., Class A * | | |
Total Common Stocks
(Cost $269,270) | | |
SEE NOTES TO FINANCIAL STATEMENTS.
| J.P. Morgan Small Cap Funds | |
JPMorgan SMID Cap Equity Fund
SCHEDULE OF PORTFOLIO INVESTMENTSAS OF December 31, 2023 (Unaudited) (continued)
| | |
Short-Term Investments — 3.5% |
Investment Companies — 3.5% |
JPMorgan Prime Money Market Fund Class IM Shares, 5.51% (a) (b)
(Cost $11,801) | | |
Total Investments — 100.1%
(Cost $281,071) | | |
Liabilities in Excess of Other Assets — (0.1)% | | |
| | |
Percentages indicated are based on net assets. |
| |
| Real Estate Investment Trust |
| Non-income producing security. |
| Investment in an affiliated fund, which is registered under the Investment Company Act of 1940, as amended, and is advised by J.P. Morgan Investment Management Inc. |
| The rate shown is the current yield as of December 31, 2023. |
SEE NOTES TO FINANCIAL STATEMENTS.
| J.P. Morgan Small Cap Funds | |
JPMorgan U.S. Small Company Fund
SCHEDULE OF PORTFOLIO INVESTMENTSAS OF December 31, 2023 (Unaudited)
| | |
|
Aerospace & Defense — 0.3% |
| | |
Air Freight & Logistics — 0.6% |
| | |
Hub Group, Inc., Class A * | | |
Radiant Logistics, Inc. * | | |
| | |
Automobile Components — 0.7% |
| | |
American Axle & Manufacturing Holdings, Inc. * | | |
| | |
| | |
| | |
| | |
|
Amalgamated Financial Corp. | | |
| | |
| | |
Banc of California, Inc. (b) | | |
| | |
Bank of NT Butterfield & Son Ltd. (The) (Bermuda) | | |
| | |
| | |
Business First Bancshares, Inc. | | |
| | |
Capital City Bank Group, Inc. | | |
Central Pacific Financial Corp. | | |
| | |
Coastal Financial Corp. * | | |
| | |
Customers Bancorp, Inc. * | | |
| | |
| | |
Enterprise Financial Services Corp. | | |
Equity Bancshares, Inc., Class A | | |
Financial Institutions, Inc. | | |
First BanCorp (Puerto Rico) | | |
First Bancshares, Inc. (The) | | |
First Citizens BancShares, Inc., Class A | | |
First Commonwealth Financial Corp. | | |
| | |
| | |
First Mid Bancshares, Inc. | | |
| | |
|
|
| | |
Heartland Financial USA, Inc. | | |
| | |
| | |
| | |
Live Oak Bancshares, Inc. | | |
| | |
| | |
MidWestOne Financial Group, Inc. | | |
| | |
National Bank Holdings Corp., Class A | | |
OceanFirst Financial Corp. | | |
OFG Bancorp (Puerto Rico) | | |
| | |
| | |
| | |
| | |
Pinnacle Financial Partners, Inc. | | |
Popular, Inc. (Puerto Rico) | | |
| | |
| | |
| | |
South Plains Financial, Inc. | | |
Southside Bancshares, Inc. | | |
| | |
| | |
| | |
| | |
| | |
| | |
| | |
| | |
| | |
| | |
|
Coca-Cola Consolidated, Inc. | | |
| | |
Vita Coco Co., Inc. (The) * (b) | | |
| | |
|
ACADIA Pharmaceuticals, Inc. * | | |
| | |
| | |
SEE NOTES TO FINANCIAL STATEMENTS.
| J.P. Morgan Small Cap Funds | |
JPMorgan U.S. Small Company Fund
SCHEDULE OF PORTFOLIO INVESTMENTSAS OF December 31, 2023 (Unaudited) (continued)
| | |
Common Stocks — continued |
Biotechnology — continued |
Allogene Therapeutics, Inc. * | | |
Amicus Therapeutics, Inc. * | | |
Arrowhead Pharmaceuticals, Inc. * | | |
Atara Biotherapeutics, Inc. * | | |
| | |
| | |
Blueprint Medicines Corp. * | | |
Bridgebio Pharma, Inc. * (b) | | |
Catalyst Pharmaceuticals, Inc. * | | |
Enanta Pharmaceuticals, Inc. * | | |
| | |
| | |
Intellia Therapeutics, Inc. * | | |
Kura Oncology, Inc. * (b) | | |
Madrigal Pharmaceuticals, Inc. * (b) | | |
| | |
| | |
| | |
OmniAb Operations, Inc. ‡ * | | |
Ovid therapeutics, Inc. * | | |
Protagonist Therapeutics, Inc. * | | |
Prothena Corp. plc (Ireland) * | | |
| | |
| | |
REVOLUTION Medicines, Inc. * | | |
Sage Therapeutics, Inc. * | | |
Sana Biotechnology, Inc. * (b) | | |
SpringWorks Therapeutics, Inc. * (b) | | |
| | |
Syndax Pharmaceuticals, Inc. * | | |
Travere Therapeutics, Inc. * | | |
Twist Bioscience Corp. * (b) | | |
Tyra Biosciences, Inc. * (b) | | |
| | |
Viking Therapeutics, Inc. * (b) | | |
| | |
Y-mAbs Therapeutics, Inc. * | | |
| | |
|
Savers Value Village, Inc. * (b) | | |
|
| | |
Gibraltar Industries, Inc. * | | |
| | |
|
Building Products — continued |
| | |
Resideo Technologies, Inc. * | | |
Simpson Manufacturing Co., Inc. | | |
| | |
| | |
|
AssetMark Financial Holdings, Inc. * | | |
| | |
Donnelley Financial Solutions, Inc. * | | |
| | |
| | |
| | |
PJT Partners, Inc., Class A | | |
| | |
Victory Capital Holdings, Inc., Class A | | |
Virtus Investment Partners, Inc. | | |
| | |
|
| | |
| | |
| | |
| | |
| | |
| | |
| | |
| | |
| | |
| | |
Commercial Services & Supplies — 1.8% |
| | |
| | |
| | |
| | |
| | |
Communications Equipment — 0.5% |
| | |
| | |
| | |
| | |
Construction & Engineering — 3.5% |
| | |
SEE NOTES TO FINANCIAL STATEMENTS.
| J.P. Morgan Small Cap Funds | |
| | |
Common Stocks — continued |
Construction & Engineering — continued |
| | |
Comfort Systems USA, Inc. | | |
Construction Partners, Inc., Class A * | | |
| | |
| | |
| | |
| | |
Sterling Infrastructure, Inc. * | | |
| | |
Construction Materials — 0.1% |
Summit Materials, Inc., Class A * | | |
|
Enova International, Inc. * | | |
| | |
| | |
Consumer Staples Distribution & Retail — 0.7% |
| | |
Chefs' Warehouse, Inc. (The) * | | |
| | |
Sprouts Farmers Market, Inc. * (b) | | |
| | |
Containers & Packaging — 0.2% |
| | |
| | |
| | |
Diversified Consumer Services — 1.0% |
Adtalem Global Education, Inc. * | | |
| | |
| | |
| | |
| | |
|
Armada Hoffler Properties, Inc. | | |
Broadstone Net Lease, Inc. | | |
Essential Properties Realty Trust, Inc. | | |
| | |
Diversified Telecommunication Services — 0.5% |
EchoStar Corp., Class A * | | |
Iridium Communications, Inc. | | |
| | |
|
Diversified Telecommunication Services — continued |
Liberty Latin America Ltd., Class C (Puerto Rico) * | | |
| | |
| | |
Electric Utilities — 0.9% |
| | |
| | |
Portland General Electric Co. | | |
| | |
Electrical Equipment — 1.5% |
| | |
Bloom Energy Corp., Class A * (b) | | |
| | |
| | |
Electronic Equipment, Instruments & Components — 1.9% |
Benchmark Electronics, Inc. | | |
| | |
| | |
Insight Enterprises, Inc. * (b) | | |
| | |
| | |
| | |
Energy Equipment & Services — 2.3% |
| | |
Helmerich & Payne, Inc. (b) | | |
Liberty Energy, Inc., Class A | | |
| | |
Oceaneering International, Inc. * | | |
Oil States International, Inc. * | | |
Patterson-UTI Energy, Inc. | | |
Select Water Solutions, Inc. | | |
| | |
Weatherford International plc * | | |
| | |
|
Lions Gate Entertainment Corp., Class A * (b) | | |
Financial Services — 3.7% |
| | |
| | |
EVERTEC, Inc. (Puerto Rico) | | |
Federal Agricultural Mortgage Corp., Class C | | |
| | |
SEE NOTES TO FINANCIAL STATEMENTS.
| J.P. Morgan Small Cap Funds | |
JPMorgan U.S. Small Company Fund
SCHEDULE OF PORTFOLIO INVESTMENTSAS OF December 31, 2023 (Unaudited) (continued)
| | |
Common Stocks — continued |
Financial Services — continued |
International Money Express, Inc. * | | |
Jackson Financial, Inc., Class A | | |
| | |
| | |
NMI Holdings, Inc., Class A * | | |
PennyMac Financial Services, Inc. (b) | | |
| | |
| | |
Repay Holdings Corp., Class A * | | |
| | |
|
Cal-Maine Foods, Inc. (b) | | |
Darling Ingredients, Inc. * | | |
| | |
Fresh Del Monte Produce, Inc. | | |
John B Sanfilippo & Son, Inc. | | |
Simply Good Foods Co. (The) * | | |
| | |
| | |
| | |
|
Chesapeake Utilities Corp. | | |
New Jersey Resources Corp. | | |
Northwest Natural Holding Co. | | |
| | |
| | |
Ground Transportation — 0.4% |
| | |
Health Care Equipment & Supplies — 1.9% |
Alphatec Holdings, Inc. * | | |
| | |
| | |
| | |
| | |
| | |
Lantheus Holdings, Inc. * (b) | | |
Merit Medical Systems, Inc. * | | |
| | |
| | |
Treace Medical Concepts, Inc. * | | |
| | |
| | |
|
Health Care Providers & Services — 2.4% |
AMN Healthcare Services, Inc. * | | |
Cross Country Healthcare, Inc. * | | |
Fulgent Genetics, Inc. * (b) | | |
| | |
National HealthCare Corp. | | |
| | |
Option Care Health, Inc. * | | |
| | |
| | |
| | |
| | |
|
| | |
Community Healthcare Trust, Inc. | | |
Global Medical REIT, Inc. | | |
Sabra Health Care REIT, Inc. | | |
| | |
Health Care Technology — 0.5% |
| | |
| | |
| | |
| | |
Hotel & Resort REITs — 0.9% |
Apple Hospitality REIT, Inc. | | |
| | |
Ryman Hospitality Properties, Inc. | | |
| | |
Hotels, Restaurants & Leisure — 2.0% |
Bluegreen Vacations Holding Corp., Class A (b) | | |
| | |
| | |
Dave & Buster's Entertainment, Inc. * | | |
| | |
Hilton Grand Vacations, Inc. * | | |
Kura Sushi USA, Inc., Class A * (b) | | |
| | |
SeaWorld Entertainment, Inc. * | | |
| | |
| | |
Household Durables — 2.0% |
Green Brick Partners, Inc. * | | |
SEE NOTES TO FINANCIAL STATEMENTS.
| J.P. Morgan Small Cap Funds | |
| | |
Common Stocks — continued |
Household Durables — continued |
| | |
| | |
| | |
| | |
Taylor Morrison Home Corp., Class A * | | |
| | |
| | |
Household Products — 0.3% |
Central Garden & Pet Co., Class A * | | |
Independent Power and Renewable Electricity Producers — 0.4% |
Clearway Energy, Inc., Class A (b) | | |
Clearway Energy, Inc., Class C (b) | | |
Sunnova Energy International, Inc. * (b) | | |
| | |
|
First Industrial Realty Trust, Inc. | | |
Innovative Industrial Properties, Inc. (b) | | |
Plymouth Industrial REIT, Inc. | | |
| | |
| | |
| | |
|
American Equity Investment Life Holding Co. * | | |
BRP Group, Inc., Class A * | | |
| | |
Kinsale Capital Group, Inc. | | |
| | |
| | |
Skyward Specialty Insurance Group, Inc. * | | |
| | |
Interactive Media & Services — 0.8% |
| | |
| | |
| | |
| | |
| | |
|
Information Services Group, Inc. | | |
| | |
| | |
|
|
Squarespace, Inc., Class A * | | |
| | |
| | |
|
Acushnet Holdings Corp. (b) | | |
| | |
| | |
Life Sciences Tools & Services — 0.7% |
Adaptive Biotechnologies Corp. * | | |
| | |
| | |
| | |
| | |
| | |
|
Albany International Corp., Class A | | |
Luxfer Holdings plc (United Kingdom) | | |
| | |
| | |
Titan International, Inc. * | | |
Watts Water Technologies, Inc., Class A | | |
| | |
Marine Transportation — 0.4% |
Eagle Bulk Shipping, Inc. (b) | | |
| | |
Safe Bulkers, Inc. (Greece) | | |
| | |
|
| | |
Integral Ad Science Holding Corp. * | | |
John Wiley & Sons, Inc., Class A | | |
| | |
| | |
| | |
|
Alpha Metallurgical Resources, Inc. (b) | | |
| | |
| | |
| | |
| | |
| | |
SEE NOTES TO FINANCIAL STATEMENTS.
| J.P. Morgan Small Cap Funds | |
JPMorgan U.S. Small Company Fund
SCHEDULE OF PORTFOLIO INVESTMENTSAS OF December 31, 2023 (Unaudited) (continued)
| | |
Common Stocks — continued |
Metals & Mining — continued |
| | |
| | |
Schnitzer Steel Industries, Inc., Class A | | |
| | |
| | |
Mortgage Real Estate Investment Trusts (REITs) — 0.6% |
Brightspire Capital, Inc., Class A | | |
KKR Real Estate Finance Trust, Inc. | | |
| | |
| | |
| | |
|
Northwestern Energy Group, Inc. | | |
| | |
| | |
|
| | |
| | |
| | |
Easterly Government Properties, Inc., Class A | | |
| | |
SL Green Realty Corp. (b) | | |
| | |
Oil, Gas & Consumable Fuels — 4.0% |
California Resources Corp. | | |
| | |
Civitas Resources, Inc. (b) | | |
CNX Resources Corp. * (b) | | |
| | |
| | |
| | |
| | |
| | |
| | |
Magnolia Oil & Gas Corp., Class A (b) | | |
| | |
| | |
| | |
PBF Energy, Inc., Class A (b) | | |
| | |
REX American Resources Corp. * | | |
| | |
| | |
|
Oil, Gas & Consumable Fuels — continued |
Teekay Tankers Ltd., Class A (Canada) | | |
Uranium Energy Corp. * (b) | | |
| | |
Passenger Airlines — 0.5% |
Blade Air Mobility, Inc. * | | |
Joby Aviation, Inc. * (b) | | |
| | |
| | |
Personal Care Products — 2.2% |
| | |
Edgewell Personal Care Co. (b) | | |
| | |
| | |
| | |
Nature's Sunshine Products, Inc. * | | |
Oddity Tech Ltd., Class A (Israel) * (b) | | |
USANA Health Sciences, Inc. * | | |
| | |
|
ANI Pharmaceuticals, Inc. * | | |
Axsome Therapeutics, Inc. * (b) | | |
Esperion Therapeutics, Inc. * (b) | | |
Longboard Pharmaceuticals, Inc. * | | |
Prestige Consumer Healthcare, Inc. * | | |
| | |
Professional Services — 2.8% |
| | |
Barrett Business Services, Inc. | | |
CACI International, Inc., Class A * | | |
| | |
Heidrick & Struggles International, Inc. | | |
Huron Consulting Group, Inc. * | | |
| | |
| | |
| | |
| | |
Real Estate Management & Development — 0.3% |
| | |
Opendoor Technologies, Inc. * | | |
| | |
SEE NOTES TO FINANCIAL STATEMENTS.
| J.P. Morgan Small Cap Funds | |
| | |
Common Stocks — continued |
|
| | |
| | |
| | |
|
| | |
InvenTrust Properties Corp. | | |
| | |
Phillips Edison & Co., Inc. (b) | | |
Retail Opportunity Investments Corp. | | |
| | |
| | |
| | |
| | |
Semiconductors & Semiconductor Equipment — 2.6% |
ACM Research, Inc., Class A * (b) | | |
Axcelis Technologies, Inc. * | | |
| | |
MACOM Technology Solutions Holdings, Inc. * | | |
| | |
| | |
| | |
SMART Global Holdings, Inc. * (b) | | |
Ultra Clean Holdings, Inc. * | | |
Veeco Instruments, Inc. * (b) | | |
| | |
|
| | |
Asana, Inc., Class A * (b) | | |
| | |
| | |
| | |
| | |
C3.ai, Inc., Class A * (b) | | |
CommVault Systems, Inc. * | | |
| | |
LiveRamp Holdings, Inc. * | | |
MicroStrategy, Inc., Class A * (b) | | |
| | |
| | |
| | |
| | |
Riot Platforms, Inc. * (b) | | |
| | |
|
|
Sprout Social, Inc., Class A * (b) | | |
| | |
| | |
| | |
| | |
| | |
|
National Storage Affiliates Trust (b) | | |
| | |
| | |
|
Abercrombie & Fitch Co., Class A * | | |
Academy Sports & Outdoors, Inc. | | |
Asbury Automotive Group, Inc. * | | |
Boot Barn Holdings, Inc. * (b) | | |
| | |
| | |
| | |
| | |
| | |
| | |
| | |
| | |
| | |
Technology Hardware, Storage & Peripherals — 1.0% |
Super Micro Computer, Inc. * | | |
Textiles, Apparel & Luxury Goods — 0.8% |
| | |
G-III Apparel Group Ltd. * | | |
| | |
| | |
Trading Companies & Distributors — 3.1% |
Applied Industrial Technologies, Inc. | | |
Beacon Roofing Supply, Inc. * | | |
BlueLinx Holdings, Inc. * | | |
| | |
| | |
| | |
Hudson Technologies, Inc. * | | |
| | |
Rush Enterprises, Inc., Class A | | |
SEE NOTES TO FINANCIAL STATEMENTS.
| J.P. Morgan Small Cap Funds | |
JPMorgan U.S. Small Company Fund
SCHEDULE OF PORTFOLIO INVESTMENTSAS OF December 31, 2023 (Unaudited) (continued)
| | |
Common Stocks — continued |
Trading Companies & Distributors — continued |
| | |
WESCO International, Inc. | | |
| | |
|
American States Water Co. | | |
Wireless Telecommunication Services — 0.1% |
| | |
Telephone and Data Systems, Inc. | | |
| | |
Total Common Stocks
(Cost $756,547) | | |
Short-Term Investments — 10.9% |
Investment Companies — 2.2% |
JPMorgan Prime Money Market Fund Class IM Shares, 5.51% (c) (d)
(Cost $20,802) | | |
Investment of Cash Collateral from Securities Loaned — 8.7% |
JPMorgan Securities Lending Money Market Fund Agency SL Class Shares, 5.56% (c) (d) | | |
JPMorgan U.S. Government Money Market Fund Class IM Shares, 5.30% (c) (d) | | |
Total Investment of Cash Collateral from Securities Loaned
(Cost $81,502) | | |
Total Short-Term Investments
(Cost $102,304) | | |
Total Investments — 108.4%
(Cost $858,851) | | |
Liabilities in Excess of Other Assets — (8.4)% | | |
| | |
Percentages indicated are based on net assets. |
Amounts presented as a dash ("-") represent amounts that round to less than a thousand. |
| |
| Real Estate Investment Trust |
| Value determined using significant unobservable inputs. |
| Non-income producing security. |
| Security exempt from registration pursuant to Regulation S under the Securities Act of 1933, as amended. Regulation S applies to securities offerings that are made outside of the United States and do not involve direct selling efforts in the United States and as such may have restrictions on resale. |
| The security or a portion of this security is on loan at December 31, 2023. The total value of securities on loan at December 31, 2023 is $78,093. |
| Investment in an affiliated fund, which is registered under the Investment Company Act of 1940, as amended, and is advised by J.P. Morgan Investment Management Inc. |
| The rate shown is the current yield as of December 31, 2023. |
SEE NOTES TO FINANCIAL STATEMENTS.
| J.P. Morgan Small Cap Funds | |
Futures contracts outstanding as of December 31, 2023 (amounts in thousands, except number of contracts):
| | | | | VALUE AND
UNREALIZED
APPRECIATION
(DEPRECIATION) ($) |
| | | | | |
Russell 2000 E-Mini Index | | | | | |
SEE NOTES TO FINANCIAL STATEMENTS.
| J.P. Morgan Small Cap Funds | |
STATEMENTS OF ASSETS AND LIABILITIESAS OF December 31, 2023 (Unaudited)
(Amounts in thousands, except per share amounts)
| JPMorgan
Small Cap
Blend Fund | JPMorgan
Small Cap
Equity Fund | |
| | | |
Investments in non-affiliates, at value | | | |
Investments in affiliates, at value | | | |
Investments of cash collateral received from securities loaned, at value (See Note 2.C.) | | | |
Options purchased, at value | | | |
| | | |
| | | |
Investment securities sold | | | |
| | | |
Dividends from non-affiliates | | | |
Dividends from affiliates | | | |
Securities lending income (See Note 2.C.) | | | |
| | | |
| | | |
| | | |
| | | |
Investment securities purchased | | | |
Collateral received on securities loaned (See Note 2.C.) | | | |
| | | |
| | | |
| | | |
| | | |
| | | |
| | | |
Custodian and accounting fees | | | |
Trustees’ and Chief Compliance Officer’s fees | | | |
| | | |
| | | |
| | | |
(a)
Amount rounds to less than one thousand.
SEE NOTES TO FINANCIAL STATEMENTS.
| J.P. Morgan Small Cap Funds | |
| JPMorgan Small Cap Blend Fund | JPMorgan Small Cap Equity Fund | |
| | | |
| | | |
Total distributable earnings (loss) | | | |
| | | |
| | | |
| | | |
| | | |
| | | |
| | | |
| | | |
| | | |
| | | |
| | | |
| | | |
| | | |
Outstanding units of beneficial interest (shares)
($0.0001 par value; unlimited number of shares authorized): | | | |
| | | |
| | | |
| | | |
| | | |
| | | |
| | | |
| | | |
| | | |
| | | |
| | | |
Class A — Redemption price per share | | | |
Class C — Offering price per share (b) | | | |
Class I — Offering and redemption price per share | | | |
Class L — Offering and redemption price per share | | | |
Class R2 — Offering and redemption price per share | | | |
Class R3 — Offering and redemption price per share | | | |
Class R4 — Offering and redemption price per share | | | |
Class R5 — Offering and redemption price per share | | | |
Class R6 — Offering and redemption price per share | | | |
Class A maximum sales charge | | | |
Class A maximum public offering price per share
[net asset value per share/(100% – maximum sales charge)] | | | |
Cost of investments in non-affiliates | | | |
Cost of investments in affiliates | | | |
Cost of options purchased | | | |
Investment securities on loan, at value (See Note 2.C.) | | | |
Cost of investment of cash collateral (See Note 2.C.) | | | |
(a)
Per share amounts may not recalculate due to rounding of net assets and/or shares outstanding.
(b)
Redemption price for Class C Shares varies based upon length of time the shares are held.
SEE NOTES TO FINANCIAL STATEMENTS.
| J.P. Morgan Small Cap Funds | |
STATEMENTS OF ASSETS AND LIABILITIESAS OF December 31, 2023 (Unaudited) (continued)
(Amounts in thousands, except per share amounts)
| JPMorgan
Small Cap
Sustainable Leaders
Fund | JPMorgan
Small Cap
Value Fund | JPMorgan
SMID Cap
Equity Fund | |
| | | | |
Investments in non-affiliates, at value | | | | |
Investments in affiliates, at value | | | | |
Investments of cash collateral received from securities loaned, at value (See Note 2.C.) | | | | |
| | | | |
Deposits at broker for futures contracts | | | | |
| | | | |
Investment securities sold | | | | |
| | | | |
Dividends from non-affiliates | | | | |
Dividends from affiliates | | | | |
Securities lending income (See Note 2.C.) | | | | |
| | | | |
| | | | |
| | | | |
| | | | |
| | | | |
Investment securities purchased | | | | |
Collateral received on securities loaned (See Note 2.C.) | | | | |
| | | | |
Variation margin on futures contracts | | | | |
| | | | |
| | | | |
| | | | |
| | | | |
| | | | |
Custodian and accounting fees | | | | |
Trustees’ and Chief Compliance Officer’s fees | | | | |
| | | | |
| | | | |
| | | | |
(a)
Amount rounds to less than one thousand.
SEE NOTES TO FINANCIAL STATEMENTS.
| J.P. Morgan Small Cap Funds | |
| JPMorgan Small Cap Sustainable Leaders Fund | JPMorgan Small Cap Value Fund | JPMorgan SMID Cap Equity Fund | |
| | | | |
| | | | |
Total distributable earnings (loss) | | | | |
| | | | |
| | | | |
| | | | |
| | | | |
| | | | |
| | | | |
| | | | |
| | | | |
| | | | |
| | | | |
| | | | |
| | | | |
Outstanding units of beneficial interest (shares)
($0.0001 par value; unlimited number of shares authorized): | | | | |
| | | | |
| | | | |
| | | | |
| | | | |
| | | | |
| | | | |
| | | | |
| | | | |
| | | | |
| | | | |
Class A — Redemption price per share | | | | |
Class C — Offering price per share (b) | | | | |
Class I — Offering and redemption price per share | | | | |
Class L — Offering and redemption price per share | | | | |
Class R2 — Offering and redemption price per share | | | | |
Class R3 — Offering and redemption price per share | | | | |
Class R4 — Offering and redemption price per share | | | | |
Class R5 — Offering and redemption price per share | | | | |
Class R6 — Offering and redemption price per share | | | | |
Class A maximum sales charge | | | | |
Class A maximum public offering price per share
[net asset value per share/(100% – maximum sales charge)] | | | | |
Cost of investments in non-affiliates | | | | |
Cost of investments in affiliates | | | | |
Investment securities on loan, at value (See Note 2.C.) | | | | |
Cost of investment of cash collateral (See Note 2.C.) | | | | |
(a)
Per share amounts may not recalculate due to rounding of net assets and/or shares outstanding.
(b)
Redemption price for Class C Shares varies based upon length of time the shares are held.
SEE NOTES TO FINANCIAL STATEMENTS.
| J.P. Morgan Small Cap Funds | |
STATEMENTS OF OPERATIONSFOR THE SIX MONTHS ENDED December 31, 2023 (Unaudited)
(Amounts in thousands)
| JPMorgan
Small Cap
Blend Fund | JPMorgan
Small Cap
Equity Fund | |
| | | |
Interest income from affiliates | | | |
Dividend income from non-affiliates | | | |
Dividend income from affiliates | | | |
Income from securities lending (net) (See Note 2.C.) | | | |
| | | |
| | | |
| | | |
| | | |
| | | |
| | | |
| | | |
| | | |
| | | |
| | | |
| | | |
| | | |
| | | |
| | | |
| | | |
| | | |
| | | |
| | | |
Custodian and accounting fees | | | |
Interest expense to affiliates | | | |
| | | |
Trustees’ and Chief Compliance Officer’s fees | | | |
Printing and mailing costs | | | |
Registration and filing fees | | | |
Transfer agency fees (See Note 2.H.) | | | |
| | | |
| | | |
| | | |
Less expense reimbursements | | | |
| | | |
Net investment income (loss) | | | |
(a)
Amount rounds to less than one thousand.
SEE NOTES TO FINANCIAL STATEMENTS.
| J.P. Morgan Small Cap Funds | |
| JPMorgan Small Cap Blend Fund | JPMorgan Small Cap Equity Fund | |
REALIZED/UNREALIZED GAINS (LOSSES): | | | |
Net realized gain (loss) on transactions from: | | | |
Investments in non-affiliates | | | |
Investments in affiliates | | | |
| | | |
| | | |
Change in net unrealized appreciation/depreciation on: | | | |
Investments in non-affiliates | | | |
Investments in affiliates | | | |
| | | |
Change in net unrealized appreciation/depreciation | | | |
Net realized/unrealized gains (losses) | | | |
Change in net assets resulting from operations | | | |
SEE NOTES TO FINANCIAL STATEMENTS.
| J.P. Morgan Small Cap Funds | |
STATEMENTS OF OPERATIONSFOR THE SIX MONTHS ENDED December 31, 2023 (Unaudited) (continued)
(Amounts in thousands)
| JPMorgan
Small Cap
Sustainable Leaders
Fund | JPMorgan
Small Cap
Value Fund | JPMorgan
SMID Cap
Equity Fund | |
| | | | |
Interest income from non-affiliates | | | | |
Dividend income from non-affiliates | | | | |
Dividend income from affiliates | | | | |
Income from securities lending (net) (See Note 2.C.) | | | | |
| | | | |
| | | | |
| | | | |
| | | | |
| | | | |
| | | | |
| | | | |
| | | | |
| | | | |
| | | | |
| | | | |
| | | | |
| | | | |
| | | | |
| | | | |
| | | | |
| | | | |
| | | | |
Custodian and accounting fees | | | | |
Interest expense to affiliates | | | | |
| | | | |
Trustees’ and Chief Compliance Officer’s fees | | | | |
Printing and mailing costs | | | | |
Registration and filing fees | | | | |
Transfer agency fees (See Note 2.H.) | | | | |
| | | | |
| | | | |
| | | | |
Less expense reimbursements | | | | |
| | | | |
Net investment income (loss) | | | | |
(a)
Amount rounds to less than one thousand.
SEE NOTES TO FINANCIAL STATEMENTS.
| J.P. Morgan Small Cap Funds | |
| JPMorgan Small Cap Sustainable Leaders Fund | JPMorgan Small Cap Value Fund | JPMorgan SMID Cap Equity Fund | |
REALIZED/UNREALIZED GAINS (LOSSES): | | | | |
Net realized gain (loss) on transactions from: | | | | |
Investments in non-affiliates | | | | |
Investments in affiliates | | | | |
| | | | |
| | | | |
Change in net unrealized appreciation/depreciation on: | | | | |
Investments in non-affiliates | | | | |
Investments in affiliates | | | | |
| | | | |
Change in net unrealized appreciation/depreciation | | | | |
Net realized/unrealized gains (losses) | | | | |
Change in net assets resulting from operations | | | | |
(a)
Amount rounds to less than one thousand.
SEE NOTES TO FINANCIAL STATEMENTS.
| J.P. Morgan Small Cap Funds | |
STATEMENTS OF CHANGES IN NET ASSETSFOR THE PERIODS INDICATED
(Amounts in thousands)
| JPMorgan Small
Cap Blend Fund | JPMorgan Small Cap Equity Fund |
| Six Months Ended
December 31, 2023
(Unaudited) | | Six Months Ended
December 31, 2023
(Unaudited) | |
CHANGE IN NET ASSETS RESULTING FROM OPERATIONS: | | | | |
Net investment income (loss) | | | | |
| | | | |
Change in net unrealized appreciation/depreciation | | | | |
Change in net assets resulting from operations | | | | |
DISTRIBUTIONS TO SHAREHOLDERS: | | | | |
| | | | |
| | | | |
| | | | |
| | | | |
| | | | |
| | | | |
| | | | |
| | | | |
Total distributions to shareholders | | | | |
| | | | |
Change in net assets resulting from capital transactions | | | | |
| | | | |
| | | | |
| | | | |
| | | | |
SEE NOTES TO FINANCIAL STATEMENTS.
| J.P. Morgan Small Cap Funds | |
| JPMorgan Small Cap Growth Fund | JPMorgan Small Cap Sustainable Leaders Fund |
| Six Months Ended
December 31, 2023
(Unaudited) | | Six Months Ended
December 31, 2023
(Unaudited) | |
CHANGE IN NET ASSETS RESULTING FROM OPERATIONS: | | | | |
Net investment income (loss) | | | | |
| | | | |
Change in net unrealized appreciation/depreciation | | | | |
Change in net assets resulting from operations | | | | |
DISTRIBUTIONS TO SHAREHOLDERS: | | | | |
| | | | |
| | | | |
| | | | |
| | | | |
| | | | |
| | | | |
| | | | |
| | | | |
| | | | |
Total distributions to shareholders | | | | |
| | | | |
Change in net assets resulting from capital transactions | | | | |
| | | | |
| | | | |
| | | | |
| | | | |
SEE NOTES TO FINANCIAL STATEMENTS.
| J.P. Morgan Small Cap Funds | |
STATEMENTS OF CHANGES IN NET ASSETSFOR THE PERIODS INDICATED (continued)
(Amounts in thousands)
| JPMorgan Small Cap Value Fund | JPMorgan SMID Cap Equity Fund |
| Six Months Ended
December 31, 2023
(Unaudited) | | Six Months Ended
December 31, 2023
(Unaudited) | |
CHANGE IN NET ASSETS RESULTING FROM OPERATIONS: | | | | |
Net investment income (loss) | | | | |
| | | | |
Change in net unrealized appreciation/depreciation | | | | |
Change in net assets resulting from operations | | | | |
DISTRIBUTIONS TO SHAREHOLDERS: | | | | |
| | | | |
| | | | |
| | | | |
| | | | |
| | | | |
| | | | |
| | | | |
| | | | |
Total distributions to shareholders | | | | |
| | | | |
Change in net assets resulting from capital transactions | | | | |
| | | | |
| | | | |
| | | | |
| | | | |
SEE NOTES TO FINANCIAL STATEMENTS.
| J.P. Morgan Small Cap Funds | |
| JPMorgan U.S. Small Company Fund |
| Six Months Ended
December 31, 2023
(Unaudited) | |
CHANGE IN NET ASSETS RESULTING FROM OPERATIONS: | | |
Net investment income (loss) | | |
| | |
Change in net unrealized appreciation/depreciation | | |
Change in net assets resulting from operations | | |
DISTRIBUTIONS TO SHAREHOLDERS: | | |
| | |
| | |
| | |
| | |
| | |
| | |
| | |
| | |
| | |
Total distributions to shareholders | | |
| | |
Change in net assets resulting from capital transactions | | |
| | |
| | |
| | |
| | |
SEE NOTES TO FINANCIAL STATEMENTS.
| J.P. Morgan Small Cap Funds | |
STATEMENTS OF CHANGES IN NET ASSETSFOR THE PERIODS INDICATED (continued)
(Amounts in thousands)
| JPMorgan Small
Cap Blend Fund | JPMorgan Small Cap Equity Fund |
| Six Months Ended December 31, 2023
(Unaudited) | | Six Months Ended December 31, 2023
(Unaudited) | |
| | | | |
| | | | |
Proceeds from shares issued | | | | |
| | | | |
| | | | |
Change in net assets resulting from Class A capital transactions | | | | |
| | | | |
Proceeds from shares issued | | | | |
| | | | |
| | | | |
Change in net assets resulting from Class C capital transactions | | | | |
| | | | |
Proceeds from shares issued | | | | |
| | | | |
| | | | |
Change in net assets resulting from Class I capital transactions | | | | |
| | | | |
Proceeds from shares issued | | | | |
| | | | |
| | | | |
Change in net assets resulting from Class R2 capital transactions | | | | |
| | | | |
Proceeds from shares issued | | | | |
| | | | |
| | | | |
Change in net assets resulting from Class R3 capital transactions | | | | |
| | | | |
Proceeds from shares issued | | | | |
| | | | |
| | | | |
Change in net assets resulting from Class R4 capital transactions | | | | |
| | | | |
Proceeds from shares issued | | | | |
| | | | |
| | | | |
Change in net assets resulting from Class R5 capital transactions | | | | |
SEE NOTES TO FINANCIAL STATEMENTS.
| J.P. Morgan Small Cap Funds | |
| JPMorgan Small Cap Blend Fund | JPMorgan Small Cap Equity Fund |
| Six Months Ended December 31, 2023 (Unaudited) | | Six Months Ended December 31, 2023 (Unaudited) | |
CAPITAL TRANSACTIONS: (continued) | | | | |
| | | | |
Proceeds from shares issued | | | | |
| | | | |
| | | | |
Change in net assets resulting from Class R6 capital transactions | | | | |
Total change in net assets resulting from capital transactions | | | | |
| | | | |
| | | | |
| | | | |
| | | | |
| | | | |
| | | | |
| | | | |
| | | | |
| | | | |
| | | | |
| | | | |
| | | | |
| | | | |
| | | | |
| | | | |
| | | | |
| | | | |
| | | | |
| | | | |
| | | | |
Change in Class R2 Shares | | | | |
| | | | |
| | | | |
| | | | |
| | | | |
Change in Class R3 Shares | | | | |
| | | | |
| | | | |
| | | | |
| | | | |
Change in Class R4 Shares | | | | |
(a)
Amount rounds to less than one thousand.
SEE NOTES TO FINANCIAL STATEMENTS.
| J.P. Morgan Small Cap Funds | |
STATEMENTS OF CHANGES IN NET ASSETSFOR THE PERIODS INDICATED (continued)
(Amounts in thousands)
| JPMorgan Small Cap Blend Fund | JPMorgan Small Cap Equity Fund |
| Six Months Ended December 31, 2023 (Unaudited) | | Six Months Ended December 31, 2023 (Unaudited) | |
SHARE TRANSACTIONS: (continued) | | | | |
| | | | |
| | | | |
| | | | |
| | | | |
Change in Class R5 Shares | | | | |
| | | | |
| | | | |
| | | | |
| | | | |
Change in Class R6 Shares | | | | |
SEE NOTES TO FINANCIAL STATEMENTS.
| J.P. Morgan Small Cap Funds | |
| JPMorgan Small Cap Growth Fund | JPMorgan Small Cap Sustainable Leaders Fund |
| Six Months Ended December 31, 2023
(Unaudited) | | Six Months Ended December 31, 2023
(Unaudited) | |
| | | | |
| | | | |
Proceeds from shares issued | | | | |
| | | | |
| | | | |
Change in net assets resulting from Class A capital transactions | | | | |
| | | | |
Proceeds from shares issued | | | | |
| | | | |
| | | | |
Change in net assets resulting from Class C capital transactions | | | | |
| | | | |
Proceeds from shares issued | | | | |
| | | | |
| | | | |
Change in net assets resulting from Class I capital transactions | | | | |
| | | | |
Proceeds from shares issued | | | | |
| | | | |
| | | | |
Change in net assets resulting from Class L capital transactions | | | | |
| | | | |
Proceeds from shares issued | | | | |
| | | | |
| | | | |
Change in net assets resulting from Class R2 capital transactions | | | | |
| | | | |
Proceeds from shares issued | | | | |
| | | | |
| | | | |
Change in net assets resulting from Class R3 capital transactions | | | | |
SEE NOTES TO FINANCIAL STATEMENTS.
| J.P. Morgan Small Cap Funds | |
STATEMENTS OF CHANGES IN NET ASSETSFOR THE PERIODS INDICATED (continued)
(Amounts in thousands)
| JPMorgan Small Cap Growth Fund | JPMorgan Small Cap Sustainable Leaders Fund |
| Six Months Ended December 31, 2023 (Unaudited) | | Six Months Ended December 31, 2023 (Unaudited) | |
CAPITAL TRANSACTIONS: (continued) | | | | |
| | | | |
Proceeds from shares issued | | | | |
| | | | |
| | | | |
Change in net assets resulting from Class R4 capital transactions | | | | |
| | | | |
Proceeds from shares issued | | | | |
| | | | |
| | | | |
Change in net assets resulting from Class R5 capital transactions | | | | |
| | | | |
Proceeds from shares issued | | | | |
| | | | |
| | | | |
Change in net assets resulting from Class R6 capital transactions | | | | |
Total change in net assets resulting from capital transactions | | | | |
| | | | |
| | | | |
| | | | |
| | | | |
| | | | |
| | | | |
| | | | |
| | | | |
| | | | |
| | | | |
| | | | |
| | | | |
| | | | |
| | | | |
| | | | |
| | | | |
(a)
Amount rounds to less than one thousand.
SEE NOTES TO FINANCIAL STATEMENTS.
| J.P. Morgan Small Cap Funds | |
| JPMorgan Small Cap Growth Fund | JPMorgan Small Cap Sustainable Leaders Fund |
| Six Months Ended December 31, 2023 (Unaudited) | | Six Months Ended December 31, 2023 (Unaudited) | |
SHARE TRANSACTIONS: (continued) | | | | |
| | | | |
| | | | |
| | | | |
| | | | |
| | | | |
| | | | |
| | | | |
| | | | |
| | | | |
Change in Class R2 Shares | | | | |
| | | | |
| | | | |
| | | | |
| | | | |
Change in Class R3 Shares | | | | |
| | | | |
| | | | |
| | | | |
| | | | |
Change in Class R4 Shares | | | | |
| | | | |
| | | | |
| | | | |
| | | | |
Change in Class R5 Shares | | | | |
| | | | |
| | | | |
| | | | |
| | | | |
Change in Class R6 Shares | | | | |
(a)
Amount rounds to less than one thousand.
SEE NOTES TO FINANCIAL STATEMENTS.
| J.P. Morgan Small Cap Funds | |
STATEMENTS OF CHANGES IN NET ASSETSFOR THE PERIODS INDICATED (continued)
(Amounts in thousands)
| JPMorgan Small Cap Value Fund | JPMorgan SMID Cap Equity Fund |
| Six Months Ended December 31, 2023
(Unaudited) | | Six Months Ended December 31, 2023
(Unaudited) | |
| | | | |
| | | | |
Proceeds from shares issued | | | | |
| | | | |
| | | | |
Change in net assets resulting from Class A capital transactions | | | | |
| | | | |
Proceeds from shares issued | | | | |
| | | | |
| | | | |
Change in net assets resulting from Class C capital transactions | | | | |
| | | | |
Proceeds from shares issued | | | | |
| | | | |
| | | | |
Change in net assets resulting from Class I capital transactions | | | | |
| | | | |
Proceeds from shares issued | | | | |
| | | | |
| | | | |
Change in net assets resulting from Class R2 capital transactions | | | | |
| | | | |
Proceeds from shares issued | | | | |
| | | | |
| | | | |
Change in net assets resulting from Class R3 capital transactions | | | | |
| | | | |
Proceeds from shares issued | | | | |
| | | | |
| | | | |
Change in net assets resulting from Class R4 capital transactions | | | | |
| | | | |
Proceeds from shares issued | | | | |
| | | | |
| | | | |
Change in net assets resulting from Class R5 capital transactions | | | | |
(a)
Amount rounds to less than one thousand.
SEE NOTES TO FINANCIAL STATEMENTS.
| J.P. Morgan Small Cap Funds | |
| JPMorgan Small Cap Value Fund | JPMorgan SMID Cap Equity Fund |
| Six Months Ended December 31, 2023 (Unaudited) | | Six Months Ended December 31, 2023 (Unaudited) | |
CAPITAL TRANSACTIONS: (continued) | | | | |
| | | | |
Proceeds from shares issued | | | | |
| | | | |
| | | | |
Change in net assets resulting from Class R6 capital transactions | | | | |
Total change in net assets resulting from capital transactions | | | | |
| | | | |
| | | | |
| | | | |
| | | | |
| | | | |
| | | | |
| | | | |
| | | | |
| | | | |
| | | | |
| | | | |
| | | | |
| | | | |
| | | | |
| | | | |
| | | | |
| | | | |
| | | | |
| | | | |
| | | | |
Change in Class R2 Shares | | | | |
| | | | |
| | | | |
| | | | |
| | | | |
Change in Class R3 Shares | | | | |
| | | | |
| | | | |
| | | | |
| | | | |
Change in Class R4 Shares | | | | |
(a)
Amount rounds to less than one thousand.
SEE NOTES TO FINANCIAL STATEMENTS.
| J.P. Morgan Small Cap Funds | |
STATEMENTS OF CHANGES IN NET ASSETSFOR THE PERIODS INDICATED (continued)
(Amounts in thousands)
| JPMorgan Small Cap Value Fund | JPMorgan SMID Cap Equity Fund |
| Six Months Ended December 31, 2023 (Unaudited) | | Six Months Ended December 31, 2023 (Unaudited) | |
SHARE TRANSACTIONS: (continued) | | | | |
| | | | |
| | | | |
| | | | |
| | | | |
Change in Class R5 Shares | | | | |
| | | | |
| | | | |
| | | | |
| | | | |
Change in Class R6 Shares | | | | |
SEE NOTES TO FINANCIAL STATEMENTS.
| J.P. Morgan Small Cap Funds | |
| JPMorgan U.S. Small Company Fund |
| Six Months Ended December 31, 2023
(Unaudited) | |
| | |
| | |
Proceeds from shares issued | | |
| | |
| | |
Change in net assets resulting from Class A capital transactions | | |
| | |
Proceeds from shares issued | | |
| | |
| | |
Change in net assets resulting from Class C capital transactions | | |
| | |
Proceeds from shares issued | | |
| | |
| | |
Change in net assets resulting from Class I capital transactions | | |
| | |
Proceeds from shares issued | | |
| | |
| | |
Change in net assets resulting from Class L capital transactions | | |
| | |
Proceeds from shares issued | | |
| | |
| | |
Change in net assets resulting from Class R2 capital transactions | | |
| | |
Proceeds from shares issued | | |
| | |
| | |
Change in net assets resulting from Class R3 capital transactions | | |
| | |
Proceeds from shares issued | | |
| | |
| | |
Change in net assets resulting from Class R4 capital transactions | | |
SEE NOTES TO FINANCIAL STATEMENTS.
| J.P. Morgan Small Cap Funds | |
STATEMENTS OF CHANGES IN NET ASSETSFOR THE PERIODS INDICATED (continued)
(Amounts in thousands)
| JPMorgan U.S. Small Company Fund |
| Six Months Ended December 31, 2023 (Unaudited) | |
CAPITAL TRANSACTIONS: (continued) | | |
| | |
Proceeds from shares issued | | |
| | |
| | |
Change in net assets resulting from Class R5 capital transactions | | |
| | |
Proceeds from shares issued | | |
| | |
| | |
Change in net assets resulting from Class R6 capital transactions | | |
Total change in net assets resulting from capital transactions | | |
| | |
| | |
| | |
| | |
| | |
| | |
| | |
| | |
| | |
| | |
| | |
| | |
| | |
| | |
| | |
| | |
| | |
| | |
| | |
| | |
| | |
| | |
| | |
| | |
| | |
Change in Class R2 Shares | | |
SEE NOTES TO FINANCIAL STATEMENTS.
| J.P. Morgan Small Cap Funds | |
| JPMorgan U.S. Small Company Fund |
| Six Months Ended December 31, 2023 (Unaudited) | |
SHARE TRANSACTIONS: (continued) | | |
| | |
| | |
| | |
| | |
Change in Class R3 Shares | | |
| | |
| | |
| | |
| | |
Change in Class R4 Shares | | |
| | |
| | |
| | |
| | |
Change in Class R5 Shares | | |
| | |
| | |
| | |
| | |
Change in Class R6 Shares | | |
SEE NOTES TO FINANCIAL STATEMENTS.
| J.P. Morgan Small Cap Funds | |
FINANCIAL HIGHLIGHTSFOR THE PERIODS INDICATED
| Per share operating performance |
| | | |
| Net asset
value,
beginning
of period | Net
investment
income
(loss)(b) | Net realized
and unrealized
gains
(losses) on
investments | Total from
investment
operations | | | |
JPMorgan Small Cap Blend Fund | | | | | | | |
| | | | | | | |
Six Months Ended December 31, 2023 (Unaudited) | | | | | | | |
| | | | | | | |
| | | | | | | |
| | | | | | | |
| | | | | | | |
| | | | | | | |
| | | | | | | |
Six Months Ended December 31, 2023 (Unaudited) | | | | | | | |
| | | | | | | |
| | | | | | | |
| | | | | | | |
| | | | | | | |
| | | | | | | |
| | | | | | | |
Six Months Ended December 31, 2023 (Unaudited) | | | | | | | |
| | | | | | | |
| | | | | | | |
| | | | | | | |
| | | | | | | |
| | | | | | | |
| | | | | | | |
Six Months Ended December 31, 2023 (Unaudited) | | | | | | | |
| | | | | | | |
| | | | | | | |
| | | | | | | |
| | | | | | | |
July 2, 2018 (g) through June 30, 2019 | | | | | | | |
|
| Annualized for periods less than one year, unless otherwise noted. |
| Calculated based upon average shares outstanding. |
| Not annualized for periods less than one year. |
| Includes adjustments in accordance with accounting principles generally accepted in the United States of America and as such, the net asset values for financial reporting purposes and the returns based upon those net asset values may differ from the net asset values and returns for shareholder transactions. |
| Includes interest expense, if applicable, each of which is less than 0.005% unless otherwise noted. |
| Amount rounds to less than $0.005. |
| Commencement of offering of class of shares. |
SEE NOTES TO FINANCIAL STATEMENTS.
| J.P. Morgan Small Cap Funds | |
| |
| | | Ratios to average net assets(a) |
Net asset
value,
end of
period | Total return
(excludes
sales charge)(c)(d) | Net assets,
end of
period
(000's) | | Net
investment
income
(loss) | Expenses without
waivers and reimbursements | |
| | | | | | |
| | | | | | |
| | | | | | |
| | | | | | |
| | | | | | |
| | | | | | |
| | | | | | |
| | | | | | |
| | | | | | |
| | | | | | |
| | | | | | |
| | | | | | |
| | | | | | |
| | | | | | |
| | | | | | |
| | | | | | |
| | | | | | |
| | | | | | |
| | | | | | |
| | | | | | |
| | | | | | |
| | | | | | |
| | | | | | |
| | | | | | |
| | | | | | |
| | | | | | |
| | | | | | |
| | | | | | |
| | | | | | |
SEE NOTES TO FINANCIAL STATEMENTS.
| J.P. Morgan Small Cap Funds | |
FINANCIAL HIGHLIGHTSFOR THE PERIODS INDICATED
| Per share operating performance |
| | | |
| Net asset
value,
beginning
of period | Net
investment
income
(loss)(b) | Net realized
and unrealized
gains
(losses) on
investments | Total from
investment
operations | | | |
JPMorgan Small Cap Equity Fund | | | | | | | |
| | | | | | | |
Six Months Ended December 31, 2023 (Unaudited) | | | | | | | |
| | | | | | | |
| | | | | | | |
| | | | | | | |
| | | | | | | |
| | | | | | | |
| | | | | | | |
Six Months Ended December 31, 2023 (Unaudited) | | | | | | | |
| | | | | | | |
| | | | | | | |
| | | | | | | |
| | | | | | | |
| | | | | | | |
| | | | | | | |
Six Months Ended December 31, 2023 (Unaudited) | | | | | | | |
| | | | | | | |
| | | | | | | |
| | | | | | | |
| | | | | | | |
| | | | | | | |
| | | | | | | |
Six Months Ended December 31, 2023 (Unaudited) | | | | | | | |
| | | | | | | |
| | | | | | | |
| | | | | | | |
| | | | | | | |
| | | | | | | |
| | | | | | | |
Six Months Ended December 31, 2023 (Unaudited) | | | | | | | |
| | | | | | | |
| | | | | | | |
| | | | | | | |
| | | | | | | |
| | | | | | | |
| | | | | | | |
Six Months Ended December 31, 2023 (Unaudited) | | | | | | | |
| | | | | | | |
| | | | | | | |
| | | | | | | |
| | | | | | | |
| | | | | | | |
SEE NOTES TO FINANCIAL STATEMENTS.
| J.P. Morgan Small Cap Funds | |
| |
| | | Ratios to average net assets(a) |
Net asset
value,
end of
period | Total return
(excludes
sales charge)(c)(d) | Net assets,
end of
period
(000's) | | Net
investment
income
(loss) | Expenses without
waivers and reimbursements | |
| | | | | | |
| | | | | | |
| | | | | | |
| | | | | | |
| | | | | | |
| | | | | | |
| | | | | | |
| | | | | | |
| | | | | | |
| | | | | | |
| | | | | | |
| | | | | | |
| | | | | | |
| | | | | | |
| | | | | | |
| | | | | | |
| | | | | | |
| | | | | | |
| | | | | | |
| | | | | | |
| | | | | | |
| | | | | | |
| | | | | | |
| | | | | | |
| | | | | | |
| | | | | | |
| | | | | | |
| | | | | | |
| | | | | | |
| | | | | | |
| | | | | | |
| | | | | | |
| | | | | | |
| | | | | | |
| | | | | | |
| | | | | | |
| | | | | | |
| | | | | | |
| | | | | | |
| | | | | | |
| | | | | | |
| | | | | | |
| | | | | | |
SEE NOTES TO FINANCIAL STATEMENTS.
| J.P. Morgan Small Cap Funds | |
FINANCIAL HIGHLIGHTSFOR THE PERIODS INDICATED (continued)
| Per share operating performance |
| | | |
| Net asset
value,
beginning
of period | Net
investment
income
(loss)(b) | Net realized
and unrealized
gains
(losses) on
investments | Total from
investment
operations | | | |
JPMorgan Small Cap Equity Fund (continued) | | | | | | | |
| | | | | | | |
Six Months Ended December 31, 2023 (Unaudited) | | | | | | | |
| | | | | | | |
| | | | | | | |
| | | | | | | |
| | | | | | | |
| | | | | | | |
| | | | | | | |
Six Months Ended December 31, 2023 (Unaudited) | | | | | | | |
| | | | | | | |
| | | | | | | |
| | | | | | | |
| | | | | | | |
| | | | | | | |
|
| Annualized for periods less than one year, unless otherwise noted. |
| Calculated based upon average shares outstanding. |
| Not annualized for periods less than one year. |
| Includes adjustments in accordance with accounting principles generally accepted in the United States of America and as such, the net asset values for financial reporting purposes and the returns based upon those net asset values may differ from the net asset values and returns for shareholder transactions. |
| Includes interest expense, if applicable, each of which is less than 0.005% unless otherwise noted. |
| Amount rounds to less than $0.005. |
| Amount rounds to less than 0.005%. |
SEE NOTES TO FINANCIAL STATEMENTS.
| J.P. Morgan Small Cap Funds | |
| |
| | | Ratios to average net assets(a) |
Net asset
value,
end of
period | Total return
(excludes
sales charge)(c)(d) | Net assets,
end of
period
(000's) | | Net
investment
income
(loss) | Expenses without
waivers and reimbursements | |
|
| | | | | | |
| | | | | | |
| | | | | | |
| | | | | | |
| | | | | | |
| | | | | | |
| | | | | | |
| | | | | | |
| | | | | | |
| | | | | | |
| | | | | | |
| | | | | | |
| | | | | | |
| | | | | | |
SEE NOTES TO FINANCIAL STATEMENTS.
| J.P. Morgan Small Cap Funds | |
FINANCIAL HIGHLIGHTSFOR THE PERIODS INDICATED
| Per share operating performance |
| | | |
| Net asset
value,
beginning
of period | Net
investment
income
(loss)(b) | Net realized
and unrealized
gains
(losses) on
investments | Total from
investment
operations | | | |
JPMorgan Small Cap Growth Fund | | | | | | | |
| | | | | | | |
Six Months Ended December 31, 2023 (Unaudited) | | | | | | | |
| | | | | | | |
| | | | | | | |
| | | | | | | |
| | | | | | | |
| | | | | | | |
| | | | | | | |
Six Months Ended December 31, 2023 (Unaudited) | | | | | | | |
| | | | | | | |
| | | | | | | |
| | | | | | | |
| | | | | | | |
| | | | | | | |
| | | | | | | |
Six Months Ended December 31, 2023 (Unaudited) | | | | | | | |
| | | | | | | |
| | | | | | | |
| | | | | | | |
| | | | | | | |
| | | | | | | |
| | | | | | | |
Six Months Ended December 31, 2023 (Unaudited) | | | | | | | |
| | | | | | | |
| | | | | | | |
| | | | | | | |
| | | | | | | |
| | | | | | | |
| | | | | | | |
Six Months Ended December 31, 2023 (Unaudited) | | | | | | | |
| | | | | | | |
| | | | | | | |
| | | | | | | |
| | | | | | | |
| | | | | | | |
| | | | | | | |
Six Months Ended December 31, 2023 (Unaudited) | | | | | | | |
| | | | | | | |
| | | | | | | |
| | | | | | | |
| | | | | | | |
| | | | | | | |
SEE NOTES TO FINANCIAL STATEMENTS.
| J.P. Morgan Small Cap Funds | |
| |
| | | Ratios to average net assets(a) |
Net asset
value,
end of
period | Total return
(excludes
sales charge)(c)(d) | Net assets,
end of
period
(000's) | | Net
investment
income
(loss) | Expenses without
waivers and reimbursements | |
| | | | | | |
| | | | | | |
| | | | | | |
| | | | | | |
| | | | | | |
| | | | | | |
| | | | | | |
| | | | | | |
| | | | | | |
| | | | | | |
| | | | | | |
| | | | | | |
| | | | | | |
| | | | | | |
| | | | | | |
| | | | | | |
| | | | | | |
| | | | | | |
| | | | | | |
| | | | | | |
| | | | | | |
| | | | | | |
| | | | | | |
| | | | | | |
| | | | | | |
| | | | | | |
| | | | | | |
| | | | | | |
| | | | | | |
| | | | | | |
| | | | | | |
| | | | | | |
| | | | | | |
| | | | | | |
| | | | | | |
| | | | | | |
| | | | | | |
| | | | | | |
| | | | | | |
| | | | | | |
| | | | | | |
| | | | | | |
| | | | | | |
SEE NOTES TO FINANCIAL STATEMENTS.
| J.P. Morgan Small Cap Funds | |
FINANCIAL HIGHLIGHTSFOR THE PERIODS INDICATED (continued)
| Per share operating performance |
| | | |
| Net asset
value,
beginning
of period | Net
investment
income
(loss)(b) | Net realized
and unrealized
gains
(losses) on
investments | Total from
investment
operations | | | |
JPMorgan Small Cap Growth Fund (continued) | | | | | | | |
| | | | | | | |
Six Months Ended December 31, 2023 (Unaudited) | | | | | | | |
| | | | | | | |
| | | | | | | |
| | | | | | | |
| | | | | | | |
| | | | | | | |
| | | | | | | |
Six Months Ended December 31, 2023 (Unaudited) | | | | | | | |
| | | | | | | |
| | | | | | | |
| | | | | | | |
| | | | | | | |
| | | | | | | |
| | | | | | | |
Six Months Ended December 31, 2023 (Unaudited) | | | | | | | |
| | | | | | | |
| | | | | | | |
| | | | | | | |
| | | | | | | |
| | | | | | | |
|
| Annualized for periods less than one year, unless otherwise noted. |
| Calculated based upon average shares outstanding. |
| Not annualized for periods less than one year. |
| Includes adjustments in accordance with accounting principles generally accepted in the United States of America and as such, the net asset values for financial reporting purposes and the returns based upon those net asset values may differ from the net asset values and returns for shareholder transactions. |
| Includes interest expense, if applicable, each of which is less than 0.005% unless otherwise noted. |
SEE NOTES TO FINANCIAL STATEMENTS.
| J.P. Morgan Small Cap Funds | |
| |
| | | Ratios to average net assets(a) |
Net asset
value,
end of
period | Total return
(excludes
sales charge)(c)(d) | Net assets,
end of
period
(000's) | | Net
investment
income
(loss) | Expenses without
waivers and reimbursements | |
|
| | | | | | |
| | | | | | |
| | | | | | |
| | | | | | |
| | | | | | |
| | | | | | |
| | | | | | |
| | | | | | |
| | | | | | |
| | | | | | |
| | | | | | |
| | | | | | |
| | | | | | |
| | | | | | |
| | | | | | |
| | | | | | |
| | | | | | |
| | | | | | |
| | | | | | |
| | | | | | |
| | | | | | |
SEE NOTES TO FINANCIAL STATEMENTS.
| J.P. Morgan Small Cap Funds | |
FINANCIAL HIGHLIGHTSFOR THE PERIODS INDICATED
| Per share operating performance |
| | | |
| Net asset
value,
beginning
of period | Net
investment
income
(loss)(b) | Net realized
and unrealized
gains
(losses) on
investments | Total from
investment
operations | | | |
JPMorgan Small Cap Sustainable Leaders Fund | | | | | | | |
| | | | | | | |
Six Months Ended December 31, 2023 (Unaudited) | | | | | | | |
| | | | | | | |
| | | | | | | |
| | | | | | | |
| | | | | | | |
| | | | | | | |
| | | | | | | |
Six Months Ended December 31, 2023 (Unaudited) | | | | | | | |
| | | | | | | |
| | | | | | | |
| | | | | | | |
| | | | | | | |
| | | | | | | |
| | | | | | | |
Six Months Ended December 31, 2023 (Unaudited) | | | | | | | |
| | | | | | | |
| | | | | | | |
| | | | | | | |
| | | | | | | |
| | | | | | | |
| | | | | | | |
Six Months Ended December 31, 2023 (Unaudited) | | | | | | | |
| | | | | | | |
| | | | | | | |
| | | | | | | |
| | | | | | | |
| | | | | | | |
| | | | | | | |
Six Months Ended December 31, 2023 (Unaudited) | | | | | | | |
| | | | | | | |
| | | | | | | |
| | | | | | | |
| | | | | | | |
| | | | | | | |
| | | | | | | |
Six Months Ended December 31, 2023 (Unaudited) | | | | | | | |
| | | | | | | |
| | | | | | | |
| | | | | | | |
| | | | | | | |
| | | | | | | |
SEE NOTES TO FINANCIAL STATEMENTS.
| J.P. Morgan Small Cap Funds | |
| |
| | | Ratios to average net assets(a) |
Net asset
value,
end of
period | Total return
(excludes
sales charge)(c)(d) | Net assets,
end of
period
(000's) | | Net
investment
income
(loss) | Expenses without
waivers and reimbursements | |
| | | | | | |
| | | | | | |
| | | | | | |
| | | | | | |
| | | | | | |
| | | | | | |
| | | | | | |
| | | | | | |
| | | | | | |
| | | | | | |
| | | | | | |
| | | | | | |
| | | | | | |
| | | | | | |
| | | | | | |
| | | | | | |
| | | | | | |
| | | | | | |
| | | | | | |
| | | | | | |
| | | | | | |
| | | | | | |
| | | | | | |
| | | | | | |
| | | | | | |
| | | | | | |
| | | | | | |
| | | | | | |
| | | | | | |
| | | | | | |
| | | | | | |
| | | | | | |
| | | | | | |
| | | | | | |
| | | | | | |
| | | | | | |
| | | | | | |
| | | | | | |
| | | | | | |
| | | | | | |
| | | | | | |
| | | | | | |
| | | | | | |
SEE NOTES TO FINANCIAL STATEMENTS.
| J.P. Morgan Small Cap Funds | |
FINANCIAL HIGHLIGHTSFOR THE PERIODS INDICATED (continued)
| Per share operating performance |
| | | |
| Net asset
value,
beginning
of period | Net
investment
income
(loss)(b) | Net realized
and unrealized
gains
(losses) on
investments | Total from
investment
operations | | | |
JPMorgan Small Cap Sustainable Leaders Fund (continued) | | | | | | | |
| | | | | | | |
Six Months Ended December 31, 2023 (Unaudited) | | | | | | | |
| | | | | | | |
| | | | | | | |
| | | | | | | |
| | | | | | | |
| | | | | | | |
| | | | | | | |
Six Months Ended December 31, 2023 (Unaudited) | | | | | | | |
| | | | | | | |
| | | | | | | |
| | | | | | | |
| | | | | | | |
| | | | | | | |
|
| Annualized for periods less than one year, unless otherwise noted. |
| Calculated based upon average shares outstanding. |
| Not annualized for periods less than one year. |
| Includes adjustments in accordance with accounting principles generally accepted in the United States of America and as such, the net asset values for financial reporting purposes and the returns based upon those net asset values may differ from the net asset values and returns for shareholder transactions. |
| Includes interest expense, if applicable, each of which is less than 0.005% unless otherwise noted. |
| Amount rounds to less than $0.005. |
SEE NOTES TO FINANCIAL STATEMENTS.
| J.P. Morgan Small Cap Funds | |
| |
| | | Ratios to average net assets(a) |
Net asset
value,
end of
period | Total return
(excludes
sales charge)(c)(d) | Net assets,
end of
period
(000's) | | Net
investment
income
(loss) | Expenses without
waivers and reimbursements | |
|
| | | | | | |
| | | | | | |
| | | | | | |
| | | | | | |
| | | | | | |
| | | | | | |
| | | | | | |
| | | | | | |
| | | | | | |
| | | | | | |
| | | | | | |
| | | | | | |
| | | | | | |
| | | | | | |
SEE NOTES TO FINANCIAL STATEMENTS.
| J.P. Morgan Small Cap Funds | |
FINANCIAL HIGHLIGHTSFOR THE PERIODS INDICATED
| Per share operating performance |
| | | |
| Net asset
value,
beginning
of period | Net
investment
income
(loss)(b) | Net realized
and unrealized
gains
(losses) on
investments | Total from
investment
operations | | | |
JPMorgan Small Cap Value Fund | | | | | | | |
| | | | | | | |
Six Months Ended December 31, 2023 (Unaudited) | | | | | | | |
| | | | | | | |
| | | | | | | |
| | | | | | | |
| | | | | | | |
| | | | | | | |
| | | | | | | |
Six Months Ended December 31, 2023 (Unaudited) | | | | | | | |
| | | | | | | |
| | | | | | | |
| | | | | | | |
| | | | | | | |
| | | | | | | |
| | | | | | | |
Six Months Ended December 31, 2023 (Unaudited) | | | | | | | |
| | | | | | | |
| | | | | | | |
| | | | | | | |
| | | | | | | |
| | | | | | | |
| | | | | | | |
Six Months Ended December 31, 2023 (Unaudited) | | | | | | | |
| | | | | | | |
| | | | | | | |
| | | | | | | |
| | | | | | | |
| | | | | | | |
| | | | | | | |
Six Months Ended December 31, 2023 (Unaudited) | | | | | | | |
| | | | | | | |
| | | | | | | |
| | | | | | | |
| | | | | | | |
| | | | | | | |
| | | | | | | |
Six Months Ended December 31, 2023 (Unaudited) | | | | | | | |
| | | | | | | |
| | | | | | | |
| | | | | | | |
| | | | | | | |
| | | | | | | |
SEE NOTES TO FINANCIAL STATEMENTS.
| J.P. Morgan Small Cap Funds | |
| |
| | | Ratios to average net assets(a) |
Net asset
value,
end of
period | Total return
(excludes
sales charge)(c)(d) | Net assets,
end of
period
(000's) | | Net
investment
income
(loss) | Expenses without
waivers and reimbursements | |
| | | | | | |
| | | | | | |
| | | | | | |
| | | | | | |
| | | | | | |
| | | | | | |
| | | | | | |
| | | | | | |
| | | | | | |
| | | | | | |
| | | | | | |
| | | | | | |
| | | | | | |
| | | | | | |
| | | | | | |
| | | | | | |
| | | | | | |
| | | | | | |
| | | | | | |
| | | | | | |
| | | | | | |
| | | | | | |
| | | | | | |
| | | | | | |
| | | | | | |
| | | | | | |
| | | | | | |
| | | | | | |
| | | | | | |
| | | | | | |
| | | | | | |
| | | | | | |
| | | | | | |
| | | | | | |
| | | | | | |
| | | | | | |
| | | | | | |
| | | | | | |
| | | | | | |
| | | | | | |
| | | | | | |
| | | | | | |
| | | | | | |
SEE NOTES TO FINANCIAL STATEMENTS.
| J.P. Morgan Small Cap Funds | |
FINANCIAL HIGHLIGHTSFOR THE PERIODS INDICATED (continued)
| Per share operating performance |
| | | |
| Net asset
value,
beginning
of period | Net
investment
income
(loss)(b) | Net realized
and unrealized
gains
(losses) on
investments | Total from
investment
operations | | | |
JPMorgan Small Cap Value Fund (continued) | | | | | | | |
| | | | | | | |
Six Months Ended December 31, 2023 (Unaudited) | | | | | | | |
| | | | | | | |
| | | | | | | |
| | | | | | | |
| | | | | | | |
| | | | | | | |
| | | | | | | |
Six Months Ended December 31, 2023 (Unaudited) | | | | | | | |
| | | | | | | |
| | | | | | | |
| | | | | | | |
| | | | | | | |
| | | | | | | |
|
| Annualized for periods less than one year, unless otherwise noted. |
| Calculated based upon average shares outstanding. |
| Not annualized for periods less than one year. |
| Includes adjustments in accordance with accounting principles generally accepted in the United States of America and as such, the net asset values for financial reporting purposes and the returns based upon those net asset values may differ from the net asset values and returns for shareholder transactions. |
| Includes interest expense, if applicable, each of which is less than 0.005% unless otherwise noted. |
SEE NOTES TO FINANCIAL STATEMENTS.
| J.P. Morgan Small Cap Funds | |
| |
| | | Ratios to average net assets(a) |
Net asset
value,
end of
period | Total return
(excludes
sales charge)(c)(d) | Net assets,
end of
period
(000's) | | Net
investment
income
(loss) | Expenses without
waivers and reimbursements | |
|
| | | | | | |
| | | | | | |
| | | | | | |
| | | | | | |
| | | | | | |
| | | | | | |
| | | | | | |
| | | | | | |
| | | | | | |
| | | | | | |
| | | | | | |
| | | | | | |
| | | | | | |
| | | | | | |
SEE NOTES TO FINANCIAL STATEMENTS.
| J.P. Morgan Small Cap Funds | |
FINANCIAL HIGHLIGHTSFOR THE PERIODS INDICATED
| Per share operating performance |
| | | |
| Net asset
value,
beginning
of period | Net
investment
income
(loss)(b) | Net realized
and unrealized
gains
(losses) on
investments | Total from
investment
operations | | | |
JPMorgan SMID Cap Equity Fund | | | | | | | |
| | | | | | | |
Six Months Ended December 31, 2023 (Unaudited) | | | | | | | |
| | | | | | | |
| | | | | | | |
| | | | | | | |
| | | | | | | |
| | | | | | | |
| | | | | | | |
Six Months Ended December 31, 2023 (Unaudited) | | | | | | | |
| | | | | | | |
| | | | | | | |
| | | | | | | |
| | | | | | | |
| | | | | | | |
| | | | | | | |
Six Months Ended December 31, 2023 (Unaudited) | | | | | | | |
| | | | | | | |
| | | | | | | |
| | | | | | | |
| | | | | | | |
| | | | | | | |
| | | | | | | |
Six Months Ended December 31, 2023 (Unaudited) | | | | | | | |
| | | | | | | |
| | | | | | | |
| | | | | | | |
| | | | | | | |
| | | | | | | |
| | | | | | | |
Six Months Ended December 31, 2023 (Unaudited) | | | | | | | |
| | | | | | | |
| | | | | | | |
| | | | | | | |
| | | | | | | |
| | | | | | | |
SEE NOTES TO FINANCIAL STATEMENTS.
| J.P. Morgan Small Cap Funds | |
| |
| | | Ratios to average net assets(a) |
Net asset
value,
end of
period | Total return
(excludes
sales charge)(c)(d) | Net assets,
end of
period
(000's) | | Net
investment
income
(loss) | Expenses without
waivers and reimbursements | |
| | | | | | |
| | | | | | |
| | | | | | |
| | | | | | |
| | | | | | |
| | | | | | |
| | | | | | |
| | | | | | |
| | | | | | |
| | | | | | |
| | | | | | |
| | | | | | |
| | | | | | |
| | | | | | |
| | | | | | |
| | | | | | |
| | | | | | |
| | | | | | |
| | | | | | |
| | | | | | |
| | | | | | |
| | | | | | |
| | | | | | |
| | | | | | |
| | | | | | |
| | | | | | |
| | | | | | |
| | | | | | |
| | | | | | |
| | | | | | |
| | | | | | |
| | | | | | |
| | | | | | |
| | | | | | |
| | | | | | |
| | | | | | |
SEE NOTES TO FINANCIAL STATEMENTS.
| J.P. Morgan Small Cap Funds | |
FINANCIAL HIGHLIGHTSFOR THE PERIODS INDICATED (continued)
| Per share operating performance |
| | | |
| Net asset
value,
beginning
of period | Net
investment
income
(loss)(b) | Net realized
and unrealized
gains
(losses) on
investments | Total from
investment
operations | | | |
JPMorgan SMID Cap Equity Fund (continued) | | | | | | | |
| | | | | | | |
Six Months Ended December 31, 2023 (Unaudited) | | | | | | | |
| | | | | | | |
| | | | | | | |
| | | | | | | |
| | | | | | | |
| | | | | | | |
|
| Annualized for periods less than one year, unless otherwise noted. |
| Calculated based upon average shares outstanding. |
| Not annualized for periods less than one year. |
| Includes adjustments in accordance with accounting principles generally accepted in the United States of America and as such, the net asset values for financial reporting purposes and the returns based upon those net asset values may differ from the net asset values and returns for shareholder transactions. |
| Includes interest expense, if applicable, each of which is less than 0.005% unless otherwise noted. |
| Amount rounds to less than $0.005. |
| Amount rounds to less than 0.005%. |
SEE NOTES TO FINANCIAL STATEMENTS.
| J.P. Morgan Small Cap Funds | |
| |
| | | Ratios to average net assets(a) |
Net asset
value,
end of
period | Total return
(excludes
sales charge)(c)(d) | Net assets,
end of
period
(000's) | | Net
investment
income
(loss) | Expenses without
waivers and reimbursements | |
|
| | | | | | |
| | | | | | |
| | | | | | |
| | | | | | |
| | | | | | |
| | | | | | |
| | | | | | |
SEE NOTES TO FINANCIAL STATEMENTS.
| J.P. Morgan Small Cap Funds | |
FINANCIAL HIGHLIGHTSFOR THE PERIODS INDICATED
| Per share operating performance |
| | | |
| Net asset
value,
beginning
of period | Net
investment
income
(loss)(b) | Net realized
and unrealized
gains
(losses) on
investments | Total from
investment
operations | | | |
JPMorgan U.S. Small Company Fund | | | | | | | |
| | | | | | | |
Six Months Ended December 31, 2023 (Unaudited) | | | | | | | |
| | | | | | | |
| | | | | | | |
| | | | | | | |
| | | | | | | |
| | | | | | | |
| | | | | | | |
Six Months Ended December 31, 2023 (Unaudited) | | | | | | | |
| | | | | | | |
| | | | | | | |
| | | | | | | |
| | | | | | | |
| | | | | | | |
| | | | | | | |
Six Months Ended December 31, 2023 (Unaudited) | | | | | | | |
| | | | | | | |
| | | | | | | |
| | | | | | | |
| | | | | | | |
| | | | | | | |
| | | | | | | |
Six Months Ended December 31, 2023 (Unaudited) | | | | | | | |
| | | | | | | |
| | | | | | | |
| | | | | | | |
| | | | | | | |
| | | | | | | |
| | | | | | | |
Six Months Ended December 31, 2023 (Unaudited) | | | | | | | |
| | | | | | | |
| | | | | | | |
| | | | | | | |
| | | | | | | |
| | | | | | | |
| | | | | | | |
Six Months Ended December 31, 2023 (Unaudited) | | | | | | | |
| | | | | | | |
| | | | | | | |
| | | | | | | |
| | | | | | | |
| | | | | | | |
SEE NOTES TO FINANCIAL STATEMENTS.
| J.P. Morgan Small Cap Funds | |
| |
| | | Ratios to average net assets(a) |
Net asset
value,
end of
period | Total return
(excludes
sales charge)(c)(d) | Net assets,
end of
period
(000's) | | Net
investment
income
(loss) | Expenses without
waivers and reimbursements | |
| | | | | | |
| | | | | | |
| | | | | | |
| | | | | | |
| | | | | | |
| | | | | | |
| | | | | | |
| | | | | | |
| | | | | | |
| | | | | | |
| | | | | | |
| | | | | | |
| | | | | | |
| | | | | | |
| | | | | | |
| | | | | | |
| | | | | | |
| | | | | | |
| | | | | | |
| | | | | | |
| | | | | | |
| | | | | | |
| | | | | | |
| | | | | | |
| | | | | | |
| | | | | | |
| | | | | | |
| | | | | | |
| | | | | | |
| | | | | | |
| | | | | | |
| | | | | | |
| | | | | | |
| | | | | | |
| | | | | | |
| | | | | | |
| | | | | | |
| | | | | | |
| | | | | | |
| | | | | | |
| | | | | | |
| | | | | | |
| | | | | | |
SEE NOTES TO FINANCIAL STATEMENTS.
| J.P. Morgan Small Cap Funds | |
FINANCIAL HIGHLIGHTSFOR THE PERIODS INDICATED (continued)
| Per share operating performance |
| | | |
| Net asset
value,
beginning
of period | Net
investment
income
(loss)(b) | Net realized
and unrealized
gains
(losses) on
investments | Total from
investment
operations | | | |
JPMorgan U.S. Small Company Fund (continued) | | | | | | | |
| | | | | | | |
Six Months Ended December 31, 2023 (Unaudited) | | | | | | | |
| | | | | | | |
| | | | | | | |
| | | | | | | |
| | | | | | | |
| | | | | | | |
| | | | | | | |
Six Months Ended December 31, 2023 (Unaudited) | | | | | | | |
| | | | | | | |
| | | | | | | |
| | | | | | | |
| | | | | | | |
| | | | | | | |
| | | | | | | |
Six Months Ended December 31, 2023 (Unaudited) | | | | | | | |
| | | | | | | |
| | | | | | | |
| | | | | | | |
| | | | | | | |
| | | | | | | |
|
| Annualized for periods less than one year, unless otherwise noted. |
| Calculated based upon average shares outstanding. |
| Not annualized for periods less than one year. |
| Includes adjustments in accordance with accounting principles generally accepted in the United States of America and as such, the net asset values for financial reporting purposes and the returns based upon those net asset values may differ from the net asset values and returns for shareholder transactions. |
| Includes interest expense, if applicable, each of which is less than 0.005% unless otherwise noted. |
| Amount rounds to less than $0.005. |
SEE NOTES TO FINANCIAL STATEMENTS.
| J.P. Morgan Small Cap Funds | |
| |
| | | Ratios to average net assets(a) |
Net asset
value,
end of
period | Total return
(excludes
sales charge)(c)(d) | Net assets,
end of
period
(000's) | | Net
investment
income
(loss) | Expenses without
waivers and reimbursements | |
|
| | | | | | |
| | | | | | |
| | | | | | |
| | | | | | |
| | | | | | |
| | | | | | |
| | | | | | |
| | | | | | |
| | | | | | |
| | | | | | |
| | | | | | |
| | | | | | |
| | | | | | |
| | | | | | |
| | | | | | |
| | | | | | |
| | | | | | |
| | | | | | |
| | | | | | |
| | | | | | |
| | | | | | |
SEE NOTES TO FINANCIAL STATEMENTS.
| J.P. Morgan Small Cap Funds | |
NOTES TO FINANCIAL STATEMENTSAS OF December 31, 2023 (Unaudited)
(Dollar values in thousands)
1. Organization
JPMorgan Trust I (“JPM I") and JPMorgan Trust II (“JPM II") (collectively, the “Trusts”) were formed on November 12, 2004, as Delaware statutory trusts, pursuant to Declarations of Trust dated November 5, 2004 and are registered under the Investment Company Act of 1940, as amended (the “1940 Act”), as open-end management investment companies.
The following are 7 separate funds of the Trusts (each, a "Fund" and collectively, the "Funds") covered by this report:
| | | Diversification Classification |
JPMorgan Small Cap Blend Fund | Class A, Class C, Class I and Class R6 | | |
JPMorgan Small Cap Equity Fund | Class A, Class C, Class I, Class R2, Class R3, Class R4, Class R5 and Class R6 | | |
JPMorgan Small Cap Growth Fund | Class A, Class C, Class I, Class L, Class R2, Class R3, Class R4, Class R5 and Class R6 | | |
JPMorgan Small Cap Sustainable Leaders Fund | Class A, Class C, Class I, Class R2, Class R3, Class R4, Class R5 and Class R6 | | |
JPMorgan Small Cap Value Fund | Class A, Class C, Class I, Class R2, Class R3, Class R4, Class R5 and Class R6 | | |
JPMorgan SMID Cap Equity Fund | Class A, Class C, Class I, Class R3, Class R4 and Class R6 | | |
JPMorgan U.S. Small Company Fund | Class A, Class C, Class I, Class L, Class R2, Class R3, Class R4, Class R5 and Class R6 | | |
The investment objective of JPMorgan Small Cap Blend Fund (“Small Cap Blend Fund”), JPMorgan Small Cap Equity Fund (“Small Cap Equity Fund”) and JPMorgan Small Cap Sustainable Leaders Fund (“Small Cap Sustainable Leaders Fund”) is to seek capital growth over the long term.
The investment objective of JPMorgan Small Cap Growth Fund (“Small Cap Growth Fund”) is to seek long-term capital growth primarily by investing in a portfolio of equity securities of small-capitalization and emerging growth companies.
The investment objective of JPMorgan Small Cap Value Fund (“Small Cap Value Fund”) is to seek long-term capital growth primarily by investing in equity securities of small-capitalization companies.
The investment objective of JPMorgan SMID Cap Equity Fund (“SMID Cap Equity Fund”) is to seek long-term capital growth by investing primarily in equity securities of companies with intermediate capitalizations.
The investment objective of JPMorgan U.S. Small Company Fund (“U.S. Small Company Fund”) is to seek to provide high total return from a portfolio of small company stocks.
All share classes of Small Cap Growth Fund and Class L Shares of U.S. Small Company Fund are publicly offered on a limited basis. Investors are not eligible to purchase shares of Small Cap Growth Fund and Class L Shares of the U.S. Small Company Fund unless they meet certain requirements as described in the Small Cap Growth Fund's and U.S. Small Company Fund's prospectuses.
Prior to October, 28, 2022, share classes of Small Cap Equity Fund were publicly offered on a limited basis. Investors were not eligible to purchase shares of the Small Cap Equity Fund unless they met certain requirements as described in the Small Cap Equity Fund's prospectus.
Class A Shares generally provide for a front-end sales charge while Class C Shares provide for a contingent deferred sales charge ("CDSC"). No sales charges are assessed with respect to Class I, Class L, Class R2, Class R3, Class R4, Class R5 and Class R6 Shares. Certain Class A Shares, for which front-end sales charges have been waived, may be subject to a CDSC as described in the Funds' prospectus. Class C Shares automatically convert to Class A Shares after eight years. All classes of shares have equal rights as to earnings, assets and voting privileges, except that each class may bear different transfer agency, distribution and service fees and each class has exclusive voting rights with respect to its distribution plan and shareholder servicing agreements.
J.P. Morgan Investment Management Inc. (“JPMIM”), an indirect, wholly-owned subsidiary of JPMorgan Chase & Co. (“JPMorgan”), acts as adviser (the “Adviser”) and administrator (the “Administrator”) to the Funds.
2. Significant Accounting Policies
The following is a summary of significant accounting policies followed by the Funds in the preparation of their financial statements. The Funds are investment companies and, accordingly, follow the investment company accounting and reporting guidance of the Financial Accounting Standards Board (“FASB”) Accounting Standards Codification Topic 946 — Investment Companies, which is part of U.S. generally accepted accounting principles (“GAAP”). The preparation of financial statements in conformity with GAAP requires management to make estimates and assumptions that affect (i) the reported amounts of assets and liabilities, (ii) disclosure of contingent assets and liabilities at the date of the financial statements, and (iii) the reported amounts of increases and decreases in net assets from operations during the reporting period. Actual results could differ from those estimates.
| J.P. Morgan Small Cap Funds | |
A. Valuation of Investments — Investments are valued in accordance with GAAP and the Funds' valuation policies set forth by, and under the supervision and responsibility of, the Boards of Trustees of the Trusts (the "Boards"), which established the following approach to valuation, as described more fully below: (i) investments for which market quotations are readily available shall be valued at their market value and (ii) all other investments for which market quotations are not readily available shall be valued at their fair value as determined in good faith by the Boards.
Under Section 2(a)(41) of the 1940 Act, the Boards are required to determine fair value for securities that do not have readily available market quotations. Under SEC Rule 2a-5 (Good Faith Determinations of Fair Value), the Boards may designate the performance of these fair valuation determinations to a valuation designee. The Boards have designated the Adviser as the “Valuation Designee” to perform fair valuation determinations for the Funds on behalf of the Boards subject to appropriate oversight by the Boards. The Adviser, as Valuation Designee, leverages the J.P. Morgan Asset Management Americas Valuation Committee (“AVC”) to help oversee and carry out the policies for the valuation of investments held in the Funds. The Adviser, as Valuation Designee, remains responsible for the valuation determinations.
This oversight by the AVC includes monitoring the appropriateness of fair values based on results of ongoing valuation oversight including, but not limited to, consideration of macro or security specific events, market events, and pricing vendor and broker due diligence. The Administrator is responsible for discussing and assessing the potential impacts to the fair values on an ongoing basis, and, at least on a quarterly basis, with the AVC and the Boards.
A market-based approach is primarily used to value the Funds' investments. Investments for which market quotations are not readily available are fair valued using prices supplied by approved affiliated and/or unaffiliated pricing vendors or third party broker-dealers (collectively referred to as “Pricing Services”) or may be internally fair valued using methods set forth by the valuation policies approved by the Boards. This may include the use of related or comparable assets or liabilities, recent transactions, market multiples, book values and other relevant information for the investment. An income-based valuation approach may be used in which the anticipated future cash flows of the investment are discounted to calculate the fair value. Discounts may also be applied due to the nature or duration of any restrictions on the disposition of the investments. Valuations may be based upon current market prices of securities that are comparable in coupon, rating, maturity and industry. It is possible that the estimated values may differ significantly from the values that would have been used had a ready market for the investments existed, and such differences could be material.
Equities and other exchange-traded instruments are valued at the last sale price or official market closing price on the primary exchange on which the instrument is traded before the net asset values (“NAV”) of the Funds are calculated on a valuation date.
Investments in open-end investment companies (“Underlying Funds”) are valued at each Underlying Fund’s NAV per share as of the report date.
Futures contracts and options are generally valued on the basis of available market quotations.
Valuations reflected in this report are as of the report date. As a result, changes in valuation due to market events and/or issuer-related events after the report date and prior to issuance of the report are not reflected herein.
The various inputs that are used in determining the valuation of the Funds' investments are summarized into the three broad levels listed below.
•
Level 1 — Unadjusted inputs using quoted prices in active markets for identical investments.
•
Level 2 — Other significant observable inputs including, but not limited to, quoted prices for similar investments, inputs other than quoted prices that are observable for investments (such as interest rates, prepayment speeds, credit risk, etc.) or other market corroborated inputs.
•
Level 3 — Significant inputs based on the best information available in the circumstances, to the extent observable inputs are not available (including the Funds' assumptions in determining the fair value of investments).
A financial instrument’s level within the fair value hierarchy is based on the lowest level of any input, both individually and in the aggregate, that is significant to the fair value measurement. The inputs or methodology used for valuing instruments are not necessarily an indication of the risk associated with investing in those instruments.
The following tables represent each valuation input as presented on the Schedules of Portfolio Investments ("SOIs"):
| | | | |
| | Level 2
Other significant
observable inputs | Level 3
Significant
unobservable inputs | |
Total Investments in Securities (a) | | | | |
|
| Please refer to the SOI for specifics of portfolio holdings. |
| J.P. Morgan Small Cap Funds | |
NOTES TO FINANCIAL STATEMENTSAS OF December 31, 2023 (Unaudited) (continued)
(Dollar values in thousands)
| | | | |
| | Level 2
Other significant
observable inputs | Level 3
Significant
unobservable inputs | |
Total Investments in Securities (a) | | | | |
|
| Please refer to the SOI for specifics of portfolio holdings. |
| | | | |
| | Level 2
Other significant
observable inputs | Level 3
Significant
unobservable inputs | |
Total Investments in Securities (a) | | | | |
|
| Please refer to the SOI for specifics of portfolio holdings. |
Small Cap Sustainable Leaders Fund | | | | |
| | Level 2
Other significant
observable inputs | Level 3
Significant
unobservable inputs | |
Investments in Securities | | | | |
| | | | |
| | | | |
| | | | |
| | | | |
Total Investments in Securities | | | | |
|
| Amount rounds to less than one thousand. |
| | | | |
| | Level 2
Other significant
observable inputs | Level 3
Significant
unobservable inputs | |
Total Investments in Securities (a) | | | | |
Appreciation in Other Financial Instruments | | | | |
| | | | |
|
| Please refer to the SOI for specifics of portfolio holdings. |
| | | | |
| | Level 2
Other significant
observable inputs | Level 3
Significant
unobservable inputs | |
Total Investments in Securities (a) | | | | |
|
| Please refer to the SOI for specifics of portfolio holdings. |
| J.P. Morgan Small Cap Funds | |
| | | | |
| | Level 2
Other significant
observable inputs | Level 3
Significant
unobservable inputs | |
Investments in Securities | | | | |
| | | | |
| | | | |
| | | | |
| | | | |
| | | | |
| | | | |
| | | | |
| | | | |
| | | | |
| | | | |
| | | | |
Commercial Services & Supplies | | | | |
| | | | |
Construction & Engineering | | | | |
| | | | |
| | | | |
Consumer Staples Distribution & Retail | | | | |
| | | | |
Diversified Consumer Services | | | | |
| | | | |
Diversified Telecommunication Services | | | | |
| | | | |
| | | | |
Electronic Equipment, Instruments & Components | | | | |
Energy Equipment & Services | | | | |
| | | | |
| | | | |
| | | | |
| | | | |
| | | | |
Health Care Equipment & Supplies | | | | |
Health Care Providers & Services | | | | |
| | | | |
| | | | |
| | | | |
Hotels, Restaurants & Leisure | | | | |
| | | | |
| | | | |
Independent Power and Renewable Electricity Producers | | | | |
| | | | |
| | | | |
Interactive Media & Services | | | | |
| | | | |
| | | | |
Life Sciences Tools & Services | | | | |
| | | | |
| | | | |
| | | | |
| J.P. Morgan Small Cap Funds | |
NOTES TO FINANCIAL STATEMENTSAS OF December 31, 2023 (Unaudited) (continued)
(Dollar values in thousands)
U.S. Small Company Fund (continued) | | | | |
| | Level 2 Other significant observable inputs | Level 3 Significant unobservable inputs | |
| | | | |
Mortgage Real Estate Investment Trusts (REITs) | | | | |
| | | | |
| | | | |
Oil, Gas & Consumable Fuels | | | | |
| | | | |
| | | | |
| | | | |
| | | | |
Real Estate Management & Development | | | | |
| | | | |
| | | | |
Semiconductors & Semiconductor Equipment | | | | |
| | | | |
| | | | |
| | | | |
Technology Hardware, Storage & Peripherals | | | | |
Textiles, Apparel & Luxury Goods | | | | |
Trading Companies & Distributors | | | | |
| | | | |
Wireless Telecommunication Services | | | | |
| | | | |
| | | | |
| | | | |
Investment of Cash Collateral from Securities Loaned | | | | |
Total Short-Term Investments | | | | |
Total Investments in Securities | | | | |
Appreciation in Other Financial Instruments | | | | |
| | | | |
|
| Amount rounds to less than one thousand. |
B. Restricted Securities — Certain securities held by the Funds may be subject to legal or contractual restrictions on resale. Restricted securities generally are resold in transactions exempt from registration under the Securities Act of 1933, as amended (the “Securities Act”). Disposal of these securities may involve time-consuming negotiations and expense. Prompt sale at the current valuation may be difficult and could adversely affect the NAVs of the Funds.
As of December 31, 2023, the Funds had no investments in restricted securities other than securities sold to the Funds under Rule 144A and/or Regulation S under the Securities Act.
| J.P. Morgan Small Cap Funds | |
C. Securities Lending — The Funds are authorized to engage in securities lending in order to generate additional income. The Funds are able to lend to approved borrowers. Citibank N.A. (“Citibank”) serves as lending agent for the Funds, pursuant to a Securities Lending Agency Agreement (the “Securities Lending Agency Agreement”). Securities loaned are collateralized by cash equal to at least 100% of the market value plus accrued interest on the securities lent, which is invested in the Class IM Shares of the JPMorgan U.S. Government Money Market Fund and the Agency SL Class Shares of the JPMorgan Securities Lending Money Market Fund. The Funds retain the interest earned on cash collateral investments but are required to pay the borrower a rebate for the use of the cash collateral. In cases where the lent security is of high value to borrowers, there may be a negative rebate (i.e., a net payment from the borrower to the Funds). Upon termination of a loan, the Funds are required to return to the borrower an amount equal to the cash collateral, plus any rebate owed to the borrowers. The remaining maturities of the securities lending transactions are considered overnight and continuous. Loans are subject to termination by the Funds or the borrower at any time.
The net income earned on the securities lending (after payment of rebates and Citibank’s fee) is included on the Statements of Operations as Income from securities lending (net). The Funds also receive payments from the borrower during the period of the loan, equivalent to dividends and interest earned on the securities loaned, which are recorded as Dividend or Interest income, respectively, on the Statements of Operations.
Under the Securities Lending Agency Agreement, Citibank marks to market the loaned securities on a daily basis. In the event the cash received from the borrower is less than 102% of the value of the loaned securities (105% for loans of non-U.S. securities), Citibank requests additional cash from the borrower so as to maintain a collateralization level of at least 102% of the value of the loaned securities plus accrued interest (105% for loans of non-U.S. securities), subject to certain de minimis amounts.
The value of securities out on loan is recorded as an asset on the Statements of Assets and Liabilities. The value of the cash collateral received is recorded as a liability on the Statements of Assets and Liabilities and details of collateral investments are disclosed on the SOIs.
The Funds bear the risk of loss associated with the collateral investments and are not entitled to additional collateral from the borrower to cover any such losses. To the extent that the value of the collateral investments declines below the amount owed to a borrower, the Funds may incur losses that exceed the amount they earned on lending the security. Upon termination of a loan, the Funds may use leverage (borrow money) to repay the borrower for cash collateral posted if the Adviser does not believe that it is prudent to sell the collateral investments to fund the payment of this liability. Securities lending activity is subject to master netting arrangements.
The following table presents for each lending Fund, the value of the securities on loan with Citibank, net of amounts available for offset under the master netting arrangements and any related collateral received or posted by the Funds as of December 31, 2023.
| Investment Securities
on Loan, at value,
Presented on the
Statements of Assets
and Liabilities | Cash Collateral
Posted by Borrower* | Net Amount Due
to Counterparty
(not less than zero) |
| | | |
| | | |
| | | |
| | | |
| | | |
|
| Collateral posted reflects the value of securities on loan and does not include any additional amounts received from the borrower. |
Securities lending also involves counterparty risks, including the risk that the loaned securities may not be returned in a timely manner or at all. Subject to certain conditions, Citibank has agreed to indemnify the Funds from losses resulting from a borrower’s failure to return a loaned security.
JPMIM voluntarily waived investment advisory fees charged to the Funds to reduce the impact of the cash collateral investment in the JPMorgan U.S. Government Money Market Fund from 0.13% to 0.06%. For the six months ended December 31, 2023, JPMIM waived fees associated with the Funds' investment in the JPMorgan U.S. Government Money Market Fund as follows:
|
| Amount rounds to less than one thousand. |
| J.P. Morgan Small Cap Funds | |
NOTES TO FINANCIAL STATEMENTSAS OF December 31, 2023 (Unaudited) (continued)
(Dollar values in thousands)
The above waiver is included in the determination of earnings on cash collateral investment and in the calculation of Citibank’s compensation and is included on the Statements of Operations as Income from securities lending (net).
Small Cap Sustainable Leaders Fund did not lend out any securities during the six months ended December 31, 2023.
D. Investment Transactions with Affiliates — The Funds invested in Underlying Funds advised by the Adviser. An issuer which is under common control with a Fund may be considered an affiliate. For the purposes of the financial statements, the Funds assume the issuers listed in the tables below to be affiliated issuers. The Underlying Funds’ distributions may be reinvested into such Underlying Funds. Reinvestment amounts are included in the purchases at cost amounts in the tables below.
|
For the six months ended December 31, 2023 |
| | | | | Change in
Unrealized
Appreciation/
(Depreciation) | | Shares at
December 31,
2023 | | Capital Gain
Distributions |
JPMorgan Prime Money Market Fund Class IM Shares, 5.51% (a) (b) | | | | | | | | | |
JPMorgan Securities Lending Money Market Fund Agency SL Class Shares, 5.56% (a) (b) | | | | | | | | | |
JPMorgan U.S. Government Money Market Fund Class IM Shares, 5.30% (a) (b) | | | | | | | | | |
| | | | | | | | | |
|
| Investment in an affiliated fund, which is registered under the Investment Company Act of 1940, as amended, and is advised by J.P. Morgan Investment Management Inc. |
| The rate shown is the current yield as of December 31, 2023. |
| Amount is included on the Statements of Operations as Income from securities lending (net) (after payments of rebates and Citibank’s fee). |
|
For the six months ended December 31, 2023 |
| | | | | Change in
Unrealized
Appreciation/
(Depreciation) | | Shares at
December 31,
2023 | | Capital Gain
Distributions |
JPMorgan Prime Money Market Fund Class IM Shares, 5.51% (a) (b) | | | | | | | | | |
| J.P. Morgan Small Cap Funds | |
Small Cap Growth Fund (continued) |
For the six months ended December 31, 2023 |
| | | | | Change in Unrealized Appreciation/ (Depreciation) | | Shares at December 31, 2023 | | Capital Gain Distributions |
JPMorgan Securities Lending Money Market Fund Agency SL Class Shares, 5.56% (a) (b) | | | | | | | | | |
JPMorgan U.S. Government Money Market Fund Class IM Shares, 5.30% (a) (b) | | | | | | | | | |
| | | | | | | | | |
|
| Investment in an affiliated fund, which is registered under the Investment Company Act of 1940, as amended, and is advised by J.P. Morgan Investment Management Inc. |
| The rate shown is the current yield as of December 31, 2023. |
| Amount is included on the Statements of Operations as Income from securities lending (net) (after payments of rebates and Citibank’s fee). |
Small Cap Sustainable Leaders Fund |
For the six months ended December 31, 2023 |
| | | | | Change in
Unrealized
Appreciation/
(Depreciation) | | Shares at
December 31,
2023 | | Capital Gain
Distributions |
JPMorgan Prime Money Market Fund Class IM Shares, 5.51% (a) (b) | | | | | | | | | |
|
| Investment in an affiliated fund, which is registered under the Investment Company Act of 1940, as amended, and is advised by J.P. Morgan Investment Management Inc. |
| The rate shown is the current yield as of December 31, 2023. |
| Amount rounds to less than one thousand. |
|
For the six months ended December 31, 2023 |
| | | | | Change in
Unrealized
Appreciation/
(Depreciation) | | Shares at
December 31,
2023 | | Capital Gain
Distributions |
JPMorgan Prime Money Market Fund Class IM Shares, 5.51% (a) (b) | | | | | | | | | |
JPMorgan Securities Lending Money Market Fund Agency SL Class Shares, 5.56% (a) (b) | | | | | | | | | |
JPMorgan U.S. Government Money Market Fund Class IM Shares, 5.30% (a) (b) | | | | | | | | | |
| | | | | | | | | |
|
| Investment in an affiliated fund, which is registered under the Investment Company Act of 1940, as amended, and is advised by J.P. Morgan Investment Management Inc. |
| The rate shown is the current yield as of December 31, 2023. |
| Amount is included on the Statements of Operations as Income from securities lending (net) (after payments of rebates and Citibank’s fee). |
| J.P. Morgan Small Cap Funds | |
NOTES TO FINANCIAL STATEMENTSAS OF December 31, 2023 (Unaudited) (continued)
(Dollar values in thousands)
|
For the six months ended December 31, 2023 |
| | | | | Change in
Unrealized
Appreciation/
(Depreciation) | | Shares at
December 31,
2023 | | Capital Gain
Distributions |
JPMorgan Prime Money Market Fund Class IM Shares, 5.51% (a) (b) | | | | | | | | | |
JPMorgan U.S. Government Money Market Fund Class IM Shares, 5.30% (a) (b) | | | | | | | | | |
| | | | | | | | | |
|
| Investment in an affiliated fund, which is registered under the Investment Company Act of 1940, as amended, and is advised by J.P. Morgan Investment Management Inc. |
| The rate shown is the current yield as of December 31, 2023. |
| Amount is included on the Statements of Operations as Income from securities lending (net) (after payments of rebates and Citibank’s fee). |
|
For the six months ended December 31, 2023 |
| | | | | Change in
Unrealized
Appreciation/
(Depreciation) | | Shares at
December 31,
2023 | | Capital Gain
Distributions |
JPMorgan Prime Money Market Fund Class IM Shares, 5.51% (a) (b) | | | | | | | | | |
JPMorgan Securities Lending Money Market Fund Agency SL Class Shares, 5.56% (a) (b) | | | | | | | | | |
JPMorgan U.S. Government Money Market Fund Class IM Shares, 5.30% (a) (b) | | | | | | | | | |
| | | | | | | | | |
|
| Investment in an affiliated fund, which is registered under the Investment Company Act of 1940, as amended, and is advised by J.P. Morgan Investment Management Inc. |
| The rate shown is the current yield as of December 31, 2023. |
| Amount is included on the Statements of Operations as Income from securities lending (net) (after payments of rebates and Citibank’s fee). |
E. Options— Small Cap Blend Fund purchased and sold (“wrote”) put and call options on various instruments including options on indices to manage and hedge interest rate risks within their portfolios and also to gain long or short exposure to the underlying instrument, index, currency or rate. A purchaser of a put option has the right, but not the obligation, to sell the underlying instrument at an agreed upon price (“strike price”) to the option seller. A purchaser of a call option has the right, but not the obligation, to purchase the underlying instrument at the strike price from the option seller.
Options Purchased — Premiums paid by the Fund for options purchased are included on the Statements of Assets and Liabilities as Options purchased. The option is adjusted daily to reflect the current market value of the option and the change is recorded as Change in net unrealized appreciation/depreciation on options purchased on the Statements of Operations. If the option is allowed to expire, the Fund will lose the entire premium it paid and record a realized loss for the premium amount. Premiums paid for options purchased which are exercised or closed are added to the amounts paid or offset against the proceeds on the underlying investment transaction to determine the realized gain (loss) or cost basis of the underlying investment.
The Fund's exchange-traded option contracts are not subject to master netting arrangements (the right to close out all transactions traded with a counterparty and net amounts owed or due across transactions).
F. Futures Contracts — Small Cap Value Fund and U.S. Small Company Fund used index futures contracts to gain or reduce exposure to the stock market, or maintain liquidity or minimize transaction costs. The Funds also purchased futures contracts to invest incoming cash in the market or sold futures in response to cash outflows, thereby simulating an invested position in the underlying index while maintaining a cash balance for liquidity.
Futures contracts provide for the delayed delivery of the underlying instrument at a fixed price or are settled for a cash amount based on the change in the value of the underlying instrument at a specific date in the future. Upon entering into a futures contract, the Funds are required to deposit
| J.P. Morgan Small Cap Funds | |
with the broker, cash or securities in an amount equal to a certain percentage of the contract amount, which is referred to as the initial margin deposit. Subsequent payments, referred to as variation margin, are made or received by the Funds periodically and are based on changes in the market value of open futures contracts. Changes in the market value of open futures contracts are recorded as Change in net unrealized appreciation/depreciation on futures contracts on the Statements of Operations. Realized gains or losses, representing the difference between the value of the contract at the time it was opened and the value at the time it was closed, are reported on the Statements of Operations at the closing or expiration of the futures contract. Securities deposited as initial margin are designated on the SOIs, while cash deposited, which is considered restricted, is recorded on the Statements of Assets and Liabilities. A receivable from and/or a payable to brokers for the daily variation margin is also recorded on the Statements of Assets and Liabilities.
The use of futures contracts exposes the Funds to equity price risk. The Funds may be subject to the risk that the change in the value of the futures contract may not correlate perfectly with the underlying instrument. Use of long futures contracts subjects the Funds to risk of loss in excess of the amounts shown on the Statements of Assets and Liabilities, up to the notional amount of the futures contracts. Use of short futures contracts subjects the Funds to unlimited risk of loss. The Funds may enter into futures contracts only on exchanges or boards of trade. The exchange or board of trade acts as the counterparty to each futures transaction; therefore, the Funds' credit risk is limited to failure of the exchange or board of trade. Under some circumstances, futures exchanges may establish daily limits on the amount that the price of a futures contract can vary from the previous day’s settlement price, which could effectively prevent liquidation of positions.
The Funds' futures contracts are not subject to master netting arrangements (the right to close out all transactions traded with a counterparty and net amounts owed or due across transactions).
Derivatives Volume
The table below discloses the volume of the Funds' options and futures contracts activity during the six months ended December 31, 2023 (amounts in thousands, except number of contracts):
| | | |
| | | |
Average Notional Balance Long | | | |
Ending Notional Balance Long | | | |
| | | |
Average Number of Contracts Purchased | | | |
Ending Number of Contracts Purchased | | | |
G. Security Transactions and Investment Income — Investment transactions are accounted for on the trade date (the date the order to buy or sell is executed). Securities gains and losses are calculated on a specifically identified cost basis.
Interest income is determined on the basis of coupon interest accrued using the effective interest method, which adjusts for amortization of premiums and accretion of discounts.
Dividend income is recorded on the ex-dividend date or when a Fund first learns of the dividend.
To the extent such information is publicly available, the Funds record distributions received in excess of income earned from underlying investments as a reduction of cost of investments and/or realized gain. Such amounts are based on estimates if actual amounts are not available and actual amounts of income, realized gain and return of capital may differ from the estimated amounts. The Funds adjust the estimated amounts of the components of distributions (and consequently their net investment income) as necessary, once the issuers provide information about the actual composition of the distributions.
H. Allocation of Income and Expenses— Expenses directly attributable to a Fund are charged directly to that Fund, while the expenses attributable to more than one fund of the Trusts are allocated among the applicable funds. Investment income, realized and unrealized gains and losses and expenses, other than class-specific expenses, are allocated daily to each class of shares based upon the proportion of net assets of each class at the beginning of each day.
Transfer agency fees are class-specific expenses. The amount of the transfer agency fees charged to each share class of the Funds for the six months ended December 31, 2023 are as follows:
| J.P. Morgan Small Cap Funds | |
NOTES TO FINANCIAL STATEMENTSAS OF December 31, 2023 (Unaudited) (continued)
(Dollar values in thousands)
| | | | | | | | | | |
| | | | | | | | | | |
| | | | | | | | | | |
Small Cap Sustainable Leaders Fund | | | | | | | | | | |
| | | | | | | | | | |
| | | | | | | | | | |
| | | | | | | | | | |
| | | | | | | | | | |
| | | | | | | | | | |
| | | | | | | | | | |
| | | | | | | | | | |
|
| Amount rounds to less than one thousand. |
I. Federal Income Taxes — Each Fund is treated as a separate taxable entity for Federal income tax purposes. Each Fund's policy is to comply with the provisions of the Internal Revenue Code (the “Code”) applicable to regulated investment companies and to distribute to shareholders all of its distributable net investment income and net realized capital gains on investments. Accordingly, no provision for Federal income tax is necessary. Management has reviewed the Funds' tax positions for all open tax years and has determined that as of December 31, 2023, no liability for Federal income tax is required in the Funds' financial statements for net unrecognized tax benefits. However, management’s conclusions may be subject to future review based on changes in, or the interpretation of, the accounting standards or tax laws and regulations. Each Fund's Federal tax returns for the prior three fiscal years remain subject to examination by the Internal Revenue Service.
J. Distributions to Shareholders — Distributions from net investment income, if any, are generally declared and paid at least annually, except for Small Cap Value Fund, for which distributions are generally declared and paid at least quarterly. Distributions are declared separately for each class. No class has preferential dividend rights; differences in per share rates are due to differences in separate class expenses. Net realized capital gains, if any, are distributed by each Fund at least annually. The amount of distributions from net investment income and net realized capital gains is determined in accordance with Federal income tax regulations, which may differ from GAAP. To the extent these “book/tax” differences are permanent in nature (i.e., that they result from other than timing of recognition — “temporary differences”), such amounts are reclassified within the capital accounts based on their Federal tax basis treatment.
3. Fees and Other Transactions with Affiliates
A. Investment Advisory Fee — Pursuant to an Investment Advisory Agreement, the Adviser manages the investments of each Fund and for such services is paid a fee. The investment advisory fee is accrued daily and paid monthly at an annual rate based on each Fund's respective average daily net assets. The annual rate for each Fund is as follows:
| |
| |
| |
| |
Small Cap Sustainable Leaders Fund | |
| |
| |
| |
The Adviser waived investment advisory fees and/or reimbursed expenses as outlined in Note 3.F.
B. Administration Fee— Pursuant to an Administration Agreement, the Administrator provides certain administration services to each Fund. In consideration of these services, the Administrator receives a fee accrued daily and paid monthly at an annual rate of 0.075% of the first $10 billion of each Fund's respective average daily net assets, plus 0.050% of each Fund's respective average daily net assets between $10 billion and $20 billion, plus 0.025% of each Fund's respective average daily net assets between $20 billion and $25 billion, plus 0.010% of each Fund's respective average daily net assets in excess of $25 billion. For the six months ended December 31, 2023, the effective annualized rate was 0.075% of each Fund's average daily net assets, notwithstanding any fee waivers and/or expense reimbursements.
The Administrator waived administration fees as outlined in Note 3.F.
JPMorgan Chase Bank, N.A. ("JPMCB"), a wholly-owned subsidiary of JPMorgan, serves as the Funds' sub-administrator (the “Sub-administrator”). For its services as Sub-administrator, JPMCB receives a portion of the fees payable to the Administrator.
| J.P. Morgan Small Cap Funds | |
C. Distribution Fees — Pursuant to a Distribution Agreement, JPMorgan Distribution Services, Inc. (“JPMDS”), an indirect, wholly-owned subsidiary of JPMorgan, serves as each Fund's principal underwriter and promotes and arranges for the sale of each Fund's shares.
The Boards have adopted a Distribution Plan (the “Distribution Plan”) for Class A, Class C, Class R2 and Class R3 Shares of the Funds, as applicable, pursuant to Rule 12b-1 under the 1940 Act. Class I, Class L, Class R4, Class R5 and Class R6 Shares of the Funds do not charge a distribution fee. The Distribution Plan provides that each Fund shall pay, with respect to the applicable share classes, distribution fees, including payments to JPMDS, at annual rates of the average daily net assets as shown in the table below:
| | | | |
| | | | |
| | | | |
| | | | |
Small Cap Sustainable Leaders Fund | | | | |
| | | | |
| | | | |
| | | | |
In addition, JPMDS is entitled to receive the front-end sales charges from purchases of Class A Shares and the CDSC from redemptions of Class C Shares and certain Class A Shares for which front-end sales charges have been waived. For the six months ended December 31, 2023, JPMDS retained the following:
| | |
| | |
| | |
| | |
Small Cap Sustainable Leaders Fund | | |
| | |
| | |
| | |
|
| Amount rounds to less than one thousand. |
D. Service Fees — The Trusts, on behalf of the Funds, have entered into a Shareholder Servicing Agreement with JPMDS under which JPMDS provides certain support services to fund shareholders. For performing these services, JPMDS receives a fee with respect to all share classes, except Class R6 Shares which do not charge a service fee, that is accrued daily and paid monthly equal to a percentage of the average daily net assets as shown in the table below:
| | | | | | | | |
| | | | | | | | |
| | | | | | | | |
| | | | | | | | |
Small Cap Sustainable Leaders Fund | | | | | | | | |
| | | | | | | | |
| | | | | | | | |
| | | | | | | | |
JPMDS has entered into shareholder services contracts with affiliated and unaffiliated financial intermediaries who provide shareholder services and other related services to their clients or customers who invest in the Funds. Pursuant to such contracts, JPMDS will pay all or a portion of such fees earned to financial intermediaries for performing such services.
JPMDS waived service fees as outlined in Note 3.F.
| J.P. Morgan Small Cap Funds | |
NOTES TO FINANCIAL STATEMENTSAS OF December 31, 2023 (Unaudited) (continued)
(Dollar values in thousands)
E. Custodian and Accounting Fees — JPMCB provides portfolio custody and accounting services to the Funds. For performing these services, the Funds pay JPMCB transaction and asset-based fees that vary according to the number of transactions and positions, plus out-of-pocket expenses. The amounts paid directly to JPMCB by the Funds for custody and accounting services are included in Custodian and accounting fees on the Statements of Operations.
Interest income earned on cash balances at the custodian, if any, is included in Interest income from affiliates on the Statements of Operations.
Interest expense paid to the custodian related to cash overdrafts, if any, is included in Interest expense to affiliates on the Statements of Operations.
F. Waivers and Reimbursements —The Adviser, Administrator and/or JPMDS have contractually agreed to waive fees and/or reimburse the Funds to the extent that total annual operating expenses (excluding acquired fund fees and expenses other than certain money market fund fees as described below, dividend and interest expenses related to short sales, interest, taxes, expenses related to litigation and potential litigation, expenses related to trustee elections and extraordinary expenses) exceed the percentages of the Funds' respective average daily net assets as shown in the table below:
| | | | | | | | | |
| | | | | | | | | |
| | | | | | | | | |
| | | | | | | | | |
Small Cap Sustainable Leaders Fund | | | | | | | | | |
| | | | | | | | | |
| | | | | | | | | |
| | | | | | | | | |
Except as noted above, the expense limitation agreements were in effect for the six months ended December 31, 2023 and the contractual expense limitation percentages in the table above are in place until at least October 31, 2024.
For the six months ended December 31, 2023, the Funds' service providers waived fees and/or reimbursed expenses for each of the Funds as follows. None of these parties expect the Funds to repay any such waived fees and/or reimbursed expenses in future years.
| | |
| | | | | Contractual
Reimbursements |
| | | | | |
| | | | | |
| | | | | |
Small Cap Sustainable Leaders Fund | | | | | |
| | | | | |
| | | | | |
| | | | | |
|
| Amount rounds to less than one thousand. |
Additionally, the Funds may invest in one or more money market funds advised by the Adviser (affiliated money market funds). The Adviser, Administrator and/or JPMDS, as shareholder servicing agent, have contractually agreed to waive fees and/or reimburse expenses in an amount sufficient to offset the respective net fees each collects from the affiliated money market fund on the applicable Fund's investment in such affiliated money market fund, except for investments of securities lending cash collateral. None of these parties expect the Funds to repay any such waived fees and/or reimbursed expenses in future years.
The amounts of these waivers resulting from investments in these money market funds for the six months ended December 31, 2023 were as follows:
| |
| |
| |
| |
Small Cap Sustainable Leaders Fund | |
| |
| |
| J.P. Morgan Small Cap Funds | |
|
| Amount rounds to less than one thousand. |
JPMIM voluntarily agreed to reimburse the Funds for the Trustee Fees paid to one of the interested Trustees. For the six months ended December 31, 2023 the amount of these reimbursements were as follows:
| |
| |
| |
| |
Small Cap Sustainable Leaders Fund | |
| |
| |
| |
G. Other— Certain officers of the Trusts are affiliated with the Adviser, the Administrator and JPMDS. Such officers, with the exception of the Chief Compliance Officer, receive no compensation from the Funds for serving in their respective roles.
The Boards designated and appointed a Chief Compliance Officer to the Funds pursuant to Rule 38a-1 under the 1940 Act. Each Fund, along with affiliated funds, makes reimbursement payments, on a pro-rata basis, to the Administrator for a portion of the fees associated with the office of the Chief Compliance Officer. Such fees are included in Trustees’ and Chief Compliance Officer’s fees on the Statements of Operations.
The Trusts adopted a Trustee Deferred Compensation Plan (the “Plan”) which allows the independent Trustees to defer the receipt of all or a portion of compensation related to performance of their duties as Trustees. The deferred fees are invested in various J.P. Morgan Funds until distribution in accordance with the Plan.
The below Funds used related party broker-dealers during the six months ended December 31, 2023, and incurred brokerage commissions with broker-dealers affiliated with the Adviser as follows:
| |
| |
| |
Small Cap Sustainable Leaders Fund | |
The Securities and Exchange Commission ("SEC") has granted an exemptive order permitting the Funds to engage in principal transactions with J.P. Morgan Securities LLC, an affiliated broker, involving taxable money market instruments, subject to certain conditions.
4. Investment Transactions
During the six months ended December 31, 2023, purchases and sales of investments (excluding short-term investments and transfers in-kind) were as follows:
| Purchases
(excluding
U.S. Government) | Sales
(excluding
U.S. Government) |
| | |
| | |
| | |
Small Cap Sustainable Leaders Fund | | |
| | |
| | |
| | |
During the six months ended December 31, 2023, there were no purchases or sales of U.S. Government securities.
| J.P. Morgan Small Cap Funds | |
NOTES TO FINANCIAL STATEMENTSAS OF December 31, 2023 (Unaudited) (continued)
(Dollar values in thousands)
5. Federal Income Tax Matters
For Federal income tax purposes, the estimated cost and unrealized appreciation (depreciation) in value of investments held at December 31, 2023 were as follows:
| | Gross
Unrealized
Appreciation | Gross
Unrealized
Depreciation | Net Unrealized
Appreciation
(Depreciation) |
| | | | |
| | | | |
| | | | |
Small Cap Sustainable Leaders Fund | | | | |
| | | | |
| | | | |
| | | | |
At June 30, 2023, the following Funds had net capital loss carryforwards which are available to offset future realized gains:
| Capital Loss Carryforward Character |
| | |
| | |
| | |
Small Cap Sustainable Leaders Fund | | |
| | |
Net capital losses (gains) and specified ordinary losses incurred after October 31 and late year ordinary losses incurred after December 31 and within the taxable year are deemed to arise on the first business day of the Funds' next taxable year. For the year ended June 30, 2023, the following Funds deferred to July 1, 2023 the following net capital losses (gains), specified ordinary losses and late year ordinary losses of:
| Net Capital Losses (Gains) | Late Year Ordinary Loss Deferral |
| | |
| | | |
| | | |
| | | |
Small Cap Sustainable Leaders Fund | | | |
| | | |
| | | |
| | | |
6. Borrowings
The Funds rely upon an exemptive order granted by the SEC (the “Order”) permitting the establishment and operation of an Interfund Lending Facility (the “Facility”). The Facility allows the Funds to directly lend and borrow money to or from any other fund relying upon the Order at rates beneficial to both the borrowing and lending funds. Advances under the Facility are taken primarily for temporary or emergency purposes, including the meeting of redemption requests that otherwise might require the untimely disposition of securities, and are subject to each Fund's borrowing restrictions. The interfund loan rate is determined, as specified in the Order, by averaging the current repurchase agreement rate and the current bank loan rate. The Order was granted to JPM II and may be relied upon by the Funds because the Funds and the series of JPM II are all investment companies in the same “group of investment companies” (as defined in Section 12(d)(1)(G) of the 1940 Act).
The Funds had no borrowings outstanding from another fund, or loans outstanding to another fund, during the six months ended December 31, 2023.
The Trusts and JPMCB have entered into a financing arrangement. Under this arrangement, JPMCB provides an unsecured, uncommitted credit facility in the aggregate amount of $100 million to certain of the J.P. Morgan Funds, including the Funds. Advances under the arrangement are taken primarily for temporary or emergency purposes, including the meeting of redemption requests that otherwise might require the untimely disposition of securities, and are subject to each Fund's borrowing restrictions. Interest on borrowings is payable at a rate determined by JPMCB at the time of borrowing. This agreement has been extended until October 29, 2024.
| J.P. Morgan Small Cap Funds | |
The Funds had no borrowings outstanding from the unsecured, uncommitted credit facility during the six months ended December 31, 2023.
The Trusts, along with certain other trusts for J.P. Morgan Funds (“Borrowers”), have entered into a joint syndicated senior unsecured revolving credit facility totaling $1.5 billion (“Credit Facility”) with various lenders and The Bank of New York Mellon, as administrative agent for the lenders. This Credit Facility provides a source of funds to the Borrowers for temporary and emergency purposes, including the meeting of redemption requests that otherwise might require the untimely disposition of securities. Under the terms of the Credit Facility, a borrowing fund must have a minimum of $25 million in adjusted net asset value and not exceed certain adjusted net asset coverage ratios prior to and during the time in which any borrowings are outstanding. If a fund does not comply with the aforementioned requirements, the fund must remediate within three business days with respect to the $25 million minimum adjusted net asset value or within one business day with respect to certain asset coverage ratios or the administrative agent at the request of, or with the consent of, the lenders may terminate the Credit Facility and declare any outstanding borrowings to be due and payable immediately.
Interest associated with any borrowing under the Credit Facility is charged to the borrowing fund at a rate of interest equal to 1.00% (the "Applicable Margin"), plus the greater on the day of the borrowing, of the federal funds effective rate, or the Adjusted Secured Overnight Financing Rate ("SOFR"). Effective August 8, 2023, the Credit Facility was amended and restated for a term of 364 days, unless extended.
The Funds did not utilize the Credit Facility during the six months ended December 31, 2023.
7. Risks, Concentrations and Indemnifications
In the normal course of business, the Funds enter into contracts that contain a variety of representations which provide general indemnifications. Each Fund's maximum exposure under these arrangements is unknown. The amount of exposure would depend on future claims that may be brought against each Fund. However, based on experience, the Funds expect the risk of loss to be remote.
As of December 31, 2023, the Funds had individual shareholder and/or affiliated omnibus accounts each owning more than 10% of the respective Fund's outstanding shares as follows:
| Number of
Individual Shareholder
and/or Affiliated
Omnibus Accounts | | Number of
Individual Shareholder
and/or Non-Affiliated
Omnibus Accounts | |
| | | | |
| | | | |
| | | | |
Small Cap Sustainable Leaders Fund | | | | |
| | | | |
| | | | |
| | | | |
As of December 31, 2023, J.P. Morgan Investor Funds and JPMorgan SmartRetirement Funds, which are affiliated fund of funds, each owned in the aggregate, shares representing more than 10% of the net assets of the Funds as follows:
| | JPMorgan
SmartRetirement
Funds |
| | |
Significant shareholder transactions by these shareholders may impact the Funds' performance and liquidity.
Because the Funds invest in Real Estate Investment Trusts ("REITs"), the Funds may be subject to certain risks similar to those associated with direct investments in real estate. REITs may be affected by changes in the value of their underlying properties and by defaults by tenants. REITs depend generally on their ability to generate cash flow to make distributions to shareholders, and certain REITs have self-liquidation provisions by which mortgages held may be paid in full and distributions of capital returns may be made at any time.
The Funds invest in companies with relatively small market capitalizations. Investments in companies with relatively small market capitalizations may involve greater risk than is usually associated with stocks of larger companies. These securities may have limited marketability and may be subject to more abrupt or erratic movements in price than securities of companies with larger capitalizations.
London Interbank Offered Rate ("LIBOR") was a leading floating rate benchmark used in loans, notes, derivatives and other instruments or investments. As a result of benchmark reforms, publication of most LIBOR settings has ceased. Some LIBOR settings continue to be published but only on a temporary, synthetic and non-representative basis. Regulated entities have generally ceased entering into new LIBOR contracts in connection with
| J.P. Morgan Small Cap Funds | |
NOTES TO FINANCIAL STATEMENTSAS OF December 31, 2023 (Unaudited) (continued)
(Dollar values in thousands)
regulatory guidance or prohibitions. Public and private sector actors have worked to establish alternative reference rates to be used in place of LIBOR. There is no assurance that any such alternative reference rate will be similar to or produce the same value or economic equivalence as LIBOR or that it will have the same volume or liquidity as did LIBOR which may affect the value, volatility, liquidity or return on certain of the Funds' loans, notes, derivatives and other instruments or investments comprising some or all of the Funds' investments and result in costs incurred in connection with changing reference rates used for positions, closing out positions and entering into new trades. Certain of the Funds' investments may have transitioned from LIBOR or will transition from LIBOR in the future. The transition from LIBOR to alternative reference rates may result in operational issues for the Funds or their investments. No assurances can be given as to the impact of the LIBOR transition (and the timing of any such impact) on the Funds and their investments.
The Funds are subject to infectious disease epidemics/pandemics risk. For example, the outbreak of COVID-19 negatively affected economies, markets and individual companies throughout the world, including those in which the Funds invest. The effects of any future pandemic or other global event to business and market conditions may have a significant negative impact on the performance of a Fund's investments, increase a Fund's volatility, exacerbate other pre-existing political, social and economic risks to the Funds and negatively impact broad segments of businesses and populations. In addition, governments, their regulatory agencies, or self-regulatory organizations have taken or may take actions in response to a pandemic or other global event that affect the instruments in which the Funds invest, or the issuers of such instruments, in ways that could have a significant negative impact on a Fund’s investment performance. The ultimate impact of any pandemic or other global event and the extent to which the associated conditions and governmental responses impact a Fund will also depend on future developments, which are highly uncertain, difficult to accurately predict and subject to frequent changes.
8. Subsequent Events
Subsequent to December 31, 2023, Small Cap Sustainable Leaders Fund had net redemptions of $8,431, which represented 22% of the Fund's net assets as of December 31, 2023.
On February 8, 2024, the Board approved the liquidation of Small Cap Sustainable Leaders Fund, which is expected to occur on or about May 21, 2024.
| J.P. Morgan Small Cap Funds | |
SCHEDULE OF SHAREHOLDER EXPENSES(Unaudited)
Hypothetical $1,000 Investment
As a shareholder of the Funds, you incur two types of costs: (1) transaction costs, including sales charges (loads) on purchase payments and (2) ongoing costs, including investment advisory fees, administration fees, distribution fees and other Fund expenses. The examples below are intended to help you understand your ongoing costs (in dollars) of investing in the Funds (not including expenses of the Underlying Funds) and to compare these ongoing costs with the ongoing costs of investing in other mutual funds. The examples assume that you had a $1,000 investment in each Class at the beginning of the reporting period, July 1, 2023, and continued to hold your shares at the end of the reporting period, December 31, 2023.
Actual Expenses
For each Class of each Fund in the table below, the first line provides information about actual account values and actual expenses. You may use the information in this line, together with the amount you invested, to estimate the expenses that you paid over the period. Simply divide your account value by $1,000 (for example, an $8,600 account value divided by $1,000 = 8.6), then multiply the result by the number in the first line of each Class under the heading titled “Expenses Paid During the Period” to estimate the expenses you paid on your account during this period.
Hypothetical Example for Comparison Purposes
The second line of each Class in the table below provides information about hypothetical account values and hypothetical expenses based on the Class’ actual expense ratio and an assumed rate of return of 5% per year before expenses, which is not the Class’ actual return. The hypothetical account values and expenses may not be used to estimate the actual ending account balance or expenses you paid for the period. You may use this information to compare the ongoing costs of investing in the Class of the Funds and other funds. To do so, compare this 5% hypothetical example with the 5% hypothetical examples that appear in the shareholder reports of the other funds. Please note that the expenses shown in the table are meant to highlight your ongoing costs only and do not reflect any transaction costs, such as sales charges (loads) or redemption fees, and expenses of the Underlying Funds. Therefore, the second line for each Class in the table is useful in comparing ongoing costs only, and will not help you determine the relative total costs of owning different funds. In addition, if these transaction costs were included, your costs would have been higher. The examples also assume all dividends and distributions have been reinvested.
| Beginning
Account Value
July 1, 2023 | Ending
Account Value
December 31, 2023 | Expenses
Paid During
the Period* | |
JPMorgan Small Cap Blend Fund | | | | |
| | | | |
| | | | |
| | | | |
| | | | |
| | | | |
| | | | |
| | | | |
| | | | |
| | | | |
| | | | |
| | | | |
| | | | |
JPMorgan Small Cap Equity Fund | | | | |
| | | | |
| | | | |
| | | | |
| | | | |
| | | | |
| | | | |
| | | | |
| | | | |
| | | | |
| | | | |
| | | | |
| | | | |
| J.P. Morgan Small Cap Funds | |
SCHEDULE OF SHAREHOLDER EXPENSES(Unaudited) (continued)
Hypothetical $1,000 Investment
| Beginning Account Value July 1, 2023 | Ending Account Value December 31, 2023 | Expenses Paid During the Period* | |
JPMorgan Small Cap Equity Fund (continued) | | | | |
| | | | |
| | | | |
| | | | |
| | | | |
| | | | |
| | | | |
| | | | |
| | | | |
| | | | |
| | | | |
| | | | |
| | | | |
JPMorgan Small Cap Growth Fund | | | | |
| | | | |
| | | | |
| | | | |
| | | | |
| | | | |
| | | | |
| | | | |
| | | | |
| | | | |
| | | | |
| | | | |
| | | | |
| | | | |
| | | | |
| | | | |
| | | | |
| | | | |
| | | | |
| | | | |
| | | | |
| | | | |
| | | | |
| | | | |
| | | | |
| | | | |
| | | | |
| | | | |
JPMorgan Small Cap Sustainable Leaders Fund | | | | |
| | | | |
| | | | |
| | | | |
| | | | |
| | | | |
| | | | |
| | | | |
| | | | |
| | | | |
| J.P. Morgan Small Cap Funds | |
| Beginning Account Value July 1, 2023 | Ending Account Value December 31, 2023 | Expenses Paid During the Period* | |
JPMorgan Small Cap Sustainable Leaders Fund (continued) | | | | |
| | | | |
| | | | |
| | | | |
| | | | |
| | | | |
| | | | |
| | | | |
| | | | |
| | | | |
| | | | |
| | | | |
| | | | |
| | | | |
| | | | |
| | | | |
JPMorgan Small Cap Value Fund | | | | |
| | | | |
| | | | |
| | | | |
| | | | |
| | | | |
| | | | |
| | | | |
| | | | |
| | | | |
| | | | |
| | | | |
| | | | |
| | | | |
| | | | |
| | | | |
| | | | |
| | | | |
| | | | |
| | | | |
| | | | |
| | | | |
| | | | |
| | | | |
| | | | |
JPMorgan SMID Cap Equity Fund | | | | |
| | | | |
| | | | |
| | | | |
| | | | |
| | | | |
| | | | |
| | | | |
| | | | |
| | | | |
| J.P. Morgan Small Cap Funds | |
SCHEDULE OF SHAREHOLDER EXPENSES(Unaudited) (continued)
Hypothetical $1,000 Investment
| Beginning Account Value July 1, 2023 | Ending Account Value December 31, 2023 | Expenses Paid During the Period* | |
JPMorgan SMID Cap Equity Fund (continued) | | | | |
| | | | |
| | | | |
| | | | |
| | | | |
| | | | |
| | | | |
| | | | |
| | | | |
| | | | |
JPMorgan U.S. Small Company Fund | | | | |
| | | | |
| | | | |
| | | | |
| | | | |
| | | | |
| | | | |
| | | | |
| | | | |
| | | | |
| | | | |
| | | | |
| | | | |
| | | | |
| | | | |
| | | | |
| | | | |
| | | | |
| | | | |
| | | | |
| | | | |
| | | | |
| | | | |
| | | | |
| | | | |
| | | | |
| | | | |
| | | | |
|
| Expenses are equal to each Class’ respective annualized net expense ratio, multiplied by the average account value over the period, multiplied by 184/366 (to reflect the one-half year period). |
| J.P. Morgan Small Cap Funds | |
BOARD APPROVAL OF INVESTMENT ADVISORY AGREEMENTS(Unaudited)
The Board of Trustees (the “Board” or the “Trustees”) has established various standing committees composed of Trustees with diverse backgrounds, to which the Board has assigned specific subject matter responsibilities to further enhance the effectiveness of the Board’s oversight and decision making. The Board and its investment committees (Money Market and Alternative Products Committee, Equity Committee, and Fixed Income Committee) met regularly throughout the year and, at each meeting, considered factors that are relevant to their annual consideration of the continuation of the investment advisory agreements. The Board also met for the specific purpose of considering the continuation of the investment advisory agreement annual renewals. The Board held meetings June 20-21, 2023 and August 8-10, 2023, at which the Trustees considered the continuation of the investment advisory agreements for each Fund whose semi-annual report is contained herein (each an “Advisory Agreement” and collectively, the “Advisory Agreements”). At the June meeting, the Board’s investment committees met to review and consider performance, expense and related information for the J.P. Morgan Funds. Each investment committee reported to the full Board, which then considered each investment committee’s preliminary findings. At the August meeting, the Trustees continued their review and consideration. The Trustees, including a majority of the Trustees who are not parties to an Advisory Agreement or “interested persons” (as defined in the Investment Company Act of 1940) of any party to an Advisory Agreement or any of their affiliates, approved the continuation of each Advisory Agreement on August 10, 2023.
As part of their review of the Advisory Agreements, the Trustees considered and reviewed performance and other information about the Funds received from J.P. Morgan Investment Management Inc. (the “Adviser”). This information included the Funds’ performance as compared to the performance of their peers and benchmarks, and analyses by the Adviser of the Funds’ performance. In addition, at each of their regular meetings throughout the year, the Trustees considered reports on the performance of certain J.P. Morgan Funds provided by an independent investment consulting firm (“independent consultant”). In addition, in preparation for the June and August meetings, the Trustees requested, received and evaluated extensive materials from the Adviser, including performance and expense information compiled by Broadridge, using data from Lipper Inc. and/or Morningstar Inc., independent providers of investment company data (together, “Broadridge”). The Trustees’ independent consultant also provided additional quantitative and statistical analyses of the Funds, including risk and performance return assessments as compared to the Funds’ objectives, benchmarks, and peers. Before voting on the Advisory Agreements, the Trustees reviewed the Advisory Agreements with representatives of the Adviser, counsel to the Funds, and independent legal counsel to the Trustees, and received a memorandum from independent
legal counsel to the Trustees discussing the legal standards for their consideration of the Advisory Agreements. The Trustees also discussed the Advisory Agreements in executive sessions with independent legal counsel at which no representatives of the Adviser were present.
A summary of the material factors evaluated by the Trustees in determining whether to approve each Advisory Agreement is provided below. Each Trustee attributed different weights to the various factors and no factor alone was considered determinative. The Trustees considered information provided with respect to the Funds throughout the year, as well as materials furnished specifically in connection with the annual review process. From year to year, the Trustees consider and place emphasis on relevant information in light of changing circumstances in market and economic conditions.
After considering and weighing the factors and information they had received, the Trustees found that the compensation to be received by the Adviser from each Fund under the applicable Advisory Agreement was fair and reasonable under the circumstances, and determined that the continuance of each Advisory Agreement was in the best interests of each Fund and its shareholders.
Nature, Extent and Quality of Services Provided by the Adviser
The Trustees received and considered information regarding the nature, extent and quality of services provided to each Fund under the applicable Advisory Agreement. The Trustees took into account information furnished throughout the year at Trustee meetings, as well as the materials furnished specifically in connection with this annual review process. Among other things, the Trustees considered:
• The background and experience of the Adviser’s senior management and investment personnel, including personnel changes, if any;
• The qualifications, backgrounds and responsibilities of the portfolio management team primarily responsible for the day-to-day management of each Fund, including personnel changes, if any;
• The investment strategy for each Fund, and the infrastructure supporting the portfolio management teams;
• Information about the structure and distribution strategy for each Fund and how it fits within the Adviser’s other fund offerings within the J.P. Morgan Funds complex;
• The administration services provided by the Adviser in its role as Administrator;
BOARD APPROVAL OF INVESTMENT ADVISORY AGREEMENTS(Unaudited) (continued)
• Their knowledge of the nature and quality of the services provided by the Adviser and its affiliates gained from their experience as Trustees of the Funds and in the financial industry generally;
• The overall reputation and capabilities of the Adviser and its affiliates;
• The commitment of the Adviser to provide high quality service to the Funds;
• Their overall confidence in the Adviser’s integrity; and
• The Adviser’s responsiveness to requests for additional information, questions or concerns raised by them, including the Adviser’s willingness to consider and implement organizational and operational changes designed to improve investment results and the services provided to each Fund.
Based upon these considerations and other factors, the Trustees concluded that they were satisfied with the nature, extent and quality of the services provided to the Funds by the Adviser.
Costs of Services Provided and Profitability to the Adviser and its Affiliates
The Trustees received and considered information regarding the profitability to the Adviser and its affiliates from providing services to each Fund. The Trustees reviewed and discussed this information. The Trustees recognized that this information is not audited and represents the Adviser’s determination of its and its affiliates’ revenues from the contractual services provided to the Funds, less expenses of providing such services. Expenses include direct and indirect costs and are calculated using an allocation methodology developed by the Adviser and reviewed with the Board. The Trustees also recognized that it is difficult to make comparisons of profitability from fund investment advisory contracts because comparative information is not generally publicly available and is affected by numerous factors, including the structure of the particular adviser, the types of funds it manages, its business mix, numerous assumptions regarding allocations and the fact that publicly-traded fund managers’ operating profits and net income are net of distribution and marketing expenses. Based upon their review, and taking into consideration the factors noted above, the Trustees concluded that the profitability to the Adviser under each Advisory Agreement was not unreasonable in light of the services and benefits provided to each Fund.
The Trustees also considered that JPMorgan Distribution Services, Inc. (“JPMDS”), an affiliate of the Adviser, and the Adviser earn fees from the Funds for providing shareholder and administration services, respectively. These fees were shown separately in the profitability analysis presented to the Trustees. The Trustees also considered the payments of Rule 12b-1 fees to JPMDS, which also acts as the Funds’
distributor, and that these fees are in turn generally paid to financial intermediaries that sell the Funds, including financial intermediaries that are affiliates of the Adviser (although they are retained by JPMDS in certain instances). The Trustees also considered the fees earned by JPMorgan Chase Bank, N.A. (“JPMCB”), an affiliate of the Adviser, for custody, fund accounting and other related services for each Fund, and the profitability of the arrangements to JPMCB.
Fall-Out Benefits
The Trustees reviewed information regarding potential “fall-out” or ancillary benefits received by the Adviser and its affiliates as a result of their relationship with the Funds. The Trustees considered that the J.P. Morgan Funds’ operating accounts are held at JPMCB, which, as a result, will receive float benefits for certain J.P. Morgan Funds, as applicable. The Trustees also noted that the Adviser supports a diverse set of products and services, which benefits the Adviser by allowing it to leverage its infrastructure to serve additional clients, including benefits that may be received by the Adviser and its affiliates in connection with the Funds’ potential investments in other funds advised by the Adviser. The Trustees also reviewed the Adviser’s allocation of fund brokerage for the J.P. Morgan Funds complex, including allocations to brokers who provide research to the Adviser, as well as the Adviser’s use of affiliates to provide other services and the benefits to such affiliates of doing so. The Trustees also considered the benefit to the Adviser and its affiliates from allocating client assets to the Funds.
Economies of Scale
The Trustees considered the extent to which the Funds may benefit from potential economies of scale. The Trustees considered that there may not be a direct relationship between economies of scale realized by the Funds and those realized by the Adviser as assets increase. The Trustees considered the extent to which the Funds were priced to scale and whether it would be appropriate to add advisory fee breakpoints. The Trustees noted certain Funds with contractual expense limitations and fee waivers (“Fee Caps”), which allow a Fund’s shareholders to share potential economies of scale from a Fund’s inception, prior to reaching scale. The Trustees also noted that certain other Funds that had achieved scale as asset levels had increased no longer had Fee Caps in place for some or all of their share classes, but shared economies of scale through lower average expenses. The Trustees noted that the fees remain fair and reasonable relative to peer funds. The Trustees considered the benefits to the Funds of the use of an affiliated distributor and custodian, including the ability to rely on existing infrastructure supporting distribution, custodial and transfer agent services and the ability to negotiate competitive fees for the Funds. The Trustees further considered the Adviser's and JPMDS's ongoing investments in their business in support of the Funds, including the Adviser's and/or JPMDS's
investments in trading systems, technology (including improvements to the J.P. Morgan Funds’ website, and cybersecurity improvements), retention of key talent, and regulatory support enhancements. The Trustees concluded that the current fee structure for each Fund, including any Fee Caps the Adviser has in place that serve to limit the overall net expense ratios of each Fund at competitive levels, was reasonable. The Trustees concluded that, for Funds with Fee Caps in place for some or all of their share classes, the relevant Fund’s shareholders received the benefits of potential economies of scale through the Fee Caps and, for Funds that achieved scale and no longer had Fee Caps in place for some or all of their share classes, the relevant Fund’s shareholders benefited from lower average expenses resulting from increased assets. The Trustees also concluded that all Funds benefited from the Adviser’s reinvestment in its operations to serve the Funds and their shareholders. The Trustees noted that the Adviser’s reinvestment ensures sufficient resources in terms of personnel and infrastructure to support the Funds.
Independent Written Evaluation of the Funds’ Senior Officer
The Trustees noted that, upon their direction, the Senior Officer for the Small Cap Growth Fund, Small Cap Value Fund, and SMID Cap Equity Fund had prepared an independent written evaluation in order to assist the Trustees in determining the reasonableness of the proposed management fees. In determining whether to continue the Advisory Agreements, the Trustees considered the Senior Officer’s report.
Fees Relative to Adviser’s Other Clients
The Trustees received and considered information about the nature and extent of investment advisory services and fee rates offered to other clients of the Adviser, including, to the extent applicable, institutional separate accounts, collective investment trusts, other registered investment companies and/or private funds sub-advised by the Adviser, for investment management styles substantially similar to that of each Fund. The Trustees considered the complexity of investment management for registered investment companies relative to the Adviser’s other clients and noted differences, as applicable, in the fee structure and the regulatory, legal and other risks and responsibilities of providing services to the different clients. The Trustees considered that serving as an adviser to a registered investment company involves greater responsibilities and risks than acting as a sub-adviser and observed that sub-advisory fees may be lower than those charged by the Adviser to each Fund. The Trustees also noted that the adviser, not the applicable registered investment company, typically bears the sub-advisory fee and that many responsibilities related to the advisory function are typically retained by the primary adviser. The Trustees concluded that the fee rates charged to each Fund in comparison to those charged to the Adviser’s other clients were reasonable.
Investment Performance
The Trustees receive and consider information about each Fund’s performance throughout the year. In addition, the Trustees received and considered absolute and/or relative performance information for the Funds in a report prepared by Broadridge. The Trustees considered the total return performance information, which included the ranking of the Funds within a performance universe comprised of funds’ selected share classes with the same Broadridge investment classification and objective (the “Universe”), by total return for the applicable one-, three- and five-year periods. The Trustees reviewed a description of Broadridge’s methodology for selecting mutual funds in each Fund’s Universe, and noted that Universe quintile rankings were not calculated if the number of funds in the Universe did not meet a predetermined minimum. The Broadridge materials provided to the Trustees highlighted information with respect to certain representative classes to assist the Trustees in their review. As part of this review, the Trustees also reviewed each Fund’s performance against its benchmark and considered the performance information provided for the Funds at regular Board meetings by the Adviser and the Trustees’ independent consultant and also considered the special analysis prepared for the Funds by the Trustees’ independent consultant. The Trustees also engaged with the Adviser to consider what steps might be taken to improve performance, as applicable. The Broadridge performance data noted by the Trustees as part of their review and the determinations made by the Trustees with respect to each Fund’s performance for certain representative classes are summarized below:
The Trustees noted that the Small Cap Blend Fund’s performance for Class A shares was in the fourth, third and first quintiles of the Universe for the one-, three- and five-year periods ended December 31, 2022, respectively. The Trustees noted that the performance for Class I shares was in the fifth, third and first quintiles of the Universe for the one-, three- and five-year periods ended December 31, 2022, respectively. The Trustees noted that the performance for Class R6 shares was in the fifth and third quintiles of the Universe for the one- and three-year periods ended December 31, 2022, respectively. The Trustees discussed the performance and investment strategy of the Fund with the Adviser and reviewed the performance analysis and evaluation prepared by the independent consultant. Based upon these discussions and various other factors, the Trustees concluded that the Fund’s performance was satisfactory under the circumstances.
The Trustees noted that the Small Cap Equity Fund’s performance for Class A shares was in the third, third and second quintiles of the Universe for the one-, three- and five-year periods ended December 31, 2022, respectively. The Trustees noted that the performance for Class I and Class R6 shares was in the second, third and first quintiles of the Universe for the
BOARD APPROVAL OF INVESTMENT ADVISORY AGREEMENTS(Unaudited) (continued)
one-, three- and five-year periods ended December 31, 2022, respectively. The Trustees discussed the performance and investment strategy of the Fund with the Adviser and reviewed the performance analysis and evaluation prepared by the independent consultant. Based upon these discussions and various other factors, the Trustees concluded that the Fund’s performance was satisfactory.
The Trustees noted that the Small Cap Growth Fund’s performance for Class A and Class R6 shares was in the fourth, fourth and third quintiles of the Universe for the one-, three- and five-year periods ended December 31, 2022, respectively. The Trustees noted that the performance for Class I shares was in the fourth, fifth and third quintiles of the Universe for the one-, three- and five-year periods ended December 31, 2022, respectively. The Trustees discussed the performance and investment strategy of the Fund with the Adviser and reviewed the performance analysis and evaluation prepared by the independent consultant. Based upon these discussions and various other factors, the Trustees concluded that the Fund’s performance was satisfactory under the circumstances.
The Trustees noted that the Small Cap Sustainable Leaders Fund’s performance for Class A, Class R5 and Class R6 shares was in the fifth quintiles of the Universe for each of the one-, three- and five-year periods ended December 31, 2022. The Trustees discussed the performance and investment strategy of the Fund with the Adviser and reviewed the performance analysis and evaluation prepared by the independent consultant. Based upon these discussions and various other factors, the Trustees concluded that the Fund’s performance was satisfactory under the circumstances. The Trustees requested, however, that the Fund’s Adviser provide additional Fund performance information to be reviewed with the members of the Board’s Equity Committee at each of its regularly scheduled meetings over the course of the next year.
The Trustees noted that the Small Cap Value Fund’s performance for Class A and Class I shares was in the fourth, third and fourth quintiles of the Universe for the one-, three- and five-year periods ended December 31, 2022, respectively. The Trustees noted that the performance for Class R6 shares was in the fourth, third and third quintiles of the Universe for the one-, three-, and five-year periods ended December 31, 2022, respectively. The Trustees discussed the performance and investment strategy of the Fund with the Adviser and reviewed the performance analysis and evaluation prepared by the independent consultant. Based upon these discussions and various other factors, the Trustees concluded that the Fund’s performance was satisfactory under the circumstances.
The Trustees noted that the SMID Cap Equity Fund’s performance for Class A, Class I and Class R6 shares was in the fourth, fifth and fifth quintiles of the Universe for the one-, three- and five-year periods ended December 31, 2022,
respectively. The Trustees discussed the performance and investment strategy of the Fund with the Adviser and reviewed the performance analysis and evaluation prepared by the independent consultant. Based upon these discussions and various other factors, the Trustees concluded that the Fund’s performance was satisfactory under the circumstances. The Trustees requested, however, that the Fund’s Adviser provide additional Fund performance information to be reviewed with the members of the Board’s Equity Committee at each of its regularly scheduled meetings over the course of the next year.
The Trustees noted that the U.S. Small Company Fund’s performance for Class A, Class I and Class R6 shares was in the third, second and third quintiles of the Universe for the one-, three- and five-year periods ended December 31, 2022, respectively. The Trustees discussed the performance and investment strategy of the Fund with the Adviser and reviewed the performance analysis and evaluation prepared by the independent consultant. Based upon these discussions and various other factors, the Trustees concluded that the Fund’s performance was satisfactory.
Advisory Fees and Expense Ratios
The Trustees considered the contractual advisory fee rate and administration fee rate paid by each Fund to the Adviser and compared the combined rate to the information prepared by Broadridge concerning management fee rates paid by other funds’ selected share classes in the Universe, as well as a subset of funds within the Universe (the “Peer Group”). The Trustees recognized that Broadridge reported each Fund’s management fee rate as the combined contractual advisory fee and administration fee rates. The Trustees also reviewed information about other expenses and the expense ratios for each Fund and noted that Universe and Peer Group quintile rankings were not calculated if the number of funds in the Universe and/or Peer Groups did not meet a predetermined minimum. For each Fund that had a Fee Cap in place, the Trustees considered the net advisory fee rate and net expense ratio for each share class, as applicable, taking into account any waivers and/or reimbursements. The Trustees also considered any proposed changes to a Fee Cap, and, where deemed appropriate by the Trustees, additional waivers and/or reimbursements. The Trustees recognized that it can be difficult to make comparisons of advisory fees because there are variations in the services that are included in the fees paid by other funds. The Trustees’ determinations as a result of the review of each Fund’s advisory fees and expense ratios for certain representative classes are summarized below:
The Trustees noted that the Small Cap Blend Fund’s net advisory fee for Class A shares was in the second quintile of both the Peer Group and Universe, and that the actual total expenses for Class A shares were in the fourth and third quintiles of the Peer Group and Universe, respectively. The Trustees noted that the net advisory fee for Class I shares was
in the second quintile of both the Peer Group and Universe, and that the actual total expenses for Class I shares were in the second and third quintiles of the Peer Group and Universe, respectively. The Trustees noted that the net advisory fee for Class R6 shares was in the first and second quintile of the Peer Group and Universe, respectively, and that the actual total expenses for Class R6 shares were in the first quintile of both the Peer Group and Universe. After considering the factors identified above, in light of this information, the Trustees concluded that the advisory fee was fair and reasonable in light of the services provided to the Fund.
The Trustees noted that the Small Cap Equity Fund’s net advisory fee for Class A shares was in the third and second quintiles of the Peer Group and Universe, respectively, and that the actual total expenses for Class A shares were in the fifth and fourth quintiles of the Peer Group and Universe, respectively. The Trustees noted that the net advisory fee for Class I shares was in the third and second quintiles of the Peer Group and Universe, respectively, and that the actual total expenses for Class I shares were in the second and fourth quintiles of the Peer Group and Universe, respectively. The Trustees noted that the net advisory fee for Class R6 shares was in the second quintile of both the Peer Group and Universe, and that the actual total expenses for Class R6 shares were in the second and first quintiles of the Peer Group and Universe, respectively. After considering the factors identified above, in light of this information, the Trustees concluded that the advisory fee was fair and reasonable in light of the services provided to the Fund.
The Trustees noted that the Small Cap Growth Fund’s net advisory fee for Class A shares was in the second quintile of both the Peer Group and Universe, and that the actual total expenses were in the fourth and third quintiles of the Peer Group and Universe, respectively. The Trustees noted that the net advisory fee for Class I shares was in the second quintiles of both the Peer Group and Universe, and that the actual total expenses were in the first and third quintiles of the Peer Group and Universe, respectively. The Trustees noted that the net advisory fee for Class R6 shares was in the second quintile of both the Peer Group and Universe, and that the actual total expenses for Class R6 shares were in the second and first quintiles of the Peer Group and Universe, respectively. After considering the factors identified above, in light of this information, in light of this information, the Trustees concluded that the advisory fee was fair and reasonable in light of the services provided to the Fund.
The Trustees noted that the Small Cap Sustainable Leaders Fund’s net advisory fee and actual total expenses for Class A shares was in the first quintile of the Universe. Broadridge did not calculate quintile rankings for the Peer Group for Class A shares of this Fund due to the limited number of funds in the Peer Groups. The Trustees noted that the net advisory fee for
Class R5 and Class R6 shares was in the first quintile of both the Peer Group and Universe, and that the actual total expenses for Class R5 and Class R6 shares were also in the first quintile of both the Peer Group and Universe. After considering the factors identified above, in light of this information, the Trustees concluded that the advisory fee was fair and reasonable in light of the services provided to the Fund.
The Trustees noted that the Small Cap Value Fund’s net advisory fee for Class A shares was in the second quintile of both the Peer Group and Universe, and that the actual total expenses for Class A shares were in the third and second quintiles of the Peer Group and Universe, respectively. The Trustees noted that the net advisory fee for Class I shares was in the third and second quintiles of the Peer Group and Universe, respectively, and that the actual total expenses for Class I shares were in the first and third quintiles of the Peer Group and Universe, respectively. The Trustees noted that the net advisory fee for Class R6 shares was in the third and second quintiles of the Peer Group and Universe, respectively, and that the actual total expenses for Class R6 shares were in the second and first quintiles of the Peer Group and Universe, respectively. After considering the factors identified above, in light of this information, the Trustees concluded that the advisory fee was fair and reasonable in light of the services provided to the Fund.
The Trustees noted that the SMID Cap Equity Fund’s net advisory fee for Class A shares was in the first quintile of both the Peer Group and Universe, and that the actual total expenses for Class A shares were in the first and second quintiles of the Peer Group and Universe, respectively. The Trustees noted that the net advisory fee for Class I shares was in the second and first quintiles of the Peer Group and Universe, respectively, and that the actual total expenses for Class I shares were in the first and second quintiles of the Peer Group and Universe, respectively. The Trustees noted that the net advisory fee and actual total expenses for Class R6 shares were both in the first quintile of both the Peer Group and Universe. After considering the factors identified above, in light of this information, the Trustees concluded that the advisory fee was fair and reasonable in light of the services provided to the Fund.
The Trustees noted that the U.S. Small Company Fund’s net advisory fee for Class A shares was in the first and second quintiles of the Peer Group and Universe, respectively, and that the actual total expenses for Class A shares were in the third and second quintiles of the Peer Group and Universe, respectively. The Trustees noted that the net advisory fee for Class I shares was in the first and second quintiles of the Peer Group and Universe, respectively, and that the actual total expenses for Class I shares were in the second and third quintiles of the Peer Group and Universe, respectively. The Trustees noted that the net advisory fee for Class R6 shares was in the first and second quintiles of the Peer Group and Universe, respectively,
BOARD APPROVAL OF INVESTMENT ADVISORY AGREEMENTS(Unaudited) (continued)
and that the actual total expenses for Class R6 shares were in the first quintile of both the Peer Group and Universe. After considering the factors identified above, in light of this information, the Trustees concluded that the advisory fee was fair and reasonable in light of the services provided to the Fund.
J.P. Morgan Funds are distributed by JPMorgan Distribution Services, Inc., which is an affiliate of JPMorgan Chase & Co. Affiliates of JPMorgan Chase & Co. receive fees for providing various services to the Funds.
Contact JPMorgan Distribution Services, Inc. at 1-800-480-4111 for a fund prospectus. You can also visit us at www.jpmorganfunds.com. Investors should carefully consider the investment objectives and risk as well as charges and expenses of the mutual fund before investing. The prospectus contains this and other information about the mutual fund. Read the prospectus carefully before investing.
Investors may obtain information about the Securities Investor Protection Corporation (SIPC), including the SIPC brochure, by visiting www.sipc.org or by calling SIPC at 202-371-8300.
Each Fund files a complete schedule of its fund holdings for the first and third quarters of its fiscal year with the SEC as an exhibit to its report on Form N-PORT. The Funds' Form N-PORT reports are available on the SEC’s website at http://www.sec.gov. Each Fund's quarterly holdings can be found by visiting the J.P. Morgan Funds’ website at www.jpmorganfunds.com.
Effective January 24, 2023, the SEC adopted rule and form amendments that will result in changes to the design and delivery of shareholder reports of mutual funds and ETFs, requiring them to transmit concise and visually engaging streamlined annual and semi-annual reports to shareholders that highlight key information. Other information, including financial statements, will no longer appear in a streamlined shareholder report but must be available online, delivered free of charge upon request, and filed on a semi-annual basis on Form N-CSR. The rule and form amendments have a compliance date of July 24, 2024.
A description of each Fund's policies and procedures with respect to the disclosure of each Fund's holdings is available in the prospectuses and Statement of Additional Information.
A copy of proxy policies and procedures is available without charge upon request by calling 1-800-480-4111 and on the Funds' website at www.jpmorganfunds.com. A description of such policies and procedures is on the SEC’s website at www.sec.gov. The Trustees have delegated the authority to vote proxies for securities owned by the Funds to the Adviser. A copy of the Funds' voting record for the most recent 12-month period ended June 30 is available on the SEC’s website at www.sec.gov or at the Funds' website at www.jpmorganfunds.com no later than August 31 of each year. The Funds' proxy voting record will include, among other things, a brief description of the matter voted on for each fund security, and will state how each vote was cast, for example, for or against the proposal.
J.P. Morgan Asset Management is the brand name for the asset management business of JPMorgan Chase & Co. and its affiliates worldwide.
© JPMorgan Chase & Co., 2023. All rights reserved. December 2023.
SAN-SC-1223
Semi-Annual Report
J.P. Morgan Mid Cap/Multi-Cap Funds
December 31, 2023 (Unaudited)
JPMorgan Growth Advantage Fund |
JPMorgan Mid Cap Equity Fund |
JPMorgan Mid Cap Growth Fund |
JPMorgan Mid Cap Value Fund |
JPMorgan Value Advantage Fund |
CONTENTS
Investments in a Fund are not deposits or obligations of, or guaranteed or endorsed by, any bank and are not insured or guaranteed by the FDIC, the Federal Reserve Board or any other government agency. You could lose money if you sell when a Fund’s share price is lower than when you invested.
Past performance is no guarantee of future performance. The general market views expressed in this report are opinions based on market and other conditions through the end of the reporting period and are subject to change without notice. These views are not intended to predict the future performance of a Fund or the securities markets.
Prospective investors should refer to the Funds’ prospectuses for a discussion of the Funds’ investment objectives, strategies and risks. Call J.P. Morgan Funds Service Center at 1-800-480-4111 for a prospectus containing more complete information about a Fund, including management fees and other expenses. Please read it carefully before investing.
Letter to ShareholdersFebruary 7, 2024 (Unaudited)
Dear Shareholder,
U.S. equity markets surged through the end of 2023 and into early 2024 as the risk of economic recession receded and the prospect of lower interest rates drove investor optimism. Globally, financial markets largely generated positive returns, despite heightened geopolitical tensions and signs of economic weakness across Europe and China.
|
“Investors appear to have begun 2024 with a positive outlook, with the U.S. economy and its financial markets leading global growth.” — Brian S. Shlissel
|
Inflation pressures eased sufficiently during the second half of 2023 to allow the U.S. Federal Reserve (the “Fed”) to hold the benchmark discount interest rate at 5.25% at its June 2023 meeting, ending a string of 10 consecutive interest rate increases. The Fed raised rates once more in July 2023, then held the benchmark rate at 5.50% for the remainder of the 2023.
In the face of elevated interest rates, the U.S. economy proved surprisingly resilient and largely led developed markets in growth through the end of 2023. Gross domestic product outpaced economists’ consensus expectations with a 4.9% jump in the third quarter and estimated growth of 3.3% in the fourth quarter. Though the U.S. economy continued to expand, inflation data indicated that the Fed’s efforts to cool the domestic economy appeared to be effective.
Certain other measures of the U.S. economy showed little sign of weakness. Consumer spending remained elevated in the second half of 2023 and rose month-to-month to reach approximately $709.9 billion in retail sales in December 2023. The unemployment rate settled at 3.7% in the final two months of 2023 as approximately 333,000 jobs were added in December alone. Further, an estimated 353,000 jobs were added in January 2024, approximately double the increase anticipated by certain economists.
Both equity and bond markets in the U.S. performed well, buoyed by the overall strength shown by the U.S. economy and the apparent turn in Fed policy. Stronger-than-expected consumer spending and corporate earnings, as well as investor expectations for artificial-intelligence-driven productivity gains bolstered demand for equities in recent months. Certain leading U.S. equity indexes returned more than 9% in November and in excess of 5% in December 2023. In January 2024, the S&P 500 Index reached six new closing highs and surpassed 4,800 points for the first time. However, equity market gains were not broadly spread: The largest 10 stocks in the S&P 500 Index comprised approximately 90% of the index’s price gains for all of 2023.
While U.S. financial markets largely appeared to withstand increased geopolitical tensions in 2023, the potential for the conflicts in Ukraine and Israel to expand in intensity and geography may threaten global economic growth and increase market volatility. Additionally, the Fed may be forced to change policy should the strength of U.S. economy recede or the downward trend in inflation were to reverse.
Investors appear to have begun 2024 with a positive outlook, with the U.S. economy and its financial markets leading global growth. While risks to the growth outlook remain, we believe investors who hold a well-diversified portfolio over the long term should be positioned to benefit from positive economic trends.
Our suite of investment solutions seeks to provide investors with the ability to build durable portfolios that meet their financial goals, regardless of macroeconomic and geopolitical uncertainties.
Sincerely,
Brian S. Shlissel
President, J.P. Morgan Funds
J.P. Morgan Asset Management
1-800-480-4111 or www.jpmorganfunds.com for more information
| J.P. Morgan Mid Cap/Multi-Cap Funds | |
J.P. Morgan Mid Cap/Multi-Cap Funds
MARKET OVERVIEWSIX MONTHS ENDED December 31, 2023 (Unaudited)
U.S. equity markets largely rallied in the final two months of 2023, rebounding from three months of declines to generate positive returns for the six month period. Investor demand for large cap stocks in the technology and communications sectors was a leading driver of equity market returns. Bond markets generally provided positive returns but underperformed equity markets.
After raising its policy benchmark interest rates by 0.25% in July 2023, the U.S. Federal Reserve (the “Fed”) declined to raise rates further at its next three meetings for the year. More importantly for investors, the central bank stated in December 2023 that it could begin to lower interest rates in the first half of 2024, if inflationary pressures continued to recede.
While the U.S. economic growth showed signs of slowing in mid-2023, third-quarter gross domestic product exceeded economists’ consensus expectations with a 4.9% increase. Growth was largely driven by resilient consumer spending and inventory building by businesses. The unemployment rate in the U.S. remained historically low at 3.8% for most of the six-month period before settling at 3.7% in December 2023. The data and the outlook for interest rates fed investor expectations that the U.S. could avoid an economic recession in 2024.
U.S. equities generally outperformed both international developed markets and emerging markets equities for the period. Overall, gains in U.S. markets were led by large capitalization stocks in the technology and communications sectors, particularly the so-called Magnificent Seven: Apple Inc., Amazon.com Inc., Alphabet Inc., Meta Platforms Inc., Microsoft Corp., Nvidia Corp. and Tesla Inc. At the end of 2023, the 10 largest companies in the S&P 500 Index accounted for 31.2% of the index’s total market capitalization. Notably, only within small cap stocks did value outperform growth for the period.
Investor expectations that the Fed and private sector banks could begin to lower their interest rates sparked a broad rally in U.S. fixed income markets in the final two months of 2023. Overall, lower quality bonds, high yield bonds (also known a junk bonds) and emerging markets debt outperformed U.S. Treasury bonds and higher quality U.S. corporate debt.
| J.P. Morgan Mid Cap/Multi-Cap Funds | |
JPMorgan Growth Advantage Fund
FUND COMMENTARYSIX MONTHS ENDED December 31, 2023 (Unaudited)
| |
Fund (Class A Shares, without a sales charge) * | |
Russell 3000 Growth Index | |
Net Assets as of 12/31/2023 (In Thousands) | |
INVESTMENT OBJECTIVE **
The JPMorgan Growth Advantage Fund (the “Fund”) seeks to provide long-term capital growth.
WHAT WERE THE MAIN DRIVERS OF THE FUND’S PERFORMANCE?
The Fund’s Class A Shares, without a sales charge, underperformed the Russell 3000 Growth Index (the “Benchmark”) for the six months ended December 31, 2023.
The Fund’s security selection in the health care and industrials sectors was a leading detractor from performance relative to the Benchmark, while the Fund’s security selection in the technology and consumer discretionary sectors was a leading contributor to relative performance.
Leading individual detractors from relative performance included the Fund’s out-of-Benchmark position in SolarEdge Technologies Inc. and its overweight positions in Confluent Inc. and Exact Sciences Inc. Shares of SolarEdge Technologies, a manufacturer of semiconductor materials and equipment for the solar energy industry, fell amid lower-than-expected reported sales during the period and weakness in the broader solar energy sector. Shares of Confluent, a software developer, fell sharply after the company issued a weaker than expected earnings forecast. Shares of Exact Sciences, a provider of cancer screening and medical diagnostic tests, fell following a rally in the shares in the first half of 2023.
Leading individual contributors to relative performance included the Fund’s underweight position in Apple Inc. and its overweight positions in Intuit Inc. and Uber Technologies Inc. Shares of Apple, a diversified information technology provider, fell late in the period following a rally that pushed the company’s share price to a record high on December 14, 2023. Shares of Intuit, a financial software developer, rose after the company reported better-than-expected earnings and revenue for its fiscal first quarter. Shares of Uber Technologies, a ride-hailing service, rose amid increased bookings and after the company was included in the S&P 500 Index.
HOW WAS THE FUND POSITIONED?
The Fund’s portfolio managers utilized a bottom-up approach to stock selection, researching individual companies across
market capitalizations in an effort to construct portfolios of stocks that have strong fundamentals. The Fund’s portfolio managers sought to invest in high quality companies with durable franchises that, in their view, possessed the ability to
generate strong future earnings growth.
TOP TEN HOLDINGS OF THE
PORTFOLIO AS OF December 31, 2023 | PERCENT OF
TOTAL
INVESTMENTS |
| | |
| | |
| | |
| | |
| Meta Platforms, Inc., Class A | |
| | |
| Mastercard, Inc., Class A | |
| | |
| | |
| | |
PORTFOLIO COMPOSITION BY SECTOR
AS OF December 31, 2023 | PERCENT OF
TOTAL
INVESTMENTS |
| |
| |
| |
| |
| |
| |
| |
Others (each less than 1.0%) | |
| |
*
The return shown is based on net asset values calculated for shareholder transactions and may differ from the return shown in the financial highlights, which reflects adjustments made to the net asset values in accordance with accounting principles generally accepted in the United States of America.
**
The adviser seeks to achieve the Fund’s objective. There can be no guarantee it will be achieved.
| J.P. Morgan Mid Cap/Multi-Cap Funds | |
JPMorgan Growth Advantage Fund
FUND COMMENTARYSIX MONTHS ENDED December 31, 2023 (Unaudited) (continued)
AVERAGE ANNUAL TOTAL RETURNS AS OF December 31, 2023
|
| |
| Sales Charge for Class A Shares is 5.25%. |
| Assumes a 1% CDSC (contingent deferred sales charge) for the 6 month and one year periods and 0% CDSC thereafter. |
TEN YEAR FUND PERFORMANCE (12/31/13 TO 12/31/23)
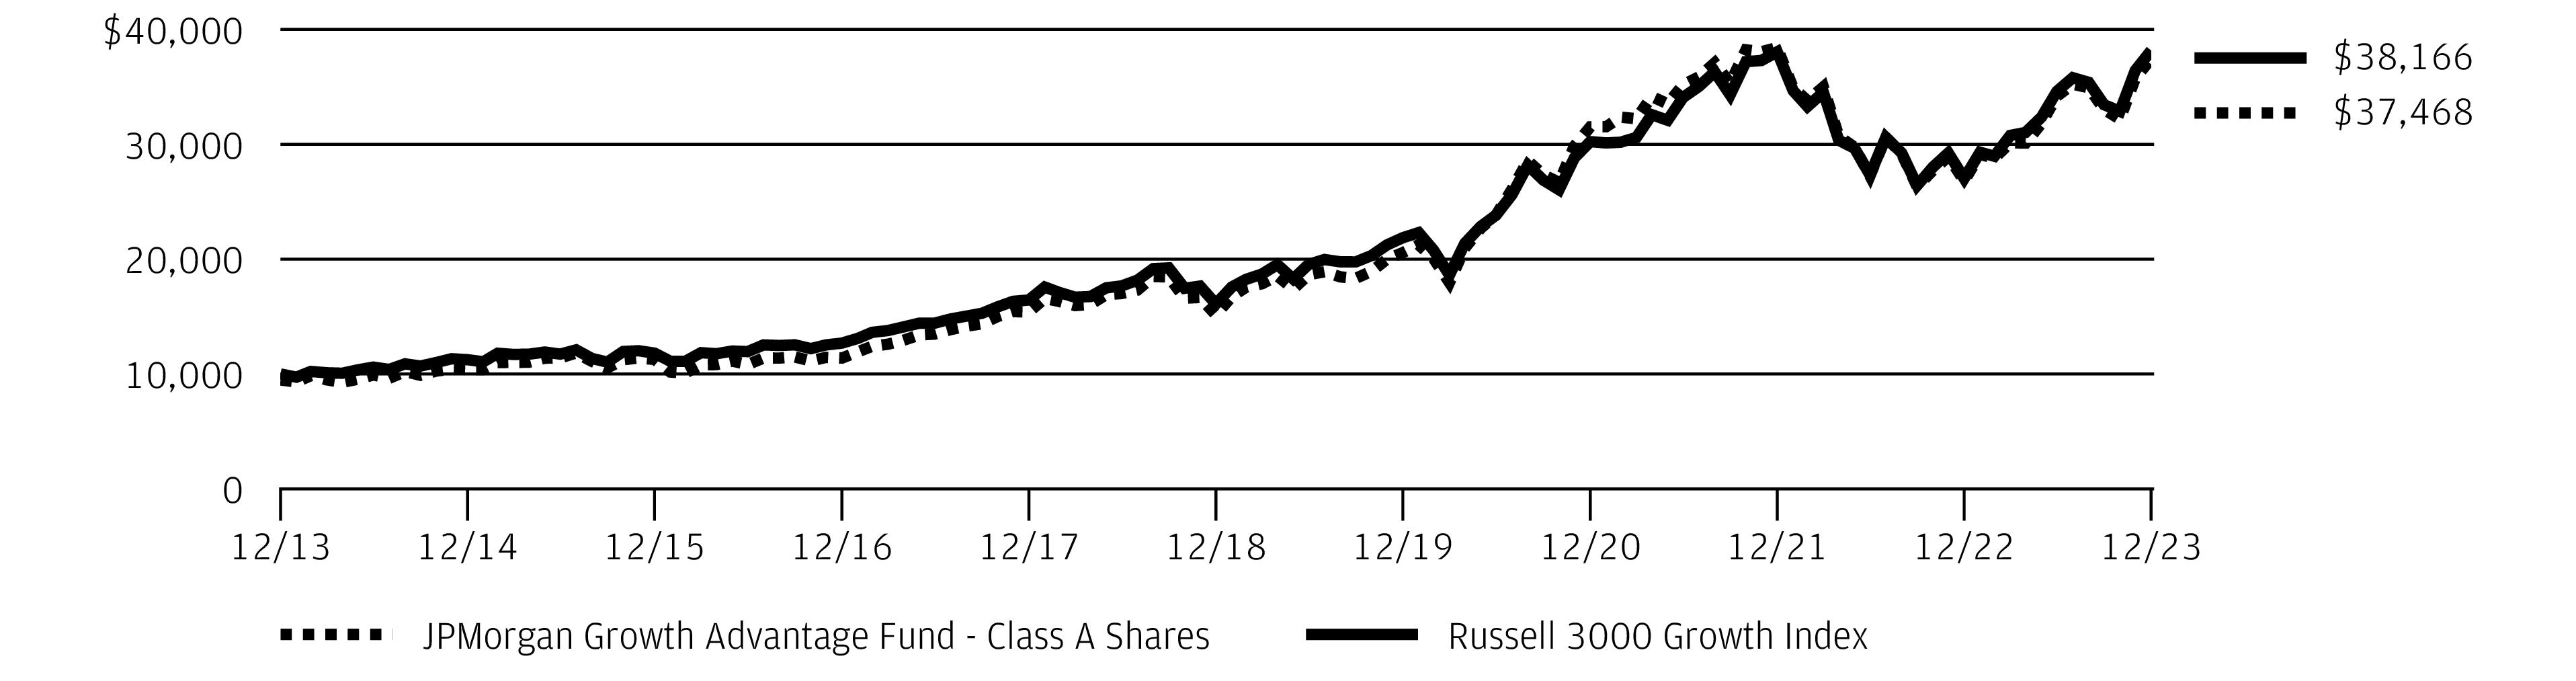
The performance quoted is past performance and is not a guarantee of future results. Mutual funds are subject to certain market risks. Investment returns and principal value of an investment will fluctuate so that an investor’s shares, when redeemed, may be worth more or less than their original cost. Current performance may be higher or lower than the performance data shown. Updated performance information is available by visiting www.jpmorganfunds.com or by calling 1-800-480-4111.
Returns for Class R2 and Class R3 Shares prior to their inception dates are based on the performance of Class A Shares. The actual returns for Class R2 Shares would have been lower than those shown because Class R2 Shares have higher expenses than Class A Shares. The actual returns for Class R3 Shares would have been similar to those shown because Class R3 Shares have similar expenses to Class A Shares.
Returns for Class R4 Shares prior to their inception dates are based on the performance of Class I Shares. The actual returns of Class R4 Shares would have been different than those shown because Class R4 Shares have different expenses to Class I Shares.
The graph illustrates comparative performance for $10,000 invested in Class A Shares of the JPMorgan Growth Advantage Fund and the Russell 3000 Growth Index from December 31, 2013 to December 31, 2023. The performance of the Fund assumes reinvestment of all dividends and capital gain distributions, if any, and includes a sales charge. The performance of the Russell 3000 Growth Index does not reflect the deduction of expenses or a sales charge associated with a mutual fund and has been adjusted to reflect reinvestment of all
dividends and capital gain distributions of the securities included in the benchmark, if applicable. The Russell 3000 Growth Index is an unmanaged index which measures the performance of those Russell 3000 companies (largest 3000 U.S. companies) with higher price-to-book ratios and higher forecasted growth values. Investors cannot invest directly in an index.
Class A Shares have a $1,000 minimum initial investment and carry a 5.25% sales charge.
Fund performance may reflect the waiver of the Fund’s fees and reimbursement of expenses for certain periods. Without these waivers and reimbursements, performance would have been lower. Also, performance shown in this section does not reflect the deduction of taxes that a shareholder would pay on Fund distributions or on gains resulting from redemptions of Fund shares.
Because Class C Shares automatically convert to Class A Shares after 8 years, the 10 year average annual total return shown above for Class C Shares reflects Class A Share's performance for the period after conversion.
The returns shown are based on net asset values calculated for shareholder transactions and may differ from the returns shown in the financial highlights, which reflect adjustments made to the net asset values in accordance with accounting principles generally accepted in the United States of America.
Frank Russell Company is the source and owner of the Russell Index data contained or reflected in this material and all trademarks and copyrights related thereto. Frank Russell Company is not responsible for the formatting or configuration of this material or for any inaccuracy in the adviser's presentation thereof.
| J.P. Morgan Mid Cap/Multi-Cap Funds | |
JPMorgan Mid Cap Equity Fund
FUND COMMENTARYSIX MONTHS ENDED December 31, 2023 (Unaudited)
| |
| |
| |
Net Assets as of 12/31/2023 (In Thousands) | |
INVESTMENT OBJECTIVE **
The JPMorgan Mid Cap Equity Fund (the “Fund”) seeks long-term capital growth.
WHAT WERE THE MAIN DRIVERS OF THE FUND’S PERFORMANCE?
The Fund’s Class I Shares underperformed the Russell Midcap Index (the “Benchmark”) for the six months ended December 31, 2023.
The Fund’s security selection in the industrials and energy sectors was a leading detractor from performance relative to the Benchmark, while the Fund’s security selection in the consumer discretionary and consumer staples sectors was a leading contributor to relative performance.
Leading individual detractors from relative performance included the Fund’s out-of-Benchmark position in SolarEdge Technologies Inc. and its overweight positions in LKQ Corp. and Confluent Inc. Shares of SolarEdge Technologies, a manufacturer of semiconductor materials and equipment for the solar energy industry, fell amid lower-than-expected reported sales during the period and weakness in the broader solar energy sector. Shares of LKQ, an automotive parts distributor, fell after the company reported lower-than-expected earnings for the third quarter of 2023. Shares of Confluent, a software developer, fell sharply after the company issued a weaker than expected earnings forecast.
Leading individual contributors to relative performance included the Fund’s overweight positions in ITT Inc., CrowdStrike Holdings Inc., and Jabil Inc. Shares of ITT, a manufacturer of industrial machinery and components, rose amid consecutive quarters of better-than-expected earnings during the period. Shares of CrowdStrike Holdings, a data security software provider, rose amid surging corporate demand for cybersecurity and artificial intelligence technologies. Shares of Jabil, an electronics manufacturer, rose after the company reported better-than-expected earnings and revenue for its fiscal first quarter.
HOW WAS THE FUND POSITIONED?
The Fund’s portfolio managers employed a bottom-up approach to stock selection, constructing a portfolio based on company
fundamentals, quantitative screening and proprietary fundamental analysis. The Fund’s portfolio managers sought to identify dominant franchises with predictable business models they deemed capable of achieving, in their view, sustained growth, as well as undervalued companies with the potential to
grow their intrinsic value per share.
TOP TEN HOLDINGS OF THE
PORTFOLIO AS OF December 31, 2023 | PERCENT OF
TOTAL
INVESTMENTS |
| | |
| | |
| | |
| Ameriprise Financial, Inc. | |
| | |
| Raymond James Financial, Inc. | |
| Teledyne Technologies, Inc. | |
| | |
| | |
| | |
PORTFOLIO COMPOSITION BY SECTOR
AS OF December 31, 2023 | PERCENT OF
TOTAL
INVESTMENTS |
| |
| |
| |
| |
| |
| |
| |
| |
| |
| |
| |
| |
*
The return shown is based on net asset values calculated for shareholder transactions and may differ from the return shown in
| J.P. Morgan Mid Cap/Multi-Cap Funds | |
JPMorgan Mid Cap Equity Fund
FUND COMMENTARYSIX MONTHS ENDED December 31, 2023 (Unaudited) (continued)
the financial highlights, which reflects adjustments made to the net asset values in accordance with accounting principles generally accepted in the United States of America.
**
The adviser seeks to achieve the Fund’s objective. There can be no guarantee it will be achieved.
| J.P. Morgan Mid Cap/Multi-Cap Funds | |
AVERAGE ANNUAL TOTAL RETURNS AS OF December 31, 2023
|
| |
| Sales Charge for Class A Shares is 5.25%. |
| Assumes a 1% CDSC (contingent deferred sales charge) for the 6 month and one year periods and 0% CDSC thereafter. |
TEN YEAR FUND PERFORMANCE (12/31/13 TO 12/31/23)
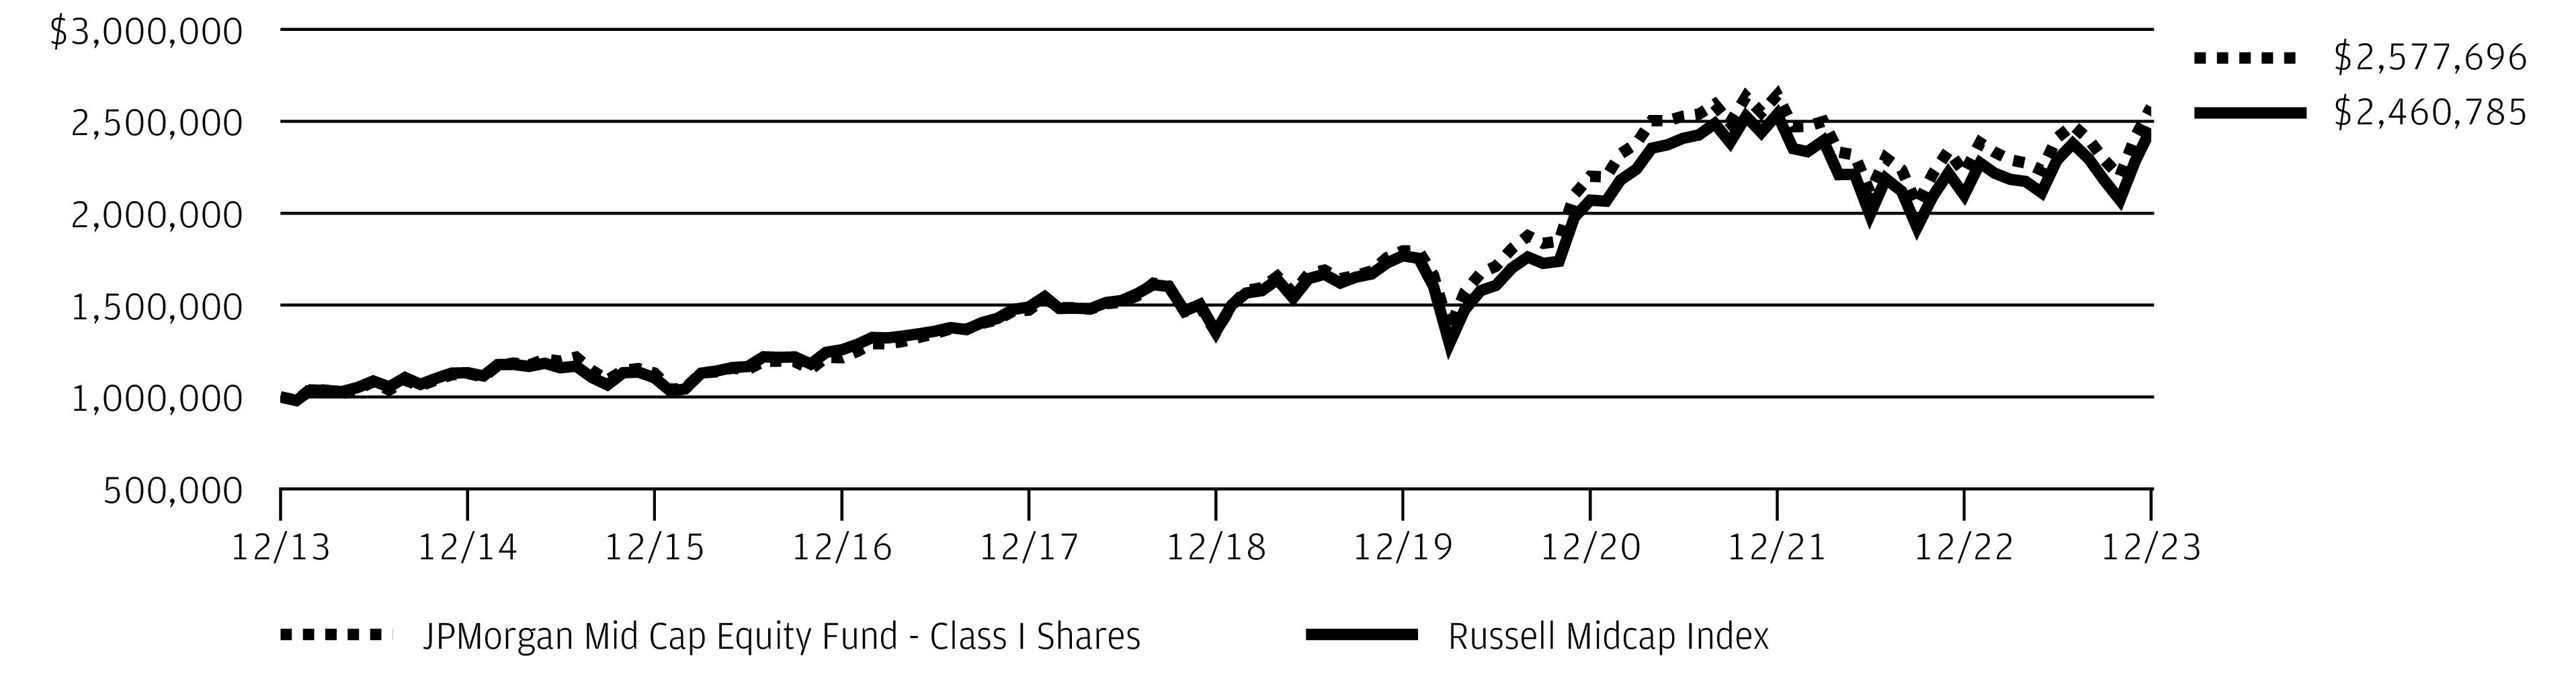
The performance quoted is past performance and is not a guarantee of future results. Mutual funds are subject to certain market risks. Investment returns and principal value of an investment will fluctuate so that an investor’s shares, when redeemed, may be worth more or less than their original cost. Current performance may be higher or lower than the performance data shown. Updated performance information is available by visiting www.jpmorganfunds.com or by calling 1-800-480-4111.
Returns for Class R2 Shares prior to their inception date are based on the performance of Class A Shares. The actual returns of Class R2 Shares would have been lower than those shown because Class R2 Shares have higher expenses than Class A Shares.
Returns for Class R5 and Class R6 Shares prior to their inception date are based on the performance of Class I Shares. The actual returns of Class R5 and Class R6 Shares would have been different than those shown because Class R5 and Class R6 Shares have different expenses than Class I Shares.
The graph illustrates comparative performance for $1,000,000 invested in the Class I Shares of JPMorgan Mid Cap Equity Fund and the Russell Midcap Index from December 31, 2013 to December 31, 2023. The performance of the Fund assumes reinvestment of all dividends and capital gain distributions, if any, and does not include a sales charge. The performance of the Russell Midcap Index does not reflect the deduction of expenses or a sales charge associated with a mutual fund and has been adjusted to reflect reinvestment of all dividends and capital gain distributions of the securities included in the bench mark, if
applicable. The Russell Midcap Index is an unmanaged index which measures the performance of the 800 smallest companies in the Russell 1000 Index. Investors cannot invest directly in an index.
Class I Shares have a $1,000,000 minimum initial investment.
Fund performance may reflect the waiver of the Fund’s fees and reimbursement of expenses for certain periods. Without these waivers and reimbursements, performance would have been lower. Also, performance shown in this section does not reflect the deduction of taxes that a shareholder would pay on Fund distributions or on gains resulting from redemptions of Fund shares.
Because Class C Shares automatically convert to Class A Shares after 8 years, the 10 year average annual total return shown above for Class C Shares reflects Class A Share's performance for the period after conversion.
The returns shown are based on net asset values calculated for shareholder transactions and may differ from the returns shown in the financial highlights, which reflect adjustments made to the net asset values in accordance with accounting principles generally accepted in the United States of America.
Frank Russell Company is the source and owner of the Russell Index data contained or reflected in this material and all trademarks and copyrights related thereto. Frank Russell Company is not responsible for the formatting or configuration of this material or for any inaccuracy in the adviser's presentation thereof.
| J.P. Morgan Mid Cap/Multi-Cap Funds | |
JPMorgan Mid Cap Growth Fund
FUND COMMENTARYSIX MONTHS ENDED December 31, 2023 (Unaudited)
| |
| |
Russell Midcap Growth Index | |
Net Assets as of 12/31/2023 (In Thousands) | |
INVESTMENT OBJECTIVE **
The JPMorgan Mid Cap Growth Fund (the “Fund”) seeks growth of capital.
WHAT WERE THE MAIN DRIVERS OF THE FUND’S PERFORMANCE?
The Fund’s Class I Shares underperformed the Russell Midcap Growth Index (the “Benchmark”) for the six months ended December 31, 2023.
The Fund’s security selection in the technology and industrials sectors was a leading detractor from performance relative to the Benchmark, while the Fund’s security selection in the consumer discretionary sector and its underweight position in the consumer staples sectors were leading contributors to relative performance.
Leading individual detractors from relative performance included the Fund’s out-of-Benchmark position in SolarEdge Technologies Inc. and its overweight positions in Confluent Inc. and Exact Sciences Inc. Shares of SolarEdge Technologies, a manufacturer of semiconductor materials and equipment for the solar energy industry, fell amid lower-than-expected reported sales during the period and weakness in the broader solar energy sector. Shares of Confluent, a software developer, fell sharply after the company issued a weaker-than-expected earnings forecast. Shares of Exact Sciences, a provider of cancer screening and medical diagnostic tests, fell following a rally in the shares in the first half of 2023.
Leading individual contributors to relative performance included the Fund’s overweight position in CrowdStrike Holdings Inc., its out-of-Benchmark position in Uber Technologies Inc. and its underweight position in Paycom Software Inc. Shares of CrowdStrike Holdings, a data security software provider, rose amid surging corporate demand for cybersecurity and artificial intelligence technologies. Shares of Uber Technologies, a ride-hailing service, rose amid increased bookings and after the company was included in the S&P 500 Index. Shares of Paycom Software, a provider of business management software, fell after the company reported lower-than-expected revenue for the third quarter of 2023 and issued a weaker-than-expected revenue forecast for the fourth quarter of 2023.
HOW WAS THE FUND POSITIONED?
The Fund’s portfolio managers utilized a bottom-up approach to stock selection, researching individual companies in an effort to construct a portfolio of stocks that have strong fundamentals. The Fund’s portfolio managers sought to invest in high quality companies with durable franchises that, in their view, possessed the ability to generate strong future earnings
growth.
TOP TEN HOLDINGS OF THE
PORTFOLIO AS OF December 31, 2023 | PERCENT OF
TOTAL
INVESTMENTS |
| Crowdstrike Holdings, Inc., Class A | |
| | |
| | |
| | |
| | |
| Agilent Technologies, Inc. | |
| | |
| Trade Desk, Inc. (The), Class A | |
| | |
| | |
PORTFOLIO COMPOSITION BY SECTOR
AS OF December 31, 2023 | PERCENT OF
TOTAL
INVESTMENTS |
| |
| |
| |
| |
| |
| |
| |
| |
Others (each less than 1.0%) | |
| |
*
The return shown is based on net asset values calculated for shareholder transactions and may differ from the return shown in
| J.P. Morgan Mid Cap/Multi-Cap Funds | |
the financial highlights, which reflects adjustments made to the net asset values in accordance with accounting principles generally accepted in the United States of America.
**
The adviser seeks to achieve the Fund’s objective. There can be no guarantee it will be achieved.
| J.P. Morgan Mid Cap/Multi-Cap Funds | |
JPMorgan Mid Cap Growth Fund
FUND COMMENTARYSIX MONTHS ENDED December 31, 2023 (Unaudited) (continued)
AVERAGE ANNUAL TOTAL RETURNS AS OF December 31, 2023
|
| |
| Sales Charge for Class A Shares is 5.25%. |
| Assumes a 1% CDSC (contingent deferred sales charge) for the 6 month and one year periods and 0% CDSC thereafter. |
TEN YEAR FUND PERFORMANCE (12/31/13 TO 12/31/23)

The performance quoted is past performance and is not a guarantee of future results. Mutual funds are subject to certain market risks. Investment returns and principal value of an investment will fluctuate so that an investor’s shares, when redeemed, may be worth more or less than their original cost. Current performance may be higher or lower than the performance data shown. Updated performance information is available by visiting www.jpmorganfunds.com or by calling 1-800-480-4111.
Returns for the Class R3 and Class R4 Shares prior to their inception dates are based on the performance of Class I Shares. Prior performance for Class R3 and Class R4 Shares has been adjusted to reflect the differences in expenses between classes.
The graph illustrates comparative performance for $1,000,000 invested in Class I Shares of the JPMorgan Mid Cap Growth Fund and the Russell Midcap Growth Index from December 31, 2013 to December 31, 2023. The performance of the Fund assumes reinvestment of all dividends and capital gain distributions, if any, and does not include a sales charge. The performance of the Russell Midcap Growth Index does not reflect the deduction of expenses or a sales charge associated with a mutual fund and has been adjusted to reflect reinvestment of all dividends and capital gain distributions of the securities included in the benchmark, if applicable. The Russell Midcap Growth Index is an unmanaged index which measures the performance of those Russell Midcap companies with higher price-to-book ratios and higher forecasted growth values. Investors cannot invest directly in an index.
Class I Shares have a $1,000,000 minimum initial investment.
Fund performance may reflect the waiver of the Fund’s fees and reimbursement of expenses for certain periods. Without these waivers and reimbursements, performance would have been lower. Also, performance shown in this section does not reflect the deduction of taxes that a shareholder would pay on Fund distributions or on gains resulting from redemptions of Fund shares.
Because Class C Shares automatically convert to Class A Shares after 8 years, the 10 year average annual total return shown above for Class C Shares reflects Class A Share's performance for the period after conversion.
The returns shown are based on net asset values calculated for shareholder transactions and may differ from the returns shown in the financial highlights, which reflect adjustments made to the net asset values in accordance with accounting principles generally accepted in the United States of America.
Frank Russell Company is the source and owner of the Russell Index data contained or reflected in this material and all trademarks and copyrights related thereto. Frank Russell Company is not responsible for the formatting or configuration of this material or for any inaccuracy in the adviser's presentation thereof.
| J.P. Morgan Mid Cap/Multi-Cap Funds | |
JPMorgan Mid Cap Value Fund
FUND COMMENTARYSIX MONTHS ENDED December 31, 2023 (Unaudited)
| |
| |
Russell Midcap Value Index | |
Net Assets as of 12/31/2023 (In Thousands) | |
INVESTMENT OBJECTIVE**
The JPMorgan Mid Cap Value Fund (the “Fund”) seeks growth from capital appreciation.
WHAT WERE THE MAIN DRIVERS OF THE FUND’S PERFORMANCE?
The Fund’s Class L Shares underperformed the Russell Midcap Value Index (the “Benchmark”) for the six months ended December 31, 2023.
The Fund’s security selection in the consumer discretionary and financials sector was a leading detractor from performance relative to the Benchmark, while the Fund’s security selection in the information technology and materials sectors was a leading contributor to relative performance.
Leading individual detractors from relative performance included the Fund’s overweight positions in LKQ Corp. and IAC Inc., and its underweight position in Coinbase Global Inc.
Shares of LKQ, an automotive parts distributor, fell after the company reported lower-than-expected earnings for the third quarter of 2023. Shares of IAC, a provider of interactive media and services, fell amid consecutive quarters of lower-than-expected earnings. Shares of Coinbase Global, a cryptocurrency exchange provider, rose amid a broad rally among stocks in the cryptocurrency subsector late in the period.
Leading individual contributors to relative performance included the Fund’s overweight positions in GoDaddy Inc., ITT Inc. and Expedia Group Inc. Shares of GoDaddy, an e-commerce platform provider, rose after the company reported better-than-expected earnings and revenue for the third quarter of 2023 and investor expectations for the company’s artificial intelligence technology. Shares of ITT, a manufacturer of industrial machinery and components, rose amid consecutive quarters of better-than-expected earnings during the period. Shares of Expedia Group, an online travel and vacation booking service, rose after the company reported better-than-expected earnings and revenue for the third quarter and unveiled a $5 billion share repurchase plan.
HOW WAS THE FUND POSITIONED?
The Fund’s portfolio managers utilized a bottom-up approach to stock selection and sought to identify durable franchises possessing the ability to generate, in their view, sustainable
levels of free cash flow.
TOP TEN HOLDINGS OF THE
PORTFOLIO AS OF December 31, 2023 | PERCENT OF
TOTAL
INVESTMENTS |
| Ameriprise Financial, Inc. | |
| | |
| | |
| | |
| | |
| | |
| Martin Marietta Materials, Inc. | |
| | |
| | |
| Lincoln Electric Holdings, Inc. | |
PORTFOLIO COMPOSITION BY SECTOR
AS OF December 31, 2023 | PERCENT OF
TOTAL
INVESTMENTS |
| |
| |
| |
| |
| |
| |
| |
| |
| |
| |
| |
| |
*
The return shown is based on net asset values calculated for shareholder transactions and may differ from the return shown in the financial highlights, which reflects adjustments made to the net asset values in accordance with accounting principles generally accepted in the United States of America.
**
The adviser seeks to achieve the Fund’s objective. There can be no guarantee it will be achieved.
| J.P. Morgan Mid Cap/Multi-Cap Funds | |
JPMorgan Mid Cap Value Fund
FUND COMMENTARYSIX MONTHS ENDED December 31, 2023 (Unaudited) (continued)
AVERAGE ANNUAL TOTAL RETURNS AS OF December 31, 2023
|
| |
| Sales Charge for Class A Shares is 5.25%. |
| Assumes a 1% CDSC (contingent deferred sales charge) for the 6 month and one year periods and 0% CDSC thereafter. |
TEN YEAR FUND PERFORMANCE (12/31/13 TO 12/31/23)

The performance quoted is past performance and is not a guarantee of future results. Mutual funds are subject to certain market risks. Investment returns and principal value of an investment will fluctuate so that an investor’s shares, when redeemed, may be worth more or less than their original cost. Current performance may be higher or lower than the performance data shown. Updated performance information is available by visiting www.jpmorganfunds.com or by calling 1-800-480-4111.
Returns for Class R3 Shares prior to their inception dates are based on the performance of Class A Shares. The actual returns of Class R3 Shares would have been lower than those shown because Class R3 Shares have higher expenses than Class A Shares.
Returns for the Class R4 Shares prior to their inception date are based on the performance of Class I Shares. The actual returns of Class R4 Shares would have been lower because Class R4 Shares have higher expenses than Class I Shares.
Returns for the Class R5 and R6 Shares prior to their inception date are based on the performance of Class L Shares. The actual returns of Class R5 Shares would have been lower than those shown because Class R5 Shares have higher expenses than Class L Shares. The actual returns for Class R6 Shares would have been different than those shown because Class R6 Shares have different expenses to Class L Shares.
The graph illustrates comparative performance for $3,000,000 invested in Class L Shares of the JPMorgan Mid Cap Value Fund and the Russell Midcap Value Index from December 31, 2013 to December 31, 2023. The performance of the Fund assumes reinvestment of all dividends and capital gain distributions, if any, and does not include a sales charge. The performance of the Russell Mid-cap Value Index does not reflect the deduction of expenses or a sales charge associated with a mutual fund and has been adjusted to reflect reinvestment of all dividends and capital gain distributions of the securities included in the benchmark, if applicable. The Russell Midcap Value Index is an unmanaged index which measures the performance of those Russell Midcap companies with lower price-to-book ratios and lower forecasted growth values. Investors cannot invest directly in an index.
Class L Shares have a $3,000,000 minimum initial investment.
Fund performance may reflect the waiver of the Fund’s fees and reimbursement of expenses for certain periods. Without these waivers and reimbursements, performance would have been lower. Also, performance shown in this section does not reflect the deduction of taxes that a shareholder would pay on Fund distributions or on gains resulting from redemptions of Fund shares.
Because Class C Shares automatically convert to Class A Shares after 8 years, the 10 year average annual total return shown above for Class C Shares reflects Class A Share's performance for the period after conversion.
| J.P. Morgan Mid Cap/Multi-Cap Funds | |
The returns shown are based on net asset values calculated for shareholder transactions and may differ from the returns shown in the financial highlights, which reflect adjustments made to the net asset values in accordance with accounting principles generally accepted in the United States of America.
Frank Russell Company is the source and owner of the Russell Index data contained or reflected in this material and all trademarks and copyrights related
thereto. Frank Russell Company is not responsible for the formatting or configuration of this material or for any inaccuracy in the adviser's presentation thereof.
| J.P. Morgan Mid Cap/Multi-Cap Funds | |
JPMorgan Value Advantage Fund
FUND COMMENTARYSIX MONTHS ENDED December 31, 2023 (Unaudited)
| |
| |
| |
Net Assets as of 12/31/2023 (In Thousands) | |
INVESTMENT OBJECTIVE**
The JPMorgan Value Advantage Fund (the “Fund”) seeks to provide long-term total return from a combination of income and capital gains.
WHAT WERE THE MAIN DRIVERS OF THE FUND’S PERFORMANCE?
The Fund’s Class L Shares outperformed the Russell 3000 Value Index (the “Benchmark”) for the six months ended December 31, 2023.
The Fund’s security selection in the health care and consumer discretionary sectors was a leading contributor to performance relative to the Benchmark, while the Fund’s underweight positions in the information technology and industrials sectors was a leading detractor from relative performance.
Leading individual contributors to relative performance included the Fund’s overweight position in Capital One Financial Corp. and its underweight positions in Pfizer Inc. and Exxon Mobil Corp. Shares of Capital One Financial, a credit card and consumer banking provider, rose after the company reported consecutive quarters of better-than-expected earnings and amid investor expectations that banks would generally benefit from lower interest rates in 2024. Shares of Pfizer, a pharmaceuticals developer and health care products manufacturer not held in the Fund, fell after the company issued a weaker-than-expected earnings forecast. Shares of Exxon Mobil, an integrated petroleum and natural gas producer, fell after the company reported lower-than-expected earnings and revenue for the third quarter of 2023, and amid investor concerns over increased regulatory scrutiny of the company’s proposed $60 billion takeover of Pioneer Natural Resources Co.
Leading individual detractors from relative performance included the Fund’s underweight positions in Intel Inc. and JPMorgan Chase & Co., and its overweight position in Bristol-Myers Squibb Co. Shares of Intel, a semiconductor manufacturer not held in the Fund, rose amid broad demand for artificial intelligence technologies and after the company obtained a $3.2 billion grant from Israel to build a factory there. Shares of JPMorgan Chase, a banking and financial services company that the Fund is prohibited from holding because it is an affiliate, rose amid consecutive quarters of better-than-expected earnings and investor expectations that the company
would benefit from lower interest rates in 2024. Shares of Bristol-Myers Squibb, a developer and manufacturer of pharmaceuticals, fell after the company reported a decline in sales for the third quarter of 2023, amid increased competition from generic versions of the company’s leading anti-cancer drug.
HOW WAS THE FUND POSITIONED?
The Fund’s portfolio managers utilized a bottom-up approach to stock selection and sought to identify durable franchises possessing the ability to generate, in the portfolio managers’
view, significant levels of free cash flow.
TOP TEN HOLDINGS OF THE
PORTFOLIO AS OF December 31, 2023 | PERCENT OF
TOTAL
INVESTMENTS |
| Berkshire Hathaway, Inc., Class B | |
| Capital One Financial Corp. | |
| | |
| | |
| | |
| | |
| | |
| | |
| | |
| Martin Marietta Materials, Inc. | |
PORTFOLIO COMPOSITION BY SECTOR
AS OF December 31, 2023 | PERCENT OF
TOTAL
INVESTMENTS |
| |
| |
| |
| |
| |
| |
| |
| |
| |
| |
| |
| |
| J.P. Morgan Mid Cap/Multi-Cap Funds | |
*
The return shown is based on net asset values calculated for shareholder transactions and may differ from the return shown in the financial highlights, which reflects adjustments made to the net asset values in accordance with accounting principles generally accepted in the United States of America.
**
The adviser seeks to achieve the Fund’s objective. There can be no guarantee it will be achieved.
| J.P. Morgan Mid Cap/Multi-Cap Funds | |
JPMorgan Value Advantage Fund
FUND COMMENTARYSIX MONTHS ENDED December 31, 2023 (Unaudited) (continued)
AVERAGE ANNUAL TOTAL RETURNS AS OF December 31, 2023
|
| |
| Sales Charge for Class A Shares is 5.25%. |
| Assumes a 1% CDSC (contingent deferred sales charge) for the 6 month and one year periods and 0% CDSC thereafter. |
TEN YEAR FUND PERFORMANCE (12/31/13 TO 12/31/23)
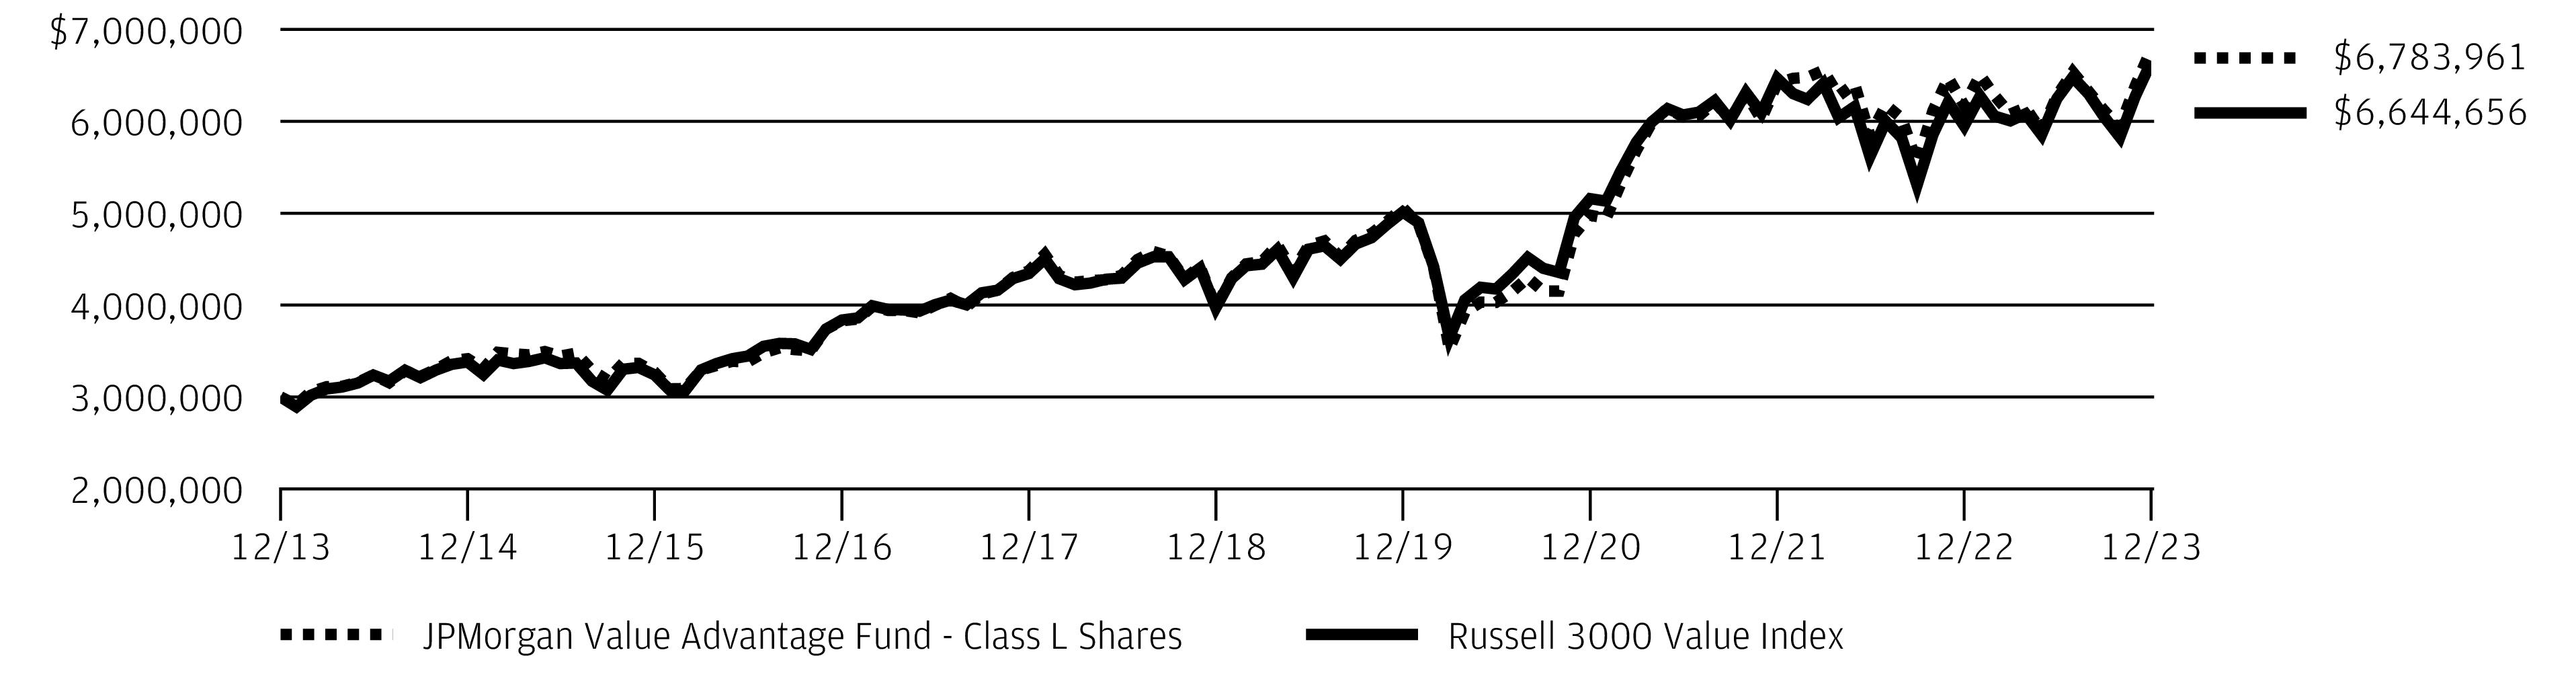
The performance quoted is past performance and is not a guarantee of future results. Mutual funds are subject to certain market risks. Investment returns and principal value of an investment will fluctuate so that an investor’s shares, when redeemed, may be worth more or less than their original cost. Current performance may be higher or lower than the performance data shown. Updated performance information is available by visiting www.jpmorganfunds.com or by calling 1-800-480-4111.
Returns for Class R2 and Class R3 Shares prior to their inception date are based on the performance of Class A Shares. The actual returns of Class R2 Shares would have been lower than those shown because Class R2 Shares have higher expenses than Class A Shares. Returns for Class R3 Shares would have been similar to those shown because Class R3 Shares have similar expenses to Class A Shares.
Returns for the Class R4 Shares prior to their inception date are based on the performance of Class I Shares. The actual returns of Class R4 Shares would have been similar to those shown because Class R4 Shares have similar expenses to Class I Shares.
Returns for the Class R5 and Class R6 Shares prior to their inception date are based on the performance of Class L Shares. The actual returns for Class R5 and Class R6 Shares would have been different than those shown because Class R5 and Class R6 Shares have different expenses to Class L Shares.
The graph illustrates comparative performance for $3,000,000 invested in Class L Shares of the JPMorgan Value Advantage Fund and the Russell 3000 Value Index from December 31, 2013 to December 31, 2023. The performance of the Fund assumes reinvestment of all dividends and capital gain distributions, if any, and does not include a sales charge. The performance of the Russell 3000 Value Index does not reflect the deduction of expenses or a sales charge associated with a mutual fund and has been adjusted to reflect reinvestment of all dividends and capital gain distributions of the securities included in the benchmark, if applicable. The Russell 3000 Value Index is an unmanaged index which measures the performance of those Russell 3000 companies (largest 3000 U.S. companies) with lower price-to-book ratios and lower forecasted growth values. Investors cannot invest directly in an index.
Class L Shares have a $3,000,000 minimum initial investment.
Fund performance may reflect the waiver of the Fund’s fees and reimbursement of expenses for certain periods. Without these waivers and reimbursements, performance would have been lower. Also, performance shown in this section does not reflect the deduction of taxes that a shareholder would pay on Fund distributions or on gains resulting from redemptions of Fund shares.
Because Class C Shares automatically convert to Class A Shares after 8 years, the 10 year average annual total return shown above for Class C Shares reflects Class A Share's performance for the period after conversion.
| J.P. Morgan Mid Cap/Multi-Cap Funds | |
The returns shown are based on net asset values calculated for shareholder transactions and may differ from the returns shown in the financial highlights, which reflect adjustments made to the net asset values in accordance with accounting principles generally accepted in the United States of America.
Frank Russell Company is the source and owner of the Russell Index data contained or reflected in this material and all trademarks and copyrights related
thereto. Frank Russell Company is not responsible for the formatting or configuration of this material or for any inaccuracy in the adviser's presentation thereof.
| J.P. Morgan Mid Cap/Multi-Cap Funds | |
JPMorgan Growth Advantage Fund
SCHEDULE OF PORTFOLIO INVESTMENTSAS OF December 31, 2023 (Unaudited)
| | |
|
|
| | |
|
Constellation Brands, Inc., Class A | | |
|
Alnylam Pharmaceuticals, Inc. * | | |
| | |
| | |
Regeneron Pharmaceuticals, Inc. * | | |
| | |
|
| | |
|
| | |
|
| | |
| | |
| | |
| | |
Commercial Services & Supplies — 1.0% |
| | |
Communications Equipment — 0.6% |
| | |
Construction & Engineering — 1.7% |
| | |
| | |
| | |
|
| | |
Electrical Equipment — 1.5% |
| | |
| | |
| | |
Electronic Equipment, Instruments & Components — 0.8% |
| | |
Energy Equipment & Services — 0.9% |
TechnipFMC plc (United Kingdom) | | |
| | |
|
|
| | |
Take-Two Interactive Software, Inc. * | | |
| | |
Financial Services — 3.3% |
Mastercard, Inc., Class A | | |
Ground Transportation — 2.8% |
JB Hunt Transport Services, Inc. | | |
Old Dominion Freight Line, Inc. | | |
Uber Technologies, Inc. * | | |
| | |
Health Care Equipment & Supplies — 2.0% |
| | |
| | |
Intuitive Surgical, Inc. * | | |
| | |
Health Care Providers & Services — 2.6% |
| | |
| | |
| | |
Hotels, Restaurants & Leisure — 1.9% |
| | |
Hilton Worldwide Holdings, Inc. | | |
| | |
Household Durables — 0.5% |
| | |
|
| | |
Interactive Media & Services — 8.7% |
Alphabet, Inc., Class C * | | |
Meta Platforms, Inc., Class A * | | |
| | |
|
| | |
Snowflake, Inc., Class A * | | |
| | |
Life Sciences Tools & Services — 1.3% |
Mettler-Toledo International, Inc. * | | |
Thermo Fisher Scientific, Inc. | | |
| | |
SEE NOTES TO FINANCIAL STATEMENTS.
| J.P. Morgan Mid Cap/Multi-Cap Funds | |
| | |
Common Stocks — continued |
|
| | |
|
Trade Desk, Inc. (The), Class A * | | |
|
| | |
Oil, Gas & Consumable Fuels — 1.3% |
| | |
| | |
| | |
|
| | |
Royalty Pharma plc, Class A | | |
| | |
Professional Services — 0.7% |
Booz Allen Hamilton Holding Corp. | | |
Semiconductors & Semiconductor Equipment — 10.3% |
Advanced Micro Devices, Inc. * | | |
| | |
| | |
| | |
| | |
| | |
|
Cadence Design Systems, Inc. * | | |
Confluent, Inc., Class A * | | |
| | |
Crowdstrike Holdings, Inc., Class A * | | |
| | |
| | |
| | |
| | |
Palo Alto Networks, Inc. * | | |
| | |
| | |
| | |
|
| | |
| | |
| | |
| | |
| | |
|
Technology Hardware, Storage & Peripherals — 6.9% |
| | |
Textiles, Apparel & Luxury Goods — 0.7% |
Lululemon Athletica, Inc. * | | |
Trading Companies & Distributors — 0.3% |
| | |
Total Common Stocks
(Cost $8,782,642) | | |
Short-Term Investments — 1.7% |
Investment Companies — 1.5% |
JPMorgan Prime Money Market Fund Class IM Shares, 5.51% (c) (d)
(Cost $257,039) | | |
Investment of Cash Collateral from Securities Loaned — 0.2% |
JPMorgan Securities Lending Money Market Fund Agency SL Class Shares, 5.56% (c) (d) | | |
JPMorgan U.S. Government Money Market Fund Class IM Shares, 5.30% (c) (d) | | |
Total Investment of Cash Collateral from Securities Loaned
(Cost $26,324) | | |
Total Short-Term Investments
(Cost $283,363) | | |
Total Investments — 100.2%
(Cost $9,066,005) | | |
Liabilities in Excess of Other Assets — (0.2)% | | |
| | |
Percentages indicated are based on net assets. |
| Value determined using significant unobservable inputs. |
| Non-income producing security. |
| The security or a portion of this security is on loan at December 31, 2023. The total value of securities on loan at December 31, 2023 is $25,418. |
| Restricted security. See Note 2.B. |
| Investment in an affiliated fund, which is registered under the Investment Company Act of 1940, as amended, and is advised by J.P. Morgan Investment Management Inc. |
| The rate shown is the current yield as of December 31, 2023. |
SEE NOTES TO FINANCIAL STATEMENTS.
| J.P. Morgan Mid Cap/Multi-Cap Funds | |
JPMorgan Mid Cap Equity Fund
SCHEDULE OF PORTFOLIO INVESTMENTSAS OF December 31, 2023 (Unaudited)
| | |
|
Aerospace & Defense — 0.4% |
| | |
|
Thor Industries, Inc. (a) | | |
|
| | |
First Citizens BancShares, Inc., Class A | | |
Huntington Bancshares, Inc. | | |
| | |
| | |
| | |
|
Constellation Brands, Inc., Class A | | |
| | |
| | |
|
Alnylam Pharmaceuticals, Inc. * | | |
Amicus Therapeutics, Inc. * | | |
Apellis Pharmaceuticals, Inc. * (a) | | |
Exact Sciences Corp. * (a) | | |
| | |
| | |
Neurocrine Biosciences, Inc. * | | |
| | |
|
| | |
Fortune Brands Innovations, Inc. | | |
Simpson Manufacturing Co., Inc. | | |
| | |
| | |
|
Ameriprise Financial, Inc. | | |
Ares Management Corp., Class A | | |
FactSet Research Systems, Inc. | | |
Interactive Brokers Group, Inc., Class A | | |
| | |
LPL Financial Holdings, Inc. | | |
| | |
| | |
| | |
Raymond James Financial, Inc. | | |
| | |
|
Capital Markets — continued |
| | |
Tradeweb Markets, Inc., Class A | | |
| | |
|
| | |
| | |
| | |
Commercial Services & Supplies — 1.3% |
| | |
| | |
| | |
| | |
Communications Equipment — 0.7% |
| | |
| | |
| | |
Construction & Engineering — 0.8% |
| | |
Quanta Services, Inc. (a) | | |
| | |
Construction Materials — 1.0% |
Martin Marietta Materials, Inc. | | |
|
Discover Financial Services | | |
Consumer Staples Distribution & Retail — 1.2% |
| | |
| | |
| | |
Containers & Packaging — 1.9% |
| | |
Packaging Corp. of America | | |
| | |
| | |
|
| | |
| | |
| | |
| | |
SEE NOTES TO FINANCIAL STATEMENTS.
| J.P. Morgan Mid Cap/Multi-Cap Funds | |
| | |
Common Stocks — continued |
Diversified Consumer Services — 0.3% |
Bright Horizons Family Solutions, Inc. * (a) | | |
|
| | |
Electric Utilities — 2.3% |
| | |
| | |
| | |
| | |
Electrical Equipment — 3.3% |
| | |
| | |
| | |
| | |
Electronic Equipment, Instruments & Components — 4.2% |
| | |
| | |
| | |
Keysight Technologies, Inc. * | | |
Teledyne Technologies, Inc. * | | |
Zebra Technologies Corp., Class A * | | |
| | |
Energy Equipment & Services — 0.3% |
TechnipFMC plc (United Kingdom) | | |
|
Liberty Media Corp-Liberty Live, Class C * | | |
Take-Two Interactive Software, Inc. * | | |
| | |
Financial Services — 1.8% |
Fidelity National Information Services, Inc. | | |
| | |
| | |
| | |
Rocket Cos., Inc., Class A * (a) | | |
| | |
| | |
|
| | |
|
| | |
| | |
|
Ground Transportation — 1.1% |
JB Hunt Transport Services, Inc. | | |
Old Dominion Freight Line, Inc. | | |
Uber Technologies, Inc. * | | |
| | |
Health Care Equipment & Supplies — 3.1% |
| | |
| | |
| | |
Globus Medical, Inc., Class A * | | |
IDEXX Laboratories, Inc. * | | |
Inspire Medical Systems, Inc. * (a) | | |
| | |
Shockwave Medical, Inc. * | | |
Zimmer Biomet Holdings, Inc. | | |
| | |
Health Care Providers & Services — 4.3% |
Acadia Healthcare Co., Inc. * | | |
| | |
| | |
| | |
Laboratory Corp. of America Holdings (a) | | |
| | |
| | |
Universal Health Services, Inc., Class B | | |
| | |
|
| | |
Hotel & Resort REITs — 0.3% |
Host Hotels & Resorts, Inc. | | |
Hotels, Restaurants & Leisure — 3.3% |
Chipotle Mexican Grill, Inc. * | | |
| | |
| | |
DoorDash, Inc., Class A * | | |
| | |
Hilton Worldwide Holdings, Inc. | | |
| | |
Royal Caribbean Cruises Ltd. * | | |
| | |
Household Durables — 1.1% |
| | |
SEE NOTES TO FINANCIAL STATEMENTS.
| J.P. Morgan Mid Cap/Multi-Cap Funds | |
JPMorgan Mid Cap Equity Fund
SCHEDULE OF PORTFOLIO INVESTMENTSAS OF December 31, 2023 (Unaudited) (continued)
| | |
Common Stocks — continued |
Household Durables — continued |
| | |
Mohawk Industries, Inc. * | | |
| | |
| | |
Household Products — 0.3% |
| | |
|
Rexford Industrial Realty, Inc. | | |
|
Arch Capital Group Ltd. * | | |
Arthur J Gallagher & Co. (a) | | |
| | |
Hartford Financial Services Group, Inc. (The) | | |
| | |
| | |
| | |
Interactive Media & Services — 0.6% |
| | |
|
| | |
| | |
| | |
| | |
Snowflake, Inc., Class A * | | |
| | |
Life Sciences Tools & Services — 2.0% |
10X Genomics, Inc., Class A * | | |
Agilent Technologies, Inc. | | |
| | |
Mettler-Toledo International, Inc. * | | |
West Pharmaceutical Services, Inc. | | |
| | |
|
| | |
| | |
| | |
| | |
Lincoln Electric Holdings, Inc. (a) | | |
| | |
| | |
|
|
| | |
| | |
| | |
|
Liberty Media Corp-Liberty SiriusXM * | | |
Trade Desk, Inc. (The), Class A * | | |
| | |
|
| | |
|
| | |
| | |
| | |
|
| | |
Oil, Gas & Consumable Fuels — 3.3% |
| | |
| | |
| | |
| | |
Williams Cos., Inc. (The) | | |
| | |
Personal Care Products — 0.2% |
| | |
|
Jazz Pharmaceuticals plc * | | |
Royalty Pharma plc, Class A | | |
| | |
Professional Services — 0.7% |
Booz Allen Hamilton Holding Corp. | | |
| | |
| | |
Real Estate Management & Development — 0.5% |
CBRE Group, Inc., Class A * | | |
|
American Homes 4 Rent, Class A | | |
AvalonBay Communities, Inc. | | |
Essex Property Trust, Inc. | | |
SEE NOTES TO FINANCIAL STATEMENTS.
| J.P. Morgan Mid Cap/Multi-Cap Funds | |
| | |
Common Stocks — continued |
Residential REITs — continued |
Mid-America Apartment Communities, Inc. | | |
| | |
| | |
|
Brixmor Property Group, Inc. | | |
Federal Realty Investment Trust | | |
| | |
| | |
| | |
Semiconductors & Semiconductor Equipment — 2.4% |
Allegro MicroSystems, Inc. (Japan) * | | |
| | |
| | |
| | |
Microchip Technology, Inc. | | |
Monolithic Power Systems, Inc. | | |
| | |
| | |
| | |
|
Cadence Design Systems, Inc. * | | |
Confluent, Inc., Class A * | | |
Crowdstrike Holdings, Inc., Class A * | | |
| | |
| | |
| | |
| | |
Palo Alto Networks, Inc. * | | |
Procore Technologies, Inc. * | | |
| | |
| | |
Zoom Video Communications, Inc., Class A * | | |
| | |
|
| | |
| | |
| | |
|
| | |
| | |
| | |
| | |
|
Specialty Retail — continued |
Burlington Stores, Inc. * | | |
Floor & Decor Holdings, Inc., Class A * (a) | | |
| | |
| | |
| | |
Textiles, Apparel & Luxury Goods — 1.9% |
| | |
Lululemon Athletica, Inc. * | | |
| | |
| | |
| | |
Trading Companies & Distributors — 0.2% |
| | |
Total Common Stocks
(Cost $2,791,292) | | |
Short-Term Investments — 4.1% |
Investment Companies — 2.3% |
JPMorgan Prime Money Market Fund Class IM Shares, 5.51% (b) (c)
(Cost $93,016) | | |
Investment of Cash Collateral from Securities Loaned — 1.8% |
JPMorgan Securities Lending Money Market Fund Agency SL Class Shares, 5.56% (b) (c) | | |
JPMorgan U.S. Government Money Market Fund Class IM Shares, 5.30% (b) (c) | | |
Total Investment of Cash Collateral from Securities Loaned
(Cost $71,238) | | |
Total Short-Term Investments
(Cost $164,254) | | |
Total Investments — 101.6%
(Cost $2,955,546) | | |
Liabilities in Excess of Other Assets — (1.6)% | | |
| | |
Percentages indicated are based on net assets. |
| |
| Real Estate Investment Trust |
| Non-income producing security. |
SEE NOTES TO FINANCIAL STATEMENTS.
| J.P. Morgan Mid Cap/Multi-Cap Funds | |
JPMorgan Mid Cap Equity Fund
SCHEDULE OF PORTFOLIO INVESTMENTSAS OF December 31, 2023 (Unaudited) (continued)
| The security or a portion of this security is on loan at December 31, 2023. The total value of securities on loan at December 31, 2023 is $69,077. |
| Investment in an affiliated fund, which is registered under the Investment Company Act of 1940, as amended, and is advised by J.P. Morgan Investment Management Inc. |
| The rate shown is the current yield as of December 31, 2023. |
SEE NOTES TO FINANCIAL STATEMENTS.
| J.P. Morgan Mid Cap/Multi-Cap Funds | |
JPMorgan Mid Cap Growth Fund
SCHEDULE OF PORTFOLIO INVESTMENTSAS OF December 31, 2023 (Unaudited)
| | |
|
Aerospace & Defense — 1.2% |
| | |
|
Thor Industries, Inc. (a) | | |
|
Constellation Brands, Inc., Class A | | |
|
Alnylam Pharmaceuticals, Inc. * | | |
Amicus Therapeutics, Inc. * (a) | | |
Apellis Pharmaceuticals, Inc. * (a) | | |
| | |
| | |
| | |
Neurocrine Biosciences, Inc. * | | |
| | |
|
Simpson Manufacturing Co., Inc. | | |
| | |
| | |
|
Ares Management Corp., Class A | | |
FactSet Research Systems, Inc. (a) | | |
Interactive Brokers Group, Inc., Class A | | |
| | |
LPL Financial Holdings, Inc. | | |
| | |
| | |
Raymond James Financial, Inc. | | |
Tradeweb Markets, Inc., Class A | | |
| | |
Commercial Services & Supplies — 3.7% |
| | |
| | |
| | |
| | |
Communications Equipment — 0.6% |
| | |
Construction & Engineering — 2.2% |
| | |
| | |
| | |
| | |
|
|
| | |
Diversified Consumer Services — 0.7% |
Bright Horizons Family Solutions, Inc. * (a) | | |
Electrical Equipment — 1.8% |
| | |
| | |
| | |
Electronic Equipment, Instruments & Components — 3.6% |
| | |
| | |
Keysight Technologies, Inc. * | | |
Teledyne Technologies, Inc. * | | |
| | |
Energy Equipment & Services — 0.9% |
TechnipFMC plc (United Kingdom) (a) | | |
|
Take-Two Interactive Software, Inc. * | | |
Financial Services — 1.5% |
| | |
| | |
Rocket Cos., Inc., Class A * (a) | | |
| | |
Ground Transportation — 3.3% |
JB Hunt Transport Services, Inc. | | |
Old Dominion Freight Line, Inc. | | |
Uber Technologies, Inc. * | | |
| | |
Health Care Equipment & Supplies — 6.2% |
| | |
| | |
| | |
IDEXX Laboratories, Inc. * | | |
Inspire Medical Systems, Inc. * | | |
| | |
Shockwave Medical, Inc. * | | |
| | |
Health Care Providers & Services — 2.6% |
Acadia Healthcare Co., Inc. * | | |
SEE NOTES TO FINANCIAL STATEMENTS.
| J.P. Morgan Mid Cap/Multi-Cap Funds | |
JPMorgan Mid Cap Growth Fund
SCHEDULE OF PORTFOLIO INVESTMENTSAS OF December 31, 2023 (Unaudited) (continued)
| | |
Common Stocks — continued |
Health Care Providers & Services — continued |
| | |
| | |
| | |
Hotels, Restaurants & Leisure — 5.8% |
Chipotle Mexican Grill, Inc. * | | |
| | |
DoorDash, Inc., Class A * | | |
Hilton Worldwide Holdings, Inc. | | |
| | |
Royal Caribbean Cruises Ltd. * (a) | | |
| | |
Household Durables — 1.0% |
| | |
| | |
| | |
|
Arthur J Gallagher & Co. (a) | | |
|
| | |
| | |
| | |
Snowflake, Inc., Class A * | | |
| | |
Life Sciences Tools & Services — 5.7% |
10X Genomics, Inc., Class A * | | |
Agilent Technologies, Inc. | | |
| | |
Mettler-Toledo International, Inc. * (a) | | |
West Pharmaceutical Services, Inc. | | |
| | |
|
| | |
| | |
| | |
|
Trade Desk, Inc. (The), Class A * | | |
|
| | |
| | |
|
Oil, Gas & Consumable Fuels — 2.9% |
| | |
| | |
| | |
Personal Care Products — 0.6% |
| | |
|
Royalty Pharma plc, Class A | | |
Professional Services — 1.9% |
Booz Allen Hamilton Holding Corp. | | |
| | |
| | |
Semiconductors & Semiconductor Equipment — 5.3% |
Allegro MicroSystems, Inc. (Japan) * | | |
| | |
| | |
| | |
Monolithic Power Systems, Inc. (a) | | |
ON Semiconductor Corp. * (a) | | |
| | |
| | |
|
Cadence Design Systems, Inc. * | | |
Confluent, Inc., Class A * | | |
| | |
Crowdstrike Holdings, Inc., Class A * | | |
Datadog, Inc., Class A * (a) | | |
| | |
| | |
| | |
Palo Alto Networks, Inc. * | | |
Procore Technologies, Inc. * | | |
| | |
| | |
Zoom Video Communications, Inc., Class A * | | |
| | |
|
| | |
Burlington Stores, Inc. * | | |
Floor & Decor Holdings, Inc., Class A * (a) | | |
SEE NOTES TO FINANCIAL STATEMENTS.
| J.P. Morgan Mid Cap/Multi-Cap Funds | |
| | |
Common Stocks — continued |
Specialty Retail — continued |
| | |
| | |
| | |
Textiles, Apparel & Luxury Goods — 0.9% |
Lululemon Athletica, Inc. * | | |
Trading Companies & Distributors — 0.7% |
| | |
Total Common Stocks
(Cost $7,510,938) | | |
Short-Term Investments — 4.3% |
Investment Companies — 1.3% |
JPMorgan Prime Money Market Fund Class IM Shares, 5.51% (c) (d)
(Cost $139,677) | | |
Investment of Cash Collateral from Securities Loaned — 3.0% |
JPMorgan Securities Lending Money Market Fund Agency SL Class Shares, 5.56% (c) (d) | | |
JPMorgan U.S. Government Money Market Fund Class IM Shares, 5.30% (c) (d) | | |
Total Investment of Cash Collateral from Securities Loaned
(Cost $309,473) | | |
Total Short-Term Investments
(Cost $449,150) | | |
Total Investments — 103.1%
(Cost $7,960,088) | | |
Liabilities in Excess of Other Assets — (3.1)% | | |
| | |
Percentages indicated are based on net assets. |
| Value determined using significant unobservable inputs. |
| Non-income producing security. |
| The security or a portion of this security is on loan at December 31, 2023. The total value of securities on loan at December 31, 2023 is $299,746. |
| Restricted security. See Note 2.B. |
| Investment in an affiliated fund, which is registered under the Investment Company Act of 1940, as amended, and is advised by J.P. Morgan Investment Management Inc. |
| The rate shown is the current yield as of December 31, 2023. |
SEE NOTES TO FINANCIAL STATEMENTS.
| J.P. Morgan Mid Cap/Multi-Cap Funds | |
JPMorgan Mid Cap Value Fund
SCHEDULE OF PORTFOLIO INVESTMENTSAS OF December 31, 2023 (Unaudited)
| | |
|
|
| | |
First Citizens BancShares, Inc., Class A | | |
Huntington Bancshares, Inc. | | |
| | |
| | |
| | |
|
Constellation Brands, Inc., Class A | | |
| | |
| | |
|
| | |
Fortune Brands Innovations, Inc. | | |
| | |
|
Ameriprise Financial, Inc. | | |
| | |
Raymond James Financial, Inc. | | |
| | |
| | |
|
| | |
| | |
| | |
Communications Equipment — 0.8% |
| | |
Construction Materials — 1.6% |
Martin Marietta Materials, Inc. | | |
|
Discover Financial Services | | |
Consumer Staples Distribution & Retail — 1.8% |
| | |
| | |
| | |
Containers & Packaging — 3.0% |
| | |
Packaging Corp. of America | | |
| | |
| | |
| | |
|
|
| | |
| | |
| | |
|
| | |
Electric Utilities — 3.5% |
| | |
| | |
| | |
| | |
Electrical Equipment — 4.2% |
| | |
| | |
| | |
| | |
Electronic Equipment, Instruments & Components — 4.6% |
| | |
| | |
| | |
Teledyne Technologies, Inc. * | | |
Zebra Technologies Corp., Class A * | | |
| | |
|
Liberty Media Corp-Liberty Live, Class C * | | |
Take-Two Interactive Software, Inc. * | | |
| | |
Financial Services — 2.0% |
Fidelity National Information Services, Inc. | | |
| | |
| | |
| | |
|
Post Holdings, Inc. * (a) | | |
|
| | |
Health Care Equipment & Supplies — 1.5% |
Globus Medical, Inc., Class A * | | |
Zimmer Biomet Holdings, Inc. | | |
| | |
SEE NOTES TO FINANCIAL STATEMENTS.
| J.P. Morgan Mid Cap/Multi-Cap Funds | |
| | |
Common Stocks — continued |
Health Care Providers & Services — 5.2% |
| | |
| | |
Laboratory Corp. of America Holdings (a) | | |
| | |
Universal Health Services, Inc., Class B | | |
| | |
|
| | |
Hotel & Resort REITs — 0.4% |
Host Hotels & Resorts, Inc. | | |
Hotels, Restaurants & Leisure — 2.0% |
| | |
| | |
| | |
Household Durables — 1.3% |
Mohawk Industries, Inc. * | | |
| | |
| | |
Household Products — 0.5% |
| | |
|
Rexford Industrial Realty, Inc. (a) | | |
|
Arch Capital Group Ltd. * | | |
| | |
Hartford Financial Services Group, Inc. (The) | | |
| | |
| | |
| | |
Interactive Media & Services — 0.9% |
| | |
|
| | |
|
| | |
| | |
| | |
Lincoln Electric Holdings, Inc. (a) | | |
| | |
| | |
|
|
| | |
| | |
| | |
|
Liberty Media Corp-Liberty SiriusXM * | | |
|
| | |
|
| | |
| | |
| | |
|
| | |
Oil, Gas & Consumable Fuels — 3.6% |
| | |
Diamondback Energy, Inc. (a) | | |
Williams Cos., Inc. (The) | | |
| | |
|
Jazz Pharmaceuticals plc * | | |
Real Estate Management & Development — 0.9% |
CBRE Group, Inc., Class A * | | |
|
American Homes 4 Rent, Class A | | |
AvalonBay Communities, Inc. | | |
Essex Property Trust, Inc. | | |
Mid-America Apartment Communities, Inc. | | |
| | |
| | |
|
Brixmor Property Group, Inc. | | |
Federal Realty Investment Trust | | |
| | |
| | |
| | |
Semiconductors & Semiconductor Equipment — 0.9% |
Microchip Technology, Inc. | | |
SEE NOTES TO FINANCIAL STATEMENTS.
| J.P. Morgan Mid Cap/Multi-Cap Funds | |
JPMorgan Mid Cap Value Fund
SCHEDULE OF PORTFOLIO INVESTMENTSAS OF December 31, 2023 (Unaudited) (continued)
| | |
Common Stocks — continued |
|
| | |
| | |
| | |
|
| | |
| | |
| | |
| | |
Textiles, Apparel & Luxury Goods — 2.4% |
| | |
| | |
| | |
| | |
Total Common Stocks
(Cost $7,863,795) | | |
Short-Term Investments — 2.0% |
Investment Companies — 1.3% |
JPMorgan Prime Money Market Fund Class IM Shares, 5.51% (b) (c)
(Cost $168,263) | | |
Investment of Cash Collateral from Securities Loaned — 0.7% |
JPMorgan Securities Lending Money Market Fund Agency SL Class Shares, 5.56% (b) (c) | | |
| | |
|
Investment of Cash Collateral from Securities Loaned — continued |
JPMorgan U.S. Government Money Market Fund Class IM Shares, 5.30% (b) (c) | | |
Total Investment of Cash Collateral from Securities Loaned
(Cost $94,631) | | |
Total Short-Term Investments
(Cost $262,894) | | |
Total Investments — 100.8%
(Cost $8,126,689) | | |
Liabilities in Excess of Other Assets — (0.8)% | | |
| | |
Percentages indicated are based on net assets. |
| |
| Real Estate Investment Trust |
| Non-income producing security. |
| The security or a portion of this security is on loan at December 31, 2023. The total value of securities on loan at December 31, 2023 is $92,233. |
| Investment in an affiliated fund, which is registered under the Investment Company Act of 1940, as amended, and is advised by J.P. Morgan Investment Management Inc. |
| The rate shown is the current yield as of December 31, 2023. |
SEE NOTES TO FINANCIAL STATEMENTS.
| J.P. Morgan Mid Cap/Multi-Cap Funds | |
JPMorgan Value Advantage Fund
SCHEDULE OF PORTFOLIO INVESTMENTSAS OF December 31, 2023 (Unaudited)
| | |
|
Aerospace & Defense — 2.2% |
| | |
| | |
| | |
| | |
Air Freight & Logistics — 0.9% |
| | |
United Parcel Service, Inc., Class B | | |
| | |
|
| | |
| | |
Citizens Financial Group, Inc. | | |
First Citizens BancShares, Inc., Class A | | |
| | |
PNC Financial Services Group, Inc. (The) | | |
| | |
| | |
| | |
|
| | |
|
| | |
Regeneron Pharmaceuticals, Inc. * | | |
Vertex Pharmaceuticals, Inc. * | | |
| | |
|
| | |
Fortune Brands Innovations, Inc. | | |
| | |
|
Charles Schwab Corp. (The) | | |
| | |
| | |
| | |
| | |
|
Axalta Coating Systems Ltd. * | | |
Communications Equipment — 0.4% |
| | |
| | |
|
Construction Materials — 1.7% |
Martin Marietta Materials, Inc. | | |
| | |
| | |
|
| | |
Capital One Financial Corp. | | |
| | |
Consumer Staples Distribution & Retail — 0.6% |
Albertsons Cos., Inc., Class A | | |
Containers & Packaging — 2.3% |
Graphic Packaging Holding Co. | | |
Packaging Corp. of America | | |
| | |
| | |
| | |
Diversified Telecommunication Services — 0.5% |
Verizon Communications, Inc. | | |
Electric Utilities — 3.1% |
| | |
| | |
| | |
| | |
| | |
| | |
Electrical Equipment — 0.6% |
| | |
Electronic Equipment, Instruments & Components — 1.0% |
| | |
| | |
| | |
|
Liberty Media Corp-Liberty Live, Class C * | | |
Financial Services — 4.2% |
Berkshire Hathaway, Inc., Class B * | | |
FleetCor Technologies, Inc. * | | |
| | |
| | |
SEE NOTES TO FINANCIAL STATEMENTS.
| J.P. Morgan Mid Cap/Multi-Cap Funds | |
JPMorgan Value Advantage Fund
SCHEDULE OF PORTFOLIO INVESTMENTSAS OF December 31, 2023 (Unaudited) (continued)
| | |
Common Stocks — continued |
|
| | |
| | |
| | |
Ground Transportation — 1.0% |
| | |
Health Care Equipment & Supplies — 1.0% |
| | |
Zimmer Biomet Holdings, Inc. | | |
| | |
Health Care Providers & Services — 6.2% |
| | |
| | |
| | |
| | |
| | |
Laboratory Corp. of America Holdings | | |
| | |
| | |
| | |
|
| | |
Hotel & Resort REITs — 0.4% |
Apple Hospitality REIT, Inc. (a) | | |
Hotels, Restaurants & Leisure — 1.4% |
| | |
Texas Roadhouse, Inc., Class A | | |
| | |
Household Durables — 1.2% |
Mohawk Industries, Inc. * | | |
| | |
| | |
Household Products — 1.5% |
| | |
Procter & Gamble Co. (The) | | |
| | |
Industrial Conglomerates — 0.7% |
Honeywell International, Inc. | | |
|
EastGroup Properties, Inc. | | |
| | |
|
|
| | |
| | |
Fairfax Financial Holdings Ltd. (Canada) | | |
| | |
| | |
Travelers Cos., Inc. (The) | | |
| | |
| | |
Interactive Media & Services — 1.5% |
Alphabet, Inc., Class C * | | |
| | |
Meta Platforms, Inc., Class A * | | |
| | |
|
International Business Machines Corp. | | |
Life Sciences Tools & Services — 0.2% |
Fortrea Holdings, Inc. * (a) | | |
|
| | |
| | |
| | |
| | |
|
Liberty Broadband Corp., Class C * | | |
Liberty Media Corp-Liberty SiriusXM * | | |
Nexstar Media Group, Inc., Class A (a) | | |
| | |
|
Public Service Enterprise Group, Inc. | | |
Oil, Gas & Consumable Fuels — 8.3% |
| | |
| | |
| | |
| | |
| | |
| | |
Williams Cos., Inc. (The) | | |
| | |
Personal Care Products — 0.6% |
| | |
SEE NOTES TO FINANCIAL STATEMENTS.
| J.P. Morgan Mid Cap/Multi-Cap Funds | |
| | |
Common Stocks — continued |
|
| | |
| | |
| | |
| | |
Real Estate Management & Development — 0.7% |
CBRE Group, Inc., Class A * | | |
|
American Homes 4 Rent, Class A | | |
Mid-America Apartment Communities, Inc. | | |
| | |
|
Brixmor Property Group, Inc. | | |
Federal Realty Investment Trust | | |
| | |
| | |
| | |
Semiconductors & Semiconductor Equipment — 2.4% |
| | |
NXP Semiconductors NV (China) | | |
| | |
| | |
|
Lamar Advertising Co., Class A | | |
| | |
| | |
| | |
| | |
|
| | |
| | |
| | |
Dick's Sporting Goods, Inc. (a) | | |
| | |
| | |
| | |
| | |
Textiles, Apparel & Luxury Goods — 1.2% |
| | |
| | |
|
Textiles, Apparel & Luxury Goods — continued |
Columbia Sportswear Co. (a) | | |
| | |
| | |
|
Philip Morris International, Inc. | | |
Wireless Telecommunication Services — 0.5% |
| | |
Total Common Stocks
(Cost $5,753,042) | | |
Short-Term Investments — 1.7% |
Investment Companies — 1.0% |
JPMorgan Prime Money Market Fund Class IM Shares, 5.51% (b) (c)
(Cost $86,191) | | |
Investment of Cash Collateral from Securities Loaned — 0.7% |
JPMorgan Securities Lending Money Market Fund Agency SL Class Shares, 5.56% (b) (c) | | |
JPMorgan U.S. Government Money Market Fund Class IM Shares, 5.30% (b) (c) | | |
Total Investment of Cash Collateral from Securities Loaned
(Cost $65,583) | | |
Total Short-Term Investments
(Cost $151,774) | | |
Total Investments — 100.9%
(Cost $5,904,816) | | |
Liabilities in Excess of Other Assets — (0.9)% | | |
| | |
Percentages indicated are based on net assets. |
| |
| Real Estate Investment Trust |
| Non-income producing security. |
| The security or a portion of this security is on loan at December 31, 2023. The total value of securities on loan at December 31, 2023 is $63,676. |
| Investment in an affiliated fund, which is registered under the Investment Company Act of 1940, as amended, and is advised by J.P. Morgan Investment Management Inc. |
| The rate shown is the current yield as of December 31, 2023. |
SEE NOTES TO FINANCIAL STATEMENTS.
| J.P. Morgan Mid Cap/Multi-Cap Funds | |
STATEMENTS OF ASSETS AND LIABILITIESAS OF December 31, 2023 (Unaudited)
(Amounts in thousands, except per share amounts)
| JPMorgan
Growth
Advantage Fund | JPMorgan
Mid Cap
Equity Fund | |
| | | |
Investments in non-affiliates, at value | | | |
Investments in affiliates, at value | | | |
Investments of cash collateral received from securities loaned, at value (See Note 2.C.) | | | |
| | | |
| | | |
| | | |
Dividends from non-affiliates | | | |
Dividends from affiliates | | | |
Securities lending income (See Note 2.C.) | | | |
| | | |
| | | |
| | | |
| | | |
Investment securities purchased | | | |
Collateral received on securities loaned (See Note 2.C.) | | | |
| | | |
| | | |
| | | |
| | | |
| | | |
| | | |
Custodian and accounting fees | | | |
Trustees’ and Chief Compliance Officer’s fees | | | |
| | | |
| | | |
| | | |
SEE NOTES TO FINANCIAL STATEMENTS.
| J.P. Morgan Mid Cap/Multi-Cap Funds | |
| JPMorgan Growth Advantage Fund | JPMorgan Mid Cap Equity Fund | |
| | | |
| | | |
Total distributable earnings (loss) | | | |
| | | |
| | | |
| | | |
| | | |
| | | |
| | | |
| | | |
| | | |
| | | |
| | | |
| | | |
Outstanding units of beneficial interest (shares)
($0.0001 par value; unlimited number of shares authorized): | | | |
| | | |
| | | |
| | | |
| | | |
| | | |
| | | |
| | | |
| | | |
| | | |
Class A — Redemption price per share | | | |
Class C — Offering price per share (b) | | | |
Class I — Offering and redemption price per share | | | |
Class R2 — Offering and redemption price per share | | | |
Class R3 — Offering and redemption price per share | | | |
Class R4 — Offering and redemption price per share | | | |
Class R5 — Offering and redemption price per share | | | |
Class R6 — Offering and redemption price per share | | | |
Class A maximum sales charge | | | |
Class A maximum public offering price per share
[net asset value per share/(100% – maximum sales charge)] | | | |
Cost of investments in non-affiliates | | | |
Cost of investments in affiliates | | | |
Investment securities on loan, at value (See Note 2.C.) | | | |
Cost of investment of cash collateral (See Note 2.C.) | | | |
(a)
Per share amounts may not recalculate due to rounding of net assets and/or shares outstanding.
(b)
Redemption price for Class C Shares varies based upon length of time the shares are held.
SEE NOTES TO FINANCIAL STATEMENTS.
| J.P. Morgan Mid Cap/Multi-Cap Funds | |
STATEMENTS OF ASSETS AND LIABILITIESAS OF December 31, 2023 (Unaudited) (continued)
(Amounts in thousands, except per share amounts)
| JPMorgan
Mid Cap
Value Fund | |
| | |
Investments in non-affiliates, at value | | |
Investments in affiliates, at value | | |
Investments of cash collateral received from securities loaned, at value (See Note 2.C.) | | |
| | |
| | |
| | |
Dividends from non-affiliates | | |
Dividends from affiliates | | |
Securities lending income (See Note 2.C.) | | |
| | |
| | |
| | |
Investment securities purchased | | |
Collateral received on securities loaned (See Note 2.C.) | | |
| | |
| | |
| | |
| | |
| | |
| | |
Custodian and accounting fees | | |
Trustees’ and Chief Compliance Officer’s fees | | |
| | |
| | |
| | |
(a)
Amount rounds to less than one thousand.
SEE NOTES TO FINANCIAL STATEMENTS.
| J.P. Morgan Mid Cap/Multi-Cap Funds | |
| JPMorgan Mid Cap Value Fund | |
| | |
| | |
Total distributable earnings (loss) | | |
| | |
| | |
| | |
| | |
| | |
| | |
| | |
| | |
| | |
| | |
| | |
| | |
Outstanding units of beneficial interest (shares)
($0.0001 par value; unlimited number of shares authorized): | | |
| | |
| | |
| | |
| | |
| | |
| | |
| | |
| | |
| | |
| | |
Class A — Redemption price per share | | |
Class C — Offering price per share (b) | | |
Class I — Offering and redemption price per share | | |
Class L — Offering and redemption price per share | | |
Class R2 — Offering and redemption price per share | | |
Class R3 — Offering and redemption price per share | | |
Class R4 — Offering and redemption price per share | | |
Class R5 — Offering and redemption price per share | | |
Class R6 — Offering and redemption price per share | | |
Class A maximum sales charge | | |
Class A maximum public offering price per share
[net asset value per share/(100% – maximum sales charge)] | | |
Cost of investments in non-affiliates | | |
Cost of investments in affiliates | | |
Investment securities on loan, at value (See Note 2.C.) | | |
Cost of investment of cash collateral (See Note 2.C.) | | |
(a)
Per share amounts may not recalculate due to rounding of net assets and/or shares outstanding.
(b)
Redemption price for Class C Shares varies based upon length of time the shares are held.
SEE NOTES TO FINANCIAL STATEMENTS.
| J.P. Morgan Mid Cap/Multi-Cap Funds | |
STATEMENTS OF OPERATIONSFOR THE SIX MONTHS ENDED December 31, 2023 (Unaudited)
(Amounts in thousands)
| JPMorgan
Growth
Advantage Fund | JPMorgan
Mid Cap
Equity Fund | |
| | | |
Interest income from affiliates | | | |
Dividend income from non-affiliates | | | |
Dividend income from affiliates | | | |
Income from securities lending (net) (See Note 2.C.) | | | |
| | | |
| | | |
| | | |
| | | |
| | | |
| | | |
| | | |
| | | |
| | | |
| | | |
| | | |
| | | |
| | | |
| | | |
| | | |
| | | |
| | | |
Custodian and accounting fees | | | |
| | | |
Trustees’ and Chief Compliance Officer’s fees | | | |
Printing and mailing costs | | | |
Registration and filing fees | | | |
Transfer agency fees (See Note 2.G.) | | | |
| | | |
| | | |
| | | |
Less expense reimbursements | | | |
| | | |
Net investment income (loss) | | | |
(a)
Amount rounds to less than one thousand.
SEE NOTES TO FINANCIAL STATEMENTS.
| J.P. Morgan Mid Cap/Multi-Cap Funds | |
| JPMorgan Growth Advantage Fund | JPMorgan Mid Cap Equity Fund | |
REALIZED/UNREALIZED GAINS (LOSSES): | | | |
Net realized gain (loss) on transactions from: | | | |
Investments in non-affiliates | | | |
Investments in affiliates | | | |
| | | |
Change in net unrealized appreciation/depreciation on: | | | |
Investments in non-affiliates | | | |
Investments in affiliates | | | |
Change in net unrealized appreciation/depreciation | | | |
Net realized/unrealized gains (losses) | | | |
Change in net assets resulting from operations | | | |
SEE NOTES TO FINANCIAL STATEMENTS.
| J.P. Morgan Mid Cap/Multi-Cap Funds | |
STATEMENTS OF OPERATIONSFOR THE SIX MONTHS ENDED December 31, 2023 (Unaudited) (continued)
(Amounts in thousands)
| JPMorgan
Mid Cap
Value Fund | |
| | |
Interest income from affiliates | | |
Dividend income from non-affiliates | | |
Dividend income from affiliates | | |
Income from securities lending (net) (See Note 2.C.) | | |
| | |
| | |
| | |
| | |
| | |
| | |
| | |
| | |
| | |
| | |
| | |
| | |
| | |
| | |
| | |
| | |
| | |
| | |
Custodian and accounting fees | | |
| | |
Trustees’ and Chief Compliance Officer’s fees | | |
Printing and mailing costs | | |
Registration and filing fees | | |
Transfer agency fees (See Note 2.G.) | | |
| | |
| | |
| | |
Less expense reimbursements | | |
| | |
Net investment income (loss) | | |
(a)
Amount rounds to less than one thousand.
SEE NOTES TO FINANCIAL STATEMENTS.
| J.P. Morgan Mid Cap/Multi-Cap Funds | |
| JPMorgan Mid Cap Value Fund | |
REALIZED/UNREALIZED GAINS (LOSSES): | | |
Net realized gain (loss) on transactions from: | | |
Investments in non-affiliates | | |
Investments in affiliates | | |
| | |
Change in net unrealized appreciation/depreciation on: | | |
Investments in non-affiliates | | |
Investments in affiliates | | |
Change in net unrealized appreciation/depreciation | | |
Net realized/unrealized gains (losses) | | |
Change in net assets resulting from operations | | |
SEE NOTES TO FINANCIAL STATEMENTS.
| J.P. Morgan Mid Cap/Multi-Cap Funds | |
STATEMENTS OF CHANGES IN NET ASSETSFOR THE PERIODS INDICATED
(Amounts in thousands)
| JPMorgan Growth Advantage Fund | JPMorgan Mid Cap Equity Fund |
| Six Months Ended
December 31, 2023
(Unaudited) | | Six Months Ended
December 31, 2023
(Unaudited) | |
CHANGE IN NET ASSETS RESULTING FROM OPERATIONS: | | | | |
Net investment income (loss) | | | | |
| | | | |
Change in net unrealized appreciation/depreciation | | | | |
Change in net assets resulting from operations | | | | |
DISTRIBUTIONS TO SHAREHOLDERS: | | | | |
| | | | |
| | | | |
| | | | |
| | | | |
| | | | |
| | | | |
| | | | |
| | | | |
Total distributions to shareholders | | | | |
| | | | |
Change in net assets resulting from capital transactions | | | | |
| | | | |
| | | | |
| | | | |
| | | | |
SEE NOTES TO FINANCIAL STATEMENTS.
| J.P. Morgan Mid Cap/Multi-Cap Funds | |
| JPMorgan Mid Cap Growth Fund | JPMorgan Mid Cap Value Fund |
| Six Months Ended
December 31, 2023
(Unaudited) | | Six Months Ended
December 31, 2023
(Unaudited) | |
CHANGE IN NET ASSETS RESULTING FROM OPERATIONS: | | | | |
Net investment income (loss) | | | | |
| | | | |
Change in net unrealized appreciation/depreciation | | | | |
Change in net assets resulting from operations | | | | |
DISTRIBUTIONS TO SHAREHOLDERS: | | | | |
| | | | |
| | | | |
| | | | |
| | | | |
| | | | |
| | | | |
| | | | |
| | | | |
| | | | |
Total distributions to shareholders | | | | |
| | | | |
Change in net assets resulting from capital transactions | | | | |
| | | | |
| | | | |
| | | | |
| | | | |
SEE NOTES TO FINANCIAL STATEMENTS.
| J.P. Morgan Mid Cap/Multi-Cap Funds | |
STATEMENTS OF CHANGES IN NET ASSETSFOR THE PERIODS INDICATED (continued)
(Amounts in thousands)
| JPMorgan Value Advantage Fund |
| Six Months Ended
December 31, 2023
(Unaudited) | |
CHANGE IN NET ASSETS RESULTING FROM OPERATIONS: | | |
Net investment income (loss) | | |
| | |
Change in net unrealized appreciation/depreciation | | |
Change in net assets resulting from operations | | |
DISTRIBUTIONS TO SHAREHOLDERS: | | |
| | |
| | |
| | |
| | |
| | |
| | |
| | |
| | |
| | |
Total distributions to shareholders | | |
| | |
Change in net assets resulting from capital transactions | | |
| | |
| | |
| | |
| | |
SEE NOTES TO FINANCIAL STATEMENTS.
| J.P. Morgan Mid Cap/Multi-Cap Funds | |
| JPMorgan Growth Advantage Fund | JPMorgan Mid Cap Equity Fund |
| Six Months Ended December 31, 2023
(Unaudited) | | Six Months Ended December 31, 2023
(Unaudited) | |
| | | | |
| | | | |
Proceeds from shares issued | | | | |
| | | | |
| | | | |
Change in net assets resulting from Class A capital transactions | | | | |
| | | | |
Proceeds from shares issued | | | | |
| | | | |
| | | | |
Change in net assets resulting from Class C capital transactions | | | | |
| | | | |
Proceeds from shares issued | | | | |
| | | | |
| | | | |
Change in net assets resulting from Class I capital transactions | | | | |
| | | | |
Proceeds from shares issued | | | | |
| | | | |
| | | | |
Change in net assets resulting from Class R2 capital transactions | | | | |
| | | | |
Proceeds from shares issued | | | | |
| | | | |
| | | | |
Change in net assets resulting from Class R3 capital transactions | | | | |
| | | | |
Proceeds from shares issued | | | | |
| | | | |
| | | | |
Change in net assets resulting from Class R4 capital transactions | | | | |
| | | | |
Proceeds from shares issued | | | | |
| | | | |
| | | | |
Change in net assets resulting from Class R5 capital transactions | | | | |
SEE NOTES TO FINANCIAL STATEMENTS.
| J.P. Morgan Mid Cap/Multi-Cap Funds | |
STATEMENTS OF CHANGES IN NET ASSETSFOR THE PERIODS INDICATED (continued)
(Amounts in thousands)
| JPMorgan Growth Advantage Fund | JPMorgan Mid Cap Equity Fund |
| Six Months Ended December 31, 2023 (Unaudited) | | Six Months Ended December 31, 2023 (Unaudited) | |
CAPITAL TRANSACTIONS: (continued) | | | | |
| | | | |
Proceeds from shares issued | | | | |
| | | | |
| | | | |
Change in net assets resulting from Class R6 capital transactions | | | | |
Total change in net assets resulting from capital transactions | | | | |
| | | | |
| | | | |
| | | | |
| | | | |
| | | | |
| | | | |
| | | | |
| | | | |
| | | | |
| | | | |
| | | | |
| | | | |
| | | | |
| | | | |
| | | | |
| | | | |
| | | | |
| | | | |
| | | | |
| | | | |
Change in Class R2 Shares | | | | |
| | | | |
| | | | |
| | | | |
| | | | |
Change in Class R3 Shares | | | | |
| | | | |
| | | | |
| | | | |
| | | | |
Change in Class R4 Shares | | | | |
(a)
Amount rounds to less than one thousand.
SEE NOTES TO FINANCIAL STATEMENTS.
| J.P. Morgan Mid Cap/Multi-Cap Funds | |
| JPMorgan Growth Advantage Fund | JPMorgan Mid Cap Equity Fund |
| Six Months Ended December 31, 2023 (Unaudited) | | Six Months Ended December 31, 2023 (Unaudited) | |
SHARE TRANSACTIONS: (continued) | | | | |
| | | | |
| | | | |
| | | | |
| | | | |
Change in Class R5 Shares | | | | |
| | | | |
| | | | |
| | | | |
| | | | |
Change in Class R6 Shares | | | | |
(a)
Amount rounds to less than one thousand.
SEE NOTES TO FINANCIAL STATEMENTS.
| J.P. Morgan Mid Cap/Multi-Cap Funds | |
STATEMENTS OF CHANGES IN NET ASSETSFOR THE PERIODS INDICATED (continued)
(Amounts in thousands)
| JPMorgan Mid Cap Growth Fund | JPMorgan Mid Cap Value Fund |
| Six Months Ended December 31, 2023
(Unaudited) | | Six Months Ended December 31, 2023
(Unaudited) | |
| | | | |
| | | | |
Proceeds from shares issued | | | | |
| | | | |
| | | | |
Change in net assets resulting from Class A capital transactions | | | | |
| | | | |
Proceeds from shares issued | | | | |
| | | | |
| | | | |
Change in net assets resulting from Class C capital transactions | | | | |
| | | | |
Proceeds from shares issued | | | | |
| | | | |
| | | | |
Change in net assets resulting from Class I capital transactions | | | | |
| | | | |
Proceeds from shares issued | | | | |
| | | | |
| | | | |
Change in net assets resulting from Class L capital transactions | | | | |
| | | | |
Proceeds from shares issued | | | | |
| | | | |
| | | | |
Change in net assets resulting from Class R2 capital transactions | | | | |
| | | | |
Proceeds from shares issued | | | | |
| | | | |
| | | | |
Change in net assets resulting from Class R3 capital transactions | | | | |
| | | | |
Proceeds from shares issued | | | | |
| | | | |
| | | | |
Change in net assets resulting from Class R4 capital transactions | | | | |
| | | | |
Proceeds from shares issued | | | | |
| | | | |
| | | | |
Change in net assets resulting from Class R5 capital transactions | | | | |
SEE NOTES TO FINANCIAL STATEMENTS.
| J.P. Morgan Mid Cap/Multi-Cap Funds | |
| JPMorgan Mid Cap Growth Fund | JPMorgan Mid Cap Value Fund |
| Six Months Ended December 31, 2023 (Unaudited) | | Six Months Ended December 31, 2023 (Unaudited) | |
CAPITAL TRANSACTIONS: (continued) | | | | |
| | | | |
Proceeds from shares issued | | | | |
| | | | |
| | | | |
Change in net assets resulting from Class R6 capital transactions | | | | |
Total change in net assets resulting from capital transactions | | | | |
| | | | |
| | | | |
| | | | |
| | | | |
| | | | |
| | | | |
| | | | |
| | | | |
| | | | |
| | | | |
| | | | |
| | | | |
| | | | |
| | | | |
| | | | |
| | | | |
| | | | |
| | | | |
| | | | |
| | | | |
| | | | |
| | | | |
| | | | |
| | | | |
| | | | |
Change in Class R2 Shares | | | | |
| | | | |
| | | | |
| | | | |
| | | | |
Change in Class R3 Shares | | | | |
SEE NOTES TO FINANCIAL STATEMENTS.
| J.P. Morgan Mid Cap/Multi-Cap Funds | |
STATEMENTS OF CHANGES IN NET ASSETSFOR THE PERIODS INDICATED (continued)
(Amounts in thousands)
| JPMorgan Mid Cap Growth Fund | JPMorgan Mid Cap Value Fund |
| Six Months Ended December 31, 2023 (Unaudited) | | Six Months Ended December 31, 2023 (Unaudited) | |
SHARE TRANSACTIONS: (continued) | | | | |
| | | | |
| | | | |
| | | | |
| | | | |
Change in Class R4 Shares | | | | |
| | | | |
| | | | |
| | | | |
| | | | |
Change in Class R5 Shares | | | | |
| | | | |
| | | | |
| | | | |
| | | | |
Change in Class R6 Shares | | | | |
SEE NOTES TO FINANCIAL STATEMENTS.
| J.P. Morgan Mid Cap/Multi-Cap Funds | |
| JPMorgan Value Advantage Fund |
| Six Months Ended December 31, 2023
(Unaudited) | |
| | |
| | |
Proceeds from shares issued | | |
| | |
| | |
Change in net assets resulting from Class A capital transactions | | |
| | |
Proceeds from shares issued | | |
| | |
| | |
Change in net assets resulting from Class C capital transactions | | |
| | |
Proceeds from shares issued | | |
| | |
| | |
Change in net assets resulting from Class I capital transactions | | |
| | |
Proceeds from shares issued | | |
| | |
| | |
Change in net assets resulting from Class L capital transactions | | |
| | |
Proceeds from shares issued | | |
| | |
| | |
Change in net assets resulting from Class R2 capital transactions | | |
| | |
Proceeds from shares issued | | |
| | |
| | |
Change in net assets resulting from Class R3 capital transactions | | |
| | |
Proceeds from shares issued | | |
| | |
| | |
Change in net assets resulting from Class R4 capital transactions | | |
SEE NOTES TO FINANCIAL STATEMENTS.
| J.P. Morgan Mid Cap/Multi-Cap Funds | |
STATEMENTS OF CHANGES IN NET ASSETSFOR THE PERIODS INDICATED (continued)
(Amounts in thousands)
| JPMorgan Value Advantage Fund |
| Six Months Ended December 31, 2023 (Unaudited) | |
CAPITAL TRANSACTIONS: (continued) | | |
| | |
Proceeds from shares issued | | |
| | |
| | |
Change in net assets resulting from Class R5 capital transactions | | |
| | |
Proceeds from shares issued | | |
| | |
| | |
Change in net assets resulting from Class R6 capital transactions | | |
Total change in net assets resulting from capital transactions | | |
| | |
| | |
| | |
| | |
| | |
| | |
| | |
| | |
| | |
| | |
| | |
| | |
| | |
| | |
| | |
| | |
| | |
| | |
| | |
| | |
| | |
| | |
| | |
| | |
| | |
Change in Class R2 Shares | | |
(a)
Amount rounds to less than one thousand.
SEE NOTES TO FINANCIAL STATEMENTS.
| J.P. Morgan Mid Cap/Multi-Cap Funds | |
| JPMorgan Value Advantage Fund |
| Six Months Ended December 31, 2023 (Unaudited) | |
SHARE TRANSACTIONS: (continued) | | |
| | |
| | |
| | |
| | |
Change in Class R3 Shares | | |
| | |
| | |
| | |
| | |
Change in Class R4 Shares | | |
| | |
| | |
| | |
| | |
Change in Class R5 Shares | | |
| | |
| | |
| | |
| | |
Change in Class R6 Shares | | |
(a)
Amount rounds to less than one thousand.
SEE NOTES TO FINANCIAL STATEMENTS.
| J.P. Morgan Mid Cap/Multi-Cap Funds | |
FINANCIAL HIGHLIGHTSFOR THE PERIODS INDICATED
| Per share operating performance |
| | | |
| Net asset
value,
beginning
of period | Net
investment
income
(loss)(b) | Net realized
and unrealized
gains
(losses) on
investments | Total from
investment
operations | | | |
JPMorgan Growth Advantage Fund | | | | | | | |
| | | | | | | |
Six Months Ended December 31, 2023 (Unaudited) | | | | | | | |
| | | | | | | |
| | | | | | | |
| | | | | | | |
| | | | | | | |
| | | | | | | |
| | | | | | | |
Six Months Ended December 31, 2023 (Unaudited) | | | | | | | |
| | | | | | | |
| | | | | | | |
| | | | | | | |
| | | | | | | |
| | | | | | | |
| | | | | | | |
Six Months Ended December 31, 2023 (Unaudited) | | | | | | | |
| | | | | | | |
| | | | | | | |
| | | | | | | |
| | | | | | | |
| | | | | | | |
| | | | | | | |
Six Months Ended December 31, 2023 (Unaudited) | | | | | | | |
| | | | | | | |
| | | | | | | |
| | | | | | | |
| | | | | | | |
| | | | | | | |
| | | | | | | |
Six Months Ended December 31, 2023 (Unaudited) | | | | | | | |
| | | | | | | |
| | | | | | | |
| | | | | | | |
| | | | | | | |
| | | | | | | |
| | | | | | | |
Six Months Ended December 31, 2023 (Unaudited) | | | | | | | |
| | | | | | | |
| | | | | | | |
| | | | | | | |
| | | | | | | |
| | | | | | | |
SEE NOTES TO FINANCIAL STATEMENTS.
| J.P. Morgan Mid Cap/Multi-Cap Funds | |
| |
| | | Ratios to average net assets(a) |
Net asset
value,
end of
period | Total return
(excludes
sales charge)(c)(d) | Net assets,
end of
period
(000's) | | Net
investment
income
(loss) | Expenses without
waivers and reimbursements | |
| | | | | | |
| | | | | | |
| | | | | | |
| | | | | | |
| | | | | | |
| | | | | | |
| | | | | | |
| | | | | | |
| | | | | | |
| | | | | | |
| | | | | | |
| | | | | | |
| | | | | | |
| | | | | | |
| | | | | | |
| | | | | | |
| | | | | | |
| | | | | | |
| | | | | | |
| | | | | | |
| | | | | | |
| | | | | | |
| | | | | | |
| | | | | | |
| | | | | | |
| | | | | | |
| | | | | | |
| | | | | | |
| | | | | | |
| | | | | | |
| | | | | | |
| | | | | | |
| | | | | | |
| | | | | | |
| | | | | | |
| | | | | | |
| | | | | | |
| | | | | | |
| | | | | | |
| | | | | | |
| | | | | | |
| | | | | | |
| | | | | | |
SEE NOTES TO FINANCIAL STATEMENTS.
| J.P. Morgan Mid Cap/Multi-Cap Funds | |
FINANCIAL HIGHLIGHTSFOR THE PERIODS INDICATED (continued)
| Per share operating performance |
| | | |
| Net asset
value,
beginning
of period | Net
investment
income
(loss)(b) | Net realized
and unrealized
gains
(losses) on
investments | Total from
investment
operations | | | |
JPMorgan Growth Advantage Fund (continued) | | | | | | | |
| | | | | | | |
Six Months Ended December 31, 2023 (Unaudited) | | | | | | | |
| | | | | | | |
| | | | | | | |
| | | | | | | |
| | | | | | | |
| | | | | | | |
| | | | | | | |
Six Months Ended December 31, 2023 (Unaudited) | | | | | | | |
| | | | | | | |
| | | | | | | |
| | | | | | | |
| | | | | | | |
| | | | | | | |
|
| Annualized for periods less than one year, unless otherwise noted. |
| Calculated based upon average shares outstanding. |
| Not annualized for periods less than one year. |
| Includes adjustments in accordance with accounting principles generally accepted in the United States of America and as such, the net asset values for financial reporting purposes and the returns based upon those net asset values may differ from the net asset values and returns for shareholder transactions. |
| Includes interest expense, if applicable, each of which is less than 0.005% unless otherwise noted. |
SEE NOTES TO FINANCIAL STATEMENTS.
| J.P. Morgan Mid Cap/Multi-Cap Funds | |
| |
| | | Ratios to average net assets(a) |
Net asset
value,
end of
period | Total return
(excludes
sales charge)(c)(d) | Net assets,
end of
period
(000's) | | Net
investment
income
(loss) | Expenses without
waivers and reimbursements | |
|
| | | | | | |
| | | | | | |
| | | | | | |
| | | | | | |
| | | | | | |
| | | | | | |
| | | | | | |
| | | | | | |
| | | | | | |
| | | | | | |
| | | | | | |
| | | | | | |
| | | | | | |
| | | | | | |
SEE NOTES TO FINANCIAL STATEMENTS.
| J.P. Morgan Mid Cap/Multi-Cap Funds | |
FINANCIAL HIGHLIGHTSFOR THE PERIODS INDICATED
| Per share operating performance |
| | | |
| Net asset
value,
beginning
of period | Net
investment
income
(loss)(b) | Net realized
and unrealized
gains
(losses) on
investments | Total from
investment
operations | | | |
JPMorgan Mid Cap Equity Fund | | | | | | | |
| | | | | | | |
Six Months Ended December 31, 2023 (Unaudited) | | | | | | | |
| | | | | | | |
| | | | | | | |
| | | | | | | |
| | | | | | | |
| | | | | | | |
| | | | | | | |
Six Months Ended December 31, 2023 (Unaudited) | | | | | | | |
| | | | | | | |
| | | | | | | |
| | | | | | | |
| | | | | | | |
| | | | | | | |
| | | | | | | |
Six Months Ended December 31, 2023 (Unaudited) | | | | | | | |
| | | | | | | |
| | | | | | | |
| | | | | | | |
| | | | | | | |
| | | | | | | |
| | | | | | | |
Six Months Ended December 31, 2023 (Unaudited) | | | | | | | |
| | | | | | | |
| | | | | | | |
| | | | | | | |
| | | | | | | |
| | | | | | | |
| | | | | | | |
Six Months Ended December 31, 2023 (Unaudited) | | | | | | | |
| | | | | | | |
| | | | | | | |
| | | | | | | |
| | | | | | | |
| | | | | | | |
SEE NOTES TO FINANCIAL STATEMENTS.
| J.P. Morgan Mid Cap/Multi-Cap Funds | |
| |
| | | Ratios to average net assets(a) |
Net asset
value,
end of
period | Total return
(excludes
sales charge)(c)(d) | Net assets,
end of
period
(000's) | | Net
investment
income
(loss) | Expenses without
waivers and reimbursements | |
| | | | | | |
| | | | | | |
| | | | | | |
| | | | | | |
| | | | | | |
| | | | | | |
| | | | | | |
| | | | | | |
| | | | | | |
| | | | | | |
| | | | | | |
| | | | | | |
| | | | | | |
| | | | | | |
| | | | | | |
| | | | | | |
| | | | | | |
| | | | | | |
| | | | | | |
| | | | | | |
| | | | | | |
| | | | | | |
| | | | | | |
| | | | | | |
| | | | | | |
| | | | | | |
| | | | | | |
| | | | | | |
| | | | | | |
| | | | | | |
| | | | | | |
| | | | | | |
| | | | | | |
| | | | | | |
| | | | | | |
| | | | | | |
SEE NOTES TO FINANCIAL STATEMENTS.
| J.P. Morgan Mid Cap/Multi-Cap Funds | |
FINANCIAL HIGHLIGHTSFOR THE PERIODS INDICATED (continued)
| Per share operating performance |
| | | |
| Net asset
value,
beginning
of period | Net
investment
income
(loss)(b) | Net realized
and unrealized
gains
(losses) on
investments | Total from
investment
operations | | | |
JPMorgan Mid Cap Equity Fund (continued) | | | | | | | |
| | | | | | | |
Six Months Ended December 31, 2023 (Unaudited) | | | | | | | |
| | | | | | | |
| | | | | | | |
| | | | | | | |
| | | | | | | |
| | | | | | | |
|
| Annualized for periods less than one year, unless otherwise noted. |
| Calculated based upon average shares outstanding. |
| Not annualized for periods less than one year. |
| Includes adjustments in accordance with accounting principles generally accepted in the United States of America and as such, the net asset values for financial reporting purposes and the returns based upon those net asset values may differ from the net asset values and returns for shareholder transactions. |
| Includes interest expense, if applicable, each of which is less than 0.005% unless otherwise noted. |
SEE NOTES TO FINANCIAL STATEMENTS.
| J.P. Morgan Mid Cap/Multi-Cap Funds | |
| |
| | | Ratios to average net assets(a) |
Net asset
value,
end of
period | Total return
(excludes
sales charge)(c)(d) | Net assets,
end of
period
(000's) | | Net
investment
income
(loss) | Expenses without
waivers and reimbursements | |
|
| | | | | | |
| | | | | | |
| | | | | | |
| | | | | | |
| | | | | | |
| | | | | | |
| | | | | | |
SEE NOTES TO FINANCIAL STATEMENTS.
| J.P. Morgan Mid Cap/Multi-Cap Funds | |
FINANCIAL HIGHLIGHTSFOR THE PERIODS INDICATED
| Per share operating performance |
| | | |
| Net asset
value,
beginning
of period | Net
investment
income
(loss)(b) | Net realized
and unrealized
gains
(losses) on
investments | Total from
investment
operations | | | |
JPMorgan Mid Cap Growth Fund | | | | | | | |
| | | | | | | |
Six Months Ended December 31, 2023 (Unaudited) | | | | | | | |
| | | | | | | |
| | | | | | | |
| | | | | | | |
| | | | | | | |
| | | | | | | |
| | | | | | | |
Six Months Ended December 31, 2023 (Unaudited) | | | | | | | |
| | | | | | | |
| | | | | | | |
| | | | | | | |
| | | | | | | |
| | | | | | | |
| | | | | | | |
Six Months Ended December 31, 2023 (Unaudited) | | | | | | | |
| | | | | | | |
| | | | | | | |
| | | | | | | |
| | | | | | | |
| | | | | | | |
| | | | | | | |
Six Months Ended December 31, 2023 (Unaudited) | | | | | | | |
| | | | | | | |
| | | | | | | |
| | | | | | | |
| | | | | | | |
| | | | | | | |
| | | | | | | |
Six Months Ended December 31, 2023 (Unaudited) | | | | | | | |
| | | | | | | |
| | | | | | | |
| | | | | | | |
| | | | | | | |
| | | | | | | |
| | | | | | | |
Six Months Ended December 31, 2023 (Unaudited) | | | | | | | |
| | | | | | | |
| | | | | | | |
| | | | | | | |
| | | | | | | |
| | | | | | | |
SEE NOTES TO FINANCIAL STATEMENTS.
| J.P. Morgan Mid Cap/Multi-Cap Funds | |
| |
| | | Ratios to average net assets(a) |
Net asset
value,
end of
period | | Net assets,
end of
period
(000's) | | Net
investment
income
(loss) | Expenses without
waivers and reimbursements | |
| | | | | | |
| | | | | | |
| | | | | | |
| | | | | | |
| | | | | | |
| | | | | | |
| | | | | | |
| | | | | | |
| | | | | | |
| | | | | | |
| | | | | | |
| | | | | | |
| | | | | | |
| | | | | | |
| | | | | | |
| | | | | | |
| | | | | | |
| | | | | | |
| | | | | | |
| | | | | | |
| | | | | | |
| | | | | | |
| | | | | | |
| | | | | | |
| | | | | | |
| | | | | | |
| | | | | | |
| | | | | | |
| | | | | | |
| | | | | | |
| | | | | | |
| | | | | | |
| | | | | | |
| | | | | | |
| | | | | | |
| | | | | | |
| | | | | | |
| | | | | | |
| | | | | | |
| | | | | | |
| | | | | | |
| | | | | | |
| | | | | | |
SEE NOTES TO FINANCIAL STATEMENTS.
| J.P. Morgan Mid Cap/Multi-Cap Funds | |
FINANCIAL HIGHLIGHTSFOR THE PERIODS INDICATED (continued)
| Per share operating performance |
| | | |
| Net asset
value,
beginning
of period | Net
investment
income
(loss)(b) | Net realized
and unrealized
gains
(losses) on
investments | Total from
investment
operations | | | |
JPMorgan Mid Cap Growth Fund (continued) | | | | | | | |
| | | | | | | |
Six Months Ended December 31, 2023 (Unaudited) | | | | | | | |
| | | | | | | |
| | | | | | | |
| | | | | | | |
| | | | | | | |
| | | | | | | |
| | | | | | | |
Six Months Ended December 31, 2023 (Unaudited) | | | | | | | |
| | | | | | | |
| | | | | | | |
| | | | | | | |
| | | | | | | |
| | | | | | | |
|
| Annualized for periods less than one year, unless otherwise noted. |
| Calculated based upon average shares outstanding. |
| Not annualized for periods less than one year. |
| Includes adjustments in accordance with accounting principles generally accepted in the United States of America and as such, the net asset values for financial reporting purposes and the returns based upon those net asset values may differ from the net asset values and returns for shareholder transactions. |
| Includes interest expense, if applicable, each of which is less than 0.005% unless otherwise noted. |
SEE NOTES TO FINANCIAL STATEMENTS.
| J.P. Morgan Mid Cap/Multi-Cap Funds | |
| |
| | | Ratios to average net assets(a) |
Net asset
value,
end of
period | | Net assets,
end of
period
(000's) | | Net
investment
income
(loss) | Expenses without
waivers and reimbursements | |
|
| | | | | | |
| | | | | | |
| | | | | | |
| | | | | | |
| | | | | | |
| | | | | | |
| | | | | | |
| | | | | | |
| | | | | | |
| | | | | | |
| | | | | | |
| | | | | | |
| | | | | | |
| | | | | | |
SEE NOTES TO FINANCIAL STATEMENTS.
| J.P. Morgan Mid Cap/Multi-Cap Funds | |
FINANCIAL HIGHLIGHTSFOR THE PERIODS INDICATED
| Per share operating performance |
| | | |
| Net asset
value,
beginning
of period | Net
investment
income
(loss)(b) | Net realized
and unrealized
gains
(losses) on
investments | Total from
investment
operations | | | |
JPMorgan Mid Cap Value Fund | | | | | | | |
| | | | | | | |
Six Months Ended December 31, 2023 (Unaudited) | | | | | | | |
| | | | | | | |
| | | | | | | |
| | | | | | | |
| | | | | | | |
| | | | | | | |
| | | | | | | |
Six Months Ended December 31, 2023 (Unaudited) | | | | | | | |
| | | | | | | |
| | | | | | | |
| | | | | | | |
| | | | | | | |
| | | | | | | |
| | | | | | | |
Six Months Ended December 31, 2023 (Unaudited) | | | | | | | |
| | | | | | | |
| | | | | | | |
| | | | | | | |
| | | | | | | |
| | | | | | | |
| | | | | | | |
Six Months Ended December 31, 2023 (Unaudited) | | | | | | | |
| | | | | | | |
| | | | | | | |
| | | | | | | |
| | | | | | | |
| | | | | | | |
| | | | | | | |
Six Months Ended December 31, 2023 (Unaudited) | | | | | | | |
| | | | | | | |
| | | | | | | |
| | | | | | | |
| | | | | | | |
| | | | | | | |
| | | | | | | |
Six Months Ended December 31, 2023 (Unaudited) | | | | | | | |
| | | | | | | |
| | | | | | | |
| | | | | | | |
| | | | | | | |
| | | | | | | |
SEE NOTES TO FINANCIAL STATEMENTS.
| J.P. Morgan Mid Cap/Multi-Cap Funds | |
| |
| | | Ratios to average net assets(a) |
Net asset
value,
end of
period | Total return
(excludes
sales charge)(c)(d) | Net assets,
end of
period
(000's) | | Net
investment
income
(loss) | Expenses without
waivers and reimbursements | |
| | | | | | |
| | | | | | |
| | | | | | |
| | | | | | |
| | | | | | |
| | | | | | |
| | | | | | |
| | | | | | |
| | | | | | |
| | | | | | |
| | | | | | |
| | | | | | |
| | | | | | |
| | | | | | |
| | | | | | |
| | | | | | |
| | | | | | |
| | | | | | |
| | | | | | |
| | | | | | |
| | | | | | |
| | | | | | |
| | | | | | |
| | | | | | |
| | | | | | |
| | | | | | |
| | | | | | |
| | | | | | |
| | | | | | |
| | | | | | |
| | | | | | |
| | | | | | |
| | | | | | |
| | | | | | |
| | | | | | |
| | | | | | |
| | | | | | |
| | | | | | |
| | | | | | |
| | | | | | |
| | | | | | |
| | | | | | |
| | | | | | |
SEE NOTES TO FINANCIAL STATEMENTS.
| J.P. Morgan Mid Cap/Multi-Cap Funds | |
FINANCIAL HIGHLIGHTSFOR THE PERIODS INDICATED (continued)
| Per share operating performance |
| | | |
| Net asset
value,
beginning
of period | Net
investment
income
(loss)(b) | Net realized
and unrealized
gains
(losses) on
investments | Total from
investment
operations | | | |
JPMorgan Mid Cap Value Fund (continued) | | | | | | | |
| | | | | | | |
Six Months Ended December 31, 2023 (Unaudited) | | | | | | | |
| | | | | | | |
| | | | | | | |
| | | | | | | |
| | | | | | | |
| | | | | | | |
| | | | | | | |
Six Months Ended December 31, 2023 (Unaudited) | | | | | | | |
| | | | | | | |
| | | | | | | |
| | | | | | | |
| | | | | | | |
| | | | | | | |
| | | | | | | |
Six Months Ended December 31, 2023 (Unaudited) | | | | | | | |
| | | | | | | |
| | | | | | | |
| | | | | | | |
| | | | | | | |
| | | | | | | |
|
| Annualized for periods less than one year, unless otherwise noted. |
| Calculated based upon average shares outstanding. |
| Not annualized for periods less than one year. |
| Includes adjustments in accordance with accounting principles generally accepted in the United States of America and as such, the net asset values for financial reporting purposes and the returns based upon those net asset values may differ from the net asset values and returns for shareholder transactions. |
| Includes interest expense, if applicable, each of which is less than 0.005% unless otherwise noted. |
SEE NOTES TO FINANCIAL STATEMENTS.
| J.P. Morgan Mid Cap/Multi-Cap Funds | |
| |
| | | Ratios to average net assets(a) |
Net asset
value,
end of
period | Total return
(excludes
sales charge)(c)(d) | Net assets,
end of
period
(000's) | | Net
investment
income
(loss) | Expenses without
waivers and reimbursements | |
|
| | | | | | |
| | | | | | |
| | | | | | |
| | | | | | |
| | | | | | |
| | | | | | |
| | | | | | |
| | | | | | |
| | | | | | |
| | | | | | |
| | | | | | |
| | | | | | |
| | | | | | |
| | | | | | |
| | | | | | |
| | | | | | |
| | | | | | |
| | | | | | |
| | | | | | |
| | | | | | |
| | | | | | |
SEE NOTES TO FINANCIAL STATEMENTS.
| J.P. Morgan Mid Cap/Multi-Cap Funds | |
FINANCIAL HIGHLIGHTSFOR THE PERIODS INDICATED
| Per share operating performance |
| | | |
| Net asset
value,
beginning
of period | Net
investment
income
(loss)(b) | Net realized
and unrealized
gains
(losses) on
investments | Total from
investment
operations | | | |
JPMorgan Value Advantage Fund | | | | | | | |
| | | | | | | |
Six Months Ended December 31, 2023 (Unaudited) | | | | | | | |
| | | | | | | |
| | | | | | | |
| | | | | | | |
| | | | | | | |
| | | | | | | |
| | | | | | | |
Six Months Ended December 31, 2023 (Unaudited) | | | | | | | |
| | | | | | | |
| | | | | | | |
| | | | | | | |
| | | | | | | |
| | | | | | | |
| | | | | | | |
Six Months Ended December 31, 2023 (Unaudited) | | | | | | | |
| | | | | | | |
| | | | | | | |
| | | | | | | |
| | | | | | | |
| | | | | | | |
| | | | | | | |
Six Months Ended December 31, 2023 (Unaudited) | | | | | | | |
| | | | | | | |
| | | | | | | |
| | | | | | | |
| | | | | | | |
| | | | | | | |
| | | | | | | |
Six Months Ended December 31, 2023 (Unaudited) | | | | | | | |
| | | | | | | |
| | | | | | | |
| | | | | | | |
| | | | | | | |
| | | | | | | |
| | | | | | | |
Six Months Ended December 31, 2023 (Unaudited) | | | | | | | |
| | | | | | | |
| | | | | | | |
| | | | | | | |
| | | | | | | |
| | | | | | | |
SEE NOTES TO FINANCIAL STATEMENTS.
| J.P. Morgan Mid Cap/Multi-Cap Funds | |
| |
| | | Ratios to average net assets(a) |
Net asset
value,
end of
period | Total return
(excludes
sales charge)(c)(d) | Net assets,
end of
period
(000's) | | Net
investment
income
(loss) | Expenses without
waivers and reimbursements | |
| | | | | | |
| | | | | | |
| | | | | | |
| | | | | | |
| | | | | | |
| | | | | | |
| | | | | | |
| | | | | | |
| | | | | | |
| | | | | | |
| | | | | | |
| | | | | | |
| | | | | | |
| | | | | | |
| | | | | | |
| | | | | | |
| | | | | | |
| | | | | | |
| | | | | | |
| | | | | | |
| | | | | | |
| | | | | | |
| | | | | | |
| | | | | | |
| | | | | | |
| | | | | | |
| | | | | | |
| | | | | | |
| | | | | | |
| | | | | | |
| | | | | | |
| | | | | | |
| | | | | | |
| | | | | | |
| | | | | | |
| | | | | | |
| | | | | | |
| | | | | | |
| | | | | | |
| | | | | | |
| | | | | | |
| | | | | | |
| | | | | | |
SEE NOTES TO FINANCIAL STATEMENTS.
| J.P. Morgan Mid Cap/Multi-Cap Funds | |
FINANCIAL HIGHLIGHTSFOR THE PERIODS INDICATED (continued)
| Per share operating performance |
| | | |
| Net asset
value,
beginning
of period | Net
investment
income
(loss)(b) | Net realized
and unrealized
gains
(losses) on
investments | Total from
investment
operations | | | |
JPMorgan Value Advantage Fund (continued) | | | | | | | |
| | | | | | | |
Six Months Ended December 31, 2023 (Unaudited) | | | | | | | |
| | | | | | | |
| | | | | | | |
| | | | | | | |
| | | | | | | |
| | | | | | | |
| | | | | | | |
Six Months Ended December 31, 2023 (Unaudited) | | | | | | | |
| | | | | | | |
| | | | | | | |
| | | | | | | |
| | | | | | | |
| | | | | | | |
| | | | | | | |
Six Months Ended December 31, 2023 (Unaudited) | | | | | | | |
| | | | | | | |
| | | | | | | |
| | | | | | | |
| | | | | | | |
| | | | | | | |
|
| Annualized for periods less than one year, unless otherwise noted. |
| Calculated based upon average shares outstanding. |
| Not annualized for periods less than one year. |
| Includes adjustments in accordance with accounting principles generally accepted in the United States of America and as such, the net asset values for financial reporting purposes and the returns based upon those net asset values may differ from the net asset values and returns for shareholder transactions. |
| Includes interest expense, if applicable, each of which is less than 0.005% unless otherwise noted. |
SEE NOTES TO FINANCIAL STATEMENTS.
| J.P. Morgan Mid Cap/Multi-Cap Funds | |
| |
| | | Ratios to average net assets(a) |
Net asset
value,
end of
period | Total return
(excludes
sales charge)(c)(d) | Net assets,
end of
period
(000's) | | Net
investment
income
(loss) | Expenses without
waivers and reimbursements | |
|
| | | | | | |
| | | | | | |
| | | | | | |
| | | | | | |
| | | | | | |
| | | | | | |
| | | | | | |
| | | | | | |
| | | | | | |
| | | | | | |
| | | | | | |
| | | | | | |
| | | | | | |
| | | | | | |
| | | | | | |
| | | | | | |
| | | | | | |
| | | | | | |
| | | | | | |
| | | | | | |
| | | | | | |
SEE NOTES TO FINANCIAL STATEMENTS.
| J.P. Morgan Mid Cap/Multi-Cap Funds | |
NOTES TO FINANCIAL STATEMENTSAS OF December 31, 2023 (Unaudited)
(Dollar values in thousands)
1. Organization
JPMorgan Trust I (“JPM I") and JPMorgan Trust II (“JPM II") (collectively, the “Trusts”) were formed on November 12, 2004, as Delaware statutory trusts, pursuant to Declarations of Trust dated November 5, 2004 and are registered under the Investment Company Act of 1940, as amended (the “1940 Act”), as open-end management investment companies.
J.P. Morgan Mutual Fund Investment Trust (“JPMMFIT”) was organized as a Massachusetts business trust on September 23, 1997, as an open-end management investment company.
J.P. Morgan Fleming Mutual Fund Group, Inc. (“JPMFMFG,” and with JPM I, JPM II and JPMMFIT, collectively, the “Trusts”) was organized as a Maryland corporation on August 19, 1997, as an open-end management investment company.
The following are 5 separate funds of the Trusts (each, a "Fund" and collectively, the "Funds") covered by this report:
| | | Diversification Classification |
JPMorgan Growth Advantage Fund | Class A, Class C, Class I, Class R2, Class R3, Class R4, Class R5 and Class R6 | | |
JPMorgan Mid Cap Equity Fund | Class A, Class C, Class I, Class R2, Class R5 and Class R6 | | |
JPMorgan Mid Cap Growth Fund | Class A, Class C, Class I, Class R2, Class R3, Class R4, Class R5 and Class R6 | | |
JPMorgan Mid Cap Value Fund | Class A, Class C, Class I, Class L, Class R2, Class R3, Class R4, Class R5 and Class R6 | | |
JPMorgan Value Advantage Fund | Class A, Class C, Class I, Class L, Class R2, Class R3, Class R4, Class R5 and Class R6 | | |
The investment objective of JPMorgan Growth Advantage Fund (“Growth Advantage Fund”) and JPMorgan Mid Cap Equity Fund (“Mid Cap Equity Fund”) is to seek to provide long-term capital growth.
The investment objective of JPMorgan Mid Cap Growth Fund (“Mid Cap Growth Fund”) is to seek growth of capital.
The investment objective of JPMorgan Mid Cap Value Fund (“Mid Cap Value Fund”) is to seek growth from capital appreciation.
The investment objective of JPMorgan Value Advantage Fund (“Value Advantage Fund”) is to seek to provide long-term total return from a combination of income and capital gains.
Class L Shares of Mid Cap Value Fund and Value Advantage Fund are publicly offered on a limited basis. Investors are not eligible to purchase Class L Shares of the Funds unless they meet certain requirements as described in the Funds’ prospectus.
Class A Shares generally provide for a front-end sales charge while Class C Shares provide for a contingent deferred sales charge ("CDSC"). No sales charges are assessed with respect to Class I, Class L, Class R2, Class R3, Class R4, Class R5 and Class R6 Shares. Certain Class A Shares, for which front-end sales charges have been waived, may be subject to a CDSC as described in the Funds' prospectus. Class C Shares automatically convert to Class A Shares after eight years. All classes of shares have equal rights as to earnings, assets and voting privileges, except that each class may bear different transfer agency, distribution and service fees and each class has exclusive voting rights with respect to its distribution plan and shareholder servicing agreements.
J.P. Morgan Investment Management Inc. (“JPMIM”), an indirect, wholly-owned subsidiary of JPMorgan Chase & Co. (“JPMorgan”), acts as adviser (the “Adviser”) and administrator (the “Administrator”) to the Funds.
2. Significant Accounting Policies
The following is a summary of significant accounting policies followed by the Funds in the preparation of their financial statements. The Funds are investment companies and, accordingly, follow the investment company accounting and reporting guidance of the Financial Accounting Standards Board (“FASB”) Accounting Standards Codification Topic 946 — Investment Companies, which is part of U.S. generally accepted accounting principles (“GAAP”). The preparation of financial statements in conformity with GAAP requires management to make estimates and assumptions that affect (i) the reported amounts of assets and liabilities, (ii) disclosure of contingent assets and liabilities at the date of the financial statements, and (iii) the reported amounts of increases and decreases in net assets from operations during the reporting period. Actual results could differ from those estimates.
| J.P. Morgan Mid Cap/Multi-Cap Funds | |
A. Valuation of Investments — Investments are valued in accordance with GAAP and the Funds' valuation policies set forth by, and under the supervision and responsibility of, the Boards of Trustees of the Trusts (the "Boards"), which established the following approach to valuation, as described more fully below: (i) investments for which market quotations are readily available shall be valued at their market value and (ii) all other investments for which market quotations are not readily available shall be valued at their fair value as determined in good faith by the Boards.
Under Section 2(a)(41) of the 1940 Act, the Boards are required to determine fair value for securities that do not have readily available market quotations. Under SEC Rule 2a-5 (Good Faith Determinations of Fair Value), the Boards may designate the performance of these fair valuation determinations to a valuation designee. The Boards have designated the Adviser as the “Valuation Designee” to perform fair valuation determinations for the Funds on behalf of the Boards subject to appropriate oversight by the Boards. The Adviser, as Valuation Designee, leverages the J.P. Morgan Asset Management Americas Valuation Committee (“AVC”) to help oversee and carry out the policies for the valuation of investments held in the Funds. The Adviser, as Valuation Designee, remains responsible for the valuation determinations.
This oversight by the AVC includes monitoring the appropriateness of fair values based on results of ongoing valuation oversight including, but not limited to, consideration of macro or security specific events, market events, and pricing vendor and broker due diligence. The Administrator is responsible for discussing and assessing the potential impacts to the fair values on an ongoing basis, and, at least on a quarterly basis, with the AVC and the Boards.
Equities and other exchange-traded instruments are valued at the last sale price or official market closing price on the primary exchange on which the instrument is traded before the net asset values (“NAV”) of the Funds are calculated on a valuation date.
Investments in open-end investment companies (“Underlying Funds”) are valued at each Underlying Fund’s NAV per share as of the report date.
Valuations reflected in this report are as of the report date. As a result, changes in valuation due to market events and/or issuer-related events after the report date and prior to issuance of the report are not reflected herein.
The various inputs that are used in determining the valuation of the Funds' investments are summarized into the three broad levels listed below.
•
Level 1 — Unadjusted inputs using quoted prices in active markets for identical investments.
•
Level 2 — Other significant observable inputs including, but not limited to, quoted prices for similar investments, inputs other than quoted prices that are observable for investments (such as interest rates, prepayment speeds, credit risk, etc.) or other market corroborated inputs.
•
Level 3 — Significant inputs based on the best information available in the circumstances, to the extent observable inputs are not available (including the Funds' assumptions in determining the fair value of investments).
A financial instrument’s level within the fair value hierarchy is based on the lowest level of any input, both individually and in the aggregate, that is significant to the fair value measurement. The inputs or methodology used for valuing instruments are not necessarily an indication of the risk associated with investing in those instruments.
The following tables represent each valuation input as presented on the Schedules of Portfolio Investments ("SOIs"):
| | | | |
| | Level 2
Other significant
observable inputs | Level 3
Significant
unobservable inputs | |
Investments in Securities | | | | |
| | | | |
| | | | |
| | | | |
| | | | |
| | | | |
| | | | |
| | | | |
Commercial Services & Supplies | | | | |
| | | | |
Construction & Engineering | | | | |
| | | | |
| | | | |
Electronic Equipment, Instruments & Components | | | | |
Energy Equipment & Services | | | | |
| | | | |
| | | | |
| J.P. Morgan Mid Cap/Multi-Cap Funds | |
NOTES TO FINANCIAL STATEMENTSAS OF December 31, 2023 (Unaudited) (continued)
(Dollar values in thousands)
Growth Advantage Fund (continued) | | | | |
| | Level 2 Other significant observable inputs | Level 3 Significant unobservable inputs | |
| | | | |
Health Care Equipment & Supplies | | | | |
Health Care Providers & Services | | | | |
Hotels, Restaurants & Leisure | | | | |
| | | | |
| | | | |
Interactive Media & Services | | | | |
| | | | |
Life Sciences Tools & Services | | | | |
| | | | |
| | | | |
| | | | |
Oil, Gas & Consumable Fuels | | | | |
| | | | |
| | | | |
Semiconductors & Semiconductor Equipment | | | | |
| | | | |
| | | | |
Technology Hardware, Storage & Peripherals | | | | |
Textiles, Apparel & Luxury Goods | | | | |
Trading Companies & Distributors | | | | |
| | | | |
| | | | |
| | | | |
Investment of Cash Collateral from Securities Loaned | | | | |
Total Short-Term Investments | | | | |
Total Investments in Securities | | | | |
| | | | |
| | Level 2
Other significant
observable inputs | Level 3
Significant
unobservable inputs | |
Total Investments in Securities (a) | | | | |
|
| Please refer to the SOI for specifics of portfolio holdings. |
| | | | |
| | Level 2
Other significant
observable inputs | Level 3
Significant
unobservable inputs | |
Investments in Securities | | | | |
| | | | |
| | | | |
| | | | |
| | | | |
| | | | |
| | | | |
| | | | |
| J.P. Morgan Mid Cap/Multi-Cap Funds | |
Mid Cap Growth Fund (continued) | | | | |
| | Level 2 Other significant observable inputs | Level 3 Significant unobservable inputs | |
Commercial Services & Supplies | | | | |
| | | | |
Construction & Engineering | | | | |
| | | | |
Diversified Consumer Services | | | | |
| | | | |
Electronic Equipment, Instruments & Components | | | | |
Energy Equipment & Services | | | | |
| | | | |
| | | | |
| | | | |
Health Care Equipment & Supplies | | | | |
Health Care Providers & Services | | | | |
Hotels, Restaurants & Leisure | | | | |
| | | | |
| | | | |
| | | | |
Life Sciences Tools & Services | | | | |
| | | | |
| | | | |
| | | | |
Oil, Gas & Consumable Fuels | | | | |
| | | | |
| | | | |
| | | | |
Semiconductors & Semiconductor Equipment | | | | |
| | | | |
| | | | |
Textiles, Apparel & Luxury Goods | | | | |
Trading Companies & Distributors | | | | |
| | | | |
| | | | |
| | | | |
Investment of Cash Collateral from Securities Loaned | | | | |
Total Short-Term Investments | | | | |
Total Investments in Securities | | | | |
| | | | |
| | Level 2
Other significant
observable inputs | Level 3
Significant
unobservable inputs | |
Total Investments in Securities (a) | | | | |
|
| Please refer to the SOI for specifics of portfolio holdings. |
| J.P. Morgan Mid Cap/Multi-Cap Funds | |
NOTES TO FINANCIAL STATEMENTSAS OF December 31, 2023 (Unaudited) (continued)
(Dollar values in thousands)
| | | | |
| | Level 2
Other significant
observable inputs | Level 3
Significant
unobservable inputs | |
Total Investments in Securities (a) | | | | |
|
| Please refer to the SOI for specifics of portfolio holdings. |
B. Restricted Securities— Certain securities held by the Funds may be subject to legal or contractual restrictions on resale. Restricted securities generally are resold in transactions exempt from registration under the Securities Act of 1933, as amended (the “Securities Act”). Disposal of these securities may involve time-consuming negotiations and expense. Prompt sale at the current valuation may be difficult and could adversely affect the NAVs of the Funds.
As of December 31, 2023, the Funds, with the exception of Growth Advantage Fund and Mid Cap Growth Fund, had no investments in restricted securities other than securities sold to the Funds under Rule 144A and/or Regulation S under the Securities Act.
As of December 31, 2023, Growth Advantage Fund and Mid Cap Growth Fund held restricted securities as follows:
Growth Advantage Fund
| | | | Percentage
of Funds
Net Assets |
| | | | |
Mid Cap Growth Fund
| | | | Percentage
of Funds
Net Assets |
| | | | |
C. Securities Lending — The Funds are authorized to engage in securities lending in order to generate additional income. The Funds are able to lend to approved borrowers. Citibank N.A. (“Citibank”) serves as lending agent for the Funds, pursuant to a Securities Lending Agency Agreement (the “Securities Lending Agency Agreement”). Securities loaned are collateralized by cash equal to at least 100% of the market value plus accrued interest on the securities lent, which is invested in the Class IM Shares of the JPMorgan U.S. Government Money Market Fund and the Agency SL Class Shares of the JPMorgan Securities Lending Money Market Fund. The Funds retain the interest earned on cash collateral investments but are required to pay the borrower a rebate for the use of the cash collateral. In cases where the lent security is of high value to borrowers, there may be a negative rebate (i.e., a net payment from the borrower to the Funds). Upon termination of a loan, the Funds are required to return to the borrower an amount equal to the cash collateral, plus any rebate owed to the borrowers. The remaining maturities of the securities lending transactions are considered overnight and continuous. Loans are subject to termination by the Funds or the borrower at any time.
The net income earned on the securities lending (after payment of rebates and Citibank’s fee) is included on the Statements of Operations as Income from securities lending (net). The Funds also receive payments from the borrower during the period of the loan, equivalent to dividends and interest earned on the securities loaned, which are recorded as Dividend or Interest income, respectively, on the Statements of Operations.
Under the Securities Lending Agency Agreement, Citibank marks to market the loaned securities on a daily basis. In the event the cash received from the borrower is less than 102% of the value of the loaned securities (105% for loans of non-U.S. securities), Citibank requests additional cash from the borrower so as to maintain a collateralization level of at least 102% of the value of the loaned securities plus accrued interest (105% for loans of non-U.S. securities), subject to certain de minimis amounts.
The value of securities out on loan is recorded as an asset on the Statements of Assets and Liabilities. The value of the cash collateral received is recorded as a liability on the Statements of Assets and Liabilities and details of collateral investments are disclosed on the SOIs.
The Funds bear the risk of loss associated with the collateral investments and are not entitled to additional collateral from the borrower to cover any such losses. To the extent that the value of the collateral investments declines below the amount owed to a borrower, the Funds may incur losses that exceed the amount they earned on lending the security. Upon termination of a loan, the Funds may use leverage (borrow money) to repay the borrower for cash collateral posted if the Adviser does not believe that it is prudent to sell the collateral investments to fund the payment of this liability. Securities lending activity is subject to master netting arrangements.
| J.P. Morgan Mid Cap/Multi-Cap Funds | |
The following table presents for each lending Fund, the value of the securities on loan with Citibank, net of amounts available for offset under the master netting arrangements and any related collateral received or posted by the Funds as of December 31, 2023.
| Investment Securities
on Loan, at value,
Presented on the
Statements of Assets
and Liabilities | Cash Collateral
Posted by Borrower* | Net Amount Due
to Counterparty
(not less than zero) |
| | | |
| | | |
| | | |
| | | |
| | | |
|
| Collateral posted reflects the value of securities on loan and does not include any additional amounts received from the borrower. |
Securities lending also involves counterparty risks, including the risk that the loaned securities may not be returned in a timely manner or at all. Subject to certain conditions, Citibank has agreed to indemnify the Funds from losses resulting from a borrower’s failure to return a loaned security.
JPMIM voluntarily waived investment advisory fees charged to the Funds to reduce the impact of the cash collateral investment in the JPMorgan U.S. Government Money Market Fund from 0.13% to 0.06%. For the six months ended December 31, 2023, JPMIM waived fees associated with the Funds' investment in the JPMorgan U.S. Government Money Market Fund as follows:
The above waiver is included in the determination of earnings on cash collateral investment and in the calculation of Citibank’s compensation and is included on the Statements of Operations as Income from securities lending (net).
D. Investment Transactions with Affiliates — The Funds invested in Underlying Funds advised by the Adviser. An issuer which is under common control with a Fund may be considered an affiliate. For the purposes of the financial statements, the Funds assume the issuers listed in the tables below to be affiliated issuers. The Underlying Funds’ distributions may be reinvested into such Underlying Funds. Reinvestment amounts are included in the purchases at cost amounts in the tables below.
|
For the six months ended December 31, 2023 |
| | | | | Change in
Unrealized
Appreciation/
(Depreciation) | | Shares at
December 31,
2023 | | Capital Gain
Distributions |
JPMorgan Prime Money Market Fund Class IM Shares, 5.51% (a) (b) | | | | | | | | | |
JPMorgan Securities Lending Money Market Fund Agency SL Class Shares, 5.56% (a) (b) | | | | | | | | | |
JPMorgan U.S. Government Money Market Fund Class IM Shares, 5.30% (a) (b) | | | | | | | | | |
| | | | | | | | | |
|
| Investment in an affiliated fund, which is registered under the Investment Company Act of 1940, as amended, and is advised by J.P. Morgan Investment Management Inc. |
| The rate shown is the current yield as of December 31, 2023. |
| Amount rounds to less than one thousand. |
| Amount is included on the Statements of Operations as Income from securities lending (net) (after payments of rebates and Citibank’s fee). |
| J.P. Morgan Mid Cap/Multi-Cap Funds | |
NOTES TO FINANCIAL STATEMENTSAS OF December 31, 2023 (Unaudited) (continued)
(Dollar values in thousands)
|
For the six months ended December 31, 2023 |
| | | | | Change in
Unrealized
Appreciation/
(Depreciation) | | Shares at
December 31,
2023 | | Capital Gain
Distributions |
JPMorgan Prime Money Market Fund Class IM Shares, 5.51% (a) (b) | | | | | | | | | |
JPMorgan Securities Lending Money Market Fund Agency SL Class Shares, 5.56% (a) (b) | | | | | | | | | |
JPMorgan U.S. Government Money Market Fund Class IM Shares, 5.30% (a) (b) | | | | | | | | | |
| | | | | | | | | |
|
| Investment in an affiliated fund, which is registered under the Investment Company Act of 1940, as amended, and is advised by J.P. Morgan Investment Management Inc. |
| The rate shown is the current yield as of December 31, 2023. |
| Amount rounds to less than one thousand. |
| Amount is included on the Statements of Operations as Income from securities lending (net) (after payments of rebates and Citibank’s fee). |
|
For the six months ended December 31, 2023 |
| | | | | Change in
Unrealized
Appreciation/
(Depreciation) | | Shares at
December 31,
2023 | | Capital Gain
Distributions |
JPMorgan Prime Money Market Fund Class IM Shares, 5.51% (a) (b) | | | | | | | | | |
JPMorgan Securities Lending Money Market Fund Agency SL Class Shares, 5.56% (a) (b) | | | | | | | | | |
JPMorgan U.S. Government Money Market Fund Class IM Shares, 5.30% (a) (b) | | | | | | | | | |
| | | | | | | | | |
|
| Investment in an affiliated fund, which is registered under the Investment Company Act of 1940, as amended, and is advised by J.P. Morgan Investment Management Inc. |
| The rate shown is the current yield as of December 31, 2023. |
| Amount is included on the Statements of Operations as Income from securities lending (net) (after payments of rebates and Citibank’s fee). |
|
For the six months ended December 31, 2023 |
| | | | | Change in
Unrealized
Appreciation/
(Depreciation) | | Shares at
December 31,
2023 | | Capital Gain
Distributions |
JPMorgan Prime Money Market Fund Class IM Shares, 5.51% (a) (b) | | | | | | | | | |
| J.P. Morgan Mid Cap/Multi-Cap Funds | |
Mid Cap Value Fund (continued) |
For the six months ended December 31, 2023 |
| | | | | Change in Unrealized Appreciation/ (Depreciation) | | Shares at December 31, 2023 | | Capital Gain Distributions |
JPMorgan Securities Lending Money Market Fund Agency SL Class Shares, 5.56% (a) (b) | | | | | | | | | |
JPMorgan U.S. Government Money Market Fund Class IM Shares, 5.30% (a) (b) | | | | | | | | | |
| | | | | | | | | |
|
| Investment in an affiliated fund, which is registered under the Investment Company Act of 1940, as amended, and is advised by J.P. Morgan Investment Management Inc. |
| The rate shown is the current yield as of December 31, 2023. |
| Amount is included on the Statements of Operations as Income from securities lending (net) (after payments of rebates and Citibank’s fee). |
|
For the six months ended December 31, 2023 |
| | | | | Change in
Unrealized
Appreciation/
(Depreciation) | | Shares at
December 31,
2023 | | Capital Gain
Distributions |
JPMorgan Prime Money Market Fund Class IM Shares, 5.51% (a) (b) | | | | | | | | | |
JPMorgan Securities Lending Money Market Fund Agency SL Class Shares, 5.56% (a) (b) | | | | | | | | | |
JPMorgan U.S. Government Money Market Fund Class IM Shares, 5.30% (a) (b) | | | | | | | | | |
| | | | | | | | | |
|
| Investment in an affiliated fund, which is registered under the Investment Company Act of 1940, as amended, and is advised by J.P. Morgan Investment Management Inc. |
| The rate shown is the current yield as of December 31, 2023. |
| Amount is included on the Statements of Operations as Income from securities lending (net) (after payments of rebates and Citibank’s fee). |
E. Foreign Currency Translation — The books and records of the Funds are maintained in U.S. dollars. Foreign currency amounts are translated into U.S. dollars at the prevailing exchange rates of such currencies against the U.S. dollar. The market value of investment securities and other assets and liabilities are translated at the exchange rate as of the valuation date. Purchases and sales of investment securities, income and expenses are translated at the exchange rate prevailing on the respective dates of such transactions.
The Funds do not isolate the effect of changes in foreign exchange rates from changes in market prices on securities held. Accordingly, such changes are included within Change in net unrealized appreciation/depreciation on investments in non-affiliates on the Statements of Operations.
Reported realized foreign currency gains and losses arise from the disposition of foreign currency, currency gains or losses realized between the trade and settlement dates on securities transactions, and the difference between the amounts of dividends, interest and foreign withholding taxes recorded on each Fund's books on the transaction date and the U.S. dollar equivalent of the amounts actually received or paid. These reported realized foreign currency gains and losses are included in Net realized gain (loss) on foreign currency transactions on the Statements of Operations. Unrealized foreign currency gains and losses arise from changes (due to changes in exchange rates) in the value of foreign currency and other assets and liabilities denominated in foreign currencies, which are held at period end and are included in Change in net unrealized appreciation/depreciation on foreign currency translations on the Statements of Operations.
F. Security Transactions and Investment Income — Investment transactions are accounted for on the trade date (the date the order to buy or sell is executed). Securities gains and losses are calculated on a specifically identified cost basis.
Dividend income is recorded on the ex-dividend date or when a Fund first learns of the dividend.
| J.P. Morgan Mid Cap/Multi-Cap Funds | |
NOTES TO FINANCIAL STATEMENTSAS OF December 31, 2023 (Unaudited) (continued)
(Dollar values in thousands)
To the extent such information is publicly available, the Funds record distributions received in excess of income earned from underlying investments as a reduction of cost of investments and/or realized gain. Such amounts are based on estimates if actual amounts are not available and actual amounts of income, realized gain and return of capital may differ from the estimated amounts. The Funds adjust the estimated amounts of the components of distributions (and consequently their net investment income) as necessary, once the issuers provide information about the actual composition of the distributions.
G. Allocation of Income and Expenses— Expenses directly attributable to a Fund are charged directly to that Fund, while the expenses attributable to more than one fund of the Trusts are allocated among the applicable funds. Investment income, realized and unrealized gains and losses and expenses, other than class-specific expenses, are allocated daily to each class of shares based upon the proportion of net assets of each class at the beginning of each day.
Transfer agency fees are class-specific expenses. The amount of the transfer agency fees charged to each share class of the Funds for the six months ended December 31, 2023 are as follows:
|
| Amount rounds to less than one thousand. |
H. Federal Income Taxes — Each Fund is treated as a separate taxable entity for Federal income tax purposes. Each Fund's policy is to comply with the provisions of the Internal Revenue Code (the “Code”) applicable to regulated investment companies and to distribute to shareholders all of its distributable net investment income and net realized capital gains on investments. Accordingly, no provision for Federal income tax is necessary. Management has reviewed the Funds' tax positions for all open tax years and has determined that as of December 31, 2023, no liability for Federal income tax is required in the Funds' financial statements for net unrecognized tax benefits. However, management’s conclusions may be subject to future review based on changes in, or the interpretation of, the accounting standards or tax laws and regulations. Each Fund's Federal tax returns for the prior three fiscal years remain subject to examination by the Internal Revenue Service.
I. Distributions to Shareholders— Distributions from net investment income, if any, are generally declared and paid at least annually and are declared separately for each class. No class has preferential dividend rights; differences in per share rates are due to differences in separate class expenses. Net realized capital gains, if any, are distributed by each Fund at least annually. The amount of distributions from net investment income and net realized capital gains is determined in accordance with Federal income tax regulations, which may differ from GAAP. To the extent these “book/tax” differences are permanent in nature (i.e., that they result from other than timing of recognition — “temporary differences”), such amounts are reclassified within the capital accounts based on their Federal tax basis treatment.
3. Fees and Other Transactions with Affiliates
A. Investment Advisory Fee — Pursuant to an Investment Advisory Agreement, the Adviser manages the investments of each Fund and for such services is paid a fee. The investment advisory fee is accrued daily and paid monthly at an annual rate based on each Fund's respective average daily net assets. The annual rate for each Fund is as follows:
The Adviser waived investment advisory fees and/or reimbursed expenses as outlined in Note 3.F.
| J.P. Morgan Mid Cap/Multi-Cap Funds | |
B. Administration Fee— Pursuant to an Administration Agreement, the Administrator provides certain administration services to each Fund. In consideration of these services, the Administrator receives a fee accrued daily and paid monthly at an annual rate of 0.075% of the first $10 billion of each Fund's respective average daily net assets, plus 0.050% of each Fund's respective average daily net assets between $10 billion and $20 billion, plus 0.025% of each Fund's respective average daily net assets between $20 billion and $25 billion, plus 0.010% of each Fund's respective average daily net assets in excess of $25 billion. For the six months ended December 31, 2023, the effective annualized rate was 0.070% of each Fund's average daily net assets, notwithstanding any fee waivers and/or expense reimbursements.
The Administrator waived administration fees as outlined in Note 3.F.
JPMorgan Chase Bank, N.A. ("JPMCB"), a wholly-owned subsidiary of JPMorgan, serves as the Funds' sub-administrator (the “Sub-administrator”). For its services as Sub-administrator, JPMCB receives a portion of the fees payable to the Administrator.
C. Distribution Fees — Pursuant to a Distribution Agreement, JPMorgan Distribution Services, Inc. (“JPMDS”), an indirect, wholly-owned subsidiary of JPMorgan, serves as each Fund's principal underwriter and promotes and arranges for the sale of each Fund's shares.
The Boards have adopted a Distribution Plan (the “Distribution Plan”) for Class A, Class C, Class R2 and Class R3 Shares of the Funds, as applicable, pursuant to Rule 12b-1 under the 1940 Act. Class I, Class L, Class R4, Class R5 and Class R6 Shares of the Funds do not charge a distribution fee. The Distribution Plan provides that each Fund shall pay, with respect to the applicable share classes, distribution fees, including payments to JPMDS, at annual rates of the average daily net assets as shown in the table below:
In addition, JPMDS is entitled to receive the front-end sales charges from purchases of Class A Shares and the CDSC from redemptions of Class C Shares and certain Class A Shares for which front-end sales charges have been waived. For the six months ended December 31, 2023, JPMDS retained the following:
|
| Amount rounds to less than one thousand. |
D. Service Fees — The Trusts, on behalf of the Funds, have entered into a Shareholder Servicing Agreement with JPMDS under which JPMDS provides certain support services to fund shareholders. For performing these services, JPMDS receives a fee with respect to all share classes, except Class R6 Shares which do not charge a service fee, that is accrued daily and paid monthly equal to a percentage of the average daily net assets as shown in the table below:
JPMDS has entered into shareholder services contracts with affiliated and unaffiliated financial intermediaries who provide shareholder services and other related services to their clients or customers who invest in the Funds. Pursuant to such contracts, JPMDS will pay all or a portion of such fees earned to financial intermediaries for performing such services.
JPMDS waived service fees as outlined in Note 3.F.
| J.P. Morgan Mid Cap/Multi-Cap Funds | |
NOTES TO FINANCIAL STATEMENTSAS OF December 31, 2023 (Unaudited) (continued)
(Dollar values in thousands)
E. Custodian and Accounting Fees — JPMCB provides portfolio custody and accounting services to the Funds. For performing these services, the Funds pay JPMCB transaction and asset-based fees that vary according to the number of transactions and positions, plus out-of-pocket expenses. The amounts paid directly to JPMCB by the Funds for custody and accounting services are included in Custodian and accounting fees on the Statements of Operations.
Interest income earned on cash balances at the custodian, if any, is included in Interest income from affiliates on the Statements of Operations.
Interest expense paid to the custodian related to cash overdrafts, if any, is included in Interest expense to affiliates on the Statements of Operations.
F. Waivers and Reimbursements —The Adviser, Administrator and/or JPMDS have contractually agreed to waive fees and/or reimburse the Funds to the extent that total annual operating expenses (excluding acquired fund fees and expenses other than certain money market fund fees as described below, dividend and interest expenses related to short sales, interest, taxes, expenses related to litigation and potential litigation, expenses related to trustee elections and extraordinary expenses) exceed the percentages of the Funds' respective average daily net assets as shown in the table below:
The expense limitation agreements were in effect for the six months ended December 31, 2023 and are in place until at least October 31, 2024.
For the six months ended December 31, 2023, the Funds' service providers waived fees and/or reimbursed expenses for each of the Funds as follows. None of these parties expect the Funds to repay any such waived fees and/or reimbursed expenses in future years.
| | |
| | | | | Contractual
Reimbursements |
| | | | | |
| | | | | |
| | | | | |
| | | | | |
| | | | | |
Additionally, the Funds may invest in one or more money market funds advised by the Adviser (affiliated money market funds). The Adviser, Administrator and/or JPMDS, as shareholder servicing agent, have contractually agreed to waive fees and/or reimburse expenses in an amount sufficient to offset the respective net fees each collects from the affiliated money market fund on the applicable Fund's investment in such affiliated money market fund, except for investments of securities lending cash collateral. None of these parties expect the Funds to repay any such waived fees and/or reimbursed expenses in future years.
The amounts of these waivers resulting from investments in these money market funds for the six months ended December 31, 2023 were as follows:
JPMIM voluntarily agreed to reimburse the Funds for the Trustee Fees paid to one of the interested Trustees. For the six months ended December 31, 2023 the amount of these reimbursements were as follows:
| J.P. Morgan Mid Cap/Multi-Cap Funds | |
G. Other— Certain officers of the Trusts are affiliated with the Adviser, the Administrator and JPMDS. Such officers, with the exception of the Chief Compliance Officer, receive no compensation from the Funds for serving in their respective roles.
The Boards designated and appointed a Chief Compliance Officer to the Funds pursuant to Rule 38a-1 under the 1940 Act. Each Fund, along with affiliated funds, makes reimbursement payments, on a pro-rata basis, to the Administrator for a portion of the fees associated with the office of the Chief Compliance Officer. Such fees are included in Trustees’ and Chief Compliance Officer’s fees on the Statements of Operations.
The Trusts adopted a Trustee Deferred Compensation Plan (the “Plan”) which allows the independent Trustees to defer the receipt of all or a portion of compensation related to performance of their duties as Trustees. The deferred fees are invested in various J.P. Morgan Funds until distribution in accordance with the Plan.
The below Funds used related party broker-dealers during the six months ended December 31, 2023, and incurred brokerage commissions with broker-dealers affiliated with the Adviser as follows:
The Securities and Exchange Commission ("SEC") has granted an exemptive order permitting the Funds to engage in principal transactions with J.P. Morgan Securities LLC, an affiliated broker, involving taxable money market instruments, subject to certain conditions.
4. Investment Transactions
During the six months ended December 31, 2023, purchases and sales of investments (excluding short-term investments) were as follows:
| Purchases
(excluding
U.S. Government) | Sales
(excluding
U.S. Government) |
| | |
| | |
| | |
| | |
| | |
During the six months ended December 31, 2023, there were no purchases or sales of U.S. Government securities.
5. Federal Income Tax Matters
For Federal income tax purposes, the estimated cost and unrealized appreciation (depreciation) in value of investments held at December 31, 2023 were as follows:
| | Gross
Unrealized
Appreciation | Gross
Unrealized
Depreciation | Net Unrealized
Appreciation
(Depreciation) |
| | | | |
| | | | |
| | | | |
| | | | |
| | | | |
| J.P. Morgan Mid Cap/Multi-Cap Funds | |
NOTES TO FINANCIAL STATEMENTSAS OF December 31, 2023 (Unaudited) (continued)
(Dollar values in thousands)
At June 30, 2023, the following Funds had net capital loss carryforwards which are available to offset future realized gains:
| Capital Loss Carryforward Character |
| | |
| | |
| | |
Net capital losses (gains) and specified ordinary losses incurred after October 31 and late year ordinary losses incurred after December 31 and within the taxable year are deemed to arise on the first business day of the Funds' next taxable year. For the year ended June 30, 2023, the following Funds deferred to July 1, 2023 the following net capital losses (gains), specified ordinary losses and late year ordinary losses of:
| Net Capital Losses (Gains) | | Late Year Ordinary Loss Deferral |
| | |
| | | | |
| | | | |
| | | | |
| | | | |
6. Borrowings
The Funds rely upon an exemptive order granted by the SEC (the “Order”) permitting the establishment and operation of an Interfund Lending Facility (the “Facility”). The Facility allows the Funds to directly lend and borrow money to or from any other fund relying upon the Order at rates beneficial to both the borrowing and lending funds. Advances under the Facility are taken primarily for temporary or emergency purposes, including the meeting of redemption requests that otherwise might require the untimely disposition of securities, and are subject to each Fund's borrowing restrictions. The interfund loan rate is determined, as specified in the Order, by averaging the current repurchase agreement rate and the current bank loan rate. The Order was granted to JPM II and may be relied upon by the Funds because the Funds and the series of JPM II are all investment companies in the same “group of investment companies” (as defined in Section 12(d)(1)(G) of the 1940 Act).
The Funds had no borrowings outstanding from another fund, or loans outstanding to another fund, during the six months ended December 31, 2023.
The Trusts and JPMCB have entered into a financing arrangement. Under this arrangement, JPMCB provides an unsecured, uncommitted credit facility in the aggregate amount of $100 million to certain of the J.P. Morgan Funds, including the Funds. Advances under the arrangement are taken primarily for temporary or emergency purposes, including the meeting of redemption requests that otherwise might require the untimely disposition of securities, and are subject to each Fund's borrowing restrictions. Interest on borrowings is payable at a rate determined by JPMCB at the time of borrowing. This agreement has been extended until October 29, 2024.
The Funds had no borrowings outstanding from the unsecured, uncommitted credit facility during the six months ended December 31, 2023.
The Trusts, along with certain other trusts for J.P. Morgan Funds (“Borrowers”), have entered into a joint syndicated senior unsecured revolving credit facility totaling $1.5 billion (“Credit Facility”) with various lenders and The Bank of New York Mellon, as administrative agent for the lenders. This Credit Facility provides a source of funds to the Borrowers for temporary and emergency purposes, including the meeting of redemption requests that otherwise might require the untimely disposition of securities. Under the terms of the Credit Facility, a borrowing fund must have a minimum of $25 million in adjusted net asset value and not exceed certain adjusted net asset coverage ratios prior to and during the time in which any borrowings are outstanding. If a fund does not comply with the aforementioned requirements, the fund must remediate within three business days with respect to the $25 million minimum adjusted net asset value or within one business day with respect to certain asset coverage ratios or the administrative agent at the request of, or with the consent of, the lenders may terminate the Credit Facility and declare any outstanding borrowings to be due and payable immediately.
Interest associated with any borrowing under the Credit Facility is charged to the borrowing fund at a rate of interest equal to 1.00% (the "Applicable Margin"), plus the greater on the day of the borrowing, of the federal funds effective rate, or the Adjusted Secured Overnight Financing Rate ("SOFR"). Effective August 8, 2023, the Credit Facility was amended and restated for a term of 364 days, unless extended.
The Funds did not utilize the Credit Facility during the six months ended December 31, 2023.
7. Risks, Concentrations and Indemnifications
In the normal course of business, the Funds enter into contracts that contain a variety of representations which provide general indemnifications. Each Fund's maximum exposure under these arrangements is unknown. The amount of exposure would depend on future claims that may be brought against each Fund. However, based on experience, the Funds expect the risk of loss to be remote.
| J.P. Morgan Mid Cap/Multi-Cap Funds | |
As of December 31, 2023, the Funds had individual shareholders and/or non-affiliated omnibus accounts each owning more than 10% of the respective Fund's outstanding shares as follows:
| Number of
Individual Shareholder
and/or Affiliated
Omnibus Accounts | | Number of
Individual Shareholder
and/or Non-Affiliated
Omnibus Accounts | |
| | | | |
| | | | |
| | | | |
| | | | |
| | | | |
Significant shareholder transactions by these shareholders may impact the Funds' performance and liquidity.
As of December 31, 2023, the Funds owned in the aggregate, shares representing more than 10% of the net assets of the following Underlying Funds:
| JPMorgan
SmartRetirement
Funds |
| |
| |
Because Mid Cap Equity Fund, Mid Cap Value Fund and Value Advantage Fund invest in Real Estate Investment Trusts (“REITs”), the Funds may be subject to certain risks similar to those associated with direct investments in real estate. REITs may be affected by changes in the value of their underlying properties and by defaults by tenants. REITs depend generally on their ability to generate cash flow to make distributions to shareholders, and certain REITs have self-liquidation provisions by which mortgages held may be paid in full and distributions of capital returns may be made at any time.
London Interbank Offered Rate ("LIBOR") was a leading floating rate benchmark used in loans, notes, derivatives and other instruments or investments. As a result of benchmark reforms, publication of most LIBOR settings has ceased. Some LIBOR settings continue to be published but only on a temporary, synthetic and non-representative basis. Regulated entities have generally ceased entering into new LIBOR contracts in connection with regulatory guidance or prohibitions. Public and private sector actors have worked to establish alternative reference rates to be used in place of LIBOR. There is no assurance that any such alternative reference rate will be similar to or produce the same value or economic equivalence as LIBOR or that it will have the same volume or liquidity as did LIBOR which may affect the value, volatility, liquidity or return on certain of the Funds' loans, notes, derivatives and other instruments or investments comprising some or all of the Funds' investments and result in costs incurred in connection with changing reference rates used for positions, closing out positions and entering into new trades. Certain of the Funds' investments may have transitioned from LIBOR or will transition from LIBOR in the future. The transition from LIBOR to alternative reference rates may result in operational issues for the Funds or their investments. No assurances can be given as to the impact of the LIBOR transition (and the timing of any such impact) on the Funds and their investments.
The Funds are subject to infectious disease epidemics/pandemics risk. For example, the outbreak of COVID-19 negatively affected economies, markets and individual companies throughout the world, including those in which the Funds invest. The effects of any future pandemic or other global event to business and market conditions may have a significant negative impact on the performance of a Fund's investments, increase a Fund's volatility, exacerbate other pre-existing political, social and economic risks to the Funds and negatively impact broad segments of businesses and populations. In addition, governments, their regulatory agencies, or self-regulatory organizations have taken or may take actions in response to a pandemic or other global event that affect the instruments in which the Funds invest, or the issuers of such instruments, in ways that could have a significant negative impact on a Fund’s investment performance. The ultimate impact of any pandemic or other global event and the extent to which the associated conditions and governmental responses impact a Fund will also depend on future developments, which are highly uncertain, difficult to accurately predict and subject to frequent changes.
| J.P. Morgan Mid Cap/Multi-Cap Funds | |
SCHEDULE OF SHAREHOLDER EXPENSES(Unaudited)
Hypothetical $1,000 Investment
As a shareholder of the Funds, you incur two types of costs: (1) transaction costs, including sales charges (loads) on purchase payments and (2) ongoing costs, including investment advisory fees, administration fees, distribution fees and other Fund expenses. The examples below are intended to help you understand your ongoing costs (in dollars) of investing in the Funds (not including expenses of the Underlying Funds) and to compare these ongoing costs with the ongoing costs of investing in other mutual funds. The examples assume that you had a $1,000 investment in each Class at the beginning of the reporting period, July 1, 2023, and continued to hold your shares at the end of the reporting period, December 31, 2023.
Actual Expenses
For each Class of each Fund in the table below, the first line provides information about actual account values and actual expenses. You may use the information in this line, together with the amount you invested, to estimate the expenses that you paid over the period. Simply divide your account value by $1,000 (for example, an $8,600 account value divided by $1,000 = 8.6), then multiply the result by the number in the first line of each Class under the heading titled “Expenses Paid During the Period” to estimate the expenses you paid on your account during this period.
Hypothetical Example for Comparison Purposes
The second line of each Class in the table below provides information about hypothetical account values and hypothetical expenses based on the Class’ actual expense ratio and an assumed rate of return of 5% per year before expenses, which is not the Class’ actual return. The hypothetical account values and expenses may not be used to estimate the actual ending account balance or expenses you paid for the period. You may use this information to compare the ongoing costs of investing in the Class of the Funds and other funds. To do so, compare this 5% hypothetical example with the 5% hypothetical examples that appear in the shareholder reports of the other funds. Please note that the expenses shown in the table are meant to highlight your ongoing costs only and do not reflect any transaction costs, such as sales charges (loads) or redemption fees, and expenses of the Underlying Funds. Therefore, the second line for each Class in the table is useful in comparing ongoing costs only, and will not help you determine the relative total costs of owning different funds. In addition, if these transaction costs were included, your costs would have been higher. The examples also assume all dividends and distributions have been reinvested.
| Beginning
Account Value
July 1, 2023 | Ending
Account Value
December 31, 2023 | Expenses
Paid During
the Period* | |
JPMorgan Growth Advantage Fund | | | | |
| | | | |
| | | | |
| | | | |
| | | | |
| | | | |
| | | | |
| | | | |
| | | | |
| | | | |
| | | | |
| | | | |
| | | | |
| | | | |
| | | | |
| | | | |
| | | | |
| | | | |
| | | | |
| | | | |
| | | | |
| | | | |
| | | | |
| | | | |
| | | | |
| J.P. Morgan Mid Cap/Multi-Cap Funds | |
| Beginning Account Value July 1, 2023 | Ending Account Value December 31, 2023 | Expenses Paid During the Period* | |
JPMorgan Mid Cap Equity Fund | | | | |
| | | | |
| | | | |
| | | | |
| | | | |
| | | | |
| | | | |
| | | | |
| | | | |
| | | | |
| | | | |
| | | | |
| | | | |
| | | | |
| | | | |
| | | | |
| | | | |
| | | | |
| | | | |
JPMorgan Mid Cap Growth Fund | | | | |
| | | | |
| | | | |
| | | | |
| | | | |
| | | | |
| | | | |
| | | | |
| | | | |
| | | | |
| | | | |
| | | | |
| | | | |
| | | | |
| | | | |
| | | | |
| | | | |
| | | | |
| | | | |
| | | | |
| | | | |
| | | | |
| | | | |
| | | | |
| | | | |
JPMorgan Mid Cap Value Fund | | | | |
| | | | |
| | | | |
| | | | |
| | | | |
| | | | |
| | | | |
| J.P. Morgan Mid Cap/Multi-Cap Funds | |
SCHEDULE OF SHAREHOLDER EXPENSES(Unaudited) (continued)
Hypothetical $1,000 Investment
| Beginning Account Value July 1, 2023 | Ending Account Value December 31, 2023 | Expenses Paid During the Period* | |
JPMorgan Mid Cap Value Fund (continued) | | | | |
| | | | |
| | | | |
| | | | |
| | | | |
| | | | |
| | | | |
| | | | |
| | | | |
| | | | |
| | | | |
| | | | |
| | | | |
| | | | |
| | | | |
| | | | |
| | | | |
| | | | |
| | | | |
| | | | |
| | | | |
| | | | |
JPMorgan Value Advantage Fund | | | | |
| | | | |
| | | | |
| | | | |
| | | | |
| | | | |
| | | | |
| | | | |
| | | | |
| | | | |
| | | | |
| | | | |
| | | | |
| | | | |
| | | | |
| | | | |
| | | | |
| | | | |
| | | | |
| | | | |
| | | | |
| | | | |
| | | | |
| | | | |
| | | | |
| | | | |
| | | | |
| | | | |
|
| Expenses are equal to each Class’ respective annualized net expense ratio, multiplied by the average account value over the period, multiplied by 184/366 (to reflect the one-half year period). |
| J.P. Morgan Mid Cap/Multi-Cap Funds | |
BOARD APPROVAL OF INVESTMENT ADVISORY AGREEMENTS(Unaudited)
The Board of Trustees (the “Board” or the “Trustees”) has established various standing committees composed of Trustees with diverse backgrounds, to which the Board has assigned specific subject matter responsibilities to further enhance the effectiveness of the Board’s oversight and decision making. The Board and its investment committees (Money Market and Alternative Products Committee, Equity Committee, and Fixed Income Committee) met regularly throughout the year and, at each meeting, considered factors that are relevant to their annual consideration of the continuation of the investment advisory agreements. The Board also met for the specific purpose of considering investment advisory agreement annual renewals. The Board held meetings June 20-21, 2023 and August 8-10, 2023, at which the Trustees considered the continuation of the investment advisory agreements for each Fund whose semi-annual report is contained herein (each an “Advisory Agreement” and collectively, the “Advisory Agreements”). At the June meeting, the Board’s investment committees met to review and consider performance, expense and related information for the J.P. Morgan Funds. Each investment committee reported to the full Board, which then considered each investment committee’s preliminary findings. At the August meeting, the Trustees continued their review and consideration. The Trustees, including a majority of the Trustees who are not parties to an Advisory Agreement or “interested persons” (as defined in the Investment Company Act of 1940) of any party to an Advisory Agreement or any of their affiliates, approved the continuation of each Advisory Agreement on August 10, 2023.
As part of their review of the Advisory Agreements, the Trustees considered and reviewed performance and other information about the Funds received from J.P. Morgan Investment Management Inc. (the “Adviser”). This information included the Funds’ performance as compared to the performance of their peers and benchmarks, and analyses by the Adviser of the Funds’ performance. In addition, at each of their regular meetings throughout the year, the Trustees considered reports on the performance of certain J.P. Morgan Funds provided by an independent investment consulting firm (the “independent consultant”). In addition, in preparation for the June and August meetings, the Trustees requested, received and evaluated extensive materials from the Adviser, including performance and expense information compiled by Broadridge, using data from Lipper Inc. and/or Morningstar Inc., independent providers of investment company data (together, “Broadridge”). The Trustees’ independent consultant also provided additional quantitative and statistical analyses of the Funds, including risk and performance return assessments as compared to the Funds’ objectives, benchmarks, and peers. Before voting on the Advisory Agreements, the Trustees reviewed the Advisory Agreements with representatives of the Adviser, counsel to the Funds, and independent legal counsel to the Trustees, and received a memorandum from independent
legal counsel to the Trustees discussing the legal standards for their consideration of the Advisory Agreements. The Trustees also discussed the Advisory Agreements with independent legal counsel in executive sessions at which no representatives of the Adviser were present.
A summary of the material factors evaluated by the Trustees in determining whether to approve each Advisory Agreement is provided below. Each Trustee attributed different weights to the various factors, and no factor alone was considered determinative. The Trustees considered information provided with respect to the Funds throughout the year, as well as materials furnished specifically in connection with the annual review process. From year to year, the Trustees consider and place emphasis on relevant information in light of changing circumstances in market and economic conditions.
After considering and weighing the factors and information they had received, the Trustees found that the compensation to be received by the Adviser from each Fund under the applicable Advisory Agreement was fair and reasonable under the circumstances, and determined that the continuance of each Advisory Agreement was in the best interests of each Fund and its shareholders.
Nature, Extent and Quality of Services Provided by the Adviser
The Trustees received and considered information regarding the nature, extent and quality of services provided to each Fund under the applicable Advisory Agreement. The Trustees took into account information furnished throughout the year at Trustee meetings, as well as the materials furnished specifically in connection with this annual review process. Among other things, the Trustees considered:
• The background and experience of the Adviser’s senior management and investment personnel, including personnel changes, if any;
• The qualifications, backgrounds and responsibilities of the portfolio management team primarily responsible for the day-to-day management of each Fund, including personnel changes, if any;
• The investment strategy for each Fund, and the infrastructure supporting the portfolio management teams;
• Information about the structure and distribution strategy for each Fund and how it fits within the Adviser’s other fund offerings within the J.P. Morgan Funds complex;
• The administration services provided by the Adviser in its role as Administrator;
| J.P. Morgan Mid Cap/Multi-Cap Funds | |
BOARD APPROVAL OF INVESTMENT ADVISORY AGREEMENTS(Unaudited) (continued)
• Their knowledge of the nature and quality of the services provided by the Adviser and its affiliates gained from their experience as Trustees of the Funds and in the financial industry generally;
• The overall reputation and capabilities of the Adviser and its affiliates;
• The commitment of the Adviser to provide high quality service to the Funds;
• Their overall confidence in the Adviser’s integrity; and
• The Adviser’s responsiveness to requests for additional information, questions or concerns raised by them, including the Adviser’s willingness to consider and implement organizational and operational changes designed to improve investment results and the services provided to each Fund.
Based upon these considerations and other factors, the Trustees concluded that they were satisfied with the nature, extent and quality of the services provided to the Funds by the Adviser.
Costs of Services Provided and Profitability to the Adviser and its Affiliates
The Trustees received and considered information regarding the profitability to the Adviser and its affiliates from providing services to each Fund. The Trustees reviewed and discussed this information. The Trustees recognized that this information is not audited and represents the Adviser’s determination of its and its affiliates’ revenues from the contractual services provided to the Funds, less expenses of providing such services. Expenses include direct and indirect costs and are calculated using an allocation methodology developed by the Adviser and reviewed with the Board. The Trustees also recognized that it is difficult to make comparisons of profitability from fund investment advisory contracts because comparative information is not generally publicly available and is affected by numerous factors, including the structure of the particular adviser, the types of funds it manages, its business mix, numerous assumptions regarding allocations and the fact that publicly-traded fund managers’ operating profits and net income are net of distribution and marketing expenses. Based upon their review, and taking into consideration the factors noted above, the Trustees concluded that the profitability to the Adviser under each Advisory Agreement was not unreasonable in light of the services and benefits provided to each Fund.
The Trustees also considered that JPMorgan Distribution Services, Inc. (“JPMDS”), an affiliate of the Adviser, and the Adviser earn fees from the Funds for providing shareholder and administration services, respectively. These fees were shown separately in the profitability analysis presented to the Trustees. The Trustees also considered the payments of Rule 12b-1 fees to JPMDS, which also acts as the Funds’
distributor, and that these fees are in turn generally paid to financial intermediaries that sell the Funds, including financial intermediaries that are affiliates of the Adviser (although they are retained by JPMDS in certain instances). The Trustees also considered the fees earned by JPMorgan Chase Bank, N.A. (“JPMCB”), an affiliate of the Adviser, for custody, fund accounting and other related services for each Fund, and the profitability of the arrangements to JPMCB.
Fall-Out Benefits
The Trustees reviewed information regarding potential “fall-out” or ancillary benefits received by the Adviser and its affiliates as a result of their relationship with the Funds. The Trustees considered that the J.P. Morgan Funds’ operating accounts are held at JPMCB, which, as a result, will receive float benefits for certain J.P. Morgan Funds, as applicable. The Trustees also noted that the Adviser supports a diverse set of products and services, which benefits the Adviser by allowing it to leverage its infrastructure to serve additional clients, including benefits that may be received by the Adviser and its affiliates in connection with the Funds’ potential investments in other funds advised by the Adviser. The Trustees also reviewed the Adviser’s allocation of fund brokerage for the J.P. Morgan Funds complex, including allocations to brokers who provide research to the Adviser, as well as the Adviser’s use of affiliates to provide other services and the benefits to such affiliates of doing so. The Trustees also considered the benefit to the Adviser and its affiliates from allocating client assets to the Funds.
Economies of Scale
The Trustees considered the extent to which the Funds may benefit from potential economies of scale. The Trustees considered that there may not be a direct relationship between economies of scale realized by the Funds and those realized by the Adviser as assets increase. The Trustees considered the extent to which the Funds were priced to scale and whether it would be appropriate to add advisory fee breakpoints. The Trustees noted certain Funds with contractual expense limitations and fee waivers (“Fee Caps”), which allow a Fund’s shareholders to share potential economies of scale from a Fund’s inception, prior to reaching scale. The Trustees also noted that certain other Funds that had achieved scale as asset levels had increased, no longer had Fee Caps in place for some or all of their share classes, but shared economies of scale through lower average expenses. The Trustees noted that the fees remain fair and reasonable relative to peer funds. The Trustees considered the benefits to the Funds of the use of an affiliated distributor and custodian, including the ability to rely on existing infrastructure supporting distribution, custodial and transfer agent services and the ability to negotiate competitive fees for the Funds. The Trustees further considered the Adviser's and JPMDS's ongoing investments in their business in support of the Funds, including the Adviser's and/or JPMDS's
| J.P. Morgan Mid Cap/Multi-Cap Funds | |
investments in trading systems, technology (including improvements to the J.P. Morgan Funds’ website, and cybersecurity improvements), retention of key talent, and regulatory support enhancements. The Trustees concluded that the current fee structure for each Fund, including any Fee Caps the Adviser has in place that serve to limit the overall net expense ratios of each Fund at competitive levels, was reasonable. The Trustees concluded that, for Funds with Fee Caps in place for some or all of their share classes, the relevant Fund’s shareholders received the benefits of potential economies of scale through the Fee Caps and, for Funds that achieved scale and no longer had Fee Caps in place for some or all of their share classes, the relevant Fund’s shareholders benefited from lower average expenses resulting from increased assets. The Trustees also concluded that all Funds benefited from the Adviser’s reinvestment in its operations to serve the Funds and their shareholders. The Trustees noted that the Adviser’s reinvestment ensures sufficient resources in terms of personnel and infrastructure to support the Funds.
Independent Written Evaluation of the Funds’ Senior Officer
The Trustees noted that, upon their direction, the Senior Officer for the Mid Cap Growth Fund and Mid Cap Value Fund had prepared an independent written evaluation in order to assist the Trustees in determining the reasonableness of the proposed management fees. In determining whether to continue the Advisory Agreements, the Trustees considered the Senior Officer’s report.
Fees Relative to Adviser’s Other Clients
The Trustees received and considered information about the nature and extent of investment advisory services and fee rates offered to other clients of the Adviser, including, to the extent applicable, institutional separate accounts, collective investment trusts, other registered investment companies and/or private funds sub-advised by the Adviser, for investment management styles substantially similar to that of each Fund. The Trustees considered the complexity of investment management for registered investment companies relative to the Adviser’s other clients and noted differences, as applicable, in the fee structure and the regulatory, legal and other risks and responsibilities of providing services to the different clients. The Trustees considered that serving as an adviser to a registered investment company involves greater responsibilities and risks than acting as a sub-adviser and observed that sub-advisory fees may be lower than those charged by the Adviser to each Fund. The Trustees also noted that the adviser, not the applicable registered investment company, typically bears the sub-advisory fee and that many responsibilities related to the advisory function are typically retained by the primary adviser. The Trustees concluded that the fee rates charged to each Fund in comparison to those charged to the Adviser’s other clients were reasonable.
Investment Performance
The Trustees receive and consider information about each Fund’s performance throughout the year. In addition, the Trustees received and considered absolute and/or relative performance information for the Funds in a report prepared by Broadridge. The Trustees considered the total return performance information, which included the ranking of the Funds within a performance universe comprised of funds’ selected share classes with the same Broadridge investment classification and objective (the “Universe”), by total return for the applicable one-, three- and five-year periods. The Trustees reviewed a description of Broadridge’s methodology for selecting mutual funds in each Fund’s Universe, and noted that Universe quintile rankings were not calculated if the number of funds in the Universe did not meet a predetermined minimum. The Broadridge materials provided to the Trustees highlighted information with respect to certain representative classes to assist the Trustees in their review. As part of this review, the Trustees also reviewed each Fund’s performance against its benchmark and considered the performance information provided for the Funds at regular Board meetings by the Adviser and the Trustees’ independent consultant and also considered the special analysis prepared for the Funds by the Trustees’ independent consultant. The Trustees also engaged with the Adviser to consider what steps might be taken to improve performance, as applicable. The Broadridge performance data noted by the Trustees as part of their review and the determinations made by the Trustees with respect to each Fund’s performance for certain representative classes are summarized below:
The Trustees noted that the Growth Advantage Fund’s performance for Class A, Class I and Class R6 shares was in the third, first and first quintiles of the Universe, for the one-, three- and five-year periods ended December 31, 2022, respectively. The Trustees discussed the performance and investment strategy of the Fund with the Adviser and reviewed the performance analysis and evaluation prepared by the independent consultant. Based upon these discussions and various other factors, the Trustees concluded that the Fund’s performance was satisfactory.
The Trustees noted that the Mid Cap Equity Fund’s performance for Class A and Class R6 shares was in the third, first and first quintiles of the Universe for the one-, three- and five-year periods ended December 31, 2022, respectively. The Trustees noted that the performance for Class I shares was in the fourth, second and first quintiles of the Universe for the one-, three- and five-year periods ended December 31, 2022, respectively. The Trustees discussed the performance and investment strategy of the Fund with the Adviser and reviewed the
| J.P. Morgan Mid Cap/Multi-Cap Funds | |
BOARD APPROVAL OF INVESTMENT ADVISORY AGREEMENTS(Unaudited) (continued)
performance analysis and evaluation prepared by the independent consultant. Based upon these discussions and various other factors, the Trustees concluded that the Fund’s performance was satisfactory under the circumstances.
The Trustees noted that the Mid Cap Growth Fund’s performance for Class A and Class I shares was in the second, second and first quintiles of the Universe for the one-, three- and five-year periods ended December 31, 2022, respectively. The Trustees noted that the performance for Class R6 shares was in the second, first and first quintiles of the Universe for the one-, three- and five-year periods ended December 31, 2022, respectively. The Trustees discussed the performance and investment strategy of the Fund with the Adviser and reviewed the performance analysis and evaluation prepared by the independent consultant. Based upon these discussions and various other factors, the Trustees concluded that the Fund’s performance was satisfactory.
The Trustees noted that the Mid Cap Value Fund’s performance for Class A, Class I and Class R6 shares was in the third quintiles of the Universe for each of the one-, three- and five-year periods ended December 31, 2022. The Trustees discussed the performance and investment strategy of the Fund with the Adviser and reviewed the performance analysis and evaluation prepared by the independent consultant. Based upon these discussions and various other factors, the Trustees concluded that the Fund’s performance was satisfactory.
The Trustees noted that the Value Advantage Fund’s performance for Class A, Class I and Class R6 shares was in the second, third and third quintiles of the Universe for the one-, three- and five-year periods ended December 31, 2022, respectively. The Trustees discussed the performance and investment strategy of the Fund with the Adviser and reviewed the performance analysis and evaluation prepared by the independent consultant. Based upon these discussions and various other factors, the Trustees concluded that the Fund’s performance was satisfactory.
Advisory Fees and Expense Ratios
The Trustees considered the contractual advisory fee rate and administration fee rate paid by each Fund to the Adviser and compared the combined rate to the information prepared by Broadridge concerning management fee rates paid by other funds’ selected share classes in the Universe, as well as a subset of funds within the Universe (the “Peer Group”). The Trustees recognized that Broadridge reported each Fund’s management fee rate as the combined contractual advisory fee and administration fee rates. The Trustees also reviewed information about other expenses and the expense ratios for each Fund and noted that Universe and Peer Group quintile rankings were not calculated if the number of funds in the Universe and/or Peer Groups did not meet a predetermined minimum. For each Fund that had a Fee Cap in place, the
Trustees considered the net advisory fee rate and net expense ratio for each share class, as applicable, taking into account any waivers and/or reimbursements. The Trustees also considered any proposed changes to a Fee Cap, and, where deemed appropriate by the Trustees, additional waivers and/or reimbursements. The Trustees recognized that it can be difficult to make comparisons of advisory fees because there are variations in the services that are included in the fees paid by other funds. The Trustees’ determinations as a result of the review of each Fund’s advisory fees and expense ratios for certain representative classes are summarized below:
The Trustees noted that the Growth Advantage Fund’s net advisory fee for Class A shares was in the third and second quintile of the Peer Group and Universe, respectively, and that the actual total expenses for Class A shares were in the fifth and third quintiles of the Peer Group and Universe, respectively. The Trustees noted that the net advisory fee for Class I shares was in the third and second quintile of the Peer Group and Universe, respectively, and that the actual total expenses for Class I shares were in the first and third quintiles of the Peer Group and Universe, respectively. The Trustees noted that the net advisory fee for Class R6 shares was in the second quintile of both the Peer Group and Universe, and that the actual total expenses for Class R6 shares were in the second and first quintiles of the Peer Group and Universe, respectively. After considering the factors identified above, in light of this information, the Trustees concluded that the advisory fee was fair and reasonable in light of the services provided to the Fund.
The Trustees noted that the Mid Cap Equity Fund’s net advisory fee for Class A shares was in the first and second quintiles of the Peer Group and Universe, respectively, and that the actual total expenses for Class A shares were in the second quintiles of both the Peer Group and Universe. The Trustees noted that the net advisory fee for Class I shares was in the first and second quintiles of the Peer Group and Universe, respectively, and that the actual total expenses for Class I shares were in the first and third quintiles of the Peer Group and Universe, respectively. The Trustees noted that the net advisory fee for Class R6 shares was in the first and second quintiles of the Peer Group and Universe, respectively, and that the actual total expenses for Class R6 shares were in the first quintile of both the Peer Group and Universe. After considering the factors identified above, in light of this information, the Trustees concluded that the advisory fee was fair and reasonable in light of the services provided to the Fund.
The Trustees noted that the Mid Cap Growth Fund’s net advisory fee for Class A shares was in the third and second quintiles of the Peer Group and Universe, respectively, and that the actual total expenses for Class A shares were in the fourth and third quintiles of the Peer Group and Universe, respectively. The Trustees noted that the net advisory fee for Class I shares was
| J.P. Morgan Mid Cap/Multi-Cap Funds | |
in the third quintile of both the Peer Group and Universe, and that the actual total expenses for Class I shares were in the first and third quintiles of the Peer Group and Universe, respectively. The Trustees noted that the net advisory fee for Class R6 shares was in the third quintile of both the Peer Group and Universe, and that the actual total expenses for Class R6 shares were in the third and first quintiles of the Peer Group and Universe, respectively. After considering the factors identified above, in light of this information, the Trustees concluded that the advisory fee was fair and reasonable in light of the services provided to the Fund.
The Trustees noted that the Mid Cap Value Fund’s net advisory fee for Class A shares was in the third and second quintiles of the Peer Group and Universe, respectively, and that the actual total expenses for Class A shares were in the fourth and third quintile of the Peer Group and Universe, respectively. The Trustees noted that the net advisory fee for Class I shares was in the third quintile of both the Peer Group and Universe, and that the actual total expenses for Class I shares were in the second and fourth quintiles of the Peer Group and Universe, respectively. The Trustees noted that the net advisory fee for Class R6 shares was in the third quintile of both the Peer Group and Universe, and that the actual total expenses for Class R6
shares were in the third and first quintiles of the Peer Group and Universe, respectively. After considering the factors identified above, in light of this information, the Trustees concluded that the advisory fee was fair and reasonable in light of the services provided to the Fund.
The Trustees noted that the Value Advantage Fund’s net advisory fee Class A shares was in the third and second quintiles of the Peer Group and Universe, respectively, and that the actual total expenses for Class A shares were in the fourth and third quintiles of the Peer Group and Universe, respectively. The Trustees noted that the net advisory fee for Class I shares was in the third quintile of both the Peer Group and Universe, and that the actual total expenses for Class I shares were in the second and fourth quintiles of the Peer Group and Universe, respectively. The Trustees noted that the net advisory fee for Class R6 shares was in the second and third quintiles of the Peer Group and Universe, respectively, and that the actual total expenses for Class R6 shares were in the second and first quintiles of the Peer Group and Universe, respectively. After considering the factors identified above, in light of this information, the Trustees concluded that the advisory fee was fair and reasonable in light of the services provided to the Fund.
| J.P. Morgan Mid Cap/Multi-Cap Funds | |
THIS PAGE IS INTENTIONALLY LEFT BLANK
J.P. Morgan Funds are distributed by JPMorgan Distribution Services, Inc., which is an affiliate of JPMorgan Chase & Co. Affiliates of JPMorgan Chase & Co. receive fees for providing various services to the Funds.
Contact JPMorgan Distribution Services, Inc. at 1-800-480-4111 for a fund prospectus. You can also visit us at www.jpmorganfunds.com. Investors should carefully consider the investment objectives and risk as well as charges and expenses of the mutual fund before investing. The prospectus contains this and other information about the mutual fund. Read the prospectus carefully before investing.
Investors may obtain information about the Securities Investor Protection Corporation (SIPC), including the SIPC brochure, by visiting www.sipc.org or by calling SIPC at 202-371-8300.
Each Fund files a complete schedule of its fund holdings for the first and third quarters of its fiscal year with the SEC as an exhibit to its report on Form N-PORT. The Funds' Form N-PORT reports are available on the SEC’s website at http://www.sec.gov. Each Fund's quarterly holdings can be found by visiting the J.P. Morgan Funds’ website at www.jpmorganfunds.com.
Effective January 24, 2023, the SEC adopted rule and form amendments that will result in changes to the design and delivery of shareholder reports of mutual funds and ETFs, requiring them to transmit concise and visually engaging streamlined annual and semi-annual reports to shareholders that highlight key information. Other information, including financial statements, will no longer appear in a streamlined shareholder report but must be available online, delivered free of charge upon request, and filed on a semi-annual basis on Form N-CSR. The rule and form amendments have a compliance date of July 24, 2024.
A description of each Fund's policies and procedures with respect to the disclosure of each Fund's holdings is available in the prospectuses and Statement of Additional Information.
A copy of proxy policies and procedures is available without charge upon request by calling 1-800-480-4111 and on the Funds' website at www.jpmorganfunds.com. A description of such policies and procedures is on the SEC’s website at www.sec.gov. The Trustees have delegated the authority to vote proxies for securities owned by the Funds to the Adviser. A copy of the Funds' voting record for the most recent 12-month period ended June 30 is available on the SEC’s website at www.sec.gov or at the Funds' website at www.jpmorganfunds.com no later than August 31 of each year. The Funds' proxy voting record will include, among other things, a brief description of the matter voted on for each fund security, and will state how each vote was cast, for example, for or against the proposal.
J.P. Morgan Asset Management is the brand name for the asset management business of JPMorgan Chase & Co. and its affiliates worldwide.
© JPMorgan Chase & Co., 2023. All rights reserved. December 2023.
SAN-MC-1223
Semi-Annual Report
J.P. Morgan Large Cap Funds
December 31, 2023 (Unaudited)
JPMorgan Equity Income Fund |
JPMorgan Equity Index Fund |
JPMorgan Equity Premium Income Fund |
JPMorgan Hedged Equity Fund |
JPMorgan Hedged Equity 2 Fund |
JPMorgan Hedged Equity 3 Fund |
JPMorgan Large Cap Growth Fund |
JPMorgan Large Cap Value Fund |
JPMorgan U.S. Applied Data Science Value Fund |
JPMorgan U.S. Equity Fund |
JPMorgan U.S. GARP Equity Fund |
JPMorgan U.S. Large Cap Core Plus Fund |
JPMorgan U.S. Research Enhanced Equity Fund |
JPMorgan U.S. Sustainable Leaders Fund |
|
CONTENTS
Investments in a Fund are not deposits or obligations of, or guaranteed or endorsed by, any bank and are not insured or guaranteed by the FDIC, the Federal Reserve Board or any other government agency. You could lose money if you sell when a Fund’s share price is lower than when you invested.
Past performance is no guarantee of future performance. The general market views expressed in this report are opinions based on market and other conditions through the end of the reporting period and are subject to change without notice. These views are not intended to predict the future performance of a Fund or the securities markets.
Prospective investors should refer to the Funds’ prospectuses for a discussion of the Funds’ investment objectives, strategies and risks. Call J.P. Morgan Funds Service Center at 1-800-480-4111 for a prospectus containing more complete information about a Fund, including management fees and other expenses. Please read it carefully before investing.
Letter to ShareholdersFebruary 7, 2024 (Unaudited)
Dear Shareholder,
U.S. equity markets surged through the end of 2023 and into early 2024 as the risk of economic recession receded and the prospect of lower interest rates drove investor optimism. Globally, financial markets largely generated positive returns, despite heightened geopolitical tensions and signs of economic weakness across Europe and China.
|
“Investors appear to have begun 2024 with a positive outlook, with the U.S. economy and its financial markets leading global growth.” — Brian S. Shlissel
|
Inflation pressures eased sufficiently during the second half of 2023 to allow the U.S. Federal Reserve (the “Fed”) to hold the benchmark discount interest rate at 5.25% at its June 2023 meeting, ending a string of 10 consecutive interest rate increases. The Fed raised rates once more in July 2023, then held the benchmark rate at 5.50% for the remainder of the 2023.
In the face of elevated interest rates, the U.S. economy proved surprisingly resilient and largely led developed markets in growth through the end of 2023. Gross domestic product outpaced economists’ consensus expectations with a 4.9% jump in the third quarter and estimated growth of 3.3% in the fourth quarter. Though the U.S. economy continued to expand, inflation data indicated that the Fed’s efforts to cool the domestic economy appeared to be effective.
Certain other measures of the U.S. economy showed little sign of weakness. Consumer spending remained elevated in the second half of 2023 and rose month-to-month to reach approximately $709.9 billion in retail sales in December 2023. The unemployment rate settled at 3.7% in the final two months of 2023 as approximately 333,000 jobs were added in December alone. Further, an estimated 353,000 jobs were added in January 2024, approximately double the increase anticipated by certain economists.
Both equity and bond markets in the U.S. performed well, buoyed by the overall strength shown by the U.S. economy and the apparent turn in Fed policy. Stronger-than-expected consumer spending and corporate earnings, as well as investor expectations for artificial-intelligence-driven productivity gains bolstered demand for equities in recent months. Certain leading U.S. equity indexes returned more than 9% in November and in excess of 5% in December 2023. In January 2024, the S&P 500 Index reached six new closing highs and surpassed 4,800 points for the first time. However, equity market gains were not broadly spread: The largest 10 stocks in the S&P 500 Index comprised approximately 90% of the index’s price gains for all of 2023.
While U.S. financial markets largely appeared to withstand increased geopolitical tensions in 2023, the potential for the conflicts in Ukraine and Israel to expand in intensity and geography may threaten global economic growth and increase market volatility. Additionally, the Fed may be forced to change policy should the strength of U.S. economy recede or the downward trend in inflation were to reverse.
Investors appear to have begun 2024 with a positive outlook, with the U.S. economy and its financial markets leading global growth. While risks to the growth outlook remain, we believe investors who hold a well-diversified portfolio over the long term should be positioned to benefit from positive economic trends.
Our suite of investment solutions seeks to provide investors with the ability to build durable portfolios that meet their financial goals, regardless of macroeconomic and geopolitical uncertainties.
Sincerely,
Brian S. Shlissel
President, J.P. Morgan Funds
J.P. Morgan Asset Management
1-800-480-4111 or www.jpmorganfunds.com for more information
| J.P. Morgan Large Cap Funds | |
MARKET OVERVIEWSIX MONTHS ENDED December 31, 2023 (Unaudited)
U.S. equity markets largely rallied in the final two months of 2023, rebounding from three months of declines to generate positive returns for the six month period. Investor demand for large cap stocks in the technology and communications sectors was a leading driver of equity market returns. Bond markets generally provided positive returns but underperformed equity markets.
After raising its policy benchmark interest rates by 0.25% in July 2023, the U.S. Federal Reserve (the “Fed”) declined to raise rates further at its next three meetings for the year. More importantly for investors, the central bank stated in December 2023 that it could begin to lower interest rates in the first half of 2024, if inflationary pressures continued to recede.
While the U.S. economic growth showed signs of slowing in mid-2023, third-quarter gross domestic product exceeded economists’ consensus expectations with a 4.9% increase. Growth was largely driven by resilient consumer spending and inventory building by businesses. The unemployment rate in the U.S. remained historically low at 3.8% for most of the six-month period before settling at 3.7% in December 2023. The data and the outlook for interest rates fed investor expectations that the U.S. could avoid an economic recession in 2024.
U.S. equities generally outperformed both international developed markets and emerging markets equities for the period. Overall, gains in U.S. markets were led by large capitalization stocks in the technology and communications sectors, particularly the so-called Magnificent Seven: Apple Inc., Amazon.com Inc., Alphabet Inc., Meta Platforms Inc., Microsoft Corp., Nvidia Corp. and Tesla Inc. At the end of 2023, the 10 largest companies in the S&P 500 Index accounted for 31.2% of the index’s total market capitalization. Notably, only within small cap stocks did value outperform growth for the period.
Investor expectations that the Fed and private sector banks could begin to lower their interest rates sparked a broad rally in U.S. fixed income markets in the final two months of 2023. Overall, lower quality bonds, high yield bonds (also known a junk bonds) and emerging markets debt outperformed U.S. Treasury bonds and higher quality U.S. corporate debt.
| J.P. Morgan Large Cap Funds | |
JPMorgan Equity Income Fund
FUND COMMENTARYSIX MONTHS ENDED December 31, 2023 (Unaudited)
| |
| |
| |
Net Assets as of 12/31/2023 (In Thousands) | |
INVESTMENT OBJECTIVE**
The JPMorgan Equity Income Fund (the “Fund”) seeks capital appreciation and current income.
WHAT WERE THE MAIN DRIVERS OF THE FUND’S PERFORMANCE?
The Fund’s Class I Shares underperformed the Russell 1000 Value Index (the “Benchmark”) for the six months ended December 31, 2023.
The Fund’s security selection in the industrials and materials sectors was a leading detractor from performance relative to the Benchmark, while the Fund’s security selection in the financials and health care sectors was a leading contributor to relative performance.
Leading individual detractors from relative performance included the Fund’s overweight positions in Bristol-Myers Squibb Co. and RTX Corp., and its underweight position in Intel Corp. Shares of Bristol-Myers Squibb, a developer and manufacturer of pharmaceuticals, fell after the company reported a decline in sales for the third quarter of 2023, amid increased competition from generic versions of the company’s leading anti-cancer drug. Shares of RTX, an aerospace and defense manufacturer formerly known as Raytheon Technologies, fell after the company said the recall of Pratt & Whitney jet engines would hurt earnings. Shares of Intel, a semiconductor manufacturer not held in the Fund, rose amid broad demand for artificial intelligence technologies and after the company obtained a $3.2 billion grant from Israel to build a factory there.
Leading individual contributors to relative performance included the Fund’s overweight positions in U.S. Bancorp and PNC Financial Services Group Inc., and its out-of-Benchmark position in AbbVie Inc. Shares of U.S. Bancorp and PNC Financial Services Group, both diversified regional banks, rose amid investor expectations that regional banks would benefit from lower interest rates in 2024. Shares of AbbVie, a developer and manufacturer of pharmaceuticals, rose amid investor expectations the company would benefit from mergers and acquisitions activity across the broader pharmaceuticals sector.
HOW WAS THE FUND POSITIONED?
The Fund’s portfolio managers’ focus remained on stock selection, as they believed that quality companies trading at attractive valuations had the greatest potential to outperform in the long term. As the Fund aimed to purchase stocks with above average dividend yields, the research process seeks to identify companies with predictable and durable business models deemed capable of generating sustainable free cash
flow.
TOP TEN HOLDINGS OF THE
PORTFOLIO AS OF December 31, 2023 | PERCENT OF
TOTAL
INVESTMENTS |
| | |
| | |
| | |
| | |
| Air Products and Chemicals, Inc. | |
| | |
| | |
| | |
| | |
| | |
PORTFOLIO COMPOSITION BY SECTOR
AS OF December 31, 2023 | PERCENT OF
TOTAL
INVESTMENTS |
| |
| |
| |
| |
| |
| |
| |
| |
| |
| |
| |
| |
*
The return shown is based on net asset values calculated for shareholder transactions and may differ from the return shown in
| J.P. Morgan Large Cap Funds | |
JPMorgan Equity Income Fund
FUND COMMENTARYSIX MONTHS ENDED December 31, 2023 (Unaudited) (continued)
the financial highlights, which reflects adjustments made to the net asset values in accordance with accounting principles generally accepted in the United States of America.
**
The adviser seeks to achieve the Fund’s objective. There can be no guarantee it will be achieved.
| J.P. Morgan Large Cap Funds | |
AVERAGE ANNUAL TOTAL RETURNS AS OF December 31, 2023
|
| |
| Sales Charge for Class A Shares is 5.25%. |
| Assumes a 1% CDSC (contingent deferred sales charge) for the 6 month and one year periods and 0% CDSC thereafter. |
TEN YEAR FUND PERFORMANCE (12/31/13 TO 12/31/23)
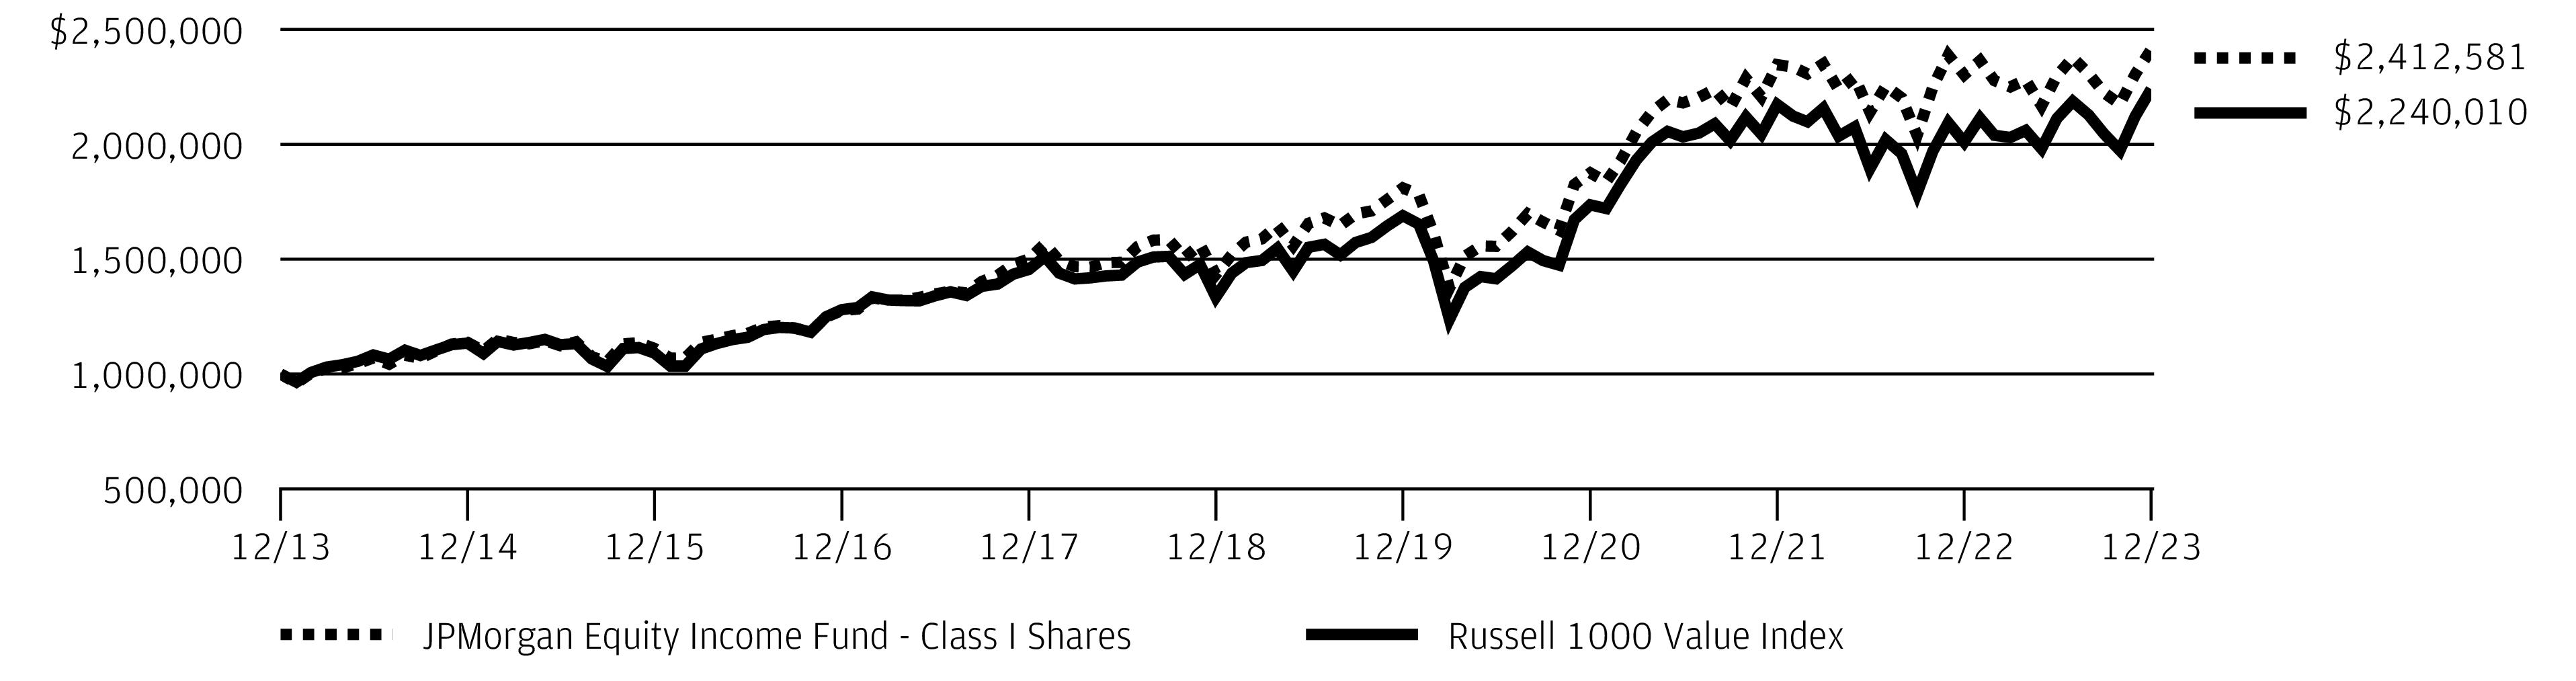
The performance quoted is past performance and is not a guarantee of future results. Mutual funds are subject to certain market risks. Investment returns and principal value of an investment will fluctuate so that an investor’s shares, when redeemed, may be worth more or less than their original cost. Current performance may be higher or lower than the performance data shown. Updated performance information is available by visiting www.jpmorganfunds.com or by calling 1-800-480-4111.
Returns for Class R4 Shares prior to their inception date are based on the performance of Class I Shares. The actual returns for Class R4 Shares would have been similar to those shown because Class R4 Shares had similar expenses to Class I Shares.
Returns for Class R3 Shares prior to their inception date are based on the performance of Class A Shares. The actual returns for Class R3 Shares would have been similar to those shown because Class R3 Shares currently have the same expenses as Class A Shares.
The graph illustrates comparative performance for $1,000,000 invested in Class I Shares of the JPMorgan Equity Income Fund and the Russell 1000 Value Index from December 31, 2013 to December 31, 2023. The performance of the Fund assumes reinvestment of all dividends and capital gain distributions, if any, and does not include a sales charge. The performance of the Russell 1000 Value Index does not reflect the deduction of expenses or a sales charge associated with a mutual fund and has been adjusted to reflect reinvestment of all dividends and capital gain distributions of the securities included in the bench mark, if applicable. The Russell 1000 Value Index is an unmanaged index
which measures the performance of those Russell 1000 companies with lower price-to-book ratios and lower forecasted growth values. Investors cannot invest directly in an index.
Class I Shares have a $1,000,000 minimum initial investment.
Fund performance may reflect the waiver of the Fund’s fees and reimbursement of expenses for certain periods. Without these waivers and reimbursements, performance would have been lower. Also, performance shown in this section does not reflect the deduction of taxes that a shareholder would pay on Fund distributions or on gains resulting from redemptions of Fund shares.
Because Class C Shares automatically convert to Class A Shares after 8 years, the 10 year average annual total return shown above for Class C Shares reflects Class A Share's Performance for the period after conversion.
The returns shown are based on net asset values calculated for shareholder transactions and may differ from the returns shown in the financial highlights, which reflect adjustments made to the net asset values in accordance with accounting principles generally accepted in the United States of America.
Frank Russell Company is the source and owner of the Russell Index data contained or reflected in this material and all trademarks and copyrights related thereto. Frank Russell Company is not responsible for the formatting or configuration of this material or for any inaccuracy in the adviser's presentation thereof.
| J.P. Morgan Large Cap Funds | |
JPMorgan Equity Index Fund
FUND COMMENTARYSIX MONTHS ENDED December 31, 2023 (Unaudited)
| |
| |
| |
Net Assets as of 12/31/2023 (In Thousands) | |
INVESTMENT OBJECTIVE**
The JPMorgan Equity Index Fund (the “Fund”) seeks investment results that correspond to the aggregate price and dividend performance of securities in the S&P 500 Index (the “Benchmark”).
WHAT WERE THE MAIN DRIVERS OF THE FUND’S PERFORMANCE?
For the six months ended December 31, 2023, the Fund’s Class I Shares largely performed in line with the Benchmark, before considering the effect of Fund fees and expenses. This was consistent with the Fund’s investment objective and indexing strategy, as the Fund looks to generate returns that are comparable to those of the Benchmark.
U.S. equity indexes provided positive returns for the period, amid receding inflation, buoyant consumer demand and low unemployment. For the six-month period, the information technology and financials sectors were leading contributors to performance for the Fund and the Benchmark, while the utilities and consumer staples sectors were the sole detractors from performance.
HOW WAS THE FUND POSITIONED?
Regardless of the market outlook, the Fund was managed in strict conformity with a full index replication strategy and aimed to hold the same stocks in nearly the same proportions
as those found in the Benchmark.
TOP TEN HOLDINGS OF THE
PORTFOLIO AS OF December 31, 2023 | PERCENT OF
TOTAL
INVESTMENTS |
| | |
| | |
| | |
| | |
| | |
| Meta Platforms, Inc., Class A | |
| | |
| | |
| Berkshire Hathaway, Inc., Class B | |
| | |
PORTFOLIO COMPOSITION BY SECTOR
AS OF December 31, 2023 | PERCENT OF
TOTAL
INVESTMENTS |
| |
| |
| |
| |
| |
| |
| |
| |
| |
| |
| |
| |
*
The return shown is based on net asset values calculated for shareholder transactions and may differ from the return shown in the financial highlights, which reflects adjustments made to the net asset values in accordance with accounting principles generally accepted in the United States of America.
**
The adviser seeks to achieve the Fund’s objective. There can be no guarantee it will be achieved.
| J.P. Morgan Large Cap Funds | |
AVERAGE ANNUAL TOTAL RETURNS AS OF December 31, 2023
|
| |
| Sales Charge for Class A Shares is 5.25%. |
| Assumes a 1% CDSC (contingent deferred sales charge) for the 6 month and one year periods and 0% CDSC thereafter. |
TEN YEAR FUND PERFORMANCE (12/31/13 TO 12/31/23)
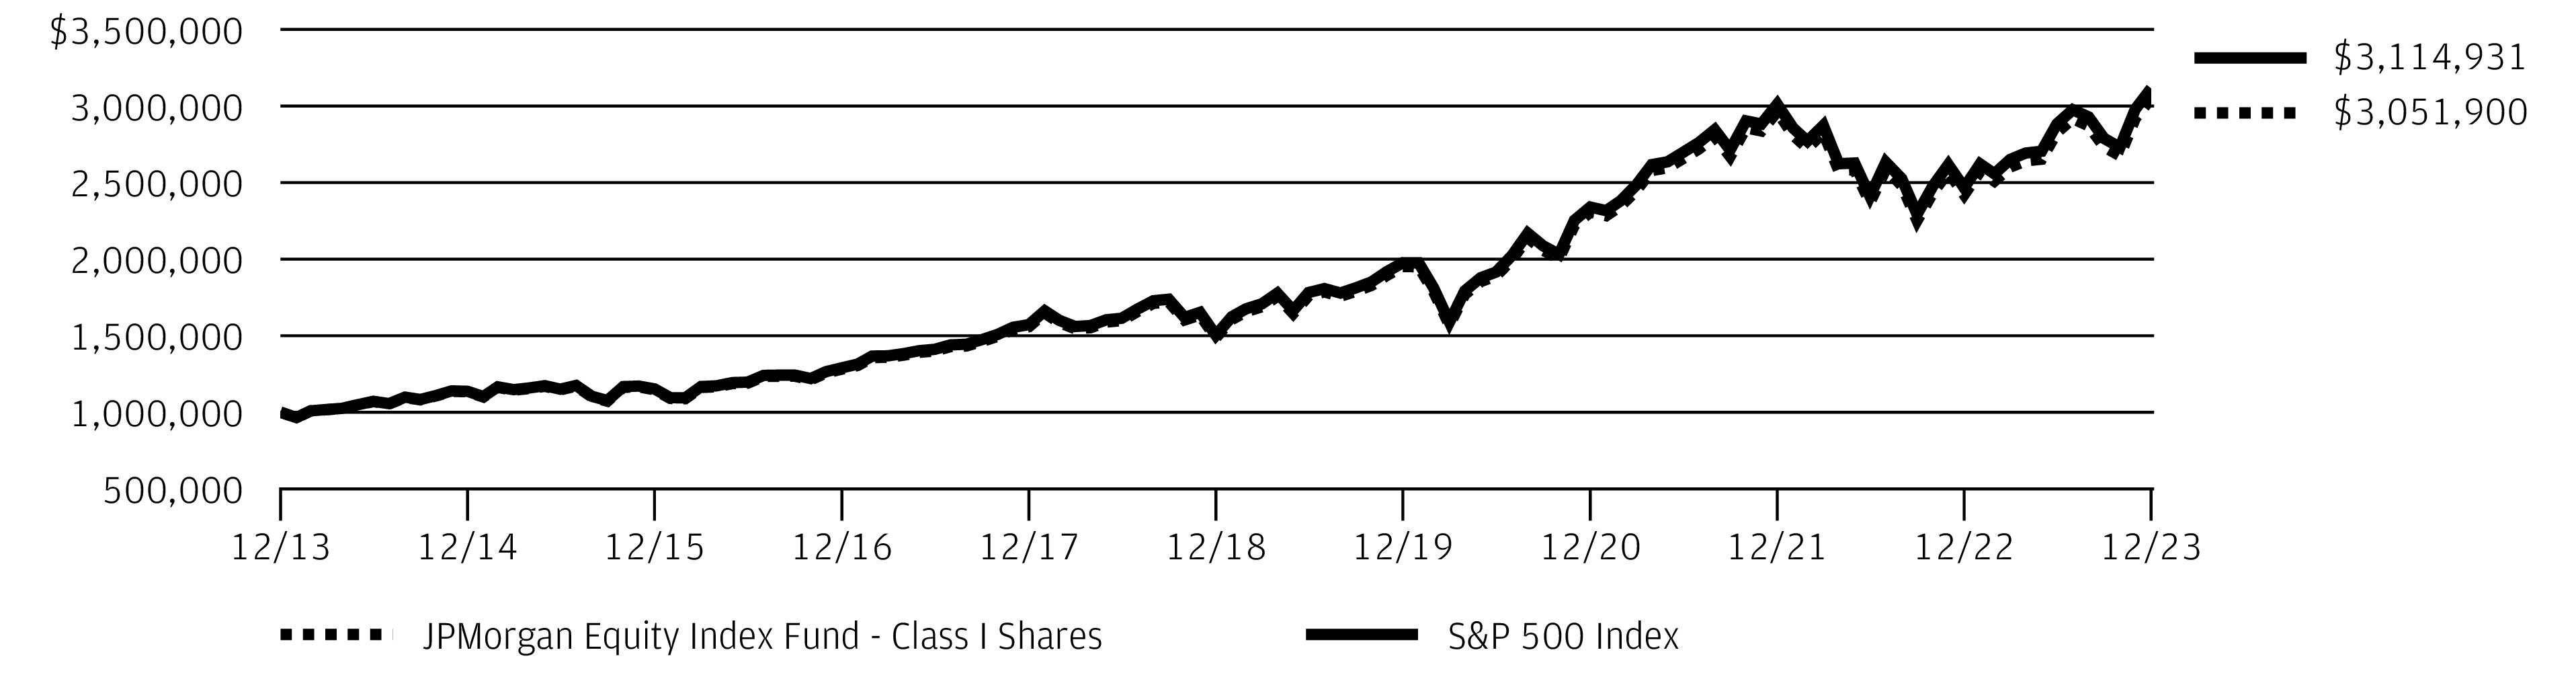
The performance quoted is past performance and is not a guarantee of future results. Mutual funds are subject to certain market risks. Investment returns and principal value of an investment will fluctuate so that an investor’s shares, when redeemed, may be worth more or less than their original cost. Current performance may be higher or lower than the performance data shown. Updated performance information is available by visiting www.jpmorganfunds.com or by calling 1-800-480-4111.
Returns for Class R6 Shares prior to their inception date are based on the performance of Class I Shares. The actual returns for Class R6 Shares would have been different than those shown because Class R6 Shares have different expenses than Class I Shares.
The graph illustrates comparative performance for $1,000,000 invested in Class I Shares of the JPMorgan Equity Index Fund and the S&P 500 Index from December 31, 2013 to December 31, 2023. The performance of the Fund assumes reinvestment of all dividends and capital gain distributions, if any, and does not include a sales charge. The performance of the S&P 500 Index does not reflect the deduction of expenses or a sales charge associated with a mutual fund and has been adjusted to reflect reinvestment of all dividends and capital gain distributions of the securities included in the benchmark, if applicable. The S&P 500 Index is an unmanaged index generally representative of the performance of large companies in the U.S. stock market. Investors cannot invest directly in an index.
Class I Shares have a $1,000,000 minimum initial investment.
Fund performance may reflect the waiver of the Fund’s fees and reimbursement of expenses for certain periods. Without these waivers and reimbursements, performance would have been lower. Also, performance shown in this section
does not reflect the deduction of taxes that a shareholder would pay on Fund distributions or on gains resulting from redemptions of Fund shares.
Because Class C Shares automatically convert to Class A Shares after 8 years, the 10 year average annual total return shown above for Class C Shares reflects Class A Share's Performance for the period after conversion.
The returns shown are based on net asset values calculated for shareholder transactions and may differ from the returns shown in the financial highlights, which reflect adjustments made to the net asset values in accordance with accounting principles generally accepted in the United States of America.
The S&P 500 Index (“Index”) is a product of S&P Dow Jones Indices LLC and/or its affiliates and have been licensed for use by the adviser. Copyright © 2023. S&P Dow Jones Indices LLC, a subsidiary of S&P Global, Inc., and/or its affiliates. All rights reserved. Redistribution or reproduction in whole or in part are prohibited without written permission of S&P Dow Jones Indices LLC. For more information on any of S&P Dow Jones Indices LLC’s indices please visit www.spdji.com. S&P® is a registered trademark of Standard & Poor’s Financial Services LLC and Dow Jones® is a registered trademark of Dow Jones Trademark Holdings LLC. Neither S&P Dow Jones Indices LLC, Dow Jones Trademark Holdings LLC, their affiliates nor their third party licensors make any representation or warranty, express or implied, as to the ability of any index to accurately represent the asset class or market sector that it purports to represent and neither S&P Dow Jones Indices LLC, Dow Jones Trademark Holdings LLC, their affiliates nor their third party licensors shall have any liability for any errors, omissions, or interruptions of any index or the data included therein.
| J.P. Morgan Large Cap Funds | |
JPMorgan Equity Premium Income Fund
FUND COMMENTARYSIX MONTHS ENDED December 31, 2023 (Unaudited)
| |
| |
| |
ICE BofA 3-Month US Treasury Bill Index | |
Net Assets as of 12/31/2023 (In Thousands) | |
INVESTMENT OBJECTIVE**
The JPMorgan Equity Premium Income Fund (the “Fund”) seeks current income while maintaining prospects for capital appreciation.
WHAT WERE THE MAIN DRIVERS OF THE FUND’S PERFORMANCE?
The Fund’s Class I Shares underperformed the S&P 500 Index (the “Benchmark”) and outperformed the ICE BofA 3-Month U.S. Treasury Bill Index for the six months ended December 31, 2023.
The Fund’s overweight positions in the consumer staples and utilities sectors were leading detractors from performance relative to the Benchmark, while the Fund’s security selection in the health care and information technology sectors was a leading contributor to relative performance.
Leading individual detractors from performance relative to the Benchmark included the Fund’s overweight positions in Hershey Co., Texas Instruments Inc. and Bristol-Myers Squibb Co. Shares of Hershey, a maker of chocolates and other snacks, fell amid rising global cocoa prices and investor concerns that widespread use of new weight-loss drugs would reduce demand for confectionary products. Shares of Texas Instruments, a semiconductor manufacturer, fell after the company reported lower-than-expected revenue for the third quarter of 2023 and issued a weaker-than-expected earnings forecast. Shares of Bristol-Myers Squibb, a developer and manufacturer of pharmaceuticals, fell after the company reported a decline in sales for the third quarter of 2023 amid increased competition from generic versions of the company’s leading anti-cancer drug.
Leading individual contributors to performance relative to the Benchmark included the Fund’s overweight positions in Intuit Inc. and Trane Technologies and its underweight position in Pfizer Inc. Shares of Intuit, a financial software developer, rose after the company reported better-than-expected earnings and revenue for its fiscal first quarter. Shares of Trane Technologies, a supplier of heating, cooling and ventilation systems, rose after the company reported consecutive quarters of better-than-expected earnings and revenue. Shares of Pfizer, a pharmaceuticals developer and health care products manufacturer not held in the Fund, fell after the company issued a weaker-than-expected earnings forecast.
HOW WAS THE FUND POSITIONED?
The Fund seeks to generate income through a combination of selling options, investing in large cap stocks and delivering monthly income from associated option premiums and stock dividends. The Fund’s portfolio managers employed a proprietary research process designed to identify what they believed were overvalued and undervalued stocks with
attractive risk/return characteristics.
TOP TEN HOLDINGS OF THE
PORTFOLIO AS OF December 31, 2023 | PERCENT OF
TOTAL
INVESTMENTS |
| | |
| | |
| | |
| | |
| | |
| Mastercard, Inc., Class A | |
| | |
| | |
| | |
| | |
PORTFOLIO COMPOSITION BY SECTOR
AS OF December 31, 2023 | PERCENT OF
TOTAL
INVESTMENTS |
| |
| |
| |
| |
| |
| |
| |
| |
| |
| |
| |
| |
| |
| J.P. Morgan Large Cap Funds | |
*
The return shown is based on net asset values calculated for shareholder transactions and may differ from the return shown in the financial highlights, which reflects adjustments made to the net asset values in accordance with accounting principles generally accepted in the United States of America.
**
The adviser seeks to achieve the Fund’s objective. There can be no guarantee it will be achieved.
***
Equity-Linked Notes that are linked to the S&P 500 Index.
| J.P. Morgan Large Cap Funds | |
JPMorgan Equity Premium Income Fund
FUND COMMENTARYSIX MONTHS ENDED December 31, 2023 (Unaudited) (continued)
AVERAGE ANNUAL TOTAL RETURNS AS OF December 31, 2023
|
| |
| Sales Charge for Class A Shares is 5.25%. |
| Assumes a 1% CDSC (contingent deferred sales charge) for the 6 month and one year periods and 0% CDSC thereafter. |
LIFE OF FUND PERFORMANCE (8/31/18 TO 12/31/23)

The performance quoted is past performance and is not a guarantee of future results. Mutual funds are subject to certain market risks. Investment returns and principal value of an investment will fluctuate so that an investor’s shares, when redeemed, may be worth more or less than their original cost. Current performance may be higher or lower than the performance data shown. Updated performance information is available by visiting www.jpmorganfunds.com or by calling 1-800-480-4111.
The Fund commenced operations on August 31, 2018.
The graph illustrates comparative performance for $1,000,000 invested in Class I Shares of the JPMorgan Equity Premium Income Fund, the S&P 500 Index and the ICE BofA 3-Month US Treasury Bill Index from August 31, 2018 to December 31, 2023. The performance of the Fund assumes reinvestment of all dividends and capital gain distributions, if any, and does not include a sales charge. The performance of the S&P 500 Index and the ICE BofA 3-Month US Treasury Bill Index does not reflect the deduction of expenses or a sales charge associated with a mutual fund and approximates the minimum possible dividend reinvestment of the securities included in the benchmarks, if applicable. These expenses are not identical to the expenses incurred by the Fund. The S&P 500 Index is an unmanaged index generally representative of the performance of large companies in the U.S. stock market. The ICE BofA 3-Month US Treasury Bill Index is comprised of a single issue purchased at the beginning of the month and held for a full month. Each month the ICE BofA 3-Month US Treasury Bill Index is rebalanced and the issue selected is the outstanding Treasury Bill that matures closest to, but not beyond, 3 months from the rebalancing date. Investors cannot invest directly in an index.
Class I Shares have a $1,000,000 minimum initial investment.
Subsequent to the inception date of the Fund and through April 7, 2019, the Fund did not experience any shareholder activity. If such shareholder activity had occurred, the Fund’s performance may have been impacted.
Fund performance may reflect the waiver of the Fund’s fees and reimbursement of expenses for certain periods since the inception date. Without these waivers and reimbursements, performance would have been lower. Also, performance shown in this section does not reflect the deduction of taxes that a shareholder would pay on Fund distributions or on gains resulting from redemptions of Fund shares.
The returns shown are based on net asset values calculated for shareholder transactions and may differ from the returns shown in the financial highlights, which reflect adjustments made to the net asset values in accordance with accounting principles generally accepted in the United States of America.
The S&P 500 Index (“Index”) is a product of S&P Dow Jones Indices LLC and/or its affiliates and have been licensed for use by the adviser. Copyright © 2023. S&P Dow Jones Indices LLC, a subsidiary of S&P Global, Inc., and/or its affiliates. All rights reserved. Redistribution or reproduction in whole or in part are prohibited without written permission of S&P Dow Jones Indices LLC. For more information on any of S&P Dow Jones Indices LLC’s indices please visit www.spdji.com. S&P® is a registered trademark of Standard & Poor’s Financial Services LLC and Dow Jones® is a registered trademark of Dow Jones Trademark Holdings LLC. Neither S&P Dow Jones Indices LLC, Dow Jones Trademark Holdings LLC, their affiliates nor their third party licensors make any representation or warranty, express or implied, as to the ability of any index to accurately represent the asset class or market sector that it purports to represent and neither S&P Dow Jones Indices LLC, Dow Jones Trademark
| J.P. Morgan Large Cap Funds | |
Holdings LLC, their affiliates nor their third party licensors shall have any liability for any errors, omissions, or interruptions of any index or the data included therein.
Source ICE Data Indices, LLC is used with permission. ICE® is a registered trademark of ICE Data Indices, LLC or its affiliates and BofA® is a registered trademark of Bank of America Corporation licensed by Bank of America
Corporation and its affiliates ("BofA"), and may not be used without BofA's prior written approval. The index data referenced herein is the property of ICE Data Indices, LLC, its affiliates (“ICE Data”) and/or its third party suppliers and has been licensed for use by J.P. Morgan Investment Management, Inc. ICE Data and its Third Party Suppliers accept no liability in connection with the use of such index data or marks. See prospectus for a full copy of the Disclaimer.
| J.P. Morgan Large Cap Funds | |
JPMorgan Hedged Equity Fund
FUND COMMENTARYSIX MONTHS ENDED December 31, 2023 (Unaudited)
| |
| |
| |
ICE BofA 3-Month US Treasury Bill Index | |
Net Assets as of 12/31/2023 (In Thousands) | |
INVESTMENT OBJECTIVE**
The JPMorgan Hedged Equity Fund (the “Fund”) seeks to provide capital appreciation.
WHAT WERE THE MAIN DRIVERS OF THE FUND’S PERFORMANCE?
The Fund’s Class I Shares underperformed the S&P 500 Index (the “Benchmark”) for the six months ended December 31, 2023. The Fund’s hedging strategy using exchange-traded index put options and exchange-traded index call options was a leading detractor from performance relative to the Benchmark as equity prices largely rallied in the final months of the period.
The Fund’s security selection in the technology and industrial cyclical sectors was a leading detractor from performance relative to the Benchmark, while the Fund’s security selection in the consumer cyclical and media sectors was a leading contributor to relative performance.
Leading individual detractors from relative performance included the Fund’s underweight positions in Broadcom Inc. and Intel Corp., and its overweight position in Bristol-Myers Squibb Co. Shares of Broadcom, a semiconductor manufacturer, rose amid increased demand for artificial intelligence technologies. Shares of Intel, a semiconductor manufacturer not held in the Fund, rose amid broad demand for artificial intelligence technologies and after the company obtained a $3.2 billion grant from Israel to build a factory there. Shares of Bristol-Myers Squibb, a developer and manufacturer of pharmaceuticals, fell after the company reported a decline in sales for the third quarter of 2023, amid increased competition from generic versions of the company’s leading anti-cancer drug.
Leading individual contributors to relative performance included the Fund’s underweight position in Pfizer Inc. and its overweight positions in Trane Technologies PLC and Booking Holdings Inc. Shares of Pfizer, a pharmaceuticals developer and health care products manufacturer not held in the Fund, fell after the company issued a weaker-than-expected earnings forecast. Shares of Trane Technologies, a supplier of heating, cooling and ventilation systems, rose after the company reported consecutive quarters of better-than-expected earnings and revenue. Shares of Booking Holdings, a provider of online travel and restaurant reservation services, rose after reporting consecutive quarters of better-than-expected earnings.
HOW WAS THE FUND POSITIONED?
The Fund used an enhanced index strategy that invests primarily in common stocks of large capitalization U.S. companies, while systematically purchasing and selling exchange-traded index put options and selling exchange-traded index call options. The options overlay is known as a Put/Spread Collar strategy. The combination of the diversified portfolio of equity securities, downside protection from index put options and income from index call options provided the Fund with a portion of the returns associated with equity market investments while exposing the Fund to less risk than
traditional long-only equity strategies.
| J.P. Morgan Large Cap Funds | |
*
The return shown is based on net asset values calculated for shareholder transactions and may differ from the return shown in the financial highlights, which reflects adjustments made to the net asset values in accordance with accounting principles generally accepted in the United States of America.
**
The adviser seeks to achieve the Fund’s objective. There can be no guarantee it will be achieved.
TOP TEN HOLDINGS OF THE
PORTFOLIO AS OF December 31, 2023 | PERCENT OF
TOTAL
INVESTMENTS |
| | |
| | |
| | |
| | |
| Meta Platforms, Inc., Class A | |
| | |
| | |
| Mastercard, Inc., Class A | |
| | |
| | |
PORTFOLIO COMPOSITION BY SECTOR
AS OF December 31, 2023 | PERCENT OF
TOTAL
INVESTMENTS |
| |
| |
| |
| |
| |
| |
| |
| |
| |
| |
| |
Others (each less than 1.0%) | |
| |
| J.P. Morgan Large Cap Funds | |
JPMorgan Hedged Equity Fund
FUND COMMENTARYSIX MONTHS ENDED December 31, 2023 (Unaudited) (continued)
AVERAGE ANNUAL TOTAL RETURNS AS OF December 31, 2023
|
| |
| Sales Charge for Class A Shares is 5.25%. |
| Assumes a 1% CDSC (contingent deferred sales charge) for the 6 month and one year periods and 0% CDSC thereafter. |
TEN YEAR FUND PERFORMANCE (12/31/13 TO 12/31/23)

The performance quoted is past performance and is not a guarantee of future results. Mutual funds are subject to certain market risks. Investment returns and principal value of an investment will fluctuate so that an investor’s shares, when redeemed, may be worth more or less than their original cost. Current performance may be higher or lower than the performance data shown. Updated performance information is available by visiting www.jpmorganfunds.com or by calling 1-800-480-4111.
The Fund commenced operations on December 13, 2013.
The graph illustrates comparative performance for $1,000,000 invested in Class I Shares of the JPMorgan Hedged Equity Fund, the S&P 500 Index and the ICE BofA 3-Month US Treasury Bill Index from December 13, 2013 to December 31, 2023. The performance of the Fund assumes reinvestment of all dividends and capital gain distributions, if any, and does not include a sales charge. The performance of the S&P 500 Index and the ICE BofA 3-Month US Treasury Bill Index does not reflect the deduction of expenses or a sales charge associated with a mutual fund and approximates the minimum possible dividend reinvestment of the securities included in the benchmarks, if applicable. The S&P 500 Index is an unmanaged index generally representative of the performance of large companies in the U.S. stock market. The ICE BofA 3-Month US Treasury Bill Index is comprised of a single issue purchased at the beginning of the month and held for a full month. Each month the ICE BofA 3-Month US Treasury Bill Index is rebalanced and the issue selected is the outstanding Treasury Bill that matures closest to, but not beyond, 3 months from the rebalancing date. Investors cannot invest directly in an index.
Class I Shares have a $1,000,000 minimum initial investment.
Subsequent to the inception date of the Fund and through May 30, 2014, the Fund did not experience any shareholder activity. If such shareholder activity had occurred, the Fund’s performance may have been impacted.
Fund performance may reflect the waiver of the Fund’s fees and reimbursement of expenses for certain periods since the inception date. Without these waivers and reimbursements, performance would have been lower. Also, performance shown in this section does not reflect the deduction of taxes that a shareholder would pay on Fund distributions or on gains resulting from redemptions of Fund shares.
The returns shown are based on net asset values calculated for shareholder transactions and may differ from the returns shown in the financial highlights, which reflect adjustments made to the net asset values in accordance with accounting principles generally accepted in the United States of America.
The S&P 500 Index (“Index”) is a product of S&P Dow Jones Indices LLC and/or its affiliates and have been licensed for use by the adviser. Copyright © 2023. S&P Dow Jones Indices LLC, a subsidiary of S&P Global, Inc., and/or its affiliates. All rights reserved. Redistribution or reproduction in whole or in part are prohibited without written permission of S&P Dow Jones Indices LLC. For more information on any of S&P Dow Jones Indices LLC’s indices please visit www.spdji.com. S&P® is a registered trademark of Standard & Poor’s Financial Services LLC and Dow Jones® is a registered trademark of Dow Jones Trademark Holdings LLC. Neither S&P Dow Jones Indices LLC, Dow Jones Trademark Holdings LLC, their affiliates nor their third party licensors make any representation or warranty, express or implied, as to the ability of any index to accurately represent the asset class or market sector that it purports to represent and neither S&P Dow Jones Indices LLC, Dow Jones Trademark Holdings LLC, their affiliates nor their third party licensors shall have any
| J.P. Morgan Large Cap Funds | |
liability for any errors, omissions, or interruptions of any index or the data included therein.
Source ICE Data Indices, LLC is used with permission. ICE® is a registered trademark of ICE Data Indices, LLC or its affiliates and BofA® is a registered trademark of Bank of America Corporation licensed by Bank of America Corporation and its affiliates ("BofA"), and may not be used without BofA's prior
written approval. The index data referenced herein is the property of ICE Data Indices, LLC, its affiliates (“ICE Data”) and/or its third party suppliers and has been licensed for use by J.P. Morgan Investment Management, Inc. ICE Data and its Third Party Suppliers accept no liability in connection with the use of such index data or marks. See prospectus for a full copy of the Disclaimer.
| J.P. Morgan Large Cap Funds | |
JPMorgan Hedged Equity 2 Fund
FUND COMMENTARYSIX MONTHS ENDED December 31, 2023 (Unaudited)
| |
| |
| |
ICE BofA 3-Month US Treasury Bill Index | |
Net Assets as of 12/31/2023 (In Thousands) | |
INVESTMENT OBJECTIVE**
The JPMorgan Hedged Equity 2 Fund (the “Fund”) seeks to provide capital appreciation.
WHAT WERE THE MAIN DRIVERS OF THE FUND’S PERFORMANCE?
The Fund’s Class I Shares underperformed the S&P 500 Index (the “Benchmark”) for the six months ended December 31, 2023. The Fund’s hedging strategy using exchange-traded index put options and exchange-traded index call options was a leading detractor from performance relative to the Benchmark as equity prices largely rallied in the final months of the period.
The Fund’s security selection in the technology and industrial cyclical sectors was a leading detractor from performance relative to the Benchmark, while the Fund’s security selection in the consumer cyclical and media sectors was a leading contributor to relative performance.
Leading individual detractors from relative performance included the Fund’s underweight positions in Broadcom Inc. and Intel Corp., and its overweight position in Bristol-Myers Squibb Co. Shares of Broadcom, a semiconductor manufacturer, rose amid increased demand for artificial intelligence technologies. Shares of Intel, a semiconductor manufacturer not held in the Fund, rose amid broad demand for artificial intelligence technologies and after the company obtained a $3.2 billion grant from Israel to build a factory there. Shares of Bristol-Myers Squibb, a developer and manufacturer of pharmaceuticals, fell after the company reported a decline in sales for the third quarter of 2023, amid increased competition from generic versions of the company’s leading anti-cancer drug.
Leading individual contributors to relative performance included the Fund’s underweight position in Pfizer Inc. and its overweight positions in Trane Technologies PLC and Booking Holdings Inc. Shares of Pfizer, a pharmaceuticals developer and health care products manufacturer not held in the Fund, fell after the company issued a weaker-than-expected earnings forecast. Shares of Trane Technologies, a supplier of heating, cooling and ventilation systems, rose after the company reported consecutive quarters of better-than-expected earnings and revenue. Shares of Booking Holdings, a provider of online travel and restaurant reservation services, rose after reporting consecutive quarters of better-than-expected earnings.
HOW WAS THE FUND POSITIONED?
The Fund used an enhanced index strategy that invests primarily in common stocks of large capitalization U.S. companies, while systematically purchasing and selling exchange-traded index put options and selling exchange-traded index call options. The options overlay is known as a Put/Spread Collar strategy. The combination of the diversified portfolio of equity securities, downside protection from index put options and income from index call options provided the Fund with a portion of the returns associated with equity market investments while exposing the Fund to less risk than
traditional long-only equity strategies.
| J.P. Morgan Large Cap Funds | |
*
The return shown is based on net asset values calculated for shareholder transactions and may differ from the return shown in the financial highlights, which reflects adjustments made to the net asset values in accordance with accounting principles generally accepted in the United States of America.
**
The adviser seeks to achieve the Fund’s objective. There can be no guarantee it will be achieved.
***
Amount rounds to less than 0.1%.
TOP TEN HOLDINGS OF THE
PORTFOLIO AS OF December 31, 2023 | PERCENT OF
TOTAL
INVESTMENTS |
| | |
| | |
| | |
| | |
| Meta Platforms, Inc., Class A | |
| | |
| | |
| Mastercard, Inc., Class A | |
| | |
| | |
PORTFOLIO COMPOSITION BY SECTOR
AS OF December 31, 2023 | PERCENT OF
TOTAL
INVESTMENTS |
| |
| |
| |
| |
| |
| |
| |
| |
| |
| |
| |
Others (each less than 1.0%) | |
| |
| J.P. Morgan Large Cap Funds | |
JPMorgan Hedged Equity 2 Fund
FUND COMMENTARYSIX MONTHS ENDED December 31, 2023 (Unaudited) (continued)
AVERAGE ANNUAL TOTAL RETURNS AS OF December 31, 2023
|
| |
| Sales Charge for Class A Shares is 5.25%. |
| Assumes a 1% CDSC (contingent deferred sales charge) for the 6 month and one year periods and 0% CDSC thereafter. |
LIFE OF FUND PERFORMANCE (2/26/21 TO 12/31/23)
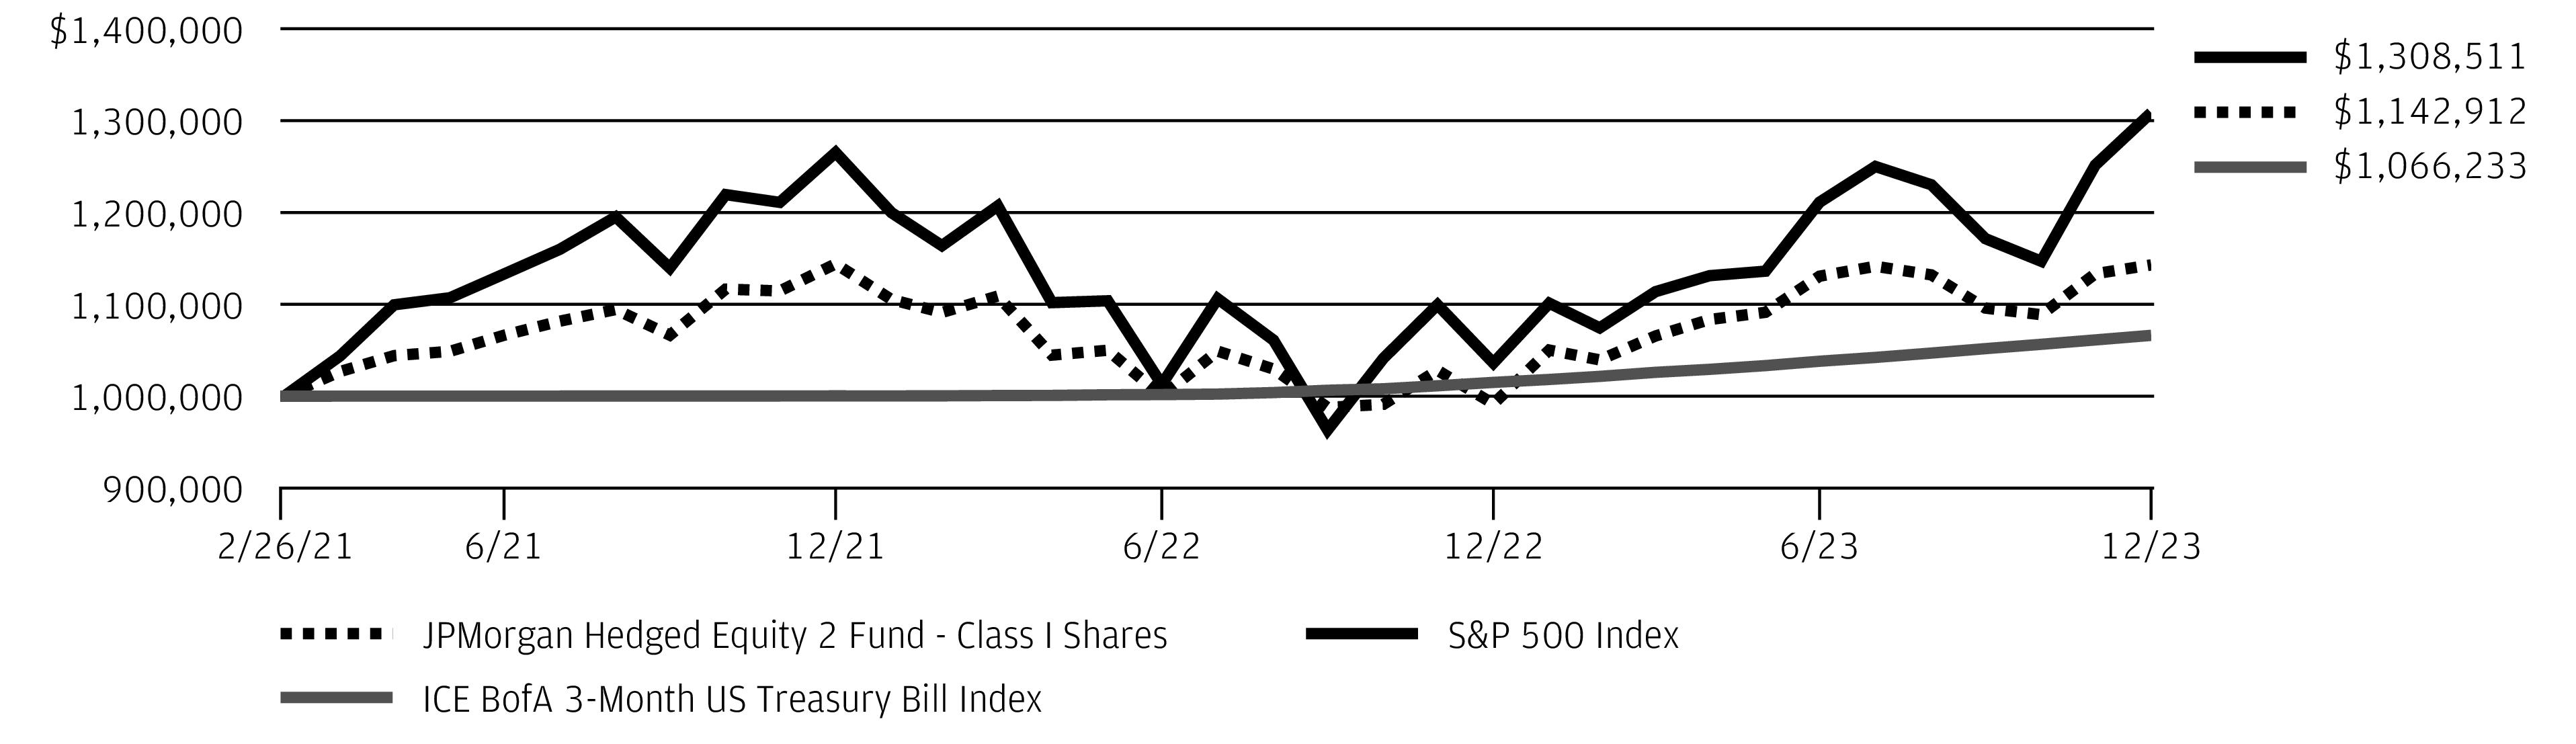
The performance quoted is past performance and is not a guarantee of future results. Mutual funds are subject to certain market risks. Investment returns and principal value of an investment will fluctuate so that an investor’s shares, when redeemed, may be worth more or less than their original cost. Current performance may be higher or lower than the performance data shown. Updated performance information is available by visiting www.jpmorganfunds.com or by calling 1-800-480-4111.
The Fund commenced operations on February 26, 2021.
The graph illustrates comparative performance for $1,000,000 invested in Class I Shares of the JPMorgan Hedged Equity 2 Fund, the S&P 500 Index and the ICE BofA 3-Month US Treasury Bill Index from February 26, 2021 to December 31, 2023. The performance of the Fund assumes reinvestment of all dividends and capital gain distributions, if any, and does not include a sales charge. The performance of the S&P 500 Index and the ICE BofA 3-Month US Treasury Bill Index does not reflect the deduction of expenses or a sales charge associated with a mutual fund and approximates the minimum possible dividend reinvestment of the securities included in the benchmarks, if applicable. The S&P 500 Index is an unmanaged index generally representative of the performance of large companies in the U.S. stock market. Investors cannot invest directly in an index. The ICE BofA 3-Month US Treasury Bill Index is comprised of a single issue purchased at the beginning of the month and held for a full month. Each month the ICE BofA 3-Month US Treasury Bill Index is rebalanced and the issue selected is the outstanding Treasury Bill that matures closest to, but not beyond, 3 months from the rebalancing date. Investors cannot invest directly in an index.
Class I Shares have a $1,000,000 minimum initial investment.
Fund performance may reflect the waiver of the Fund’s fees and reimbursement of expenses for certain periods since the inception date. Without these waivers and reimbursements, performance would have been lower. Also, performance shown in this section does not reflect the deduction of taxes that a shareholder would pay on Fund distributions or on gains resulting from redemptions of Fund shares.
The returns shown are based on net asset values calculated for shareholder transactions and may differ from the returns shown in the financial highlights, which reflect adjustments made to the net asset values in accordance with accounting principles generally accepted in the United States of America.
The S&P 500 Index (“Index”) is a product of S&P Dow Jones Indices LLC and/or its affiliates and have been licensed for use by the adviser. Copyright © 2023. S&P Dow Jones Indices LLC, a subsidiary of S&P Global, Inc., and/or its affiliates. All rights reserved. Redistribution or reproduction in whole or in part are prohibited without written permission of S&P Dow Jones Indices LLC. For more information on any of S&P Dow Jones Indices LLC’s indices please visit www.spdji.com. S&P® is a registered trademark of Standard & Poor’s Financial Services LLC and Dow Jones® is a registered trademark of Dow Jones Trademark Holdings LLC. Neither S&P Dow Jones Indices LLC, Dow Jones Trademark Holdings LLC, their affiliates nor their third party licensors make any representation or warranty, express or implied, as to the ability of any index to accurately represent the asset class or market sector that it purports to represent and neither S&P Dow Jones Indices LLC, Dow Jones Trademark Holdings LLC, their affiliates nor their third party licensors shall have any liability for any errors, omissions, or interruptions of any index or the data included therein.
| J.P. Morgan Large Cap Funds | |
Source ICE Data Indices, LLC is used with permission. ICE® is a registered trademark of ICE Data Indices, LLC or its affiliates and BofA® is a registered trademark of Bank of America Corporation licensed by Bank of America Corporation and its affiliates ("BofA"), and may not be used without BofA's prior written approval. The index data referenced herein is the property of ICE Data
Indices, LLC, its affiliates (“ICE Data”) and/or its third party suppliers and has been licensed for use by J.P. Morgan Investment Management, Inc. ICE Data and its Third Party Suppliers accept no liability in connection with the use of such index data or marks. See prospectus for a full copy of the Disclaimer.
| J.P. Morgan Large Cap Funds | |
JPMorgan Hedged Equity 3 Fund
FUND COMMENTARYSIX MONTHS ENDED December 31, 2023 (Unaudited)
| |
| |
| |
ICE BofA 3-Month US Treasury Bill Index | |
Net Assets as of 12/31/2023 (In Thousands) | |
INVESTMENT OBJECTIVE**
The JPMorgan Hedged Equity 3 Fund (the “Fund”) seeks to provide capital appreciation.
WHAT WERE THE MAIN DRIVERS OF THE FUND’S PERFORMANCE?
The Fund’s Class I Shares underperformed the S&P 500 Index (the “Benchmark”) for the six months ended December 31, 2023. The Fund’s hedging strategy using exchange-traded index put options and exchange-traded index call options was a leading detractor from performance relative to the Benchmark as equity prices largely rallied in the final months of the period.
The Fund’s security selection in the technology and industrial cyclical sectors was a leading detractor from performance relative to the Benchmark, while the Fund’s security selection in the consumer cyclical and media sectors was a leading contributor to relative performance.
Leading individual detractors from relative performance included the Fund’s underweight positions in Broadcom Inc. and Intel Corp., and its overweight position in Bristol-Myers Squibb Co. Shares of Broadcom, a semiconductor manufacturer, rose amid increased demand for artificial intelligence technologies. Shares of Intel, a semiconductor manufacturer not held in the Fund, rose amid broad demand for artificial intelligence technologies and after the company obtained a $3.2 billion grant from Israel to build a factory there. Shares of Bristol-Myers Squibb, a developer and manufacturer of pharmaceuticals, fell after the company reported a decline in sales for the third quarter of 2023, amid increased competition from generic versions of the company’s leading anti-cancer drug.
Leading individual contributors to relative performance included the Fund’s underweight position in Pfizer Inc. and its overweight positions in Trane Technologies PLC and Booking Holdings Inc. Shares of Pfizer, a pharmaceuticals developer and health care products manufacturer not held in the Fund, fell after the company issued a weaker-than-expected earnings forecast. Shares of Trane Technologies, a supplier of heating, cooling and ventilation systems, rose after the company reported consecutive quarters of better-than-expected earnings and revenue. Shares of Booking Holdings, a provider of online travel and restaurant reservation services, rose after reporting consecutive quarters of better-than-expected earnings.
HOW WAS THE FUND POSITIONED?
The Fund used an enhanced index strategy that invests primarily in common stocks of large capitalization U.S. companies, while systematically purchasing and selling exchange-traded index put options and selling exchange-traded index call options. The options overlay is known as a Put/Spread Collar strategy. The combination of the diversified portfolio of equity securities, downside protection from index put options and income from index call options provided the Fund with a portion of the returns associated with equity market investments while exposing the Fund to less risk than
traditional long-only equity strategies.
| J.P. Morgan Large Cap Funds | |
*
The return shown is based on net asset values calculated for shareholder transactions and may differ from the return shown in the financial highlights, which reflects adjustments made to the net asset values in accordance with accounting principles generally accepted in the United States of America.
**
The adviser seeks to achieve the Fund’s objective. There can be no guarantee it will be achieved.
TOP TEN HOLDINGS OF THE
PORTFOLIO AS OF December 31, 2023 | PERCENT OF
TOTAL
INVESTMENTS |
| | |
| | |
| | |
| | |
| Meta Platforms, Inc., Class A | |
| | |
| | |
| Mastercard, Inc., Class A | |
| | |
| | |
PORTFOLIO COMPOSITION BY SECTOR
AS OF December 31, 2023 | PERCENT OF
TOTAL
INVESTMENTS |
| |
| |
| |
| |
| |
| |
| |
| |
| |
| |
| |
Others (each less than 1.0%) | |
| |
| J.P. Morgan Large Cap Funds | |
JPMorgan Hedged Equity 3 Fund
FUND COMMENTARYSIX MONTHS ENDED December 31, 2023 (Unaudited) (continued)
AVERAGE ANNUAL TOTAL RETURNS AS OF December 31, 2023
|
| |
| Sales Charge for Class A Shares is 5.25%. |
| Assumes a 1% CDSC (contingent deferred sales charge) for the 6 month and one year periods and 0% CDSC thereafter. |
LIFE OF FUND PERFORMANCE (2/26/21 TO 12/31/23)
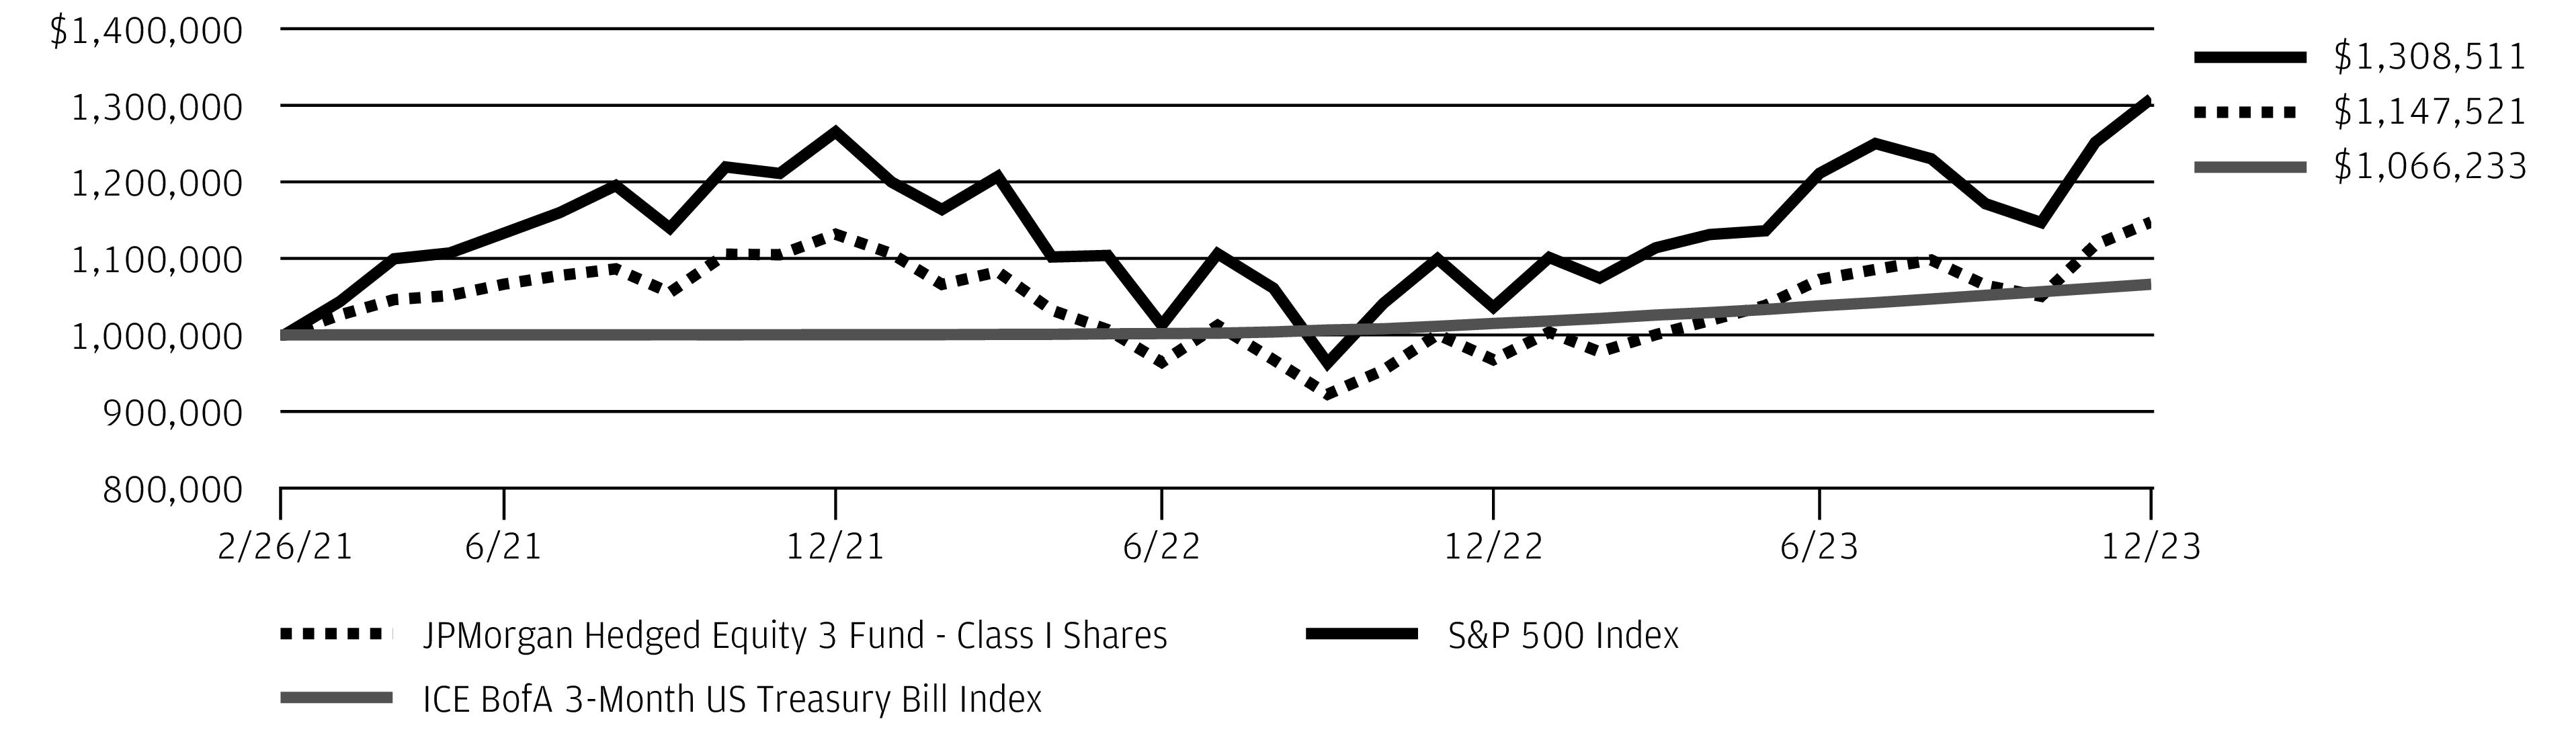
The performance quoted is past performance and is not a guarantee of future results. Mutual funds are subject to certain market risks. Investment returns and principal value of an investment will fluctuate so that an investor’s shares, when redeemed, may be worth more or less than their original cost. Current performance may be higher or lower than the performance data shown. Updated performance information is available by visiting www.jpmorganfunds.com or by calling 1-800-480-4111.
The Fund commenced operations on February 26, 2021.
The graph illustrates comparative performance for $1,000,000 invested in Class I Shares of the JPMorgan Hedged Equity 3 Fund, the S&P 500 Index and the ICE BofA 3-Month US Treasury Bill Index from February 26, 2021 to December 31, 2023. The performance of the Fund assumes reinvestment of all dividends and capital gain distributions, if any, and does not include a sales charge. The performance of the S&P 500 Index and the ICE BofA 3-Month US Treasury Bill Index does not reflect the deduction of expenses or a sales charge associated with a mutual fund and approximates the minimum possible dividend reinvestment of the securities included in the benchmarks, if applicable. The S&P 500 Index is an unmanaged index generally representative of the performance of large companies in the U.S. stock market. Investors cannot invest directly in an index. The ICE BofA 3-Month US Treasury Bill Index is comprised of a single issue purchased at the beginning of the month and held for a full month. Each month the ICE BofA 3-Month US Treasury Bill Index is rebalanced and the issue selected is the outstanding Treasury Bill that matures closest to, but not beyond, 3 months from the rebalancing date. Investors cannot invest directly in an index.
Class I Shares have a $1,000,000 minimum initial investment.
Fund performance may reflect the waiver of the Fund’s fees and reimbursement of expenses for certain periods since the inception date. Without these waivers and reimbursements, performance would have been lower. Also, performance shown in this section does not reflect the deduction of taxes that a shareholder would pay on Fund distributions or on gains resulting from redemptions of Fund shares.
The returns shown are based on net asset values calculated for shareholder transactions and may differ from the returns shown in the financial highlights, which reflect adjustments made to the net asset values in accordance with accounting principles generally accepted in the United States of America.
The S&P 500 Index (“Index”) is a product of S&P Dow Jones Indices LLC and/or its affiliates and have been licensed for use by the adviser. Copyright © 2023. S&P Dow Jones Indices LLC, a subsidiary of S&P Global, Inc., and/or its affiliates. All rights reserved. Redistribution or reproduction in whole or in part are prohibited without written permission of S&P Dow Jones Indices LLC. For more information on any of S&P Dow Jones Indices LLC’s indices please visit www.spdji.com. S&P® is a registered trademark of Standard & Poor’s Financial Services LLC and Dow Jones® is a registered trademark of Dow Jones Trademark Holdings LLC. Neither S&P Dow Jones Indices LLC, Dow Jones Trademark Holdings LLC, their affiliates nor their third party licensors make any representation or warranty, express or implied, as to the ability of any index to accurately represent the asset class or market sector that it purports to represent and neither S&P Dow Jones Indices LLC, Dow Jones Trademark Holdings LLC, their affiliates nor their third party licensors shall have any liability for any errors, omissions, or interruptions of any index or the data included therein.
| J.P. Morgan Large Cap Funds | |
Source ICE Data Indices, LLC is used with permission. ICE® is a registered trademark of ICE Data Indices, LLC or its affiliates and BofA® is a registered trademark of Bank of America Corporation licensed by Bank of America Corporation and its affiliates ("BofA"), and may not be used without BofA's prior written approval. The index data referenced herein is the property of ICE Data
Indices, LLC, its affiliates (“ICE Data”) and/or its third party suppliers and has been licensed for use by J.P. Morgan Investment Management, Inc. ICE Data and its Third Party Suppliers accept no liability in connection with the use of such index data or marks. See prospectus for a full copy of the Disclaimer.
| J.P. Morgan Large Cap Funds | |
JPMorgan Large Cap Growth Fund
FUND COMMENTARYSIX MONTHS ENDED December 31, 2023 (Unaudited)
| |
| |
Russell 1000 Growth Index | |
Net Assets as of 12/31/2023 (In Thousands) | |
INVESTMENT OBJECTIVE**
The JPMorgan Large Cap Growth Fund (the “Fund”) seeks long-term capital appreciation.
WHAT WERE THE MAIN DRIVERS OF THE FUND’S PERFORMANCE?
The Fund’s Class I Shares underperformed the Russell 1000 Growth Index (the “Benchmark”) for the six months ended December 31, 2023.
The Fund’s security selection in the health care and energy sectors was a leading detractor from performance relative to the Benchmark, while the Fund’s security selection in the technology and consumer staples sectors was a leading contributor to relative performance.
Leading individual detractors from relative performance included the Fund’s overweight positions in Align Technology Inc., Exact Sciences Corp. and Oracle Inc. Shares of Align Technology, a maker of clear dental aligners, fell after the company reported lower-than-expected earnings and revenue for the third quarter of 2023. Shares of Exact Sciences, a provider of cancer screening and medical diagnostic tests, fell following a rally in the shares in the first half of 2023. Shares of Oracle, a software developer, fell after the company reported consecutive quarters of lower-than-expected revenue.
Leading individual contributors to relative performance included the Fund’s underweight position in Apple Inc., its overweight position in Uber Technologies Inc. and its out-of-Benchmark position in MercadoLibre Inc. Shares of Apple, a diversified information technology provider, fell late in the period following a rally in the company’s share price. Shares of Uber Technologies, a ride-hailing service, rose amid increased bookings and after the company was included in the S&P 500 Index. Shares of MercadoLibre, an online retail commerce platform, rose after the company reported consecutive quarters of better-than-expected earnings and revenue.
HOW WAS THE FUND POSITIONED?
The Fund’s portfolio managers utilized a bottom-up approach to stock selection, rigorously researching individual companies
in an effort to construct portfolios of stocks that have strong fundamentals and positive price momentum. The Fund’s portfolio managers sought to invest in companies with attractive fundamentals that, in their view, possessed the potential to significantly exceed expectations for a prolonged
period of time.
TOP TEN HOLDINGS OF THE
PORTFOLIO AS OF December 31, 2023 | PERCENT OF
TOTAL
INVESTMENTS |
| | |
| | |
| | |
| Meta Platforms, Inc., Class A | |
| | |
| | |
| | |
| Mastercard, Inc., Class A | |
| | |
| | |
PORTFOLIO COMPOSITION BY SECTOR
AS OF December 31, 2023 | PERCENT OF
TOTAL
INVESTMENTS |
| |
| |
| |
| |
| |
| |
| |
| |
Others (each less than 1.0%) | |
| |
*
The return shown is based on net asset values calculated for shareholder transactions and may differ from the return shown in the financial highlights, which reflects adjustments made to the net asset values in accordance with accounting principles generally accepted in the United States of America.
**
The adviser seeks to achieve the Fund’s objective. There can be no guarantee it will be achieved.
| J.P. Morgan Large Cap Funds | |
AVERAGE ANNUAL TOTAL RETURNS AS OF December 31, 2023
|
| |
| Sales Charge for Class A Shares is 5.25%. |
| Assumes a 1% CDSC (contingent deferred sales charge) for the 6 month and one year periods and 0% CDSC thereafter. |
TEN YEAR FUND PERFORMANCE (12/31/13 TO 12/31/23)
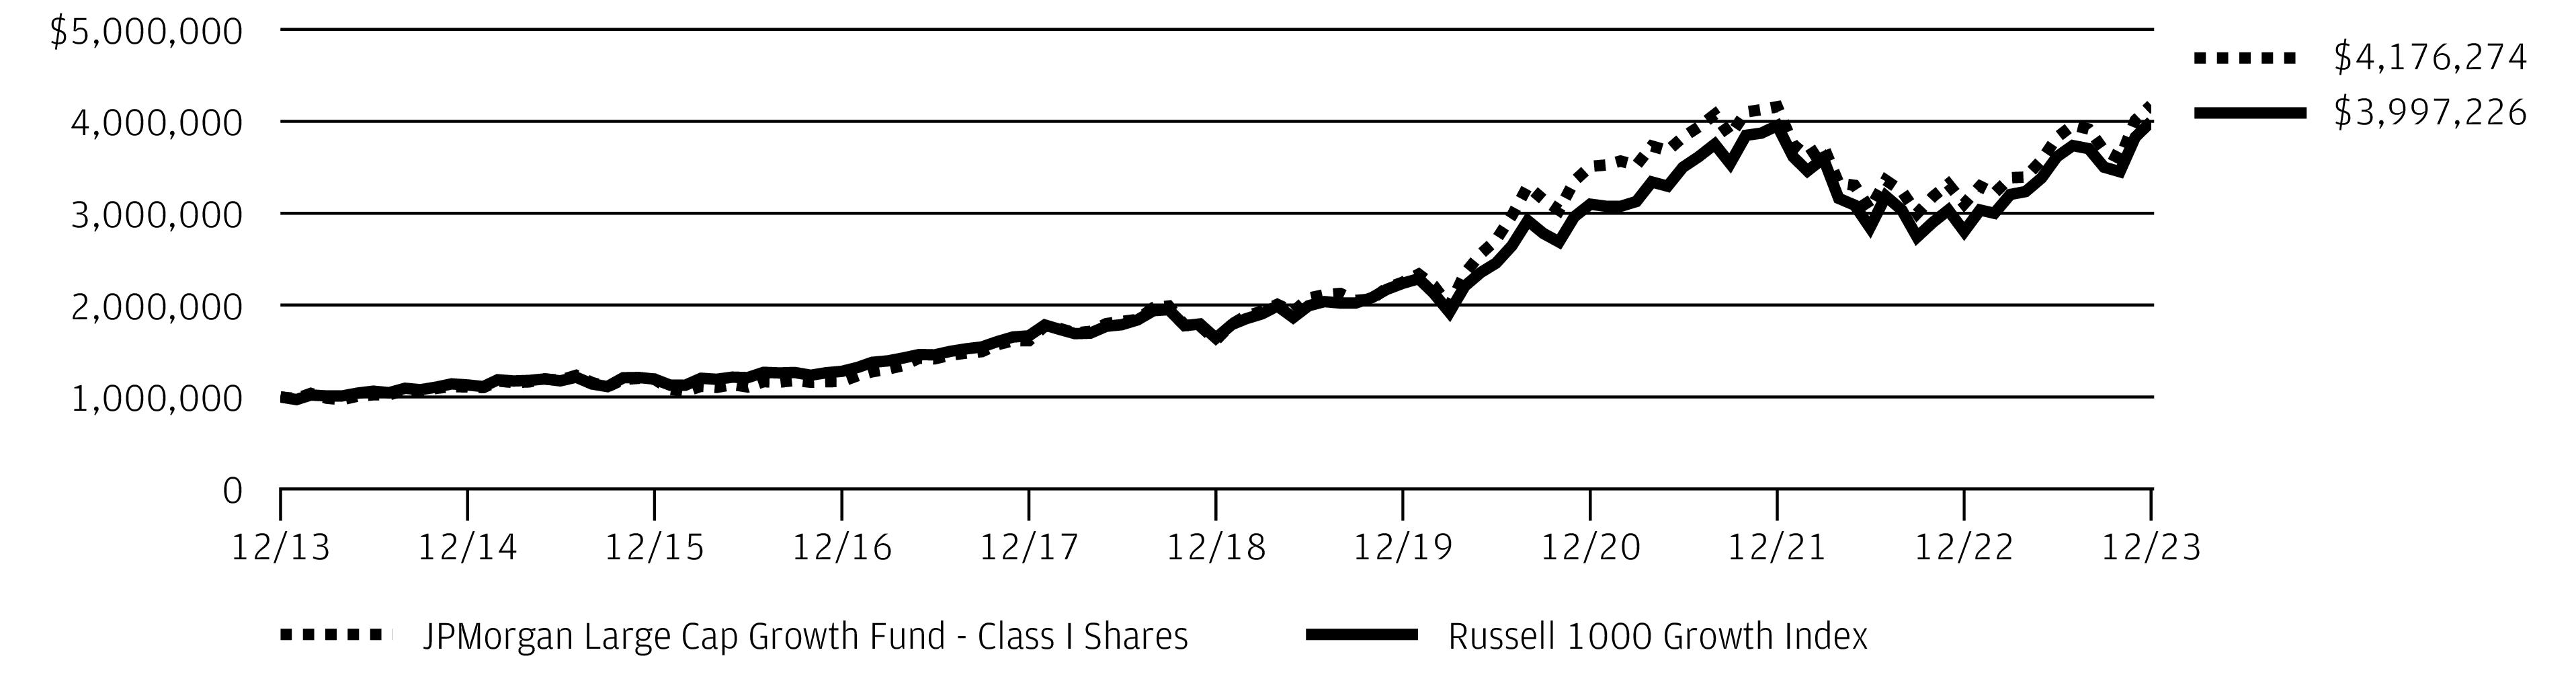
The performance quoted is past performance and is not a guarantee of future results. Mutual funds are subject to certain market risks. Investment returns and principal value of an investment will fluctuate so that an investor’s shares, when redeemed, may be worth more or less than their original cost. Current performance may be higher or lower than the performance data shown. Updated performance information is available by visiting www.jpmorganfunds.com or by calling 1-800-480-4111.
Returns for Class R3 and Class R4 Shares prior to their inception dates are based on the performance of Class I Shares. With respect to Class R3 Shares, prior class performance has been adjusted to reflect the differences in expenses between classes. The actual returns of Class R4 Shares would have been similar to those shown because Class R4 Shares had similar expenses to Class I Shares.
The graph illustrates comparative performance for $1,000,000 invested in Class I Shares of the JPMorgan Large Cap Growth Fund and the Russell 1000 Growth Index from December 31, 2013 to December 31, 2023. The performance of the Fund assumes reinvestment of all dividends and capital gain distributions, if any, and does not include a sales charge. The performance of the Russell 1000 Growth Index does not reflect the deduction of expenses or a sales charge associated with a mutual fund and has been adjusted to reflect reinvestment of all dividends and capital gain distributions of the securities included in the benchmark, if applicable. The Russell 1000 Growth Index is an unmanaged index which measures the performance of those Russell 1000
companies with higher price-to-book ratios and higher forecasted growth values. Investors cannot invest directly in an index.
Class I Shares have a $1,000,000 minimum initial investment.
Fund performance may reflect the waiver of the Fund’s fees and reimbursement of expenses for certain periods. Without these waivers and reimbursements, performance would have been lower. Also, performance shown in this section does not reflect the deduction of taxes that a shareholder would pay on Fund distributions or on gains resulting from redemptions of Fund shares.
Because Class C Shares automatically convert to Class A Shares after 8 years, the 10 year average annual total return shown above for Class C Shares reflects Class A Share's Performance for the period after conversion.
The returns shown are based on net asset values calculated for shareholder transactions and may differ from the returns shown in the financial highlights, which reflect adjustments made to the net asset values in accordance with accounting principles generally accepted in the United States of America.
Frank Russell Company is the source and owner of the Russell Index data contained or reflected in this material and all trademarks and copyrights related thereto. Frank Russell Company is not responsible for the formatting or configuration of this material or for any inaccuracy in the adviser's presentation thereof.
| J.P. Morgan Large Cap Funds | |
JPMorgan Large Cap Value Fund
FUND COMMENTARYSIX MONTHS ENDED December 31, 2023 (Unaudited)
| |
| |
| |
Net Assets as of 12/31/2023 (In Thousands) | |
INVESTMENT OBJECTIVE**
The JPMorgan Large Cap Value Fund (the “Fund”) seeks capital appreciation with the incidental goal of achieving current income by investing primarily in equity securities.
WHAT WERE THE MAIN DRIVERS OF THE FUND’S PERFORMANCE?
The Fund’s Class I Shares outperformed the Russell 1000 Value Index (the “Benchmark”) for the six months ended December 31, 2023.
The Fund’s security selection in the financials and consumer discretionary sectors was a leading contributor to performance relative to the Benchmark, while the Fund’s security selection in the materials and utilities sectors was a leading detractor from relative performance.
Leading individual contributors to relative performance included the Fund’s out-of-Benchmark positions in AbbVie Inc. and Kontoor Brands Inc., and its overweight position in Centene Corp. Shares of AbbVie, a developer and manufacturer of pharmaceuticals, rose amid investor expectations the company would benefit from mergers and acquisitions activity in the broader pharmaceuticals sector. Shares of Kontoor Brands, an apparel and luxury goods manufacturer, rose after the company reported better-than-expected earnings and revenue for the second quarter of 2023. Shares of Centene, a managed health care provider, rose after the company reported consecutive quarters of better-than-expected earnings and revenue.
Leading individual detractors from relative performance included the Fund’s overweight positions in FMC Corp., Bristol-Myers Squibb Co. and Chemours Co. Shares of FMC, a fertilizer and agricultural chemicals manufacturer, fell after the company lowered its full year 2023 earnings forecast. Shares of Bristol-Myers Squibb, a developer and manufacturer of pharmaceuticals, fell after the company reported a decline in sales for the third quarter of 2023 amid increased competition from generic versions of the company’s leading anti-cancer drug. Shares of Chemours, a diversified chemicals manufacturer, fell after the company reported lower-than-expected earnings for the third quarter of 2023 and lowered its earnings forecast for the full year 2023.
HOW WAS THE FUND POSITIONED?
The Fund’s portfolio manager combined a bottom-up fundamental approach to security selection with a systematic valuation process. Overall, the Fund’s portfolio manager looked to take advantage of mispriced stocks that he believed
appeared attractive relative to their fair value.
TOP TEN HOLDINGS OF THE
PORTFOLIO AS OF December 31, 2023 | PERCENT OF
TOTAL
INVESTMENTS |
| | |
| | |
| | |
| | |
| | |
| | |
| | |
| Digital Realty Trust, Inc. | |
| | |
| | |
PORTFOLIO COMPOSITION BY SECTOR
AS OF December 31, 2023 | PERCENT OF
TOTAL
INVESTMENTS |
| |
| |
| |
| |
| |
| |
| |
| |
| |
| |
| |
| |
*
The return shown is based on net asset values calculated for shareholder transactions and may differ from the return shown in
| J.P. Morgan Large Cap Funds | |
the financial highlights, which reflects adjustments made to the net asset values in accordance with accounting principles generally accepted in the United States of America.
**
The adviser seeks to achieve the Fund’s objective. There can be no guarantee it will be achieved.
| J.P. Morgan Large Cap Funds | |
JPMorgan Large Cap Value Fund
FUND COMMENTARYSIX MONTHS ENDED December 31, 2023 (Unaudited) (continued)
AVERAGE ANNUAL TOTAL RETURNS AS OF December 31, 2023
|
| |
| Sales Charge for Class A Shares is 5.25%. |
| Assumes a 1% CDSC (contingent deferred sales charge) for the 6 month and one year periods and 0% CDSC thereafter. |
TEN YEAR FUND PERFORMANCE (12/31/13 TO 12/31/23)
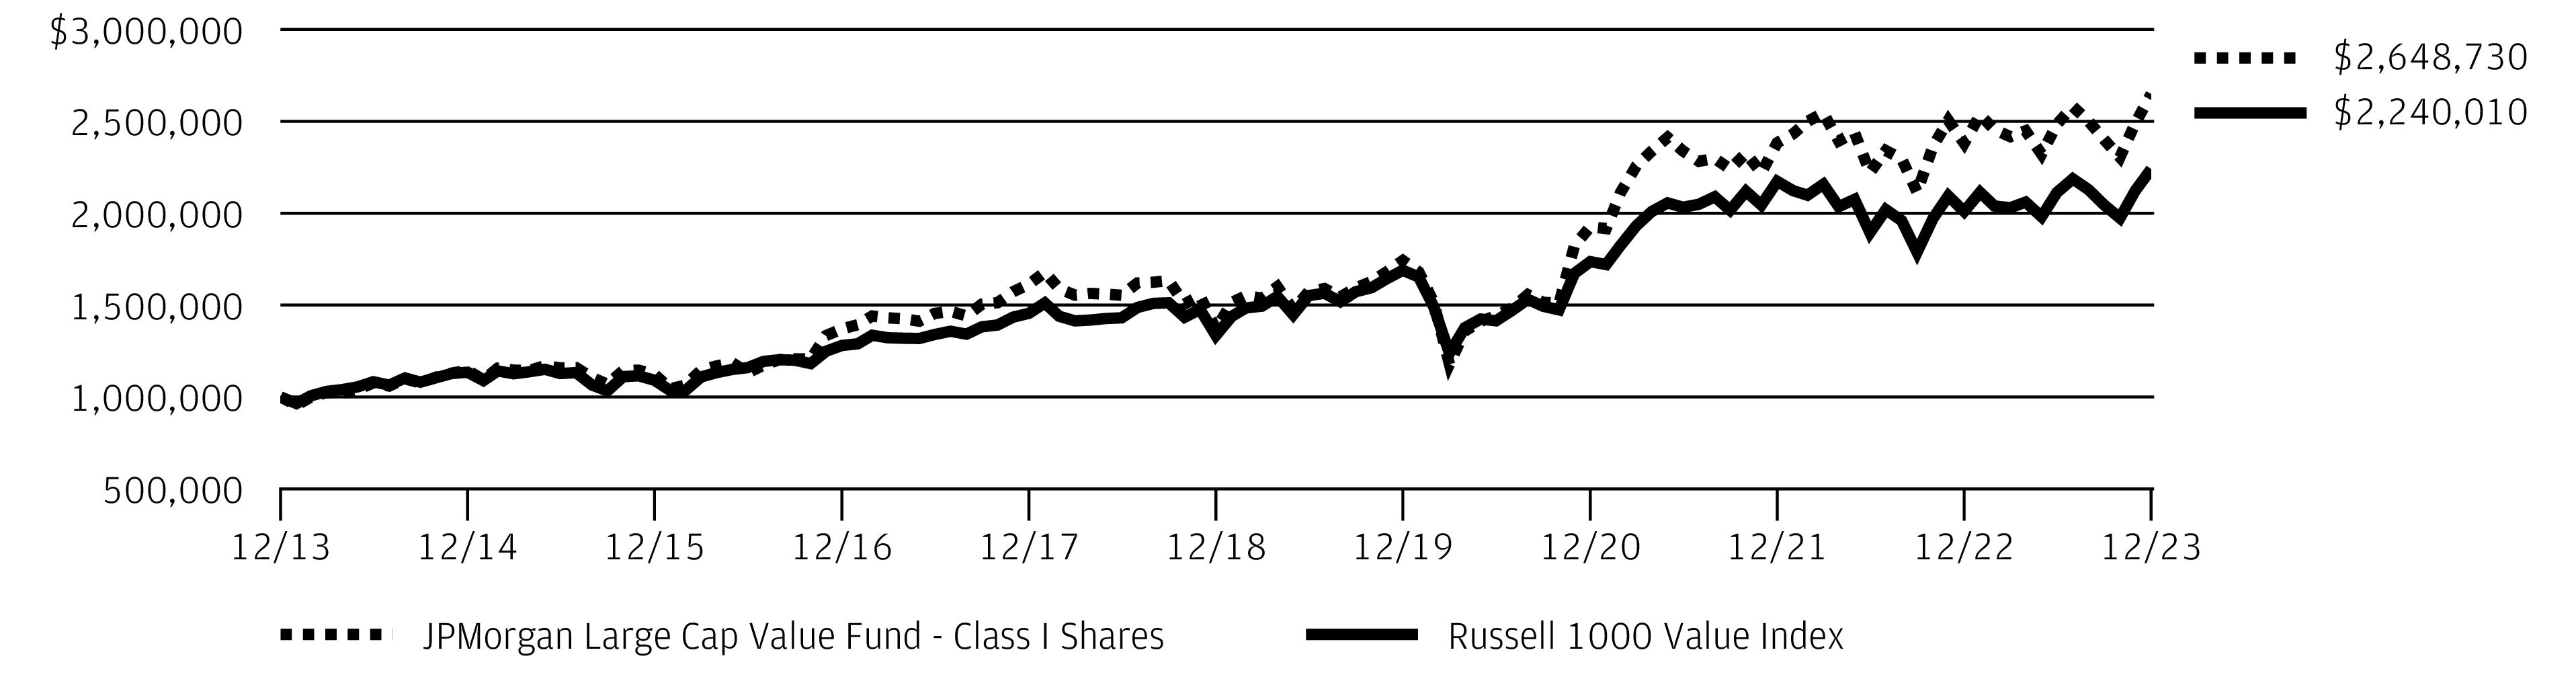
The performance quoted is past performance and is not a guarantee of future results. Mutual funds are subject to certain market risks. Investment returns and principal value of an investment will fluctuate so that an investor’s shares, when redeemed, may be worth more or less than their original cost. Current performance may be higher or lower than the performance data shown. Updated performance information is available by visiting www.jpmorganfunds.com or by calling 1-800-480-4111.
Returns for Class R3 Shares prior to their inception date are based on the performance of Class A Shares. The actual returns of Class R3 Shares would have been different than those shown because Class R3 Shares have different expenses than Class A Shares.
Returns for Class R4 Shares prior to their inception date are based on the performance of Class I Shares. The actual returns for Class R4 Shares would have been similar to those shown because Class R4 Shares have similar expenses than Class I Shares.
The graph illustrates comparative performance for $1,000,000 invested in Class I Shares of the JPMorgan Large Cap Value Fund and the Russell 1000 Value Index from December 31, 2013 to December 31, 2023. The performance of the Fund assumes reinvestment of all dividends and capital gain distributions, if any, and does not include a sales charge. The performance of the Russell 1000 Value Index does not reflect the deduction of expenses or a sales charge associated with a mutual fund and has been adjusted to reflect reinvestment of all dividends and capital gain distributions of the securities included in the benchmark, if applicable. The Russell 1000 Value Index is an unmanaged index
which measures the performance of those Russell 1000 companies with lower price-to-book ratios and lower forecasted growth values. Investors cannot invest directly in an index.
Class I Shares have a $1,000,000 minimum initial investment.
Fund performance may reflect the waiver of the Fund’s fees and reimbursement of expenses for certain periods. Without these waivers and reimbursements, performance would have been lower. Also, performance shown in this section does not reflect the deduction of taxes that a shareholder would pay on Fund distributions or on gains resulting from redemptions of Fund shares.
Because Class C Shares automatically convert to Class A Shares after 8 years, the 10 year average annual total return shown above for Class C Shares reflects Class A Share's performance for the period after conversion.
The returns shown are based on net asset values calculated for shareholder transactions and may differ from the returns shown in the financial highlights, which reflect adjustments made to the net asset values in accordance with accounting principles generally accepted in the United States of America.
Frank Russell Company is the source and owner of the Russell Index data contained or reflected in this material and all trademarks and copyrights related thereto. Frank Russell Company is not responsible for the formatting or configuration of this material or for any inaccuracy in the adviser's presentation thereof.
| J.P. Morgan Large Cap Funds | |
JPMorgan U.S. Applied Data Science Value Fund
FUND COMMENTARYSIX MONTHS ENDED December 31, 2023 (Unaudited)
| |
| |
| |
Net Assets as of 12/31/2023 (In Thousands) | |
INVESTMENT OBJECTIVE**
The JPMorgan U.S. Applied Data Science Value Fund (the “Fund”) seeks to provide long-term capital appreciation.
WHAT WERE THE MAIN DRIVERS OF THE FUND’S PERFORMANCE?
The Fund’s Class I Shares outperformed the Russell 1000 Value Index (the “Benchmark”) for the six months ended December 31, 2023.
The Fund’s security selection in the health care and energy sectors was a leading contributor to performance relative to the Benchmark, while the Fund’s security selection in the information technology and the utilities sector was a leading detractor from relative performance.
Leading individual contributors to relative performance included the Fund’s out-of-Benchmark positions in AbbVie Inc. and Eli Lilly & Co., and its overweight position in Vertex Pharmaceuticals Inc. Shares of AbbVie, a developer and manufacturer of pharmaceuticals, rose amid investor expectations that the company would benefit from mergers and acquisitions activity in the broader pharmaceuticals sector. Shares of Eli Lilly, a developer and manufacturer of pharmaceuticals, rose amid strong demand for the company’s weight-loss drug. Shares of Vertex Pharmaceuticals, a drug developer, rose after the company provided positive data from a study of its new pain medication.
Leading individual detractors from relative performance included the Fund’s overweight positions in NextEra Energy Inc. and Bristol-Myers Squibb Co., and its underweight position in Intel Corp. Shares of NextEra Energy, an electric utility based in Florida, fell after the company lowered its growth forecast amid pressure from elevated interest rates. Shares of Bristol-Myers Squibb, a developer and manufacturer of pharmaceuticals, fell after the company reported a decline in sales for the third quarter of 2023 amid increased competition from generic versions of the company’s leading anti-cancer drug. Shares of Intel, a semiconductor manufacturer not held in the Fund, rose amid broad demand for artificial intelligence technologies and after the company obtained a $3.2 billion grant from Israel to build a factory there.
HOW WAS THE FUND POSITIONED?
During the period, the Fund’s portfolio managers employed a data science driven investment approach that combines research, data insights and risk management. The portfolio managers utilize proprietary techniques to process, analyze and combine a wide variety of data sources, including a multi-decade history of proprietary fundamental research,
company fundamentals and alternative data.
TOP TEN HOLDINGS OF THE
PORTFOLIO AS OF December 31, 2023 | PERCENT OF
TOTAL
INVESTMENTS |
| | |
| | |
| | |
| | |
| | |
| | |
| | |
| Berkshire Hathaway, Inc., Class B | |
| | |
| | |
PORTFOLIO COMPOSITION BY SECTOR
AS OF December 31, 2023 | PERCENT OF
TOTAL
INVESTMENTS |
| |
| |
| |
| |
| |
| |
| |
| |
| |
| |
| |
| |
*
The return shown is based on net asset values calculated for shareholder transactions and may differ from the return shown in
| J.P. Morgan Large Cap Funds | |
JPMorgan U.S. Applied Data Science Value Fund
FUND COMMENTARYSIX MONTHS ENDED December 31, 2023 (Unaudited) (continued)
the financial highlights, which reflects adjustments made to the net asset values in accordance with accounting principles generally accepted in the United States of America.
**
The adviser seeks to achieve the Fund’s objective. There can be no guarantee it will be achieved.
| J.P. Morgan Large Cap Funds | |
AVERAGE ANNUAL TOTAL RETURNS AS OF December 31, 2023
|
| |
| Sales Charge for Class A Shares is 5.25%. |
| Assumes a 1% CDSC (contingent deferred sales charge) for the 6 month and one year periods and 0% CDSC thereafter. |
TEN YEAR FUND PERFORMANCE (12/31/13 TO 12/31/23)
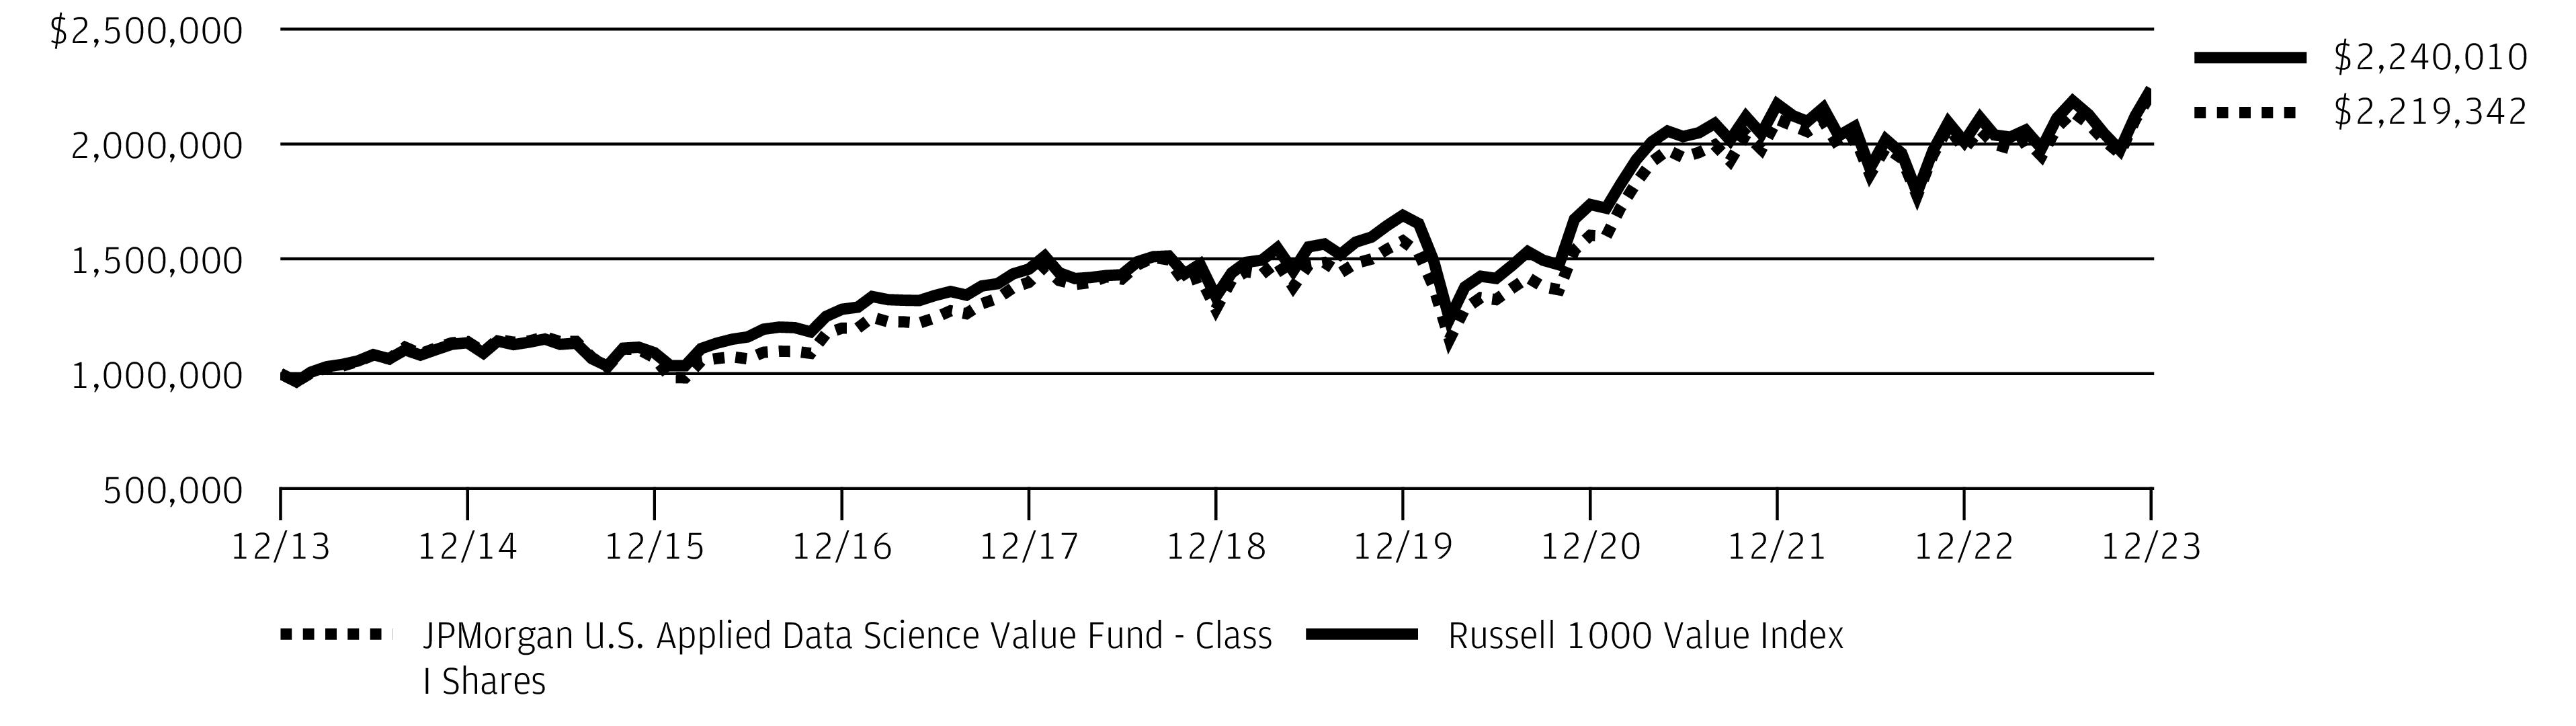
The performance quoted is past performance and is not a guarantee of future results. Mutual funds are subject to certain market risks. Investment returns and principal value of an investment will fluctuate so that an investor’s shares, when redeemed, may be worth more or less than their original cost. Current performance may be higher or lower than the performance data shown. Updated performance information is available by visiting www.jpmorganfunds.com or by calling 1-800-480-4111.
The graph illustrates comparative performance for $1,000,000 invested in Class I Shares of the JPMorgan U.S. Applied Data Science Value Fund and the Russell 1000 Value Index from December 31, 2013 to December 31, 2023. The performance of the Fund assumes reinvestment of all dividends and capital gain distributions, if any, and does not include a sales charge. The performance of the Russell 1000 Value Index does not reflect the deduction of expenses or a sales charge associated with a mutual fund and has been adjusted to reflect reinvestment of all dividends and capital gain distributions of the securities included in the benchmark, if applicable. The Russell 1000 Value Index is an unmanaged index which measures the performance of those Russell 1000 companies with lower price-to-book ratios and lower forecasted growth values. Investors cannot invest directly in an index.
Class I Shares have a $1,000,000 minimum initial investment.
Fund performance may reflect the waiver of the Fund’s fees and reimbursement of expenses for certain periods. Without these waivers and reimbursements, performance would have been lower. Also, performance shown in this section does not reflect the deduction of taxes that a shareholder would pay on Fund distributions or on gains resulting from redemptions of Fund shares.
Because Class C Shares automatically convert to Class A Shares after 8 years, the 10 year average annual total return shown above for Class C Shares reflects Class A Share's performance for the period after conversion.
The returns shown are based on net asset values calculated for shareholder transactions and may differ from the returns shown in the financial highlights, which reflect adjustments made to the net asset values in accordance with accounting principles generally accepted in the United States of America.
Frank Russell Company is the source and owner of the Russell Index data contained or reflected in this material and all trademarks and copyrights related thereto. Frank Russell Company is not responsible for the formatting or configuration of this material or for any inaccuracy in the adviser's presentation thereof.
| J.P. Morgan Large Cap Funds | |
JPMorgan U.S. Equity Fund
FUND COMMENTARYSIX MONTHS ENDED December 31, 2023 (Unaudited)
| |
| |
| |
Net Assets as of 12/31/2023 (In Thousands) | |
INVESTMENT OBJECTIVE**
The JPMorgan U.S. Equity Fund (the “Fund”) seeks to provide high total return from a portfolio of selected equity securities.
WHAT WERE THE MAIN DRIVERS OF THE FUND’S PERFORMANCE?
The Fund’s Class L Shares outperformed the S&P 500 Index (the “Benchmark”) for the six months ended December 31, 2023.
The Fund’s security selection in the pharmaceuticals/medical technology and media sectors was a leading contributor to performance relative to the Benchmark, while the Fund’s security selection in the utilities and the software & services sectors was a leading detractor from relative performance.
Leading individual contributors to relative performance included the Fund’s overweight positions in Uber Technologies Inc., Eaton Corp. and Regeneron Pharmaceuticals Inc. Shares of Uber Technologies, a ride-hailing service, rose amid increased bookings and after the company was included in the S&P 500 Index. Shares of Eaton, an electrical equipment and components manufacturer, rose after the company reported consecutive quarters of better-than-expected earnings and revenue and raised its profit forecast. Shares of Regeneron Pharmaceuticals, a drug developer and manufacturer, rose after the company reported consecutive quarters of better-than-expected earnings and revenue.
Leading individual detractors from relative performance included the Fund’s overweight positions in NextEra Energy Inc., Bristol-Myers Squibb Co., and Oracle Inc. Shares of NextEra Energy, an electric utility based in Florida, fell after the company lowered its growth forecast amid pressure from elevated interest rates. Shares of Bristol-Myers Squibb, a developer and manufacturer of pharmaceuticals, fell after the company reported a decline in sales for the third quarter of 2023 amid increased competition from generic versions of the company’s leading anti-cancer drug. Shares of Oracle, a software developer, fell after the company reported consecutive quarters of lower-than-expected revenue.
HOW WAS THE FUND POSITIONED?
The Fund’s portfolio managers employed a bottom-up fundamental approach to stock selection, researching companies to determine what they believed to be their
underlying value and potential for future earnings growth.
TOP TEN HOLDINGS OF THE
PORTFOLIO AS OF December 31, 2023 | PERCENT OF
TOTAL
INVESTMENTS |
| | |
| | |
| | |
| | |
| | |
| | |
| Meta Platforms, Inc., Class A | |
| | |
| | |
| NXP Semiconductors NV (China) | |
PORTFOLIO COMPOSITION BY SECTOR
AS OF December 31, 2023 | PERCENT OF
TOTAL
INVESTMENTS |
| |
| |
| |
| |
| |
| |
| |
| |
| |
| |
| |
| |
*
The return shown is based on net asset values calculated for shareholder transactions and may differ from the return shown in the financial highlights, which reflects adjustments made to the net asset values in accordance with accounting principles generally accepted in the United States of America.
**
The adviser seeks to achieve the Fund’s objective. There can be no guarantee it will be achieved.
| J.P. Morgan Large Cap Funds | |
AVERAGE ANNUAL TOTAL RETURNS AS OF December 31, 2023
|
| |
| Sales Charge for Class A Shares is 5.25%. |
| Assumes a 1% CDSC (contingent deferred sales charge) for the 6 month and one year periods and 0% CDSC thereafter. |
TEN YEAR FUND PERFORMANCE (12/31/13 TO 12/31/23)
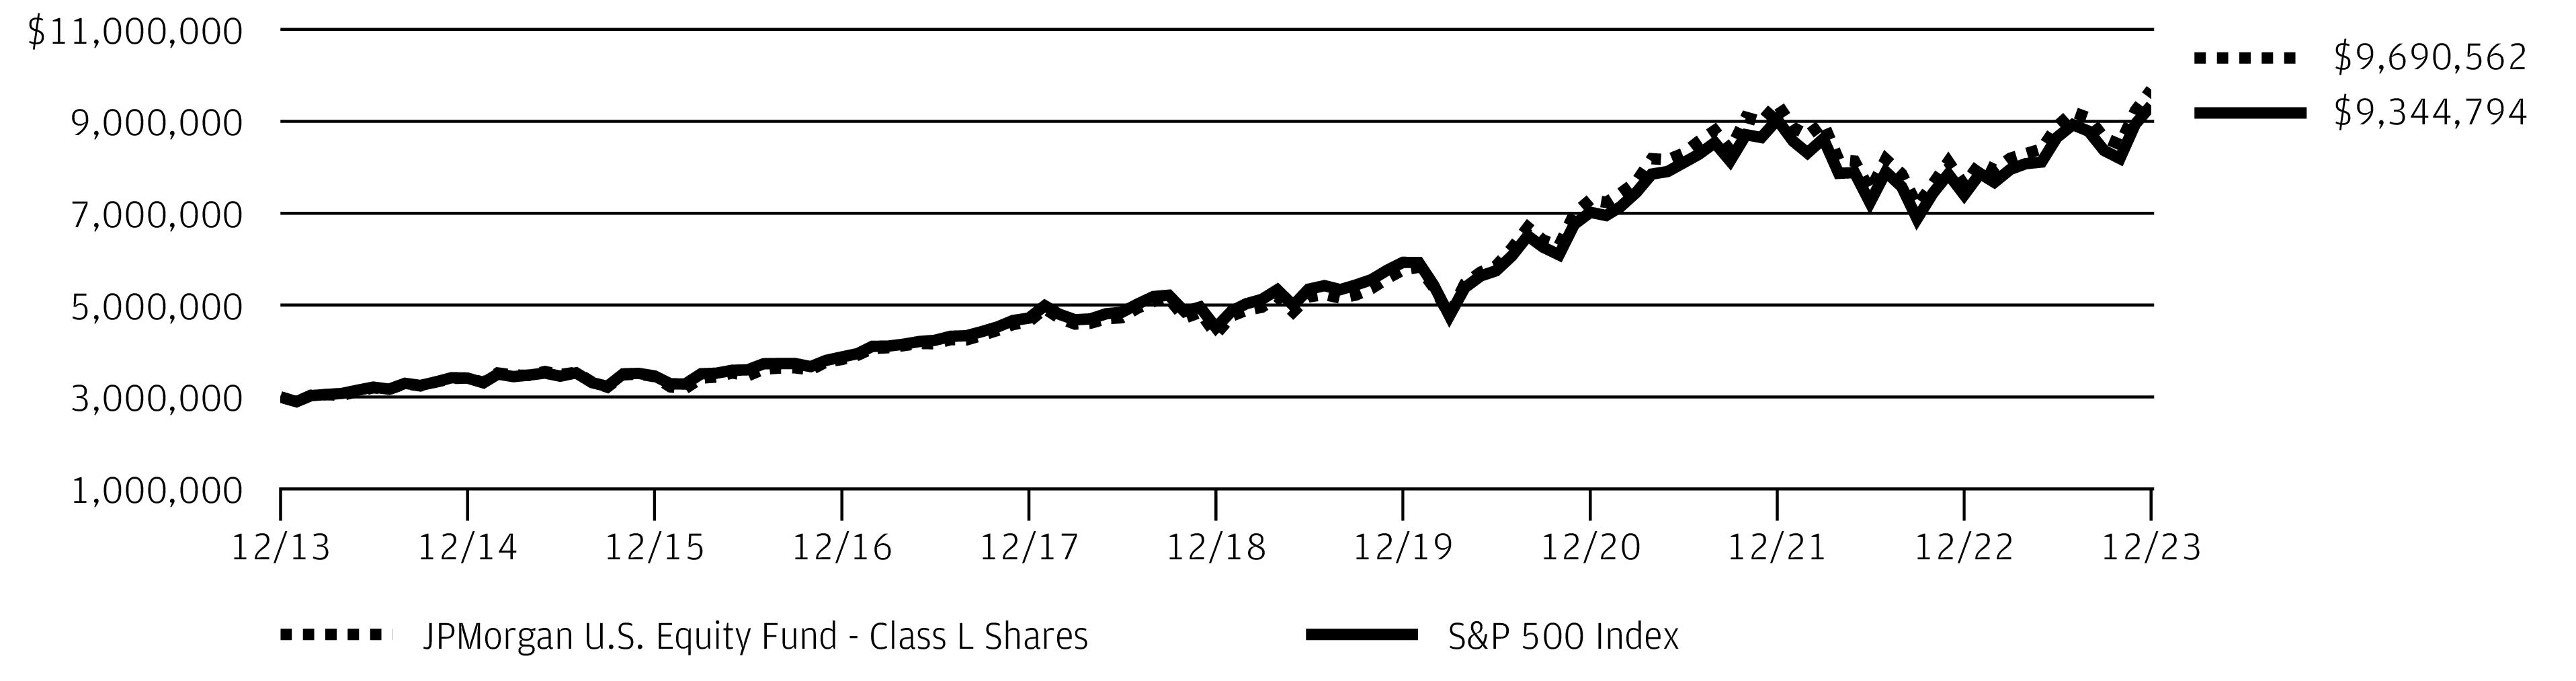
The performance quoted is past performance and is not a guarantee of future results. Mutual funds are subject to certain market risks. Investment returns and principal value of an investment will fluctuate so that an investor’s shares, when redeemed, may be worth more or less than their original cost. Current performance may be higher or lower than the performance data shown. Updated performance information is available by visiting www.jpmorganfunds.com or by calling 1-800-480-4111.
Returns for Class R3 Shares prior to their inception date are based on the performance of Class A Shares. The actual returns of Class R3 Shares would have been similar to those shown because Class R3 Shares have similar expenses to Class A Shares.
Returns for Class R4 Shares prior to their inception date are based on the performance of Class I Shares. The actual returns for Class R4 Shares would have been similar to those shown because Class R4 Shares have similar expenses than Class I Shares.
The graph illustrates comparative performance for $3,000,000 invested in Class L Shares of the JPMorgan U.S. Equity Fund and the S&P 500 Index from December 31, 2013 to December 31, 2023. The performance of the Fund assumes reinvestment of all dividends and capital gain distributions, if any, and does not include a sales charge. The performance of the S&P 500 Index does not reflect the deduction of expenses or a sales charge associated with a mutual fund and has been adjusted to reflect reinvestment of all dividends and capital gain distributions of the securities included in the benchmark, if
applicable. The S&P 500 Index is an unmanaged index generally representative of the performance of large companies in the U.S. stock market. Investors cannot invest directly in an index.
Class L Shares have a $3,000,000 minimum initial investment.
Fund performance may reflect the waiver of the Fund’s fees and reimbursement of expenses for certain periods. Without these waivers and reimbursements, performance would have been lower. Also, performance shown in this section does not reflect the deduction of taxes that a shareholder would pay on Fund distributions or on gains resulting from redemptions of Fund shares.
Because Class C Shares automatically convert to Class A Shares after 8 years, the 10 year average annual total return shown above for Class C Shares reflects Class A Share's performance for the period after conversion.
The returns shown are based on net asset values calculated for shareholder transactions and may differ from the returns shown in the financial highlights, which reflect adjustments made to the net asset values in accordance with accounting principles generally accepted in the United States of America.
The S&P 500 Index (“Index”) is a product of S&P Dow Jones Indices LLC and/or its affiliates and have been licensed for use by the adviser. Copyright © 2023. S&P Dow Jones Indices LLC, a subsidiary of S&P Global, Inc., and/or its affiliates. All rights reserved. Redistribution or reproduction in whole or in part are prohibited without written permission of S&P Dow Jones Indices LLC. For more
| J.P. Morgan Large Cap Funds | |
JPMorgan U.S. Equity Fund
FUND COMMENTARYSIX MONTHS ENDED December 31, 2023 (Unaudited) (continued)
information on any of S&P Dow Jones Indices LLC’s indices please visit www.spdji.com. S&P® is a registered trademark of Standard & Poor’s Financial Services LLC and Dow Jones® is a registered trademark of Dow Jones Trademark Holdings LLC. Neither S&P Dow Jones Indices LLC, Dow Jones Trademark Holdings LLC, their affiliates nor their third party licensors make any representation or warranty, express or implied, as to the ability of any index to
accurately represent the asset class or market sector that it purports to represent and neither S&P Dow Jones Indices LLC, Dow Jones Trademark Holdings LLC, their affiliates nor their third party licensors shall have any liability for any errors, omissions, or interruptions of any index or the data included therein.
| J.P. Morgan Large Cap Funds | |
JPMorgan U.S. GARP Equity Fund
FUND COMMENTARYSIX MONTHS ENDED December 31, 2023 (Unaudited)
| |
| |
Russell 1000 Growth Index | |
Net Assets as of 12/31/2023 (In Thousands) | |
INVESTMENT OBJECTIVE**
The JPMorgan U.S. GARP Equity Fund (the “Fund”) seeks to provide long-term capital growth.
WHAT WERE THE MAIN DRIVERS OF THE FUND’S PERFORMANCE?
The Fund’s Class I Shares outperformed the Russell 1000 Growth Index (the “Benchmark”) for the six months ended December 31, 2023.
The Fund’s security selection in the industrials and consumer staples sectors was a leading contributor to performance relative to the Benchmark, while the Fund’s security selection in the utilities and materials sectors was a leading detractor from relative performance.
Leading individual contributors to relative performance included the Fund’s out-of-Benchmark position in Seagate Technology Holdings Inc. and its overweight positions in Crowdstrike Holdings Inc. and Intuit Inc. Shares of Seagate Technology Holdings, a data hardware and storage provider, rose amid investor expectations that the company will benefit from increased demand for artificial intelligence technologies. Shares of CrowdStrike Holdings, a data security software provider, rose amid surging corporate demand for cybersecurity and artificial intelligence technologies. Shares of Intuit, a financial software developer, rose after the company reported better-than-expected earnings and revenue for its fiscal first quarter.
Leading individual detractors from relative performance included the Fund’s overweight positions in Oracle Inc. and Lowe’s Cos., and its underweight position in Broadcom Inc. Shares of Oracle, a software developer, fell after the company reported consecutive quarters of lower-than-expected revenue. Shares of Lowe’s, a home improvement products retail chain, fell amid declining demand for do-it-yourself projects and weaker-than-expected revenue during the period. Shares of Broadcom, a semiconductor manufacturer, rose amid increased demand for artificial intelligence technologies.
HOW WAS THE FUND POSITIONED?
The Fund’s managers sought high quality growth companies that they believed had superior growth expectations and that
were trading at a discount to their peers.
TOP TEN HOLDINGS OF THE
PORTFOLIO AS OF December 31, 2023 | PERCENT OF
TOTAL
INVESTMENTS |
| | |
| | |
| | |
| | |
| Meta Platforms, Inc., Class A | |
| Mastercard, Inc., Class A | |
| | |
| | |
| | |
| | |
PORTFOLIO COMPOSITION BY SECTOR
AS OF December 31, 2023 | PERCENT OF
TOTAL
INVESTMENTS |
| |
| |
| |
| |
| |
| |
| |
| |
| |
Others (each less than 1.0%) | |
| |
*
The return shown is based on net asset values calculated for shareholder transactions and may differ from the return shown in the financial highlights, which reflects adjustments made to the net asset values in accordance with accounting principles generally accepted in the United States of America.
**
The adviser seeks to achieve the Fund’s objective. There can be no guarantee it will be achieved.
| J.P. Morgan Large Cap Funds | |
JPMorgan U.S. GARP Equity Fund
FUND COMMENTARYSIX MONTHS ENDED December 31, 2023 (Unaudited) (continued)
AVERAGE ANNUAL TOTAL RETURNS AS OF December 31, 2023
|
| |
| Sales Charge for Class A Shares is 5.25%. |
| Assumes a 1% CDSC (contingent deferred sales charge) for the 6 month and one year periods and 0% CDSC thereafter. |
TEN YEAR FUND PERFORMANCE (12/31/13 TO 12/31/23)

The performance quoted is past performance and is not a guarantee of future results. Mutual funds are subject to certain market risks. Investment returns and principal value of an investment will fluctuate so that an investor’s shares, when redeemed, may be worth more or less than their original cost. Current performance may be higher or lower than the performance data shown. Updated performance information is available by visiting www.jpmorganfunds.com or by calling 1-800-480-4111.
Returns for Class R6 Shares prior to their inception date are based on the performance of Class R5 Shares. The actual returns for Class R6 Shares would have been different than those shown because Class R6 Shares have different expenses than Class R5 Shares.
The graph illustrates comparative performance for $1,000,000 invested in Class I Shares of the JPMorgan U.S. GARP Equity Fund and the Russell 1000 Growth Index, from December 31, 2013 to December 31, 2023. The performance of the Fund assumes reinvestment of all dividends and capital gain distributions, if any, and does not include a sales charge. The performance of the Russell 1000 Growth Index does not reflect the deduction of expenses or a sales charge associated with a mutual fund and has been adjusted to reflect reinvestment of all dividends and capital gain distributions of the securities included in the benchmark, if applicable. The Russell 1000 Growth Index is an unmanaged index which measures the performance of those Russell 1000 companies with higher price-to-book ratios and higher forecasted growth values. Investors cannot invest directly in an index.
Class I Shares have a $1,000,000 minimum initial investment.
Fund performance may reflect the waiver of the Fund’s fees and reimbursement of expenses for certain periods. Without these waivers and reimbursements, performance would have been lower. Also, performance shown in this section does not reflect the deduction of taxes that a shareholder would pay on Fund distributions or on gains resulting from redemptions of Fund shares.
Because Class C Shares automatically convert to Class A Shares after 8 years, the 10 year average annual total return shown above for Class C Shares reflects Class A Share's performance for the period after conversion.
The returns shown are based on net asset values calculated for shareholder transactions and may differ from the returns shown in the financial highlights, which reflect adjustments made to the net asset values in accordance with accounting principles generally accepted in the United States of America.
Frank Russell Company is the source and owner of the Russell Index data contained or reflected in this material and all trademarks and copyrights related thereto. Frank Russell Company is not responsible for the formatting or configuration of this material or for any inaccuracy in the adviser's presentation thereof.
| J.P. Morgan Large Cap Funds | |
JPMorgan U.S. Large Cap Core Plus Fund
FUND COMMENTARYSIX MONTHS ENDED December 31, 2023 (Unaudited)
| |
| |
| |
Net Assets as of 12/31/2023 (In Thousands) | |
INVESTMENT OBJECTIVE**
The JPMorgan U.S. Large Cap Core Plus Fund (the “Fund”) seeks to provide a high total return from a portfolio of selected equity securities.
WHAT WERE THE MAIN DRIVERS OF THE FUND’S PERFORMANCE?
The Fund’s Class I Shares outperformed the S&P 500 Index (the “Benchmark”) for the six months ended December 31, 2023.
The Fund’s security selection in the media sector and its underweight position in the automobiles & transportation sectors were leading contributors to performance relative to the Benchmark, while the Fund’s security selection in the industrial cyclical and software & services sectors was a leading detractor from relative performance.
Leading individual contributors to relative performance included the Fund’s overweight positions in Uber Technologies Inc. and Seagate Technology Holdings Inc., and its underweight position in Tesla Inc. Shares of Uber Technologies, a ride-hailing service, rose amid increased bookings and after the company was included in the S&P 500 Index. Shares of Seagate Technology Holdings, a data hardware and storage provider, rose amid investor expectations that the company will benefit from increased demand for artificial intelligence technologies. Shares of Tesla, an electric vehicles manufacturer, fell after the company reported lower-than-expected earnings and revenue for the third quarter of 2023.
Leading individual detractors from relative performance included the Fund’s out-of-Benchmark position in Endeavor Group Holdings Inc. and its short positions in Intel Corp. and Broadcom Inc. Shares of Endeavor Group Holdings, an entertainment and live events provider, fell after an agreement
to be acquired by Silver Lake Technology Management failed to be completed during the period. Shares of Intel, a semiconductor manufacturer not held in the Fund, rose amid broad demand for artificial intelligence technologies and after the company obtained a $3.2 billion grant from Israel to build a factory there. Shares of Broadcom, a semiconductor manufacturer, rose amid increased demand for artificial intelligence technologies.
HOW WAS THE FUND POSITIONED?
The Fund’s portfolio managers employed a bottom-up fundamental approach to stock selection, researching companies to determine their underlying value and potential for future earnings growth. Overall, the Fund’s portfolio managers aimed to take advantage of mispriced stocks that appeared attractive relative to fair value for long positions and looked for overvalued stocks in which to take short positions. The long-to-short exposure ratio at the end of the reporting
period was 127% to 27%.
TOP TEN LONG POSITIONS OF THE
PORTFOLIO AS OF December 31, 2023 | PERCENT OF
TOTAL
INVESTMENTS |
| | |
| | |
| | |
| | |
| | |
| Meta Platforms, Inc., Class A | |
| Mastercard, Inc., Class A | |
| | |
| NXP Semiconductors NV (China) | |
| | |
| J.P. Morgan Large Cap Funds | |
JPMorgan U.S. Large Cap Core Plus Fund
FUND COMMENTARYSIX MONTHS ENDED December 31, 2023 (Unaudited) (continued)
TOP TEN SHORT POSITIONS OF THE
PORTFOLIO AS OF December 31, 2023 | PERCENT OF
TOTAL
INVESTMENTS |
| | |
| | |
| | |
| | |
| | |
| | |
| Simon Property Group, Inc. | |
| | |
| | |
| | |
LONG POSITION PORTFOLIO COMPOSITION
BY SECTOR AS OF December 31, 2023 | PERCENT OF
TOTAL
INVESTMENTS |
| |
| |
| |
| |
| |
| |
| |
| |
| |
| |
| |
| |
SHORT POSITION PORTFOLIO COMPOSITION
BY SECTOR AS OF December 31, 2023 | PERCENT OF
TOTAL
INVESTMENTS |
| |
| |
| |
| |
| |
| |
| |
| |
| |
| |
| |
*
The return shown is based on net asset values calculated for shareholder transactions and may differ from the return shown in the financial highlights, which reflects adjustments made to the net asset values in accordance with accounting principles generally accepted in the United States of America.
**
The adviser seeks to achieve the Fund’s objective. There can be no guarantee it will be achieved.
| J.P. Morgan Large Cap Funds | |
AVERAGE ANNUAL TOTAL RETURNS AS OF December 31, 2023
|
| |
| Sales Charge for Class A Shares is 5.25%. |
| Assumes a 1% CDSC (contingent deferred sales charge) for the 6 month and one year periods and 0% CDSC thereafter. |
TEN YEAR FUND PERFORMANCE (12/31/13 TO 12/31/23)
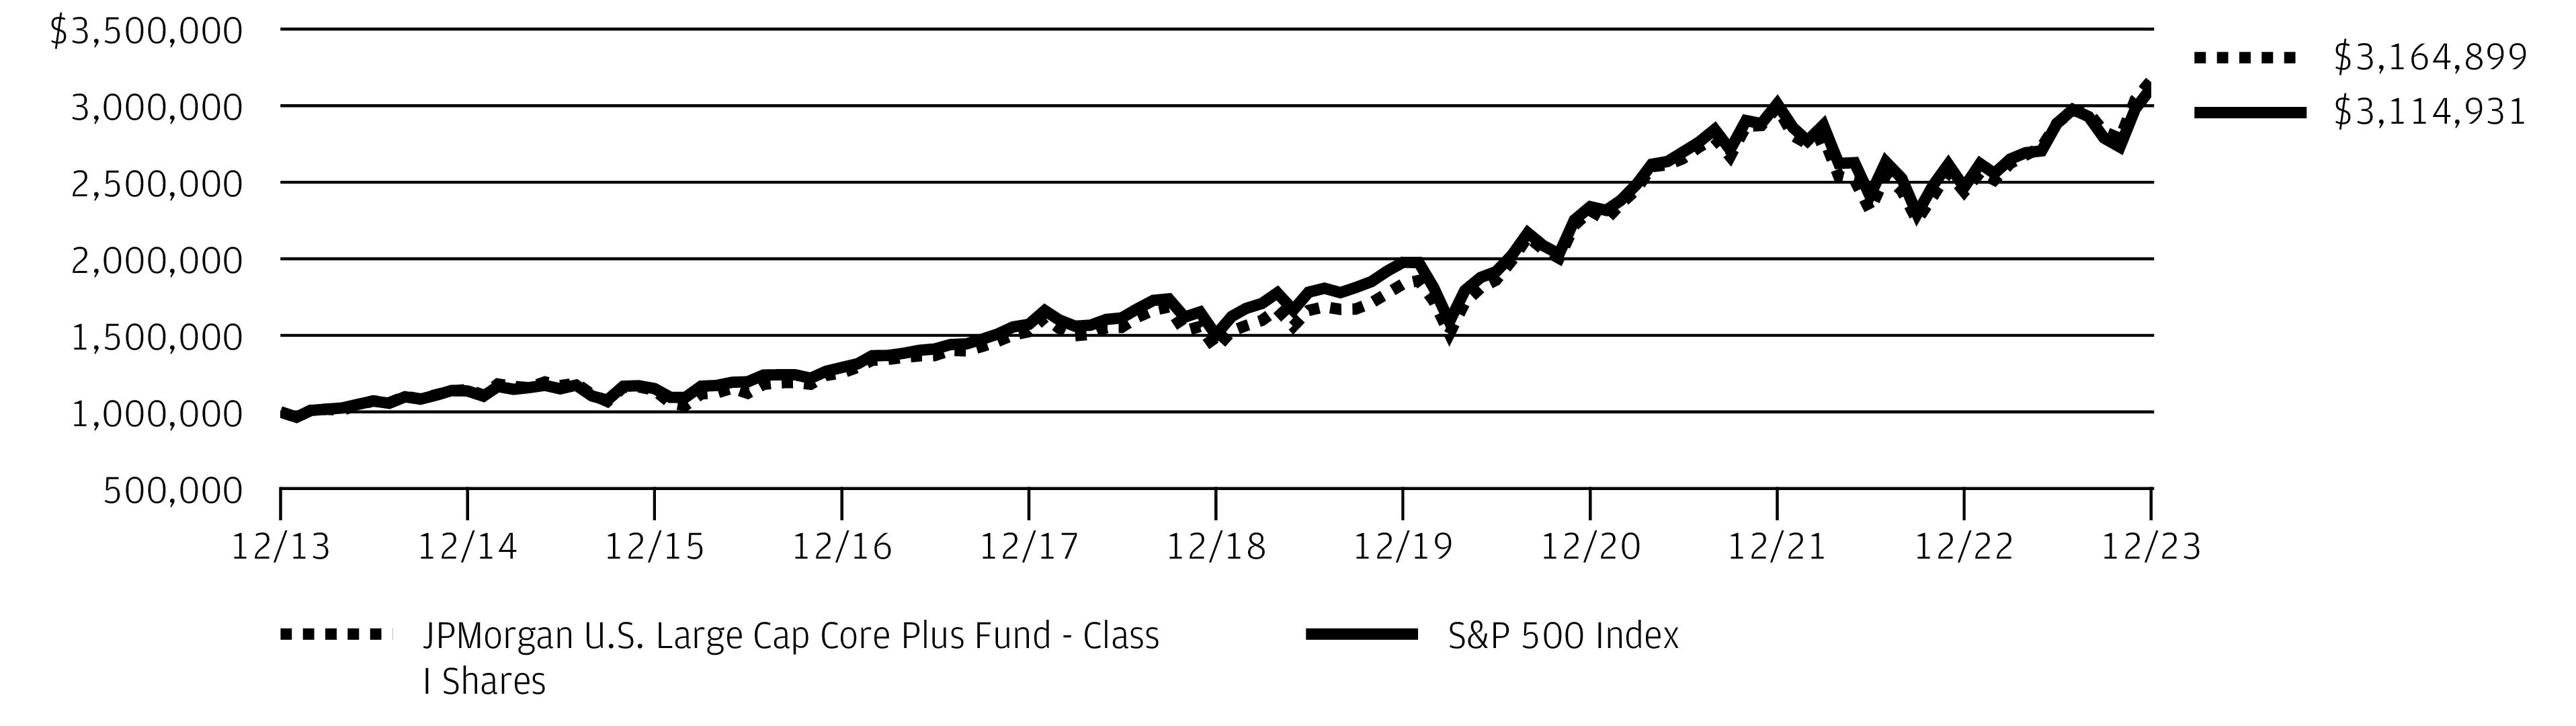
The performance quoted is past performance and is not a guarantee of future results. Mutual funds are subject to certain market risks. Investment returns and principal value of an investment will fluctuate so that an investor’s shares, when redeemed, may be worth more or less than their original cost. Current performance may be higher or lower than the performance data shown. Updated performance information is available by visiting www.jpmorganfunds.com or by calling 1-800-480-4111.
Returns for Class R6 Shares prior to its inception date are based on the performance of Class R5 Shares. The actual returns of Class R6 Shares would have been different than those shown because Class R6 Shares have different expenses than Class R5 Shares.
The graph illustrates comparative performance for $1,000,000 invested in Class I Shares of the JPMorgan U.S. Large Cap Core Plus Fund and the S&P 500 Index from December 31, 2013 to December 31, 2023. The performance of the Fund assumes reinvestment of all dividends and capital gain distributions, if any, and does not include a sales charge. The performance of the S&P 500 Index does not reflect the deduction of expenses or a sales charge associated with a mutual fund and has been adjusted to reflect reinvestment of all dividends and capital gain distributions of the securities included in the benchmark, if applicable. The S&P 500 Index is an unmanaged index generally representative of the performance of large companies in the U.S. stock market. Investors cannot invest directly in an index.
Class I Shares have a $1,000,000 minimum initial investment.
Fund performance may reflect the waiver of the Fund’s fees and reimbursement of expenses for certain periods. Without these waivers and reimbursements,
performance would have been lower. Also, performance shown in this section does not reflect the deduction of taxes that a shareholder would pay on Fund distributions or on gains resulting from redemptions of Fund shares.
Because Class C Shares automatically convert to Class A Shares after 8 years, the 10 year average annual total return shown above for Class C Shares reflects Class A Share's performance for the period after conversion.
The returns shown are based on net asset values calculated for shareholder transactions and may differ from the returns shown in the financial highlights, which reflect adjustments made to the net asset values in accordance with accounting principles generally accepted in the United States of America.
The S&P 500 Index (“Index”) is a product of S&P Dow Jones Indices LLC and/or its affiliates and have been licensed for use by the adviser. Copyright © 2023. S&P Dow Jones Indices LLC, a subsidiary of S&P Global, Inc., and/or its affiliates. All rights reserved. Redistribution or reproduction in whole or in part are prohibited without written permission of S&P Dow Jones Indices LLC. For more information on any of S&P Dow Jones Indices LLC’s indices please visit www.spdji.com. S&P® is a registered trademark of Standard & Poor’s Financial Services LLC and Dow Jones® is a registered trademark of Dow Jones Trademark Holdings LLC. Neither S&P Dow Jones Indices LLC, Dow Jones Trademark Holdings LLC, their affiliates nor their third party licensors make any representation or warranty, express or implied, as to the ability of any index to accurately represent the asset class or market sector that it purports to represent and neither S&P Dow Jones Indices LLC, Dow Jones Trademark Holdings LLC, their affiliates nor their third party licensors shall have any liability for any errors, omissions, or interruptions of any index or the data included therein.
| J.P. Morgan Large Cap Funds | |
JPMorgan U.S. Research Enhanced Equity Fund
FUND COMMENTARYSIX MONTHS ENDED December 31, 2023 (Unaudited)
| |
| |
| |
Net Assets as of 12/31/2023 (In Thousands) | |
INVESTMENT OBJECTIVE**
The JPMorgan U.S. Research Enhanced Equity Fund (the “Fund”) seeks to provide a consistently high total return from a broadly diversified portfolio of equity securities with risk characteristics similar to the S&P 500 Index (the “Benchmark”).
WHAT WERE THE MAIN DRIVERS OF THE FUND’S PERFORMANCE?
The Fund’s Class I Shares outperformed the Benchmark for the six months ended December 31, 2023.
The Fund’s security selection in the consumer cyclical and media sectors was a leading contributor to performance relative to the Benchmark, while the Fund’s security selection in the technology and industrial cyclical sectors was a leading detractor from relative performance.
Leading individual contributors to relative performance included the Fund’s underweight position in Pfizer Inc. and its overweight positions in Trane Technologies PLC and Booking Holdings Inc. Shares of Pfizer, a pharmaceuticals developer and health care products manufacturer not held in the Fund, fell after the company issued a weaker-than-expected earnings forecast. Shares of Trane Technologies, a supplier of heating, cooling and ventilation systems, rose after the company reported consecutive quarters of better-than-expected earnings and revenue. Shares of Booking Holdings, a provider of online travel and restaurant reservation services, rose after reporting consecutive quarters of better-than-expected earnings.
Leading individual detractors from relative performance included the Fund’s underweight position in Broadcom Inc. and Intel Corp., and its overweight position in Bristol-Myers Squibb Co. Shares of Broadcom, a semiconductor manufacturer, rose amid increased demand for artificial intelligence technologies. Shares of Intel, a semiconductor manufacturer not held in the Fund, rose amid broad demand for artificial intelligence technologies and after the company obtained a $3.2 billion grant from Israel to build a factory there. Shares of Bristol-Myers Squibb, a developer and manufacturer of pharmaceuticals, fell after the company reported a decline in sales for the third quarter of 2023, amid increased competition from generic versions of the company’s leading anti-cancer drug.
HOW WAS THE FUND POSITIONED?
The Fund’s portfolio managers attempted to construct the portfolio so that stock selection was the principal source of potential excess return. The Fund’s portfolio managers sought investment opportunities in companies that they believed were
attractive based on valuation and strong fundamentals.
TOP TEN HOLDINGS OF THE
PORTFOLIO AS OF December 31, 2023 | PERCENT OF
TOTAL
INVESTMENTS |
| | |
| | |
| | |
| | |
| Meta Platforms, Inc., Class A | |
| | |
| | |
| Mastercard, Inc., Class A | |
| | |
| | |
PORTFOLIO COMPOSITION BY SECTOR
AS OF December 31, 2023 | PERCENT OF
TOTAL
INVESTMENTS |
| |
| |
| |
| |
| |
| |
| |
| |
| |
| |
| |
| |
*
The return shown is based on net asset values calculated for shareholder transactions and may differ from the return shown in
| J.P. Morgan Large Cap Funds | |
the financial highlights, which reflects adjustments made to the net asset values in accordance with accounting principles generally accepted in the United States of America.
**
The adviser seeks to achieve the Fund’s objective. There can be no guarantee it will be achieved.
| J.P. Morgan Large Cap Funds | |
JPMorgan U.S. Research Enhanced Equity Fund
FUND COMMENTARYSIX MONTHS ENDED December 31, 2023 (Unaudited) (continued)
AVERAGE ANNUAL TOTAL RETURNS AS OF December 31, 2023
|
| |
| Sales Charge for Class A Shares is 5.25%. |
TEN YEAR FUND PERFORMANCE (12/31/13 TO 12/31/23)
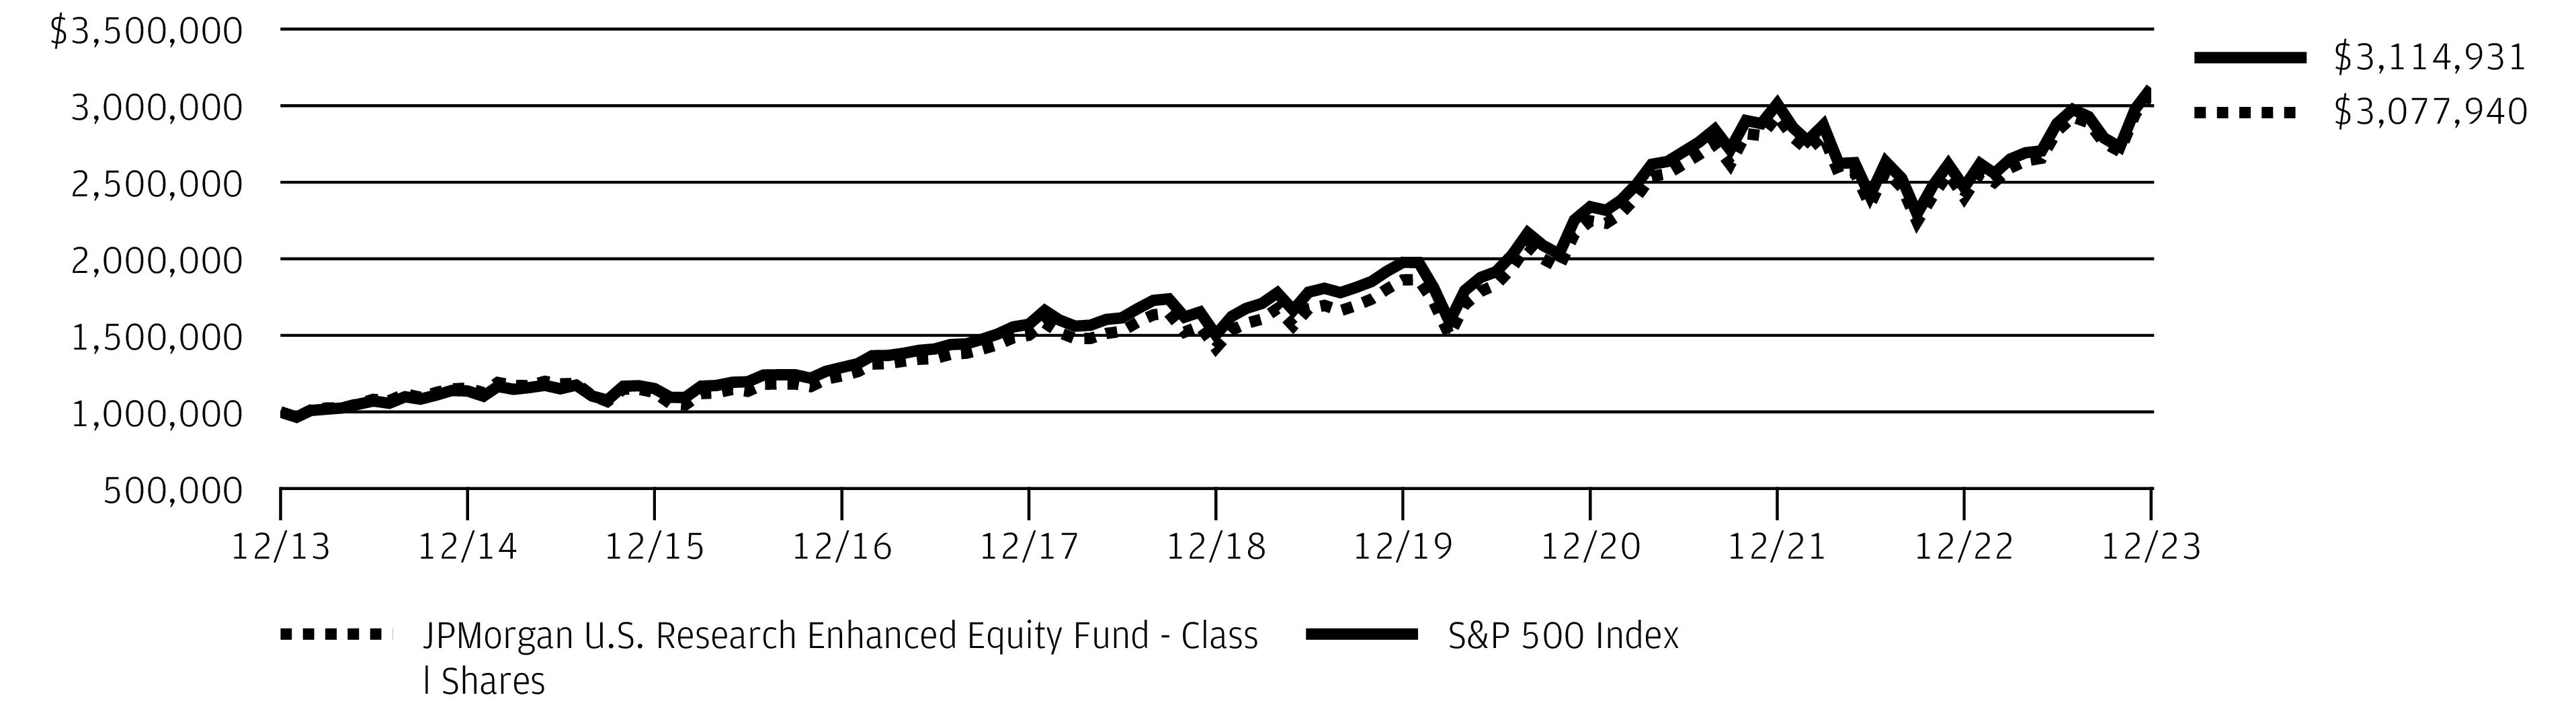
The performance quoted is past performance and is not a guarantee of future results. Mutual funds are subject to certain market risks. Investment returns and principal value of an investment will fluctuate so that an investor’s shares, when redeemed, may be worth more or less than their original cost. Current performance may be higher or lower than the performance data shown. Updated performance information is available by visiting www.jpmorganfunds.com or by calling 1-800-480-4111.
The graph illustrates comparative performance for $1,000,000 invested in Class I Shares of the JPMorgan U.S. Research Enhanced Equity Fund and the S&P 500 Index from December 31, 2013 to December 31, 2023. The performance of the Fund assumes reinvestment of all dividends and capital gain distributions, if any, and does not include a sales charge. The performance of the S&P 500 Index does not reflect the deduction of expenses or a sales charge associated with a mutual fund and has been adjusted to reflect reinvestment of all dividends and capital gain distributions of the securities included in the benchmark, if applicable. The S&P 500 Index is an unmanaged index generally representative of the performance of large companies in the U.S. stock market. Investors cannot invest directly in an index.
Class I Shares have a $1,000,000 minimum initial investment.
Fund performance may reflect the waiver of the Fund’s fees and reimbursement of expenses for certain periods. Without these waivers and reimbursements, performance would have been lower. Also, performance shown in this section
does not reflect the deduction of taxes that a shareholder would pay on Fund distributions or on gains resulting from redemptions of Fund shares.
The returns shown are based on net asset values calculated for shareholder transactions and may differ from the returns shown in the financial highlights, which reflect adjustments made to the net asset values in accordance with accounting principles generally accepted in the United States of America.
The S&P 500 Index (“Index”) is a product of S&P Dow Jones Indices LLC and/or its affiliates and have been licensed for use by the adviser. Copyright © 2023. S&P Dow Jones Indices LLC, a subsidiary of S&P Global, Inc., and/or its affiliates. All rights reserved. Redistribution or reproduction in whole or in part are prohibited without written permission of S&P Dow Jones Indices LLC. For more information on any of S&P Dow Jones Indices LLC’s indices please visit www.spdji.com. S&P® is a registered trademark of Standard & Poor’s Financial Services LLC and Dow Jones® is a registered trademark of Dow Jones Trademark Holdings LLC. Neither S&P Dow Jones Indices LLC, Dow Jones Trademark Holdings LLC, their affiliates nor their third party licensors make any representation or warranty, express or implied, as to the ability of any index to accurately represent the asset class or market sector that it purports to represent and neither S&P Dow Jones Indices LLC, Dow Jones Trademark Holdings LLC, their affiliates nor their third party licensors shall have any liability for any errors, omissions, or interruptions of any index or the data included therein.
| J.P. Morgan Large Cap Funds | |
JPMorgan U.S. Sustainable Leaders Fund
FUND COMMENTARYSIX MONTHS ENDED December 31, 2023 (Unaudited)
| |
| |
| |
Net Assets as of 12/31/2023 (In Thousands) | |
INVESTMENT OBJECTIVE**
The JPMorgan U.S. Sustainable Leaders Fund (the “Fund”) seeks to provide long-term capital appreciation.
WHAT WERE THE MAIN DRIVERS OF THE FUND’S PERFORMANCE?
The Fund’s Class I Shares outperformed the S&P 500 Index (the “Benchmark”) for the six months ended December 31, 2023.
The Fund’s security selection in the industrials and consumer staples sectors was a leading contributor to performance relative to the Benchmark, while the Fund’s security selection in the utilities and information technology sectors was a leading detractor from relative performance.
Leading individual contributors to relative performance included the Fund’s overweight positions in Costco Wholesale Corp., Seagate Technology Holdings Inc. and Union Pacific Corp. Shares of Costco Wholesale, a consumer staples retail chain, rose amid growth in monthly sales and consecutive quarters of better-than-expected earnings. Shares of Seagate Technology Holdings, a data hardware and storage provider, rose amid investor expectations that the company will benefit from increased demand for artificial intelligence technologies. Shares of Union Pacific, freight railroad operator, rose after the company named a new chief executive and reported better-than-expected earnings and revenue for the third quarter of 2023.
Leading individual detractors from relative performance included the Fund’s overweight positions in SolarEdge Technologies Inc., Bristol-Myers Squib Co, and Texas Instruments Inc.
Shares of SolarEdge Technologies, a manufacturer of semiconductor materials and equipment for the solar energy industry, fell amid lower-than-expected reported sales during the period and weakness in the broader solar energy sector. Shares of Bristol-Myers Squibb, a developer and manufacturer of pharmaceuticals, fell after the company reported a decline in sales for the third quarter of 2023, amid increased competition from generic versions of the company’s leading anti-cancer drug. Shares of Texas Instruments, a semiconductor manufacturer, fell after the company reported lower-than-expected revenue for the third quarter of 2023 and issued a weaker-than-expected earnings forecast.
HOW WAS THE FUND POSITIONED?
During the period, the Fund employed a proprietary scoring methodology to invest in companies that the Fund’s portfolio managers believed have attractive environmental, social and governance characteristics and potential for long-term capital appreciation. The Fund’s positioning during the period was a
result of that process.
TOP TEN HOLDINGS OF THE
PORTFOLIO AS OF December 31, 2023 | PERCENT OF
TOTAL
INVESTMENTS |
| | |
| | |
| | |
| | |
| Mastercard, Inc., Class A | |
| | |
| | |
| | |
| | |
| | |
PORTFOLIO COMPOSITION BY SECTOR
AS OF December 31, 2023 | PERCENT OF
TOTAL
INVESTMENTS |
| |
| |
| |
| |
| |
| |
| |
| |
| |
| |
| |
| |
*
The return shown is based on net asset values calculated for shareholder transactions and may differ from the return shown in
| J.P. Morgan Large Cap Funds | |
JPMorgan U.S. Sustainable Leaders Fund
FUND COMMENTARYSIX MONTHS ENDED December 31, 2023 (Unaudited) (continued)
the financial highlights, which reflects adjustments made to the net asset values in accordance with accounting principles generally accepted in the United States of America.
**
The adviser seeks to achieve the Fund’s objective. There can be no guarantee it will be achieved.
| J.P. Morgan Large Cap Funds | |
AVERAGE ANNUAL TOTAL RETURNS AS OF December 31, 2023
|
| |
| Sales Charge for Class A Shares is 5.25%. |
| Assumes a 1% CDSC (contingent deferred sales charge) for the 6 month and one year periods and 0% CDSC thereafter. |
TEN YEAR FUND PERFORMANCE (12/31/13 TO 12/31/23)
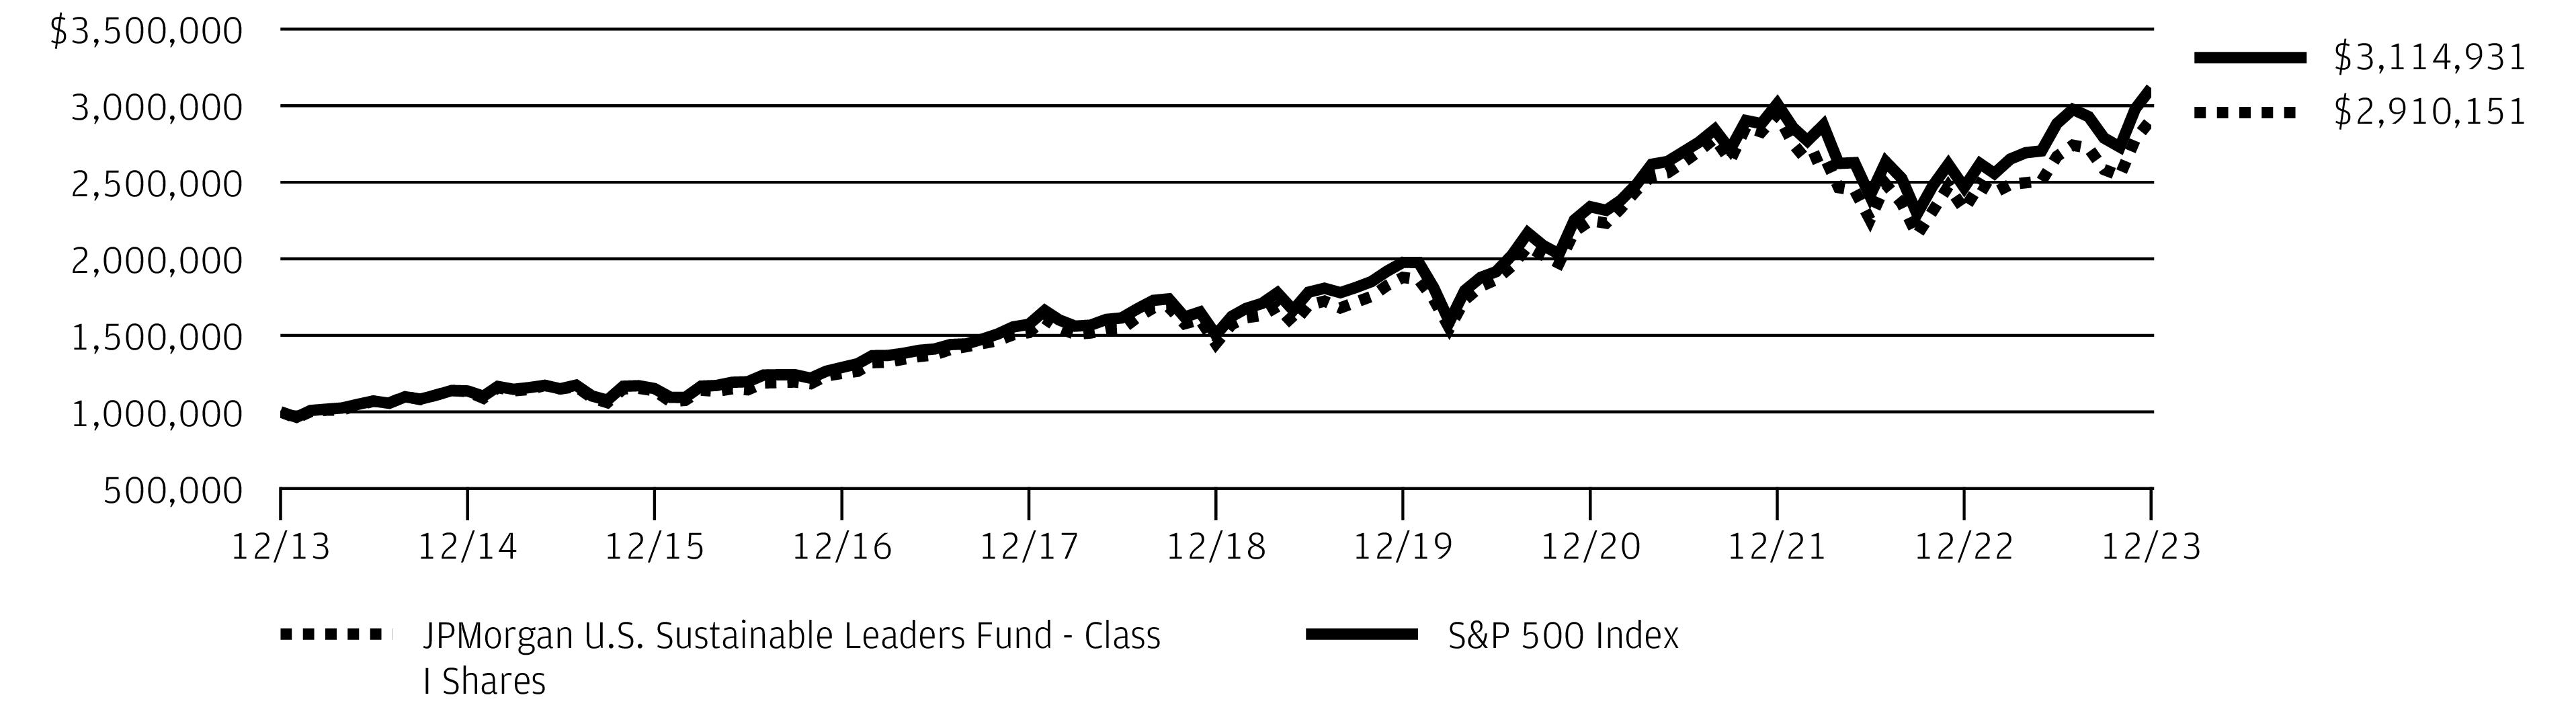
The performance quoted is past performance and is not a guarantee of future results. Mutual funds are subject to certain market risks. Investment returns and principal value of an investment will fluctuate so that an investor’s shares, when redeemed, may be worth more or less than their original cost. Current performance may be higher or lower than the performance data shown. Updated performance information is available by visiting www.jpmorganfunds.com or by calling 1-800-480-4111.
Returns for Class R6 Shares prior to their inception date are based on the performance of Class I Shares. The actual returns of Class R6 Shares would have been different than those shown because Class R6 Shares have different expenses than Class I Shares.
The graph illustrates comparative performance for $1,000,000 invested in Class I Shares of the JPMorgan U.S. Sustainable Leaders Fund and the S&P 500 Index from December 31, 2013 to December 31, 2023. The performance of the Fund assumes reinvestment of all dividends and capital gain distributions, if any, and does not include a sales charge. The performance of the S&P 500 Index does not reflect the deduction of expenses or a sales charge associated with a mutual fund and has been adjusted to reflect reinvestment of all dividends and capital gain distributions of the securities included in the benchmark, if applicable. The S&P 500 Index is an unmanaged index generally representative of the performance of large companies in the U.S. stock market. Investors cannot invest directly in an index.
Class I Shares have a $1,000,000 minimum initial investment.
Fund performance may reflect the waiver of the Fund’s fees and reimbursement of expenses for certain periods. Without these waivers and reimbursements, performance would have been lower. Also, performance shown in this section does not reflect the deduction of taxes that a shareholder would pay on Fund distributions or on gains resulting from redemptions of Fund shares.
Effective November 1, 2016, the Fund changed its investment strategies. Although past performance is not necessarily an indication of how the Fund will perform in the future, in view of these changes, the Fund’s performance record prior to this date might be less relevant for investors considering whether to purchase shares of the Fund.
Because Class C Shares automatically convert to Class A Shares after 8 years, the 10 year average annual total return shown above for Class C Shares reflects Class A Share's performance for the period after conversion.
The returns shown are based on net asset values calculated for shareholder transactions and may differ from the returns shown in the financial highlights, which reflect adjustments made to the net asset values in accordance with accounting principles generally accepted in the United States of America.
The S&P 500 Index (“Index”) is a product of S&P Dow Jones Indices LLC and/or its affiliates and have been licensed for use by the adviser. Copyright © 2023. S&P Dow Jones Indices LLC, a subsidiary of S&P Global, Inc., and/or its affiliates. All rights reserved. Redistribution or reproduction in whole or in part are prohibited without written permission of S&P Dow Jones Indices LLC. For more information on any of S&P Dow Jones Indices LLC’s indices please visit www.spdji.com. S&P® is a registered trademark of Standard & Poor’s Financial Services LLC and Dow Jones® is a registered trademark of Dow Jones Trademark Holdings LLC. Neither S&P Dow Jones Indices LLC, Dow Jones Trademark Holdings LLC, their affiliates nor their third party licensors make any representation or warranty, express or implied, as to the ability of any index to accurately represent the asset class or market sector that it purports to represent and neither S&P Dow Jones Indices LLC, Dow Jones Trademark Holdings LLC, their affiliates nor their third party licensors shall have any liability for any errors, omissions, or interruptions of any index or the data included therein.
| J.P. Morgan Large Cap Funds | |
FUND COMMENTARYSIX MONTHS ENDED December 31, 2023 (Unaudited)
| |
Fund (Class A Shares, without a sales charge) * | |
| |
Net Assets as of 12/31/2023 (In Thousands) | |
INVESTMENT OBJECTIVE**
The JPMorgan U.S. Value Fund (the “Fund”) seeks to provide capital growth over the long term.
WHAT WERE THE MAIN DRIVERS OF THE FUND’S PERFORMANCE?
The Fund’s Class A Shares, without a sales charge, underperformed the Russell 1000 Value Index (the “Benchmark”) for the six months ended December 31, 2023.
The Fund’s security selection in the industrials and materials sectors was a leading detractor from performance relative to the Benchmark, while the Fund’s security selection in the health care and communication services sectors was a leading contributor to relative performance.
Leading individual detractors from relative performance included the Fund’s underweight positions in Intel Corp. and JPMorgan Chase & Co. and its overweight position in Bristol-Myers Squibb Co. Shares of Intel, a semiconductor manufacturer not held in the Fund, rose amid broad demand for artificial intelligence technologies and after the company obtained a $3.2 billion grant from Israel to build a factory there. Shares of JPMorgan Chase, a banking and financial services company that the Fund is prohibited from holding because it is an affiliate, rose amid consecutive quarters of better-than-expected earnings and investor expectations that the company would benefit from lower interest rates in 2024. Shares of Bristol-Myers Squibb, a developer and manufacturer of pharmaceuticals, fell after the company reported a decline in sales for the third quarter of 2023, amid increased competition from generic versions of the company’s leading anti-cancer drug.
Leading individual contributors to relative performance included the Fund’s overweight positions in BlackRock Inc. and Wells Fargo & Co., and its out-of-Benchmark position in Meta Platforms Inc. Shares of BlackRock, a financial services provider, rose amid continued growth in earnings and investor expectations that the company would benefit from lower interest rates in 2024. Shares of Wells Fargo, a diversified bank, rose after the company reported better-than-expected earnings and revenue for the third quarter of 2023 and amid investor expectations that the company would benefit from lower interest rates in 2024. Shares a Meta Platforms, parent of
Facebook and other interactive media services, rose amid investor demand for large cap stocks in the information technology sector during the period.
HOW WAS THE FUND POSITIONED?
The Fund’s portfolio managers focused on stock selection and aimed to invest in undervalued companies with durable franchises, strong management and the ability to grow their intrinsic value per share. The portfolio managers employed a bottom-up approach to security selection and fundamental
research.
TOP TEN HOLDINGS OF THE
PORTFOLIO AS OF December 31, 2023 | PERCENT OF
TOTAL
INVESTMENTS |
| | |
| | |
| | |
| | |
| Berkshire Hathaway, Inc., Class B | |
| | |
| Axalta Coating Systems Ltd. | |
| | |
| | |
| United Parcel Service, Inc., Class B | |
PORTFOLIO COMPOSITION BY SECTOR
AS OF December 31, 2023 | PERCENT OF
TOTAL
INVESTMENTS |
| |
| |
| |
| |
| |
| |
| |
| |
| |
| |
| |
| |
| J.P. Morgan Large Cap Funds | |
*
The return shown is based on net asset values calculated for shareholder transactions and may differ from the return shown in the financial highlights, which reflects adjustments made to the net asset values in accordance with accounting principles generally accepted in the United States of America.
**
The adviser seeks to achieve the Fund’s objective. There can be no guarantee it will be achieved.
| J.P. Morgan Large Cap Funds | |
FUND COMMENTARYSIX MONTHS ENDED December 31, 2023 (Unaudited) (continued)
AVERAGE ANNUAL TOTAL RETURNS AS OF December 31, 2023
|
| |
| Sales Charge for Class A Shares is 5.25%. |
| Assumes a 1% CDSC (contingent deferred sales charge) for the 6 month and one year periods and 0% CDSC thereafter. |
TEN YEAR FUND PERFORMANCE (12/31/13 TO 12/31/23)
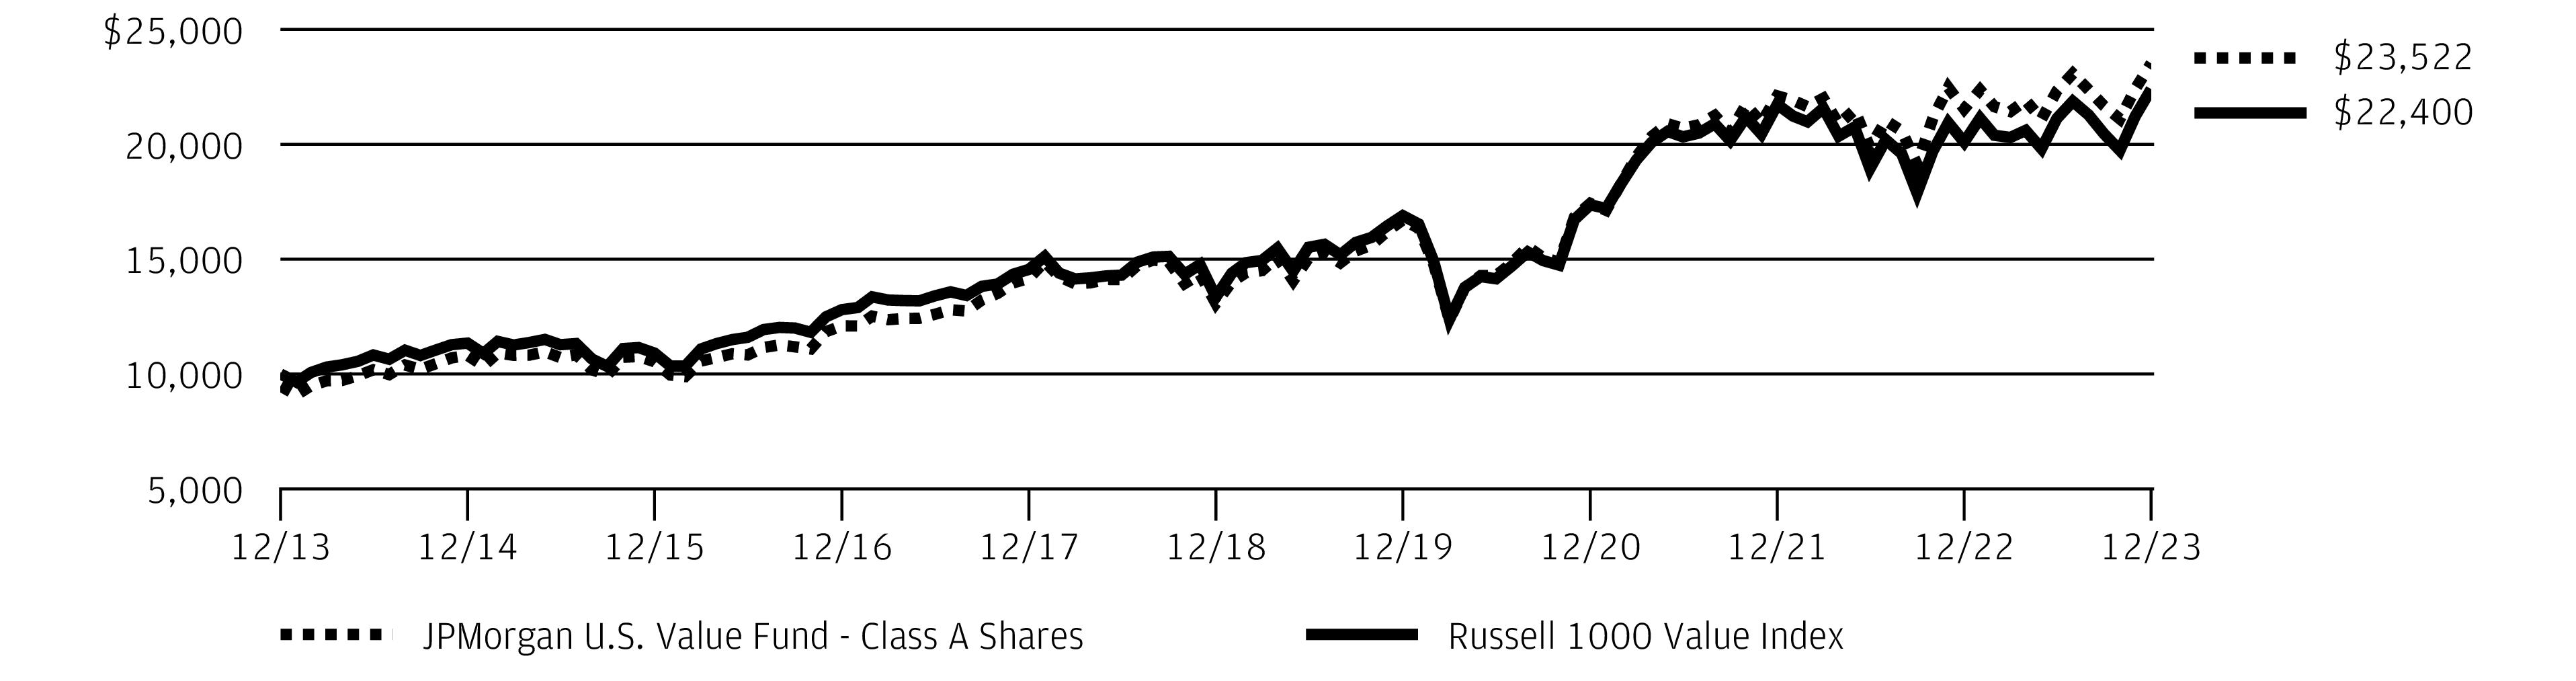
The performance quoted is past performance and is not a guarantee of future results. Mutual funds are subject to certain market risks. Investment returns and principal value of an investment will fluctuate so that an investor’s shares, when redeemed, may be worth more or less than their original cost. Current performance may be higher or lower than the performance data shown. Updated performance information is available by visiting www.jpmorganfunds.com or by calling 1-800-480-4111.
Returns for Class R2 Shares prior to their inception date are based on the performance of Class A Shares. The actual returns of Class R2 Shares would have been lower than those shown because Class R2 Shares have higher expenses than Class A Shares.
Returns for Class R3 Shares prior to their inception date are based on the performance of the Class A Shares. The actual returns of Class R3 Shares would have been similar to those shown because Class R3 Shares have similar expenses to Class A Shares.
Returns for Class R4 Shares prior to their inception date are based on the performance of the Class I Shares. The actual returns of Class R4 Shares would have been similar to those shown because Class R4 Shares have similar expenses to Class I Shares.
Returns for Class R5 and Class R6 Shares prior to their inception date are based on the performance of Class I Shares. The actual returns of Class R5 and Class R6 Shares would have been different than those shown because Class R5 and Class R6 Shares have different expenses than Class I Shares.
The graph illustrates comparative performance for $10,000 invested in Class A Shares of the JPMorgan U.S. Value Fund and the Russell 1000 Value Index from December 31, 2013 to December 31, 2023. The performance of the Fund assumes reinvestment of all dividends and capital gain distributions, if any, and includes a sales charge. The performance of the Russell 1000 Value Index does not reflect the deduction of expenses or a sales charge associated with a mutual fund and has been adjusted to reflect reinvestment of all dividends and capital gain distributions of the securities included in the benchmarks, if applicable. The Russell 1000 Value Index is an unmanaged index, which measures the performance of those Russell 1000 companies with lower price-to-book ratios and lower forecasted growth values. Investors cannot invest directly in an index.
Class A Shares have a $1,000 minimum initial investment and carry a 5.25% sales charge.
Fund performance may reflect the waiver of the Fund’s fees and reimbursement of expenses for certain periods. Without these waivers and reimbursements, performance would have been lower. Also, performance shown in this section does not reflect the deduction of taxes that a shareholder would pay on Fund distributions or on gains resulting from redemptions of Fund shares.
Because Class C Shares automatically convert to Class A Shares after 8 years, the 10 year average annual total return shown above for Class C Shares reflects Class A Share's performance for the period after conversion.
| J.P. Morgan Large Cap Funds | |
The returns shown are based on net asset values calculated for shareholder transactions and may differ from the returns shown in the financial highlights, which reflect adjustments made to the net asset values in accordance with accounting principles generally accepted in the United States of America.
Frank Russell Company is the source and owner of the Russell Index data contained or reflected in this material and all trademarks and copyrights related
thereto. Frank Russell Company is not responsible for the formatting or configuration of this material or for any inaccuracy in the adviser's presentation thereof.
| J.P. Morgan Large Cap Funds | |
JPMorgan Equity Income Fund
SCHEDULE OF PORTFOLIO INVESTMENTSAS OF December 31, 2023 (Unaudited)
| | |
|
Aerospace & Defense — 4.2% |
| | |
| | |
| | |
| | |
Air Freight & Logistics — 1.9% |
United Parcel Service, Inc., Class B | | |
|
| | |
PNC Financial Services Group, Inc. (The) | | |
| | |
| | |
| | |
|
| | |
| | |
| | |
|
| | |
| | |
| | |
|
| | |
Charles Schwab Corp. (The) | | |
| | |
| | |
| | |
|
Air Products and Chemicals, Inc. | | |
| | |
| | |
Commercial Services & Supplies — 0.9% |
| | |
|
| | |
Capital One Financial Corp. | | |
| | |
| | |
|
Consumer Staples Distribution & Retail — 2.3% |
| | |
| | |
| | |
Diversified Telecommunication Services — 0.6% |
Verizon Communications, Inc. | | |
Electric Utilities — 2.2% |
| | |
| | |
| | |
Electrical Equipment — 1.4% |
| | |
Electronic Equipment, Instruments & Components — 0.7% |
| | |
|
| | |
Mondelez International, Inc., Class A | | |
| | |
Ground Transportation — 2.5% |
| | |
| | |
| | |
Health Care Equipment & Supplies — 3.4% |
| | |
Baxter International, Inc. | | |
| | |
| | |
| | |
Health Care Providers & Services — 5.0% |
| | |
| | |
| | |
| | |
| | |
|
| | |
Hotels, Restaurants & Leisure — 2.1% |
| | |
| | |
| | |
SEE NOTES TO FINANCIAL STATEMENTS.
| J.P. Morgan Large Cap Funds | |
| | |
Common Stocks — continued |
Household Products — 1.4% |
Procter & Gamble Co. (The) | | |
|
| | |
|
| | |
| | |
Hartford Financial Services Group, Inc. (The) | | |
Marsh & McLennan Cos., Inc. | | |
| | |
| | |
Travelers Cos., Inc. (The) | | |
| | |
|
| | |
International Business Machines Corp. | | |
| | |
|
| | |
| | |
| | |
| | |
|
| | |
|
| | |
| | |
Public Service Enterprise Group, Inc. | | |
| | |
|
Alexandria Real Estate Equities, Inc. | | |
Oil, Gas & Consumable Fuels — 8.4% |
| | |
| | |
| | |
| | |
| | |
Personal Care Products — 0.6% |
| | |
|
| | |
| | |
|
Pharmaceuticals — continued |
| | |
| | |
| | |
| | |
| | |
|
AvalonBay Communities, Inc. | | |
Semiconductors & Semiconductor Equipment — 5.2% |
| | |
| | |
Microchip Technology, Inc. | | |
NXP Semiconductors NV (China) | | |
| | |
| | |
|
| | |
|
| | |
| | |
| | |
| | |
| | |
Technology Hardware, Storage & Peripherals — 0.9% |
| | |
Seagate Technology Holdings plc | | |
| | |
|
Philip Morris International, Inc. | | |
Total Common Stocks
(Cost $31,704,534) | | |
SEE NOTES TO FINANCIAL STATEMENTS.
| J.P. Morgan Large Cap Funds | |
JPMorgan Equity Income Fund
SCHEDULE OF PORTFOLIO INVESTMENTSAS OF December 31, 2023 (Unaudited) (continued)
| | |
Short-Term Investments — 0.3% |
Investment Companies — 0.3% |
JPMorgan Prime Money Market Fund Class IM Shares, 5.51% (a) (b)
(Cost $145,185) | | |
Total Investments — 100.0%
(Cost $31,849,719) | | |
Liabilities in Excess of Other Assets — (0.0)% ^ | | |
| | |
Percentages indicated are based on net assets. |
| |
| Real Estate Investment Trust |
| Amount rounds to less than 0.1% of net assets. |
| Investment in an affiliated fund, which is registered under the Investment Company Act of 1940, as amended, and is advised by J.P. Morgan Investment Management Inc. | |
| The rate shown is the current yield as of December 31, 2023. | |
SEE NOTES TO FINANCIAL STATEMENTS.
| J.P. Morgan Large Cap Funds | |
JPMorgan Equity Index Fund
SCHEDULE OF PORTFOLIO INVESTMENTSAS OF December 31, 2023 (Unaudited)
| | |
|
Aerospace & Defense — 1.6% |
| | |
| | |
| | |
| | |
Huntington Ingalls Industries, Inc. | | |
L3Harris Technologies, Inc. | | |
| | |
| | |
| | |
| | |
| | |
| | |
Air Freight & Logistics — 0.5% |
CH Robinson Worldwide, Inc. | | |
Expeditors International of Washington, Inc. | | |
| | |
United Parcel Service, Inc., Class B | | |
| | |
Automobile Components — 0.1% |
| | |
| | |
| | |
|
| | |
| | |
| | |
| | |
|
| | |
| | |
Citizens Financial Group, Inc. | | |
| | |
| | |
Huntington Bancshares, Inc. | | |
| | |
| | |
| | |
PNC Financial Services Group, Inc. (The) | | |
| | |
| | |
| | |
| | |
|
|
| | |
| | |
| | |
|
Brown-Forman Corp., Class B (a) | | |
| | |
Constellation Brands, Inc., Class A | | |
| | |
Molson Coors Beverage Co., Class B | | |
| | |
| | |
| | |
|
| | |
| | |
| | |
| | |
| | |
| | |
Regeneron Pharmaceuticals, Inc. * | | |
Vertex Pharmaceuticals, Inc. * | | |
| | |
|
| | |
| | |
| | |
| | |
|
| | |
| | |
Builders FirstSource, Inc. * | | |
| | |
Johnson Controls International plc | | |
| | |
| | |
| | |
|
Ameriprise Financial, Inc. | | |
Bank of New York Mellon Corp. (The) | | |
| | |
| | |
SEE NOTES TO FINANCIAL STATEMENTS.
JPMorgan Equity Index Fund
SCHEDULE OF PORTFOLIO INVESTMENTSAS OF December 31, 2023 (Unaudited) (continued)
| | |
Common Stocks — continued |
Capital Markets — continued |
Cboe Global Markets, Inc. | | |
Charles Schwab Corp. (The) | | |
| | |
FactSet Research Systems, Inc. | | |
| | |
Goldman Sachs Group, Inc. (The) | | |
Intercontinental Exchange, Inc. | | |
| | |
MarketAxess Holdings, Inc. | | |
| | |
| | |
| | |
| | |
| | |
Raymond James Financial, Inc. | | |
| | |
| | |
T. Rowe Price Group, Inc. | | |
| | |
|
Air Products and Chemicals, Inc. | | |
| | |
| | |
CF Industries Holdings, Inc. | | |
| | |
| | |
| | |
| | |
| | |
| | |
International Flavors & Fragrances, Inc. | | |
| | |
LyondellBasell Industries NV, Class A | | |
| | |
| | |
Sherwin-Williams Co. (The) | | |
| | |
Commercial Services & Supplies — 0.6% |
| | |
| | |
| | |
| | |
| | |
|
Commercial Services & Supplies — continued |
| | |
| | |
| | |
Communications Equipment — 0.8% |
| | |
| | |
| | |
| | |
| | |
| | |
Construction & Engineering — 0.1% |
| | |
Construction Materials — 0.2% |
Martin Marietta Materials, Inc. | | |
| | |
| | |
|
| | |
Capital One Financial Corp. | | |
Discover Financial Services | | |
| | |
| | |
Consumer Staples Distribution & Retail — 1.8% |
| | |
| | |
| | |
| | |
| | |
| | |
Walgreens Boots Alliance, Inc. (a) | | |
| | |
| | |
Containers & Packaging — 0.2% |
| | |
| | |
| | |
| | |
Packaging Corp. of America | | |
| | |
| | |
SEE NOTES TO FINANCIAL STATEMENTS.
| | |
Common Stocks — continued |
|
| | |
| | |
| | |
| | |
Diversified Telecommunication Services — 0.7% |
| | |
Verizon Communications, Inc. | | |
| | |
Electric Utilities — 1.5% |
| | |
American Electric Power Co., Inc. | | |
Constellation Energy Corp. | | |
| | |
| | |
| | |
| | |
| | |
| | |
| | |
| | |
| | |
| | |
Pinnacle West Capital Corp. | | |
| | |
| | |
| | |
| | |
Electrical Equipment — 0.6% |
| | |
| | |
| | |
| | |
| | |
Rockwell Automation, Inc. | | |
| | |
Electronic Equipment, Instruments & Components — 0.6% |
| | |
| | |
| | |
| | |
Keysight Technologies, Inc. * | | |
| | |
| | |
|
Electronic Equipment, Instruments & Components — continued |
Teledyne Technologies, Inc. * | | |
| | |
Zebra Technologies Corp., Class A * | | |
| | |
Energy Equipment & Services — 0.4% |
| | |
| | |
| | |
| | |
|
| | |
Live Nation Entertainment, Inc. * | | |
| | |
Take-Two Interactive Software, Inc. * | | |
| | |
Warner Bros Discovery, Inc. * | | |
| | |
Financial Services — 4.1% |
Berkshire Hathaway, Inc., Class B * | | |
Fidelity National Information Services, Inc. | | |
| | |
FleetCor Technologies, Inc. * | | |
| | |
Jack Henry & Associates, Inc. | | |
Mastercard, Inc., Class A | | |
| | |
| | |
| | |
|
Archer-Daniels-Midland Co. | | |
| | |
| | |
| | |
| | |
| | |
| | |
| | |
| | |
| | |
Lamb Weston Holdings, Inc. | | |
McCormick & Co., Inc. (Non-Voting) | | |
SEE NOTES TO FINANCIAL STATEMENTS.
JPMorgan Equity Index Fund
SCHEDULE OF PORTFOLIO INVESTMENTSAS OF December 31, 2023 (Unaudited) (continued)
| | |
Common Stocks — continued |
Food Products — continued |
Mondelez International, Inc., Class A | | |
Tyson Foods, Inc., Class A | | |
| | |
|
| | |
Ground Transportation — 1.1% |
| | |
JB Hunt Transport Services, Inc. | | |
| | |
Old Dominion Freight Line, Inc. | | |
Uber Technologies, Inc. * | | |
| | |
| | |
Health Care Equipment & Supplies — 2.6% |
| | |
| | |
Baxter International, Inc. | | |
| | |
Boston Scientific Corp. * | | |
| | |
| | |
| | |
Edwards Lifesciences Corp. * | | |
GE HealthCare Technologies, Inc. (a) | | |
| | |
IDEXX Laboratories, Inc. * | | |
| | |
Intuitive Surgical, Inc. * | | |
| | |
| | |
| | |
| | |
| | |
Zimmer Biomet Holdings, Inc. | | |
| | |
Health Care Providers & Services — 2.8% |
| | |
| | |
| | |
| | |
| | |
| | |
| | |
|
Health Care Providers & Services — continued |
| | |
| | |
| | |
| | |
Laboratory Corp. of America Holdings | | |
| | |
Molina Healthcare, Inc. * | | |
| | |
| | |
Universal Health Services, Inc., Class B | | |
| | |
|
Healthpeak Properties, Inc. | | |
| | |
| | |
| | |
Hotel & Resort REITs — 0.0% ^ |
Host Hotels & Resorts, Inc. | | |
Hotels, Restaurants & Leisure — 2.2% |
| | |
| | |
Caesars Entertainment, Inc. * | | |
| | |
Chipotle Mexican Grill, Inc. * | | |
| | |
| | |
| | |
Hilton Worldwide Holdings, Inc. | | |
| | |
Marriott International, Inc., Class A | | |
| | |
MGM Resorts International * | | |
Norwegian Cruise Line Holdings Ltd. * (a) | | |
Royal Caribbean Cruises Ltd. * | | |
| | |
| | |
| | |
| | |
Household Durables — 0.4% |
| | |
| | |
| | |
SEE NOTES TO FINANCIAL STATEMENTS.
| | |
Common Stocks — continued |
Household Durables — continued |
Mohawk Industries, Inc. * | | |
| | |
| | |
| | |
| | |
Household Products — 1.2% |
Church & Dwight Co., Inc. | | |
| | |
| | |
| | |
Procter & Gamble Co. (The) | | |
| | |
Independent Power and Renewable Electricity Producers — 0.0% ^ |
| | |
Industrial Conglomerates — 0.8% |
| | |
| | |
Honeywell International, Inc. | | |
| | |
|
| | |
|
| | |
| | |
American International Group, Inc. | | |
| | |
Arch Capital Group Ltd. * | | |
| | |
| | |
| | |
| | |
Cincinnati Financial Corp. | | |
| | |
| | |
Hartford Financial Services Group, Inc. (The) | | |
| | |
Marsh & McLennan Cos., Inc. | | |
| | |
Principal Financial Group, Inc. | | |
| | |
Prudential Financial, Inc. | | |
| | |
|
|
Travelers Cos., Inc. (The) | | |
| | |
| | |
| | |
Interactive Media & Services — 5.8% |
Alphabet, Inc., Class A * | | |
Alphabet, Inc., Class C * | | |
| | |
Meta Platforms, Inc., Class A * | | |
| | |
|
| | |
Akamai Technologies, Inc. * | | |
Cognizant Technology Solutions Corp., Class A | | |
| | |
| | |
International Business Machines Corp. | | |
| | |
| | |
Leisure Products — 0.0% ^ |
| | |
Life Sciences Tools & Services — 1.4% |
Agilent Technologies, Inc. | | |
Bio-Rad Laboratories, Inc., Class A * | | |
| | |
Charles River Laboratories International, Inc. * | | |
| | |
| | |
| | |
Mettler-Toledo International, Inc. * | | |
| | |
Thermo Fisher Scientific, Inc. | | |
| | |
West Pharmaceutical Services, Inc. | | |
| | |
|
| | |
| | |
| | |
| | |
| | |
SEE NOTES TO FINANCIAL STATEMENTS.
JPMorgan Equity Index Fund
SCHEDULE OF PORTFOLIO INVESTMENTSAS OF December 31, 2023 (Unaudited) (continued)
| | |
Common Stocks — continued |
|
| | |
Illinois Tool Works, Inc. | | |
| | |
| | |
| | |
| | |
| | |
| | |
| | |
Stanley Black & Decker, Inc. | | |
Westinghouse Air Brake Technologies Corp. | | |
| | |
| | |
|
Charter Communications, Inc., Class A * | | |
| | |
| | |
| | |
Interpublic Group of Cos., Inc. (The) (a) | | |
| | |
| | |
| | |
Paramount Global, Class B | | |
| | |
|
| | |
| | |
| | |
| | |
| | |
|
| | |
| | |
| | |
Consolidated Edison, Inc. | | |
| | |
| | |
| | |
Public Service Enterprise Group, Inc. | | |
| | |
| | |
| | |
| | |
|
|
Alexandria Real Estate Equities, Inc. (a) | | |
| | |
| | |
Oil, Gas & Consumable Fuels — 3.5% |
| | |
| | |
| | |
| | |
| | |
| | |
| | |
| | |
| | |
| | |
| | |
| | |
| | |
Occidental Petroleum Corp. (a) | | |
| | |
| | |
Pioneer Natural Resources Co. | | |
| | |
| | |
Williams Cos., Inc. (The) | | |
| | |
Passenger Airlines — 0.2% |
American Airlines Group, Inc. * (a) | | |
| | |
| | |
United Airlines Holdings, Inc. * | | |
| | |
Personal Care Products — 0.2% |
Estee Lauder Cos., Inc. (The), Class A | | |
| | |
| | |
|
| | |
| | |
| | |
| | |
| | |
| | |
SEE NOTES TO FINANCIAL STATEMENTS.
| | |
Common Stocks — continued |
Pharmaceuticals — continued |
| | |
| | |
| | |
Professional Services — 0.7% |
Automatic Data Processing, Inc. | | |
Broadridge Financial Solutions, Inc. | | |
Ceridian HCM Holding, Inc. * (a) | | |
| | |
| | |
| | |
| | |
| | |
| | |
| | |
| | |
Real Estate Management & Development — 0.2% |
CBRE Group, Inc., Class A * | | |
| | |
| | |
|
AvalonBay Communities, Inc. | | |
| | |
| | |
Essex Property Trust, Inc. | | |
| | |
Mid-America Apartment Communities, Inc. | | |
| | |
| | |
|
Federal Realty Investment Trust | | |
| | |
| | |
| | |
Simon Property Group, Inc. | | |
| | |
Semiconductors & Semiconductor Equipment — 8.1% |
Advanced Micro Devices, Inc. * | | |
| | |
| | |
| | |
| | |
| | |
|
Semiconductors & Semiconductor Equipment — continued |
| | |
| | |
| | |
| | |
Microchip Technology, Inc. | | |
| | |
Monolithic Power Systems, Inc. | | |
| | |
NXP Semiconductors NV (China) | | |
| | |
| | |
| | |
| | |
| | |
| | |
| | |
|
| | |
| | |
| | |
Cadence Design Systems, Inc. * | | |
| | |
| | |
| | |
| | |
| | |
| | |
Palo Alto Networks, Inc. * | | |
| | |
| | |
| | |
| | |
| | |
Tyler Technologies, Inc. * | | |
| | |
|
| | |
| | |
Digital Realty Trust, Inc. | | |
| | |
Extra Space Storage, Inc. | | |
| | |
| | |
SEE NOTES TO FINANCIAL STATEMENTS.
JPMorgan Equity Index Fund
SCHEDULE OF PORTFOLIO INVESTMENTSAS OF December 31, 2023 (Unaudited) (continued)
| | |
Common Stocks — continued |
Specialized REITs — continued |
| | |
VICI Properties, Inc., Class A | | |
| | |
| | |
|
| | |
| | |
| | |
| | |
| | |
| | |
O'Reilly Automotive, Inc. * | | |
| | |
| | |
| | |
| | |
| | |
Technology Hardware, Storage & Peripherals — 7.3% |
| | |
Hewlett Packard Enterprise Co. | | |
| | |
| | |
Seagate Technology Holdings plc | | |
| | |
| | |
Textiles, Apparel & Luxury Goods — 0.5% |
Lululemon Athletica, Inc. * | | |
| | |
| | |
| | |
| | |
| | |
|
| | |
Philip Morris International, Inc. | | |
| | |
Trading Companies & Distributors — 0.3% |
| | |
| | |
| | |
| | |
| | |
|
|
American Water Works Co., Inc. | | |
Wireless Telecommunication Services — 0.2% |
| | |
Total Common Stocks
(Cost $3,825,996) | | |
| | |
|
Health Care Equipment & Supplies — 0.0% ^ |
ABIOMED, Inc., CVR ‡ *
(Cost $10) | | |
| | |
Short-Term Investments — 1.3% |
Investment Companies — 0.4% |
JPMorgan U.S. Government Money Market Fund Class Institutional Shares, 5.21% (c) (d)
(Cost $38,229) | | |
Investment of Cash Collateral from Securities Loaned — 0.9% |
JPMorgan Securities Lending Money Market Fund Agency SL Class Shares, 5.56% (c) (d) | | |
JPMorgan U.S. Government Money Market Fund Class IM Shares, 5.30% (c) (d) | | |
Total Investment of Cash Collateral from Securities Loaned
(Cost $74,650) | | |
Total Short-Term Investments
(Cost $112,879) | | |
Total Investments — 100.8%
(Cost $3,938,885) | | |
Liabilities in Excess of Other Assets — (0.8)% | | |
| | |
Percentages indicated are based on net assets. |
| |
| |
| Real Estate Investment Trust |
| Amount rounds to less than 0.1% of net assets. |
| Value determined using significant unobservable inputs. | |
SEE NOTES TO FINANCIAL STATEMENTS.
| Non-income producing security. | |
| The security or a portion of this security is on loan at December 31, 2023. The total value of securities on loan at December 31, 2023 is $72,467. | |
| Investment in affiliate. This security is included in an index in which the Fund, as an index fund, tracks. | |
| Investment in an affiliated fund, which is registered under the Investment Company Act of 1940, as amended, and is advised by J.P. Morgan Investment Management Inc. | |
| The rate shown is the current yield as of December 31, 2023. | |
Futures contracts outstanding as of December 31, 2023 (amounts in thousands, except number of contracts):
| | | | | VALUE AND
UNREALIZED
APPRECIATION
(DEPRECIATION) ($) |
| | | | | |
| | | | | |
SEE NOTES TO FINANCIAL STATEMENTS.
JPMorgan Equity Premium Income Fund
SCHEDULE OF PORTFOLIO INVESTMENTSAS OF December 31, 2023 (Unaudited)
| | |
|
Aerospace & Defense — 1.3% |
| | |
| | |
| | |
| | |
Air Freight & Logistics — 1.5% |
| | |
United Parcel Service, Inc., Class B | | |
| | |
|
| | |
|
| | |
| | |
| | |
| | |
|
| | |
| | |
Regeneron Pharmaceuticals, Inc. * | | |
Vertex Pharmaceuticals, Inc. * | | |
| | |
|
| | |
|
| | |
|
| | |
Intercontinental Exchange, Inc. | | |
| | |
| | |
|
Air Products and Chemicals, Inc. | | |
| | |
| | |
LyondellBasell Industries NV, Class A | | |
| | |
Commercial Services & Supplies — 0.0% ^ |
| | |
| | |
|
Communications Equipment — 0.2% |
| | |
|
| | |
Consumer Staples Distribution & Retail — 2.4% |
| | |
| | |
| | |
| | |
Electric Utilities — 2.1% |
| | |
| | |
| | |
| | |
Electrical Equipment — 1.2% |
| | |
Electronic Equipment, Instruments & Components — 0.6% |
Keysight Technologies, Inc. * | | |
Financial Services — 5.0% |
Berkshire Hathaway, Inc., Class B * | | |
FleetCor Technologies, Inc. * | | |
Jack Henry & Associates, Inc. | | |
Mastercard, Inc., Class A | | |
| | |
| | |
|
| | |
Mondelez International, Inc., Class A | | |
| | |
Ground Transportation — 2.5% |
| | |
| | |
Old Dominion Freight Line, Inc. | | |
| | |
| | |
Health Care Equipment & Supplies — 1.0% |
| | |
Boston Scientific Corp. * | | |
| | |
| | |
SEE NOTES TO FINANCIAL STATEMENTS.
| J.P. Morgan Large Cap Funds | |
| | |
Common Stocks — continued |
Health Care Providers & Services — 2.5% |
| | |
| | |
| | |
| | |
| | |
Hotels, Restaurants & Leisure — 3.3% |
| | |
Chipotle Mexican Grill, Inc. * | | |
| | |
| | |
Household Products — 3.2% |
Church & Dwight Co., Inc. | | |
| | |
| | |
Procter & Gamble Co. (The) | | |
| | |
Industrial Conglomerates — 1.3% |
Honeywell International, Inc. | | |
|
| | |
|
| | |
| | |
| | |
Travelers Cos., Inc. (The) | | |
| | |
Interactive Media & Services — 2.6% |
Alphabet, Inc., Class A * | | |
Meta Platforms, Inc., Class A * | | |
| | |
|
| | |
Cognizant Technology Solutions Corp., Class A | | |
| | |
| | |
Life Sciences Tools & Services — 1.1% |
| | |
Thermo Fisher Scientific, Inc. | | |
| | |
| | |
|
|
| | |
| | |
| | |
| | |
|
Charter Communications, Inc., Class A * | | |
| | |
| | |
|
| | |
| | |
| | |
Public Service Enterprise Group, Inc. | | |
| | |
Oil, Gas & Consumable Fuels — 2.5% |
| | |
| | |
| | |
| | |
Personal Care Products — 0.2% |
| | |
|
| | |
| | |
| | |
| | |
| | |
|
| | |
| | |
| | |
Semiconductors & Semiconductor Equipment — 4.3% |
| | |
ASML Holding NV (Registered), NYRS (Netherlands) | | |
NXP Semiconductors NV (China) | | |
| | |
| | |
|
| | |
| | |
SEE NOTES TO FINANCIAL STATEMENTS.
| J.P. Morgan Large Cap Funds | |
JPMorgan Equity Premium Income Fund
SCHEDULE OF PORTFOLIO INVESTMENTSAS OF December 31, 2023 (Unaudited) (continued)
| | |
Common Stocks — continued |
|
Cadence Design Systems, Inc. * | | |
| | |
| | |
| | |
| | |
| | |
|
| | |
| | |
| | |
| | |
|
| | |
| | |
Burlington Stores, Inc. * | | |
| | |
O'Reilly Automotive, Inc. * | | |
| | |
| | |
Technology Hardware, Storage & Peripherals — 0.3% |
| | |
Seagate Technology Holdings plc | | |
| | |
|
| | |
Philip Morris International, Inc. | | |
| | |
Trading Companies & Distributors — 0.1% |
| | |
Total Common Stocks
(Cost $4,246,100) | | |
| | |
Equity-Linked Notes — 13.6% |
BNP Paribas, ELN, 40.46%, 1/9/2024, (linked to S&P 500 Index) (b) | | |
BNP Paribas, ELN, 41.73%, 1/26/2024, (linked to S&P 500 Index) (b) | | |
BNP Paribas, ELN, 42.35%, 1/17/2024, (linked to S&P 500 Index) (b) | | |
| | |
|
BNP Paribas, ELN, 43.63%, 2/2/2024, (linked to S&P 500 Index) (b) | | |
BofA Finance LLC, ELN, 43.80%, 1/12/2024, (linked to S&P 500 Index) (b) | | |
Canadian Imperial Bank of Commerce, ELN, 42.13%, 2/5/2024, (linked to S&P 500 Index) (Canada) (b) | | |
Goldman Sachs & Co. LLC, ELN, 43.53%, 1/16/2024, (linked to S&P 500 Index) (b) | | |
Goldman Sachs & Co. LLC, ELN, 46.45%, 1/30/2024, (linked to S&P 500 Index) (b) | | |
Royal Bank of Canada, ELN, 47.51%,1/29/2024, (linked to S&P 500 Index) (Canada) (b) | | |
Societe Generale, ELN, 38.15%, 1/5/2024, (linked to S&P 500 Index) (France) (b) | | |
Societe Generale, ELN, 38.94%, 1/19/2024, (linked to S&P 500 Index) (b) | | |
Societe Generale, ELN, 40.12%, 1/8/2024, (linked to S&P 500 Index) (France) (b) | | |
The Bank of Nova Scotia, ELN, 42.11%, 2/6/2024, (linked to S&P 500 Index) (Canada) (b) | | |
UBS Securities LLC, ELN, 37.72%, 1/22/2024, (linked to S&P 500 Index) (Switzerland) (b) | | |
UBS Securities LLC, ELN, 38.46%, 1/23/2024, (linked to S&P 500 Index) (Switzerland) (b) | | |
Total Equity-Linked Notes
(Cost $834,981) | | |
| | |
Short-Term Investments — 1.2% |
Investment of Cash Collateral from Securities Loaned — 1.2% |
JPMorgan Securities Lending Money Market Fund Agency SL Class Shares, 5.56% (c) (d) | | |
JPMorgan U.S. Government Money Market Fund Class IM Shares, 5.30% (c) (d) | | |
Total Investment of Cash Collateral from Securities Loaned
(Cost $70,337) | | |
Total Investments — 100.2%
(Cost $5,151,418) | | |
Liabilities in Excess of Other Assets — (0.2)% | | |
| | |
Percentages indicated are based on net assets. |
SEE NOTES TO FINANCIAL STATEMENTS.
| J.P. Morgan Large Cap Funds | |
| |
| |
| |
| Real Estate Investment Trust |
| Amount rounds to less than 0.1% of net assets. |
| Non-income producing security. | |
| The security or a portion of this security is on loan at December 31, 2023. The total value of securities on loan at December 31, 2023 is $68,920. | |
| Securities exempt from registration under Rule 144A or section 4(a)(2), of the Securities Act of 1933, as amended. | |
| Investment in an affiliated fund, which is registered under the Investment Company Act of 1940, as amended, and is advised by J.P. Morgan Investment Management Inc. | |
| The rate shown is the current yield as of December 31, 2023. | |
Futures contracts outstanding as of December 31, 2023 (amounts in thousands, except number of contracts):
| | | | | VALUE AND
UNREALIZED
APPRECIATION
(DEPRECIATION) ($) |
| | | | | |
| | | | | |
SEE NOTES TO FINANCIAL STATEMENTS.
| J.P. Morgan Large Cap Funds | |
JPMorgan Hedged Equity Fund
SCHEDULE OF PORTFOLIO INVESTMENTSAS OF December 31, 2023 (Unaudited)
| | |
|
Aerospace & Defense — 1.4% |
| | |
| | |
| | |
| | |
Air Freight & Logistics — 1.1% |
| | |
United Parcel Service, Inc., Class B | | |
| | |
Automobile Components — 0.2% |
| | |
| | |
| | |
|
| | |
|
| | |
| | |
| | |
| | |
| | |
| | |
|
| | |
Constellation Brands, Inc., Class A | | |
| | |
| | |
| | |
|
| | |
| | |
BioMarin Pharmaceutical, Inc. * | | |
Neurocrine Biosciences, Inc. * | | |
Regeneron Pharmaceuticals, Inc. * | | |
Sarepta Therapeutics, Inc. * | | |
Vertex Pharmaceuticals, Inc. * | | |
| | |
|
| | |
| | |
|
|
| | |
| | |
| | |
|
| | |
Charles Schwab Corp. (The) | | |
| | |
Goldman Sachs Group, Inc. (The) | | |
Intercontinental Exchange, Inc. | | |
| | |
| | |
| | |
|
Air Products and Chemicals, Inc. | | |
| | |
| | |
| | |
LyondellBasell Industries NV, Class A | | |
| | |
| | |
Commercial Services & Supplies — 0.1% |
| | |
Communications Equipment — 0.2% |
| | |
|
| | |
Consumer Staples Distribution & Retail — 2.1% |
Costco Wholesale Corp. (a) | | |
| | |
| | |
| | |
| | |
|
| | |
Electric Utilities — 1.9% |
Constellation Energy Corp. | | |
| | |
| | |
| | |
| | |
SEE NOTES TO FINANCIAL STATEMENTS.
| J.P. Morgan Large Cap Funds | |
| | |
Common Stocks — continued |
Electrical Equipment — 0.6% |
| | |
Electronic Equipment, Instruments & Components — 0.3% |
| | |
Keysight Technologies, Inc. * | | |
| | |
Energy Equipment & Services — 0.1% |
| | |
|
| | |
Warner Bros Discovery, Inc. * | | |
| | |
Financial Services — 4.7% |
Berkshire Hathaway, Inc., Class B * (a) | | |
| | |
| | |
FleetCor Technologies, Inc. * | | |
Mastercard, Inc., Class A (a) | | |
| | |
| | |
|
Mondelez International, Inc., Class A (a) | | |
Ground Transportation — 1.1% |
| | |
Norfolk Southern Corp. (a) | | |
Uber Technologies, Inc. * | | |
| | |
| | |
Health Care Equipment & Supplies — 2.3% |
Baxter International, Inc. | | |
| | |
Boston Scientific Corp. * (a) | | |
| | |
Intuitive Surgical, Inc. * | | |
| | |
| | |
| | |
Health Care Providers & Services — 2.8% |
| | |
| | |
| | |
| | |
|
Health Care Providers & Services — continued |
| | |
| | |
UnitedHealth Group, Inc. (a) | | |
| | |
|
| | |
| | |
| | |
Hotels, Restaurants & Leisure — 2.7% |
Booking Holdings, Inc. * (a) | | |
Chipotle Mexican Grill, Inc. * | | |
| | |
Marriott International, Inc., Class A | | |
Royal Caribbean Cruises Ltd. * | | |
| | |
| | |
Household Durables — 0.3% |
| | |
| | |
| | |
Household Products — 0.8% |
Church & Dwight Co., Inc. | | |
Procter & Gamble Co. (The) (a) | | |
| | |
Industrial Conglomerates — 1.1% |
Honeywell International, Inc. (a) | | |
|
| | |
|
| | |
| | |
| | |
| | |
Progressive Corp. (The) (a) | | |
Travelers Cos., Inc. (The) | | |
| | |
Interactive Media & Services — 5.8% |
Alphabet, Inc., Class A * (a) | | |
SEE NOTES TO FINANCIAL STATEMENTS.
| J.P. Morgan Large Cap Funds | |
JPMorgan Hedged Equity Fund
SCHEDULE OF PORTFOLIO INVESTMENTSAS OF December 31, 2023 (Unaudited) (continued)
| | |
Common Stocks — continued |
Interactive Media & Services — continued |
Alphabet, Inc., Class C * (a) | | |
Meta Platforms, Inc., Class A * (a) | | |
| | |
|
| | |
Cognizant Technology Solutions Corp., Class A | | |
| | |
Life Sciences Tools & Services — 1.3% |
| | |
Thermo Fisher Scientific, Inc. (a) | | |
| | |
|
| | |
| | |
| | |
| | |
| | |
|
Charter Communications, Inc., Class A * (a) | | |
Comcast Corp., Class A (a) | | |
Liberty Media Corp-Liberty SiriusXM, Class A * | | |
| | |
|
| | |
|
| | |
Public Service Enterprise Group, Inc. | | |
| | |
Oil, Gas & Consumable Fuels — 3.7% |
| | |
| | |
| | |
| | |
| | |
| | |
| | |
Passenger Airlines — 0.1% |
| | |
| | |
|
Personal Care Products — 0.3% |
| | |
|
Bristol-Myers Squibb Co. (a) | | |
| | |
| | |
| | |
| | |
Professional Services — 0.2% |
| | |
|
Equity LifeStyle Properties, Inc. | | |
| | |
| | |
| | |
Semiconductors & Semiconductor Equipment — 8.7% |
Advanced Micro Devices, Inc. * (a) | | |
| | |
| | |
| | |
| | |
NXP Semiconductors NV (China) | | |
| | |
| | |
Texas Instruments, Inc. (a) | | |
| | |
|
| | |
Cadence Design Systems, Inc. * | | |
| | |
| | |
| | |
| | |
| | |
|
Digital Realty Trust, Inc. | | |
| | |
| | |
|
| | |
| | |
SEE NOTES TO FINANCIAL STATEMENTS.
| J.P. Morgan Large Cap Funds | |
| | |
Common Stocks — continued |
Specialty Retail — continued |
| | |
Burlington Stores, Inc. * | | |
| | |
O'Reilly Automotive, Inc. * | | |
| | |
| | |
Technology Hardware, Storage & Peripherals — 7.2% |
| | |
Seagate Technology Holdings plc | | |
| | |
|
| | |
Philip Morris International, Inc. | | |
| | |
Trading Companies & Distributors — 0.2% |
| | |
Wireless Telecommunication Services — 0.2% |
| | |
Total Common Stocks
(Cost $10,276,522) | | |
| | |
|
Put Options Purchased — 0.8% |
| | |
3/28/2024 at USD 4,510.00 , European Style | | |
| | |
|
|
Notional Amount: USD 16,869,935 | | |
Counterparty: Exchange-Traded *
(Cost $141,826) | | |
| | |
Short-Term Investments — 3.8% |
Investment Companies — 3.8% |
JPMorgan U.S. Government Money Market Fund Class Institutional Shares, 5.21% (b) (c)
(Cost $648,540) | | |
Total Investments — 103.1%
(Cost $11,066,888) | | |
Liabilities in Excess of Other Assets — (3.1)% | | |
| | |
Percentages indicated are based on net assets. |
| |
| Real Estate Investment Trust |
| |
| Non-income producing security. |
| All or a portion of the security is segregated for options written. |
| Investment in an affiliated fund, which is registered under the Investment Company Act of 1940, as amended, and is advised by J.P. Morgan Investment Management Inc. |
| The rate shown is the current yield as of December 31, 2023. |
Futures contracts outstanding as of December 31, 2023 (amounts in thousands, except number of contracts):
| | | | | VALUE AND
UNREALIZED
APPRECIATION
(DEPRECIATION) ($) |
| | | | | |
| | | | | |
SEE NOTES TO FINANCIAL STATEMENTS.
| J.P. Morgan Large Cap Funds | |
JPMorgan Hedged Equity Fund
SCHEDULE OF PORTFOLIO INVESTMENTSAS OF December 31, 2023 (Unaudited) (continued)
Written Call Options Contracts as of December 31, 2023 (amounts in thousands, except number of contracts):
|
| | | | | | |
| | | | | | |
Written Put Options Contracts as of December 31, 2023 (amounts in thousands, except number of contracts):
|
| | | | | | |
| | | | | | |
Total Written Options Contracts (Premiums Received $142,427) | |
SEE NOTES TO FINANCIAL STATEMENTS.
| J.P. Morgan Large Cap Funds | |
JPMorgan Hedged Equity 2 Fund
SCHEDULE OF PORTFOLIO INVESTMENTSAS OF December 31, 2023 (Unaudited)
| | |
|
Aerospace & Defense — 1.5% |
| | |
| | |
| | |
| | |
Air Freight & Logistics — 1.2% |
| | |
United Parcel Service, Inc., Class B | | |
| | |
Automobile Components — 0.2% |
| | |
| | |
| | |
|
| | |
|
| | |
| | |
| | |
| | |
| | |
| | |
|
| | |
Constellation Brands, Inc., Class A | | |
| | |
| | |
| | |
|
| | |
| | |
BioMarin Pharmaceutical, Inc. * | | |
Neurocrine Biosciences, Inc. * | | |
Regeneron Pharmaceuticals, Inc. * | | |
Sarepta Therapeutics, Inc. * | | |
Vertex Pharmaceuticals, Inc. * | | |
| | |
|
| | |
| | |
|
|
| | |
| | |
| | |
|
| | |
Charles Schwab Corp. (The) | | |
| | |
Goldman Sachs Group, Inc. (The) | | |
Intercontinental Exchange, Inc. | | |
| | |
| | |
| | |
|
Air Products and Chemicals, Inc. | | |
| | |
| | |
| | |
LyondellBasell Industries NV, Class A | | |
| | |
| | |
Commercial Services & Supplies — 0.1% |
| | |
Communications Equipment — 0.2% |
| | |
|
| | |
Consumer Staples Distribution & Retail — 2.2% |
| | |
| | |
| | |
| | |
| | |
|
| | |
Electric Utilities — 2.1% |
Constellation Energy Corp. | | |
| | |
| | |
| | |
| | |
SEE NOTES TO FINANCIAL STATEMENTS.
| J.P. Morgan Large Cap Funds | |
JPMorgan Hedged Equity 2 Fund
SCHEDULE OF PORTFOLIO INVESTMENTSAS OF December 31, 2023 (Unaudited) (continued)
| | |
Common Stocks — continued |
Electrical Equipment — 0.7% |
| | |
Electronic Equipment, Instruments & Components — 0.4% |
| | |
Keysight Technologies, Inc. * | | |
| | |
Energy Equipment & Services — 0.1% |
| | |
|
| | |
Warner Bros Discovery, Inc. * | | |
| | |
Financial Services — 5.1% |
Berkshire Hathaway, Inc., Class B * (a) | | |
| | |
| | |
FleetCor Technologies, Inc. * | | |
Mastercard, Inc., Class A (a) | | |
| | |
| | |
|
Mondelez International, Inc., Class A | | |
Ground Transportation — 1.2% |
| | |
| | |
Uber Technologies, Inc. * | | |
| | |
| | |
Health Care Equipment & Supplies — 2.5% |
Baxter International, Inc. | | |
| | |
Boston Scientific Corp. * | | |
| | |
Intuitive Surgical, Inc. * | | |
| | |
| | |
| | |
Health Care Providers & Services — 3.0% |
| | |
| | |
| | |
| | |
|
Health Care Providers & Services — continued |
| | |
| | |
UnitedHealth Group, Inc. (a) | | |
| | |
|
| | |
| | |
| | |
Hotels, Restaurants & Leisure — 2.9% |
| | |
Chipotle Mexican Grill, Inc. * | | |
| | |
Marriott International, Inc., Class A | | |
Royal Caribbean Cruises Ltd. * | | |
| | |
| | |
Household Durables — 0.3% |
| | |
| | |
| | |
Household Products — 0.9% |
Church & Dwight Co., Inc. | | |
Procter & Gamble Co. (The) | | |
| | |
Industrial Conglomerates — 1.1% |
Honeywell International, Inc. | | |
|
| | |
|
| | |
| | |
| | |
| | |
| | |
Travelers Cos., Inc. (The) | | |
| | |
Interactive Media & Services — 6.3% |
Alphabet, Inc., Class A * (a) | | |
SEE NOTES TO FINANCIAL STATEMENTS.
| J.P. Morgan Large Cap Funds | |
| | |
Common Stocks — continued |
Interactive Media & Services — continued |
Alphabet, Inc., Class C * (a) | | |
Meta Platforms, Inc., Class A * (a) | | |
| | |
|
| | |
Cognizant Technology Solutions Corp., Class A | | |
| | |
Life Sciences Tools & Services — 1.4% |
| | |
Thermo Fisher Scientific, Inc. | | |
| | |
|
| | |
| | |
| | |
| | |
| | |
|
Charter Communications, Inc., Class A * | | |
| | |
Liberty Media Corp-Liberty SiriusXM, Class A * | | |
| | |
|
| | |
|
| | |
Public Service Enterprise Group, Inc. | | |
| | |
Oil, Gas & Consumable Fuels — 4.1% |
| | |
| | |
| | |
| | |
| | |
| | |
| | |
Passenger Airlines — 0.1% |
| | |
| | |
|
Personal Care Products — 0.3% |
| | |
|
| | |
| | |
| | |
| | |
| | |
Professional Services — 0.2% |
| | |
|
Equity LifeStyle Properties, Inc. | | |
| | |
| | |
| | |
Semiconductors & Semiconductor Equipment — 9.4% |
Advanced Micro Devices, Inc. * | | |
| | |
| | |
| | |
| | |
NXP Semiconductors NV (China) | | |
| | |
| | |
| | |
| | |
|
| | |
Cadence Design Systems, Inc. * | | |
| | |
| | |
| | |
| | |
| | |
|
Digital Realty Trust, Inc. | | |
| | |
| | |
|
| | |
| | |
SEE NOTES TO FINANCIAL STATEMENTS.
| J.P. Morgan Large Cap Funds | |
JPMorgan Hedged Equity 2 Fund
SCHEDULE OF PORTFOLIO INVESTMENTSAS OF December 31, 2023 (Unaudited) (continued)
| | |
Common Stocks — continued |
Specialty Retail — continued |
| | |
Burlington Stores, Inc. * | | |
| | |
O'Reilly Automotive, Inc. * | | |
| | |
| | |
Technology Hardware, Storage & Peripherals — 7.8% |
| | |
Seagate Technology Holdings plc | | |
| | |
|
| | |
Philip Morris International, Inc. | | |
| | |
Trading Companies & Distributors — 0.2% |
| | |
Wireless Telecommunication Services — 0.2% |
| | |
Total Common Stocks
(Cost $3,990,020) | | |
| | |
Options Purchased — 0.0% ^ |
Put Options Purchased — 0.0% ^ |
| | |
1/31/2024 at USD 3,965.00 , European Style | | |
Notional Amount: USD 5,038,848 | | |
| | |
|
|
Counterparty: Exchange-Traded *
(Cost $62,967) | | |
| | |
Short-Term Investments — 1.7% |
Investment Companies — 1.7% |
JPMorgan U.S. Government Money Market Fund Class IM Shares, 5.30% (b) (c)
(Cost $78,904) | | |
Total Investments — 108.4%
(Cost $4,131,891) | | |
Liabilities in Excess of Other Assets — (8.4)% | | |
| | |
Percentages indicated are based on net assets. |
| |
| Real Estate Investment Trust |
| |
| Amount rounds to less than 0.1% of net assets. |
| Non-income producing security. | |
| All or a portion of the security is segregated for options written. | |
| Investment in an affiliated fund, which is registered under the Investment Company Act of 1940, as amended, and is advised by J.P. Morgan Investment Management Inc. | |
| The rate shown is the current yield as of December 31, 2023. | |
Futures contracts outstanding as of December 31, 2023 (amounts in thousands, except number of contracts):
| | | | | VALUE AND
UNREALIZED
APPRECIATION
(DEPRECIATION) ($) |
| | | | | |
| | | | | |
SEE NOTES TO FINANCIAL STATEMENTS.
| J.P. Morgan Large Cap Funds | |
Written Call Options Contracts as of December 31, 2023 (amounts in thousands, except number of contracts):
|
| | | | | | |
| | | | | | |
Written Put Options Contracts as of December 31, 2023 (amounts in thousands, except number of contracts):
|
| | | | | | |
| | | | | | |
Total Written Options Contracts (Premiums Received $62,039) | |
SEE NOTES TO FINANCIAL STATEMENTS.
| J.P. Morgan Large Cap Funds | |
JPMorgan Hedged Equity 3 Fund
SCHEDULE OF PORTFOLIO INVESTMENTSAS OF December 31, 2023 (Unaudited)
| | |
|
Aerospace & Defense — 1.4% |
| | |
| | |
| | |
| | |
Air Freight & Logistics — 1.1% |
| | |
United Parcel Service, Inc., Class B | | |
| | |
Automobile Components — 0.2% |
| | |
| | |
| | |
|
| | |
|
| | |
| | |
| | |
| | |
| | |
| | |
|
| | |
Constellation Brands, Inc., Class A | | |
| | |
| | |
| | |
|
| | |
| | |
BioMarin Pharmaceutical, Inc. * | | |
Neurocrine Biosciences, Inc. * | | |
Regeneron Pharmaceuticals, Inc. * | | |
Sarepta Therapeutics, Inc. * | | |
Vertex Pharmaceuticals, Inc. * | | |
| | |
|
| | |
| | |
|
|
| | |
| | |
| | |
|
| | |
Charles Schwab Corp. (The) | | |
| | |
Goldman Sachs Group, Inc. (The) | | |
Intercontinental Exchange, Inc. | | |
| | |
| | |
| | |
|
Air Products and Chemicals, Inc. | | |
| | |
| | |
| | |
LyondellBasell Industries NV, Class A | | |
| | |
| | |
Commercial Services & Supplies — 0.1% |
| | |
Communications Equipment — 0.2% |
| | |
|
| | |
Consumer Staples Distribution & Retail — 2.1% |
| | |
| | |
| | |
| | |
| | |
|
| | |
Electric Utilities — 2.0% |
Constellation Energy Corp. | | |
| | |
| | |
| | |
| | |
SEE NOTES TO FINANCIAL STATEMENTS.
| J.P. Morgan Large Cap Funds | |
| | |
Common Stocks — continued |
Electrical Equipment — 0.7% |
| | |
Electronic Equipment, Instruments & Components — 0.4% |
| | |
Keysight Technologies, Inc. * | | |
| | |
Energy Equipment & Services — 0.1% |
| | |
|
| | |
Warner Bros Discovery, Inc. * | | |
| | |
Financial Services — 4.8% |
Berkshire Hathaway, Inc., Class B * | | |
| | |
| | |
FleetCor Technologies, Inc. * | | |
Mastercard, Inc., Class A | | |
| | |
| | |
|
Mondelez International, Inc., Class A | | |
Ground Transportation — 1.1% |
| | |
| | |
Uber Technologies, Inc. * | | |
| | |
| | |
Health Care Equipment & Supplies — 2.4% |
Baxter International, Inc. | | |
| | |
Boston Scientific Corp. * | | |
| | |
Intuitive Surgical, Inc. * | | |
| | |
| | |
| | |
Health Care Providers & Services — 2.9% |
| | |
| | |
| | |
| | |
|
Health Care Providers & Services — continued |
| | |
| | |
| | |
| | |
|
| | |
| | |
| | |
Hotels, Restaurants & Leisure — 2.8% |
| | |
Chipotle Mexican Grill, Inc. * | | |
| | |
Marriott International, Inc., Class A | | |
Royal Caribbean Cruises Ltd. * | | |
| | |
| | |
Household Durables — 0.3% |
| | |
| | |
| | |
Household Products — 0.8% |
Church & Dwight Co., Inc. | | |
Procter & Gamble Co. (The) | | |
| | |
Industrial Conglomerates — 1.1% |
Honeywell International, Inc. | | |
|
| | |
|
| | |
| | |
| | |
| | |
| | |
Travelers Cos., Inc. (The) | | |
| | |
Interactive Media & Services — 6.0% |
Alphabet, Inc., Class A * | | |
SEE NOTES TO FINANCIAL STATEMENTS.
| J.P. Morgan Large Cap Funds | |
JPMorgan Hedged Equity 3 Fund
SCHEDULE OF PORTFOLIO INVESTMENTSAS OF December 31, 2023 (Unaudited) (continued)
| | |
Common Stocks — continued |
Interactive Media & Services — continued |
Alphabet, Inc., Class C * | | |
Meta Platforms, Inc., Class A * (a) | | |
| | |
|
| | |
Cognizant Technology Solutions Corp., Class A | | |
| | |
Life Sciences Tools & Services — 1.3% |
| | |
Thermo Fisher Scientific, Inc. | | |
| | |
|
| | |
| | |
| | |
| | |
| | |
|
Charter Communications, Inc., Class A * | | |
| | |
Liberty Media Corp-Liberty SiriusXM, Class A * | | |
| | |
|
| | |
|
| | |
Public Service Enterprise Group, Inc. | | |
| | |
Oil, Gas & Consumable Fuels — 3.9% |
| | |
| | |
| | |
| | |
| | |
| | |
| | |
Passenger Airlines — 0.1% |
| | |
| | |
|
Personal Care Products — 0.3% |
| | |
|
| | |
| | |
| | |
| | |
| | |
Professional Services — 0.2% |
| | |
|
Equity LifeStyle Properties, Inc. | | |
| | |
| | |
| | |
Semiconductors & Semiconductor Equipment — 8.9% |
Advanced Micro Devices, Inc. * | | |
| | |
| | |
| | |
| | |
NXP Semiconductors NV (China) | | |
| | |
| | |
| | |
| | |
|
| | |
Cadence Design Systems, Inc. * | | |
| | |
| | |
| | |
| | |
| | |
|
Digital Realty Trust, Inc. | | |
| | |
| | |
|
| | |
| | |
SEE NOTES TO FINANCIAL STATEMENTS.
| J.P. Morgan Large Cap Funds | |
| | |
Common Stocks — continued |
Specialty Retail — continued |
| | |
Burlington Stores, Inc. * | | |
| | |
O'Reilly Automotive, Inc. * | | |
| | |
| | |
Technology Hardware, Storage & Peripherals — 7.5% |
| | |
Seagate Technology Holdings plc | | |
| | |
|
| | |
Philip Morris International, Inc. | | |
| | |
Trading Companies & Distributors — 0.2% |
| | |
Wireless Telecommunication Services — 0.2% |
| | |
Total Common Stocks
(Cost $2,327,953) | | |
| | |
|
Put Options Purchased — 0.3% |
| | |
2/29/2024 at USD 4,320.00 , European Style | | |
| | |
|
|
Notional Amount: USD 2,920,567 | | |
Counterparty: Exchange-Traded *
(Cost $23,457) | | |
| | |
Short-Term Investments — 0.6% |
Investment Companies — 0.6% |
JPMorgan U.S. Government Money Market Fund Class IM Shares, 5.30% (b) (c)
(Cost $15,876) | | |
Total Investments — 102.3%
(Cost $2,367,286) | | |
Liabilities in Excess of Other Assets — (2.3)% | | |
| | |
Percentages indicated are based on net assets. |
| |
| Real Estate Investment Trust |
| |
| Non-income producing security. |
| All or a portion of the security is segregated for options written. |
| Investment in an affiliated fund, which is registered under the Investment Company Act of 1940, as amended, and is advised by J.P. Morgan Investment Management Inc. |
| The rate shown is the current yield as of December 31, 2023. |
Futures contracts outstanding as of December 31, 2023 (amounts in thousands, except number of contracts):
| | | | | VALUE AND
UNREALIZED
APPRECIATION
(DEPRECIATION) ($) |
| | | | | |
| | | | | |
SEE NOTES TO FINANCIAL STATEMENTS.
| J.P. Morgan Large Cap Funds | |
JPMorgan Hedged Equity 3 Fund
SCHEDULE OF PORTFOLIO INVESTMENTSAS OF December 31, 2023 (Unaudited) (continued)
Written Call Options Contracts as of December 31, 2023 (amounts in thousands, except number of contracts):
|
| | | | | | |
| | | | | | |
Written Put Options Contracts as of December 31, 2023 (amounts in thousands, except number of contracts):
|
| | | | | | |
| | | | | | |
Total Written Options Contracts (Premiums Received $23,066) | |
SEE NOTES TO FINANCIAL STATEMENTS.
| J.P. Morgan Large Cap Funds | |
JPMorgan Large Cap Growth Fund
SCHEDULE OF PORTFOLIO INVESTMENTSAS OF December 31, 2023 (Unaudited)
| | |
|
Aerospace & Defense — 1.4% |
| | |
|
| | |
|
| | |
| | |
| | |
|
Alnylam Pharmaceuticals, Inc. * | | |
| | |
| | |
Regeneron Pharmaceuticals, Inc. * | | |
| | |
|
| | |
MercadoLibre, Inc. (Brazil) * | | |
| | |
|
| | |
|
| | |
Charles Schwab Corp. (The) | | |
| | |
| | |
| | |
Communications Equipment — 0.8% |
| | |
Construction & Engineering — 0.6% |
| | |
Electrical Equipment — 1.7% |
| | |
Electronic Equipment, Instruments & Components — 1.5% |
| | |
| | |
| | |
|
| | |
| | |
| | |
| | |
|
Financial Services — 2.9% |
| | |
Mastercard, Inc., Class A | | |
| | |
Ground Transportation — 2.1% |
Uber Technologies, Inc. * | | |
Health Care Equipment & Supplies — 0.9% |
| | |
Edwards Lifesciences Corp. * | | |
Intuitive Surgical, Inc. * | | |
| | |
Health Care Providers & Services — 1.4% |
| | |
| | |
| | |
Hotels, Restaurants & Leisure — 4.0% |
| | |
Chipotle Mexican Grill, Inc. * | | |
DoorDash, Inc., Class A * | | |
Marriott International, Inc., Class A | | |
| | |
| | |
Household Durables — 0.6% |
| | |
Interactive Media & Services — 9.0% |
Alphabet, Inc., Class C * | | |
Meta Platforms, Inc., Class A * | | |
| | |
|
Cognizant Technology Solutions Corp., Class A | | |
| | |
Shopify, Inc., Class A (Canada) * | | |
| | |
Life Sciences Tools & Services — 0.0% ^ |
Thermo Fisher Scientific, Inc. | | |
|
| | |
|
Trade Desk, Inc. (The), Class A * | | |
SEE NOTES TO FINANCIAL STATEMENTS.
| J.P. Morgan Large Cap Funds | |
JPMorgan Large Cap Growth Fund
SCHEDULE OF PORTFOLIO INVESTMENTSAS OF December 31, 2023 (Unaudited) (continued)
| | |
Common Stocks — continued |
|
| | |
Oil, Gas & Consumable Fuels — 1.0% |
| | |
| | |
| | |
Personal Care Products — 0.0% ^ |
Estee Lauder Cos., Inc. (The), Class A | | |
|
| | |
Semiconductors & Semiconductor Equipment — 10.3% |
Advanced Micro Devices, Inc. * | | |
ASML Holding NV (Registered), NYRS (Netherlands) | | |
| | |
| | |
| | |
| | |
| | |
| | |
|
| | |
| | |
| | |
| | |
| | |
Palo Alto Networks, Inc. * | | |
| | |
| | |
| | |
| | |
| | |
| | |
|
|
| | |
| | |
| | |
Technology Hardware, Storage & Peripherals — 5.3% |
| | |
Trading Companies & Distributors — 0.6% |
| | |
Total Common Stocks
(Cost $47,592,591) | | |
Short-Term Investments — 2.7% |
Investment Companies — 2.7% |
JPMorgan Prime Money Market Fund Class IM Shares, 5.51% (a) (b)
(Cost $1,965,567) | | |
Total Investments — 100.2%
(Cost $49,558,158) | | |
Liabilities in Excess of Other Assets — (0.2)% | | |
| | |
Percentages indicated are based on net assets. |
| Amount rounds to less than 0.1% of net assets. |
| Non-income producing security. | |
| Investment in an affiliated fund, which is registered under the Investment Company Act of 1940, as amended, and is advised by J.P. Morgan Investment Management Inc. | |
| The rate shown is the current yield as of December 31, 2023. | |
SEE NOTES TO FINANCIAL STATEMENTS.
| J.P. Morgan Large Cap Funds | |
JPMorgan Large Cap Value Fund
SCHEDULE OF PORTFOLIO INVESTMENTSAS OF December 31, 2023 (Unaudited)
| | |
|
Aerospace & Defense — 2.3% |
| | |
| | |
| | |
Air Freight & Logistics — 2.0% |
| | |
United Parcel Service, Inc., Class B | | |
| | |
|
| | |
| | |
| | |
PNC Financial Services Group, Inc. (The) | | |
| | |
| | |
| | |
|
| | |
|
| | |
| | |
BioMarin Pharmaceutical, Inc. * | | |
| | |
|
| | |
| | |
| | |
|
Charles Schwab Corp. (The) | | |
Goldman Sachs Group, Inc. (The) | | |
Intercontinental Exchange, Inc. | | |
Raymond James Financial, Inc. (a) | | |
| | |
|
Air Products and Chemicals, Inc. | | |
| | |
| | |
| | |
Consumer Staples Distribution & Retail — 4.1% |
BJ's Wholesale Club Holdings, Inc. * | | |
| | |
| | |
|
Consumer Staples Distribution & Retail — continued |
Performance Food Group Co. * | | |
| | |
| | |
Containers & Packaging — 1.6% |
Graphic Packaging Holding Co. | | |
| | |
| | |
Diversified Telecommunication Services — 0.5% |
| | |
Electric Utilities — 2.0% |
| | |
| | |
| | |
Electrical Equipment — 1.9% |
| | |
Vertiv Holdings Co., Class A | | |
| | |
|
Endeavor Group Holdings, Inc., Class A (a) | | |
| | |
Warner Bros Discovery, Inc. * (a) | | |
| | |
Financial Services — 5.6% |
Berkshire Hathaway, Inc., Class B * | | |
Fidelity National Information Services, Inc. | | |
| | |
Rocket Cos., Inc., Class A * (a) | | |
| | |
|
Lamb Weston Holdings, Inc. | | |
Ground Transportation — 1.4% |
| | |
Knight-Swift Transportation Holdings, Inc. | | |
| | |
Health Care Equipment & Supplies — 2.8% |
Baxter International, Inc. | | |
| | |
Zimmer Biomet Holdings, Inc. | | |
| | |
SEE NOTES TO FINANCIAL STATEMENTS.
| J.P. Morgan Large Cap Funds | |
JPMorgan Large Cap Value Fund
SCHEDULE OF PORTFOLIO INVESTMENTSAS OF December 31, 2023 (Unaudited) (continued)
| | |
Common Stocks — continued |
Health Care Providers & Services — 3.4% |
| | |
| | |
| | |
| | |
|
| | |
Hotels, Restaurants & Leisure — 1.3% |
| | |
Royal Caribbean Cruises Ltd. * | | |
| | |
Household Durables — 0.4% |
| | |
Industrial Conglomerates — 1.5% |
Honeywell International, Inc. | | |
|
| | |
Travelers Cos., Inc. (The) | | |
| | |
Interactive Media & Services — 1.0% |
Meta Platforms, Inc., Class A * | | |
Life Sciences Tools & Services — 0.8% |
Thermo Fisher Scientific, Inc. | | |
|
| | |
|
Charter Communications, Inc., Class A * | | |
| | |
Interpublic Group of Cos., Inc. (The) | | |
Liberty Media Corp-Liberty SiriusXM, Class A * (a) | | |
| | |
|
| | |
| | |
Kinross Gold Corp. (Canada) | | |
| | |
| | |
|
| | |
| | |
|
Multi-Utilities — continued |
| | |
Public Service Enterprise Group, Inc. | | |
| | |
|
| | |
Oil, Gas & Consumable Fuels — 5.2% |
| | |
| | |
Pioneer Natural Resources Co. | | |
| | |
Passenger Airlines — 0.6% |
| | |
|
| | |
|
| | |
|
| | |
Semiconductors & Semiconductor Equipment — 5.2% |
| | |
Microchip Technology, Inc. | | |
NXP Semiconductors NV (China) | | |
Taiwan Semiconductor Manufacturing Co. Ltd., ADR (Taiwan) | | |
| | |
| | |
|
| | |
| | |
| | |
|
Digital Realty Trust, Inc. | | |
|
| | |
Burlington Stores, Inc. * | | |
| | |
Technology Hardware, Storage & Peripherals — 0.8% |
Seagate Technology Holdings plc | | |
SEE NOTES TO FINANCIAL STATEMENTS.
| J.P. Morgan Large Cap Funds | |
| | |
Common Stocks — continued |
Textiles, Apparel & Luxury Goods — 1.9% |
| | |
| | |
| | |
| | |
|
Philip Morris International, Inc. | | |
Trading Companies & Distributors — 3.3% |
AerCap Holdings NV (Ireland) * | | |
| | |
WESCO International, Inc. | | |
| | |
Total Common Stocks
(Cost $3,150,558) | | |
Short-Term Investments — 1.7% |
Investment Companies — 0.8% |
JPMorgan Prime Money Market Fund Class IM Shares, 5.51% (b) (c)
(Cost $30,619) | | |
Investment of Cash Collateral from Securities Loaned — 0.9% |
JPMorgan Securities Lending Money Market Fund Agency SL Class Shares, 5.56% (b) (c) | | |
JPMorgan U.S. Government Money Market Fund Class IM Shares, 5.30% (b) (c) | | |
Total Investment of Cash Collateral from Securities Loaned
(Cost $31,436) | | |
Total Short-Term Investments
(Cost $62,055) | | |
Total Investments — 101.3%
(Cost $3,212,613) | | |
Liabilities in Excess of Other Assets — (1.3)% | | |
| | |
Percentages indicated are based on net assets. |
| |
| American Depositary Receipt |
| Real Estate Investment Trust |
| Non-income producing security. |
| The security or a portion of this security is on loan at December 31, 2023. The total value of securities on loan at December 31, 2023 is $29,877. |
| Investment in an affiliated fund, which is registered under the Investment Company Act of 1940, as amended, and is advised by J.P. Morgan Investment Management Inc. |
| The rate shown is the current yield as of December 31, 2023. |
SEE NOTES TO FINANCIAL STATEMENTS.
| J.P. Morgan Large Cap Funds | |
JPMorgan U.S. Applied Data Science Value Fund
SCHEDULE OF PORTFOLIO INVESTMENTSAS OF December 31, 2023 (Unaudited)
| | |
|
Aerospace & Defense — 1.6% |
| | |
| | |
| | |
Air Freight & Logistics — 1.0% |
United Parcel Service, Inc., Class B | | |
Automobile Components — 0.5% |
| | |
|
| | |
| | |
Citizens Financial Group, Inc. | | |
| | |
PNC Financial Services Group, Inc. (The) | | |
| | |
| | |
|
| | |
|
| | |
Regeneron Pharmaceuticals, Inc. * | | |
Vertex Pharmaceuticals, Inc. * | | |
| | |
|
Johnson Controls International plc | | |
| | |
| | |
|
| | |
Charles Schwab Corp. (The) | | |
| | |
| | |
| | |
|
Axalta Coating Systems Ltd. * | | |
| | |
| | |
| | |
Communications Equipment — 0.5% |
| | |
| | |
|
|
| | |
Capital One Financial Corp. | | |
| | |
Consumer Staples Distribution & Retail — 1.1% |
| | |
| | |
| | |
Containers & Packaging — 0.7% |
| | |
Diversified Telecommunication Services — 1.5% |
Verizon Communications, Inc. | | |
Electric Utilities — 3.9% |
Constellation Energy Corp. | | |
| | |
| | |
| | |
| | |
Electrical Equipment — 2.2% |
| | |
Electronic Equipment, Instruments & Components — 0.6% |
Teledyne Technologies, Inc. * | | |
|
| | |
Financial Services — 4.0% |
Berkshire Hathaway, Inc., Class B * | | |
Fidelity National Information Services, Inc. | | |
| | |
FleetCor Technologies, Inc. * | | |
Mastercard, Inc., Class A | | |
| | |
|
Mondelez International, Inc., Class A | | |
Tyson Foods, Inc., Class A | | |
| | |
Ground Transportation — 3.0% |
| | |
| | |
Uber Technologies, Inc. * | | |
| | |
SEE NOTES TO FINANCIAL STATEMENTS.
| J.P. Morgan Large Cap Funds | |
| | |
Common Stocks — continued |
Health Care Equipment & Supplies — 2.8% |
Baxter International, Inc. | | |
Boston Scientific Corp. * | | |
| | |
| | |
Health Care Providers & Services — 3.1% |
| | |
| | |
| | |
| | |
|
| | |
Hotel & Resort REITs — 0.5% |
Host Hotels & Resorts, Inc. | | |
Hotels, Restaurants & Leisure — 1.9% |
| | |
| | |
| | |
| | |
Household Durables — 0.3% |
| | |
Household Products — 1.6% |
Procter & Gamble Co. (The) | | |
Spectrum Brands Holdings, Inc. | | |
| | |
Industrial Conglomerates — 1.3% |
Honeywell International, Inc. | | |
|
| | |
|
| | |
Travelers Cos., Inc. (The) | | |
| | |
Interactive Media & Services — 0.9% |
Meta Platforms, Inc., Class A * | | |
|
Cognizant Technology Solutions Corp., Class A | | |
| | |
|
Life Sciences Tools & Services — 1.3% |
Agilent Technologies, Inc. | | |
| | |
| | |
|
| | |
| | |
| | |
| | |
|
Charter Communications, Inc., Class A * | | |
| | |
| | |
|
| | |
Public Service Enterprise Group, Inc. | | |
| | |
Oil, Gas & Consumable Fuels — 8.7% |
| | |
| | |
| | |
| | |
| | |
| | |
| | |
Personal Care Products — 0.3% |
| | |
|
| | |
| | |
Jazz Pharmaceuticals plc * | | |
| | |
| | |
| | |
| | |
Professional Services — 0.8% |
Booz Allen Hamilton Holding Corp. | | |
SS&C Technologies Holdings, Inc. | | |
| | |
Real Estate Management & Development — 0.8% |
CBRE Group, Inc., Class A * | | |
SEE NOTES TO FINANCIAL STATEMENTS.
| J.P. Morgan Large Cap Funds | |
JPMorgan U.S. Applied Data Science Value Fund
SCHEDULE OF PORTFOLIO INVESTMENTSAS OF December 31, 2023 (Unaudited) (continued)
| | |
Common Stocks — continued |
Semiconductors & Semiconductor Equipment — 4.0% |
Advanced Micro Devices, Inc. * | | |
| | |
NXP Semiconductors NV (China) | | |
| | |
| | |
|
| | |
|
Digital Realty Trust, Inc. | | |
|
| | |
| | |
O'Reilly Automotive, Inc. * | | |
| | |
|
Philip Morris International, Inc. | | |
Total Common Stocks
(Cost $136,337) | | |
| | |
Short-Term Investments — 0.5% |
Investment Companies — 0.5% |
JPMorgan Prime Money Market Fund Class IM Shares, 5.51% (a) (b)
(Cost $872) | | |
Total Investments — 100.4%
(Cost $137,209) | | |
Liabilities in Excess of Other Assets — (0.4)% | | |
| | |
Percentages indicated are based on net assets. |
| |
| Real Estate Investment Trust |
| Non-income producing security. |
| Investment in an affiliated fund, which is registered under the Investment Company Act of 1940, as amended, and is advised by J.P. Morgan Investment Management Inc. |
| The rate shown is the current yield as of December 31, 2023. |
Futures contracts outstanding as of December 31, 2023 (amounts in thousands, except number of contracts):
| | | | | VALUE AND
UNREALIZED
APPRECIATION
(DEPRECIATION) ($) |
| | | | | |
| | | | | |
SEE NOTES TO FINANCIAL STATEMENTS.
| J.P. Morgan Large Cap Funds | |
JPMorgan U.S. Equity Fund
SCHEDULE OF PORTFOLIO INVESTMENTSAS OF December 31, 2023 (Unaudited)
| | |
|
Aerospace & Defense — 2.5% |
| | |
| | |
| | |
|
| | |
|
| | |
| | |
| | |
|
| | |
|
| | |
| | |
Regeneron Pharmaceuticals, Inc. * | | |
Vertex Pharmaceuticals, Inc. * | | |
| | |
|
| | |
|
| | |
|
Ameriprise Financial, Inc. | | |
| | |
| | |
| | |
|
| | |
| | |
| | |
Construction Materials — 1.3% |
| | |
|
| | |
Electric Utilities — 4.0% |
| | |
| | |
| | |
| | |
|
Electrical Equipment — 2.0% |
| | |
Energy Equipment & Services — 2.4% |
| | |
Financial Services — 2.6% |
FleetCor Technologies, Inc. * | | |
Mastercard, Inc., Class A | | |
| | |
Ground Transportation — 3.2% |
| | |
| | |
Uber Technologies, Inc. * | | |
| | |
Health Care Equipment & Supplies — 1.4% |
| | |
Health Care Providers & Services — 3.2% |
| | |
Hotels, Restaurants & Leisure — 2.9% |
Marriott International, Inc., Class A | | |
| | |
| | |
|
| | |
|
| | |
Interactive Media & Services — 5.9% |
Alphabet, Inc., Class A * | | |
Meta Platforms, Inc., Class A * | | |
| | |
|
| | |
Life Sciences Tools & Services — 1.1% |
| | |
|
| | |
Oil, Gas & Consumable Fuels — 2.9% |
| | |
Pioneer Natural Resources Co. | | |
| | |
SEE NOTES TO FINANCIAL STATEMENTS.
| J.P. Morgan Large Cap Funds | |
JPMorgan U.S. Equity Fund
SCHEDULE OF PORTFOLIO INVESTMENTSAS OF December 31, 2023 (Unaudited) (continued)
| | |
Common Stocks — continued |
|
| | |
| | |
| | |
Semiconductors & Semiconductor Equipment — 8.4% |
Advanced Micro Devices, Inc. * | | |
| | |
ASML Holding NV (Registered), NYRS (Netherlands) | | |
| | |
NXP Semiconductors NV (China) | | |
| | |
|
| | |
| | |
| | |
| | |
|
| | |
| | |
| | |
Technology Hardware, Storage & Peripherals — 5.5% |
| | |
Seagate Technology Holdings plc | | |
| | |
Total Common Stocks
(Cost $15,619,531) | | |
| | |
Short-Term Investments — 1.2% |
Investment Companies — 1.2% |
JPMorgan Prime Money Market Fund Class IM Shares, 5.51% (a) (b)
(Cost $290,768) | | |
Total Investments — 100.7%
(Cost $15,910,299) | | |
Liabilities in Excess of Other Assets — (0.7)% | | |
| | |
Percentages indicated are based on net assets. |
| |
| |
| Real Estate Investment Trust |
| Non-income producing security. |
| Investment in an affiliated fund, which is registered under the Investment Company Act of 1940, as amended, and is advised by J.P. Morgan Investment Management Inc. |
| The rate shown is the current yield as of December 31, 2023. |
SEE NOTES TO FINANCIAL STATEMENTS.
| J.P. Morgan Large Cap Funds | |
JPMorgan U.S. GARP Equity Fund
SCHEDULE OF PORTFOLIO INVESTMENTSAS OF December 31, 2023 (Unaudited)
| | |
|
Aerospace & Defense — 0.7% |
| | |
| | |
| | |
|
| | |
|
| | |
| | |
| | |
|
| | |
| | |
Neurocrine Biosciences, Inc. * | | |
Regeneron Pharmaceuticals, Inc. * | | |
Vertex Pharmaceuticals, Inc. * | | |
| | |
|
| | |
|
Builders FirstSource, Inc. * | | |
| | |
| | |
|
Ameriprise Financial, Inc. | | |
Charles Schwab Corp. (The) | | |
| | |
| | |
|
| | |
| | |
| | |
Commercial Services & Supplies — 0.5% |
| | |
Communications Equipment — 0.7% |
| | |
Construction & Engineering — 0.5% |
| | |
| | |
|
Consumer Staples Distribution & Retail — 1.5% |
| | |
| | |
| | |
Electric Utilities — 0.6% |
| | |
| | |
| | |
Electrical Equipment — 0.3% |
| | |
Energy Equipment & Services — 0.4% |
| | |
|
Live Nation Entertainment, Inc. * | | |
| | |
| | |
Financial Services — 4.0% |
Mastercard, Inc., Class A | | |
| | |
| | |
|
| | |
Mondelez International, Inc., Class A | | |
| | |
Ground Transportation — 1.8% |
| | |
Uber Technologies, Inc. * | | |
| | |
Health Care Equipment & Supplies — 0.8% |
Boston Scientific Corp. * | | |
| | |
| | |
Health Care Providers & Services — 3.0% |
| | |
| | |
| | |
| | |
| | |
Hotels, Restaurants & Leisure — 3.1% |
| | |
SEE NOTES TO FINANCIAL STATEMENTS.
| J.P. Morgan Large Cap Funds | |
JPMorgan U.S. GARP Equity Fund
SCHEDULE OF PORTFOLIO INVESTMENTSAS OF December 31, 2023 (Unaudited) (continued)
| | |
Common Stocks — continued |
Hotels, Restaurants & Leisure — continued |
Chipotle Mexican Grill, Inc. * | | |
Hilton Worldwide Holdings, Inc. | | |
| | |
Royal Caribbean Cruises Ltd. * | | |
| | |
|
| | |
|
Arch Capital Group Ltd. * | | |
| | |
| | |
Interactive Media & Services — 9.5% |
Alphabet, Inc., Class A * | | |
Alphabet, Inc., Class C * | | |
Meta Platforms, Inc., Class A * | | |
| | |
Life Sciences Tools & Services — 1.7% |
| | |
Thermo Fisher Scientific, Inc. | | |
| | |
|
| | |
| | |
| | |
| | |
|
Charter Communications, Inc., Class A * | | |
Liberty Media Corp-Liberty SiriusXM * | | |
| | |
Oil, Gas & Consumable Fuels — 0.9% |
| | |
| | |
| | |
Personal Care Products — 0.3% |
Estee Lauder Cos., Inc. (The), Class A | | |
|
| | |
Jazz Pharmaceuticals plc * | | |
| | |
| | |
|
Professional Services — 0.4% |
Booz Allen Hamilton Holding Corp. | | |
Semiconductors & Semiconductor Equipment — 10.4% |
Advanced Micro Devices, Inc. * | | |
| | |
ASML Holding NV (Registered), NYRS (Netherlands) | | |
| | |
| | |
| | |
NXP Semiconductors NV (China) | | |
Taiwan Semiconductor Manufacturing Co. Ltd., ADR (Taiwan) | | |
| | |
| | |
|
| | |
Cadence Design Systems, Inc. * | | |
Crowdstrike Holdings, Inc., Class A * | | |
| | |
| | |
| | |
| | |
Palo Alto Networks, Inc. * | | |
Procore Technologies, Inc. * | | |
| | |
| | |
| | |
|
| | |
VICI Properties, Inc., Class A | | |
| | |
|
| | |
Burlington Stores, Inc. * | | |
| | |
O'Reilly Automotive, Inc. * | | |
| | |
Technology Hardware, Storage & Peripherals — 10.2% |
| | |
Dell Technologies, Inc., Class C | | |
Seagate Technology Holdings plc | | |
| | |
SEE NOTES TO FINANCIAL STATEMENTS.
| J.P. Morgan Large Cap Funds | |
| | |
Common Stocks — continued |
|
Philip Morris International, Inc. | | |
Total Common Stocks
(Cost $611,549) | | |
Short-Term Investments — 1.8% |
Investment Companies — 1.2% |
JPMorgan Prime Money Market Fund Class IM Shares, 5.51% (b) (c)
(Cost $14,179) | | |
Investment of Cash Collateral from Securities Loaned — 0.6% |
JPMorgan Securities Lending Money Market Fund Agency SL Class Shares, 5.56% (b) (c) | | |
JPMorgan U.S. Government Money Market Fund Class IM Shares, 5.30% (b) (c) | | |
Total Investment of Cash Collateral from Securities Loaned
(Cost $7,368) | | |
Total Short-Term Investments
(Cost $21,547) | | |
Total Investments — 100.5%
(Cost $633,096) | | |
Liabilities in Excess of Other Assets — (0.5)% | | |
| | |
Percentages indicated are based on net assets. |
| |
| American Depositary Receipt |
| |
| Real Estate Investment Trust |
| Non-income producing security. |
| The security or a portion of this security is on loan at December 31, 2023. The total value of securities on loan at December 31, 2023 is $7,213. |
| Investment in an affiliated fund, which is registered under the Investment Company Act of 1940, as amended, and is advised by J.P. Morgan Investment Management Inc. |
| The rate shown is the current yield as of December 31, 2023. |
Futures contracts outstanding as of December 31, 2023 (amounts in thousands, except number of contracts):
| | | | | VALUE AND
UNREALIZED
APPRECIATION
(DEPRECIATION) ($) |
| | | | | |
| | | | | |
SEE NOTES TO FINANCIAL STATEMENTS.
| J.P. Morgan Large Cap Funds | |
JPMorgan U.S. Large Cap Core Plus Fund
SCHEDULE OF PORTFOLIO INVESTMENTSAS OF December 31, 2023 (Unaudited)
| | |
|
|
Aerospace & Defense — 2.8% |
| | |
Northrop Grumman Corp. (a) | | |
| | |
| | |
| | |
Air Freight & Logistics — 0.6% |
United Parcel Service, Inc., Class B | | |
|
Bank of America Corp. (a) | | |
| | |
First Citizens BancShares, Inc., Class A | | |
| | |
| | |
| | |
|
| | |
| | |
| | |
| | |
| | |
|
| | |
| | |
BioMarin Pharmaceutical, Inc. * | | |
Regeneron Pharmaceuticals, Inc. * | | |
Sarepta Therapeutics, Inc. * | | |
Vertex Pharmaceuticals, Inc. * | | |
| | |
|
| | |
|
| | |
|
Ameriprise Financial, Inc. | | |
Charles Schwab Corp. (The) | | |
Intercontinental Exchange, Inc. | | |
| | |
| | |
|
|
Capital Markets — continued |
Raymond James Financial, Inc. | | |
| | |
| | |
|
Air Products and Chemicals, Inc. | | |
| | |
| | |
| | |
Commercial Services & Supplies — 0.3% |
| | |
Communications Equipment — 0.1% |
| | |
Construction Materials — 0.7% |
Martin Marietta Materials, Inc. | | |
Consumer Staples Distribution & Retail — 0.8% |
| | |
Electric Utilities — 3.0% |
| | |
| | |
| | |
| | |
| | |
Electrical Equipment — 1.2% |
| | |
Electronic Equipment, Instruments & Components — 0.5% |
| | |
Keysight Technologies, Inc. * | | |
| | |
Energy Equipment & Services — 0.8% |
| | |
| | |
| | |
|
Endeavor Group Holdings, Inc., Class A | | |
Take-Two Interactive Software, Inc. * | | |
Warner Bros Discovery, Inc. * | | |
| | |
SEE NOTES TO FINANCIAL STATEMENTS.
| J.P. Morgan Large Cap Funds | |
| | |
Long Positions — continued |
Common Stocks — continued |
Financial Services — 6.1% |
Berkshire Hathaway, Inc., Class B * | | |
| | |
Fidelity National Information Services, Inc. | | |
| | |
FleetCor Technologies, Inc. * | | |
Mastercard, Inc., Class A (a) | | |
| | |
| | |
|
Mondelez International, Inc., Class A (a) | | |
Ground Transportation — 2.3% |
| | |
Norfolk Southern Corp. (a) | | |
Old Dominion Freight Line, Inc. | | |
Uber Technologies, Inc. * | | |
| | |
| | |
| | |
Health Care Equipment & Supplies — 3.4% |
Boston Scientific Corp. * (a) | | |
Intuitive Surgical, Inc. * | | |
| | |
| | |
| | |
Health Care Providers & Services — 3.0% |
| | |
UnitedHealth Group, Inc. (a) | | |
| | |
Hotels, Restaurants & Leisure — 5.4% |
| | |
Chipotle Mexican Grill, Inc. * | | |
| | |
Hilton Worldwide Holdings, Inc. | | |
| | |
Royal Caribbean Cruises Ltd. * | | |
| | |
| | |
| | |
|
|
Household Products — 1.0% |
Church & Dwight Co., Inc. | | |
Procter & Gamble Co. (The) (a) | | |
| | |
Industrial Conglomerates — 1.3% |
Honeywell International, Inc. (a) | | |
|
| | |
|
| | |
| | |
| | |
Progressive Corp. (The) (a) | | |
Travelers Cos., Inc. (The) | | |
| | |
Interactive Media & Services — 7.6% |
Alphabet, Inc., Class C * | | |
Alphabet, Inc., Class A * (a) | | |
Meta Platforms, Inc., Class A * (a) | | |
Pinterest, Inc., Class A * | | |
| | |
|
Cognizant Technology Solutions Corp., Class A | | |
Life Sciences Tools & Services — 1.4% |
| | |
Thermo Fisher Scientific, Inc. (a) | | |
| | |
|
| | |
| | |
| | |
| | |
| | |
|
Charter Communications, Inc., Class A * (a) | | |
Comcast Corp., Class A (a) | | |
Liberty Media Corp-Liberty SiriusXM * | | |
Liberty Media Corp-Liberty SiriusXM, Class A * | | |
| | |
SEE NOTES TO FINANCIAL STATEMENTS.
| J.P. Morgan Large Cap Funds | |
JPMorgan U.S. Large Cap Core Plus Fund
SCHEDULE OF PORTFOLIO INVESTMENTSAS OF December 31, 2023 (Unaudited) (continued)
| | |
Long Positions — continued |
Common Stocks — continued |
|
| | |
| | |
Public Service Enterprise Group, Inc. | | |
| | |
Oil, Gas & Consumable Fuels — 4.9% |
| | |
| | |
| | |
| | |
| | |
| | |
| | |
| | |
| | |
Personal Care Products — 0.8% |
Estee Lauder Cos., Inc. (The), Class A | | |
| | |
| | |
|
Bristol-Myers Squibb Co. (a) | | |
Elanco Animal Health, Inc. * | | |
| | |
| | |
| | |
Professional Services — 0.4% |
Booz Allen Hamilton Holding Corp. | | |
|
American Homes 4 Rent, Class A | | |
Semiconductors & Semiconductor Equipment — 14.3% |
Advanced Micro Devices, Inc. * | | |
| | |
ASML Holding NV (Registered), NYRS (Netherlands) | | |
Microchip Technology, Inc. | | |
| | |
| | |
NXP Semiconductors NV (China) | | |
| | |
| | |
Taiwan Semiconductor Manufacturing Co. Ltd., ADR (Taiwan) | | |
| | |
|
|
Semiconductors & Semiconductor Equipment — continued |
| | |
Texas Instruments, Inc. (a) | | |
| | |
| | |
|
| | |
| | |
| | |
| | |
| | |
| | |
|
| | |
Digital Realty Trust, Inc. | | |
| | |
| | |
| | |
|
| | |
| | |
Burlington Stores, Inc. * | | |
| | |
O'Reilly Automotive, Inc. * (a) | | |
| | |
| | |
Technology Hardware, Storage & Peripherals — 5.6% |
| | |
Dell Technologies, Inc., Class C | | |
Seagate Technology Holdings plc | | |
| | |
| | |
Trading Companies & Distributors — 0.1% |
| | |
Wireless Telecommunication Services — 0.5% |
| | |
Total Common Stocks
(Cost $1,047,711) | | |
SEE NOTES TO FINANCIAL STATEMENTS.
| J.P. Morgan Large Cap Funds | |
| | |
Long Positions — continued |
Short-Term Investments — 3.1% |
Investment Companies — 3.1% |
JPMorgan Prime Money Market Fund Class IM Shares, 5.51% (b) (c)(Cost $48,721) | | |
Total Long Positions
(Cost $1,096,432) | | |
Short Positions — (25.9)% |
|
Aerospace & Defense — (1.2)% |
| | |
| | |
Huntington Ingalls Industries, Inc. | | |
Spirit AeroSystems Holdings, Inc., Class A * | | |
| | |
Air Freight & Logistics — (0.3)% |
Expeditors International of Washington, Inc. | | |
|
| | |
|
Huntington Bancshares, Inc. | | |
PNC Financial Services Group, Inc. (The) | | |
| | |
|
Molson Coors Beverage Co., Class B | | |
|
| | |
| | |
| | |
| | |
Broadline Retail — (0.2)% |
| | |
Building Products — (0.2)% |
Johnson Controls International plc | | |
|
Bank of New York Mellon Corp. (The) | | |
| | |
Coinbase Global, Inc., Class A * | | |
FactSet Research Systems, Inc. | | |
| | |
Goldman Sachs Group, Inc. (The) | | |
LPL Financial Holdings, Inc. | | |
| | |
|
|
Capital Markets — continued |
| | |
| | |
T. Rowe Price Group, Inc. | | |
| | |
Communications Equipment — (0.9)% |
| | |
| | |
| | |
Consumer Finance — (0.3)% |
| | |
Consumer Staples Distribution & Retail — (0.9)% |
| | |
| | |
Walgreens Boots Alliance, Inc. | | |
| | |
Containers & Packaging — (0.2)% |
| | |
Diversified Telecommunication Services — (0.3)% |
| | |
Verizon Communications, Inc. | | |
| | |
Electric Utilities — (1.3)% |
American Electric Power Co., Inc. | | |
| | |
| | |
| | |
| | |
| | |
| | |
Electrical Equipment — (0.3)% |
| | |
Energy Equipment & Services — (0.2)% |
| | |
|
| | |
Financial Services — (1.7)% |
| | |
| | |
| | |
SEE NOTES TO FINANCIAL STATEMENTS.
| J.P. Morgan Large Cap Funds | |
JPMorgan U.S. Large Cap Core Plus Fund
SCHEDULE OF PORTFOLIO INVESTMENTSAS OF December 31, 2023 (Unaudited) (continued)
| | |
Short Positions — continued |
Common Stocks — continued |
Financial Services — continued |
| | |
| | |
| | |
| | |
|
| | |
| | |
| | |
| | |
|
| | |
Ground Transportation — (0.0)% ^ |
| | |
Health Care Equipment & Supplies — (0.4)% |
| | |
| | |
Zimmer Biomet Holdings, Inc. | | |
| | |
Health Care Providers & Services — (0.3)% |
| | |
| | |
| | |
Hotels, Restaurants & Leisure — (0.5)% |
| | |
| | |
| | |
Industrial Conglomerates — (0.2)% |
| | |
|
| | |
| | |
American International Group, Inc. | | |
| | |
Kinsale Capital Group, Inc. | | |
Marsh & McLennan Cos., Inc. | | |
| | |
| | |
| | |
|
|
|
| | |
International Business Machines Corp. | | |
| | |
Life Sciences Tools & Services — (0.8)% |
Agilent Technologies, Inc. | | |
| | |
| | |
| | |
|
| | |
| | |
Illinois Tool Works, Inc. | | |
| | |
Stanley Black & Decker, Inc. | | |
| | |
|
| | |
Interpublic Group of Cos., Inc. (The) | | |
| | |
Paramount Global, Class B | | |
| | |
|
Consolidated Edison, Inc. | | |
|
| | |
| | |
| | |
Oil, Gas & Consumable Fuels — (1.2)% |
| | |
| | |
| | |
| | |
| | |
| | |
| | |
| | |
| | |
Passenger Airlines — (0.4)% |
American Airlines Group, Inc. * | | |
SEE NOTES TO FINANCIAL STATEMENTS.
| J.P. Morgan Large Cap Funds | |
| | |
Short Positions — continued |
Common Stocks — continued |
Passenger Airlines — continued |
| | |
| | |
| | |
Professional Services — (0.6)% |
Ceridian HCM Holding, Inc. * | | |
| | |
| | |
| | |
| | |
|
| | |
Simon Property Group, Inc. | | |
| | |
Semiconductors & Semiconductor Equipment — (2.1)% |
| | |
| | |
| | |
| | |
| | |
| | |
| | |
|
| | |
Specialized REITs — (0.1)% |
| | |
Specialty Retail — (0.6)% |
| | |
| | |
| | |
| | |
Technology Hardware, Storage & Peripherals — (1.0)% |
Hewlett Packard Enterprise Co. | | |
| | |
| | |
| | |
| | |
|
|
Textiles, Apparel & Luxury Goods — (0.1)% |
| | |
On Holding AG (Switzerland), Class A * | | |
| | |
Trading Companies & Distributors — (0.4)% |
| | |
Total Common Stocks
(Proceeds $(414,795)) | | |
Total Short Positions
(Proceeds $(414,795)) | | |
Total Investments — 99.8%
(Cost $681,637) | | |
Other Assets Less Liabilities — 0.2% | | |
| | |
Percentages indicated are based on net assets. |
Amounts presented as a dash ("-") represent amounts that round to less than a thousand. |
| |
| American Depositary Receipt |
| |
| Real Estate Investment Trust |
| Amount rounds to less than 0.1% of net assets. |
| Non-income producing security. | |
| All or a portion of this security is segregated as collateral for short sales. The total value of securities segregated as collateral is $561,165. | |
| Investment in an affiliated fund, which is registered under the Investment Company Act of 1940, as amended, and is advised by J.P. Morgan Investment Management Inc. | |
| The rate shown is the current yield as of December 31, 2023. | |
SEE NOTES TO FINANCIAL STATEMENTS.
| J.P. Morgan Large Cap Funds | |
JPMorgan U.S. Large Cap Core Plus Fund
SCHEDULE OF PORTFOLIO INVESTMENTSAS OF December 31, 2023 (Unaudited) (continued)
Futures contracts outstanding as of December 31, 2023 (amounts in thousands, except number of contracts):
| | | | | VALUE AND
UNREALIZED
APPRECIATION
(DEPRECIATION) ($) |
| | | | | |
| | | | | |
SEE NOTES TO FINANCIAL STATEMENTS.
| J.P. Morgan Large Cap Funds | |
JPMorgan U.S. Research Enhanced Equity Fund
SCHEDULE OF PORTFOLIO INVESTMENTSAS OF December 31, 2023 (Unaudited)
| | |
|
Aerospace & Defense — 1.4% |
| | |
| | |
| | |
| | |
Air Freight & Logistics — 1.1% |
| | |
United Parcel Service, Inc., Class B | | |
| | |
Automobile Components — 0.2% |
| | |
| | |
| | |
|
| | |
|
| | |
| | |
| | |
| | |
| | |
| | |
|
| | |
Constellation Brands, Inc., Class A | | |
| | |
| | |
| | |
|
| | |
| | |
BioMarin Pharmaceutical, Inc. * | | |
Neurocrine Biosciences, Inc. * | | |
Regeneron Pharmaceuticals, Inc. * | | |
Sarepta Therapeutics, Inc. * | | |
Vertex Pharmaceuticals, Inc. * | | |
| | |
|
| | |
| | |
|
|
| | |
| | |
| | |
|
| | |
Charles Schwab Corp. (The) | | |
| | |
Goldman Sachs Group, Inc. (The) | | |
Intercontinental Exchange, Inc. | | |
| | |
| | |
| | |
|
Air Products and Chemicals, Inc. | | |
| | |
| | |
| | |
LyondellBasell Industries NV, Class A | | |
| | |
| | |
Commercial Services & Supplies — 0.1% |
| | |
Communications Equipment — 0.2% |
| | |
|
| | |
Consumer Staples Distribution & Retail — 2.1% |
| | |
| | |
| | |
| | |
| | |
|
| | |
Electric Utilities — 1.9% |
Constellation Energy Corp. | | |
| | |
| | |
| | |
| | |
SEE NOTES TO FINANCIAL STATEMENTS.
| J.P. Morgan Large Cap Funds | |
JPMorgan U.S. Research Enhanced Equity Fund
SCHEDULE OF PORTFOLIO INVESTMENTSAS OF December 31, 2023 (Unaudited) (continued)
| | |
Common Stocks — continued |
Electrical Equipment — 0.6% |
| | |
Electronic Equipment, Instruments & Components — 0.3% |
| | |
Keysight Technologies, Inc. * | | |
| | |
Energy Equipment & Services — 0.1% |
| | |
|
| | |
Warner Bros Discovery, Inc. * | | |
| | |
Financial Services — 4.7% |
Berkshire Hathaway, Inc., Class B * | | |
| | |
| | |
FleetCor Technologies, Inc. * | | |
Mastercard, Inc., Class A | | |
| | |
| | |
|
Mondelez International, Inc., Class A | | |
Ground Transportation — 1.1% |
| | |
| | |
Uber Technologies, Inc. * | | |
| | |
| | |
Health Care Equipment & Supplies — 2.4% |
Baxter International, Inc. | | |
| | |
Boston Scientific Corp. * | | |
| | |
Intuitive Surgical, Inc. * | | |
| | |
| | |
| | |
Health Care Providers & Services — 2.8% |
| | |
| | |
| | |
| | |
|
Health Care Providers & Services — continued |
| | |
| | |
| | |
| | |
|
| | |
| | |
| | |
Hotels, Restaurants & Leisure — 2.7% |
| | |
Chipotle Mexican Grill, Inc. * | | |
| | |
Marriott International, Inc., Class A | | |
Royal Caribbean Cruises Ltd. * | | |
| | |
| | |
Household Durables — 0.3% |
| | |
| | |
| | |
Household Products — 0.8% |
Church & Dwight Co., Inc. | | |
Procter & Gamble Co. (The) | | |
| | |
Industrial Conglomerates — 1.1% |
Honeywell International, Inc. | | |
|
| | |
|
| | |
| | |
| | |
| | |
| | |
Travelers Cos., Inc. (The) | | |
| | |
Interactive Media & Services — 5.8% |
Alphabet, Inc., Class A * | | |
SEE NOTES TO FINANCIAL STATEMENTS.
| J.P. Morgan Large Cap Funds | |
| | |
Common Stocks — continued |
Interactive Media & Services — continued |
Alphabet, Inc., Class C * | | |
Meta Platforms, Inc., Class A * | | |
| | |
|
| | |
Cognizant Technology Solutions Corp., Class A | | |
| | |
Life Sciences Tools & Services — 1.3% |
| | |
Thermo Fisher Scientific, Inc. | | |
| | |
|
| | |
| | |
| | |
| | |
| | |
|
Charter Communications, Inc., Class A * | | |
| | |
Liberty Media Corp-Liberty SiriusXM, Class A * | | |
| | |
|
| | |
|
| | |
Public Service Enterprise Group, Inc. | | |
| | |
Oil, Gas & Consumable Fuels — 3.8% |
| | |
| | |
| | |
| | |
| | |
| | |
| | |
Passenger Airlines — 0.1% |
| | |
| | |
|
Personal Care Products — 0.3% |
| | |
|
| | |
| | |
| | |
| | |
| | |
Professional Services — 0.2% |
| | |
|
Equity LifeStyle Properties, Inc. | | |
| | |
| | |
| | |
Semiconductors & Semiconductor Equipment — 8.7% |
Advanced Micro Devices, Inc. * | | |
| | |
| | |
| | |
| | |
NXP Semiconductors NV (China) | | |
| | |
| | |
| | |
| | |
|
| | |
Cadence Design Systems, Inc. * | | |
| | |
| | |
| | |
| | |
| | |
|
Digital Realty Trust, Inc. | | |
| | |
| | |
|
| | |
| | |
SEE NOTES TO FINANCIAL STATEMENTS.
| J.P. Morgan Large Cap Funds | |
JPMorgan U.S. Research Enhanced Equity Fund
SCHEDULE OF PORTFOLIO INVESTMENTSAS OF December 31, 2023 (Unaudited) (continued)
| | |
Common Stocks — continued |
Specialty Retail — continued |
| | |
Burlington Stores, Inc. * | | |
| | |
O'Reilly Automotive, Inc. * | | |
| | |
| | |
Technology Hardware, Storage & Peripherals — 7.3% |
| | |
Seagate Technology Holdings plc | | |
| | |
|
| | |
Philip Morris International, Inc. | | |
| | |
Trading Companies & Distributors — 0.2% |
| | |
Wireless Telecommunication Services — 0.2% |
| | |
Total Common Stocks
(Cost $4,519,798) | | |
| | |
Short-Term Investments — 0.8% |
Investment Companies — 0.8% |
JPMorgan Prime Money Market Fund Class IM Shares, 5.51% (a) (b)
(Cost $62,266) | | |
Total Investments — 99.9%
(Cost $4,582,064) | | |
Other Assets Less Liabilities — 0.1% | | |
| | |
Percentages indicated are based on net assets. |
| |
| Real Estate Investment Trust |
| Non-income producing security. |
| Investment in an affiliated fund, which is registered under the Investment Company Act of 1940, as amended, and is advised by J.P. Morgan Investment Management Inc. |
| The rate shown is the current yield as of December 31, 2023. |
Futures contracts outstanding as of December 31, 2023 (amounts in thousands, except number of contracts):
| | | | | VALUE AND
UNREALIZED
APPRECIATION
(DEPRECIATION) ($) |
| | | | | |
| | | | | |
SEE NOTES TO FINANCIAL STATEMENTS.
| J.P. Morgan Large Cap Funds | |
JPMorgan U.S. Sustainable Leaders Fund
SCHEDULE OF PORTFOLIO INVESTMENTSAS OF December 31, 2023 (Unaudited)
| | |
|
Automobile Components — 0.6% |
| | |
|
| | |
|
| | |
| | |
| | |
| | |
|
| | |
Regeneron Pharmaceuticals, Inc. * | | |
Vertex Pharmaceuticals, Inc. * | | |
| | |
|
| | |
|
| | |
|
Charles Schwab Corp. (The) | | |
| | |
| | |
| | |
| | |
|
| | |
| | |
| | |
Commercial Services & Supplies — 1.1% |
| | |
Consumer Staples Distribution & Retail — 3.0% |
| | |
| | |
| | |
Containers & Packaging — 0.5% |
| | |
Diversified Telecommunication Services — 0.8% |
Verizon Communications, Inc. | | |
Electric Utilities — 3.2% |
| | |
| | |
|
Electric Utilities — continued |
| | |
| | |
| | |
Electrical Equipment — 1.6% |
| | |
Energy Equipment & Services — 1.8% |
| | |
|
| | |
| | |
| | |
Financial Services — 3.6% |
Mastercard, Inc., Class A | | |
|
| | |
Ground Transportation — 1.5% |
| | |
Health Care Equipment & Supplies — 2.6% |
Boston Scientific Corp. * | | |
| | |
| | |
Health Care Providers & Services — 3.2% |
| | |
| | |
| | |
|
| | |
|
Marsh & McLennan Cos., Inc. | | |
| | |
| | |
Travelers Cos., Inc. (The) | | |
| | |
Interactive Media & Services — 4.7% |
Alphabet, Inc., Class A * | | |
|
| | |
SEE NOTES TO FINANCIAL STATEMENTS.
| J.P. Morgan Large Cap Funds | |
JPMorgan U.S. Sustainable Leaders Fund
SCHEDULE OF PORTFOLIO INVESTMENTSAS OF December 31, 2023 (Unaudited) (continued)
| | |
Common Stocks — continued |
Life Sciences Tools & Services — 2.9% |
| | |
Thermo Fisher Scientific, Inc. | | |
| | |
|
| | |
| | |
| | |
|
Charter Communications, Inc., Class A * | | |
|
| | |
Personal Care Products — 0.4% |
Estee Lauder Cos., Inc. (The), Class A | | |
|
| | |
| | |
| | |
| | |
Semiconductors & Semiconductor Equipment — 6.9% |
Advanced Micro Devices, Inc. * | | |
| | |
| | |
NXP Semiconductors NV (China) | | |
| | |
| | |
|
| | |
| | |
Cadence Design Systems, Inc. * | | |
Crowdstrike Holdings, Inc., Class A * | | |
| | |
| | |
| | |
Palo Alto Networks, Inc. * | | |
| | |
| | |
|
|
| | |
| | |
| | |
|
| | |
| | |
| | |
| | |
| | |
Technology Hardware, Storage & Peripherals — 7.0% |
| | |
Seagate Technology Holdings plc | | |
| | |
Total Common Stocks
(Cost $138,156) | | |
Short-Term Investments — 1.5% |
Investment Companies — 1.5% |
JPMorgan Prime Money Market Fund Class IM Shares, 5.51% (a) (b)
(Cost $2,901) | | |
Total Investments — 99.8%
(Cost $141,057) | | |
Other Assets Less Liabilities — 0.2% | | |
| | |
Percentages indicated are based on net assets. |
| |
| Real Estate Investment Trust |
| Non-income producing security. |
| Investment in an affiliated fund, which is registered under the Investment Company Act of 1940, as amended, and is advised by J.P. Morgan Investment Management Inc. |
| The rate shown is the current yield as of December 31, 2023. |
SEE NOTES TO FINANCIAL STATEMENTS.
| J.P. Morgan Large Cap Funds | |
Futures contracts outstanding as of December 31, 2023 (amounts in thousands, except number of contracts):
| | | | | VALUE AND
UNREALIZED
APPRECIATION
(DEPRECIATION) ($) |
| | | | | |
S&P 500 E-Mini ESG Equity Index | | | | | |
SEE NOTES TO FINANCIAL STATEMENTS.
| J.P. Morgan Large Cap Funds | |
SCHEDULE OF PORTFOLIO INVESTMENTSAS OF December 31, 2023 (Unaudited)
| | |
|
Aerospace & Defense — 3.5% |
| | |
| | |
| | |
| | |
Air Freight & Logistics — 1.9% |
United Parcel Service, Inc., Class B | | |
|
| | |
| | |
PNC Financial Services Group, Inc. (The) | | |
| | |
| | |
| | |
|
| | |
|
| | |
| | |
Regeneron Pharmaceuticals, Inc. * | | |
Vertex Pharmaceuticals, Inc. * | | |
| | |
|
| | |
|
| | |
Charles Schwab Corp. (The) | | |
Goldman Sachs Group, Inc. (The) | | |
| | |
| | |
| | |
|
Air Products and Chemicals, Inc. | | |
Axalta Coating Systems Ltd. * | | |
| | |
Commercial Services & Supplies — 0.9% |
| | |
Construction Materials — 1.4% |
| | |
| | |
|
|
| | |
Capital One Financial Corp. | | |
| | |
Consumer Staples Distribution & Retail — 1.8% |
| | |
| | |
| | |
Containers & Packaging — 0.4% |
| | |
Electric Utilities — 2.2% |
| | |
| | |
| | |
| | |
Electrical Equipment — 1.4% |
| | |
|
| | |
Financial Services — 2.1% |
Berkshire Hathaway, Inc., Class B * | | |
|
Mondelez International, Inc., Class A | | |
Ground Transportation — 2.1% |
| | |
| | |
| | |
Health Care Equipment & Supplies — 3.4% |
| | |
Boston Scientific Corp. * | | |
| | |
Zimmer Biomet Holdings, Inc. | | |
| | |
Health Care Providers & Services — 4.6% |
| | |
| | |
| | |
| | |
Universal Health Services, Inc., Class B | | |
| | |
SEE NOTES TO FINANCIAL STATEMENTS.
| J.P. Morgan Large Cap Funds | |
| | |
Common Stocks — continued |
|
| | |
Hotel & Resort REITs — 0.6% |
Host Hotels & Resorts, Inc. | | |
Hotels, Restaurants & Leisure — 1.6% |
| | |
| | |
| | |
Household Products — 1.2% |
Procter & Gamble Co. (The) | | |
|
| | |
Hartford Financial Services Group, Inc. (The) | | |
Marsh & McLennan Cos., Inc. | | |
| | |
Prudential Financial, Inc. | | |
| | |
Interactive Media & Services — 2.1% |
Alphabet, Inc., Class C * | | |
Meta Platforms, Inc., Class A * | | |
| | |
|
International Business Machines Corp. | | |
|
| | |
| | |
| | |
|
| | |
|
| | |
Public Service Enterprise Group, Inc. | | |
| | |
Oil, Gas & Consumable Fuels — 8.2% |
| | |
| | |
| | |
| | |
| | |
| | |
|
|
| | |
| | |
| | |
| | |
| | |
| | |
|
AvalonBay Communities, Inc. | | |
Semiconductors & Semiconductor Equipment — 6.1% |
Advanced Micro Devices, Inc. * | | |
| | |
NXP Semiconductors NV (China) | | |
| | |
| | |
| | |
|
| | |
|
| | |
| | |
| | |
O'Reilly Automotive, Inc. * | | |
| | |
| | |
Textiles, Apparel & Luxury Goods — 0.8% |
| | |
|
Philip Morris International, Inc. | | |
Wireless Telecommunication Services — 0.5% |
| | |
Total Common Stocks
(Cost $4,352,811) | | |
SEE NOTES TO FINANCIAL STATEMENTS.
| J.P. Morgan Large Cap Funds | |
SCHEDULE OF PORTFOLIO INVESTMENTSAS OF December 31, 2023 (Unaudited) (continued)
| | |
Short-Term Investments — 1.4% |
Investment Companies — 1.4% |
JPMorgan Prime Money Market Fund Class IM Shares, 5.51% (a) (b)
(Cost $74,664) | | |
Total Investments — 100.0%
(Cost $4,427,475) | | |
Other Assets Less Liabilities — 0.0% ^ | | |
| | |
Percentages indicated are based on net assets. |
| |
| Real Estate Investment Trust |
| Amount rounds to less than 0.1% of net assets. |
| Non-income producing security. | |
| Investment in an affiliated fund, which is registered under the Investment Company Act of 1940, as amended, and is advised by J.P. Morgan Investment Management Inc. | |
| The rate shown is the current yield as of December 31, 2023. | |
SEE NOTES TO FINANCIAL STATEMENTS.
| J.P. Morgan Large Cap Funds | |
STATEMENTS OF ASSETS AND LIABILITIESAS OF December 31, 2023 (Unaudited)
(Amounts in thousands, except per share amounts)
| JPMorgan
Equity Income
Fund | | JPMorgan
Equity Premium
Income Fund | |
| | | | |
Investments in non-affiliates, at value | | | | |
Investments in affiliates, at value | | | | |
Investments of cash collateral received from securities loaned, at value (See Note 2.C.) | | | | |
Options purchased, at value | | | | |
| | | | |
Deposits at broker for futures contracts | | | | |
| | | | |
Investment securities sold | | | | |
| | | | |
Interest from non-affiliates | | | | |
Dividends from non-affiliates | | | | |
Dividends from affiliates | | | | |
Securities lending income (See Note 2.C.) | | | | |
| | | | |
| | | | |
| | | | |
| | | | |
| | | | |
| | | | |
Investment securities purchased | | | | |
Collateral received on securities loaned (See Note 2.C.) | | | | |
| | | | |
Variation margin on futures contracts | | | | |
Outstanding options written, at fair value | | | | |
| | | | |
| | | | |
| | | | |
| | | | |
| | | | |
Custodian and accounting fees | | | | |
Trustees’ and Chief Compliance Officer’s fees | | | | |
| | | | |
| | | | |
| | | | |
(a)
Amount rounds to less than one thousand.
SEE NOTES TO FINANCIAL STATEMENTS.
| J.P. Morgan Large Cap Funds | |
STATEMENTS OF ASSETS AND LIABILITIESAS OF December 31, 2023 (Unaudited) (continued)
(Amounts in thousands, except per share amounts)
| JPMorgan Equity Income Fund | | JPMorgan Equity Premium Income Fund | |
| | | | |
| | | | |
Total distributable earnings (loss) | | | | |
| | | | |
| | | | |
| | | | |
| | | | |
| | | | |
| | | | |
| | | | |
| | | | |
| | | | |
| | | | |
| | | | |
Outstanding units of beneficial interest (shares)
($0.0001 par value; unlimited number of shares authorized): | | | | |
| | | | |
| | | | |
| | | | |
| | | | |
| | | | |
| | | | |
| | | | |
| | | | |
| | | | |
Class A — Redemption price per share | | | | |
Class C — Offering price per share (b) | | | | |
Class I — Offering and redemption price per share | | | | |
Class R2 — Offering and redemption price per share | | | | |
Class R3 — Offering and redemption price per share | | | | |
Class R4 — Offering and redemption price per share | | | | |
Class R5 — Offering and redemption price per share | | | | |
Class R6 — Offering and redemption price per share | | | | |
Class A maximum sales charge | | | | |
Class A maximum public offering price per share
[net asset value per share/(100% – maximum sales charge)] | | | | |
Cost of investments in non-affiliates | | | | |
Cost of investments in affiliates | | | | |
Cost of options purchased | | | | |
Investment securities on loan, at value (See Note 2.C.) | | | | |
Cost of investment of cash collateral (See Note 2.C.) | | | | |
Premiums received from options written | | | | |
(a)
Per share amounts may not recalculate due to rounding of net assets and/or shares outstanding.
(b)
Redemption price for Class C Shares varies based upon length of time the shares are held.
SEE NOTES TO FINANCIAL STATEMENTS.
| J.P. Morgan Large Cap Funds | |
| JPMorgan
Hedged
Equity 2 Fund | JPMorgan
Hedged
Equity 3 Fund | JPMorgan
Large Cap
Growth Fund | |
| | | | |
Investments in non-affiliates, at value | | | | |
Investments in affiliates, at value | | | | |
Investments of cash collateral received from securities loaned, at value (See Note 2.C.) | | | | |
Options purchased, at value | | | | |
| | | | |
Deposits at broker for futures contracts | | | | |
| | | | |
Investment securities sold | | | | |
| | | | |
Dividends from non-affiliates | | | | |
Dividends from affiliates | | | | |
Securities lending income (See Note 2.C.) | | | | |
| | | | |
| | | | |
| | | | |
Investment securities purchased | | | | |
Collateral received on securities loaned (See Note 2.C.) | | | | |
| | | | |
Variation margin on futures contracts | | | | |
Outstanding options written, at fair value | | | | |
| | | | |
| | | | |
| | | | |
| | | | |
| | | | |
Custodian and accounting fees | | | | |
Trustees’ and Chief Compliance Officer’s fees | | | | |
| | | | |
| | | | |
| | | | |
(a)
Amount rounds to less than one thousand.
SEE NOTES TO FINANCIAL STATEMENTS.
| J.P. Morgan Large Cap Funds | |
STATEMENTS OF ASSETS AND LIABILITIESAS OF December 31, 2023 (Unaudited) (continued)
(Amounts in thousands, except per share amounts)
| JPMorgan Hedged Equity 2 Fund | JPMorgan Hedged Equity 3 Fund | JPMorgan Large Cap Growth Fund | |
| | | | |
| | | | |
Total distributable earnings (loss) | | | | |
| | | | |
| | | | |
| | | | |
| | | | |
| | | | |
| | | | |
| | | | |
| | | | |
| | | | |
| | | | |
| | | | |
Outstanding units of beneficial interest (shares)
($0.0001 par value; unlimited number of shares authorized): | | | | |
| | | | |
| | | | |
| | | | |
| | | | |
| | | | |
| | | | |
| | | | |
| | | | |
| | | | |
Class A — Redemption price per share | | | | |
Class C — Offering price per share (b) | | | | |
Class I — Offering and redemption price per share | | | | |
Class R2 — Offering and redemption price per share | | | | |
Class R3 — Offering and redemption price per share | | | | |
Class R4 — Offering and redemption price per share | | | | |
Class R5 — Offering and redemption price per share | | | | |
Class R6 — Offering and redemption price per share | | | | |
Class A maximum sales charge | | | | |
Class A maximum public offering price per share
[net asset value per share/(100% – maximum sales charge)] | | | | |
Cost of investments in non-affiliates | | | | |
Cost of investments in affiliates | | | | |
Cost of options purchased | | | | |
Investment securities on loan, at value (See Note 2.C.) | | | | |
Cost of investment of cash collateral (See Note 2.C.) | | | | |
Premiums received from options written | | | | |
(a)
Per share amounts may not recalculate due to rounding of net assets and/or shares outstanding.
(b)
Redemption price for Class C Shares varies based upon length of time the shares are held.
SEE NOTES TO FINANCIAL STATEMENTS.
| J.P. Morgan Large Cap Funds | |
| JPMorgan
U.S. Applied
Data Science
Value Fund | | JPMorgan
U.S. GARP
Equity Fund | JPMorgan
U.S. Large
Cap Core
|
| | | | |
Investments in non-affiliates, at value | | | | |
Investments in affiliates, at value | | | | |
Investments of cash collateral received from securities loaned, at value (See Note 2.C.) | | | | |
| | | | |
Deposits at broker for futures contracts | | | | |
| | | | |
Investment securities sold | | | | |
| | | | |
Dividends from non-affiliates | | | | |
Dividends from affiliates | | | | |
Securities lending income (See Note 2.C.) | | | | |
| | | | |
| | | | |
| | | | |
| | | | |
Securities sold short, at value | | | | |
Dividend expense to non-affiliates on securities sold short | | | | |
Investment securities purchased | | | | |
Interest expense to non-affiliates on securities sold short | | | | |
Collateral received on securities loaned (See Note 2.C.) | | | | |
| | | | |
Variation margin on futures contracts | | | | |
| | | | |
| | | | |
| | | | |
| | | | |
| | | | |
Custodian and accounting fees | | | | |
Trustees’ and Chief Compliance Officer’s fees | | | | |
| | | | |
| | | | |
| | | | |
(a)
Amount rounds to less than one thousand.
SEE NOTES TO FINANCIAL STATEMENTS.
| J.P. Morgan Large Cap Funds | |
STATEMENTS OF ASSETS AND LIABILITIESAS OF December 31, 2023 (Unaudited) (continued)
(Amounts in thousands, except per share amounts)
| JPMorgan U.S. Applied Data Science Value Fund | | JPMorgan U.S. GARP Equity Fund | JPMorgan U.S. Large Cap Core |
| | | | |
| | | | |
Total distributable earnings (loss) | | | | |
| | | | |
| | | | |
| | | | |
| | | | |
| | | | |
| | | | |
| | | | |
| | | | |
| | | | |
| | | | |
| | | | |
| | | | |
Outstanding units of beneficial interest (shares)
($0.0001 par value; unlimited number of shares authorized): | | | | |
| | | | |
| | | | |
| | | | |
| | | | |
| | | | |
| | | | |
| | | | |
| | | | |
| | | | |
| | | | |
Class A — Redemption price per share | | | | |
Class C — Offering price per share (b) | | | | |
Class I — Offering and redemption price per share | | | | |
Class L — Offering and redemption price per share | | | | |
Class R2 — Offering and redemption price per share | | | | |
Class R3 — Offering and redemption price per share | | | | |
Class R4 — Offering and redemption price per share | | | | |
Class R5 — Offering and redemption price per share | | | | |
Class R6 — Offering and redemption price per share | | | | |
Class A maximum sales charge | | | | |
Class A maximum public offering price per share
[net asset value per share/(100% – maximum sales charge)] | | | | |
Cost of investments in non-affiliates | | | | |
Cost of investments in affiliates | | | | |
Investment securities on loan, at value (See Note 2.C.) | | | | |
Cost of investment of cash collateral (See Note 2.C.) | | | | |
Proceeds from securities sold short | | | | |
(a)
Per share amounts may not recalculate due to rounding of net assets and/or shares outstanding.
(b)
Redemption price for Class C Shares varies based upon length of time the shares are held.
SEE NOTES TO FINANCIAL STATEMENTS.
| J.P. Morgan Large Cap Funds | |
| JPMorgan
U.S. Research
Enhanced
Equity Fund | JPMorgan
U.S. Sustainable
Leaders Fund | |
| | | |
Investments in non-affiliates, at value | | | |
Investments in affiliates, at value | | | |
| | | |
Deposits at broker for futures contracts | | | |
| | | |
Investment securities sold | | | |
| | | |
Dividends from non-affiliates | | | |
Dividends from affiliates | | | |
| | | |
| | | |
| | | |
Investment securities purchased | | | |
| | | |
Variation margin on futures contracts | | | |
| | | |
| | | |
| | | |
| | | |
| | | |
Custodian and accounting fees | | | |
Trustees’ and Chief Compliance Officer’s fees | | | |
| | | |
| | | |
| | | |
(a)
Amount rounds to less than one thousand.
SEE NOTES TO FINANCIAL STATEMENTS.
| J.P. Morgan Large Cap Funds | |
STATEMENTS OF ASSETS AND LIABILITIESAS OF December 31, 2023 (Unaudited) (continued)
(Amounts in thousands, except per share amounts)
| JPMorgan U.S. Research Enhanced Equity Fund | JPMorgan U.S. Sustainable Leaders Fund | |
| | | |
| | | |
Total distributable earnings (loss) | | | |
| | | |
| | | |
| | | |
| | | |
| | | |
| | | |
| | | |
| | | |
| | | |
| | | |
| | | |
Outstanding units of beneficial interest (shares)
($0.0001 par value; unlimited number of shares authorized): | | | |
| | | |
| | | |
| | | |
| | | |
| | | |
| | | |
| | | |
| | | |
| | | |
Class A — Redemption price per share | | | |
Class C — Offering price per share (b) | | | |
Class I — Offering and redemption price per share | | | |
Class R2 — Offering and redemption price per share | | | |
Class R3 — Offering and redemption price per share | | | |
Class R4 — Offering and redemption price per share | | | |
Class R5 — Offering and redemption price per share | | | |
Class R6 — Offering and redemption price per share | | | |
Class A maximum sales charge | | | |
Class A maximum public offering price per share
[net asset value per share/(100% – maximum sales charge)] | | | |
Cost of investments in non-affiliates | | | |
Cost of investments in affiliates | | | |
(a)
Per share amounts may not recalculate due to rounding of net assets and/or shares outstanding.
(b)
Redemption price for Class C Shares varies based upon length of time the shares are held.
SEE NOTES TO FINANCIAL STATEMENTS.
| J.P. Morgan Large Cap Funds | |
STATEMENTS OF OPERATIONSFOR THE SIX MONTHS ENDED December 31, 2023 (Unaudited)
(Amounts in thousands)
| JPMorgan
Equity Income
Fund | | JPMorgan
Equity Premium
Income Fund | |
| | | | |
Interest income from non-affiliates | | | | |
Interest income from affiliates | | | | |
Dividend income from non-affiliates | | | | |
Dividend income from affiliates | | | | |
Income from securities lending (net) (See Note 2.C.) | | | | |
| | | | |
| | | | |
| | | | |
| | | | |
| | | | |
| | | | |
| | | | |
| | | | |
| | | | |
| | | | |
| | | | |
| | | | |
| | | | |
| | | | |
| | | | |
| | | | |
| | | | |
Custodian and accounting fees | | | | |
Interest expense to affiliates | | | | |
| | | | |
Trustees’ and Chief Compliance Officer’s fees | | | | |
Printing and mailing costs | | | | |
Registration and filing fees | | | | |
Transfer agency fees (See Note 2.K.) | | | | |
| | | | |
| | | | |
| | | | |
Less expense reimbursements | | | | |
| | | | |
Net investment income (loss) | | | | |
(a)
Amount rounds to less than one thousand.
SEE NOTES TO FINANCIAL STATEMENTS.
| J.P. Morgan Large Cap Funds | |
STATEMENTS OF OPERATIONSFOR THE SIX MONTHS ENDED December 31, 2023 (Unaudited) (continued)
(Amounts in thousands)
| JPMorgan Equity Income Fund | | JPMorgan Equity Premium Income Fund | |
REALIZED/UNREALIZED GAINS (LOSSES): | | | | |
Net realized gain (loss) on transactions from: | | | | |
Investments in non-affiliates | | | | |
Investments in affiliates | | | | |
| | | | |
| | | | |
| | | | |
| | | | |
Change in net unrealized appreciation/depreciation on: | | | | |
Investments in non-affiliates | | | | |
Investments in affiliates | | | | |
| | | | |
| | | | |
| | | | |
Change in net unrealized appreciation/depreciation | | | | |
Net realized/unrealized gains (losses) | | | | |
Change in net assets resulting from operations | | | | |
SEE NOTES TO FINANCIAL STATEMENTS.
| J.P. Morgan Large Cap Funds | |
| JPMorgan
Hedged
Equity 2 Fund | JPMorgan
Hedged
Equity 3 Fund | JPMorgan
Large Cap
Growth Fund | |
| | | | |
Interest income from non-affiliates | | | | |
Interest income from affiliates | | | | |
Dividend income from non-affiliates | | | | |
Dividend income from affiliates | | | | |
Income from securities lending (net) (See Note 2.C.) | | | | |
| | | | |
| | | | |
| | | | |
| | | | |
| | | | |
| | | | |
| | | | |
| | | | |
| | | | |
| | | | |
| | | | |
| | | | |
| | | | |
| | | | |
| | | | |
| | | | |
| | | | |
Custodian and accounting fees | | | | |
Interest expense to affiliates | | | | |
| | | | |
Trustees’ and Chief Compliance Officer’s fees | | | | |
Printing and mailing costs | | | | |
Registration and filing fees | | | | |
Transfer agency fees (See Note 2.K.) | | | | |
| | | | |
| | | | |
| | | | |
Less expense reimbursements | | | | |
| | | | |
Net investment income (loss) | | | | |
(a)
Amount rounds to less than one thousand.
SEE NOTES TO FINANCIAL STATEMENTS.
| J.P. Morgan Large Cap Funds | |
STATEMENTS OF OPERATIONSFOR THE SIX MONTHS ENDED December 31, 2023 (Unaudited) (continued)
(Amounts in thousands)
| JPMorgan Hedged Equity 2 Fund | JPMorgan Hedged Equity 3 Fund | JPMorgan Large Cap Growth Fund | |
REALIZED/UNREALIZED GAINS (LOSSES): | | | | |
Net realized gain (loss) on transactions from: | | | | |
Investments in non-affiliates | | | | |
Investments in affiliates | | | | |
| | | | |
| | | | |
Foreign currency transactions | | | | |
| | | | |
| | | | |
Change in net unrealized appreciation/depreciation on: | | | | |
Investments in non-affiliates | | | | |
Investments in affiliates | | | | |
| | | | |
| | | | |
| | | | |
Change in net unrealized appreciation/depreciation | | | | |
Net realized/unrealized gains (losses) | | | | |
Change in net assets resulting from operations | | | | |
SEE NOTES TO FINANCIAL STATEMENTS.
| J.P. Morgan Large Cap Funds | |
| JPMorgan
U.S. Applied
Data Science
Value Fund | | JPMorgan
U.S. GARP
Equity Fund | JPMorgan
U.S. Large
Cap Core
|
| | | | |
Interest income from non-affiliates | | | | |
Interest income from affiliates | | | | |
Dividend income from non-affiliates | | | | |
Dividend income from affiliates | | | | |
Income from securities lending (net) (See Note 2.C.) | | | | |
| | | | |
| | | | |
| | | | |
| | | | |
| | | | |
| | | | |
| | | | |
| | | | |
| | | | |
| | | | |
| | | | |
| | | | |
| | | | |
| | | | |
| | | | |
| | | | |
| | | | |
| | | | |
Custodian and accounting fees | | | | |
Interest expense to affiliates | | | | |
| | | | |
Trustees’ and Chief Compliance Officer’s fees | | | | |
Printing and mailing costs | | | | |
Registration and filing fees | | | | |
Transfer agency fees (See Note 2.K.) | | | | |
Dividend expense to non-affiliates on securities sold short | | | | |
Interest expense to non-affiliates on securities sold short | | | | |
| | | | |
| | | | |
| | | | |
Less expense reimbursements | | | | |
| | | | |
Net investment income (loss) | | | | |
(a)
Amount rounds to less than one thousand.
SEE NOTES TO FINANCIAL STATEMENTS.
| J.P. Morgan Large Cap Funds | |
STATEMENTS OF OPERATIONSFOR THE SIX MONTHS ENDED December 31, 2023 (Unaudited) (continued)
(Amounts in thousands)
| JPMorgan U.S. Applied Data Science Value Fund | | JPMorgan U.S. GARP Equity Fund | JPMorgan U.S. Large Cap Core |
REALIZED/UNREALIZED GAINS (LOSSES): | | | | |
Net realized gain (loss) on transactions from: | | | | |
Investments in non-affiliates | | | | |
Investments in affiliates | | | | |
| | | | |
| | | | |
| | | | |
Change in net unrealized appreciation/depreciation on: | | | | |
Investments in non-affiliates | | | | |
Investments in affiliates | | | | |
| | | | |
| | | | |
Change in net unrealized appreciation/depreciation | | | | |
Net realized/unrealized gains (losses) | | | | |
Change in net assets resulting from operations | | | | |
(a)
Amount rounds to less than one thousand.
SEE NOTES TO FINANCIAL STATEMENTS.
| J.P. Morgan Large Cap Funds | |
| JPMorgan
U.S. Research
Enhanced
Equity Fund | JPMorgan
U.S. Sustainable
Leaders Fund | |
| | | |
Interest income from non-affiliates | | | |
Interest income from affiliates | | | |
Dividend income from non-affiliates | | | |
Dividend income from affiliates | | | |
Income from securities lending (net) (See Note 2.C.) | | | |
| | | |
| | | |
| | | |
| | | |
| | | |
| | | |
| | | |
| | | |
| | | |
| | | |
| | | |
| | | |
| | | |
| | | |
| | | |
| | | |
| | | |
Custodian and accounting fees | | | |
| | | |
Trustees’ and Chief Compliance Officer’s fees | | | |
Printing and mailing costs | | | |
Registration and filing fees | | | |
Transfer agency fees (See Note 2.K.) | | | |
| | | |
| | | |
| | | |
Less expense reimbursements | | | |
| | | |
Net investment income (loss) | | | |
(a)
Amount rounds to less than one thousand.
SEE NOTES TO FINANCIAL STATEMENTS.
| J.P. Morgan Large Cap Funds | |
STATEMENTS OF OPERATIONSFOR THE SIX MONTHS ENDED December 31, 2023 (Unaudited) (continued)
(Amounts in thousands)
| JPMorgan U.S. Research Enhanced Equity Fund | JPMorgan U.S. Sustainable Leaders Fund | |
REALIZED/UNREALIZED GAINS (LOSSES): | | | |
Net realized gain (loss) on transactions from: | | | |
Investments in non-affiliates | | | |
Investments in affiliates | | | |
| | | |
| | | |
Change in net unrealized appreciation/depreciation on: | | | |
Investments in non-affiliates | | | |
Investments in affiliates | | | |
| | | |
Change in net unrealized appreciation/depreciation | | | |
Net realized/unrealized gains (losses) | | | |
Change in net assets resulting from operations | | | |
(a)
Amount rounds to less than one thousand.
SEE NOTES TO FINANCIAL STATEMENTS.
| J.P. Morgan Large Cap Funds | |
STATEMENTS OF CHANGES IN NET ASSETSFOR THE PERIODS INDICATED
(Amounts in thousands)
| JPMorgan Equity Income Fund | JPMorgan Equity Index Fund |
| Six Months Ended
December 31, 2023
(Unaudited) | | Six Months Ended
December 31, 2023
(Unaudited) | |
CHANGE IN NET ASSETS RESULTING FROM OPERATIONS: | | | | |
Net investment income (loss) | | | | |
| | | | |
Change in net unrealized appreciation/depreciation | | | | |
Change in net assets resulting from operations | | | | |
DISTRIBUTIONS TO SHAREHOLDERS: | | | | |
| | | | |
| | | | |
| | | | |
| | | | |
| | | | |
| | | | |
| | | | |
| | | | |
Total distributions to shareholders | | | | |
| | | | |
Change in net assets resulting from capital transactions | | | | |
| | | | |
| | | | |
| | | | |
| | | | |
SEE NOTES TO FINANCIAL STATEMENTS.
| J.P. Morgan Large Cap Funds | |
STATEMENTS OF CHANGES IN NET ASSETSFOR THE PERIODS INDICATED (continued)
(Amounts in thousands)
| JPMorgan Equity Premium
Income Fund | JPMorgan Hedged Equity Fund |
| Six Months Ended
December 31, 2023
(Unaudited) | | Six Months Ended
December 31, 2023
(Unaudited) | |
CHANGE IN NET ASSETS RESULTING FROM OPERATIONS: | | | | |
Net investment income (loss) | | | | |
| | | | |
Change in net unrealized appreciation/depreciation | | | | |
Change in net assets resulting from operations | | | | |
DISTRIBUTIONS TO SHAREHOLDERS: | | | | |
| | | | |
| | | | |
| | | | |
| | | | |
| | | | |
Total distributions to shareholders | | | | |
| | | | |
Change in net assets resulting from capital transactions | | | | |
| | | | |
| | | | |
| | | | |
| | | | |
SEE NOTES TO FINANCIAL STATEMENTS.
| J.P. Morgan Large Cap Funds | |
| JPMorgan Hedged Equity 2 Fund | JPMorgan Hedged Equity 3 Fund |
| Six Months Ended
December 31, 2023
(Unaudited) | | Six Months Ended
December 31, 2023
(Unaudited) | |
CHANGE IN NET ASSETS RESULTING FROM OPERATIONS: | | | | |
Net investment income (loss) | | | | |
| | | | |
Change in net unrealized appreciation/depreciation | | | | |
Change in net assets resulting from operations | | | | |
DISTRIBUTIONS TO SHAREHOLDERS: | | | | |
| | | | |
| | | | |
| | | | |
| | | | |
| | | | |
Total distributions to shareholders | | | | |
| | | | |
Change in net assets resulting from capital transactions | | | | |
| | | | |
| | | | |
| | | | |
| | | | |
(a)
Amount rounds to less than one thousand.
SEE NOTES TO FINANCIAL STATEMENTS.
| J.P. Morgan Large Cap Funds | |
STATEMENTS OF CHANGES IN NET ASSETSFOR THE PERIODS INDICATED (continued)
(Amounts in thousands)
| JPMorgan Large Cap Growth Fund | JPMorgan Large Cap Value Fund |
| Six Months Ended
December 31, 2023
(Unaudited) | | Six Months Ended
December 31, 2023
(Unaudited) | |
CHANGE IN NET ASSETS RESULTING FROM OPERATIONS: | | | | |
Net investment income (loss) | | | | |
| | | | |
Change in net unrealized appreciation/depreciation | | | | |
Change in net assets resulting from operations | | | | |
DISTRIBUTIONS TO SHAREHOLDERS: | | | | |
| | | | |
| | | | |
| | | | |
| | | | |
| | | | |
| | | | |
| | | | |
| | | | |
Total distributions to shareholders | | | | |
| | | | |
Change in net assets resulting from capital transactions | | | | |
| | | | |
| | | | |
| | | | |
| | | | |
SEE NOTES TO FINANCIAL STATEMENTS.
| J.P. Morgan Large Cap Funds | |
| JPMorgan U.S. Applied Data Science Value Fund | JPMorgan U.S. Equity Fund |
| Six Months Ended
December 31, 2023
(Unaudited) | | Six Months Ended
December 31, 2023
(Unaudited) | |
CHANGE IN NET ASSETS RESULTING FROM OPERATIONS: | | | | |
Net investment income (loss) | | | | |
| | | | |
Change in net unrealized appreciation/depreciation | | | | |
Change in net assets resulting from operations | | | | |
DISTRIBUTIONS TO SHAREHOLDERS: | | | | |
| | | | |
| | | | |
| | | | |
| | | | |
| | | | |
| | | | |
| | | | |
| | | | |
| | | | |
Total distributions to shareholders | | | | |
| | | | |
Change in net assets resulting from capital transactions | | | | |
| | | | |
| | | | |
| | | | |
| | | | |
SEE NOTES TO FINANCIAL STATEMENTS.
| J.P. Morgan Large Cap Funds | |
STATEMENTS OF CHANGES IN NET ASSETSFOR THE PERIODS INDICATED (continued)
(Amounts in thousands)
| JPMorgan U.S. GARP Equity Fund | JPMorgan U.S. Large Cap Core Plus Fund |
| Six Months Ended
December 31, 2023
(Unaudited) | | Six Months Ended
December 31, 2023
(Unaudited) | |
CHANGE IN NET ASSETS RESULTING FROM OPERATIONS: | | | | |
Net investment income (loss) | | | | |
| | | | |
Change in net unrealized appreciation/depreciation | | | | |
Change in net assets resulting from operations | | | | |
DISTRIBUTIONS TO SHAREHOLDERS: | | | | |
| | | | |
| | | | |
| | | | |
| | | | |
| | | | |
| | | | |
Total distributions to shareholders | | | | |
| | | | |
Change in net assets resulting from capital transactions | | | | |
| | | | |
| | | | |
| | | | |
| | | | |
SEE NOTES TO FINANCIAL STATEMENTS.
| J.P. Morgan Large Cap Funds | |
| JPMorgan U.S. Research
Enhanced Equity Fund | JPMorgan U.S. Sustainable Leaders Fund |
| Six Months Ended
December 31, 2023
(Unaudited) | | Six Months Ended
December 31, 2023
(Unaudited) | |
CHANGE IN NET ASSETS RESULTING FROM OPERATIONS: | | | | |
Net investment income (loss) | | | | |
| | | | |
Change in net unrealized appreciation/depreciation | | | | |
Change in net assets resulting from operations | | | | |
DISTRIBUTIONS TO SHAREHOLDERS: | | | | |
| | | | |
| | | | |
| | | | |
| | | | |
Total distributions to shareholders | | | | |
| | | | |
Change in net assets resulting from capital transactions | | | | |
| | | | |
| | | | |
| | | | |
| | | | |
SEE NOTES TO FINANCIAL STATEMENTS.
| J.P. Morgan Large Cap Funds | |
STATEMENTS OF CHANGES IN NET ASSETSFOR THE PERIODS INDICATED (continued)
(Amounts in thousands)
| |
| Six Months Ended
December 31, 2023
(Unaudited) | |
CHANGE IN NET ASSETS RESULTING FROM OPERATIONS: | | |
Net investment income (loss) | | |
| | |
Change in net unrealized appreciation/depreciation | | |
Change in net assets resulting from operations | | |
DISTRIBUTIONS TO SHAREHOLDERS: | | |
| | |
| | |
| | |
| | |
| | |
| | |
| | |
| | |
Total distributions to shareholders | | |
| | |
Change in net assets resulting from capital transactions | | |
| | |
| | |
| | |
| | |
SEE NOTES TO FINANCIAL STATEMENTS.
| J.P. Morgan Large Cap Funds | |
| JPMorgan Equity Income Fund | JPMorgan Equity Index Fund |
| Six Months Ended December 31, 2023
(Unaudited) | | Six Months Ended December 31, 2023
(Unaudited) | |
| | | | |
| | | | |
Proceeds from shares issued | | | | |
| | | | |
| | | | |
Change in net assets resulting from Class A capital transactions | | | | |
| | | | |
Proceeds from shares issued | | | | |
| | | | |
| | | | |
Change in net assets resulting from Class C capital transactions | | | | |
| | | | |
Proceeds from shares issued | | | | |
| | | | |
| | | | |
Change in net assets resulting from Class I capital transactions | | | | |
| | | | |
Proceeds from shares issued | | | | |
| | | | |
| | | | |
Change in net assets resulting from Class R2 capital transactions | | | | |
| | | | |
Proceeds from shares issued | | | | |
| | | | |
| | | | |
Change in net assets resulting from Class R3 capital transactions | | | | |
| | | | |
Proceeds from shares issued | | | | |
| | | | |
| | | | |
Change in net assets resulting from Class R4 capital transactions | | | | |
| | | | |
Proceeds from shares issued | | | | |
| | | | |
| | | | |
Change in net assets resulting from Class R5 capital transactions | | | | |
SEE NOTES TO FINANCIAL STATEMENTS.
| J.P. Morgan Large Cap Funds | |
STATEMENTS OF CHANGES IN NET ASSETSFOR THE PERIODS INDICATED (continued)
(Amounts in thousands)
| JPMorgan Equity Income Fund | JPMorgan Equity Index Fund |
| Six Months Ended December 31, 2023 (Unaudited) | | Six Months Ended December 31, 2023 (Unaudited) | |
CAPITAL TRANSACTIONS: (continued) | | | | |
| | | | |
Proceeds from shares issued | | | | |
| | | | |
| | | | |
Change in net assets resulting from Class R6 capital transactions | | | | |
Total change in net assets resulting from capital transactions | | | | |
| | | | |
| | | | |
| | | | |
| | | | |
| | | | |
| | | | |
| | | | |
| | | | |
| | | | |
| | | | |
| | | | |
| | | | |
| | | | |
| | | | |
| | | | |
| | | | |
| | | | |
| | | | |
| | | | |
| | | | |
Change in Class R2 Shares | | | | |
| | | | |
| | | | |
| | | | |
| | | | |
Change in Class R3 Shares | | | | |
| | | | |
| | | | |
| | | | |
| | | | |
Change in Class R4 Shares | | | | |
SEE NOTES TO FINANCIAL STATEMENTS.
| J.P. Morgan Large Cap Funds | |
| JPMorgan Equity Income Fund | JPMorgan Equity Index Fund |
| Six Months Ended December 31, 2023 (Unaudited) | | Six Months Ended December 31, 2023 (Unaudited) | |
SHARE TRANSACTIONS: (continued) | | | | |
| | | | |
| | | | |
| | | | |
| | | | |
Change in Class R5 Shares | | | | |
| | | | |
| | | | |
| | | | |
| | | | |
Change in Class R6 Shares | | | | |
SEE NOTES TO FINANCIAL STATEMENTS.
| J.P. Morgan Large Cap Funds | |
STATEMENTS OF CHANGES IN NET ASSETSFOR THE PERIODS INDICATED (continued)
(Amounts in thousands)
| JPMorgan Equity Premium
Income Fund | JPMorgan Hedged Equity Fund |
| Six Months Ended December 31, 2023
(Unaudited) | | Six Months Ended December 31, 2023
(Unaudited) | |
| | | | |
| | | | |
Proceeds from shares issued | | | | |
| | | | |
| | | | |
Change in net assets resulting from Class A capital transactions | | | | |
| | | | |
Proceeds from shares issued | | | | |
| | | | |
| | | | |
Change in net assets resulting from Class C capital transactions | | | | |
| | | | |
Proceeds from shares issued | | | | |
| | | | |
| | | | |
Change in net assets resulting from Class I capital transactions | | | | |
| | | | |
Proceeds from shares issued | | | | |
| | | | |
| | | | |
Change in net assets resulting from Class R5 capital transactions | | | | |
| | | | |
Proceeds from shares issued | | | | |
| | | | |
| | | | |
Change in net assets resulting from Class R6 capital transactions | | | | |
Total change in net assets resulting from capital transactions | | | | |
| | | | |
| | | | |
| | | | |
| | | | |
| | | | |
| | | | |
| | | | |
| | | | |
| | | | |
| | | | |
| | | | |
SEE NOTES TO FINANCIAL STATEMENTS.
| J.P. Morgan Large Cap Funds | |
| JPMorgan Equity Premium Income Fund | JPMorgan Hedged Equity Fund |
| Six Months Ended December 31, 2023 (Unaudited) | | Six Months Ended December 31, 2023 (Unaudited) | |
SHARE TRANSACTIONS: (continued) | | | | |
| | | | |
| | | | |
| | | | |
| | | | |
| | | | |
| | | | |
| | | | |
| | | | |
| | | | |
Change in Class R5 Shares | | | | |
| | | | |
| | | | |
| | | | |
| | | | |
Change in Class R6 Shares | | | | |
SEE NOTES TO FINANCIAL STATEMENTS.
| J.P. Morgan Large Cap Funds | |
STATEMENTS OF CHANGES IN NET ASSETSFOR THE PERIODS INDICATED (continued)
(Amounts in thousands)
| JPMorgan Hedged Equity 2 Fund | JPMorgan Hedged Equity 3 Fund |
| Six Months Ended December 31, 2023
(Unaudited) | | Six Months Ended December 31, 2023
(Unaudited) | |
| | | | |
| | | | |
Proceeds from shares issued | | | | |
| | | | |
| | | | |
Change in net assets resulting from Class A capital transactions | | | | |
| | | | |
Proceeds from shares issued | | | | |
| | | | |
| | | | |
Change in net assets resulting from Class C capital transactions | | | | |
| | | | |
Proceeds from shares issued | | | | |
| | | | |
| | | | |
Change in net assets resulting from Class I capital transactions | | | | |
| | | | |
Proceeds from shares issued | | | | |
| | | | |
| | | | |
Change in net assets resulting from Class R5 capital transactions | | | | |
| | | | |
Proceeds from shares issued | | | | |
| | | | |
| | | | |
Change in net assets resulting from Class R6 capital transactions | | | | |
Total change in net assets resulting from capital transactions | | | | |
| | | | |
| | | | |
| | | | |
| | | | |
| | | | |
| | | | |
| | | | |
| | | | |
| | | | |
| | | | |
| | | | |
(a)
Amount rounds to less than one thousand.
SEE NOTES TO FINANCIAL STATEMENTS.
| J.P. Morgan Large Cap Funds | |
| JPMorgan Hedged Equity 2 Fund | JPMorgan Hedged Equity 3 Fund |
| Six Months Ended December 31, 2023 (Unaudited) | | Six Months Ended December 31, 2023 (Unaudited) | |
SHARE TRANSACTIONS: (continued) | | | | |
| | | | |
| | | | |
| | | | |
| | | | |
| | | | |
| | | | |
| | | | |
| | | | |
| | | | |
Change in Class R5 Shares | | | | |
| | | | |
| | | | |
| | | | |
| | | | |
Change in Class R6 Shares | | | | |
(a)
Amount rounds to less than one thousand.
SEE NOTES TO FINANCIAL STATEMENTS.
| J.P. Morgan Large Cap Funds | |
STATEMENTS OF CHANGES IN NET ASSETSFOR THE PERIODS INDICATED (continued)
(Amounts in thousands)
| JPMorgan Large Cap Growth Fund | JPMorgan Large Cap Value Fund |
| Six Months Ended December 31, 2023
(Unaudited) | | Six Months Ended December 31, 2023
(Unaudited) | |
| | | | |
| | | | |
Proceeds from shares issued | | | | |
| | | | |
| | | | |
Change in net assets resulting from Class A capital transactions | | | | |
| | | | |
Proceeds from shares issued | | | | |
| | | | |
| | | | |
Change in net assets resulting from Class C capital transactions | | | | |
| | | | |
Proceeds from shares issued | | | | |
| | | | |
| | | | |
Change in net assets resulting from Class I capital transactions | | | | |
| | | | |
Proceeds from shares issued | | | | |
| | | | |
| | | | |
Change in net assets resulting from Class R2 capital transactions | | | | |
| | | | |
Proceeds from shares issued | | | | |
| | | | |
| | | | |
Change in net assets resulting from Class R3 capital transactions | | | | |
| | | | |
Proceeds from shares issued | | | | |
| | | | |
| | | | |
Change in net assets resulting from Class R4 capital transactions | | | | |
| | | | |
Proceeds from shares issued | | | | |
| | | | |
| | | | |
Change in net assets resulting from Class R5 capital transactions | | | | |
SEE NOTES TO FINANCIAL STATEMENTS.
| J.P. Morgan Large Cap Funds | |
| JPMorgan Large Cap Growth Fund | JPMorgan Large Cap Value Fund |
| Six Months Ended December 31, 2023 (Unaudited) | | Six Months Ended December 31, 2023 (Unaudited) | |
CAPITAL TRANSACTIONS: (continued) | | | | |
| | | | |
Proceeds from shares issued | | | | |
| | | | |
| | | | |
Change in net assets resulting from Class R6 capital transactions | | | | |
Total change in net assets resulting from capital transactions | | | | |
| | | | |
| | | | |
| | | | |
| | | | |
| | | | |
| | | | |
| | | | |
| | | | |
| | | | |
| | | | |
| | | | |
| | | | |
| | | | |
| | | | |
| | | | |
| | | | |
| | | | |
| | | | |
| | | | |
| | | | |
Change in Class R2 Shares | | | | |
| | | | |
| | | | |
| | | | |
| | | | |
Change in Class R3 Shares | | | | |
| | | | |
| | | | |
| | | | |
| | | | |
Change in Class R4 Shares | | | | |
SEE NOTES TO FINANCIAL STATEMENTS.
| J.P. Morgan Large Cap Funds | |
STATEMENTS OF CHANGES IN NET ASSETSFOR THE PERIODS INDICATED (continued)
(Amounts in thousands)
| JPMorgan Large Cap Growth Fund | JPMorgan Large Cap Value Fund |
| Six Months Ended December 31, 2023 (Unaudited) | | Six Months Ended December 31, 2023 (Unaudited) | |
SHARE TRANSACTIONS: (continued) | | | | |
| | | | |
| | | | |
| | | | |
| | | | |
Change in Class R5 Shares | | | | |
| | | | |
| | | | |
| | | | |
| | | | |
Change in Class R6 Shares | | | | |
SEE NOTES TO FINANCIAL STATEMENTS.
| J.P. Morgan Large Cap Funds | |
| JPMorgan U.S. Applied Data Science Value Fund | JPMorgan U.S. Equity Fund |
| Six Months Ended December 31, 2023
(Unaudited) | | Six Months Ended December 31, 2023
(Unaudited) | |
| | | | |
| | | | |
Proceeds from shares issued | | | | |
| | | | |
| | | | |
Change in net assets resulting from Class A capital transactions | | | | |
| | | | |
Proceeds from shares issued | | | | |
| | | | |
| | | | |
Change in net assets resulting from Class C capital transactions | | | | |
| | | | |
Proceeds from shares issued | | | | |
| | | | |
| | | | |
Change in net assets resulting from Class I capital transactions | | | | |
| | | | |
Proceeds from shares issued | | | | |
| | | | |
| | | | |
Change in net assets resulting from Class L capital transactions | | | | |
| | | | |
Proceeds from shares issued | | | | |
| | | | |
| | | | |
Change in net assets resulting from Class R2 capital transactions | | | | |
| | | | |
Proceeds from shares issued | | | | |
| | | | |
| | | | |
Change in net assets resulting from Class R3 capital transactions | | | | |
SEE NOTES TO FINANCIAL STATEMENTS.
| J.P. Morgan Large Cap Funds | |
STATEMENTS OF CHANGES IN NET ASSETSFOR THE PERIODS INDICATED (continued)
(Amounts in thousands)
| JPMorgan U.S. Applied Data Science Value Fund | JPMorgan U.S. Equity Fund |
| Six Months Ended December 31, 2023 (Unaudited) | | Six Months Ended December 31, 2023 (Unaudited) | |
CAPITAL TRANSACTIONS: (continued) | | | | |
| | | | |
Proceeds from shares issued | | | | |
| | | | |
| | | | |
Change in net assets resulting from Class R4 capital transactions | | | | |
| | | | |
Proceeds from shares issued | | | | |
| | | | |
| | | | |
Change in net assets resulting from Class R5 capital transactions | | | | |
| | | | |
Proceeds from shares issued | | | | |
| | | | |
| | | | |
Change in net assets resulting from Class R6 capital transactions | | | | |
Total change in net assets resulting from capital transactions | | | | |
| | | | |
| | | | |
| | | | |
| | | | |
| | | | |
| | | | |
| | | | |
| | | | |
| | | | |
| | | | |
| | | | |
| | | | |
| | | | |
| | | | |
| | | | |
| | | | |
SEE NOTES TO FINANCIAL STATEMENTS.
| J.P. Morgan Large Cap Funds | |
| JPMorgan U.S. Applied Data Science Value Fund | JPMorgan U.S. Equity Fund |
| Six Months Ended December 31, 2023 (Unaudited) | | Six Months Ended December 31, 2023 (Unaudited) | |
SHARE TRANSACTIONS: (continued) | | | | |
| | | | |
| | | | |
| | | | |
| | | | |
| | | | |
| | | | |
| | | | |
| | | | |
| | | | |
Change in Class R2 Shares | | | | |
| | | | |
| | | | |
| | | | |
| | | | |
Change in Class R3 Shares | | | | |
| | | | |
| | | | |
| | | | |
| | | | |
Change in Class R4 Shares | | | | |
| | | | |
| | | | |
| | | | |
| | | | |
Change in Class R5 Shares | | | | |
| | | | |
| | | | |
| | | | |
| | | | |
Change in Class R6 Shares | | | | |
SEE NOTES TO FINANCIAL STATEMENTS.
| J.P. Morgan Large Cap Funds | |
STATEMENTS OF CHANGES IN NET ASSETSFOR THE PERIODS INDICATED (continued)
(Amounts in thousands)
| JPMorgan U.S. GARP Equity Fund | JPMorgan U.S. Large Cap Core Plus Fund |
| Six Months Ended December 31, 2023
(Unaudited) | | Six Months Ended December 31, 2023
(Unaudited) | |
| | | | |
| | | | |
Proceeds from shares issued | | | | |
| | | | |
| | | | |
Change in net assets resulting from Class A capital transactions | | | | |
| | | | |
Proceeds from shares issued | | | | |
| | | | |
| | | | |
Change in net assets resulting from Class C capital transactions | | | | |
| | | | |
Proceeds from shares issued | | | | |
| | | | |
| | | | |
Change in net assets resulting from Class I capital transactions | | | | |
| | | | |
Proceeds from shares issued | | | | |
| | | | |
| | | | |
Change in net assets resulting from Class R2 capital transactions | | | | |
| | | | |
Proceeds from shares issued | | | | |
| | | | |
| | | | |
Change in net assets resulting from Class R5 capital transactions | | | | |
| | | | |
Proceeds from shares issued | | | | |
| | | | |
| | | | |
Change in net assets resulting from Class R6 capital transactions | | | | |
Total change in net assets resulting from capital transactions | | | | |
| | | | |
| | | | |
| | | | |
| | | | |
| | | | |
| | | | |
SEE NOTES TO FINANCIAL STATEMENTS.
| J.P. Morgan Large Cap Funds | |
| JPMorgan U.S. GARP Equity Fund | JPMorgan U.S. Large Cap Core Plus Fund |
| Six Months Ended December 31, 2023 (Unaudited) | | Six Months Ended December 31, 2023 (Unaudited) | |
SHARE TRANSACTIONS: (continued) | | | | |
| | | | |
| | | | |
| | | | |
| | | | |
| | | | |
| | | | |
| | | | |
| | | | |
| | | | |
| | | | |
| | | | |
| | | | |
| | | | |
| | | | |
Change in Class R2 Shares | | | | |
| | | | |
| | | | |
| | | | |
| | | | |
Change in Class R5 Shares | | | | |
| | | | |
| | | | |
| | | | |
| | | | |
Change in Class R6 Shares | | | | |
SEE NOTES TO FINANCIAL STATEMENTS.
| J.P. Morgan Large Cap Funds | |
STATEMENTS OF CHANGES IN NET ASSETSFOR THE PERIODS INDICATED (continued)
(Amounts in thousands)
| JPMorgan U.S. Research
Enhanced Equity Fund | JPMorgan U.S. Sustainable Leaders Fund |
| Six Months Ended December 31, 2023
(Unaudited) | | Six Months Ended December 31, 2023
(Unaudited) | |
| | | | |
| | | | |
Proceeds from shares issued | | | | |
| | | | |
| | | | |
Change in net assets resulting from Class A capital transactions | | | | |
| | | | |
Proceeds from shares issued | | | | |
| | | | |
| | | | |
Change in net assets resulting from Class C capital transactions | | | | |
| | | | |
Proceeds from shares issued | | | | |
| | | | |
| | | | |
Change in net assets resulting from Class I capital transactions | | | | |
| | | | |
Proceeds from shares issued | | | | |
| | | | |
| | | | |
Change in net assets resulting from Class R6 capital transactions | | | | |
Total change in net assets resulting from capital transactions | | | | |
| | | | |
| | | | |
| | | | |
| | | | |
| | | | |
| | | | |
| | | | |
| | | | |
| | | | |
| | | | |
| | | | |
| | | | |
| | | | |
| | | | |
| | | | |
| | | | |
(a)
Amount rounds to less than one thousand.
SEE NOTES TO FINANCIAL STATEMENTS.
| J.P. Morgan Large Cap Funds | |
| JPMorgan U.S. Research Enhanced Equity Fund | JPMorgan U.S. Sustainable Leaders Fund |
| Six Months Ended December 31, 2023 (Unaudited) | | Six Months Ended December 31, 2023 (Unaudited) | |
SHARE TRANSACTIONS: (continued) | | | | |
| | | | |
| | | | |
| | | | |
| | | | |
Change in Class R6 Shares | | | | |
SEE NOTES TO FINANCIAL STATEMENTS.
| J.P. Morgan Large Cap Funds | |
STATEMENTS OF CHANGES IN NET ASSETSFOR THE PERIODS INDICATED (continued)
(Amounts in thousands)
| |
| Six Months Ended December 31, 2023
(Unaudited) | |
| | |
| | |
Proceeds from shares issued | | |
| | |
| | |
Change in net assets resulting from Class A capital transactions | | |
| | |
Proceeds from shares issued | | |
| | |
| | |
Change in net assets resulting from Class C capital transactions | | |
| | |
Proceeds from shares issued | | |
| | |
| | |
Change in net assets resulting from Class I capital transactions | | |
| | |
Proceeds from shares issued | | |
| | |
| | |
Change in net assets resulting from Class R2 capital transactions | | |
| | |
Proceeds from shares issued | | |
| | |
| | |
Change in net assets resulting from Class R3 capital transactions | | |
| | |
Proceeds from shares issued | | |
| | |
| | |
Change in net assets resulting from Class R4 capital transactions | | |
| | |
Proceeds from shares issued | | |
| | |
| | |
Change in net assets resulting from Class R5 capital transactions | | |
SEE NOTES TO FINANCIAL STATEMENTS.
| J.P. Morgan Large Cap Funds | |
| |
| Six Months Ended December 31, 2023 (Unaudited) | |
CAPITAL TRANSACTIONS: (continued) | | |
| | |
Proceeds from shares issued | | |
| | |
| | |
Change in net assets resulting from Class R6 capital transactions | | |
Total change in net assets resulting from capital transactions | | |
| | |
| | |
| | |
| | |
| | |
| | |
| | |
| | |
| | |
| | |
| | |
| | |
| | |
| | |
| | |
| | |
| | |
| | |
| | |
| | |
Change in Class R2 Shares | | |
| | |
| | |
| | |
| | |
Change in Class R3 Shares | | |
| | |
| | |
| | |
| | |
Change in Class R4 Shares | | |
(a)
Amount rounds to less than one thousand.
SEE NOTES TO FINANCIAL STATEMENTS.
| J.P. Morgan Large Cap Funds | |
STATEMENTS OF CHANGES IN NET ASSETSFOR THE PERIODS INDICATED (continued)
(Amounts in thousands)
| |
| Six Months Ended December 31, 2023 (Unaudited) | |
SHARE TRANSACTIONS: (continued) | | |
| | |
| | |
| | |
| | |
Change in Class R5 Shares | | |
| | |
| | |
| | |
| | |
Change in Class R6 Shares | | |
SEE NOTES TO FINANCIAL STATEMENTS.
| J.P. Morgan Large Cap Funds | |
STATEMENT OF CASH FLOWSFOR THE PERIOD ENDED December 31, 2023
(Amounts in thousands)
| JPMorgan
U.S. Large
Cap Core
Plus Fund |
INCREASE (DECREASE) IN CASH | |
Cash flows provided (used) by operating activities: | |
Net increase in net assets resulting from operations | |
Adjustments to reconcile net increase/decrease in net assets resulting
from operations to net cash provided (used) by operating activities: | |
Purchases of investment securities | |
Proceeds from disposition of investment securities | |
Covers of investment securities sold short | |
Proceeds from investment securities sold short | |
Purchases of short-term investments — affiliates, net | |
Change in unrealized (appreciation)/depreciation on investments in non-affiliates | |
Change in unrealized (appreciation)/depreciation on investments in affiliates | |
Change in unrealized (appreciation)/depreciation on investment securities sold short | |
Net realized (gain)/loss on investments in non-affiliates | |
Net realized (gain)/loss on investments in affiliates | |
Net realized (gain)/loss on securities sold short | |
Increase in dividends receivable from affiliates | |
Increase in dividends receivable from non-affiliates | |
Decrease in variation margin receivable | |
Increase in dividend expense payable to non-affiliates on securities sold short | |
Increase in interest expense payable to non-affiliates on securities sold short | |
Increase in variation margin payable | |
Increase in investment advisory fees payable | |
Increase in administration fees payable | |
Increase in distribution fees payable | |
Increase in service fees payable | |
Decrease in custodian and accounting fees payable | |
Decrease in other accrued expenses payable | |
Net cash provided (used) by operating activities | |
Cash flows provided (used) by financing activities: | |
Proceeds from shares issued | |
Payment for shares redeemed | |
Cash distributions paid to shareholders (net of reinvestments $154,990) | |
Net cash provided (used) by financing activities | |
| |
Net increase (decrease) in unrestricted and restricted cash, foreign currency and deposits at broker | |
Restricted and unrestricted cash and foreign currency at beginning of period | |
Restricted and unrestricted cash and foreign currency at end of period | |
Supplemental disclosure of cash flow information:For the period ended December 31, 2023 the Fund paid approximately $1,007 in interest expense.
For purposes of reporting the Statement of Cash Flows, the Fund considers all cash accounts that are not subject to withdrawal restrictions or penalties to be cash equivalents.
SEE NOTES TO FINANCIAL STATEMENTS.
| J.P. Morgan Large Cap Funds | |
STATEMENT OF CASH FLOWSFOR THE PERIOD ENDED December 31, 2023 (continued)
(Amounts in thousands)
Reconciliation of restricted and unrestricted cash and foreign currency at the end of period to the Statements of Assets and Liabilities:
| JPMorgan
U.S. Large
Cap Core
Plus Fund | JPMorgan
U.S. Large
Cap Core
Plus Fund |
| | |
| | |
| | |
| | |
| | |
SEE NOTES TO FINANCIAL STATEMENTS.
| J.P. Morgan Large Cap Funds | |
THIS PAGE IS INTENTIONALLY LEFT BLANK
FINANCIAL HIGHLIGHTSFOR THE PERIODS INDICATED
| Per share operating performance |
| | | |
| Net asset
value,
beginning
of period | Net
investment
income
(loss)(b) | Net realized
and unrealized
gains
(losses) on
investments | Total from
investment
operations | | | |
JPMorgan Equity Income Fund | | | | | | | |
| | | | | | | |
Six Months Ended December 31, 2023 (Unaudited) | | | | | | | |
| | | | | | | |
| | | | | | | |
| | | | | | | |
| | | | | | | |
| | | | | | | |
| | | | | | | |
Six Months Ended December 31, 2023 (Unaudited) | | | | | | | |
| | | | | | | |
| | | | | | | |
| | | | | | | |
| | | | | | | |
| | | | | | | |
| | | | | | | |
Six Months Ended December 31, 2023 (Unaudited) | | | | | | | |
| | | | | | | |
| | | | | | | |
| | | | | | | |
| | | | | | | |
| | | | | | | |
| | | | | | | |
Six Months Ended December 31, 2023 (Unaudited) | | | | | | | |
| | | | | | | |
| | | | | | | |
| | | | | | | |
| | | | | | | |
| | | | | | | |
| | | | | | | |
Six Months Ended December 31, 2023 (Unaudited) | | | | | | | |
| | | | | | | |
| | | | | | | |
| | | | | | | |
| | | | | | | |
| | | | | | | |
| | | | | | | |
Six Months Ended December 31, 2023 (Unaudited) | | | | | | | |
| | | | | | | |
| | | | | | | |
| | | | | | | |
| | | | | | | |
| | | | | | | |
SEE NOTES TO FINANCIAL STATEMENTS.
| J.P. Morgan Large Cap Funds | |
| |
| | | Ratios to average net assets(a) |
Net asset
value,
end of
period | Total return
(excludes
sales charge)(c)(d) | Net assets,
end of
period
(000's) | | Net
investment
income
(loss) | Expenses without
waivers and reimbursements | |
| | | | | | |
| | | | | | |
| | | | | | |
| | | | | | |
| | | | | | |
| | | | | | |
| | | | | | |
| | | | | | |
| | | | | | |
| | | | | | |
| | | | | | |
| | | | | | |
| | | | | | |
| | | | | | |
| | | | | | |
| | | | | | |
| | | | | | |
| | | | | | |
| | | | | | |
| | | | | | |
| | | | | | |
| | | | | | |
| | | | | | |
| | | | | | |
| | | | | | |
| | | | | | |
| | | | | | |
| | | | | | |
| | | | | | |
| | | | | | |
| | | | | | |
| | | | | | |
| | | | | | |
| | | | | | |
| | | | | | |
| | | | | | |
| | | | | | |
| | | | | | |
| | | | | | |
| | | | | | |
| | | | | | |
| | | | | | |
| | | | | | |
SEE NOTES TO FINANCIAL STATEMENTS.
| J.P. Morgan Large Cap Funds | |
FINANCIAL HIGHLIGHTSFOR THE PERIODS INDICATED (continued)
| Per share operating performance |
| | | |
| Net asset
value,
beginning
of period | Net
investment
income
(loss)(b) | Net realized
and unrealized
gains
(losses) on
investments | Total from
investment
operations | | | |
JPMorgan Equity Income Fund (continued) | | | | | | | |
| | | | | | | |
Six Months Ended December 31, 2023 (Unaudited) | | | | | | | |
| | | | | | | |
| | | | | | | |
| | | | | | | |
| | | | | | | |
| | | | | | | |
| | | | | | | |
Six Months Ended December 31, 2023 (Unaudited) | | | | | | | |
| | | | | | | |
| | | | | | | |
| | | | | | | |
| | | | | | | |
| | | | | | | |
|
| Annualized for periods less than one year, unless otherwise noted. |
| Calculated based upon average shares outstanding. |
| Not annualized for periods less than one year. |
| Includes adjustments in accordance with accounting principles generally accepted in the United States of America and as such, the net asset values for financial reporting purposes and the returns based upon those net asset values may differ from the net asset values and returns for shareholder transactions. |
| Includes interest expense, if applicable, each of which is less than 0.005% unless otherwise noted. |
SEE NOTES TO FINANCIAL STATEMENTS.
| J.P. Morgan Large Cap Funds | |
| |
| | | Ratios to average net assets(a) |
Net asset
value,
end of
period | Total return
(excludes
sales charge)(c)(d) | Net assets,
end of
period
(000's) | | Net
investment
income
(loss) | Expenses without
waivers and reimbursements | |
|
| | | | | | |
| | | | | | |
| | | | | | |
| | | | | | |
| | | | | | |
| | | | | | |
| | | | | | |
| | | | | | |
| | | | | | |
| | | | | | |
| | | | | | |
| | | | | | |
| | | | | | |
| | | | | | |
SEE NOTES TO FINANCIAL STATEMENTS.
| J.P. Morgan Large Cap Funds | |
FINANCIAL HIGHLIGHTSFOR THE PERIODS INDICATED
| Per share operating performance |
| | | |
| Net asset
value,
beginning
of period | Net
investment
income
(loss)(b) | Net realized
and unrealized
gains
(losses) on
investments | Total from
investment
operations | | | |
JPMorgan Equity Index Fund | | | | | | | |
| | | | | | | |
Six Months Ended December 31, 2023 (Unaudited) | | | | | | | |
| | | | | | | |
| | | | | | | |
| | | | | | | |
| | | | | | | |
| | | | | | | |
| | | | | | | |
Six Months Ended December 31, 2023 (Unaudited) | | | | | | | |
| | | | | | | |
| | | | | | | |
| | | | | | | |
| | | | | | | |
| | | | | | | |
| | | | | | | |
Six Months Ended December 31, 2023 (Unaudited) | | | | | | | |
| | | | | | | |
| | | | | | | |
| | | | | | | |
| | | | | | | |
| | | | | | | |
| | | | | | | |
Six Months Ended December 31, 2023 (Unaudited) | | | | | | | |
| | | | | | | |
| | | | | | | |
| | | | | | | |
| | | | | | | |
| | | | | | | |
|
| Annualized for periods less than one year, unless otherwise noted. |
| Calculated based upon average shares outstanding. |
| Not annualized for periods less than one year. |
| Includes adjustments in accordance with accounting principles generally accepted in the United States of America and as such, the net asset values for financial reporting purposes and the returns based upon those net asset values may differ from the net asset values and returns for shareholder transactions. |
| Includes interest expense, if applicable, each of which is less than 0.005% unless otherwise noted. |
| Net expenses for Class R6 Shares are 0.044% for the six months ended December 31, 2023, 0.045% for the year ended June 30, 2023, 0.045% for the year ended June 30, 2022, 0.044% for the year ended June 30, 2021, 0.044% for the year ended June 30, 2020 and 0.043% for the year ended June 30, 2019. |
SEE NOTES TO FINANCIAL STATEMENTS.
| J.P. Morgan Large Cap Funds | |
| |
| | | Ratios to average net assets(a) |
Net asset
value,
end of
period | Total return
(excludes
sales charge)(c)(d) | Net assets,
end of
period
(000's) | | Net
investment
income
(loss) | Expenses without
waivers and reimbursements | |
| | | | | | |
| | | | | | |
| | | | | | |
| | | | | | |
| | | | | | |
| | | | | | |
| | | | | | |
| | | | | | |
| | | | | | |
| | | | | | |
| | | | | | |
| | | | | | |
| | | | | | |
| | | | | | |
| | | | | | |
| | | | | | |
| | | | | | |
| | | | | | |
| | | | | | |
| | | | | | |
| | | | | | |
| | | | | | |
| | | | | | |
| | | | | | |
| | | | | | |
| | | | | | |
| | | | | | |
| | | | | | |
| | | | | | |
SEE NOTES TO FINANCIAL STATEMENTS.
| J.P. Morgan Large Cap Funds | |
FINANCIAL HIGHLIGHTSFOR THE PERIODS INDICATED
| Per share operating performance |
| | | |
| Net asset
value,
beginning
of period | Net
investment
income
(loss)(b) | Net realized
and unrealized
gains
(losses) on
investments | Total from
investment
operations | | Net asset
value,
end of
period |
JPMorgan Equity Premium Income Fund | | | | | | |
| | | | | | |
Six Months Ended December 31, 2023 (Unaudited) | | | | | | |
| | | | | | |
| | | | | | |
| | | | | | |
| | | | | | |
August 31, 2018 (f) through June 30, 2019 | | | | | | |
| | | | | | |
Six Months Ended December 31, 2023 (Unaudited) | | | | | | |
| | | | | | |
| | | | | | |
| | | | | | |
| | | | | | |
August 31, 2018 (f) through June 30, 2019 | | | | | | |
| | | | | | |
Six Months Ended December 31, 2023 (Unaudited) | | | | | | |
| | | | | | |
| | | | | | |
| | | | | | |
| | | | | | |
August 31, 2018 (f) through June 30, 2019 | | | | | | |
| | | | | | |
Six Months Ended December 31, 2023 (Unaudited) | | | | | | |
| | | | | | |
| | | | | | |
| | | | | | |
| | | | | | |
August 31, 2018 (f) through June 30, 2019 | | | | | | |
| | | | | | |
Six Months Ended December 31, 2023 (Unaudited) | | | | | | |
| | | | | | |
| | | | | | |
| | | | | | |
| | | | | | |
August 31, 2018 (f) through June 30, 2019 | | | | | | |
|
| Annualized for periods less than one year, unless otherwise noted. |
| Calculated based upon average shares outstanding. |
| Not annualized for periods less than one year. |
| Includes adjustments in accordance with accounting principles generally accepted in the United States of America and as such, the net asset values for financial reporting purposes and the returns based upon those net asset values may differ from the net asset values and returns for shareholder transactions. |
| Includes interest expense, if applicable, each of which is less than 0.005% unless otherwise noted. |
| Commencement of operations. |
| Certain non-recurring expenses incurred by the Fund were not annualized for the period indicated. |
SEE NOTES TO FINANCIAL STATEMENTS.
| J.P. Morgan Large Cap Funds | |
|
| | Ratios to average net assets(a) |
Total return
(excludes
sales charge)(c)(d) | Net assets,
end of
period
(000's) | | Net
investment
income
(loss) | Expenses without
waivers and reimbursements | |
| | | | | |
| | | | | |
| | | | | |
| | | | | |
| | | | | |
| | | | | |
| | | | | |
| | | | | |
| | | | | |
| | | | | |
| | | | | |
| | | | | |
| | | | | |
| | | | | |
| | | | | |
| | | | | |
| | | | | |
| | | | | |
| | | | | |
| | | | | |
| | | | | |
| | | | | |
| | | | | |
| | | | | |
| | | | | |
| | | | | |
| | | | | |
| | | | | |
| | | | | |
| | | | | |
| | | | | |
| | | | | |
| | | | | |
| | | | | |
| | | | | |
| | | | | |
SEE NOTES TO FINANCIAL STATEMENTS.
| J.P. Morgan Large Cap Funds | |
FINANCIAL HIGHLIGHTSFOR THE PERIODS INDICATED
| Per share operating performance |
| | | |
| Net asset
value,
beginning
of period | Net
investment
income
(loss)(b) | Net realized
and unrealized
gains
(losses) on
investments | Total from
investment
operations | | Net asset
value,
end of
period |
JPMorgan Hedged Equity Fund | | | | | | |
| | | | | | |
Six Months Ended December 31, 2023 (Unaudited) | | | | | | |
| | | | | | |
| | | | | | |
| | | | | | |
| | | | | | |
| | | | | | |
| | | | | | |
Six Months Ended December 31, 2023 (Unaudited) | | | | | | |
| | | | | | |
| | | | | | |
| | | | | | |
| | | | | | |
| | | | | | |
| | | | | | |
Six Months Ended December 31, 2023 (Unaudited) | | | | | | |
| | | | | | |
| | | | | | |
| | | | | | |
| | | | | | |
| | | | | | |
| | | | | | |
Six Months Ended December 31, 2023 (Unaudited) | | | | | | |
| | | | | | |
| | | | | | |
| | | | | | |
| | | | | | |
| | | | | | |
| | | | | | |
Six Months Ended December 31, 2023 (Unaudited) | | | | | | |
| | | | | | |
| | | | | | |
| | | | | | |
| | | | | | |
| | | | | | |
|
| Annualized for periods less than one year, unless otherwise noted. |
| Calculated based upon average shares outstanding. |
| Not annualized for periods less than one year. |
| Includes adjustments in accordance with accounting principles generally accepted in the United States of America and as such, the net asset values for financial reporting purposes and the returns based upon those net asset values may differ from the net asset values and returns for shareholder transactions. |
| Includes interest expense, if applicable, each of which is less than 0.005% unless otherwise noted. |
SEE NOTES TO FINANCIAL STATEMENTS.
| J.P. Morgan Large Cap Funds | |
|
| | Ratios to average net assets(a) |
Total return
(excludes
sales charge)(c)(d) | Net assets,
end of
period
(000's) | | Net
investment
income
(loss) | Expenses without
waivers and reimbursements | |
| | | | | |
| | | | | |
| | | | | |
| | | | | |
| | | | | |
| | | | | |
| | | | | |
| | | | | |
| | | | | |
| | | | | |
| | | | | |
| | | | | |
| | | | | |
| | | | | |
| | | | | |
| | | | | |
| | | | | |
| | | | | |
| | | | | |
| | | | | |
| | | | | |
| | | | | |
| | | | | |
| | | | | |
| | | | | |
| | | | | |
| | | | | |
| | | | | |
| | | | | |
| | | | | |
| | | | | |
| | | | | |
| | | | | |
| | | | | |
| | | | | |
| | | | | |
SEE NOTES TO FINANCIAL STATEMENTS.
| J.P. Morgan Large Cap Funds | |
FINANCIAL HIGHLIGHTSFOR THE PERIODS INDICATED
| Per share operating performance |
| | | |
| Net asset
value,
beginning
of period | Net
investment
income
(loss)(b) | Net realized
and unrealized
gains
(losses) on
investments | Total from
investment
operations | | | |
JPMorgan Hedged Equity 2 Fund | | | | | | | |
| | | | | | | |
Six Months Ended December 31, 2023 (Unaudited) | | | | | | | |
| | | | | | | |
| | | | | | | |
February 26, 2021 (f) through June 30, 2021 | | | | | | | |
| | | | | | | |
Six Months Ended December 31, 2023 (Unaudited) | | | | | | | |
| | | | | | | |
| | | | | | | |
February 26, 2021 (f) through June 30, 2021 | | | | | | | |
| | | | | | | |
Six Months Ended December 31, 2023 (Unaudited) | | | | | | | |
| | | | | | | |
| | | | | | | |
February 26, 2021 (f) through June 30, 2021 | | | | | | | |
| | | | | | | |
Six Months Ended December 31, 2023 (Unaudited) | | | | | | | |
| | | | | | | |
| | | | | | | |
February 26, 2021 (f) through June 30, 2021 | | | | | | | |
| | | | | | | |
Six Months Ended December 31, 2023 (Unaudited) | | | | | | | |
| | | | | | | |
| | | | | | | |
February 26, 2021 (f) through June 30, 2021 | | | | | | | |
|
| Annualized for periods less than one year, unless otherwise noted. |
| Calculated based upon average shares outstanding. |
| Not annualized for periods less than one year. |
| Includes adjustments in accordance with accounting principles generally accepted in the United States of America and as such, the net asset values for financial reporting purposes and the returns based upon those net asset values may differ from the net asset values and returns for shareholder transactions. |
| Includes interest expense, if applicable, each of which is less than 0.005% unless otherwise noted. |
| Commencement of operations. |
| Certain non-recurring expenses incurred by the Fund were not annualized for the period indicated. |
| Amount rounds to less than $0.005. |
SEE NOTES TO FINANCIAL STATEMENTS.
| J.P. Morgan Large Cap Funds | |
| |
| | | Ratios to average net assets(a) |
Net asset
value,
end of
period | Total return
(excludes
sales charge)(c)(d) | Net assets,
end of
period
(000's) | | Net
investment
income
(loss) | Expenses without
waivers and reimbursements | |
| | | | | | |
| | | | | | |
| | | | | | |
| | | | | | |
| | | | | | |
| | | | | | |
| | | | | | |
| | | | | | |
| | | | | | |
| | | | | | |
| | | | | | |
| | | | | | |
| | | | | | |
| | | | | | |
| | | | | | |
| | | | | | |
| | | | | | |
| | | | | | |
| | | | | | |
| | | | | | |
| | | | | | |
| | | | | | |
| | | | | | |
| | | | | | |
| | | | | | |
| | | | | | |
SEE NOTES TO FINANCIAL STATEMENTS.
| J.P. Morgan Large Cap Funds | |
FINANCIAL HIGHLIGHTSFOR THE PERIODS INDICATED
| Per share operating performance |
| | | |
| Net asset
value,
beginning
of period | Net
investment
income
(loss)(b) | Net realized
and unrealized
gains
(losses) on
investments | Total from
investment
operations | | | |
JPMorgan Hedged Equity 3 Fund | | | | | | | |
| | | | | | | |
Six Months Ended December 31, 2023 (Unaudited) | | | | | | | |
| | | | | | | |
| | | | | | | |
February 26, 2021 (f) through June 30, 2021 | | | | | | | |
| | | | | | | |
Six Months Ended December 31, 2023 (Unaudited) | | | | | | | |
| | | | | | | |
| | | | | | | |
February 26, 2021 (f) through June 30, 2021 | | | | | | | |
| | | | | | | |
Six Months Ended December 31, 2023 (Unaudited) | | | | | | | |
| | | | | | | |
| | | | | | | |
February 26, 2021 (f) through June 30, 2021 | | | | | | | |
| | | | | | | |
Six Months Ended December 31, 2023 (Unaudited) | | | | | | | |
| | | | | | | |
| | | | | | | |
February 26, 2021 (f) through June 30, 2021 | | | | | | | |
| | | | | | | |
Six Months Ended December 31, 2023 (Unaudited) | | | | | | | |
| | | | | | | |
| | | | | | | |
February 26, 2021 (f) through June 30, 2021 | | | | | | | |
|
| Annualized for periods less than one year, unless otherwise noted. |
| Calculated based upon average shares outstanding. |
| Not annualized for periods less than one year. |
| Includes adjustments in accordance with accounting principles generally accepted in the United States of America and as such, the net asset values for financial reporting purposes and the returns based upon those net asset values may differ from the net asset values and returns for shareholder transactions. |
| Includes interest expense, if applicable, each of which is less than 0.005% unless otherwise noted. |
| Commencement of operations. |
| Certain non-recurring expenses incurred by the Fund were not annualized for the period indicated. |
| Amount rounds to less than $0.005. |
SEE NOTES TO FINANCIAL STATEMENTS.
| J.P. Morgan Large Cap Funds | |
| |
| | | Ratios to average net assets(a) |
Net asset
value,
end of
period | Total return
(excludes
sales charge)(c)(d) | Net assets,
end of
period
(000's) | | Net
investment
income
(loss) | Expenses without
waivers and reimbursements | |
| | | | | | |
| | | | | | |
| | | | | | |
| | | | | | |
| | | | | | |
| | | | | | |
| | | | | | |
| | | | | | |
| | | | | | |
| | | | | | |
| | | | | | |
| | | | | | |
| | | | | | |
| | | | | | |
| | | | | | |
| | | | | | |
| | | | | | |
| | | | | | |
| | | | | | |
| | | | | | |
| | | | | | |
| | | | | | |
| | | | | | |
| | | | | | |
| | | | | | |
| | | | | | |
SEE NOTES TO FINANCIAL STATEMENTS.
| J.P. Morgan Large Cap Funds | |
FINANCIAL HIGHLIGHTSFOR THE PERIODS INDICATED
| Per share operating performance |
| | | |
| Net asset
value,
beginning
of period | Net
investment
income
(loss)(b) | Net realized
and unrealized
gains
(losses) on
investments | Total from
investment
operations | | | |
JPMorgan Large Cap Growth Fund | | | | | | | |
| | | | | | | |
Six Months Ended December 31, 2023 (Unaudited) | | | | | | | |
| | | | | | | |
| | | | | | | |
| | | | | | | |
| | | | | | | |
| | | | | | | |
| | | | | | | |
Six Months Ended December 31, 2023 (Unaudited) | | | | | | | |
| | | | | | | |
| | | | | | | |
| | | | | | | |
| | | | | | | |
| | | | | | | |
| | | | | | | |
Six Months Ended December 31, 2023 (Unaudited) | | | | | | | |
| | | | | | | |
| | | | | | | |
| | | | | | | |
| | | | | | | |
| | | | | | | |
| | | | | | | |
Six Months Ended December 31, 2023 (Unaudited) | | | | | | | |
| | | | | | | |
| | | | | | | |
| | | | | | | |
| | | | | | | |
| | | | | | | |
| | | | | | | |
Six Months Ended December 31, 2023 (Unaudited) | | | | | | | |
| | | | | | | |
| | | | | | | |
| | | | | | | |
| | | | | | | |
| | | | | | | |
| | | | | | | |
Six Months Ended December 31, 2023 (Unaudited) | | | | | | | |
| | | | | | | |
| | | | | | | |
| | | | | | | |
| | | | | | | |
| | | | | | | |
SEE NOTES TO FINANCIAL STATEMENTS.
| J.P. Morgan Large Cap Funds | |
| |
| | | Ratios to average net assets(a) |
Net asset
value,
end of
period | Total return
(excludes
sales charge)(c)(d) | Net assets,
end of
period
(000's) | | Net
investment
income
(loss) | Expenses without
waivers and reimbursements | |
| | | | | | |
| | | | | | |
| | | | | | |
| | | | | | |
| | | | | | |
| | | | | | |
| | | | | | |
| | | | | | |
| | | | | | |
| | | | | | |
| | | | | | |
| | | | | | |
| | | | | | |
| | | | | | |
| | | | | | |
| | | | | | |
| | | | | | |
| | | | | | |
| | | | | | |
| | | | | | |
| | | | | | |
| | | | | | |
| | | | | | |
| | | | | | |
| | | | | | |
| | | | | | |
| | | | | | |
| | | | | | |
| | | | | | |
| | | | | | |
| | | | | | |
| | | | | | |
| | | | | | |
| | | | | | |
| | | | | | |
| | | | | | |
| | | | | | |
| | | | | | |
| | | | | | |
| | | | | | |
| | | | | | |
| | | | | | |
| | | | | | |
SEE NOTES TO FINANCIAL STATEMENTS.
| J.P. Morgan Large Cap Funds | |
FINANCIAL HIGHLIGHTSFOR THE PERIODS INDICATED (continued)
| Per share operating performance |
| | | |
| Net asset
value,
beginning
of period | Net
investment
income
(loss)(b) | Net realized
and unrealized
gains
(losses) on
investments | Total from
investment
operations | | | |
JPMorgan Large Cap Growth Fund (continued) | | | | | | | |
| | | | | | | |
Six Months Ended December 31, 2023 (Unaudited) | | | | | | | |
| | | | | | | |
| | | | | | | |
| | | | | | | |
| | | | | | | |
| | | | | | | |
| | | | | | | |
Six Months Ended December 31, 2023 (Unaudited) | | | | | | | |
| | | | | | | |
| | | | | | | |
| | | | | | | |
| | | | | | | |
| | | | | | | |
|
| Annualized for periods less than one year, unless otherwise noted. |
| Calculated based upon average shares outstanding. |
| Not annualized for periods less than one year. |
| Includes adjustments in accordance with accounting principles generally accepted in the United States of America and as such, the net asset values for financial reporting purposes and the returns based upon those net asset values may differ from the net asset values and returns for shareholder transactions. |
| Includes interest expense, if applicable, each of which is less than 0.005% unless otherwise noted. |
| Net investment income (loss) may appear disproportionate among the classes due to the timing of recognition of income and changes in the relative size of the classes. |
SEE NOTES TO FINANCIAL STATEMENTS.
| J.P. Morgan Large Cap Funds | |
| |
| | | Ratios to average net assets(a) |
Net asset
value,
end of
period | Total return
(excludes
sales charge)(c)(d) | Net assets,
end of
period
(000's) | | Net
investment
income
(loss) | Expenses without
waivers and reimbursements | |
|
| | | | | | |
| | | | | | |
| | | | | | |
| | | | | | |
| | | | | | |
| | | | | | |
| | | | | | |
| | | | | | |
| | | | | | |
| | | | | | |
| | | | | | |
| | | | | | |
| | | | | | |
| | | | | | |
SEE NOTES TO FINANCIAL STATEMENTS.
| J.P. Morgan Large Cap Funds | |
FINANCIAL HIGHLIGHTSFOR THE PERIODS INDICATED
| Per share operating performance |
| | | |
| Net asset
value,
beginning
of period | Net
investment
income
(loss)(b) | Net realized
and unrealized
gains
(losses) on
investments | Total from
investment
operations | | | |
JPMorgan Large Cap Value Fund | | | | | | | |
| | | | | | | |
Six Months Ended December 31, 2023 (Unaudited) | | | | | | | |
| | | | | | | |
| | | | | | | |
| | | | | | | |
| | | | | | | |
| | | | | | | |
| | | | | | | |
Six Months Ended December 31, 2023 (Unaudited) | | | | | | | |
| | | | | | | |
| | | | | | | |
| | | | | | | |
| | | | | | | |
| | | | | | | |
| | | | | | | |
Six Months Ended December 31, 2023 (Unaudited) | | | | | | | |
| | | | | | | |
| | | | | | | |
| | | | | | | |
| | | | | | | |
| | | | | | | |
| | | | | | | |
Six Months Ended December 31, 2023 (Unaudited) | | | | | | | |
| | | | | | | |
| | | | | | | |
| | | | | | | |
| | | | | | | |
| | | | | | | |
| | | | | | | |
Six Months Ended December 31, 2023 (Unaudited) | | | | | | | |
| | | | | | | |
| | | | | | | |
| | | | | | | |
| | | | | | | |
October 1, 2018 (g) through June 30, 2019 | | | | | | | |
| | | | | | | |
Six Months Ended December 31, 2023 (Unaudited) | | | | | | | |
| | | | | | | |
| | | | | | | |
| | | | | | | |
| | | | | | | |
October 1, 2018 (g) through June 30, 2019 | | | | | | | |
SEE NOTES TO FINANCIAL STATEMENTS.
| J.P. Morgan Large Cap Funds | |
| |
| | | Ratios to average net assets(a) |
Net asset
value,
end of
period | Total return
(excludes
sales charge)(c)(d) | Net assets,
end of
period
(000's) | | Net
investment
income
(loss) | Expenses without
waivers and reimbursements | |
| | | | | | |
| | | | | | |
| | | | | | |
| | | | | | |
| | | | | | |
| | | | | | |
| | | | | | |
| | | | | | |
| | | | | | |
| | | | | | |
| | | | | | |
| | | | | | |
| | | | | | |
| | | | | | |
| | | | | | |
| | | | | | |
| | | | | | |
| | | | | | |
| | | | | | |
| | | | | | |
| | | | | | |
| | | | | | |
| | | | | | |
| | | | | | |
| | | | | | |
| | | | | | |
| | | | | | |
| | | | | | |
| | | | | | |
| | | | | | |
| | | | | | |
| | | | | | |
| | | | | | |
| | | | | | |
| | | | | | |
| | | | | | |
| | | | | | |
| | | | | | |
| | | | | | |
| | | | | | |
| | | | | | |
| | | | | | |
| | | | | | |
SEE NOTES TO FINANCIAL STATEMENTS.
| J.P. Morgan Large Cap Funds | |
FINANCIAL HIGHLIGHTSFOR THE PERIODS INDICATED (continued)
| Per share operating performance |
| | | |
| Net asset
value,
beginning
of period | Net
investment
income
(loss)(b) | Net realized
and unrealized
gains
(losses) on
investments | Total from
investment
operations | | | |
JPMorgan Large Cap Value Fund (continued) | | | | | | | |
| | | | | | | |
Six Months Ended December 31, 2023 (Unaudited) | | | | | | | |
| | | | | | | |
| | | | | | | |
| | | | | | | |
| | | | | | | |
| | | | | | | |
| | | | | | | |
Six Months Ended December 31, 2023 (Unaudited) | | | | | | | |
| | | | | | | |
| | | | | | | |
| | | | | | | |
| | | | | | | |
| | | | | | | |
|
| Annualized for periods less than one year, unless otherwise noted. |
| Calculated based upon average shares outstanding. |
| Not annualized for periods less than one year. |
| Includes adjustments in accordance with accounting principles generally accepted in the United States of America and as such, the net asset values for financial reporting purposes and the returns based upon those net asset values may differ from the net asset values and returns for shareholder transactions. |
| Includes interest expense, if applicable, each of which is less than 0.005% unless otherwise noted. |
| Amount rounds to less than $0.005. |
| Commencement of offering of class of shares. |
SEE NOTES TO FINANCIAL STATEMENTS.
| J.P. Morgan Large Cap Funds | |
| |
| | | Ratios to average net assets(a) |
Net asset
value,
end of
period | Total return
(excludes
sales charge)(c)(d) | Net assets,
end of
period
(000's) | | Net
investment
income
(loss) | Expenses without
waivers and reimbursements | |
|
| | | | | | |
| | | | | | |
| | | | | | |
| | | | | | |
| | | | | | |
| | | | | | |
| | | | | | |
| | | | | | |
| | | | | | |
| | | | | | |
| | | | | | |
| | | | | | |
| | | | | | |
| | | | | | |
SEE NOTES TO FINANCIAL STATEMENTS.
| J.P. Morgan Large Cap Funds | |
FINANCIAL HIGHLIGHTSFOR THE PERIODS INDICATED
| Per share operating performance |
| | | |
| Net asset
value,
beginning
of period | Net
investment
income
(loss)(b) | Net realized
and unrealized
gains
(losses) on
investments | Total from
investment
operations | | | |
JPMorgan U.S. Applied Data Science Value Fund | | | | | | | |
| | | | | | | |
Six Months Ended December 31, 2023 (Unaudited) | | | | | | | |
| | | | | | | |
| | | | | | | |
| | | | | | | |
| | | | | | | |
| | | | | | | |
| | | | | | | |
Six Months Ended December 31, 2023 (Unaudited) | | | | | | | |
| | | | | | | |
| | | | | | | |
| | | | | | | |
| | | | | | | |
| | | | | | | |
| | | | | | | |
Six Months Ended December 31, 2023 (Unaudited) | | | | | | | |
| | | | | | | |
| | | | | | | |
| | | | | | | |
| | | | | | | |
| | | | | | | |
| | | | | | | |
Six Months Ended December 31, 2023 (Unaudited) | | | | | | | |
| | | | | | | |
| | | | | | | |
| | | | | | | |
| | | | | | | |
| | | | | | | |
| | | | | | | |
Six Months Ended December 31, 2023 (Unaudited) | | | | | | | |
| | | | | | | |
| | | | | | | |
| | | | | | | |
| | | | | | | |
| | | | | | | |
SEE NOTES TO FINANCIAL STATEMENTS.
| J.P. Morgan Large Cap Funds | |
| |
| | | Ratios to average net assets(a) |
Net asset
value,
end of
period | Total return
(excludes
sales charge)(c)(d) | Net assets,
end of
period
(000's) | | Net
investment
income
(loss) | Expenses without
waivers and reimbursements | |
| | | | | | |
| | | | | | |
| | | | | | |
| | | | | | |
| | | | | | |
| | | | | | |
| | | | | | |
| | | | | | |
| | | | | | |
| | | | | | |
| | | | | | |
| | | | | | |
| | | | | | |
| | | | | | |
| | | | | | |
| | | | | | |
| | | | | | |
| | | | | | |
| | | | | | |
| | | | | | |
| | | | | | |
| | | | | | |
| | | | | | |
| | | | | | |
| | | | | | |
| | | | | | |
| | | | | | |
| | | | | | |
| | | | | | |
| | | | | | |
| | | | | | |
| | | | | | |
| | | | | | |
| | | | | | |
| | | | | | |
| | | | | | |
SEE NOTES TO FINANCIAL STATEMENTS.
| J.P. Morgan Large Cap Funds | |
FINANCIAL HIGHLIGHTSFOR THE PERIODS INDICATED (continued)
| Per share operating performance |
| | | |
| Net asset
value,
beginning
of period | Net
investment
income
(loss)(b) | Net realized
and unrealized
gains
(losses) on
investments | Total from
investment
operations | | | |
JPMorgan U.S. Applied Data Science Value Fund (continued) | | | | | | | |
| | | | | | | |
Six Months Ended December 31, 2023 (Unaudited) | | | | | | | |
| | | | | | | |
| | | | | | | |
| | | | | | | |
| | | | | | | |
| | | | | | | |
|
| Annualized for periods less than one year, unless otherwise noted. |
| Calculated based upon average shares outstanding. |
| Not annualized for periods less than one year. |
| Includes adjustments in accordance with accounting principles generally accepted in the United States of America and as such, the net asset values for financial reporting purposes and the returns based upon those net asset values may differ from the net asset values and returns for shareholder transactions. |
| Includes interest expense, if applicable, each of which is less than 0.005% unless otherwise noted. |
| Reflects special dividends paid out during the year by several of the Fund’s holdings. Had the Fund not received the special dividends, the net investment income (loss) per share would have been $0.46, $0.30, $0.53, $0.38, $0.57 and $0.60 for Class A, Class C, Class I, Class R2, Class R5 and Class R6 Shares, respectively, and the net investment income (loss) ratio would have been 1.56%, 1.05%, 1.70%, 1.30%, 1.85% and 2.04% for Class A, Class C, Class I, Class R2, Class R5 and Class R6 Shares, respectively. |
SEE NOTES TO FINANCIAL STATEMENTS.
| J.P. Morgan Large Cap Funds | |
| |
| | | Ratios to average net assets(a) |
Net asset
value,
end of
period | Total return
(excludes
sales charge)(c)(d) | Net assets,
end of
period
(000's) | | Net
investment
income
(loss) | Expenses without
waivers and reimbursements | |
|
| | | | | | |
| | | | | | |
| | | | | | |
| | | | | | |
| | | | | | |
| | | | | | |
| | | | | | |
SEE NOTES TO FINANCIAL STATEMENTS.
| J.P. Morgan Large Cap Funds | |
FINANCIAL HIGHLIGHTSFOR THE PERIODS INDICATED
| Per share operating performance |
| | | |
| Net asset
value,
beginning
of period | Net
investment
income
(loss)(b) | Net realized
and unrealized
gains
(losses) on
investments | Total from
investment
operations | | | |
JPMorgan U.S. Equity Fund | | | | | | | |
| | | | | | | |
Six Months Ended December 31, 2023 (Unaudited) | | | | | | | |
| | | | | | | |
| | | | | | | |
| | | | | | | |
| | | | | | | |
| | | | | | | |
| | | | | | | |
Six Months Ended December 31, 2023 (Unaudited) | | | | | | | |
| | | | | | | |
| | | | | | | |
| | | | | | | |
| | | | | | | |
| | | | | | | |
| | | | | | | |
Six Months Ended December 31, 2023 (Unaudited) | | | | | | | |
| | | | | | | |
| | | | | | | |
| | | | | | | |
| | | | | | | |
| | | | | | | |
| | | | | | | |
Six Months Ended December 31, 2023 (Unaudited) | | | | | | | |
| | | | | | | |
| | | | | | | |
| | | | | | | |
| | | | | | | |
| | | | | | | |
| | | | | | | |
Six Months Ended December 31, 2023 (Unaudited) | | | | | | | |
| | | | | | | |
| | | | | | | |
| | | | | | | |
| | | | | | | |
| | | | | | | |
| | | | | | | |
Six Months Ended December 31, 2023 (Unaudited) | | | | | | | |
| | | | | | | |
| | | | | | | |
| | | | | | | |
| | | | | | | |
| | | | | | | |
SEE NOTES TO FINANCIAL STATEMENTS.
| J.P. Morgan Large Cap Funds | |
| |
| | | Ratios to average net assets(a) |
Net asset
value,
end of
period | Total return
(excludes
sales charge)(c)(d) | Net assets,
end of
period
(000's) | | Net
investment
income
(loss) | Expenses without
waivers and reimbursements | |
| | | | | | |
| | | | | | |
| | | | | | |
| | | | | | |
| | | | | | |
| | | | | | |
| | | | | | |
| | | | | | |
| | | | | | |
| | | | | | |
| | | | | | |
| | | | | | |
| | | | | | |
| | | | | | |
| | | | | | |
| | | | | | |
| | | | | | |
| | | | | | |
| | | | | | |
| | | | | | |
| | | | | | |
| | | | | | |
| | | | | | |
| | | | | | |
| | | | | | |
| | | | | | |
| | | | | | |
| | | | | | |
| | | | | | |
| | | | | | |
| | | | | | |
| | | | | | |
| | | | | | |
| | | | | | |
| | | | | | |
| | | | | | |
| | | | | | |
| | | | | | |
| | | | | | |
| | | | | | |
| | | | | | |
| | | | | | |
| | | | | | |
SEE NOTES TO FINANCIAL STATEMENTS.
| J.P. Morgan Large Cap Funds | |
FINANCIAL HIGHLIGHTSFOR THE PERIODS INDICATED (continued)
| Per share operating performance |
| | | |
| Net asset
value,
beginning
of period | Net
investment
income
(loss)(b) | Net realized
and unrealized
gains
(losses) on
investments | Total from
investment
operations | | | |
JPMorgan U.S. Equity Fund (continued) | | | | | | | |
| | | | | | | |
Six Months Ended December 31, 2023 (Unaudited) | | | | | | | |
| | | | | | | |
| | | | | | | |
| | | | | | | |
| | | | | | | |
| | | | | | | |
| | | | | | | |
Six Months Ended December 31, 2023 (Unaudited) | | | | | | | |
| | | | | | | |
| | | | | | | |
| | | | | | | |
| | | | | | | |
| | | | | | | |
| | | | | | | |
Six Months Ended December 31, 2023 (Unaudited) | | | | | | | |
| | | | | | | |
| | | | | | | |
| | | | | | | |
| | | | | | | |
| | | | | | | |
|
| Annualized for periods less than one year, unless otherwise noted. |
| Calculated based upon average shares outstanding. |
| Not annualized for periods less than one year. |
| Includes adjustments in accordance with accounting principles generally accepted in the United States of America and as such, the net asset values for financial reporting purposes and the returns based upon those net asset values may differ from the net asset values and returns for shareholder transactions. |
| Includes interest expense, if applicable, each of which is less than 0.005% unless otherwise noted. |
SEE NOTES TO FINANCIAL STATEMENTS.
| J.P. Morgan Large Cap Funds | |
| |
| | | Ratios to average net assets(a) |
Net asset
value,
end of
period | Total return
(excludes
sales charge)(c)(d) | Net assets,
end of
period
(000's) | | Net
investment
income
(loss) | Expenses without
waivers and reimbursements | |
|
| | | | | | |
| | | | | | |
| | | | | | |
| | | | | | |
| | | | | | |
| | | | | | |
| | | | | | |
| | | | | | |
| | | | | | |
| | | | | | |
| | | | | | |
| | | | | | |
| | | | | | |
| | | | | | |
| | | | | | |
| | | | | | |
| | | | | | |
| | | | | | |
| | | | | | |
| | | | | | |
| | | | | | |
SEE NOTES TO FINANCIAL STATEMENTS.
| J.P. Morgan Large Cap Funds | |
FINANCIAL HIGHLIGHTSFOR THE PERIODS INDICATED
| Per share operating performance |
| | | |
| Net asset
value,
beginning
of period | Net
investment
income
(loss)(b) | Net realized
and unrealized
gains
(losses) on
investments | Total from
investment
operations | | | |
JPMorgan U.S. GARP Equity Fund | | | | | | | |
| | | | | | | |
Six Months Ended December 31, 2023 (Unaudited) | | | | | | | |
| | | | | | | |
| | | | | | | |
| | | | | | | |
| | | | | | | |
| | | | | | | |
| | | | | | | |
Six Months Ended December 31, 2023 (Unaudited) | | | | | | | |
| | | | | | | |
| | | | | | | |
| | | | | | | |
| | | | | | | |
| | | | | | | |
| | | | | | | |
Six Months Ended December 31, 2023 (Unaudited) | | | | | | | |
| | | | | | | |
| | | | | | | |
| | | | | | | |
| | | | | | | |
| | | | | | | |
| | | | | | | |
Six Months Ended December 31, 2023 (Unaudited) | | | | | | | |
| | | | | | | |
| | | | | | | |
| | | | | | | |
| | | | | | | |
| | | | | | | |
| | | | | | | |
Six Months Ended December 31, 2023 (Unaudited) | | | | | | | |
| | | | | | | |
| | | | | | | |
| | | | | | | |
| | | | | | | |
| | | | | | | |
SEE NOTES TO FINANCIAL STATEMENTS.
| J.P. Morgan Large Cap Funds | |
| |
| | | Ratios to average net assets(a) |
Net asset
value,
end of
period | Total return
(excludes
sales charge)(c)(d) | Net assets,
end of
period
(000's) | | Net
investment
income
(loss) | Expenses without
waivers and reimbursements | |
| | | | | | |
| | | | | | |
| | | | | | |
| | | | | | |
| | | | | | |
| | | | | | |
| | | | | | |
| | | | | | |
| | | | | | |
| | | | | | |
| | | | | | |
| | | | | | |
| | | | | | |
| | | | | | |
| | | | | | |
| | | | | | |
| | | | | | |
| | | | | | |
| | | | | | |
| | | | | | |
| | | | | | |
| | | | | | |
| | | | | | |
| | | | | | |
| | | | | | |
| | | | | | |
| | | | | | |
| | | | | | |
| | | | | | |
| | | | | | |
| | | | | | |
| | | | | | |
| | | | | | |
| | | | | | |
| | | | | | |
| | | | | | |
SEE NOTES TO FINANCIAL STATEMENTS.
| J.P. Morgan Large Cap Funds | |
FINANCIAL HIGHLIGHTSFOR THE PERIODS INDICATED (continued)
| Per share operating performance |
| | | |
| Net asset
value,
beginning
of period | Net
investment
income
(loss)(b) | Net realized
and unrealized
gains
(losses) on
investments | Total from
investment
operations | | | |
JPMorgan U.S. GARP Equity Fund (continued) | | | | | | | |
| | | | | | | |
Six Months Ended December 31, 2023 (Unaudited) | | | | | | | |
| | | | | | | |
| | | | | | | |
| | | | | | | |
| | | | | | | |
| | | | | | | |
|
| Annualized for periods less than one year, unless otherwise noted. |
| Calculated based upon average shares outstanding. |
| Not annualized for periods less than one year. |
| Includes adjustments in accordance with accounting principles generally accepted in the United States of America and as such, the net asset values for financial reporting purposes and the returns based upon those net asset values may differ from the net asset values and returns for shareholder transactions. |
| Includes interest expense, if applicable, each of which is less than 0.005% unless otherwise noted. |
| Amount rounds to less than $0.005. |
| Reflects special dividends paid out during the year by several of the Fund’s holdings. Had the Fund not received the special dividends, the net investment income (loss) per share would have been $0.27, $(0.01), $0.41, $0.13, $0.49 and $0.55 for Class A, Class C, Class I, Class R2, Class R5 and Class R6 Shares, respectively, and the net investment income (loss) ratio would have been 0.48%, (0.02)%, 0.73%, 0.23%, 0.88% and 0.99% for Class A, Class C, Class I, Class R2, Class R5 and Class R6 Shares, respectively. |
| Net investment income (loss) may appear disproportionate among the classes due to the timing of recognition of income and changes in the relative size of the classes. |
SEE NOTES TO FINANCIAL STATEMENTS.
| J.P. Morgan Large Cap Funds | |
| |
| | | Ratios to average net assets(a) |
Net asset
value,
end of
period | Total return
(excludes
sales charge)(c)(d) | Net assets,
end of
period
(000's) | | Net
investment
income
(loss) | Expenses without
waivers and reimbursements | |
|
| | | | | | |
| | | | | | |
| | | | | | |
| | | | | | |
| | | | | | |
| | | | | | |
| | | | | | |
SEE NOTES TO FINANCIAL STATEMENTS.
| J.P. Morgan Large Cap Funds | |
FINANCIAL HIGHLIGHTSFOR THE PERIODS INDICATED
| Per share operating performance |
| | | |
| Net asset
value,
beginning
of period | Net
investment
income
(loss)(b) | Net realized
and unrealized
gains
(losses) on
investments | Total from
investment
operations | | | |
JPMorgan U.S. Large Cap Core Plus Fund | | | | | | | |
| | | | | | | |
Six Months Ended December 31, 2023 (Unaudited) | | | | | | | |
| | | | | | | |
| | | | | | | |
| | | | | | | |
| | | | | | | |
| | | | | | | |
| | | | | | | |
Six Months Ended December 31, 2023 (Unaudited) | | | | | | | |
| | | | | | | |
| | | | | | | |
| | | | | | | |
| | | | | | | |
| | | | | | | |
| | | | | | | |
Six Months Ended December 31, 2023 (Unaudited) | | | | | | | |
| | | | | | | |
| | | | | | | |
| | | | | | | |
| | | | | | | |
| | | | | | | |
| | | | | | | |
Six Months Ended December 31, 2023 (Unaudited) | | | | | | | |
| | | | | | | |
| | | | | | | |
| | | | | | | |
| | | | | | | |
| | | | | | | |
| | | | | | | |
Six Months Ended December 31, 2023 (Unaudited) | | | | | | | |
| | | | | | | |
| | | | | | | |
| | | | | | | |
| | | | | | | |
| | | | | | | |
SEE NOTES TO FINANCIAL STATEMENTS.
| J.P. Morgan Large Cap Funds | |
| |
| | | Ratios to average net assets(a) |
Net asset
value,
end of
period | Total return
(excludes
sales charge)(c)(d) | Net assets,
end of
period
(000's) | Net
expenses
(including dividend
and interest expense
for securities sold
short)(e)(f) | Net
investment
income
(loss) | Expenses without
waivers and reimbursements
(including dividend
and interest expense
for securities sold
short)(f) | Portfolio
turnover rate
(excluding securities
sold short)(c) | Portfolio
turnover rate
(including securities
sold short)(c) |
| | | | | | | |
| | | | | | | |
| | | | | | | |
| | | | | | | |
| | | | | | | |
| | | | | | | |
| | | | | | | |
| | | | | | | |
| | | | | | | |
| | | | | | | |
| | | | | | | |
| | | | | | | |
| | | | | | | |
| | | | | | | |
| | | | | | | |
| | | | | | | |
| | | | | | | |
| | | | | | | |
| | | | | | | |
| | | | | | | |
| | | | | | | |
| | | | | | | |
| | | | | | | |
| | | | | | | |
| | | | | | | |
| | | | | | | |
| | | | | | | |
| | | | | | | |
| | | | | | | |
| | | | | | | |
| | | | | | | |
| | | | | | | |
| | | | | | | |
| | | | | | | |
| | | | | | | |
| | | | | | | |
SEE NOTES TO FINANCIAL STATEMENTS.
| J.P. Morgan Large Cap Funds | |
FINANCIAL HIGHLIGHTSFOR THE PERIODS INDICATED (continued)
| Per share operating performance |
| | | |
| Net asset
value,
beginning
of period | Net
investment
income
(loss)(b) | Net realized
and unrealized
gains
(losses) on
investments | Total from
investment
operations | | | |
JPMorgan U.S. Large Cap Core Plus Fund (continued) | | | | | | | |
| | | | | | | |
Six Months Ended December 31, 2023 (Unaudited) | | | | | | | |
| | | | | | | |
| | | | | | | |
| | | | | | | |
| | | | | | | |
| | | | | | | |
|
| Annualized for periods less than one year, unless otherwise noted. |
| Calculated based upon average shares outstanding. |
| Not annualized for periods less than one year. |
| Includes adjustments in accordance with accounting principles generally accepted in the United States of America and as such, the net asset values for financial reporting purposes and the returns based upon those net asset values may differ from the net asset values and returns for shareholder transactions. |
| Includes interest expense, if applicable, each of which is less than 0.005% unless otherwise noted. |
| |
| | | | | | |
Net expenses (excluding dividend and interest expense for securities sold short) | | | | | | |
| | | | | | |
| | | | | | |
| | | | | | |
| | | | | | |
| | | | | | |
| | | | | | |
Expenses without waivers and reimbursements (excluding dividend and interest expense for securities sold short) | | | | | | |
| | | | | | |
| | | | | | |
| | | | | | |
| | | | | | |
| | | | | | |
| | | | | | |
|
| Amount rounds to less than $0.005. |
| Interest expense on securities sold short is 0.14%. |
| Interest expense on securities sold short is 0.62%. |
| Interest expense on securities sold short is 0.16%. |
| Net investment income (loss) may appear disproportionate among the classes due to the timing of recognition of income and changes in the relative size of the classes. |
SEE NOTES TO FINANCIAL STATEMENTS.
| J.P. Morgan Large Cap Funds | |
| |
| | | Ratios to average net assets(a) |
Net asset
value,
end of
period | Total return
(excludes
sales charge)(c)(d) | Net assets,
end of
period
(000's) | Net
expenses
(including dividend
and interest expense
for securities sold
short)(e)(f) | Net
investment
income
(loss) | Expenses without
waivers and reimbursements
(including dividend
and interest expense
for securities sold
short)(f) | Portfolio
turnover rate
(excluding securities
sold short)(c) | Portfolio
turnover rate
(including securities
sold short)(c) |
|
| | | | | | | |
| | | | | | | |
| | | | | | | |
| | | | | | | |
| | | | | | | |
| | | | | | | |
| | | | | | | |
SEE NOTES TO FINANCIAL STATEMENTS.
| J.P. Morgan Large Cap Funds | |
FINANCIAL HIGHLIGHTSFOR THE PERIODS INDICATED
| Per share operating performance |
| | | |
| Net asset
value,
beginning
of period | Net
investment
income
(loss)(b) | Net realized
and unrealized
gains
(losses) on
investments | Total from
investment
operations | | | |
JPMorgan U.S. Research Enhanced Equity Fund | | | | | | | |
| | | | | | | |
Six Months Ended December 31, 2023 (Unaudited) | | | | | | | |
| | | | | | | |
| | | | | | | |
| | | | | | | |
| | | | | | | |
| | | | | | | |
| | | | | | | |
Six Months Ended December 31, 2023 (Unaudited) | | | | | | | |
| | | | | | | |
| | | | | | | |
| | | | | | | |
| | | | | | | |
| | | | | | | |
| | | | | | | |
Six Months Ended December 31, 2023 (Unaudited) | | | | | | | |
| | | | | | | |
| | | | | | | |
| | | | | | | |
| | | | | | | |
| | | | | | | |
|
| Annualized for periods less than one year, unless otherwise noted. |
| Calculated based upon average shares outstanding. |
| Not annualized for periods less than one year. |
| Includes adjustments in accordance with accounting principles generally accepted in the United States of America and as such, the net asset values for financial reporting purposes and the returns based upon those net asset values may differ from the net asset values and returns for shareholder transactions. |
| Includes interest expense, if applicable, each of which is less than 0.005% unless otherwise noted. |
SEE NOTES TO FINANCIAL STATEMENTS.
| J.P. Morgan Large Cap Funds | |
| |
| | | Ratios to average net assets(a) |
Net asset
value,
end of
period | Total return
(excludes
sales charge)(c)(d) | Net assets,
end of
period
(000's) | | Net
investment
income
(loss) | Expenses without
waivers and reimbursements | |
| | | | | | |
| | | | | | |
| | | | | | |
| | | | | | |
| | | | | | |
| | | | | | |
| | | | | | |
| | | | | | |
| | | | | | |
| | | | | | |
| | | | | | |
| | | | | | |
| | | | | | |
| | | | | | |
| | | | | | |
| | | | | | |
| | | | | | |
| | | | | | |
| | | | | | |
| | | | | | |
| | | | | | |
| | | | | | |
SEE NOTES TO FINANCIAL STATEMENTS.
| J.P. Morgan Large Cap Funds | |
FINANCIAL HIGHLIGHTSFOR THE PERIODS INDICATED
| Per share operating performance |
| | | |
| Net asset
value,
beginning
of period | Net
investment
income
(loss)(b) | Net realized
and unrealized
gains
(losses) on
investments | Total from
investment
operations | | | |
JPMorgan U.S. Sustainable Leaders Fund | | | | | | | |
| | | | | | | |
Six Months Ended December 31, 2023 (Unaudited) | | | | | | | |
| | | | | | | |
| | | | | | | |
| | | | | | | |
| | | | | | | |
| | | | | | | |
| | | | | | | |
Six Months Ended December 31, 2023 (Unaudited) | | | | | | | |
| | | | | | | |
| | | | | | | |
| | | | | | | |
| | | | | | | |
| | | | | | | |
| | | | | | | |
Six Months Ended December 31, 2023 (Unaudited) | | | | | | | |
| | | | | | | |
| | | | | | | |
| | | | | | | |
| | | | | | | |
| | | | | | | |
| | | | | | | |
Six Months Ended December 31, 2023 (Unaudited) | | | | | | | |
| | | | | | | |
| | | | | | | |
September 30, 2020 (f) through June 30, 2021 | | | | | | | |
|
| Annualized for periods less than one year, unless otherwise noted. |
| Calculated based upon average shares outstanding. |
| Not annualized for periods less than one year. |
| Includes adjustments in accordance with accounting principles generally accepted in the United States of America and as such, the net asset values for financial reporting purposes and the returns based upon those net asset values may differ from the net asset values and returns for shareholder transactions. |
| Includes interest expense, if applicable, each of which is less than 0.005% unless otherwise noted. |
| Commencement of offering of class of shares. |
SEE NOTES TO FINANCIAL STATEMENTS.
| J.P. Morgan Large Cap Funds | |
| |
| | | Ratios to average net assets(a) |
Net asset
value,
end of
period | Total return
(excludes
sales charge)(c)(d) | Net assets,
end of
period
(000's) | | Net
investment
income
(loss) | Expenses without
waivers and reimbursements | |
| | | | | | |
| | | | | | |
| | | | | | |
| | | | | | |
| | | | | | |
| | | | | | |
| | | | | | |
| | | | | | |
| | | | | | |
| | | | | | |
| | | | | | |
| | | | | | |
| | | | | | |
| | | | | | |
| | | | | | |
| | | | | | |
| | | | | | |
| | | | | | |
| | | | | | |
| | | | | | |
| | | | | | |
| | | | | | |
| | | | | | |
| | | | | | |
| | | | | | |
| | | | | | |
| | | | | | |
SEE NOTES TO FINANCIAL STATEMENTS.
| J.P. Morgan Large Cap Funds | |
FINANCIAL HIGHLIGHTSFOR THE PERIODS INDICATED
| Per share operating performance |
| | | |
| Net asset
value,
beginning
of period | Net
investment
income
(loss)(b) | Net realized
and unrealized
gains
(losses) on
investments | Total from
investment
operations | | | |
| | | | | | | |
| | | | | | | |
Six Months Ended December 31, 2023 (Unaudited) | | | | | | | |
| | | | | | | |
| | | | | | | |
| | | | | | | |
| | | | | | | |
| | | | | | | |
| | | | | | | |
Six Months Ended December 31, 2023 (Unaudited) | | | | | | | |
| | | | | | | |
| | | | | | | |
| | | | | | | |
| | | | | | | |
| | | | | | | |
| | | | | | | |
Six Months Ended December 31, 2023 (Unaudited) | | | | | | | |
| | | | | | | |
| | | | | | | |
| | | | | | | |
| | | | | | | |
| | | | | | | |
| | | | | | | |
Six Months Ended December 31, 2023 (Unaudited) | | | | | | | |
| | | | | | | |
| | | | | | | |
| | | | | | | |
| | | | | | | |
| | | | | | | |
| | | | | | | |
Six Months Ended December 31, 2023 (Unaudited) | | | | | | | |
| | | | | | | |
| | | | | | | |
| | | | | | | |
| | | | | | | |
| | | | | | | |
| | | | | | | |
Six Months Ended December 31, 2023 (Unaudited) | | | | | | | |
| | | | | | | |
| | | | | | | |
| | | | | | | |
| | | | | | | |
| | | | | | | |
SEE NOTES TO FINANCIAL STATEMENTS.
| J.P. Morgan Large Cap Funds | |
| |
| | | Ratios to average net assets(a) |
Net asset
value,
end of
period | Total return
(excludes
sales charge)(c)(d) | Net assets,
end of
period
(000's) | | Net
investment
income
(loss) | Expenses without
waivers and reimbursements | |
| | | | | | |
| | | | | | |
| | | | | | |
| | | | | | |
| | | | | | |
| | | | | | |
| | | | | | |
| | | | | | |
| | | | | | |
| | | | | | |
| | | | | | |
| | | | | | |
| | | | | | |
| | | | | | |
| | | | | | |
| | | | | | |
| | | | | | |
| | | | | | |
| | | | | | |
| | | | | | |
| | | | | | |
| | | | | | |
| | | | | | |
| | | | | | |
| | | | | | |
| | | | | | |
| | | | | | |
| | | | | | |
| | | | | | |
| | | | | | |
| | | | | | |
| | | | | | |
| | | | | | |
| | | | | | |
| | | | | | |
| | | | | | |
| | | | | | |
| | | | | | |
| | | | | | |
| | | | | | |
| | | | | | |
| | | | | | |
| | | | | | |
SEE NOTES TO FINANCIAL STATEMENTS.
| J.P. Morgan Large Cap Funds | |
FINANCIAL HIGHLIGHTSFOR THE PERIODS INDICATED (continued)
| Per share operating performance |
| | | |
| Net asset
value,
beginning
of period | Net
investment
income
(loss)(b) | Net realized
and unrealized
gains
(losses) on
investments | Total from
investment
operations | | | |
JPMorgan U.S. Value Fund (continued) | | | | | | | |
| | | | | | | |
Six Months Ended December 31, 2023 (Unaudited) | | | | | | | |
| | | | | | | |
| | | | | | | |
| | | | | | | |
| | | | | | | |
| | | | | | | |
| | | | | | | |
Six Months Ended December 31, 2023 (Unaudited) | | | | | | | |
| | | | | | | |
| | | | | | | |
| | | | | | | |
| | | | | | | |
| | | | | | | |
|
| Annualized for periods less than one year, unless otherwise noted. |
| Calculated based upon average shares outstanding. |
| Not annualized for periods less than one year. |
| Includes adjustments in accordance with accounting principles generally accepted in the United States of America and as such, the net asset values for financial reporting purposes and the returns based upon those net asset values may differ from the net asset values and returns for shareholder transactions. |
| Includes interest expense, if applicable, each of which is less than 0.005% unless otherwise noted. |
SEE NOTES TO FINANCIAL STATEMENTS.
| J.P. Morgan Large Cap Funds | |
| |
| | | Ratios to average net assets(a) |
Net asset
value,
end of
period | Total return
(excludes
sales charge)(c)(d) | Net assets,
end of
period
(000's) | | Net
investment
income
(loss) | Expenses without
waivers and reimbursements | |
|
| | | | | | |
| | | | | | |
| | | | | | |
| | | | | | |
| | | | | | |
| | | | | | |
| | | | | | |
| | | | | | |
| | | | | | |
| | | | | | |
| | | | | | |
| | | | | | |
| | | | | | |
| | | | | | |
SEE NOTES TO FINANCIAL STATEMENTS.
| J.P. Morgan Large Cap Funds | |
NOTES TO FINANCIAL STATEMENTSAS OF December 31, 2023 (Unaudited)
(Dollar values in thousands)
1. Organization
JPMorgan Trust I (“JPM I”), JPMorgan Trust II (“JPM II”) and JPMorgan Trust IV (“JPM IV”) (collectively, the “Trusts”) were formed on November 12, 2004 for JPM I and JPM II and November 11, 2015 for JPM IV, as Delaware statutory trusts, pursuant to Declarations of Trust dated November 5, 2004 and November 11, 2015, respectively, and are registered under the Investment Company Act of 1940, as amended (the “1940 Act”), as open-end management investment companies.
The following are 15 separate funds of the Trusts (each, a "Fund" and collectively, the "Funds") covered by this report:
| | | Diversification Classification |
JPMorgan Equity Income Fund | Class A, Class C, Class I, Class R2, Class R3, Class R4, Class R5 and Class R6 | | |
JPMorgan Equity Index Fund | Class A, Class C, Class I and Class R6 | | |
JPMorgan Equity Premium Income Fund | Class A, Class C, Class I, Class R5 and Class R6 | | |
JPMorgan Hedged Equity Fund | Class A, Class C, Class I, Class R5 and Class R6 | | |
JPMorgan Hedged Equity 2 Fund | Class A, Class C, Class I, Class R5 and Class R6 | | |
JPMorgan Hedged Equity 3 Fund | Class A, Class C, Class I, Class R5 and Class R6 | | |
JPMorgan Large Cap Growth Fund | Class A, Class C, Class I, Class R2, Class R3, Class R4, Class R5 and Class R6 | | |
JPMorgan Large Cap Value Fund | Class A, Class C, Class I, Class R2, Class R3, Class R4, Class R5 and Class R6 | | |
JPMorgan U.S. Applied Data Science Value Fund
| Class A, Class C, Class I, Class R2, Class R5 and Class R6 | | |
JPMorgan U.S. Equity Fund | Class A, Class C, Class I, Class L, Class R2, Class R3, Class R4, Class R5 and Class R6 | | |
JPMorgan U.S. GARP Equity Fund | Class A, Class C, Class I, Class R2, Class R5 and Class R6 | | |
JPMorgan U.S. Large Cap Core Plus Fund | Class A, Class C, Class I, Class R2, Class R5 and Class R6 | | |
JPMorgan U.S. Research Enhanced Equity Fund | Class A, Class I and Class R6 | | |
JPMorgan U.S. Sustainable Leaders Fund | Class A, Class C, Class I and Class R6 | | |
| Class A, Class C, Class I, Class R2, Class R3, Class R4, Class R5 and Class R6 | | |
The investment objective of JPMorgan Equity Income Fund (“Equity Income Fund”) is to seek capital appreciation and current income.
The investment objective of JPMorgan Equity Index Fund ("Equity Index Fund") is to seek investment results that correspond to the aggregate price and dividend performance of securities in the Standard & Poor's 500 Composite Stock Price Index.
The investment objective of JPMorgan Equity Premium Income Fund (“Equity Premium Income Fund”) is to seek current income while maintaining prospects for capital appreciation.
The investment objective of JPMorgan Hedged Equity Fund (“Hedged Equity Fund”), JPMorgan Hedged Equity 2 Fund (“Hedged Equity 2 Fund”) and JPMorgan Hedged Equity 3 Fund (“Hedged Equity 3 Fund”) is to seek to provide capital appreciation.
The investment objective of JPMorgan Large Cap Growth Fund ("Large Cap Growth Fund") is to seek long-term capital appreciation.
The investment objective of JPMorgan Large Cap Value Fund (“Large Cap Value Fund”) is to seek capital appreciation with the incidental goal of achieving current income by investing primarily in equity securities.
The investment objective of JPMorgan U.S. Applied Data Science Value Fund (“U.S. Applied Data Science Value Fund”) and JPMorgan U.S. Sustainable Leaders Fund (“U.S. Sustainable Leaders Fund”) is to seek to provide long-term capital appreciation.
The investment objective of JPMorgan U.S. Equity Fund (“U.S. Equity Fund”) and JPMorgan U.S. Large Cap Core Plus Fund ("U.S. Large Cap Core Plus Fund") is to seek to provide high total return from a portfolio of selected equity securities.
The investment objective of JPMorgan U.S. GARP Equity Fund (“U.S. GARP Equity Fund”) is to seek to provide long-term capital growth.
The investment objective of JPMorgan U.S. Research Enhanced Equity Fund (“U.S. Research Enhanced Equity Fund”) is to seek to provide a consistently high total return from a broadly diversified portfolio of equity securities with risk characteristics similar to the Standard and Poor’s 500 Composite Stock Price Index.
The investment objective of JPMorgan U.S. Value Fund (“U.S. Value Fund”) is to seek to provide capital growth over the long-term and to earn income from dividends.
| J.P. Morgan Large Cap Funds | |
Class L Shares of U.S. Equity Fund and Class A Shares of U.S. Research Enhanced Equity Fund are publicly offered on a limited basis. Investors are not eligible to purchase Class L Shares of the Funds unless they meet certain requirements as described in the Funds’ prospectus.
Prior to February 17, 2023, all share classes of Hedged Equity Fund were publicly offered on a limited basis. Investors were not eligible to purchase shares of Hedged Equity Fund unless they met certain requirements as described in the Fund's prospectuses.
JPMorgan Equity Income Fund is offered on a limited basis. Investors are not eligible to purchase shares of the Fund unless they meet certain requirements as described in the Fund’s prospectuses. Effective January 15, 2024, the Fund is no longer be subject to a limited offering, and all limited offering disclosure relating to the Fund will be deleted.
Class A Shares generally provide for a front-end sales charge while Class C Shares provide for a contingent deferred sales charge ("CDSC"). No sales charges are assessed with respect to Class I, Class L, Class R2, Class R3, Class R4, Class R5 and Class R6 Shares. Certain Class A Shares, for which front-end sales charges have been waived, may be subject to a CDSC as described in the Funds' prospectus. Class C Shares automatically convert to Class A Shares after eight years. All classes of shares have equal rights as to earnings, assets and voting privileges, except that each class may bear different transfer agency, distribution and service fees and each class has exclusive voting rights with respect to its distribution plan and shareholder servicing agreements.
J.P. Morgan Investment Management Inc. (“JPMIM”), an indirect, wholly-owned subsidiary of JPMorgan Chase & Co. (“JPMorgan”), acts as adviser (the “Adviser”) and administrator (the “Administrator”) to the Funds.
2. Significant Accounting Policies
The following is a summary of significant accounting policies followed by the Funds in the preparation of their financial statements. The Funds are investment companies and, accordingly, follow the investment company accounting and reporting guidance of the Financial Accounting Standards Board (“FASB”) Accounting Standards Codification Topic 946 — Investment Companies, which is part of U.S. generally accepted accounting principles (“GAAP”). The preparation of financial statements in conformity with GAAP requires management to make estimates and assumptions that affect (i) the reported amounts of assets and liabilities, (ii) disclosure of contingent assets and liabilities at the date of the financial statements, and (iii) the reported amounts of increases and decreases in net assets from operations during the reporting period. Actual results could differ from those estimates.
A. Valuation of Investments — Investments are valued in accordance with GAAP and the Funds' valuation policies set forth by, and under the supervision and responsibility of, the Boards of Trustees of the Trusts (the "Boards"), which established the following approach to valuation, as described more fully below: (i) investments for which market quotations are readily available shall be valued at their market value and (ii) all other investments for which market quotations are not readily available shall be valued at their fair value as determined in good faith by the Boards.
Under Section 2(a)(41) of the 1940 Act, the Boards are required to determine fair value for securities that do not have readily available market quotations. Under SEC Rule 2a-5 (Good Faith Determinations of Fair Value), the Boards may designate the performance of these fair valuation determinations to a valuation designee. The Boards have designated the Adviser as the “Valuation Designee” to perform fair valuation determinations for the Funds on behalf of the Boards subject to appropriate oversight by the Boards. The Adviser, as Valuation Designee, leverages the J.P. Morgan Asset Management Americas Valuation Committee (“AVC”) to help oversee and carry out the policies for the valuation of investments held in the Funds. The Adviser, as Valuation Designee, remains responsible for the valuation determinations.
This oversight by the AVC includes monitoring the appropriateness of fair values based on results of ongoing valuation oversight including, but not limited to, consideration of macro or security specific events, market events, and pricing vendor and broker due diligence. The Administrator is responsible for discussing and assessing the potential impacts to the fair values on an ongoing basis, and, at least on a quarterly basis, with the AVC and the Boards.
A market-based approach is primarily used to value the Funds' investments. Investments for which market quotations are not readily available are fair valued using prices supplied by approved affiliated and/or unaffiliated pricing vendors or third party broker-dealers (collectively referred to as “Pricing Services”) or may be internally fair valued using methods set forth by the valuation policies approved by the Boards. This may include the use of related or comparable assets or liabilities, recent transactions, market multiples, book values and other relevant information for the investment. An income-based valuation approach may be used in which the anticipated future cash flows of the investment are discounted to calculate the fair value. Discounts may also be applied due to the nature or duration of any restrictions on the disposition of the investments. Valuations may be based upon current market prices of securities that are comparable in coupon, rating, maturity and industry. It is possible that the estimated values may differ significantly from the values that would have been used had a ready market for the investments existed, and such differences could be material.
Fixed income instruments are valued based on prices received from approved affiliated and unaffiliated pricing vendors or third party broker-dealers (collectively referred to as “Pricing Services”). The Pricing Services use multiple valuation techniques to determine the valuation of fixed income instruments. In instances where sufficient market activity exists, the Pricing Services may utilize a market-based approach through which trades or quotes from market makers are used to determine the valuation of these instruments. In instances where sufficient market activity may not exist, the Pricing Services also utilize proprietary valuation models which may consider market transactions in comparable securities and the
| J.P. Morgan Large Cap Funds | |
NOTES TO FINANCIAL STATEMENTSAS OF December 31, 2023 (Unaudited) (continued)
(Dollar values in thousands)
various relationships between securities in determining fair value and/or market characteristics in order to estimate the relevant cash flows, which are then discounted to calculate the fair values.
Equities and other exchange-traded instruments are valued at the last sale price or official market closing price on the primary exchange on which the instrument is traded before the net asset values (“NAV”) of the Funds are calculated on a valuation date.
Investments in open-end investment companies (“Underlying Funds”) are valued at each Underlying Fund’s NAV per share as of the report date.
Futures contracts and options are generally valued on the basis of available market quotations.
Valuations reflected in this report are as of the report date. As a result, changes in valuation due to market events and/or issuer-related events after the report date and prior to issuance of the report are not reflected herein.
The various inputs that are used in determining the valuation of the Funds' investments are summarized into the three broad levels listed below.
•
Level 1 — Unadjusted inputs using quoted prices in active markets for identical investments.
•
Level 2 — Other significant observable inputs including, but not limited to, quoted prices for similar investments, inputs other than quoted prices that are observable for investments (such as interest rates, prepayment speeds, credit risk, etc.) or other market corroborated inputs.
•
Level 3 — Significant inputs based on the best information available in the circumstances, to the extent observable inputs are not available (including the Funds' assumptions in determining the fair value of investments).
A financial instrument’s level within the fair value hierarchy is based on the lowest level of any input, both individually and in the aggregate, that is significant to the fair value measurement. The inputs or methodology used for valuing instruments are not necessarily an indication of the risk associated with investing in those instruments.
The following tables represent each valuation input as presented on the Schedules of Portfolio Investments ("SOIs"):
| | | | |
| | Level 2
Other significant
observable inputs | Level 3
Significant
unobservable inputs | |
Total Investments in Securities (a) | | | | |
|
| Please refer to the SOI for specifics of portfolio holdings. |
| | | | |
| | Level 2
Other significant
observable inputs | Level 3
Significant
unobservable inputs | |
Investments in Securities | | | | |
| | | | |
| | | | |
| | | | |
| | | | |
Investment of Cash Collateral from Securities Loaned | | | | |
Total Short-Term Investments | | | | |
Total Investments in Securities | | | | |
Appreciation in Other Financial Instruments | | | | |
| | | | |
Equity Premium Income Fund | | | | |
| | Level 2
Other significant
observable inputs | Level 3
Significant
unobservable inputs | |
Investments in Securities | | | | |
| | | | |
| | | | |
| J.P. Morgan Large Cap Funds | |
Equity Premium Income Fund (continued) | | | | |
| | Level 2 Other significant observable inputs | Level 3 Significant unobservable inputs | |
| | | | |
Investment of Cash Collateral from Securities Loaned | | | | |
Total Investments in Securities | | | | |
Depreciation in Other Financial Instruments | | | | |
| | | | |
| | | | |
| | Level 2
Other significant
observable inputs | Level 3
Significant
unobservable inputs | |
Total Investments in Securities (a) | | | | |
Appreciation in Other Financial Instruments | | | | |
| | | | |
Depreciation in Other Financial Instruments | | | | |
| | | | |
| | | | |
| | | | |
Total Net Appreciation/ Depreciation in Other
Financial Instruments | | | | |
|
| Please refer to the SOI for specifics of portfolio holdings. |
| | | | |
| | Level 2
Other significant
observable inputs | Level 3
Significant
unobservable inputs | |
Total Investments in Securities (a) | | | | |
Appreciation in Other Financial Instruments | | | | |
| | | | |
| J.P. Morgan Large Cap Funds | |
NOTES TO FINANCIAL STATEMENTSAS OF December 31, 2023 (Unaudited) (continued)
(Dollar values in thousands)
Hedged Equity 3 Fund (continued) | | | | |
| | Level 2 Other significant observable inputs | Level 3 Significant unobservable inputs | |
Depreciation in Other Financial Instruments | | | | |
| | | | |
| | | | |
| | | | |
Total Net Appreciation/ Depreciation in Other
Financial Instruments | | | | |
|
| Please refer to the SOI for specifics of portfolio holdings. |
| | | | |
| | Level 2
Other significant
observable inputs | Level 3
Significant
unobservable inputs | |
Total Investments in Securities (a) | | | | |
|
| Please refer to the SOI for specifics of portfolio holdings. |
| | | | |
| | Level 2
Other significant
observable inputs | Level 3
Significant
unobservable inputs | |
Total Investments in Securities (a) | | | | |
|
| Please refer to the SOI for specifics of portfolio holdings. |
U.S. Applied Data Science Value Fund | | | | |
| | Level 2
Other significant
observable inputs | Level 3
Significant
unobservable inputs | |
Total Investments in Securities (a) | | | | |
Appreciation in Other Financial Instruments | | | | |
| | | | |
|
| Please refer to the SOI for specifics of portfolio holdings. |
| | | | |
| | Level 2
Other significant
observable inputs | Level 3
Significant
unobservable inputs | |
Total Investments in Securities (a) | | | | |
|
| Please refer to the SOI for specifics of portfolio holdings. |
| | | | |
| | Level 2
Other significant
observable inputs | Level 3
Significant
unobservable inputs | |
Total Investments in Securities (a) | | | | |
| J.P. Morgan Large Cap Funds | |
U.S. GARP Equity Fund (continued) | | | | |
| | Level 2 Other significant observable inputs | Level 3 Significant unobservable inputs | |
Appreciation in Other Financial Instruments | | | | |
| | | | |
|
| Please refer to the SOI for specifics of portfolio holdings. |
U.S. Large Cap Core Plus Fund | | | | |
| | Level 2
Other significant
observable inputs | Level 3
Significant
unobservable inputs | |
Total Investments in Securities (a) | | | | |
Total Liabilities in Securities Sold Short (a) | | | | |
Appreciation in Other Financial Instruments | | | | |
| | | | |
|
| Please refer to the SOI for specifics of portfolio holdings. |
U.S. Research Enhanced Equity Fund | | | | |
| | Level 2
Other significant
observable inputs | Level 3
Significant
unobservable inputs | |
Total Investments in Securities (a) | | | | |
Appreciation in Other Financial Instruments | | | | |
| | | | |
|
| Please refer to the SOI for specifics of portfolio holdings. |
U.S. Sustainable Leaders Fund | | | | |
| | Level 2
Other significant
observable inputs | Level 3
Significant
unobservable inputs | |
Total Investments in Securities (a) | | | | |
Appreciation in Other Financial Instruments | | | | |
| | | | |
|
| Please refer to the SOI for specifics of portfolio holdings. |
| | | | |
| | Level 2
Other significant
observable inputs | Level 3
Significant
unobservable inputs | |
Total Investments in Securities (a) | | | | |
|
| Please refer to the SOI for specifics of portfolio holdings. |
| J.P. Morgan Large Cap Funds | |
NOTES TO FINANCIAL STATEMENTSAS OF December 31, 2023 (Unaudited) (continued)
(Dollar values in thousands)
B. Restricted Securities — Certain securities held by the Funds may be subject to legal or contractual restrictions on resale. Restricted securities generally are resold in transactions exempt from registration under the Securities Act of 1933, as amended (the “Securities Act”). Disposal of these securities may involve time-consuming negotiations and expense. Prompt sale at the current valuation may be difficult and could adversely affect the NAVs of the Funds.
As of December 31, 2023, the Funds had no investments in restricted securities other than securities sold to the Funds under Rule 144A and/or Regulation S under the Securities Act.
C. Securities Lending — The Funds are authorized to engage in securities lending in order to generate additional income. The Funds are able to lend to approved borrowers. Citibank N.A. (“Citibank”) serves as lending agent for the Funds, pursuant to a Securities Lending Agency Agreement (the “Securities Lending Agency Agreement”). Securities loaned are collateralized by cash equal to at least 100% of the market value plus accrued interest on the securities lent, which is invested in the Class IM Shares of the JPMorgan U.S. Government Money Market Fund, the Class IM Shares of the JPMorgan Prime Money Market Fund, and the Agency SL Class Shares of the JPMorgan Securities Lending Money Market Fund. The Funds retain the interest earned on cash collateral investments but are required to pay the borrower a rebate for the use of the cash collateral. In cases where the lent security is of high value to borrowers, there may be a negative rebate (i.e., a net payment from the borrower to the Funds). Upon termination of a loan, the Funds are required to return to the borrower an amount equal to the cash collateral, plus any rebate owed to the borrowers. The remaining maturities of the securities lending transactions are considered overnight and continuous. Loans are subject to termination by the Funds or the borrower at any time.
The net income earned on the securities lending (after payment of rebates and Citibank’s fee) is included on the Statements of Operations as Income from securities lending (net). The Funds also receive payments from the borrower during the period of the loan, equivalent to dividends and interest earned on the securities loaned, which are recorded as Dividend or Interest income, respectively, on the Statements of Operations.
Under the Securities Lending Agency Agreement, Citibank marks to market the loaned securities on a daily basis. In the event the cash received from the borrower is less than 102% of the value of the loaned securities (105% for loans of non-U.S. securities), Citibank requests additional cash from the borrower so as to maintain a collateralization level of at least 102% of the value of the loaned securities plus accrued interest (105% for loans of non-U.S. securities), subject to certain de minimis amounts.
The value of securities out on loan is recorded as an asset on the Statements of Assets and Liabilities. The value of the cash collateral received is recorded as a liability on the Statements of Assets and Liabilities and details of collateral investments are disclosed on the SOIs.
The Funds bear the risk of loss associated with the collateral investments and are not entitled to additional collateral from the borrower to cover any such losses. To the extent that the value of the collateral investments declines below the amount owed to a borrower, the Funds may incur losses that exceed the amount they earned on lending the security. Upon termination of a loan, the Funds may use leverage (borrow money) to repay the borrower for cash collateral posted if the Adviser does not believe that it is prudent to sell the collateral investments to fund the payment of this liability. Securities lending activity is subject to master netting arrangements.
The following table presents for each lending Fund, the value of the securities on loan with Citibank, net of amounts available for offset under the master netting arrangements and any related collateral received or posted by the Funds as of December 31, 2023.
| Investment Securities
on Loan, at value,
Presented on the
Statements of Assets
and Liabilities | Cash Collateral
Posted by Borrower* | Net Amount Due
to Counterparty
(not less than zero) |
| | | |
Equity Premium Income Fund | | | |
| | | |
| | | |
|
| Collateral posted reflects the value of securities on loan and does not include any additional amounts received from the borrower. |
Securities lending also involves counterparty risks, including the risk that the loaned securities may not be returned in a timely manner or at all. Subject to certain conditions, Citibank has agreed to indemnify the Funds from losses resulting from a borrower’s failure to return a loaned security.
| J.P. Morgan Large Cap Funds | |
JPMIM voluntarily waived investment advisory fees charged to the Funds to reduce the impact of the cash collateral investment in the JPMorgan U.S. Government Money Market Fund from 0.13% to 0.06%. For the six months ended December 31, 2023, JPMIM waived fees associated with the Funds' investment in the JPMorgan U.S. Government Money Market Fund as follows:
| |
| |
Equity Premium Income Fund | |
| |
| |
| |
| |
| |
|
| Amount rounds to less than one thousand. |
The above waiver is included in the determination of earnings on cash collateral investment and in the calculation of Citibank’s compensation and is included on the Statements of Operations as Income from securities lending (net).
Equity Income Fund, Hedged Equity Fund, Hedged Equity 2 Fund, Hedged Equity 3 Fund, Large Cap Growth Fund, U.S. Applied Data Science Value Fund, U.S. Equity Fund, U.S. Large Cap Core Plus Fund, U.S. Research Enhanced Equity Fund, U.S. Sustainable Leaders Fund and U.S. Value Fund did not have any securities out on loan at December 31, 2023. Hedged Equity Fund, Hedged Equity 2 Fund, Hedged Equity 3 Fund, U.S. Applied Data Science Value Fund, U.S. Large Cap Core Plus Fund, U.S. Research Enhanced Equity Fund and U.S. Sustainable Leaders Fund did not lend out any securities during the six months ended December 31, 2023.
D. Investment Transactions with Affiliates — The Funds invested in Underlying Funds advised by the Adviser. An issuer which is under common control with a Fund may be considered an affiliate. For the purposes of the financial statements, the Funds assume the issuers listed in the tables below to be affiliated issuers. The Underlying Funds’ distributions may be reinvested into such Underlying Funds. Reinvestment amounts are included in the purchases at cost amounts in the tables below.
|
For the six months ended December 31, 2023 |
| | | | | Change in
Unrealized
Appreciation/
(Depreciation) | | Shares at
December 31,
2023 | | Capital Gain
Distributions |
JPMorgan Prime Money Market Fund Class IM Shares, 5.51% (a) (b) | | | | | | | | | |
JPMorgan Securities Lending Money Market Fund Agency SL Class Shares, 5.56% (a) (b) | | | | | | | | | |
JPMorgan U.S. Government Money Market Fund Class IM Shares, 5.30% (a) (b) | | | | | | | | | |
| | | | | | | | | |
|
| Investment in an affiliated fund, which is registered under the Investment Company Act of 1940, as amended, and is advised by J.P. Morgan Investment Management Inc. |
| The rate shown is the current yield as of December 31, 2023. |
| Amount is included on the Statements of Operations as Income from securities lending (net) (after payments of rebates and Citibank’s fee). |
|
For the six months ended December 31, 2023 |
| | | | | Change in
Unrealized
Appreciation/
(Depreciation) | | Shares at
December 31,
2023 | | Capital Gain
Distributions |
| | | | | | | | | |
| J.P. Morgan Large Cap Funds | |
NOTES TO FINANCIAL STATEMENTSAS OF December 31, 2023 (Unaudited) (continued)
(Dollar values in thousands)
Equity Index Fund (continued) |
For the six months ended December 31, 2023 |
| | | | | Change in Unrealized Appreciation/ (Depreciation) | | Shares at December 31, 2023 | | Capital Gain Distributions |
JPMorgan Securities Lending Money Market Fund Agency SL Class Shares, 5.56% (b) (c) | | | | | | | | | |
JPMorgan U.S. Government Money Market Fund Class IM Shares, 5.30% (b) (c) | | | | | | | | | |
JPMorgan U.S. Government Money Market Fund Class Institutional Shares, 5.21% (b) (c) | | | | | | | | | |
| | | | | | | | | |
|
| Investment in affiliate. This security is included in an index in which the Fund, as an index fund, tracks. |
| Investment in an affiliated fund, which is registered under the Investment Company Act of 1940, as amended, and is advised by J.P. Morgan Investment Management Inc. |
| The rate shown is the current yield as of December 31, 2023. |
| Amount is included on the Statements of Operations as Income from securities lending (net) (after payments of rebates and Citibank’s fee). |
Equity Premium Income Fund |
For the six months ended December 31, 2023 |
| | | | | Change in
Unrealized
Appreciation/
(Depreciation) | | Shares at
December 31,
2023 | | Capital Gain
Distributions |
JPMorgan Prime Money Market Fund Class IM Shares, 5.51% (a) (b) | | | | | | | | | |
JPMorgan Securities Lending Money Market Fund Agency SL Class Shares, 5.56% (a) (b) | | | | | | | | | |
JPMorgan U.S. Government Money Market Fund Class IM Shares, 5.30% (a) (b) | | | | | | | | | |
| | | | | | | | | |
|
| Investment in an affiliated fund, which is registered under the Investment Company Act of 1940, as amended, and is advised by J.P. Morgan Investment Management Inc. |
| The rate shown is the current yield as of December 31, 2023. |
| Amount is included on the Statements of Operations as Income from securities lending (net) (after payments of rebates and Citibank’s fee). |
|
For the six months ended December 31, 2023 |
| | | | | Change in
Unrealized
Appreciation/
(Depreciation) | | Shares at
December 31,
2023 | | Capital Gain
Distributions |
JPMorgan U.S. Government Money Market Fund Class Institutional Shares, 5.21% (a) (b) | | | | | | | | | |
|
| Investment in an affiliated fund, which is registered under the Investment Company Act of 1940, as amended, and is advised by J.P. Morgan Investment Management Inc. |
| The rate shown is the current yield as of December 31, 2023. |
| J.P. Morgan Large Cap Funds | |
|
For the six months ended December 31, 2023 |
| | | | | Change in
Unrealized
Appreciation/
(Depreciation) | | Shares at
December 31,
2023 | | Capital Gain
Distributions |
JPMorgan U.S. Government Money Market Fund Class IM Shares, 5.30% (a) (b) | | | | | | | | | |
|
| Investment in an affiliated fund, which is registered under the Investment Company Act of 1940, as amended, and is advised by J.P. Morgan Investment Management Inc. |
| The rate shown is the current yield as of December 31, 2023. |
|
For the six months ended December 31, 2023 |
| | | | | Change in
Unrealized
Appreciation/
(Depreciation) | | Shares at
December 31,
2023 | | Capital Gain
Distributions |
JPMorgan Prime Money Market Fund Class IM Shares, 5.51% (a) (b) | | | | | | | | | |
JPMorgan U.S. Government Money Market Fund Class IM Shares, 5.30% (a) (b) | | | | | | | | | |
| | | | | | | | | |
|
| Investment in an affiliated fund, which is registered under the Investment Company Act of 1940, as amended, and is advised by J.P. Morgan Investment Management Inc. |
| The rate shown is the current yield as of December 31, 2023. |
|
For the six months ended December 31, 2023 |
| | | | | Change in
Unrealized
Appreciation/
(Depreciation) | | Shares at
December 31,
2023 | | Capital Gain
Distributions |
JPMorgan Prime Money Market Fund Class IM Shares, 5.51% (a) (b) | | | | | | | | | |
JPMorgan Securities Lending Money Market Fund Agency SL Class Shares, 5.56% (a) (b) | | | | | | | | | |
JPMorgan U.S. Government Money Market Fund Class IM Shares, 5.30% (a) (b) | | | | | | | | | |
| | | | | | | | | |
|
| Investment in an affiliated fund, which is registered under the Investment Company Act of 1940, as amended, and is advised by J.P. Morgan Investment Management Inc. |
| The rate shown is the current yield as of December 31, 2023. |
| Amount is included on the Statements of Operations as Income from securities lending (net) (after payments of rebates and Citibank’s fee). |
| J.P. Morgan Large Cap Funds | |
NOTES TO FINANCIAL STATEMENTSAS OF December 31, 2023 (Unaudited) (continued)
(Dollar values in thousands)
|
For the six months ended December 31, 2023 |
| | | | | Change in
Unrealized
Appreciation/
(Depreciation) | | Shares at
December 31,
2023 | | Capital Gain
Distributions |
JPMorgan Prime Money Market Fund Class IM Shares, 5.51% (a) (b) | | | | | | | | | |
JPMorgan Securities Lending Money Market Fund Agency SL Class Shares, 5.56% (a) (b) | | | | | | | | | |
JPMorgan U.S. Government Money Market Fund Class IM Shares, 5.30% (a) (b) | | | | | | | | | |
| | | | | | | | | |
|
| Investment in an affiliated fund, which is registered under the Investment Company Act of 1940, as amended, and is advised by J.P. Morgan Investment Management Inc. |
| The rate shown is the current yield as of December 31, 2023. |
| Amount is included on the Statements of Operations as Income from securities lending (net) (after payments of rebates and Citibank’s fee). |
U.S. Applied Data Science Value Fund |
For the six months ended December 31, 2023 |
| | | | | Change in
Unrealized
Appreciation/
(Depreciation) | | Shares at
December 31,
2023 | | Capital Gain
Distributions |
JPMorgan Prime Money Market Fund Class IM Shares, 5.51% (a) (b) | | | | | | | | | |
|
| Investment in an affiliated fund, which is registered under the Investment Company Act of 1940, as amended, and is advised by J.P. Morgan Investment Management Inc. |
| The rate shown is the current yield as of December 31, 2023. |
| Amount rounds to less than one thousand. |
|
For the six months ended December 31, 2023 |
| | | | | Change in
Unrealized
Appreciation/
(Depreciation) | | Shares at
December 31,
2023 | | Capital Gain
Distributions |
JPMorgan Prime Money Market Fund Class IM Shares, 5.51% (a) (b) | | | | | | | | | |
JPMorgan Securities Lending Money Market Fund Agency SL Class Shares, 5.56% (a) (b) | | | | | | | | | |
JPMorgan U.S. Government Money Market Fund Class IM Shares, 5.30% (a) (b) | | | | | | | | | |
| | | | | | | | | |
|
| Investment in an affiliated fund, which is registered under the Investment Company Act of 1940, as amended, and is advised by J.P. Morgan Investment Management Inc. |
| The rate shown is the current yield as of December 31, 2023. |
| Amount is included on the Statements of Operations as Income from securities lending (net) (after payments of rebates and Citibank’s fee). |
| J.P. Morgan Large Cap Funds | |
|
For the six months ended December 31, 2023 |
| | | | | Change in
Unrealized
Appreciation/
(Depreciation) | | Shares at
December 31,
2023 | | Capital Gain
Distributions |
JPMorgan Prime Money Market Fund Class IM Shares, 5.51% (a) (b) | | | | | | | | | |
JPMorgan Securities Lending Money Market Fund Agency SL Class Shares, 5.56% (a) (b) | | | | | | | | | |
JPMorgan U.S. Government Money Market Fund Class IM Shares, 5.30% (a) (b) | | | | | | | | | |
| | | | | | | | | |
|
| Investment in an affiliated fund, which is registered under the Investment Company Act of 1940, as amended, and is advised by J.P. Morgan Investment Management Inc. |
| The rate shown is the current yield as of December 31, 2023. |
| Amount is included on the Statements of Operations as Income from securities lending (net) (after payments of rebates and Citibank’s fee). |
U.S. Large Cap Core Plus Fund |
For the six months ended December 31, 2023 |
| | | | | Change in
Unrealized
Appreciation/
(Depreciation) | | Shares at
December 31,
2023 | | Capital Gain
Distributions |
JPMorgan Prime Money Market Fund Class IM Shares, 5.51% (a) (b) | | | | | | | | | |
|
| Investment in an affiliated fund, which is registered under the Investment Company Act of 1940, as amended, and is advised by J.P. Morgan Investment Management Inc. |
| The rate shown is the current yield as of December 31, 2023. |
U.S. Research Enhanced Equity Fund |
For the six months ended December 31, 2023 |
| | | | | Change in
Unrealized
Appreciation/
(Depreciation) | | Shares at
December 31,
2023 | | Capital Gain
Distributions |
JPMorgan Prime Money Market Fund Class IM Shares, 5.51% (a) (b) | | | | | | | | | |
JPMorgan Securities Lending Money Market Fund Agency SL Class Shares, 5.56% (a) (b) | | | | | | | | | |
| | | | | | | | | |
|
| Investment in an affiliated fund, which is registered under the Investment Company Act of 1940, as amended, and is advised by J.P. Morgan Investment Management Inc. |
| The rate shown is the current yield as of December 31, 2023. |
| Amount is included on the Statements of Operations as Income from securities lending (net) (after payments of rebates and Citibank’s fee). |
| J.P. Morgan Large Cap Funds | |
NOTES TO FINANCIAL STATEMENTSAS OF December 31, 2023 (Unaudited) (continued)
(Dollar values in thousands)
U.S. Sustainable Leaders Fund |
For the six months ended December 31, 2023 |
| | | | | Change in
Unrealized
Appreciation/
(Depreciation) | | Shares at
December 31,
2023 | | Capital Gain
Distributions |
JPMorgan Prime Money Market Fund Class IM Shares, 5.51% (a) (b) | | | | | | | | | |
|
| Investment in an affiliated fund, which is registered under the Investment Company Act of 1940, as amended, and is advised by J.P. Morgan Investment Management Inc. |
| The rate shown is the current yield as of December 31, 2023. |
| Amount rounds to less than one thousand. |
|
For the six months ended December 31, 2023 |
| | | | | Change in
Unrealized
Appreciation/
(Depreciation) | | Shares at
December 31,
2023 | | Capital Gain
Distributions |
JPMorgan Prime Money Market Fund Class IM Shares, 5.51% (a) (b) | | | | | | | | | |
JPMorgan U.S. Government Money Market Fund Class IM Shares, 5.30% (a) (b) | | | | | | | | | |
| | | | | | | | | |
|
| Investment in an affiliated fund, which is registered under the Investment Company Act of 1940, as amended, and is advised by J.P. Morgan Investment Management Inc. |
| The rate shown is the current yield as of December 31, 2023. |
E. Foreign Currency Translation — The books and records of the Funds are maintained in U.S. dollars. Foreign currency amounts are translated into U.S. dollars at the prevailing exchange rates of such currencies against the U.S. dollar. The market value of investment securities and other assets and liabilities are translated at the exchange rate as of the valuation date. Purchases and sales of investment securities, income and expenses are translated at the exchange rate prevailing on the respective dates of such transactions.
The Funds do not isolate the effect of changes in foreign exchange rates from changes in market prices on securities held. Accordingly, such changes are included within Change in net unrealized appreciation/depreciation on investments in non-affiliates on the Statements of Operations.
Reported realized foreign currency gains and losses arise from the disposition of foreign currency, currency gains or losses realized between the trade and settlement dates on securities transactions, and the difference between the amounts of dividends, interest and foreign withholding taxes recorded on each Fund's books on the transaction date and the U.S. dollar equivalent of the amounts actually received or paid. These reported realized foreign currency gains and losses are included in Net realized gain (loss) on foreign currency transactions on the Statements of Operations. Unrealized foreign currency gains and losses arise from changes (due to changes in exchange rates) in the value of foreign currency and other assets and liabilities denominated in foreign currencies, which are held at period end and are included in Change in net unrealized appreciation/depreciation on foreign currency translations on the Statements of Operations.
F. Options — Hedged Equity Fund, Hedged Equity 2 Fund and Hedged Equity 3 Fund purchased and sold (“wrote”) put and call options on various instruments including options on indices to manage and hedge interest rate risks within their portfolios and also to gain long or short exposure to the underlying instrument, index, currency or rate. A purchaser of a put option has the right, but not the obligation, to sell the underlying instrument at an agreed upon price (“strike price”) to the option seller. A purchaser of a call option has the right, but not the obligation, to purchase the underlying instrument at the strike price from the option seller.
Options Purchased— Premiums paid by the Funds for options purchased are included on the Statements of Assets and Liabilities as Options purchased. The option is adjusted daily to reflect the current market value of the option and the change is recorded as Change in net unrealized appreciation/depreciation on options purchased on the Statements of Operations. If the option is allowed to expire, the Funds will lose the entire premium they paid and record a realized loss for the premium amount. Premiums paid for options purchased which are exercised or closed are added to the amounts paid or offset against the proceeds on the underlying investment transaction to determine the realized gain (loss) or cost basis of the underlying investment.
| J.P. Morgan Large Cap Funds | |
Options Written— Premiums received by the Funds for options written are included on the Statements of Assets and Liabilities as a liability. The amount of the liability is adjusted daily to reflect the current market value of the option written and the change in market value is recorded as Change in net unrealized appreciation/depreciation on options written on the Statements of Operations. Premiums received from options written that expire are treated as realized gains. If a written option is closed, the Funds record a realized gain or loss on options written based on whether the cost of the closing transaction exceeds the premium received. If a call option is exercised by the option buyer, the premium received by the Funds is added to the proceeds from the sale of the underlying security to the option buyer and compared to the cost of the closing transaction to determine whether there has been a realized gain or loss. If a put option is exercised by an option buyer, the premium received by the option seller reduces the cost basis of the purchased security.
The Funds pledge collateral to the counterparty in the form of securities for options written. Securities designated as collateral are denoted on the SOIs.
Written uncovered call options subject the Funds to unlimited risk of loss. Written covered call options limit the upside potential of a security above the strike price. Written put options subject the Funds to risk of loss if the value of the security declines below the exercise price minus the put premium.
The Funds are not subject to credit risk on options written as the counterparty has already performed its obligation by paying the premium at the inception of the contract.
The Funds’ exchange-traded option contracts are not subject to master netting arrangements (the right to close out all transactions traded with a counterparty and net amounts owed or due across transactions).
G. Futures Contracts — Equity Index Fund, Equity Premium Income Fund, Hedged Equity Fund, Hedged Equity 2 Fund, Hedged Equity 3 Fund, U.S. Applied Data Science Value Fund, U.S. Equity Fund, U.S. GARP Equity Fund, U.S. Large Cap Core Plus Fund, U.S. Research Enhanced Equity Fund and U.S. Sustainable Leaders Fund used index futures contracts to gain or reduce exposure to the stock market, or maintain liquidity or minimize transaction costs. The Funds also purchased futures contracts to invest incoming cash in the market or sold futures in response to cash outflows, thereby simulating an invested position in the underlying index while maintaining a cash balance for liquidity.
Futures contracts provide for the delayed delivery of the underlying instrument at a fixed price or are settled for a cash amount based on the change in the value of the underlying instrument at a specific date in the future. Upon entering into a futures contract, the Funds are required to deposit with the broker, cash or securities in an amount equal to a certain percentage of the contract amount, which is referred to as the initial margin deposit. Subsequent payments, referred to as variation margin, are made or received by the Funds periodically and are based on changes in the market value of open futures contracts. Changes in the market value of open futures contracts are recorded as Change in net unrealized appreciation/depreciation on futures contracts on the Statements of Operations. Realized gains or losses, representing the difference between the value of the contract at the time it was opened and the value at the time it was closed, are reported on the Statements of Operations at the closing or expiration of the futures contract. Securities deposited as initial margin are designated on the SOIs, while cash deposited, which is considered restricted, is recorded on the Statements of Assets and Liabilities. A receivable from and/or a payable to brokers for the daily variation margin is also recorded on the Statements of Assets and Liabilities.
The use of futures contracts exposes the Funds to equity price risk. The Funds may be subject to the risk that the change in the value of the futures contract may not correlate perfectly with the underlying instrument. Use of long futures contracts subjects the Funds to risk of loss in excess of the amounts shown on the Statements of Assets and Liabilities, up to the notional amount of the futures contracts. Use of short futures contracts subjects the Funds to unlimited risk of loss. The Funds may enter into futures contracts only on exchanges or boards of trade. The exchange or board of trade acts as the counterparty to each futures transaction; therefore, the Funds' credit risk is limited to failure of the exchange or board of trade. Under some circumstances, futures exchanges may establish daily limits on the amount that the price of a futures contract can vary from the previous day’s settlement price, which could effectively prevent liquidation of positions.
The Funds' futures contracts are not subject to master netting arrangements (the right to close out all transactions traded with a counterparty and net amounts owed or due across transactions).
Derivatives Volume
The table below discloses the volume of the Funds' options and futures contracts activity during the six months ended December 31, 2023. Please refer to the tables in the Summary of Derivatives Information for derivative-related gains and losses associated with volume activity (amounts in thousands, except number of contracts):
| | Equity Premium
Income Fund |
| | |
Average Notional Balance Long | | |
Average Notional Balance Short | | |
Ending Notional Balance Long | | |
| J.P. Morgan Large Cap Funds | |
NOTES TO FINANCIAL STATEMENTSAS OF December 31, 2023 (Unaudited) (continued)
(Dollar values in thousands)
| | | |
| | | |
Average Notional Balance Long | | | |
Ending Notional Balance Long | | | |
| | | |
Average Number of Contracts Purchased | | | |
Average Number of Contracts Written | | | |
Ending Number of Contracts Purchased | | | |
Ending Number of Contracts Written | | | |
| U.S.
Applied Data
Science
Value Fund | | |
| | | |
Average Notional Balance Long | | | |
Ending Notional Balance Long | | | |
| U.S.
Large Cap
Core Plus
Fund | U.S.
Research
Enhanced
Equity
Fund | U.S.
Sustainable
Leaders
Fund |
| | | |
Average Notional Balance Long | | | |
Ending Notional Balance Long | | | |
The Funds' derivatives contracts held at December 31, 2023 are not accounted for as hedging instruments under GAAP.
H. Equity-Linked Notes — Equity Premium Income Fund invested in Equity-Linked Notes (“ELNs”). These are hybrid instruments which combine both debt and equity characteristics into a single note form. ELNs' values are linked to the performance of an underlying index. ELNs are unsecured debt obligations of an issuer and may not be publicly listed or traded on an exchange. ELNs are valued daily, under procedures adopted by the Board, based on values provided by an approved pricing source. These notes have a coupon which is accrued and recorded as interest income on the Statements of Operations. Changes in the market value of ELNs are recorded as Change in net unrealized appreciation or depreciation on the Statements of Operations. The Fund realizes a gain or loss when an ELN is sold or matures, which is recorded as Net realized gain (loss) on transactions from investments in non-affiliates on the Statements of Operations.
As of December 31, 2023, Equity Premium Income Fund had outstanding ELNs as listed on the SOIs.
I. Short Sales — U.S. Large Cap Core Plus Fund engaged in short sales as part of its normal investment activities. In a short sale, the Fund sells securities it does not own in anticipation of a decline in the market value of those securities. In order to deliver securities to the purchaser, the Fund borrows securities from a broker. To close out a short position, the Fund delivers the same securities to the broker.
The Fund is required to pledge cash or securities to the broker as collateral for the securities sold short. Collateral requirements are calculated daily based on the current market value of the short positions. Cash collateral deposited with the broker is recorded as Deposits at broker for securities sold short, while cash collateral deposited at the Fund's custodian for the benefit of the broker is recorded as Restricted cash for securities sold short on the Statements of Assets and Liabilities. Securities segregated as collateral are denoted on the SOIs. The Fund may receive or pay the net of the following amounts: (i) a portion of the income from the investment of cash collateral; (ii) the broker’s fee on the borrowed securities (calculated daily based upon the market value of each borrowed security and a variable rate that is dependent on availability of the security); and (iii) a financing charge for the difference between the market value of the short position and cash collateral deposited with the broker. The net amounts of income or fees are included as interest income or interest expense on securities sold short on the Statements of Operations.
The Fund is obligated to pay the broker dividends declared on short positions when a position is open on the record date. Dividends on short positions are reported on ex-dividend date on the Statements of Operations as Dividend expense on securities sold short. The Fund is obligated to pay the broker interest accrued on short positions while the position is outstanding. Interest expense on short positions is reported as Interest expense to non-affiliates on securities sold short on the Statements of Operations. Liabilities for securities sold short are reported at market value on the Statements of Assets and Liabilities and the change in market value is recorded as Change in net unrealized appreciation/depreciation on the Statements of Operations. Short sale transactions may result in unlimited losses as the security’s price increases and the short position loses value. There is no upward limit on the price a borrowed security could attain. The Fund is also subject to risk of loss if the broker were to fail to perform its obligations under the contractual terms.
| J.P. Morgan Large Cap Funds | |
The Fund will record a realized loss if the price of the borrowed security increases between the date of the short sale and the date on which the Fund replaces the borrowed security. The Fund will record a realized gain if the price of the borrowed security declines between those dates.
As of December 31, 2023, U.S. Large Cap Core Plus Fund had outstanding short sales as listed on their SOIs.
J. Security Transactions and Investment Income — Investment transactions are accounted for on the trade date (the date the order to buy or sell is executed). Securities gains and losses are calculated on a specifically identified cost basis.
Interest income and interest expense on securities sold short, if any, is determined on the basis of coupon interest accrued using the effective interest method, which adjusts for amortization of premiums and accretion of discounts.
Dividend income and dividend expense on securities sold short, if any, is recorded on the ex-dividend date or when the Funds first learn of the dividend.
To the extent such information is publicly available, the Funds record distributions received in excess of income earned from underlying investments as a reduction of cost of investments and/or realized gain. Such amounts are based on estimates if actual amounts are not available and actual amounts of income, realized gain and return of capital may differ from the estimated amounts. The Funds adjust the estimated amounts of the components of distributions (and consequently their net investment income) as necessary, once the issuers provide information about the actual composition of the distributions.
K. Allocation of Income and Expenses— Expenses directly attributable to a Fund are charged directly to that Fund, while the expenses attributable to more than one fund of the Trusts are allocated among the applicable funds. Investment income, realized and unrealized gains and losses and expenses, other than class-specific expenses, are allocated daily to each class of shares based upon the proportion of net assets of each class at the beginning of each day.
Transfer agency fees are class-specific expenses. The amount of the transfer agency fees charged to each share class of the Funds for the six months ended December 31, 2023 are as follows:
| | | | | | | | | | |
| | | | | | | | | | |
| | | | | | | | | | |
| | | | | | | | | | |
| | | | | | | | | | |
Equity Premium Income Fund | | | | | | | | | | |
| | | | | | | | | | |
| | | | | | | | | | |
| | | | | | | | | | |
| | | | | | | | | | |
| | | | | | | | | | |
| | | | | | | | | | |
| | | | | | | | | | |
| | | | | | | | | | |
| | | | | | | | | | |
| | | | | | | | | | |
| | | | | | | | | | |
U.S. Applied Data Science Value Fund | | | | | | | | | | |
| | | | | | | | | | |
| | | | | | | | | | |
| | | | | | | | | | |
| | | | | | | | | | |
| | | | | | | | | | |
U.S. Large Cap Core Plus Fund | | | | | | | | | | |
| | | | | | | | | | |
U.S. Research Enhanced Equity Fund | | | | | | | | | | |
| | | | | | | | | | |
U.S. Sustainable Leaders Fund | | | | | | | | | | |
| | | | | | | | | | |
| J.P. Morgan Large Cap Funds | |
NOTES TO FINANCIAL STATEMENTSAS OF December 31, 2023 (Unaudited) (continued)
(Dollar values in thousands)
|
| Amount rounds to less than one thousand. |
L. Federal Income Taxes — Each Fund is treated as a separate taxable entity for Federal income tax purposes. Each Fund's policy is to comply with the provisions of the Internal Revenue Code (the “Code”) applicable to regulated investment companies and to distribute to shareholders all of its distributable net investment income and net realized capital gains on investments. Accordingly, no provision for Federal income tax is necessary. Management has reviewed the Funds' tax positions for all open tax years and has determined that as of December 31, 2023, no liability for Federal income tax is required in the Funds' financial statements for net unrecognized tax benefits. However, management’s conclusions may be subject to future review based on changes in, or the interpretation of, the accounting standards or tax laws and regulations. Each Fund's Federal tax returns for the prior three fiscal years, or since inception if shorter, remain subject to examination by the Internal Revenue Service.
M. Distributions to Shareholders — Distributions from net investment income, if any, are generally declared and paid at least quarterly, except for Large Cap Growth Fund, U.S. GARP Equity Fund, U.S. Large Cap Core Plus Fund and U.S. Sustainable Leaders Fund, for which distributions are generally declared and paid at least annually, Equity Income Fund, for which distributions are generally declared and paid at least monthly, and Equity Premium Income Fund, for which distributions are generally declared daily and paid at least monthly. Distributions are declared separately for each class. No class has preferential dividend rights; differences in per share rates are due to differences in separate class expenses. Net realized capital gains, if any, are distributed by each Fund at least annually. The amount of distributions from net investment income and net realized capital gains is determined in accordance with Federal income tax regulations, which may differ from GAAP. To the extent these “book/tax” differences are permanent in nature (i.e., that they result from other than timing of recognition — “temporary differences”), such amounts are reclassified within the capital accounts based on their Federal tax basis treatment.
3. Fees and Other Transactions with Affiliates
A. Investment Advisory Fee — Pursuant to an Investment Advisory Agreement, the Adviser manages the investments of each Fund and for such services is paid a fee. The investment advisory fee is accrued daily and paid monthly at an annual rate based on each Fund's respective average daily net assets. The annual rate for each Fund is as follows:
| |
| |
| |
Equity Premium Income Fund | |
| |
| |
| |
| |
| |
U.S. Applied Data Science Value Fund | |
| |
| |
U.S. Large Cap Core Plus Fund | |
U.S. Research Enhanced Equity Fund | |
U.S. Sustainable Leaders Fund | |
| |
The Adviser waived investment advisory fees and/or reimbursed expenses as outlined in Note 3.F.
| J.P. Morgan Large Cap Funds | |
B. Administration Fee— Pursuant to an Administration Agreement, the Administrator provides certain administration services to each Fund. In consideration of these services, the Administrator receives a fee accrued daily and paid monthly at an annual rate of 0.075% of the first $10 billion of each Fund's respective average daily net assets, plus 0.050% of each Fund's respective average daily net assets between $10 billion and $20 billion, plus 0.025% of each Fund's respective average daily net assets between $20 billion and $25 billion, plus 0.01% of each Fund's respective average daily net assets in excess of $25 billion. For the six months ended December 31, 2023, the effective annualized rate for Equity Income Fund, Equity Index Fund, Equity Premium Income Fund, Hedged Equity Fund, Hedged Equity 2 Fund, Hedged Equity 3 Fund, Large Cap Growth Fund, Large Cap Value Fund, U.S. Applied Data Science Value Fund, U.S. Equity Fund, U.S. GARP Equity Fund, U.S. Large Cap Core Plus Fund, U.S. Research Enhanced Equity Fund, U.S. Sustainable Leaders Fund and U.S. Value Fund was 0.035%, 0.075%, 0.075%, 0.065%, 0.075%, 0.075%, 0.027%, 0.075%, 0.075%, 0.057%, 0.075%, 0.075%, 0.075%, 0.075% and 0.075%, respectively, of each Fund’s average daily net assets, notwithstanding any fee waivers and/or expense reimbursements.
The Administrator waived administration fees as outlined in Note 3.F.
JPMorgan Chase Bank, N.A. ("JPMCB"), a wholly-owned subsidiary of JPMorgan, serves as the Funds' sub-administrator (the “Sub-administrator”). For its services as Sub-administrator, JPMCB receives a portion of the fees payable to the Administrator.
C. Distribution Fees — Pursuant to a Distribution Agreement, JPMorgan Distribution Services, Inc. (“JPMDS”), an indirect, wholly-owned subsidiary of JPMorgan, serves as each Fund's principal underwriter and promotes and arranges for the sale of each Fund's shares.
The Boards have adopted a Distribution Plan (the “Distribution Plan”) for Class A, Class C, Class R2 and Class R3 Shares of the Funds, as applicable, pursuant to Rule 12b-1 under the 1940 Act. Class I, Class L, Class R4, Class R5 and Class R6 Shares of the Funds do not charge a distribution fee. The Distribution Plan provides that each Fund shall pay, with respect to the applicable share classes, distribution fees, including payments to JPMDS, at annual rates of the average daily net assets as shown in the table below:
| | | | |
| | | | |
| | | | |
Equity Premium Income Fund | | | | |
| | | | |
| | | | |
| | | | |
| | | | |
| | | | |
U.S. Applied Data Science Value Fund | | | | |
| | | | |
| | | | |
U.S. Large Cap Core Plus Fund | | | | |
U.S. Research Enhanced Equity Fund | | | | |
U.S. Sustainable Leaders Fund | | | | |
| | | | |
In addition, JPMDS is entitled to receive the front-end sales charges from purchases of Class A Shares and the CDSC from redemptions of Class C Shares and certain Class A Shares for which front-end sales charges have been waived. For the six months ended December 31, 2023, JPMDS retained the following:
| | |
| | |
| | |
Equity Premium Income Fund | | |
| | |
| | |
| | |
| | |
| | |
U.S. Applied Data Science Value Fund | | |
| | |
| | |
U.S. Large Cap Core Plus Fund | | |
| J.P. Morgan Large Cap Funds | |
NOTES TO FINANCIAL STATEMENTSAS OF December 31, 2023 (Unaudited) (continued)
(Dollar values in thousands)
| | |
U.S. Research Enhanced Equity Fund | | |
U.S. Sustainable Leaders Fund | | |
| | |
|
| Amount rounds to less than one thousand. |
D. Service Fees — The Trusts, on behalf of the Funds, have entered into a Shareholder Servicing Agreement with JPMDS under which JPMDS provides certain support services to fund shareholders. For performing these services, JPMDS receives a fee with respect to all share classes, except Class R6 Shares which do not charge a service fee, that is accrued daily and paid monthly equal to a percentage of the average daily net assets as shown in the table below:
| | | | | | | | |
| | | | | | | | |
| | | | | | | | |
Equity Premium Income Fund | | | | | | | | |
| | | | | | | | |
| | | | | | | | |
| | | | | | | | |
| | | | | | | | |
| | | | | | | | |
U.S. Applied Data Science Value Fund | | | | | | | | |
| | | | | | | | |
| | | | | | | | |
U.S. Large Cap Core Plus Fund | | | | | | | | |
U.S. Research Enhanced Equity Fund | | | | | | | | |
U.S. Sustainable Leaders Fund | | | | | | | | |
| | | | | | | | |
JPMDS has entered into shareholder services contracts with affiliated and unaffiliated financial intermediaries who provide shareholder services and other related services to their clients or customers who invest in the Funds. Pursuant to such contracts, JPMDS will pay all or a portion of such fees earned to financial intermediaries for performing such services.
JPMDS waived service fees as outlined in Note 3.F.
E. Custodian and Accounting Fees — JPMCB provides portfolio custody and accounting services to the Funds. For performing these services, the Funds pay JPMCB transaction and asset-based fees that vary according to the number of transactions and positions, plus out-of-pocket expenses. The amounts paid directly to JPMCB by the Funds for custody and accounting services are included in Custodian and accounting fees on the Statements of Operations.
Interest income earned on cash balances at the custodian, if any, is included in Interest income from affiliates on the Statements of Operations.
Interest expense paid to the custodian related to cash overdrafts, if any, is included in Interest expense to affiliates on the Statements of Operations.
| J.P. Morgan Large Cap Funds | |
F. Waivers and Reimbursements —The Adviser, Administrator and/or JPMDS have contractually agreed to waive fees and/or reimburse the Funds to the extent that total annual operating expenses (excluding acquired fund fees and expenses other than certain money market fund fees as described below, dividend and interest expenses related to short sales, interest, taxes, expenses related to litigation and potential litigation, expenses related to trustee elections and extraordinary expenses) exceed the percentages of the Funds' respective average daily net assets as shown in the table below:
| | | | | | | | |
| | | | | | | | |
Equity Premium Income Fund | | | | | | | | |
| | | | | | | | |
| | | | | | | | |
| | | | | | | | |
| | | | | | | | |
| | | | | | | | |
U.S. Applied Data Science Value Fund | | | | | | | | |
| | | | | | | | |
| | | | | | | | |
U.S. Large Cap Core Plus Fund | | | | | | | | |
U.S. Research Enhanced Equity Fund | | | | | | | | |
U.S. Sustainable Leaders Fund | | | | | | | | |
| | | | | | | | |
The expense limitation agreements were in effect for the six months ended December 31, 2023 and the contractual expense limitation percentages in the table above are in place until at least October 31, 2024.
For the six months ended December 31, 2023, the Funds' service providers waived fees and/or reimbursed expenses for each of the Funds as follows. None of these parties expect the Funds to repay any such waived fees and/or reimbursed expenses in future years.
| | |
| | | | | Contractual
Reimbursements |
| | | | | |
| | | | | |
Equity Premium Income Fund | | | | | |
| | | | | |
| | | | | |
| | | | | |
| | | | | |
| | | | | |
U.S. Applied Data Science Value Fund | | | | | |
| | | | | |
| | | | | |
U.S. Large Cap Core Plus Fund | | | | | |
U.S. Research Enhanced Equity Fund | | | | | |
U.S. Sustainable Leaders Fund | | | | | |
| | | | | |
|
| Amount rounds to less than one thousand. |
| J.P. Morgan Large Cap Funds | |
NOTES TO FINANCIAL STATEMENTSAS OF December 31, 2023 (Unaudited) (continued)
(Dollar values in thousands)
Additionally, the Funds may invest in one or more money market funds advised by the Adviser (affiliated money market funds). The Adviser, Administrator and/or JPMDS, as shareholder servicing agent, have contractually agreed to waive fees and/or reimburse expenses in an amount sufficient to offset the respective net fees each collects from the affiliated money market fund on the applicable Fund’s investment in such affiliated money market fund, except for investments of securities lending cash collateral. None of these parties expect the Funds to repay any such waived fees and/ or reimbursed expenses in future years.
The amounts of these waivers resulting from investments in these money market funds for the six months ended December 31, 2023 were as follows:
| |
| |
| |
Equity Premium Income Fund | |
| |
| |
| |
| |
| |
U.S. Applied Data Science Value Fund | |
| |
| |
U.S. Large Cap Core Plus Fund | |
U.S. Research Enhanced Equity Fund | |
U.S. Sustainable Leaders Fund | |
| |
JPMIM voluntarily agreed to reimburse the Funds for the Trustee Fees paid to one of the interested Trustees. For the six months ended December 31, 2023 the amount of these reimbursements were as follows:
| |
| |
| |
Equity Premium Income Fund | |
| |
| |
| |
| |
| |
U.S. Applied Data Science Value Fund | |
| |
| |
U.S. Large Cap Core Plus Fund | |
U.S. Research Enhanced Equity Fund | |
U.S. Sustainable Leaders Fund | |
| |
G. Other— Certain officers of the Trusts are affiliated with the Adviser, the Administrator and JPMDS. Such officers, with the exception of the Chief Compliance Officer, receive no compensation from the Funds for serving in their respective roles.
The Boards designated and appointed a Chief Compliance Officer to the Funds pursuant to Rule 38a-1 under the 1940 Act. Each Fund, along with affiliated funds, makes reimbursement payments, on a pro-rata basis, to the Administrator for a portion of the fees associated with the office of the Chief Compliance Officer. Such fees are included in Trustees’ and Chief Compliance Officer’s fees on the Statements of Operations.
The Trusts adopted a Trustee Deferred Compensation Plan (the “Plan”) which allows the independent Trustees to defer the receipt of all or a portion of compensation related to performance of their duties as Trustees. The deferred fees are invested in various J.P. Morgan Funds until distribution in accordance with the Plan.
During the six months ended December 31, 2023, Large Cap Value Fund purchased securities from an underwriting syndicate in which the principal underwriter or members of the syndicate were affiliated with the Adviser.
| J.P. Morgan Large Cap Funds | |
The below Funds used related party broker-dealers during the six months ended December 31, 2023, and incurred brokerage commissions with broker-dealers affiliated with the Adviser as follows:
| |
| |
Equity Premium Income Fund | |
| |
| |
| |
| |
U.S. Applied Data Science Value Fund | |
| |
U.S. Sustainable Leaders Fund | |
| |
|
| Amount rounds to less than one thousand. |
4. Investment Transactions
During the six months ended December 31, 2023, purchases and sales of investments (excluding short-term investments) were as follows:
| Purchases
(excluding
U.S. Government) | Sales
(excluding
U.S. Government) | | Covers on
Securities
Sold Short |
| | | | |
| | | | |
Equity Premium Income Fund | | | | |
| | | | |
| | | | |
| | | | |
| | | | |
| | | | |
U.S. Applied Data Science Value Fund | | | | |
| | | | |
| | | | |
U.S. Large Cap Core Plus Fund | | | | |
U.S. Research Enhanced Equity Fund | | | | |
U.S. Sustainable Leaders Fund | | | | |
| | | | |
| J.P. Morgan Large Cap Funds | |
NOTES TO FINANCIAL STATEMENTSAS OF December 31, 2023 (Unaudited) (continued)
(Dollar values in thousands)
5. Federal Income Tax Matters
For Federal income tax purposes, the estimated cost and unrealized appreciation (depreciation) in value of investments held at December 31, 2023 were as follows:
| | Gross
Unrealized
Appreciation | Gross
Unrealized
Depreciation | Net Unrealized
Appreciation
(Depreciation) |
| | | | |
| | | | |
Equity Premium Income Fund | | | | |
| | | | |
| | | | |
| | | | |
| | | | |
| | | | |
U.S. Applied Data Science Value Fund | | | | |
| | | | |
| | | | |
U.S. Large Cap Core Plus Fund * | | | | |
U.S. Research Enhanced Equity Fund | | | | |
U.S. Sustainable Leaders Fund | | | | |
| | | | |
|
| The tax cost includes the proceeds from short sales which may result in a net negative cost. |
At June 30, 2023, the following Funds had net capital loss carryforwards which are available to offset future realized gains:
| Capital Loss Carryforward Character |
| | |
| | |
Equity Premium Income Fund | | |
| | |
| | |
| | |
| | |
| | |
U.S. Sustainable Leaders Fund | | |
| | |
| J.P. Morgan Large Cap Funds | |
Net capital losses (gains) and specified ordinary losses incurred after October 31 and late year ordinary losses incurred after December 31 and within the taxable year are deemed to arise on the first business day of the Funds' next taxable year. For the year ended June 30, 2023, the following Funds deferred to July 1, 2023 the following net capital losses (gains), specified ordinary losses and late year ordinary losses of:
| Net Capital Losses (Gains) |
| | |
| | |
| | |
Equity Premium Income Fund | | |
| | |
| | |
| | |
| | |
| | |
U.S. Large Cap Core Plus Fund | | |
U.S. Research Enhanced Equity Fund | | |
U.S. Sustainable Leaders Fund | | |
| | |
6. Borrowings
The Funds rely upon an exemptive order granted by the SEC (the “Order”) permitting the establishment and operation of an Interfund Lending Facility (the “Facility”). The Facility allows the Funds to directly lend and borrow money to or from any other fund relying upon the Order at rates beneficial to both the borrowing and lending funds. Advances under the Facility are taken primarily for temporary or emergency purposes, including the meeting of redemption requests that otherwise might require the untimely disposition of securities, and are subject to each Fund's borrowing restrictions. The interfund loan rate is determined, as specified in the Order, by averaging the current repurchase agreement rate and the current bank loan rate. The Order was granted to JPM II and may be relied upon by the Funds because the Funds and the series of JPM II are all investment companies in the same “group of investment companies” (as defined in Section 12(d)(1)(G) of the 1940 Act).
The Funds had no borrowings outstanding from another fund as of December 31, 2023. Average borrowings from the Facility for the six months ended December 31, 2023, were as follows:
The Trusts and JPMCB have entered into a financing arrangement. Under this arrangement, JPMCB provides an unsecured, uncommitted credit facility in the aggregate amount of $100 million to certain of the J.P. Morgan Funds, including the Funds. Advances under the arrangement are taken primarily for temporary or emergency purposes, including the meeting of redemption requests that otherwise might require the untimely disposition of securities, and are subject to each Fund's borrowing restrictions. Interest on borrowings is payable at a rate determined by JPMCB at the time of borrowing. This agreement has been extended until October 29, 2024.
The Funds had no borrowings outstanding from the unsecured, uncommitted credit facility during the six months ended December 31, 2023.
The Trusts, along with certain other trusts for J.P. Morgan Funds (“Borrowers”), have entered into a joint syndicated senior unsecured revolving credit facility totaling $1.5 billion (“Credit Facility”) with various lenders and The Bank of New York Mellon, as administrative agent for the lenders. This Credit Facility provides a source of funds to the Borrowers for temporary and emergency purposes, including the meeting of redemption requests that otherwise might require the untimely disposition of securities. Under the terms of the Credit Facility, a borrowing fund must have a minimum of $25 million in adjusted net asset value and not exceed certain adjusted net asset coverage ratios prior to and during the time in which any borrowings are outstanding. If a fund does not comply with the aforementioned requirements, the fund must remediate within three business days with respect to the $25 million minimum adjusted net asset value or within one business day with respect to certain asset coverage ratios or the administrative agent at the request of, or with the consent of, the lenders may terminate the Credit Facility and declare any outstanding borrowings to be due and payable immediately.
Interest associated with any borrowing under the Credit Facility is charged to the borrowing fund at a rate of interest equal to 1.00% (the "Applicable Margin"), plus the greater on the day of the borrowing, of the federal funds effective rate, or the Adjusted Secured Overnight Financing Rate ("SOFR"). Effective August 8, 2023, the Credit Facility was amended and restated for a term of 364 days, unless extended.
| J.P. Morgan Large Cap Funds | |
NOTES TO FINANCIAL STATEMENTSAS OF December 31, 2023 (Unaudited) (continued)
(Dollar values in thousands)
The Funds did not utilize the Credit Facility during the six months ended December 31, 2023.
7. Risks, Concentrations and Indemnifications
In the normal course of business, the Funds enter into contracts that contain a variety of representations which provide general indemnifications. Each Fund's maximum exposure under these arrangements is unknown. The amount of exposure would depend on future claims that may be brought against each Fund. However, based on experience, the Funds expect the risk of loss to be remote.
As of December 31, 2023, the Funds had individual shareholder and/or omnibus accounts each owning more than 10% of the respective Fund's outstanding shares as follows:
| Number of
Individual Shareholder
and/or Affiliated
Omnibus Accounts | | Number of
Individual Shareholder
and/or Non-Affiliated
Omnibus Accounts | |
| | | | |
| | | | |
Equity Premium Income Fund | | | | |
| | | | |
| | | | |
| | | | |
| | | | |
| | | | |
U.S. Applied Data Science Value Fund | | | | |
| | | | |
| | | | |
U.S. Large Cap Core Plus Fund | | | | |
U.S. Research Enhanced Equity Fund | | | | |
U.S. Sustainable Leaders Fund | | | | |
| | | | |
As of December 31, 2023, J.P. Morgan Investor Funds, JPMorgan SmartRetirement Funds and JPMorgan SmartRetirement Blend Funds, which are affiliated fund of funds, each owned in the aggregate, shares representing more than 10% of the net assets of the Funds as follows:
| | JPMorgan
SmartRetirement
Funds | JPMorgan
SmartRetirement
Blend Funds |
| | | |
| | | |
| | | |
| | | |
U.S. Research Enhanced Equity Fund | | | |
Equity Premium Income Fund’s investments in ELNs entail varying degrees of risks. The Fund is subject to loss of their full principal amount. In addition, the ELNs are subject to a stated maximum return which may limit the payment at maturity. The Fund may also be exposed to additional risks associated with structured notes including: counterparty credit risk related to the issuer’s ability to make payment at maturity; liquidity risk related to a lack of liquid market for these notes, preventing the Fund from trading or selling the notes easily; and a greater degree of market risk than other types of debt securities because the investor bears the risk associated with the underlying financial instruments.
London Interbank Offered Rate ("LIBOR") was a leading floating rate benchmark used in loans, notes, derivatives and other instruments or investments. As a result of benchmark reforms, publication of most LIBOR settings has ceased. Some LIBOR settings continue to be published but only on a temporary, synthetic and non-representative basis. Regulated entities have generally ceased entering into new LIBOR contracts in connection with regulatory guidance or prohibitions. Public and private sector actors have worked to establish alternative reference rates to be used in place of LIBOR. There is no assurance that any such alternative reference rate will be similar to or produce the same value or economic equivalence as LIBOR or that it will have the same volume or liquidity as did LIBOR which may affect the value, volatility, liquidity or return on certain of the Funds' loans, notes, derivatives and other instruments or investments comprising some or all of the Funds' investments and result in costs incurred in connection with changing reference rates used for positions, closing out positions and entering into new trades. Certain of the Funds' investments may have transitioned from LIBOR or will transition from LIBOR in the future. The transition from LIBOR to alternative reference rates may result in operational
| J.P. Morgan Large Cap Funds | |
issues for the Funds or their investments. No assurances can be given as to the impact of the LIBOR transition (and the timing of any such impact) on the Funds and their investments.
The Funds are subject to infectious disease epidemics/pandemics risk. For example, the outbreak of COVID-19 negatively affected economies, markets and individual companies throughout the world, including those in which the Funds invest. The effects of any future pandemic or other global event to business and market conditions may have a significant negative impact on the performance of a Fund's investments, increase a Fund's volatility, exacerbate other pre-existing political, social and economic risks to the Funds and negatively impact broad segments of businesses and populations. In addition, governments, their regulatory agencies, or self-regulatory organizations have taken or may take actions in response to a pandemic or other global event that affect the instruments in which the Funds invest, or the issuers of such instruments, in ways that could have a significant negative impact on a Fund’s investment performance. The ultimate impact of any pandemic or other global event and the extent to which the associated conditions and governmental responses impact a Fund will also depend on future developments, which are highly uncertain, difficult to accurately predict and subject to frequent changes.
| J.P. Morgan Large Cap Funds | |
SCHEDULE OF SHAREHOLDER EXPENSES(Unaudited)
Hypothetical $1,000 Investment
As a shareholder of the Funds, you incur two types of costs: (1) transaction costs, including sales charges (loads) on purchase payments and (2) ongoing costs, including investment advisory fees, administration fees, distribution fees and other Fund expenses. The examples below are intended to help you understand your ongoing costs (in dollars) of investing in the Funds (not including expenses of the Underlying Funds) and to compare these ongoing costs with the ongoing costs of investing in other mutual funds. The examples assume that you had a $1,000 investment in each Class at the beginning of the reporting period, July 1, 2023, and continued to hold your shares at the end of the reporting period, December 31, 2023.
Actual Expenses
For each Class of each Fund in the table below, the first line provides information about actual account values and actual expenses. You may use the information in this line, together with the amount you invested, to estimate the expenses that you paid over the period. Simply divide your account value by $1,000 (for example, an $8,600 account value divided by $1,000 = 8.6), then multiply the result by the number in the first line of each Class under the heading titled “Expenses Paid During the Period” to estimate the expenses you paid on your account during this period.
Hypothetical Example for Comparison Purposes
The second line of each Class in the table below provides information about hypothetical account values and hypothetical expenses based on the Class’ actual expense ratio and an assumed rate of return of 5% per year before expenses, which is not the Class’ actual return. The hypothetical account values and expenses may not be used to estimate the actual ending account balance or expenses you paid for the period. You may use this information to compare the ongoing costs of investing in the Class of the Funds and other funds. To do so, compare this 5% hypothetical example with the 5% hypothetical examples that appear in the shareholder reports of the other funds. Please note that the expenses shown in the table are meant to highlight your ongoing costs only and do not reflect any transaction costs, such as sales charges (loads) or redemption fees, and expenses of the Underlying Funds. Therefore, the second line for each Class in the table is useful in comparing ongoing costs only, and will not help you determine the relative total costs of owning different funds. In addition, if these transaction costs were included, your costs would have been higher. The examples also assume all dividends and distributions have been reinvested.
| Beginning
Account Value
July 1, 2023 | Ending
Account Value
December 31, 2023 | Expenses
Paid During
the Period* | |
JPMorgan Equity Income Fund | | | | |
| | | | |
| | | | |
| | | | |
| | | | |
| | | | |
| | | | |
| | | | |
| | | | |
| | | | |
| | | | |
| | | | |
| | | | |
| | | | |
| | | | |
| | | | |
| | | | |
| | | | |
| | | | |
| | | | |
| | | | |
| | | | |
| | | | |
| | | | |
| | | | |
| J.P. Morgan Large Cap Funds | |
| Beginning Account Value July 1, 2023 | Ending Account Value December 31, 2023 | Expenses Paid During the Period* | |
JPMorgan Equity Index Fund | | | | |
| | | | |
| | | | |
| | | | |
| | | | |
| | | | |
| | | | |
| | | | |
| | | | |
| | | | |
| | | | |
| | | | |
| | | | |
JPMorgan Equity Premium Income Fund | | | | |
| | | | |
| | | | |
| | | | |
| | | | |
| | | | |
| | | | |
| | | | |
| | | | |
| | | | |
| | | | |
| | | | |
| | | | |
| | | | |
| | | | |
| | | | |
JPMorgan Hedged Equity Fund | | | | |
| | | | |
| | | | |
| | | | |
| | | | |
| | | | |
| | | | |
| | | | |
| | | | |
| | | | |
| | | | |
| | | | |
| | | | |
| | | | |
| | | | |
| | | | |
JPMorgan Hedged Equity 2 Fund | | | | |
| | | | |
| | | | |
| | | | |
| | | | |
| | | | |
| | | | |
| J.P. Morgan Large Cap Funds | |
SCHEDULE OF SHAREHOLDER EXPENSES(Unaudited) (continued)
Hypothetical $1,000 Investment
| Beginning Account Value July 1, 2023 | Ending Account Value December 31, 2023 | Expenses Paid During the Period* | |
JPMorgan Hedged Equity 2 Fund (continued) | | | | |
| | | | |
| | | | |
| | | | |
| | | | |
| | | | |
| | | | |
| | | | |
| | | | |
| | | | |
JPMorgan Hedged Equity 3 Fund | | | | |
| | | | |
| | | | |
| | | | |
| | | | |
| | | | |
| | | | |
| | | | |
| | | | |
| | | | |
| | | | |
| | | | |
| | | | |
| | | | |
| | | | |
| | | | |
JPMorgan Large Cap Growth Fund | | | | |
| | | | |
| | | | |
| | | | |
| | | | |
| | | | |
| | | | |
| | | | |
| | | | |
| | | | |
| | | | |
| | | | |
| | | | |
| | | | |
| | | | |
| | | | |
| | | | |
| | | | |
| | | | |
| | | | |
| | | | |
| | | | |
| | | | |
| | | | |
| | | | |
| J.P. Morgan Large Cap Funds | |
| Beginning Account Value July 1, 2023 | Ending Account Value December 31, 2023 | Expenses Paid During the Period* | |
JPMorgan Large Cap Value Fund | | | | |
| | | | |
| | | | |
| | | | |
| | | | |
| | | | |
| | | | |
| | | | |
| | | | |
| | | | |
| | | | |
| | | | |
| | | | |
| | | | |
| | | | |
| | | | |
| | | | |
| | | | |
| | | | |
| | | | |
| | | | |
| | | | |
| | | | |
| | | | |
| | | | |
JPMorgan U.S. Applied Data Science Value Fund | | | | |
| | | | |
| | | | |
| | | | |
| | | | |
| | | | |
| | | | |
| | | | |
| | | | |
| | | | |
| | | | |
| | | | |
| | | | |
| | | | |
| | | | |
| | | | |
| | | | |
| | | | |
| | | | |
JPMorgan U.S. Equity Fund | | | | |
| | | | |
| | | | |
| | | | |
| | | | |
| | | | |
| | | | |
| J.P. Morgan Large Cap Funds | |
SCHEDULE OF SHAREHOLDER EXPENSES(Unaudited) (continued)
Hypothetical $1,000 Investment
| Beginning Account Value July 1, 2023 | Ending Account Value December 31, 2023 | Expenses Paid During the Period* | |
JPMorgan U.S. Equity Fund (continued) | | | | |
| | | | |
| | | | |
| | | | |
| | | | |
| | | | |
| | | | |
| | | | |
| | | | |
| | | | |
| | | | |
| | | | |
| | | | |
| | | | |
| | | | |
| | | | |
| | | | |
| | | | |
| | | | |
| | | | |
| | | | |
| | | | |
JPMorgan U.S. GARP Equity Fund | | | | |
| | | | |
| | | | |
| | | | |
| | | | |
| | | | |
| | | | |
| | | | |
| | | | |
| | | | |
| | | | |
| | | | |
| | | | |
| | | | |
| | | | |
| | | | |
| | | | |
| | | | |
| | | | |
JPMorgan U.S. Large Cap Core Plus Fund | | | | |
| | | | |
| | | | |
| | | | |
| | | | |
| | | | |
| | | | |
| | | | |
| | | | |
| | | | |
| J.P. Morgan Large Cap Funds | |
| Beginning Account Value July 1, 2023 | Ending Account Value December 31, 2023 | Expenses Paid During the Period* | |
JPMorgan U.S. Large Cap Core Plus Fund (continued) | | | | |
| | | | |
| | | | |
| | | | |
| | | | |
| | | | |
| | | | |
| | | | |
| | | | |
| | | | |
JPMorgan U.S. Research Enhanced Equity Fund | | | | |
| | | | |
| | | | |
| | | | |
| | | | |
| | | | |
| | | | |
| | | | |
| | | | |
| | | | |
JPMorgan U.S. Sustainable Leaders Fund | | | | |
| | | | |
| | | | |
| | | | |
| | | | |
| | | | |
| | | | |
| | | | |
| | | | |
| | | | |
| | | | |
| | | | |
| | | | |
| | | | |
| | | | |
| | | | |
| | | | |
| | | | |
| | | | |
| | | | |
| | | | |
| | | | |
| | | | |
| | | | |
| | | | |
| | | | |
| | | | |
| | | | |
| | | | |
| | | | |
| | | | |
| | | | |
| J.P. Morgan Large Cap Funds | |
SCHEDULE OF SHAREHOLDER EXPENSES(Unaudited) (continued)
Hypothetical $1,000 Investment
| Beginning Account Value July 1, 2023 | Ending Account Value December 31, 2023 | Expenses Paid During the Period* | |
JPMorgan U.S. Value Fund (continued) | | | | |
| | | | |
| | | | |
| | | | |
| | | | |
| | | | |
| | | | |
|
| Expenses are equal to each Class’ respective annualized net expense ratio, multiplied by the average account value over the period, multiplied by 184/366 (to reflect the one-half year period). |
| J.P. Morgan Large Cap Funds | |
BOARD APPROVAL OF INVESTMENT ADVISORY AGREEMENTS(Unaudited)
The Board of Trustees (the “Board” or the “Trustees”) has established various standing committees composed of Trustees with diverse backgrounds, to which the Board has assigned specific subject matter responsibilities to further enhance the effectiveness of the Board’s oversight and decision making. The Board and its investment committees (Money Market and Alternative Products Committee, Equity Committee, and Fixed Income Committee) met regularly throughout the year and, at each meeting, considered factors that are relevant to their annual consideration of the continuation of the investment advisory agreements. The Board also met for the specific purpose of considering investment advisory agreement annual renewals. The Board held meetings June 20-21, 2023 and August 8-10, 2023, at which the Trustees considered the continuation of the investment advisory agreements for each Fund whose semi-annual report is contained herein (each an “Advisory Agreement” and collectively, the “Advisory Agreements”). At the June meeting, the Board’s investment committees met to review and consider performance, expense and related information for the J.P. Morgan Funds. Each investment committee reported to the full Board, which then considered each investment committee’s preliminary findings. At the August meeting, the Trustees continued their review and consideration. The Trustees, including a majority of the Trustees who are not parties to an Advisory Agreement or “interested persons” (as defined in the Investment Company Act of 1940) of any party to an Advisory Agreement or any of their affiliates, approved the continuation of each Advisory Agreement on August 10, 2023.
As part of their review of the Advisory Agreements, the Trustees considered and reviewed performance and other information about the Funds received from J.P. Morgan Investment Management Inc. (the “Adviser”). This information included the Funds’ performance as compared to the performance of their peers and benchmarks, and analyses by the Adviser of the Funds’ performance. In addition, at each of their regular meetings throughout the year, the Trustees considered reports on the performance of certain J.P. Morgan Funds provided by an independent investment consulting firm (the “independent consultant”). In addition, in preparation for the June and August meetings, the Trustees requested, received and evaluated extensive materials from the Adviser, including performance and expense information compiled by Broadridge, using data from Lipper Inc. and/or Morningstar Inc., independent providers of investment company data (together, “Broadridge”). The Trustees’ independent consultant also provided additional quantitative and statistical analyses of certain Funds, including risk and performance return assessments as compared to the Funds’ objectives, benchmarks, and peers. Before voting on the Advisory Agreements, the Trustees reviewed the Advisory Agreements with representatives of the Adviser, counsel to the Funds, and independent legal counsel to the Trustees, and received a memorandum from independent
legal counsel to the Trustees discussing the legal standards for their consideration of the Advisory Agreements. The Trustees also discussed the Advisory Agreements in executive sessions with independent legal counsel at which no representatives of the Adviser were present.
A summary of the material factors evaluated by the Trustees in determining whether to approve each Advisory Agreement is provided below. Each Trustee attributed different weights to the various factors, and no factor alone was considered determinative. The Trustees considered information provided with respect to the Funds throughout the year, as well as materials furnished specifically in connection with the annual review process. From year to year, the Trustees consider and place emphasis on relevant information in light of changing circumstances in market and economic conditions.
After considering and weighing the factors and information they had received, the Trustees found that the compensation to be received by the Adviser from each Fund under the applicable Advisory Agreement was fair and reasonable under the circumstances, and determined that the continuance of each Advisory Agreement was in the best interests of each Fund and its shareholders.
Nature, Extent and Quality of Services Provided by the Adviser
The Trustees received and considered information regarding the nature, extent and quality of services provided to each Fund under the applicable Advisory Agreement. The Trustees took into account information furnished throughout the year at Trustee meetings, as well as the materials furnished specifically in connection with this annual review process. Among other things, the Trustees considered:
• The background and experience of the Adviser’s senior management and investment personnel, including personnel changes, if any;
• The qualifications, backgrounds and responsibilities of the portfolio management team primarily responsible for the day-to-day management of each Fund, including personnel changes, if any;
• The investment strategy for each Fund, and the infrastructure supporting the portfolio management teams;
• Information about the structure and distribution strategy for each Fund and how it fits within the Adviser’s other fund offerings within the J.P. Morgan Funds complex;
• The administration services provided by the Adviser in its role as Administrator;
| J.P. Morgan Large Cap Funds | |
BOARD APPROVAL OF INVESTMENT ADVISORY AGREEMENTS(Unaudited) (continued)
• Their knowledge of the nature and quality of the services provided by the Adviser and its affiliates gained from their experience as Trustees of the Funds and in the financial industry generally;
• The overall reputation and capabilities of the Adviser and its affiliates;
• The commitment of the Adviser to provide high quality service to the Funds;
• Their overall confidence in the Adviser’s integrity; and
• The Adviser’s responsiveness to requests for additional information, questions or concerns raised by them, including the Adviser’s willingness to consider and implement organizational and operational changes designed to improve investment results and the services provided to each Fund.
Based upon these considerations and other factors, the Trustees concluded that they were satisfied with the nature, extent and quality of the services provided to the Funds by the Adviser.
Costs of Services Provided and Profitability to the Adviser and its Affiliates
The Trustees received and considered information regarding the profitability to the Adviser and its affiliates from providing services to each Fund. The Trustees reviewed and discussed this information. The Trustees recognized that this information is not audited and represents the Adviser’s determination of its and its affiliates’ revenues from the contractual services provided to the Funds, less expenses of providing such services. Expenses include direct and indirect costs and are calculated using an allocation methodology developed by the Adviser and reviewed with the Board. The Trustees also recognized that it is difficult to make comparisons of profitability from fund investment advisory contracts because comparative information is not generally publicly available and is affected by numerous factors, including the structure of the particular adviser, the types of funds it manages, its business mix, numerous assumptions regarding allocations and the fact that publicly-traded fund managers’ operating profits and net income are net of distribution and marketing expenses. Based upon their review, and taking into consideration the factors noted above, the Trustees concluded that the profitability to the Adviser under each Advisory Agreement was not unreasonable in light of the services and benefits provided to each Fund.
The Trustees also considered that JPMorgan Distribution Services, Inc. (“JPMDS”), an affiliate of the Adviser, and the Adviser earn fees from the Funds for providing shareholder and administration services, respectively. These fees were shown separately in the profitability analysis presented to the Trustees. The Trustees also considered the payments of Rule 12b-1 fees to JPMDS, which also acts as the Funds’
distributor, and that these fees are in turn generally paid to financial intermediaries that sell the Funds, including financial intermediaries that are affiliates of the Adviser (although they are retained by JPMDS in certain instances). The Trustees also considered the fees earned by JPMorgan Chase Bank, N.A. (“JPMCB”), an affiliate of the Adviser, for custody, fund accounting and other related services for each Fund, and the profitability of the arrangements to JPMCB.
Fall-Out Benefits
The Trustees reviewed information regarding potential “fall-out” or ancillary benefits received by the Adviser and its affiliates as a result of their relationship with the Funds. The Trustees considered that the J.P. Morgan Funds' operating accounts are held at JPMCB, which, as a result, will receive float benefits for certain J.P. Morgan Funds, as applicable. The Trustees also noted that the Adviser supports a diverse set of products and services, which benefits the Adviser by allowing it to leverage its infrastructure to serve additional clients, including benefits that may be received by the Adviser and its affiliates in connection with the Funds’ potential investments in other funds advised by the Adviser. The Trustees also reviewed the Adviser’s allocation of fund brokerage for the J.P. Morgan Funds complex, including allocations to brokers who provide research to the Adviser, as well as the Adviser’s use of affiliates to provide other services and the benefits to such affiliates of doing so. The Trustees also considered the benefit to the Adviser and its affiliates from allocating client assets to the Funds.
Economies of Scale
The Trustees considered the extent to which the Funds may benefit from potential economies of scale. The Trustees considered that there may not be a direct relationship between economies of scale realized by the Funds and those realized by the Adviser as assets increase. The Trustees considered the extent to which the Funds were priced to scale and whether it would be appropriate to add advisory fee breakpoints. The Trustees noted certain Funds with contractual expense limitations and fee waivers (“Fee Caps”) which allow a Fund’s shareholders to share potential economies of scale from a Fund’s inception, prior to reaching scale. The Trustees also noted that certain other Funds that had achieved scale as asset levels had increased no longer had Fee Caps in place for some or all of their share classes, but shared economies of scale through lower average expenses. The Trustees noted that the fees remain fair and reasonable relative to peer funds. The Trustees considered the benefits to the Funds of the use of an affiliated distributor and custodian, including the ability to rely on existing infrastructure supporting distribution, custodial and transfer agent services and the ability to negotiate competitive fees for the Funds. The Trustees further considered the Adviser's and JPMDS's ongoing investments in their business in support of the Funds, including the Adviser's and/or JPMDS's
| J.P. Morgan Large Cap Funds | |
investments in trading systems, technology (including improvements to the J.P. Morgan Funds’ website, and cybersecurity improvements), retention of key talent, and regulatory support enhancements. The Trustees concluded that the current fee structure for each Fund, including any Fee Caps the Adviser has in place that serve to limit the overall net expense ratios of each Fund at competitive levels, was reasonable. The Trustees concluded that, for Funds with Fee Caps in place for some or all of their share classes, the relevant Fund’s shareholders received the benefits of potential economies of scale through the Fee Caps and, for Funds that achieved scale and no longer had Fee Caps in place for some or all of their share classes, the relevant Fund’s shareholders benefited from lower average expenses resulting from increased assets. The Trustees also concluded that all Funds benefited from the Adviser’s reinvestment in its operations to serve the Funds and their shareholders. The Trustees noted that the Adviser’s reinvestment ensures sufficient resources in terms of personnel and infrastructure to support the Funds.
Independent Written Evaluation of the Funds’ Senior Officer
The Trustees noted that, upon their direction, the Senior Officer for the Equity Income Fund, Equity Index Fund, Large Cap Growth Fund, Large Cap Value Fund and U.S. Equity Fund had prepared an independent written evaluation in order to assist the Trustees in determining the reasonableness of the proposed management fees. In determining whether to continue the Advisory Agreements, the Trustees considered the Senior Officer’s report.
Fees Relative to Adviser’s Other Clients
The Trustees received and considered information about the nature and extent of investment advisory services and fee rates offered to other clients of the Adviser, including, to the extent applicable, institutional separate accounts, collective investment trusts, other registered investment companies and/or private funds sub-advised by the Adviser, for investment management styles substantially similar to that of each Fund. The Trustees considered the complexity of investment management for registered investment companies relative to the Adviser’s other clients and noted differences, as applicable, in the fee structure and the regulatory, legal and other risks and responsibilities of providing services to the different clients. The Trustees considered that serving as an adviser to a registered investment company involves greater responsibilities and risks than acting as a sub-adviser and observed that sub-advisory fees may be lower than those charged by the Adviser to each Fund. The Trustees also noted that the adviser, not the applicable registered investment company, typically bears the sub-advisory fee and that many responsibilities related to the advisory function are typically retained by the primary adviser. The Trustees concluded that the fee rates charged to each Fund in comparison to those charged to the Adviser’s other clients were reasonable.
Investment Performance
The Trustees receive and consider information about each Fund’s performance throughout the year. In addition, the Trustees received and considered absolute and/or relative performance information for the Funds in a report prepared by Broadridge. The Trustees considered the total return performance information, which included the ranking of the Funds within a performance universe comprised of funds’ selected share classes with the same Broadridge investment classification and objective (the “Universe”), by total return for the applicable one-, three- and five-year periods. The Trustees reviewed a description of Broadridge’s methodology for selecting mutual funds in each Fund’s Universe, and noted that Universe quintile rankings were not calculated if the number of funds in the Universe did not meet a predetermined minimum. The Broadridge materials provided to the Trustees highlighted information with respect to certain representative classes to assist the Trustees in their review. As part of this review, the Trustees also reviewed each Fund’s performance against its benchmark and considered the performance information provided for the Funds at regular Board meetings by the Adviser and the Trustees’ independent consultant and also considered the special analysis prepared for certain Funds by the Trustees’ independent consultant. The Trustees also engaged with the Adviser to consider what steps might be taken to improve performance, as applicable. The Broadridge performance data noted by the Trustees as part of their review and the determinations made by the Trustees with respect to each Fund’s performance for certain representative classes are summarized below:
The Trustees noted that the Equity Income Fund’s performance for Class A, Class I and Class R6 shares was in the first, second and first quintiles of the Universe for the one-, three- and five-year periods ended December 31, 2022, respectively. The Trustees discussed the performance and investment strategy of the Fund with the Adviser and reviewed the performance analysis and evaluation prepared by the independent consultant. Based upon these discussions and various other factors, the Trustees concluded that the Fund’s performance was satisfactory.
The Trustees noted that the Equity Index Fund’s performance for Class A shares was in the third, second and second quintiles of the Universe, for the one-, three- and five-year periods ended December 31, 2022, respectively. The Trustees noted that the performance for Class I shares was in the third, third and second quintiles of the Universe for the one-, three- and five-year periods ended December 31, 2022, respectively. The Trustees noted that the performance for Class R6 shares was in the third, second and second quintiles of the Universe for the one-, three- and five-year periods ended December 31, 2022, respectively. The Trustees discussed the performance and investment strategy of the Fund with the Adviser and reviewed
| J.P. Morgan Large Cap Funds | |
BOARD APPROVAL OF INVESTMENT ADVISORY AGREEMENTS(Unaudited) (continued)
the performance analysis and evaluation prepared by the independent consultant. Based upon these discussions and various other factors, the Trustees concluded that the Fund’s performance was satisfactory.
The Trustees noted that the Equity Premium Income Fund’s performance for Class A shares was in the second and first quintiles of the Universe for the one- and three-year periods ended December 31, 2022, respectively. The Trustees noted that the performance for Class I shares was in the second and first quintiles of the Universe for the one- and three-year periods ended December 31, 2022, respectively. The Trustees noted that the performance for Class R6 shares was in the second and first quintiles of the Universe for the one- and three-year periods ended December 31, 2022, respectively. The Trustees discussed the performance and investment strategy of the Fund with the Advisor and reviewed the performance analysis and evaluation prepared by the independent consultant. Based upon these discussions and various other factors, the Trustees concluded that the Fund’s performance was satisfactory.
The Trustees noted that the Hedged Equity Fund’s performance for Class A shares was in the second, first and first quintiles of the Universe for the one-, three- and five-year periods ended December 31, 2022, respectively. The Trustees noted that the performance for Class I and Class R6 shares was in the third, first and first quintiles of the Universe for the one-, three- and five-year periods ended December 31, 2022, respectively. The Trustees discussed the performance and investment strategy of the Fund with the Adviser and reviewed the performance analysis and evaluation prepared by the independent consultant. Based upon these discussions and various other factors, the Trustees concluded that the Fund’s performance was satisfactory.
The Trustees noted that the Hedged Equity 2 Fund’s performance for Class A shares was in the fourth quintile of the Universe for the one-year period ended December 31, 2022. The Trustees noted that the performance for Class I and Class R6 shares were in fifth quintile of the Universe for one-year period ended December 31,2022. The Trustees discussed the performance and investment strategy of the Fund with the Advisor and reviewed the performance analysis and evaluation prepared by the independent consultant. Based upon these discussions and various other factors, the Trustees concluded that the Fund’s performance was satisfactory under the circumstances.
The Trustees noted that the Hedged Equity 3 Fund’s performance for Class A, Class I and Class R6 shares was in the fifth quintile of the Universe for the one-year ended December 31, 2022. The Trustees discussed the performance and investment strategy of the Fund with the Advisor and reviewed the performance analysis and evaluation prepared by the indepen
dent consultant. Based upon these discussions and various other factors, the Trustees concluded that the Fund’s performance was satisfactory under the circumstances.
The Trustees noted that the Large Cap Growth Fund’s performance for Class A, Class I and Class R6 shares was in the second, first and first quintiles of the Universe for the one-, three- and five-year periods ended December 31, 2022, respectively. The Trustees discussed the performance and investment strategy of the Fund with the Adviser and reviewed the performance analysis and evaluation prepared by the independent consultant. Based upon these discussions and various other factors, the Trustees concluded that the Fund’s performance was satisfactory.
The Trustees noted that the Large Cap Value Fund’s performance for Class A, Class I and Class R6 was in the first, first and second of the Universe for the one-, three- and five-year periods ended December 31, 2022, respectively. The Trustees discussed the performance and investment strategy of the Fund with the Adviser and reviewed the performance analysis and evaluation prepared by the independent consultant. Based upon these discussions and various other factors, the Trustees concluded that the Fund’s performance was satisfactory.
The Trustees noted that the U.S. Applied Data Science Value Fund’s performance for Class A, Class I and Class R6 shares was in the third, second and third quintiles of the Universe for the one-, three- and five-year periods ended December 31, 2022, respectively. The Trustees discussed the performance and investment strategy of the Fund with the Adviser and reviewed the performance analysis and evaluation prepared by the independent consultant. Based upon these discussions and various other factors, the Trustees concluded that the Fund’s performance was satisfactory.
The Trustees noted that the U.S. Equity Fund’s performance for Class A, Class I and Class R6 shares was in the fourth, first and first quintiles of the Universe for the one-, three and five-year periods ended December 31, 2022, respectively. The Trustees discussed the performance and investment strategy of the Fund with the Adviser and reviewed the performance analysis and evaluation prepared by the independent consultant. Based upon these discussions and various other factors, the Trustees concluded that the Fund’s performance was satisfactory under the circumstances.
The Trustees noted that the U.S. GARP Equity Fund’s performance for Class A, Class I and Class R6 shares was in the second, second and third quintiles of the Universe for the one-, three- and five-year periods ended December 31, 2022, respectively. The Trustees discussed the performance and investment strategy of the Fund with the Adviser and reviewed the performance analysis and evaluation prepared by the
| J.P. Morgan Large Cap Funds | |
independent consultant. Based upon these discussions and various other factors, the Trustees concluded that the Fund’s performance was satisfactory.
The Trustees noted that the U.S. Large Cap Core Plus Fund’s performance for both Class A and Class R6 shares was in the third, first and first quintiles of the Universe for the one-, three- and five-year periods ended December 31, 2022, respectively. The Trustees noted that the performance for Class I shares was in the fourth, first and first quintiles of the Universe for the one-, three- and five-year periods ended December 31, 2022, respectively. The Trustees discussed the performance and investment strategy of the Fund with the Adviser and reviewed the performance analysis prepared by the independent consultant. Based upon these discussions, and various other factors, the Trustees concluded that the Fund’s performance was satisfactory under the circumstances.
The Trustees noted that the U.S. Research Enhanced Equity Fund’s performance for Class A, Class I and Class R6 shares was in the third, first and first quintiles of the Universe for the one-, three- and five-year periods ended December 31, 2022, respectively. The Trustees discussed the performance and investment strategy of the Fund with the Adviser and reviewed the performance analysis and evaluation prepared by the independent consultant. Based upon these discussions and various other factors, the Trustees concluded that the Fund’s performance was satisfactory.
The Trustees noted that the U.S. Sustainable Leaders Fund’s performance for Class A and Class I shares was in the fifth, third and third quintiles of the Universe for the one-, three- and five-year periods ended December 31, 2022, respectively. The Trustees noted that the performance for Class R6 shares was in the fifth quintile of the Universe for the one-year period ended December 31, 2022. The Trustees discussed the performance and investment strategy of the Fund with the Adviser, and reviewed the performance analysis and evaluation prepared by the independent consultant. Based upon these discussions and various other factors, the Trustees concluded that the Fund’s performance was satisfactory under the circumstances. The Trustees requested, however, that the Fund’s Adviser provide additional Fund performance information to be reviewed with the members of the Board’s Equity Committee at each of its regularly scheduled meetings over the course of the next year.
The Trustees noted that the U.S. Value Fund’s performance for Class A, Class I and Class R6 shares was in the first quintile of the Universe for each of the one-, three- and five-year periods ended December 31, 2022. The Trustees discussed the performance and investment strategy of the Fund with the Adviser and reviewed the performance analysis and evaluation prepared by the independent consultant. Based upon these discussions and various other factors, the Trustees concluded that the Fund’s performance was satisfactory.
Advisory Fees and Expense Ratios
The Trustees considered the contractual advisory fee rate and administration fee rate paid by each Fund to the Adviser and compared the combined rate to the information prepared by Broadridge concerning management fee rates paid by other funds’ selected share classes in the Universe, as well as a subset of funds within the Universe (the “Peer Group”). The Trustees recognized that Broadridge reported each Fund’s management fee rate as the combined contractual advisory fee and administration fee rates. The Trustees also reviewed information about other expenses and the expense ratios for each Fund and noted that Universe and Peer Group quintile rankings were not calculated if the number of funds in the Universe and/or Peer Groups did not meet a predetermined minimum. For each Fund that had a Fee Cap in place, the Trustees considered the net advisory fee rate and net expense ratio for each share class, as applicable, taking into account any waivers and/or reimbursements. The Trustees also considered any proposed changes to a Fee Cap, and, where deemed appropriate by the Trustees, additional waivers and/or reimbursements. The Trustees recognized that it can be difficult to make comparisons of advisory fees because there are variations in the services that are included in the fees paid by other funds. The Trustees’ determinations as a result of the review of each Fund’s advisory fees and expense ratios for certain representative classes are summarized below:
The Trustees noted that the Equity Income Fund’s net advisory fee for Class A shares was in the second and first quintiles of the Peer Group and Universe, respectively, and that the actual total expenses for Class A shares were in the fourth and second quintiles of the Peer Group and Universe, respectively. The Trustees noted that the net advisory fee for Class I shares was in the second quintile of both the Peer Group and Universe, and that the actual total expenses for Class I shares were in the first and second quintiles of the Peer Group and Universe, respectively. The Trustees noted that the net advisory fee for Class R6 shares was in the first and second quintiles of the Peer Group and Universe, respectively, and that the actual total expenses for Class R6 shares were in the first quintile of both the Peer Group and Universe. After considering the factors identified above, in light of this information, the Trustees concluded that the advisory fee was fair and reasonable in light of the services provided to the Fund.
The Trustees noted that the Equity Index Fund’s net advisory fee for Class A shares was in the first quintile of both the Peer Group and Universe, and that the actual total expenses for Class A shares were in the second quintile of both the Peer Group and Universe. The Trustees noted that the net advisory fee for Class I shares was in the first quintile of both the Peer Group and Universe, and that the actual total expenses for Class I shares were in the first and third quintiles of the Peer Group and Universe, respectively. The Trustees noted that the
| J.P. Morgan Large Cap Funds | |
BOARD APPROVAL OF INVESTMENT ADVISORY AGREEMENTS(Unaudited) (continued)
net advisory fee for Class R6 shares was in the second and first quintiles of the Peer Group and Universe, respectively. and that the actual total expenses for Class R6 shares were in the first quintile of both the Peer Group and Universe. After considering the factors identified above, in light of this information, the Trustees concluded that the advisory fee was fair and reasonable in light of the services provided to the Fund.
The Trustees noted that the Equity Premium Income Fund’s net advisory fee and actual total expenses for Class A shares were in the first quintile of both the Peer Group and Universe. The Trustees noted that the net advisory fee and actual total expenses for Class I and Class R6 shares were in the first quintile of the Universe. Broadridge did not calculate quintile rankings for the Peer Group for Class I and Class R6 shares due to the limited number of funds in the Peer Groups. After considering the factors identified above, in light of this information, the Trustees concluded that the advisory fee was fair and reasonable in light of the services provided to the Fund.
The Trustees noted that the Hedged Equity Fund’s net advisory fee and actual total expenses for Class A shares were in the first quintile of both the Peer Group and Universe. The Trustees noted that the net advisory fee and actual total expenses for Class I shares were in the second quintile of the Universe. Broadridge did not calculate quintile rankings for the Peer Group for Class I shares due to the limited number of funds in the Peer Groups. The Trustees noted that the net advisory fee for Class R6 shares was in the first and second quintiles of the Peer Group and Universe, respectively, and that the actual total expenses for Class R6 shares were in the first quintile of both the Peer Group and Universe. After considering the factors identified above, in light of this information, the Trustees concluded that the advisory fee was fair and reasonable in light of the services provided to the Fund.
The Trustees noted that the Hedged Equity 2 Fund’s net advisory fee and actual total expenses for Class A and Class R6 shares were in the first quintile of both the Peer Group and Universe. The Trustees noted that the net advisory fee for Class I shares was in first quintile of the Universe, and that the actual total expenses for Class I shares were in the second quintile of the Universe. Broadridge did not calculate quintile rankings for the Peer Group for Class I shares due to the limited number of funds in the Peer Groups. After considering the factors identified above, in light of this information, the Trustees concluded that the advisory fee was fair and reasonable in light of the services provided to the Fund.
The Trustees noted that the Hedged Equity 3 Fund’s net advisory fee and actual total expenses for Class A and Class R6 shares were in the first quintile of both the Peer Group and Universe. The Trustees noted that the net advisory fee for Class I shares was in first quintile of the Universe, and that the
actual total expenses for Class I shares were in the second quintile of the Universe. Broadridge did not calculate quintile rankings for the Peer Group for Class I shares due to the limited number of funds in the Peer Groups. After considering the factors identified above, in light of this information, the Trustees concluded that the advisory fee was fair and reasonable in light of the services provided to the Fund.
The Trustees noted that the Large Cap Growth Fund’s net advisory fee for Class A shares was in the first quintile of both the Peer Group and Universe, and that the actual total expenses for Class A shares were in the third and second quintiles of the Peer Group and Universe, respectively. The Trustees noted that the net advisory fee for Class I shares was in the first quintile of both the Peer Group and Universe, and that the actual total expenses for Class I shares were in the first and second quintiles of the Peer Group and Universe, respectively. The Trustees noted that the net advisory fee Class R6 shares was in the second and first quintiles of the Peer Group and Universe, respectively, and that the actual total expenses for Class R6 shares were in the first quintile of both the Peer Group and Universe. After considering the factors identified above, in light of this information, the Trustees concluded that the advisory fee was fair and reasonable in light of the services provided to the Fund.
The Trustees noted that the Large Cap Value Fund’s net advisory fee for Class A shares was in the first quintile of both the Peer Group and Universe, and that the actual total expenses for Class A shares were in the third and second quintiles of the Peer Group and Universe, respectively. The Trustees noted that the net advisory fee for Class I shares was in the second and first quintiles of the Peer Group and Universe, respectively, and that the actual total expenses for Class I shares were in the first and second quintiles of the Peer Group and Universe, respectively. The Trustees noted that the net advisory fee and actual total expenses for Class R6 shares were in the first quintile of both the Peer Group and Universe. After considering the factors identified above, in light of this information, the Trustees concluded that the advisory fee was fair and reasonable in light of the services provided to the Fund.
The Trustees noted that the U.S. Applied Data Science Value Fund’s net advisory fee and actual total expenses for Class A, Class I and Class R6 shares were in the first quintile of both the Peer Group and the Universe. After considering the factors identified above, in light of this information, the Trustees concluded that the advisory fee was fair and reasonable in light of the services provided to the Fund.
The Trustees noted that the U.S. Equity Fund’s net advisory fee for Class A shares was in the first and second quintiles of the Peer Group and Universe, respectively, and that the actual total expenses for Class A shares were in the third and second quintiles of the Peer Group and Universe, respectively. The
| J.P. Morgan Large Cap Funds | |
Trustees noted that the net advisory fee for Class I shares was in the second quintile of both the Peer Group and Universe, and that the actual total expenses for Class I shares were in the second and third quintiles of the Peer Group and Universe, respectively. The Trustees noted that the net advisory fee for Class R6 shares was in the second quintile of both the Peer Group and Universe, and that the actual total expenses for Class R6 shares were in the second and first quintiles of the Peer Group and Universe, respectively. After considering the factors identified above, in light of this information, the Trustees concluded that the advisory fee was fair and reasonable in light of the services provided to the Fund.
The Trustees noted that the U.S. GARP Equity Fund’s net advisory fee and actual total expenses for Class A, Class I and Class R6 shares were in the first quintile of both the Peer Group and Universe. After considering the factors identified above, in light of this information, the Trustees concluded that the advisory fee was fair and reasonable in light of the services provided to the Fund.
The Trustees noted that the U.S. Large Cap Core Plus Fund’s net advisory fee for Class A shares were in the third and fourth quintiles of the Peer Group and Universe, respectively, and that the actual total expenses for Class A shares were in third and second quintiles of the Peer Group and Universe, respectively. The Trustees noted that the net advisory fee for Class I shares was in fourth quintile of both the Peer Group and Universe, and that the actual total expenses for Class I shares were in the first and third quintiles of the Peer Group and Universe, respectively. The Trustees noted that the net advisory fee for Class R6 shares was in the fifth and fourth quintile of the Peer Group and Universe, respectively, and that the actual total expenses for Class R6 shares were in the fourth and second quintiles of the Peer Group and Universe, respectively. After considering all of the factors identified above, in light of this information, the Trustees concluded that the advisory fee was fair and reasonable in light of the services provided to the Fund.
The Trustees noted that the U.S. Research Enhanced Equity Fund’s net advisory fee and actual total expenses for Class A and Class I shares were in the first quintile of both the Peer Group and Universe. The Trustees noted that the net advisory fee for Class R6 shares was in the second and first quintiles of the Peer Group and Universe, respectively, and that the actual total expenses for Class R6 shares were in first quintile of both the Peer Group and Universe. After considering the factors identified above, in light of this information, the Trustees concluded that the advisory fee was fair and reasonable in light of the services provided to the Fund.
The Trustees noted that the U.S. Sustainable Leader Fund’s net advisory fee and actual total expenses for Class A, Class I and Class R6 shares were in the first quintile based upon both the Peer Group and Universe. After considering the factors identified above, in light of this information, the Trustees concluded that the advisory fee was fair and reasonable in light of the services provided to the Fund.
The Trustees noted that the U.S. Value Fund’s net advisory fee for Class A shares was in the first quintile of both the Peer Group and Universe, and that the actual total expenses for Class A shares were in the second quintiles of both the Peer Group and Universe. The Trustees noted that the net advisory fee for Class I shares was in the first quintile of both the Peer Group and Universe, and that the actual total expenses for Class I shares were in the first and second quintiles of the Peer Group and Universe, respectively. The Trustees noted that both the net advisory fee and actual total expenses for Class R6 shares were in the first quintile of both the Peer Group and Universe. After considering the factors identified above, in light of this information, the Trustees concluded that the advisory fee was fair and reasonable in light of the services provided to the Fund.
| J.P. Morgan Large Cap Funds | |
J.P. Morgan Funds are distributed by JPMorgan Distribution Services, Inc., which is an affiliate of JPMorgan Chase & Co. Affiliates of JPMorgan Chase & Co. receive fees for providing various services to the Funds.
Contact JPMorgan Distribution Services, Inc. at 1-800-480-4111 for a fund prospectus. You can also visit us at www.jpmorganfunds.com. Investors should carefully consider the investment objectives and risk as well as charges and expenses of the mutual fund before investing. The prospectus contains this and other information about the mutual fund. Read the prospectus carefully before investing.
Investors may obtain information about the Securities Investor Protection Corporation (SIPC), including the SIPC brochure, by visiting www.sipc.org or by calling SIPC at 202-371-8300.
Each Fund files a complete schedule of its fund holdings for the first and third quarters of its fiscal year with the SEC as an exhibit to its report on Form N-PORT. The Funds' Form N-PORT reports are available on the SEC’s website at http://www.sec.gov. Each Fund's quarterly holdings can be found by visiting the J.P. Morgan Funds’ website at www.jpmorganfunds.com.
Effective January 24, 2023, the SEC adopted rule and form amendments that will result in changes to the design and delivery of shareholder reports of mutual funds and ETFs, requiring them to transmit concise and visually engaging streamlined annual and semi-annual reports to shareholders that highlight key information. Other information, including financial statements, will no longer appear in a streamlined shareholder report but must be available online, delivered free of charge upon request, and filed on a semi-annual basis on Form N-CSR. The rule and form amendments have a compliance date of July 24, 2024.
A description of each Fund's policies and procedures with respect to the disclosure of each Fund's holdings is available in the prospectuses and Statement of Additional Information.
A copy of proxy policies and procedures is available without charge upon request by calling 1-800-480-4111 and on the Funds' website at www.jpmorganfunds.com. A description of such policies and procedures is on the SEC’s website at www.sec.gov. The Trustees have delegated the authority to vote proxies for securities owned by the Funds to the Adviser. A copy of the Funds' voting record for the most recent 12-month period ended June 30 is available on the SEC’s website at www.sec.gov or at the Funds' website at www.jpmorganfunds.com no later than August 31 of each year. The Funds' proxy voting record will include, among other things, a brief description of the matter voted on for each fund security, and will state how each vote was cast, for example, for or against the proposal.
J.P. Morgan Asset Management is the brand name for the asset management business of JPMorgan Chase & Co. and its affiliates worldwide.
© JPMorgan Chase & Co., 2023. All rights reserved. December 2023.
SAN-LCE-1223
Semi-Annual Report
J.P. Morgan Investor Funds
December 31, 2023 (Unaudited)
JPMorgan Investor Balanced Fund |
JPMorgan Investor Conservative Growth Fund |
JPMorgan Investor Growth Fund |
JPMorgan Investor Growth & Income Fund |
CONTENTS
Investments in a Fund are not deposits or obligations of, or guaranteed or endorsed by, any bank and are not insured or guaranteed by the FDIC, the Federal Reserve Board or any other government agency. You could lose money if you sell when a Fund’s share price is lower than when you invested.
Past performance is no guarantee of future performance. The general market views expressed in this report are opinions based on market and other conditions through the end of the reporting period and are subject to change without notice. These views are not intended to predict the future performance of a Fund or the securities markets.
Prospective investors should refer to the Funds’ prospectuses for a discussion of the Funds’ investment objectives, strategies and risks. Call J.P. Morgan Funds Service Center at 1-800-480-4111 for a prospectus containing more complete information about a Fund, including management fees and other expenses. Please read it carefully before investing.
Letter to ShareholdersFebruary 7, 2024 (Unaudited)
Dear Shareholder,
U.S. equity markets surged through the end of 2023 and into early 2024 as the risk of economic recession receded and the prospect of lower interest rates drove investor optimism. Globally, financial markets largely generated positive returns, despite heightened geopolitical tensions and signs of economic weakness across Europe and China.
|
“Investors appear to have begun 2024 with a positive outlook, with the U.S. economy and its financial markets leading global growth.” — Brian S. Shlissel
|
Inflation pressures eased sufficiently during the second half of 2023 to allow the U.S. Federal Reserve (the “Fed”) to hold the benchmark discount interest rate at 5.25% at its June 2023 meeting, ending a string of 10 consecutive interest rate increases. The Fed raised rates once more in July 2023, then held the benchmark rate at 5.50% for the remainder of the 2023.
In the face of elevated interest rates, the U.S. economy proved surprisingly resilient and largely led developed markets in growth through the end of 2023. Gross domestic product outpaced economists’ consensus expectations with a 4.9% jump in the third quarter and estimated growth of 3.3% in the fourth quarter. Though the U.S. economy continued to expand, inflation data indicated that the Fed’s efforts to cool the domestic economy appeared to be effective.
Certain other measures of the U.S. economy showed little sign of weakness. Consumer spending remained elevated in the second half of 2023 and rose month-to-month to reach approximately $709.9 billion in retail sales in December 2023. The unemployment rate settled at 3.7% in the final two months of 2023 as approximately 333,000 jobs were added in December alone. Further, an estimated 353,000 jobs were added in January 2024, approximately double the increase anticipated by certain economists.
Both equity and bond markets in the U.S. performed well, buoyed by the overall strength shown by the U.S. economy and the apparent turn in Fed policy. Stronger-than-expected consumer spending and corporate earnings, as well as investor expectations for artificial-intelligence-driven productivity gains bolstered demand for equities in recent months. Certain leading U.S. equity indexes returned more than 9% in November and in excess of 5% in December 2023. In January 2024, the S&P 500 Index reached six new closing highs and surpassed 4,800 points for the first time. However, equity market gains were not broadly spread: The largest 10 stocks in the S&P 500 Index comprised approximately 90% of the index’s price gains for all of 2023.
While U.S. financial markets largely appeared to withstand increased geopolitical tensions in 2023, the potential for the conflicts in Ukraine and Israel to expand in intensity and geography may threaten global economic growth and increase market volatility. Additionally, the Fed may be forced to change policy should the strength of U.S. economy recede or the downward trend in inflation were to reverse.
Investors appear to have begun 2024 with a positive outlook, with the U.S. economy and its financial markets leading global growth. While risks to the growth outlook remain, we believe investors who hold a well-diversified portfolio over the long term should be positioned to benefit from positive economic trends.
Our suite of investment solutions seeks to provide investors with the ability to build durable portfolios that meet their financial goals, regardless of macroeconomic and geopolitical uncertainties.
Sincerely,
Brian S. Shlissel
President, J.P. Morgan Funds
J.P. Morgan Asset Management
1-800-480-4111 or www.jpmorganfunds.com for more information
| J.P. Morgan Investor Funds | |
J.P. Morgan Investor Funds
FUND FACTSSIX MONTHS ENDED December 31, 2023 (Unaudited)
| Fund Return
(With
sales charge)* | Fund Return
(Without
sales charge)* | Bloomberg Barclays U.S.
Intermediate Aggregate
Index Return
(Broad-Based Fixed
Income Benchmark) | Russell 3000
Index Return
(Broad-Based
Equity Benchmark) | MSCI EAFE Index
(net of foreign
withholding
taxes) | Fund Net
Assets as of December 31, 2023 (In thousands) |
JPMorgan Investor Balanced Fund, Class A | | | | | | |
JPMorgan Investor Conservative Growth Fund, Class A | | | | | | |
JPMorgan Investor Growth Fund, Class A | | | | | | |
JPMorgan Investor Growth & Income Fund, Class A | | | | | | |
| The return shown is based on net asset values calculated for shareholder transactions and may differ from the return shown in the financial highlights, which reflects adjustments made to the net asset values in accordance with accounting principles generally accepted in the United States of America. |
JPMorgan Investor Balanced Fund
PORTFOLIO COMPOSITION BY ASSET CLASS
AS OF December 31, 2023 | PERCENT OF
TOTAL
INVESTMENTS |
| |
| |
| |
| |
| |
JPMorgan Investor Conservative Growth Fund
PORTFOLIO COMPOSITION BY ASSET CLASS
AS OF December 31, 2023 | PERCENT OF
TOTAL
INVESTMENTS |
| |
| |
| |
| |
| |
JPMorgan Investor Growth Fund
PORTFOLIO COMPOSITION BY ASSET CLASS
AS OF December 31, 2023 | PERCENT OF
TOTAL
INVESTMENTS |
| |
| |
| |
| |
JPMorgan Investor Growth & Income Fund
PORTFOLIO COMPOSITION BY ASSET CLASS
AS OF December 31, 2023 | PERCENT OF
TOTAL
INVESTMENTS |
| |
| |
| |
| |
| J.P. Morgan Investor Funds | |
J.P. Morgan Investor Funds
FUNDS COMMENTARYSIX MONTHS ENDED December 31, 2023 (Unaudited)
INVESTMENT OBJECTIVES*
The JPMorgan Investor Balanced Fund seeks high total return consistent with the preservation of capital by investing primarily in a diversified group of mutual funds within the same group of investment companies that invest primarily in equity and fixed income securities.
The JPMorgan Investor Conservative Growth Fund seeks income and capital appreciation by investing primarily in a diversified group of mutual funds within the same group of investment companies that invest primarily in fixed income and equity securities.
The JPMorgan Investor Growth Fund seeks long-term capital appreciation by investing primarily in a diversified group of mutual funds within the same group of investment companies that invest primarily in equity securities.
The JPMorgan Investor Growth & Income Fund seeks long-term capital appreciation and growth of income by investing primarily in a diversified group of mutual funds within the same group of investment companies that invest primarily in equity securities.
HOW DID THE MARKET PERFORM?
U.S. equity markets largely rallied in the final two months of 2023, rebounding from three months of declines to generate positive returns for the six month period. Investor demand for large cap stocks in the technology and communications sectors was a leading driver of equity market returns. Bond markets generally provided positive returns but underperformed equity markets.
After raising its policy benchmark interest rates by 0.25% in July 2023, the U.S. Federal Reserve (the “Fed”) declined to raise rates further at its next three meetings for the year. More importantly for investors, the central bank stated in December 2023 that it could begin to lower interest rates in the first half of 2024, if inflationary pressures continued to recede.
While the U.S. economic growth showed signs of slowing in mid-2023, third-quarter gross domestic product exceeded economists’ consensus expectations with a 4.9% increase. Growth was largely driven by resilient consumer spending and inventory building by businesses. The unemployment rate in the U.S. remained historically low at 3.8% for most of the six-month period before settling at 3.7% in December 2023. The data and the outlook for interest rates fed investor expectations that the U.S. could avoid an economic recession in 2024.
U.S. equities generally outperformed both international developed markets and emerging markets equities for the period. Overall, gains in U.S. markets were led by large capitalization stocks in the technology and communications sectors, particularly the so-called Magnificent Seven: Apple
Inc., Amazon.com Inc., Alphabet Inc., Meta Platforms Inc., Microsoft Corp., Nvidia Corp. and Tesla Inc. At the end of 2023, the 10 largest companies in the S&P 500 Index accounted for 31.2% of the index’s total market capitalization. Notably, only within small cap stocks did value outperform growth for the period.
Investor expectations that the Fed and private sector banks could begin to lower their interest rates sparked a broad rally in U.S. fixed income markets in the final two months of 2023. Overall, lower quality bonds, high yield bonds (also known a junk bonds) and emerging markets debt outperformed U.S. Treasury bonds and higher quality U.S. corporate debt.
WHAT WERE THE MAIN DRIVERS OF THE FUNDS' PERFORMANCE?
In accordance with their model allocations, each of the JPMorgan Investor Funds (the “Investor Funds”) allocated its assets among fixed income, equity and alternative investments.
For the six months ended December 31, 2023, each of the Investor Funds’ Class A Shares outperformed the Bloomberg U.S. Intermediate Aggregate Index, the Investor Funds’ broad based fixed income benchmark, mainly due to the Investor Funds’ exposure to equities.
Each of the Investor Funds underperformed the Russell 3000 Index, the Investor Funds’ broad based U.S. equity benchmark, mainly due to the Funds’ allocations to fixed income. The JPMorgan Investor Growth and JPMorgan Investor Growth & Income Funds outperformed the MSCI EAFE Index, a broad global equity index, largely due to its exposure to U.S. equities which outperformed international equities. The JPMorgan Investor Balanced Fund and JPMorgan Investor Conservative Growth Fund underperformed the MSCI EAFE Index, largely due to their higher allocations to fixed income.
HOW WERE THE FUNDS POSITIONED?
Each Investor Fund invested in underlying JPMorgan Funds (“underlying funds”). The underlying funds invest in fixed income securities, equities and other alternative fixed income and equity strategies, such as below investment grade, high yield bonds and real estate investment trusts. Among equities, the underlying funds in which the Investor Funds invested were allocated among large-cap, mid-cap, small-cap and international stocks. The Investor Funds’ portfolio managers made investments for each Investor Fund based on an evaluation of three components: underlying fund selection, tactical asset allocation and strategic asset allocation. The portfolio managers determined the strategic weight for each asset class in the Investor Funds by making investments that they believed would perform well over the long term and maintaining a level of volatility similar to that of each Investor
| J.P. Morgan Investor Funds | |
J.P. Morgan Investor Funds
FUNDS COMMENTARYSIX MONTHS ENDED December 31, 2023 (Unaudited) (continued)
*
The adviser seeks to achieve the Portfolio’s objective. There can be no guarantee it will be achieved.
Fund’s composite benchmark. During the period, the portfolio managers maintained a neutral-to-slightly-overweight position in equities and a neutral-to-slightly underweight position in fixed income across the Investor Funds.
| J.P. Morgan Investor Funds | |
JPMorgan Investor Balanced Fund
FUND COMMENTARYSIX MONTHS ENDED December 31, 2023 (Unaudited)
AVERAGE ANNUAL TOTAL RETURNS AS OF December 31, 2023
|
| |
| Sales Charge for Class A Shares is 4.50%. |
| Assumes a 1% CDSC (contingent deferred sales charge) for the 6 month and one year periods and 0% CDSC thereafter. |
TEN YEAR FUND PERFORMANCE (12/31/13 TO 12/31/23)
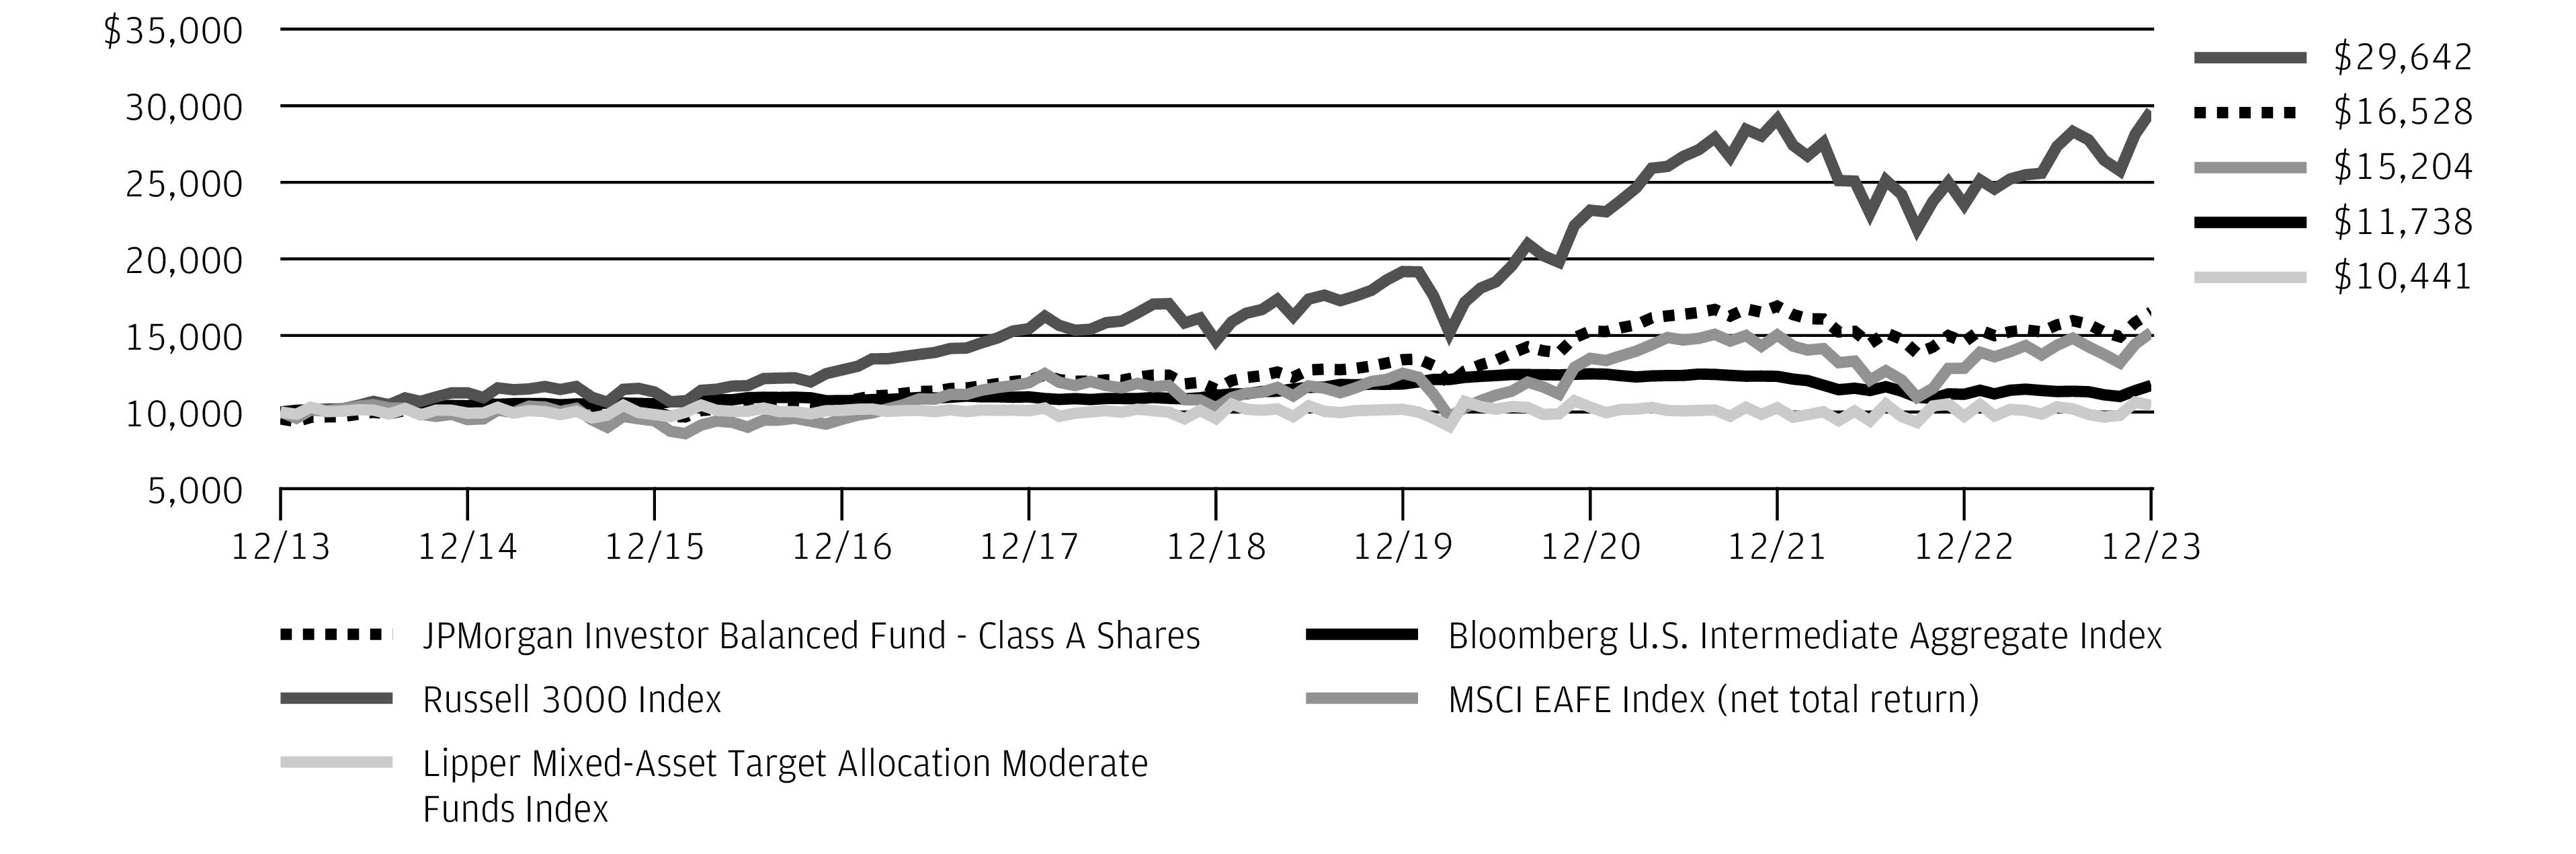
The performance quoted is past performance and is not a guarantee of future results. Mutual funds are subject to certain market risks. Investment returns and principal value of an investment will fluctuate so that an investor’s shares, when redeemed, may be worth more or less than their original cost. Current performance may be higher or lower than the performance data shown. Updated performance information is available by visiting www.jpmorganfunds.com or by calling 1-800-480-4111.
Returns for Class R6 Shares prior to its inception date are based on the performance of Class I Shares. The actual returns for Class R6 Shares would have been different than those shown because Class R6 Shares have different expenses than Class I Shares.
The graph illustrates comparative performance for $10,000 invested in Class A Shares of the JPMorgan Investor Balanced Fund, the Bloomberg U.S. Intermediate Aggregate Index, the Russell 3000 Index, the MSCI EAFE Index (net total return) and the Lipper Mixed-Asset Target Allocation Moderate Funds Index from December 31, 2013 to December 31, 2023. The performance of the Fund assumes reinvestment of all dividends and capital gain distributions, if any, and includes a sales charge. The performance of the broad-based securities indices and the MSCI EAFE Index (net total return) does not reflect the deduction of expenses or a sales charge associated with a mutual fund and has been adjusted to reflect reinvestment of all dividends and capital gain distributions of the securities included in the benchmark, if applicable. The performance of the Lipper Mixed-Asset Target Allocation Moderate Funds Index, which is not a broad-based securities index, includes expenses associated with a mutual fund, such as investment management fees. These expenses are not identical to the expenses incurred by the Fund. The Bloomberg U.S. Intermediate Aggregate Index is an unmanaged index
comprised of U.S. Government, mortgage, corporate, and asset-backed securities with maturities of one to 10 years. The Russell 3000 Index is an unmanaged index which measures the performance of the 3,000 largest U.S. companies based on total market capitalization, which represents approximately 98% of the investable U.S. equity market. The MSCI EAFE Index (net total return) is a free float-adjusted market capitalization weighted index that is designed to measure the equity market performance of developed markets, excluding the U.S. and Canada. The Lipper Mixed-Asset Target Allocation Moderate Funds Index consists of funds that by portfolio practice maintain a mix of between 40% to 60% equity securities, with the remainder invested in bonds, cash and cash equivalents. Investors cannot invest directly in an index.
Class A Shares have a $500 minimum initial investment and carry a 4.50% sales charge.
Fund performance may reflect the waiver of the Fund’s fees and reimbursement of expenses for certain periods. Without these waivers and reimbursements, performance would have been lower. Also, performance shown in this section does not reflect the deduction of taxes that a shareholder would pay on Fund distributions or on gains resulting from redemptions of Fund shares.
Because Class C Shares automatically convert to Class A Shares after 8 years, the 10 year average annual total return shown above for Class C Shares reflects Class A Share's performance for the period after conversion.
The returns shown are based on net asset values calculated for shareholder transactions and may differ from the returns shown in the financial highlights,
JPMorgan Investor Balanced Fund
FUND COMMENTARYSIX MONTHS ENDED December 31, 2023 (Unaudited)
which reflect adjustments made to the net asset values in accordance with accounting principles generally accepted in the United States of America.
Source: Bloomberg Index Services Limited. BLOOMBERG® is a trademark and service mark of Bloomberg Finance L.P. and its affiliates (collectively "Bloomberg"). Bloomberg or Bloomberg's licensors own all proprietary rights in the Bloomberg Indices. Bloomberg does not approve or endorse this material, or guarantee the accuracy or completeness of any information herein, or make any warranty, express or implied, as to the results to be obtained therefrom and, to the maximum extent allowed by law, shall have any liability or responsibility for injury or damages arising in connection therewith.
Frank Russell Company is the source and owner of the Russell Index data contained or reflected in this material and all trademarks and copyrights related thereto. Frank Russell Company is not responsible for the formatting or configuration of this material or for any inaccuracy in the adviser's presentation thereof.
Source: MSCI. The MSCI information may only be used for your internal use, may not be reproduced or redisseminated in any form and may not be used as a basis
for or a component of any financial instruments or products or indices. None of the MSCI information is intended to constitute investment advice or a recommendation to make (or refrain from making) any kind of investment decision and may not be relied on as such. Historical data and analysis should not be taken as an indication or guarantee of any future performance analysis, forecast, or prediction. The MSCI information is provided on an "as is" basis and the user of this information assumes the entire risk of any use made of this information. MSCI, each of its affiliates and each other person involved in or related to compiling, computing or creating any MSCI information (collectively, the "MSCI Parties") expressly disclaims all warranties (including, without limitation, any warranties of originality, accuracy, completeness, timeliness, non-infringement, merchantability and fitness for a particular purpose) with respect to this information. Without limiting any of the foregoing, in no event shall any MSCI Party have any liability for any direct, indirect, special, incidental, punitive, consequential (including, without limitation, lost profits) or any other damages. (www.msci.com)
JPMorgan Investor Conservative Growth Fund
FUND COMMENTARYSIX MONTHS ENDED December 31, 2023 (Unaudited)
AVERAGE ANNUAL TOTAL RETURNS AS OF December 31, 2023
|
| |
| Sales Charge for Class A Shares is 4.50%. |
| Assumes a 1% CDSC (contingent deferred sales charge) for the 6 month and one year periods and 0% CDSC thereafter. |
TEN YEAR FUND PERFORMANCE (12/31/13 TO 12/31/23)
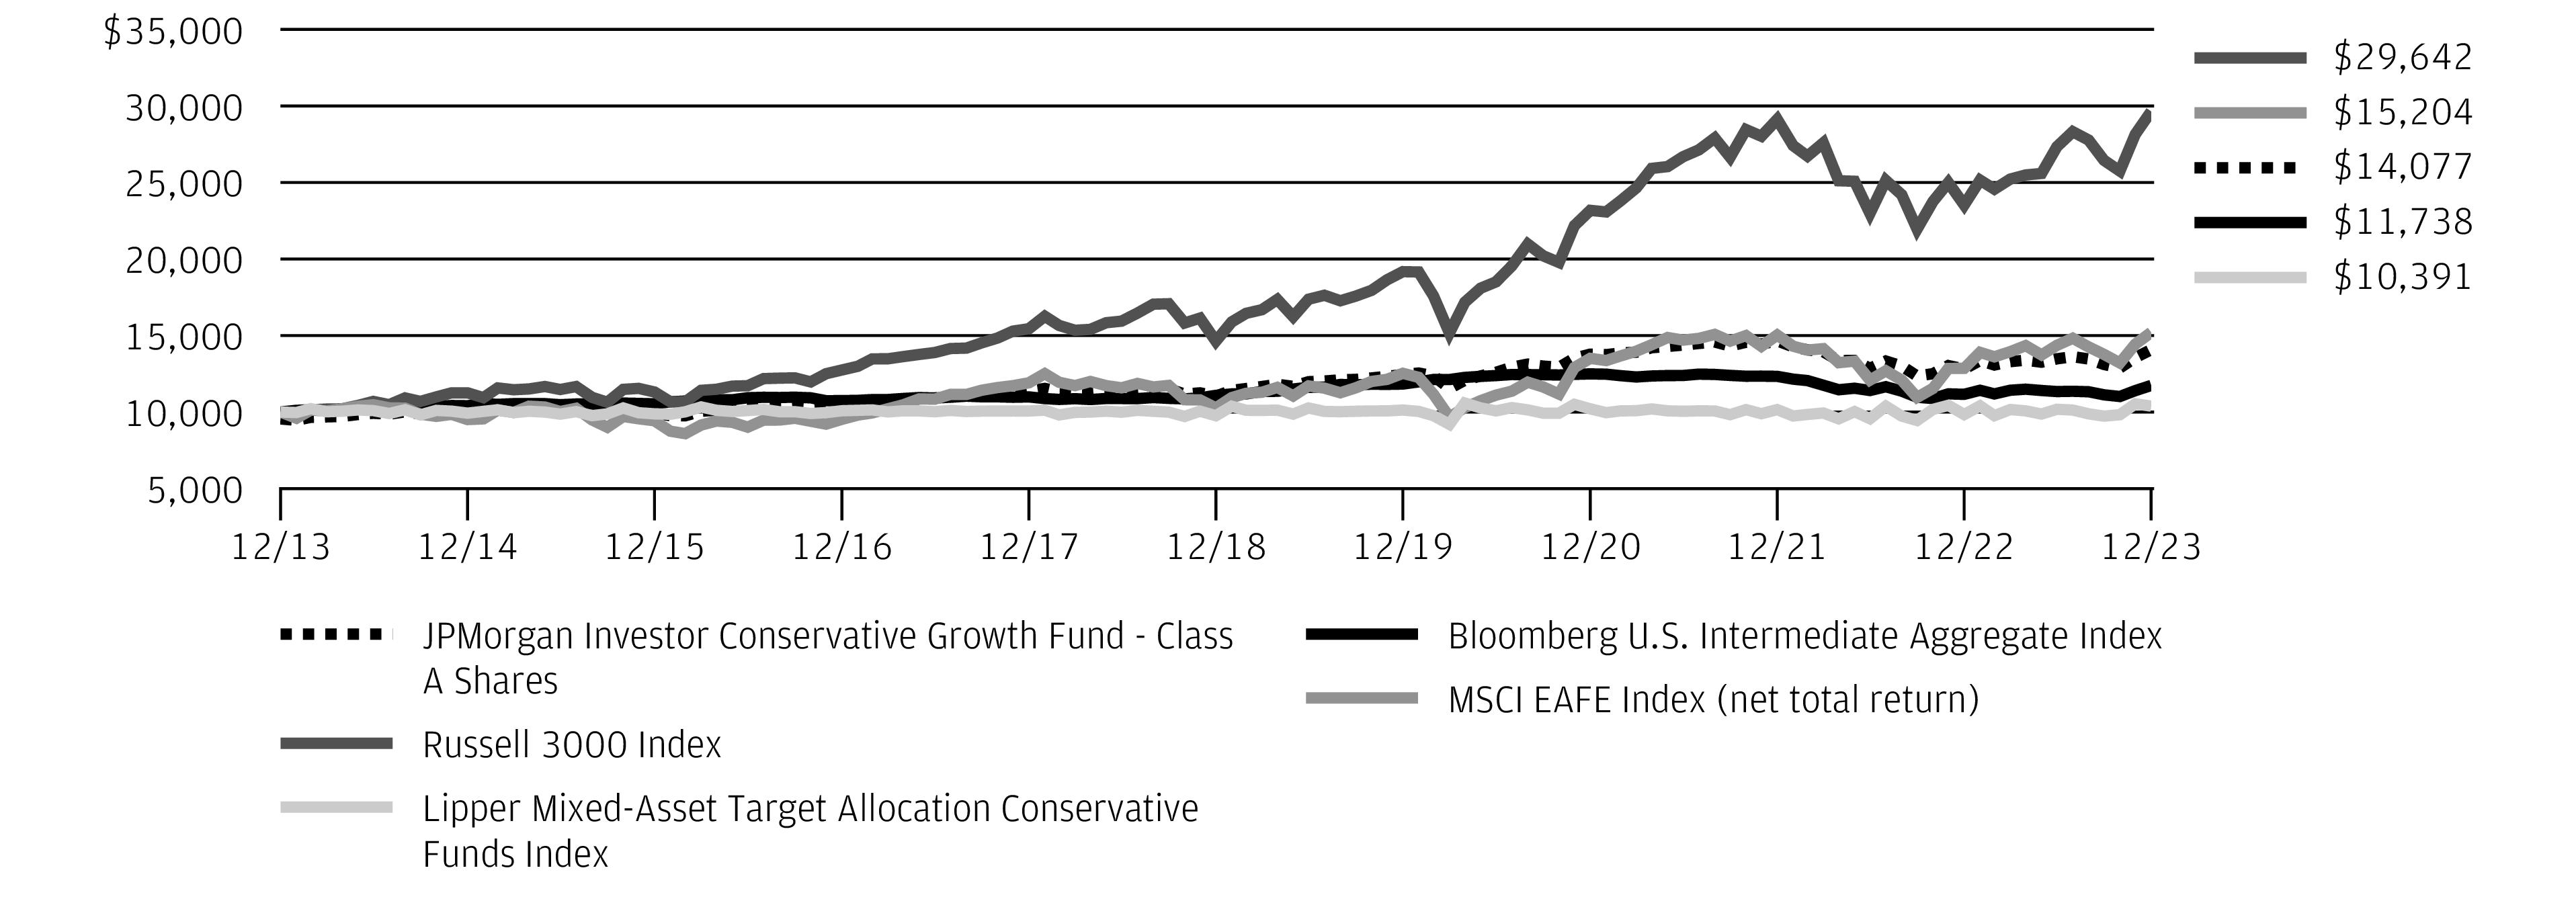
The performance quoted is past performance and is not a guarantee of future results. Mutual funds are subject to certain market risks. Investment returns and principal value of an investment will fluctuate so that an investor’s shares, when redeemed, may be worth more or less than their original cost. Current performance may be higher or lower than the performance data shown. Updated performance information is available by visiting www.jpmorganfunds.com or by calling 1-800-480-4111.
Returns for Class R6 Shares prior to its inception date are based on the performance of Class I Shares. The actual returns for Class R6 Shares would have been different than those shown because Class R6 Shares have different expenses than Class I Shares.
The graph illustrates comparative performance for $10,000 invested in Class A Shares of the JPMorgan Investor Conservative Growth Fund, the Bloomberg U.S. Intermediate Aggregate Index, the Russell 3000 Index, the MSCI EAFE Index (net total return) and the Lipper Mixed-Asset Target Allocation Conservative Funds Index from December 31, 2013 to December 31, 2023. The performance of the Fund assumes reinvestment of all dividends and capital gain distributions, if any, and includes a sales charge. The performance of the broad-based securities indices and the MSCI EAFE Index (net total return) does not reflect the deduction of expenses or a sales charge associated with a mutual fund and has been adjusted to reflect reinvestment of all dividends and capital gain distributions of the securities included in the benchmark, if applicable. The performance of the Lipper Mixed-Asset Target Allocation Conservative Funds Index, which is not a broad-based securities index, includes expenses associated with a mutual fund, such as investment management fees.
These expenses are not identical to the expenses incurred by the Fund. The Bloomberg U.S. Intermediate Aggregate Index is an unmanaged index comprised of U.S. Government, mortgage, corporate, and asset-backed securities with maturities of one to 10 years. The Russell 3000 Index is an unmanaged index which measures the performance of the 3,000 largest U.S. companies based on total market capitalization, which represents approximately 98% of the investable U.S. equity market. The MSCI EAFE Index (net total return) is a free float-adjusted market capitalization weighted index that is designed to measure the equity market performance of developed markets, excluding the U.S. and Canada. The Lipper Mixed-Asset Target Allocation Conservative Funds Index consists of funds that by portfolio practice maintain a mix of between 20% to 40% equity securities, with the remainder invested in bonds, cash and cash equivalents. Investors cannot invest directly in an index.
Class A Shares have a $500 minimum initial investment and carry a 4.50% sales charge.
Fund performance may reflect the waiver of the Fund’s fees and reimbursement of expenses for certain periods. Without these waivers and reimbursements, performance would have been lower. Also, performance shown in this section does not reflect the deduction of taxes that a shareholder would pay on Fund distributions or on gains resulting from redemptions of Fund shares.
Because Class C Shares automatically convert to Class A Shares after 8 years, the 10 year average annual total return shown above for Class C Shares reflects Class A Share's performance for the period after conversion.
JPMorgan Investor Conservative Growth Fund
FUND COMMENTARYSIX MONTHS ENDED December 31, 2023 (Unaudited)
The returns shown are based on net asset values calculated for shareholder transactions and may differ from the returns shown in the financial highlights, which reflect adjustments made to the net asset values in accordance with accounting principles generally accepted in the United States of America.
Source: Bloomberg Index Services Limited. BLOOMBERG® is a trademark and service mark of Bloomberg Finance L.P. and its affiliates (collectively "Bloomberg"). Bloomberg or Bloomberg's licensors own all proprietary rights in the Bloomberg Indices. Bloomberg does not approve or endorse this material, or guarantee the accuracy or completeness of any information herein, or make any warranty, express or implied, as to the results to be obtained therefrom and, to the maximum extent allowed by law, shall have any liability or responsibility for injury or damages arising in connection therewith.
Frank Russell Company is the source and owner of the Russell Index data contained or reflected in this material and all trademarks and copyrights related thereto. Frank Russell Company is not responsible for the formatting or configuration of this material or for any inaccuracy in the adviser's presentation thereof.
Source: MSCI. The MSCI information may only be used for your internal use, may not be reproduced or redisseminated in any form and may not be used as a basis for or a component of any financial instruments or products or indices. None of the MSCI information is intended to constitute investment advice or a recommendation to make (or refrain from making) any kind of investment decision and may not be relied on as such. Historical data and analysis should not be taken as an indication or guarantee of any future performance analysis, forecast, or prediction. The MSCI information is provided on an "as is" basis and the user of this information assumes the entire risk of any use made of this information. MSCI, each of its affiliates and each other person involved in or related to compiling, computing or creating any MSCI information (collectively, the "MSCI Parties") expressly disclaims all warranties (including, without limitation, any warranties of originality, accuracy, completeness, timeliness, non-infringement, merchantability and fitness for a particular purpose) with respect to this information. Without limiting any of the foregoing, in no event shall any MSCI Party have any liability for any direct, indirect, special, incidental, punitive, consequential (including, without limitation, lost profits) or any other damages. (www.msci.com)
JPMorgan Investor Growth Fund
FUND COMMENTARYSIX MONTHS ENDED December 31, 2023 (Unaudited)
AVERAGE ANNUAL TOTAL RETURNS AS OF December 31, 2023
|
| |
| Sales Charge for Class A Shares is 4.50%. |
| Assumes a 1% CDSC (contingent deferred sales charge) for the 6 month and one year periods and 0% CDSC thereafter. |
TEN YEAR FUND PERFORMANCE (12/31/13 TO 12/31/23)
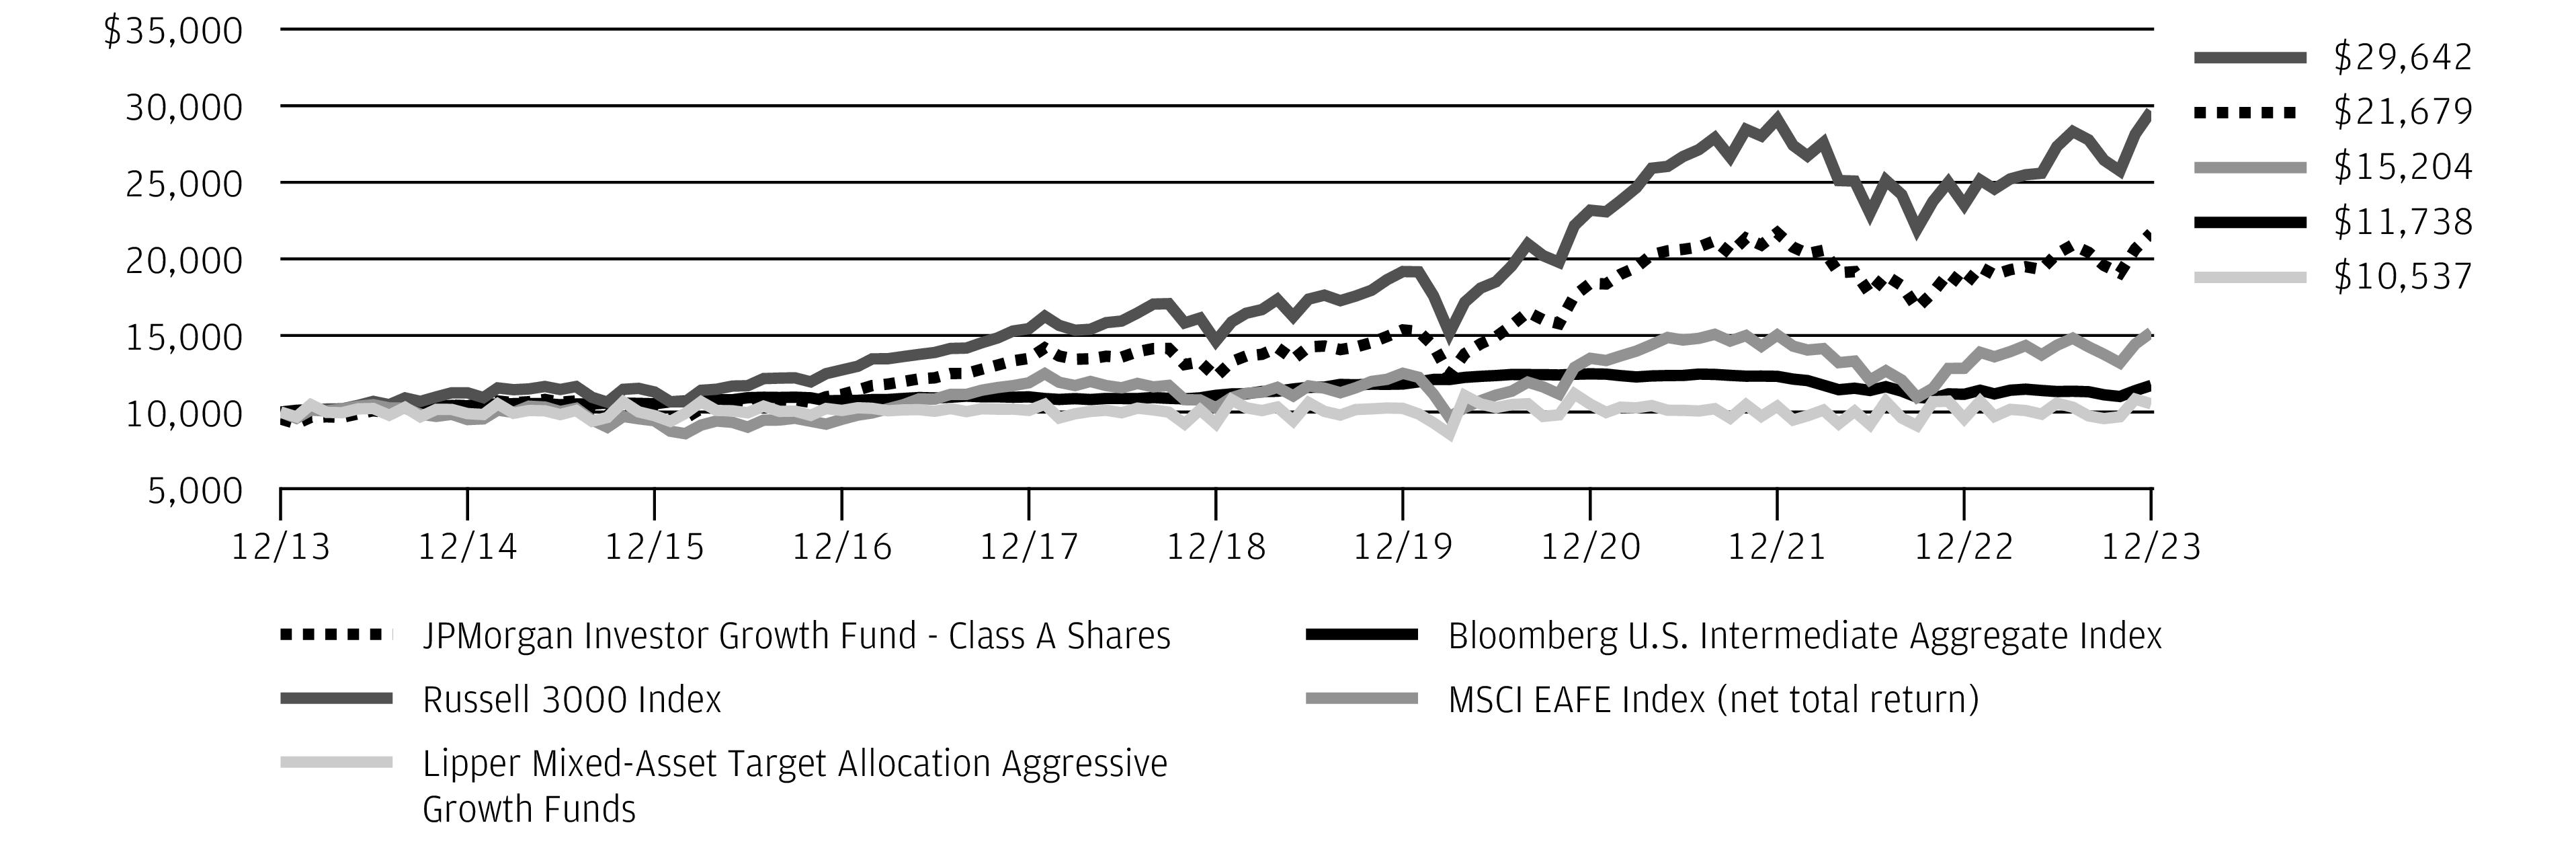
The performance quoted is past performance and is not a guarantee of future results. Mutual funds are subject to certain market risks. Investment returns and principal value of an investment will fluctuate so that an investor’s shares, when redeemed, may be worth more or less than their original cost. Current performance may be higher or lower than the performance data shown. Updated performance information is available by visiting www.jpmorganfunds.com or by calling 1-800-480-4111.
Returns for Class R6 Shares prior to their inception date are based on the performance of Class I Shares. The actual returns for Class R6 Shares would have been different than those shown because Class R6 Shares have different expenses than Class I Shares.
The graph illustrates comparative performance for $10,000 invested in Class A Shares of the JPMorgan Investor Growth Fund, the Bloomberg U.S. Intermediate Aggregate Index, the Russell 3000 Index, the MSCI EAFE Index (net total return) and the Lipper Mixed-Asset Target Allocation Conservative Funds Index from December 31, 2013 to December 31, 2023. The performance of the Fund assumes reinvestment of all dividends and capital gain distributions, if any, and includes a sales charge. The performance of the broad-based securities indices and the MSCI EAFE Index (net total return) does not reflect the deduction of expenses or a sales charge associated with a mutual fund and has been adjusted to reflect reinvestment of all dividends and capital gain distributions of the securities included in the benchmark, if applicable. The performance of the Lipper Mixed-Asset Target Allocation Conservative Funds Index, which is not a broad-based securities index, includes expenses associated with a mutual fund, such as investment management fees. These expenses are not identical to the expenses incurred by the Fund. The Bloomberg U.S. Intermediate Aggregate Index is an unmanaged index comprised of U.S. Government, mortgage, corporate, and asset-backed securities with maturities of one to 10 years. The
Russell 3000 Index is an unmanaged index which measures the performance of the 3,000 largest U.S. companies based on total market capitalization, which represents approximately 98% of the investable U.S. equity market. The MSCI EAFE Index (net total return) is a free float-adjusted market capitalization weighted index that is designed to measure the equity market performance of developed markets, excluding the U.S. and Canada. The Lipper Mixed-Asset Target Allocation Conservative Funds Index consists of funds that by portfolio practice maintain a mix of between 20% to 40% equity securities, with the remainder invested in bonds, cash and cash equivalents. Investors cannot invest directly in an index.
Class A Shares have a $500 minimum initial investment and carry a 4.50% sales charge.
Fund performance may reflect the waiver of the Fund’s fees and reimbursement of expenses for certain periods. Without these waivers and reimbursements, performance would have been lower. Also, performance shown in this section does not reflect the deduction of taxes that a shareholder would pay on Fund distributions or on gains resulting from redemptions of Fund shares.
Because Class C Shares automatically convert to Class A Shares after 8 years, the 10 year average annual total return shown above for Class C Shares reflects Class A Share's performance for the period after conversion.
The returns shown are based on net asset values calculated for shareholder transactions and may differ from the returns shown in the financial highlights, which reflect adjustments made to the net asset values in accordance with accounting principles generally accepted in the United States of America.
Source: Bloomberg Index Services Limited. BLOOMBERG® is a trademark and service mark of Bloomberg Finance L.P. and its affiliates (collectively
JPMorgan Investor Growth Fund
FUND COMMENTARYSIX MONTHS ENDED December 31, 2023 (Unaudited)
"Bloomberg"). Bloomberg or Bloomberg's licensors own all proprietary rights in the Bloomberg Indices. Bloomberg does not approve or endorse this material, or guarantee the accuracy or completeness of any information herein, or make any warranty, express or implied, as to the results to be obtained therefrom and, to the maximum extent allowed by law, shall have any liability or responsibility for injury or damages arising in connection therewith.
Frank Russell Company is the source and owner of the Russell Index data contained or reflected in this material and all trademarks and copyrights related thereto. Frank Russell Company is not responsible for the formatting or configuration of this material or for any inaccuracy in the adviser's presentation thereof.
Source: MSCI. The MSCI information may only be used for your internal use, may not be reproduced or redisseminated in any form and may not be used as a basis for or a component of any financial instruments or products or indices. None of
the MSCI information is intended to constitute investment advice or a recommendation to make (or refrain from making) any kind of investment decision and may not be relied on as such. Historical data and analysis should not be taken as an indication or guarantee of any future performance analysis, forecast, or prediction. The MSCI information is provided on an "as is" basis and the user of this information assumes the entire risk of any use made of this information. MSCI, each of its affiliates and each other person involved in or related to compiling, computing or creating any MSCI information (collectively, the "MSCI Parties") expressly disclaims all warranties (including, without limitation, any warranties of originality, accuracy, completeness, timeliness, non-infringement, merchantability and fitness for a particular purpose) with respect to this information. Without limiting any of the foregoing, in no event shall any MSCI Party have any liability for any direct, indirect, special, incidental, punitive, consequential (including, without limitation, lost profits) or any other damages. (www.msci.com)
JPMorgan Investor Growth & Income Fund
FUND COMMENTARYSIX MONTHS ENDED December 31, 2023 (Unaudited)
AVERAGE ANNUAL TOTAL RETURNS AS OF December 31, 2023
|
| |
| Sales Charge for Class A Shares is 4.50%. |
| Assumes a 1% CDSC (contingent deferred sales charge) for the 6 month and one year periods and 0% CDSC thereafter. |
TEN YEAR FUND PERFORMANCE (12/31/13 TO 12/31/23)
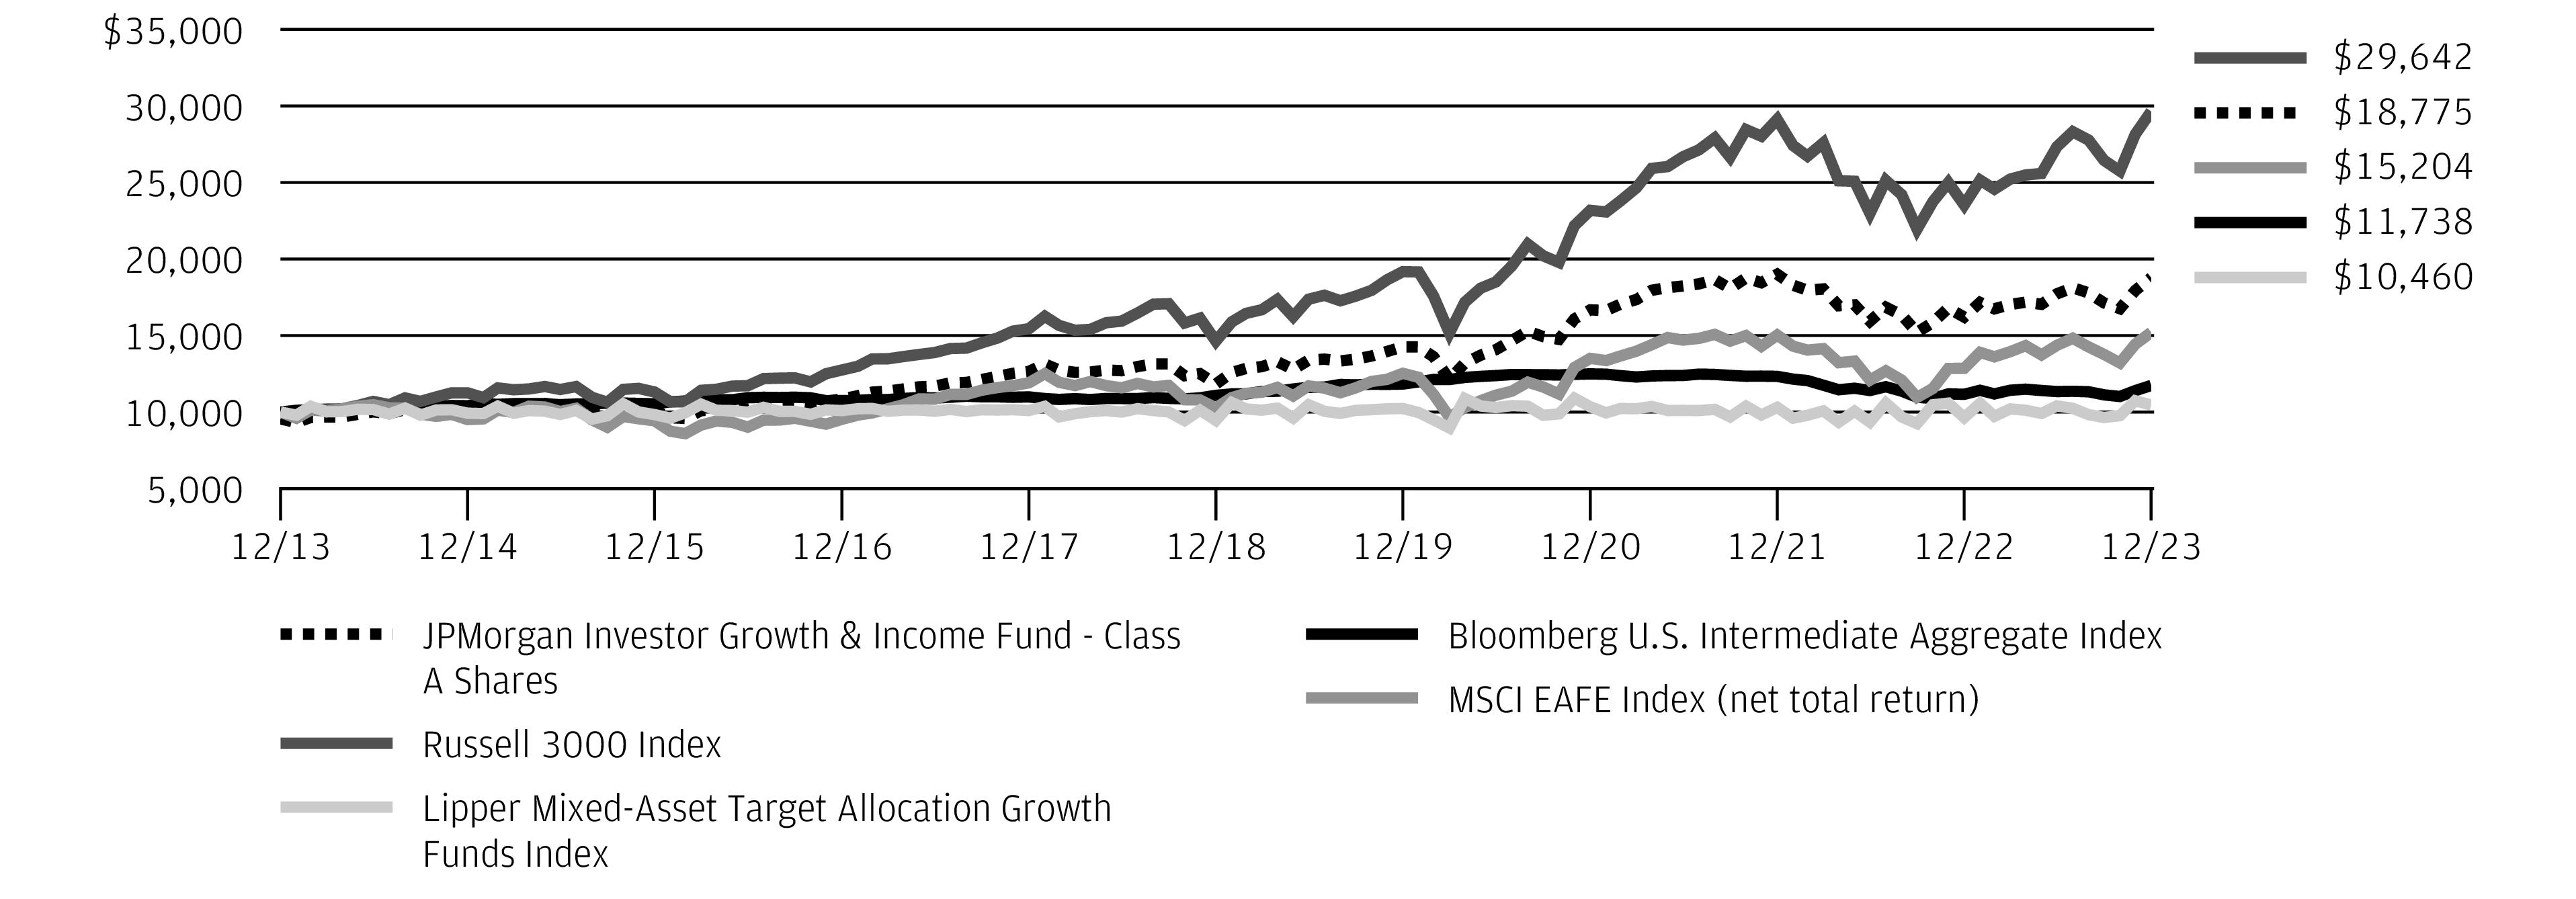
The performance quoted is past performance and is not a guarantee of future results. Mutual funds are subject to certain market risks. Investment returns and principal value of an investment will fluctuate so that an investor’s shares, when redeemed, may be worth more or less than their original cost. Current performance may be higher or lower than the performance data shown. Updated performance information is available by visiting www.jpmorganfunds.com or by calling 1-800-480-4111.
Returns for Class R6 Shares prior to its inception date are based on the performance of Class I Shares. The actual returns for Class R6 Shares would have been different than those shown because Class R6 Shares have different expenses than Class I Shares.
The graph illustrates comparative performance for $10,000 invested in Class A Shares of the JPMorgan Investor Growth & Income Fund, the Bloomberg U.S. Intermediate Aggregate Index, the Russell 3000 Index, the MSCI EAFE Index (net total return) and the Lipper Mixed-Asset Target Allocation Growth Funds Index from December 31, 2013 to December 31, 2023. The performance of the Fund assumes reinvestment of all dividends and capital gain distributions, if any, and includes a sales charge. The performance of the broadbased securities indices and the MSCI EAFE Index (net total return) does not reflect the deduction of expenses or a sales charge associated with a mutual fund and has been adjusted to reflect reinvestment of all dividends and capital gain distributions of the securities included in the benchmark, if applicable. The performance of the Lipper Mixed-Asset Target Allocation Growth Funds Index, which is not a broad-based securities index, includes expenses associated with a mutual fund, such as investment management fees. These expenses are not identical to the expenses incurred by the Fund. The
Bloomberg U.S. Intermediate Aggregate Index is an unmanaged index comprised of U.S. Government, mortgage, corporate, and asset-backed securities with maturities of one to 10 years. The Russell 3000 Index is an unmanaged index which measures the performance of the 3,000 largest U.S. companies based on total market capitalization, which represents approximately 98% of the investable U.S. equity market. The MSCI EAFE Index (net total return) is a free float-adjusted market capitalization weighted index that is designed to measure the equity market performance of developed markets, excluding the U.S. and Canada. The Lipper Mixed-Asset Target Allocation Growth Funds Index consists of funds that by portfolio practice maintain a mix of between 60% to 80% equity securities, with the remainder invested in bonds, cash and cash equivalents. Investors cannot invest directly in an index.
Class A Shares have a $500 minimum initial investment and carry a 4.50% sales charge.
Fund performance may reflect the waiver of the Fund’s fees and reimbursement of expenses for certain periods. Without these waivers and reimbursements, performance would have been lower. Also, performance shown in this section does not reflect the deduction of taxes that a shareholder would pay on Fund distributions or on gains resulting from redemptions of Fund shares. Because Class C Shares automatically convert to Class A Shares after 8 years, the 10 year average annual total return shown above for Class C Shares reflects Class A Share's performance for the period after conversion.
The returns shown are based on net asset values calculated for shareholder transactions and may differ from the returns shown in the financial highlights,
JPMorgan Investor Growth & Income Fund
FUND COMMENTARYSIX MONTHS ENDED December 31, 2023 (Unaudited)
which reflect adjustments made to the net asset values in accordance with accounting principles generally accepted in the United States of America.
Source: Bloomberg Index Services Limited. BLOOMBERG® is a trademark and service mark of Bloomberg Finance L.P. and its affiliates (collectively "Bloomberg"). Bloomberg or Bloomberg's licensors own all proprietary rights in the Bloomberg Indices. Bloomberg does not approve or endorse this material, or guarantee the accuracy or completeness of any information herein, or make any warranty, express or implied, as to the results to be obtained therefrom and, to the maximum extent allowed by law, shall have any liability or responsibility for injury or damages arising in connection therewith.
Frank Russell Company is the source and owner of the Russell Index data contained or reflected in this material and all trademarks and copyrights related thereto. Frank Russell Company is not responsible for the formatting or configuration of this material or for any inaccuracy in the adviser's presentation thereof.
Source: MSCI. The MSCI information may only be used for your internal use, may not be reproduced or redisseminated in any form and may not be used as a basis
for or a component of any financial instruments or products or indices. None of the MSCI information is intended to constitute investment advice or a recommendation to make (or refrain from making) any kind of investment decision and may not be relied on as such. Historical data and analysis should not be taken as an indication or guarantee of any future performance analysis, forecast, or prediction. The MSCI information is provided on an "as is" basis and the user of this information assumes the entire risk of any use made of this information. MSCI, each of its affiliates and each other person involved in or related to compiling, computing or creating any MSCI information (collectively, the "MSCI Parties") expressly disclaims all warranties (including, without limitation, any warranties of originality, accuracy, completeness, timeliness, non-infringement, merchantability and fitness for a particular purpose) with respect to this information. Without limiting any of the foregoing, in no event shall any MSCI Party have any liability for any direct, indirect, special, incidental, punitive, consequential (including, without limitation, lost profits) or any other damages. (www.msci.com)
JPMorgan Investor Balanced Fund
SCHEDULE OF PORTFOLIO INVESTMENTSAS OF December 31, 2023 (Unaudited)
| | |
Investment Companies — 86.9% |
Alternative Assets — 0.8% |
JPMorgan Unconstrained Debt Fund Class R6 Shares (a) | | |
|
JPMorgan Core Bond Fund Class R6 Shares (a) | | |
JPMorgan Core Plus Bond Fund Class R6 Shares (a) | | |
JPMorgan Emerging Markets Debt Fund Class R6 Shares (a) | | |
JPMorgan High Yield Fund Class R6 Shares (a) | | |
JPMorgan Income Fund Class R6 Shares (a) | | |
JPMorgan Short Duration Core Plus Fund Class R6 Shares (a) | | |
| | |
International Equity — 6.6% |
JPMorgan Emerging Markets Equity Fund Class R6 Shares (a) | | |
JPMorgan Emerging Markets Research Enhanced Equity Fund Class R6 Shares (a) | | |
JPMorgan Europe Dynamic Fund Class R6 Shares (a) | | |
JPMorgan International Equity Fund Class R6 Shares (a) | | |
Total International Equity | | |
|
JPMorgan Equity Income Fund Class R6 Shares (a) | | |
JPMorgan Large Cap Growth Fund Class R6 Shares (a) | | |
JPMorgan Large Cap Value Fund Class R6 Shares (a) | | |
JPMorgan Mid Cap Growth Fund Class R6 Shares * (a) | | |
JPMorgan Small Cap Equity Fund Class R6 Shares (a) | | |
JPMorgan Small Cap Value Fund Class R6 Shares (a) | | |
JPMorgan U.S. Equity Fund Class R6 Shares (a) | | |
JPMorgan U.S. GARP Equity Fund Class R6 Shares (a) | | |
JPMorgan U.S. Research Enhanced Equity Fund Class R6 Shares (a) | | |
JPMorgan Value Advantage Fund Class R6 Shares (a) | | |
| | |
Total Investment Companies
(Cost $3,840,810) | | |
| | |
Exchange-Traded Funds — 11.8% |
|
JPMorgan Limited Duration Bond ETF (a) | | |
International Equity — 5.5% |
JPMorgan International Research Enhanced Equity ETF (a) | | |
|
JPMorgan Market Expansion Enhanced Equity ETF (a) | | |
Total Exchange-Traded Funds
(Cost $504,598) | | |
Short-Term Investments — 1.4% |
Investment Companies — 1.4% |
JPMorgan U.S. Government Money Market Fund Class IM Shares, 5.30% (a) (b)
(Cost $72,564) | | |
Total Investments — 100.1%
(Cost $4,417,972) | | |
Liabilities in Excess of Other Assets — (0.1)% | | |
| | |
Percentages indicated are based on net assets. |
| Non-income producing security. |
| Investment in an affiliated fund, which is registered under the Investment Company Act of 1940, as amended, and is advised by J.P. Morgan Investment Management Inc. |
| The rate shown is the current yield as of December 31, 2023. |
Detailed information about investment portfolios of the underlying funds and ETFs can be found in shareholder reports filed with the Securities and Exchange Commission (SEC) by each such underlying fund semi-annually on Form N-CSR and in portfolio holdings filed quarterly on Form N-PORT, and are available for download from both the SEC’s as well as each respective underlying fund’s website. Detailed information about underlying J.P. Morgan Funds can also be found at www.jpmorganfunds.com or by calling 1-800-480-4111.
SEE NOTES TO FINANCIAL STATEMENTS.
| J.P. Morgan Investor Funds | |
JPMorgan Investor Conservative Growth Fund
SCHEDULE OF PORTFOLIO INVESTMENTSAS OF December 31, 2023 (Unaudited)
| | |
Investment Companies — 86.7% |
Alternative Assets — 1.0% |
JPMorgan Unconstrained Debt Fund Class R6 Shares (a) | | |
|
JPMorgan Core Bond Fund Class R6 Shares (a) | | |
JPMorgan Core Plus Bond Fund Class R6 Shares (a) | | |
JPMorgan Emerging Markets Debt Fund Class R6 Shares (a) | | |
JPMorgan Government Bond Fund Class R6 Shares (a) | | |
JPMorgan High Yield Fund Class R6 Shares (a) | | |
JPMorgan Income Fund Class R6 Shares (a) | | |
JPMorgan Short Duration Core Plus Fund Class R6 Shares (a) | | |
| | |
International Equity — 4.2% |
JPMorgan Emerging Markets Equity Fund Class R6 Shares (a) | | |
JPMorgan Emerging Markets Research Enhanced Equity Fund Class R6 Shares (a) | | |
JPMorgan Europe Dynamic Fund Class R6 Shares (a) | | |
JPMorgan International Equity Fund Class R6 Shares (a) | | |
Total International Equity | | |
|
JPMorgan Equity Income Fund Class R6 Shares (a) | | |
JPMorgan Large Cap Growth Fund Class R6 Shares (a) | | |
JPMorgan Large Cap Value Fund Class R6 Shares (a) | | |
JPMorgan Mid Cap Growth Fund Class R6 Shares * (a) | | |
JPMorgan Small Cap Equity Fund Class R6 Shares (a) | | |
JPMorgan Small Cap Value Fund Class R6 Shares (a) | | |
JPMorgan U.S. Equity Fund Class R6 Shares (a) | | |
JPMorgan U.S. GARP Equity Fund Class R6 Shares (a) | | |
JPMorgan U.S. Research Enhanced Equity Fund Class R6 Shares (a) | | |
JPMorgan Value Advantage Fund Class R6 Shares (a) | | |
| | |
Total Investment Companies
(Cost $3,269,786) | | |
| | |
Exchange-Traded Funds — 10.9% |
|
JPMorgan Limited Duration Bond ETF (a) | | |
International Equity — 3.9% |
JPMorgan International Research Enhanced Equity ETF (a) | | |
|
JPMorgan Market Expansion Enhanced Equity ETF (a) | | |
Total Exchange-Traded Funds
(Cost $374,749) | | |
Short-Term Investments — 2.4% |
Investment Companies — 2.4% |
JPMorgan U.S. Government Money Market Fund Class IM Shares, 5.30% (a) (b)
(Cost $93,437) | | |
Total Investments — 100.0%
(Cost $3,737,972) | | |
Liabilities in Excess of Other Assets — (0.0)% ^ | | |
| | |
Percentages indicated are based on net assets. |
| Amount rounds to less than 0.1% of net assets. |
| Non-income producing security. | |
| Investment in an affiliated fund, which is registered under the Investment Company Act of 1940, as amended, and is advised by J.P. Morgan Investment Management Inc. | |
| The rate shown is the current yield as of December 31, 2023. | |
Detailed information about investment portfolios of the underlying funds and ETFs can be found in shareholder reports filed with the Securities and Exchange Commission (SEC) by each such underlying fund semi-annually on Form N-CSR and in portfolio holdings filed quarterly on Form N-PORT, and are available for download from both the SEC’s as well as each respective underlying fund’s website. Detailed information about underlying J.P. Morgan Funds can also be found at www.jpmorganfunds.com or by calling 1-800-480-4111.
SEE NOTES TO FINANCIAL STATEMENTS.
| J.P. Morgan Investor Funds | |
JPMorgan Investor Growth Fund
SCHEDULE OF PORTFOLIO INVESTMENTSAS OF December 31, 2023 (Unaudited)
| | |
Investment Companies — 85.6% |
|
JPMorgan Core Bond Fund Class R6 Shares (a) | | |
JPMorgan Core Plus Bond Fund Class R6 Shares (a) | | |
JPMorgan Emerging Markets Debt Fund Class R6 Shares (a) | | |
JPMorgan High Yield Fund Class R6 Shares (a) | | |
JPMorgan Income Fund Class R6 Shares (a) | | |
| | |
International Equity — 15.0% |
JPMorgan Emerging Markets Equity Fund Class R6 Shares (a) | | |
JPMorgan Emerging Markets Research Enhanced Equity Fund Class R6 Shares (a) | | |
JPMorgan Europe Dynamic Fund Class R6 Shares (a) | | |
JPMorgan International Equity Fund Class R6 Shares (a) | | |
JPMorgan International Focus Fund Class R6 Shares (a) | | |
Total International Equity | | |
|
JPMorgan Equity Income Fund Class R6 Shares (a) | | |
JPMorgan Large Cap Growth Fund Class R6 Shares (a) | | |
JPMorgan Large Cap Value Fund Class R6 Shares (a) | | |
JPMorgan Mid Cap Growth Fund Class R6 Shares * (a) | | |
JPMorgan Small Cap Equity Fund Class R6 Shares (a) | | |
JPMorgan Small Cap Value Fund Class R6 Shares (a) | | |
JPMorgan U.S. Equity Fund Class R6 Shares (a) | | |
JPMorgan U.S. GARP Equity Fund Class R6 Shares (a) | | |
JPMorgan U.S. Research Enhanced Equity Fund Class R6 Shares (a) | | |
JPMorgan Value Advantage Fund Class R6 Shares (a) | | |
| | |
Total Investment Companies
(Cost $2,984,204) | | |
| | |
Exchange-Traded Funds — 12.9% |
International Equity — 7.9% |
JPMorgan International Research Enhanced Equity ETF (a) | | |
|
JPMorgan Market Expansion Enhanced Equity ETF (a) | | |
Total Exchange-Traded Funds
(Cost $528,684) | | |
Short-Term Investments — 1.6% |
Investment Companies — 1.6% |
JPMorgan U.S. Government Money Market Fund Class IM Shares, 5.30% (a) (b)
(Cost $77,903) | | |
Total Investments — 100.1%
(Cost $3,590,791) | | |
Liabilities in Excess of Other Assets — (0.1)% | | |
| | |
Percentages indicated are based on net assets. |
| Non-income producing security. |
| Investment in an affiliated fund, which is registered under the Investment Company Act of 1940, as amended, and is advised by J.P. Morgan Investment Management Inc. |
| The rate shown is the current yield as of December 31, 2023. |
Detailed information about investment portfolios of the underlying funds and ETFs can be found in shareholder reports filed with the Securities and Exchange Commission (SEC) by each such underlying fund semi-annually on Form N-CSR and in portfolio holdings filed quarterly on Form N-PORT, and are available for download from both the SEC’s as well as each respective underlying fund’s website. Detailed information about underlying J.P. Morgan Funds can also be found at www.jpmorganfunds.com or by calling 1-800-480-4111.
SEE NOTES TO FINANCIAL STATEMENTS.
| J.P. Morgan Investor Funds | |
JPMorgan Investor Growth & Income Fund
SCHEDULE OF PORTFOLIO INVESTMENTSAS OF December 31, 2023 (Unaudited)
| | |
Investment Companies — 87.8% |
|
JPMorgan Core Bond Fund Class R6 Shares (a) | | |
JPMorgan Core Plus Bond Fund Class R6 Shares (a) | | |
JPMorgan Emerging Markets Debt Fund Class R6 Shares (a) | | |
JPMorgan High Yield Fund Class R6 Shares (a) | | |
JPMorgan Income Fund Class R6 Shares (a) | | |
JPMorgan Short Duration Core Plus Fund Class R6 Shares (a) | | |
| | |
International Equity — 9.8% |
JPMorgan Emerging Markets Equity Fund Class R6 Shares (a) | | |
JPMorgan Emerging Markets Research Enhanced Equity Fund Class R6 Shares (a) | | |
JPMorgan Europe Dynamic Fund Class R6 Shares (a) | | |
JPMorgan International Equity Fund Class R6 Shares (a) | | |
JPMorgan International Focus Fund Class R6 Shares (a) | | |
Total International Equity | | |
|
JPMorgan Equity Income Fund Class R6 Shares (a) | | |
JPMorgan Large Cap Growth Fund Class R6 Shares (a) | | |
JPMorgan Large Cap Value Fund Class R6 Shares (a) | | |
JPMorgan Mid Cap Growth Fund Class R6 Shares * (a) | | |
JPMorgan Small Cap Equity Fund Class R6 Shares (a) | | |
JPMorgan Small Cap Value Fund Class R6 Shares (a) | | |
JPMorgan U.S. Equity Fund Class R6 Shares (a) | | |
JPMorgan U.S. GARP Equity Fund Class R6 Shares (a) | | |
JPMorgan U.S. Research Enhanced Equity Fund Class R6 Shares (a) | | |
JPMorgan Value Advantage Fund Class R6 Shares (a) | | |
| | |
Total Investment Companies
(Cost $2,930,282) | | |
| | |
Exchange-Traded Funds — 10.7% |
|
JPMorgan Limited Duration Bond ETF (a) | | |
International Equity — 5.7% |
JPMorgan International Research Enhanced Equity ETF (a) | | |
|
JPMorgan Market Expansion Enhanced Equity ETF (a) | | |
Total Exchange-Traded Funds
(Cost $376,179) | | |
Short-Term Investments — 1.6% |
Investment Companies — 1.6% |
JPMorgan U.S. Government Money Market Fund Class IM Shares, 5.30% (a) (b)
(Cost $68,321) | | |
Total Investments — 100.1%
(Cost $3,374,782) | | |
Liabilities in Excess of Other Assets — (0.1)% | | |
| | |
Percentages indicated are based on net assets. |
| Non-income producing security. |
| Investment in an affiliated fund, which is registered under the Investment Company Act of 1940, as amended, and is advised by J.P. Morgan Investment Management Inc. |
| The rate shown is the current yield as of December 31, 2023. |
Detailed information about investment portfolios of the underlying funds and ETFs can be found in shareholder reports filed with the Securities and Exchange Commission (SEC) by each such underlying fund semi-annually on Form N-CSR and in portfolio holdings filed quarterly on Form N-PORT, and are available for download from both the SEC’s as well as each respective underlying fund’s website. Detailed information about underlying J.P. Morgan Funds can also be found at www.jpmorganfunds.com or by calling 1-800-480-4111.
SEE NOTES TO FINANCIAL STATEMENTS.
| J.P. Morgan Investor Funds | |
STATEMENTS OF ASSETS AND LIABILITIESAS OF December 31, 2023 (Unaudited)
(Amounts in thousands, except per share amounts)
| JPMorgan
Investor
Balanced Fund | JPMorgan
Investor
Conservative
Growth Fund | JPMorgan
Investor
Growth
Fund | |
| | | | |
Investments in affiliates, at value | | | | |
| | | | |
| | | | |
| | | | |
Dividends from affiliates | | | | |
| | | | |
| | | | |
| | | | |
| | | | |
Investment securities purchased | | | | |
| | | | |
| | | | |
| | | | |
| | | | |
| | | | |
Custodian and accounting fees | | | | |
Trustees’ and Chief Compliance Officer’s fees | | | | |
| | | | |
| | | | |
| | | | |
(a)
Amount rounds to less than one thousand.
SEE NOTES TO FINANCIAL STATEMENTS.
| J.P. Morgan Investor Funds | |
STATEMENTS OF ASSETS AND LIABILITIESAS OF December 31, 2023 (Unaudited) (continued)
(Amounts in thousands, except per share amounts)
| JPMorgan Investor Balanced Fund | JPMorgan Investor Conservative Growth Fund | JPMorgan Investor Growth Fund | |
| | | | |
| | | | |
Total distributable earnings (loss) | | | | |
| | | | |
| | | | |
| | | | |
| | | | |
| | | | |
| | | | |
| | | | |
Outstanding units of beneficial interest (shares)
($0.0001 par value; unlimited number of shares authorized): | | | | |
| | | | |
| | | | |
| | | | |
| | | | |
| | | | |
Class A — Redemption price per share | | | | |
Class C — Offering price per share (b) | | | | |
Class I — Offering and redemption price per share | | | | |
Class R6 — Offering and redemption price per share | | | | |
Class A maximum sales charge | | | | |
Class A maximum public offering price per share
[net asset value per share/(100% – maximum sales charge)] | | | | |
Cost of investments in affiliates | | | | |
(a)
Per share amounts may not recalculate due to rounding of net assets and/or shares outstanding.
(b)
Redemption price for Class C Shares varies based upon length of time the shares are held.
SEE NOTES TO FINANCIAL STATEMENTS.
| J.P. Morgan Investor Funds | |
STATEMENTS OF OPERATIONSFOR THE SIX MONTHS ENDED December 31, 2023 (Unaudited)
(Amounts in thousands)
| JPMorgan
Investor
Balanced Fund | JPMorgan
Investor
Conservative
Growth Fund | JPMorgan
Investor
Growth
Fund | |
| | | | |
Interest income from affiliates | | | | |
Dividend income from affiliates | | | | |
| | | | |
| | | | |
| | | | |
| | | | |
| | | | |
| | | | |
| | | | |
| | | | |
| | | | |
| | | | |
Custodian and accounting fees | | | | |
| | | | |
Trustees’ and Chief Compliance Officer’s fees | | | | |
Printing and mailing costs | | | | |
Registration and filing fees | | | | |
Transfer agency fees (See Note 2.E.) | | | | |
| | | | |
| | | | |
| | | | |
Less expense reimbursements | | | | |
| | | | |
Net investment income (loss) | | | | |
REALIZED/UNREALIZED GAINS (LOSSES): | | | | |
Net realized gain (loss) on transactions from investments in affiliates | | | | |
Distribution of capital gains received from investment company affiliates | | | | |
Change in net unrealized appreciation/depreciation on investments in affiliates | | | | |
Net realized/unrealized gains (losses) | | | | |
Change in net assets resulting from operations | | | | |
(a)
Amount rounds to less than one thousand.
SEE NOTES TO FINANCIAL STATEMENTS.
| J.P. Morgan Investor Funds | |
STATEMENTS OF CHANGES IN NET ASSETSFOR THE PERIODS INDICATED
(Amounts in thousands)
| JPMorgan Investor Balanced Fund | JPMorgan Investor Conservative
Growth Fund |
| Six Months Ended
December 31, 2023
(Unaudited) | | Six Months Ended
December 31, 2023
(Unaudited) | |
CHANGE IN NET ASSETS RESULTING FROM OPERATIONS: | | | | |
Net investment income (loss) | | | | |
Net realized gain (loss) on investments in affiliates | | | | |
Distributions of capital gains received from investment company affiliates | | | | |
Change in net unrealized appreciation/depreciation of investments in affiliates | | | | |
Change in net assets resulting from operations | | | | |
DISTRIBUTIONS TO SHAREHOLDERS: | | | | |
| | | | |
| | | | |
| | | | |
| | | | |
Total distributions to shareholders | | | | |
| | | | |
Change in net assets resulting from capital transactions | | | | |
| | | | |
| | | | |
| | | | |
| | | | |
SEE NOTES TO FINANCIAL STATEMENTS.
| J.P. Morgan Investor Funds | |
| JPMorgan Investor Growth Fund | JPMorgan Investor Growth &
Income Fund |
| Six Months Ended
December 31, 2023
(Unaudited) | | Six Months Ended
December 31, 2023
(Unaudited) | |
CHANGE IN NET ASSETS RESULTING FROM OPERATIONS: | | | | |
Net investment income (loss) | | | | |
Net realized gain (loss) on investments in affiliates | | | | |
Distributions of capital gains received from investment company affiliates | | | | |
Change in net unrealized appreciation/depreciation of investments in affiliates | | | | |
Change in net assets resulting from operations | | | | |
DISTRIBUTIONS TO SHAREHOLDERS: | | | | |
| | | | |
| | | | |
| | | | |
| | | | |
Total distributions to shareholders | | | | |
| | | | |
Change in net assets resulting from capital transactions | | | | |
| | | | |
| | | | |
| | | | |
| | | | |
SEE NOTES TO FINANCIAL STATEMENTS.
| J.P. Morgan Investor Funds | |
STATEMENTS OF CHANGES IN NET ASSETSFOR THE PERIODS INDICATED (continued)
(Amounts in thousands)
| JPMorgan Investor Balanced Fund | JPMorgan Investor Conservative
Growth Fund |
| Six Months Ended December 31, 2023
(Unaudited) | | Six Months Ended December 31, 2023
(Unaudited) | |
| | | | |
| | | | |
Proceeds from shares issued | | | | |
| | | | |
| | | | |
Change in net assets resulting from Class A capital transactions | | | | |
| | | | |
Proceeds from shares issued | | | | |
| | | | |
| | | | |
Change in net assets resulting from Class C capital transactions | | | | |
| | | | |
Proceeds from shares issued | | | | |
| | | | |
| | | | |
Change in net assets resulting from Class I capital transactions | | | | |
| | | | |
Proceeds from shares issued | | | | |
| | | | |
| | | | |
Change in net assets resulting from Class R6 capital transactions | | | | |
Total change in net assets resulting from capital transactions | | | | |
| | | | |
| | | | |
| | | | |
| | | | |
| | | | |
| | | | |
| | | | |
| | | | |
| | | | |
| | | | |
| | | | |
| | | | |
| | | | |
| | | | |
| | | | |
| | | | |
SEE NOTES TO FINANCIAL STATEMENTS.
| J.P. Morgan Investor Funds | |
| JPMorgan Investor Balanced Fund | JPMorgan Investor Conservative Growth Fund |
| Six Months Ended December 31, 2023 (Unaudited) | | Six Months Ended December 31, 2023 (Unaudited) | |
SHARE TRANSACTIONS: (continued) | | | | |
| | | | |
| | | | |
| | | | |
| | | | |
Change in Class R6 Shares | | | | |
SEE NOTES TO FINANCIAL STATEMENTS.
| J.P. Morgan Investor Funds | |
STATEMENTS OF CHANGES IN NET ASSETSFOR THE PERIODS INDICATED (continued)
(Amounts in thousands)
| JPMorgan Investor Growth Fund | JPMorgan Investor Growth &
Income Fund |
| Six Months Ended December 31, 2023
(Unaudited) | | Six Months Ended December 31, 2023
(Unaudited) | |
| | | | |
| | | | |
Proceeds from shares issued | | | | |
| | | | |
| | | | |
Change in net assets resulting from Class A capital transactions | | | | |
| | | | |
Proceeds from shares issued | | | | |
| | | | |
| | | | |
Change in net assets resulting from Class C capital transactions | | | | |
| | | | |
Proceeds from shares issued | | | | |
| | | | |
| | | | |
Change in net assets resulting from Class I capital transactions | | | | |
| | | | |
Proceeds from shares issued | | | | |
| | | | |
| | | | |
Change in net assets resulting from Class R6 capital transactions | | | | |
Total change in net assets resulting from capital transactions | | | | |
| | | | |
| | | | |
| | | | |
| | | | |
| | | | |
| | | | |
| | | | |
| | | | |
| | | | |
| | | | |
| | | | |
| | | | |
| | | | |
| | | | |
| | | | |
| | | | |
SEE NOTES TO FINANCIAL STATEMENTS.
| J.P. Morgan Investor Funds | |
| JPMorgan Investor Growth Fund | JPMorgan Investor Growth & Income Fund |
| Six Months Ended December 31, 2023 (Unaudited) | | Six Months Ended December 31, 2023 (Unaudited) | |
SHARE TRANSACTIONS: (continued) | | | | |
| | | | |
| | | | |
| | | | |
| | | | |
Change in Class R6 Shares | | | | |
SEE NOTES TO FINANCIAL STATEMENTS.
| J.P. Morgan Investor Funds | |
FINANCIAL HIGHLIGHTSFOR THE PERIODS INDICATED
| Per share operating performance |
| | | |
| Net asset
value,
beginning
of period | Net
investment
income
(loss)(b)(c) | Net realized
and unrealized
gains
(losses) on
investments | Total from
investment
operations | | | |
JPMorgan Investor Balanced Fund | | | | | | | |
| | | | | | | |
Six Months Ended December 31, 2023 (Unaudited) | | | | | | | |
| | | | | | | |
| | | | | | | |
| | | | | | | |
| | | | | | | |
| | | | | | | |
| | | | | | | |
Six Months Ended December 31, 2023 (Unaudited) | | | | | | | |
| | | | | | | |
| | | | | | | |
| | | | | | | |
| | | | | | | |
| | | | | | | |
| | | | | | | |
Six Months Ended December 31, 2023 (Unaudited) | | | | | | | |
| | | | | | | |
| | | | | | | |
| | | | | | | |
| | | | | | | |
| | | | | | | |
| | | | | | | |
Six Months Ended December 31, 2023 (Unaudited) | | | | | | | |
| | | | | | | |
| | | | | | | |
| | | | | | | |
| | | | | | | |
| | | | | | | |
|
| Annualized for periods less than one year, unless otherwise noted. |
| Net investment income (loss) is affected by the timing of distributions from Underlying Funds. |
| Calculated based upon average shares outstanding. |
| Not annualized for periods less than one year. |
| Includes adjustments in accordance with accounting principles generally accepted in the United States of America and as such, the net asset values for financial reporting purposes and the returns based upon those net asset values may differ from the net asset values and returns for shareholder transactions. |
| Includes interest expense, if applicable, each of which is less than 0.005% unless otherwise noted. |
| Does not include expenses of Underlying Funds. |
SEE NOTES TO FINANCIAL STATEMENTS.
| J.P. Morgan Investor Funds | |
| |
| | | Ratios to average net assets(a) |
Net asset
value,
end of
period | Total return
(excludes
sales charge)(d)(e) | Net assets,
end of
period
(000's) | | Net
investment
income
(loss) | Expenses without
waivers and reimbursements(g) | |
| | | | | | |
| | | | | | |
| | | | | | |
| | | | | | |
| | | | | | |
| | | | | | |
| | | | | | |
| | | | | | |
| | | | | | |
| | | | | | |
| | | | | | |
| | | | | | |
| | | | | | |
| | | | | | |
| | | | | | |
| | | | | | |
| | | | | | |
| | | | | | |
| | | | | | |
| | | | | | |
| | | | | | |
| | | | | | |
| | | | | | |
| | | | | | |
| | | | | | |
| | | | | | |
| | | | | | |
| | | | | | |
| | | | | | |
SEE NOTES TO FINANCIAL STATEMENTS.
| J.P. Morgan Investor Funds | |
FINANCIAL HIGHLIGHTSFOR THE PERIODS INDICATED
| Per share operating performance |
| | | |
| Net asset
value,
beginning
of period | Net
investment
income
(loss)(b)(c) | Net realized
and unrealized
gains
(losses) on
investments | Total from
investment
operations | | | |
JPMorgan Investor Conservative Growth Fund | | | | | | | |
| | | | | | | |
Six Months Ended December 31, 2023 (Unaudited) | | | | | | | |
| | | | | | | |
| | | | | | | |
| | | | | | | |
| | | | | | | |
| | | | | | | |
| | | | | | | |
Six Months Ended December 31, 2023 (Unaudited) | | | | | | | |
| | | | | | | |
| | | | | | | |
| | | | | | | |
| | | | | | | |
| | | | | | | |
| | | | | | | |
Six Months Ended December 31, 2023 (Unaudited) | | | | | | | |
| | | | | | | |
| | | | | | | |
| | | | | | | |
| | | | | | | |
| | | | | | | |
| | | | | | | |
Six Months Ended December 31, 2023 (Unaudited) | | | | | | | |
| | | | | | | |
| | | | | | | |
| | | | | | | |
| | | | | | | |
| | | | | | | |
|
| Annualized for periods less than one year, unless otherwise noted. |
| Net investment income (loss) is affected by the timing of distributions from Underlying Funds. |
| Calculated based upon average shares outstanding. |
| Not annualized for periods less than one year. |
| Includes adjustments in accordance with accounting principles generally accepted in the United States of America and as such, the net asset values for financial reporting purposes and the returns based upon those net asset values may differ from the net asset values and returns for shareholder transactions. |
| Includes interest expense, if applicable, each of which is less than 0.005% unless otherwise noted. |
| Does not include expenses of Underlying Funds. |
SEE NOTES TO FINANCIAL STATEMENTS.
| J.P. Morgan Investor Funds | |
| |
| | | Ratios to average net assets(a) |
Net asset
value,
end of
period | Total return
(excludes
sales charge)(d)(e) | Net assets,
end of
period
(000's) | | Net
investment
income
(loss) | Expenses without
waivers and reimbursements(g) | |
| | | | | | |
| | | | | | |
| | | | | | |
| | | | | | |
| | | | | | |
| | | | | | |
| | | | | | |
| | | | | | |
| | | | | | |
| | | | | | |
| | | | | | |
| | | | | | |
| | | | | | |
| | | | | | |
| | | | | | |
| | | | | | |
| | | | | | |
| | | | | | |
| | | | | | |
| | | | | | |
| | | | | | |
| | | | | | |
| | | | | | |
| | | | | | |
| | | | | | |
| | | | | | |
| | | | | | |
| | | | | | |
| | | | | | |
SEE NOTES TO FINANCIAL STATEMENTS.
| J.P. Morgan Investor Funds | |
FINANCIAL HIGHLIGHTSFOR THE PERIODS INDICATED
| Per share operating performance |
| | | |
| Net asset
value,
beginning
of period | Net
investment
income
(loss)(b)(c) | Net realized
and unrealized
gains
(losses) on
investments | Total from
investment
operations | | | |
JPMorgan Investor Growth Fund | | | | | | | |
| | | | | | | |
Six Months Ended December 31, 2023 (Unaudited) | | | | | | | |
| | | | | | | |
| | | | | | | |
| | | | | | | |
| | | | | | | |
| | | | | | | |
| | | | | | | |
Six Months Ended December 31, 2023 (Unaudited) | | | | | | | |
| | | | | | | |
| | | | | | | |
| | | | | | | |
| | | | | | | |
| | | | | | | |
| | | | | | | |
Six Months Ended December 31, 2023 (Unaudited) | | | | | | | |
| | | | | | | |
| | | | | | | |
| | | | | | | |
| | | | | | | |
| | | | | | | |
| | | | | | | |
Six Months Ended December 31, 2023 (Unaudited) | | | | | | | |
| | | | | | | |
| | | | | | | |
| | | | | | | |
| | | | | | | |
| | | | | | | |
|
| Annualized for periods less than one year, unless otherwise noted. |
| Net investment income (loss) is affected by the timing of distributions from Underlying Funds. |
| Calculated based upon average shares outstanding. |
| Not annualized for periods less than one year. |
| Includes adjustments in accordance with accounting principles generally accepted in the United States of America and as such, the net asset values for financial reporting purposes and the returns based upon those net asset values may differ from the net asset values and returns for shareholder transactions. |
| Includes interest expense, if applicable, each of which is less than 0.005% unless otherwise noted. |
| Does not include expenses of Underlying Funds. |
SEE NOTES TO FINANCIAL STATEMENTS.
| J.P. Morgan Investor Funds | |
| |
| | | Ratios to average net assets(a) |
Net asset
value,
end of
period | Total return
(excludes
sales charge)(d)(e) | Net assets,
end of
period
(000's) | | Net
investment
income
(loss) | Expenses without
waivers and reimbursements(g) | |
| | | | | | |
| | | | | | |
| | | | | | |
| | | | | | |
| | | | | | |
| | | | | | |
| | | | | | |
| | | | | | |
| | | | | | |
| | | | | | |
| | | | | | |
| | | | | | |
| | | | | | |
| | | | | | |
| | | | | | |
| | | | | | |
| | | | | | |
| | | | | | |
| | | | | | |
| | | | | | |
| | | | | | |
| | | | | | |
| | | | | | |
| | | | | | |
| | | | | | |
| | | | | | |
| | | | | | |
| | | | | | |
| | | | | | |
SEE NOTES TO FINANCIAL STATEMENTS.
| J.P. Morgan Investor Funds | |
FINANCIAL HIGHLIGHTSFOR THE PERIODS INDICATED
| Per share operating performance |
| | | |
| Net asset
value,
beginning
of period | Net
investment
income
(loss)(b)(c) | Net realized
and unrealized
gains
(losses) on
investments | Total from
investment
operations | | | |
JPMorgan Investor Growth & Income Fund | | | | | | | |
| | | | | | | |
Six Months Ended December 31, 2023 (Unaudited) | | | | | | | |
| | | | | | | |
| | | | | | | |
| | | | | | | |
| | | | | | | |
| | | | | | | |
| | | | | | | |
Six Months Ended December 31, 2023 (Unaudited) | | | | | | | |
| | | | | | | |
| | | | | | | |
| | | | | | | |
| | | | | | | |
| | | | | | | |
| | | | | | | |
Six Months Ended December 31, 2023 (Unaudited) | | | | | | | |
| | | | | | | |
| | | | | | | |
| | | | | | | |
| | | | | | | |
| | | | | | | |
| | | | | | | |
Six Months Ended December 31, 2023 (Unaudited) | | | | | | | |
| | | | | | | |
| | | | | | | |
| | | | | | | |
| | | | | | | |
| | | | | | | |
|
| Annualized for periods less than one year, unless otherwise noted. |
| Net investment income (loss) is affected by the timing of distributions from Underlying Funds. |
| Calculated based upon average shares outstanding. |
| Not annualized for periods less than one year. |
| Includes adjustments in accordance with accounting principles generally accepted in the United States of America and as such, the net asset values for financial reporting purposes and the returns based upon those net asset values may differ from the net asset values and returns for shareholder transactions. |
| Includes interest expense, if applicable, each of which is less than 0.005% unless otherwise noted. |
| Does not include expenses of Underlying Funds. |
SEE NOTES TO FINANCIAL STATEMENTS.
| J.P. Morgan Investor Funds | |
| |
| | | Ratios to average net assets(a) |
Net asset
value,
end of
period | Total return
(excludes
sales charge)(d)(e) | Net assets,
end of
period
(000's) | | Net
investment
income
(loss) | Expenses without
waivers and reimbursements(g) | |
| | | | | | |
| | | | | | |
| | | | | | |
| | | | | | |
| | | | | | |
| | | | | | |
| | | | | | |
| | | | | | |
| | | | | | |
| | | | | | |
| | | | | | |
| | | | | | |
| | | | | | |
| | | | | | |
| | | | | | |
| | | | | | |
| | | | | | |
| | | | | | |
| | | | | | |
| | | | | | |
| | | | | | |
| | | | | | |
| | | | | | |
| | | | | | |
| | | | | | |
| | | | | | |
| | | | | | |
| | | | | | |
| | | | | | |
SEE NOTES TO FINANCIAL STATEMENTS.
| J.P. Morgan Investor Funds | |
NOTES TO FINANCIAL STATEMENTSAS OF December 31, 2023 (Unaudited)
(Dollar values in thousands)
1. Organization
JPMorgan Trust II (the “Trust”) was formed on November 12, 2004, as a Delaware statutory trust, pursuant to a Declaration of Trust dated November 5, 2004 and is registered under the Investment Company Act of 1940, as amended (the “1940 Act”), as an open-end management investment company.
The following are 4 separate funds of the Trust (each, a "Fund" and collectively, the "Funds") covered by this report:
| | Diversification Classification |
JPMorgan Investor Balanced Fund | Class A, Class C, Class I and Class R6 | |
JPMorgan Investor Conservative Growth Fund | Class A, Class C, Class I and Class R6 | |
JPMorgan Investor Growth Fund | Class A, Class C, Class I and Class R6 | |
JPMorgan Investor Growth & Income Fund | Class A, Class C, Class I and Class R6 | |
The investment objective of JPMorgan Investor Balanced Fund (“Investor Balanced Fund”) is to seek high total return consistent with the preservation of capital by investing primarily in a diversified group of mutual funds within the same group of investment companies that invest primarily in equity and fixed income securities.
The investment objective of JPMorgan Investor Conservative Growth Fund (“Investor Conservative Growth Fund”) is to seek income and capital appreciation by investing primarily in a diversified group of mutual funds within the same group of investment companies that invest primarily in fixed income and equity securities.
The investment objective of JPMorgan Investor Growth Fund (“Investor Growth Fund”) is to seek long-term capital appreciation by investing primarily in a diversified group of mutual funds within the same group of investment companies that invest primarily in equity securities.
The investment objective of JPMorgan Investor Growth & Income Fund (“Investor Growth & Income Fund”) is to seek long-term capital appreciation and growth of income by investing primarily in a diversified group of mutual funds within the same group of investment companies that invest primarily in equity securities.
Class A Shares generally provide for a front-end sales charge while Class C Shares provide for a contingent deferred sales charge ("CDSC"). No sales charges are assessed with respect to Class I and Class R6 shares. Certain Class A Shares, for which front-end sales charges have been waived, may be subject to a CDSC as described in the Funds' prospectus. Class C Shares automatically convert to Class A Shares after eight years. All classes of shares have equal rights as to earnings, assets and voting privileges, except that each class may bear different transfer agency, distribution and service fees and each class has exclusive voting rights with respect to its distribution plan and shareholder servicing agreements.
J.P. Morgan Investment Management Inc. (“JPMIM”), an indirect, wholly-owned subsidiary of JPMorgan Chase & Co. (“JPMorgan”), acts as adviser (the “Adviser”) and administrator (the “Administrator”) to the Funds.
2. Significant Accounting Policies
The following is a summary of significant accounting policies followed by the Funds in the preparation of their financial statements. The Funds are investment companies and, accordingly, follow the investment company accounting and reporting guidance of the Financial Accounting Standards Board (“FASB”) Accounting Standards Codification Topic 946 — Investment Companies, which is part of U.S. generally accepted accounting principles (“GAAP”). The preparation of financial statements in conformity with GAAP requires management to make estimates and assumptions that affect (i) the reported amounts of assets and liabilities, (ii) disclosure of contingent assets and liabilities at the date of the financial statements, and (iii) the reported amounts of increases and decreases in net assets from operations during the reporting period. Actual results could differ from those estimates.
A. Valuation of Investments — Investments are valued in accordance with GAAP and the Funds' valuation policies set forth by, and under the supervision and responsibility of, the Board of Trustees of the Trust (the "Board"), which established the following approach to valuation, as described more fully below: (i) investments for which market quotations are readily available shall be valued at their market value and (ii) all other investments for which market quotations are not readily available shall be valued at their fair value as determined in good faith by the Board.
Under Section 2(a)(41) of the 1940 Act, the Board is required to determine fair value for securities that do not have readily available market quotations. Under SEC Rule 2a-5 (Good Faith Determinations of Fair Value), the Board may designate the performance of these fair valuation determinations to a valuation designee. The Board has designated the Adviser as the “Valuation Designee” to perform fair valuation determinations for the Funds on behalf of the Board subject to appropriate oversight by the Board. The Adviser, as Valuation Designee, leverages the J.P. Morgan Asset Management Americas Valuation Committee (“AVC”) to help oversee and carry out the policies for the valuation of investments held in the Funds. The Adviser, as Valuation Designee, remains responsible for the valuation determinations.
| J.P. Morgan Investor Funds | |
This oversight by the AVC includes monitoring the appropriateness of fair values based on results of ongoing valuation oversight including, but not limited to, consideration of macro or security specific events, market events, and pricing vendor and broker due diligence. The Administrator is responsible for discussing and assessing the potential impacts to the fair values on an ongoing basis, and, at least on a quarterly basis, with the AVC and the Board.
Investments in open-end investment companies, excluding exchange-traded funds (“ETFs”) (“Underlying Funds”), are valued at each Underlying Fund’s net asset value ("NAV") per share as of the report date.
Valuations reflected in this report are as of the report date. As a result, changes in valuation due to market events and/or issuer-related events after the report date and prior to issuance of the report are not reflected herein.
The various inputs that are used in determining the valuation of the Funds' investments are summarized into the three broad levels listed below.
•
Level 1 — Unadjusted inputs using quoted prices in active markets for identical investments.
•
Level 2 — Other significant observable inputs including, but not limited to, quoted prices for similar investments, inputs other than quoted prices that are observable for investments (such as interest rates, prepayment speeds, credit risk, etc.) or other market corroborated inputs.
•
Level 3 — Significant inputs based on the best information available in the circumstances, to the extent observable inputs are not available (including the Funds' assumptions in determining the fair value of investments).
A financial instrument’s level within the fair value hierarchy is based on the lowest level of any input, both individually and in the aggregate, that is significant to the fair value measurement. The inputs or methodology used for valuing instruments are not necessarily an indication of the risk associated with investing in those instruments.
The following tables represent each valuation input as presented on the Schedules of Portfolio Investments ("SOIs"):
| | | | |
| | Level 2
Other significant
observable inputs | Level 3
Significant
unobservable inputs | |
Total Investments in Securities (a) | | | | |
|
| Please refer to the SOI for specifics of portfolio holdings. |
Investor Conservative Growth Fund | | | | |
| | Level 2
Other significant
observable inputs | Level 3
Significant
unobservable inputs | |
Total Investments in Securities (a) | | | | |
|
| Please refer to the SOI for specifics of portfolio holdings. |
| | | | |
| | Level 2
Other significant
observable inputs | Level 3
Significant
unobservable inputs | |
Total Investments in Securities (a) | | | | |
|
| Please refer to the SOI for specifics of portfolio holdings. |
Investor Growth & Income Fund | | | | |
| | Level 2
Other significant
observable inputs | Level 3
Significant
unobservable inputs | |
Total Investments in Securities (a) | | | | |
|
| Please refer to the SOI for specifics of portfolio holdings. |
| J.P. Morgan Investor Funds | |
NOTES TO FINANCIAL STATEMENTSAS OF December 31, 2023 (Unaudited) (continued)
(Dollar values in thousands)
B. Restricted Securities — Certain securities held by the Funds may be subject to legal or contractual restrictions on resale. Restricted securities generally are resold in transactions exempt from registration under the Securities Act of 1933, as amended (the “Securities Act”). Disposal of these securities may involve time-consuming negotiations and expense. Prompt sale at the current valuation may be difficult and could adversely affect the NAVs of the Funds.
As of December 31, 2023, the Funds had no investments in restricted securities including securities sold to the Funds under Rule 144A and/or Regulation S under the Securities Act.
C. Investment Transactions with Affiliates — The Funds invested in Underlying Funds and ETFs advised by the Adviser. An issuer which is under common control with a Fund may be considered an affiliate. For the purposes of the financial statements, the Funds assume the issuers listed in the tables below to be affiliated issuers. The Underlying Funds’ and ETFs' distributions may be reinvested into such Underlying Funds and ETFs. Reinvestment amounts are included in the purchases at cost amounts in the tables below.
|
For the six months ended December 31, 2023 |
| | | | | Change in
Unrealized
Appreciation/
(Depreciation) | | Shares at
December 31,
2023 | | Capital Gain
Distributions |
JPMorgan Core Bond Fund Class R6 Shares (a) | | | | | | | | | |
JPMorgan Core Plus Bond Fund Class R6 Shares (a) | | | | | | | | | |
JPMorgan Emerging Markets Debt Fund Class R6 Shares (a) | | | | | | | | | |
JPMorgan Emerging Markets Equity Fund Class R6 Shares (a) | | | | | | | | | |
JPMorgan Emerging Markets Research Enhanced Equity Fund Class R6 Shares (a) | | | | | | | | | |
JPMorgan Equity Income Fund Class R6 Shares (a) | | | | | | | | | |
JPMorgan Europe Dynamic Fund Class R6 Shares (a) | | | | | | | | | |
JPMorgan High Yield Fund Class R6 Shares (a) | | | | | | | | | |
JPMorgan Income Fund Class R6 Shares (a) | | | | | | | | | |
JPMorgan International Equity Fund Class R6 Shares (a) | | | | | | | | | |
JPMorgan International Research Enhanced Equity ETF (a) | | | | | | | | | |
JPMorgan Large Cap Growth Fund Class R6 Shares (a) | | | | | | | | | |
JPMorgan Large Cap Value Fund Class R6 Shares (a) | | | | | | | | | |
JPMorgan Limited Duration Bond ETF (a) | | | | | | | | | |
JPMorgan Limited Duration Bond Fund Class R6 Shares (a) | | | | | | | | | |
JPMorgan Market Expansion Enhanced Equity ETF (a) | | | | | | | | | |
JPMorgan Mid Cap Growth Fund Class R6 Shares (a) * | | | | | | | | | |
JPMorgan Realty Income ETF (a) | | | | | | | | | |
JPMorgan Short Duration Core Plus Fund Class R6 Shares (a) | | | | | | | | | |
JPMorgan Small Cap Equity Fund Class R6 Shares (a) | | | | | | | | | |
JPMorgan Small Cap Value Fund Class R6 Shares (a) | | | | | | | | | |
JPMorgan U.S. Equity Fund Class R6 Shares (a) | | | | | | | | | |
| J.P. Morgan Investor Funds | |
Investor Balanced Fund (continued) |
For the six months ended December 31, 2023 |
| | | | | Change in Unrealized Appreciation/ (Depreciation) | | Shares at December 31, 2023 | | Capital Gain Distributions |
JPMorgan U.S. GARP Equity Fund Class R6 Shares (a) | | | | | | | | | |
JPMorgan U.S. Government Money Market Fund Class IM Shares, 5.30% (a) (b) | | | | | | | | | |
JPMorgan U.S. Research Enhanced Equity Fund Class R6 Shares (a) | | | | | | | | | |
JPMorgan Unconstrained Debt Fund Class R6 Shares (a) | | | | | | | | | |
JPMorgan Value Advantage Fund Class R6 Shares (a) | | | | | | | | | |
| | | | | | | | | |
|
| Investment in an affiliated fund, which is registered under the Investment Company Act of 1940, as amended, and is advised by J.P. Morgan Investment Management Inc. |
| The rate shown is the current yield as of December 31, 2023. |
| Non-income producing security. |
Investor Conservative Growth Fund |
For the six months ended December 31, 2023 |
| | | | | Change in
Unrealized
Appreciation/
(Depreciation) | | Shares at
December 31,
2023 | | Capital Gain
Distributions |
JPMorgan Core Bond Fund Class R6 Shares (a) | | | | | | | | | |
JPMorgan Core Plus Bond Fund Class R6 Shares (a) | | | | | | | | | |
JPMorgan Emerging Markets Debt Fund Class R6 Shares (a) | | | | | | | | | |
JPMorgan Emerging Markets Equity Fund Class R6 Shares (a) | | | | | | | | | |
JPMorgan Emerging Markets Research Enhanced Equity Fund Class R6 Shares (a) | | | | | | | | | |
JPMorgan Equity Income Fund Class R6 Shares (a) | | | | | | | | | |
JPMorgan Europe Dynamic Fund Class R6 Shares (a) | | | | | | | | | |
JPMorgan Government Bond Fund Class R6 Shares (a) | | | | | | | | | |
JPMorgan High Yield Fund Class R6 Shares (a) | | | | | | | | | |
JPMorgan Income Fund Class R6 Shares (a) | | | | | | | | | |
JPMorgan International Equity Fund Class R6 Shares (a) | | | | | | | | | |
JPMorgan International Research Enhanced Equity ETF (a) | | | | | | | | | |
JPMorgan Large Cap Growth Fund Class R6 Shares (a) | | | | | | | | | |
JPMorgan Large Cap Value Fund Class R6 Shares (a) | | | | | | | | | |
JPMorgan Limited Duration Bond ETF (a) | | | | | | | | | |
| J.P. Morgan Investor Funds | |
NOTES TO FINANCIAL STATEMENTSAS OF December 31, 2023 (Unaudited) (continued)
(Dollar values in thousands)
Investor Conservative Growth Fund (continued) |
For the six months ended December 31, 2023 |
| | | | | Change in Unrealized Appreciation/ (Depreciation) | | Shares at December 31, 2023 | | Capital Gain Distributions |
JPMorgan Limited Duration Bond Fund Class R6 Shares (a) | | | | | | | | | |
JPMorgan Market Expansion Enhanced Equity ETF (a) | | | | | | | | | |
JPMorgan Mid Cap Growth Fund Class R6 Shares (a) * | | | | | | | | | |
JPMorgan Realty Income ETF (a) | | | | | | | | | |
JPMorgan Short Duration Core Plus Fund Class R6 Shares (a) | | | | | | | | | |
JPMorgan Small Cap Equity Fund Class R6 Shares (a) | | | | | | | | | |
JPMorgan Small Cap Value Fund Class R6 Shares (a) | | | | | | | | | |
JPMorgan U.S. Equity Fund Class R6 Shares (a) | | | | | | | | | |
JPMorgan U.S. GARP Equity Fund Class R6 Shares (a) | | | | | | | | | |
JPMorgan U.S. Government Money Market Fund Class IM Shares, 5.30% (a) (b) | | | | | | | | | |
JPMorgan U.S. Research Enhanced Equity Fund Class R6 Shares (a) | | | | | | | | | |
JPMorgan Unconstrained Debt Fund Class R6 Shares (a) | | | | | | | | | |
JPMorgan Value Advantage Fund Class R6 Shares (a) | | | | | | | | | |
| | | | | | | | | |
|
| Investment in an affiliated fund, which is registered under the Investment Company Act of 1940, as amended, and is advised by J.P. Morgan Investment Management Inc. |
| The rate shown is the current yield as of December 31, 2023. |
| Non-income producing security. |
|
For the six months ended December 31, 2023 |
| | | | | Change in
Unrealized
Appreciation/
(Depreciation) | | Shares at
December 31,
2023 | | Capital Gain
Distributions |
JPMorgan Core Bond Fund Class R6 Shares (a) | | | | | | | | | |
JPMorgan Core Plus Bond Fund Class R6 Shares (a) | | | | | | | | | |
JPMorgan Emerging Markets Debt Fund Class R6 Shares (a) | | | | | | | | | |
JPMorgan Emerging Markets Equity Fund Class R6 Shares (a) | | | | | | | | | |
JPMorgan Emerging Markets Research Enhanced Equity Fund Class R6 Shares (a) | | | | | | | | | |
JPMorgan Equity Income Fund Class R6 Shares (a) | | | | | | | | | |
JPMorgan Europe Dynamic Fund Class R6 Shares (a) | | | | | | | | | |
| J.P. Morgan Investor Funds | |
Investor Growth Fund (continued) |
For the six months ended December 31, 2023 |
| | | | | Change in Unrealized Appreciation/ (Depreciation) | | Shares at December 31, 2023 | | Capital Gain Distributions |
JPMorgan High Yield Fund Class R6 Shares (a) | | | | | | | | | |
JPMorgan Income Fund Class R6 Shares (a) | | | | | | | | | |
JPMorgan International Equity Fund Class R6 Shares (a) | | | | | | | | | |
JPMorgan International Focus Fund Class R6 Shares (a) | | | | | | | | | |
JPMorgan International Research Enhanced Equity ETF (a) | | | | | | | | | |
JPMorgan Large Cap Growth Fund Class R6 Shares (a) | | | | | | | | | |
JPMorgan Large Cap Value Fund Class R6 Shares (a) | | | | | | | | | |
JPMorgan Market Expansion Enhanced Equity ETF (a) | | | | | | | | | |
JPMorgan Mid Cap Growth Fund Class R6 Shares (a) * | | | | | | | | | |
JPMorgan Realty Income ETF (a) | | | | | | | | | |
JPMorgan Small Cap Equity Fund Class R6 Shares (a) | | | | | | | | | |
JPMorgan Small Cap Value Fund Class R6 Shares (a) | | | | | | | | | |
JPMorgan U.S. Equity Fund Class R6 Shares (a) | | | | | | | | | |
JPMorgan U.S. GARP Equity Fund Class R6 Shares (a) | | | | | | | | | |
JPMorgan U.S. Government Money Market Fund Class IM Shares, 5.30% (a) (b) | | | | | | | | | |
JPMorgan U.S. Research Enhanced Equity Fund Class R6 Shares (a) | | | | | | | | | |
JPMorgan Value Advantage Fund Class R6 Shares (a) | | | | | | | | | |
| | | | | | | | | |
|
| Investment in an affiliated fund, which is registered under the Investment Company Act of 1940, as amended, and is advised by J.P. Morgan Investment Management Inc. |
| The rate shown is the current yield as of December 31, 2023. |
| Non-income producing security. |
Investor Growth & Income Fund |
For the six months ended December 31, 2023 |
| | | | | Change in
Unrealized
Appreciation/
(Depreciation) | | Shares at
December 31,
2023 | | Capital Gain
Distributions |
JPMorgan Core Bond Fund Class R6 Shares (a) | | | | | | | | | |
JPMorgan Core Plus Bond Fund Class R6 Shares (a) | | | | | | | | | |
JPMorgan Emerging Markets Debt Fund Class R6 Shares (a) | | | | | | | | | |
| J.P. Morgan Investor Funds | |
NOTES TO FINANCIAL STATEMENTSAS OF December 31, 2023 (Unaudited) (continued)
(Dollar values in thousands)
Investor Growth & Income Fund (continued) |
For the six months ended December 31, 2023 |
| | | | | Change in Unrealized Appreciation/ (Depreciation) | | Shares at December 31, 2023 | | Capital Gain Distributions |
JPMorgan Emerging Markets Equity Fund Class R6 Shares (a) | | | | | | | | | |
JPMorgan Emerging Markets Research Enhanced Equity Fund Class R6 Shares (a) | | | | | | | | | |
JPMorgan Equity Income Fund Class R6 Shares (a) | | | | | | | | | |
JPMorgan Europe Dynamic Fund Class R6 Shares (a) | | | | | | | | | |
JPMorgan High Yield Fund Class R6 Shares (a) | | | | | | | | | |
JPMorgan Income Fund Class R6 Shares (a) | | | | | | | | | |
JPMorgan International Equity Fund Class R6 Shares (a) | | | | | | | | | |
JPMorgan International Focus Fund Class R6 Shares (a) | | | | | | | | | |
JPMorgan International Research Enhanced Equity ETF (a) | | | | | | | | | |
JPMorgan Large Cap Growth Fund Class R6 Shares (a) | | | | | | | | | |
JPMorgan Large Cap Value Fund Class R6 Shares (a) | | | | | | | | | |
JPMorgan Limited Duration Bond ETF (a) | | | | | | | | | |
JPMorgan Limited Duration Bond Fund Class R6 Shares (a) | | | | | | | | | |
JPMorgan Market Expansion Enhanced Equity ETF (a) | | | | | | | | | |
JPMorgan Mid Cap Growth Fund Class R6 Shares (a) * | | | | | | | | | |
JPMorgan Realty Income ETF (a) | | | | | | | | | |
JPMorgan Short Duration Core Plus Fund Class R6 Shares (a) | | | | | | | | | |
JPMorgan Small Cap Equity Fund Class R6 Shares (a) | | | | | | | | | |
JPMorgan Small Cap Value Fund Class R6 Shares (a) | | | | | | | | | |
JPMorgan U.S. Equity Fund Class R6 Shares (a) | | | | | | | | | |
JPMorgan U.S. GARP Equity Fund Class R6 Shares (a) | | | | | | | | | |
JPMorgan U.S. Government Money Market Fund Class IM Shares, 5.30% (a) (b) | | | | | | | | | |
JPMorgan U.S. Research Enhanced Equity Fund Class R6 Shares (a) | | | | | | | | | |
JPMorgan Value Advantage Fund Class R6 Shares (a) | | | | | | | | | |
| | | | | | | | | |
|
| Investment in an affiliated fund, which is registered under the Investment Company Act of 1940, as amended, and is advised by J.P. Morgan Investment Management Inc. |
| The rate shown is the current yield as of December 31, 2023. |
| Non-income producing security. |
| J.P. Morgan Investor Funds | |
D. Security Transactions and Investment Income— Investment transactions are accounted for on the trade date (the date the order to buy or sell is executed). Securities gains and losses are calculated on a specifically identified cost basis. Distributions of net investment income and realized capital gains from the Underlying Funds and ETFs are recorded on the ex-dividend date.
E. Allocation of Income and Expenses— Expenses directly attributable to a Fund are charged directly to that Fund, while the expenses attributable to more than one fund of the Trust are allocated among the applicable funds. Investment income, realized and unrealized gains and losses and expenses, other than class-specific expenses, are allocated daily to each class of shares based upon the proportion of net assets of each class at the beginning of each day.
Transfer agency fees are class-specific expenses. The amount of the transfer agency fees charged to each share class of the Funds for the six months ended December 31, 2023 are as follows:
| | | | | |
| | | | | |
| | | | | |
Investor Conservative Growth Fund | | | | | |
| | | | | |
| | | | | |
| | | | | |
Investor Growth & Income Fund | | | | | |
| | | | | |
|
| Amount rounds to less than one thousand. |
The Funds invested in Underlying Funds and ETFs and, as a result bear a portion of the expenses incurred by these Underlying Funds and ETFs. These expenses are not reflected in the expenses shown on the Statements of Operations and are not included in the ratios to average net assets shown in the Financial Highlights. Certain expenses of affiliated Underlying Funds and ETFs are waived as described in Note 3.F.
F. Federal Income Taxes — Each Fund is treated as a separate taxable entity for Federal income tax purposes. Each Fund's policy is to comply with the provisions of the Internal Revenue Code (the “Code”) applicable to regulated investment companies and to distribute to shareholders all of its distributable net investment income and net realized capital gains on investments. Accordingly, no provision for Federal income tax is necessary. Management has reviewed the Funds' tax positions for all open tax years and has determined that as of December 31, 2023, no liability for Federal income tax is required in the Funds' financial statements for net unrecognized tax benefits. However, management’s conclusions may be subject to future review based on changes in, or the interpretation of, the accounting standards or tax laws and regulations. Each Fund's Federal tax returns for the prior three fiscal years remain subject to examination by the Internal Revenue Service.
G. Distributions to Shareholders— Distributions from net investment income, if any, are generally declared and paid at least quarterly, except for Investor Conservative Growth Fund, for which distributions are generally declared and paid at least monthly. Distributions are declared separately for each class. No class has preferential dividend rights; differences in per share rates are due to differences in separate class expenses. Net realized capital gains, if any, are distributed by each Fund at least annually. The amount of distributions from net investment income and net realized capital gains is determined in accordance with Federal income tax regulations, which may differ from GAAP. To the extent these “book/tax” differences are permanent in nature (i.e., that they result from other than timing of recognition — “temporary differences”), such amounts are reclassified within the capital accounts based on their Federal tax basis treatment.
3. Fees and Other Transactions with Affiliates
A. Investment Advisory Fee— Pursuant to an Investment Advisory Agreement, the Adviser manages the investments of each Fund and for such services is paid a fee. The investment advisory fee is accrued daily and paid monthly at an annual rate of 0.05% of the Funds' average daily net assets.
The Adviser waived investment advisory fees and/or reimbursed expenses as outlined in Note 3.F.
B. Administration Fee — Pursuant to an Administration Agreement, the Administrator provides certain administration services to each Fund. The Administrator does not receive a fee for these services.
JPMorgan Chase Bank, N.A. ("JPMCB"), a wholly-owned subsidiary of JPMorgan, serves as the Funds' sub-administrator (the “Sub-administrator”). For its services as Sub-administrator, JPMCB receives a portion of the fees payable to the Administrator.
| J.P. Morgan Investor Funds | |
NOTES TO FINANCIAL STATEMENTSAS OF December 31, 2023 (Unaudited) (continued)
(Dollar values in thousands)
C. Distribution Fees — Pursuant to a Distribution Agreement, JPMorgan Distribution Services, Inc. (“JPMDS”), an indirect, wholly-owned subsidiary of JPMorgan, serves as each Fund's principal underwriter and promotes and arranges for the sale of each Fund's shares.
The Board has adopted a Distribution Plan (the “Distribution Plan”) for Class A and Class C Shares of the Funds, as applicable, pursuant to Rule 12b-1 under the 1940 Act. Class I and Class R6 Shares of the Funds do not charge a distribution fee. The Distribution Plan provides that each Fund shall pay, with respect to the applicable share classes, distribution fees, including payments to JPMDS, at annual rates of the average daily net assets as shown in the table below:
In addition, JPMDS is entitled to receive the front-end sales charges from purchases of Class A Shares and the CDSC from redemptions of Class C Shares and certain Class A Shares for which front-end sales charges have been waived. For the six months ended December 31, 2023, JPMDS retained the following:
| | |
| | |
Investor Conservative Growth Fund | | |
| | |
Investor Growth & Income Fund | | |
|
| Amount rounds to less than one thousand. |
D. Service Fees — The Trust, on behalf of the Funds, has entered into a Shareholder Servicing Agreement with JPMDS under which JPMDS provides certain support services to fund shareholders. For performing these services, JPMDS receives a fee with respect to all share classes, except Class R6 Shares which do not charge a service fee, that is accrued daily and paid monthly equal to a percentage of the average daily net assets as shown in the table below:
JPMDS has entered into shareholder services contracts with affiliated and unaffiliated financial intermediaries who provide shareholder services and other related services to their clients or customers who invest in the Funds. Pursuant to such contracts, JPMDS will pay all or a portion of such fees earned to financial intermediaries for performing such services.
JPMDS waived service fees as outlined in Note 3.F.
E. Custodian and Accounting Fees — JPMCB provides portfolio custody and accounting services to the Funds. For performing these services, the Funds pay JPMCB transaction and asset-based fees that vary according to the number of transactions and positions, plus out-of-pocket expenses. The amounts paid directly to JPMCB by the Funds for custody and accounting services are included in Custodian and accounting fees on the Statements of Operations.
Interest income earned on cash balances at the custodian, if any, is included in Interest income from affiliates on the Statements of Operations.
Interest expense paid to the custodian related to cash overdrafts, if any, is included in Interest expense to affiliates on the Statements of Operations.
F. Waivers and Reimbursements —The Adviser, Administrator and/or JPMDS have contractually agreed to waive fees and/or reimburse the Funds to the extent that total annual operating expenses (excluding acquired fund fees and expenses other than certain money market fund fees as described below, dividend and interest expenses related to short sales, interest, taxes, expenses related to litigation and potential litigation, expenses related to trustee elections and extraordinary expenses) exceed the percentages of the Funds' respective average daily net assets as shown in the table below:
| | | | |
JPMorgan Investor Balanced Fund | | | | |
JPMorgan Investor Conservative Growth Fund | | | | |
JPMorgan Investor Growth Fund | | | | |
JPMorgan Investor Growth & Income Fund | | | | |
The expense limitation agreements were in effect for the six months ended December 31, 2023 and the contractual expense limitation percentages in the table above are in place until at least October 31, 2024.
| J.P. Morgan Investor Funds | |
The Underlying Funds may impose separate advisory and service fees. To avoid charging a service fee at an effective rate above 0.25% for Class A, Class C and Class I Shares, JPMDS will waive service fees with respect to the Funds in an amount equal to the weighted average pro-rata amount of service fees charged by the Underlying Funds up to 0.25% for Class A, Class C and Class I Shares. These waivers may be in addition to any waivers required to meet the Funds’ contractual expense limitations, but will not exceed the Funds’ service fees.
For the six months ended December 31, 2023, the Funds' service providers waived fees and/or reimbursed expenses for each of the Funds as follows. None of these parties expect the Funds to repay any such waived fees and/or reimbursed expenses in future years.
| |
| | | |
| | | |
Investor Conservative Growth Fund | | | |
| | | |
Investor Growth & Income Fund | | | |
Additionally, the Funds may invest in one or more money market funds advised by the Adviser (affiliated money market funds). The Adviser, Administrator and/or JPMDS, as shareholder servicing agent, have contractually agreed to waive fees and/or reimburse expenses in an amount sufficient to offset the respective net fees each collects from the affiliated money market fund on the applicable Fund’s investment in such affiliated money market fund, except for investments of securities lending cash collateral. None of these parties expect the Funds to repay any such waived fees and/ or reimbursed expenses in future years.
The amounts of these waivers resulting from investments in these money market funds for the six months ended December 31, 2023 were as follows:
| |
| |
Investor Conservative Growth Fund | |
| |
Investor Growth & Income Fund | |
JPMIM voluntarily agreed to reimburse the Funds for the Trustee Fees paid to one of the interested Trustees. For the six months ended December 31, 2023 the amount of these reimbursements were as follows:
| |
| |
Investor Conservative Growth Fund | |
| |
Investor Growth & Income Fund | |
G. Other— Certain officers of the Trust are affiliated with the Adviser, the Administrator and JPMDS. Such officers, with the exception of the Chief Compliance Officer, receive no compensation from the Funds for serving in their respective roles.
The Board designated and appointed a Chief Compliance Officer to the Funds pursuant to Rule 38a-1 under the 1940 Act. Each Fund, along with affiliated funds, makes reimbursement payments, on a pro-rata basis, to the Administrator for a portion of the fees associated with the office of the Chief Compliance Officer. Such fees are included in Trustees’ and Chief Compliance Officer’s fees on the Statements of Operations.
The Trust adopted a Trustee Deferred Compensation Plan (the “Plan”) which allows the independent Trustees to defer the receipt of all or a portion of compensation related to performance of their duties as Trustees. The deferred fees are invested in various J.P. Morgan Funds until distribution in accordance with the Plan.
4. Investment Transactions
During the six months ended December 31, 2023, purchases and sales of investments (excluding short-term investments) were as follows:
| Purchases
(excluding
U.S. Government) | Sales
(excluding
U.S. Government) |
| | |
Investor Conservative Growth Fund | | |
| | |
| J.P. Morgan Investor Funds | |
NOTES TO FINANCIAL STATEMENTSAS OF December 31, 2023 (Unaudited) (continued)
(Dollar values in thousands)
| Purchases (excluding U.S. Government) | Sales (excluding U.S. Government) |
Investor Growth & Income Fund | | |
During the six months ended December 31, 2023, there were no purchases or sales of U.S. Government securities.
5. Federal Income Tax Matters
For Federal income tax purposes, the estimated cost and unrealized appreciation (depreciation) in value of investments held at December 31, 2023 were as follows:
| | Gross
Unrealized
Appreciation | Gross
Unrealized
Depreciation | Net Unrealized
Appreciation
(Depreciation) |
| | | | |
Investor Conservative Growth Fund | | | | |
| | | | |
Investor Growth & Income Fund | | | | |
At June 30, 2023, the Funds did not have any net capital loss carryforwards.
Net capital losses (gains) incurred after October 31 and within the taxable year are deemed to arise on the first business day of the Funds' next taxable year. For the year ended June 30, 2023, the following Funds deferred to July 1, 2023 the following net capital losses (gains) : of:
| Net Capital Losses (Gains) |
| |
Investor Conservative Growth Fund | |
| |
Investor Growth & Income Fund | |
6. Borrowings
The Funds rely upon an exemptive order granted by the SEC (the “Order”) permitting the establishment and operation of an Interfund Lending Facility (the “Facility”). The Facility allows the Funds to directly lend and borrow money to or from any other fund relying upon the Order at rates beneficial to both the borrowing and lending funds. Advances under the Facility are taken primarily for temporary or emergency purposes, including the meeting of redemption requests that otherwise might require the untimely disposition of securities, and are subject to each Fund's borrowing restrictions. The interfund loan rate is determined, as specified in the Order, by averaging the current repurchase agreement rate and the current bank loan rate. The Order was granted to the Trust and may be relied upon by the Funds because the Funds and the series of the Trust are all investment companies in the same “group of investment companies” (as defined in Section 12(d)(1)(G) of the 1940 Act).
The Funds had no borrowings outstanding from another fund, or loans outstanding to another fund, during the six months ended December 31, 2023.
The Trust and JPMCB have entered into a financing arrangement. Under this arrangement, JPMCB provides an unsecured, uncommitted credit facility in the aggregate amount of $100 million to certain of the J.P. Morgan Funds, including the Funds. Advances under the arrangement are taken primarily for temporary or emergency purposes, including the meeting of redemption requests that otherwise might require the untimely disposition of securities, and are subject to each Fund's borrowing restrictions. Interest on borrowings is payable at a rate determined by JPMCB at the time of borrowing. This agreement has been extended until October 29, 2024.
The Funds had no borrowings outstanding from the unsecured, uncommitted credit facility during the six months ended December 31, 2023.
The Trust, along with certain other trusts for J.P. Morgan Funds (“Borrowers”), have entered into a joint syndicated senior unsecured revolving credit facility totaling $1.5 billion (“Credit Facility”) with various lenders and The Bank of New York Mellon, as administrative agent for the lenders. This Credit Facility provides a source of funds to the Borrowers for temporary and emergency purposes, including the meeting of redemption requests that otherwise might require the untimely disposition of securities. Under the terms of the Credit Facility, a borrowing fund must have a minimum of $25 million in adjusted net asset value and not exceed certain adjusted net asset coverage ratios prior to and during the time in which any borrowings are outstanding. If a fund does not comply with the aforementioned requirements, the fund must remediate within three business days with
| J.P. Morgan Investor Funds | |
respect to the $25 million minimum adjusted net asset value or within one business day with respect to certain asset coverage ratios or the administrative agent at the request of, or with the consent of, the lenders may terminate the Credit Facility and declare any outstanding borrowings to be due and payable immediately.
Interest associated with any borrowing under the Credit Facility is charged to the borrowing fund at a rate of interest equal to 1.00% (the "Applicable Margin"), plus the greater on the day of the borrowing, of the federal funds effective rate, or the Adjusted Secured Overnight Financing Rate ("SOFR"). Effective August 8, 2023, the Credit Facility was amended and restated for a term of 364 days, unless extended.
The Funds did not utilize the Credit Facility during the six months ended December 31, 2023.
7. Risks, Concentrations and Indemnifications
In the normal course of business, the Funds enter into contracts that contain a variety of representations which provide general indemnifications. Each Fund's maximum exposure under these arrangements is unknown. The amount of exposure would depend on future claims that may be brought against each Fund. However, based on experience, the Funds expect the risk of loss to be remote.
As of December 31, 2023, the Funds had individual shareholder and/or omnibus accounts each owning more than 10% of the respective Fund's outstanding shares as follows:
| Number of
Individual Shareholder
and/or Affiliated
Omnibus Accounts | | Number of
Individual Shareholder
and/or Non-Affiliated
Omnibus Accounts | |
| | | | |
Investor Conservative Growth Fund | | | | |
| | | | |
Investor Growth & Income Fund | | | | |
Significant shareholder transactions by these shareholders may impact the Funds' performance and liquidity.
As of December 31, 2023, the Funds owned in the aggregate, shares representing more than 10% of the net assets of the following Underlying Funds:
| |
JPMorgan Market Expansion Enhanced Equity ETF | |
JPMorgan Europe Dynamic Fund | |
JPMorgan Limited Duration Bond ETF | |
JPMorgan U.S. GARP Equity Fund | |
JPMorgan Large Cap Value Fund | |
JPMorgan Emerging Markets Debt Fund | |
JPMorgan International Research Enhanced Equity ETF | |
JPMorgan Small Cap Value Fund | |
JPMorgan Emerging Markets Research Enhanced Equity Fund | |
JPMorgan International Focus Fund | |
JPMorgan U.S. Research Enhanced Equity Fund | |
Because of the Funds’ investments in Underlying Funds and ETFs, the Funds indirectly pay a portion of the expenses incurred by the Underlying Funds and ETFs. As a result, the cost of investing in the Funds may be higher than the cost of investing in a mutual fund that invests directly in individual securities and financial instruments. The Funds are also subject to certain risks related to the Underlying Funds’ and ETFs’ investments in securities and financial instruments such as fixed income securities, including high yield, asset-backed and mortgage-related securities, equity securities, foreign and emerging markets securities, commodities and real estate securities. These securities are subject to risks specific to their structure, sector or market.
The Funds invest in ETFs. ETFs are pooled investment vehicles whose ownership interests are purchased and sold on a securities exchange. ETFs may be structured as investment companies, depositary receipts or other pooled investment vehicles and may be passively or actively managed. Passively managed ETFs generally seek to track the performance of a particular market index, including broad-based market indices, as well as indices relating to particular sectors, markets, regions or industries. Actively managed ETFs do not seek to track the performance of a particular market index. The price movement of an index-based ETF may not track the underlying index and may result in a loss. In addition, ETFs may trade at a price below or above their NAV (also known as a discount or premium, respectively).
| J.P. Morgan Investor Funds | |
NOTES TO FINANCIAL STATEMENTSAS OF December 31, 2023 (Unaudited) (continued)
(Dollar values in thousands)
In addition, the Underlying Funds and ETFs may use derivative instruments in connection with their individual investment strategies including futures contracts, forward foreign currency exchange contracts, options, swaps and other derivatives, which are also subject to specific risks related to their structure, sector or market and may be riskier than investments in other types of securities.
Specific risks and concentrations present in the Underlying Funds and ETFs are disclosed within their individual financial statements and registration statements, as appropriate.
Derivatives may be riskier than other types of investments because they may be more sensitive to changes in economic and market conditions and could result in losses that significantly exceed the Funds’ original investment. Derivatives also expose the Funds to counterparty risk (the risk that the derivative counterparty will not fulfill its contractual obligations), including credit risk of the derivative counterparty. The possible lack of a liquid secondary market for derivatives and the resulting inability of the Funds to sell or otherwise close a derivatives position could expose the Funds to losses.
London Interbank Offered Rate ("LIBOR") was a leading floating rate benchmark used in loans, notes, derivatives and other instruments or investments. As a result of benchmark reforms, publication of most LIBOR settings has ceased. Some LIBOR settings continue to be published but only on a temporary, synthetic and non-representative basis. Regulated entities have generally ceased entering into new LIBOR contracts in connection with regulatory guidance or prohibitions. Public and private sector actors have worked to establish alternative reference rates to be used in place of LIBOR. There is no assurance that any such alternative reference rate will be similar to or produce the same value or economic equivalence as LIBOR or that it will have the same volume or liquidity as did LIBOR which may affect the value, volatility, liquidity or return on certain of the Funds' loans, notes, derivatives and other instruments or investments comprising some or all of the Funds' investments and result in costs incurred in connection with changing reference rates used for positions, closing out positions and entering into new trades. Certain of the Funds' investments may have transitioned from LIBOR or will transition from LIBOR in the future. The transition from LIBOR to alternative reference rates may result in operational issues for the Funds or their investments. No assurances can be given as to the impact of the LIBOR transition (and the timing of any such impact) on the Fund and its investments.
The Funds are subject to infectious disease epidemics/pandemics risk. For example, the outbreak of COVID-19 negatively affected economies, markets and individual companies throughout the world, including those in which the Funds invest. The effects of any future pandemic or other global event to business and market conditions may have a significant negative impact on the performance of a Fund's investments, increase a Fund's volatility, exacerbate other pre-existing political, social and economic risks to the Funds and negatively impact broad segments of businesses and populations. In addition, governments, their regulatory agencies, or self-regulatory organizations have taken or may take actions in response to a pandemic or other global event that affect the instruments in which the Funds invest, or the issuers of such instruments, in ways that could have a significant negative impact on a Fund’s investment performance. The ultimate impact of any pandemic or other global event and the extent to which the associated conditions and governmental responses impact a Fund will also depend on future developments, which are highly uncertain, difficult to accurately predict and subject to frequent changes.
| J.P. Morgan Investor Funds | |
SCHEDULE OF SHAREHOLDER EXPENSES(Unaudited)
Hypothetical $1,000 Investment
As a shareholder of the Funds, you incur two types of costs: (1) transaction costs, including sales charges (loads) on purchase payments and (2) ongoing costs, including investment advisory fees, administration fees, distribution fees and other Fund expenses. The examples below are intended to help you understand your ongoing costs (in dollars) of investing in the Funds (not including expenses of the Underlying Funds) and to compare these ongoing costs with the ongoing costs of investing in other mutual funds. The examples assume that you had a $1,000 investment in each Class at the beginning of the reporting period, July 1, 2023, and continued to hold your shares at the end of the reporting period, December 31, 2023.
Actual Expenses
For each Class of each Fund in the table below, the first line provides information about actual account values and actual expenses. You may use the information in this line, together with the amount you invested, to estimate the expenses that you paid over the period. Simply divide your account value by $1,000 (for example, an $8,600 account value divided by $1,000 = 8.6), then multiply the result by the number in the first line of each Class under the heading titled “Expenses Paid During the Period” to estimate the expenses you paid on your account during this period.
Hypothetical Example for Comparison Purposes
The second line of each Class in the table below provides information about hypothetical account values and hypothetical expenses based on the Class’ actual expense ratio and an assumed rate of return of 5% per year before expenses, which is not the Class’ actual return. The hypothetical account values and expenses may not be used to estimate the actual ending account balance or expenses you paid for the period. You may use this information to compare the ongoing costs of investing in the Class of the Funds and other funds. To do so, compare this 5% hypothetical example with the 5% hypothetical examples that appear in the shareholder reports of the other funds. Please note that the expenses shown in the table are meant to highlight your ongoing costs only and do not reflect any transaction costs, such as sales charges (loads) or redemption fees, and expenses of the Underlying Funds. Therefore, the second line for each Class in the table is useful in comparing ongoing costs only, and will not help you determine the relative total costs of owning different funds. In addition, if these transaction costs were included, your costs would have been higher. The examples also assume all dividends and distributions have been reinvested.
| Beginning
Account Value
July 1, 2023 | Ending
Account Value
December 31, 2023 | Expenses
Paid During
the Period* | |
JPMorgan Investor Balanced Fund | | | | |
| | | | |
| | | | |
| | | | |
| | | | |
| | | | |
| | | | |
| | | | |
| | | | |
| | | | |
| | | | |
| | | | |
| | | | |
JPMorgan Investor Conservative Growth Fund | | | | |
| | | | |
| | | | |
| | | | |
| | | | |
| | | | |
| | | | |
| | | | |
| | | | |
| | | | |
| | | | |
| | | | |
| | | | |
| J.P. Morgan Investor Funds | |
SCHEDULE OF SHAREHOLDER EXPENSES(Unaudited) (continued)
Hypothetical $1,000 Investment
| Beginning Account Value July 1, 2023 | Ending Account Value December 31, 2023 | Expenses Paid During the Period* | |
JPMorgan Investor Growth Fund | | | | |
| | | | |
| | | | |
| | | | |
| | | | |
| | | | |
| | | | |
| | | | |
| | | | |
| | | | |
| | | | |
| | | | |
| | | | |
JPMorgan Investor Growth & Income Fund | | | | |
| | | | |
| | | | |
| | | | |
| | | | |
| | | | |
| | | | |
| | | | |
| | | | |
| | | | |
| | | | |
| | | | |
| | | | |
|
| Expenses are equal to each Class’ respective annualized net expense ratio, multiplied by the average account value over the period, multiplied by 184/366 (to reflect the one-half year period). |
| J.P. Morgan Investor Funds | |
BOARD APPROVAL OF INVESTMENT ADVISORY AGREEMENTS(Unaudited)
The Board of Trustees (the “Board” or the “Trustees”) has established various standing committees composed of Trustees with diverse backgrounds, to which the Board has assigned specific subject matter responsibilities to further enhance the effectiveness of the Board’s oversight and decision making. The Board and its investment committees (Money Market and Alternative Products Committee, Equity Committee, and Fixed Income Committee) met regularly throughout the year and, at each meeting, considered factors that are relevant to their annual consideration of the continuation of the investment advisory agreements. The Board also met for the specific purpose of considering investment advisory agreement annual renewals. The Board held meetings June 20-21, 2023 and August 8-10, 2023, at which the Trustees considered the continuation of the investment advisory agreement for each Fund whose semi-annual report is contained herein (each an “Advisory Agreement” and collectively, the “Advisory Agreements”). At the June meeting, the Board’s investment committees met to review and consider performance, expense and related information for the Funds and the other J.P. Morgan Funds overseen by the Board in which each Fund invests (the “Underlying Funds”). Each investment committee reported to the full Board, which then considered each investment committee’s preliminary findings. At the August meeting, the Trustees continued their review and consideration. The Trustees, including a majority of the Trustees who are not parties to an Advisory Agreement or “interested persons” (as defined in the Investment Company Act of 1940) of any party to an Advisory Agreement or any of their affiliates, approved the continuation of each Advisory Agreement on August 10, 2023.
As part of their review of the Advisory Agreements, the Trustees considered and reviewed performance and other information about the Funds and Underlying Funds received from J.P. Morgan Investment Management Inc. (the “Adviser”). This information included the Funds’ and Underlying Funds’ performance as compared to the performance of the Funds’ and Underlying Funds’ peers and benchmarks, and analyses by the Adviser of the Funds’ and the Underlying Funds’ performance. In addition, at each of their regular meetings throughout the year, the Trustees considered reports on the performance of certain J.P. Morgan Funds provided by an independent investment consulting firm (the “independent consultant”). In addition, in preparation for the June and August meetings, the Trustees requested, received and evaluated extensive materials from the Adviser, including, with respect to the Funds and/or Underlying Funds, performance and expense information compiled by Broadridge, using data from Lipper Inc. and/or Morningstar Inc., independent providers of investment company data (together, “Broadridge”). The Trustees’ independent consultant also provided additional quantitative and statistical analyses of the Funds and certain Underlying Funds, including risk and performance return assessments as compared to the Funds’ and/or Under
lying Funds’ objectives, benchmarks, and peers. Before voting on the Advisory Agreements, the Trustees reviewed the Advisory Agreements with representatives of the Adviser, counsel to the Funds, and independent legal counsel to the Trustees, and received a memorandum from independent legal counsel to the Trustees discussing the legal standards for their consideration of the Advisory Agreements. The Trustees also discussed the Advisory Agreements with independent legal counsel in executive sessions at which no representatives of the Adviser were present.
A summary of the material factors evaluated by the Trustees in determining whether to approve each Advisory Agreement is provided below. Each Trustee attributed different weights to the various factors and no factor alone was considered determinative. The Trustees considered information provided with respect to the Funds and Underlying Funds throughout the year, as well as materials furnished specifically in connection with the annual review process. From year to year, the Trustees consider and place emphasis on relevant information in light of changing circumstances in market and economic conditions.
After considering and weighing the factors and information they had received, the Trustees found that the compensation to be received by the Adviser from each Fund under the applicable Advisory Agreement was fair and reasonable under the circumstances, and determined that the continuance of each Advisory Agreement was in the best interests of each Fund and its shareholders.
Nature, Extent and Quality of Services Provided by the Adviser
The Trustees received and considered information regarding the nature, extent and quality of services provided to each Fund under the applicable Advisory Agreement. The Trustees took into account information furnished throughout the year at Trustee meetings, as well as the materials furnished specifically in connection with this annual review process. Among other things, the Trustees considered:
• The background and experience of the Adviser’s senior management and investment personnel, including personnel changes, if any;
• The qualifications, backgrounds and responsibilities of the portfolio management team primarily responsible for the day-to-day management of each Fund and Underlying Funds, including personnel changes, if any;
• The investment strategy for each Fund, and the infrastructure supporting the portfolio management teams;
• Information about the structure and distribution strategy for each Fund and how it fits within the Adviser’s other fund offerings within the J.P. Morgan Funds complex;
| J.P. Morgan Investor Funds | |
BOARD APPROVAL OF INVESTMENT ADVISORY AGREEMENTS(Unaudited) (continued)
• The administration services provided by the Adviser in its role as Administrator;
• Their knowledge of the nature and quality of the services provided by the Adviser and its affiliates gained from their experience as Trustees of the Funds and in the financial industry generally;
• The overall reputation and capabilities of the Adviser and its affiliates;
• The commitment of the Adviser to provide high quality service to the Funds and Underlying Funds, as applicable;
• Their overall confidence in the Adviser’s integrity; and
• The Adviser’s responsiveness to requests for additional information, questions or concerns raised by them, including the Adviser’s willingness to consider and implement organizational and operational changes designed to improve investment results and the services provided to each Fund and Underlying Funds.
Based upon these considerations and other factors, the Trustees concluded that they were satisfied with the nature, extent and quality of the services provided to the Funds by the Adviser.
Costs of Services Provided and Profitability to the Adviser and its Affiliates
The Trustees received and considered information regarding the profitability to the Adviser and its affiliates from providing services to the Funds and Underlying Funds. The Trustees reviewed and discussed this information. The Trustees recognized that this information is not audited and represents the Adviser’s determination of its and its affiliates’ revenues from the contractual services provided to the Funds and Underlying Funds, less expenses of providing such services. Expenses include direct and indirect costs and are calculated using an allocation methodology developed by the Adviser and reviewed with the Board. The Trustees also recognized that it is difficult to make comparisons of profitability from fund investment advisory contracts because comparative information is not generally publicly available and is affected by numerous factors, including the structure of the particular adviser, the types of funds it manages, its business mix, numerous assumptions regarding allocations and the fact that publicly-traded fund managers’ operating profits and net income are net of distribution and marketing expenses. Based upon their review, and taking into consideration the factors noted above, the Trustees concluded that the profitability to the Adviser under each Advisory Agreement was not unreasonable in light of the services and benefits provided to each Fund and Underlying Fund.
The Trustees also considered that JPMorgan Distribution Services, Inc. (“JPMDS”), an affiliate of the Adviser, and the Adviser earn fees from the Funds and/or Underlying Funds for providing shareholder and administration services, respectively. These fees were shown separately in the profitability analysis presented to the Trustees. The Trustees also considered the payments of Rule 12b-1 fees to JPMDS, which also acts as the Funds’ distributor and that these fees are in turn generally paid to financial intermediaries that sell the Funds, including financial intermediaries that are affiliates of the Adviser (although they are retained by JPMDS in certain instances). The Trustees also considered the fees earned by JPMorgan Chase Bank, N.A. (“JPMCB”), an affiliate of the Adviser, for custody, fund accounting and other related services for the Funds and/or Underlying Funds, and the profitability of the arrangements to JPMCB.
Fall-Out Benefits
The Trustees reviewed information regarding potential “fall-out” or ancillary benefits received by the Adviser and its affiliates as a result of their relationship with the Funds. The Trustees considered that the J.P. Morgan Funds' operating accounts are held at JPMCB, which, as a result, will receive float benefits for certain J.P. Morgan Funds, as applicable. The Trustees also noted that the Adviser supports a diverse set of products and services, which benefits the Adviser by allowing it to leverage its infrastructure to serve additional clients, including the benefits received by the Adviser and its affiliates in connection with the Funds’ investments in the Underlying Funds. The Trustees also reviewed the Adviser’s allocation of fund brokerage for the J.P. Morgan Funds complex, including allocations to brokers who provide research to the Adviser, as well as the Adviser’s use of affiliates to provide other services and the benefits to such affiliates of doing so. The Trustees also considered the benefit to the Adviser and its affiliates from allocating client assets to the Funds.
Economies of Scale
The Trustees considered the extent to which the Funds may benefit from potential economies of scale. The Trustees considered that there may not be a direct relationship between economies of scale realized by the Funds and those realized by the Adviser as assets increase. The Trustees considered the extent to which the Funds were priced to scale and whether it would be appropriate to add advisory fee breakpoints. The Trustees noted certain Funds with contractual expense limitations and fee waivers (“Fee Caps”) which allow a Fund’s shareholders to share potential economies of scale from a Fund’s inception, prior to reaching scale. The Trustees also noted that certain other Funds that had achieved scale as asset levels had increased, no longer had Fee Caps in place for some or all of their share classes, but shared economies of scale through lower average expenses. The Trustees noted that the fees remain fair and reasonable relative to peer funds. The
| J.P. Morgan Investor Funds | |
Trustees considered the benefits to the Funds of the use of an affiliated distributor and custodian, including the ability to rely on existing infrastructure supporting distribution, custodial and transfer agent services and the ability to negotiate competitive fees for the Funds. The Trustees further considered the Adviser's and JPMDS's ongoing investments in their business in support of the Funds, including the Adviser's and/or JPMDS's investments in trading systems, technology (including improvements to the J.P. Morgan Funds’ website, and cybersecurity improvements), retention of key talent, and regulatory support enhancements. The Trustees concluded that the current fee structure for each Fund, including any Fee Caps the Adviser has in place that serve to limit the overall net expense ratios of each Fund at competitive levels, was reasonable. The Trustees concluded that, for Funds with Fee Caps in place for some or all of their share classes, the relevant Fund’s shareholders received the benefits of potential economies of scale through the Fee Caps and, for Funds that achieved scale and no longer had Fee Caps in place for some or all of their share classes, the relevant Fund’s shareholders benefited from lower average expenses resulting from increased assets. The Trustees also concluded that all Funds benefited from the Adviser’s reinvestment in its operations to serve the Funds and their shareholders. The Trustees noted that the Adviser’s reinvestment ensures sufficient resources in terms of personnel and infrastructure to support the Funds.
Independent Written Evaluation of the Funds’ Senior Officer
The Trustees noted that, upon their direction, the Senior Officer for the Funds had prepared an independent written evaluation in order to assist the Trustees in determining the reasonableness of the proposed management fees. In determining whether to continue the Advisory Agreements, the Trustees considered the Senior Officer’s report.
Fees Relative to Adviser’s Other Clients
The Trustees received and considered information about the nature and extent of investment advisory services and fee rates offered to other clients of the Adviser, including, to the extent applicable, institutional separate accounts, collective investment trusts, other registered investment companies and/or private funds sub-advised by the Adviser, and for investment management styles substantially similar to that of each Fund. The Trustees considered the complexity of investment management for registered investment companies relative to the Adviser’s other clients and noted differences, as applicable, in the fee structure and the regulatory, legal and other risks and responsibilities of providing services to the different clients. The Trustees considered that serving as an adviser to a registered investment company involves greater responsibilities and risks than acting as a sub-adviser and observed that sub-advisory fees may be lower than those charged by the Adviser to each Fund. The Trustees also noted that the adviser, not the applicable registered investment company, typically
bears the sub-advisory fee and that many responsibilities related to the advisory function are typically retained by the primary adviser. The Trustees concluded that the fee rates charged to each Fund in comparison to those charged to the Adviser’s other clients were reasonable.
Investment Performance
The Trustees receive and consider information about each Fund’s performance throughout the year. In addition, the Trustees received and considered absolute and/or relative performance information for the Funds in a report prepared by Broadridge. The Trustees considered the total return performance information, which included the ranking of the Funds within a performance universe comprised of funds’ selected share classes with the same Broadridge investment classification and objective (the “Universe”), by total return for the applicable one-, three- and five-year periods. The Trustees reviewed a description of Broadridge’s methodology for selecting mutual funds in each Fund’s Universe, and noted that Universe quintile rankings were not calculated if the number of funds in the Universe did not meet a predetermined minimum. The Broadridge materials provided to the Trustees highlighted information with respect to certain representative classes to assist the Trustees in their review. As part of this review, the Trustees also reviewed each Fund’s performance against its benchmark and considered the performance information provided for the Funds at regular Board meetings by the Adviser and the Trustees’ independent consultant and also considered the special analysis prepared for the Funds by the Trustees’ independent consultant. The Trustees also engaged with the Adviser to consider what steps might be taken to improve performance, as applicable. The Broadridge performance data noted by the Trustees as part of their review and the determinations made by the Trustees with respect to each Fund’s performance for certain representative classes are summarized below:
The Trustees noted that the Investor Balanced Fund’s performance for Class A, Class I and Class R6 shares was in the second quintile of the Universe for each of the one-, three- and five-year periods ended December 31, 2022. The Trustees discussed the performance and investment strategy of the Fund with the Adviser and reviewed the performance analysis prepared by the independent consultant. Based upon these discussions, and various other factors, the Trustees concluded that the Fund’s performance was satisfactory.
The Trustees noted that the Investor Conservative Growth Fund’s performance for Class A shares was in the second quintile of the Universe for each of the one-, three- and five-year periods ended December 31, 2022. The Trustees noted that the performance for the Class I shares was in the second, first and first quintiles of the Universe for the one-, three- and five-year periods ended December 31, 2022, respectively. The Trustees noted that the performance for
| J.P. Morgan Investor Funds | |
BOARD APPROVAL OF INVESTMENT ADVISORY AGREEMENTS(Unaudited) (continued)
Class R6 shares was in the second, first and first quintiles of the Universe for the one-, three- and five-year periods ended December 31, 2022, respectively. The Trustees discussed the performance and investment strategy of the Fund with the Adviser and reviewed the performance analysis prepared by the independent consultant. Based upon these discussions, and various other factors, the Trustees concluded that the Fund’s performance was satisfactory.
The Trustees noted that the Investor Growth Fund’s performance for Class A shares was in the first quintile of the Universe for each of the one-, three- and five-year periods ended December 31, 2022. The Trustees noted that the performance for Class I shares was in the second, first and first quintiles of the Universe for the one-, three- and five-year periods ended December 31, 2022, respectively. The Trustees noted that the performance for Class R6 shares was in the first quintile of the Universe for each of the one-, three- and five-year periods ended December 31, 2022. The Trustees discussed the performance and investment strategy of the Fund with the Adviser and reviewed the performance analysis prepared by the independent consultant. Based upon these discussions, and various other factors, the Trustees concluded that the Fund’s performance was satisfactory.
The Trustees noted that the Investor Growth & Income Fund’s performance for Class A shares was in the second, first and second quintiles of the Universe for the one-, three- and five-year periods ended December 31, 2022, respectively. The Trustees noted that the performance for Class I shares was in the second, first and second quintiles of the Universe for the one-, three- and five-year periods ended December 31, 2022, respectively. The Trustees noted that the performance for Class R6 shares was in the second, first and second quintiles of the Universe for the one-, three- and five-year periods ended December 31, 2022, respectively. The Trustees discussed the performance and investment strategy of the Fund with the Adviser and reviewed the performance analysis prepared by the independent consultant. Based upon these discussions, and various other factors, the Trustees concluded that the Fund’s performance was satisfactory.
Advisory Fees and Expense Ratios
The Trustees considered the contractual advisory fee rate and administration fee rate paid by each Fund to the Adviser and compared the combined rate to the information prepared by Broadridge concerning management fee rates paid by other funds’ selected share classes in the Universe, as well as a subset of funds within the Universe (the “Peer Group”). The Trustees recognized that Broadridge reported each Fund’s management fee rate as the combined contractual advisory fee and the administration fee rates. The Trustees also reviewed information about other expenses and the expense ratios for each Fund and noted that Universe and/or Peer Group quintile rankings were not calculated if the number of funds in the
Universe and/or Peer Groups did not meet a predetermined minimum. For each Fund that had a Fee Cap in place, the Trustees considered the net advisory fee rate and net expense ratio for each share class, as applicable, taking into account any waivers and/or reimbursements. The Trustees also considered any proposed changes to a Fee Cap, and, where deemed appropriate by the Trustees, additional waivers and/or reimbursements. The Trustees recognized that it can be difficult to make comparisons of advisory fees because there are variations in the services that are included in the fees paid by other funds. The Trustees’ determinations as a result of the review of each Fund’s advisory fees and expense ratios for certain representative classes are summarized below:
The Trustees noted that the Investor Balanced Fund’s net advisory fee for Class A shares was in the second and third quintiles of the Peer Group and Universe, respectively, and that the actual total expenses for Class A shares were in the second quintile of both the Peer Group and Universe. The Trustees noted that the net advisory fee for Class I shares was in the third quintile of both the Peer Group and Universe, and that the actual total expenses for Class I shares were in the second quintile of both the Peer Group and Universe. The Trustees noted that the net advisory fee for Class R6 shares was in the third quintile of both the Peer Group and Universe, and that the actual total expenses for Class R6 shares were in the second and first quintiles of the Peer Group and Universe, respectively. After considering the factors identified above, in light of the information, the Trustees concluded that the advisory fee was fair and reasonable in light of the services provided to the Fund and that such fees would be for services provided in addition to, rather than duplicative of, services provided under the advisory contract of the Underlying Funds in which the Fund invests.
The Trustees noted that the Investor Conservative Growth Fund’s net advisory fee for Class A shares was in the second and third quintiles of the Peer Group and Universe, respectively, and that the actual total expenses for Class A shares were in the second quintile of both the Peer Group and Universe. The Trustees noted that the net advisory fee for Class I shares was in the third quintile of both the Peer Group and Universe, and that the actual total expenses for Class I shares were in the second and third quintiles of the Peer Group and Universe, respectively. The Trustees noted that the net advisory fee for Class R6 shares was in the third quintile of both the Peer Group and Universe, and that the actual total expenses were in the second and first quintiles of the Peer Group and Universe, respectively. After considering the factors identified above, in light of the information, the Trustees concluded that the advisory fee was fair and reasonable in light of the services provided to the Fund and that such fees would be for services
| J.P. Morgan Investor Funds | |
provided in addition to, rather than duplicative of, services provided under the advisory contract of the Underlying Funds in which the Fund invests.
The Trustees noted that the Investor Growth Fund’s net advisory fee for Class A shares was in the second and third quintiles of the Peer Group and Universe, respectively, and that the actual total expenses for Class A shares were in the first and second quintile of the Peer Group and Universe, respectively. The Trustees noted that the net advisory fee for Class I shares was in the second and third quintiles of the Peer Group and Universe, respectively, and that the actual total expenses for Class I shares were in the first and second quintiles of the Peer Group and Universe, respectively. The Trustees noted that the net advisory fee for Class R6 shares was in the third quintile of both the Peer Group and Universe, and that the actual total expenses for Class R6 shares were in the first quintile of both the Peer Group and Universe. After considering the factors identified above, in light of the information, the Trustees concluded that the advisory fee was fair and reasonable in light of the services provided to the Fund and that such fees would be for services provided in addition to, rather than duplicative of, services provided under the advisory contract of the Underlying Funds in which the Fund invests.
The Trustees noted that the Investor Growth & Income Fund’s net advisory fee for Class A shares was in the second and third quintiles of the Peer Group and Universe, respectively, and that the actual total expenses for Class A shares were in the second quintiles of both the Peer Group and Universe. The Trustees noted that the net advisory fee for Class I shares was in the second and fourth quintiles of the Peer Group and Universe, respectively, and that the actual total expenses for Class I shares were in the first and third quintiles of the Peer Group and Universe, respectively. The Trustees noted that the net advisory fee for Class R6 shares was in the third and fourth quintiles of the Peer Group and Universe, respectively, and that the actual total expenses for Class R6 shares were in the first quintile of both the Peer Group and Universe. After considering the factors identified above, in light of the information, the Trustees concluded that the advisory fee was fair and reasonable in light of the services provided to the Fund and that such fees would be for services provided in addition to, rather than duplicative of, services provided under the advisory contract of the Underlying Funds in which the Fund invests.
| J.P. Morgan Investor Funds | |
TAX LETTER(Unaudited)
(Dollar values in thousands)
Certain tax information for the J.P. Morgan Funds is required to be provided to shareholders based upon the Funds’ income and distributions for the taxable year ended June 30, 2023. The information and distributions reported in this letter may differ from the information and taxable distributions reported to the shareholders for the calendar year ending December 31, 2023. The information necessary to complete your income tax returns for the calendar year ending December 31, 2023 will be provided under separate cover.
Foreign Source Income and Foreign Tax Credit Pass Through
For the fiscal year ended June 30, 2023, the following Funds intend to elect to pass through to shareholders taxes paid to foreign countries. Gross income and foreign tax expenses are as follows or amounts as finally determined:
| Total Foreign
Source Income | |
JPMorgan Investor Balanced Fund | | |
JPMorgan Investor Conservative Growth Fund | | |
JPMorgan Investor Growth Fund | | |
JPMorgan Investor Growth & Income Fund | | |
| J.P. Morgan Investor Funds | |
THIS PAGE IS INTENTIONALLY LEFT BLANK
THIS PAGE IS INTENTIONALLY LEFT BLANK
J.P. Morgan Funds are distributed by JPMorgan Distribution Services, Inc., which is an affiliate of JPMorgan Chase & Co. Affiliates of JPMorgan Chase & Co. receive fees for providing various services to the Funds.
Contact JPMorgan Distribution Services, Inc. at 1-800-480-4111 for a fund prospectus. You can also visit us at www.jpmorganfunds.com. Investors should carefully consider the investment objectives and risk as well as charges and expenses of the mutual fund before investing. The prospectus contains this and other information about the mutual fund. Read the prospectus carefully before investing.
Investors may obtain information about the Securities Investor Protection Corporation (SIPC), including the SIPC brochure, by visiting www.sipc.org or by calling SIPC at 202-371-8300.
Each Fund files a complete schedule of its fund holdings for the first and third quarters of its fiscal year with the SEC as an exhibit to its report on Form N-PORT. The Funds' Form N-PORT reports are available on the SEC’s website at http://www.sec.gov. Each Fund's quarterly holdings can be found by visiting the J.P. Morgan Funds’ website at www.jpmorganfunds.com.
Effective January 24, 2023, the SEC adopted rule and form amendments that will result in changes to the design and delivery of shareholder reports of mutual funds and ETFs, requiring them to transmit concise and visually engaging streamlined annual and semi-annual reports to shareholders that highlight key information. Other information, including financial statements, will no longer appear in a streamlined shareholder report but must be available online, delivered free of charge upon request, and filed on a semi-annual basis on Form N-CSR. The rule and form amendments have a compliance date of July 24, 2024.
A description of each Fund's policies and procedures with respect to the disclosure of each Fund's holdings is available in the prospectuses and Statement of Additional Information.
A copy of proxy policies and procedures is available without charge upon request by calling 1-800-480-4111 and on the Funds' website at www.jpmorganfunds.com. A description of such policies and procedures is on the SEC’s website at www.sec.gov. The Trustees have delegated the authority to vote proxies for securities owned by the Funds to the Adviser. A copy of the Funds' voting record for the most recent 12-month period ended June 30 is available on the SEC’s website at www.sec.gov or at the Funds' website at www.jpmorganfunds.com no later than August 31 of each year. The Funds' proxy voting record will include, among other things, a brief description of the matter voted on for each fund security, and will state how each vote was cast, for example, for or against the proposal.
J.P. Morgan Asset Management is the brand name for the asset management business of JPMorgan Chase & Co. and its affiliates worldwide.
© JPMorgan Chase & Co., 2023. All rights reserved. December 2023.
SAN-INV-1223
ITEM 2. CODE OF ETHICS.
Not applicable to a semi-annual report.
ITEM 3. AUDIT COMMITTEE FINANCIAL EXPERT.
Not applicable to a semi-annual report.
ITEM 4. PRINCIPAL ACCOUNTANT FEES AND SERVICES.
Not applicable to a semi-annual report.
ITEM 5. AUDIT COMMITTEE OF LISTED REGISTRANTS.
Not applicable to a semi-annual report.
ITEM 6. INVESTMENTS.
File Schedule I – Investments in securities of unaffiliated issuers as of the close of the reporting period as set forth in Section 210.12-12 of Regulation S-X, unless the schedule is included as part of the report to shareholders filed under Item 1 of this Form.
Included in Item 1.
ITEM 7. DISCLOSURE OF PROXY VOTING POLICIES AND PROCEDURES FOR CLOSED-END MANAGEMENT INVESTMENT COMPANIES.
Not applicable.
ITEM 8. PORTFOLIO MANAGERS OF CLOSED-END MANAGEMENT INVESTMENT COMPANIES.
Not applicable.
ITEM 9. PURCHASE OF EQUITY SECURITIES BY CLOSED-END MANAGEMENT INVESTMENT COMPANY AND AFFILIATED PURCHASERS.
Not applicable.
ITEM 10. SUBMISSION OF MATTERS TO A VOTE OF SECURITY HOLDERS.
Describe any material changes to the procedures by which shareholders may recommend nominees to the registrant’s board of directors, where those changes were implemented after the registrant last provided disclosure in response to the requirements of Item 7(d)(2)(ii)(G) of Schedule 14A (17 CFR 240.14a-101), or this Item.
No material changes to report.
ITEM 11. CONTROLS AND PROCEDURES.
(a) Disclose the conclusions of the registrant’s principal executive and principal financial officers, or persons performing similar functions, regarding the effectiveness of the registrant’s disclosure controls and procedures (as defined in Rule 30a-3(c) under the Act (17 CFR 270.30a-3(c))) as of a date within 90 days of the filing date of the report that includes the disclosure required by this paragraph, based on the evaluation of these controls and procedures required by Rule 30a-3(b) under the Act (17 CFR 270.30a-3(b)) and Rules 13a-15(b) or 15d-15(b) under the Exchange Act (17 CFR 240.13a-15(b) or 240.15d-15(b)).
The Registrant’s principal executive and principal financial officers have concluded, based on their evaluation of the Registrant’s disclosure controls and procedures as of a date within 90 days of the filing date of this report, that the Registrant’s disclosure controls and procedures are reasonably designed to ensure that information required to be disclosed by the Registrant on Form N-CSR is recorded, processed, summarized and reported within the required time periods and that information required to be disclosed by the Registrant in the reports that it files or submits on Form N-CSR is accumulated and communicated to the Registrant’s management, including its principal executive and principal financial officers, as appropriate to allow timely decisions regarding required disclosure.
(b) Disclose any change in the registrant’s internal control over financial reporting (as defined in Rule 30a-3(d) under the Act (17 CFR 270.30a-3(d)) that occurred during the period covered by this report that has materially affected, or is reasonably likely to materially affect, the registrant’s internal control over financial reporting.
There were no changes in the Registrant’s internal control over financial reporting that occurred during period covered by this report that have materially affected, or are reasonably likely to materially affect, the Registrant’s internal control over financial reporting.
ITEM 12. DISCLOSURE OF SECURITIES LENDING ACTIVITIES FOR CLOSED-END MANAGEMENT INVESTMENT COMPANIES.
Not applicable.
ITEM 13. EXHIBITS.
| | (a) | File the exhibits listed below as part of this Form. Letter or number the exhibits in the sequence indicated. |
(1) Any code of ethics, or amendment thereto, that is the subject of the disclosure required by Item 2, to the extent that the registrant intends to satisfy the Item 2 requirements through filing of an exhibit.
Not applicable.
(2) A separate certification for each principal executive officer and principal financial officer of the registrant as required by Rule 30a-2(a) under the Act (17 CFR 270.30a-2), exactly as set forth below:
Certifications pursuant to Rule 30a-2(a) under the Investment Company Act of 1940 are attached hereto.
(1) Any written solicitation to purchase securities under Rule 23c-1 under the Act (17 CFR 270.23c-1) sent or given during the period covered by the report by or on behalf of the registrant to 10 or more persons.
Not applicable.
(2) Change in the registrant’s independent public accountant. Provide the information called for by Item 4 of Form 8-K under the Exchange Act (17 CFR 249.308). Unless otherwise specified by Item 4, or related to and necessary for a complete understanding of information not previously disclosed, the information should relate to events occurring during the reporting period.
Not applicable.
| | (b) | A separate or combined certification for each principal executive officer and principal officer of the registrant as required by Rule 30a-2(b) under the Act of 1940. |
Certifications pursuant to Rule 30a-2(b) under the Investment Company Act of 1940 are attached hereto.
SIGNATURES
Pursuant to the requirements of the Securities Exchange Act of 1934 and the Investment Company Act of 1940, the registrant has duly caused this report to be signed on its behalf by the undersigned, thereunto duly authorized.
JPMorgan Trust II
| | |
| By: | | /s/ Brian S. Shlissel |
| | Brian S. Shlissel |
| | President and Principal Executive Officer |
| | March 4, 2024 |
Pursuant to the requirements of the Securities Exchange Act of 1934 and the Investment Company Act of 1940, this report has been signed below by the following persons on behalf of the registrant and in the capacities and on the dates indicated.
| | |
| By: | | /s/ Brian S. Shlissel |
| | Brian S. Shlissel |
| | President and Principal Executive Officer |
| | March 4, 2024 |
| |
| By: | | /s/ Timothy J. Clemens |
| | Timothy J. Clemens |
| | Treasurer and Principal Financial Officer |
| | March 4, 2024 |