
| Investor Presentation KBW Field Trip May 9, 2006 |

| FORWARD LOOKING STATEMENTS Statements contained in this Presentation that are not based on current or historical fact are forward-looking in nature. Such forward-looking statements are based on current plans, estimates and expectations and are made pursuant to the Private Securities Litigation Reform Act of 1995. Forward- looking statements are based on known and unknown risks, assumptions, uncertainties and other factors. The Company's actual results, performance, or achievements may differ materially from any future results, performance, or achievements expressed or implied by such forward-looking statements. The Company undertakes no obligation to publicly update or revise any forward-looking statement. The financial information included in this presentation for the first quarter of 2006 is based on preliminary unaudited data and is subject to change. |
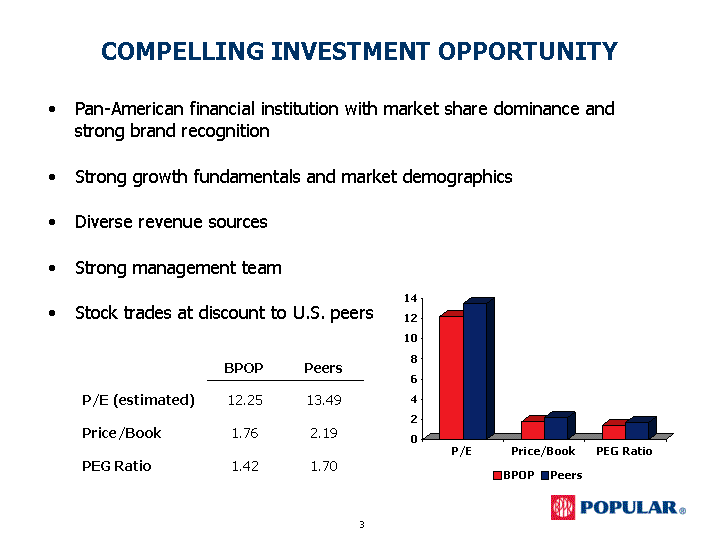
| COMPELLING INVESTMENT OPPORTUNITY Pan-American financial institution with market share dominance and strong brand recognition Strong growth fundamentals and market demographics Diverse revenue sources Strong management team Stock trades at discount to U.S. peers BPOP Peers P/E (estimated) 12.25 13.49 Price/Book 1.76 2.19 PEG Ratio 1.42 1.70 P/E Price/Book PEG Ratio BPOP 12.25 1.76 1.42 Peers 13.49 2.19 1.7 |
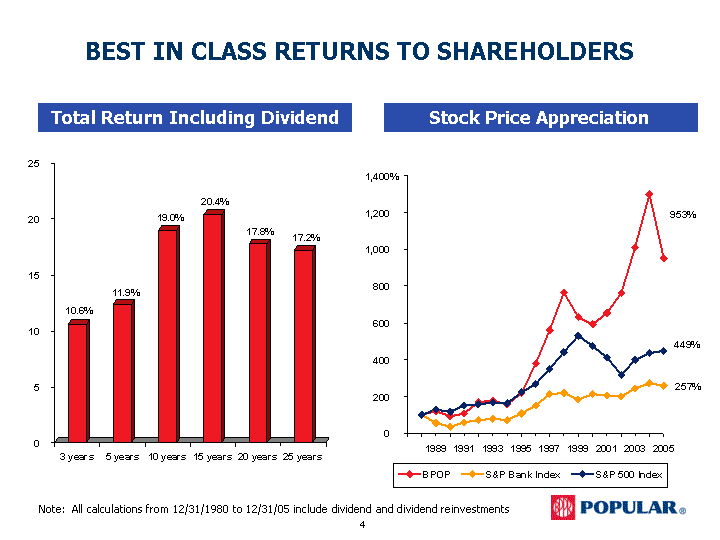
| 3 years 5 years 10 years 15 years 20 years 25 years 10.57 12.4 19 20.4 17.8 17.2 Note: All calculations from 12/31/1980 to 12/31/05 include dividend and dividend reinvestments BEST IN CLASS RETURNS TO SHAREHOLDERS Stock Price Appreciation Total Return Including Dividend 1988 1989 1990 1991 1992 1993 1994 1995 1996 1997 1998 1999 2000 2001 2002 2003 2004 2005 BPOP 100 121 90 108 170 177 158 218 380 558 766 630 593 655 762 1011 1299 953 S&P Bank Index 100 55 37 58 73 78 71 109 149 212 220 184 213 207 199 244 270 257 S&P 500 Index 100 127 119 150 157 168 165 222 267 349 443 529 475 413 317 400 436 449 953% 449% 257% |
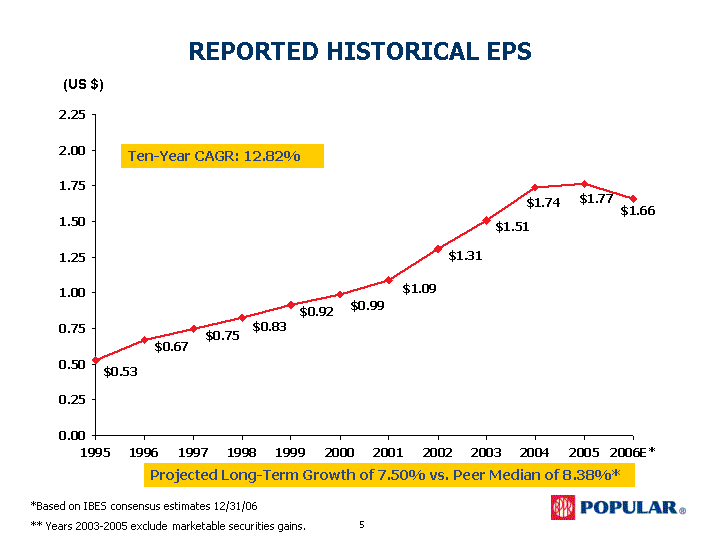
| REPORTED HISTORICAL EPS 1995 1996 1997 1998 1999 2000 2001 2002 2003 2004 2005 2006E* 0.53 0.67 0.75 0.83 0.92 0.99 1.09 1.31 1.51 1.74 1.77 1.66 (US $) Ten-Year CAGR: 12.82% Projected Long-Term Growth of 7.50% vs. Peer Median of 8.38%* *Based on IBES consensus estimates 12/31/06 ** Years 2003-2005 exclude marketable securities gains. |
| POPULAR AT A GLANCE Founded in 1893 Diversified financial services and transaction processing company. Operations in Puerto Rico, the Caribbean, the mainland United States and Central America. Largest Puerto Rican financial institution and largest Hispanic bank in the United States. 25th largest U.S. bank holding company in assets (as of 12/31/05). Popular, Inc. and its related subsidiaries are regulated by the Federal Reserve Bank of NY, the OCC and the Office of the Commissioner of Financial Institutions of Puerto Rico. Leader in ATM/POS electronic data processing in the Caribbean. $48.6 billion in assets, $23.4 billion in deposits and $3.49 billion of equity as of 3/31/06. |
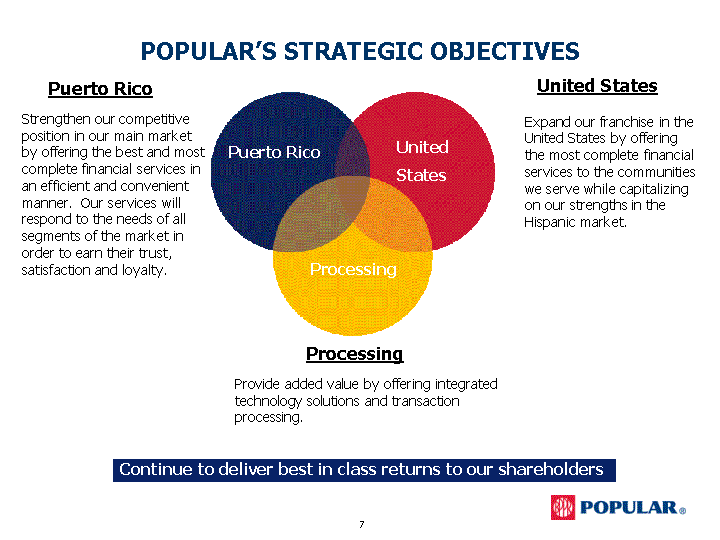
| POPULAR'S STRATEGIC OBJECTIVES POPULAR'S STRATEGIC OBJECTIVES Puerto Rico Strengthen our competitive position in our main market by offering the best and most complete financial services in an efficient and convenient manner. Our services will respond to the needs of all segments of the market in order to earn their trust, satisfaction and loyalty. United States Expand our franchise in the United States by offering the most complete financial services to the communities we serve while capitalizing on our strengths in the Hispanic market. Processing Provide added value by offering integrated technology solutions and transaction processing. Continue to deliver best in class returns to our shareholders |
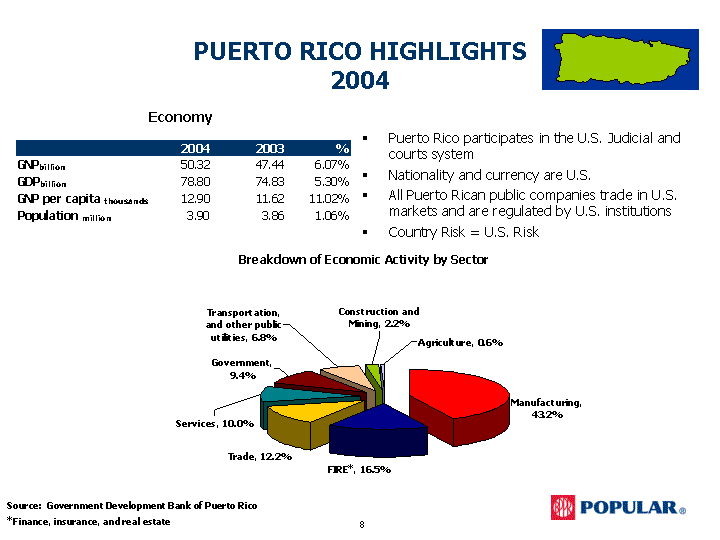
| PUERTO RICO HIGHLIGHTS 2004 Puerto Rico participates in the U.S. Judicial and courts system Nationality and currency are U.S. All Puerto Rican public companies trade in U.S. markets and are regulated by U.S. institutions Country Risk = U.S. Risk Source: Government Development Bank of Puerto Rico *Finance, insurance, and real estate |
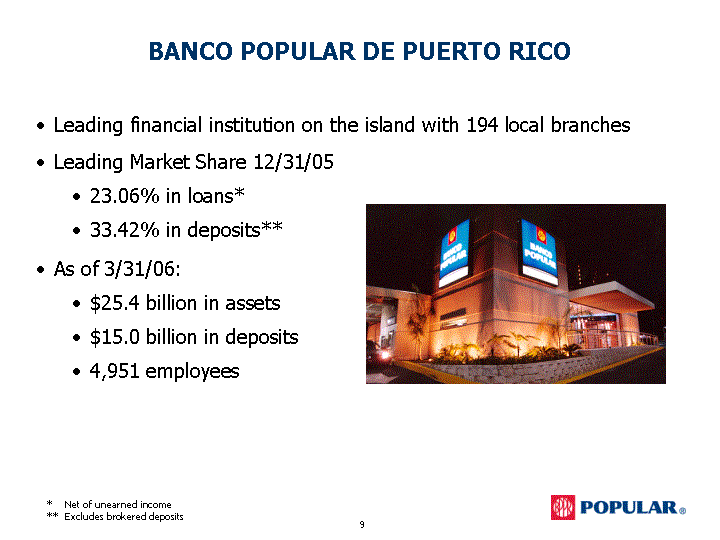
| BANCO POPULAR DE PUERTO RICO Leading Market Share 12/31/05 23.06% in loans* 33.42% in deposits** As of 3/31/06: $25.4 billion in assets $15.0 billion in deposits 4,951 employees * Net of unearned income ** Excludes brokered deposits Leading financial institution on the island with 194 local branches Leading financial institution on the island with 194 local branches |
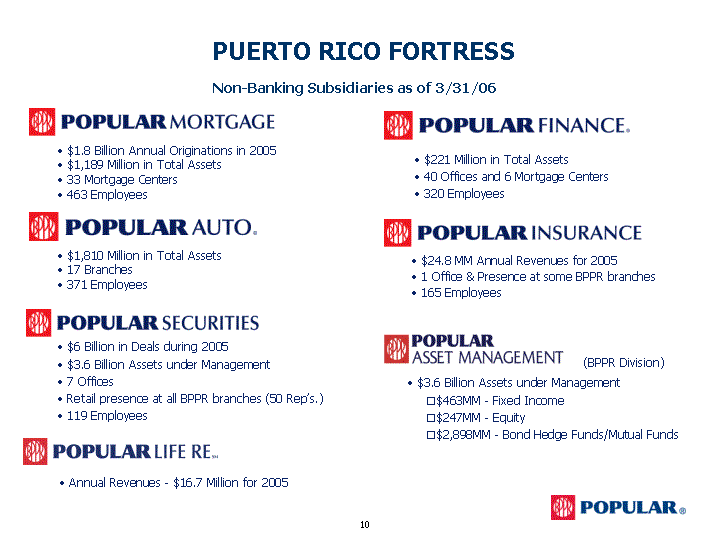
| Non-Banking Subsidiaries as of 3/31/06 PUERTO RICO FORTRESS $24.8 MM Annual Revenues for 2005 1 Office & Presence at some BPPR branches 165 Employees $1.8 Billion Annual Originations in 2005 $1,189 Million in Total Assets 33 Mortgage Centers 463 Employees $6 Billion in Deals during 2005 $3.6 Billion Assets under Management 7 Offices Retail presence at all BPPR branches (50 Rep's.) 119 Employees $221 Million in Total Assets 40 Offices and 6 Mortgage Centers 320 Employees $1,810 Million in Total Assets 17 Branches 371 Employees $3.6 Billion Assets under Management $463MM - Fixed Income $247MM - Equity $2,898MM - Bond Hedge Funds/Mutual Funds Annual Revenues - $16.7 Million for 2005 (BPPR Division) |
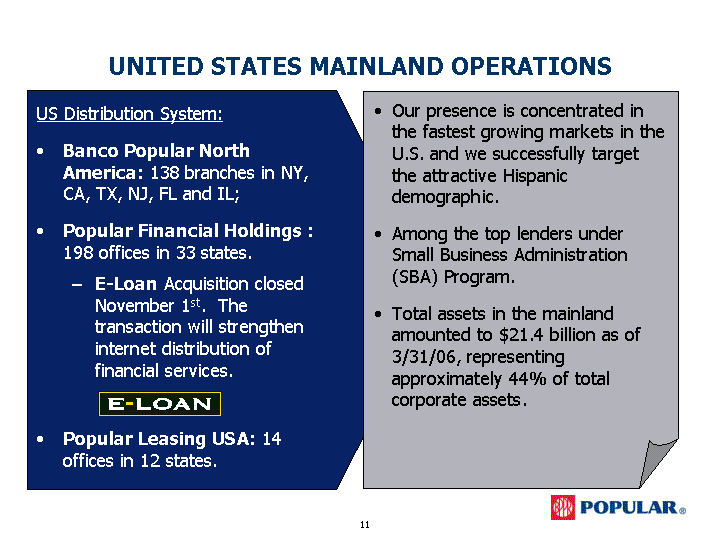
| UNITED STATES MAINLAND OPERATIONS US Distribution System: Banco Popular North America: 138 branches in NY, CA, TX, NJ, FL and IL; Popular Financial Holdings : 198 offices in 33 states. E-Loan Acquisition closed November 1st. The transaction will strengthen internet distribution of financial services. Popular Leasing USA: 14 offices in 12 states. offices in 12 states. offices in 12 states. offices in 12 states. offices in 12 states. offices in 12 states. offices in 12 states. offices in 12 states. offices in 12 states. offices in 12 states. offices in 12 states. offices in 12 states. offices in 12 states. offices in 12 states. offices in 12 states. Our presence is concentrated in the fastest growing markets in the U.S. and we successfully target the attractive Hispanic demographic. Among the top lenders under Small Business Administration (SBA) Program. Total assets in the mainland amounted to $21.4 billion as of 3/31/06, representing approximately 44% of total corporate assets. |
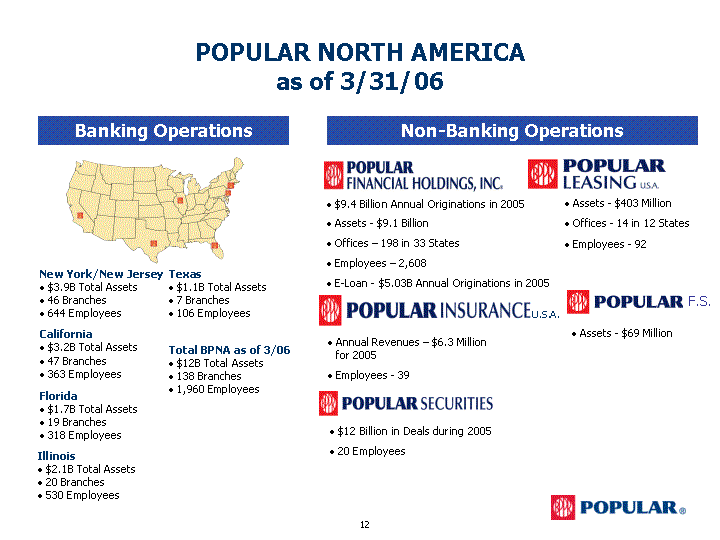
| POPULAR NORTH AMERICA as of 3/31/06 Non-Banking Operations Banking Operations California $3.2B Total Assets 47 Branches 363 Employees Florida $1.7B Total Assets 19 Branches 318 Employees Texas $1.1B Total Assets 7 Branches 106 Employees Illinois $2.1B Total Assets 20 Branches 530 Employees New York/New Jersey $3.9B Total Assets 46 Branches 644 Employees Total BPNA as of 3/06 $12B Total Assets 138 Branches 1,960 Employees $9.4 Billion Annual Originations in 2005 Assets - $9.1 Billion Offices - 198 in 33 States Employees - 2,608 E-Loan - $5.03B Annual Originations in 2005 Assets - $403 Million Offices - 14 in 12 States Employees - 92 Annual Revenues - $6.3 Million for 2005 Employees - 39 Assets - $69 Million U.S.A. F.S. $12 Billion in Deals during 2005 20 Employees |
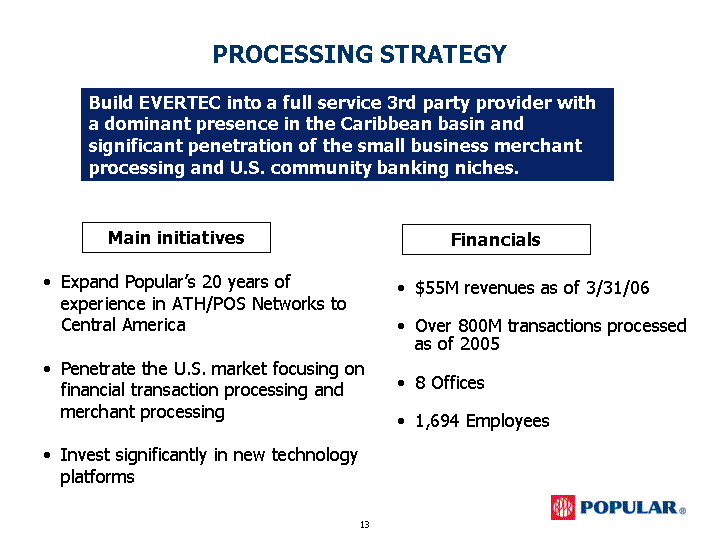
| PROCESSING STRATEGY Build EVERTEC into a full service 3rd party provider with a dominant presence in the Caribbean basin and significant penetration of the small business merchant processing and U.S. community banking niches. Expand Popular's 20 years of experience in ATH/POS Networks to Central America Penetrate the U.S. market focusing on financial transaction processing and merchant processing Invest significantly in new technology platforms Main initiatives $55M revenues as of 3/31/06 Over 800M transactions processed as of 2005 8 Offices 1,694 Employees Financials |

| Ten-Year CAGR (1995 - 2005): 13.95%** Five-Year CAGR (2000 - 2005): 14.39% Net Income Growth ($ Millions) *Include securities net gains of $71.1M, $15.3M, & $52.1M, respectively. **13.59% excluding securities gain. 1995 1996 1997 1998 1999 2000 2001 2002 2003 2004 2005 146.4 185.2 209.6 232.3 257.6 276.1 304.5 351.9 470.9 489.9 540.7 * * * |
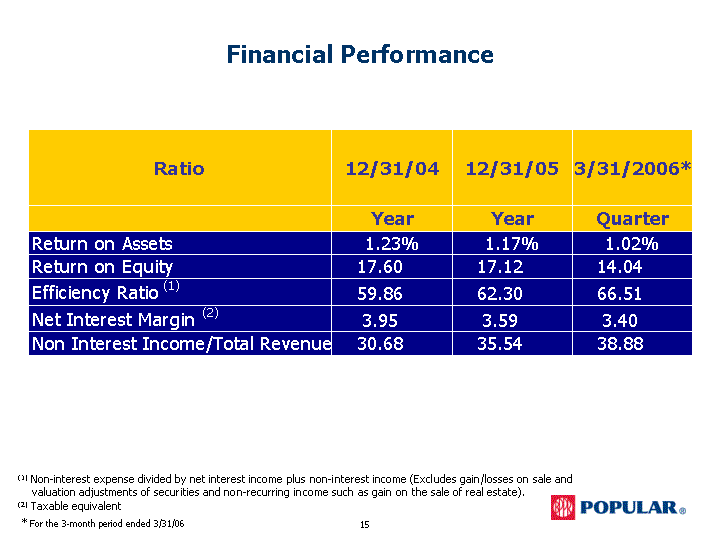
| (1) Non-interest expense divided by net interest income plus non-interest income (Excludes gain/losses on sale and valuation adjustments of securities and non-recurring income such as gain on the sale of real estate). (2) Taxable equivalent Financial Performance * For the 3-month period ended 3/31/06 |
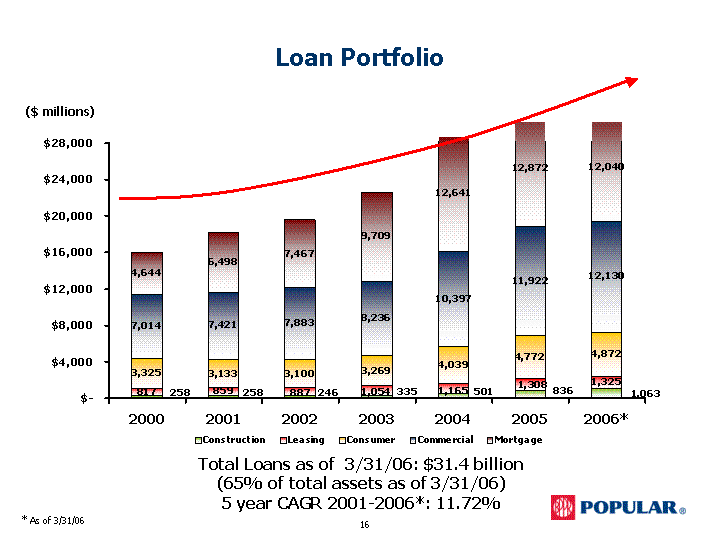
| Total Loans as of 3/31/06: $31.4 billion (65% of total assets as of 3/31/06) 5 year CAGR 2001-2006*: 11.72% Loan Portfolio ($ millions) * As of 3/31/06 |

| Increasing Non-Interest Income ($ in millions) * Excludes gain on sale of investment securities and valuation adjustment. Total Non-Interest Income for 2005: $733.2* million 5 Year CAGR 2000 - 2005: 10.11% |
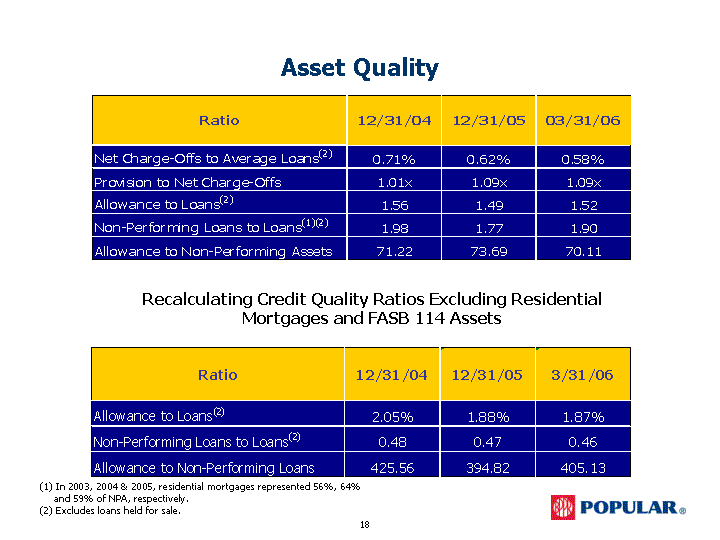
| Asset Quality (1) In 2003, 2004 & 2005, residential mortgages represented 56%, 64% and 59% of NPA, respectively. (2) Excludes loans held for sale. Recalculating Credit Quality Ratios Excluding Residential Mortgages and FASB 114 Assets |

| Interest Only Strips ("IO's") and Mortgage Servicing Rights ("MSR's") For the first quarter of 2006, gains of $11.5 million have been realized on the securitization transactions that met the sale criteria under SFAS No. 140. The Corporation also does securitization transactions that do not meet the SFAS No. 140 criteria for sales accounting and as such, these transactions are accounted for as secured borrowings. Balances of IO's and MSR's for the following periods were: ($ thousands) 12/31/2005 3/31/2006 IO's $64,542 $89,068 MSR's 136,750 $160,174 Total $201,292 $246,269 The Corporation intends to continue accessing the asset-backed securitization market, through sales or financing transactions throughout the year. |
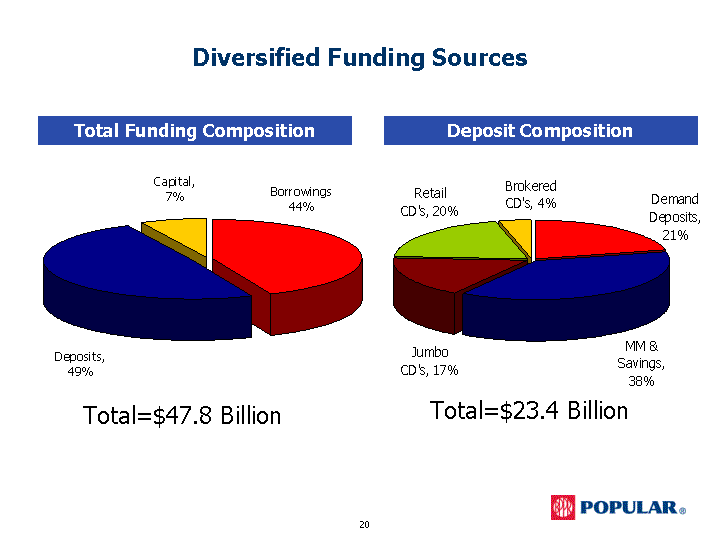
| Diversified Funding Sources Total Funding Composition Total=$47.8 Billion Total=$23.4 Billion Deposit Composition |
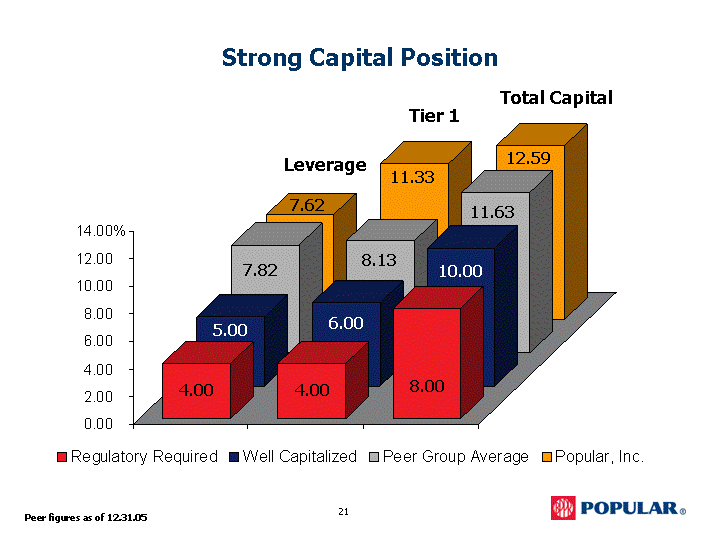
| Strong Capital Position Leverage Tier 1 Total Capital 8.13 7.62 5.00 11.36 11.63 10.00 6.00 8.00 4.00 4.00 7.82 12.62 Peer figures as of 12.31.05 |
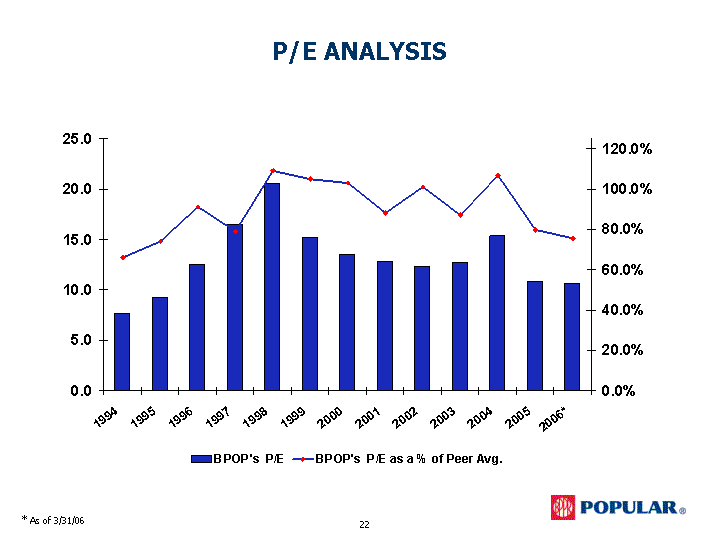
| P/E ANALYSIS 1994 1995 1996 1997 1998 1999 2000 2001 2002 2003 2004 2005 2006* BPOP's P/E 7.66 9.25 12.57 16.5 20.61 15.18 13.563 12.8106 12.34 12.71 15.34 10.85 10.65 BPOP's P/E as a % of Peer Avg. 0.66 0.74 0.91 0.79 1.09 1.05 1.03 0.88 1.01 0.87 1.067 0.797 0.755 * As of 3/31/06 |
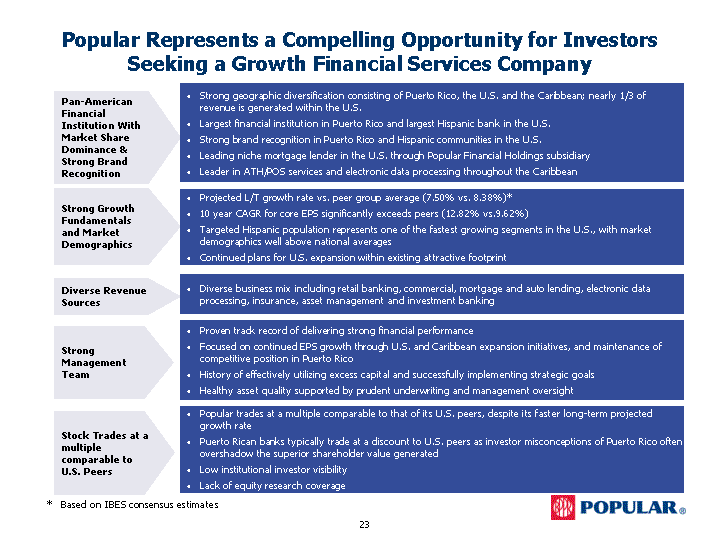
| Popular Represents a Compelling Opportunity for Investors Seeking a Growth Financial Services Company Strong Growth Fundamentals and Market Demographics Pan-American Financial Institution With Market Share Dominance & Strong Brand Recognition Diverse Revenue Sources Strong geographic diversification consisting of Puerto Rico, the U.S. and the Caribbean; nearly 1/3 of revenue is generated within the U.S. Largest financial institution in Puerto Rico and largest Hispanic bank in the U.S. Strong brand recognition in Puerto Rico and Hispanic communities in the U.S. Leading niche mortgage lender in the U.S. through Popular Financial Holdings subsidiary Leader in ATH/POS services and electronic data processing throughout the Caribbean Diverse business mix including retail banking, commercial, mortgage and auto lending, electronic data processing, insurance, asset management and investment banking Projected L/T growth rate vs. peer group average (7.50% vs. 8.38%)* 10 year CAGR for core EPS significantly exceeds peers (12.82% vs.9.62%) Targeted Hispanic population represents one of the fastest growing segments in the U.S., with market demographics well above national averages Continued plans for U.S. expansion within existing attractive footprint Proven track record of delivering strong financial performance Focused on continued EPS growth through U.S. and Caribbean expansion initiatives, and maintenance of competitive position in Puerto Rico History of effectively utilizing excess capital and successfully implementing strategic goals Healthy asset quality supported by prudent underwriting and management oversight Strong Management Team Stock Trades at a multiple comparable to U.S. Peers Popular trades at a multiple comparable to that of its U.S. peers, despite its faster long-term projected growth rate Puerto Rican banks typically trade at a discount to U.S. peers as investor misconceptions of Puerto Rico often overshadow the superior shareholder value generated Low institutional investor visibility Lack of equity research coverage * Based on IBES consensus estimates |

| Investor Presentation KBW Field Trip May 9, 2006 |