Exhibit 99.1

Financial Results Second Quarter 2013

Forward Looking Statements
The information contained in this presentation includes forward-looking statements within the meaning of the Private Securities Litigation Reform Act of 1995. These forward-looking statements are based on management’s current expectations and involve risks and uncertainties that may cause the Company’s actual results to differ materially from any future results expressed or implied by such forward-looking statements. Factors that may cause such a difference include, but are not limited to (i) the rate of growth in the economy and employment levels, as well as general business and economic conditions; (ii) changes in interest rates, as well as the magnitude of such changes; (iii) the fiscal and monetary policies of the federal government and its agencies; (iv) changes in federal bank regulatory and supervisory policies, including required levels of capital; (v) the relative strength or weakness of the consumer and commercial credit sectors and of the real estate markets in Puerto Rico and the other markets in which borrowers are located; (vi) the performance of the stock and bond markets; (vii) competition in the financial services industry; (viii) possible legislative, tax or regulatory changes; (ix) the impact of the Dodd-Frank Act on our businesses, business practice and cost of operations; and (x) additional Federal Deposit Insurance Corporation assessments. Other than to the extent required by applicable law, the Company undertakes no obligation to publicly update or revise any forward-looking statement. Please refer to our Annual Report on Form 10-K for the year ended December 31, 2012 and other SEC reports for a discussion of those factors that could impact our future results. The financial information included in this presentation for the quarter ended June 30, 2013 is based on preliminary unaudited data and is subject to change.
Accomplishments & Q2 2013 Results
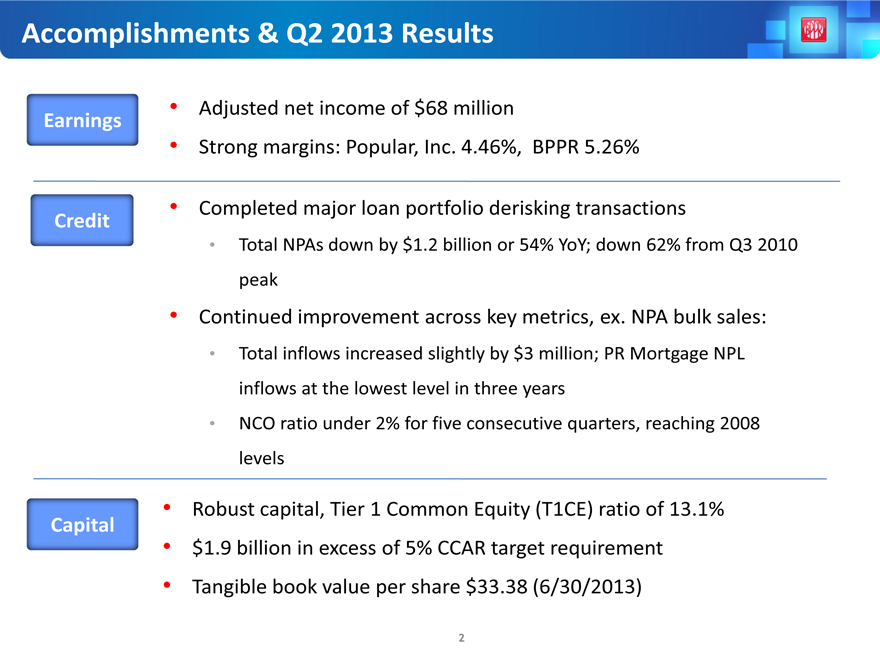
Earnings
Credit
Capital
Adjusted net income of $68 million
Strong margins: Popular, Inc. 4.46%, BPPR 5.26%
Completed major loan portfolio derisking transactions
Total NPAs down by $1.2 billion or 54% YoY; down 62% from Q3 2010 peak
Continued improvement across key metrics, ex. NPA bulk sales:
Total inflows increased slightly by $3 million; PR Mortgage NPL inflows at the lowest level in three years
NCO ratio under 2% for five consecutive quarters, reaching 2008 levels
Robust capital, Tier 1 Common Equity (T1CE) ratio of 13.1%
$1.9 billion in excess of 5% CCAR target requirement
Tangible book value per share $33.38 (6/30/2013)
Recent Events Q2: EVERTEC
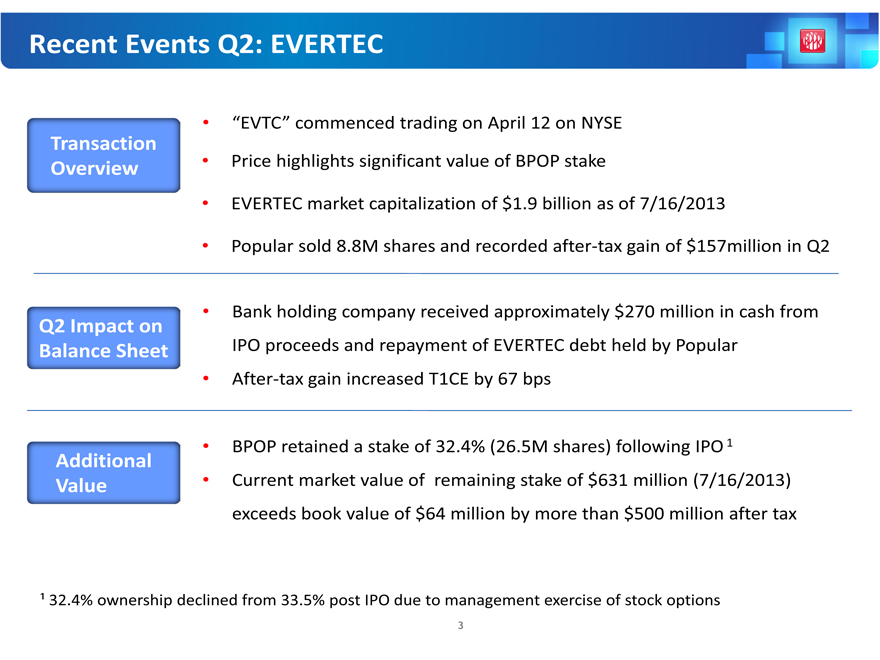
“EVTC” commenced trading on April 12 on NYSE
Transaction
Price highlights significant value of BPOP stake
Overview
EVERTEC market capitalization of $1.9 billion as of 7/16/2013
Popular sold 8.8M shares and recorded after-tax gain of $157million in Q2
Bank holding company received approximately $270 million in cash from
Q2 Impact on
Balance Sheet IPO proceeds and repayment of EVERTEC debt held by Popular
After-tax gain increased T1CE by 67 bps
BPOP retained a stake of 32.4% (26.5M shares) following IPO 1
Additional
Value Current market value of remaining stake of $631 million (7/16/2013) exceeds book value of $64 million by more than $500 million after tax
¹ 32.4% ownership declined from 33.5% post IPO due to management exercise of stock options
3
Recent Events Q2:
NPL Sale Substantially Derisked Balance Sheet
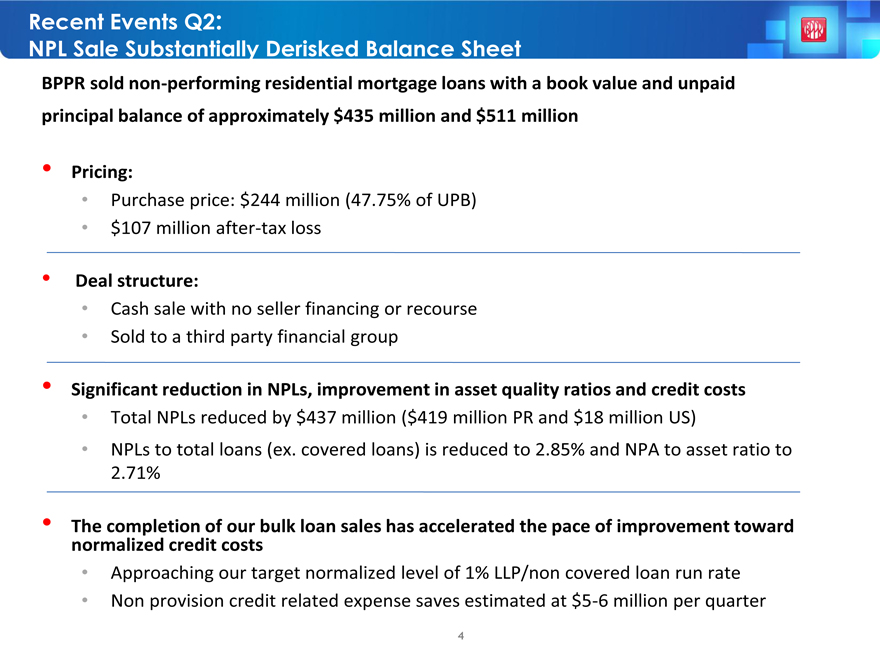
BPPR sold non-performing residential mortgage loans with a book value and unpaid principal balance of approximately $435 million and $511 million
Pricing:
Purchase price: $244 million (47.75% of UPB)
$107 million after-tax loss
Deal structure:
Cash sale with no seller financing or recourse
Sold to a third party financial group
Significant reduction in NPLs, improvement in asset quality ratios and credit costs
Total NPLs reduced by $437 million ($419 million PR and $18 million US)
NPLs to total loans (ex. covered loans) is reduced to 2.85% and NPA to asset ratio to 2.71%
The completion of our bulk loan sales has accelerated the pace of improvement toward normalized credit costs
Approaching our target normalized level of 1% LLP/non covered loan run rate
Non provision credit related expense saves estimated at $5-6 million per quarter
4
Key Areas of Shareholder Focus
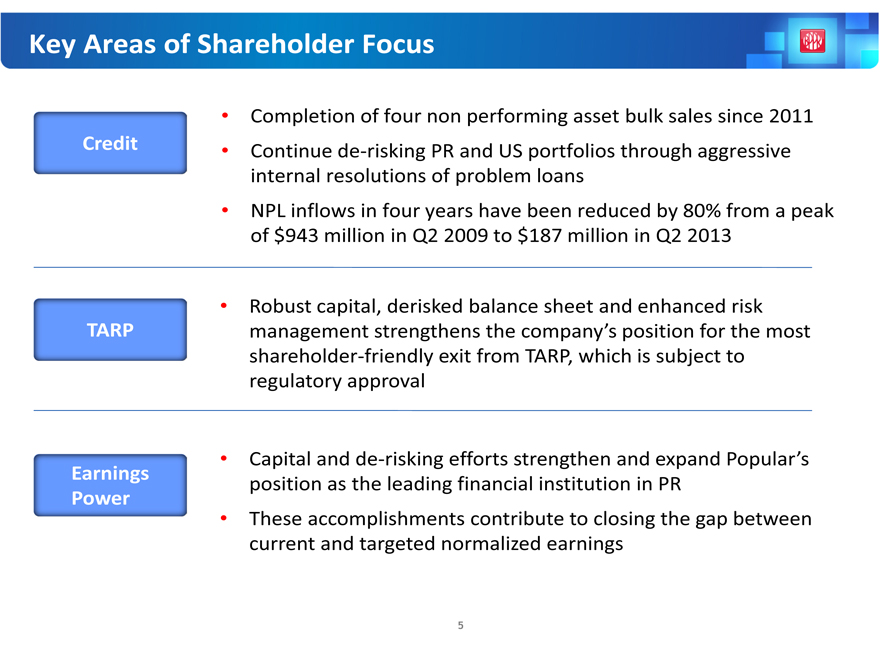
Completion of four non performing asset bulk sales since 2011
Credit
Continue de-risking PR and US portfolios through aggressive internal resolutions of problem loans
NPL inflows in four years have been reduced by 80% from a peak of $943 million in Q2 2009 to $187 million in Q2 2013
Robust capital, derisked balance sheet and enhanced risk TARP management strengthens the company’s position for the most shareholder-friendly exit from TARP, which is subject to regulatory approval
Earnings Capital and de-risking efforts strengthen and expand Popular’s Power position as the leading financial institution in PR
These accomplishments contribute to closing the gap between current and targeted normalized earnings
5
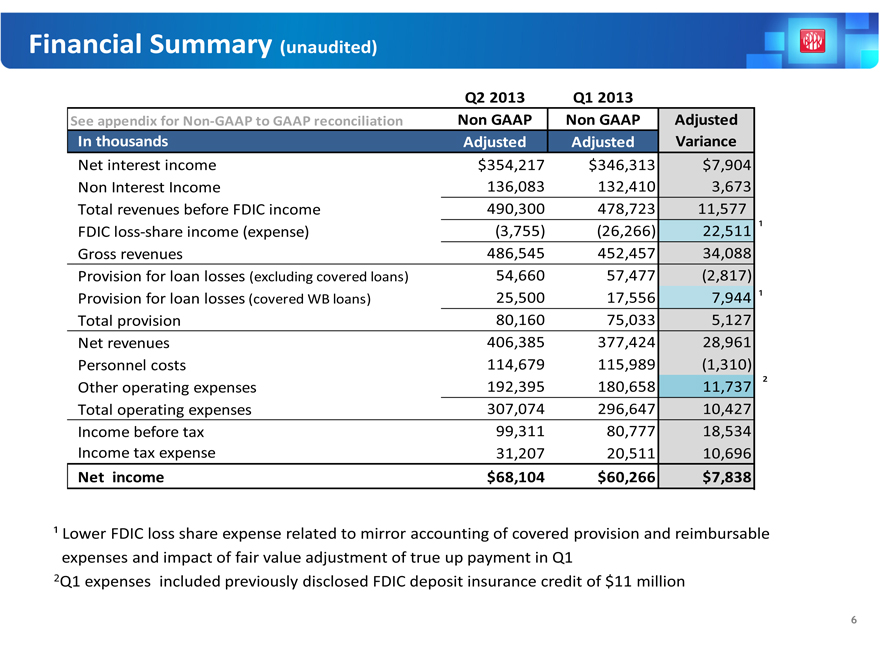
Financial Summary (unaudited)
Q2 2013 Q1 2013
See appendix for Non-GAAP to GAAP reconciliation Non GAAP Non GAAP Adjusted
In thousands Adjusted Adjusted Variance
Net interest income $354,217 $346,313 $7,904 Non Interest Income 136,083 132,410 3,673 Total revenues before FDIC income 490,300 478,723 11,577 FDIC loss-share income (expense) (3,755) (26,266) 22,511 ¹ Gross revenues 486,545 452,457 34,088 Provision for loan losses (excluding covered loans) 54,660 57,477 (2,817) Provision for loan losses (covered WB loans) 25,500 17,556 7,944 ¹ Total provision 80,160 75,033 5,127 Net revenues 406,385 377,424 28,961 Personnel costs 114,679 115,989 (1,310) Other operating expenses 192,395 180,658 11,737 ² Total operating expenses 307,074 296,647 10,427 Income before tax 99,311 80,777 18,534 Income tax expense 31,207 20,511 10,696
Net income $68,104 $60,266 $7,838
¹ Lower FDIC loss share expense related to mirror accounting of covered provision and reimbursable expenses and impact of fair value adjustment of true up payment in Q1 2Q1 expenses included previously disclosed FDIC deposit insurance credit of $11 million
6
PR Corporate Tax Changes
The Government of Puerto Rico revised the corporate tax framework and implemented various other revenue raising measures
The corporate income tax rate was increased to 39%, reverting to the rate in effect in 2011
The Government has included a tax on gross income of approximately 0.5%
Impact to Popular
Income tax net benefit of $216 million due to revaluation of the PR Deferred Tax Asset (DTA)
The effective tax rate will be approximately 35%
7
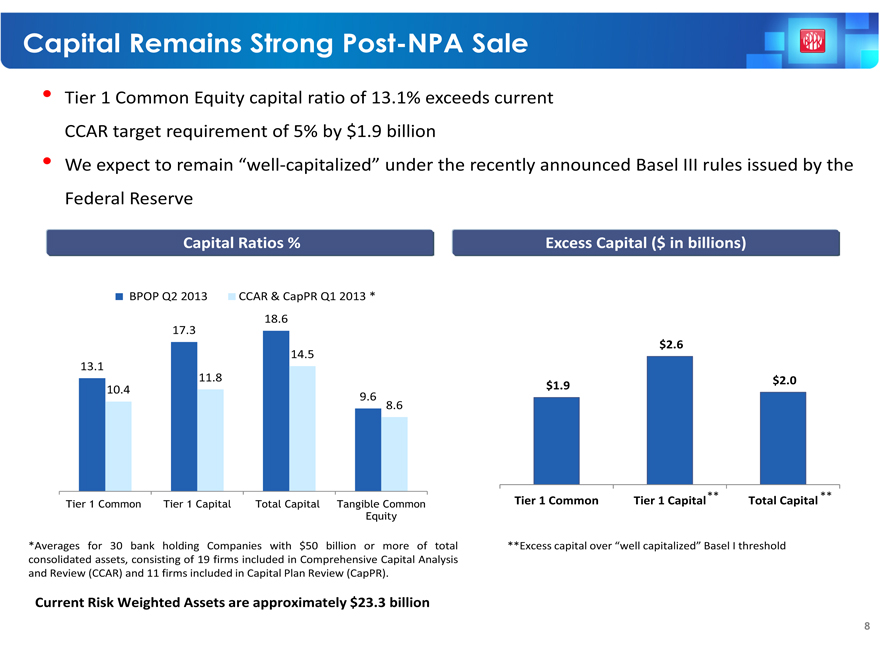
Tier 1 Common Equity capital ratio of 13.1% exceeds current CCAR target requirement of 5% by $1.9 billion
We expect to remain “well-capitalized” under the recently announced Basel III rules issued by the Federal Reserve
Capital Ratios % Excess Capital ($ in billions)
BPOP Q2 2013 CCAR & CapPR Q1 2013 *
18.6
17.3
$2.6
14.5
13.1
11.8 $1.9 $2.0
10.4
9.6 8.6
** **
Tier 1 Common Tier 1 Capital Total Capital Tangible Common Tier 1 Common Tier 1 Capital Total Capital Equity
*Averages for 30 bank holding Companies with $50 billion or more of total **Excess capital over “well capitalized” Basel I threshold consolidated assets, consisting of 19 firms included in Comprehensive Capital Analysis and Review (CCAR) and 11 firms included in Capital Plan Review (CapPR).
Current Risk Weighted Assets are approximately $23.3 billion
8
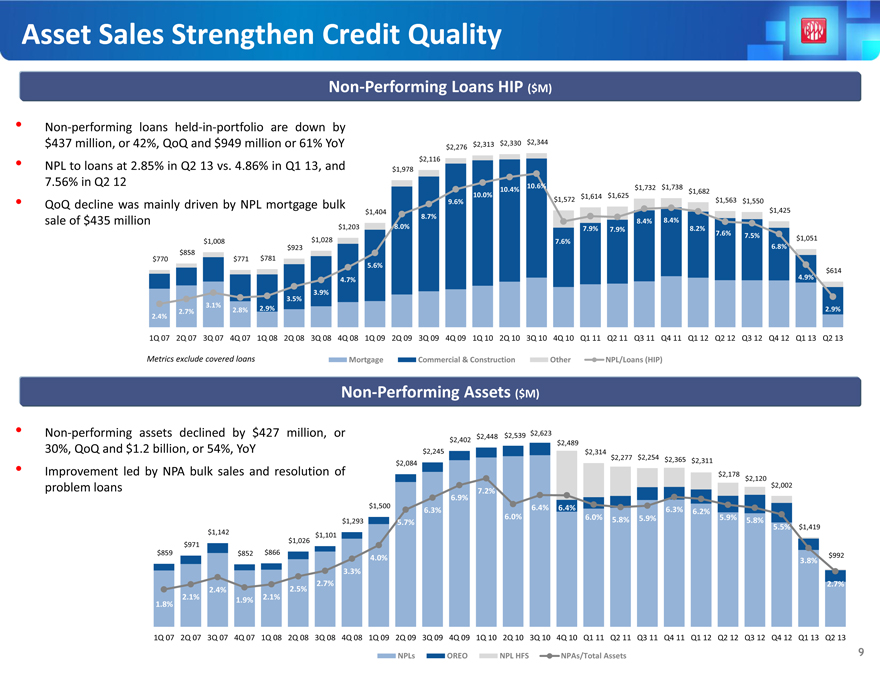
Asset Sales Strengthen Credit Quality
Non-Performing Loans HIP ($M)
Non-performing loans held-in-portfolio are down by $437 million, or 42%, QoQ and $949 million or 61% YoY $2,313 $2,330 $2,344
$2,276 $2,116
NPL to loans at 2.85% in Q2 13 vs. 4.86% in Q1 13, and $1,978
7.56% in Q2 12 10.6%
10.4% $1,732 $1,738 $1,682
10.0% $1,614 $1,625
QoQ decline was mainly driven by NPL mortgage bulk 9.6% $1,572 $1,563 $1,550
$1,404 8.7% $1,425
sale of $435 million 8.4% 8.4%
$1,203 8.0% 7.9% 8.2% 7.9%
7.6% 7.5% $1,028 $1,051 $1,008 7.6% $858 $923 6.8% $770 $771 $781 5.6% $614
4.7% 4.9% 3.9% 3.5% 3.1% 2.8% 2.9% 2.9% 2.7% 2.4%
1Q 07 2Q 07 3Q 07 4Q 07 1Q 08 2Q 08 3Q 08 4Q 08 1Q 09 2Q 09 3Q 09 4Q 09 1Q 10 2Q 10 3Q 10 4Q 10 Q1 11 Q2 11 Q3 11 Q4 11 Q1 12 Q2 12 Q3 12 Q4 12 Q1 13 Q2 13
Metrics exclude covered loans Mortgage Commercial & Construction Other NPL/Loans (HIP)
Non-Performing Assets ($M)
Non-performing assets declined by $427 million, or $2,539 $2,623
$2,448 $2,402 $2,489
30%, QoQ and $1.2 billion, or 54%, YoY $2,245 $2,314
$2,277 $2,254 $2,365 $2,084 $2,311
Improvement led by NPA bulk sales and resolution of $2,178 $2,120 problem loans 7.2% $2,002
6.9% $1,500 6.4% 6.4%
6.3% 6.3% 6.2% 6.0% 6.0% 5.8% 5.9% 5.9% $1,293 5.7% 5.8% $1,142 5.5% $1,419 $1,026 $1,101 $971 $859 $852 $866 4.0% $992
3.8% 3.3% 2.7% 2.7% 2.4% 2.5% 2.1% 1.9% 2.1% 1.8%
1Q 07 2Q 07 3Q 07 4Q 07 1Q 08 2Q 08 3Q 08 4Q 08 1Q 09 2Q 09 3Q 09 4Q 09 1Q 10 2Q 10 3Q 10 4Q 10 Q1 11 Q2 11 Q3 11 Q4 11 Q1 12 Q2 12 Q3 12 Q4 12 Q1 13 Q2 13
NPLs OREO NPL HFS NPAs/Total Assets 9
NPL Inflows remained stable
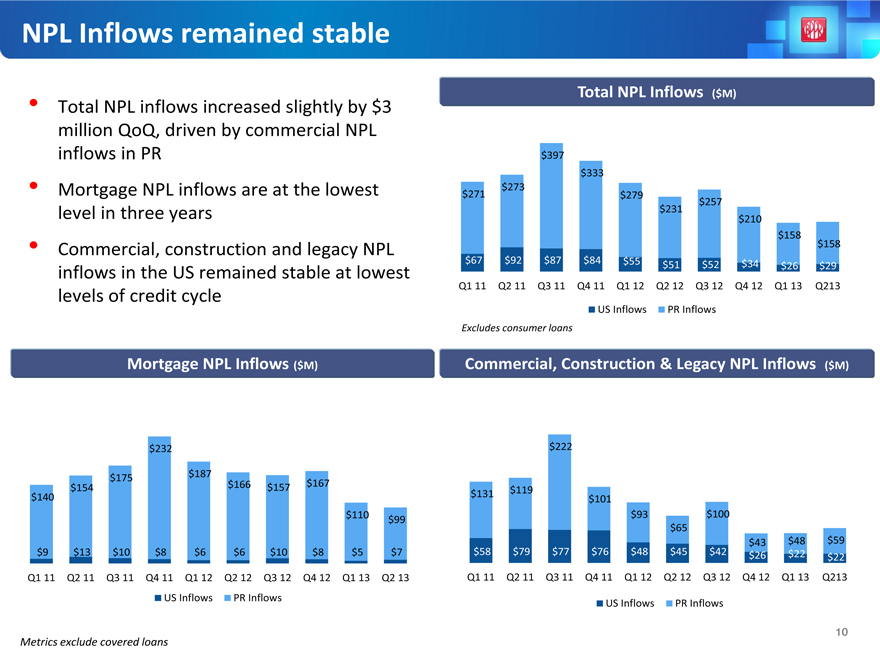
Total NPL inflows increased slightly by $3 million QoQ, driven by commercial NPL inflows in PR
Mortgage NPL inflows are at the lowest level in three years
Commercial, construction and legacy NPL inflows in the US remained stable at lowest levels of credit cycle
Total NPL Inflows ($M)
$397
$333
$273
$271 $279
$257
$231
$210
$158
$158
$67 $92 $87 $84 $55 $51 $52 $34 $26 $29
Q1 11 Q2 11 Q3 11 Q4 11 Q1 12 Q2 12 Q3 12 Q4 12 Q1 13 Q213
US Inflows PR Inflows
Excludes consumer loans
Mortgage NPL Inflows ($M) Commercial, Construction & Legacy NPL Inflows ($M)
$232 $222
$175 $187
$154 $166 $157 $167 $119
$140 $131 $101
$110 $ 93 $100
$99
$ 65
$ 43 $ 48 $ 59
$9 $13 $10 $8 $6 $6 $10 $8 $5 $7 $58 $79 $77 $76 $ 48 $ 45 $42 $ 26 $ 22 $ 22
Q1 11 Q2 11 Q3 11 Q4 11 Q1 12 Q2 12 Q3 12 Q4 12 Q1 13 Q2 13 Q1 11 Q2 11 Q3 11 Q4 11 Q1 12 Q2 12 Q3 12 Q4 12 Q1 13 Q213
US Inflows PR Inflows US Inflows PR Inflows
Metrics exclude covered loans
10
Allowance for Loan and Lease Losses (ALLL)
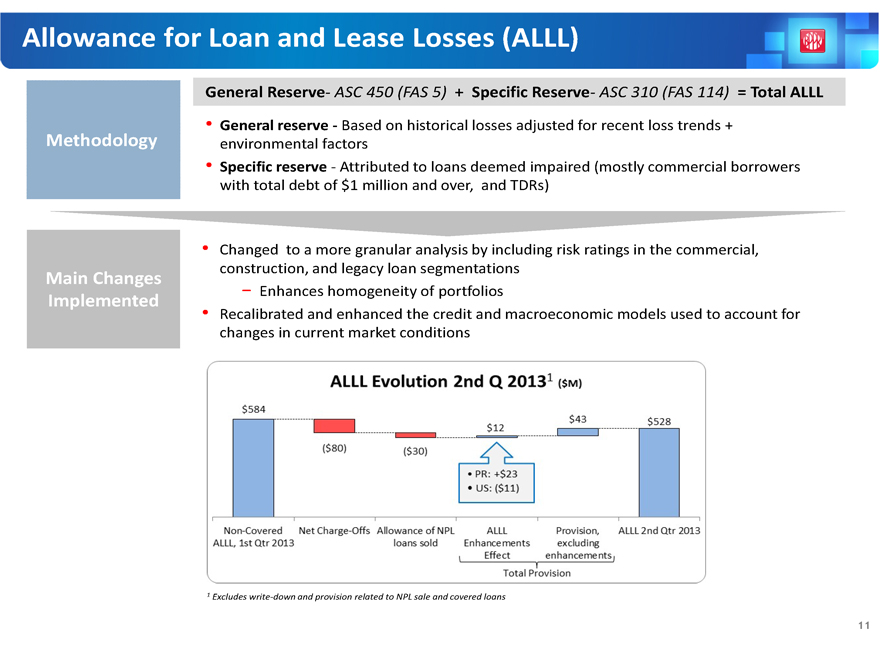
General Reserve- ASC 450 (FAS 5) + Specific Reserve- ASC 310 (FAS 114) = Total ALLL
General reserve - Based on historical losses adjusted for recent loss trends + Methodology environmental factors
Specific reserve - Attributed to loans deemed impaired (mostly commercial borrowers with total debt of $1 million and over, and TDRs)
Changed to a more granular analysis by including risk ratings in the commercial, construction, and legacy loan segmentations
Main Changes
î Enhances homogeneity of portfolios
Implemented
Recalibrated and enhanced the credit and macroeconomic models used to account for changes in current market conditions
1 Excludes write-down and provision related to NPL sale and covered loans
11
Continuous Improvement in Asset Quality
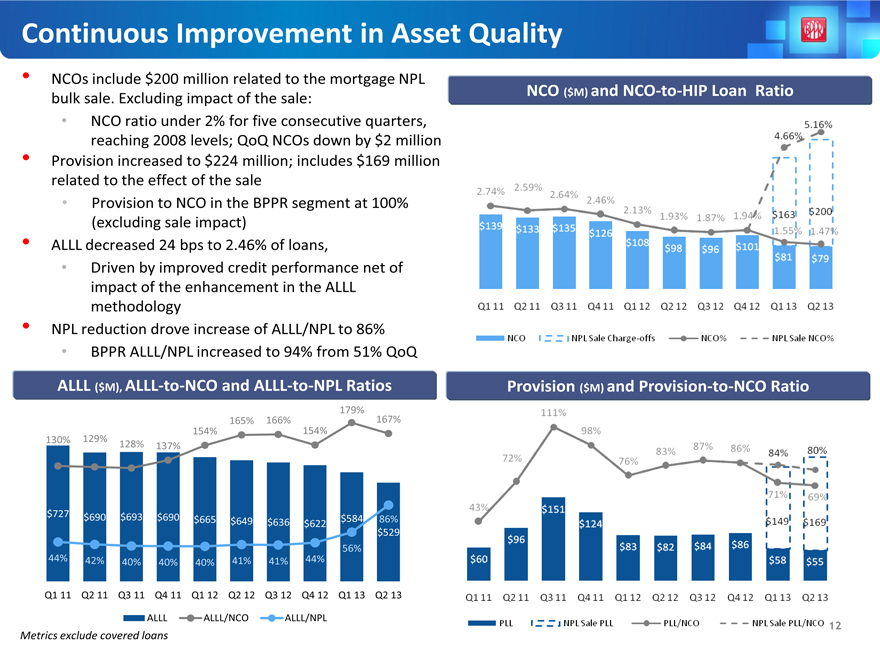
NCOs include $200 million related to the mortgage NPL bulk sale. Excluding impact of the sale:
NCO ratio under 2% for five consecutive quarters, reaching 2008 levels; QoQ NCOs down by $2 million
Provision increased to $224 million; includes $169 million related to the effect of the sale
Provision to NCO in the BPPR segment at 100% (excluding sale impact)
ALLL decreased 24 bps to 2.46% of loans,
Driven by improved credit performance net of impact of the enhancement in the ALLL methodology
NPL reduction drove increase of ALLL/NPL to 86%
BPPR ALLL/NPL increased to 94% from 51% QoQ
NCO ($M) and NCO-to-HIP Loan Ratio
ALLL ($M), ALLL-to-NCO and ALLL-to-NPL Ratios
Provision ($M) and Provision-to-NCO Ratio
179%
165% 166% 167%
154% 154%
130% 129% 128% 137%
$727 $690 $693 $690 $665 $649 $636 $622 $584 86%
$529
56%
44% 42% 40% 40% 40% 41% 41% 44%
Q1 11 Q2 11 Q3 11 Q4 11 Q1 12 Q2 12 Q3 12 Q4 12 Q1 13 Q2 13
ALLL ALLL/NCO ALLL/NPL
Metrics exclude covered loans
12
Driving Shareholder Value
Earnings Capital Value
Unique franchise in PR provides strong, stable revenue-generating
capacity
With the major NPA transactions completed, Popular’s credit
metrics are now close to historical low levels and proximity to peers
Robust capital with excess Tier 1 Common Equity of $1.9 billion,
we expect to remain “well-capitalized” under the recently
announced Basel III rules issued by the Federal Reserve
Our accomplishments drive us closer to TARP exit in the most
shareholder-friendly fashion
EVTC ownership, BHD stake and optionality in US operations
13

Appendix
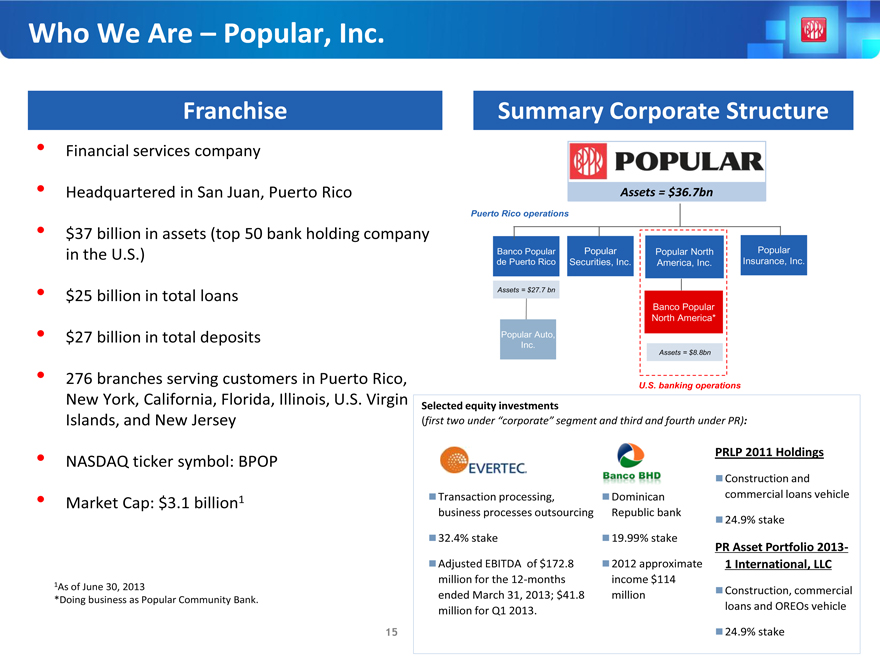
Who We Are – Popular, Inc.
Franchise
Summary Corporate Structure
Financial services company
Headquartered in San Juan, Puerto Rico
$37 billion in assets (top 50 bank holding company in the U.S.)
$25 billion in total loans
$27 billion in total deposits
276 branches serving customers in Puerto Rico, New York, California, Florida, Illinois, U.S. Virgin Islands, and New Jersey
NASDAQ ticker symbol: BPOP
Market Cap: $3.1 billion1
1As of June 30, 2013
*Doing business as Popular Community Bank.
15
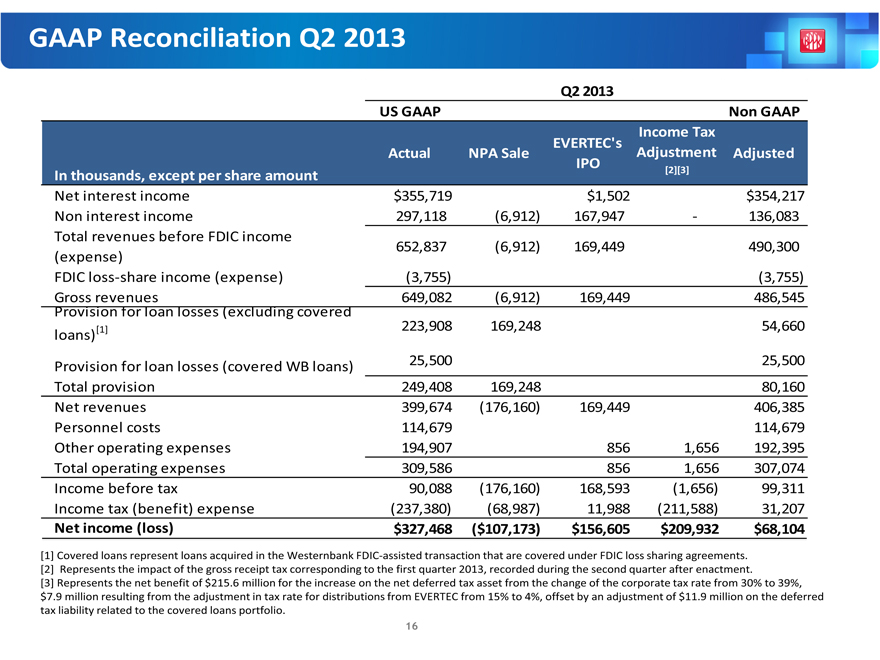
GAAP Reconciliation Q2 2013
Q2 2013
US GAAP Non GAAP Income Tax EVERTEC’s Actual NPA Sale Adjustment Adjusted IPO
[2][3]
In thousands, except per share amount
Net interest income $355,719 $1,502 $354,217 Non interest income 297,118 (6,912) 167,947 - 136,083 Total revenues before FDIC income 652,837 (6,912) 169,449 490,300 (expense) FDIC loss-share income (expense) (3,755) (3,755) Gross revenues 649,082 (6,912) 169,449 486,545 Provision for loan losses (excluding covered [1] 223,908 169,248 54,660 loans)
25,500 25,500 Provision for loan losses (covered WB loans) Total provision 249,408 169,248 80,160 Net revenues 399,674 (176,160) 169,449 406,385 Personnel costs 114,679 114,679 Other operating expenses 194,907 856 1,656 192,395 Total operating expenses 309,586 856 1,656 307,074 Income before tax 90,088 (176,160) 168,593 (1,656) 99,311 Income tax (benefit) expense (237,380) (68,987) 11,988 (211,588) 31,207
Net income (loss) $327,468 ($107,173) $156,605 $209,932 $68,104
[1] Covered loans represent loans acquired in the Westernbank FDIC-assisted transaction that are covered under FDIC loss sharing agreements. [2] Represents the impact of the gross receipt tax corresponding to the first quarter 2013, recorded during the second quarter after enactment.
[3] Represents the net benefit of $215.6 million for the increase on the net deferred tax asset from the change of the corporate tax rate from 30% to 39%,
$7.9 million resulting from the adjustment in tax rate for distributions from EVERTEC from 15% to 4%, offset by an adjustment of $11.9 million on the deferred tax liability related to the covered loans portfolio.
16
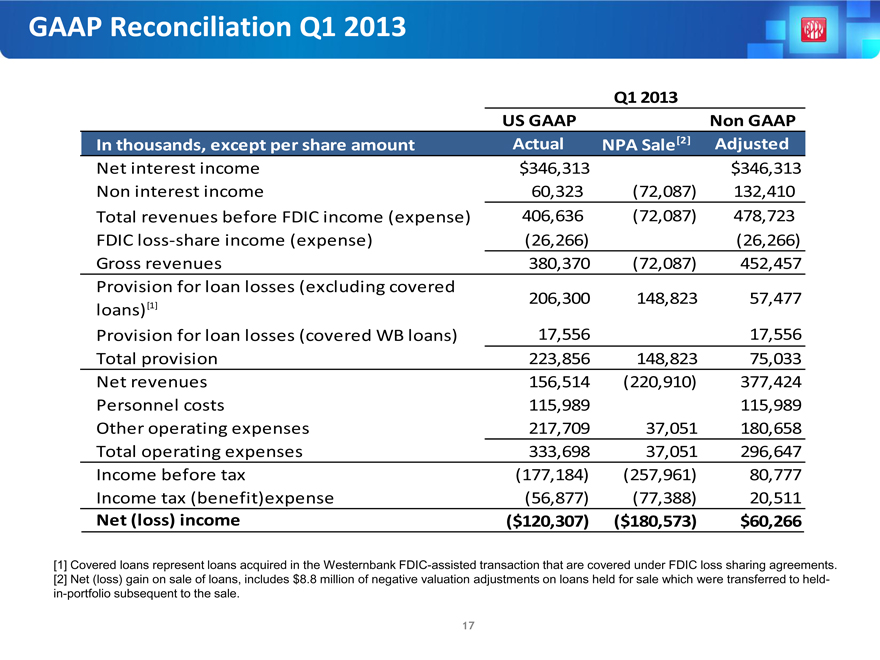
GAAP Reconciliation Q1 2013
Q1 2013
US GAAP Non GAAP
In thousands, except per share amount Actual NPA Sale [2] Adjusted
Net interest income $346,313 $346,313
Non interest income 60,323 (72,087) 132,410
Total revenues before FDIC income (expense) 406,636 (72,087) 478,723
FDIC loss-share income (expense) (26,266) (26,266)
Gross revenues 380,370 (72,087) 452,457
Provision for loan losses (excluding covered
206,300 148,823 57,477
loans) [1]
Provision for loan losses (covered WB loans) 17,556 17,556
Total provision 223,856 148,823 75,033
Net revenues 156,514 (220,910) 377,424
Personnel costs 115,989 115,989
Other operating expenses 217,709 37,051 180,658
Total operating expenses 333,698 37,051 296,647
Income before tax (177,184) (257,961) 80,777
Income tax (benefit)expense (56,877) (77,388) 20,511
Net (loss) income ($120,307) ($180,573) $60,266
[1] Covered loans represent loans acquired in the Westernbank FDIC-assisted transaction that are covered under FDIC loss sharing agreements. [2] Net (loss) gain on sale of loans, includes $8.8 million of negative valuation adjustments on loans held for sale which were transferred to held-in-portfolio subsequent to the sale.
17
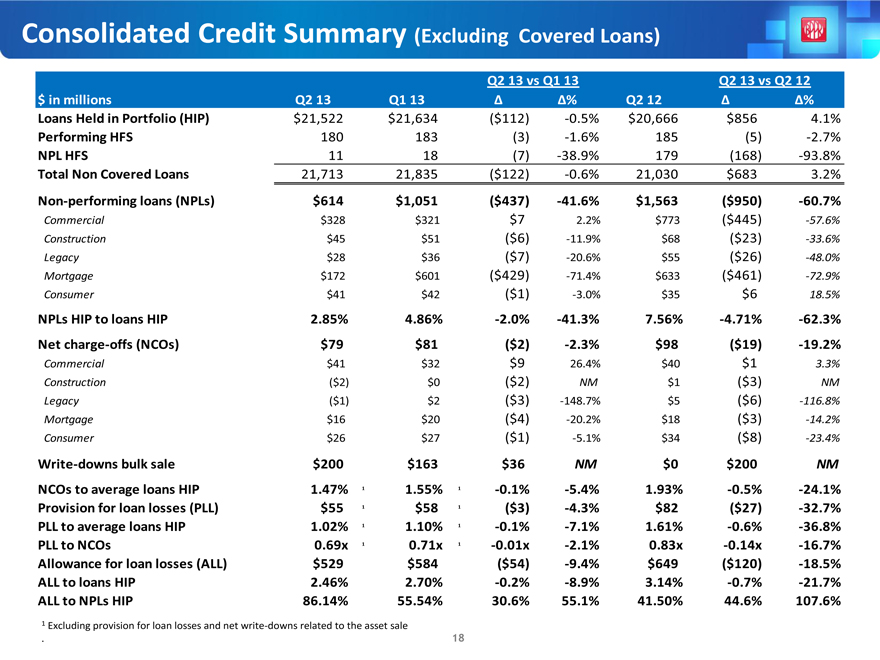
Consolidated Credit Summary (Excluding Covered Loans)
Q2 13 vs Q1 13 Q2 13 vs Q2 12
$ in millions Q2 13 Q1 13 % Q2 12 %
Loans Held in Portfolio (HIP) $21,522 $21,634 ($112) -0.5% $20,666 $856 4.1%
Performing HFS 180 183 (3) -1.6% 185 (5) -2.7%
NPL HFS 11 18 (7) -38.9% 179 (168) -93.8%
Total Non Covered Loans 21,713 21,835 ($122) -0.6% 21,030 $683 3.2%
Non-performing loans (NPLs) $614 $1,051 ($437) -41.6% $1,563 ($950) -60.7%
Commercial $328 $321 $7 2.2% $773 ($445) -57.6%
Construction $45 $51 ($6) -11.9% $68 ($23) -33.6%
Legacy $28 $36 ($7) -20.6% $55 ($26) -48.0%
Mortgage $172 $601 ($429) -71.4% $633 ($461) -72.9%
Consumer $41 $42 ($1) -3.0% $35 $6 18.5%
NPLs HIP to loans HIP 2.85% 4.86% -2.0% -41.3% 7.56% -4.71% -62.3%
Net charge-offs (NCOs) $79 $81 ($2) -2.3% $98 ($19) -19.2%
Commercial $41 $32 $9 26.4% $40 $1 3.3%
Construction ($2) $0 ($2) NM $1 ($3) NM
Legacy ($1) $2 ($3) -148.7% $5 ($6) -116.8%
Mortgage $16 $20 ($4) -20.2% $18 ($3) -14.2%
Consumer $26 $27 ($1) -5.1% $34 ($8) -23.4%
Write-downs bulk sale $200 $163 $36 NM $0 $200 NM
NCOs to average loans HIP 1.47% 1 1.55% 1 -0.1% -5.4% 1.93% -0.5% -24.1%
Provision for loan losses (PLL) $55 1 $58 1 ($3) -4.3% $82 ($27) -32.7%
PLL to average loans HIP 1.02% 1 1.10% 1 -0.1% -7.1% 1.61% -0.6% -36.8%
PLL to NCOs 0.69x 1 0.71x 1 -0.01x -2.1% 0.83x -0.14x -16.7%
Allowance for loan losses (ALL) $529 $584 ($54) -9.4% $649 ($120) -18.5%
ALL to loans HIP 2.46% 2.70% -0.2% -8.9% 3.14% -0.7% -21.7%
ALL to NPLs HIP 86.14% 55.54% 30.6% 55.1% 41.50% 44.6% 107.6%
1 Excluding provision for loan losses and net write-downs related to the asset sale
18
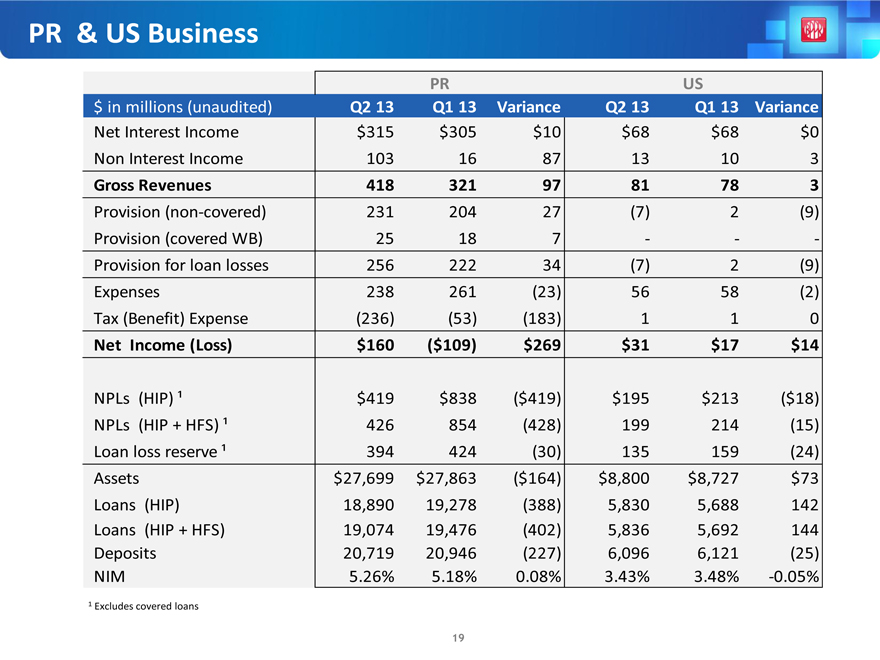
PR & US Business
PR US
$ in millions (unaudited) Q2 13 Q1 13 Variance Q2 13 Q1 13 Variance
Net Interest Income $315 $305 $10 $68 $68 $0
Non Interest Income 103 16 87 13 10 3
Gross Revenues 418 321 97 81 78 3
Provision (non-covered) 231 204 27 (7) 2 (9)
Provision (covered WB) 25 18 7 - - -
Provision for loan losses 256 222 34 (7) 2 (9)
Expenses 238 261 (23) 56 58 (2)
Tax (Benefit) Expense (236) (53) (183) 1 1 0
Net Income (Loss) $160 ($109) $269 $31 $17 $14
NPLs (HIP) ¹ $419 $838 ($419) $195 $213 ($18)
NPLs (HIP + HFS) ¹ 426 854 (428) 199 214 (15)
Loan loss reserve ¹ 394 424 (30) 135 159 (24)
Assets $27,699 $27,863 ($164) $8,800 $8,727 $73
Loans (HIP) 18,890 19,278 (388) 5,830 5,688 142
Loans (HIP + HFS) 19,074 19,476 (402) 5,836 5,692 144
Deposits 20,719 20,946 (227) 6,096 6,121 (25)
NIM 5.26% 5.18% 0.08% 3.43% 3.48% -0.05%
1 Excludes covered loans
19
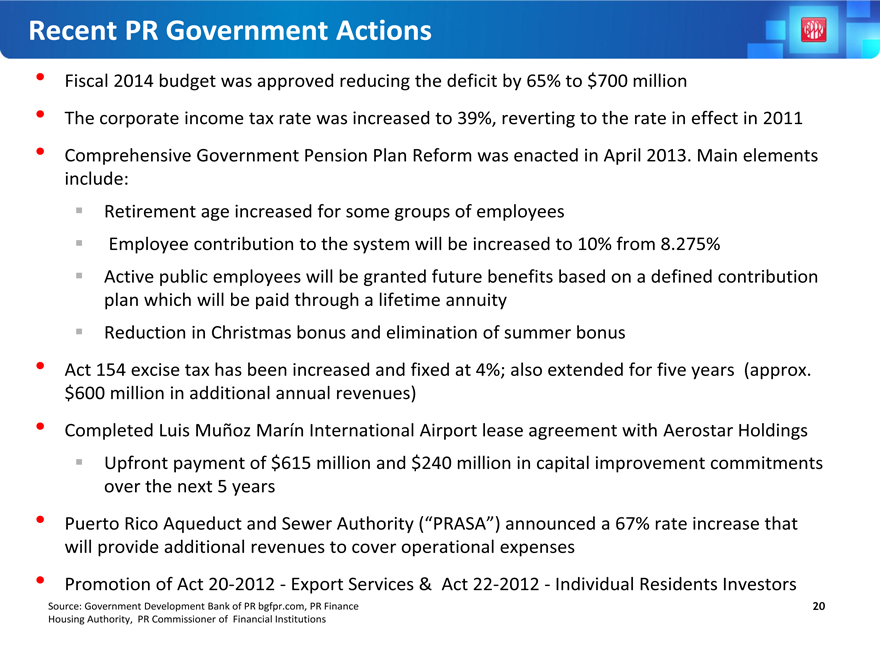
Recent PR Government Actions
Fiscal 2014 budget was approved reducing the deficit by 65% to $700 million
The corporate income tax rate was increased to 39%, reverting to the rate in effect in 2011
Comprehensive Government Pension Plan Reform was enacted in April 2013. Main elements include:
Retirement age increased for some groups of employees
Employee contribution to the system will be increased to 10% from 8.275%
Active public employees will be granted future benefits based on a defined contribution plan which will be paid through a lifetime annuity Reduction in Christmas bonus and elimination of summer bonus
Act 154 excise tax has been increased and fixed at 4%; also extended for five years (approx. $600 million in additional annual revenues)
Completed Luis Muñoz Marín International Airport lease agreement with Aerostar Holdings Upfront payment of $615 million and $240 million in capital improvement commitments over the next 5 years
Puerto Rico Aqueduct and Sewer Authority (“PRASA”) announced a 67% rate increase that will provide additional revenues to cover operational expenses
Promotion of Act 20-2012 - Export Services & Act 22-2012 - Individual Residents Investors
Source: Government Development Bank of PR bgfpr.com, PR Finance Housing Authority, PR Commissioner of Financial Institutions
20

Popular, Inc. Credit Ratings
Our senior unsecured ratings have been gradually improving since 2010:
Fitch: BB- Stable Outlook (Revised January 2013)
Moody’s: B1 Stable Outlook (Revised December 2012)
S&P: B+ Stable Outlook (No Change)
January 2013: Fitch raised to BB- from B+; outlook revised to stable
December 2012: Moody’s downgraded BPOP by two notches to B1; stable outlook assigned
April 2012: Moody’s placing most of the PR banks under review with the possibility of downgrades, due to the state of the Puerto Rico economy
January 2012: Fitch raised BPOP’s outlook to positive
December 2011: S&P raised its ratings on BPPR to BB from BB- and changed outlook to stable given revised bank criteria to regional banks
July 2011: S&P raised our senior unsecured rating by one notch to B+
As the P.R. economy stabilizes and our credit metrics improve, we should see upward pressure on the ratings
21

Financial Results Second Quarter 2013