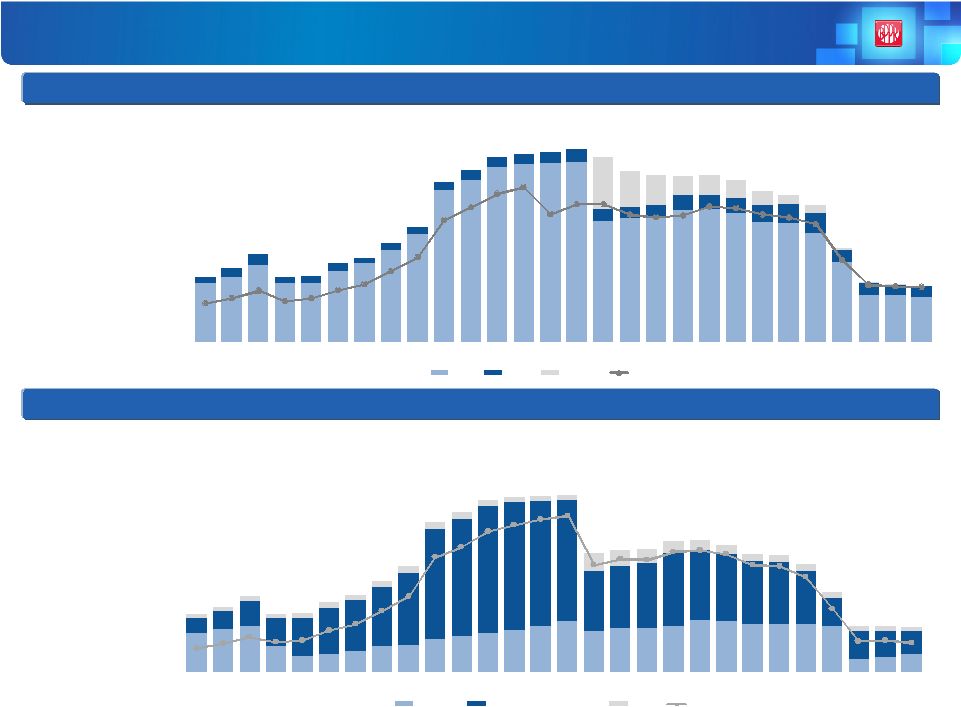
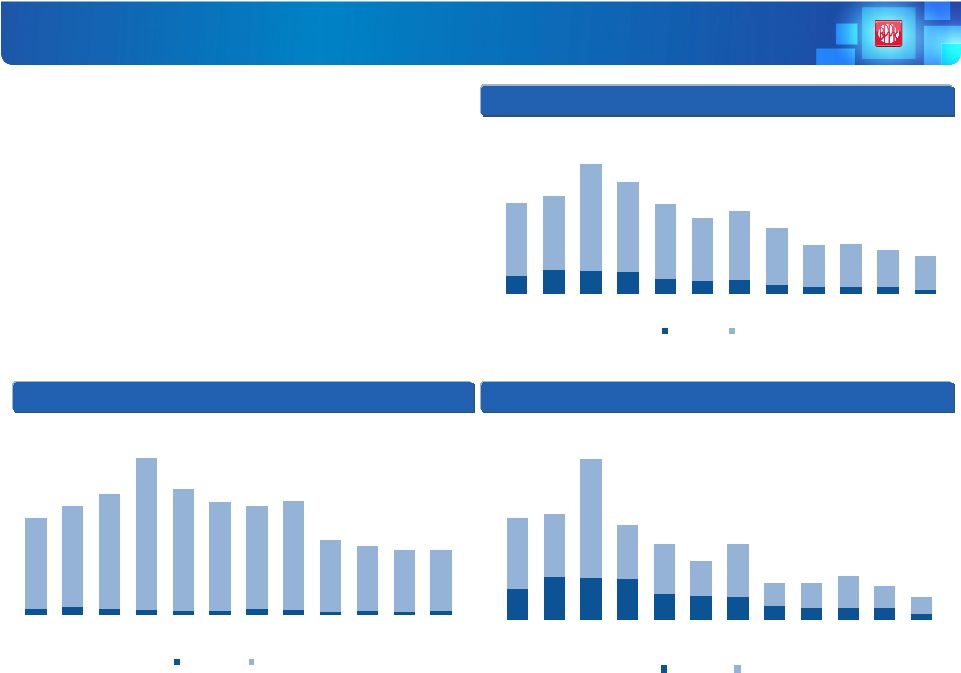
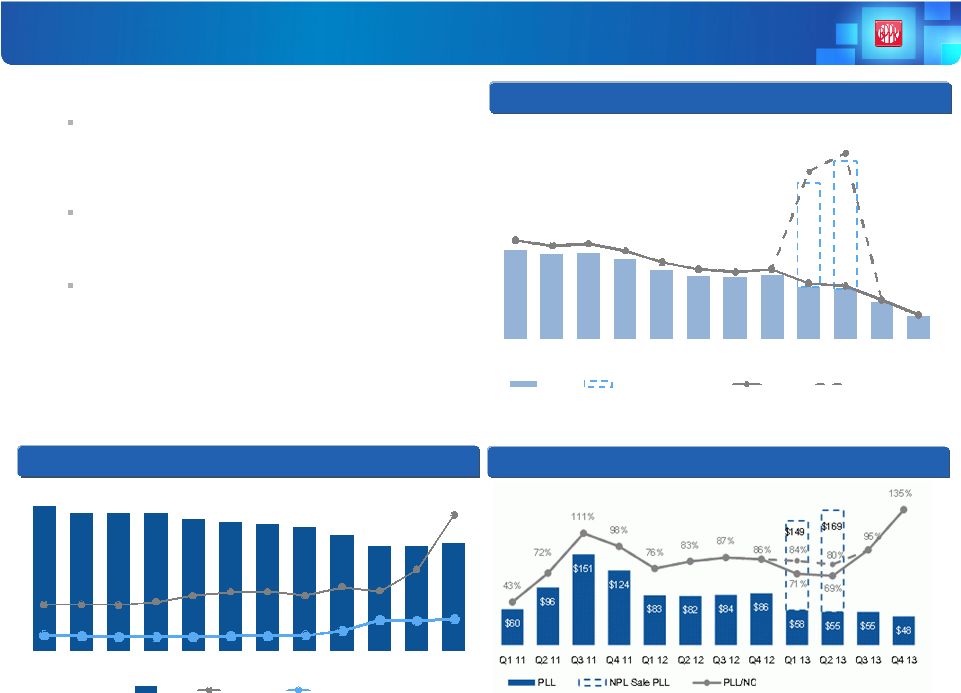
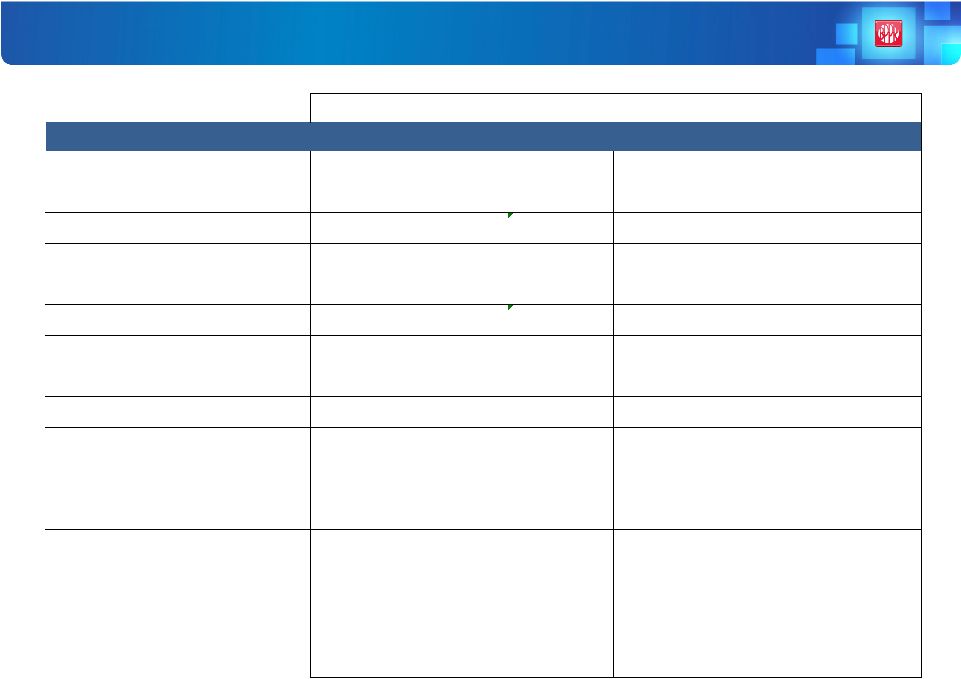
$618 $770 $858 $1,008 $771 $781 $923 $1,028 $1,203 $1,404 $1,978 $2,116 $2,276 $2,313 $2,330 $2,344 $1,572 $1,614 $1,625 $1,732 $1,738 $1,682 $1,563 $1,550 $1,425 $1,051 $614 $618 $598 2.4% 2.7% 3.1% 2.8% 2.9% 3.5% 3.9% 4.7% 5.6% 8.0% 8.7% 9.6% 10.0% 10.4% 10.6% 7.6% 7.9% 7.9% 8.4% 8.4% 8.2% 7.6% 7.5% 6.8% 4.9% 2.9% 2.9% 2.8% 0.0% 2.0% 4.0% 6.0% 8.0% 10.0 12.0 14.0 1Q 07 2Q 07 3Q 07 4Q 07 1Q 08 2Q 08 3Q 08 4Q 08 1Q 09 2Q 09 3Q 09 4Q 09 1Q 10 2Q 10 3Q 10 4Q 10 Q1 11 Q2 11 Q3 11 Q4 11 Q1 12 Q2 12 Q3 12 Q4 12 Q1 13 Q2 13 Q3 13 Q4 13 Mortgage Commercial & Construction Other NPL/Loans (HIP) $944 $859 $971 $1,142 $852 $866 $1,026 $1,101 $1,293 $1,500 $2,084 $2,245 $2,402 $2,448 $2,539 $2,623 $2,489 $2,314 $2,277 $2,254 $2,365 $2,311 $2,178 $2,120 $2,002 $1,419 $992 $944 $922 1.8% 2.1% 2.4% 1.9% 2.1% 2.5% 2.7% 3.3% 4.0% 5.7% 6.3% 6.9% 7.2% 6.0% 6.4% 6.4% 6.0% 5.8% 5.9% 6.3% 6.2% 5.9% 5.8% 5.5% 3.8% 2.7% 2.6% 2.6% 1Q 07 2Q 07 3Q 07 4Q 07 1Q 08 2Q 08 3Q 08 4Q 08 1Q 09 2Q 09 3Q 09 4Q 09 1Q 10 2Q 10 3Q 10 4Q 10 Q1 11 Q2 11 Q3 11 Q4 11 Q1 12 Q2 12 Q3 12 Q4 12 Q1 13 Q2 13 Q3 13 Q4 13 NPLs OREO NPL HFS NPAs/Total Assets Steady Improvements in Non Performing Assets • Non-performing loans held-in-portfolio declined by $19.6 million, or 3.2%, QoQ and by $827 million, or 58% YoY • NPL to loans stands at 2.8% compared to 2.9% in Q3 2013, and at the same level in Q4 2007 • QoQ improvement was driven by commercial, legacy and construction NPLs, in part offset by higher mortgage NPLs in the PR segment Non-Performing Loans HIP ($MM) 9 Non-Performing Assets ($MM) Metrics exclude covered loans • Non-performing assets declined by $21.7 million, or 2.3%, QoQ and $1.1 billion, or 54%, YoY • Steady improvements following NPA bulk sales completed during the first half of 2013 |