Exhibit 13.1

POPULAR®

CONTENTS/ÍNDICE 1 Popular, Inc. Year in Review 3 Fast Facts 5 Our Values 6 Puerto Rico In the Face of Change 8 Key Drivers Behind Solid Performance 9 Succeeding in a Challenging Regulatory Environment 10 A Transformative 2013 Supported By A Robust Infrastructure 11 Popular, Inc. Management 12 25-Year Historical Financial Summary 14 Our Creed/Our People 15 Popular, Inc. – Resumen del Año 17 Cifras a la Mano 19 Nuestros Valores 20 Puerto Rico de Cara al Cambio 22 Impulsores Claves de un Desempeño Sólido 23 Teniendo Éxito en un Ambiente Legal y Regulatorio Desafiante 24 Un 2013 Transformador Apoyado por una Infraestructura Robusta 25 Popular, Inc. Gerencia 26 Resumen Financiero Histórico – 25 Años 28 Nuestro Credo/Nuestra Gente Popular, Inc. (NASDAQ:BPOP) is a full-service, financial provider based in Puerto Rico with operations in Puerto Rico and the United States. In Puerto Rico, Popular is the leading banking institution by both assets and deposits and ranks among the largest 40 banks in the U.S. by assets. With 180 branches in Puerto Rico and the Virgin Islands, Popular offers retail and commercial banking services, as well as auto and equipment leasing and financing, mortgage loans, insurance, investment banking and broker-dealer services. In the United States, Popular has established a community-banking franchise, doing business as Popular Community Bank, providing a broad range of financial services and products with branches in New York, New Jersey, Illinois, Florida and California. Popular, Inc. (NASDAQ: BPOP) es un proveedor financiero de servicio completo con sede en Puerto Rico y operaciones en Puerto Rico y los Estados Unidos. En Puerto Rico es la institución bancaria líder tanto en activos como en depósitos y se encuentra entre los 40 bancos más grandes de Estados Unidos por total de activos. Con 180 sucursales en Puerto Rico y las Islas Vírgenes, Popular ofrece servicios bancarios a individuos y comercios, así como arrendamiento y financiamiento de autos y equipo, préstamos hipotecarios, seguros, banca de inversión y transacciones de corredores de valores. En los Estados Unidos, Popular ha establecido una franquicia bancaria de base comunitaria, que opera bajo el nombre de Popular Community Bank y provee una amplia gama de servicios y productos financieros, con sucursales en Nueva York, Nueva Jersey, Illinois, Florida y California.

POPULAR, INC. 2 01 3 A n n u a l R e p o r t Popular, Inc. Year In Review POPULAR, INC. 2 01 3 A n n u a l R e p o r t RICHARD L. CARRIÓN Chairman, President and Chief Executive Officer I am pleased to report that Popular generated strong financial results in 2013. Our financial performance was driven by robust revenues and improving credit trends, which helped offset the impact of low demand stemming from continued economic weakness in Puerto Rico, our main market. We made considerable progress in our primary areas of focus: credit quality, business growth, our U.S. operation, and efficiency and organizational excellence. CREDIT QUALITY Credit quality has been a particular area of intense focus for all financial institutions since the financial crisis of 2008, and we are no different. I am pleased by the steady progress we have made in recent years in improving our credit metrics. But 2013 was truly a turnaround year. • Non-performing assets declined dramatically, from $2 billion or 5.5 percent of assets in 2012 to $932 million or 2.6 percent of assets by the end of 2013. • This improvement was the result of a combination of strategies. During the year, we completed two bulk sales involving approximately $944 million in non-performing assets which included commercial, construction and mortgage loans as well as commercial and residential other real estate owned. In addition, our credit administration groups continued working diligently on our loss mitigation efforts and loan resolutions and restructurings. • Other encouraging results include significant reductions in net charge-offs, excluding the impact of the bulk sales, and a substantial decline in non-performing loan inflows when compared to 2012. Despite the continued weakness of the Puerto Rico economy, we have not seen significant signs of stress in our loan portfolio in Puerto Rico. We remain cautious, but are encouraged by ongoing stability in our credit quality indicators. Expanded Insights We have redesigned our annual report to provide you additional outlooks and insights into our operations and markets. In their own words, the managers who lead some of the most vital areas of our Corporation walk you through the drivers behind our strategies to maximize long-term shareholder value. In addition to our annual shareholders letter that outlines key performance indicators, we have included a deeper look into our financial performance, as well as viewpoints about our main market in Puerto Rico, our risk-management blueprint and the increasingly challenging regulatory environment. BUSINESS GROWTH In 2013, we continued to identify potential areas where we could grow our business to offset the impact of the challenging economic environment. Despite market conditions in Puerto Rico, we continued strengthening our competitive position on the island, increasing our market share in most product categories and further distancing ourselves from other financial providers. • Our total loan book increased by 4 percent in 2013, driven mainly by an increase in mortgage balances. The growth of our 1

POPULAR, INC. 2 01 3 A n n u a l R e p o r t Popular, Inc. POPULAR STOCK PRICE CHANGE VS PEERS (2013) Percent 60 50 40 30 20 10 0 -10 12/12 1/13 2/13 3/13 4/13 5/13 6/13 7/13 8/13 9/13 10/13 11/13 12/13 BPOP PR PEER AVG. US PEER AVG. KBW INDEX In 2013, we continued to identify potential areas where we could grow our business to offset the impact of the challenging economic environment. Despite market conditions in Puerto Rico, we continued strengthening our competitive position on the island, increasing our market share in most product categories and further distancing ourselves from other financial providers. mortgage portfolio was the result of strong origination volume, supplemented with several portfolio acquisitions amounting to approximately $761 million. • Initiatives to grow our auto financing business also yielded very positive results, leading to a 13 percent increase in this portfolio. • The commercial loan portfolio increased by 3 percent, with higher activity in the corporate segment offsetting lower demand in the small and middle segments, which are more susceptible to weak economic conditions. Though we are not expecting an improvement in market conditions in Puerto Rico in the short term, we have proved that we can generate healthy revenues, even in trying times, and are uniquely poised to benefit from an eventual economic recovery. POPULAR COMMUNITY BANK Popular Community Bank (PCB) has made significant progress in recent years. • Financial results have improved substantially as a result of lower credit costs and effective expense management. • However, slow demand for commercial loans remains the biggest challenge. As a result, we launched a series of niche lending initiatives to generate additional loan volume. While these efforts are still in a development stage, we have observed encouraging results in several of them. In addition, we took advantage of several opportunities to acquire loan portfolios, adding approximately $411 million in mortgages to our loan book. We still have a long way to go with regards to PCB. But these improvements put PCB in a better position and grant us greater flexibility as we evaluate strategic alternatives for our U.S. operation. Fundamental Resources And Skills Of course, the successful execution of current and future business strategies at Popular depends on the quality of our organization’s 2
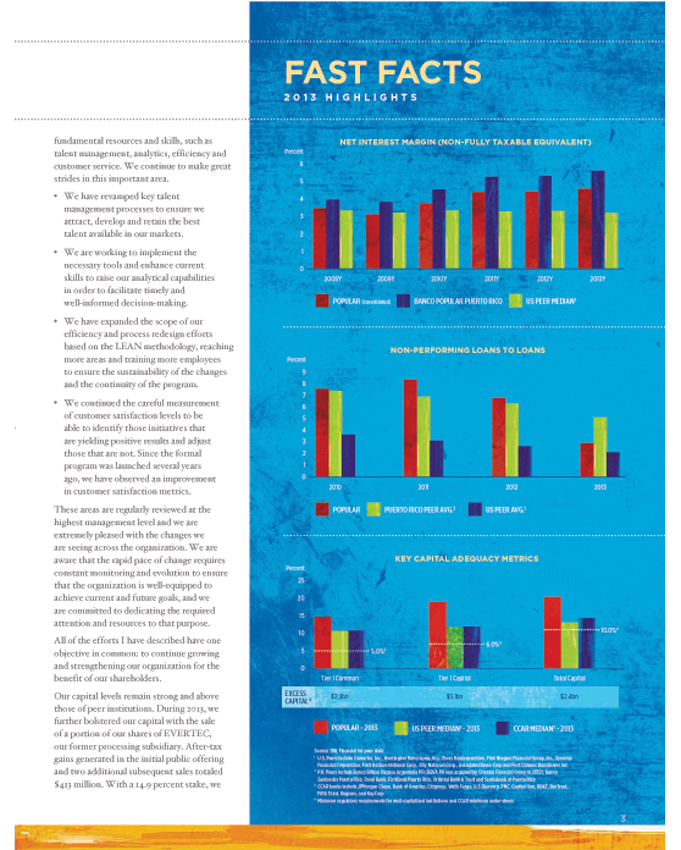
FAST FACTS 2 0 1 3 H I G H L I G H T S fundamental resources and skills, such as talent management, analytics, efficiency and customer service. We continue to make great strides in this important area. • We have revamped key talent management processes to ensure we attract, develop and retain the best talent available in our markets. • We are working to implement the necessary tools and enhance current Percent 6 5 4 3 2 1 0 NET INTEREST MARGIN (NON-FULLY TAXABLE EQUIVALENT) skills to raise our analytical capabilities in order to facilitate timely and 2008Y 2009Y 2010Y 2011Y 2012Y 2013Y well-informed decision-making. • We have expanded the scope of our efficiency and process redesign efforts POPULAR (consolidated) BANCO POPULAR PUERTO RICO US PEER MEDIAN1 based on the LEAN methodology, reaching more areas and training more employees to ensure the sustainability of the changes and the continuity of the program. • We continued the careful measurement of customer satisfaction levels to be able to identify those initiatives that are yielding positive results and adjust those that are not. Since the formal program was launched several years ago, we have observed an improvement Percent 9 8 7 6 5 4 3 2 1 0 NON-PERFORMING LOANS TO LOANS in customer satisfaction metrics. These areas are regularly reviewed at the highest management level and we are extremely pleased with the changes we are seeing across the organization. We are 2010 POPULAR 2011 PUERTO RICO PEER AVG.2 2012 US PEER AVG.1 2013 aware that the rapid pace of change requires constant monitoring and evolution to ensure that the organization is well-equipped to achieve current and future goals, and we are committed to dedicating the required attention and resources to that purpose. All of the efforts I have described have one objective in common: to continue growing and strengthening our organization for the Percent 25 20 15 10 5 0 5.0%4 KEY CAPITAL ADEQUACY METRICS 6.0%4 10.0%4 benefit of our shareholders. Our capital levels remain strong and above those of peer institutions. During 2013, we further bolstered our capital with the sale EXCESS CAPITAL 4 Tier 1 Common Tier 1 Capital Total Capital $2.3bn $3.1bn $2.4bn of a portion of our shares of EVERTEC, our former processing subsidiary. After-tax POPULAR - 2013 Source: SNL Financial for peer data US PEER MEDIAN1 - 2013 CCAR MEDIAN3 - 2013 gains generated in the initial public offering and two additional subsequent sales totaled $413 million. With a 14.9 percent stake, we 1 U.S. Peers include Comerica, Inc., Huntington Bancshares, Inc., Zions Bancorporation, First Niagara Financial Group, Inc., Synovus Financial Corporation, First Horizon National Corp., City National Corp., Associated Banc-Corp and First Citizens Bancshares Inc. ² P.R. Peers include Banco Bilbao Vizcaya Argentaria PR (BBVA PR was acquired by Oriental Financial Group in 2012), Banco Santander Puerto Rico, Doral Bank, FirstBank Puerto Rico, Oriental Bank & Trust and Scotiabank of Puerto Rico 3 CCAR banks include JPMorgan Chase, Bank of America, Citigroup, Wells Fargo, U.S. Bancorp, PNC, Capital One, BB&T, SunTrust, Fifth Third, Regions, and KeyCorp Minimum regulatory requirements for well-capitalized institutions and CCAR minimum under stress 3 POPULAR, INC. 2 01 3 A n n u a l R e p o r t

POPULAR, INC. 2 01 3 A n n u a l R e p o r t Popular, Inc. Year In Review If I have learned one thing in recent years, it is that our people, 8,000 strong, thrive in the most difficult of times and outdo themselves under challenging circumstances. remain a large shareholder of EVERTEC, which continues to be an important business partner and a source of income for Popular. Given our strong capital levels, there has been significant interest regarding the timing and structure of an eventual repayment of TARP funds. We are eager and ready to repay TARP. In October of 2013, we submitted a formal application to our regulators indicating our desire to repay and we remain in constant communication with them regarding this matter. While we cannot provide specific details on the repayment plan yet, let me reassure you that our objective is, and has always been, to repay these funds in a manner that is most beneficial for our shareholders. The upward trend in our stock price during 2012 continued in the early months of 2013, and the stock price had risen 65 percent by mid-August. However, the share price began to deteriorate as concerns with Puerto Rico’s fiscal and economic situation began to grow. Notwithstanding the decline in the second half of the year, BPOP closed 2013 at $28.73, an increase of 38 percent when compared with 2012. OUR ORGANIZATION As we announced in January of 2013, Jorge A. Junquera, who had served as our Chief Financial Officer (CFO) for 16 years, assumed the role of Vice-Chairman and Special Assistant to the CEO. Carlos J. Vázquez, who has held various important positions in our organization, succeeded Jorge as CFO. The transition was better than seamless, with both Jorge and Carlos growing into their new roles for the benefit of the organization. Our Board of Directors also received a significant inflow of talent and energy with the appointment of Joaquín E. Bacardí, III and John W. Diercksen. Mr. Bacardí is the President and Chief Executive Officer of Bacardi Corporation, a major producer and distributor of rum and other spirits. He brings extensive experience in the development and implementation of international marketing, sales and distribution strategies from more than 20 years of service at Bacardí. Mr. Diercksen was an Executive Vice President of Verizon Communications, Inc., responsible for key strategic initiatives related to the review and assessment of potential mergers, acquisitions and divestitures. Joaquín and John bring valuable skills and experience to Popular that will undoubtedly enrich our Board’s discussions and decisions. Popular has a first- rate Board of Directors and I consider it a privilege to have their guidance and support. I extend my most sincere gratitude to all of the Directors for their continued leadership. The year 2013 marked our 120th anniversary. Throughout 2013, we celebrated our history and reaffirmed our values, recognizing that they are at the core of everything we do. These values clearly spell out our commitment to our customers, our employees, our communities and our shareholders, as well as the principles that guide our behavior – innovation, integrity and excellence. In conclusion, we are proud of Popular’s achievements in 2013, but we are far from satisfied. The year 2014 brings its own set of challenges. The Puerto Rican economy has not recovered as we expected a year ago, and the island’s fiscal troubles will likely complicate matters going forward. Our operations in the U. S., while improving, are still not where we need them to be. Meanwhile, the regulatory environment and its requirements place increasing pressure on all financial institutions. Still, I am confident we are facing these challenges from a position of strength. Our revenue-generating capacity is formidable, thanks to our unique franchise in Puerto Rico. After a multi-year effort, credit quality is at or close to normalized levels. We continue to have a robust capital base, even as we seek to repay TARP. We are actively evaluating alternatives to improve the performance of our operations in the U.S. And we have buttressed those areas responsible for managing heightened regulatory requirements. If I have learned one thing in recent years, it is that our people, 8,000 strong, thrive in the most difficult of times and outdo themselves under challenging circumstances. We are aware of the headwinds we are facing, but we are also optimistic about the opportunities that lie ahead of us. We have clear objectives, the right team to pursue them and the determination to achieve them.I thank you for your continued support. Sincerely, RICHARD L. CARRIÓN CHAIRMAN, PRESIDENT AND CHIEF EXECUTIVE OFFICER 4

POPULAR, INC. 2 01 3 A n n u a l R e p o r t Our Values Social Commitment We work hand-in-hand with our communities. We are committed to actively promote the social and economic well-being of our communities. Customer We develop life-long relationships. Our relationship with the customer takes precedence over any particular transaction. We add value to each interaction by offering high quality personalized service, and efficient and innovative solutions. Integrity We live up to the trust placed in us. We adhere to the strictest ethical and moral standards through our daily decisions and action. Excellence We strive to excel each day. We believe there is only one way to do things: doing them right the first time while exceeding expectations. Innovation We are a driving force for progress. We foster a constant search for innovative ideas and solutions in everything we do, thus enhancing our competitive advantage. Our People Performance We have the best talent. We are leaders and work together as a team in a caring and disciplined environment. We are fully committed to our shareholders. We aim to attain a high level of efficiency, both individually and as a team, to achieve superior and consistent financial results based on a long-term vision. 5

POPULAR, INC. 2 01 3 A n n u a l R e p o r t Puerto Rico In the Face of Change The inauguration of the former art-deco headquarters of Banco Popular de Puerto Rico on April 11, 1939 sent a strong message of local resilience near the end of The Great Depression, from which Puerto Rico recovered to transform its economy from agrarian to industrial. Today, the building in the historic Old San Juan hosts the Banco Popular Foundation, a full-fledged branch and an exhibition hall where it explores socioeconomic issues of Puerto Rico. RicHARd cARRión Chairman, President and Chief Executive OfficerPUeRto Rico is on tHe cUsP oF An iMPoRtAnt tRAnsFoRMAtion. The legacy of decades of fiscal mismanagement and the toll of a prolonged recession have combined with a shifting global economy and a lower risk tolerance in the wake of the international financial crisis to create what some have called a perfect storm. 6 Without minimizing the extent of the challenges Puerto Rico faces, we remain optimistic about the prospects of Puerto Rico emerging from the current situation with a stronger and more vibrant economy. This optimism does not stem from blind faith. It comes from experience. The 120-year history of Popular has allowed us to witness events such as a change in sovereignty, two world wars, the Great Depression and devastating hurricanes. Throughout this history, we have seen Puerto Rico transform itself time and time again, a testament to our resilience and resourcefulness. The most important metamorphosis of the last century – the economy’s transformation from agrarian to industrial – produced a dramatic increase in standards of living, a gross domestic product per capita that, despite the recent years of stagnation, is the highest in Latin America and a manufacturing infrastructure that is recognized around the world for its leadership in pharmaceutical and medical- device products. We are now at the threshold of a second economic transformation – from an industrial to a knowledge-based and services economy. Readymade infrastructure, tested human capital, high enrollment in local universities, a modern communications and transportation infrastructure and a

POPULAR, INC. 2 01 3 A n n u a l R e p o r t solid legal and institutional framework are pillars Puerto Rico can build on. Leading institutional investors are taking notice. …we look forward to the opportunities that will arise from this important moment in our history, just as they have from past junctures… Stateside and local investors have purchased $1.6 billion in commercial and real estate assets in a span of three years. The local government has taken major steps toward addressing its fiscal issues and has enacted serious reforms to its public- pension system. We see a path of fiscal reconstruction similar to various countries with similar debt levels that, after serious fiscal reforms, have regained market access at favorable rates. Additional changes, however, are necessary to speed up an economic recovery and put the economy on a track of sustainable growth. Two areas we see as requiring urgent attention are energy and taxes. Reducing the high cost of energy on our island will liberate substantial capital for businesses and consumers and is critical to the long-term competitiveness of the island. Puerto Rico’s public electric utility sold energy to consumers, businesses and manufacturers at an average of 26 cents per kWh for the past three years. That is nearly three times more expensive than the average retail price of electricity per U.S. state (10.6 kWh). Opening energy generation to private and public-private partnerships can lower energy costs by generating competition and facilitate investment in natural gas and other clean sources of energy. Overhauling our tax system can generate greater stability in revenues, promote self-sufficiency and relieve workers and businesses from carrying the tax burden of a substantially large cash economy. New levies have generated additional revenues in the current fiscal year. While this has provided some relief to the government, we see it as only a short-term solution, not a long-term policy. There is room to maneuver into a more equitable and productive tax system. For example, while income taxes generated 30% of revenues in fiscal 2012, property taxes only accounted for about 4% of revenues. Most of the island’s residences are exempt from paying property taxes. Amid current economic pressures, Puerto Rico would be served best by a tax system that is more efficient to administer, simpler to comply with and better tuned to the island’s economic realities and persistent evasion. These actions are feasible. There is consensus across diverse circles that these two major issues need to be addressed. The private sector also has to adjust to these new economic realities by developing new products and services and finding untapped markets. Puerto Rican businesses can leverage our unique position in the hemisphere, which benefits from our relationship with the largest economy in the world as well as our cultural affinity with Latin America. We are encouraged by the healthy level of reinvention we see among the 1.5 million clients we serve at Banco Popular. We have financed acquisitions of nonoperational plants for local businesses that have successfully turned them into multipurpose operations serving local and regional markets. We are seeing new opportunities unfold in the tourism sector, which has recently drawn substantial investments from local and stateside investors, as it registered the highest number of hotel check-ins and occupancy rate in the last eight years. We are encouraged by plans to revitalize old industries with potential in the current global economy like the sugar cane industry, which can generate economic activity by helping lower the production costs of local rum distilleries that currently buy raw materials in international markets. We are inspired by the resolve of entrepreneurs and technicians who with hard work and careful study have expanded their local businesses to international markets. These are some pixels that form part of a larger emerging picture encouraging us to look beyond the current headlines. Popular has a privileged position with a broad view of the economy we have been an important part of for more than a century. We recognize and are prepared for the challenges ahead. But, more importantly, we look forward to the opportunities that will arise from this important moment in our history, just as they have from past junctures, and stand ready to actively support Puerto Rico in this new transformation.

POPULAR, INC. 2 01 3 A n n u a l R e p o r tKey Drivers Behind cARLos J. VAZQUeZ Executive Vice President Chief Financial Officer Popular, Inc. President Popular Community Bank2013 marked yet another set of notable improvements for Popular. With our third consecutive year of healthy profitability, our franchise continues to demonstrate its ability to yield reasonable returns even in a Percent 12 10 8 6 4 2 0 2009 tAnGiBLe coMMon eQUitY/tAnGiBLe Assets 2010 2011 2012 2013 BPOP 11.08 PEER AVG. 8.26 challenging economic environment. Credit quality improvements, strong earnings and healthy capital levels were key drivers of our solid performance and will surely be the cornerstones of our future results. Popular’s adjusted net income of $256 million was up 4% from 2012, as we remained focused on creating revenue opportunities while effectively managing credit and overhead costs. Our adjusted gross revenues Driving our earnings power are spread levels above our peers, which result from strong asset yields and funding costs that have improved every quarter for more than four years. and our minority ownership in Centro Financiero BHD, which includes one of the largest banks in the Dominican Republic, form the foundation of our capital management efforts. Specifically, we seek to maintain strong capital levels appropriate for Popular’s risk profile; strive toward our target of a for the year stayed strong at $1.9 billion while the loan loss provision, excluding bulk sales, double digit return on tangible equity; and eventually pursue – with the approval of fell by $124 million to a level comparable to our normalized target. Driving our earnings power are spread levels above our peers, which result from strong asset yields and funding costs that have improved every quarter for more than four years. Popular’s net interest margin (NIM) for 2013 increased to 4.52%, up 16 basis points from 2012 levels. Continued improvements in actual and projected cash flows from our covered portfolio (Westernbank) contributed to the stability of our NIM. While organic loan growth in Puerto Rico remains limited, we plan to offset this impact through selective loan portfolio purchases. Operating expenses stayed somewhat elevated due mainly to the expenses stemming from the workout of our covered loan portfolio. As credit continues to normalize, we expect additional savings in costs related to our credit management efforts, including reductions in legal fees, appraisals and OREO expenses. We are confident that these efforts, ahead of the 2015 expiration of our loss-sharing agreement of commercial loans with the FDIC, will lead to a lower cost base in the coming years. Managing the expense side of our operations is still a top priority, and we are committed to capturing every opportunity to do so. Our stress-testing and capital planning programs are robust, as we have permanently reallocated resources to bolster these important management and regulatory processes. The power of substantial internal capital generation from improved operating earnings, alongside additional sources of value in our remaining stake in EVERTEC our regulators – other capital management and distribution strategies, including the repayment of TARP. With two thirds of our managers holding Popular stock, our leadership continues to work with a great shared interest and a motivated ownership approach. Popular’s stock valuation is not immune to the uncertainties now confronting Puerto Rico – our principal market. Having said that, we are confident that our fundamental strengthening of Popular’s credit condition, liquidity, market share and capital base should result in a valuation that better reflects our tangible book value and underlying earning capacity. 8

Succeeding in a Challenging Regulatory Environment POPULAR, INC. 2 01 3 A n n u a l R e p o r t IGNACIO ÁLVAREZ Executive Vice President Chief Legal Officer General Counsel & Corporate Matters Group Popular, Inc.Like all financial institutions, we are working hard to address the challenges of succeeding in a rapidly evolving and increasingly demanding regulatory environment. Banking has always been a highly regulated industry, but today’s pace and sheer amount of regulatory and legal changes affecting the banking industry are unprecedented. The Dodd-Frank Wall Street Reform and CAPITAL During the financial crisis, the banking industry suffered a significant reduction in capital due to substantial credit losses. As a result, regulators continue to push for high capital ratios and enhanced stress testing processes. Our current robust capital levels, however, will allow us to comply with the additional requirements mandated under Basel III, without having to raise new capital. Notwithstanding that, as an institution, we will have to continue to review our balance sheet and product offerings carefully to determine proactively whether we should emphasize growth in certain asset classes and deemphasize it in others. substantial human and financial resources to conform our mortgage and other consumer products to these new CFPB requirements. We remain focused on these evolving regulations to make sure that our product and service offerings comply with all regulatory requirements as well as the needs of our clients. GOVERNANCE In this new environment, regulators expect greater involvement from senior management and the board of directors in overseeing regulatory and compliance issues. At Popular, we believe that good governance is a key element of our success, as evidenced by our strong governance Protection Act of 2010 (the “Dodd -Frank framework. As this area continues to Act”) is the most significant and far-reaching legislation affecting the banking industry since the Great Depression. Failure to comply with these new regulations can result not only in massive fines or other penalties, but can also trigger corrective actions that entail considerable financial expenditures and investment of human capital. In our case, the challenge is even greater due to the difficult economic environment in our principal market, Puerto Rico. The Puerto Rican government’s current fiscal problems will continue to challenge the local macro- economic environment, and we will seek more creative ways to meet the needs of our clients given this and other challenges. These regulatory changes will result in additional costs and administrative burdens that will undoubtedly lead to structural changes in how financial institutions develop and deliver products and services to their clients. At Popular, we are approaching this new reality as an opportunity to review and transform our processes and systems to better serve our clients. Some of the principal changes facing our institution will be in the areas of capital and compliance regulations: At Popular, we are approaching this new reality as an opportunity to review and transform our processes and systems to better serve our clients. COMPLIANCE As a bank with large retail operations, we have put a strong emphasis on compliance. Following the financial crisis, regulators have given greater weight to compliance issues and have found major compliance breakdowns at a number of large financial institutions that resulted in enforcement actions with significant fines and penalties. One important result was the creation of the Consumer Financial Protection Bureau (CFPB), which is the first federal regulatory agency dedicated exclusively to the protection of consumers of financial services and products. The CFPB has given particular attention to mortgage origination and servicing, as well as fair lending and consumer lending activities, such as credit cards and auto loans. We have dedicated evolve, we will continue to review our processes on a regular basis to identify further enhancements. In the last four years, we increased the diversity and skill set of our board with the addition of six new directors – better equipping the board to help us meet these new governance challenges. LOOKING AHEAD The regulatory environment is driving significant change in the banking industry, and it will have a major impact on how we structure the products and services we offer our clients. Banks that do a better job of rapidly adapting to this new paradigm will have a more favorable opportunity to grow their business. Those who fail to change face not only the loss of clients, but also enormous legal and reputational risks. At Popular, we are keenly aware of how much is at stake, and we are dedicating the time, resources and management focus to ensure that we continue to thrive in this new environment. 9

POPULAR, INC. 2 01 3 A n n u a l R e p o r tA Transformative 2013 Supported By A Robust Infrastructure LIDIO SORIANO Executive Vice President of Popular, Inc. Corporate Risk ManagementLast year was transformative for Popular. In the face of a challenging economic and regulatory environment, we have reduced total non-performing assets (including covered loans) and our net charge-off ratio to their lowest levels since 2007. Although this decrease was driven in part by two large bulk sales of loan portfolios in Puerto Rico and improving credit 1) Strengthening our loan and appraisal review functions by expanding our loan and appraisal review teams; 2) Creating a Quantitative Analysis Unit, currently made up of seven full-time analysts with economic and statistics backgrounds, to expand our modeling capabilities. Our Analytics team has designed performance models with diverse macroeconomic variables, expanded file-security controls and enhanced personal loans and leases models by moving from product-level to loan-level models. Our unit has also developed a system for procedural documentation per model. strategy to succeed within the current economic and regulatory environment. We no longer have a national lending platform or a subprime consumer and mortgage business on the U.S. mainland. We are now a U.S. community bank and niche lender, with a much lower risk profile. This change has reduced our U.S. mainland non-performing legacy loans held-in-portfolio to only $15.1 million at the end of 2013. In Puerto Rico, our commercial exposure, including construction loans, decreased from 55% of our total loan book to 42%. Construction lending has declined 85% and stands at only $161 million as conditions in the U.S., we would not have achieved these latest lows without the mainstays of sound credit management: effective underwriting and loss-mitigation efforts, with successful resolutions and restructurings. These primary risk-management functions were supported by a sound and well-fortified infrastructure. For the past two years we have strengthened our risk-management division to operate effectively in what will certainly be a more heavily regulated environment once significant CONSOLIDATED CREDIT QUALITY summary (Excluding Covered Loans)$ in millions 2011 2012 20133) Installing a dynamic risk-monitoring of December 31, 2013. We have also reduced exposure to commercial loan segments with historically high losses in Puerto Rico, mainly loans to small and medium-sized businesses. A disproportionate level (91%) of total commercial charge-offs occurred in these portfolios during the downturn of the local economy. In the Puerto Rico consumer portfolio, secured exposures increased from 66% 84.76% at the beginning of the financial crisis to 76% at the end of 2013. These changes in our risk profile regulatory changes and uncertainties unfold fully. Two months into 2014, the timing and implementation of a number of provisions of The Dodd-Frank Wall Street Reform and Consumer Protection Act of 2010, among other regulatory initiatives, are still being finalized. Also, the newly created Consumer Financial Protection Bureau (CFPB) is introducing a number of additional regulations, including mortgage-lending reform. Against this backdrop, we reinforced and redesigned areas of our risk-management framework with multi-million dollar investments in new resources. These measures include: system that integrates customer-risk profiles with due-diligence to better ensure consumer compliance and improve customer experience. 4) Investing in a new mortgage origination and servicing platform to meet new CFPB regulatory requirements As a result of these investments in new resources, along with other measures taken, we are in an even stronger position to face the rapidly evolving regulatory environment. RISK PROFILE Given our current exposures and risk profile, we are confident about our future. Since the financial crisis, we have adapted our business are among the main drivers behind our portfolio’s positive credit trends. LOOKING AHEAD Heading into 2014, we remain cautious, given the changing regulatory environment and the economic challenges in our main market in Puerto Rico. At the same time, we are encouraged by the performance and profile of our credit exposure and the enhancements we have made to solidify further our risk management infrastructure. We strongly believe that Popular is well positioned to capitalize on emerging opportunities. 10

POPULAR, INC. POPULAR, INC. 2 01 3 A n n u a l R e p o r t EXECUTIVE OFFICERS RICHARD L .. CARRIÓN Chairman, President and Chief Executive Officer Popular, Inc. CARLOS J. VÁZQUEZ Executive Vice President Chief Financial Officer Popular, Inc. President Popular Community Bank IGNACIO ÁLVAREZ Executive Vice President Chief Legal Officer General Counsel & Corporate Matters Group Popular, Inc. ILEANA GONZÁLEZ Executive Vice President Commercial Credit Administration Group Banco Popular de Puerto Rico JUAN GUERRERO Executive Vice President Financial & Insurance Services Group Banco Popular de Puerto Rico GILBERTO MONZÓN Executive Vice President Individual Credit Group Banco Popular de Puerto Rico EDUARDO J. NEGRÓN Executive Vice President Administration Group Popular, Inc. NÉSTOR O. RIVERA Executive Vice President Retail Banking and Operations Group Banco Popular de Puerto Rico ELI SEPÚLVEDA Executive Vice President Popular, Inc.Commercial Credit Group Banco Popular de Puerto Rico LIDIO SORIANO Executive Vice President Chief Risk Officer Corporate Risk Management Group Popular, Inc. BOARD OF DIRECTORS RICHARD L . CARRIÓN Chairman, President and Chief Executive Officer Popular, Inc. JOAQUÍN E. BACARDÍ, III President and Chief Executive Officer Bacardi Corporation ALEJANDRO M. BALLESTER President Ballester Hermanos, Inc. JOHN DIERCKSEN Principal Greycrest, LLC. MARÍA LUISA FERRE President and Chief Executive Officer Grupo Ferré Rangel DAVID E. GOEL Managing General Partner Matrix Capital Management Company, LLC C. KIM GOODWIN Private Investor WILLIAM J. TEUBER JR. Vice Chairman EMC Corporation CARLOS A. UNANUE President Goya de Puerto Rico 11
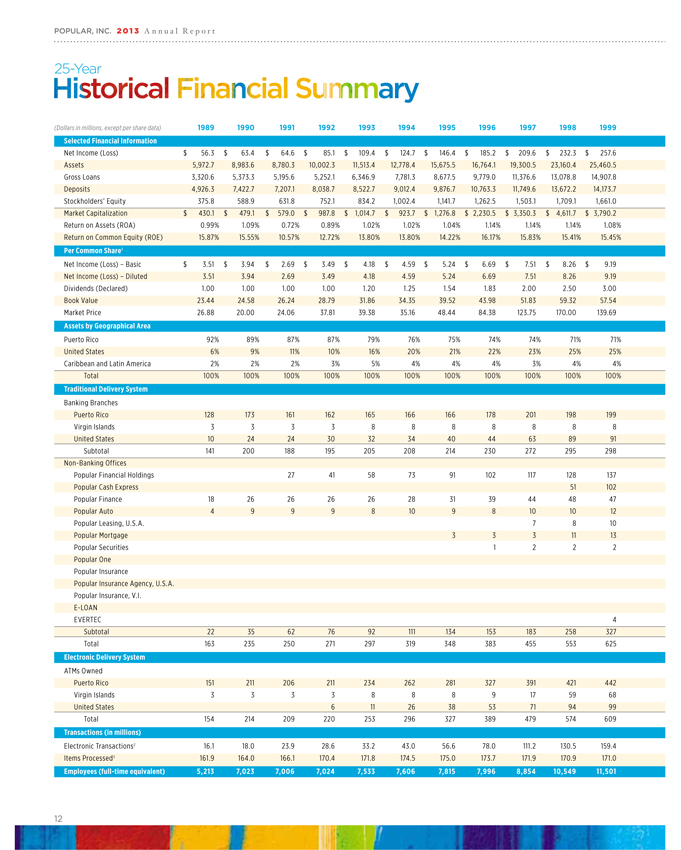
POPULAR, INC. 2 01 3 A n n u a l R e p o r t 25-Year Historical Financial Summary (Dollars in millions, except per share data) 1989 1990 1991 1992 1993 1994 1995 1996 1997 1998 1999 Selected Financial Information Net Income (Loss) $ 56.3 $ 63.4 $ 64.6 $ 85.1 $ 109.4 $ 124.7 $ 146.4 $ 185.2 $ 209.6 $ 232.3 $ 257.6 Assets 5,972.7 8,983.6 8,780.3 10,002.3 11,513.4 12,778.4 15,675.5 16,764.1 19,300.5 23,160.4 25,460.5 Gross Loans 3,320.6 5,373.3 5,195.6 5,252.1 6,346.9 7,781.3 8,677.5 9,779.0 11,376.6 13,078.8 14,907.8 Deposits 4,926.3 7,422.7 7,207.1 8,038.7 8,522.7 9,012.4 9,876.7 10,763.3 11,749.6 13,672.2 14,173.7 Stockholders’ Equity 375.8 588.9 631.8 752.1 834.2 1,002.4 1,141.7 1,262.5 1,503.1 1,709.1 1,661.0 Market Capitalization $ 430.1 $ 479.1 $ 579.0 $ 987.8 $ 1,014.7 $ 923.7 $ 1,276.8 $ 2,230.5 $ 3,350.3 $ 4,611.7 $ 3,790.2 Return on Assets (ROA) 0.99% 1.09% 0.72% 0.89% 1.02% 1.02% 1.04% 1.14% 1.14% 1.14% 1.08% Return on Common Equity (ROE) 15.87% 15.55% 10.57% 12.72% 13.80% 13.80% 14.22% 16.17% 15.83% 15.41% 15.45% Per Common Share1 Net Income (Loss) – Basic $ 3.51 $ 3.94 $ 2.69 $ 3.49 $ 4.18 $ 4.59 $ 5.24 $ 6.69 $ 7.51 $ 8.26 $ 9.19 Net Income (Loss) – Diluted 3.51 3.94 2.69 3.49 4.18 4.59 5.24 6.69 7.51 8.26 9.19 Dividends (Declared) 1.00 1.00 1.00 1.00 1.20 1.25 1.54 1.83 2.00 2.50 3.00 Book Value 23.44 24.58 26.24 28.79 31.86 34.35 39.52 43.98 51.83 59.32 57.54 Market Price 26.88 20.00 24.06 37.81 39.38 35.16 48.44 84.38 123.75 170.00 139.69 Assets by Geographical Area Puerto Rico 92% 89% 87% 87% 79% 76% 75% 74% 74% 71% 71% United States 6% 9% 11% 10% 16% 20% 21% 22% 23% 25% 25% Caribbean and Latin America 2% 2% 2% 3% 5% 4% 4% 4% 3% 4% 4% Total 100% 100% 100% 100% 100% 100% 100% 100% 100% 100% 100% Traditional Delivery System Banking Branches Puerto Rico 128 173 161 162 165 166 166 178 201 198 199 Virgin Islands 3 3 3 3 8 8 8 8 8 8 8 United States 10 24 24 30 32 34 40 44 63 89 91 Subtotal 141 200 188 195 205 208 214 230 272 295 298 Non-Banking Offices Popular Financial Holdings 27 41 58 73 91 102 117 128 137 Popular Cash Express 51 102 Popular Finance 18 26 26 26 26 28 31 39 44 48 47 Popular Auto 4 9 9 9 8 10 9 8 10 10 12 Popular Leasing, U.S.A. 7 8 10 Popular Mortgage 3 3 3 11 13 Popular Securities 1 2 2 2 Popular One Popular Insurance Popular Insurance Agency, U.S.A. Popular Insurance, V.I. E-LOAN EVERTEC 4 Subtotal 22 35 62 76 92 111 134 153 183 258 327 Total 163 235 250 271 297 319 348 383 455 553 625 Electronic Delivery System ATMs Owned Puerto Rico 151 211 206 211 234 262 281 327 391 421 442 Virgin Islands 3 3 3 3 8 8 8 9 17 59 68 United States 6 11 26 38 53 71 94 99 Total 154 214 209 220 253 296 327 389 479 574 609 Transactions (in millions) Electronic Transactions2 16.1 18.0 23.9 28.6 33.2 43.0 56.6 78.0 111.2 130.5 159.4 Items Processed3 161.9 164.0 166.1 170.4 171.8 174.5 175.0 173.7 171.9 170.9 171.0 Employees (full-time equivalent) 5, 2 13 7,02 3 7,0 0 6 7,02 4 7, 533 7,6 0 6 7, 815 7,9 9 6 8 , 85 4 1 0, 5 49 11 , 5 01 12
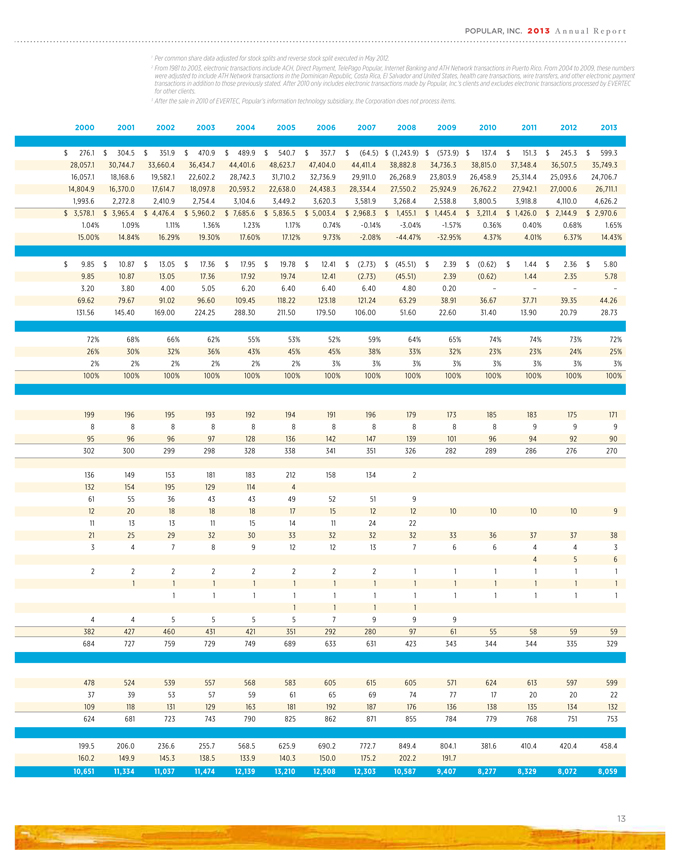
POPULAR, INC. 2 01 3 A n n u a l R e p o r t 1 Per common share data adjusted for stock splits and reverse stock split executed in May 2012. 2 From 1981 to 2003, electronic transactions include ACH, Direct Payment, TelePago Popular, Internet Banking and ATH Network transactions in Puerto Rico. From 2004 to 2009, these numbers were adjusted to include ATH Network transactions in the Dominican Republic, Costa Rica, El Salvador and United States, health care transactions, wire transfers, and other electronic payment transactions in addition to those previously stated. After 2010 only includes electronic transactions made by Popular, Inc.’s clients and excludes electronic transactions processed by EVERTEC for other clients. 3 After the sale in 2010 of EVERTEC, Popular’s information technology subsidiary, the Corporation does not process items. 2000 2001 2002 2003 2004 2005 2006 2007 2008 2009 2010 2011 2012 2013 $ 276.1 $ 304.5 $ 351.9 $ 470.9 $ 489.9 $ 540.7 $ 357.7 $ (64.5) $ (1,243.9) $ (573.9) $ 137.4 $ 151.3 $ 245.3 $ 599.3 28,057.1 30,744.7 33,660.4 36,434.7 44,401.6 48,623.7 47,404.0 44,411.4 38,882.8 34,736.3 38,815.0 37,348.4 36,507.5 35,749.3 16,057.1 18,168.6 19,582.1 22,602.2 28,742.3 31,710.2 32,736.9 29,911.0 26,268.9 23,803.9 26,458.9 25,314.4 25,093.6 24,706.7 14,804.9 16,370.0 17,614.7 18,097.8 20,593.2 22,638.0 24,438.3 28,334.4 27,550.2 25,924.9 26,762.2 27,942.1 27,000.6 26,711.1 1,993.6 2,272.8 2,410.9 2,754.4 3,104.6 3,449.2 3,620.3 3,581.9 3,268.4 2,538.8 3,800.5 3,918.8 4,110.0 4,626.2 $ 3,578.1 $ 3,965.4 $ 4,476.4 $ 5,960.2 $ 7,685.6 $ 5,836.5 $ 5,003.4 $ 2,968.3 $ 1,455.1 $ 1,445.4 $ 3,211.4 $ 1,426.0 $ 2,144.9 $ 2,970.6 1.04% 1.09% 1.11% 1.36% 1.23% 1.17% 0.74% -0.14% -3.04% -1.57% 0.36% 0.40% 0.68% 1.65% 15.00% 14.84% 16.29% 19.30% 17.60% 17.12% 9.73% -2.08% -44.47% -32.95% 4.37% 4.01% 6.37% 14.43% $ 9.85 $ 10.87 $ 13.05 $ 17.36 $ 17.95 $ 19.78 $ 12.41 $ (2.73) $ (45.51) $ 2.39 $ (0.62) $ 1.44 $ 2.36 $ 5.80 9.85 10.87 13.05 17.36 17.92 19.74 12.41(2.73) (45.51) 2.39 (0.62) 1.44 2.35 5.78 3.20 3.80 4.00 5.05 6.20 6.40 6.40 6.40 4.80 0.20 – – – – 69.62 79.67 91.02 96.60 109.45 118.22 123.18 121.24 63.29 38.91 36.67 37.71 39.35 44.26 131.56 145.40 169.00 224.25 288.30 211.50 179.50 106.00 51.60 22.60 31.40 13.90 20.79 28.73 72% 68% 66% 62% 55% 53% 52% 59% 64% 65% 74% 74% 73% 72% 26% 30% 32% 36% 43% 45% 45% 38% 33% 32% 23% 23% 24% 25% 2% 2% 2% 2% 2% 2% 3% 3% 3% 3% 3% 3% 3% 3% 100% 100% 100% 100% 100% 100% 100% 100% 100% 100% 100% 100% 100% 100% 199 196 195 193 192 194 191 196 179 173 185 183 175 171 8 8 8 8 8 8 8 8 8 8 8 9 9 9 95 96 96 97 128 136 142 147 139 101 96 94 92 90 302 300 299 298 328 338 341 351 326 282 289 286 276 270 136 149 153 181 183 212 158 134 2 132 154 195 129 114 4 61 55 36 43 43 49 52 51 9 12 20 18 18 18 17 15 12 12 10 10 10 10 9 11 13 13 11 15 14 11 24 22 21 25 29 32 30 33 32 32 32 33 36 37 37 38 3 4 7 8 9 12 12 13 7 6 6 4 4 3 4 5 6 2 2 2 2 2 2 2 2 1 1 1 1 1 1 1 1 1 1 1 1 1 1 1 1 1 1 1 1 1 1 1 1 1 1 1 1 1 1 1 1 1 1 1 4 4 5 5 5 5 7 9 9 9 382 427 460 431 421 351 292 280 97 61 55 58 59 59 684 727 759 729 749 689 633 631 423 343 344 344 335 329 478 524 539 557 568 583 605 615 605 571 624 613 597 599 37 39 53 57 59 61 65 69 74 77 17 20 20 22 109 118 131 129 163 181 192 187 176 136 138 135 134 132 624 681 723 743 790 825 862 871 855 784 779 768 751 753 199.5 206.0 236.6 255.7 568.5 625.9 690.2 772.7 849.4 804.1 381.6 410.4 420.4 458.4 160.2 149.9 145.3 138.5 133.9 140.3 150.0 175.2 202.2 191.7 1 0,651 11 , 33 4 11 ,037 11 ,474 12 ,139 13, 2 1 0 12 , 5 0 8 12 , 303 1 0, 5 87 9,4 07 8 , 2 7 7 8 , 3 2 9 8 ,07 2 8 ,059 13


POPULAR® P.O. Box 362708 San Juan, Puerto Rico 00936-2708
Financial Review and
Supplementary Information
| | | | | | |
| | Management’s Discussion and Analysis of | | | | |
| | Financial Condition and Results of Operations | | 2 | | |
| | | |
| | Statistical Summaries | | 107 | | |
| | | |
| | Financial Statements | | | | |
| | | |
| | Management’s Report to Stockholders | | 112 | | |
| | | |
| | Report of Independent Registered Public Accounting Firm | | 113 | | |
| | | |
| | Consolidated Statements of Financial Condition as of December 31, 2013 and 2012 | | 115 | | |
| | | |
| | Consolidated Statements of Operations for the years ended December 31, 2013, 2012 and 2011 | | 116 | | |
| | | |
| | Consolidated Statements of Comprehensive Income (Loss) for the years ended December 31, 2013, 2012 and 2011 | | 117 | | |
| | | |
| | Consolidated Statements of Changes in Stockholders’ Equity for the years ended December 31, 2013, 2012 and 2011 | | 118 | | |
| | | |
| | Consolidated Statements of Cash Flows for the years ended December 31, 2013, 2012 and 2011 | | 119 | | |
| | | |
| | Notes to Consolidated Financial Statements | | 121 | | |
Management’s Discussion and
Analysis of Financial Condition
and Results of Operations
| | | | | | |
| | | |
| | Forward-Looking Statements | | 3 | | |
| | | |
| | Overview | | 4 | | |
| | | |
| | Critical Accounting Policies / Estimates | | 10 | | |
| | | |
| | Statement of Operations Analysis | | 25 | | |
| | | |
| | Net Interest Income | | 25 | | |
| | | |
| | Provision for Loan Losses | | 30 | | |
| | | |
| | Non-Interest Income | | 30 | | |
| | | |
| | Operating Expenses | | 33 | | |
| | | |
| | Income Taxes | | 34 | | |
| | | |
| | Fourth Quarter Results | | 36 | | |
| | | |
| | Reportable Segment Results | | 37 | | |
| | | |
| | Statement of Financial Condition Analysis | | 41 | | |
| | | |
| | Assets | | 41 | | |
| | | |
| | Deposits and Borrowings | | 47 | | |
| | | |
| | Stockholders’ Equity | | 48 | | |
| | | |
| | Regulatory Capital | | 49 | | |
| | | |
| | Off-Balance Sheet Arrangements and Other Commitments | | 53 | | |
| | | |
| | Contractual Obligations and Commercial Commitments | | 53 | | |
| | | |
| | Guarantees | | 55 | | |
| | | |
| | Risk Management | | 59 | | |
| | | |
| | Market / Interest Rate Risk | | 60 | | |
| | | |
| | Liquidity | | 68 | | |
| | | |
| | Credit Risk Management and Loan Quality | | 75 | | |
| | | |
| | Enterprise Risk and Operational Risk Management | | 103 | | |
| | | |
| | Adoption of New Accounting Standards and Issued But Not Yet Effective Accounting Standards | | 104 | | |
| | | |
| | Statistical Summaries | | | | |
| | | |
| | Statements of Financial Condition | | 107 | | |
| | | |
| | Statements of Operations | | 108 | | |
| | | |
| | Average Balance Sheet and Summary of Net Interest Income | | 109 | | |
| | | |
| | Quarterly Financial Data | | 111 | | |
2
The following Management’s Discussion and Analysis (“MD&A”) provides information which management believes is necessary for understanding the financial performance of Popular, Inc. and its subsidiaries (the “Corporation” or “Popular”). All accompanying tables, consolidated financial statements, and corresponding notes included in this “Financial Review and Supplementary Information - 2013 Annual Report” (“the report”) should be considered an integral part of this MD&A.
FORWARD-LOOKING STATEMENTS
The information included in this report contains certain forward-looking statements within the meaning of the Private Securities Litigation Reform Act of 1995. These forward-looking statements may relate to the Corporation’s financial condition, results of operations, plans, objectives, future performance and business, including, but not limited to, statements with respect to expected earnings levels, the adequacy of the allowance for loan losses, delinquency trends, market risk and the impact of interest rate changes, capital market conditions, capital adequacy and liquidity, and the effect of legal proceedings and new accounting standards on the Corporation’s financial condition and results of operations. All statements contained herein that are not clearly historical in nature are forward-looking, and the words “anticipate,” “believe,” “continues,” “expect,” “estimate,” “intend,” “project” and similar expressions and future or conditional verbs such as “will,” “would,” “should,” “could,” “might,” “can,” “may,” or similar expressions are generally intended to identify forward-looking statements.
Forward-looking statements are not guarantees of future performance, are based on management’s current expectations and, by their nature, involve certain risks, uncertainties, estimates and assumptions by management that are difficult to predict. Various factors, some of which are beyond the Corporation’s control, could cause actual results to differ materially from those expressed in, or implied by, such forward-looking statements. Factors that might cause such a difference include, but are not limited to, the rate of growth in the economy and employment levels, as well as general business and economic conditions; changes in interest rates, as well as the magnitude of such changes; the fiscal and monetary policies of the federal government and its agencies; changes in federal bank regulatory and supervisory policies, including required levels of capital; the impact of the Dodd-Frank Wall Street Reform and Consumer Protection Act (Financial Reform Act) on the Corporation’s businesses, business practices and costs of operations; the relative strength or weakness of the consumer and commercial credit sectors and of the real estate markets in Puerto Rico and the other markets in which borrowers are located; the performance of the stock and bond markets; competition in the financial services industry; additional Federal Deposit Insurance Corporation (“FDIC”) assessments; and possible legislative, tax or regulatory changes. Other possible events or factors that could cause results or performance to differ materially from those expressed in such forward-looking statements include the following: negative economic conditions that adversely affect the general economy, housing prices, the job market, consumer confidence and spending habits which may affect, among other things, the level of non-performing assets, charge-offs and provision expense; changes in interest rates and market liquidity, which may reduce interest margins, impact funding sources and affect the ability to originate and distribute financial products in the primary and secondary markets; adverse movements and volatility in debt and equity capital markets; changes in market rates and prices, which may adversely impact the value of financial assets and liabilities; liabilities resulting from litigation and regulatory investigations; changes in accounting standards, rules and interpretations; increased competition; the Corporation’s ability to grow its core businesses; decisions to downsize, sell or close units or otherwise change the business mix of the Corporation; and management’s ability to identify and manage these and other risks. Moreover, the outcome of legal proceedings is inherently uncertain and depends on judicial interpretations of law and the findings of regulators, judges and juries.
All forward-looking statements included in this report are based upon information available to the Corporation as of the date of this report, and other than as required by law, including the requirements of applicable securities laws, management assumes no obligation to update or revise any such forward-looking statements to reflect occurrences or unanticipated events or circumstances after the date of such statements.
The description of the Corporation’s business and risk factors contained in Item 1 and 1A of its Form 10-K for the year ended December 31, 2013 discusses additional information about the business of the Corporation and the material risk factors that, in addition to the other information in this report, readers should consider.
3
OVERVIEW
The Corporation is a diversified, publicly-owned financial holding company subject to the supervision and regulation of the Board of Governors of the Federal Reserve System. The Corporation has operations in Puerto Rico, the United States (“U.S.”) mainland, and the U.S. and British Virgin Islands. In Puerto Rico, the Corporation provides retail, including residential mortgage loans originations, and commercial banking services through its principal banking subsidiary, Banco Popular de Puerto Rico (“BPPR”), as well as investment banking, broker-dealer, auto and equipment leasing and financing, and insurance services through specialized subsidiaries. Effective December 31, 2012, Popular Mortgage, which was a wholly-owned subsidiary of BPPR prior to that date, was merged with and into BPPR as part of an internal reorganization. The Corporation’s mortgage origination business continues to be conducted under the brand name Popular Mortgage, a division of BPPR. In the U.S. mainland, the Corporation operates Banco Popular North America (“BPNA”), including its wholly-owned subsidiary E-LOAN. The BPNA franchise operates under the brand name of Popular Community Bank. BPNA focuses efforts and resources on the core community banking business. BPNA operates branches in New York, California, Illinois, New Jersey and Florida. E-LOAN markets deposit accounts under its name for the benefit of BPNA. Note 41 to the consolidated financial statements presents information about the Corporation’s business segments.
The Corporation has several investments which accounts for under the equity method. These include the 14.9% interest in EVERTEC, a 19.99% interest in Centro Financiero BHD, a 24.9% interest in PR Asset Portfolio 2013-1 International, LLC and a 24.9% interest in PRLP 2011 Holdings LLP, among other investments in limited partnerships which mainly hold investment securities. EVERTEC provides transaction processing services throughout the Caribbean and Latin America, including servicing many of the Corporation’s system infrastructures and transaction processing businesses. Centro Financiero BHD is a diversified financial services institution operating in the Dominican Republic. PR Asset Portfolio 2013-1 International, LLC is a joint venture to which the Corporation sold construction and commercial loans and commercial and residential real estate owned assets, most of which were non-performing, with a fair value of $306 million during the year 2013. PRLP 2011 Holdings LLP is a joint venture to which the Corporation sold construction and commercial loans, most of which were non-performing, with a fair value of $148 million during the year 2011. For the year ended December 31, 2013, the Corporation recorded approximately $42.9 million in earnings from these investments on an aggregate basis. The carrying amounts of these investments as of December 31, 2013 were $197.0 million. Refer to Note 16 to the consolidated financial statements for additional information of the Corporation’s investments at equity.
The Corporation’s net income for the year ended December 31, 2013 amounted to $599.3 million, compared with net income of $245.3 million and $151.3 million for 2012 and 2011, respectively. The results for 2013 reflect the impact of two bulk sale of non-performing assets resulting in an aggregate after tax loss of $287.7 million, $412.8 million in after tax gains resulting from the initial and subsequent public offerings and related transactions completed by EVERTEC in which the Corporation participated as a selling stockholder and an income tax benefit of $197.5 million related to the change in the corporate tax rate from 30% to 39%. The results for 2012 reflect an income tax benefit of $72.9 million related to reduction of the deferred tax liability on the estimated gains for tax purposes related to the loans acquired from Westernbank as a result of the closing agreement with the Puerto Rico Department of Treasury, which established that these would be taxed at a capital gain rate. Also, the results from 2012 reflect a benefit of approximately $26.9 million from the Corporation’s share of a tax benefit from a grant received by EVERTEC from the Puerto Rico Government. During 2011, the Corporation recorded an income tax expense of $103.3 million as a result of the reduction in the marginal tax rate, which was partially offset by a benefit of $53.6 million recorded as a result of a closing agreement with the Puerto Rico Department of Treasury, which deferred the deduction of charge-offs taken during 2009 and 2010 until the years 2013-2016. Table 1 provides selected financial data for the past five years. For purposes of the discussions, assets subject to loss sharing agreements with the FDIC, including loans and other real estate owned, are referred to as “covered assets” or “covered loans” since the Corporation expects to be reimbursed for 80% of any future losses on those assets, subject to the terms of the FDIC loss sharing agreements.
Excluding the impact of the above mentioned transactions, the adjusted net income for the year ended December 31, 2013 was $256.2 million. Refer to Table 70 for the reconciliation to the adjusted, Non-GAAP net income.
During 2013, the Corporation maintained a strong net interest margin and reflected a reduction in its provision for loan losses, excluding the impact of the bulk sales of non performing assets. Net interest margin, on a taxable equivalent basis, increased 24 basis points from 2012 to 4.72%, mainly due to a higher yield from the covered loans portfolio, lower levels of non-performing assets and lower cost of funds. The Corporation made significant improvements in its overall credit metrics. Non-performing assets,
4
excluding covered assets, declined $1.1 billion as a result of the two bulk sales of non-performing assets during the first and second quarters as well as the continuation of aggressive asset resolution strategies. Excluding the impact of the bulk sales of non-performing assets, the provision for loan losses for the non-covered portfolio was down $119.0 million from the year ended December 31, 2012. Inflows of non-performing assets were down $492 million, or 42%, from 2012 and the net charge off ratio was 1.19%, compared to 1.97% in 2012 (excluding the impact of the bulk sales of non-performing assets).
While the Corporation has made improvements in the credit quality of its portfolios, the continued economic weakness in Puerto Rico, our principal market, continues to present challenges which are being considered in its overall reserve levels. In light of these economic conditions, which put pressure on loan growth, during 2013 the Corporation supplemented its organic growth with opportunistic loan purchases, particularly of residential mortgage loans.
The Corporation’s U.S. mainland operations were profitable during 2013 with net income of $116.6 million, compared to $46.0 million for 2012. The improvement is mainly related to improved credit performance which resulted in a reserve release of $14.7 million for 2013, compared to a provision of $52.0 million for 2012, a $66.7 million variance. The reserve release also reflects the impact of $10.8 million due to the enhancements to the allowance for loan losses methodology implemented during the second quarter of 2013. The U.S. operations have followed the general credit trends on the mainland demonstrating progressive improvement. Management remains focused on increasing BPNA’s customer base, as it continues its strategy to transition from a mainly Hispanic-focused bank to a more broad-based community bank. The biggest challenge for the BPNA reportable segment is achieving healthy loan growth in the markets it serves at an adequate risk-adjusted return.
Table 1 - Selected Financial Data
| | | | | | | | | | | | | | | | | | | | |
| |
| | | Year ended December 31, | |
| |
| (Dollars in thousands, except per common share data) | | 2013 | | | 2012 | | | 2011 | | | 2010 | | | 2009 | |
| |
CONDENSED STATEMENTS OF OPERATIONS | | | | | | | | | | | | | | | | | | | | |
Interest income | | $ | 1,748,456 | | | $ | 1,755,846 | | | $ | 1,941,161 | | | $ | 1,949,300 | | | $ | 1,854,997 | |
Interest expense | | | 315,876 | | | | 379,213 | | | | 505,816 | | | | 653,427 | | | | 753,744 | |
| |
Net interest income | | | 1,432,580 | | | | 1,376,633 | | | | 1,435,345 | | | | 1,295,873 | | | | 1,101,253 | |
| |
Provision for loan losses: | | | | | | | | | | | | | | | | | | | | |
Non-covered loans | | | 533,167 | | | | 334,102 | | | | 430,085 | | | | 1,011,880 | | | | 1,405,807 | |
Covered loans | | | 69,396 | | | | 74,839 | | | | 145,635 | | | | - | | | | - | |
Non-interest income | | | 810,569 | | | | 531,212 | | | | 625,426 | | | | 1,304,458 | | | | 896,501 | |
Operating expenses | | | 1,292,586 | | | | 1,280,032 | | | | 1,218,799 | | | | 1,342,820 | | | | 1,154,196 | |
Income tax (benefit) expense | | | (251,327) | | | | (26,403) | | | | 114,927 | | | | 108,230 | | | | (8,302) | |
| |
Income (loss) from continuing operations | | | 599,327 | | | | 245,275 | | | | 151,325 | | | | 137,401 | | | | (553,947) | |
Loss from discontinued operations, net of tax | | | - | | | | - | | | | - | | | | - | | | | (19,972) | |
| |
Net income (loss) | | $ | 599,327 | | | $ | 245,275 | | | $ | 151,325 | | | $ | 137,401 | | | $ | (573,919) | |
| |
Net income (loss) applicable to common stock | | $ | 595,604 | | | $ | 241,552 | | | $ | 147,602 | | | $ | (54,576) | | | $ | 97,377 | |
| |
PER COMMON SHARE DATA[1] | | | | | | | | | | | | | | | | | | | | |
Net income (loss): | | | | | | | | | | | | | | | | | | | | |
Basic: | | | | | | | | | | | | | | | | | | | | |
From continuing operations | | $ | 5.80 | | | $ | 2.36 | | | $ | 1.44 | | | $ | (0.62) | | | $ | 2.88 | |
From discontinued operations | | | - | | | | - | | | | - | | | | - | | | | (0.49) | |
| |
Total | | $ | 5.80 | | | $ | 2.36 | | | $ | 1.44 | | | $ | (0.62) | | | $ | 2.39 | |
| |
Diluted: | | | | | | | | | | | | | | | | | | | | |
From continuing operations | | $ | 5.78 | | | $ | 2.35 | | | $ | 1.44 | | | $ | (0.62) | | | $ | 2.88 | |
From discontinued operations | | | - | | | | - | | | | - | | | | - | | | | (0.49) | |
| |
Total | | $ | 5.78 | | | $ | 2.35 | | | $ | 1.44 | | | $ | (0.62) | | | $ | 2.39 | |
| |
Dividends declared | | $ | - | | | $ | - | | | $ | - | | | $ | - | | | $ | 0.20 | |
Book Value | | | 44.26 | | | | 39.35 | | | | 37.71 | | | | 36.67 | | | | 38.91 | |
Market Price | | | 28.73 | | | | 20.79 | | | | 13.90 | | | | 31.40 | | | | 22.60 | |
Outstanding shares: | | | | | | | | | | | | | | | | | | | | |
Average - basic | | | 102,693,685 | | | | 102,429,755 | | | | 102,179,393 | | | | 88,515,404 | | | | 40,822,950 | |
Average - assuming dilution | | | 103,061,475 | | | | 102,653,610 | | | | 102,289,496 | | | | 88,515,404 | | | | 40,822,950 | |
End of period | | | 103,397,699 | | | | 103,169,806 | | | | 102,590,457 | | | | 102,272,780 | | | | 63,954,011 | |
AVERAGE BALANCES | | | | | | | | | | | | | | | | | | | | |
5
| | | | | | | | | | | | | | | | | | | | |
Net loans[2] | | $ | 24,734,542 | | | $ | 24,845,494 | | | $ | 25,617,767 | | | $ | 25,821,778 | | | $ | 24,836,067 | |
Earning assets | | | 31,675,763 | | | | 31,569,702 | | | | 32,931,332 | | | | 34,154,021 | | | | 34,083,406 | |
Total assets | | | 36,266,993 | | | | 36,264,031 | | | | 38,066,268 | | | | 38,378,966 | | | | 36,569,370 | |
Deposits | | | 26,772,375 | | | | 26,903,933 | | | | 27,503,391 | | | | 26,650,497 | | | | 26,828,209 | |
Borrowings | | | 4,293,042 | | | | 4,415,624 | | | | 5,846,874 | | | | 7,448,021 | | | | 5,832,896 | |
Total stockholders’ equity | | | 4,176,349 | | | | 3,843,652 | | | | 3,732,836 | | | | 3,259,167 | | | | 2,852,065 | |
PERIOD END BALANCE | | | | | | | | | | | | | | | | | | | | |
Net loans[2] | | $ | 24,706,719 | | | $ | 25,093,632 | | | $ | 25,314,392 | | | $ | 26,458,855 | | | $ | 23,803,909 | |
Allowance for loan losses | | | 640,555 | | | | 730,607 | | | | 815,308 | | | | 793,225 | | | | 1,261,204 | |
Earning assets | | | 31,521,963 | | | | 31,906,198 | | | | 32,441,983 | | | | 33,507,582 | | | | 32,340,967 | |
Total assets | | | 35,749,333 | | | | 36,507,535 | | | | 37,348,432 | | | | 38,814,998 | | | | 34,736,325 | |
Deposits | | | 26,711,145 | | | | 27,000,613 | | | | 27,942,127 | | | | 26,762,200 | | | | 25,924,894 | |
Borrowings | | | 3,645,246 | | | | 4,430,673 | | | | 4,293,669 | | | | 6,946,955 | | | | 5,288,748 | |
Total stockholders’ equity | | | 4,626,150 | | | | 4,110,000 | | | | 3,918,753 | | | | 3,800,531 | | | | 2,538,817 | |
SELECTED RATIOS | | | | | | | | | | | | | | | | | | | | |
Net interest margin (taxable equivalent basis) | | | 4.72 | % | | | 4.48 | % | | | 4.48 | % | | | 3.82 | % | | | 3.47 % | |
Return on average total assets | | | 1.65 | | | | 0.68 | | | | 0.40 | | | | 0.36 | | | | (1.57) | |
Return on average common stockholders’ equity | | | 14.43 | | | | 6.37 | | | | 4.01 | | | | 4.37 | | | | (32.95) | |
Tier I Capital to risk-adjusted assets | | | 19.15 | | | | 17.35 | | | | 15.97 | | | | 14.52 | | | | 9.81 | |
Total Capital to risk-adjusted assets | | | 20.42 | | | | 18.63 | | | | 17.25 | | | | 15.79 | | | | 11.13 | |
| |
| | |
[1] Per share data is based on the average number of shares outstanding during the periods, except for the book value and market price which are based on the information at the end of the periods. All per share data has been adjusted to retroactively reflect the 1-for-10 reverse stock split effected on May 29, 2012. |
| [2] Includes loans held-for-sale and covered loans. |
|
The Corporation has strived to mitigate the decline in earning assets amid challenging economic conditions in Puerto Rico. During the first half of 2013, the Corporation completed two bulk purchases from Puerto Rico financial institutions acquiring $761.3 million in mortgage loans. Also, during 2012, the BPPR reportable segment purchased $265 million in consumer loans. During the first half of 2011, the Corporation completed two bulk purchases of residential mortgage loans from a Puerto Rico financial institution, adding $518 million in performing mortgage loans to its portfolio. In August 2011, the Corporation completed the purchase of Citibank’s AAdvantage co-branded credit card portfolio in Puerto Rico and the U.S. Virgin Islands, which represented approximately $131 million in balances. In addition, BPPR entered into an agreement with American Airlines, Inc. to become the exclusive issuer of AAdvantage co-branded credit cards in those two regions.
On April 30, 2010, BPPR acquired certain assets and assumed certain liabilities of Westernbank from the FDIC in an assisted transaction. Table 2 provides a summary of the gross revenues derived from the assets acquired in the FDIC-assisted transaction during 2013, 2012 and 2011.
Table 2 - Financial Information - Westernbank FDIC-Assisted Transaction
| | | | | | | | | | | | |
| | | Year ended December 31, | |
(In thousands) | | 2013 | | | 2012 | | | 2011 | |
| |
Interest income: | | | | | | | | | | | | |
Interest income on covered loans | | $ | 300,745 | | | $ | 301,441 | | | $ | 375,595 | |
Discount accretion on ASC 310-20 covered loans | | | - | | | | - | | | | 37,083 | |
| |
Total interest income on covered loans | | | 300,745 | | | | 301,441 | | | | 412,678 | |
| |
FDIC loss share (expense) income : | | | | | | | | | | | | |
Amortization of loss share indemnification asset | | | (161,635) | | | | (129,676) | | | | (10,855) | |
80% mirror accounting on credit impairment losses[1] | | | 60,454 | | | | 58,187 | | | | 110,457 | |
80% mirror accounting on reimbursable expenses | | | 50,985 | | | | 30,771 | | | | 5,093 | |
80% mirror accounting on recoveries on covered assets, including rental income on OREOs, subject to reimbursement to the FDIC | | | (16,057) | | | | (2,979) | | | | - | |
80% mirror accounting on amortization of contingent liability on unfunded commitments | | | (473) | | | | (969) | | | | (33,221) | |
Change in true-up payment obligation | | | (15,993) | | | | (13,178) | | | | (6,304) | |
Other | | | 668 | | | | 1,633 | | | | 1,621 | |
| |
Total FDIC loss share (expense) income | | | (82,051) | | | | (56,211) | | | | 66,791 | |
| |
6
| | | | | | | | | | | | |
| |
Fair value change in equity appreciation instrument | | | - | | | | - | | | | 8,323 | |
Amortization of contingent liability on unfunded commitments (included in other operating income) | | | 593 | | | | 1,211 | | | | 4,487 | |
| |
Total revenues | | | 219,287 | | | | 246,441 | | | | 492,279 | |
| |
Provision for loan losses | | | 69,396 | | | | 74,839 | | | | 145,635 | |
| |
Total revenues less provision for loan losses | | $ | 149,891 | | | $ | 171,602 | | | $ | 346,644 | |
| |
| [1] | Reductions in expected cash flows for ASC 310-30 loans, which may impact the provision for loan losses, may consider reductions in both principal and interest cash flow expectations. The amount covered under the FDIC loss sharing agreements for interest not collected from borrowers is limited under the agreements (approximately 90 days); accordingly, these amounts are not subject fully to the 80% mirror accounting. | |
| | | | | | | | | | |
|
| |
| Average balances | | | |
|
| | | Year ended December 31, |
| (In millions) | | 2013 | | | 2012 | | | |
|
Covered loans | | $ | 3,228 | | | $ | 4,050 | | | |
FDIC loss share asset | | | 1,310 | | | | 1,680 | | | |
|
Interest income on covered loans for the year 2013 amounted to $300.7 million vs. $301.4 million in 2012, reflecting a yield of 9.32% vs. 7.44%, for each year respectively. The increase in the yield was due to higher expected cash flows which are reflected in the accretable yield and recognized over the life of the loans and resolutions of loans during the year. This portfolio, due to its nature, should continue to decline as scheduled payments are received and workout arrangements are made. The yield improvement in 2013 reflects higher collections and estimated cash flows, which increase the accretable yield to be taken over the life of the loan pools. For 2011, net interest income reflects $37.1 million of discount accretion related to covered loans accounted for under ASC Subtopic 310-20. This discount was fully accreted into earnings during 2011.
The FDIC loss share reflected an expense of $82.1 million for 2013, compared to $56.2 million for 2012. This was the mainly the result of higher amortization of the indemnification asset by $32.0 million and higher recoveries on covered assets, including rental income, of $13.1 million, offset by higher mirror accounting on reimbursable expenses for $20.2 million. For 2012, when compared to 2011 this line reflected a negative variance of $123.0 million due to lower discount accretion on loans and unfunded commitments subject to ASC Subtopic 310-20, higher amortization of the FDIC loss share asset, lower mirror accounting on credit impairment losses and higher fair value adjustments to the true-up payment obligation, partially offset by the favorable mirror accounting on reimbursable expenses.
Although the increase in cash flows increases the accretable yield to be recognized over the life of the loans, it also has the effect of lowering the realizable value of the loss share asset since the Corporation would receive lower FDIC payments under the loss share agreements. This is reflected in the increased amortization of the loss share asset for 2013 and an increase in the fair value of the true-up payment obligation. The change in the amortization of the loss share asset from 2011 to 2012 also reflected higher expected cash flows from year to year.
The discussion that follows provides highlights of the Corporation’s results of operations for the year ended December 31, 2013 compared to the results of operations of 2012. It also provides some highlights with respect to the Corporation’s financial condition, credit quality, capital and liquidity. Table 3 presents a five-year summary of the components of net income (loss) as a percentage of average total assets.
| | | | | | | | | | | | | | | | | | | | |
| Table 3 - Components of Net Income (Loss) as a Percentage of Average Total Assets | |
| |
| | | | | |
| | | 2013 | | | 2012 | | | 2011 | | | 2010 | | | 2009 | |
| |
| | | | | |
Net interest income | | | 3.95 % | | | | 3.80 % | | | | 3.77 % | | | | 3.38 % | | | | 3.01 % | |
| | | | | |
Provision for loan losses | | | (1.66) | | | | (1.13) | | | | (1.51) | | | | (2.64) | | | | (3.84) | |
| | | | | |
Mortgage banking activities | | | 0.20 | | | | 0.24 | | | | (0.01) | | | | 0.04 | | | | 0.04 | |
| | | | | |
Net gain and valuation adjustments on investment securities | | | 0.02 | | | | - | | | | 0.03 | | | | 0.01 | | | | 0.60 | |
| | | | | |
Net (loss) gain on sale of loans, including valuation adjustments on loans held-for-sale | | | (0.14) | | | | (0.08) | | | | 0.01 | | | | 0.02 | | | | (0.03) | |
| | | | | |
Adjustments (expense) to indemnity reserves | | | (0.10) | | | | (0.06) | | | | (0.09) | | | | (0.19) | | | | (0.11) | |
| | | | | |
Trading account profit | | | (0.04) | | | | 0.01 | | | | 0.12 | | | | 0.09 | | | | 0.15 | |
7
| | | | | | | | | | | | | | | | | | | | |
FDIC loss share (expense) income | | | (0.23) | | | | (0.16) | | | | 0.18 | | | | (0.07) | | | | - | |
| | | | | |
Fair value change in equity appreciation instrument | | | - | | | | - | | | | 0.02 | | | | 0.11 | | | | - | |
| | | | | |
Gain on sale of processing and technology business | | | - | | | | - | | | | - | | | | 1.67 | | | | - | |
| | | | | |
Other non-interest income | | | 2.52 | | | | 1.51 | | | | 1.38 | | | | 1.72 | | | | 1.80 | |
| |
| | | | | |
Total net interest income and non-interest income, net of provision for loan losses | | | 4.52 | | | | 4.13 | | | | 3.90 | | | | 4.14 | | | | 1.62 | |
| | | | | |
Operating expenses | | | (3.56) | | | | (3.52) | | | | (3.20) | | | | (3.50) | | | | (3.16) | |
| |
| | | | | |
Income (loss) from continuing operations before income tax | | | 0.96 | | | | 0.61 | | | | 0.70 | | | | 0.64 | | | | (1.54) | |
| | | | | |
Income tax (benefit) expense | | | (0.69) | | | | (0.07) | | | | 0.30 | | | | 0.28 | | | | (0.02) | |
| |
| | | | | |
Income (loss) from continuing operations | | | 1.65 | | | | 0.68 | | | | 0.40 | | | | 0.36 | | | | (1.52) | |
| | | | | |
Loss from discontinued operations, net of tax | | | - | | | | - | | | | - | | | | - | | | | (0.05) | |
| |
| | | | | |
Net income (loss) | | | 1.65 % | | | | 0.68 % | | | | 0.40 % | | | | 0.36 % | | | | (1.57) % | |
| |
Net interest income on a taxable equivalent basis for the year ended December 31, 2013 amounted to $1.4 billion, an increase of $55.9 million, compared with 2012. Net interest margin, on a taxable equivalent basis, was 4.72% for the year 2013, an increase of 24 basis points from 2012, resulting from a higher yield from the covered portfolio due to higher expected cash flows and loan resolutions, higher yields from the commercial and construction portfolios due to the reduction in non-performing loans and lower cost of funds. Refer to the Net Interest Income section of this MD&A for a discussion of the major variances in net interest income, including yields and costs.
The provision for loan losses for the non-covered portfolio for year ended December 31, 2013 increased by $199.1 million, or 60%, compared with 2012, mainly due to the write downs of $318.0 million recorded in connection with the bulk sales of non-performing loans completed during the first and second quarters of 2013. Excluding the impact of the bulk sales, the provision for loan losses for the non-covered portfolio was down $119.0 million from the year ended December 31, 2012, reflecting a decrease of $67 million in the BPNA and a decrease of $52 million in BPPR. During the second quarter of 2013, the Corporation implemented certain enhancements to the allowance for loan losses methodology which resulted in a net reserve increase of $11.8 million for the non-covered portfolio and $7.5 million for the covered portfolio. Also, the Corporation recorded a recovery of $8.9 million associated with the sale of a portfolio of previously charged-off credit cards and personal loans during 2013. The provision for the covered portfolio was lower by $5.4 million and reflected lower expected losses in loans accounted by ASC Subtopic 310-30, mainly in commercial and construction loan pools.
Non-performing assets, excluding covered assets declined by $1.1 billion, driven by the bulk sales as well as the continuation of aggressive asset resolution strategies. Inflows of non-performing assets were down $492 million, of 42%, from 2012 and the net charge off ratio, excluding the impact of the bulk sales of non-performing assets, was 1.19%, compared to 1.97% in 2012.
Refer to the Provision for Loan Losses and Credit Risk Management and Loan Quality section of this MD&A for information on the allowance for loan losses, non-performing assets, troubled debt restructurings, net charge-offs and credit quality metrics.
Non-interest income for the year ended December 31, 2013 amounted to $810.6 million, an increase of $279.4 million, compared with 2012. The increase was mainly due to the gain of $430.3 million recorded as a result of the sales of EVERTEC shares in connection with their public offerings during 2013 and the $5.9 million prepayment penalty fee income on EVERTEC’s prepayment of the debt held by Popular, in connection with their initial public offering, which was recorded as a gain on sale of securities. This was partially offset by the impact of the bulk sales of non-performing assets, completed during the first and second quarters of 2013, which resulted in an aggregated loss on sale of loans of $65.3 million and provisions for indemnity reserves of $13.7 million. Also, there were higher trading account losses by $18.0 million due mainly to losses on Puerto Rico government securities and closed end funds held by our broker-dealer subsidiary and higher FDIC loss share expense by $25.8 million mainly due to higher cash flows expected driving higher asset amortization, higher recoveries on covered assets, including rental income, offset by higher mirror accounting on reimbursable expenses. Refer to the Non-Interest Income section of this MD&A for a table that provides a breakdown of the different categories of non-interest income.
8
Total operating expenses for the year 2013 amounted to $1.3 billion, an increase of $12.6 million, when compared with the previous year. The increase was mainly due to higher OREO expenses due to the $37 million loss incurred in connection with the bulk sale of non-performing assets by BPPR and higher write downs consisting primarily of covered assets which are subject to 80% reimbursement from the FDIC, higher other taxes due to the gross receipts tax enacted during 2013 and higher professional services fees. These negative variances were offset by lower FDIC deposit insurance expense by $25.2 million and lower extinguishment of debt due to the expense of $25 million recorded in 2012 for the cancellation of $350 million in repurchase agreements. Refer to the Operating Expenses section of this MD&A for additional explanations on the major variances in the different categories of operating expenses.
For the year 2013, the Corporation recorded an income tax benefit of $251.3 million, compared to a benefit of $26.4 million for the year 2012. During the year 2013, the Corporation recorded an income tax benefit of $197.5 million reflecting the impact of an amendment to the Puerto Rico Internal Revenue Code which, among other things, increased the marginal tax rate from 30% to 39%. In addition, the Corporation recorded an income tax benefit of $146.4 million in connection with the loss generated on the Puerto Rico operations by the sales of non-performing assets that took place during the year 2013 and a tax expense of $23.7 million related to the gain realized on the sale of a portion of EVERTEC’s shares which was taxable at a preferential tax rate. Refer to the Income Taxes section in this MD&A and Note 40 to the consolidated financial statements for additional information on income taxes.
At December 31, 2013, the Corporation’s total assets were $35.7 billion, compared with $36.5 billion at December 31, 2012, a decrease of $758 million. Total earning assets at December 31, 2013 amounted to $31.5 billion, a decrease of $384 million, or 1.2%, compared with December 31, 2012.
Loans held-in-portfolio, excluding covered loans, totaled $21.6 billion, an increase of $628.7 million compared to 2012. The increase was mainly in mortgage loans at the BPPR segment, attributed largely to opportunistic loan purchases as well as organic growth. The commercial portfolio also increased by $179.0 million, offset by the run-off of the legacy portfolio in the U.S. operations. The covered portfolio declined by $771.5 million as this portfolio continues its normal run-off. Loans held-for-sale declined by $244.0 million from 2012, due to a decline in mortgage originations for sale in the secondary market and the impact of the bulk loan sales.
Refer to Table 19 in the Statement of Financial Condition Analysis section of this MD&A for the percentage allocation of the composition of the Corporation’s financing to total assets. Deposits amounted to $26.7 billion at December 31, 2013, compared with $27.0 billion at December 31, 2012. Table 20 presents a breakdown of deposits by major categories. The Corporation’s borrowings amounted to $3.6 billion at December 31, 2013, compared with $4.4 billion at December 31, 2012.
Stockholders’ equity amounted to $4.6 billion at December 31, 2013, compared with $4.1 billion at December 31, 2012. The Corporation continues to be well-capitalized at December 31, 2013. The Corporation’s regulatory capital ratios improved from December 31, 2012 to December 31, 2013. The Tier 1 risk-based capital and Tier 1 common equity to risk-weighted assets stood at 19.15% and 14.83%, respectively, at December 31, 2013, compared with 17.35% and 13.18%, respectively, at December 31, 2012. The improvement in the Corporation’s regulatory capital ratios from the end of 2012 to December 31, 2013 was principally due to internal capital generation from earnings, partially offset by an increase in disallowed deferred tax assets.
On October 18, 2013, the Corporation submitted a formal application to the Federal Reserve of New York to redeem the $935 million in trust preferred securities due under the TARP, discussed in Note 23 to the accompanying financial statements. There can be no assurance that the Corporation will be approved to repay TARP, nor on the timing of this event.
In summary, during 2013, the Corporation achieved a significant milestone in its de-risking strategy by reducing its non-performing assets, excluding covered assets, by $1.1 billion. The provision for loan losses declined as a result of improvements in credit metrics. Also, the Corporation maintained a strong net interest margin and a solid revenue stream. The Corporation capitalized on the sales of EVERTEC shares, which offset the losses incurred as part of the bulk sales of assets. The covered loans portfolio lower estimated losses, driving lower provisions and the U.S. operations showed profitable results. As mentioned above, the Corporation remains over the well-capitalized regulatory requirements at the end of 2013.
Moving forward, in Puerto Rico, the Corporation will continue to focus on its credit performance and to identify opportunities to add lower-risk assets that can be managed within the existing business platforms. In the U.S. mainland, the Corporation expects to
9
solidify the trend of improving credit quality by continuing the run-off or disposition of legacy portfolios, actively managing the existing classified portfolio, and identifying new asset growth opportunities in selected loan categories.
For further discussion of operating results, financial condition and business risks refer to the narrative and tables included herein.
The shares of the Corporation’s common stock are traded on the NASDAQ Global Select Market under the symbol BPOP. Table 4 shows the Corporation’s common stock performance on a quarterly basis during the last five years.
Table 4 - Common Stock Performance
| | | | | | | | | | | | | | | | | | | | | | | | | | | | | | |
| | | Market Price | | | Cash Dividends
Declared per Share | | Book Value
Per Share | | Dividend
Yield[1] | | | | | Price/
Earnings
Ratio | | | | | Market/Book
Ratio | | | |
| | | High | | | Low | | | | | | | | | |
| |
2013 | | | | | | | | | | | | $ 44.26 | | N.M. | | | | | | 4.95 | | | x | | | 64.91 | | | % | |
4th quarter | | $ | 29.17 | | | $ | 24.07 | | | $ - | | | | | | | | | | | | | | | | | | | | |
3rd quarter | | | 34.20 | | | | 26.25 | | | - | | | | | | | | | | | | | | | | | | | | |
2nd quarter | | | 30.60 | | | | 26.88 | | | - | | | | | | | | | | | | | | | | | | | | |
1st quarter | | | 28.92 | | | | 21.70 | | | - | | | | | | | | | | | | | | | | | | | | |
| | | | | | | | | | |
2012 | | | | | | | | | | | | 39.35 | | N.M. | | | | | | 8.85 | | | | | | 52.83 | | | | |
4th quarter | | $ | 20.90 | | | $ | 17.42 | | | $ - | | | | | | | | | | | | | | | | | | | | |
3rd quarter | | | 18.74 | | | | 13.55 | | | - | | | | | | | | | | | | | | | | | | | | |
2nd quarter | | | 21.20 | | | | 13.58 | | | - | | | | | | | | | | | | | | | | | | | | |
1st quarter | | | 23.00 | | | | 14.30 | | | - | | | | | | | | | | | | | | | | | | | | |
| | | | | | | | | | |
2011 | | | | | | | | | | | | 37.71 | | N.M. | | | | | | 9.65 | | | | | | 36.86 | | | | |
4th quarter | | $ | 19.00 | | | $ | 11.15 | | | $ - | | | | | | | | | | | | | | | | | | | | |
3rd quarter | | | 28.30 | | | | 13.70 | | | - | | | | | | | | | | | | | | | | | | | | |
2nd quarter | | | 32.40 | | | | 26.30 | | | - | | | | | | | | | | | | | | | | | | | | |
1st quarter | | | 35.33 | | | | 28.70 | | | - | | | | | | | | | | | | | | | | | | | | |
| | | | | | | | | | |
2010 | | | | | | | | | | | | 36.67 | | N.M. | | | | | | (50.65) | | | | | | 85.63 | | | | |
4th quarter | | $ | 31.40 | | | $ | 27.01 | | | $ - | | | | | | | | | | | | | | | | | | | | |
3rd quarter | | | 29.50 | | | | 24.50 | | | - | | | | | | | | | | | | | | | | | | | | |
2nd quarter | | | 40.20 | | | | 26.40 | | | - | | | | | | | | | | | | | | | | | | | | |
1st quarter | | | 29.10 | | | | 17.50 | | | - | | | | | | | | | | | | | | | | | | | | |
| | | | | | | | | | |
2009 | | | | | | | | | | | | 38.91 | | 2.55 | | | % | | | 9.46 | | | | | | 58.08 | | | | |
4th quarter | | $ | 28.00 | | | $ | 21.20 | | | $ - | | | | | | | | | | | | | | | | | | | | |
3rd quarter | | | 28.30 | | | | 10.40 | | | - | | | | | | | | | | | | | | | | | | | | |
2nd quarter | | | 36.60 | | | | 21.90 | | | - | | | | | | | | | | | | | | | | | | | | |
1st quarter | | | 55.20 | | | | 14.70 | | | 0.20 | | | | | | | | | | | | | | | | | | | | |
| |
| | |
[1] Based on the average high and low market price for the four quarters. |
Note: All per share data has been adjusted to retroactively reflect the 1-for-10 reverse stock split effected on May 29, 2012. |
| N.M. – Not meaningful. |
|
CRITICAL ACCOUNTING POLICIES / ESTIMATES
The accounting and reporting policies followed by the Corporation and its subsidiaries conform with generally accepted accounting principles (“GAAP”) in the United States of America and general practices within the financial services industry. The Corporation’s significant accounting policies are described in detail in Note 2 to the consolidated financial statements and should be read in conjunction with this section.
Critical accounting policies require management to make estimates and assumptions, which involve significant judgment about the effect of matters that are inherently uncertain and that involve a high degree of subjectivity. These estimates are made under facts and circumstances at a point in time and changes in those facts and circumstances could produce actual results that differ from those estimates. The following MD&A section is a summary of what management considers the Corporation’s critical accounting policies / estimates.
Fair Value Measurement of Financial Instruments
10
The Corporation measures fair value as required by ASC Subtopic 820-10 “Fair Value Measurements and Disclosures”, which defines fair value as the exchange price that would be received for an asset or paid to transfer a liability in the principal or most advantageous market for the asset or liability in an orderly transaction between market participants on the measurement date. The Corporation currently measures at fair value on a recurring basis its trading assets, available-for-sale securities, derivatives, mortgage servicing rights and contingent consideration. Occasionally, the Corporation may be required to record at fair value other assets on a nonrecurring basis, such as loans held-for-sale, impaired loans held-in-portfolio that are collateral dependent and certain other assets. These nonrecurring fair value adjustments typically result from the application of lower of cost or fair value accounting or write-downs of individual assets.
The Corporation categorizes its assets and liabilities measured at fair value under the three-level hierarchy. The level within the hierarchy is based on whether the inputs to the valuation methodology used for fair value measurement are observable. The hierarchy is broken down into three levels based on the reliability of inputs as follows:
| | — | | Level 1- Unadjusted quoted prices in active markets for identical assets or liabilities that the Corporation has the ability to access at the measurement date. No significant degree of judgment for these valuations is needed, as they are based on quoted prices that are readily available in an active market. |
| | — | | Level 2- Quoted prices other than those included in Level 1 that are observable either directly or indirectly. Level 2 inputs include quoted prices for similar assets or liabilities in active markets, quoted prices for identical or similar assets or liabilities in markets that are not active, and other inputs that are observable or that can be corroborated by observable market data for substantially the full term of the financial instrument. |
| | — | | Level 3- Unobservable inputs that are supported by little or no market activity and that are significant to the fair value measurement of the financial asset or liability. Unobservable inputs reflect the Corporation’s own assumptions about what market participants would use to price the asset or liability, including assumptions about risk. The inputs are developed based on the best available information, which might include the Corporation’s own data such as internally-developed models and discounted cash flow analyses. |
The Corporation requires the use of observable inputs when available, in order to minimize the use of unobservable inputs to determine fair value. The inputs or methodologies used for valuing securities are not necessarily an indication of the risk associated with investing on those securities. The amount of judgment involved in estimating the fair value of a financial instrument depends upon the availability of quoted market prices or observable market parameters. In addition, it may be affected by other factors such as the type of instrument, the liquidity of the market for the instrument, transparency around the inputs to the valuation, as well as the contractual characteristics of the instrument.
If listed prices or quotes are not available, the Corporation employs valuation models that primarily use market-based inputs including yield curves, interest rate curves, volatilities, credit curves, and discount, prepayment and delinquency rates, among other considerations. When market observable data is not available, the valuation of financial instruments becomes more subjective and involves substantial judgment. The need to use unobservable inputs generally results from diminished observability of both actual trades and assumptions resulting from the lack of market liquidity for those types of loans or securities. When fair values are estimated based on modeling techniques such as discounted cash flow models, the Corporation uses assumptions such as interest rates, prepayment speeds, default rates, loss severity rates and discount rates. Valuation adjustments are limited to those necessary to ensure that the financial instrument’s fair value is adequately representative of the price that would be received or paid in the marketplace.
The fair value measurements and disclosures guidance in ASC Subtopic 820-10 also addresses measuring fair value in situations where markets are inactive and transactions are not orderly. Transactions or quoted prices for assets and liabilities may not be determinative of fair value when transactions are not orderly and thus may require adjustments to estimate fair value. Price quotes based on transactions that are not orderly should be given little, if any, weight in measuring fair value. Price quotes based upon transactions that are orderly shall be considered in determining fair value and the weight given is based on facts and circumstances. If sufficient information is not available to determine if price quotes are based upon orderly transactions, less weight should be given to the price quote relative to other transactions that are known to be orderly.
The lack of liquidity is incorporated into the fair value measurement based on the type of asset measured and the valuation methodology used. An illiquid market is one in which little or no observable activity has occurred or one that lacks willing buyers or willing sellers. Discounted cash flow techniques incorporate forecasting of expected cash flows discounted at appropriate market discount rates which reflect the lack of liquidity in the market which a market participant would consider. Broker quotes used for fair
11
value measurements inherently reflect any lack of liquidity in the market since they represent an exit price from the perspective of the market participants.
Management believes that fair values are reasonable and consistent with the fair value measurement guidance based on the Corporation’s internal validation procedure and consistency of the processes followed, which include obtaining market quotes when possible or using valuation techniques that incorporate market-based inputs.
Refer to Note 32 to the consolidated financial statements for information on the Corporation’s fair value measurement disclosures required by the applicable accounting standard. At December 31, 2013, approximately $ 5.6 billion, or 97%, of the assets measured at fair value on a recurring basis used market-based or market-derived valuation methodology and, therefore, were classified as Level 1 or Level 2. The majority of instruments measured at fair value were classified as Level 2, including U.S. Treasury securities, obligations of U.S. Government sponsored entities, obligations of Puerto Rico, States and political subdivisions, most mortgage-backed securities (“MBS”) and collateralized mortgage obligations (“CMOs”), and derivative instruments. U.S. Treasury securities were valued based on yields that were interpolated from the constant maturity treasury curve. Obligations of U.S. Government sponsored entities were priced based on an active exchange market and on quoted prices for similar securities. Obligations of Puerto Rico, States and political subdivisions were valued based on trades, bid price or spread, two sided markets, quotes, benchmark curves, market data feeds, discount and capital rates and trustee reports. MBS and CMOs were priced based on a bond’s theoretical value from similar bonds defined by credit quality and market sector. Refer to the Derivatives section below for a description of the valuation techniques used to value these derivative instruments.
The remaining 3% of assets measured at fair value on a recurring basis at December 31, 2013 were classified as Level 3 since their valuation methodology considered significant unobservable inputs. The financial assets measured as Level 3 included mostly Puerto Rico tax-exempt GNMA mortgage-backed securities and mortgage servicing rights (“MSRs”). GNMA tax exempt mortgage-backed securities are priced using a local demand price matrix prepared from local dealer quotes, and other local investments such as corporate securities and local mutual funds which are priced by local dealers. MSRs, on the other hand, are priced internally using a discounted cash flow model which considers servicing fees, portfolio characteristics, prepayment assumptions, delinquency rates, late charges, other ancillary revenues, cost to service and other economic factors. Additionally, the Corporation reported $ 26 million of financial assets that were measured at fair value on a nonrecurring basis at December 31, 2013, all of which were classified as Level 3 in the hierarchy.
Broker quotes used for fair value measurements inherently reflect any lack of liquidity in the market since they represent an exit price from the perspective of the market participants. Financial assets that were fair valued using broker quotes amounted to $ 31 million at December 31, 2013, of which $ 17 million were Level 3 assets and $ 14 million were Level 2 assets. Level 3 assets consisted principally of tax-exempt GNMA mortgage-backed securities. Fair value for these securities was based on an internally-prepared matrix derived from an average of two indicative local broker quotes. The main input used in the matrix pricing was non-binding local broker quotes obtained from limited trade activity. Therefore, these securities were classified as Level 3.
There were no transfers in and/or out of Level 1, Level 2, or Level 3 for financial instruments measured at fair value on a recurring basis during the year ended December 31, 2013 and 2011. There were no transfers in and/or out of Level 1 for financial instruments measured at fair value on a recurring basis during the year ended December 31, 2012. There were $ 2 million in transfers from Level 2 to Level 3 and $ 8 million in transfers from Level 3 to Level 2 for financial instruments measured at fair value on a recurring basis during the year ended December 31, 2012. The transfers from Level 2 to Level 3 of trading mortgage-backed securities were the result of a change in valuation technique to a matrix pricing model, based on indicative prices provided by brokers. The transfers from Level 3 to Level 2 of trading mortgage-backed securities resulted from observable market data becoming available for these securities. The Corporation’s policy is to recognize transfers as of the end of the reporting period.
Trading Account Securities and Investment Securities Available-for-Sale
The majority of the values for trading account securities and investment securities available-for-sale are obtained from third-party pricing services and are validated with alternate pricing sources when available. Securities not priced by a secondary pricing source are documented and validated internally according to their significance to the Corporation’s financial statements. Management has established materiality thresholds according to the investment class to monitor and investigate material deviations in prices obtained from the primary pricing service provider and the secondary pricing source used as support for the valuation results. During the year ended December 31, 2013, the Corporation did not adjust any prices obtained from pricing service providers or broker dealers.
Inputs are evaluated to ascertain that they consider current market conditions, including the relative liquidity of the market. When a market quote for a specific security is not available, the pricing service provider generally uses observable data to derive an exit
12
price for the instrument, such as benchmark yield curves and trade data for similar products. To the extent trading data is not available, the pricing service provider relies on specific information including dialogue with brokers, buy side clients, credit ratings, spreads to established benchmarks and transactions on similar securities, to draw correlations based on the characteristics of the evaluated instrument. If for any reason the pricing service provider cannot observe data required to feed its model, it discontinues pricing the instrument. During the year ended December 31, 2013, none of the Corporation’s investment securities were subject to pricing discontinuance by the pricing service providers. The pricing methodology and approach of our primary pricing service providers is concluded to be consistent with the fair value measurement guidance.
Furthermore, management assesses the fair value of its portfolio of investment securities at least on a quarterly basis, which includes analyzing changes in fair value that have resulted in losses that may be considered other-than-temporary. Factors considered include, for example, the nature of the investment, severity and duration of possible impairments, industry reports, sector credit ratings, economic environment, creditworthiness of the issuers and any guarantees.
Securities are classified in the fair value hierarchy according to product type, characteristics and market liquidity. At the end of each period, management assesses the valuation hierarchy for each asset or liability measured. The fair value measurement analysis performed by the Corporation includes validation procedures and review of market changes, pricing methodology, assumption and level hierarchy changes, and evaluation of distressed transactions.
At December 31, 2013, the Corporation’s portfolio of trading and investment securities available-for-sale amounted to $ 5.6 billion and represented 97% of the Corporation’s assets measured at fair value on a recurring basis. At December 31, 2013, net unrealized gains on the trading securities approximated $7 million and net unrealized losses on available-for-sale investment securities portfolio approximated to $ 51 million. Fair values for most of the Corporation’s trading and investment securities available-for-sale were classified as Level 2. Trading and investment securities available-for-sale classified as Level 3, which were the securities that involved the highest degree of judgment, represent less than 1% of the Corporation’s total portfolio of trading and investment securities available-for-sale.
Mortgage Servicing Rights
Mortgage servicing rights (“MSRs”), which amounted to $ 161 million at December 31, 2013, and are primarily related to residential mortgage loans originated in Puerto Rico, do not trade in an active, open market with readily observable prices. Fair value is estimated based upon discounted net cash flows calculated from a combination of loan level data and market assumptions. The valuation model combines loans with common characteristics that impact servicing cash flows (e.g. investor, remittance cycle, interest rate, product type, etc.) in order to project net cash flows. Market valuation assumptions include prepayment speeds, discount rate, cost to service, escrow account earnings, and contractual servicing fee income, among other considerations. Prepayment speeds are derived from market data that is more relevant to the U.S. mainland loan portfolios and, thus, are adjusted for the Corporation’s loan characteristics and portfolio behavior since prepayment rates in Puerto Rico have been historically lower. Other assumptions are, in the most part, directly obtained from third-party providers. Disclosure of two of the key economic assumptions used to measure MSRs, which are prepayment speed and discount rate, and a sensitivity analysis to adverse changes to these assumptions, is included in Note 13 to the consolidated financial statements.
Derivatives
Derivatives, such as interest rate swaps, interest rate caps and indexed options, are traded in over-the-counter active markets. These derivatives are indexed to an observable interest rate benchmark, such as LIBOR or equity indexes, and are priced using an income approach based on present value and option pricing models using observable inputs. Other derivatives are liquid and have quoted prices, such as forward contracts or “to be announced securities” (“TBAs”). All of these derivatives held by the Corporation were classified as Level 2. Valuations of derivative assets and liabilities reflect the values associated with counterparty risk and nonperformance risk, respectively. The non-performance risk, which measures the Corporation’s own credit risk, is determined using internally-developed models that consider the net realizable value of the collateral posted, remaining term, and the creditworthiness or credit standing of the Corporation. The counterparty risk is also determined using internally-developed models which incorporate the creditworthiness of the entity that bears the risk, net realizable value of the collateral received, and available public data or internally-developed data to determine their probability of default. To manage the level of credit risk, the Corporation employs procedures for credit approvals and credit limits, monitors the counterparties’ credit condition, enters into master netting agreements whenever possible and, when appropriate, requests additional collateral. During the year ended December 31, 2013, inclusion of credit risk in the fair value of the derivatives resulted in a net gain of $1.5 million recorded in the other operating income and interest expense captions of the consolidated statement of operations, which consisted of a gain of $0.5 million resulting from the Corporation’s own credit standing adjustment and a gain of $1.0 million from the assessment of the counterparties’ credit risk.
13
Contingent consideration liability
The fair value of the true-up payment obligation (contingent consideration) to the FDIC as it relates to the Westernbank FDIC-assisted transaction amounted to $128 million at December 31, 2013. The fair value was estimated using projected cash flows related to the loss sharing agreements at the true-up measurement date, taking into consideration the intrinsic loss estimate, asset premium/discount, cumulative shared loss payments, and the cumulative servicing amount related to the loan portfolio. Refer to Note 11 to the consolidated financial statements for a description of the true-up payment formula. The true-up payment obligation was discounted using a term rate consistent with the time remaining until the payment is due. The discount rate was an estimate of the sum of the risk-free benchmark rate for the term remaining before the true-up payment is due and a risk premium to account for the credit risk profile of BPPR. The risk premium was calculated based on a 12-month trailing average spread of the yields on corporate bonds with credit ratings similar to BPPR.
Loans held-in-portfolio considered impaired under ASC Section 310-10-35 that are collateral dependent
The impairment is measured based on the fair value of the collateral, which is derived from appraisals that take into consideration prices in observed transactions involving similar assets in similar locations, size and supply and demand. The challenging conditions of the housing markets continue to affect the market activity related to real estate properties. These collateral dependent impaired loans are classified as Level 3 and are reported as a nonrecurring fair value measurement.
Loans measured at fair value pursuant to lower of cost or fair value adjustments
Loans measured at fair value on a nonrecurring basis pursuant to lower of cost or fair value were priced based on secondary market prices and discounted cash flow models which incorporate internally-developed assumptions for prepayments and credit loss estimates. These loans are classified as Level 3.
Other real estate owned and other foreclosed assets
Other real estate owned includes real estate properties securing mortgage, consumer, and commercial loans. Other foreclosed assets include automobiles securing auto loans. The fair value of foreclosed assets may be determined using an external appraisal, broker price opinion, internal valuation or binding offer. The majority of these foreclosed assets is classified as Level 3 since they are subject to internal adjustments and reported as a nonrecurring fair value measurement.
Loans and Allowance for Loan Losses
Interest on loans is accrued and recorded as interest income based upon the principal amount outstanding.
Non-accrual loans are those loans on which the accrual of interest is discontinued. When a loan is placed on non-accrual status, all previously accrued and unpaid interest is charged against income and the loan is accounted for either on a cash-basis method or on the cost-recovery method. Loans designated as non-accruing are returned to accrual status when the Corporation expects repayment of the remaining contractual principal and interest. The determination as to the ultimate collectability of the loan’s balance may involve management’s judgment in the evaluation of the borrower’s financial condition and prospects for repayment.
Refer to the MD&A section titled Credit Risk Management and Loan Quality, particularly the Non-performing assets sub-section, for a detailed description of the Corporation’s non-accruing and charge-off policies by major loan categories.
One of the most critical and complex accounting estimates is associated with the determination of the allowance for loan losses. The provision for loan losses charged to current operations is based on this determination. The Corporation’s assessment of the allowance for loan losses is determined in accordance with accounting guidance, specifically guidance of loss contingencies in ASC Subtopic 450-20 and loan impairment guidance in ASC Section 310-10-35.
The accounting guidance provides for the recognition of a loss allowance for groups of homogeneous loans. The determination for general reserves of the allowance for loan losses includes the following principal factors:
14
| | — | | Base net loss rates, which are based on the moving average of annualized net loss rates computed over a 3-year historical loss period for the commercial and construction loan portfolios, and an 18-month period for the consumer and mortgage loan portfolios. The base net loss rates are applied by loan type and by legal entity. |
| | — | | Recent loss trend adjustment, which replaces the base loss rate with a 12-month average loss rate for the commercial, construction and legacy loan portfolios and 6-month average loss rate for the consumer and mortgage loan portfolios, when these trends are higher than the respective base loss rates, up to a determined cap in the case of consumer and mortgage loan portfolios. The objective of this adjustment is to allow for a more recent loss trend to be captured and reflected in the ALLL estimation process, while limiting excessive pro-cyclicality on changing economic periods using caps for the consumer and mortgage portfolios given the shorter six month look back window. These caps are calibrated annually at the end of each year and consistently applied until the next annual review. As part of the periodic review of the adequacy of the ALLL models and related assumptions, management monitors and reviews the loan segments for which the caps are being triggered in order to assess the reasonability of the cap in light of the risk profile of the portfolio and current credit and loss trends. Upon the completion of these qualitative reviews, management may make reserve adjustments that may partially or fully override the effect of the caps, if warranted. The caps are determined by measuring historic periods in which the recent loss trend adjustment rates were higher than the base loss rates and setting the cap at a percentile of the historic trend loss rates. |
For the period ended December 31, 2013, the recent loss trend adjustment caps for the consumer and mortgage portfolios were triggered in only one portfolio segment within the Puerto Rico consumer portfolio. Management assessed the impact of the applicable cap through a review of qualitative factors that specifically considered the drivers of recent loss trends and changes to the portfolio composition. The related effect of the aforementioned cap was immaterial for the overall level of the Allowance for Loan and Lease Losses for the Puerto Rico consumer portfolio.
For the period ended December 31, 2012, the recent loss trend adjustment caps for the consumer and mortgage portfolios were triggered in three consumer portfolio segments and one mortgage portfolio segment in the Puerto Rico region, and three consumer portfolio segments in the US region. Management assessed the adequacy of the applicable caps through a review of qualitative factors and recorded a $4 million qualitative offsetting adjustment that reversed the effect of the cap on the overall level of the Allowance for Loan and Lease Losses for the Puerto Rico mortgage portfolio. This offsetting adjustment considered the aforementioned review of qualitative factors, specifically, the 2012 revision to the Corporation’s charge-off policy that resulted in higher loss trends for this portfolio. The related effect of the aforementioned Puerto Rico and US region caps was immaterial for the overall level of the Allowance for Loan and Lease Losses for the corresponding portfolios.
At December 31, 2012, the impact of the use of recent loss trend adjustment caps on the overall level of Allowance for Loan and Lease Losses for the commercial portfolio was immaterial. The use of recent loss trend adjustment caps in the commercial portfolio was eliminated in the second quarter of 2013.
For the period ended December 31, 2013, 27% (2012 – 32%) of the ALLL for BPPR non-covered loan portfolios utilized the recent loss trend adjustment instead of the base loss. The effect of replacing the base loss with the recent loss trend adjustment was mainly concentrated in the commercial multi-family, leasing, and auto loan portfolios for 2013, and in the commercial multi-family, commercial and industrial, construction, credit cards, and personal loan portfolios for 2012.
For the period ended December 31, 2013, 29% (2012 – 8%) of the ALLL for BPNA loan portfolios utilized the recent loss trend adjustment instead of the base loss. The effect of replacing the base loss with the recent loss trend adjustment was mainly concentrated in the commercial multi-family, commercial real estate non-owner occupied, commercial and industrial and legacy loan portfolios for 2013, and in the construction and legacy loan portfolios for 2012.
| | — | | Environmental factors, which include credit and macroeconomic indicators such as unemployment rate, economic activity index and delinquency rates, were adopted to account for current market conditions that are likely to cause estimated credit losses to differ from historical losses. The Corporation reflects the effect of these environmental factors on each loan group as an adjustment that, as appropriate, increases or decreases the historical loss rate applied to each group. Environmental factors provide updated perspective on credit and economic conditions. Regression analysis was used to select these indicators and quantify the effect on the general reserve of the allowance for loan losses. |
During the second quarter of 2013, management enhanced the estimation process for evaluating the adequacy of the general reserve component of the allowance for loan losses. The enhancements to the ALLL methodology, which are described in the paragraphs below, were implemented as of June 30, 2013 and resulted in a net increase to the allowance for loan losses of $11.8 million for the non-covered portfolio and $7.5 million for the covered portfolio.
Management made the following principal changes to the methodology during the second quarter of 2013:
| | — | | Incorporated risk ratings to establish a more granular stratification of the commercial, construction and legacy loan portfolios to enhance the homogeneity of the loan classes.Prior to the second quarter enhancements, the Corporation’s loan segmentation was based on product type, line of business and legal entity. During the second quarter of 2013, lines of business were simplified and a regulatory risk classification level was added. These changes increase the homogeneity of each portfolio and capture the higher potential for loan loss in the criticized and substandard accruing categories. |
These enhancements resulted in a decrease to the allowance for loan losses of $42.9 million at June 30, 2013, which consisted of a $35.7 million decrease in the non-covered BPPR segment and a $7.2 million reduction in the BPNA segment.
| | — | | Recalibration and enhancements of the environmental factors adjustment. The environmental factor adjustments are developed by performing regression analyses on selected credit and economic indicators for each applicable loan segment. Prior to the second quarter enhancements, these adjustments were applied in the form of a set of multipliers and weights assigned to credit and economic indicators. During the second quarter of 2013, the environmental factor models used to account for changes in current credit and macroeconomic conditions, were enhanced and recalibrated based on the latest applicable trends. Also, as part of these enhancements, environmental factors are directly applied to the adjusted base loss rates using regression models based on particular credit data for the segment and relevant economic factors. These enhancements result in a more precise adjustment by having recalibrated models with improved |
15
| | statistical analysis and eliminating the multiplier concept that ensures that environmental factors are sufficiently sensitive to changing economic conditions. |
The combined effect of the aforementioned changes to the environmental factors adjustment resulted in an increase to the allowance for loan losses of $52.5 million at June 30, 2013, of which $56.1 million related to the non-covered BPPR segment, offset in part by a $3.6 million reduction in the BPNA segment.
There were additional enhancements to the allowance for loan losses methodology which accounted for an increase of $9.7 million at June 30, 2013 at the BPPR segment. These enhancements included the elimination of the use of a cap for the commercial recent loss adjustment (12-month average), the incorporation of a minimum general reserve assumption for the commercial, construction and legacy portfolios with minimal or zero loss history, and the application of the enhanced ALLL framework to the covered loan portfolio.
A loan is impaired when, based on current information and events, it is probable that the principal and/or interest are not going to be collected according to the original contractual terms of the loan agreement. Current information and events include “environmental” factors, e.g. existing industry, geographical, economic and political factors. Probable means the future event or events which will confirm the loss or impairment of the loan is likely to occur.
According to the accounting guidance criteria for specific impairment of a loan, the Corporation defines as impaired loans those commercial and construction borrowers with total debt greater than or equal to $1 million classified as “Substandard Non-Accrual”, “Doubtful” or “Loss”, as well as non-accrual loans and trouble debt restructurings. Commercial and construction loans that originally met the Corporation’s threshold for impairment identification in a prior period, but due to charge-offs or payments are currently below the $1 million threshold and are still 90 days past due, except for TDRs, are accounted for under the Corporation’s general reserve methodology. Although the accounting codification guidance for specific impairment of a loan excludes large groups of smaller balance homogeneous loans that are collectively evaluated for impairment (e.g. mortgage and consumer loans), it specifically requires that loan modifications considered troubled debt restructurings (“TDRs”) be analyzed under its provisions. An allowance for loan impairment is recognized to the extent that the carrying value of an impaired loan exceeds the present value of the expected future cash flows discounted at the loan’s effective rate, the observable market price of the loan, if available, or the fair value of the collateral if the loan is collateral dependent.
The fair value of the collateral on commercial and construction loans is generally derived from appraisals. The Corporation periodically requires updated appraisal reports for loans that are considered impaired. The frequency of updated appraisals depends on total debt outstanding and type of collateral. Currently, for commercial and construction loans secured by real estate, if the borrower’s total debt is equal to or greater than $1 million, the appraisal is updated annually. If the borrower’s total debt is less than $1 million, the appraisal is updated at least every two years.
As a general procedure, the Corporation internally reviews appraisals as part of the underwriting and approval process and also for credits considered impaired following certain materiality benchmarks. Appraisals may be adjusted due to their age, property conditions, geographical area or general market conditions. The adjustments applied are based upon internal information, like other appraisals and/or loss severity information that can provide historical trends in the real estate market. Discount rates used may change from time-to-time based on management’s estimates. Refer to the Credit Risk Management and Loan Quality section of this MD&A for more detailed information on the Corporation’s collateral value estimation for other real estate.
The Corporation’s management evaluates the adequacy of the allowance for loan losses on a quarterly basis following a systematic methodology in order to provide for known and inherent risks in the loan portfolio. In developing its assessment of the adequacy of the allowance for loan losses, the Corporation must rely on estimates and exercise judgment regarding matters where the ultimate outcome is unknown such as economic developments affecting specific customers, industries or markets. Other factors that can affect management’s estimates are the years of historical data to include when estimating losses, the level of volatility of losses in a specific portfolio, changes in underwriting standards, financial accounting standards and loan impairment measurement, among others. Changes in the financial condition of individual borrowers, in economic conditions, in historical loss experience and in the condition of the various markets in which collateral may be sold may all affect the required level of the allowance for loan losses. Consequently, the business, financial condition, liquidity, capital and results of operations could also be affected.
The collateral dependent method is generally used for the impairment determination on commercial and construction loans since the expected realizable value of the loan is based upon the proceeds received from the liquidation of the collateral property. For commercial properties, the “as is” value or the “income approach” value is used depending on the financial condition of the subject
16
borrower and/or the nature of the subject collateral. In most cases, impaired commercial loans do not have reliable or sustainable cash flow to use the discounted cash flow valuation method. On construction loans, “as developed” collateral values are used when the loan is originated since the assumption is that the cash flow of the property once leased or sold will provide sufficient funds to repay the loan. In the case of many impaired construction loans, the “as developed” collateral value is also used since completing the project reflects the best exit strategy in terms of potential loss reduction. In these cases, the costs to complete are considered as part of the impairment determination. As a general rule, the appraisal valuation used by the Corporation for impaired construction loans is based on discounted value to a single purchaser, discounted sell out or “as is” depending on the condition and status of the project and the performance of the same.
A restructuring constitutes a TDR when the Corporation separately concludes that both of the following conditions exist: (i) the restructuring constitutes a concession and (ii) the debtor is experiencing financial difficulties. The concessions stem from an agreement between the creditor and the debtor or are imposed by law or a court. These concessions could include a reduction in the interest rate on the loan, payment extensions, forgiveness of principal, forbearance or other actions intended to maximize collection. A concession has been granted when, as a result of the restructuring, the Corporation does not expect to collect all amounts due, including interest accrued at the original contract rate. If the payment of principal is dependent on the value of collateral, the current value of the collateral is taken into consideration in determining the amount of principal to be collected; therefore, all factors that changed are considered to determine if a concession was granted, including the change in the fair value of the underlying collateral that may be used to repay the loan. In addition, in order to expedite the resolution of delinquent construction and commercial loans, the Corporation routinely enters into liquidation agreements with borrowers and guarantors through the regular legal process, bankruptcy procedures and in certain occasions, out of Court transactions. These liquidation agreements, in general, contemplate the following conditions: (1) consent to judgment by the borrowers and guarantors; (2) acknowledgement by the borrower of debt, its liquidity and maturity; (3) acknowledgement of the default payments. The contractual interest rate is not reduced and continues to accrue during the term of the agreement. At the end of the period, borrower is obligated to remit all amounts due or be subject to the Corporation’s exercise of its foreclosure rights and further collection efforts. Likewise, the borrower’s failure to make stipulated payments will grant the Corporation the ability to exercise its foreclosure rights. This strategy procures to expedite the foreclosure process, resulting in a more effective and efficient collection process. Although in general, these liquidation agreements do not contemplate the forgiveness of principal or interest as debtor is required to cover all outstanding amounts when the agreement becomes due, it could be construed that the Corporation has granted a concession by temporarily accepting a payment schedule that is different from the contractual payment schedule. Accordingly, loans under this program are considered TDRs.
Classification of loan modifications as TDRs involves a degree of judgment. Indicators that the debtor is experiencing financial difficulties which are considered include: (i) the borrower is currently in default on any of its debt or it is probable that the borrower would be in payment default on any of its debt in the foreseeable future without the modification; (ii) the borrower has declared or is in the process of declaring bankruptcy; (iii) there is significant doubt as to whether the borrower will continue to be a going concern; (iv) the borrower has securities that have been delisted, are in the process of being delisted, or are under threat of being delisted from an exchange; (v) based on estimates and projections that only encompass the borrower’s current business capabilities, it is forecasted that the entity-specific cash flows will be insufficient to service the debt (both interest and principal) in accordance with the contractual terms of the existing agreement through maturity; and (vi) absent the current modification, the borrower cannot obtain funds from sources other than the existing creditors at an effective interest rate equal to the current market interest rate for similar debt for a non-troubled debtor. The identification of TDRs is critical in the determination of the adequacy of the allowance for loan losses. Loans classified as TDRs are excluded from TDR status if performance under the restructured terms exists for a reasonable period (at least twelve months of sustained performance) and the loan yields a market rate.
For mortgage and other consumer loans that are modified with regard to payment terms and which constitute TDRs, the discounted cash flow value method is used as the impairment valuation is more appropriately calculated based on the ongoing cash flow from the individuals rather than the liquidation of the collateral asset. The computations give consideration to probability of default and loss-given default on the related estimated cash flows.
Refer to Note 10 to the consolidated financial statements for disclosures on the impact of adopting ASU 2011-02 and to Note 3 for a general description of the ASU 2011-02 guidance.
Acquisition Accounting for Covered Loans and Related Indemnification Asset
17
The Corporation accounted for the Westernbank FDIC-assisted transaction under the accounting guidance of ASC Topic 805,Business Combinations, which requires the use of the purchase method of accounting. All identifiable assets and liabilities acquired were initially recorded at fair value. No allowance for loan losses related to the acquired loans was recorded on the acquisition date as the fair value of the loans acquired incorporated assumptions regarding credit risk. Loans acquired were recorded at fair value in accordance with the fair value methodology prescribed in ASC Topic 820, exclusive of the shared-loss agreements with the FDIC. These fair value estimates associated with the loans included estimates related to expected prepayments and the amount and timing of expected principal, interest and other cash flows.
Because the FDIC has agreed to reimburse the Corporation for losses related to the acquired loans in the Westernbank FDIC-assisted transaction, subject to certain provisions specified in the agreements, an indemnification asset was recorded at fair value at the acquisition date. The indemnification asset was recognized at the same time as the indemnified loans, and is measured on the same basis, subject to collectability or contractual limitations. The loss share indemnification asset on the acquisition date reflected the reimbursements expected to be received from the FDIC, using an appropriate discount rate, which reflected counterparty credit risk and other uncertainties.
The initial valuation of these loans and related indemnification asset required management to make subjective judgments concerning estimates about how the acquired loans would perform in the future using valuation methods, including discounted cash flow analyses and independent third-party appraisals. Factors that may significantly affect the initial valuation included, among others, market-based and industry data related to expected changes in interest rates, assumptions related to probability and severity of credit losses, estimated timing of credit losses including the timing of foreclosure and liquidation of collateral, expected prepayment rates, required or anticipated loan modifications, unfunded loan commitments, the specific terms and provisions of any loss share agreements, and specific industry and market conditions that may impact discount rates and independent third-party appraisals.
The Corporation applied the guidance of ASC Subtopic 310-30 to all loans acquired in the Westernbank FDIC-assisted transaction (including loans that do not meet the scope of ASC Subtopic 310-30), except for credit cards and revolving lines of credit. ASC Subtopic 310-30 provides two specific criteria that have to be met in order for a loan to be within its scope: (1) credit deterioration on the loan from its inception until the acquisition date and (2) that it is probable that not all of the contractual cash flows will be collected on the loan. Once in the scope of ASC Subtopic 310-30, the credit portion of the fair value discount on an acquired loan cannot be accreted into income until the acquirer has assessed that it expects to receive more cash flows on the loan than initially anticipated.
Acquired loans that meet the definition of nonaccrual status fall within the Corporation’s definition of impaired loans under ASC Subtopic 310-30. It is possible that performing loans would not meet criteria number 1 above related to evidence of credit deterioration since the date of loan origination, and therefore not fall within the scope of ASC Subtopic 310-30. Based on the fair value determined for the acquired portfolio, acquired loans that did not meet the Corporation’s definition of non-accrual status also resulted in the recognition of a significant discount attributable to credit quality.
Given the significant discount related to credit in the valuation of the Westernbank acquired portfolio, the Corporation considered two possible options for the performing loans (1) accrete the entire fair value discount (including the credit portion) using the interest method over the life of the loan in accordance with ASC Subtopic 310-20; or (2) analogize to ASC Subtopic 310-30 and only accrete the portion of the fair value discount unrelated to credit.
Pursuant to an AICPA letter dated December 18, 2009, the AICPA summarized the SEC Staff’s view regarding the accounting in subsequent periods for discount accretion associated with loan receivables acquired in a business combination or asset purchase. Regarding the accounting for such loan receivables, in the absence of further standard setting, the AICPA understands that the SEC Staff would not object to an accounting policy based on contractual cash flows (Option 1 - ASC Subtopic 310-20 approach) or an accounting policy based on expected cash flows (Option 2 – ASC Subtopic 310-30 approach). As such, the Corporation considered the two allowable options as follows:
| | — | | Option 1 - Since the credit portion of the fair value discount is associated with an expectation of cash flows that an acquirer does not expect to receive over the life of the loan, it does not appear appropriate to accrete that portion over the life of the loan as doing so could eventually overstate the acquirer’s expected value of the loan and ultimately result in recognizing income (i.e. through the accretion of the yield) on a portion of the loan it does not expect to receive. Therefore, the Corporation does not believe this is an appropriate method to apply. |
18
| | — | | Option 2 – The Corporation believes analogizing to ASC Subtopic 310-30 is the more appropriate option to follow in accounting for the credit portion of the fair value discount. By doing so, the loan is only being accreted up to the value that the acquirer expected to receive at acquisition of the loan. |
Based on the above, the Corporation elected Option 2 – the ASC Subtopic 310-30 approach to the outstanding balance for all the acquired loans in the Westernbank FDIC-assisted transaction with the exception of revolving lines of credit with active privileges as of the acquisition date, which are explicitly scoped out by the ASC Subtopic 310-30 accounting guidance. New advances / draws after the acquisition date under existing credit lines that did not have revolving privileges as of the acquisition date, particularly for construction loans, will effectively be treated as a “new” loan for accounting purposes and accounted for under the provisions of ASC Subtopic 310-20, resulting in a hybrid accounting for the overall construction loan balance.
Management used judgment in evaluating factors impacting expected cash flows and probable loss assumptions, including the quality of the loan portfolio, portfolio concentrations, distressed economic conditions in Puerto Rico, quality of underwriting standards of the acquired institution, reductions in collateral real estate values, and material weaknesses disclosed by the acquired institution, including matters related to credit quality review and appraisal report review.
At April 30, 2010, the acquired loans accounted for pursuant to ASC Subtopic 310-30 by the Corporation totaled $4.9 billion which represented undiscounted unpaid contractually-required principal and interest balances of $9.9 billion reduced by a discount of $5.0 billion resulting from acquisition date fair value adjustments. The non-accretable discount on loans accounted for under ASC Subtopic 310-30 amounted to $3.4 billion or approximately 68% of the total discount, thus indicating a significant amount of expected credit losses on the acquired portfolios.
Pursuant to ASC Section 310-20-15-5, the Corporation aggregated loans acquired in the FDIC-assisted transaction into pools with common risk characteristics for purposes of applying the recognition, measurement and disclosure provisions of this subtopic. Each loan pool is accounted for as a single asset with a single composite interest rate and an aggregate expectation of cash flows. Characteristics considered in pooling loans in the Westernbank FDIC-assisted transaction included loan type, interest rate type, accruing status, amortization type, rate index and source type. Once the pools are defined, the Corporation maintains the integrity of the pool of multiple loans accounted for as a single asset.
Under ASC Subtopic 310-30, the difference between the undiscounted cash flows expected at acquisition and the fair value of the loans, or the “accretable yield,” is recognized as interest income using the effective yield method over the estimated life of the loan if the timing and amount of the future cash flows of the pool is reasonably estimable. The non-accretable difference represents the difference between contractually required principal and interest and the cash flows expected to be collected. Subsequent to the acquisition date, increases in cash flows over those expected at the acquisition date are recognized as interest income prospectively as an adjustment to accretable yield over the pool’s remaining life. Decreases in expected cash flows after the acquisition date are generally recognized by recording an allowance for loan losses.
The fair value discount of lines of credit with revolving privileges that are accounted for pursuant to the guidance of ASC Subtopic 310-20, represented the difference between the contractually required loan payment receivable in excess of the initial investment in the loan. Any cash flows collected in excess of the carrying amount of the loan are recognized in earnings at the time of collection. The carrying amount of lines of credit with revolving privileges, which are accounted pursuant to the guidance of ASC Subtopic 310-20, are subject to periodic review to determine the need for recognizing an allowance for loan losses.
The FDIC loss share indemnification asset for loss share agreements is measured separately from the related covered assets as it is not contractually embedded in the assets and is not transferable with the assets should the assets be sold.
The FDIC loss share indemnification asset is recognized on the same basis as the assets subject to loss share protection, except that the amortization / accretion terms differ for each asset. For covered loans accounted for pursuant to ASC Subtopic 310-30, decreases in expected reimbursements from the FDIC due to improvements in expected cash flows to be received from borrowers are recognized in non-interest income prospectively over the life of the FDIC loss sharing agreements. For covered loans accounted for under ASC Subtopic 310-20, as the loan discount recorded as of the acquisition date was accreted into income, a reduction of the related indemnification asset was recorded as a reduction in non-interest income. Increases in expected reimbursements from the FDIC are recognized in non-interest income in the same period that the allowance for credit losses for the related loans is recognized.
Over the life of the acquired loans that are accounted under ASC Subtopic 310-30, the Corporation continues to estimate cash flows expected to be collected on individual loans or on pools of loans sharing common risk characteristics. The Corporation evaluates at each balance sheet date whether the present value of its loans determined using the effective interest rates has decreased based
19
on revised estimated cash flows and if so, recognizes a provision for loan loss in its consolidated statement of operations and an allowance for loan losses in its consolidated statement of financial condition. For any increases in cash flows expected to be collected from borrowers, the Corporation adjusts the amount of accretable yield recognized on the loans on a prospective basis over the pool’s remaining life.
The evaluation of estimated cash flows expected to be collected subsequent to acquisition on loans accounted pursuant to ASC Subtopic 310-30 and inherent losses on loans accounted pursuant to ASC Subtopic 310-20 require the continued usage of key assumptions and estimates. Given the current economic environment, the Corporation must apply judgment to develop its estimates of cash flows considering the impact of home price and property value changes, changing loss severities and prepayment speeds. Decreases in the expected cash flows for ASC Subtopic 310-30 loans and decreases in the net realizable value of ASC Subtopic 310-20 loans will generally result in a charge to the provision for credit losses resulting in an increase to the allowance for loan losses. These estimates are particularly sensitive to changes in loan credit quality.
The amount that the Corporation realizes on the covered loans and related indemnification assets could differ materially from the carrying value reflected in these financial statements, based upon the timing and amount of collections on the acquired loans in future periods. The Corporation’s losses on these assets may be mitigated to the extent covered under the specific terms and provisions of the loss share agreements.
Income Taxes
Income taxes are accounted for using the asset and liability method. Under this method, deferred tax assets and liabilities are recognized based on the future tax consequences attributable to temporary differences between the financial statement carrying amounts of existing assets and liabilities and their respective tax basis, and attributable to operating loss and tax credit carryforwards. Deferred tax assets and liabilities are measured using enacted tax rates expected to apply in the years in which the temporary differences are expected to be recovered or paid. The effect on deferred tax assets and liabilities of a change in tax rates is recognized in earnings in the period when the changes are enacted.
The calculation of periodic income taxes is complex and requires the use of estimates and judgments. The Corporation has recorded two accruals for income taxes: (i) the net estimated amount currently due or to be received from taxing jurisdictions, including any reserve for potential examination issues, and (ii) a deferred income tax that represents the estimated impact of temporary differences between how the Corporation recognizes assets and liabilities under accounting principles generally accepted in the United States (GAAP), and how such assets and liabilities are recognized under the tax code. Differences in the actual outcome of these future tax consequences could impact the Corporation’s financial position or its results of operations. In estimating taxes, management assesses the relative merits and risks of the appropriate tax treatment of transactions taking into consideration statutory, judicial and regulatory guidance.
A deferred tax asset should be reduced by a valuation allowance if based on the weight of all available evidence, it is more likely than not (a likelihood of more than 50%) that some portion or the entire deferred tax asset will not be realized. The valuation allowance should be sufficient to reduce the deferred tax asset to the amount that is more likely than not to be realized. The determination of whether a deferred tax asset is realizable is based on weighting all available evidence, including both positive and negative evidence. The realization of deferred tax assets, including carryforwards and deductible temporary differences, depends upon the existence of sufficient taxable income of the same character during the carryback or carryforward period. The realization of deferred tax assets requires the consideration of all sources of taxable income available to realize the deferred tax asset, including the future reversal of existing temporary differences, future taxable income exclusive of reversing temporary differences and carryforwards, taxable income in carryback years and tax-planning strategies.
For purposes of assessing the realization of the deferred tax assets in the U.S. mainland management evaluates and weights all available positive and negative evidence. The Corporation’s U.S. mainland operations are no longer in a cumulative loss position for the three-year period ended December 31, 2013 taking into account taxable income adjusted by temporary differences. This represents positive evidence within management’s evaluation. The assessment as of December 31, 2013 considers the book income for 2013 and excludes the loss recorded during the fourth quarter of 2010, which previously drove the cumulative loss position. The book income for 2013 was significantly impacted by a reversal of the loan loss provision due to the improved credit quality of the loan portfolios. However, the U.S. mainland operations did not report taxable income for any of the three years evaluated. Future realization of the deferred tax assets depends on the existence of sufficient taxable income of the appropriate character within the carryforward period available under the tax law. The lack of taxable income together with the uncertainties regarding future performance represents strong negative evidence within management’s evaluation. After weighting of all positive
20
and negative evidence management concluded, as of the reporting date, that it is more likely than not that the Corporation will not be able to realize any portion of the deferred tax assets, considering the criteria of ASC Topic 740.
At December 31, 2013, the Corporation’s net deferred tax assets related to its Puerto Rico operations amounted to $790 million. The Corporation’s Puerto Rico Banking operation is not in a cumulative loss position and has sustained profitability during the years 2012 and 2013, exclusive of the loss generated on the sales of non performing assets that took place in 2013 which is not a continuing condition of the operations. This is considered a strong piece of objectively verifiable positive evidence that out weights any negative evidence considered by management in the evaluation of the realization of the deferred tax asset. Based on this evidence, the Corporation has concluded that it is more likely than not that such net deferred tax asset of the Puerto Rico operations will be realized.
Under the Puerto Rico Internal Revenue Code, the Corporation and its subsidiaries are treated as separate taxable entities and are not entitled to file consolidated tax returns. The Code provides a dividends-received deduction of 100% on dividends received from “controlled” subsidiaries subject to taxation in Puerto Rico and 85% on dividends received from other taxable domestic corporations.
Changes in the Corporation’s estimates can occur due to changes in tax rates, new business strategies, newly enacted guidance, and resolution of issues with taxing authorities regarding previously taken tax positions. Such changes could affect the amount of accrued taxes. The current income tax payable for 2013 has been paid during the year in accordance with estimated tax payments rules. Any remaining payment will not have any significant impact on liquidity and capital resources.
The valuation of deferred tax assets requires judgment in assessing the likely future tax consequences of events that have been recognized in the financial statements or tax returns and future profitability. The accounting for deferred tax consequences represents management’s best estimate of those future events. Changes in management’s current estimates, due to unanticipated events, could have a material impact on the Corporation’s financial condition and results of operations.
The Corporation establishes tax liabilities or reduces tax assets for uncertain tax positions when, despite its assessment that its tax return positions are appropriate and supportable under local tax law, the Corporation believes it may not succeed in realizing the tax benefit of certain positions if challenged. In evaluating a tax position, the Corporation determines whether it is more-likely-than-not that the position will be sustained upon examination, including resolution of any related appeals or litigation processes, based on the technical merits of the position. The Corporation’s estimate of the ultimate tax liability contains assumptions based on past experiences, and judgments about potential actions by taxing jurisdictions as well as judgments about the likely outcome of issues that have been raised by taxing jurisdictions. The tax position is measured as the largest amount of benefit that is greater than 50% likely of being realized upon ultimate settlement. The Corporation evaluates these uncertain tax positions each quarter and adjusts the related tax liabilities or assets in light of changing facts and circumstances, such as the progress of a tax audit or the expiration of a statute of limitations. The Corporation believes the estimates and assumptions used to support its evaluation of uncertain tax positions are reasonable.
The amount of unrecognized tax benefits, including accrued interest, at December 31, 2013 amounted to $11.9 million. Refer to Note 40 to the consolidated financial statements for further information on this subject matter. The Corporation anticipates a reduction in the total amount of unrecognized tax benefits within the next 12 months, which could amount to approximately $7.6 million.
The amount of unrecognized tax benefits may increase or decrease in the future for various reasons including adding amounts for current tax year positions, expiration of open income tax returns due to the statutes of limitation, changes in management’s judgment about the level of uncertainty, status of examinations, litigation and legislative activity and the addition or elimination of uncertain tax positions. Although the outcome of tax audits is uncertain, the Corporation believes that adequate amounts of tax, interest and penalties have been provided for any adjustments that are expected to result from open years. From time to time, the Corporation is audited by various federal, state and local authorities regarding income tax matters. Although management believes its approach in determining the appropriate tax treatment is supportable and in accordance with the accounting standards, it is possible that the final tax authority will take a tax position that is different than the tax position reflected in the Corporation’s income tax provision and other tax reserves. As each audit is conducted, adjustments, if any, are appropriately recorded in the consolidated financial statement in the period determined. Such differences could have an adverse effect on the Corporation’s income tax provision or benefit, or other tax reserves, in the reporting period in which such determination is made and, consequently, on the Corporation’s results of operations, financial position and / or cash flows for such period.
Goodwill
21
The Corporation’s goodwill and other identifiable intangible assets having an indefinite useful life are tested for impairment. Intangibles with indefinite lives are evaluated for impairment at least annually, and on a more frequent basis, if events or circumstances indicate impairment could have taken place. Such events could include, among others, a significant adverse change in the business climate, an adverse action by a regulator, an unanticipated change in the competitive environment and a decision to change the operations or dispose of a reporting unit.
Under applicable accounting standards, goodwill impairment analysis is a two-step test. The first step of the goodwill impairment test involves comparing the fair value of the reporting unit with its carrying amount, including goodwill. If the fair value of the reporting unit exceeds its carrying amount, goodwill of the reporting unit is considered not impaired; however, if the carrying amount of the reporting unit exceeds its fair value, the second step must be performed. The second step involves calculating an implied fair value of goodwill for each reporting unit for which the first step indicated possible impairment. The implied fair value of goodwill is determined in the same manner as the amount of goodwill recognized in a business combination, which is the excess of the fair value of the reporting unit, as determined in the first step, over the aggregate fair values of the individual assets, liabilities and identifiable intangibles (including any unrecognized intangible assets, such as unrecognized core deposits and trademark) as if the reporting unit was being acquired in a business combination and the fair value of the reporting unit was the price paid to acquire the reporting unit. The Corporation estimates the fair values of the assets and liabilities of a reporting unit, consistent with the requirements of the fair value measurements accounting standard, which defines fair value as the price that would be received to sell an asset or paid to transfer a liability in an orderly transaction between market participants at the measurement date. The fair value of the assets and liabilities reflects market conditions, thus volatility in prices could have a material impact on the determination of the implied fair value of the reporting unit goodwill at the impairment test date. The adjustments to measure the assets, liabilities and intangibles at fair value are for the purpose of measuring the implied fair value of goodwill and such adjustments are not reflected in the consolidated statement of condition. If the implied fair value of goodwill exceeds the goodwill assigned to the reporting unit, there is no impairment. If the goodwill assigned to a reporting unit exceeds the implied fair value of the goodwill, an impairment charge is recorded for the excess. An impairment loss recognized cannot exceed the amount of goodwill assigned to a reporting unit, and the loss establishes a new basis in the goodwill. Subsequent reversal of goodwill impairment losses is not permitted under applicable accounting standards.
At December 31, 2013, goodwill amounted to $648 million. Note 17 to the consolidated financial statements provides the assignment of goodwill by reportable segment and the Corporate group.
The Corporation performed the annual goodwill impairment evaluation for the entire organization during the third quarter of 2013 using July 31, 2013 as the annual evaluation date. The reporting units utilized for this evaluation were those that are one level below the business segments, which are the legal entities within the reportable segment. The Corporation assigns goodwill to the reporting units when carrying out a business combination.
In determining the fair value of a reporting unit, the Corporation generally uses a combination of methods, including market price multiples of comparable companies and transactions, as well as discounted cash flow analysis. Management evaluates the particular circumstances of each reporting unit in order to determine the most appropriate valuation methodology. The Corporation evaluates the results obtained under each valuation methodology to identify and understand the key value drivers in order to ascertain that the results obtained are reasonable and appropriate under the circumstances. Elements considered include current market and economic conditions, developments in specific lines of business, and any particular features in the individual reporting units.
The computations require management to make estimates and assumptions. Critical assumptions that are used as part of these evaluations include:
| | |
| — | | a selection of comparable publicly traded companies, based on nature of business, location and size; |
| |
| — | | a selection of comparable acquisition and capital raising transactions; |
| |
| — | | the discount rate applied to future earnings, based on an estimate of the cost of equity; |
| |
| — | | the potential future earnings of the reporting unit; and |
| |
| — | | the market growth and new business assumptions. |
For purposes of the market comparable approach, valuations were determined by calculating average price multiples of relevant value drivers from a group of companies that are comparable to the reporting unit being analyzed and applying those price multiples to the value drivers of the reporting unit. Multiples used are minority based multiples and thus, no control premium adjustment is
22
made to the comparable companies market multiples. While the market price multiple is not an assumption, a presumption that it provides an indicator of the value of the reporting unit is inherent in the valuation. The determination of the market comparables also involves a degree of judgment.
For purposes of the discounted cash flows (“DCF”) approach, the valuation is based on estimated future cash flows. The financial projections used in the DCF valuation analysis for each reporting unit are based on the most recent (as of the valuation date) financial projections presented to the Corporation’s Asset / Liability Management Committee (“ALCO”). The growth assumptions included in these projections are based on management’s expectations for each reporting unit’s financial prospects considering economic and industry conditions as well as particular plans of each entity (i.e. restructuring plans, de-leveraging, etc.). The cost of equity used to discount the cash flows was calculated using the Ibbotson Build-Up Method and ranged from 13.5% to 17.34% for the 2013 analysis. The Ibbotson Build-Up Method builds up a cost of equity starting with the rate of return of a “risk-free” asset (20-year U.S. Treasury note) and adds to it additional risk elements such as equity risk premium, size premium and industry risk premium. The resulting discount rates were analyzed in terms of reasonability given the current market conditions and adjustments were made when necessary.
For BPNA, the only reporting unit that failed Step 1, the Corporation determined the fair value of Step 1 utilizing a DCF approach and a market value approach. The market value approach is based on a combination of price multiples from comparable companies and multiples from capital raising transactions of comparable companies. The market multiples used included “price to book” and “price to tangible book”. The Step 1 fair value for BPNA under both valuation approaches (market and DCF) was below the carrying amount of its equity book value as of the valuation date (July 31), requiring the completion of Step 2. In accordance with accounting standards, the Corporation performed a valuation of all assets and liabilities of BPNA, including any recognized and unrecognized intangible assets, to determine the fair value of BPNA’s net assets. To complete Step 2, the Corporation subtracted from BPNA’s Step 1 fair value the determined fair value of the net assets to arrive at the implied fair value of goodwill. The results of the Step 2 indicated that the implied fair value of goodwill exceeded the goodwill carrying value of $402 million at July 31, 2013 resulting in no goodwill impairment. The reduction in BPNA’s Step 1 fair value was offset by a reduction in the fair value of its net assets, resulting in an implied fair value of goodwill that exceeds the recorded book value of goodwill.
The analysis of the results for Step 2 indicates that the reduction in the fair value of the reporting unit was mainly attributed to the deteriorated fair value of the loan portfolios and not to the fair value of the reporting unit as a going concern. The current negative performance of the reporting unit is principally related to deteriorated credit quality in its loan portfolio, which is consistent with the results of the Step 2 analysis. The fair value determined for BPNA’s loan portfolio in the July 31, 2013 annual test represented a discount of 15.1%, compared with 18.2% at July 2012. The discount is mainly attributed to market participant’s expected rate of returns.
If the Step 1 fair value of BPNA declines further in the future without a corresponding decrease in the fair value of its net assets or if loan discounts improve without a corresponding increase in the Step 1 fair value, the Corporation may be required to record a goodwill impairment charge. The Corporation engaged a third-party valuator to assist management in the annual evaluation of BPNA’s goodwill (including Step 1 and Step 2) as well as BPNA’s loan portfolios as of the July 31, 2013 valuation date. Management discussed the methodologies, assumptions and results supporting the relevant values for conclusions and determined they were reasonable.
For the BPPR reporting unit, the average estimated fair value calculated in Step 1 using all valuation methodologies exceeded BPPR’s equity value by approximately $387 million in the July 31, 2013 annual test as compared with approximately $222 million at July 31, 2012. This result indicates there would be no indication of impairment on the goodwill recorded in BPPR at July 31, 2012. For the BPNA reporting unit, the estimated implied fair value of goodwill calculated in Step 2 exceeded BPNA’s goodwill carrying value by approximately $557 million as compared to approximately $338 million at July 31, 2012. The increase in the excess of the implied fair value of goodwill over its carrying amount for BPNA is mainly due to an increase in the fair value of the equity of BPNA as calculated in Step 1, which is mainly attributed to improvement in BPNA financial performance and increases in market price comparable companies and transactions. The goodwill balance of BPPR and BPNA, as legal entities, represented approximately 97% of the Corporation’s total goodwill balance as of the July 31, 2013 valuation date.
Furthermore, as part of the analyses, management performed a reconciliation of the aggregate fair values determined for the reporting units to the market capitalization of Popular, Inc. concluding that the fair value results determined for the reporting units in the July 31, 2013 annual assessment were reasonable.
The goodwill impairment evaluation process requires the Corporation to make estimates and assumptions with regard to the fair value of the reporting units. Actual values may differ significantly from these estimates. Such differences could result in future impairment of goodwill that would, in turn, negatively impact the Corporation’s results of operations and the reporting units where the goodwill is recorded. Declines in the Corporation’s market capitalization could increase the risk of goodwill impairment in the future.
23
Management monitors events or changes in circumstances between annual tests to determine if these events or changes in circumstances would more likely than not reduce the fair value of a reporting unit below its carrying amount.
At December 31, 2013 and 2012, other than goodwill, the Corporation had $ 6 million of identifiable intangible assets, with indefinite useful lives, mostly associated with E-LOAN’S trademark.
The valuation of the E-LOAN trademark was performed using the “relief-from-royalty” valuation approach. The basis of the “relief-from-royalty” method is that, by virtue of having ownership of the trademark, the Corporation is relieved from having to pay a royalty, usually expressed as a percentage of revenue, for the use of trademark. The main attributes involved in the valuation of this intangible asset include the royalty rate, revenue projections that benefit from the use of this intangible, after-tax royalty savings derived from the ownership of the intangible, and the discount rate to apply to the projected benefits to arrive at the present value of this intangible. Since estimates are an integral part of this trademark impairment analysis, changes in these estimates could have a significant impact on the calculated fair value. There were no impairments recognized during the years ended December 31, 2013 and 2012 related to E-LOAN’s trademark.
Pension and Postretirement Benefit Obligations
The Corporation provides pension and restoration benefit plans for certain employees of various subsidiaries. The Corporation also provides certain health care benefits for retired employees of BPPR. The non-contributory defined pension and benefit restoration plans (“the Plans”) are frozen with regards to all future benefit accruals.
The estimated benefit costs and obligations of the pension and postretirement benefit plans are impacted by the use of subjective assumptions, which can materially affect recorded amounts, including expected returns on plan assets, discount rates, termination rates, retirement rates and health care trend rates. Management applies judgment in the determination of these factors, which normally undergo evaluation against current industry practice and the actual experience of the Corporation. The Corporation uses an independent actuarial firm for assistance in the determination of the pension and postretirement benefit costs and obligations. Detailed information on the Plans and related valuation assumptions are included in Note 34 to the consolidated financial statements.
The Corporation periodically reviews its assumption for the long-term expected return on pension plan assets. The Plans’ assets fair value at December 31, 2013 was $705.5 million. The expected return on plan assets is determined by considering various factors, including a total fund return estimate based on a weighted-average of estimated returns for each asset class in the plan. Asset class returns are estimated using current and projected economic and market factors such as real rates of return, inflation, credit spreads, equity risk premiums and excess return expectations.
As part of the review, the Corporation’s independent consulting actuaries performed an analysis of expected returns based on the plan’s asset allocation at January 1, 2014. This analysis is reviewed by the Corporation and used as a tool to develop expected rates of return, together with other data. This forecast reflects the actuarial firm’s view of expected long-term rates of return for each significant asset class or economic indicator; for example, 8.8% for large cap stocks, 9.0% for small cap stocks, 9.2% for international stocks and 4.2% for aggregate fixed-income securities at January 1, 2014. A range of expected investment returns is developed, and this range relies both on forecasts and on broad-market historical benchmarks for expected returns, correlations, and volatilities for each asset class.
As a consequence of recent reviews, the Corporation left unchanged its expected return on plan assets for year 2014 at 7.25%. The 7.25% and 7.60% had been used as the expected rate of return in 2013 and 2012, respectively. Since the expected return assumption is on a long-term basis, it is not materially impacted by the yearly fluctuations (either positive or negative) in the actual return on assets.
During the fourth quarter of 2011, the Corporation offered a Voluntary Retirement Program (“VRP”) to all active participants eligible for retirement under the Plans, excluding senior management. The VRP provided for an additional benefit of one-year of base pay, payable either as a lump-sum payment from the Plans on February 1, 2012, or as an increase in monthly pension payments on their elected pension benefit commencement date.
During 2013 the Corporation offered a Lump Sum Distribution to terminated vested participants whose deferred pension has a current value of up to $40 thousand. The acceptance of this offer was voluntary and relieved the Corporation of all future obligations related to the terminated vested participants who accepted the offer.
Pension expense for the Plans amounted to $6.8 million in 2013. The total pension expense included a credit of $45.4 million for the expected return on assets.
Pension expense is sensitive to changes in the expected return on assets. For example, decreasing the expected rate of return for 2014 from 7.25% to 7.00% would increase the projected 2014 expense for the Banco Popular de Puerto Rico Retirement Plan, the Corporation’s largest plan, by approximately $1.6 million.
24
If the projected benefit obligation exceeds the fair value of plan assets, the Corporation shall recognize a liability equal to the unfunded projected benefit obligation and vice versa, if the fair value of plan assets exceeds the projected benefit obligation, the Corporation recognizes an asset equal to the overfunded projected benefit obligation. This asset or liability may result in a taxable or deductible temporary difference and its tax effect shall be recognized as an income tax expense or benefit which shall be allocated to various components of the financial statements, including other comprehensive income. The determination of the fair value of pension plan obligations involves judgment, and any changes in those estimates could impact the Corporation’s consolidated statement of financial condition. The valuation of pension plan obligations is discussed above. Management believes that the fair value estimates of the pension plan assets are reasonable given the valuation methodologies used to measure the investments at fair value as described in Note 34. Also, the compositions of the plan assets are primarily in equity and debt securities, which have readily determinable quoted market prices.
The Corporation uses the Towers Watson RATE: Link (10/90) Model to discount the expected program cash flows of the plans as a guide in the selection of the discount rate. The Corporation used a discount rate of 4.70% to determine the plans’ benefit obligation at December 31, 2013, compared with 3.80% at December 31, 2012.
A 50 basis point decrease in the assumed discount rate of 4.70% as of the beginning of 2014 would increase the projected 2014 expense for the Banco Popular de Puerto Rico Retirement Plan by approximately $2.5 million. The change would not affect the minimum required contribution to the Plan.
The Corporation also provides a postretirement health care benefit plan for certain employees of BPPR. This plan was unfunded (no assets were held by the plan) at December 31, 2013. The Corporation had an accrual for postretirement benefit costs of $145.7 million at December 31, 2013, using a discount rate of 4.80%. Assumed health care trend rates may have significant effects on the amounts reported for the health care plan. Note 34 to the consolidated financial statements provides information on the assumed rates considered by the Corporation and on the sensitivity that a one-percentage point change in the assumed rate may have on specified cost components and the postretirement benefit obligation of the Corporation.
STATEMENT OF OPERATIONS ANALYSIS
Net Interest Income
The principal source of earnings of the Corporation is net interest income which is defined as the difference between the revenue generated from earning assets less the interest cost of funding those assets. Net interest income is subject to several risk factors, including market driven events, changes in volumes and repricing characteristics of assets and liabilities, as well as strategic decisions made by the Corporation’s management. Net interest income on a taxable equivalent basis for the year ended December 31, 2013 resulted in an increase of $55.9 million when compared with the same period in 2012.
The average key index rates for the years 2011 through 2013 were as follows:
| | | | | | | | | | | | | | | | | | |
| | | 2013 | | | | 2012 | | | | 2011 | | | | | | | |
|
| | | | | | |
Prime rate | | | 3.25% | | | | 3.25% | | | | 3.25% | | | | | | | |
Fed funds rate | | | 0.07 | | | | 0.14 | | | | 0.11 | | | | | | | |
3-month LIBOR | | | 0.27 | | | | 0.42 | | | | 0.34 | | | | | | | |
3-month Treasury Bill | | | 0.05 | | | | 0.08 | | | | 0.05 | | | | | | | |
10-year Treasury | | | 2.36 | | | | 1.74 | | | | 2.76 | | | | | | | |
FNMA 30-year | | | 3.61 | | | | 3.07 | | | | 4.11 | | | | | | | |
|
The interest earning assets include investment securities and loans that are exempt from income tax, principally in Puerto Rico. The main sources of tax-exempt interest income are certain investments in obligations of the U.S. Government, its agencies and sponsored entities, and certain obligations of the Commonwealth of Puerto Rico and its agencies and assets held by the Corporation’s international banking entities. International banking entities in Puerto Rico had a temporary 5% tax rate that ended in December, 2011. To facilitate the comparison of all interest related to these assets, the interest income has been converted to a taxable equivalent basis, using the applicable statutory income tax rates for each period. The taxable equivalent computation considers the interest expense and other related expense disallowances required by the Puerto Rico tax law. Under this law, the
25
exempt interest can be deducted up to the amount of taxable income. The increase in the taxable equivalent adjustment in 2013 as compared to 2012 can be explained by the following:
| | — | | During the quarter ended June 30, 2013 the Puerto Rico Government amended the Commonwealth’s Internal Revenue Code. The changes that were implemented included an increase in the corporate income tax rate from 30% to 39%. The effect of this change represented an increase of approximately $20.6 million in the taxable equivalent adjustment for the year ended December 31, 2013. |
| | — | | Additional exempt loan volume resulting from consumer loans purchased at the end of the second quarter 2012 resulted in an increase in the taxable equivalent adjustment of $4 million for the year 2013 as compared to 2012. This increase excludes the effect of the change in corporate income tax rate for this portfolio discussed above. |
Average outstanding securities balances are based upon amortized cost excluding any unrealized gains or losses on securities available-for-sale. Non-accrual loans have been included in the respective average loans and leases categories. Loan fees collected and costs incurred in the origination of loans are deferred and amortized over the term of the loan as an adjustment to interest yield. Prepayment penalties, late fees collected and the amortization of premiums / discounts on purchased loans are also included as part of the loan yield. Interest income for the period ended December 31, 2013 included a favorable impact, excluding the discount accretion on covered loans accounted for under ASC Subtopic 310-30, of $12.5 million, related to those items, compared to a favorable impact of $19.2 million for the same period in 2012 and $21.4 million in 2011. The $6.7 million reduction from 2012 to 2013 resulted in part from higher amortization of premiums related to mortgage loans purchased. The discount accretion on covered loans accounted for under ASC Subtopic 310-20 (revolving lines) was fully accreted in the third quarter of 2011 and totaled $37.1 million.
Table 5 presents the different components of the Corporation’s net interest income, on a taxable equivalent basis, for the year ended December 31, 2013, as compared with the same period in 2012, segregated by major categories of interest earning assets and interest bearing liabilities.
Net interest margin, on a taxable equivalent basis, increased 24 basis points to 4.72% compared to 4.48% for the years ended December 31, 2013 and 2012, respectively. The main variances are discussed below:
| | |
| ¡ | | Higher yield from commercial and construction loans due to lower levels of non- performing loans after the bulk sale completed during the first quarter of 2013 and a $4.2 million benefit from the change in statutory tax rate. |
| |
| ¡ | | A higher yield from consumer loans due mostly to the exempt loan purchases made during the second quarter of 2012 and higher taxable equivalent yield resulting from the increase in the statutory tax rate. |
| |
| ¡ | | A higher yield from covered loans due to higher expected cash flows which are reflected in the accretable yield to be recognized over the average life of the loans and loan resolutions during 2013. The positive yield was partially offset by a lower proportion of covered loans to total earning assets. Covered loans carry a high yield and as the portfolio decreases the income on earning assets is impacted. This portfolio, due to its nature, will continue to decline as scheduled payments are received and workout arrangements are made. For a detailed movement of covered loans refer to Note 9 of this Annual Report. |
| |
| ¡ | | Lower cost of interest bearing deposits by 20 basis points, mainly individual certificates of deposits, IRAs and brokered CDs related to renewal of maturities in a low interest rate environment and management’s efforts to reduce deposit costs. |
| |
| ¡ | | A lower cost of borrowings due to the early repayment of $233.2 million in senior notes during the third quarter of 2013 with an average cost of approximately 7.77% and the cancellation, during June 2012 of $350 million in repurchase agreements with an average cost of 4.36%. |
The positive impacts in net interest margin detailed above were partially offset by the following:
| | — | | Decrease in the yield of mortgage loans due to acquisition made, mainly in the US, of high quality loans, which generally carry a lower rate and originations in a lower rate environment. Also during the third quarter of 2013 the Corporation reversed $5.9 million of interest income from reverse mortgages at BPPR, which had been accrued in excess of the amount insured by FHA. These negative variances were partially offset by higher yield at BPPR after the sale of |
26
| | non-performing loans in the second quarter of 2013 and the increase in tax benefit from the change in statutory rate in Puerto Rico that approximates $4.4 million. |
| | — | | Lower interest income from investment securities due to reinvestment of cash flows received from mortgage backed securities in lower yielding collateralized mortgage obligations as well as the acquisition of lower yielding agency securities, partially offset by a higher taxable equivalent adjustment of $6.6 million related to the change in the statutory tax rate. |
Average earning assets increased $106 million when compared with 2012. An increase in mortgage loans, most through acquisitions both in PR and the US was partially offset by reductions in the covered loans portfolio. Investment securities also increased due to reinvestment and current investment strategy to shorten the duration of the portfolio. The decrease in commercial and construction loans can be attributed to the sale of non-performing loans in the first quarter of 2013 and slower origination activity both in Puerto Rico and the U.S.
On the liability side, interest bearing deposits decreased $503 million mainly due to lower broker CDs and individual time deposits. Demand deposits increased by $371 million on average when compared to 2012, positively impacting net interest margin.
For the years 2011 and 2012, net interest margin remained basically flat at 4.47% and 4.48%, respectively. There were several factors which affected its composition as detailed below:
| | — | | Decrease in the yield of investments in part due to higher premium amortization related to mortgage backed securities as a result of higher prepayment activity and renewal of cash inflows in lower yielding collateralized mortgage obligations; |
| | — | | Lower proportion and lower yield of covered loans. The yield variance was impacted by the fact that the interest income for 2011 includes $37.1 million of discount accretion related to covered loans accounted for under ASC Subtopic 310-20. This discount was fully accreted into earnings during 2011. Also, during 2011, resolutions of certain large commercial loan relationships caused the unamortized discount to be recognized into income for one pool and increased the accretable yield to be recognized over a short period of time for another pool. The accretion generated by the amortization of the discount for covered loans accounted for under ASC Subtopic 310-20 as well as the transactions occurring within these two ASC Subtopic 310-30 pools contributed to the high yield exhibited by the covered loan portfolio during 2011; |
| | — | | A decrease in the yield of mortgage loans due to acquisition made, mainly in the US, of high quality loans, which generally carry a lower rate, originations in a lower rate environment, reversal of interest for delinquent loans, and non-performing loans repurchased under credit recourse agreements. |
The above variances were partially offset by the following factors which affected positively the Corporation’s net interest margin:
| | — | | Higher yield in the non-covered construction portfolio as a result of a lower proportion of non-performing loans; |
| | — | | Decrease of 35 basis points in the cost of interest bearing deposits, driven by management actions to reduce deposit costs; |
| | — | | Lower cost of short-term borrowings resulting from the cancellation, during the quarter ended June 30, 2012, of $350 million in repurchase agreements with an average cost of 4.36% and replacing them with lower cost Federal Home Loan Bank advances. |
Average earning assets decreased $1.4 billion when compared with 2011. This reduction was distributed between both investments and loans categories. The average loan volume decreased by approximately $772 million, principally in the categories of non-covered and covered commercial loans. This reduction occurred in both Puerto Rico and U.S markets. Lower origination activity, resolution of non-performing loans and charge-offs continue to impact the portfolio balance. In addition, the covered loan portfolio continued its normal amortization which contributed to the reduction in loan balances. For a detailed movement of covered loans refer to Note 9 of this Annual Report. The increase in the mortgage loans category resulted from strong originations within the Puerto Rico market as well as acquisitions made during the year by BPNA. The Corporation also acquired $225 million in exempt consumer loans at the end of June 2012, which contributed to the increase in the average balance of this category. In addition, the reduction in the average balance of investment securities reflected maturities and prepayment activity within the mortgage related investments. The average balance of borrowings decreased by $1.4 billion mostly due to the repayment, at the end of 2011, of the note issued to the FDIC.
27
Table 5 - Analysis of Levels & Yields on a Taxable Equivalent Basis
Year ended December 31,
| | | | | | | | | | | | | | | | | | | | | | | | | | | | | | | | | | | | | | | | | | | | |
| Average Volume | | | Average Yields / Costs | | | | | Interest | | | Variance Attributable to | |
| | | | | | | | | | | | | | | | |
2013 | | | 2012 | | | Variance | | | 2013 | | | 2012 | | | Variance | | | | | 2013 | | | 2012 | | | Variance | | | Rate | | | Volume | |
| | | | | | | | |
| (In millions) | | | | | | | | | | | | | | (In thousands) | |
| | | | | | | | | | | |
| $ | 1,036 | | | $ | 1,051 | | | $ | (15 | ) | | | 0.33 | % | | | 0.35 | % | | | (0.02)% | | | Money market investments | | $ | 3,464 | | | $ | 3,704 | | | $ | (240 | ) | | $ | (129 | ) | | $ | (111) | |
| | 5,488 | | | | 5,227 | | | | 261 | | | | 2.95 | | | | 3.48 | | | | (0.53) | | | Investment securities | | | 161,868 | | | | 182,094 | | | | (20,226 | ) | | | (22,124 | ) | | | 1,898 | |
| | 417 | | | | 446 | | | | (29 | ) | | | 6.25 | | | | 5.81 | | | | 0.44 | | | Trading securities | | | 26,026 | | | | 25,909 | | | | 117 | | | | 1,882 | | | | (1,765) | |
| | | | | | | | |
| | 6,941 | | | | 6,724 | | | | 217 | | | | 2.76 | | | | 3.15 | | | | (0.39) | | | Total money market, investment and trading securities | | | 191,358 | | | | 211,707 | | | | (20,349 | ) | | | (20,371 | ) | | | 22 | |
| | | | | | | | |
| | | | | | | | | | | | | | | | | | | | | | | | Loans: | | | | | | | | | | | | | | | | | | | | |
| | 10,077 | | | | 10,226 | | | | (149 | ) | | | 5.00 | | | | 4.97 | | | | 0.03 | | | Commercial | | | 504,243 | | | | 508,417 | | | | (4,174 | ) | | | 3,265 | | | | (7,439) | |
| | 323 | | | | 459 | | | | (136 | ) | | | 5.04 | | | | 3.61 | | | | 1.43 | | | Construction | | | 16,273 | | | | 16,597 | | | | (324 | ) | | | 5,429 | | | | (5,753) | |
| | 540 | | | | 545 | | | | (5 | ) | | | 8.07 | | | | 8.62 | | | | (0.55) | | | Leasing | | | 43,542 | | | | 46,960 | | | | (3,418 | ) | | | (2,978 | ) | | | (440) | |
| | 6,688 | | | | 5,817 | | | | 871 | | | | 5.33 | | | | 5.58 | | | | (0.25) | | | Mortgage | | | 356,755 | | | | 324,574 | | | | 32,181 | | | | (14,800 | ) | | | 46,981 | |
| | 3,879 | | | | 3,749 | | | | 130 | | | | 10.26 | | | | 10.22 | | | | 0.04 | | | Consumer | | | 398,052 | | | | 383,003 | | | | 15,049 | | | | 4,651 | | | | 10,398 | |
| | | | | | | | |
| | 21,507 | | | | 20,796 | | | | 711 | | | | 6.13 | | | | 6.15 | | | | (0.02) | | | Sub-total loans | | | 1,318,865 | | | | 1,279,551 | | | | 39,314 | | | | (4,433 | ) | | | 43,747 | |
| | 3,228 | | | | 4,050 | | | | (822 | ) | | | 9.32 | | | | 7.44 | | | | 1.88 | | | Covered loans | | | 300,745 | | | | 301,441 | | | | (696 | ) | | | 63,728 | | | | (64,424) | |
| | | | | | | | |
| | 24,735 | | | | 24,846 | | | | (111 | ) | | | 6.55 | | | | 6.36 | | | | 0.19 | | | Total loans | | | 1,619,610 | | | | 1,580,992 | | | | 38,618 | | | | 59,295 | | | | (20,677) | |
| | | | | | | | |
| | | | | | | | | | | |
| $ | 31,676 | | | $ | 31,570 | | | $ | 106 | | | | 5.72 | % | | | 5.68 | % | | | 0.04 % | | | Total earning assets | | $ | 1,810,968 | | | $ | 1,792,699 | | | $ | 18,269 | | | $ | 38,924 | | | $ | (20,655) | |
| | | | | | | | |
| | | | | | | | | | | |
| | | | | | | | | | | | | | | | | | | | | | | | Interest bearing deposits: | | | | | | | | | | | | | | | | | | | | |
| $ | 5,738 | | | $ | 5,555 | | | $ | 183 | | | | 0.34 | % | | | 0.44 | % | | | (0.10)% | | | NOW and money market [1] | | $ | 19,546 | | | $ | 24,576 | | | $ | (5,030 | ) | | $ | (6,006 | ) | | $ | 976 | |
| | 6,792 | | | | 6,571 | | | | 221 | | | | 0.24 | | | | 0.33 | | | | (0.09) | | | Savings | | | 15,978 | | | | 21,854 | | | | (5,876 | ) | | | (6,453 | ) | | | 577 | |
| | 8,514 | | | | 9,421 | | | | (907 | ) | | | 1.20 | | | | 1.46 | | | | (0.26) | | | Time deposits | | | 101,840 | | | | 137,786 | | | | (35,946 | ) | | | (23,196 | ) | | | (12,750) | |
| | | | | | | | |
| | 21,044 | | | | 21,547 | | | | (503 | ) | | | 0.65 | | | | 0.85 | | | | (0.20) | | | Total deposits | | | 137,364 | | | | 184,216 | | | | (46,852 | ) | | | (35,655 | ) | | | (11,197) | |
| | | | | | | | |
| | 2,573 | | | | 2,565 | | | | 8 | | | | 1.49 | | | | 1.82 | | | | (0.33) | | | Short-term borrowings | | | 38,433 | | | | 46,805 | | | | (8,372 | ) | | | (7,517 | ) | | | (855) | |
| | 515 | | | | 484 | | | | 31 | | | | 15.98 | | | | 15.92 | | | | 0.06 | | | TARP funds [2] | | | 82,345 | | | | 76,977 | | | | 5,368 | | | | 311 | | | | 5,057 | |
| | 1,205 | | | | 1,367 | | | | (162 | ) | | | 4.79 | | | | 5.21 | | | | (0.42) | | | Other medium and long-term debt | | | 57,734 | | | | 71,215 | | | | (13,481 | ) | | | (2,761 | ) | | | (10,720) | |
| | | | | | | | |
| | 25,337 | | | | 25,963 | | | | (626 | ) | | | 1.25 | | | | 1.46 | | | | (0.21) | | | Total interest bearing liabilities | | | 315,876 | | | | 379,213 | | | | (63,337 | ) | | | (45,622 | ) | | | (17,715) | |
| | | | | | | | |
| | 5,728 | | | | 5,357 | | | | 371 | | | | | | | | | | | | | | | Non-interest bearing demand deposits | | | | | | | | | | | | | | | | | | | | |
| | 611 | | | | 250 | | | | 361 | | | | | | | | | | | | | | | Other sources of funds | | | | | | | | | | | | | | | | | | | | |
| | | | | | | | |
| | | | | | | | | | | |
| $ | 31,676 | | | $ | 31,570 | | | $ | 106 | | | | 1.00 | % | | | 1.20 | % | | | (0.20)% | | | Total source of funds | | | 315,876 | | | | 379,213 | | | | (63,337 | ) | | | (45,622 | ) | | | (17,715) | |
| | | | | | | | | | | | | | | | | | | | | | | | |
| | | | | | | | | | | | | 4.72 | % | | | 4.48 | % | | | 0.24 % | | | Net interest margin | | | | | | | | | | | | | | | | | | | | |
| | | | | | | | | | | | | | | | | | | | | | | | | | | | | | | | | | | | |
| | | | | | | | | | | | | | | | | | | | | | | | Net interest income on a taxable equivalent basis | | | 1,495,092 | | | | 1,413,486 | | | | 81,606 | | | $ | 84,546 | | | $ | (2,940) | |
| | | | | | | | | | | | | | | | | | | | | | | | | | | | | | | | | | | | | | | | |
| | | | | | | | | | | | | 4.47 | % | | | 4.22 | % | | | 0.25 % | | | Net interest spread | | | | | | | | | | | | | | | | | | | | |
| | | | | | | | | | | | | | | | | | | | | | | | | | | | | | | | | | | | |
| | | | | | | | | | | | | | | | Taxable equivalent adjustment | | | 62,512 | | | | 36,853 | | | | 25,659 | | | | | | | | | |
| | | | | | | | | | | | | | | | | | | | | | | | | | | | | | | | | | | | |
| | | | | | | | | | | | | | | | Net interest income | | $ | 1,432,580 | | | $ | 1,376,633 | | | $ | 55,947 | | | | | | | | | |
| | | | | | | | | | | | | | | | | | | | | | | | | | | | | | | | | | | | |
Note: The changes that are not due solely to volume or rate are allocated to volume and rate based on the proportion of the change in each category.
[1] Includes interest bearing demand deposits corresponding to certain government entities in Puerto Rico.
28
[2] Junior subordinated deferrable interest debentures held by the U.S. Treasury.
Table 6 - Analysis of Levels & Yields on a Taxable Equivalent Basis
Year ended December 31,
| | | | | | | | | | | | | | | | | | | | | | | | | | | | | | | | | | | | | | | | | | | | |
| Average Volume | | | Average Yields / Costs | | | | | Interest | | | Variance Attributable to | |
| | | | | | | | | | | | | | | | |
2012 | | | 2011 | | | Variance | | | 2012 | | | 2011 | | | Variance | | | | | 2012 | | | 2011 | | | Variance | | | Rate | | | Volume | |
| | | | | | | | |
| (In millions) | | | | | | | | | | | | | | (In thousands) | |
| | | | | | | | | | | |
| $ | 1,051 | | | $ | 1,152 | | | $ | (101 | ) | | | 0.35 | % | | | 0.31 | % | | | 0.04 % | | | Money market investments | | $ | 3,704 | | | $ | 3,597 | | | $ | 107 | | | $ | 206 | | | $ | (99) | |
| | 5,227 | | | | 5,494 | | | | (267 | ) | | | 3.48 | | | | 4.08 | | | | (0.60) | | | Investment securities | | | 182,094 | | | | 224,352 | | | | (42,258 | ) | | | (28,355 | ) | | | (13,903) | |
| | 446 | | | | 667 | | | | (221 | ) | | | 5.81 | | | | 5.82 | | | | (0.01) | | | Trading securities | | | 25,909 | | | | 38,850 | | | | (12,941 | ) | | | (76 | ) | | | (12,865) | |
| | | | | | | | |
| | 6,724 | | | | 7,313 | | | | (589 | ) | | | 3.15 | | | | 3.65 | | | | (0.50) | | | Total money market, investment and trading securities | | | 211,707 | | | | 266,799 | | | | (55,092 | ) | | | (28,225 | ) | | | (26,867) | |
| | | | | | | | |
| | | | | | | | | | | | | | | | | | | | | | | | Loans: | | | | | | | | | | | | | | | | | | | | |
| | 10,226 | | | | 10,889 | | | | (663 | ) | | | 4.97 | | | | 5.08 | | | | (0.11) | | | Commercial | | | 508,417 | | | | 553,025 | | | | (44,608 | ) | | | (11,458 | ) | | | (33,150) | |
| | 459 | | | | 731 | | | | (272 | ) | | | 3.61 | | | | 1.48 | | | | 2.13 | | | Construction | | | 16,597 | | | | 10,801 | | | | 5,796 | | | | 11,001 | | | | (5,205) | |
| | 545 | | | | 577 | | | | (32 | ) | | | 8.62 | | | | 8.81 | | | | (0.19) | | | Leasing | | | 46,960 | | | | 50,867 | | | | (3,907 | ) | | | (1,121 | ) | | | (2,786) | |
| | 5,817 | | | | 5,154 | | | | 663 | | | | 5.58 | | | | 6.06 | | | | (0.48) | | | Mortgage | | | 324,574 | | | | 312,348 | | | | 12,226 | | | | (25,994 | ) | | | 38,220 | |
| | 3,749 | | | | 3,654 | | | | 95 | | | | 10.22 | | | | 10.30 | | | | (0.08) | | | Consumer | | | 383,003 | | | | 376,158 | | | | 6,845 | | | | (3,484 | ) | | | 10,329 | |
| | | | | | | | |
| | 20,796 | | | | 21,005 | | | | (209 | ) | | | 6.15 | | | | 6.20 | | | | (0.05) | | | Sub-total loans | | | 1,279,551 | | | | 1,303,199 | | | | (23,648 | ) | | | (31,056 | ) | | | 7,408 | |
| | 4,050 | | | | 4,613 | | | | (563 | ) | | | 7.44 | | | | 8.95 | | | | (1.51) | | | Covered loans | | | 301,441 | | | | 412,678 | | | | (111,237 | ) | | | (63,177 | ) | | | (48,060) | |
| | | | | | | | |
| | 24,846 | | | | 25,618 | | | | (772 | ) | | | 6.36 | | | | 6.70 | | | | (0.34) | | | Total loans | | | 1,580,992 | | | | 1,715,877 | | | | (134,885 | ) | | | (94,233 | ) | | | (40,652) | |
| | | | | | | | |
| | | | | | | | | | | |
| $ | 31,570 | | | $ | 32,931 | | | $ | (1,361 | ) | | | 5.68 | % | | | 6.02 | % | | | (0.34)% | | | Total earning assets | | $ | 1,792,699 | | | $ | 1,982,676 | | | $ | (189,977 | ) | | $ | (122,458 | ) | | $ | (67,519) | |
| | | | | | | | |
| | | | | | | | | | | |
| | | | | | | | | | | | | | | | | | | | | | | | Interest bearing deposits: | | | | | | | | | | | | | | | | | | | | |
| $ | 5,555 | | | $ | 5,204 | | | $ | 351 | | | | 0.44 | % | | | 0.60 | % | | | (0.16)% | | | NOW and money market [1] | | $ | 24,576 | | | $ | 30,994 | | | $ | (6,418 | ) | | $ | (8,445 | ) | | $ | 2,027 | |
| | 6,571 | | | | 6,321 | | | | 250 | | | | 0.33 | | | | 0.60 | | | | (0.27) | | | Savings | | | 21,854 | | | | 37,844 | | | | (15,990 | ) | | | (17,584 | ) | | | 1,594 | |
| | 9,421 | | | | 10,920 | | | | (1,499 | ) | | | 1.46 | | | | 1.84 | | | | (0.38) | | | Time deposits | | | 137,786 | | | | 200,956 | | | | (63,170 | ) | | | (38,344 | ) | | | (24,826) | |
| | | | | | | | |
| | 21,547 | | | | 22,445 | | | | (898 | ) | | | 0.85 | | | | 1.20 | | | | (0.35) | | | Total deposits | | | 184,216 | | | | 269,794 | | | | (85,578 | ) | | | (64,373 | ) | | | (21,205) | |
| | | | | | | | |
| | 2,565 | | | | 2,630 | | | | (65 | ) | | | 1.82 | | | | 2.10 | | | | (0.28) | | | Short-term borrowings | | | 46,805 | | | | 55,258 | | | | (8,453 | ) | | | 3,013 | | | | (11,466) | |
| | - | | | | 1,382 | | | | (1,382 | ) | | | - | | | | 2.33 | | | | (2.33) | | | FDIC note | | | - | | | | 32,161 | | | | (32,161 | ) | | | - | | | | (32,161) | |
| | 484 | | | | 456 | | | | 28 | | | | 15.92 | | | | 15.89 | | | | 0.03 | | | TARP funds [2] | | | 76,977 | | | | 72,520 | | | | 4,457 | | | | 127 | | | | 4,330 | |
| | 1,367 | | | | 1,379 | | | | (12 | ) | | | 5.21 | | | | 5.52 | | | | (0.31) | | | Other medium and long-term debt | | | 71,215 | | | | 76,083 | | | | (4,868 | ) | | | (2,223 | ) | | | (2,645) | |
| | | | | | | | |
| | 25,963 | | | | 28,292 | | | | (2,329 | ) | | | 1.46 | | | | 1.79 | | | | (0.33) | | | Total interest bearing liabilities | | | 379,213 | | | | 505,816 | | | | (126,603 | ) | | | (63,456 | ) | | | (63,147) | |
| | | | | | | | |
| | 5,357 | | | | 5,058 | | | | 299 | | | | | | | | | | | | | | | Non-interest bearing demand deposits | | | | | | | | | | | | | | | | | | | | |
| | 250 | | | | (419 | ) | | | 669 | | | | | | | | | | | | | | | Other sources of funds | | | | | | | | | | | | | | | | | | | | |
| | | | | | | | |
| | | | | | | | | | | |
| $ | 31,570 | | | $ | 32,931 | | | $ | (1,361 | ) | | | 1.20 | % | | | 1.54 | % | | | (0.34)% | | | Total source of funds | | | 379,213 | | | | 505,816 | | | | (126,603 | ) | | | (63,456 | ) | | | (63,147) | |
| | | | | | | | |
| | | | | | | | | | | | | 4.48 | % | | | 4.48 | % | | | - % | | | Net interest margin | | | | | | | | | | | | | | | | | | | | |
| | | | | | | | | | | | | | | | | | | | |
| | | | | | | | | | | | | | | | | | | | | | | | Net interest income on a taxable equivalent basis | | | 1,413,486 | | | | 1,476,860 | | | | (63,374 | ) | | $ | (59,002 | ) | | $ | (4,372) | |
| | | | | | | | | | | | | | | | | | | | | | | | | | | | | | | | |
| | | | | | | | | | | | | 4.22 | % | | | 4.23 | % | | | (0.01)% | | | Net interest spread | | | | | | | | | | | | | | | | | | | | |
| | | | | | | | | | | | | | | | | | | | |
| | | | | | | | | | | | | | | | | | | | | | | | Taxable equivalent adjustment | | | 36,853 | | | | 41,515 | | | | (4,662 | ) | | | | | | | | |
| | | | | | | | | | | | | | | | |
| | | | | | | | | | | | | | | | | | | | | | | | Net interest income | | $ | 1,376,633 | | | $ | 1,435,345 | | | $ | (58,712 | ) | | | | | | | | |
| | | | | | | | | | | | | | | | |
29
|
| Note: The changes that are not due solely to volume or rate are allocated to volume and rate based on the proportion of the change in each category. |
|
| [1] Includes interest bearing demand deposits corresponding to certain government entities in Puerto Rico. |
|
| [2] Junior subordinated deferrable interest debentures held by the U.S. Treasury. |
|
Provision for Loan Losses
The Corporation’s total provision for loan losses totaled $602.6 million for the year ended December 31, 2013, compared with $408.9 million for 2012, and $575.7 million for 2011.
The provision for loan losses for the non-covered loan portfolio totaled $533.2 million, compared with $334.1 million for the year ended December 31, 2012, reflecting an increase of $199.1 million mostly due to the $318.1 million impact related to the bulk loan sales completed during 2013. Excluding the impact of these sales, the provision would have declined by $119.0 million, mainly due to continued credit quality improvements, partly offset by the enhancements made to the allowance for loan losses implemented during the second quarter of 2013, which resulted in a reserve increase of $11.8 million for the non-covered portfolio. The results for 2012 reflect the impact of a reduction in the reserve of $24.8 million due to certain enhancements to the methodology implemented during the first quarter of 2012. Net charge-offs declined by $149.0 million from prior year. This decline was distributed among all loan portfolios except for the leases portfolio, in which net charge-offs increased by $2.6 million.
The provision for the Puerto Rico non-covered portfolio declined by $52.3 million, excluding the impact of the bulk non-performing assets sales. The reduction was the result of improved credit metrics, offset by the impact of the enhancements to the allowance for loan losses methodology which resulted in reserve increases of $22.6 million. Also, BPPR recorded a recovery of $8.9 million associated with the sale of a portfolio of previously charged-off credit cards and personal loans during 2013.
The U.S. operations recorded a reserve release of $14.7 million for 2013, compared to a provision of $52.0 million for 2012, a $66.7 million variance. The reserve release was due to improved credit performance and the impact of the enhancements to the allowance for loan losses methodology implemented during 2013, which reduced reserve levels by $10.8 million.
The provision for the non-covered loan portfolio declined by $96.0 million from 2011 to 2012. This decline was, mainly driven by continued credit quality improvements in all loan categories, except in mortgage loans. When compared to 2011, net charge-offs for 2012 declined by $131.3 million. This decline was distributed among all loan portfolios except in the mortgage portfolio, in which net charge-offs increased by $30.1 million, principally related to the revisions to the charge-off policy during the first quarter of 2012, coupled with the continued impact of weak economic conditions in the real estate market of Puerto Rico.
The provision for covered loans totaled in 2013 $69.4 million, compared with $74.8 million for the year ended December 31, 2012, reflecting a decrease of $5.4 million, mostly driven by lower impairment losses, in part offset by $7.5 million increase related to the enhancements to the allowance for loan losses methodology. The provision declined by $70.8 million from 2011 to 2012, mostly driven by certain commercial and construction loan pools accounted for under ASC Subtopic 310-30 which reflected lower expected loss estimates and reductions in the specific reserves of certain commercial loan relationships accounted for under ASC Subtopic 310-20.
Refer to the Credit Risk Management and Loan Quality sections of this MD&A for a detailed analysis of net charge-offs, non-performing assets, the allowance for loan losses and selected loan losses statistics.
Non-Interest Income
Refer to Table 7 for a breakdown of non-interest income by major categories for the past five years.
Table 7 - Non-Interest Income
| | | | | | | | | | |
| | | Years ended December 31, |
| | |
| | | | | |
| (In thousands) | | 2013 | | 2012 | | 2011 | | 2010 | | 2009 |
| | |
30
| | | | | | | | | | | | | | | | | | | | |
| |
| | | | | |
Service charges on deposit accounts | | $ | 172,909 | | | $ | 183,026 | | | $ | 184,940 | | | $ | 195,803 | | | $ | 213,493 | |
| |
| | | | | |
Other service fees: | | | | | | | | | | | | | | | | | | | | |
| | | | | |
Debit card fees | | | 43,262 | | | | 44,852 | | | | 59,342 | | | | 100,639 | | | | 110,040 | |
| | | | | |
Credit card fees and discounts | | | 66,309 | | | | 61,576 | | | | 52,544 | | | | 85,613 | | | | 94,636 | |
| | | | | |
Insurance fees | | | 55,323 | | | | 53,825 | | | | 54,390 | | | | 49,768 | | | | 50,132 | |
| | | | | |
Processing fees | | | - | | | | 6,330 | | | | 6,839 | | | | 45,055 | | | | 55,005 | |
| | | | | |
Sale and administration of investment products | | | 35,272 | | | | 37,766 | | | | 34,388 | | | | 37,783 | | | | 34,134 | |
| | | | | |
Trust fees | | | 17,285 | | | | 16,353 | | | | 15,333 | | | | 14,217 | | | | 12,455 | |
| | | | | |
Check cashing fees | | | 191 | | | | 244 | | | | 339 | | | | 408 | | | | 588 | |
| | | | | |
Other fees | | | 17,483 | | | | 16,919 | | | | 17,825 | | | | 20,047 | | | | 22,111 | |
| |
| | | | | |
Total other services fees | | | 235,125 | | | | 237,865 | | | | 241,000 | | | | 353,530 | | | | 379,101 | |
| |
| | | | | |
Mortgage banking activities | | | 71,673 | | | | 84,791 | | | | (4,483) | | | | 16,178 | | | | 15,451 | |
| | | | | |
Net (loss) gain on sale and valuation adjustments of investment securities | | | 7,966 | | | | (1,707) | | | | 10,844 | | | | 3,992 | | | | 219,546 | |
| | | | | |
Trading account (loss) profit | | | (13,483) | | | | 4,478 | | | | 48,098 | | | | 33,017 | | | | 54,061 | |
| | | | | |
Net gain (loss) on sale of loans, including valuation adjustments on loans held-for-sale | | | (49,130) | | | | (27,416) | | | | 5,270 | | | | 7,884 | | | | (9,535) | |
| | | | | |
Adjustments (expense) to indemnity reserves on loans sold | | | (37,054) | | | | (21,198) | | | | (33,068) | | | | (72,013) | | | | (40,211) | |
| | | | | |
FDIC loss share (expense) income | | | (82,051) | | | | (56,211) | | | | 66,791 | | | �� | (25,751) | | | | - | |
| | | | | |
Fair value change in equity appreciation instrument | | | - | | | | - | | | | 8,323 | | | | 42,555 | | | | - | |
| | | | | |
Gain on sale of processing and technology business | | | - | | | | - | | | | - | | | | 640,802 | | | | - | |
| | | | | |
Other operating income | | | 504,614 | | | | 127,584 | | | | 97,711 | | | | 108,461 | | | | 64,595 | |
| |
| | | | | |
Total non-interest income | | $ | 810,569 | | | $ | 531,212 | | | $ | 625,426 | | | $ | 1,304,458 | | | $ | 896,501 | |
| |
Table 8 - Mortgage Banking Activities
| | | | | | | | | | | | | | | | | | | | |
| | | Years ended December 31, | |
| | | | | |
| (In thousands) | | 2013 | | | 2012 | | | 2011 | | | 2010 | | | 2009 | |
| |
| | | | | |
Mortgage servicing fees, net of fair value adjustments: | | | | | | | | | | | | | | | | | | | | |
| | | | | |
Mortgage servicing fees | | $ | 45,481 | | | $ | 48,176 | | | $ | 49,158 | | | $ | 47,661 | | | $ | 46,533 | |
| | | | | |
Mortgage servicing rights fair value adjustments | | | (11,403) | | | | (17,406) | | | | (37,061) | | | | (22,860) | | | | (31,447) | |
| |
| | | | | |
Total mortgage servicing fees, net of fair value adjustments | | | 34,078 | | | | 30,770 | | | | 12,097 | | | | 24,801 | | | | 15,086 | |
| |
| | | | | |
Net gain on sale of loans, including valuation on loans held-for-sale | | | 26,719 | | | | 76,181 | | | | 25,621 | | | | 7,990 | | | | 14,686 | |
| |
| | | | | |
Trading account profit (loss): | | | | | | | | | | | | | | | | | | | | |
| | | | | |
Unrealized gains (losses) on outstanding derivative positions | | | 746 | | | | 304 | | | | 956 | | | | (2,613) | | | | 6,383 | |
| | | | | |
Realized gains (losses) on closed derivative positions | | | 10,130 | | | | (22,464) | | | | (43,157) | | | | (14,000) | | | | (20,704) | |
| |
| | | | | |
Total trading account profit (loss) | | | 10,876 | | | | (22,160) | | | | (42,201) | | | | (16,613) | | | | (14,321) | |
| |
| | | | | |
Total mortgage banking activities | | $ | 71,673 | | | $ | 84,791 | | | $ | (4,483) | | | $ | 16,178 | | | $ | 15,451 | |
| |
The increase in non-interest income for the year ended December 31, 2013, when compared with the previous year, was mainly impacted by the following factors:
| | — | | Favorable variance in net gain on sale and valuation adjustments of investment securities of $9.7 million principally attributed to the prepayment penalty fee of $5.9 million received from EVERTEC for the repayment of a $22.8 million available-for-sale debt security during the second quarter of 2013, accompanied by a gain of $2.1 million on the sale of available-for-sale securities during the fourth quarter of 2013; and |
| | — | | Higher other operating income by $377.0 million principally due to gains totaling $430.3 million recognized in connection |
31
| | with EVERTEC’s public offerings during 2013; partially offset by lower net earnings on investments accounted for under the equity method mainly due to income of $31.6 million recorded during the fourth quarter of 2012 related to the Corporation’s proportionate share of a benefit from a tax grant received by EVERTEC from the Puerto Rico Government. |
These favorable variances for the year ended December 31, 2013, when compared with the previous year, were partially offset by the following factors:
| | — | | Unfavorable variance in service charges on deposit accounts by $10.1 million mainly driven by lower commercial account fees, and nonsufficient funds and overdraft fees; |
| | — | | Lower income from mortgage banking activities by $13.1 million mainly due to a decrease of $49.5 million on gain on sale of loans driven by lower market prices, partially offset by higher trading account profit by $33.0 million related to derivative positions, and an increase of $3.3 million on mortgage servicing fees resulting from fair value adjustments. Refer to Table 8 for details of Mortgage banking activities; |
| | — | | Unfavorable variance in trading account (loss) profit of $18.0 million mainly driven by higher unrealized losses on outstanding mortgage-backed securities and higher losses on Puerto Rico government obligations and closed-end funds; |
| | — | | Higher net loss on sale of loans, net of valuation adjustments by $21.7 million driven by the loss of $61.4 million recorded during the first quarter of 2013 in connection with the bulk sale of non-performing assets and the loss of $3.9 million recorded during the second quarter of 2013 in connection with the bulk sale of non-performing residential mortgage loans. The results for 2012 include valuation adjustments on commercial and construction loans held-for-sale in the BPPR reportable segment of $27.3 million recorded during the second quarter of that year as a result of updated appraisals and market indicators; |
| | — | | An increase of $15.9 million in adjustments to indemnity reserves on loans sold, which includes $10.7 million recorded in connection with the bulk sale of non-performing assets during the first quarter of 2013 and $3.0 recorded in connection with the bulk sale of non-performing residential mortgage loans during the second quarter of 2013; and |
| | — | | Unfavorable variance in FDIC loss share (expense) income of $25.8 million, principally due to higher amortization of the FDIC loss share asset due to a decrease in expected losses, higher mirror accounting on recoveries on covered assets, including rental income on OREOs, and the impact of fair value adjustments in the true-up payment obligation, partially offset by higher mirror accounting on credit impairment losses and reimbursable loan-related expenses on covered loans. Refer to Table 2 for a breakdown of FDIC loss share (expense) income by major categories. |
For the year ended December 31, 2012, non-interest income decreased by $94.2 million, or 15%, when compared to 2011, principally due to:
| | — | | Unfavorable variance in FDIC loss share (expense) income by $123.0 million mainly resulting from higher amortization of the FDIC loss share asset due to a decrease in expected losses and lower mirror accounting on credit impairment losses partially offset by higher mirror accounting on reimbursable loan-related expenses on covered loans and a favorable impact on the mirror accounting for the discount accretion on loans and unfunded commitments accounted for under ASC Subtopic 310-20; |
| | — | | Decrease of $43.6 million in trading account profit driven by lower unrealized gains on outstanding mortgage-backed securities in the P.R. operations due to lower market prices on a lower volume of outstanding pools; |
| | — | | Unfavorable variance related to valuation adjustments of $27.3 million recorded during the second quarter of 2012 on commercial and construction loans held-for-sale in the BPPR reportable segment as a result of revised appraisals and market indicators; and |
| | — | | Unfavorable variance related to the fair value change in equity appreciation instrument of $8.3 million given that the instrument expired on May 2011. |
These unfavorable variances for the year ended December 31, 2012, when compared with the year ended December 31, 2011, were partially offset by the following factors:
| | — | | Higher income from mortgage banking activities by $89.3 million due to higher gains on sale of loans, including valuation on loans, by $50.6 million resulting from higher gains on securitization transactions in the BPPR reportable segment; |
32
| | — | | Lower trading account losses by $20.0 million related to derivative positions; |
| | — | | Higher mortgage servicing fees by $18.7 million due to fair value adjustments; |
| | — | | Increase of $29.9 million in other operating income mainly due to higher net earnings on investments accounted for under the equity method; and |
| | — | | Decrease of $11.9 million in adjustments to indemnity reserves on loans sold mainly as a result of improvements in delinquency trends of mortgage loans serviced subject to credit recourse as well as a declining portfolio. |
Operating Expenses
Table 9 provides a breakdown of operating expenses by major categories.
Table 9 - Operating Expenses
| | | | | | | | | | | | | | | | | | | | |
| | | Years ended December 31, | |
| | | | |
| (In thousands) | | 2013 | | | 2012 | | | 2011 | | | 2010 | | | 2009 | |
| |
Personnel costs: | | | | | | | | | | | | | | | | | | | | |
| | | | | |
Salaries | | $ | 299,782 | | | $ | 301,965 | | | $ | 305,018 | | | $ | 352,139 | | | $ | 364,529 | |
Commissions, incentives and other bonuses | | | 59,437 | | | | 54,702 | | | | 44,421 | | | | 53,837 | | | | 43,840 | |
Pension, postretirement and medical insurance | | | 58,658 | | | | 66,976 | | | | 62,219 | | | | 61,294 | | | | 81,372 | |
Other personnel costs, including payroll taxes | | | 43,990 | | | | 42,059 | | | | 41,712 | | | | 46,928 | | | | 43,522 | |
| |
Total personnel costs | | | 461,867 | | | | 465,702 | | | | 453,370 | | | | 514,198 | | | | 533,263 | |
| |
Net occupancy expenses | | | 99,331 | | | | 97,259 | | | | 98,858 | | | | 115,219 | | | | 111,035 | |
Equipment expenses | | | 47,483 | | | | 45,290 | | | | 43,840 | | | | 85,851 | | | | 101,530 | |
Other taxes | | | 58,286 | | | | 50,120 | | | | 51,885 | | | | 50,608 | | | | 52,605 | |
Professional fees: | | | | | | | | | | | | | | | | | | | | |
Collections, appraisals and other credit related fees | | | 35,859 | | | | 46,658 | | | | 34,241 | | | | 27,081 | | | | 21,675 | |
Programming, processing and other technology services | | | 180,098 | | | | 174,657 | | | | 169,339 | | | | 64,099 | | | | 31,286 | |
Other professional fees | | | 73,323 | | | | 63,010 | | | | 64,002 | | | | 93,339 | | | | 58,326 | |
| |
Total professional fees | | | 289,280 | | | | 284,325 | | | | 267,582 | | | | 184,519 | | | | 111,287 | |
| |
Communications | | | 26,294 | | | | 26,834 | | | | 27,115 | | | | 38,905 | | | | 46,264 | |
Business promotion | | | 60,476 | | | | 61,576 | | | | 55,067 | | | | 46,671 | | | | 38,872 | |
FDIC deposit insurance | | | 60,513 | | | | 85,697 | | | | 93,728 | | | | 67,644 | | | | 76,796 | |
Loss (gain) on early extinguishment of debt | | | 3,388 | | | | 25,196 | | | | 8,693 | | | | 38,787 | | | | (78,300) | |
Other real estate owned (OREO) expenses | | | 80,236 | | | | 23,520 | | | | 21,778 | | | | 46,789 | | | | 25,800 | |
Other operating expenses: | | | | | | | | | | | | | | | | | | | | |
Credit and debit card processing, volume, interchange and other expenses | | | 20,812 | | | | 19,729 | | | | 17,539 | | | | 40,574 | | | | 43,806 | |
Transportation and travel | | | 7,322 | | | | 6,582 | | | | 7,012 | | | | 7,769 | | | | 8,796 | |
Printing and supplies | | | 3,598 | | | | 4,615 | | | | 5,273 | | | | 9,302 | | | | 11,093 | |
Operational losses | | | 18,657 | | | | 24,465 | | | | 13,239 | | | | 19,018 | | | | 13,649 | |
All other | | | 45,160 | | | | 49,050 | | | | 44,166 | | | | 67,793 | | | | 48,218 | |
| |
Total other operating expenses | | | 95,549 | | | | 104,441 | | | | 87,229 | | | | 144,456 | | | | 125,562 | |
| |
Amortization of intangibles | | | 9,883 | | | | 10,072 | | | | 9,654 | | | | 9,173 | | | | 9,482 | |
| |
| | | | | |
Total operating expenses | | $ | 1,292,586 | | | $ | 1,280,032 | | | $ | 1,218,799 | | | $ | 1,342,820 | | | $ | 1,154,196 | |
| |
Personnel costs to average assets | | | 1.27 | % | | | 1.28 | % | | | 1.19 | % | | | 1.34 | % | | | 1.46 % | |
Operating expenses to average assets | | | 3.56 | | | | 3.53 | | | | 3.20 | | | | 3.50 | | | | 3.16 | |
Employees (full-time equivalent) | | | 8,059 | | | | 8,072 | | | | 8,329 | | | | 8,277 | | | | 9,407 | |
33
| | | | | | | | | | | | | | | | | | | | |
Average assets per employee (in millions) | | $ | 4.50 | | | $ | 4.49 | | | $ | 4.57 | | | $ | 4.64 | | | $ | 3.89 | |
| |
Operating expenses for the year ended December 31, 2013 increased by $12.6 million, or 10%, when compared with the year ended December 31, 2012. The increase in operating expenses was impacted by the following variances:
| | — | | an increase in OREO expenses by $57.0 million mainly due to the $37 million loss incurred in connection with the bulk sale of non-performing assets by BPPR and higher valuation write downs consisting primarily of covered assets which are subject to 80% reimbursement from the FDIC; |
| | — | | higher other taxes by $8.2 million related to the new PR gross receipts tax enacted in June 2013, partially offset by lower personnal property tax and lower income subject to municipal tax; and |
| | — | | an increase in professional fees by $5.0 million as a result of higher professional services, legal fees and attorneys fees, mainly in the BPPR reportable segment. |
The above variances were partially offset by:
| | — | | lower FDIC deposit insurance by $25.2 million, which includes a credit of $11.3 million received from the FDIC during the first quarter, mainly driven by revisions in the deposit insurance premium calculation, lower levels of high risk assets and efficiencies achieved from the internal reorganization in which Popular Mortgage was merged into BPPR, completed at the end of 2012; |
| | — | | a decrease in loss on extinguishment of debt by $21.8 million as a result of prepayment expense of $25 million paid in 2012 related to the early termination of repurchase agreements of $350 million; |
| | — | | lower other operating expenses by $8.9 million mainly due to lower operational losses. |
Total operating expenses for the year 2012 increased by $61.2 million, or 5%, when compared with 2011. Mainly due to the following variances:
| | — | | an increase in personnel costs of $12.3 million, principally reflected in higher incentives, commissions and other bonuses by $10.3 million mainly due to higher annual incentives programs, branch sales incentives, retail commissions and other performance incentives; and higher pension, postretirement and medical insurance expenses by $4.8 million due to higher claims activity and revised premiums during 2012; |
| | — | | an increase in professional fees of $16.7 million driven primarily by higher collection, appraisals and other credit related fees by $12.4 million, mainly in the BPPR reportable segment; |
| | — | | an increase in business promotion expenses of $6.5 million mainly driven by higher costs from the credit card rewards programs, higher expenses related to institutional advertising campaigns, and the expenses related to mobile banking applications; |
| | — | | higher loss on extinguishment of debt by $16.5 million as a result of the prepayment expense of $25 million recorded during the second quarter of 2012 which was related to the early termination of repurchase agreements of $350 million with original contractual maturities between March 2014 and May of 2014, partially offset by $8 million in prepayment penalties recorded during the first quarter of 2011 on the repayment of $100 million in medium-term notes; and |
| | — | | an increase in the category of other operating expenses of $17.2 million mainly due to higher tax, insurance advances, properties maintenance and repair expenses, and other costs associated with the collection efforts of the Westernbank covered loan portfolio by $10.5 million, which are covered under the loss-sharing agreement, |
The above variances were partially offset by:
| | — | | a decrease in the FDIC insurance expense by $8 million mainly driven by revision in the deposit insurance premium calculation and efficiencies achieved from the internal reorganization in which Popular Mortgage was merged into BPPR during the fourth quarter of 2012. |
INCOME TAXES
34
Income tax benefit amounted to $251.3 million for the year ended December 31, 2013, compared with an income tax benefit of $ 26.4 million for the previous year. The increase in income tax benefit was primarily due to the recognition during the year 2013 of a tax benefit of $197.5 million and a corresponding increase in the net deferred tax assets of the Puerto Rico operations as a result of the increase in the statutory corporate income tax rate from 30% to 39%. On June 30, 2013 the Governor of Puerto Rico signed Act Number 40 which includes several amendments to the Puerto Rico Internal Revenue Code. Among the most significant changes applicable to corporations was the increase in the statutory corporate income tax rate from 30% to 39% effective for taxable years beginning after December 31, 2012. In addition, the Corporation recorded an income tax benefit of $146.4 million in connection with the loss generated on the Puerto Rico operations by the sales of non-performing assets that took place during the year 2013 and a tax expense of $23.7 million related to the gain realized on the sale of a portion of EVERTEC’s shares which was taxable at a preferential tax rate according to Act Number 73 of May 28, 2008, known as “Economic Incentives Act for the Development of Puerto Rico”.
During 2012, an income tax benefit of $72.9 million was recorded related to the reduction of the deferred tax liability on the estimated gains for tax purposes related to the loans acquired from Westernbank (the “Acquired Loans”) as a result of a Closing Agreement signed by the Corporation and P.R. Department of the Treasury. Under this agreement, both parties agreed that the Acquired Loans are a capital asset and any gain resulting from such loans will be taxed at the capital gain rate of 15% instead of the ordinary income tax rate at that time of 30%, thus reducing the deferred tax liability on the estimated gain and recognizing an income tax benefit for accounting purposes.
Income tax benefit for the year ended December 31, 2012 was $26.4 million, compared with an income tax expense of $114.9 million for 2011. The decrease in income tax expense was due to lower income recognized by the P.R. operations during the year ended December 31, 2012 compared to year ended December 31, 2011. Furthermore, on January 1, 2011, the Governor of Puerto Rico signed Act Number 1 (Internal Revenue Code for a New Puerto Rico) which, among the most significant changes applicable to corporations, was the reduction in the marginal tax rate from 39% to 30%. Consequently, as a result of this reduction in rate, the Corporation recognized during 2011 income tax expense of $103.3 million and a corresponding reduction in the net deferred assets of the Puerto Rico operations partly offset by the tax benefit of $53.6 million recorded as a result of the Closing Agreement signed by the Corporation and the P.R. Treasury in June 2011.
The Corporation’s net deferred tax assets at December 31, 2013 amounted to $760 million (net of the valuation allowance of $1.3 billion) compared to $531 million at December 31, 2012. Note 40 to the consolidated financial statements provide the composition of the net deferred tax assets as of such dates. All of the net deferred tax assets at December 31, 2013 pertain to the Puerto Rico operations. Of the amount related to the U.S. operations, without considering the valuation allowance, $1.2 billion is attributable to net operating losses of such operations.
The components of income tax (benefit) expense for the years ended December 31, 2013, 2012 and 2011 are included in the following table:
Table 10 – Components of Income Tax (Benefit) Expense
35
| | | | | | | | | | | | | | | | | | | | | | | | |
| | | | |
| (In thousands) | | Amount | | | % of pre-tax income | | | Amount | | | % of pre-tax
income | | | Amount | | | % of pre-tax income | |
| |
Computed income tax at statutory rates | | $ | 135,720 | | | | 39 | % | | $ | 65,662 | | | | 30 | % | | $ | 79,876 | | | | 30 % | |
Benefit of net tax exempt interest income | | | (36,993 | ) | | | (11 | ) | | | (25,540 | ) | | | (12 | ) | | | (31,379 | ) | | | (12) | |
Effect of income subject to preferential tax rate [1] | | | (137,793 | ) | | | (40 | ) | | | (78,132 | ) | | | (36 | ) | | | (1,852 | ) | | | (1) | |
Deferred tax asset valuation allowance | | | (32,990 | ) | | | (9 | ) | | | 166 | | | | - | | | | 7,192 | | | | 3 | |
Non-deductible expenses | | | 32,115 | | | | 9 | | | | 23,093 | | | | 11 | | | | 21,756 | | | | 8 | |
Difference in tax rates due to multiple jurisdictions | | | (12,029 | ) | | | (3 | ) | | | (6,034 | ) | | | (3 | ) | | | (8,555 | ) | | | (3) | |
Initial adjustment in deferred tax due to change in tax rate | | | (197,467 | ) | | | (57 | ) | | | - | | | | - | | | | 103,287 | | | | 39 | |
Recognition of tax benefits from previous years [2] | | | - | | | | - | | | | - | | | | - | | | | (53,615 | ) | | | (20) | |
Unrecognized tax benefits | | | (7,727 | ) | | | (2 | ) | | | (8,985 | ) | | | (4 | ) | | | (5,160 | ) | | | (2) | |
Others | | | 5,837 | | | | 2 | | | | 3,367 | | | | 2 | | | | 3,377 | | | | 1 | |
| |
Income tax (benefit) expense | | $ | (251,327 | ) | | | (72 | )% | | $ | (26,403 | ) | | | (12 | )% | | $ | 114,927 | | | | 43 % | |
| |
[1] Includes the impact of the Closing Agreement with the P.R. Treasury signed in June 2012, the tax expense related to a gain on the sale of EVERTEC shares and income from investments in subsidiaries subject to preferential tax rates.
[2] Represents the impact of the Ruling and Closing Agreement with the P.R. Treasury signed in June 2011.
The Corporation recorded a valuation allowance in the year 2008 since in consideration of the requirement of ASC 740 management considered that it is more likely than not that all of the U.S. operation deferred tax asset will not be realized. Refer to the Critical Accounting Policies / Estimates section of this MD&A for information on the requirements of ASC 740. For purposes of assessing the realization of the deferred tax assets in the U.S. mainland management evaluates and weights all available positive and negative evidence. The Corporation’s U.S. mainland operations are no longer in a cumulative loss position for the three-year period ended December 31, 2013 taking into account taxable income exclusive of reversing temporary differences. This represents positive evidence within management’s evaluation. The assessment as of December 31, 2013 considers the book income for 2013 and excludes the loss recorded during the fourth quarter of 2010, which previously drove the cumulative loss position. The book income for 2013 was significantly impacted by a reversal of the loan loss provision due to the improved credit quality of the loan portfolios. However, the U.S. mainland operations did not report taxable income for any of the three years evaluated. Future realization of the deferred tax assets ultimately depends on the existence of sufficient taxable income of the appropriate character within the carryforward period available under the tax law. The lack of taxable income together with the uncertainties regarding future performance represents strong negative evidence within management’s evaluation. After weighting of all positive and negative evidence management concluded, as of the reporting date, that it is more likely than not that the Corporation will not be able to realize any portion of the deferred tax assets, considering the criteria of ASC 740.
The Corporation’s Puerto Rico Banking operation sustained profitability during years 2012 and 2013, exclusive of the loss generated on the sales of non performing assets that took place in 2013 which is not a continuing condition of the operations, is a strong piece of objectively verifiable positive evidence that out weights any negative evidence considered by management in the evaluation of the realization of the deferred tax asset. Based on this evidence, the Corporation has concluded that it is more likely than not that such net deferred tax asset of the Puerto Rico operations will be realized.
Management will reassess the realization of the deferred tax assets based on the criteria of ASC Topic 740 each reporting period. To the extent that the financial results of the U.S. operations improve and the deferred tax asset becomes realizable, the Corporation will be able to reduce the valuation allowance through earnings.
Refer to Note 40 to the consolidated financial statements for additional information on income taxes.
Fourth Quarter Results
36
The Corporation recognized net income of $163.0 million for the quarter ended December 31, 2013, compared with $83.9 million for the same quarter of 2012. The variance in the quarterly results was mainly driven by an after-tax gain of $88.4 million from the sale of EVERTEC shares in connection with its public offerings, net of the impact of $11.0 million from EVERTEC’s reduction in capital due to repurchase of shares.
Net interest income for the fourth quarter of 2013 amounted to $376.3 million, compared with $351.4 million for the fourth quarter of 2012. The increase in net interest income was primarily due to an increase of 342 basis points in the yield on covered loans from 8.01% to 11.43%, accompanied by higher interest income from residential mortgage loans of $6.1 million due to an increase in volume and lower costs of funds.
The provision for loan losses amounted to $56.6 million for the quarter ended December 31, 2013, compared to $82.8 million for the fourth quarter of 2012, a decline of $26.2 million, consisting a decrease of $23.1 million in BPNA and an a decrease of $3.1 million in BPPR. The provision for the non-covered covered portfolio declined by $38.5 million, due to improvements in credit quality, lower underlying loss trends and the impact of a $8.9 million recovery from the sale of a portfolio of previously charged-off credit cards and personal loans during 2013. The increase in the provision for the covered loan portfolio of $12.4 million was driven by higher net-charge offs.
Non-interest income amounted to $191.2 million for the quarter ended December 31, 2013, compared with $150.5 million for the same quarter in 2012. The increase in non-interest income was mainly driven by a $92.4 million gain on the previously mentioned sale of EVERTEC shares in connection with its public offering. The fourth quarter of 2012 included $31.6 million of income related to the Corporation’s proportionate share of a benefit from a tax grant received by EVERTEC from the Puerto Rico Government that did not recur in 2013. In addition, there was a decrease of $10.0 million in mortgage banking activities resulting from higher gains on securitization transactions at BPPR during the fourth quarter of 2012.
Operating expenses totaled $322.7 million for the quarter ended December 31, 2013, compared with $315.2 million for the same quarter in the previous year. There were higher OREO expenses by $9.5 million driven mainly by higher net losses on sale of commercial and construction OREO’s. This unfavorable variance was partially offset by a decrease in other operating expenses of $4.8 million reflected at both the Puerto Rico and U.S. operations.
Income tax expense amounted to $25.2 million for the quarter ended December 31, 2013, compared with $19.9 million for the same quarter of 2012. The variance was primarily due to higher income recognized by the Corporation during the fourth quarter of 2013 compared with the same period of 2012.
REPORTABLE SEGMENT RESULTS
The Corporation’s reportable segments for managerial reporting purposes consist of Banco Popular de Puerto Rico and Banco Popular North America. A Corporate group has been defined to support the reportable segments. For managerial reporting purposes, the costs incurred by the Corporate group are not allocated to the reportable segments.
For a description of the Corporation’s reportable segments, including additional financial information and the underlying management accounting process, refer to Note 42 to the consolidated financial statements.
The Corporate group reported a net income of $309.1 million for the year ended December 31, 2013, compared with net loss of $91.9 million for the year ended December 31, 2012. The favorable variances at the Corporate group were due to the effect of the $412.8 million after tax gain recognized during 2013 as a result of EVERTEC’s public offerings and connected transactions. For details on these transactions refer to Note 31 “Related party transactions with affiliated company/joint venture” to the consolidated financial statements.
Highlights on the earnings results for the reportable segments are discussed below:
Banco Popular de Puerto Rico
The Banco Popular de Puerto Rico reportable segment’s net income amounted to $173.6 million for the year ended December 31, 2013, compared with $290.8 million for the year ended December 31, 2012. The principal factors that contributed to the variance in the financial results included the following:
37
| | — | | higher net interest income by $61.3 million, or 5% mainly impacted by lower interest expense from deposits by $28.3 million, or lower interest cost by 16 basis points, mainly from individual certificates of deposits, IRA’s and brokered CD’s related to renewal of maturities at lower prevailing rates and to lower volume of deposits. Also, the cost of borrowings decreased by $17.7 million mostly due to the cancellation of $350 million of repurchase agreements in June 2012 that carried a cost of 4.36% and replacing them with lower cost borrowings. In addition, contributing to the positive impact in net interest income was an increase of $26 million in interest from mortgage loans mostly from acquisitions during the first quarter of 2013, partially offset by the reversal, during the third quarter, of $5.9 million in interest from reverse mortgages which had been accrued in excess of the amount insured by FHA. Also an increase of $7.8 million in interest income from consumer loans mostly resulting from an acquisition of $225 million made during the second quarter of 2012 and an increase in the auto loan business, partially offset by lower interest income from credit cards. These positive impacts were partially offset by a reduction of $19.4 million in interest income from investment securities due to the reinvestment of cash flows received from mortgage backed securities in lower yielding collateralized mortgage obligations as well as the acquisitions of lower yielding agency securities. Although yield in covered portfolio increased by 188 basis points, this was offset by lower balances, resulting in interest income of $300.7 million, relatively flat to 2012. The BPPR reportable segment had a net interest margin of 5.32% for the year ended December 31, 2013, compared with 5.06% for 2012; |
| | — | | higher provision for loan losses by $260.4 million, or 73%, mostly due to the increase in the provision for loan losses on the non-covered loan portfolio of $265.8 million, mainly related to the incremental provision of $148.8 million and $169.2 million recognized in the first and second quarters of 2013, respectively, related to the non-performing loans bulk sales. Excluding the impact of the sales, the provision for loan losses declined by $52.2 million or 19% to $229.4 million, due to positive trends in credit quality offset by the enhancements to the allowance for loan losses framework; |
| | — | | lower non-interest income by $119.5 million, or 30% mainly due to: |
| | — | | unfavorable variances of $49.6 million and $17.4 million in net gains on sale of loans and adjustments to indemnity reserves, respectively, both driven by the negative adjustments recognized in 2013 in connection with the bulk sales of non-performing loans; |
| | — | | higher FDIC loss share expense by $25.8 million (refer to Table 2 for components of such variance); |
| | — | | lower other operating income by $20.0 million resulting from lower net earnings from the equity investments in PRLP 2011 Holdings, LLC by $4.0 million, and gains of $4.7 million and $2.5 million recognized during 2012 from the sale of a bank premise property and the wholesale indirect property and casualty business of Popular Insurance, respectively; |
| | — | | higher trading account losses by $18.0 million mostly related to higher losses on Puerto Rico government obligations and close-end funds and net realized losses on mortgage backed securities sold as compared to net gains reported for the same period in 2012; |
| | — | | a decrease of $13.0 million in mortgage banking activities mainly due to lower gain on sale of loans by $49.4 million, mainly for securitization transactions, partially offset by the related closed derivative positions of $32.6 million. Refer to Table 8 for details of Mortgage banking activities. |
The negative impact in non-interest income detailed above were partially offset by lower unfavorable valuation adjustments on loans held-for-sale by $30.7 million, principally related to $27.3 million in valuation adjustments recorded during the second quarter of 2012 on commercial and construction loans held-for-sale as a result of updated appraisals and market indicators;
| | — | | higher operating expenses by $15.3 million, or 2%, mainly due to: |
| | — | | an increase of $ 50.9 million in OREO expenses primarily related to the loss of $37.0 million on the bulk sale of commercial and single family real estate owned assets during the first quarter of 2013 and to fair value adjustments on commercial properties, mainly covered assets which are subject to 80% reimbursement from the FDIC; |
| | — | | an increase of $10.2 million in other operating taxes principally related to the gross receipts tax imposed on corporations in Puerto Rico during 2013; |
| | — | | higher professional fees by $9.5 million mostly due to higher legal, transaction processing and consulting fees; |
38
The unfavorable variances in operating expenses were partially offset by lower FDIC deposit insurance assessment by $25.5 million resulting from revisions in the deposit-insurance premium calculation, lower levels of high risk assets, and savings achieved from the internal reorganization of Popular Mortgage into BPPR during the fourth quarter of 2012; $25.2 million prepayment expense recorded during the second quarter of 2012 related to the cancellation of repurchase agreements; and $5.0 million in personnel costs mainly due to lower net periodic pension costs, medical insurance costs and postretirement health benefits;
| | — | | higher income tax benefit by $216.7 million, mainly due to $197.5 million benefit recognized during the second quarter of 2013 for the increase on the net deferred tax asset due to the change in the corporate tax rate in P.R. from 30% to 39% as compared with a tax benefit of $72.9 million recognized in 2012 resulting from the Closing Agreement with the P.R. Treasury related to the tax treatment of the loans acquired in the Westernbank FDIC-assisted transaction. The increase in income tax benefit was also driven by the loss on the bulk sales of non-performing assets during 2013. |
The main factors that contributed to the variance in the financial results for the year ended December 31, 2012, when compared with 2011, included the following:
| | — | | lower net interest income by $41.5 million, or 3%, mostly due to a reduction in interest income from the covered loan portfolio by $111.2 million resulting from $37.1 million discount accretion recognized during the year ended December 31, 2011 on revolving lines of credit accounted for pursuant to ASC Subtopic 310-20, and from a lower average balance of covered loans by $563 million. Also, a reduction of approximately $794 million in the average volume of money market, investment and trading securities resulted in a lower interest income of $48.3 million. The unfavorable impact resulting from these reductions was partially offset by a $63.6 million reduction in deposit costs or 35 basis points and $44.4 million in the cost of borrowings mostly associated with the prepayment during 2011 of the note issued to the FDIC. The net interest margin was 5.06% for the year ended December 31, 2012, compared to 5.02% for 2011; |
| | — | | lower provision for loan losses by $130.7 million, or 27%, due to the decrease in the provision for loan losses on the covered loan portfolio of $70.8 million, or 49% and $59.9 million, or 18% in the provision for loan losses on the non-covered loan portfolio. The provision for loan losses for the non-covered portfolio reflected lower net charge-offs by $40.9 million and reductions in the allowance for loan losses, mainly driven by the commercial and consumer portfolios, as a result of continued improvement in credit trends. These reductions were more than offset by higher allowance levels for the mortgage loan portfolio prompted by higher loss trends and higher specific reserves for loans restructured under the Corporation’s loss mitigation program. The decrease in the provision for loan losses on covered loans was mainly driven by a lower provision on loans accounted for under ASC Subtopic 310-30 as certain pools, principally commercial and construction loan pools, reflected higher increases in expected loss estimates for 2011 when compared with the revisions in expected loss estimates for 2012; |
| | — | | lower non-interest income by $87.0 million, or 18%, mainly due to: |
| | — | | FDIC loss share expense of $56.2 million recognized for the year ended December 31, 2012, compared with FDIC loss share income of $66.8 million for 2011. Refer to Table 2 for components of this variance. |
| | — | | unfavorable variance of $43.6 million in trading account (loss) profit resulting from lower unrealized gains on outstanding mortgage-backed securities due to lower market prices on a lower volume of outstanding pools; |
| | — | | a decrease of $40.0 million in net gain on sale of loans, including valuation adjustments on loans held-for-sale, principally related to the gain of $17.4 million on the sale of construction and commercial real estate loans to a joint venture during the third quarter of 2011 and $27.3 million in valuation adjustments recorded during the second quarter of 2012 on commercial and construction loans held-for-sale as a result of updated appraisals and market indicators; |
| | — | | $8.5 million gain on the sale of $234 million in FHLB notes during the third quarter of 2011; |
The negative impacts in non-interest income detailed above were partially offset by:
| | — | | higher income from mortgage banking activities by $92.3 million mainly due to higher gains on securitization transactions, lower realized losses on derivatives and lower unfavorable fair value adjustments on mortgage servicing rights. Refer to Table 8 for details of Mortgage banking activities. |
39
| | — | | lower provision for indemnity reserves on loans sold by $18.6 million and higher other operating income by $9.6 million mainly due to $7.8 million income from the equity investment in PRLP 2011 Holdings, LLC during 2012; |
| | — | | higher operating expenses by $82.9 million, or 9%, mainly due to an increase of $24.5 million in loss on early extinguishment of debt, primarily related to the cancellation of $350 million in outstanding repurchase agreements during the second quarter of 2012; an increase of $17.7 million in other operating expenses mostly due to costs associated with the collection efforts of the covered loan portfolio, of which 80% is reimbursed by the FDIC; an increase in OREO expenses of $14.9 million mainly related to higher subsequent fair value adjustments on commercial, construction and mortgage properties; and an increase of $16.0 million in professional fees mostly due to appraisal expenses and loan collection efforts, some of which are reimbursable by the FDIC. Also there were unfavorable variances of $7.2 million in personnel costs due to higher incentive and other compensation, net periodic pension costs, medical insurance costs, post retirement health benefits, among other factors; and $5.8 million in business promotion expense mostly from credit card reward programs and other retail product promotional campaigns; and |
| | — | | lower income tax expense by $140.1 million, mainly due to $103.3 million in income tax expense recognized during the first quarter of 2011 with a corresponding reduction in the Puerto Rico Corporation’s net deferred tax asset as a result of the reduction in the marginal corporate income tax rate due to the Puerto Rico tax reform. The favorable variance was also attributable to a tax benefit of $72.9 million recognized in 2012 resulting from a Closing Agreement with the P.R. Treasury Department related to the tax treatment of the loans acquired in the Westernbank FDIC-assisted transaction, compared with a tax benefit of $53.6 million recognized in 2011 resulting from a Closing Agreement with the P.R. Treasury Department for the recognition of certain tax benefits not previously recorded during years 2009 (the benefit of reduced tax rates for capital gains) and 2010 (the benefit of the exempt income). The decrease in income tax expense was also due to lower income in the Corporation’s Puerto Rico operations compared to 2011. |
Banco Popular North America
For the year ended December 31, 2013, the reportable segment of Banco Popular North America reported net income of $116.6 million, compared with $46.0 million for the year ended December 31, 2012. The principal factors that contributed to the variance in the financial results included the following:
| | — | | lower net interest income by $1.4 million, or 0.5%. Although the variance is not significant several factors contributed to the decrease: $18.9 million decrease in the interest income from earning assets, mainly due to lower volumes and yields in the commercial and construction portfolios. This negative variance was partially offset by an increase in interest income from the mortgage portfolio, mostly through acquisitions of high quality loans. Also lower interest income from investment securities by $4.3 million due to reinvestment of cash flows from prepayments and maturities in lower yielding investments due to the prevailing interest rate scenarios. On the positive side, interest expense from deposits decreased by $18.5 million or a lower cost of 34 basis points related to the renewal of maturities from time deposits at lower prevailing rates reducing the cost of time deposits by 56 basis points and to lower volume of deposits. The BPNA reportable segment’s net interest margin was 3.53% for 2013, compared with 3.60% for 2012; |
| | — | | lower provision for loan losses by $66.8 million, or 128%, principally as a result of a reserve release reflecting improvements in credit quality and economic trends, and the effect of the enhancements to the allowance for loan losses methodology completed during the second quarter of 2013. Refer to the Credit Risk Management and Loan Quality section of this MD&A for certain quality indicators and further explanations corresponding to the BPNA reportable segment; |
| | — | | lower non-interest income by $1.1 million, or 2%, mostly due to a decrease in service charges on deposits by $4.5 million related to lower non-sufficient funds and checking fees; partially offset by higher gains on sale of loans by $2.0 million mainly related to commercial and construction loans; lower adjustments to indemnity reserves by $1.6 million; and an increase in gains on sale of securities by $1.3 million mainly due to the loss on the sale of non-agency collateralized mortgage obligations during the fourth quarter of 2012; |
| | — | | lower operating expenses by $5.3 million, or 2%, mainly due to a decrease in other operating expenses by $7.5 million and $6.8 million in professional fees, both mainly related to legal settlements recognized during 2012. These favorable variances were partially offset by an increase in OREO expenses of $5.8 million mainly related to lower net gains on the |
40
| | sale of commercial real estate properties; higher net occupancy expenses by $2.1 million due to an adjustment to the outstanding deferred rent liability; and higher personnel costs by $1.2 million mainly due to higher savings plan expense and medical insurance costs. |
The main factors that contributed to the variance in the financial results for the year ended December 31, 2012, when compared with 2011, included the following:
| | — | | lower net interest income by $13.9 million, or 5%, which was primarily the effect of lower average volume by $527 million in the loan portfolio, partially offset by higher volume of investment securities and lower deposit balances. The BPNA reportable segment’s net interest margin was 3.60% for 2012, compared with 3.64% for 2011; |
| | — | | lower provision for loan losses by $36.4 million, or 41%, principally as a result of lower net charge-offs by $90.6 million mainly from the legacy, commercial and consumer loan portfolios due to improved credit performance. These favorable variances were partly offset by a lower allowance for loan losses release for 2011. In addition, the first quarter of 2011 included a $13.8 million benefit due to improved pricing from the sale of the non-conventional mortgage loan portfolio. Refer to the Credit Risk Management and Loan Quality section of this MD&A for certain quality indicators and further explanations corresponding to the BPNA reportable segment; |
| | — | | lower non-interest income by $18.0 million, or 24%, mostly due to higher adjustments to indemnity reserves by $6.8 million; lower gains on sale of securities by $4.1 million mainly due to the $2.8 million gain on the sale of a limited partnership interest in real estate limited partnerships owning property qualifying for low-income housing tax credits during the fourth quarter of 2011; lower other service fees by $3.9 million, mostly related to debit card fees due to the effect of the Durbin Amendment of the Dodd-Frank Act; lower service charges on deposits by $2.5 million; and lower income from mortgage banking activities due to lower gains on sales of mortgage loans by $3.7 million; and |
| | — | | lower operating expenses by $11.6 million, or 5%, mainly due to a decrease in OREO expenses of $13.2 million related to higher gains on the sale of commercial real estate properties and lower FDIC insurance assessment by $5.1 million. These favorable variances were partially offset by increases of $4.3 million in personnel costs mainly due to higher headcount, benefit accruals and medical insurance costs, and $2.3 million in other operating expenses mostly due to higher operational losses. |
STATEMENT OF FINANCIAL CONDITION ANALYSIS
Assets
At December 31, 2013, the Corporation’s total assets were $35.7 billion, compared with $36.5 billion at December 31, 2012. Refer to the consolidated financial statements included in this 2013 Annual Report for the Corporation’s consolidated statements of financial condition at December 31, 2013 and December 31, 2012. Also, refer to the Statistical Summary 2009-2013 in this MD&A for condensed statements of financial condition for the past five years.
Money market, trading and investment securities
Money market investments amounted to $858 million at December 31, 2013 compared with $1.1 billion at the same date in 2012. The decrease from the end of 2012 to 2013 was mainly due to a decrease of $161 million in time deposits with the Federal Reserve Bank of New York.
Trading account securities amounted to $340 million at December 31, 2013, compared with $315 million at December 31, 2012. The increase in trading account securities was at BPPR segment mainly due to an increase in mortgage backed securities resulting from loans originations during 2013, partially offset by securities sold, principal payments and market valuation. Refer to the Market / Interest Rate Risk section of this MD&A included in the Risk Management section for a table that provides a breakdown of the trading portfolio by security type.
Investment securities available-for-sale and held-to-maturity amounted to $5.4 billion at December 31, 2013, compared with $5.2 billion at December 31, 2012. Table 11 provides a breakdown of the Corporation’s portfolio of investment securities available-for-sale (“AFS”) and held-to-maturity (“HTM”) on a combined basis at December 31, 2013 and 2012. Notes 7 and 8 to the consolidated financial statements provide additional information with respect to the Corporation’s investment securities AFS and HTM.
41
The increase in investment securities available-for-sale is mainly reflected in the categories of Obligations of US Government sponsored entities and Collateralized mortgage obligations mostly due to purchases at BPPR and BPNA during 2013, partially offset by portfolio declines in market value in line with underlying market conditions, maturities, mortgage backed securities prepayments and the prepayment of $22.8 million of EVERTEC’s debentures owned by the Corporation as part of their IPO. At December 31, 2013, the investment securities available-for-sale portfolio was in an unrealized net loss position of $51.1 million, compared with net unrealized gains of $172.5 million at December 31, 2012. As of December 31, 2013, the available-for-sale investment portfolio reflects gross unrealized losses of $130 million, driven by US Agency Collateralized Mortgage obligations, obligations from the U.S. Government sponsored entities, and Obligations of the Puerto Rico Government and its political subdivisions. As part of its other than temporary impairment (“OTTI”) analysis for all U.S. Agency securities, management considers the US Agency guarantee. The portfolio of Obligations of the Puerto Rico Government is comprised of securities with specific sources of income or revenues identified for repayments. The Corporation performs periodic credit quality review on these issuers.
Table 11 - AFS and HTM Securities
| | | | | | | | |
| (In millions) | | 2013 | | | 2012 | |
| |
U.S. Treasury securities | | $ | 28.5 | | | $ | 37.2 | |
Obligations of U.S. government sponsored entities | | | 1,629.2 | | | | 1,096.3 | |
Obligations of Puerto Rico, States and political subdivisions | | | 180.3 | | | | 171.2 | |
Collateralized mortgage obligations | | | 2,418.9 | | | | 2,369.7 | |
Mortgage-backed securities | | | 1,135.6 | | | | 1,483.1 | |
Equity securities | | | 4.1 | | | | 7.4 | |
Other | | | 38.7 | | | | 62.1 | |
| |
Total AFS and HTM investment securities | | $ | 5,435.3 | | | $ | 5,227.0 | |
| |
Loans
Refer to Table 12 for a breakdown of the Corporation’s loan portfolio, the principal category of earning assets. Loans covered under the FDIC loss sharing agreements are presented in a separate line item in Table 12. The risks on covered loans are significantly different as a result of the loss protection provided by the FDIC.
42
Table 12 - Loans Ending Balances
| | | | | | | | | | | | | | | | | | | | |
| | | At December 31, | |
| |
(in thousands) | | 2013 | | | 2012 | | | 2011 | | | 2010 | | | 2009 | |
| |
Loans not covered under FDIC loss sharing agreements: | | | | | | | | | | | | | | | | | | | | |
Commercial | | $ | 10,037,184 | | | $ | 9,858,202 | | | $ | 9,973,327 | | | $ | 10,570,502 | | | $ | 11,448,204 | |
Construction | | | 206,084 | | | | 252,857 | | | | 239,939 | | | | 340,556 | | | | 1,349,942 | |
Legacy[1] | | | 211,135 | | | | 384,217 | | | | 648,409 | | | | 1,013,484 | | | | 1,647,117 | |
Lease financing | | | 543,761 | | | | 540,523 | | | | 548,706 | | | | 572,787 | | | | 618,797 | |
Mortgage | | | 6,681,476 | | | | 6,078,507 | | | | 5,518,460 | | | | 4,524,722 | | | | 4,603,246 | |
Consumer | | | 3,932,226 | | | | 3,868,886 | | | | 3,673,755 | | | | 3,705,984 | | | | 4,045,807 | |
| |
Total non-covered loans held-in-portfolio | | | 21,611,866 | | | | 20,983,192 | | | | 20,602,596 | | | | 20,728,035 | | | | 23,713,113 | |
| |
Loans covered under FDIC loss sharing agreements: | | | | | | | | | | | | | | | | | | | | |
Commercial | | | 1,812,804 | | | | 2,244,647 | | | | 2,512,742 | | | | 2,767,181 | | | | - | |
Construction | | | 190,127 | | | | 361,396 | | | | 546,826 | | | | 640,492 | | | | - | |
Mortgage | | | 934,373 | | | | 1,076,730 | | | | 1,172,954 | | | | 1,259,459 | | | | - | |
Consumer | | | 47,123 | | | | 73,199 | | | | 116,181 | | | | 169,750 | | | | - | |
| |
Loans covered under FDIC loss sharing agreements | | | 2,984,427 | | | | 3,755,972 | | | | 4,348,703 | | | | 4,836,882 | | | | - | |
| |
Total loans held-in-portfolio | | | 24,596,293 | | | | 24,739,164 | | | | 24,951,299 | | | | 25,564,917 | | | | 23,713,113 | |
| |
Loans held-for-sale: | | | | | | | | | | | | | | | | | | | | |
Commercial | | | 603 | | | | 16,047 | | | | 25,730 | | | | 60,528 | | | | 972 | |
Construction | | | - | | | | 78,140 | | | | 236,045 | | | | 412,744 | | | | - | |
Legacy[1] | | | - | | | | 2,080 | | | | 468 | | | | - | | | | 1,925 | |
Mortgage | | | 109,823 | | | | 258,201 | | | | 100,850 | | | | 420,666 | | | | 87,899 | |
| |
Total loans held-for-sale | | | 110,426 | | | | 354,468 | | | | 363,093 | | | | 893,938 | | | | 90,796 | |
| |
Total loans | | $ | 24,706,719 | | | $ | 25,093,632 | | | $ | 25,314,392 | | | $ | 26,458,855 | | | $ | 23,803,909 | |
| |
[1] The legacy portfolio is comprised of commercial loans, construction loans and lease financings related to certain lending products exited by the Corporation as part of restructuring efforts carried out in prior years at the BPNA reportable segment.
In general, the changes in most loan categories generally reflect soft loan demand, loan purchases and bulk sales, the impact of loan charge-offs, portfolio runoff of the exited loan origination channels at the BPNA segment and the resolution of non-performing loans.
The explanations for loan portfolio variances discussed below exclude the impact of the covered loans.
Loans held-in-portfolio
Commercial loans held-in-portfolio increased $179 million from December 31, 2012. Most of the increase was at the BPPR segment, which increased by $169 million and a $10 million increase at the BPNA segment. The increase in the BPPR segment was due to new originations, increases in existing lines of credit and the reclassification of a large loan relationship from the construction category during the third quarter of 2013, partially offset by loan amortization and net charge-offs, in addition to the bulk loan sale completed during the first quarter of 2013. The increase in the BPNA reportable segment was principally due to new originations and purchases, offset by portfolio amortization and the impact of net charge-offs during 2013.
Construction loans held-in-portfolio decreased $47 million from December 31, 2012 to December 31, 2013, principally at BPPR segment which decreased $51 million. The decrease at BPPR segment was related to a loan with an outstanding balance of $62 million at December 31, 2012 that was reclassified to the commercial category during 2013.
43
The BPNA legacy portfolio, which is comprised of commercial loans, construction loans and lease financings related to certain lending products exited by the Corporation as part of restructuring efforts carried out in prior years at the BPNA reportable segment, declined $173 million, mostly due to the run-off status of this portfolio.
The increase in mortgage loans held-in-portfolio was reflected in both segments, BPPR and BPNA. The BPPR segment portfolio increased by $452 million when compared to December 31, 2012, while BPNA segment increased $151 million. The increase in the BPPR segment was principally associated to loan purchases, repurchases and loans originations. During 2013, the Corporation completed two bulk purchases of loans to financial institutions, acquiring $761 million in mortgage loans. Partially offsetting these increases, were net charge-offs of $56 million during 2013 and the bulk sale of loans with a carrying value of $435 million during the second quarter. The increase in BPNA segment was mainly related to portfolio purchases of approximately $411 million, partially offset by prepayments, portfolio amortization and net charge-offs.
The consumer loans held-in-portfolio increased $63 million from December 31, 2012 to December 31, 2013. The BPPR segment experienced an increase of $82 million, mainly in auto loans originations, which increased by $139 million. The BPNA segment decreased by $19 million due to the run-off status of a large portion of this portfolio.
Loans held-for-sale
The portfolio of mortgage loans held-for-sale decreased $148 million from December 31, 2012. The decrease was mainly at BPPR segment, which decreased by $148 million, mainly due to lower volume of originations for sale in the secondary market. Commercial and construction loans held-for-sale loans decreased $15 million and $78 million, respectively. During the first quarter of 2013, the Corporation completed a bulk sale of non-performing loans, which reduced the BPPR commercial and construction loans held-for-sale portfolios by $49.7 million and $9.8 million, respectively. The remaining construction and commercial balance of $14.9 million was reclassified to the held-in-portfolio category.
Covered loans
Covered loans were initially recorded at fair value. Their carrying value approximated $3.0 billion at December 31, 2013, of which approximately 61% pertained to commercial loans, 6% to construction loans, 31% to mortgage loans and 2% to consumer loans. Note 9 to the consolidated financial statements presents the carrying amount of the covered loans broken down by major loan type categories and the activity in the carrying amount of loans accounted for pursuant to ASC Subtopic 310-30. A substantial amount of the covered loans, or approximately $2.8 billion of their carrying value at December 31, 2013, was accounted for under ASC Subtopic 310-30.The reduction of $663.8 million from December 31, 2012 was principally the result of loan collections and resolutions, partially offset by the accretion on the loans, which increases their carrying value. Tables 13 and 14 provide the activity in the carrying amount and accretable yield on the covered loans accounted for under ASC Subtopic 310-30. The outstanding accretable yield has been impacted by increases in cash flow expectations on the loan pools based on quarterly revisions of the portfolio. The increase in the accretable yield is recognized as interest income using the effective yield method over the estimated life in each applicable loan pool.
FDIC loss share asset
As indicated in the Critical Accounting Policies / Estimates section of this MD&A, the Corporation recorded the FDIC loss share asset, measured separately from the covered loans, as part of the Westernbank FDIC-assisted transaction. Based on the accounting guidance in ASC Topic 805, at each reporting date subsequent to the initial recording of the indemnification asset, the Corporation measures the indemnification asset on the same basis as the covered loans and assesses its collectability.
The amount to be ultimately collected for the indemnification asset is dependent upon the performance of the underlying covered assets, the passage of time, claims submitted to the FDIC and the Corporation’s compliance with the terms of the loss sharing agreements. Refer to Note 11 to the consolidated financial statements for additional information on the FDIC loss share agreements.
44
Table 13 - Activity in the Carrying Amount of Covered Loans Accounted for Under ASC 310-30
| | | | | | | | |
| | | Year ended December 31, | |
| | | | |
| (In thousands) | | 2013 | | | 2012 | |
| |
Beginning balance | | $ | 3,491,759 | | | $ | 4,036,471 | |
Accretion | | | 279,708 | | | | 280,596 | |
Collections / charge-offs | | | (943,520 | ) | | | (825,308) | |
| |
Ending balance | | $ | 2,827,947 | | | $ | 3,491,759 | |
Allowance for loan losses (ALLL) | | | (93,915 | ) | | | (95,407) | |
| |
Ending balance, net of ALLL | | $ | 2,734,032 | | | $ | 3,396,352 | |
| |
Table 14 - Activity in the Accretable Yield on Covered Loans Accounted for Under ASC 310-30
| | | | | | | | |
| | | Year ended December 31, | |
| (In thousands) | | 2013 | | | 2012 | |
| |
Beginning balance | | $ | 1,451,669 | | | $ | 1,470,259 | |
Accretion [1] | | | (279,708 | ) | | | (280,596) | |
Change in expected cash flows | | | 137,244 | | | | 262,006 | |
| |
Ending balance | | $ | 1,309,205 | | | $ | 1,451,669 | |
| |
| [1] Positive to earnings, which is included in interest income. | |
| |
The loan discount accretion in 2013 and 2012, which is recorded in interest income, resulted principally from accelerated cash expectations and loan resolutions, for some of which the Corporation had estimated significantly higher losses. These cash flows resulted in a faster recognition of the corresponding loan pool’s accretable yield.
Although the reduction in estimated loan losses increases the accretable yield to be recognized over the life of the loans, it also has the effect of lowering the realizable value of the loss share asset since the Corporation would receive lower FDIC payments under the loss share agreements.
Table 15 sets forth the activity in the FDIC loss share asset for the years ended December 31, 2013, 2012 and 2012.
Table 15 - Activity of Loss Share Asset
| | | | | | | | | | | | |
| | | Year ended December 31, | |
| (In thousands) | | 2013 | | | 2012 | | | 2011 | |
| |
Balance at beginning of year | | $ | 1,399,098 | | | $ | 1,915,128 | | | $ | 2,410,219 | |
Amortization of loss share indemnification asset | | | (161,635 | ) | | | (129,676 | ) | | | (10,855) | |
Credit impairment losses to be covered under loss sharing agreements | | | 60,454 | | | | 58,187 | | | | 110,457 | |
Reimbursable expenses | | | 50,985 | | | | 30,771 | | | | 5,093 | |
Decrease due to reciprocal accounting on amortization of contingent liability on unfunded commitments | | | (473 | ) | | | (969 | ) | | | (33,221) | |
Net payments to (from) FDIC under loss sharing agreements | | | (396,223 | ) | | | (462,016 | ) | | | (561,111) | |
Other adjustments attributable to FDIC loss sharing agreements | | | (3,598 | ) | | | (12,327 | ) | | | (5,454) | |
| |
Balance at end of period | | $ | 948,608 | | | $ | 1,399,098 | | | $ | 1,915,128 | |
| |
Table 16 - Activity in the Remaining FDIC Loss Share Asset Discount
| | | | | | | | | | | | |
| | | Year ended December 31, | |
| (In thousands) | | 2013 | | | 2012 | | | 2011 | |
| |
Balance at beginning of period[1] | | $ | 141,800 | | | $ | 117,916 | | | $ | (139,283) | |
Amortization of negative discount[2] | | | (161,635 | ) | | | (129,676 | ) | | | (10,855) | |
Impact of lower projected losses | | | 123,526 | | | | 153,560 | | | | 268,054 | |
| |
Balance at end of period | | $ | 103,691 | | | $ | 141,800 | | | $ | 117,916 | |
| |
[1] Positive balance represents negative discount (debit to assets), while a negative balance represents a discount (credit to assets).
[2] Amortization results in a negative impact to non-interest income, while a positive balance results in a positive impact to non-interest income, particularly FDIC loss share income / expense.
45
While the Corporation was originally accreting to the future value of the loss share indemnity asset, the lowered loss estimates required the Corporation to amortize the loss share asset to its currently lower expected collectible balance, thus resulting in negative accretion. Due to the shorter life of the indemnity asset compared with the expected life of the covered loans, this negative accretion temporarily offsets the benefit of higher cash flows accounted through the accretable yield on the loans.
Other real estate owned
Other real estate owned (OREO) represents real estate property received in satisfaction of debt. At December 31, 2013, OREO amounted to $304 million from $406 million at December 31, 2012. The decrease was mainly as a result of write-downs in value and sales, including the bulk sale of non-performing assets completed during the first quarter of 2013, which reduced OREO by $108 million. Refer to Table 17 for the activity in other real estate owned. The amounts included as “covered other real estate” are subject to the FDIC loss sharing agreements.
Table 17 - Other Real Estate Owned Activity
| | | | | | | | | | | | | | | | | | | | |
| | | For the year ended December 31, 2013 | |
| (In thousands) | | Non-covered OREO
Commercial/ Construction | | | Non-covered
OREO
Mortgage | | | Covered OREO
Commercial/ Construction | | | Covered
OREO
Mortgage | | | Total | |
| |
Balance at beginning of period | | | $ 135,862 | | | | $ 130,982 | | | | $ 99,398 | | | | $ 39,660 | | | | $ 405,902 | |
Write-downs in value | | | (11,377) | | | | (9,525) | | | | (18,857) | | | | (4,102) | | | | (43,861) | |
Additions | | | 32,175 | | | | 82,985 | | | | 87,800 | | | | 30,037 | | | | 232,997 | |
Sales | | | (108,254) | | | | (118,596) | | | | (48,447) | | | | (17,720) | | | | (293,017) | |
Other adjustments | | | 243 | | | | 1,006 | | | | 321 | | | | (83) | | | | 1,487 | |
| |
Ending balance | | | $ 48,649 | | | | $ 86,852 | | | | $ 120,215 | | | | $ 47,792 | | | | $ 303,508 | |
| |
| |
| | | For the year ended December 31, 2012 | |
| (In thousands) | | Non-covered OREO
Commercial/ Construction | | | Non-covered
OREO
Mortgage | | | Covered OREO
Commercial/ Construction | | | Covered
OREO
Mortgage | | | Total | |
| |
Balance at beginning of period | | | $ 90,230 | | | | $ 82,267 | | | | $ 77,776 | | | | $ 31,359 | | | | $ 281,632 | |
Write-downs in value | | | (13,727) | | | | (10,823) | | | | (7,466) | | | | (767) | | | | (32,783) | |
Additions | | | 110,947 | | | | 108,312 | | | | 60,920 | | | | 23,195 | | | | 303,374 | |
Sales | | | (51,422) | | | | (46,091) | | | | (32,022) | | | | (13,122) | | | | (142,657) | |
Other adjustments | | | (166) | | | | (2,683) | | | | 190 | | | | (1,005) | | | | (3,664) | |
| |
Ending balance | | | $ 135,862 | | | | $ 130,982 | | | | $ 99,398 | | | | $ 39,660 | | | | $ 405,902 | |
| |
| |
| | | For the year ended December 31, 2011 | |
| (In thousands) | | Non-covered OREO
Commercial/ Construction | | | Non-covered
OREO
Mortgage | | | Covered OREO
Commercial/ Construction | | | Covered
OREO
Mortgage | | | Total | |
| |
Balance at beginning of period | | | $ 87,283 | | | | $ 74,213 | | | | $ 41,153 | | | | $ 16,412 | | | | $ 219,061 | |
Write-downs in value | | | (15,576) | | | | (3,032) | | | | (4,095) | | | | (220) | | | | (22,923) | |
Additions | | | 78,064 | | | | 77,543 | | | | 54,898 | | | | 23,421 | | | | 233,926 | |
Sales | | | (59,537) | | | | (65,115) | | | | (13,829) | | | | (8,184) | | | | (146,665) | |
Other adjustments | | | (4) | | | | (1,342) | | | | (351) | | | | (70) | | | | (1,767) | |
| |
Ending balance | | | $ 90,230 | | | | $ 82,267 | | | | $ 77,776 | | | | $ 31,359 | | | | $ 281,632 | |
| |
Other assets
Table 18 provides a breakdown of the principal categories that comprise the caption of “Other assets” in the consolidated statements of financial condition at December 31, 2013 and 2012.
46
Table 18 - Other Assets
| | | | | | | | | | | | |
| (In thousands) | | 2013 | | | 2012 | | | Change | |
| |
| | | |
Net deferred tax assets (net of valuation allowance) | | $ | 761,768 | | | $ | 541,499 | | | $ | 220,269 | |
| | | |
Investments under the equity method | | | 197,006 | | | | 246,776 | | | | (49,770) | |
| | | |
Bank-owned life insurance program | | | 228,805 | | | | 233,475 | | | | (4,670) | |
| | | |
Prepaid FDIC insurance assessment | | | 383 | | | | 27,533 | | | | (27,150) | |
| | | |
Prepaid taxes | | | 91,504 | | | | 88,360 | | | | 3,144 | |
| | | |
Other prepaid expenses | | | 67,108 | | | | 60,626 | | | | 6,482 | |
| | | |
Derivative assets | | | 34,710 | | | | 41,925 | | | | (7,215) | |
| | | |
Trades receivables from brokers and counterparties | | | 71,680 | | | | 137,542 | | | | (65,862) | |
| | | |
Others | | | 234,594 | | | | 191,842 | | | | 42,752 | |
| |
| | | |
Total other assets | | $ | 1,687,558 | | | $ | 1,569,578 | | | $ | 117,980 | |
| |
The increase in other assets from December 31, 2012 to December 31, 2013 was principally due to higher deferred tax assets mainly due to the impact of the increase in the corporate tax rate during the third quarter of 2013, from 30% to 39% in Puerto Rico, the deferred tax asset that resulted from the loss on the bulk sale of non-performing assets completed during 2013, partially offset by a decrease in the deferred tax asset related to the reduction in the pension plan and post retirement liability. Also, the “other” caption increased by $43 million mostly due to claims receivable mainly related to insured mortgage delinquent loans. Partially offsetting these increases, were lower securities sold not yet delivered by $66 million reflected as trades receivables from brokers and counterparties, a decrease in investments accounted for under the equity method mainly due to a decrease in the investment in EVERTEC as a result of the sale of shares completed during 2013, partially offset by the 24.9% equity investment in PR Asset Portfolio 2013-1 International, LLC created in March 2013 as part of the NPAs bulk sale transaction and lower FDIC prepaid asset. Refer to Notes 16 and 31 for additional information on the Corporation’s investments under the equity method.
Deposits and Borrowings
The composition of the Corporation’s financing to total assets at December 31, 2013 and December 31, 2012 is included in Table 19.
Table 19 - Financing to Total Assets
| | | | | | | | | | | | | | | | | | | | |
| | | December 31, | | | December 31, | | | % increase (decrease) | | | % of total assets | |
| | | | | |
| (In millions) | | 2013 | | | 2012 | | | from 2012 to 2013 | | | 2013 | | | 2012 | |
| |
| | | | | |
Non-interest bearing deposits | | $ | 5,923 | | | $ | 5,795 | | | | 2.2 | % | | | 16.6 | % | | | 15.9 % | |
| | | | | |
Interest-bearing core deposits | | | 16,026 | | | | 15,993 | | | | 0.2 | | | | 44.8 | | | | 43.8 | |
| | | | | |
Other interest-bearing deposits | | | 4,762 | | | | 5,213 | | | | (8.7) | | | | 13.3 | | | | 14.3 | |
| | | | | |
Repurchase agreements | | | 1,659 | | | | 2,017 | | | | (17.8) | | | | 4.6 | | | | 5.5 | |
| | | | | |
Other short-term borrowings | | | 401 | | | | 636 | | | | (37.0) | | | | 1.1 | | | | 1.7 | |
| | | | | |
Notes payable | | | 1,585 | | | | 1,778 | | | | (10.9) | | | | 4.4 | | | | 4.9 | |
| | | | | |
Other liabilities | | | 767 | | | | 966 | | | | (20.6) | | | | 2.2 | | | | 2.6 | |
| | | | | |
Stockholders’ equity | | | 4,626 | | | | 4,110 | | | | 12.6 | | | | 13.0 | | | | 11.3 | |
| |
47
Deposits
Table 20 - Deposits Ending Balances
| | | | | | | | | | | | | | | | | | | | |
| (In thousands) | | 2013 | | | 2012 | | | 2011 | | | 2010 | | | 2009 | |
| |
| | | | | |
Demand deposits [1] | | $ | 6,590,963 | | | $ | 6,442,739 | | | $ | 6,256,530 | | | $ | 5,501,430 | | | $ | 5,066,282 | |
| | | | | |
Savings, NOW and money market deposits (non-brokered) | | | 11,255,309 | | | | 11,190,335 | | | | 10,762,869 | | | | 10,371,580 | | | | 9,635,347 | |
| | | | | |
Savings, NOW and money market deposits (brokered) | | | 553,521 | | | | 456,830 | | | | 212,688 | | | | - | | | | - | |
| | | | | |
Time deposits (non-brokered) | | | 6,478,103 | | | | 6,541,660 | | | | 7,552,434 | | | | 8,594,759 | | | | 8,513,854 | |
| | | | | |
Time deposits (brokered CDs) | | | 1,833,249 | | | | 2,369,049 | | | | 3,157,606 | | | | 2,294,431 | | | | 2,709,411 | |
| |
| | | | | |
Total deposits | | $ | 26,711,145 | | | $ | 27,000,613 | | | $ | 27,942,127 | | | $ | 26,762,200 | | | $ | 25,924,894 | |
| |
| [1] Includes interest and non-interest bearing demand deposits. | | | | | | | | | | | | | | | | | | | | |
| |
At December 31, 2013, the Corporation’s total deposits amounted to $26.7 billion, compared to $27.0 billion at December 31, 2012. The decrease in total deposits from the end of 2012 to December 31, 2013 was mainly related to lower time deposits of $0.6 billion, principally due to the maturity of brokered CD’s at the BPPR segment. Lower deposit costs have contributed favorably to maintain the Corporation’s net interest margin above 4%. Refer to Table 20 for a breakdown of the Corporation’s deposits at December 31, 2013 and December 31, 2012.
Borrowings
The Corporation’s borrowings amounted to $3.6 billion at December 31, 2013, compared with $4.4 billion at December 31, 2012. The decrease in borrowings was mostly due to lower short term FHLB of NY advances and the early cancellation of $233 million in senior notes during the third quarter of 2013. Refer to Notes 19, 20 and 21 to the consolidated financial statements for detailed information on the Corporation’s borrowings at December 31, 2013 and December 31, 2012. Also, refer to the Liquidity section in this MD&A for additional information on the Corporation’s funding sources.
Refer to the Off-Balance Sheet Arrangements and Other Commitments section in this MD&A for additional information on the Corporation’s contractual obligations at December 31, 2013.
Other liabilities
The Corporation’s other liabilities amounted to $767 million at December 31, 2013, compared with $966 million at December 31, 2012. The decrease in other liabilities of $199 million was mostly due to lower pension plan and postretirement health benefits liability of $152 million and $38 million, respectively, due to actuarial valuation adjustments.
Stockholders’ Equity
Stockholders’ equity totaled $4.6 billion at December 31, 2013, compared with $4.1 billion at December 31, 2012. The increase was principally due to the net income of $599.3 million recorded for the year and a positive adjustment to the pension liability recorded as a component of other comprehensive income, partially offset by the negative change in the unrealized gains (losses) position of the investment securities available-for-sale portfolio which is also recorded as other comprehensive income. Refer to the consolidated statements of financial condition and of stockholders’ equity for information on the composition of stockholders’ equity. Also, refer to Note 26 for a detail of the accumulated other comprehensive income (loss), an integral component of stockholders’ equity.
Application for the Repayment of TARP
On October 18, 2013, the Corporation submitted a formal application to the Federal Reserve of New York to redeem the $935 million in trust preferred securities due under the Troubled Assets Relief Program (“TARP”), discussed in Note 23 to the accompanying financial statements. While there can be no assurance that the Corporation will be approved to repay TARP, nor on the timing of this event, if the Corporation is approved and repays TARP in full, a non-cash charge to earnings would be recorded for the unamortized portion of the discount associated with this debt, which at December 31, 2013 had a balance of $404 million.
48
REGULATORY CAPITAL
Table 21 presents the Corporation’s capital adequacy information for the years 2009 through 2013. Note 25 to the consolidated financial statements presents further information on the Corporation’s regulatory capital requirements, including the regulatory capital ratios of its depository institutions, BPPR and BPNA. The Corporation continues to exceed the well-capitalized guidelines under the federal banking regulations.
Table 21 - Capital Adequacy Data
| | | | | | | | | | | | | | | | | | | | |
| | | At December 31, | |
| |
(Dollars in thousands) | | 2013 | | | 2012 | | | 2011 | | | 2010 | | | 2009 | |
| |
Risk-based capital: | | | | | | | | | | | | | | | | | | | | |
Tier I capital | | $ | 4,464,742 | | | $ | 4,058,242 | | | $ | 3,899,593 | | | $ | 3,733,776 | | | $ | 2,563,915 | |
Supplementary (Tier II) capital | | | 296,813 | | | | 298,906 | | | | 312,477 | | | | 328,522 | | | | 346,527 | |
| |
Total capital | | $ | 4,761,555 | | | $ | 4,357,148 | | | $ | 4,212,070 | | | $ | 4,062,298 | | | $ | 2,910,442 | |
| |
Risk-weighted assets: | | | | | | | | | | | | | | | | | | | | |
Balance sheet items | | $ | 21,409,548 | | | $ | 21,175,833 | | | $ | 21,775,369 | | | $ | 22,621,779 | | | $ | 23,182,230 | |
Off-balance sheet items | | | 1,909,126 | | | | 2,215,739 | | | | 2,638,954 | | | | 3,099,186 | | | | 2,964,649 | |
| |
Total risk-weighted assets | | $ | 23,318,674 | | | $ | 23,391,572 | | | $ | 24,414,323 | | | $ | 25,720,965 | | | $ | 26,146,879 | |
| |
Adjusted average quarterly assets | | $ | 34,746,137 | | | $ | 35,226,183 | | | $ | 35,783,749 | | | $ | 38,490,597 | | | $ | 34,197,244 | |
| |
Ratios: | | | | | | | | | | | | | | | | | | | | |
Tier I capital (minimum required – 4.00%) | | | 19.15 | % | | | 17.35 | % | | | 15.97 | % | | | 14.52 | % | | | 9.81 % | |
Total capital (minimum required – 8.00%) | | | 20.42 | | | | 18.63 | | | | 17.25 | | | | 15.79 | | | | 11.13 | |
Leverage ratio[1] | | | 12.85 | | | | 11.52 | | | | 10.90 | | | | 9.70 | | | | 7.50 | |
Average equity to assets | | | 11.52 | | | | 10.60 | | | | 9.81 | | | | 8.49 | | | | 7.80 | |
Average tangible equity to assets | | | 9.78 | | | | 8.82 | | | | 8.10 | | | | 6.77 | | | | 6.12 | |
Average equity to loans | | | 16.88 | | | | 15.47 | | | | 14.57 | | | | 12.62 | | | | 11.48 | |
Internal capital generation rate[2] | | | 14.26 | | | | 6.28 | | | | 3.95 | | | | 4.21 | | | | (21.88) | |
| |
[1] All banks are required to have minimum Tier 1 leverage ratio of 3% or 4% of adjusted quarterly average assets, depending on the bank’s classification.
[2] Internal capital generation rate is defined as the rate at which a bank generates equity capital, computed by dividing net income (loss) less dividends by the average balance of stockholders’ equity for a given accounting period.
To meet minimum adequately-capitalized regulatory requirements, an institution must maintain a Tier 1 capital ratio of 4% and a total capital ratio of 8%. A “well-capitalized” institution must generally maintain capital ratios 200 basis points higher than the minimum guidelines. The risk-based capital rules have been further supplemented by a Tier 1 leverage ratio, defined as Tier 1 capital divided by adjusted quarterly average total assets, after certain adjustments. “Well capitalized” bank holding companies must have a minimum Tier 1 leverage ratio of 5%. The Corporation’s ratios presented in Table 21 show that the Corporation was “well capitalized” for regulatory purposes, the highest classification, for all years presented. BPPR and BPNA were also well-capitalized for all years presented.
The improvement in the Corporation’s regulatory capital ratios from the end of 2012 to December 31, 2013 was principally due to internal capital generation from earnings, partially offset by an increase in the portion of the net deferred tax assets that does not qualify for inclusion in Tier 1 capital based on the capital guidelines. The increase in the disallowed net deferred tax assets was mainly due to the higher corporate tax rate in the Puerto Rico tax jurisdiction.
The tangible common equity ratio and tangible book value per common share, which are presented in the table that follows, are non-GAAP measures. Management and many stock analysts use the tangible common equity ratio and tangible book value per common share in conjunction with more traditional bank capital ratios to compare the capital adequacy of banking organizations with significant amounts of goodwill or other intangible assets, typically stemming from the use of the purchase accounting method of accounting for mergers and acquisitions. Neither tangible common equity nor tangible assets or related measures should be
49
considered in isolation or as a substitute for stockholders’ equity, total assets or any other measure calculated in accordance with generally accepted accounting principles in the United States of America (“GAAP”). Moreover, the manner in which the Corporation calculates its tangible common equity, tangible assets and any other related measures may differ from that of other companies reporting measures with similar names.
Table 22 provides a reconciliation of total stockholders’ equity to tangible common equity and total assets to tangible assets at December 31, 2013 and 2012.
Table 22 - Reconciliation Tangible Common Equity and Assets
| | | | | | | | |
| | | At December 31, | |
| | | | |
| | |
| (In thousands, except share or per share information) | | 2013 | | | 2012 | |
| |
Total stockholders’ equity | | $ | 4,626,150 | | | $ | 4,110,000 | |
Less: Preferred stock | | | (50,160 | ) | | | (50,160) | |
Less: Goodwill | | | (647,757 | ) | | | (647,757) | |
Less: Other intangibles | | | (45,132 | ) | | | (54,295) | |
| |
Total tangible common equity | | $ | 3,883,101 | | | $ | 3,357,788 | |
| |
Total assets | | $ | 35,749,333 | | | $ | 36,507,535 | |
Less: Goodwill | | | (647,757 | ) | | | (647,757) | |
Less: Other intangibles | | | (45,132 | ) | | | (54,295) | |
| |
Total tangible assets | | $ | 35,056,444 | | | $ | 35,805,483 | |
| |
Tangible common equity to tangible assets at end of period | | | 11.08 | % | | | 9.38 % | |
Common shares outstanding at end of period | | | 103,397,699 | | | | 103,169,806 | |
Tangible book value per common share | | $ | 37.56 | | | $ | 32.55 | |
| |
The Tier 1 common equity to risk-weighted assets ratio is another non-GAAP measure. Ratios calculated based upon Tier 1 common equity have become a focus of regulators and investors, and management believes ratios based on Tier 1 common equity assist investors in analyzing the Corporation’s capital position.
Because Tier 1 common equity is not formally defined by GAAP or, unlike Tier 1 capital, codified in the federal banking regulations currently in place as of December 31, 2013, this measure is considered to be a non-GAAP financial measure. Non-GAAP financial measures have inherent limitations, are not required to be uniformly applied and are not audited. To mitigate these limitations, the Corporation has procedures in place to calculate these measures using the appropriate GAAP or regulatory components. Although these non-GAAP financial measures are frequently used by stakeholders in the evaluation of a company, they have limitations as analytical tools, and should not be considered in isolation, or as a substitute for analyses of results as reported under GAAP.
50
Table 23 reconciles the Corporation’s total common stockholders’ equity (GAAP) to Tier 1 common equity as defined by the Federal Reserve Board, FDIC and other bank regulatory agencies (non-GAAP).
Table 23 - Reconciliation Tier 1 Common Equity
| | | | | | | | |
| | | At December 31, | |
| (In thousands) | | 2013 | | | 2012 | |
| |
| | |
Common stockholders’ equity | | $ | 4,575,990 | | | $ | 4,059,840 | |
| | |
Less: Unrealized losses (gains) on available-for-sale securities, net of tax[1] | | | 48,344 | | | | (154,568) | |
| | |
Less: Disallowed deferred tax assets[2] | | | (626,570 | ) | | | (385,060) | |
| | |
Less: Disallowed goodwill and other intangible assets, net of deferred tax liability | | | (643,185 | ) | | | (662,201) | |
| | |
Less: Aggregate adjusted carrying value of non-financial equity investments | | | (1,442 | ) | | | (1,160) | |
| | |
Add: Pension and postretirement benefit plan liability adjustment, net of tax and of accumulated net gains (losses) on cash flow hedges[3] | | | 104,302 | | | | 226,159 | |
| |
| | |
Total Tier 1 common equity | | $ | 3,457,439 | | | $ | 3,083,010 | |
| |
| | |
Tier 1 common equity to risk-weighted assets | | | 14.83 | % | | | 13.18 % | |
| |
[1] In accordance with regulatory risk-based capital guidelines, Tier 1 capital excludes net unrealized gains (losses) on available-for-sale debt securities and net unrealized gains on available-for-sale equity securities with readily determinable fair values. In arriving at Tier 1 capital, institutions are required to deduct net unrealized losses on available-for-sale equity securities with readily determinable fair values, net of tax.
[2] Approximately $167 million of the Corporation’s $762 million of net deferred tax assets at December 31, 2013 ($118 million and $541 million, respectively, at December 31, 2012), were included without limitation in regulatory capital pursuant to the risk-based capital guidelines, while approximately $627 million of such assets at December 31, 2013 ($385 million at December 31, 2012) exceeded the limitation imposed by these guidelines and, as “disallowed deferred tax assets”, were deducted in arriving at Tier 1 capital. The remaining ($32) million of the Corporation’s other net deferred tax components at December 31, 2013 ($38 million at December 31, 2012) represented primarily the following items (a) the deferred tax effects of unrealized gains and losses on available-for-sale debt securities, which are permitted to be excluded prior to deriving the amount of net deferred tax assets subject to limitation under the guidelines; (b) the deferred tax asset corresponding to the pension liability adjustment recorded as part of accumulated other comprehensive income; and (c) the deferred tax liability associated with goodwill and other intangibles.
[3] The Federal Reserve Board has granted interim capital relief for the impact of pension liability adjustment.
New Capital Rules to Implement Basel III Capital Requirements
On July 2, 2013, the Board of Governors of the Federal Reserve System (“Board”) approved final rules (“New Capital Rules”) to establish a new comprehensive regulatory capital framework for all U.S. banking organizations. On July 9, 2013, the New Capital Rules were approved by the Office of the Comptroller of the Currency (“OCC”) and (as interim final rules) by the Federal Deposit Insurance Corporation (“FDIC”) (together with the Board, the “Agencies”).
The New Capital Rules generally implement the Basel Committee on Banking Supervision’s (the “Basel Committee”) December 2010 final capital framework referred to as “Basel III” for strengthening international capital standards. The New Capital Rules substantially revise the risk-based capital requirements applicable to bank holding companies and their depository institution subsidiaries, including Popular, BPPR and BPNA, as compared to the current U.S. general risk-based capital rules. The New Capital Rules revise the definitions and the components of regulatory capital, as well as address other issues affecting the numerator in banking institutions’ regulatory capital ratios. The New Capital Rules also address asset risk weights and other matters affecting the denominator in banking institutions’ regulatory capital ratios and replace the existing general risk-weighting approach, which was derived from the Basel Committee’s 1988 “Basel I” capital accords, with a more risk-sensitive approach based, in part, on the “standardized approach” in the Basel Committee’s 2004 “Basel II” capital accords. In addition, the New Capital Rules implement certain provisions of Dodd-Frank Act, including the requirements of Section 939A to remove references to credit ratings from the federal agencies’ rules. The New Capital Rules are effective for Popular, BPPR and BPNA on January 1, 2015, subject to phase-in periods for certain of their components and other provisions.
Among other matters, the New Capital Rules: (i) introduce a new capital measure called “Common Equity Tier 1” (“CET1”) and related regulatory capital ratio of CET1 to risk-weighted assets; (ii) specify that Tier 1 capital consists of CET1 and “Additional Tier 1 capital” instruments meeting certain revised requirements; (iii) mandate that most deductions/adjustments to regulatory capital measures be made to CET1 and not to the other components of capital; and (iv) expand the scope of the deductions from and
51
adjustments to capital as compared to existing regulations. Under the New Capital Rules, for most banking organizations, including the Corporation, the most common form of Additional Tier 1 capital is non-cumulative perpetual preferred stock and the most common form of Tier 2 capital is subordinated notes and a portion of the allocation for loan and lease losses, in each case, subject to the New Capital Rules’ specific requirements.
Pursuant to the New Capital Rules, the minimum capital ratios as of January 1, 2015 will be as follows:
| | • | | 4.5% CET1 to risk-weighted assets; |
| | • | | 6.0% Tier 1 capital (that is, CET1plus Additional Tier 1 capital) to risk-weighted assets; |
| | • | | 8.0% Total capital (that is, Tier 1 capitalplus Tier 2 capital) to risk-weighted assets; and |
| | • | | 4% Tier 1 capital to average consolidated assets as reported on consolidated financial statements (known as the “leverage ratio”). |
The New Capital Rules also introduce a new “capital conservation buffer”, composed entirely of CET1, on top of these minimum risk-weighted asset ratios. The capital conservation buffer is designed to absorb losses during periods of economic stress. Banking institutions with a ratio of CET1 to risk-weighted assets above the minimum but below the capital conservation buffer will face constraints on dividends, equity repurchases and compensation based on the amount of the shortfall. Thus, when fully phased-in on January 1, 2019, Popular, BPPR and BPNA will be required to maintain such additional capital conservation buffer of 2.5% of CET1, effectively resulting in minimum ratios of (i) CET1 to risk-weighted assets of at least 7%, (ii) Tier 1 capital to risk-weighted assets of at least 8.5%, and (iii) Total capital to risk-weighted assets of at least 10.5%.
The New Capital Rules provide for a number of deductions from and adjustments to CET1. These include, for example, the requirement that mortgage servicing rights, deferred tax assets arising from temporary differences that could not be realized through net operating loss carrybacks and significant investments in non-consolidated financial entities be deducted from CET1 to the extent that any one such category exceeds 10% of CET1 or all such items, in the aggregate, exceed 15% of CET1.
In addition, under the current general risk-based capital rules, the effects of accumulated other comprehensive income or loss (“AOCI”) items included in shareholders’ equity (for example, marks-to-market of securities held in the available for sale portfolio) under U.S. GAAP are reversed for the purposes of determining regulatory capital ratios. Pursuant to the New Capital Rules, the effects of certain AOCI items are not excluded; however, non-advanced approaches banking organizations, including Popular, BPPR and BPNA, may make a one-time permanent election to continue to exclude these items. This election must be made concurrently with the first filing of certain of the Popular’s, BPPR’s and BPNA’s periodic regulatory reports in the beginning of 2015. Popular, BPPR and BPNA expect to make this election in order to avoid significant variations in the level of capital depending upon the impact of interest rate fluctuations on the fair value of their securities portfolio. The New Capital Rules also preclude certain hybrid securities, such as trust preferred securities, from inclusion in bank holding companies’ Tier 1 capital, subject to phase-out in the case of bank holding companies that had $15 billion or more in total consolidated assets as of December 31, 2009. The Corporation’s Tier I capital level at December 31, 2013, included $427 million of trust preferred securities that are subject to the phase-out provisions of the New Capital Rules. The Corporation would be allowed to include only 25 percent of such trust preferred securities in Tier 1 capital as of January 1, 2015 and 0 percent as of January 1, 2016, and thereafter. Trust preferred securities no longer included in Popular’s Tier 1 capital may nonetheless be included as a component of Tier 2 capital on a permanent basis without phase-out and irrespective of whether such securities otherwise meet the revised definition of Tier 2 capital set forth in the New Capital Rules. The Corporation’s trust preferred securities issued to the U.S. Treasury pursuant to the Emergency Economic Stabilization Act of 2008 are exempt from the phase-out provision.
Implementation of the deductions and other adjustments to CET1 will begin on January 1, 2015 and will be phased-in over a 4-year period (beginning at 40% on January 1, 2015 and an additional 20% per year thereafter). The implementation of the capital conservation buffer will begin on January 1, 2016 at the 0.625% level and increase by 0.625% on each subsequent January 1, until it reaches 2.5% on January 1, 2019.
52
With respect to BPPR and BPNA, the New Capital Rules revise the “prompt corrective action” (“PCA”) regulations adopted pursuant to Section 38 of the Federal Deposit Insurance Act, by: (i) introducing a CET1 ratio requirement at each PCA category (other than critically undercapitalized), with the required CET1 ratio being 6.5% for well-capitalized status; (ii) increasing the minimum Tier 1 capital ratio requirement for each category, with the minimum Tier 1 capital ratio for well-capitalized status being 8% (as compared to the current 6%); and (iii) eliminating the current provision that provides that a bank with a composite supervisory rating of 1 may have a 3% leverage ratio and still be adequately capitalized. The New Capital Rules do not change the total risk-based capital requirement for any PCA category.
The New Capital Rules prescribe a new standardized approach for risk weightings that expand the risk-weighting categories from the current four Basel I-derived categories (0%, 20%, 50% and 100%) to a larger and more risk-sensitive number of categories, depending on the nature of the assets, and resulting in higher risk weights for a variety of asset classes.
We believe that Popular, BPPR and BPNA will be able to meet well-capitalized capital ratios upon implementation of the revised requirements, as finalized.
OFF-BALANCE SHEET ARRANGEMENTS AND OTHER COMMITMENTS
In the ordinary course of business, the Corporation engages in financial transactions that are not recorded on the balance sheet, or may be recorded on the balance sheet in amounts that are different than the full contract or notional amount of the transaction. As a provider of financial services, the Corporation routinely enters into commitments with off-balance sheet risk to meet the financial needs of its customers. These commitments may include loan commitments and standby letters of credit. These commitments are subject to the same credit policies and approval process used for on-balance sheet instruments. These instruments involve, to varying degrees, elements of credit and interest rate risk in excess of the amount recognized in the statement of financial position. Other types of off-balance sheet arrangements that the Corporation enters in the ordinary course of business include derivatives, operating leases and provision of guarantees, indemnifications, and representation and warranties.
Contractual Obligations and Commercial Commitments
The Corporation has various financial obligations, including contractual obligations and commercial commitments, which require future cash payments on debt and lease agreements. Also, in the normal course of business, the Corporation enters into contractual arrangements whereby it commits to future purchases of products or services from third parties. Obligations that are legally binding agreements, whereby the Corporation agrees to purchase products or services with a specific minimum quantity defined at a fixed, minimum or variable price over a specified period of time, are defined as purchase obligations.
Purchase obligations include major legal and binding contractual obligations outstanding at the end of 2013, primarily for services, equipment and real estate construction projects. Services include software licensing and maintenance, facilities maintenance, supplies purchasing, and other goods or services used in the operation of the business. Generally, these contracts are renewable or cancelable at least annually, although in some cases the Corporation has committed to contracts that may extend for several years to secure favorable pricing concessions.
As previously indicated, the Corporation also enters into derivative contracts under which it is required either to receive or pay cash, depending on changes in interest rates. These contracts are carried at fair value on the consolidated statements of financial condition with the fair value representing the net present value of the expected future cash receipts and payments based on market rates of interest as of the statement of condition date. The fair value of the contract changes daily as interest rates change. The Corporation may also be required to post additional collateral on margin calls on the derivatives and repurchase transactions.
53
At December 31, 2013, the aggregate contractual cash obligations, including purchase obligations and borrowings, by maturities, are presented in Table 24.
Table 24 - Contractual Obligations
| | | | | | | | | | | | | | | | | | | | |
| | | Payments Due by Period | |
| |
| (In millions) | | Less than 1 year | | | 1 to 3 years | | | 3 to 5 years | | | After 5 years | | | Total | |
| |
| | | | | |
Certificates of deposits | | $ | 5,387 | | | $ | 1,941 | | | $ | 912 | | | $ | 71 | | | $ | 8,311 | |
| | | | | |
Repurchase agreements | | | 917 | | | | 627 | | | | 115 | | | | - | | | | 1,659 | |
| | | | | |
Other short-term borrowings | | | 401 | | | | - | | | | - | | | | - | | | | 401 | |
| | | | | |
Long-term debt | | | 126 | | | | 242 | | | | 202 | | | | 991 [1 | ] | | | 1,561 | |
| | | | | |
Purchase obligations | | | 118 | | | | 73 | | | | 30 | | | | 25 | | | | 246 | |
| | | | | |
Annual rental commitments under operating leases | | | 37 | | | | 67 | | | | 47 | | | | 146 | | | | 297 | |
| | | | | |
Capital leases | | | 1 | | | | 2 | | | | 3 | | | | 18 | | | | 24 | |
| |
| | | | | |
Total contractual cash obligations | | $ | 6,987 | | | $ | 2,952 | | | $ | 1,309 | | | $ | 1,251 | | | $ | 12,499 | |
| |
[1] Includes junior subordinated debentures with an aggregate liquidation amount of $936 million, net of $ 404 million discount. These junior subordinated debentures are perpetual (no stated maturity).
Under the Corporation’s repurchase agreements, Popular is required to deposit cash or qualifying securities to meet margin requirements. To the extent that the value of securities previously pledged as collateral declines because of changes in interest rates, the Corporation will be required to deposit additional cash or securities to meet its margin requirements, thereby adversely affecting its liquidity.
At December 31, 2013, the Corporation’s liability on its pension, restoration and postretirement benefit plans amounted to $130 million, compared with $319 million at December 31, 2012. The Corporation’s expected contributions to the pension and benefit restoration plans are minimal, while the expected contributions to the postretirement benefit plan to fund current benefit payment requirements are estimated at $6.2 million for 2014. Obligations to these plans are based on current and projected obligations of the plans, performance of the plan assets, if applicable, and any participant contributions. Refer to Note 34 to the consolidated financial statements for further information on these plans. Management believes that the effect of the pension and postretirement plans on liquidity is not significant to the Corporation’s overall financial condition. The BPPR’s non-contributory defined pension and benefit restoration plans are frozen with regards to all future benefit accruals.
At December 31, 2013, the liability for uncertain tax positions was $9.8 million, compared with $13.4 million as of the end of 2012. This liability represents an estimate of tax positions that the Corporation has taken in its tax returns which may ultimately not be sustained upon examination by the tax authorities. The ultimate amount and timing of any future cash settlements cannot be predicted with reasonable certainty. Under the statute of limitations, the liability for uncertain tax positions expires as follows: 2014 - $4.8 million, 2015 - $2.2 million, 2016 - $0.8 million, 2017 - $0.8 million, and 2018 - $1.2 million. As a result of examinations, the Corporation anticipates a reduction in the total amount of unrecognized tax benefits within the next 12 months, which could amount to approximately $7.6 million.
The Corporation also utilizes lending-related financial instruments in the normal course of business to accommodate the financial needs of its customers. The Corporation’s exposure to credit losses in the event of nonperformance by the other party to the financial instrument for commitments to extend credit, standby letters of credit and commercial letters of credit is represented by the contractual notional amount of these instruments. The Corporation uses credit procedures and policies in making those commitments and conditional obligations as it does in extending loans to customers. Since many of the commitments may expire without being drawn upon, the total contractual amounts are not representative of the Corporation’s actual future credit exposure or liquidity requirements for these commitments.
54
The following table presents the contractual amounts related to the Corporation’s off-balance sheet lending and other activities at December 31, 2013:
Table 25 - Off-Balance Sheet Lending and Other Activities
| | | | | | | | | | | | | | | | | | | | |
| | | Amount of Commitment - Expiration Period | |
| |
| (In millions) | | 2014 | | | 2015 - 2016 | | | 2017 - 2018 | | | 2019 - thereafter | | | Total | |
| |
| | | | | |
Commitments to extend credit | | $ | 6,699 | | | $ | 533 | | | $ | 143 | | | $ | 116 | | | $ | 7,491 | |
| | | | | |
Commercial letters of credit | | | 3 | | | | - | | | | - | | | | - | | | | 3 | |
| | | | | |
Standby letters of credit | | | 77 | | | | 2 | | | | - | | | | - | | | | 79 | |
| | | | | |
Commitments to originate mortgage loans | | | 35 | | | | 13 | | | | - | | | | - | | | | 48 | |
| | | | | |
Unfunded investment obligations | | | 1 | | | | 9 | | | | - | | | | - | | | | 10 | |
| |
| | | | | |
Total | | $ | 6,815 | | | $ | 557 | | | $ | 143 | | | $ | 116 | | | $ | 7,631 | |
| |
Guarantees Associated with Loans Sold / Serviced
At December 31, 2013, the Corporation serviced $2.5 billion in residential mortgage loans subject to lifetime credit recourse provisions, principally loans associated with FNMA and FHLMC residential mortgage loan securitization programs, compared with $2.9 billion at December 31, 2012. The Corporation has not sold any mortgage loans subject to credit recourse since 2010.
In the event of any customer default, pursuant to the credit recourse provided, the Corporation is required to repurchase the loan or reimburse the third party investor for the incurred loss. The maximum potential amount of future payments that the Corporation would be required to make under the recourse arrangements in the event of nonperformance by the borrowers is equivalent to the total outstanding balance of the residential mortgage loans serviced with recourse and interest, if applicable. In the event of nonperformance by the borrower, the Corporation has rights to the underlying collateral securing the mortgage loan. The Corporation suffers losses on these loans when the proceeds from a foreclosure sale of the property underlying a defaulted mortgage loan are less than the outstanding principal balance of the loan plus any uncollected interest advanced and the costs of holding and disposing the related property.
In the case of Puerto Rico, most claims are settled by repurchases of delinquent loans, the majority of which are greater than 90 days past due. The average time period to prepare an initial response to a repurchase request is from 30 to 120 days from the initial written notice depending on the type of the repurchase request. Failure by the Corporation to respond to a request for repurchase on a timely basis could result in a deterioration of the seller/servicer relationship and the seller/servicer’s overall standing. In certain instances, investors could require additional collateral to ensure compliance with the servicer’s repurchase obligation or cancel the seller/servicer license and exercise their rights to transfer the servicing to an eligible seller/servicer.
55
The following table presents the delinquency status of the residential mortgage loans serviced by the Corporation that are subject to lifetime credit recourse provisions at December 31, 2013 and December 31, 2012.
Table 26 - Delinquency of Residential Mortgage Loans Subject to Lifetime Credit Recourse
| | | | | | | | | | |
| |
(In thousands) | | 2013 | | | | | 2012 | |
| |
| | | |
Total portfolio | | $ | 2,524,155 | | | | | $ | 2,932,555 | |
| | | |
Days past due: | | | | | | | | | | |
| | | |
30 days and over | | $ | 347,046 | | | | | $ | 412,313 | |
| | | |
90 days and over | | $ | 138,018 | | | | | $ | 158,679 | |
| | | |
As a percentage of total portfolio: | | | | | | | | | | |
| | | |
30 days past due or more | | | 13.75 % | | | | | | 14.06 % | |
| | | |
90 days past due or more | | | 5.47 % | | | | | | 5.41 % | |
| |
During the year ended December 31, 2013, the Corporation repurchased approximately $126 million of unpaid principal balance in mortgage loans subject to the credit recourse provisions (December 31, 2012 - $157 million). There are no particular loan characteristics, such as loan vintages, loan type, loan-to-value ratio, or other criteria, that denote any specific trend or a concentration of repurchases in any particular segment. Based on historical repurchase experience, the loan delinquency status is the main factor which causes the repurchase request. The current economic situation has forced the investors to take a closer review at loan performance and recourse triggers, thus causing an increase in loan repurchases.
At December 31, 2013, there were 5 outstanding unresolved claims related to the recourse portfolio with a principal balance outstanding of $769 thousand, compared with 59 and $8.0 million, respectively, at December 31, 2012. The outstanding unresolved claims at December 31, 2013 and 2012 pertained to FNMA.
At December 31, 2013, the Corporation’s liability established to cover the estimated credit loss exposure related to loans sold or serviced with credit recourse amounted to $41 million, compared with $52 million at December 31, 2012.
The following table presents the changes in the Corporation’s liability of estimated losses from these credit recourses agreements, included in the consolidated statements of financial condition for the years ended December 31, 2013 and 2012.
Table 27 - Changes in Liability of Estimated Losses from Credit Recourse Agreements
| | | | | | | | |
| (In thousands) | | 2013 | | | 2012 | |
| |
| | |
Balance as of beginning of period | | $ | 51,673 | | | $ | 58,659 | |
| | |
Provision for recourse liability | | | 21,793 | | | | 16,153 | |
| | |
Net charge-offs / terminations | | | (32,003) | | | | (23,139) | |
| |
| | |
Balance as of end of period | | $ | 41,463 | | | $ | 51,673 | |
| |
The provision for credit recourse liability increased $5.6 million for the year ended December 31, 2013, when compared to 2012. The increase in the provision was mainly driven by higher net-charge-offs.
The estimated losses to be absorbed under the credit recourse arrangements are recorded as a liability when the loans are sold and are updated by accruing or reversing expense (categorized in the line item “adjustments (expense) to indemnity reserves on loans sold” in the consolidated statements of operations) throughout the life of the loan, as necessary, when additional relevant information becomes available. The methodology used to estimate the recourse liability is a function of the recourse arrangements given and considers a variety of factors, which include actual defaults and historical loss experience, foreclosure rate, estimated future defaults and the probability that a loan would be delinquent. Statistical methods are used to estimate the recourse liability. Expected loss rates are applied to different loan segmentations. The expected loss, which represents the amount expected to be lost on a given loan, considers the probability of default and loss severity. The probability of default represents the probability that a
56
loan in good standing would become 90 days delinquent within the following twelve-month period. Regression analysis quantifies the relationship between the default event and loan-specific characteristics, including credit scores, loan-to-value ratios and loan aging, among others.
When the Corporation sells or securitizes mortgage loans, it generally makes customary representations and warranties regarding the characteristics of the loans sold. The Corporation’s mortgage operations in the Puerto Rico group conforming mortgage loans into pools which are exchanged for FNMA and GNMA mortgage-backed securities, which are generally sold to private investors, or are sold directly to FNMA or other private investors for cash. As required under the government agency programs, quality review procedures are performed by the Corporation to ensure that asset guideline qualifications are met. To the extent the loans do not meet specified characteristics, the Corporation may be required to repurchase such loans or indemnify for losses and bear any subsequent loss related to the loans. Repurchases under representation and warranty arrangements in which the Corporation’s Puerto Rico banking subsidiaries were obligated to repurchase the loans amounted to $4.7 million in unpaid principal balance with losses amounting to $1.0 million for the year ended December 31, 2013 ($3.2 million and $0.5 million, respectively, at December 31, 2012). A substantial amount of these loans reinstate to performing status or have mortgage insurance, and thus the ultimate losses on the loans are not deemed significant.
During the quarter ended June 30, 2013, the Corporation established a reserve for certain specific representation and warranties made in connection with BPPR’s sale of non-performing mortgage loans. The purchaser’s sole remedy under the indemnity clause is to seek monetary damages from BPPR, for a maximum of $16.3 million. BPPR recognized a reserve of approximately $3.0 million, representing its best estimate of the loss that would be incurred in connection with this indemnification. BPPR’s obligations under this clause end one year after the closing except to any claim asserted prior to such termination date.
During the quarter ended March 31, 2013, the Corporation established a reserve for certain specific representation and warranties made in connection with BPPR’s sale of commercial and construction loans, and commercial and single family real estate owned. The purchaser’s sole remedy under the indemnity clause is to seek monetary damages from BPPR, for a maximum of $18.0 million. BPPR is not required to repurchase any of the assets. BPPR recognized a reserve of approximately $10.7 million, representing its best estimate of the loss that would be incurred in connection with this indemnification. BPPR’s obligations under this clause end one year after the closing except to any claim asserted prior to such termination date.
Also, during the quarter ended June 30, 2011, the Corporation’s banking subsidiary, BPPR, reached an agreement (the “June 2011 agreement”) with the FDIC, as receiver for a local Puerto Rico institution, and the financial institution with respect to a loan servicing portfolio that BPPR services since 2008, related to FHLMC and GNMA pools. The loans were originated and sold by the financial institution and the servicing rights were transferred to BPPR in 2008. As part of the 2008 servicing agreement, the financial institution was required to repurchase from BPPR any loans that BPPR, as servicer, was required to repurchase from the investors under representation and warranty obligations. As part of the June 2011 agreement, the Corporation received cash to discharge the financial institution from any repurchase obligation and other claims over the related serviced portfolio, for which the Corporation recorded a representation and warranty reserve. At December 31, 2013, this reserve amounted to $ 6.2 million and the related portfolio amounted approximately to $2.4 billion (December 31, 2012 - $ 7.6 million and $2.9 billion, respectively).
Servicing agreements relating to the mortgage-backed securities programs of FNMA and GNMA, and to mortgage loans sold or serviced to certain other investors, including FHLMC, require the Corporation to advance funds to make scheduled payments of principal, interest, taxes and insurance, if such payments have not been received from the borrowers. At December 31, 2013, the Corporation serviced $16.3 billion in mortgage loans for third-parties, including the loans serviced with credit recourse, compared with $16.7 billion at December 31, 2012. The Corporation generally recovers funds advanced pursuant to these arrangements from the mortgage owner, from liquidation proceeds when the mortgage loan is foreclosed or, in the case of FHA/VA loans, under the applicable FHA and VA insurance and guarantees programs. However, in the meantime, the Corporation must absorb the cost of the funds it advances during the time the advance is outstanding. The Corporation must also bear the costs of attempting to collect on delinquent and defaulted mortgage loans. In addition, if a defaulted loan is not cured, the mortgage loan would be canceled as part of the foreclosure proceedings and the Corporation would not receive any future servicing income with respect to that loan. At December 31, 2013, the outstanding balance of funds advanced by the Corporation under such mortgage loan servicing agreements was approximately $29 million, compared with $19 million at December 31, 2012. To the extent the mortgage loans underlying the Corporation’s servicing portfolio experience increased delinquencies, the Corporation would be required to dedicate additional cash resources to comply with its obligation to advance funds as well as incur additional administrative costs related to increases in collection efforts.
At December 31, 2013, the Corporation has reserves for customary representations and warranties related to loans sold by its U.S. subsidiary E-LOAN prior to 2009. Loans had been sold to investors on a servicing released basis subject to certain representations
57
and warranties. Although the risk of loss or default was generally assumed by the investors, the Corporation made certain representations relating to borrower creditworthiness, loan documentation and collateral, which if not correct, may result in requiring the Corporation to repurchase the loans or indemnify investors for any related losses associated to these loans. At December 31, 2013 and December 31, 2012, the Corporation’s reserve for estimated losses from such representation and warranty arrangements amounted to $ 7 million and $ 8 million, respectively. E-LOAN is no longer originating and selling loans since the subsidiary ceased these activities in 2008.
On a quarterly basis, the Corporation reassesses its estimate for expected losses associated to E-LOAN’s customary representation and warranty arrangements. The analysis incorporates expectations on future disbursements based on quarterly repurchases and make-whole events. The analysis also considers factors such as the average length of time between the loan’s funding date and the loan repurchase date, as observed in the historical loan data. The liability is estimated as follows: (1) three year average of disbursement amounts (two year historical and one year projected) are used to calculate an average quarterly amount; (2) the quarterly average is annualized and multiplied by the repurchase distance, which currently averages approximately three years, to determine a liability amount; and (3) the calculated reserve is compared to current claims and disbursements to evaluate adequacy. The Corporation’s success rate in clearing the claims in full or negotiating lesser payouts has been fairly consistent. On average, the Corporation avoided paying on 52% of claimed amounts during the 24-month period ended December 31, 2013 (40% during the 24-month period ended December 31, 2012). On the remaining 48% of claimed amounts, the Corporation either repurchased the balance in full or negotiated settlements. For the accounts where the Corporation settled, it averaged paying 57% of claimed amounts during the 24-month period ended December 31, 2013 (49% during the 24-month period ended December 31, 2012). In total, during the 24-month period ended December 31, 2013, the Corporation paid an average of 29% of claimed amounts (24-month period ended December 31, 2012 – 33%).
E-LOAN’s outstanding unresolved claims related to representation and warranty obligations from mortgage loan sales prior to 2009 at December 31, 2013 and December 31, 2012 are presented in the table below.
Table 28 - E-LOAN’s Outstanding Unresolved Claims from Mortgage Loan Sales
| | | | | | | | | | |
| (In thousands) | | 2013 | | | | | 2012 | |
| |
| | | |
By Counterparty | | | | | | | | | | |
| |
| | | |
GSEs | | $ | - | | | | | $ | 1,270 | |
| | | |
Whole loan and private-label securitization investors | | | 535 | | | | | | 533 | |
| |
| | | |
Total outstanding claims by counterparty | | $ | 535 | | | | | $ | 1,803 | |
| |
| | | |
| | | | | | | | | | |
| |
| | | |
By Product Type | | | | | | | | | | |
| |
| | | |
1st lien (Prime loans) | | $ | 535 | | | | | $ | 1,803 | |
| |
| | | |
Total outstanding claims by product type | | $ | 535 | | | | | $ | 1,803 | |
| |
The outstanding claims balance from private-label investors is comprised by one counterparty at December 31, 2013 and two counterparties at December 31, 2012.
In the case of E-LOAN, the Corporation indemnifies the lender, repurchases the loan, or settles the claim, generally for less than the full amount. Each repurchase case is different and each lender / servicer has different requirements. The large majority of the loans repurchased have been greater than 90 days past due at the time of repurchase and are included in the Corporation’s non-performing loans. During the year ended December 31, 2013, charge-offs recorded by E-LOAN against this representation and warranty reserve associated with loan repurchases, indemnification or make-whole events and settlement / closure of certain agreements with counterparties to reduce the exposure to future claims were minimal. Make-whole events are typically defaulted cases in which the investor attempts to recover by collateral or guarantees, and the seller is obligated to cover any impaired or unrecovered portion of the loan. Historically, claims have been predominantly for first mortgage agency loans and principally consist of underwriting errors related to undisclosed debt or missing documentation. The table that follows presents the changes in the Corporation’s liability for estimated losses associated with customary representations and warranties related to loans sold by E-LOAN, included in the consolidated statement of condition for the years ended December 31, 2013 and 2012.
58
Table 29 - Changes in Liability for Estimated Losses Related to Loans Sold by E-LOAN
| | | | | | | | |
| (In thousands) | | 2013 | | | 2012 | |
| |
| | |
Balance as of beginning of period | | $ | 7,740 | | | $ | 10,625 | |
| | |
Provision for (reversal of) representation and warranties | | | 267 | | | | (1,836) | |
| | |
Net charge-offs / terminations | | | (1,431) | | | | (1,049) | |
| |
| | |
Balance as of end of period | | $ | 6,576 | | | $ | 7,740 | |
| |
Popular, Inc. Holding Company (“PIHC”) fully and unconditionally guarantees certain borrowing obligations issued by certain of its wholly-owned consolidated subsidiaries amounting to $ 0.2 billion at December 31, 2013 (December 31, 2012 - $ 0.5 billion). In addition, at December 31, 2013 and December 31, 2012, PIHC fully and unconditionally guaranteed on a subordinated basis $ 1.4 billion of capital securities (trust preferred securities) issued by wholly-owned issuing trust entities to the extent set forth in the applicable guarantee agreement. Refer to Note 23 to the consolidated financial statements for further information on the trust preferred securities.
The Corporation is a defendant in a number of legal proceedings arising in the ordinary course of business as described in Note 28 to the consolidated financial statements.
RISK MANAGEMENT
Managing risk is an essential component of the Corporation’s business. Risk identification and monitoring are key elements in overall risk management. The following principal risks, which have been incorporated into the Corporation’s risk management program, include:
| | — | | Credit Risk – Potential for default or loss resulting from an obligor’s failure to meet the terms of any contract with the Corporation or any of its subsidiaries, or failure otherwise to perform as agreed. Credit risk arises from all activities where success depends on counterparty, issuer, or borrower performance. |
| | — | | Interest Rate Risk (“IRR”) – Interest rate risk is the risk to earnings or capital arising from changes in interest rates. Interest rate risk arises from differences between the timing of rate changes and the timing of cash flows (repricing risk); from changing rate relationships among different yield curves affecting bank lending and borrowing activities (basis risk); from changing rate relationships across the spectrum of maturities (yield curve risk); and from interest related options embedded in bank products (options risk). |
| | — | | Market Risk – Potential for loss resulting from changes in market prices of the assets or liabilities in the Corporation’s or in any of its subsidiaries’ portfolios. Market prices may change as a result of changes in rates, credit and liquidity for the product or general economic conditions. |
| | — | | Liquidity Risk – Potential for loss resulting from the Corporation or its subsidiaries not being able to meet their financial obligations when they come due. This could be a result of market conditions, the ability of the Corporation to liquidate assets or manage or diversify various funding sources. This risk also encompasses the possibility that an instrument cannot be closed out or sold at its economic value, which might be a result of stress in the market or in a specific security type given its credit, volume and maturity. |
| | — | | Operational Risk – This risk is the possibility that inadequate or failed systems and internal controls or procedures, human error, fraud or external influences such as disasters, can cause losses. |
| | — | | Compliance Risk and Legal Risk – Potential for loss resulting from violations of or non-conformance with laws, rules, regulations, prescribed practices, existing contracts or ethical standards. |
| | — | | Strategic Risk – Potential for loss arising from adverse business decisions or improper implementation of business decisions. Also, it incorporates how management analyzes external factors that impact the strategic direction of the Corporation. |
| | — | | Reputational Risk – Potential for loss arising from negative public opinion. |
59
The Corporation’s Board of Directors (the “Board”) has established a Risk Management Committee (“RMC”) to undertake the responsibilities of overseeing and approving the Corporation’s Risk Management Program, as well as the Corporation’s Capital Plan. The Capital Plan is a plan to maintain sufficient regulatory capital at the Corporation, BPPR and BPNA, which considers current and future regulatory capital requirements, expected future profitability and credit trends and, at least, two macroeconomic scenarios, including a base and stress scenario.
The RMC, as an oversight body, monitors and approves the overall business strategies, and corporate policies to identify, measure, monitor and control risks while maintaining the effectiveness and efficiency of the business and operational processes. As an approval body for the Corporation, the RMC reviews and approves relevant risk management policies and critical processes. Also, it periodically reports to the Board about its activities.
The Board and RMC have delegated to the Corporation’s management the implementation of the risk management processes. This implementation is split into two separate but coordinated efforts that include (i) business and / or operational units who identify, manage and control the risks resulting from their activities, and (ii) a Risk Management Group (“RMG”). In general, the RMG is mandated with responsibilities such as assessing and reporting to the Corporation’s management and RMC the risk positions of the Corporation; developing and implementing mechanisms, policies and procedures to identify, measure and monitor risks; implementing measurement mechanisms and infrastructure to achieve effective risk monitoring; developing and implementing the necessary management information and reporting mechanisms; and monitoring and testing the adequacy of the Corporation’s policies, strategies and guidelines.
The RMG is responsible for the overall coordination of risk management efforts throughout the Corporation and is composed of three reporting divisions: (i) Credit Risk Management, (ii) Compliance Management, and (iii) Financial and Operational Risk Management. The latter includes an Enterprise Risk Management function that facilitates, among other aspects, the identification, coordination, and management of multiple and cross-enterprise risks.
Additionally, the Internal Auditing Division provides an independent assessment of the Corporation’s internal control structure and related systems and processes.
Moreover, management oversight of the Corporation’s risk-taking and risk management activities is conducted through management committees:
| | — | | CRESCO (Credit Strategy Committee) – Manages the Corporation’s overall credit exposure and approves credit policies, standards and guidelines that define, quantify, and monitor credit risk. Through this committee, management reviews asset quality ratios, trends and forecasts, problem loans, establishes the provision for loan losses and assesses the methodology and adequacy of the allowance for loan losses on a quarterly basis. |
| | — | | ALCO (Asset / Liability Management Committee) – Oversees and approves the policies and processes designed to ensure sound market risk and balance sheet strategies, including the interest rate, liquidity, investment and trading policies. The ALCO monitors the capital position and plan for the Corporation and approves all capital management strategies, including capital market transactions and capital distributions. The ALCO also monitors forecasted results and their impact on capital, liquidity, and net interest margin of the Corporation. |
| | — | | ORCO (Operational Risk Committee) – Monitors operational risk management activities to ensure the development and consistent application of operational risk policies, processes and procedures that measure, limit and manage the Corporation’s operational risks while maintaining the effectiveness and efficiency of the operating and businesses’ processes. |
Market / Interest Rate Risk
The financial results and capital levels of the Corporation are constantly exposed to market, interest rate and liquidity risks. The ALCO and the Corporate Finance Group are responsible for planning and executing the Corporation’s market, interest rate risk, funding activities and strategy, and for implementing the policies and procedures approved by the RMC and the ALCO. In addition, the Financial and Operational Risk Management Division is responsible for the independent monitoring and reporting of adherence with established policies, and enhancing and strengthening controls surrounding interest, liquidity and market risk. The ALCO generally meets on a weekly basis and reviews the Corporation’s current and forecasted asset and liability levels as well as desired pricing strategies and other relevant financial management and interest rate and risk topics. Also, on a monthly basis the ALCO reviews various interest rate risk sensitivity metrics, ratios
60
and portfolio information, including but not limited to, the Corporation’s liquidity positions, projected sources and uses of funds, interest rate risk positions and economic conditions.
Market risk refers to the risk of a reduction in the Corporation’s capital due to changes in the market valuation of its assets and/or liabilities.
Most of the assets subject to market valuation risk are securities in the investment portfolio classified available for sale. Refer to Notes 7 and 8 for further information on the investment portfolio. Investment securities classified as available for sale amounted to $5.3 billion as of December 31, 2013. Other assets subject to market risk include loans held-for-sale, which amounted to $110 million, the mortgage servicing rights (“MSRs”) which amounted to $161 million and securities classified as “trading” which amounted to $340 million, as of December 31, 2013.
Liabilities subject to market risk include the FDIC clawback obligation, which amounted to $128 million at December 31, 2013.
The Corporation’s market risk is independently measured and reported by the Financial and Operational Risk Management Division and is reviewed by the Risk Management Committee of the Board.
Management believes that market risk is not a material source of risk at the Corporation. A significant portion of the Corporation’s financial activities is concentrated in Puerto Rico, which has been going through a challenging economic cycle. Refer to the Geographic and Government Risk section of this MD&A for some highlights on the current status of the Puerto Rico economy.
61
Interest Rate Risk
The Corporation’s net interest income is subject to various categories of interest rate risk, including repricing, basis, yield curve and option risks. In managing interest rate risk, management may alter the mix of floating and fixed rate assets and liabilities, change pricing schedules, adjust maturities through sales and purchases of investment securities, and enter into derivative contracts, among other alternatives.
Interest rate risk management is an active process that encompasses monitoring loan and deposit flows complemented by investment and funding activities. Effective management of interest rate risk begins with understanding the dynamic characteristics of assets and liabilities and determining the appropriate rate risk position given line of business forecasts, management objectives, market expectations and policy constraints.
Management utilizes various tools to assess IRR, including simulation modeling, static gap analysis, and Economic Value of Equity (EVE). The three methodologies complement each other and are used jointly in the evaluation of the Corporation’s IRR. Simulation modeling is prepared for a five year period, which in conjunction with the EVE analysis, provides Management a better view of long term IRR.
Net interest income simulation analysis performed by legal entity and on a consolidated basis is a tool used by the Corporation in estimating the potential change in net interest income resulting from hypothetical changes in interest rates. Sensitivity analysis is calculated using a simulation model which incorporates actual balance sheet figures detailed by maturity and interest yields or costs. It also incorporates assumptions on balance sheet growth and expected changes in its composition, estimated prepayments in accordance with projected interest rates, pricing and maturity expectations on new volumes and other non-interest related data. It is a dynamic process, emphasizing future performance under diverse economic conditions.
Management assesses interest rate risk by comparing various net interest income simulations under different interest rate scenarios that differ in direction of interest rate changes, the degree of change over time, the speed of change and the projected shape of the yield curve. For example, the types of rate scenarios processed during the year included economic most likely scenarios, flat rates, yield curve twists, + 200 and + 400 basis points parallel ramps and + 200 and + 400 basis points parallel shocks. Given the fact that at December 31, 2013, some market interest rates were close to zero, management has focused on measuring the risk on net interest income in rising rate scenarios. Management also performs analyses to isolate and measure basis and prepayment risk exposures.
The asset and liability management group performs validation procedures on various assumptions used as part of the sensitivity analysis as well as validations of results on a monthly basis. In addition, the model and processes used to assess IRR are subject to third-party validations according to the guidelines established in the Model Governance and Validation policy. Due to the importance of critical assumptions in measuring market risk, the risk models incorporate third-party developed data for critical assumptions such as prepayment speeds on mortgage loans and mortgage-backed securities, estimates on the duration of the Corporation’s deposits and interest rate scenarios. These interest rate simulations exclude the impact on loans accounted pursuant to ASC Subtopic 310-30, whose yields are based on management’s current expectation of future cash flows.
The Corporation processes net interest income simulations under interest rate scenarios in which the yield curve is assumed to rise and decline gradually by the same amount. The rising rate scenarios considered in these market risk simulations reflect gradual parallel changes of 200 and 400 basis points during the twelve-month period ending December 31, 2013. Under a 200 basis points rising rate scenario, 2014 projected net interest income increases by $33 million, while under a 400 basis points rising rate scenario, 2013 projected net interest income increases by $54 million. These scenarios were compared against the Corporation’s flat or unchanged interest rates forecast scenario. Simulation analyses are based on many assumptions, including relative levels of market interest rates, interest rate spreads, loan prepayments and deposit decay. Thus, they should not be relied upon as indicative of actual results. Further, the estimates do not contemplate actions that management could take to respond to changes in interest rates. By their nature, these forward-looking computations are only estimates and may be different from what may actually occur in the future.
62
Static gap analysis measures the volume of assets and liabilities maturing or repricing at a future point in time. Static gap reports stratify all of the Corporation’s assets, liabilities and off-balance sheet positions according to the instrument’s maturity, repricing characteristics and optionality, assuming no new business. The repricing volumes typically include adjustments for anticipated future asset prepayments and for differences in sensitivity to market rates. The volume of assets and liabilities repricing during future periods, particularly within one year, is used as one short-term indicator of IRR. Depending on the duration and repricing characteristics, changes in interest rates could either increase or decrease the level of net interest income. For any given period, the pricing structure of the assets and liabilities is generally matched when an equal amount of such assets and liabilities mature or reprice in that period. Any mismatch of interest earning assets and interest bearing liabilities is known as a gap position. A positive gap denotes asset sensitivity, which means that an increase in interest rates could have a positive effect on net interest income, while a decrease in interest rates could have a negative effect on net interest income. As shown in Table 30, at December 31, 2013, the Corporation’s one-year cumulative positive gap was $3.7 billion, or 11.8% of total earning assets. This compares with $2.7 billion or 8.6%, respectively, at December 31, 2012. The change in the one-year cumulative gap position was influenced by a lower level of short-term borrowings that resulted mainly from cash inflows and lower volume of assets and higher level of capital from operations. These static measurements do not reflect the results of any projected activity and are best used as early indicators of potential interest rate exposures. They do not incorporate possible actions that could be taken to manage the Corporation’s IRR, nor do they capture the basis risks that might be included within the cumulative gap, given possible changes in the spreads between asset rates and the rates used to fund them.
Table 30 - Interest Rate Sensitivity
| | | | | | | | | | | | | | | | | | | | | | | | | | | | | | | | | | | | |
| | | At December 31, 2013 | |
| |
| | | By repricing dates | |
| |
| | | | | | | | | |
| (Dollars in thousands) | | 0-30 days | | | Within 31 - 90 days | | | After three months but within six months | | | After six months but within nine months | | | After nine months but within one year | | | After one year but within two years | | | After two years | | | Non-interest bearing funds | | | Total | |
| |
Assets: | | | | | | | | | | | | | | | | | | | | | | | | | | | | | | | | | | | | |
Money market investments | | $ | 843,945 | $ | | | 14,408 | $ | | | - | $ | | | 100 | $ | | | - | $ | | | - | $ | | | - | $ | | | - | $ | | | 858,453 | |
Investment and trading securities | | | 185,488 | | | | 571,744 | | | | 720,312 | | | | 283,835 | | | | 253,313 | | | | 918,450 | $ | | | 3,023,649 | | | | - | | | | 5,956,791 | |
Loans | | | 7,751,843 | | | | 933,747 | | | | 908,310 | | | | 817,945 | | | | 820,646 | | | | 2,605,583 | | | | 10,868,645 | | | | - | | | | 24,706,719 | |
Other assets | | | - | | | | - | | | | - | | | | - | | | | - | | | | - | | | | - | | | | 4,227,370 | | | | 4,227,370 | |
| |
Total | | | 8,781,276 | | | | 1,519,899 | | | | 1,628,622 | | | | 1,101,880 | | | | 1,073,959 | | | | 3,524,033 | | | | 13,892,294 | | | | 4,227,370 | | | | 35,749,333 | |
| |
Liabilities and stockholders’ equity: | | | | | | | | | | | | | | | | | | | | | | | | | | | | | | | | | | | | |
Savings, NOW and money market and other interest bearing demand deposits | | | 3,255,325 | | | | 7 | | | | 30 | | | | - | | | | 277 | | | | 109 | | | | 9,221,363 | | | | - | | | | 12,477,111 | |
Certificates of deposit | | | 1,484,022 | | | | 1,226,176 | | | | 1,408,655 | | | | 934,917 | | | | 611,503 | | | | 1,346,964 | | | | 1,299,115 | | | | - | | | | 8,311,352 | |
Federal funds purchased and assets sold under agreements to repurchase | | | 786,834 | | | | 157,486 | | | | - | | | | - | | | | - | | | | 146,911 | | | | 568,061 | | | | - | | | | 1,659,292 | |
Other short-term borrowings | | | 401,200 | | | | - | | | | - | | | | - | | | | - | | | | - | | | | - | | | | - | | | | 401,200 | |
Notes payable | | | 10,070 | | | | 100,140 | | | | 210 | | | | 213 | | | | 16,680 | | | | 29,040 | | | | 1,428,401 | | | | - | | | | 1,584,754 | |
Non-interest bearing deposits | | | - | | | | - | | | | - | | | | - | | | | - | | | | - | | | | - | | | | 5,922,682 | | | | 5,922,682 | |
Other non-interest bearing liabilities | | | - | | | | - | | | | - | | | | - | | | | - | | | | - | | | | - | | | | 766,792 | | | | 766,792 | |
Stockholders’ equity | | | - | | | | - | | | | - | | | | - | | | | - | | | | - | | | | - | | | | 4,626,150 | | | | 4,626,150 | |
| |
Total | | $ | 5,937,451 | $ | | | 1,483,809 | $ | | | 1,408,895 | $ | | | 935,130 | $ | | | 628,460 | $ | | | 1,523,024 | $ | | | 12,516,940 | $ | | | 11,315,624 | $ | | | 35,749,333 | |
| |
Interest rate sensitive gap | | | 2,843,825 | | | | 36,090 | | | | 219,727 | | | | 166,750 | | | | 445,499 | | | | 2,001,009 | | | | 1,375,354 | | | | (7,088,254 | ) | | | - | |
Cumulative interest rate sensitive gap | | | 2,843,825 | | | | 2,879,915 | | | | 3,099,642 | | | | 3,266,392 | | | | 3,711,891 | | | | 5,712,900 | | | | 7,088,254 | | | | - | | | | - | |
Cumulative interest rate sensitive gap to earning assets | | | 9.02 | % | | | 9.14 | % | | | 9.83 | % | | | 10.36 | % | | | 11.78 | % | | | 18.12 | % | | | 22.49 | % | | | - | | | | - | |
| |
The Corporation estimates the sensitivity of economic value of equity (“EVE”) to changes in interest rates. EVE is equal to the estimated present value of the Corporation’s assets minus the estimated present value of the liabilities. This sensitivity analysis is a useful tool to measure long-term IRR because it captures the impact of up or down rate changes in expected cash flows, including principal and interest, from all future periods.
63
EVE sensitivity calculated using interest rate shock scenarios is estimated on a quarterly basis. The shock scenarios consist of a +/- 200 and 400 basis points parallel shocks. Management has defined limits for the increases / decreases in EVE sensitivity resulting from the shock scenarios.
The Corporation maintains an overall interest rate risk management strategy that incorporates the use of derivative instruments to minimize significant unplanned fluctuations in net interest income or market value that are caused by interest rate volatility. The market value of these derivatives is subject to interest rate fluctuations and counterparty credit risk adjustments which could have a positive or negative effect in the Corporation’s earnings.
The Corporation’s loan and investment portfolios are subject to prepayment risk, which results from the ability of a third-party to repay debt obligations prior to maturity. Prepayment risk also could have a significant impact on the duration of mortgage-backed securities and collateralized mortgage obligations, since prepayments could shorten (or lower prepayments could extend) the weighted average life of these portfolios. Table 31, which presents the maturity distribution of earning assets, takes into consideration prepayment assumptions.
Table 31 - Maturity Distribution of Earning Assets
| | | | | | | | | | | | | | | | | | | | | | | | |
| | | As of December 31, 2013 | |
| | | | | | | | |
| | | Maturities | |
| | | | | | | | |
| | | | | |
| | | | | | After one year | | | | | | | | | | |
| | | | | | through five years | | | After five years | | | | | | | |
| | | | | | | | | | | | |
| | | | | | |
| | | One year | | | Fixed | | | Variable | | | Fixed interest | | | Variable interest | | | | |
| | | | | | |
| (In thousands) | | or less | | | interest rates | | | interest rates | | | rates | | | rates | | | Total | |
| |
| | | | | | |
Money market securities | | $ | 858,453 | | | | - | | | | - | | | | - | | | | - | | | $ | 858,453 | |
| | | | | | |
Investment and trading securities | | | 1,860,914 | | | $ | 2,061,930 | | | $ | 108,379 | | | $ | 1,677,589 | | | $ | 62,111 | | | | 5,770,923 | |
| | | | | | |
Loans: | | | | | | | | | | | | | | | | | | | | | | | | |
| | | | | | |
Commercial | | | 3,632,773 | | | | 1,955,091 | | | | 2,657,250 | | | | 807,725 | | | | 1,184,872 | | | | 10,237,711 | |
| | | | | | |
Construction | | | 116,245 | | | | 35,269 | | | | 30,038 | | | | 25,926 | | | | 6,817 | | | | 214,295 | |
| | | | | | |
Lease financing | | | 194,710 | | | | 349,509 | | | | - | | | | 2,543 | | | | - | | | | 546,762 | |
| | | | | | |
Consumer | | | 2,014,095 | | | | 1,348,707 | | | | 291,502 | | | | 71,462 | | | | 206,460 | | | | 3,932,226 | |
| | | | | | |
Mortgage | | | 1,045,500 | | | | 1,793,375 | | | | 433,283 | | | | 3,064,996 | | | | 454,144 | | | | 6,791,298 | |
| |
| | | | | | |
Total non-covered loans | | | 7,003,323 | | | | 5,481,951 | | | | 3,412,073 | | | | 3,972,652 | | | | 1,852,293 | | | | 21,722,292 | |
| | | | | | |
Covered loans under FDIC loss sharing agreements | | | 1,513,680 | | | | 460,281 | | | | 397,560 | | | | 477,781 | | | | 135,125 | | | | 2,984,427 | |
| |
| | | | | | |
| | $ | 11,236,370 | | | $ | 8,004,162 | | | $ | 3,918,012 | | | $ | 6,128,022 | | | $ | 2,049,529 | | | $ | 31,336,095 | |
| |
| | |
Note: | | Equity securities available-for-sale and other investment securities, including Federal Reserve Bank stock and Federal Home Loan Bank stock held by the Corporation, are not included in this table. |
| | Loans held-for-sale have been allocated according to the expected sale date. |
Covered loans
The loans acquired in the Westernbank FDIC-assisted transaction were initially recorded at estimated fair values. As expressed in the Critical Accounting Policies / Estimates section of this MD&A, most of the covered loans have an accretable yield. The accretable yield includes the future interest expected to be collected over the remaining life of the acquired loans and the purchase premium or discount. The remaining life includes the effects of estimated prepayments and expected credit losses. For covered loans accounted for under ASC Subtopic 310-30, the Corporation is required to periodically evaluate its estimate of cash flows expected to be collected. These evaluations, performed quarterly, require the continued usage of key assumptions and estimates. Management must apply judgment to develop its estimates of cash flows for those covered loans given the impact of home price and property value changes, changes in interest rates and loss severities and prepayment speeds. Decreases in the expected cash
64
flows by pool will generally result in a charge to the provision for credit losses resulting in an increase to the allowance for loan losses, while increases in the expected cash flows of a pool will generally result in an increase in interest income over the remaining life of the loan, or pool of loans.
Trading
The Corporation engages in trading activities in the ordinary course of business at its subsidiaries, Banco Popular de Puerto Rico (“BPPR”) and Popular Securities. Popular Securities’ trading activities consist primarily of market-making activities to meet expected customers’ needs related to its retail brokerage business and purchases and sales of U.S. Government and government sponsored securities with the objective of realizing gains from expected short-term price movements. BPPR’s trading activities consist primarily of holding U.S. Government sponsored mortgage-backed securities classified as “trading” and hedging the related market risk with “TBA” (to-be-announced) market transactions. The objective is to derive spread income from the portfolio and not to benefit from short-term market movements. In addition, BPPR uses forward contracts or TBAs to hedge its securitization pipeline. Risks related to variations in interest rates and market volatility are hedged with TBAs that have characteristics similar to that of the forecasted security and its conversion timeline.
At December 31, 2013, the Corporation held trading securities with a fair value of $340 million, representing approximately 1.0% of the Corporation’s total assets, compared with $315 million and 0.9% at December 31, 2012. As shown in Table 32, the trading portfolio consists principally of mortgage-backed securities relating to BPPR’s mortgage activities described above, which at December 31, 2013 were investment grade securities. As of December 31, 2013, the trading portfolio also included $11.1 million in Puerto Rico government obligations and shares of Closed-end funds that invest primarily in Puerto Rico government obligations (December 31, 2012 - $33.7 million). Trading instruments are recognized at fair value, with changes resulting from fluctuations in market prices, interest rates or exchange rates reported in current period earnings. The Corporation recognized a net trading account loss of $13.5 million for the year ended December 31, 2013, compared with a gain of $4.5 million for 2012. Table 32 provides the composition of the trading portfolio at December 31, 2013 and December 31, 2012.
Table 32 - Trading Portfolio
| | | | | | | | | | | | | | | | |
| | | December 31, 2013 | | | December 31, 2012 | |
| |
| | | | |
| (Dollars in thousands) | | Amount | | | Weighted Average Yield [1] | | | Amount | | | Weighted Average Yield [1] | |
| |
| | | | |
Mortgage-backed securities | | $ | 312,751 | | | | 4.90 % | | | $ | 262,863 | | | | 4.64 % | |
| | | | |
Collateralized mortgage obligations | | | 1,849 | | | | 4.75 | | | | 3,117 | | | | 4.57 | |
| | | | |
Commercial paper | | | - | | | | - | | | | 1,778 | | | | 5.05 | |
| | | | |
Puerto Rico obligations | | | 7,586 | | | | 5.15 | | | | 24,801 | | | | 4.74 | |
| | | | |
Interest-only strips | | | 915 | | | | 12.01 | | | | 1,136 | | | | 11.40 | |
| | | | |
Other (includes related trading derivatives) | | | 16,642 | | | | 3.14 | | | | 20,830 | | | | 4.07 | |
| |
| | | | |
Total | | $ | 339,743 | | | | 4.84 % | | | $ | 314,525 | | | | 4.64 % | |
| |
[1] Not on a taxable equivalent basis. | | | | | | | | | | | | | | | | |
| |
The Corporation’s trading activities are limited by internal policies. For each of the two subsidiaries, the market risk assumed under trading activities is measured by the 5-day net value-at-risk (“VAR”), with a confidence level of 99%. The VAR measures the maximum estimated loss that may occur over a 5-day holding period, given a 99% probability. Under the Corporation’s current policies, trading exposures cannot exceed 2% of the trading portfolio market value of each subsidiary, subject to a cap.
The Corporation’s trading portfolio had a 5-day VAR of approximately $2.1 million, assuming a confidence level of 99%, for the last week in December 2013. There are numerous assumptions and estimates associated with VAR modeling, and actual results could differ from these assumptions and estimates. Backtesting is performed to compare actual results against maximum estimated losses, in order to evaluate model and assumptions accuracy.
In the opinion of management, the size and composition of the trading portfolio does not represent a significant source of market risk for the Corporation.
65
Derivatives
Derivatives are used by the Corporation as part of its overall interest rate risk management strategy to minimize significant unexpected fluctuations in earnings and cash flows that are caused by fluctuations in interest rates. Derivative instruments that the Corporation may use include, among others, interest rate swaps, caps, floors, indexed options, and forward contracts. The Corporation does not use highly leveraged derivative instruments in its interest rate risk management strategy. The Corporation enters into interest rate swaps, interest rate caps and foreign exchange contracts for the benefit of commercial customers. Credit risk embedded in these transactions is reduced by requiring appropriate collateral from counterparties and entering into netting agreements whenever possible. All outstanding derivatives are recognized in the Corporation’s consolidated statement of condition at their fair value. Refer to Note 30 to the consolidated financial statements for further information on the Corporation’s involvement in derivative instruments and hedging activities.
The Corporation’s derivative activities are entered primarily to offset the impact of market volatility on the economic value of assets or liabilities. The net effect on the market value of potential changes in interest rates of derivatives and other financial instruments is analyzed. The effectiveness of these hedges is monitored to ascertain that the Corporation is reducing market risk as expected. Derivative transactions are generally executed with instruments with a high correlation to the hedged asset or liability. The underlying index or instrument of the derivatives used by the Corporation is selected based on its similarity to the asset or liability being hedged. As a result of interest rate fluctuations, fixed and variable interest rate hedged assets and liabilities will appreciate or depreciate in fair value. The effect of this unrealized appreciation or depreciation is expected to be substantially offset by the Corporation’s gains or losses on the derivative instruments that are linked to these hedged assets and liabilities. Management will assess if circumstances warrant liquidating or replacing the derivatives position in the hypothetical event that high correlation is reduced. Based on the Corporation’s derivative instruments outstanding at December 31, 2013, it is not anticipated that such a scenario would have a material impact on the Corporation’s financial condition or results of operations.
Certain derivative contracts also present credit risk and liquidity risk because the counterparties may not comply with the terms of the contract, or the collateral obtained might be illiquid or become so. The Corporation controls credit risk through approvals, limits and monitoring procedures, and through master netting and collateral agreements whenever possible. Further, as applicable under the terms of the master agreements, the Corporation may obtain collateral, where appropriate, to reduce credit risk. The credit risk attributed to the counterparty’s nonperformance risk is incorporated in the fair value of the derivatives. Additionally, as required by the fair value measurements guidance, the fair value of the Corporation’s own credit standing is considered in the fair value of the derivative liabilities. During the year ended December 31, 2013, inclusion of the credit risk in the fair value of the derivatives resulted in a net gain of $1.5 million (2012 – net gain of $2.9 million; 2011 – net loss of $0.6 million), which consisted of a gain of $0.5 million (2012 – loss of $ 0.5 million; 2011 – gain of $ 1.1 million) resulting from the Corporation’s credit standing adjustment and a gain of $1.0 million (2012 – gain of $3.4 million; 2011 – loss of $1.7 million) from the assessment of the counterparties’ credit risk. At December 31, 2013, the Corporation had $19 million (2012 - $ 46 million) recognized for the right to reclaim cash collateral posted. On the other hand, the Corporation did not have any obligation to return cash collateral received at December 31, 2013 (2012 - $ 1 million).
The Corporation performs appropriate due diligence and monitors the financial condition of counterparties that represent a significant volume of credit exposure. Additionally, the Corporation has exposure limits to prevent any undue funding exposure.
Cash Flow Hedges
The Corporation manages the variability of cash payments due to interest rate fluctuations by the effective use of derivatives designated as cash flow hedges and that are linked to specified hedged assets and liabilities. The cash flow hedges relate to forward contracts or “to be announced” (“TBA”) mortgage-backed securities that are sold and bought for future settlement to hedge mortgage-backed securities and loans prior to securitization. The seller agrees to deliver on a specified future date a specified instrument at a specified price or yield. These securities are hedging a forecasted transaction and are designated for cash flow hedge accounting. The Corporation did not have any derivative that qualified to be accounted for as cash flow hedges outstanding at December 31, 2013 (2012 - $ 281 million in notional amount).
Refer to Note 30 to the consolidated financial statements for additional quantitative information on these derivative contracts.
66
Fair Value Hedges
The Corporation did not have any derivatives designated as fair value hedges during the years ended December 31, 2013 and 2012.
Trading and Non-Hedging Derivative Activities
The Corporation enters into derivative positions based on market expectations or to benefit from price differentials between financial instruments and markets mostly to economically hedge a related asset or liability. The Corporation also enters into various derivatives to provide these types of derivative products to customers. These free-standing derivatives are carried at fair value with changes in fair value recorded as part of the results of operations for the period.
Following is a description of the most significant of the Corporation’s derivative activities that are not designated for hedge accounting. Refer to Note 30 to the consolidated financial statements for additional quantitative and qualitative information on these derivative instruments.
At December 31, 2013, the Corporation had outstanding $ 283 million (2012- $ 767 million) in notional amount of interest rate swap agreements with a net negative fair value of $2 million (2012 – net negative fair value of $3 million), which were not designated as accounting hedges. These swaps were entered in the Corporation’s capacity as an intermediary on behalf of its customers and their offsetting swap position.
For the year ended December 31, 2013, the impact of the mark-to-market of interest rate swaps not designated as accounting hedges was a net increase in earnings of approximately $ 1.0 million, recorded in the other operating income category of the consolidated statement of operations, compared with an earnings reduction of approximately $ 3.0 million and $ 1.4 million, in 2012 and in 2011 respectively.
At December 31, 2013, the Corporation had forward contracts with a notional amount of $ 282 million (2012 - $ 53 million) and a net negative fair value of $ 696 thousand (2012 - net negative fair value of $ 8 thousand) not designated as accounting hedges. These forward contracts are considered derivatives and are recorded at fair value. Subsequent changes in the value of these forward contracts are recorded in the consolidated statement of operations. For the year ended December 31, 2013, the impact of the mark-to-market of the forward contracts not designated as accounting hedges was a reduction to non-interest income of $ 9.0 million (2012 - loss of $ 8.0 million; 2011 - loss of $ 32.5 million), which was included in the category of mortgage banking activities in the consolidated statement of operations. The increase in 2013 was mainly attributable to forward contracts that generally are designated as cash flow hedges did not qualify for hedge accounting designation.
Furthermore, the Corporation has over-the-counter option contracts which are utilized in order to limit the Corporation’s exposure on customer deposits whose returns are tied to the S&P 500 or to certain other equity securities or commodity indexes. The Corporation offers certificates of deposit with returns linked to these indexes to its retail customers, principally in connection with individual retirement accounts (IRAs), and certificates of deposit. At December 31, 2013, these deposits amounted to $ 83 million (2012 - $ 84 million), or less than 1% (2012 – less than 1%) of the Corporation’s total deposits. In these certificates, the customer’s principal is guaranteed by the Corporation and insured by the FDIC to the maximum extent permitted by law. The instruments pay a return based on the increase of these indexes, as applicable, during the term of the instrument. Accordingly, this product gives customers the opportunity to invest in a product that protects the principal invested but allows the customer the potential to earn a return based on the performance of the indexes.
The risk of issuing certificates of deposit with returns tied to the applicable indexes is economically hedged by the Corporation. BPPR and BPNA purchase indexed options from financial institutions with strong credit standings, whose return is designed to match the return payable on the certificates of deposit issued by these banking subsidiaries. By hedging the risk in this manner, the effective cost of these deposits is fixed. The contracts have a maturity and an index equal to the terms of the pool of retail deposits that they are economically hedging.
The purchased option contracts are initially accounted for at cost (i.e., amount of premium paid) and recorded as a derivative asset. The derivative asset is marked-to-market on a quarterly basis with changes in fair value charged to earnings. The deposits are hybrid instruments containing embedded options that must be bifurcated in accordance with the derivatives and hedging activities guidance. The initial value of the embedded option (component of the deposit contract that pays a return based on changes in the
67
applicable indexes) is bifurcated from the related certificate of deposit and is initially recorded as a derivative liability and a corresponding discount on the certificate of deposit is recorded. Subsequently, the discount on the deposit is accreted and included as part of interest expense while the bifurcated option is marked-to-market with changes in fair value charged to earnings.
The purchased indexed options are used to economically hedge the bifurcated embedded option. These option contracts do not qualify for hedge accounting, and therefore, cannot be designated as accounting hedges. At December 31, 2013, the notional amount of the indexed options on deposits approximated $ 86 million (2012 - $ 86 million) with a fair value of $ 20 million (asset) (2012 - $ 14 million) while the embedded options had a notional value of $ 83 million (2012 - $ 84 million) with a fair value of $ 16 million (liability) (2012 - $ 11 million).
Refer to Note 30 to the consolidated financial statements for a description of other non-hedging derivative activities utilized by the Corporation during 2013 and 2012.
Foreign Exchange
The Corporation holds an interest in Centro Financiero BHD, S.A. (“BHD”) in the Dominican Republic, which is an investment accounted for under the equity method. The Corporation’s carrying value of the equity interest in BHD approximated $84 million at December 31, 2013. This business is conducted in the country’s foreign currency. The resulting foreign currency translation adjustment, from operations for which the functional currency is other than the U.S. dollar, is reported in accumulated other comprehensive loss in the consolidated statements of condition, except for highly-inflationary environments in which the effects would be included in the consolidated statements of operations. At December 31, 2013, the Corporation had approximately $36 million in an unfavorable foreign currency translation adjustment as part of accumulated other comprehensive loss, compared with an unfavorable adjustment of $31 million at December 31, 2012 and $29 million at December 31, 2011.
Additionally, during 2013, the Corporation sold its investment in Tarjetas y Transacciones en Red Tranred, C.A. (formerly EVERTEC DE VENEZUELA, C.A.) which was written-down during 2011 as the Corporation determined to wind-down those operations.
Liquidity
The objective of effective liquidity management is to ensure that the Corporation has sufficient liquidity to meet all of its financial obligations, finance expected future growth and maintain a reasonable safety margin for cash commitments under both normal and stressed market conditions. The Board is responsible for establishing the Corporation’s tolerance for liquidity risk, including approving relevant risk limits and policies. The Board has delegated the monitoring of these risks to the RMC and the ALCO. The management of liquidity risk, on a long-term and day-to-day basis, is the responsibility of the Corporate Treasury Division. The Corporation’s Corporate Treasurer is responsible for implementing the policies and procedures approved by the Board and for monitoring the Corporation’s liquidity position on an ongoing basis. Also, the Corporate Treasury Division coordinates corporate wide liquidity management strategies and activities with the reportable segments, oversees policy breaches and manages the escalation process. The Financial and Operational Risk Management Division is responsible for the independent monitoring and reporting of adherence with established policies.
An institution’s liquidity may be pressured if, for example, its credit rating is downgraded, it experiences a sudden and unexpected substantial cash outflow, or some other event causes counterparties to avoid exposure to the institution. Factors that the Corporation does not control, such as the economic outlook, adverse ratings of its principal markets and regulatory changes, could also affect its ability to obtain funding.
Liquidity is managed by the Corporation at the level of the holding companies that own the banking and non-banking subsidiaries. It is also managed at the level of the banking and non-banking subsidiaries. The Corporation has adopted policies and limits to monitor more effectively the Corporation’s liquidity position and that of the banking subsidiaries. Additionally, contingency funding plans are used to model various stress events of different magnitudes and affecting different time horizons that assist management in evaluating the size of the liquidity buffers needed if those stress events occur. However, such models may not predict accurately how the market and customers might react to every event, and are dependent on many assumptions.
Deposits, including customer deposits, brokered deposits, and public funds deposits, continue to be the most significant source of funds for the Corporation, funding 75% of the Corporation’s total assets at December 31, 2013, compared with 74% at December 31,
68
2012 and 75% at December 31, 2011. The ratio of total ending loans to deposits was 93% at December 31, 2013 and December 31, 2012, compared with 91% at the same date in 2011. In addition to traditional deposits, the Corporation maintains borrowing arrangements. At December 31, 2013, these borrowings consisted primarily of $1.7 billion in assets sold under agreement to repurchase, $989 million in advances with the FHLB, $971 million in junior subordinated deferrable interest debentures (net of discount of $404 million) and $689 thousand in term notes. A detailed description of the Corporation’s borrowings, including their terms, is included in Notes 19 to 21 to the consolidated financial statements. Also, the consolidated statements of cash flows in the accompanying consolidated financial statements provide information on the Corporation’s cash inflows and outflows.
During 2013, the Corporation’s liquidity position remained strong. The Corporation executed several strategies to deploy excess liquidity at its banking subsidiaries and improve the Corporation’s net interest margin. During the third quarter of 2013, the Corporation prepaid $233.2 million in senior notes at Popular North America, which resulted in cost savings and improvements in net interest margin. Also, the Corporation generated net cash proceeds of $585 million as a result of its sale of shares of EVERTEC during 2013, as further discussed below.
The following sections provide further information on the Corporation’s major funding activities and needs, as well as the risks involved in these activities. A detailed description of the Corporation’s borrowings and available lines of credit, including its terms, is included in Notes 19 to 21 to the consolidated financial statements. Also, the consolidated statements of cash flows in the accompanying consolidated financial statements provide information on the Corporation’s cash inflows and outflows.
Banking Subsidiaries
Primary sources of funding for the Corporation’s banking subsidiaries (BPPR and BPNA), or “the banking subsidiaries,” include retail and commercial deposits, brokered deposits, unpledged investment securities, and, to a lesser extent, loan sales. In addition, the Corporation maintains borrowing facilities with the FHLB and at the discount window of the Fed, and has a considerable amount of collateral pledged that can be used to quickly raise funds under these facilities.
The principal uses of funds for the banking subsidiaries include loan originations, investment portfolio purchases, loan purchases and repurchases, repayment of outstanding obligations (including deposits), and operational expenses. Also, the banking subsidiaries assume liquidity risk related to collateral posting requirements for certain activities mainly in connection with contractual commitments, recourse provisions, servicing advances, derivatives, credit card licensing agreements and support to several mutual funds administered by BPPR.
Note 45 to the consolidated financial statements provides a consolidating statement of cash flows which includes the Corporation’s banking subsidiaries as part of the “All other subsidiaries and eliminations” column.
The banking subsidiaries maintain sufficient funding capacity to address large increases in funding requirements such as deposit outflows. This capacity is comprised mainly of available liquidity derived from secured funding sources, as well as on-balance sheet liquidity in the form of cash balances maintained at the Fed and unused secured lines held at the Fed and FHLB, in addition to liquid unpledged securities. The Corporation has established liquidity guidelines that require the banking subsidiaries to have sufficient liquidity to cover all short-term borrowings and a portion of deposits.
The Corporation’s ability to compete successfully in the marketplace for deposits, excluding brokered deposits, depends on various factors, including pricing, service, convenience and financial stability as reflected by operating results, credit ratings (by nationally recognized credit rating agencies), and importantly, FDIC deposit insurance. Although a downgrade in the credit ratings of the Corporation’s banking subsidiaries may impact their ability to raise retail and commercial deposits or the rate that it is required to pay on such deposits, management does not believe that the impact should be material. Deposits at all of the Corporation’s banking subsidiaries are federally insured (subject to FDIC limits) and this is expected to mitigate the potential effect of a downgrade in the credit ratings.
Deposits are a key source of funding as they tend to be less volatile than institutional borrowings and their cost is less sensitive to changes in market rates. Refer to Table 20 for a breakdown of deposits by major types. Core deposits are generated from a large base of consumer, corporate and institutional customers. Core deposits include all non-interest bearing deposits, savings deposits and certificates of deposit under $100,000, excluding brokered deposits with denominations under $100,000. Core deposits have historically provided the Corporation with a sizable source of relatively stable and low-cost funds. Core deposits totaled $21.9 billion, or 82% of total deposits, at December 31, 2013, compared with $21.8 billion, or 81% of total deposits, at December 31, 2012. Core deposits financed 70% of the Corporation’s earning assets at December 31, 2013, compared with 68% at December 31, 2012.
69
Certificates of deposit with denominations of $100,000 and over at December 31, 2013 and December 31, 2012 totaled $3.2 billion, or 12% of total deposits. Their distribution by maturity at December 31, 2013 is presented in the table that follows.
Table 33 - Distribution by Maturity of Certificate of Deposits of $100,000 and Over
| | | | |
| (In thousands) | | | |
| |
| |
3 months or less | | $ | 1,330,303 | |
| |
3 to 6 months | | | 446,605 | |
| |
6 to 12 months | | | 654,024 | |
| |
Over 12 months | | | 778,709 | |
| |
| |
Total | | $ | 3,209,641 | |
| |
Average deposits, including brokered deposits, for the years ended December 31, 2013 and 2012 represented 85% of average earning assets, compared with 84% for the year ended December 31, 2011. Table 34 summarizes average deposits for the past five years.
Table 34 - Average Total Deposits
| | | | | | | | | | | | | | | | | | | | |
| | | For the years ended December 31, | |
| |
| | | | | |
| (In thousands) | | 2013 | | | 2012 | | | 2011 | | | 2010 | | | 2009 | |
| |
| | | | | |
Non-interest bearing demand deposits | | $ | 5,728,228 | | | $ | 5,356,649 | | | $ | 5,058,424 | | | $ | 4,732,132 | | | $ | 4,293,285 | |
| |
| | | | | |
Savings accounts | | | 6,792,137 | | | | 6,571,133 | | | | 6,320,825 | | | | 5,970,000 | | | | 5,538,077 | |
| |
| | | | | |
NOW, money market and other interest bearing demand accounts | | | 5,738,189 | | | | 5,555,203 | | | | 5,204,235 | | | | 4,981,332 | | | | 4,804,023 | |
| |
| | | | | |
Certificates of deposit: | | | | | | | | | | | | | | | | | | | | |
| | | | | |
Under $100,000 | | | 4,817,831 | | | | 5,276,389 | | | | 5,966,089 | | | | 6,099,741 | | | | 7,166,756 | |
| | | | | |
$100,000 and over | | | 2,995,175 | | | | 3,375,846 | | | | 4,026,042 | | | | 4,073,047 | | | | 4,214,125 | |
| |
| | | | | |
Certificates of deposit | | | 7,813,006 | | | | 8,652,235 | | | | 9,992,131 | | | | 10,172,788 | | | | 11,380,881 | |
| | | | | |
Other time deposits | | | 700,815 | | | | 768,713 | | | | 927,776 | | | | 794,245 | | | | 811,943 | |
| |
| | | | | |
Total interest bearing deposits | | | 21,044,147 | | | | 21,547,284 | | | | 22,444,967 | | | | 21,918,365 | | | | 22,534,924 | |
| |
| | | | | |
Total average deposits | | $ | 26,772,375 | | | $ | 26,903,933 | | | $ | 27,503,391 | | | $ | 26,650,497 | | | $ | 26,828,209 | |
| |
At December 31, 2013 and December 31, 2012, approximately 7% and 8%, respectively, of the Corporation’s assets were financed by brokered deposits. The Corporation had $2.4 billion in brokered deposits at December 31, 2013, compared with $2.8 billion at December 31, 2012. In the event that any of the Corporation’s banking subsidiaries’ regulatory capital ratios fall below those required by a well-capitalized institution or are subject to capital restrictions by the regulators, that banking subsidiary faces the risk of not being able to raise or maintain brokered deposits and faces limitations on the rate paid on deposits, which may hinder the Corporation’s ability to effectively compete in its retail markets and could affect its deposit raising efforts.
To the extent that the banking subsidiaries are unable to obtain sufficient liquidity through core deposits, the Corporation may meet its liquidity needs through short-term borrowings by pledging securities for borrowings under repurchase agreements, by pledging additional loans and securities through the available secured lending facilities, or by selling liquid assets. These measures are subject to availability of collateral.
The Corporation’s banking subsidiaries have the ability to borrow funds from the FHLB. At December 31, 2013 and December 31, 2012, the banking subsidiaries had credit facilities authorized with the FHLB aggregating to $3.0 billion and $2.8 billion, respectively, based on assets pledged with the FHLB at those dates. Outstanding borrowings under these credit facilities totaled $1.2 billion at December 31, 2013 and 2012. Such advances are collateralized by loans held-in-portfolio, do not have restrictive covenants and do not have any callable features. At December 31, 2013 the credit facilities authorized with the FHLB were collateralized by $4.5
70
billion in loans held-in-portfolio and $3.8 billion at December 31, 2012. Refer to Notes 20 and 21 to the consolidated financial statements for additional information on the terms of FHLB advances outstanding.
At December 31, 2013 and December 31, 2012, the Corporation’s borrowing capacity at the Fed’s Discount Window amounted to approximately $3.4 billion and $3.1 billion, respectively, which remained unused as of both dates. This facility is a collateralized source of credit that is highly reliable even under difficult market conditions. The amount available under this borrowing facility is dependent upon the balance of performing loans, securities pledged as collateral and the haircuts assigned to such collateral. At December 31, 2013 and December 31, 2012, this credit facility with the Fed was collateralized by $4.5 billion and $4.7 billion, respectively, in loans held-in-portfolio.
During 2013, Popular, Inc. the Corporation exchanged its interest in subordinated notes due from BPPR amounting to $185 million for additional common stock. No other capital contributions were made during the years ended December 31, 2013 and 2012, by the Corporation’s bank holding companies (Popular, Inc. (“PIHC”) and Popular North America, Inc. (“PNA”)), (“BHCs”) to BPNA and BPPR.
On July 25, 2011, PIHC and BPPR entered into a Memorandum of Understanding with the Federal Reserve Bank of New York and the Office of the Commissioner of Financial Institutions of Puerto Rico that requires the approval of these entities prior to the payment of any dividends by BPPR to PIHC. BPNA could not declare any dividends without the approval of the Federal Reserve Board.
At December 31, 2013, management believes that the banking subsidiaries had sufficient current and projected liquidity sources to meet their anticipated cash flow obligations, as well as special needs and off-balance sheet commitments, in the ordinary course of business and have sufficient liquidity resources to address a stress event. Although the banking subsidiaries have historically been able to replace maturing deposits and advances if desired, no assurance can be given that they would be able to replace those funds in the future if the Corporation’s financial condition or general market conditions were to deteriorate. The Corporation’s financial flexibility will be severely constrained if its banking subsidiaries are unable to maintain access to funding or if adequate financing is not available to accommodate future financing needs at acceptable interest rates. The banking subsidiaries also are required to deposit cash or qualifying securities to meet margin requirements. To the extent that the value of securities previously pledged as collateral declines because of market changes, the Corporation will be required to deposit additional cash or securities to meet its margin requirements, thereby adversely affecting its liquidity. Finally, if management is required to rely more heavily on more expensive funding sources to meet its future growth, revenues may not increase proportionately to cover costs. In this case, profitability would be adversely affected.
Westernbank FDIC-assisted Transaction and Impact on Liquidity
In the short-term, there may be a significant amount of the covered loans acquired in the FDIC-assisted transaction that will experience deterioration in payment performance, or will be determined to have inadequate collateral values to repay the loans. In such instances, the Corporation will likely no longer receive payments from the borrowers, which will impact cash flows. The loss sharing agreements will not fully offset the financial effects of such a situation. However, if a loan is subsequently charged-off or written down after the Corporation exhausts its best efforts at collection, the loss sharing agreements will cover 80% of the loss associated with the covered loans, offsetting most of any deterioration in the performance of the covered loans.
The effects of the loss sharing agreements on cash flows and operating results in the long-term will be similar to the short-term effects described above. The long-term effects that we may experience will depend primarily on the ability of the borrowers whose loans are covered by the loss sharing agreements to make payments over time. As the loss sharing agreements are in effect for a period of ten years for one-to-four family loans and five years for commercial, construction and consumer loans (with periods commencing on April 30, 2010), changing economic conditions will likely impact the timing of future charge-offs and the resulting reimbursements from the FDIC. Management believes that any recapture of interest income and recognition of cash flows from the borrowers or received from the FDIC on the claims filed may be recognized unevenly over this period, as management exhausts its collection efforts under the Corporation’s normal practices.
BPPR’s liquidity may also be impacted by the loan payment performance and timing of claims made and receipt of reimbursements under the FDIC loss sharing agreements. Please refer to the Legal Proceedings section of Note 28 to the consolidated financial statements and to Part II, Item 1A- Risk factors herein for a description of an ongoing contractual dispute between BPPR and the FDIC which has impacted the timing of the payment of claims under the loss share agreements.
Bank Holding Companies
71
The principal sources of funding for the holding companies include cash on hand, investment securities, dividends received from banking and non-banking subsidiaries (subject to regulatory limits and authorizations) asset sales, credit facilities available from affiliate banking subsidiaries and proceeds from potential securities offerings.
The principal use of these funds include the repayment of debt, and interest payments to holders of senior debt and junior subordinated deferrable interest (related to trust preferred securities) and capitalizing its banking subsidiaries. During 2013, Popular North America prepaid $233.2 million in senior notes, incurring $3.4 million in early cancellation payments. This resulted in cost savings and improvements in the Corporation’s net interest margin. During 2012, the main outflows of the holding companies were $128.1 million for interest on outstanding debt and $41.8 million for repayment at maturity of senior debt obligation.
During 2013 the Corporation participated as selling stockholder in the Initial Public Offering (“IPO”), completed on April 12, 2013, and subsequent offerings executed by EVERTEC during the third and fourth quarters. In connection with its IPO, EVERTEC refinanced its outstanding debt and Popular received payment in full for its portion of the EVERTEC debt held by it. As part of the offering completed during the fourth quarter, EVERTEC repurchased from the underwriters 3,690,036 shares of its common stock being sold by the selling stockholders in the offering, resulting in a reduction in its capital of approximately $75.0 million.
As a result of these transactions Popular recognized an after tax gain of $413 million, generated $585 million in net cash proceeds and retained a stake of 14.9% in EVERTEC, which has a book value of $19.9 million as of December 31, 2013. During 2013, PIHC received $4.4 million in dividends from EVERTEC’s parent company. During 2012, PIHC received net capital distributions of $155 million from the Corporation’s equity investment in EVERTEC’s parent company, which included $5 million in dividend distributions.
During 2012, there was a $50 million capital contribution from PIHC to PNA, as part of an internal reorganization.
Another use of liquidity at the parent holding company is the payment of dividends on preferred stock. At the end of 2010, the Corporation resumed paying dividends on its Series A and B preferred stock. The preferred stock dividends amounted to $3.7 million for the year ended December 31, 2013 and 2012. The preferred stock dividends paid were financed by issuing new shares of common stock to the participants of the Corporation’s qualified employee savings plans. The Corporation is required to obtain approval from the Fed prior to declaring or paying dividends, incurring, increasing or guaranteeing debt or making any distributions on its trust preferred securities or subordinated debt. The Corporation anticipates that any future preferred stock dividend payments would continue to be financed with the issuance of new common stock in connection with its qualified employee savings plans. The Corporation is not paying dividends to holders of its common stock.
The BHC’s have in the past borrowed in the money markets and in the corporate debt market primarily to finance their non-banking subsidiaries, however, the cash needs of the Corporation’s non-banking subsidiaries other than to repay indebtedness and interest are now minimal. These sources of funding have become more costly due to the reductions in the Corporation’s credit ratings. The Corporation’s principal credit ratings are below “investment grade” which affects the Corporation’s ability to raise funds in the capital markets. The Corporation has an open-ended, automatic shelf registration statement filed and effective with the Securities and Exchange Commission, which permits the Corporation to issue an unspecified amount of debt or equity securities.
Note 45 to the consolidated financial statements provides a statement of condition, of operations and of cash flows for the two BHC’s. The loans held-in-portfolio in such financial statements is principally associated with intercompany transactions.
The outstanding balance of notes payable at the BHC’s amounted to $972 million at December 31, 2013 and $1.2 billion at December 31, 2012. These borrowings are principally junior subordinated debentures (related to trust preferred securities), including those issued to the U.S. Treasury as part of the TARP, and unsecured senior debt (term notes). The repayment of the BHC’s obligations represents a potential cash need which is expected to be met with a combination of internal liquidity resources stemming mainly from future dividend receipts and new borrowings. Increasing or guaranteeing new debt would be subject to the approval of the Fed.
72
The contractual maturities of the BHC’s notes payable at December 31, 2013 are presented in Table 35.
Table 35 - Distribution of BHC’s Notes Payable by Contractual Maturity
| | | | |
| Year | | (In thousands) | |
| |
2014 | | $ | 675 | |
2015 | | | - | |
2016 | | | - | |
2017 | | | - | |
2018 | | | - | |
Later years | | | 439,800 | |
No stated maturity | | | 936,000 | |
| |
Sub-total | | | 1,376,475 | |
Less: Discount | | | 404,460 | |
| |
Total | | $ | 972,015 | |
| |
As indicated previously, the BHC did not issue new registered debt in the capital markets during the year ended December 31, 2013.
The BHCs liquidity position continues to be adequate with sufficient cash on hand, investments and other sources of liquidity which are expected to be enough to meet all BHCs obligations during the foreseeable future.
Non-banking subsidiaries
The principal sources of funding for the non-banking subsidiaries include internally generated cash flows from operations, loan sales, repurchase agreements, and borrowed funds from their direct parent companies or the holding companies. The principal uses of funds for the non-banking subsidiaries include repayment of maturing debt, operational expenses and payment of dividends to the BHCs. The liquidity needs of the non-banking subsidiaries are minimal since most of them are funded internally from operating cash flows or from intercompany borrowings from their holding companies, BPPR or BPNA.
Other Funding Sources and Capital
The investment securities portfolio provides an additional source of liquidity, which may be realized through either securities sales or repurchase agreements. The Corporation’s investment securities portfolio consists primarily of liquid U.S. government investment securities, sponsored U.S. agency securities, government sponsored mortgage-backed securities, and collateralized mortgage obligations that can be used to raise funds in the repo markets. At December 31, 2013, the investment and trading securities portfolios, as shown in Table 31, totaled $5.8 billion, of which $1.9 billion, or 32%, had maturities of one year or less. Mortgage-related investments in Table 31 are presented based on expected maturities, which may differ from contractual maturities, since they could be subject to prepayments. The availability of the repurchase agreement would be subject to having sufficient unpledged collateral available at the time the transactions are to be consummated, in addition to overall liquidity and risk appetite of the various counterparties. The Corporation’s unpledged investment and trading securities, excluding other investment securities, amounted to $2.5 billion at December 31, 2013 and $2.0 billion at December 31, 2012. A substantial portion of these securities could be used to raise financing quickly in the U.S. money markets or from secured lending sources.
Additional liquidity may be provided through loan maturities, prepayments and sales. The loan portfolio can also be used to obtain funding in the capital markets. In particular, mortgage loans and some types of consumer loans, have secondary markets which the Corporation could use. The maturity distribution of the total loan portfolio at December 31, 2013 is presented in Table 31. As of that date, $8.5 billion, or 34% of the loan portfolio was expected to mature within one year, compared with $9.3 billion or 37% of the loan portfolio in the previous year. The contractual maturities of loans have been adjusted to include prepayments based on historical data and prepayment trends.
Risks to Liquidity
Total lines of credit outstanding are not necessarily a measure of the total credit available on a continuing basis. Some of these lines could be subject to collateral requirements, standards of creditworthiness, leverage ratios and other regulatory requirements, among other factors. Derivatives, such as those embedded in long-term repurchase transactions or interest rate swaps, and off-balance sheet exposures, such as recourse, performance bonds or credit card arrangements, are subject to collateral requirements. As their fair value increases, the collateral requirements may increase, thereby reducing the balance of unpledged securities.
The importance of the Puerto Rico market for the Corporation is an additional risk factor that could affect its financing activities. In the case of a deterioration in economic conditions in Puerto Rico, the credit quality of the Corporation could be affected and result in
73
higher credit costs. The Puerto Rico economy continues to face various challenges, including significant pressures in some sectors of the residential real estate market. Refer to the Geographic and Government Risk section of this MD&A for some highlights on the current status of the Puerto Rico economy.
Factors that the Corporation does not control, such as the economic outlook and credit ratings of its principal markets and regulatory changes, could also affect its ability to obtain funding. In order to prepare for the possibility of such scenario, management has adopted contingency plans for raising financing under stress scenarios when important sources of funds that are usually fully available are temporarily unavailable. These plans call for using alternate funding mechanisms, such as the pledging of certain asset classes and accessing secured credit lines and loan facilities put in place with the FHLB and the Fed.
The credit ratings of Popular’s debt obligations are a relevant factor for liquidity because they impact the Corporation’s ability to borrow in the capital markets, its cost and access to funding sources. Credit ratings are based on the financial strength, credit quality and concentrations in the loan portfolio, the level and volatility of earnings, capital adequacy, the quality of management, the liquidity of the balance sheet, the availability of a significant base of core retail and commercial deposits, and the Corporation’s ability to access a broad array of wholesale funding sources, among other factors.
The Corporation’s banking subsidiaries have historically not used unsecured capital market borrowings to finance its operations, and therefore are less sensitive to the level and changes in the Corporation’s overall credit ratings. At the BHCs, the volume of capital market borrowings has declined substantially, as the non-banking lending businesses that it had historically funded have been shut down and the need to raise unsecured senior debt has been substantially reduced.
As indicated previously, the BHC’s did not issue new registered debt in the capital markets during the quarter ended December 31, 2013.
The BHC’s liquidity position continues to be adequate with sufficient cash on hand, investments and other sources of liquidity which are expected to be enough to meet all BHC’s obligations during the foreseeable future.
Obligations Subject to Rating Triggers or Collateral Requirements
The Corporation’s banking subsidiaries currently do not use borrowings that are rated by the major rating agencies, as these banking subsidiaries are funded primarily with deposits and secured borrowings. The banking subsidiaries had $19 million in deposits at December 31, 2013 that are subject to rating triggers.
Some of the Corporation’s derivative instruments include financial covenants tied to the bank’s well-capitalized status and certain formal regulatory actions. These agreements could require exposure collateralization, early termination or both. The fair value of derivative instruments in a liability position subject to financial covenants approximated $15 million at December 31, 2013, with the Corporation providing collateral totaling $19 million to cover the net liability position with counterparties on these derivative instruments.
In addition, certain mortgage servicing and custodial agreements that BPPR has with third parties include rating covenants. In the event of a credit rating downgrade, the third parties have the right to require the institution to engage a substitute cash custodian for escrow deposits and/or increase collateral levels securing the recourse obligations. Also, as discussed in the Guarantees section of this MD&A, the Corporation services residential mortgage loans subject to credit recourse provisions. Certain contractual agreements require the Corporation to post collateral to secure such recourse obligations if the institution’s required credit ratings are not maintained. Collateral pledged by the Corporation to secure recourse obligations amounted to approximately $120 million at December 31, 2013. The Corporation could be required to post additional collateral under the agreements. Management expects that it would be able to meet additional collateral requirements if and when needed. The requirements to post collateral under certain agreements or the loss of escrow deposits could reduce the Corporation’s liquidity resources and impact its operating results.
74
Credit Risk Management and Loan Quality
Credit risk occurs any time funds are advanced, committed, invested or otherwise exposed. Credit risk arises primarily from the Corporation’s lending activities, as well as from other on-balance sheet and off-balance sheet credit instruments. Credit risk management is based on analyzing the creditworthiness of the borrower or counterparty, the adequacy of underlying collateral given current events and conditions, and the existence and strength of any guarantor support.
Business activities that expose the Corporation to credit risk are managed within the Board’s established limits that consider factors, such as maintaining a prudent balance of risk-taking across diversified risk types and business units (compliance with regulatory guidance, considering factors such as concentrations and loan-to-value ratios), controlling the exposure to lower credit quality assets, and limiting growth in, and overall exposure to, any product or risk segment where the Corporation does not have sufficient experience and a proven ability to predict credit losses.
The significant changes in the economic conditions and the resulting changes in the borrower’s profile over the past several years requires the Corporation to continue to focus on the identification, monitoring and managing of its credit risk. The Corporation manages credit risk by maintaining sound underwriting standards, monitoring and evaluating loan portfolio quality, its trends and collectability, and assessing reserves and loan concentrations. Also, credit risk is mitigated by implementing and monitoring lending policies and collateral requirements, and instituting credit review procedures to ensure appropriate actions to comply with laws and regulations. The Corporation’s credit policies require prompt identification and quantification of asset quality deterioration or potential loss in order to ensure the adequacy of the allowance for loan losses. Included in these policies, primarily determined by the amount, type of loan and risk characteristics of the credit facility, are various approval levels and lending limit constraints, ranging from the branch or department level to those that are more centralized. When considered necessary, the Corporation requires collateral to support credit extensions and commitments, which is generally in the form of real estate and personal property, cash on deposit and other highly liquid instruments.
The Corporation’s Credit Strategy Committee (“CRESCO”) is management’s top policy-making body with respect to credit-related matters and credit strategies. CRESCO reviews the activities of each subsidiary, in the detail that it deems appropriate, to ensure a proactive and coordinated management of credit granting, credit exposures and credit procedures. CRESCO’s principal functions include reviewing the adequacy of the allowance for loan losses and periodically approving appropriate provisions, monitoring compliance with charge-off policy, establishing portfolio diversification, yield and quality standards, establishing credit exposure reporting standards, monitoring asset quality, and approving credit policies and amendments thereto for the subsidiaries and/or business lines, including special lending approval authorities when and if appropriate. The analysis of the allowance adequacy is presented to the Risk Management Committee of the Board of Directors for review, consideration and ratification on a quarterly basis.
The Corporation also has a Corporate Credit Risk Management Division (“CCRMD”). CCRMD is a centralized unit, independent of the lending function. The CCRMD’s functions include identifying, measuring and controlling credit risk independently from the business units, evaluating the credit risk rating system and reviewing the adequacy of the allowance for loan losses in accordance with GAAP and regulatory standards. CCRMD also ensures that the subsidiaries comply with the credit policies and applicable regulations, and monitors credit underwriting standards. Also, the CCRMD performs ongoing monitoring of the portfolio, including potential areas of concern for specific borrowers and/or geographic regions. The CCRMD has strengthened its quantitative measurement capabilities, part of continued improvements to the credit risk management processes.
The Corporation has a Loan Review Department within the CCRMD, which performs annual credit process reviews of several small and middle markets, construction, asset-based and corporate banking lending groups in BPPR. This group evaluates the credit risk profile of each originating unit along with each unit’s credit administration effectiveness, including the assessment of the risk rating representative of the current credit quality of the loans, and the evaluation of collateral documentation. The monitoring performed by this group contributes to assess compliance with credit policies and underwriting standards, determine the current level of credit risk, evaluate the effectiveness of the credit management process and identify control deficiencies that may arise in the credit-granting process. Based on its findings, the Corporate Loan Review Department recommends corrective actions, if necessary, that help in maintaining a sound credit process. In the case of the portfolios of commercial and construction loans in the U.S. mainland operations, credit process reviews are performed by an outside contractor. The CCRMD participates in defining the review plan with the outside loan review firm and actively participates in the discussions of the results of the loan reviews with the business units. The CCRMD may periodically review the work performed by the outside loan review firm. CCRMD reports the results of the credit process reviews to the Risk Management Committee of the Corporation’s Board of Directors.
75
The Corporation also created during the first quarter of 2012 the Commercial Credit Administration Group, which includes the Special Loans Division, the Commercial Credit Operations Division and the Loss-Sharing Agreement Administration Group. This unit focuses on maximizing the value of the Corporation’s special loans and other real estate owned of the commercial portfolio, as well as the FDIC covered loans portfolio. The continued expansion of the workout resources demonstrates the Corporation’s commitment on proactively identifying problem loans in order to reduce the level of non-performing assets.
At December 31, 2013, the Corporation’s credit exposure was centered in its $24.7 billion total loan portfolio, which represented 78% of its earning assets. The portfolio composition for the last five years is presented in Table 12.
The Corporation issues certain credit-related off-balance sheet financial instruments including commitments to extend credit, standby letters of credit and commercial letters of credit to meet the financing needs of its customers. For these financial instruments, the contract amount represents the credit risk associated with failure of the counterparty to perform in accordance with the terms and conditions of the contract and the decline in value of the underlying collateral. The credit risk associated with these financial instruments varies depending on the counterparty’s creditworthiness and the value of any collateral held. Refer to Note 28 to the consolidated financial statements and to the Contractual Obligations and Commercial Commitments section of this MD&A for the Corporation’s involvement in these credit-related activities.
At December 31, 2013, the Corporation maintained a reserve of approximately $7 million for potential losses associated with unfunded loan commitments related to commercial and consumer lines of credit (2012 - $5 million).
The Corporation is also exposed to credit risk by using derivative instruments but manages the level of risk by only dealing with counterparties of good credit standing, entering into master netting agreements whenever possible and, when appropriate, obtaining collateral. Refer to Note 30 to the consolidated financial statements for further information on the Corporation’s involvement in derivative instruments and hedging activities, and the Derivatives sub-section included under Risk Management in this MD&A.
The Corporation may also encounter risk of default in relation to its investment securities portfolio. Refer to Notes 7 and 8 for the composition of the investment securities available-for-sale and held-to-maturity. The investment securities portfolio held by the Corporation at December 31, 2013 are mostly Obligations of U.S. Government sponsored entities, collateralized mortgage obligations, mortgage-backed securities and Obligations of Puerto Rico, States and political subdivisions.
The Corporation’s credit risk exposure is spread among individual consumers, small and medium businesses, as well as corporate borrowers engaged in a wide variety of industries. Only 184 of these commercial lending relationships have an aggregate exposure of $10 million or more. At December 31, 2013, highly leveraged transactions and credit facilities to finance real estate ventures or business acquisitions amounted to $104 million, and there are no loans to less developed countries. The Corporation limits its exposure to concentrations of credit risk by the nature of its lending limits.
The Corporation has a significant portfolio of commercial loans, mostly secured by commercial real estate properties. Due to their nature, these loans entail a higher credit risk than consumer and residential mortgage loans, since they are larger in size, may have less collateral coverage, higher concentrated risk in a single borrower and are generally more sensitive to economic downturns. General economic conditions and numerous other factors continue to create volatility in collateral values and have increased the possibility that additional losses may have to be recognized with respect to the Corporation’s current nonperforming assets. Furthermore, given the current slowdown in the real estate market, the properties securing these loans may be difficult to dispose of, if foreclosed.
Historically, the levels of real estate prices in Puerto Rico were more stable than in other U.S. markets. Nevertheless, the current economic environment has accelerated the devaluation of properties when compared with the previous periods. Also, additional economic weakness, effect of the recent downgrade of Puerto Rico’s general obligation debt to non-investment grade, among others, could further pressure property values. Lower real estate values could increase the provision for loan losses, loan delinquencies, foreclosures and the cost of repossessing and disposing of real estate collateral.
The U.S. economic conditions continued to show positive signs throughout 2013. The pronounced downturn in the residential real estate market since early 2007 resulted in significantly lower real estate values. Further declines in property values could impact the credit quality of the Corporation’s loan portfolios because the value of the collateral underlying the loans is the primary source of repayment in the event of foreclosure. Notwithstanding, indicators suggests that the U.S. economy should continue to grow, but at a relatively moderate pace, with modest improvements in unemployment rates, occupancies and leases rates, as well as increasing housing prices.
The Corporation has continued to execute on its de-risking strategies. During 2013, the Corporation completed two bulk sales of commercial, construction and mortgage non-performing assets from its Puerto Rico operations with total book value of
76
approximately $935 million. In addition, as part of the actions taken to reduce credit risk, during 2011, the Corporation executed the sale of construction, commercial and commercial real estate loans also from its Puerto Rico operations, which had been reclassified to held-for-sale in December 2010. The majority of these loans were in non-accrual status at the transaction date. Furthermore, the Corporation significantly curtailed the production of non-traditional mortgages as it ceased originating non-conventional mortgage loans in its U.S. mainland operations.
Management continues to refine the Corporation’s credit standards to meet the changing economic environment. The Corporation has strengthened its underwriting criteria, as well as enhanced its line management, collection strategies and problem loan management process. The commercial lending and administration groups continue strengthening critical areas to manage more effectively the current scenario, focusing strategies on critical steps in the origination and portfolio management processes to ensure the quality of incoming loans as well as to detect and manage potential problem loans early. The consumer lending group has also tightened the underwriting standards across all business lines and reduced its exposure in areas that are more likely to be impacted under the current economic conditions.
Geographic and government risk
The Corporation is exposed to geographical and government risk. The Corporation’s assets and revenue composition by geographical area and by business segment reporting are presented in Note 42 to the consolidated financial statements. A significant portion of the Corporation’s financial activities and credit exposure is concentrated in Puerto Rico, which has been going through a challenging economic cycle. Puerto Rico’s fiscal and economic situation is expected to continue to be difficult.
The latest figures from the Puerto Rico Planning Board (the “Planning Board), released in October 2013, project that Puerto Rico’s real gross national product for fiscal year 2013 (ended June 30, 2013) neither grew nor declined when compared to the prior fiscal year. For fiscal year 2012 (ended June 30, 2012), the Planning Board’s preliminary reports indicate that the real gross national product grew by only 0.1%. These were the first years reflecting a stable, but weak economy in Puerto Rico, following a six-year steep decline in economic activity. The Planning Board, however, currently projects that Puerto Rico’s real gross national product for fiscal year 2014 (ending June 30, 2014) will decline by 0.8%. The Planning Board is expected to publish a new forecast in March 2014 for fiscal years 2014 and 2015, together with revised figures for fiscal year 2012 and the preliminary estimates for fiscal year 2013.
Employment continued to be a weak spot. A reduction in total employment began in the fourth quarter of fiscal year 2007 and has continued consistently through fiscal year 2013 due to the current recession and contractionary fiscal adjustment measures. According to the Household Survey (conducted by the Puerto Rico Department of Labor and Human Resources), the number of persons employed in Puerto Rico during fiscal year 2013 averaged 1,029,019, a decrease of 0.6% compared to the previous fiscal year; and the unemployment rate averaged 14.0%. During the first six months of fiscal year 2014 (June 30, 2013 through December 31, 2013), total employment fell by 2%, as compared to the same period for the prior fiscal year, and the unemployment rate averaged 14.8% compared to 14.2% for the same period of the prior fiscal year. Puerto Rico’s fiscal situation is expected to continue to be challenging in 2014.
In February 2014, the three principal rating agencies (Moody’s, S&P and Fitch) lowered their ratings on the general obligation bonds of the Commonwealth of Puerto Rico and on the bonds of several other Commonwealth instrumentalities to non-investment grade ratings. In connection with their rating actions, the rating agencies have noted various factors, including high levels of public debt, the lack of clear economic growth catalysts, fiscal budget deficits, the financial condition of the public sector employee pension plans and, more recently, liquidity concerns regarding the Commonwealth and Government Development Bank for Puerto Rico and concerns regarding access to market financing. Furthermore, the Puerto Rico economy continues to be susceptible to fluctuations in the price of crude oil due to its high dependence on fuel oil for energy production. Popular’s assets and revenue composition by geographical area and by business segment reporting are presented in Note 42, “Segment Reporting” to consolidated financial statements.
The Government recently announced that it will take additional measures to reduce the budget deficit for fiscal year 2014 and is committed to achieving a balanced budget by fiscal year 2015. The additional measures the Government must take to reduce or eliminate the budget deficits will include significant measures to increase revenues and/or reduce expenditures, which could have adverse effects for economic activity. Furthermore, the Commonwealth must access the capital markets to refinance existing debt If the Commonwealth is unable to successfully access the bond market or obtain alternative sources of financing, or if the adjustment measures result insufficient to address the Commonwealth’s fiscal problems, then the financial condition of the Commonwealth may deteriorate further, which could cause a further general deterioration of the economy and adversely affect our financial condition and profitability.
The lingering effects of the prolonged recession are still reflected in limited loan demand, an increase in the rate of foreclosures and delinquencies on mortgage loans granted in Puerto Rico. If the price of crude oil increases, if global or local economic conditions worsen or if the Government is unable to access the capital markets and manage its fiscal problems in an orderly manner, those adverse effects could continue or worsen. Any reduction in consumer spending as a result of these issues may also adversely impact our non-interest revenues.
77
At December 31, 2013, the Corporation’s direct exposure to the Puerto Rico government, instrumentalities and municipalities amounted $1.2 billion, of which approximately $950 million is outstanding. Of the amount outstanding, $789 million consists of loans and $161 million are securities. From this amount, $527 million represents obligations from the Government of Puerto Rico and public corporations that are either collateralized loans or obligations that have a specific source of income or revenues identified for their repayment. Some of these obligations consist of senior and subordinated loans to public corporations that obtain revenues from rates charged for services or products, such as water and electric power utilities. Public corporations have varying degrees of independence from the central Government and many receive appropriations or other payments from it. The remaining $423 million represents obligations from various municipalities in Puerto Rico for which, in most cases, the good faith, credit and unlimited taxing power of the applicable municipality has been pledged to their repayment. These municipalities are required by law to levy special property taxes in such amounts as shall be required for the payment of all of its general obligation bonds and loans. These loans have seniority to the payment of operating cost and expenses of the municipality. Table 36 has a summary of the Corporation’s direct exposure to the Puerto Rico Government.
Table 36 - Direct Exposure to the Puerto Rico Government
| | | | | | | | | | | | | | | | |
| (In thousands) | | Investment Portfolio | | | Loans | | | Total Outstanding | | | Total Exposure | |
| |
| | | | |
Central Government | | | $ 65,201 | | | | $ 282,151 | | | | $ 347,352 | | | | $ 475,213 | |
| | | | |
Government Development Bank (GDB) | | | 31,559 | | | | - | | | | 31,559 | | | | 31,559 | |
| | | | |
Public Corporations | | | 468 | | | | 147,904 | | | | 148,372 | | | | 238,778 | |
| | | | |
Municipalities | | | 63,895 | | | | 358,877 | | | | 422,772 | | | | 470,688 | |
| |
| | | | |
Total Direct Government Exposure | | | $ 161,123 | | | | $ 788,932 | | | | $ 950,055 | | | | $ 1,216,238 | |
| |
In addition, at December 31, 2013, the Corporation had $360 million in indirect exposure to loans or securities that are payable by non-governmental entities, but which carry a government guarantee to cover any shortfall in collateral in the event of borrower default. These included $274 million in residential mortgage loans that are guaranteed by the Puerto Rico Housing Finance Authority (December 31, 2012 - $294 million). These mortgage loans are secured by the underlying properties and the guarantees serve to cover shortfalls in collateral in the event of a borrower default. Also, the Corporation had $52 million in Puerto Rico pass-through housing bonds backed by FNMA, GNMA or residential loans CMO’s, and $34 million of industrial development notes.
78
As further detailed in Notes 7 and 8 to the consolidated financial statements, a substantial portion of the Corporation’s investment securities represented exposure to the U.S. Government in the form of U.S. Government sponsored entities, as well as agency mortgage-backed and U.S. Treasury securities. In addition, $934 million of residential mortgages and $160 million in commercial loans were insured or guaranteed by the U.S. Government or its agencies at December 31, 2013. The Corporation does not have any exposure to European sovereign debt.
Non-Performing Assets
Non-performing assets include primarily past-due loans that are no longer accruing interest, renegotiated loans, and real estate property acquired through foreclosure. A summary, including certain credit quality metrics, is presented in Table 37.
The Corporation’s non-accruing and charge-off policies by major categories of loan portfolios are as follows:
| | — | | Commercial and construction loans - recognition of interest income on commercial and construction loans is discontinued when the loans are 90 days or more in arrears on payments of principal or interest or when other factors indicate that the collection of principal and interest is doubtful. The impaired portions of secured loans past due as to principal and interest is charged-off not later than 365 days past due. However, in the case of collateral dependent loans individually evaluated for impairment, the excess of the recorded investment over the fair value of the collateral (portion deemed uncollectible) is generally promptly charged-off, but in any event, not later than the quarter following the quarter in which such excess was first recognized. Commercial unsecured loans are charged-off no later than 180 days past due. Overdrafts are generally charged-off no later than 60 days past their due date. |
| | — | | Lease financing - recognition of interest income for lease financing is ceased when loans are 90 days or more in arrears. Leases are charged-off when they are 120 days in arrears. |
| | — | | Mortgage loans - recognition of interest income on mortgage loans is generally discontinued when loans are 90 days or more in arrears on payments of principal or interest. The impaired portion of a mortgage loan is charged-off when the loan is 180 days past due. The Corporation discontinues the recognition of interest income on residential mortgage loans insured by the Federal Housing Administration (“FHA”) or guaranteed by the U.S. Department of Veterans Affairs (“VA”) when 18 months delinquent as to principal or interest. The principal repayment on these loans is insured. |
| | — | | Consumer loans - recognition of interest income on closed-end consumer loans and home-equity lines of credit is discontinued when the loans are 90 days or more in arrears on payments of principal or interest. Income is generally recognized on open-end consumer loans, except for home equity lines of credit, until the loans are charged-off. Closed-end consumer loans are charged-off when they are 120 days in arrears. Open-end consumer loans are charged-off when they are 180 days in arrears. Overdrafts in excess of 60 days are generally charged-off no later than 60 days past their due date. |
| | — | | Troubled debt restructurings (“TDRs”) - loans classified as TDRs are typically in non-accrual status at the time of the modification. The TDR loan continues in non-accrual status until the borrower has demonstrated a willingness and ability to make the restructured loan payments (generally at least six months of sustained performance after the modification (or one year for loans providing for quarterly or semi-annual payments)) and management has concluded that it is probable that the borrower would not be in payment default in the foreseeable future. |
| | — | | Covered loans acquired in the Westernbank FDIC-assisted transaction, except for revolving lines of credit, are accounted for by the Corporation in accordance with ASC Subtopic 310-30. Under ASC Subtopic 310-30, the acquired loans were aggregated into pools based on similar characteristics. Each loan pool is accounted for as a single asset with a single composite interest rate and an aggregate expectation of cash flows. The covered loans, which are accounted for under ASC Subtopic 310-30 by the Corporation, are not considered non-performing and will continue to have an accretable yield as long as there is a reasonable expectation about the timing and amount of cash flows expected to be collected. Also, loans charged-off against the non-accretable difference established in purchase accounting are not reported as charge-offs. Charge-offs will be recorded only to the extent that losses exceed the purchase accounting estimates. |
Because of the application of ASC Subtopic 310-30 to the Westernbank acquired loans and the loss protection provided by the FDIC which limits the risks on the covered loans, the Corporation has determined to provide certain quality metrics in this MD&A that exclude such covered loans to facilitate the comparison between loan portfolios and across periods. Given the significant amount of covered loans that are past due but still accruing due to the accounting under ASC Subtopic 310-30, the Corporation believes the inclusion of these loans in certain asset quality ratios in the numerator or denominator (or both) would result in a
79
significant distortion to these ratios. In addition, because charge-offs related to the acquired loans are recorded against the non-accretable balance, the net charge-off ratio including the acquired loans is lower for portfolios that have significant amounts of covered loans. The inclusion of these loans in the asset quality ratios could result in a lack of comparability across periods, and could negatively impact comparability with other portfolios that were not impacted by acquisition accounting. The Corporation believes that the presentation of asset quality measures, excluding covered loans and related amounts from both the numerator and denominator, provides a better perspective into underlying trends related to the quality of its loan portfolio.
Total non-performing non-covered assets were $735 million at December 31, 2013, declining by $1.1 billion, or 59%, compared with December 31, 2012, and $1.4 billion, or 66%, compared with December 31, 2011. Non-covered non-performing loans held-in-portfolio stand at $598 million, declining by $827 million, or 58%, from December 31, 2012. The ratio of non-performing loans to loans held-in-portfolio, excluding covered loans, decreased to 2.77% at December 31, 2013 from 6.79% at December 31, 2012. These reductions mainly reflect the impact of the bulk sale of assets of $509 million and $435 million during the first and second quarter of 2013, respectively, coupled with loan resolutions and disposition of foreclosed properties.
The composition of non-performing loans continues to be concentrated in real estate as 88% of non-performing loans were secured by real estate as of December 31, 2013. At December 31, 2013, non-performing loans secured by real estate held-in-portfolio, excluding covered loans, amounted to $388 million in the Puerto Rico operations and $141 million in the U.S. mainland operations. These figures compare to $1.1 million in the Puerto Rico operations and $208 million in the U.S. mainland operations at December 31, 2012. In addition to the non-performing loans included in Table 37, at December 31, 2013, there were $103 million of non-covered performing loans, mostly commercial loans, that in management’s opinion, are currently subject to potential future classification as non-performing and are considered impaired, compared with $96 million at December 31, 2012.
80
Table 37 - Non-Performing Assets
| | | | | | | | | | | | | | | | | | | | |
| | | At December 31, | | | | |
| |
| (Dollars in thousands) | | 2013 | | | 2012 | | | 2011 | | | 2010 | | | 2009 | |
| |
| | | | | |
Non-accrual loans: | | | | | | | | | | | | | | | | | | | | |
| | | | | |
Commercial | | | $ 279,053 | | | | $ 665,289 | | | | $ 830,092 | | | | $ 665,463 | | | | $ 727,527 | |
| | | | | |
Construction | | | 23,771 | | | | 43,350 | | | | 96,286 | | | | 132,897 | | | | 667,645 | |
| | | | | |
Legacy[1] | | | 15,050 | | | | 40,741 | | | | 75,660 | | | | 165,484 | | | | 298,313 | |
| | | | | |
Leasing | | | 3,495 | | | | 4,865 | | | | 5,642 | | | | 5,674 | | | | 7,835 | |
| | | | | |
Mortgage | | | 232,681 | | | | 630,130 | | | | 686,502 | | | | 542,033 | | | | 510,847 | |
| | | | | |
Consumer | | | 43,898 | | | | 40,758 | | | | 43,668 | | | | 60,302 | | | | 64,185 | |
| |
| | | | | |
Total non-performing loans held-in-portfolio, excluding covered loans | | | 597,948 | | | | 1,425,133 | | | | 1,737,850 | | | | 1,571,853 | | | | 2,276,352 | |
| | | | | |
Non-performing loans held-for-sale[2] | | | 1,092 | | | | 96,320 | | | | 262,302 | | | | 671,757 | | | | - | |
| | | | | |
Other real estate owned (“OREO”), excluding covered OREO | | | 135,501 | | | | 266,844 | | | | 172,497 | | | | 161,496 | | | | 125,483 | |
| |
| | | | | |
Total non-performing assets, excluding covered assets | | | $ 734,541 | | | | $ 1,788,297 | | | | $ 2,172,649 | | | | $2,405,106 | | | | $2,401,835 | |
| | | | | |
Covered loans and OREO[3] | | | 197,388 | | | | 213,483 | | | | 201,348 | | | | 100,718 | | | | - | |
| |
| | | | | |
Total non-performing assets | | | $ 931,929 | | | | $ 2,001,780 | | | | $ 2,373,997 | | | | $2,505,824 | | | | $2,401,835 | |
| |
| | | | | |
Accruing loans past-due 90 days or more[4] [5] | | | $ 418,028 | | | | $ 388,712 | | | | $ 316,614 | | | | $ 338,359 | | | | $ 239,559 | |
| |
| | | | | |
Excluding covered loans:[6] | | | | | | | | | | | | | | | | | | | | |
| | | | | |
Non-performing loans to loans held-in-portfolio | | | 2.77 | % | | | 6.79 | % | | | 8.44 % | | | | 7.58 | % | | | 9.60 % | |
| |
| | | | | |
Including covered loans: | | | | | | | | | | | | | | | | | | | | |
| | | | | |
Non-performing loans to loans held-in-portfolio | | | 2.55 | | | | 6.06 | | | | 7.33 | | | | 6.32 | | | | 9.60 | |
| | | | | |
Interest lost | | | $ 29,766 | | | | $ 86,442 | | | | $ 103,390 | | | | $ 75,684 | | | | $ 59,982 | |
| |
HIP = “held-in-portfolio”
[1] The legacy portfolio is comprised of commercial loans, construction loans and lease financings related to certain lending products exited by the Corporation as part of restructuring efforts carried out in prior years at the BPNA reportable segment.
[2] Non-performing loans held-for-sale consist of $603 thousand in commercial loans and $489 thousand in mortgage loans at December 31, 2013 (December 31, 2012 - $78 million in construction loans, $16 million in commercial loans, $2 million in legacy loans and $53 thousand in mortgage loans).
[3] The amount consists of $29 million in non-performing covered loans accounted for under ASC Subtopic 310-20 and $168 million in covered OREO at December 31, 2013 (December 31, 2012 - $74 million and $139 million, respectively). It excludes covered loans accounted for under ASC Subtopic 310-30 as they are considered to be performing due to the application of the accretion method, in which these loans will accrete interest income over the remaining life of the loans using estimated cash flow analyses.
[4] The carrying value of covered loans accounted for under ASC Subtopic 310-30 that are contractually 90 days or more past due was $0.7 billion at December 31, 2013 (December 31, 2012 - $0.7 billion). This amount is excluded from the above table as the covered loans’ accretable yield interest recognition is independent from the underlying contractual loan delinquency status.
[5] It is the Corporation’s policy to report delinquent residential mortgage loans insured by FHA or guaranteed by the VA as accruing loans past due 90 days or more as opposed to non-performing since the principal repayment is insured. These balances include $115 million and $86 million, respectively, of residential mortgage loans insured by FHA or guaranteed by the VA that are no longer accruing interest as of December 31, 2013 and December 31, 2012.
[6] These asset quality ratios have been adjusted to remove the impact of covered loans. Appropriate adjustments to the numerator and denominator have been reflected in the calculation of these ratios. Management believes the inclusion of acquired loans in certain asset quality ratios that include non-performing assets, past due loans or net charge-offs in the numerator and denominator results in distortions of these ratios and they may not be comparable to other periods presented or to other portfolios that were not impacted by purchase accounting.
Another key measure used to evaluate and monitor the Corporation’s asset quality is loan delinquencies. Loans delinquent 30 days or more and delinquencies, as a percentage of their related portfolio category at December 31, 2013 and 2012, are presented below.
81
Table 38 - Loan Delinquencies
| | | | | | | | |
| (Dollars in millions) | | 2013 | | | 2012 | |
| |
| | |
Loans delinquent 30 days or more | | $ | 2,635 | | | $ | 3,894 | |
|
| |
| | |
Total delinquencies as a percentage of total loans: | | | | | | | | |
| | |
Commercial | | | 3.52 | % | | | 8.26 % | |
| | |
Construction | | | 12.66 | | | | 19.72 | |
| | |
Legacy | | | 12.42 | | | | 19.94 | |
| | |
Lease financing | | | 2.31 | | | | 2.39 | |
| | |
Mortgage | | | 17.72 | | | | 23.00 | |
| | |
Consumer | | | 4.11 | | | | 3.99 | |
| | |
Covered loans | | | 29.13 | | | | 34.37 | |
| | |
Loans held-for-sale | | | 1.41 | | | | 27.49 | |
|
| |
| | |
Total | | | 10.66 | % | | | 15.52 % | |
| |
Accruing loans past due 90 days or more are composed primarily of credit cards, residential mortgage loans insured by FHA / VA, and delinquent mortgage loans included in the Corporation’s financial statements pursuant to GNMA’s buy-back option program. Servicers of loans underlying GNMA mortgage-backed securities must report as their own assets the defaulted loans that they have the option to purchase, even when they elect not to exercise that option. Also, accruing loans past due 90 days or more include residential conventional loans purchased from other financial institutions that, although delinquent, the Corporation has received timely payment from the sellers / servicers, and, in some instances, have partial guarantees under recourse agreements.
Refer to Table 39 for a summary of the activity in the allowance for loan losses and selected loan losses statistics for the past 5 years.
Table 39 - Allowance for Loan Losses and Selected Loan Losses Statistics
| | | | | | | | | | | | | | | | | | | | | | | | | | | | | | | | | | | | | | | | | | | | | | | | | | | | |
| | | 2013 | | | 2012 | | | 2011 | | | 2010 | | | 2009 | |
(Dollars in
thousands) | | Non-covered
loans | | | Covered
loans | | | Total | | | Non-covered
loans | | | Covered
loans | | | Total | | | Non-covered
loans | | | Covered
loans | | | Total | | | Non-covered
loans | | | Covered
loans | | | Total | | | | |
| |
Balance at the beginning of year | | $ | 621,701 | | | $ | 108,906 | | | $ | 730,607 | | | $ | 690,363 | | | $ | 124,945 | | | $ | 815,308 | | | $ | 793,225 | | | $ | - | | | $ | 793,225 | | | $ | 1,261,204 | | | $ | - | | | $ | 1,261,204 | | | $ | 882,807 | |
| | | | | | | | | | | | | |
Provision for loan losses | | | 533,167 | | | | 69,396 | | | | 602,563 | | | | 334,102 | | | | 74,839 | | | | 408,941 | | | | 430,085 | | | | 145,635 | | | | 575,720 | | | | 1,011,880 | | | | - | | | | 1,011,880 | | | | 1,405,807 | |
| |
| | | 1,154,868 | | | | 178,302 | | | | 1,333,170 | | | | 1,024,465 | | | | 199,784 | | | | 1,224,249 | | | | 1,223,310 | | | | 145,635 | | | | 1,368,945 | | | | 2,273,084 | | | | - | | | | 2,273,084 | | | | 2,288,614 | |
| |
Charged-offs: | | | | | | | | | | | | | | | | | | | | | | | | | | | | | | | | | | | | | | | | | | | | | | | | | | | | |
Commercial | | | 168,335 | | | | 28,423 | | | | 196,758 | | | | 255,017 | | | | 46,290 | | | | 301,307 | | | | 324,573 | | | | 13,774 | | | | 338,347 | | | | 380,818 | | | | - | | | | 380,818 | | | | 192,562 | |
Construction | | | 6,757 | | | | 39,729 | | | | 46,486 | | | | 5,569 | | | | 30,556 | | | | 36,125 | | | | 19,849 | | | | 4,353 | | | | 24,202 | | | | 307,900 | | | | - | | | | 307,900 | | | | 202,207 | |
Legacy [1] | | | 22,529 | | | | - | | | | 22,529 | | | | 36,529 | | | | - | | | | 36,529 | | | | 78,338 | | | | - | | | | 78,338 | | | | 198,059 | | | | - | | | | 198,059 | | | | 212,742 | |
Leasing | | | 6,035 | | | | - | | | | 6,035 | | | | 4,680 | | | | - | | | | 4,680 | | | | 6,527 | | | | - | | | | 6,527 | | | | 10,517 | | | | - | | | | 10,517 | | | | 16,628 | |
Mortgage | | | 59,574 | | | | 10,679 | | | | 70,253 | | | | 75,994 | | | | 5,909 | | | | 81,903 | | | | 45,785 | | | | 826 | | | | 46,611 | | | | 99,835 | | | | - | | | | 99,835 | | | | 124,781 | |
Consumer | | | 139,136 | | | | 3,952 | | | | 143,088 | | | | 161,703 | | | | 8,225 | | | | 169,928 | | | | 196,433 | | | | 3,253 | | | | 199,686 | | | | 252,227 | | | | - | | | | 252,227 | | | | 347,027 | |
| |
| | | 402,366 | | | | 82,783 | | | | 485,149 | | | | 539,492 | | | | 90,980 | | | | 630,472 | | | | 671,505 | | | | 22,206 | | | | 693,711 | | | | 1,249,356 | | | | - | | | | 1,249,356 | | | | 1,095,947 | |
| |
Recoveries: | | | | | | | | | | | | | | | | | | | | | | | | | | | | | | | | | | | | | | | | | | | | | | | | | | | | |
Commercial | | | 59,366 | | | | 816 | | | | 60,182 | | | | 65,724 | | | | 31 | | | | 65,755 | | | | 52,628 | | | | - | | | | 52,628 | | | | 26,769 | | | | - | | | | 26,769 | | | | 22,643 | |
Construction | | | 15,399 | | | | 5,621 | | | | 21,020 | | | | 7,452 | | | | 61 | | | | 7,513 | | | | 11,090 | | | | 1,500 | | | | 12,590 | | | | 2,118 | | | | - | | | | 2,118 | | | | 113 | |
Legacy [1] | | | 25,112 | | | | - | | | | 25,112 | | | | 20,191 | | | | - | | | | 20,191 | | | | 26,014 | | | | - | | | | 26,014 | | | | 20,639 | | | | - | | | | 20,639 | | | | 6,573 | |
Leasing | | | 2,529 | | | | - | | | | 2,529 | | | | 3,737 | | | | - | | | | 3,737 | | | | 3,083 | | | | - | | | | 3,083 | | | | 4,058 | | | | - | | | | 4,058 | | | | 4,137 | |
Mortgage | | | 4,035 | | | | 65 | | | | 4,100 | | | | 4,054 | | | | - | | | | 4,054 | | | | 3,974 | | | | 15 | | | | 3,989 | | | | 5,056 | | | | - | | | | 5,056 | | | | 4,175 | |
Consumer | | | 42,165 | | | | 71 | | | | 42,236 | | | | 35,604 | | | | 10 | | | | 35,614 | | | | 40,668 | | | | 1 | | | | 40,669 | | | | 38,064 | | | | - | | | | 38,064 | | | | 30,896 | |
| |
| | | 148,606 | | | | 6,573 | | | | 155,179 | | | | 136,762 | | | | 102 | | | | 136,864 | | | | 137,457 | | | | 1,516 | | | | 138,973 | | | | 96,704 | | | | - | | | | 96,704 | | | | 68,537 | |
| |
Net loans charged-offs (recoveries): | | | | | | | | | | | | | | | | | | | | | | | | | | | | | | | | | | | | | | | | | | | | | | | | | | | | |
Commercial | | | 108,969 | | | | 27,607 | | | | 136,576 | | | | 189,293 | | | | 46,259 | | | | 235,552 | | | | 271,945 | | | | 13,774 | | | | 285,719 | | | | 354,049 | | | | - | | | | 354,049 | | | | 169,919 | |
Construction | | | (8,642 | ) | | | 34,108 | | | | 25,466 | | | | (1,883 | ) | | | 30,495 | | | | 28,612 | | | | 8,759 | | | | 2,853 | | | | 11,612 | | | | 305,782 | | | | - | | | | 305,782 | | | | 202,094 | |
Legacy [1] | | | (2,583 | ) | | | - | | | | (2,583 | ) | | | 16,338 | | | | - | | | | 16,338 | | | | 52,324 | | | | - | | | | 52,324 | | | | 177,420 | | | | - | | | | 177,420 | | | | 206,169 | |
Leasing | | | 3,506 | | | | - | | | | 3,506 | | | | 943 | | | | - | | | | 943 | | | | 3,444 | | | | - | | | | 3,444 | | | | 6,459 | | | | - | | | | 6,459 | | | | 12,491 | |
Mortgage | | | 55,539 | | | | 10,614 | | | | 66,153 | | | | 71,940 | | | | 5,909 | | | | 77,849 | | | | 41,811 | | | | 811 | | | | 42,622 | | | | 94,779 | | | | - | | | | 94,779 | | | | 120,606 | |
Consumer | | | 96,971 | | | | 3,881 | | | | 100,852 | | | | 126,099 | | | | 8,215 | | | | 134,314 | | | | 155,765 | | | | 3,252 | | | | 159,017 | | | | 214,163 | | | | - | | | | 214,163 | | | | 316,131 | |
| |
| | | 253,760 | | | | 76,210 | | | | 329,970 | | | | 402,730 | | | | 90,878 | | | | 493,608 | | | | 534,048 | | | | 20,690 | | | | 554,738 | | | | 1,152,652 | | | | - | | | | 1,152,652 | | | | 1,027,410 | |
| |
82
| | | | | | | | | | | | | | | | | | | | | | | | | | | | | | | | | | | | | | | | | | | | | | | | | | | | |
| |
| | | | | | | | | | | | | |
Net write-downs [2] | | | (362,645 | ) | | | - | | | | (362,645 | ) | | | (34 | ) | | | - | | | | (34 | ) | | | 1,101 | | | | - | | | | 1,101 | | | | (327,207 | ) | | | - | | | | (327,207 | ) | | | - | |
| |
| | | | | | | | | | | | | |
Balance at end of year | | $ | 538,463 | | | $ | 102,092 | | | $ | 640,555 | | | $ | 621,701 | | | $ | 108,906 | | | $ | 730,607 | | | $ | 690,363 | | | $ | 124,945 | | | $ | 815,308 | | | $ | 793,225 | | | $ | - | | | $ | 793,225 | | | $ | 1,261,204 | |
| |
| | | | | | | | | | | |
Loans held-in-portfolio: | | | | | | | | | | | | | | | | | | | | | | | | | | | | | | | | | | | | | | | | | | | | | |
| | | | | | | | | | | | | |
Outstanding at year end | | $ | 21,611,866 | | | | | | | $ | 24,596,293 | | | $ | 20,983,192 | | | | | | | $ | 24,739,164 | | | $ | 20,602,596 | | | $ | | | | | 24,951,299 | | | $ | 20,728,035 | | | | | | | $ | 25,564,917 | | | $ | 23,713,113 | |
Average | | | 21,354,143 | | | | | | | | 24,581,862 | | | | 20,477,264 | | | | | | | | 24,527,602 | | | | 20,496,966 | | | | | | | | 25,110,328 | | | | 22,376,612 | | | | | | | | 25,741,544 | | | | 24,650,071 | |
Ratios: | | | | | | | | | | | | | | | | | | | | | | | | | | | | | | | | | | | | | | | | | | | | | | | | | |
Allowance for loan losses to year end loans held-in-portfolio | | | 2.49 | % | | | | | | | 2.60 | % | | | 2.96 | % | | | | | | | 2.95 | % | | | 3.35 | % | | | | | | | 3.27 | % | | | 3.83 | % | | | | | | | 3.10 | % | | | 5.32 % | |
Recoveries to charge-offs | | | 36.93 | | | | | | | | 31.99 | | | | 25.35 | | | | | | | | 21.71 | | | | 20.47 | | | | | | | | 20.03 | | | | 7.74 | | | | | | | | 7.74 | | | | 6.25 | |
Net charge-offs to average loans held-in-portfolio | | | 1.19 | | | | | | | | 1.34 | | | | 1.97 | | | | | | | | 2.01 | | | | 2.61 | | | | | | | | 2.21 | | | | 5.15 | | | | | | | | 4.48 | | | | 4.17 | |
Allowance for loans losses to net charge-offs | | | 2.12 | x | | | | | | | 1.94 | x | | | 1.54 | x | | | | | | | 1.48 | x | | | 1.29 | x | | | | | | | 1.47 | x | | | 0.69 | x | | | | | | | 0.69 | x | | | 1.23 x | |
| | | | | | | | | | | |
Provision for loan losses to: | | | | | | | | | | | | | | | | | | | | | | | | | | | | | | | | | | | | | | | | | | | | | |
Net charge-offs [3] | | | 0.85 | | | | | | | | 0.86 | | | | 0.83 | | | | | | | | 0.83 | | | | 0.81 | | | | | | | | 1.04 | | | | 0.88 | | | | | | | | 0.88 | | | | 1.37 | |
Average loans held-in-portfolio | | | 2.50 | % | | | | | | | 2.45 | % | | | 1.63 | % | | | | | | | 1.67 | % | | | 2.10 | % | | | | | | | 2.29 | % | | | 4.52 | % | | | | | | | 3.93 | % | | | 5.70 % | |
Allowance to non performing loans held-in-portfolio | | | 90.05 | | | | | | | | 103.78 | | | | 43.62 | | | | | | | | 48.72 | | | | 39.73 | | | | | | | | 44.76 | | | | 50.46 | | | | | | | | 49.64 | | | | 55.40 | |
[1] The legacy portfolio is comprised of commercial loans, construction loans and lease financings related to certain lending products exited by the Corporation as part of restructuring efforts carried out in prior years at the BPNA segment.
[2] Net write-downs are related to loans sold or transferred to held-for-sale.
[3] Excluding provision for loan losses of $318,071 and net write-down related to the asset sale during the year ended December 31, 2013.
The following table presents net charge-offs to average loans held-in-portfolio (“HIP”) ratio by loan category for the years ended December 31, 2013, 2012 and 2011:
Table 40 - Net Charge-Offs (Recoveries) to Average Loans HIP
| | | | | | | | | | | | | | | | |
| | | 2013 | | | | | 2012 | | | | | 2011 | |
| |
| | | | | |
Commercial | | | 1.11 | % | | | | | 1.94 | % | | | | | 2.68 % | |
| | | | | |
Construction | | | (3.13 | ) | | | | | (0.77 | ) | | | | | 3.22 | |
| | | | | |
Lease financing | | | 0.65 | | | | | | 0.18 | | | | | | 0.62 | |
| | | | | |
Legacy | | | (0.99 | ) | | | | | 3.12 | | | | | | 6.42 | |
| | | | | |
Mortgage | | | 0.85 | | | | | | 1.27 | | | | | | 0.83 | |
| | | | | |
Consumer | | | 2.50 | | | | | | 3.36 | | | | | | 4.26 | |
| |
| | | | | |
Total | | | 1.19 | % | | | | | 1.97 | % | | | | | 2.61 % | |
| |
The Corporation’s annualized net charge-offs to average non-covered loans held-in-portfolio ratio was 1.19% for the year ended December 31, 2013, down from 1.97% and 2.61% for the same periods in 2012 and 2011, respectively, lowest level in over seven years. Net charge-offs, excluding covered loans, for the year ended December 31, 2013, decreased by $149.0 million and $280.3 million, compared to the years ended December 31, 2012 and 2011. The decline is mostly driven by improvements in the credit performance of the loans portfolios and de-risking strategies taken by the Corporation to improve the risk profile of its portfolios. The commercial and residential mortgage non-performing loans bulk sales completed during the first half of 2013 added $163.1 million and $199.5 million, respectively, in write-downs at the BPPR operations.
Asset quality metrics improved significantly during 2013, with non-performing loans reaching lowest levels in over six years and returning to pre-crisis levels. This progress was driven in part by strategic loan sales executed by the Corporation during the first half of the year to reduce high risk assets and improve the risk profile of the loan portfolios, as well as overall improvements in core
83
credit quality trends. Total non-performing loans held-in-portfolio have declined significantly since peak in the third quarter of 2010, down by $1.7 billion, or 74%, accelerated with the bulk sale of approximately $767 million in commercial and residential mortgages non-performing loans. Non-covered OREO decreased by $131 million, or 49%, from December 31, 2012 due to the bulk sale of $59 million and $50 million in commercial and single family OREO, respectively, and continued disposition of foreclosed properties. The Corporation also engaged in collection and loss mitigation efforts, resolutions, and restructurings, which drove further improvements in credit quality.
The discussions in the sections that follow assess credit quality performance for 2013 for each of the Corporation’s non-covered loan portfolios.
Commercial loans
Non-covered non-performing commercial loans held-in-portfolio were $279 million at December 31, 2013, compared with $665 million at December 31, 2012, and $830 million at December 31, 2011. The decrease of $386 million, or 58%, from December 31, 2012 was principally attributed to reductions related to the non-performing bulk sale in the BPPR segment during the first quarter of 2013. The percentage of non-performing commercial loans held-in-portfolio to commercial loans held-in-portfolio decreased to 2.78% at December 31, 2013 from 6.75% at December 31, 2012 and 8.32% at December 31, 2011.
Commercial non-covered non-performing loans held-in-portfolio at the BPPR segment decreased by $337 million from December 31, 2012, mainly driven by the impact of the bulk sale of non-performing commercial loans with book value of approximately $329 million. Excluding the impact of the sale, commercial non-covered non-performing loans decreased by $7 million. The commercial portfolio at the BPPR segment continued to steadily improve throughout 2013, despite challenging economic conditions in Puerto Rico. Commercial non-performing loans held-in-portfolio at the BPNA segment decreased by $50 million from December 31, 2012, reflective of sustained improvements in credit performance, sales, and resolution of non-performing loans.
Tables 41 and 42 present the changes in the non-performing commercial loans held-in-portfolio for the years ended December 31, 2013 and 2012 for the BPPR (excluding covered loans) and BPNA segments.
Table 41 - Activity in Non-Performing Commercial Loans Held-In-Portfolio (Excluding Covered Loans)
| | | | | | | | | | | | |
| | | For the year ended December 31, 2013 | |
(In thousands) | | BPPR | | | BPNA | | | Popular, Inc. | |
| |
| | | |
Beginning Balance - NPLs | | | $ 522,733 | | | | $ 142,556 | | | | $ 665,289 | |
| | | |
Plus: | | | | | | | | | | | | |
| | | |
New non-performing loans | | | 179,377 | | | | 56,677 | | | | 236,054 | |
| | | |
Advances on existing non-performing loans | | | - | | | | 1,535 | | | | 1,535 | |
| | | |
Loans transferred from held-for-sale | | | 790 | | | | - | | | | 790 | |
| | | |
Other | | | - | | | | 4,310 | | | | 4,310 | |
Less: | | | | | | | | | | | | |
| | | |
Non-performing loans transferred to OREO | | | (17,000) | | | | (3,631) | | | | (20,631) | |
| | | |
Non-performing loans charged-off | | | (100,682) | | | | (39,702) | | | | (140,384) | |
| | | |
Loans returned to accrual status / loan collections | | | (69,853) | | | | (64,831) | | | | (134,684) | |
| | | |
Loans in accrual status transfer to held-for-sale | | | - | | | | (3,958) | | | | (3,958) | |
| | | |
Non-performing loans sold | | | (329,268) | | | | - | | | | (329,268) | |
| |
| | | |
Ending balance - NPLs | | | $ 186,097 | | | | $ 92,956 | | | | $ 279,053 | |
| |
84
Table 42 - Activity in Non-Performing Commercial Loans Held-in-Portfolio (Excluding Covered Loans)
| | | | | | | | | | | | | | | | |
| | | For the year ended December 31, 2012 | |
| | | | | |
| (In thousands) | | BPPR | | | | | BPNA | | | | | Popular, Inc. | |
| |
| | | | | |
Beginning Balance - NPLs | | | $ 631,171 | | | | | | $ 198,921 | | | | | | $ 830,092 | |
| | | | | |
Plus: | | | | | | | | | | | | | | | | |
| | | | | |
New non-performing loans | | | 286,830 | | | | | | 110,921 | | | | | | 397,751 | |
| | | | | |
Advances on existing non-performing loans | | | - | | | | | | 1,060 | | | | | | 1,060 | |
| | | | | |
Loans transferred from held-for-sale | | | - | | | | | | 4,933 | | | | | | 4,933 | |
| | | | | |
Other | | | 1,139 | | | | | | - | | | | | | 1,139 | |
| | | | | |
Less: | | | | | | | | | | | | | | | | |
| | | | | |
Non-performing loans transferred to OREO | | | (34,435) | | | | | | (44,205) | | | | | | (78,640) | |
| | | | | |
Non-performing loans charged-off | | | (164,015) | | | | | | (51,512) | | | | | | (215,527) | |
| | | | | |
Loans returned to accrual status / loan collections | | | (194,657) | | | | | | (70,869) | | | | | | (265,526) | |
| | | | | |
Loans in accrual status transfer to held-for-sale | | | - | | | | | | (6,693) | | | | | | (6,693) | |
| | | | | |
Other | | | (3,300) | | | | | | - | | | | | | (3,300) | |
| |
| | | | | |
Ending balance - NPLs | | | $ 522,733 | | | | | | $ 142,556 | | | | | | $ 665,289 | |
| |
For the year ended December 31, 2013, inflows of commercial non-performing loans held-in-portfolio at the BPPR segment amounted to $179 million, a decrease of $107 million, or 37%, when compared to inflows for the same period in 2012. Inflows of commercial non-performing loans held-in-portfolio at the BPNA segment amounted to $58 million, a decrease of $54 million, or 48%, compared to inflows for 2012. These reductions are driven by improvements in the underlying quality of the loan portfolio and proactive portfolio management processes.
Table 43 provides information on commercial non-performing loans and net charge-offs for the years ended December 31, 2013, December 31, 2012, and December 31, 2011 for the BPPR (excluding the Westernbank covered loan portfolio) and BPNA reportable segments.
Table 43 - Non-Performing Commercial Loans and Net Charge-offs (Excluding Covered Loans)
| | | | | | | | | | | | | | | | | | | | | | | | | | | | | | | | | | | | | | | | | | |
| | | | | | | | | | | | | |
| | | BPPR | | | | | BPNA | | | | | Popular, Inc. | |
| | | | | | | | | | | | |
| (Dollars in thousands) | | December 31,
2013 | | | December
31, 2012 | | | December
31, 2011 | | | | | December
31, 2013 | | | December
31, 2012 | | | December
31, 2011 | | | | | December
31, 2013 | | | | | December
31, 2012 | | | December
31, 2011 | |
| | | | | | | | | | | | | | | | | | | |
| | | | | | | | | | | | |
Non-performing commercial loans | | $ | 186,097 | $ | | | 522,733 | $ | | | 631,171 | | | $ | | | 92,956 | $ | | | 142,556 | $ | | | 198,921 | | | $ | | | 279,053 | | | $ | | | 665,289 | $ | | | 830,092 | |
| | | | | | | | | | | | |
Non-performing commercial loans to commercial loans HIP | | | 2.88 | % | | | 8.30 | % | | | 9.75 | | | % | | | 2.60 | % | | | 4.00 | % | | | 5.68 | | | % | | | 2.78 | | | % | | | 6.75 | % | | | 8.32 % | |
| |
| | | | | |
| | | BPPR | | | | | BPNA | | | | | Popular, Inc. | |
| | | For the year ended | | For the year ended | | | | | For the year ended | |
| | | | | | | | | | | | |
| (Dollars in thousands) | | December
31, 2013 | | | December
31, 2012 | | | December
31, 2011 | | | | | December
31, 2013 | | | December
31, 2012 | | | December
31, 2011 | | | | | December
31, 2013 | | | | | December
31, 2012 | | | December
31, 2011 | |
| | | | | | | | | | | | | | | | | | | |
| | | | | | | | | | | | |
Commercial loan net charge-offs | | $ | 85,601 | $ | | | 144,640 | $ | | | 195,388 | | | $ | | | 23,368 | $ | | | 44,653 | $ | | | 76,557 | | | $ | | | 108,969 | | | $ | | | 189,293 | $ | | | 271,945 | |
| | | | | | | | | | | | |
Commercial loan net charge-offs to average commercial loans HIP | | | 1.37 | % | | | 2.30 | % | | | 3.00 | | | % | | | 0.65 | % | | | 1.29 | % | | | 2.10 | | | % | | | 1.11 | | | % | | | 1.94 | % | | | 2.68 % | |
| |
85
There is one commercial loan relationship greater than $10 million in non-accrual status with an outstanding aggregate balance of $15 million at December 31, 2013, compared with two commercial loan relationships with an outstanding aggregate balance of $24 million at December 31, 2012.
Commercial loan net charge-offs, excluding net charge-offs for covered loans and write-downs related to the bulk asset sale, amounted to $109.0 million for the year ended December 31, 2013, compared to $189.3 million in December 31, 2012 and $271.9 million in December 31, 2011. Commercial loans annualized net charge-offs to average non-covered loans held-in-portfolio decreased to 1.11% for the year ended December 31, 2013 from 1.94% for the year ended December 31, 2012 and 2.68% for the year ended December 31, 2011. Commercial loan net charge-offs, excluding net charge-offs for covered loans and the impact of the sale, decline of $80.3 million, or 42%, for the year ended December 31, 2013 when compared with the year ended December 31, 2012 was primarily due to improvements in credit quality and successful actions taken by the Corporation to address problem loans.
Excluding the impact of the sale, commercial loan net charge-offs in the BPPR segment amounted to $85.6 million for the year ended December 31, 2013, compared to $144.6 million in December 31, 2012 and $195.4 million in December 31, 2011. Commercial loans annualized net charge-offs to average non-covered loans held-in-portfolio decreased to 1.37% for the year ended December 31, 2013 from 2.30% for the year ended December 31, 2012 and 3.00% for the year ended December 31, 2011. Commercial loan net charge-offs declined by $59.0 million for the year ended December 31, 2013 when compared with the year ended December 31, 2012, as the portfolio continued to show improving trends. For the year ended December 31, 2013, the charge-offs associated with collateral dependent commercial loans amounted to approximately $107.1 million in the BPPR segment.
Commercial loan net charge-offs in the BPNA segment amounted to $23.4 million for the year ended December 31, 2013, compared to $44.7 million in December 31, 2012 and $76.6 million in December 31, 2011. Commercial loans annualized net charge-offs to average non-covered loans held-in-portfolio decreased to 0.65% for the year ended December 31, 2013 from 1.29% for the year ended December 31, 2012, and 2.10% for the year ended December 31, 2011. Commercial loan net charge-offs declined by $21.3 million for the year ended December 31, 2013 when compared with the same period in 2012. For the year ended December 31, 2013, the charge-offs associated with collateral dependent commercial loans amounted to approximately $8.7 million in the BPNA segment.
The Corporation’s commercial loan portfolio secured by real estate (“CRE”), excluding covered loans, amounted to $6.4 billion at December 31, 2013, of which $2.3 billion was secured with owner occupied properties, compared with $6.5 billion and $2.8 billion, respectively, at December 31, 2012. CRE non-performing loans, excluding covered loans, amounted to $221 million at December 31, 2013, compared with $528 million at December 31, 2012. The CRE non-performing loans ratios for the BPPR and BPNA segments were 3.80% and 3.10%, respectively, at December 31, 2013, compared with 11.13% and 4.73%, respectively, at December 31, 2012.
Construction loans
Non-covered non-performing construction loans held-in-portfolio amounted to $24 million at December 31, 2013, compared to $43 million at December 31, 2012, and $96 million at December 31, 2011. The decrease of $20 million, or 45%, from December 31, 2012 was mainly driven by the BPPR segment with declines of $19 million, principally driven by the resolution of a significant borrower, minimal inflows of new construction non-performing loans and $3.5 million in non-performing loans sold during the first quarter of 2013. Stable credit trends in the construction portfolio are the result of de-risking strategies executed by the Corporation over the past several years to downsize its construction loan portfolio. The ratio of non-performing construction loans to construction loans held-in-portfolio, excluding covered loans, decreased to 11.53% at December 31, 2013 from 17.14% at December 31, 2012, and 40.13% at December 31, 2011.
Tables 44 and 45 present changes in non-performing construction loans held-in-portfolio for the years ended December 31, 2013 and 2012 for the BPPR (excluding covered loans) and BPNA segments.
86
Table 44 - Activity in Non-Performing Construction Loans Held-In-Portfolio (Excluding Covered Loans)
| | | | | | | | | | | | |
| | | For the year ended December 31, 2013 | |
(In thousands) | | BPPR | | | BPNA | | | Popular, Inc. | |
| |
| | | |
Beginning Balance - NPLs | | | $ 37,390 | | | | $ 5,960 | | | | $ 43,350 | |
| | | |
Plus: | | | | | | | | | | | | |
| | | |
New non-performing loans | | | 2,000 | | | | - | | | | 2,000 | |
| | | |
Loans transferred from held-for-sale | | | 14,152 | | | | - | | | | 14,152 | |
| | | |
Less: | | | | | | | | | | | | |
| | | |
Non-performing loans transferred to OREO | | | (775) | | | | - | | | | (775) | |
| | | |
Non-performing loans charged-off | | | (6,210) | | | | - | | | | (6,210) | |
| | | |
Loans returned to accrual status / loan collections | | | (24,965) | | | | (297) | | | | (25,262) | |
| | | |
Non-performing loans sold | | | (3,484) | | | | - | | | | (3,484) | |
| |
| | | |
Ending balance - NPLs | | | $ 18,108 | | | | $ 5,663 | | | | $ 23,771 | |
| |
Table 45 - Activity in Non-Performing Construction Loans Held-in-Portfolio (Excluding Covered Loans)
| | | | | | | | | | | | |
| | | For the year ended December 31, 2012 | |
| (In thousands) | | BPPR | | | BPNA | | | Popular, Inc. | |
| |
| | | |
Beginning Balance - NPLs | | | $ 53,859 | | | | $ 42,427 | | | | $ 96,286 | |
| | | |
Plus: | | | | | | | | | | | | |
| | | |
New non-performing loans | | | 13,377 | | | | - | | | | 13,377 | |
| | | |
Advances on existing non-performing loans | | | 145 | | | | 465 | | | | 610 | |
| | | |
Other | | | 3,300 | | | | - | | | | 3,300 | |
| | | |
Less: | | | | | | | | | | | | |
| | | |
Non-performing loans transferred to OREO | | | (280) | | | | (3,605) | | | | (3,885) | |
| | | |
Non-performing loans charged-off | | | (3,576) | | | | (1,644) | | | | (5,220) | |
| | | |
Loans returned to accrual status / loan collections | | | (28,296) | | | | (21,351) | | | | (49,647) | |
| | | |
Loans in accrual status transfer to held-for-sale | | | - | | | | (10,332) | | | | (10,332) | |
| | | |
Other | | | (1,139) | | | | - | | | | (1,139) | |
| |
| | | |
Ending balance - NPLs | | | $ 37,390 | | | | $ 5,960 | | | | $ 43,350 | |
| |
For the year ended December 31, 2013, inflows of construction non-performing loans held-in-portfolio at the BPPR segment amounted to $2 million, a decrease of $11.5 million, or 85%, when compared to additions for the year ended December 31, 2012. There were no additions of construction non-performing loans held-in-portfolio at the BPNA segment during 2013. This declining trend is the result of the Corporation’s efforts to significantly reduce its construction loan exposure.
There are no construction loan relationships greater than $10 million in non-performing status at December 31, 2013, compared with one construction loan relationship with an aggregate outstanding balance of $11 million at December 31, 2012.
Construction loan net charge-offs (recoveries), excluding net charge-offs for covered loans, amounted to recoveries of $8.6 million for the year ended December 31, 2013, compared to recoveries $1.9 million in December 31, 2012 and net charge-offs of $8.8 million in December 31, 2011. Construction loans annualized net charge-offs (recoveries) to average non-covered loans held-in-portfolio decreased to (3.13%) for the year ended December 31, 2013 from (0.77%) for the year ended December 31, 2012 and 3.22% for the year ended December 31, 2011. Construction loan net charge-offs, excluding covered loans, for the year ended December 31, 2013, decreased by $6.8 million when compared with the year ended December 31, 2012 led by a reduction of $6.4 million in the BPPR segment, mainly due to higher level of recoveries. For the year ended December 31, 2013, the charge-offs associated with collateral dependent construction loans amounted to $3.9 million in the BPPR segment and none in the BPNA segment. Management identified construction loans considered impaired and charged-off specific reserves based on the value of the collateral.
87
Table 46 provides information on construction non-performing loans and net charge-offs for the BPPR and BPNA (excluding the covered loan portfolio) segments for the years ended December 31, 2013, December 31, 2012, and December 31, 2011.
Table 46 - Non-Performing Construction Loans and Net Charge-offs (Excluding Covered Loans)
| | | | | | | | | | | | | | | | | | | | | | | | | | | | | | | | | | | | | | | | | | | | | | |
| | | | | | | | | | | | | |
| | | | | | |
| | | | | BPPR | | | | | BPNA | | | | | Popular, Inc. | |
| | | | | | | | | | | | | | |
| (Dollars in thousands) | | | | December 31,
2013 | | | December
31, 2012 | | | December
31, 2011 | | | | | December
31, 2013 | | | | | December
31, 2012 | | | December
31, 2011 | | | | | December
31, 2013 | | | | | December
31, 2012 | | | December
31, 2011 | |
| | | | | | | | | | | | | | | | | | | | | | | | | | | | | | |
| | | | | | | | | | | | | | |
Non-performing construction loans | | $ | | | 18,108 | $ | | | 37,390 | $ | | | 53,859 | | | $ | | | 5,663 | | | $ | | | 5,960 | $ | | | 42,427 | | | $ | | | 23,771 | | | $ | | | 43,350 | $ | | | 96,286 | |
| | | | | | | | | | | | | | |
Non-performing construction loans to construction loans HIP | | | | | 11.24 | % | | | 17.61 | % | | | 33.47 | | | % | | | 12.61 | | | % | | | 14.68 | % | | | 53.71 | | | % | | | 11.53 | | | % | | | 17.14 | % | | | 40.13 % | |
| |
| | | | | | |
| | | | | BPPR | | | | | BPNA | | | | | Popular, Inc. | |
| | | | |
| | | | | For the year ended | | For the year ended | | For the year ended | |
| | | | | | | | | | | | | | |
| (Dollars in thousands) | | | | December
31, 2013 | | | December
31, 2012 | | | December
31, 2011 | | | | | December
31, 2013 | | | | | December
31, 2012 | | | December
31, 2011 | | | | | December
31, 2013 | | | | | December
31, 2012 | | | December
31, 2011 | |
| | | | | | | | | | | | | |
| | | | | | | | | | | | | | |
Construction loan net charge-offs (recoveries) | | $ | | | (8,642) | $ | | | (2,283) | $ | | | 5,816 | | | $ | | | - | | | $ | | | 400 | $ | | | 2,944 | | | $ | | | (8,642) | | | $ | | | (1,883) | $ | | | 8,760 | |
| | | | | | | | | | | | | | |
Construction loan net charge-offs to average construction loans HIP | | | | | (3.57) | % | | | (1.19) | % | | | 3.82 | | | % | | | - | | | % | | | 0.77 | % | | | 2.46 | | | % | | | (3.13) | | | % | | | (0.77) | % | | | 3.22 % | |
| |
Legacy loans
The legacy portfolio is comprised of commercial loans, construction loans and lease financings related to certain lending products exited by the Corporation as part of restructuring efforts carried out in prior years at the BPNA segment.
Legacy non-performing loans held-in-portfolio amounted to $15 million at December 31, 2013, compared with $41 million at December 31, 2012, and $76 million at December 31, 2011. The decrease of $26 million, or 63%, from December 31, 2012 was primarily driven by lower inflows to non-performing loans, loan resolutions and portfolio run-off. The percentage of non-performing legacy loans held-in-portfolio to legacy loans held-in-portfolio decreased to 7.13% at December 31, 2013 from 10.60% at December 31, 2012, and 11.67% at December 31, 2011.
For the year ended December 31, 2013, additions to legacy loans in non-performing status amounted to $17 million, a decrease of $27 million, or 62%, when compared with the year ended December 31, 2012. The decrease in the inflows of non-performing legacy loans reflects improvements in overall loan credit performance.
Tables 47 and 48 present the changes in non-performing legacy loans held in-portfolio for the years ended December 31, 2013 and December 31, 2012.
88
Table 47 - Activity in Non-Performing Legacy Loans Held-In-Portfolio (Excluding Covered Loans)
| | | | | | | | | | | | |
| | | For the year ended December 31, 2013 | |
| | | |
| (In thousands) | | BPPR | | | BPNA | | | Popular, Inc. | |
| |
| | | |
Beginning Balance - NPLs | | | $ - | | | | $ 40,741 | | | | $ 40,741 | |
| | | |
Plus: | | | | | | | | | | | | |
| | | |
New non-performing loans | | | - | | | | 16,645 | | | | 16,645 | |
| | | |
Advances on existing non-performing loans | | | - | | | | 150 | | | | 150 | |
| | | |
Loans transferred from held-for-sale | | | - | | | | 400 | | | | 400 | |
| | | |
Less: | | | | | | | | | | | | |
| | | |
Non-performing loans charged-off | | | - | | | | (19,426) | | | | (19,426) | |
| | | |
Loans returned to accrual status / loan collections | | | - | | | | (19,151) | | | | (19,151) | |
| | | |
Other | | | - | | | | (4,309) | | | | (4,309) | |
| |
| | | |
Ending balance - NPLs | | $ | - | | | $ | 15,050 | | | $ | 15,050 | |
| |
Table 48 - Activity in non-Performing Legacy Loans Held-in-Portfolio (Excluding Covered Loans)
| | | | | | | | | | | | |
| | | For the year ended December 31, 2012 | |
(In thousands) | | BPPR | | | BPNA | | | Popular, Inc. | |
| |
| | | |
Beginning Balance - NPLs | | | $ - | | | | $ 75,660 | | | | $ 75,660 | |
| | | |
Plus: | | | | | | | | | | | | |
| | | |
New non-performing loans | | | - | | | | 44,076 | | | | 44,076 | |
| | | |
Advances on existing non-performing loans | | | - | | | | 17 | | | | 17 | |
| | | |
Less: | | | | | | | | | | | | |
| | | |
Non-performing loans transferred to OREO | | | - | | | | (3,485) | | | | (3,485) | |
| | | |
Non-performing loans charged-off | | | - | | | | (31,973) | | | | (31,973) | |
| | | |
Loans returned to accrual status / loan collections | | | - | | | | (22,742) | | | | (22,742) | |
| | | |
Loans in accrual status transfer to held-for-sale | | | - | | | | (20,812) | | | | (20,812) | |
| |
| | | |
Ending balance - NPLs | | | $ - | | | | $ 40,741 | | | | $ 40,741 | |
| |
In the loans held-in-portfolio, there was no legacy loan relationship greater than $10 million in non-accrual status at December 31, 2013 and December 31, 2012.
Legacy loan net charge-offs (recoveries) amounted to recoveries of $2.6 million for the year ended December 31, 2013, compared to net charge-offs of $16.3 million in December 31, 2012 and $52.3 million in December 31, 2011. Legacy loan net charge-offs (recoveries) to average non-covered loans held-in-portfolio decreased to (0.99%) for the year ended December 31, 2013 from 3.12% for the year ended December 31, 2012 and 6.42% for the year ended December 31, 2011. For the year ended December 31, 2013, legacy net charge-offs decreased by $19.0 million when compared with the year ended December 31, 2012. Net charge-offs stability reflects improvements in net charge-offs reflective of higher level of recoveries, lower level of problem loans and the continued run-off of the portfolio. For the year ended December 31, 2013, the charge-offs associated with collateral dependent legacy loans amounted to approximately $1.2 million.
Table 49 provides information on legacy non-performing loans and net charge-offs.
89
Table 49 - Non-Performing Legacy Loans and Net Charge-offs
| | | | | | | | | | | | |
| | | BPNA | |
| | | |
| (Dollars in thousands) | | December 31, 2013 | | | December 31, 2012 | | | December 31, 2011 | |
| |
| | | |
Non-performing legacy loans | | $ | 15,050 | | | $ | 40,741 | | | $ | 75,660 | |
| | | |
Non-performing legacy loans to legacy loans HIP | | | 7.13 | % | | | 10.60 | % | | | 11.67 % | |
| |
| | | BPNA | |
| |
| | | For the year ended | |
| | | |
| (Dollars in thousands) | | December 31, 2013 | | | December 31, 2012 | | | December 31, 2011 | |
| |
| | | |
Legacy loan net (recoveries) charge-offs | | $ | (2,583) | | | $ | 16,338 | | | $ | 52,323 | |
| | | |
Legacy loan net (recoveries) charge-offs to average legacy loans HIP | | | (0.99) | % | | | 3.12 | % | | | 6.42 % | |
| |
Mortgage loans
Non-covered non-performing mortgage loans held-in-portfolio were $233 million at December 31, 2013, compared to $630 million at December 31, 2012, and $687 million at December 31, 2011. The decrease of $398 million from December 31, 2012 was driven by reductions of $390 million and $8 million in the BPPR and BPNA segments, respectively. The decrease in the BPPR segment was principally due to the impact of the bulk loan sale with a book value of approximately $435 million during the second quarter of 2013. Excluding the impact of the sale, mortgage non-covered non-performing loans increased by $45 million. Although mortgage non-performing loan inflows continued decreasing, low NPL balances resulting from the bulk sale have led to reduced level of outflows.
Tables 50 and 51 present changes in non-performing mortgage loans held-in-portfolio for the years ended December 31, 2013 and 2012 for the BPPR (excluding covered loans) and BPNA segments.
Table 50 - Activity in Non-Performing Mortgage Loans Held-in-Portfolio (Excluding Covered Loans)
| | | | | | | | | | | | |
| | | For the year ended December 31, 2013 | |
| | | |
| (In thousands) | | BPPR | | | BPNA | | | Popular, Inc. | |
| |
| | | |
Beginning Balance - NPLs | | | $ 596,106 | | | | $ 34,024 | | | | $ 630,130 | |
| | | |
Plus: | | | | | | | | | | | | |
| | | |
New non-performing loans | | | 397,086 | | | | 22,253 | | | | 419,339 | |
| | | |
Less: | | | | | | | | | | | | |
| | | |
Non-performing loans transferred to OREO | | | (44,762 | ) | | | (3,799 | ) | | | (48,561) | |
| | | |
Non-performing loans charged-off | | | (32,299 | ) | | | (8,362 | ) | | | (40,661) | |
| | | |
Loans returned to accrual status / loan collections | | | (260,167 | ) | | | (17,824 | ) | | | (277,991) | |
| | | |
Loans transferred to held-for-sale | | | (14,968 | ) | | | - | | | | (14,968) | |
| | | |
Non-performing loans sold | | | (434,607 | ) | | | - | | | | (434,607) | |
| |
| | | |
Ending balance - NPLs | | | $ 206,389 | | | | $ 26,292 | | | | $ 232,681 | |
| |
90
Table 51 - Activity in Non-Performing Mortgage Loans Held-in-Portfolio (Excluding Covered Loans)
| | | | | | | | | | | | |
| | | For the year ended December 31, 2012 | |
(In thousands) | | BPPR | | | BPNA | | | Popular, Inc. | |
| |
| | | |
Beginning Balance - NPLs | | | $ 649,279 | | | | $ 37,223 | | | | $ 686,502 | |
| | | |
Plus: | | | | | | | | | | | | |
| | | |
New non-performing loans | | | 675,875 | | | | 30,293 | | | | 706,168 | |
| | | |
Less: | | | | | | | | | | | | |
| | | |
Non-performing loans transferred to OREO | | | (82,211) | | | | (7,018) | | | | (89,229) | |
| | | |
Non-performing loans charged-off | | | (69,336) | | | | (11,101) | | | | (80,437) | |
| | | |
Loans returned to accrual status / loan collections | | | (577,501) | | | | (15,373) | | | | (592,874) | |
| |
| | | |
Ending balance - NPLs | | | $ 596,106 | | | | $ 34,024 | | | | $ 630,130 | |
| |
For the year ended December 31, 2013, inflows of mortgage non-performing loans held-in-portfolio at the BPPR segment amounted to $397 million, a decrease of $279 million, or 41%, when compared to inflows for the same period in 2012. Inflows of mortgage non-performing loans held-in-portfolio at the BPNA segment amounted to $22 million, a decrease of $8 million, or 27%, compared to inflows for 2012.
Mortgage loan net charge-offs, excluding net charge-offs for covered loans and write-downs related to the bulk asset sale, amounted to $55.5 million for the year ended December 31, 2013, compared to $71.9 million in December 31, 2012 and $41.8 million in December 31, 2011. Mortgage loan net charge-offs to average mortgage non-covered loans held-in-portfolio was 0.85% in December 31, 2013, compared to 1.27% for the year ended December 31, 2012, and 0.83% for the year ended December 31, 2011. Mortgage loan net charge-offs, excluding covered loans and the impact of the sale, decrease of $16.4 million for the year ended December 31, 2013, when compared with the same period in 2012 was mainly related to lower inflows to non-performing loans and certain stabilization in economic conditions.
Mortgage loan net charge-offs at the BPPR segment, excluding covered loans and the impact of the sale, amounted to $47.7 million, or 0.89% of average non-covered loans held-in-portfolio on an annualized basis, a decrease of $9.0 million when compared to same period in 2012. For the year ended December 31, 2013, charge-offs associated with mortgage loans individually evaluated for impairment amounted to $11.9 million in the BPPR segment.
Mortgage loan net charge-offs at the BPNA segment amounted to $7.8 million for the year ended December 31, 2013, a decrease of $7.4 million when compared to same period in 2012. Mortgage loan net charge-offs to average mortgage non-covered loans held-in-portfolio decreased to 0.64% for the year ended December 31, 2013 from 1.52% for the year ended December 31, 2012. The net charge-offs for BPNA’s non-conventional mortgage loan portfolio amounted to approximately $7.7 million, or 1.77% of average non-conventional mortgage loans held-in-portfolio, for the year ended December 31, 2013, compared with $10.6 million, or 2.26% of average loans for the year ended December 31, 2012.
Table 52 provides information on mortgage non-performing loans and net charge-offs for the BPPR and BPNA (excluding the covered loan portfolio) segments for the years ended December 31, 2013, 2012, and 2011.
91
Table 52 - Non-Performing Mortgage Loans and Net Charge-offs (Excluding Covered Loans)
| | | | | | | | | | | | | | | | | | | | | | | | | | | | | | | | | | | | |
| | | BPPR | | | BPNA | | | Popular, Inc. | |
(Dollars in thousands) | | December 31,
2013 | | | December 31,
2012 | | | December 31,
2011 | | | December 31,
2013 | | | December 31,
2012 | | | December 31,
2011 | | | December 31,
2013 | | | December 31,
2012 | | | December 31,
2011 | |
| | | | | | | | | |
| | | | | | | | | |
Non-performing mortgage loans | | $ | 206,389 | | | $ | 596,106 | | | $ | 649,279 | | | $ | 26,292 | | | $ | 34,024 | | | $ | 37,223 | | | $ | 232,681 | | | $ | 630,130 | | | $ | 686,502 | |
| | | | | | | | | |
Non-performing mortgage loans to mortgage loans HIP | | | 3.82 | % | | | 12.05 | % | | | 13.85 | % | | | 2.05 | % | | | 3.01 | % | | | 4.49 | % | | | 3.48 | % | | | 10.37 | % | | | 12.44 % | |
| |
| | | |
| | | BPPR | | | BPNA | | | Popular, Inc. | |
| | | For the year ended | | | | For the year ended | | | | For the year ended | |
(Dollars in thousands) | |
| December 31,
2013 |
| |
| December 31,
2012 |
| |
| December 31,
2011 |
| |
| December 31,
2013 |
| |
| December 31,
2012 |
| |
| December 31,
2011 |
| |
| December 31,
2013 |
| |
| December 31,
2012 |
| |
| December 31,
2011 |
|
| | | | |
| | | | | | | | | |
Mortgage loan net charge-offs | | $ | 47,736 | | | $ | 56,777 | | | $ | 27,624 | | | $ | 7,803 | | | $ | 15,163 | | | $ | 14,187 | | | $ | 55,539 | | | $ | 71,940 | | | $ | 41,811 | |
| | | | | | | | | |
Mortgage loan net charge-offs to average mortgage loans HIP | | | 0.89 | % | | | 1.21 | % | | | 0.66 | % | | | 0.64 | % | | | 1.52 | % | | | 1.67 | % | | | 0.85 | % | | | 1.27 | % | | | 0.83 % | |
| |
Consumer loans
Non-covered non-performing consumer loans held-in-portfolio were $44 million at December 31, 2013, compared to $41 million at December 31, 2012, and $44 million at December 31, 2011. Consumer non-covered non-performing loans held-in-portfolio increased slightly by $3 million when compared to December 31, 2012, primarily as a result of an increase of $2.3 million in the BPPR segment, mainly related to personal and auto loans.
For the year ended December 31, 2013, inflows of consumer non-performing loans held-in-portfolio at the BPPR segment amounted to $88 million, a decrease of $2 million, or 2%, when compared to inflows for the same period of 2012. Inflows of consumer non-performing loans held-in-portfolio at the BPNA segment amounted to $27 million, a decrease of $12 million, or 31% compared to inflows for 2012.
The Corporation’s consumer loan net charge-offs, excluding covered loans, amounted to $97.0 million for the year ended December 31, 2013, compared to $126.1 million in December 31, 2012 and $155.8 million in December 31, 2011. Consumer loan net charge-offs to average consumer non-covered loans held-in-portfolio decreased to 2.50% for the year ended December 31, 2013 from 3.36% for December 31, 2012 and 4.26% for December 31, 2011. Consumer loan net charge-offs, excluding covered loans, decrease of $29.1 million for the year ended December 31, 2013, when compared with the same period in 2012, was driven by reductions of $14.5 million and $14.6 million in the BPPR and BPNA segments, respectively, led by improved credit quality of the portfolios. In addition, net charge-offs include an $8.9 million recovery associated with an opportunistic sale of a portfolio of previously charged-off credit cards and personal loans in the BPPR segment.
Table 53 provides information on consumer non-performing loans and net charge-offs by reportable segments.
92
Table 53 - Non-Performing Consumer Loans and Net Charge-offs (Excluding Covered Loans)
| | | | | | | | | | | | | | | | | | | | | | | | | | | | | | | | | | | | |
| | | BPPR | | | BPNA | | | Popular, Inc. | |
(Dollars in
thousands) | | December 31,
2013 | | | December 31,
2012 | | | December 31,
2011 | | | December 31,
2013 | | | December 31,
2012 | | | December 31,
2011 | | | December 31,
2013 | | | December 31,
2012 | | | December 31,
2011 | |
| | | | | | | | | |
| | | | | | | | | |
Non-performing consumer loans | | $ | 33,166 | | | $ | 30,888 | | | $ | 31,291 | | | $ | 10,732 | | | $ | 9,870 | | | $ | 12,377 | | | $ | 43,898 | | | $ | 40,758 | | | $ | 43,668 | |
| | | | | | | | | |
Non-performing consumer loans to consumer loans HIP | | | 1.00 | % | | | 0.96 | % | | | 1.05 | % | | | (1.74 | )% | | | 1.56 | % | | | 1.76 | % | | | 1.63 | % | | | 1.05 | % | | | 1.19 % | |
| |
| | | |
| | | BPPR | | | BPNA | | | Popular, Inc. | |
| | | For the year ended | | | For the year ended | | | For the year ended | |
(Dollars in
thousands) | | December 31,
2013 | | | December 31,
2012 | | | December 31,
2011 | | | December 31,
2013 | | | December 31,
2012 | | | December 31,
2011 | | | December 31,
2013 | | | December 31,
2012 | | | December 31,
2011 | |
| | | | | | | | | | | | |
| | | | | | | | | |
Consumer loan net charge-offs | | $ | 75,560 | | | $ | 90,095 | | | $ | 98,648 | | | $ | 21,411 | | | $ | 36,004 | | | $ | 57,118 | | | $ | 96,971 | | | $ | 126,099 | | | $ | 155,766 | |
| | | | | | | | | |
Consumer loan net charge-offs to average consumer loans HIP | | | 2.32 | % | | | 2.93 | % | | | 3.40 | % | | | 3.43 | % | | | 5.38 | % | | | 7.59 | % | | | 2.50 | % | | | 3.36 | % | | | 4.26 % | |
| |
Combined net charge-offs for E-LOAN’s home equity lines of credit and closed-end second mortgages amounted to approximately $10.8 million, or 3.78% of those particular average loan portfolios, for the year ended December 31, 2013, compared with $21.2 million, or 6.27%, for the year ended December 31, 2012. With the downsizing of E-LOAN, this subsidiary ceased originating these types of loans in 2008. Home equity lending includes both home equity loans and lines of credit. This type of lending, which is secured by a first or second mortgage on the borrower’s residence, allows customers to borrow against the equity in their home. Real estate market values at the time the loan or line is granted directly affect the amount of credit extended and, in addition, changes in these values impact the severity of losses. E-LOAN’s portfolio of home equity lines of credit and closed-end second mortgages outstanding at December 31, 2013 totaled $259 million with a related allowance for loan losses of $11 million, representing 4.05% of that particular portfolio. E-LOAN’s portfolio of home equity lines of credit and closed-end second mortgages outstanding at December 31, 2012 totaled $312 million with a related allowance for loan losses of $17 million, representing 5.47% of that particular portfolio. At December 31, 2013, home equity lines of credit and closed-end second mortgages in which E-LOAN holds both the first and second lien amounted to $47 thousand and $289 thousand, respectively, representing 0.01% and 0.05%, respectively, of the consumer loan portfolio of the BPNA segment. At December 31, 2013, 48% are paying the minimum amount due on the home equity lines of credit. At December 31, 2013, the majority of the closed-end second mortgages in which E-LOAN holds the first lien mortgage were in performing status.
Other real estate
Other real estate represents real estate property acquired through foreclosure, part of the Corporation’s continuous efforts to aggressively resolve non-performing loans. Other real estate not covered under loss sharing agreements with the FDIC decreased by $131 million from December 31, 2012 to the same date in 2013, driven by decreases in the BPPR related to the bulk sale and the BPNA segments of $110 million and $21 million, respectively.
Other real estate covered under loss sharing agreements with the FDIC, comprised principally of repossessed commercial real estate properties, amounted to $168 million at December 31, 2013, compared with $139 million at the same date in 2012. Generally, 80% of the write-downs taken on these properties based on appraisals or losses on the sale are covered under the loss sharing agreements.
During 2013, the Corporation transferred $233 million of loans to other real estate, sold $293 million of foreclosed properties and recorded write-downs and other adjustments of approximately $42 million.
93
Updated appraisals or third-party opinions of value (“BPOs”) are obtained to adjust the values of the other real estate assets. Commencing in 2011, the appraisal for a commercial or construction other real estate property with a book value greater than $1 million is updated annually and if lower than $1 million it is updated at least every two years. For residential other real estate property, the Corporation requests third-party BPOs or appraisals generally on an annual basis. Appraisals may be adjusted due to age, collateral inspections and property profiles or due to general marked conditions. The adjustments applied are based upon internal information like other appraisals for the type of properties and loss severity information that can provide historical trends in the real estate market, and may change from time to time based on market conditions.
For commercial and construction other real estate properties at the BPPR segment, depending on the type of property and/or the age of the appraisal, downward adjustments currently may range between 5% to 40%, including estimated cost to sell. For commercial and construction properties at the BPNA segment, the most typically applied collateral discount rate currently ranges from 10% to 50%, including cost to sell. This discount was determined based on a study of other real estate owned and loan sale transactions during the past two years, comparing net proceeds received by the lender relative to the most recent appraised value of the properties. However, additional haircuts can be applied depending upon the age of appraisal, the region and the condition of the property or project.
Currently, in the case of the BPPR segment, appraisals of residential properties were subject to downward adjustments of up to approximately 15%, including cost to sell of 5%. In the case of the U.S. mainland residential properties, the downward adjustment approximated up to 30%, including cost to sell of 10%.
Troubled debt restructurings
The following tables present the loans classified as TDRs according to their accruing status at December 31, 2013, 2012 and 2011.
The Corporation’s TDR loans totaled $950 million at December 31, 2013, a decrease of $201 million, or 17%, from December 31, 2012, including decreases of $125 million and $58 million in the commercial and mortgage portfolios at the BPPR segment, respectively, primarily related to the bulk loan sales completed during the first half of the year. TDRs in accruing status increased by $121 million from December 31, 2012, due to sustained borrower performance.
Table 54 - TDRs Non-Covered Loans 2013
| | | | | | | | | | | | |
| | | December 31, 2013 | |
| (In thousands) | | Accruing | | | Non-Accruing | | | Total | |
| |
Commercial | | $ | 109,462 | | | | $ 80,140 | | | | $ 189,602 | |
Construction | | | 425 | | | | 10,865 | | | | 11,290 | |
Legacy | | | - | | | | 949 | | | | 949 | |
Mortgage | | | 535,357 | | | | 82,786 | | | | 618,143 | |
Leases | | | 270 | | | | 2,623 | | | | 2,893 | |
Consumer | | | 116,719 | | | | 10,741 | | | | 127,460 | |
| |
Total | | $ | 762,233 | | | | $ 188,104 | | | | $ 950,337 | |
| |
Table 55 - TDRs Non-Covered Loans 2012
| | | | | | | | | | | | |
| | | December 31, 2012 | |
| (In thousands) | | Accruing | | | Non-Accruing | | | Total | |
| |
Commercial | | $ | 105,648 | | | | $ 208,119 | | | | $ 313,767 | |
Construction | | | 2,969 | | | | 10,310 | | | | 13,279 | |
Legacy | | | - | | | | 5,978 | | | | 5,978 | |
Mortgage | | | 405,063 | | | | 273,042 | | | | 678,105 | |
Leases | | | 1,726 | | | | 3,155 | | | | 4,881 | |
Consumer | | | 125,955 | | | | 8,981 | | | | 134,936 | |
| |
Total | | $ | 641,361 | | | | $ 509,585 | | | | $ 1,150,946 | |
| |
Table 56 - TDRs Non-Covered Loans 2011
| | | | | | | | | | | | |
| | | December 31, 2011 | |
| (In thousands) | | Accruing | | | Non-Accruing | | | Total | |
| |
Commercial | | $ | 36,848 | | �� | | $ 171,520 | | | | $ 208,368 | |
Construction | | | - | | | | 28,024 | | | | 28,024 | |
Legacy | | | - | | | | 26,906 | | | | 26,906 | |
Mortgage | | | 252,277 | | | | 218,715 | | | | 470,992 | |
Leases | | | 3,085 | | | | 3,118 | | | | 6,203 | |
Consumer | | | 134,409 | | | | 5,848 | | | | 140,257 | |
| |
Total | | $ | 426,619 | | | | $ 454,131 | | | | $ 880,750 | |
| |
94
Tables 57 and 58 present the covered loans classified as TDRs according to their accruing status at December 31, 2013 and 2012.
| | | | | | | | | | | | |
| Table 57 -TDRs Covered Loans 2013 | | | | | | | | | | | | |
| | | | |
| (In thousands) | | Accruing | | | Non-Accruing | | | Total | |
| |
Commercial | | $ | 7,389 | | | | $ 10,017 | | | | $ 17,406 | |
Construction | | | - | | | | 3,464 | | | | 3,464 | |
Mortgage | | | 146 | | | | 189 | | | | 335 | |
Consumer | | | 221 | | | | 22 | | | | 243 | |
| |
Total | | $ | 7,756 | | | | $ 13,692 | | | | $ 21,448 | |
| |
| | | | | | | | | | | | |
Table 58 -TDRs Covered Loans 2012 | | | | | | | | | | | | |
| (In thousands) | | Accruing | | | Non-Accruing | | | Total | |
| |
Commercial | | $ | 46,142 | | | | $ 4,071 | | | | $ 50,213 | |
Construction | | | - | | | | 7,435 | | | | 7,435 | |
Mortgage | | | 149 | | | | 220 | | | | 369 | |
Consumer | | | 517 | | | | 106 | | | | 623 | |
| |
Total | | $ | 46,808 | | | | $ 11,832 | | | | $ 58,640 | |
| |
At December 31, 2013, the Corporation’s commercial loan TDRs, excluding covered loans, for the BPPR and BPNA segments amounted to $172 million and $18 million, respectively, of which $63 million and $17 million, respectively, were in non-performing status. This compares with $297 million and $16 million, respectively, of which $192 million and $16 million were in non-performing status at December 31, 2012. The outstanding commitments for these commercial loan TDRs amounted to $3 million in the BPPR segment and no commitments outstanding in the BPNA segment at December 31, 2013. Commercial loans that have been modified as part of loss mitigation efforts were evaluated individually for impairment, resulting in a specific reserve of $13 million for the BPPR segment and none for the BPNA segment at December 31, 2013, compared with $17 million and $12 thousand, respectively, at December 31, 2012.
At December 31, 2013, the Corporation’s construction loan TDRs, excluding covered loans, for the BPPR and the BPNA segments amounted to $6 million each, of which $5 million and $6 million, respectively, which were in non-performing status. This compares with $7 million and $6 million, respectively, of which $4 million and $6 million were in non-performing status at December 31, 2012. There were no outstanding commitments to lend additional funds to debtors owing loans whose terms have been modified in troubled debt restructurings for these construction loan TDRs at December 31, 2013 for both the BPPR and the BPNA segments. These construction loan TDRs were individually evaluated for impairment resulting in a specific reserve of $177 thousand for the BPPR and none for the BPNA segments at December 31, 2013. At December 31, 2012, there were no specific reserves for the BPPR and BPNA segments.
At December 31, 2013, the Corporation’s legacy loans held-in-portfolio included a total of $949 thousand of loan modifications, compared with $6 million at December 31, 2012. These loans were in non-performing status at such dates. There were no commitments outstanding for these legacy loan TDRs at December 31, 2013. The legacy loan TDRs were evaluated for impairment requiring no specific reserves at December 31, 2013 and December 31, 2012.
At December 31, 2013, the mortgage loan TDRs for the BPPR and BPNA segments amounted to $565 million (including $240 million guaranteed by U.S. sponsored entities) and $53 million, respectively, of which $73 million and $10 million, respectively, were in non-performing status. This compares with $624 million (including $148 million guaranteed by U.S. sponsored entities) and $54 million, respectively, of which $263 million and $10 million were in non-performing status at December 31, 2012. These mortgage loan TDRs were evaluated for impairment resulting in a specific allowance for loan losses of $38 million and $18 million for the BPPR and BPNA segments, respectively, at December 31, 2013, compared to $59 million and $16 million, respectively, at December 31, 2012.
At December 31, 2013, the consumer loan TDRs for the BPPR and BPNA segments amounted to $125 million and $2 million, respectively, of which $10 million and $587 thousand, respectively, were in non-performing status, compared with $132 million and $3 million, respectively, of which $8 million and $643 thousand, respectively, were in non-performing status at December 31, 2012. These consumer loan TDRs were evaluated for impairment resulting in a specific allowance for loan losses of $30 million and $280 thousand for the BPPR and BPNA segments, respectively, at December 31, 2013, compared with $18 million and $107 thousand, respectively, at December 31, 2012.
95
Refer to Note 10 to the consolidated financial statements for additional information on modifications considered troubled debt restructurings, including certain qualitative and quantitative data about troubled debt restructurings performed in the past twelve months.
Allowance for Loan Losses
Non-Covered Loan Portfolio
The allowance for loan losses, which represents management’s estimate of credit losses inherent in the loan portfolio, is maintained at a sufficient level to provide for estimated credit losses on individually evaluated loans as well as estimated credit losses inherent in the remainder of the loan portfolio. The Corporation’s management evaluates the adequacy of the allowance for loan losses on a quarterly basis. In this evaluation, management considers current economic conditions and the resulting impact on Popular Inc.’s loan portfolio, the composition of the portfolio by loan type and risk characteristics, historical loss experience, results of periodic credit reviews of individual loans, regulatory requirements and loan impairment measurement, among other factors.
The Corporation must rely on estimates and exercise judgment regarding matters where the ultimate outcome is unknown, such as economic developments affecting specific customers, industries or markets. Other factors that can affect management’s estimates are the years of historical data when estimating losses, changes in underwriting standards, financial accounting standards and loan impairment measurements, among others. Changes in the financial condition of individual borrowers, in economic conditions, in historical loss experience and in the condition of the various markets in which collateral may be sold may all affect the required level of the allowance for loan losses. Consequently, the business financial condition, liquidity, capital and results of operations could also be affected.
The Corporation’s assessment of the allowance for loan losses is determined in accordance with accounting guidance, specifically guidance of loss contingencies in ASC Subtopic 450-20 (general reserve for inherent losses) and loan impairment guidance in ASC Section 310-10-35 (loans individually assessed for impairment). Decreases in expected cash flows after the acquisition date for loans (pools) accounted for under ASC Subtopic 310-30 are recognized by recording an allowance for loan losses in the current period. For purposes of loans accounted for under ASC Subtopic 310-20 and new loans originated as a result of loan commitments assumed, the Corporation’s assessment of the allowance for loan losses is determined in accordance with the accounting guidance of loss contingencies in ASC Subtopic 450-20 (general reserve for inherent losses) and loan impairment guidance in ASC Section 310-10-35 for loans individually evaluated for impairment. As explained in the Critical Accounting Policies / Estimates section of this MD&A, during the second quarter of 2013, the Corporation enhanced the estimation process for evaluating the adequacy of its allowance for loan losses for the Corporation’s commercial and construction loan portfolios by (i) incorporating risk ratings to the commercial, construction and legacy loan segmentation, and (ii) updating and enhancing the framework utilized to quantify and establish environmental factors adjustments. These enhancements resulted in a net increase to the allowance of $11.8 million for the non-covered portfolio and $7.5 million for the covered portfolio.
The following tables set forth information concerning the composition of the Corporation’s allowance for loan losses (“ALLL”) at December 31, 2013, December 31, 2012 and December 31, 2011 by loan category and by whether the allowance and related provisions were calculated individually pursuant to the requirements for specific impairment or through a general valuation allowance.
96
Table 59 - Composition of ALLL
| | | | | | | | | | | | | | | | | | | | | | | | | | | | |
| December 31, 2013 | |
| |
(Dollars in thousands) | | Commercial | | | Construction | | | Legacy [3] | | | Leasing | | | Mortgage | | | Consumer | | | Total[2] | |
| |
| | | | | | | |
Specific ALLL | | $ | 16,409 | | | $ | 177 | | | $ | - | | | $ | 1,053 | | | $ | 55,667 | | | $ | 30,200 | | | $ | 103,506 | |
| | | | | | | |
Impaired loans[1] | | $ | 297,516 | | | $ | 22,486 | | | $ | 6,045 | | | $ | 2,893 | | | $ | 452,073 | | | $ | 127,703 | | | $ | 908,716 | |
| | | | | | | |
Specific ALLL to impaired loans[1] | | | 5.52 | % | | | 0.79 | % | | | - | % | | | 36.40 | % | | | 12.31 | % | | | 23.65 | % | | | 11.39 % | |
| |
| | | | | | | |
General ALLL | | $ | 158,573 | | | $ | 5,165 | | | $ | 13,704 | | | $ | 9,569 | | | $ | 101,262 | | | $ | 146,684 | | | $ | 434,957 | |
| | | | | | | |
Loans held-in-portfolio, excluding impaired loans[1] | | $ | 9,739,669 | | | $ | 183,598 | | | $ | 205,090 | | | $ | 540,868 | | | $ | 6,229,403 | | | $ | 3,804,523 | | | $ | 20,703,151 | |
| | | | | | | |
General ALLL to loans held-in-portfolio, excluding impaired loans[1] | | | 1.63 | % | | | 2.81 | % | | | 6.68 | % | | | 1.77 | % | | | 1.63 | % | | | 3.86 | % | | | 2.10 % | |
| |
| | | | | | | |
Total ALLL | | $ | 174,982 | | | $ | 5,342 | | | $ | 13,704 | | | $ | 10,622 | | | $ | 156,929 | | | $ | 176,884 | | | $ | 538,463 | |
| | | | | | | |
Total non-covered loans held-in-portfolio[1] | | $ | 10,037,185 | | | $ | 206,084 | | | $ | 211,135 | | | $ | 543,761 | | | $ | 6,681,476 | | | $ | 3,932,226 | | | $ | 21,611,867 | |
| | | | | | | |
ALLL to loans held-in-portfolio [1] | | | 1.74 | % | | | 2.59 | % | | | 6.49 | % | | | 1.95 | % | | | 2.35 | % | | | 4.50 | % | | | 2.49 % | |
| |
[1] Excludes covered loans acquired on the Westernbank FDIC-assisted transaction. | |
[2] Excludes covered loans acquired on the Westernbank FDIC-assisted transaction. At December 31, 2013, the general allowance on the covered loans amounted to $101.8 million while the specific reserve amounted to $0.3 million. | |
[3] The legacy portfolio is comprised of commercial loans, construction loans and lease financings related to certain lending products exited by the Corporation as part of restructuring efforts carried out in prior years at the BPNA reportable segment. | |
| |
Table 60 - Composition of ALLL | |
December 31, 2012 | |
| |
(Dollars in thousands) | | Commercial | | | Construction | | | Legacy [3] | | | Leasing | | | Mortgage | | | Consumer | | | Total[2] | |
| |
| | | | | | | |
Specific ALLL | | $ | 17,348 | | | $ | 120 | | | $ | - | | | $ | 1,066 | | | $ | 74,667 | | | $ | 17,886 | | | $ | 111,087 | |
| | | | | | | |
Impaired loans[1] | | $ | 527,664 | | | $ | 41,809 | | | $ | 18,744 | | | $ | 4,881 | | | $ | 611,230 | | | $ | 133,377 | | | $ | 1,337,705 | |
| | | | | | | |
Specific ALLL to impaired loans[1] | | | 3.29 | % | | | 0.29 | % | | | - | % | | | 21.84 | % | | | 12.22 | % | | | 13.41 | % | | | 8.30 % | |
| |
| | | | | | | |
General ALLL | | $ | 280,334 | | | $ | 7,309 | | | $ | 33,102 | | | $ | 1,828 | | | $ | 74,708 | | | $ | 113,333 | | | $ | 510,614 | |
| | | | | | | |
Loans held-in-portfolio, excluding impaired loans[1] | | $ | 9,330,538 | | | $ | 211,048 | | | $ | 365,473 | | | $ | 535,642 | | | $ | 5,467,277 | | | $ | 3,735,509 | | | $ | 19,645,487 | |
| | | | | | | |
General ALLL to loans held-in-portfolio, excluding impaired loans[1] | | | 3.00 | % | | | 3.46 | % | | | 9.06 | % | | | 0.34 | % | | | 1.37 | % | | | 3.03 | % | | | 2.60 % | |
|
| |
| | | | | | | |
Total ALLL | | $ | 297,682 | | | $ | 7,429 | | | $ | 33,102 | | | $ | 2,894 | | | $ | 149,375 | | | $ | 131,219 | | | $ | 621,701 | |
| | | | | | | |
Total non-covered loans held-in-portfolio[1] | | $ | 9,858,202 | | | $ | 252,857 | | | $ | 384,217 | | | $ | 540,523 | | | $ | 6,078,507 | | | $ | 3,868,886 | | | $ | 20,983,192 | |
| | | | | | | |
ALLL to loans held-in-portfolio [1] | | | 3.02 | % | | | 2.94 | % | | | 8.62 | % | | | 0.54 | % | | | 2.46 | % | | | 3.39 | % | | | 2.96 % | |
| |
[1] Excludes covered loans acquired on the Westernbank FDIC-assisted transaction. | |
[2] Excludes covered loans acquired on the Westernbank FDIC-assisted transaction. At December 31, 2012, the general allowance on the covered loans amounted to $100 million while the specific reserve amounted to $9 million. | |
[3] The legacy portfolio is comprised of commercial loans, construction loans and lease financings related to certain lending products exited by the Corporation as part of restructuring efforts carried out in prior years at the BPNA reportable segment. | |
| |
97
| | | | | | | | | | | | | | | | | | | | | | | | | | | | |
| |
|
| Table 61 - Composition of ALLL | |
December 31, 2011 | |
| |
| (Dollars in thousands) | | Commercial | | | Construction | | | Legacy [3] | | | Leasing | | | Mortgage | | | Consumer | | | Total[2] | |
| |
| | | | | | | |
Specific ALLL | | $ | 11,738 | | | $ | 289 | | | $ | 57 | | | $ | 793 | | | $ | 29,063 | | | $ | 17,046 | | | $ | 58,986 | |
| | | | | | | |
Impaired loans[1] | | $ | 556,329 | | | $ | 91,710 | | | $ | 48,890 | | | $ | 6,104 | | | $ | 382,880 | | | $ | 140,108 | | | $ | 1,226,021 | |
| | | | | | | |
Specific ALLL to impaired loans[1] | | | 2.11 | % | | | 0.32 | % | | | 0.12 | % | | | 12.99 | % | | | 7.59 | % | | | 12.17 | % | | | 4.81 % | |
| |
| | | | | | | |
General ALLL | | $ | 357,694 | | | $ | 8,192 | | | $ | 46,171 | | | $ | 3,858 | | | $ | 73,198 | | | $ | 142,264 | | | $ | 631,377 | |
| | | | | | | |
Loans held-in-portfolio, excluding impaired loans[1] | | $ | 9,416,998 | | | $ | 148,229 | | | $ | 599,519 | | | $ | 542,602 | | | $ | 5,135,580 | | | $ | 3,533,647 | | | $ | 19,376,575 | |
| | | | | | | |
General ALLL to loans held-in-portfolio, excluding impaired loans[1] | | | 3.80 | % | | | 5.53 | % | | | 7.70 | % | | | 0.71 | % | | | 1.43 | % | | | 4.03 | % | | | 3.26 % | |
| |
| | | | | | | |
Total ALLL | | $ | 369,432 | | | $ | 8,481 | | | $ | 46,228 | | | $ | 4,651 | | | $ | 102,261 | | | $ | 159,310 | | | $ | 690,363 | |
| | | | | | | |
Total non-covered loans held-in-portfolio[1] | | $ | 9,973,327 | | | $ | 239,939 | | | $ | 648,409 | | | $ | 548,706 | | | $ | 5,518,460 | | | $ | 3,673,755 | | | $ | 20,602,596 | |
| | | | | | | |
ALLL to loans held-in-portfolio[1] | | | 3.70 | % | | | 3.53 | % | | | 7.13 | % | | | 0.85 | % | | | 1.85 | % | | | 4.34 | % | | | 3.35 % | |
| |
|
| [1] Excludes covered loans acquired on the Westernbank FDIC-assisted transaction. | |
[2] Excludes covered loans acquired on the Westernbank FDIC-assisted transaction. At December 31, 2011, the general allowance on the covered loans amounted to $98 million while the specific reserve amounted to $27 million. | |
[3] The legacy portfolio is comprised of commercial loans, construction loans and lease financings related to certain lending products exited by the Corporation as part of restructuring efforts carried out in prior years at the BPNA reportable segment. | |
| |
Table 62 details the breakdown of the allowance for loan losses by loan categories. The breakdown is made for analytical purposes, and it is not necessarily indicative of the categories in which future loan losses may occur. | |
Table 62 - Allocation of the Allowance for Loan Losses | |
| | | | | | | | | | | | | | | | | | | | | | | | | | | | | | | | | | | | | | | | |
| At December 31, | |
| |
| | | | | |
| | | 2013 | | | 2012 | | | 2011 | | | 2010 | | | 2009 | |
| |
| | | | | | | | | | |
| | | | | | % of loans | | | | | | % of loans | | | | | | % of loans | | | | | | % of loans | | | | | | % of loans | |
| | | | | | | | | | |
| | | | | | in each | | | | | | in each | | | | | | in each | | | | | | in each | | | | | | in each | |
| | | | | | | | | | |
| | | | | | category to | | | | | | category to | | | | | | category to | | | | | | category to | | | | | | category to | |
| | | | | | | | | | |
| (Dollars in millions) | | ALLL | | | total loans | | | ALLL | | | total loans | | | ALLL | | | total loans | | | ALLL | | | total loans | | | ALLL | | | total loans | |
| |
| | | | | | | | | | |
Commercial | | $ | 175.0 | | | | 46.4 | % | | $ | 297.7 | | | | 47.0 | % | | $ | 369.4 | | | | 48.4 | % | | $ | 399.8 | | | | 51.0 | % | | $ | 338.7 | | | | 48.3 % | |
| | | | | | | | | | |
Construction | | | 5.3 | | | | 1.0 | | | | 7.4 | | | | 1.2 | | | | 8.5 | | | | 1.2 | | | | 39.8 | | | | 1.6 | | | | 269.3 | | | | 5.7 | |
| | | | | | | | | | |
Legacy | | | 13.7 | | | | 1.0 | | | | 33.1 | | | | 1.8 | | | | 46.2 | | | | 3.1 | | | | 76.4 | | | | 4.9 | | | | 177.4 | | | | 6.9 | |
| | | | | | | | | | |
Leasing | | | 10.6 | | | | 2.5 | | | | 2.9 | | | | 2.6 | | | | 4.7 | | | | 2.7 | | | | 7.2 | | | | 2.8 | | | | 12.2 | | | | 2.6 | |
| | | | | | | | | | |
Mortgage | | | 156.9 | | | | 30.9 | | | | 149.4 | | | | 29.0 | | | | 102.3 | | | | 26.8 | | | | 70.9 | | | | 21.8 | | | | 154.6 | | | | 19.4 | |
| | | | | | | | | | |
Consumer | | | 176.9 | | | | 18.2 | | | | 131.2 | | | | 18.4 | | | | 159.3 | | | | 17.8 | | | | 199.1 | | | | 17.9 | | | | 309.0 | | | | 17.1 | |
| |
Total[1] | | $ | 538.4 | | | | 100.0 | % | | $ | 621.7 | | | | 100.0 | % | | $ | 690.4 | | | | 100.0 | % | | $ | 793.2 | | | | 100.0 | % | | $ | 1,261.2 | | | | 100.0 % | |
| |
[1]Note: For purposes of this table the term loans refers to loans held-in-portfolio excluding covered loans and held-for-sale.
At December 31, 2013, the allowance for loan losses, excluding covered loans, decreased by approximately $83 million when compared with the same date in the previous year. It represented 2.49% of non-covered loans held-in-portfolio at December 31,
98
2013, compared with 2.96% at December 31, 2012. This decrease in the allowance for loan losses considers reductions in the Corporation’s general and specific reserves of approximately $76 million and $8 million, respectively. The reduction in the allowance for loan losses was primarily due to the combined effect of the release related to the non-performing loans bulk sales, continued improvements in credit quality, offset by the enhancements to the allowance for loan losses methodology.
At December 31, 2013, the allowance for loan losses for non-covered loans at the BPPR segment totaled $427 million, or 2.69% of non-covered loans held-in-portfolio, compared with $445 million, or 2.92% of non-covered loans held-in-portfolio, at December 31, 2012. The decrease was mainly driven by reductions of $9 million in the general and specific reserves when compared with December 31, 2012. Excluding the reserve release of $30.3 million related to the bulk sale, the increase in the allowance mainly reflects the net effect of a $22.6 million increase arising from the enhancements to the allowance for loan losses methodology and environmental factors adjustments considering prevailing economic conditions in Puerto Rico, offset by positive credit quality trends.
The allowance for loan losses at the BPNA segment totaled $112 million, or 1.95% of loans held-in-portfolio, compared with $176 million, or 3.07% of loans held-in-portfolio, at December 31, 2012. The decrease was mainly driven by a reduction of $66 million in the general reserve component, when compared with December 31, 2012, reflective of sustained improvements in credit quality and economic trends, and the effect of the enhancements to the allowance for loan losses methodology, which resulted in a $10.8 million reserve release.
The allowance for loan losses for commercial loans held-in-portfolio, excluding covered loans, amounted to $175 million, or 1.74% of that portfolio, at December 31, 2013, compared with $298 million, or 3.02%, at December 31, 2012, and $369 million, or 3.70%, at December 31, 2011. The allowance for loan losses for the commercial loan portfolio in the BPPR segment, excluding the allowance for covered loans, totaled $128 million, or 1.98% of non-covered commercial loans held-in-portfolio, at December 31, 2013, compared with $218 million, or 3.46%, at December 31, 2012. At the BPNA segment, the allowance for loan losses of the commercial loan portfolio totaled $47 million, or 1.31% of commercial loans held-in-portfolio, at December 31, 2013, compared with $80 million, or 2.25%, at December 31, 2012. The decrease in allowance for loan losses for the commercial loans held-in-portfolio derives mainly from improvements in credit quality and the effect of the enhancements to the allowance for loan losses methodology during the second quarter of 2013.
The allowance for loan losses for construction loans held-in-portfolio, excluding covered loans, amounted to $5 million, or 2.59% of that portfolio, at December 31, 2013, compared with $7 million, or 2.94%, at December 31, 2012, and $8 million, or 3.53%, at December 31, 2011. The allowance for loan losses corresponding to the construction loan portfolio for the BPPR segment, excluding the allowance for covered loans, totaled $5 million, or 3.16% of non-covered construction loans held-in-portfolio, at December 31, 2013, compared with $6 million, or 2.76%, at December 31, 2012. At the BPNA segment, the allowance for loan losses of the construction loan portfolio totaled $247 thousand, or 0.55% of construction loans held-in-portfolio, at December 31, 2013, compared with $2 million, or 3.86%, at December 31, 2012. Stable allowance levels in the construction portfolio are the result of de-risking strategies executed by the Corporation over the past several years to downsize its construction loan portfolio.
The allowance for loan losses for the legacy loans held-in-portfolio amounted to $14 million, or 6.49% of that portfolio, at December 31, 2013, compared with $33 million, or 8.62%, at December 31, 2012, and $46 million, or 7.13%, at December 31, 2011. The ratio of allowance to non-performing loans held-in portfolio in the legacy loan category was 91.06% at December 31, 2013, compared with 81.25% at December 31, 2012 and 61.13% at December 31, 2011. The decrease in the allowance for loan losses was primarily driven by improved credit performance, lower level of problem loans and portfolio run-off.
The allowance for loan losses for mortgage loans held-in-portfolio, excluding covered loans, amounted to $157 million, or 2.35% of that portfolio, at December 31, 2013, compared with $149 million, or 2.46%, at December 31, 2012, and $102 million, or 1.85%, at December 31, 2011. The allowance for loan losses corresponding to the mortgage loan portfolio at the BPPR segment totaled $130 million, or 2.41% of mortgage loans held-in-portfolio, excluding covered loans, at December 31, 2013 compared with $119 million, or 2.41%, respectively, at December 31, 2012. The increase in the allowance was principally driven by the enhancements to the
99
allowance for loan losses methodology as a result of the recalibration of the environmental factors adjustment, offset by a reserve release of $30.3 million related to the mortgage NPL sale during the second quarter of 2013. At the BPNA segment, the allowance for loan losses corresponding to the mortgage loan portfolio totaled $27 million, or 2.08% of mortgage loans held-in-portfolio, at December 31, 2013, compared with $30 million, or 2.69%, at December 31, 2012. The allowance for loan losses for BPNA’s non-conventional mortgage loan portfolio amounted to $23 million, or 5.57% of that particular loan portfolio, compared with $25 million, or 5.60%, at December 31, 2012. The Corporation is no longer originating non-conventional mortgage loans at BPNA.
The allowance for loan losses for the consumer portfolio, excluding covered loans, amounted to $177 million, or 4.50% of that portfolio, at December 31, 2013, compared to $131 million, or 3.39%, at December 31, 2012, and $159 million, or 4.34%, at December 31, 2011. The allowance for loan losses of the non-covered consumer loan portfolio in the BPPR segment totaled $153 million, or 4.60% of that portfolio, at December 31, 2013, compared with $100 million, or 3.09%, at December 31, 2012. The increase is due to an increase of $41 million and $12 million in the general and specific reserves, respectively, mainly arising from the enhancements to the allowance for loan losses methodology during the second quarter of 2013 and refinements of certain assumptions in the expected future cash flow analysis of the consumer troubled debt restructures. At the BPNA segment, the allowance for loan losses of the consumer loan portfolio totaled $24 million, or 3.95% of consumer loans, at December 31, 2013, compared with $31 million, or 4.94%, at December 31, 2012. The decrease in the allowance for loan losses for the consumer loan portfolio was principally driven by lower loss trends, reflecting improvement in the risk profile of the consumer portfolios.
The following table presents the Corporation’s recorded investment in loans that were considered impaired and the related valuation allowance at December 31, 2013, 2012, and 2011.
Table 63 - Impaired Loans (Non-Covered Loans) and the Related Valuation Allowance
| | | | | | | | | | | | | | | | | | | | | | | | |
| | | 2013 | | | 2012 | | | 2011 | |
| |
| (In millions) | | Recorded
Investment[1] | | | Valuation
Allowance[2] | | | Recorded
Investment[1] | | | Valuation
Allowance [2] | | | Recorded
Investment [1] | | | Valuation
Allowance [2] | |
| |
| | | | | | |
Impaired loans: | | | | | | | | | | | | | | | | | | | | | | | | |
| | | | | | |
Valuation allowance | | | $642.6 | | | | $103.5 | | | | $897.6 | | | | $111.1 | | | | $632.9 | | | | $59.0 | |
| | | | | | |
No valuation allowance required | | | 266.1 | | | | - | | | | 440.1 | | | | - | | | | 593.1 | | | | - | |
| |
| | | | | | |
Total impaired loans | | | $908.7 | | | | $103.5 | | | | $1,337.7 | | | | $111.1 | | | | $1,226.0 | | | | $59.0 | |
| |
[1] Excludes covered loans acquired on the Westernbank FDIC-assisted transaction. | |
[2] Excludes the specific reserve related to covered loans acquired on the Westernbank FDIC-assisted transaction which amounted to $0.3 million at December 31, 2013 (2012 - $9 million; 2011- $27 million). | |
| |
With respect to the $266 million portfolio of impaired loans for which no allowance for loan losses was required at December 31, 2013, management followed the guidance for specific impairment of a loan. When a loan is impaired, the measurement of the impairment may be based on: (1) the present value of the expected future cash flows of the impaired loan discounted at the loan’s original effective interest rate; (2) the observable market price of the impaired loan; or (3) the fair value of the collateral, if the loan is collateral dependent. A loan is collateral dependent if the repayment of the loan is expected to be provided solely by the underlying collateral. Impaired loans with no valuation allowance were mostly collateral dependent loans for which management charged-off specific reserves based on the fair value of the collateral less estimated costs to sell.
Average impaired loans during the years ended December 31, 2013 and December 31, 2012 were $1.1 billion and $1.4 billion, respectively. The Corporation recognized interest income on impaired loans of $39.0 million and $39.1 million for the years ended December 31, 2013 and December 31, 2012, respectively.
The following tables set forth the activity in the specific reserves for impaired loans for the years ended December 31, 2013 and 2012.
100
Table 64 - Activity in Specific ALLL for the Year Ended December 31, 2013
| | | | | | | | | | | | | | | | | | | | | | | | | | | | |
| | | | | | | |
| (In thousands) | | Commercial | | | Construction | | | Mortgage | | | Legacy | | | Consumer | | | Leasing | | | Total | |
| |
| | | | | | | |
Beginning balance | | $ | 17,348 | | | $ | 120 | | | $ | 74,667 | | | $ | - | | | $ | 17,886 | | | $ | 1,066 | | | $ | 111,087 | |
| | | | | | | |
Provision for impaired loans (reversal of provision) | | | 176,104 | | | | 4,776 | | | | 70,336 | | | | 1,248 | | | | 19,089 | | | | (13 | ) | | | 271,540 | |
| | | | | | | |
Net charge-offs | | | (115,741 | ) | | | (3,880 | ) | | | (13,668 | ) | | | (1,248 | ) | | | (6,775 | ) | | | - | | | | (141,312) | |
| | | | | | | |
Net (write-downs) recoveries | | | (61,302 | ) | | | (839 | ) | | | (75,668 | ) | | | - | | | | - | | | | - | | | | (137,809) | |
| |
Specific allowance for loan losses at December 31, 2013 | | $ | 16,409 | | | $ | 177 | | | $ | 55,667 | | | $ | - | | | $ | 30,200 | | | $ | 1,053 | | | $ | 103,506 | |
| |
Table 65 - Activity in Specific ALLL for the Year Ended December 31, 2012
| | | | | | | | | | | | | | | | | | | | | | | | | | | | |
| (In thousands) | | Commercial | | | Construction | | | Mortgage | | | Legacy | | | Consumer | | | Leasing | | | Total | |
| |
| | | | | | | |
Beginning balance | | $ | 11,738 | | | $ | 289 | | | $ | 29,063 | | | $ | 57 | | | $ | 17,046 | | | $ | 793 | | | $ | 58,986 | |
| | | | | | | |
Provision for impaired loans | | | 107,497 | | | | 5,942 | | | | 54,984 | | | | 4,054 | | | | 840 | | | | 273 | | | | 173,590 | |
| | | | | | | |
Net charge-offs | | | (101,887 | ) | | | (6,111 | ) | | | (9,380 | ) | | | (4,111 | ) | | | - | | | | - | | | | (121,489) | |
| |
Specific allowance for loan losses at December 31, 2012 | | $ | 17,348 | | | $ | 120 | | | $ | 74,667 | | | $ | - | | | $ | 17,886 | | | $ | 1,066 | | | $ | 111,087 | |
| |
For the year ended December 31, 2013, total net charge-offs for individually evaluated impaired loans amounted to approximately $141.3 million, of which $129.7 million pertained to the BPPR segment and $11.6 million to the BPNA segment. Most of these net charge-offs were related to the commercial loan portfolio.
The Corporation requests updated appraisal reports from pre-approved appraisers for loans that are considered impaired, and individually analyzes them following the Corporation’s reappraisal policy. This policy requires updated appraisals for loans secured by real estate (including construction loans) either annually or every two years depending on the total exposure of the borrower. As a general procedure, the Corporation internally reviews appraisals as part of the underwriting and approval process and also for credits considered impaired. Generally, the specialized appraisal review unit of the Corporation’s Credit Risk Management Division internally reviews appraisals following certain materiality benchmarks. In addition to evaluating the reasonability of the appraisal reports, these reviews monitor that appraisals are performed following the Uniform Standards of Professional Appraisal Practice (“USPAP”).
Appraisals may be adjusted due to age or general market conditions. The adjustments applied are based upon internal information, like other appraisals and/or loss severity information that can provide historical trends in the real estate market. Specifically, in commercial and construction impaired loans for the BPPR segment, and depending on the type of property and/or the age of the appraisal, downward adjustments currently range from 5% to 40% (including costs to sell). At December 31, 2013, the weighted average discount rate for the BPPR segment was 13%.
For commercial and construction loans at the BPNA segment, downward adjustments to the collateral value currently range from 10% to 50% depending on the age of the appraisals and the type, location and condition of the property. This discount used was determined based on a study of other real estate owned and loan sale transactions during the past two years, comparing net proceeds received by the bank relative to the most recent appraised value of the properties. However, additional haircuts can be applied depending upon the age of appraisal, the region and the condition of the project. Factors are based on appraisal changes and/or trends in loss severities. Discount rates discussed above include costs to sell and may change from time to time based on market conditions. At December 31, 2013, the weighted average discount rate for the BPNA segment was 27%.
For mortgage loans secured by residential real estate properties, a current assessment of value is made not later than 180 days past the contractual due date. Any outstanding balance in excess of the estimated value of the collateral property, less estimated costs to sell, is charged-off. For this purpose, the Corporation requests third-party Broker Price Opinion of Value “BPOs” of the subject collateral property at least annually. In the case of the mortgage loan portfolio for the BPPR segment, BPOs of the subject collateral properties are currently subject to downward adjustment of up to approximately 26%, including cost to sell of 5%. In the case of the U.S. mortgage loan portfolio, a 30% haircut is taken, which includes costs to sell.
101
Discount rates discussed above include costs to sell and may change from time to time based on market conditions.
The table that follows presents the approximate amount and percentage of non-covered impaired loans for which the Corporation relied on appraisals dated more than one year old for purposes of impairment requirements at December 31, 2013.
Table 66 - Non-Covered Impaired Loans With Appraisals Dated 1 Year Or Older
| | | | | | | | |
| December 31, 2013 | |
| |
| | | Total Impaired Loans – Held-in-portfolio (HIP) | | | |
| (In thousands) | | Count | | Outstanding Principal Balance | | Impaired Loans with
Appraisals Over One-
Year Old [1] | |
| |
| | | |
Commercial | | 174 | | $ 248,154 | | | 18 % | |
| | | |
Construction | | 9 | | 20,162 | | | 27 | |
| | | |
Legacy | | 4 | | 6,045 | | | - | |
| |
| |
| [1] Based on outstanding balance of total impaired loans. | | | | |
| |
Table 67 - Non-Covered Impaired Loans With Appraisals Dated 1 Year Or Older | |
December 31, 2012 | |
| |
| | | Total Impaired Loans – Held-in-portfolio (HIP) | | | |
| (In thousands) | | Count | | Outstanding Principal Balance | | Impaired Loans with
Appraisals Over One-
Year Old [1] | |
| |
| | | |
Commercial | | 312 | | $ 408,211 | | | 31 % | |
| | | |
Construction | | 17 | | 39,944 | | | 11 | |
| | | |
Legacy | | 19 | | 18,744 | | | - | |
| |
| |
[1] Based on outstanding balance of total impaired loans. | | | | |
| |
The percentage of the Corporation’s impaired construction loans that were relied upon “as developed” and “as is” for the periods ended December 31, 2013 and 2012 are presented in the tables below.
Table 68 - Impaired Construction Loans Relied Upon “As is” or “As Developed”
| | | | | | | | | | | | | | | | | | | | | | | | | | |
| December 31, 2013 | |
| |
| | | “As is” | | | | | “As developed” | |
| (In thousands) | | Count | | | Amount in $ | | | As a % of total
construction
impaired loans HIP | | | | | Count | | Amount in $ | | As a % of total
construction
impaired loans HIP | | | Average % of
completion | |
| | | | | | |
| | | | | | | | |
Loans held-in-portfolio | | | 12 | | | | $ 18,835 | | | | 77 % | | | | | 2 | | $ 5,703 | | | 23 | % | | | 90 % | |
| |
Table 69 - Impaired Construction Loans Relied Upon “As is” or “As Developed” | |
| December 31, 2012 | |
| |
| | | “As is” | | | | | “As developed” | |
| (In thousands) | | Count | | | Amount in $ | | | As a % of total
construction
impaired loans HIP | | | | | Count | | Amount in $ | | As a % of total
construction
impaired loans HIP | | | Average % of
completion | |
| | | | | | |
| | | | | | | | |
Loans held-in-portfolio | | | 19 | | | $ | 23,685 | | | | 49 % | | | | | 5 | | $ 24,934 | | | 51 | % | | | 90 % | |
At December 31, 2013, the Corporation accounted for $6 million impaired construction loans under the “as developed” value. This approach is used since the current plan is that the project will be completed and it reflects the best strategy to reduce potential
102
losses based on the prospects of the project. The costs to complete the project and the related increase in debt are considered an integral part of the individual reserve determination.
Costs to complete are deducted from the subject “as developed” collateral value on impaired construction loans. Impairment determinations are calculated following the collateral dependent method, comparing the outstanding principal balance of the respective impaired construction loan against the expected realizable value of the subject collateral. Realizable values of subject collaterals have been defined as the “as developed” appraised value less costs to complete, costs to sell and discount factors. Costs to complete represent an estimate of the amount of money to be disbursed to complete a particular phase of a construction project. Costs to sell have been determined as a percentage of the subject collateral value, to cover related collateral disposition costs (e.g. legal and commission fees). As discussed previously, discount factors may be applied to the appraised amounts due to age or general market conditions.
Allowance for loan losses– Covered loan portfolio
The Corporation’s allowance for loan losses for the covered loan portfolio acquired in the Westernbank FDIC-assisted transaction amounted to $102 million at December 31, 2013. This allowance covers the estimated credit loss exposure related to: (i) acquired loans accounted for under ASC Subtopic 310-30, which required an allowance for loan losses of $94 million at year end, compared with $95 million at December 31, 2012; and (ii) acquired loans accounted for under ASC Subtopic 310-20, which required an allowance for loan losses of $8 million, compared with $14 million at December 31, 2012.
Decreases in expected cash flows after the acquisition date for loans (pools) accounted for under ASC Subtopic 310-30 are recognized by recording an allowance for loan losses in the current period. For purposes of loans accounted for under ASC Subtopic 310-20 and new loans originated as a result of loan commitments assumed, the Corporation’s assessment of the allowance for loan losses is determined in accordance with the accounting guidance of loss contingencies in ASC Subtopic 450-20 (general reserve for inherent losses) and loan impairment guidance in ASC Section 310-10-35 for loans individually evaluated for impairment. Concurrently, the Corporation records an increase in the FDIC loss share asset for the expected reimbursement from the FDIC under the loss sharing agreements.
Enterprise Risk and Operational Risk Management
The Financial and Operational Risk Management Division (the “FORM Division”) is responsible for overseeing the implementation of the Enterprise Risk Management (ERM) framework, as well as developing and overseeing the implementation of risk programs and reporting that facilitate a broad integrated view of risks. The FORM Division also leads the ongoing development of a strong risk management culture and the framework that support effective risk governance. For new products and initiatives, the Corporate Compliance Division has put in place processes to ensure that an appropriate standard readiness assessment is performed before launching a new product or initiative. Similar procedures are followed with the Treasury Division for transactions involving the purchase and sale of assets.
Operational risk can manifest itself in various ways, including errors, fraud, cyber attacks, business interruptions, inappropriate behavior of employees, and failure to perform in a timely manner, among others. These events can potentially result in financial losses and other damages to the Corporation, including reputational harm. The successful management of operational risk is particularly important to a diversified financial services company like Popular because of the nature, volume and complexity of its various businesses.
To monitor and control operational risk and mitigate related losses, the Corporation maintains a system of comprehensive policies and controls. The Corporation’s Operational Risk Committee (ORCO), which is composed of senior level representatives from the business lines and corporate functions, provides executive oversight to facilitate consistency of effective policies, best practices, controls and monitoring tools for managing and assessing all types of operational risks across the Corporation. The FORM Division, within the Corporation’s Risk Management Group, serves as ORCO’s operating arm and is responsible for establishing baseline processes to measure, monitor, limit and manage operational risk. In addition, the Auditing Division provides oversight about policy compliance and ensures adequate attention is paid to correct the identified issues.
Operational risks fall into two major categories: business specific and corporate-wide affecting all business lines. The primary responsibility for the day-to-day management of business specific risks relies on business unit managers. Accordingly, business unit managers are responsible for ensuring that appropriate risk containment measures, including corporate-wide or business segment specific policies and procedures, controls and monitoring tools, are in place to minimize risk occurrence and loss exposures.
103
Examples of these include personnel management practices, data reconciliation processes, transaction processing monitoring and analysis and contingency plans for systems interruptions. To manage corporate-wide risks, specialized functions, such as Legal, Information Security, Business Continuity, and Finance and Compliance, among others, assist the business units in the development and implementation of risk management practices specific to the needs of the individual businesses.
Operational risk management plays a different role in each category. For business specific risks, the FORM Division works with the segments to ensure consistency in policies, processes, and assessments. With respect to corporate-wide risks, such as information security, business continuity, legal and compliance, the risks are assessed and a consolidated corporate view is developed and communicated to the business level. Procedures exist that are designed to ensure that policies relating to conduct, ethics, and business practices are followed. We continually monitor the system of internal controls, data processing systems, and corporate-wide processes and procedures to manage operational risk at appropriate, cost-effective levels. An additional level of review is applied to current and potential regulation and its impact on business processes, to ensure that appropriate controls are put in place to address regulation requirements. Today’s threats to customer information and information systems are complex, more wide spread, continually emerging, and increasing at a rapid pace. The Corporation continuously monitors these threats and, to date, we have not experienced any material losses as a result of cyber attacks.
ADOPTION OF NEW ACCOUNTING STANDARDS AND ISSUED BUT NOT YET EFFECTIVE ACCOUNTING STANDARDS
FASB Accounting Standards Update 2014-04, Receivables-Troubled Debt Restructuring by Creditors (SubTopic 310-40): Reclassification of Residential Real Estate Collateralized Consumer Mortgage Loans upon Foreclosure (“ASU 2014-04”)
The FASB issued ASU 2014-04 in January 2014 which clarifies when a creditor should be considered to have received physical possession of a residential real estate property collateralizing a consumer mortgage loan such that the loan should be derecognized and the real estate property recognized.
The amendments of this ASU clarify that an in substance repossession or foreclosure occurs, and a creditor is considered to have received physical possession of residential real estate property collateralizing a consumer mortgage loan, upon either: a) the creditor obtaining legal title to the residential real estate property upon completion of a foreclosure; or b) the borrower conveying all interest in the residential real estate property to the creditor to satisfy that loan through completion of a deed in lieu of foreclosure or through a similar legal agreement.
The amendment of this guidance requires interim and annual disclosures of both the amount of foreclosed residential real estate property held by the creditor and the recorded investment in consumer mortgage loans collateralized by residential real estate property that are in the process of foreclosure according to local requirements of the applicable jurisdiction.
ASU 2014-04 is effective for annual periods, and interim periods within those years, beginning after December 15, 2014. The amendments in this ASU can be elected using either a modified retrospective transition method or a prospective transition method. Early adoption is permitted.
The Corporation does not anticipate that the adoption of this guidance will have a material effect on its consolidated statements of financial condition or results of operations.
FASB Accounting Standards Update 2013-11, Income Taxes (Topic 740): Presentation of an Unrecognized Tax Benefit When a Net Operating Loss Carryforward, a Similar Tax Loss, or a Tax Credit Carryforward Exists (“ASU 2013-11”)
The FASB issued ASU 2013-11 in July 2013 which requires that an unrecognized tax benefit, or a portion of an unrecognized tax benefit, be presented in the financial statements as a reduction to a deferred tax asset for a net operating loss carryforward, a similar tax loss, or a tax credit carryforward. When a net operating loss, a similar tax loss, or a tax credit carryforward is not available at the reporting date under the tax law of the applicable jurisdiction to settle any additional taxes that would result from the disallowance of a tax position, or the tax law of the applicable jurisdiction does not require the entity to use, and the entity does not intend to use, the deferred tax asset for such purposes, the unrecognized tax benefit should be presented in the financial statements as a liability and should not be combined with deferred tax assets. The assessment of whether a deferred tax asset is available is based on the unrecognized tax benefit and deferred tax asset that exist at the reporting date and should be made presuming disallowance of the tax position at the reporting date. Currently, there is no explicit guidance under U.S. GAAP on the financial
104
statement presentation of an unrecognized tax benefit when a net operating loss carryforward, a similar tax loss, or a tax credit carryforward exists. The amendment of this guidance does not require new recurring disclosures.
ASU 2013-11 is effective for fiscal years, and interim periods within those years, beginning after December 15, 2013. The adoption of this guidance is not expected to have a material effect on the Corporation’s consolidated financial statements.
FASB Accounting Standards Update 2013-10, Derivatives and Hedging (Topic 815): Inclusion of the Fed Funds Swap Rate (or Overnight Index Swap Rate) as a Benchmark Interest Rate for Hedge Accounting Purposes (“ASU 2013-10”)
The FASB issued ASU 2013-10 in July 2013 which permits the use of the Overnight Index Swap Rate (OIS), also referred to as the Fed Funds Effective Swap Rate as a U.S. GAAP benchmark interest rate for hedge accounting purposes under Topic 815. Currently, only the interest rates on direct Treasury obligations of the U.S. government (UST) and the London Interbank Offered Rate (LIBOR) swap rate are considered benchmark interest rates in the United States. This update also removes the restriction on using different benchmark rates for similar hedges. Including the Fed Funds Effective Swap Rate as an acceptable U.S. benchmark interest rate in addition to UST and LIBOR will provide risk managers with a more comprehensive spectrum of interest rate resets to utilize as the designated interest risk component under the hedge accounting guidance in Topic 815.
The amendments of this ASU are effective prospectively for qualifying new or redesignated hedging relationships entered into on or after July 17, 2013.
The adoption of this guidance has not had a material effect on its consolidated statements of financial condition or results of operations.
FASB Accounting Standards Update 2013-05, Foreign Currency Matters (Topic 830): Parent’s Accounting for the Cumulative Translation Adjustment Upon Derecognition of Certain Subsidiaries or Groups of Assets within a Foreign Entity or of an Investment in a Foreign Entity (“ASU 2013-05”)
The FASB issued ASU 2013-05 in March 2013 which clarifies the applicable guidance for the release of the cumulative translation adjustment. When a reporting entity ceases to have a controlling financial interest in a subsidiary or group of assets that is a nonprofit activity or a business within a foreign entity, the parent is required to apply the guidance in ASC subtopic 830-30 to release any related cumulative translation adjustment into net income. Accordingly, the cumulative translation adjustment should be released into net income only if the sale or transfer results in the complete or substantially complete liquidation of the foreign entity in which the subsidiary or group of assets has resided.
For an equity method investment that is a foreign entity, the partial sale guidance in ASC Section 830-30-40 still applies. As such, a pro rata portion of the cumulative translation adjustment should be released into net income upon a partial sale of such equity method investment. However, this treatment does not apply to an equity method investment that is not a foreign entity. In those instances, the cumulative translation adjustment is released into net income only if the partial sale represents a complete or substantially complete liquidation of the foreign entity that contains the equity method investment.
Additionally, the amendments in this ASU clarify that the sale of an investment in a foreign entity includes both: (1) events that result in the loss of a controlling financial interest in a foreign entity and (2) events that result in an acquirer obtaining control of an acquiree in which it held an equity interest immediately before the acquisition date. Accordingly, the cumulative translation adjustment should be released into net income upon the occurrence of those events.
ASU 2013-05 is effective for fiscal years and interim periods within those years, beginning on or after December 15, 2013. The amendments should be applied prospectively to derecognition events occurring after the effective date. Prior periods should not be adjusted.
The adoption of this guidance is not expected to have a material effect on the Corporation’s consolidated financial statements.
105
Table 70 - Adjusted Consolidated Statement of Operations for the Year Ended December 31, 2013 (Non-GAAP)
| | | | | | | | | | | | | | | | | | | | | | | | | | | | | | | | |
| | | Year ended | |
| |
| | | 31-Dec-13 | |
| |
| | | | | | 1st QTR | | | 2nd QTR | | | 3rd QTR | | | 4th QTR | | | | |
| |
| (In thousands) | | Actual Results
(US GAAP) | | | Impact of Sale
of NPAs [2] | | | Impact of Sale
of NPLs | | | Impact of
EVERTEC’s
IPO | | | Income Tax Adjustment [3] | | | Impact of
EVERTEC’s
SPO | | | Impact of
EVERTEC’s
SPO | | | Adjusted
Results
(Non-GAAP) | |
| |
| | | | | | | | |
Net interest income | | | $ 1,432,580 | | | | $ - | | | | $ - | | | | $ 1,502 | | | | $ - | | | | $ - | | | | $ - | | | $ | 1,431,078 | |
Provision for loan losses – non-covered loans | | | 533,167 | | | | 148,823 | | | | 169,248 | | | | - | | | | - | | | | - | | | | - | | | | 215,096 | |
Provision for loan losses – covered loans [1] | | | 69,396 | | | | - | | | | - | | | | - | | | | - | | | | - | | | | - | | | | 69,396 | |
| |
Net interest income after provision for loan losses | | | 830,017 | | | | (148,823 | ) | | | (169,248 | ) | | | 1,502 | | | | - | | | | - | | | | - | | | | 1,146,586 | |
| |
Service charges on deposit accounts and other service fees | | | 408,034 | | | | - | | | | - | | | | - | | | | - | | | | - | | | | - | | | | 408,034 | |
| | | | | | | | |
Mortgage banking activities | | | 71,673 | | | | - | | | | - | | | | - | | | | - | | | | - | | | | - | | | | 71,673 | |
| | | | | | | | |
Net gain and valuation adjustments on investments securities | | | 7,966 | | | | - | | | | - | | | | 5,856 | | | | - | | | | - | | | | - | | | | 2,110 | |
| | | | | | | | |
Trading account loss | | | (13,483 | ) | | | - | | | | - | | | | - | | | | - | | | | - | | | | - | | | | (13,483) | |
| | | | | | | | |
Net (loss) gain on sale of loans, including valuation adjustments on loans held-for-sale | | | (49,130 | ) | | | (61,387 | ) | | | (3,865 | ) | | | - | | | | - | | | | - | | | | - | | | | 16,122 | |
| | | | | | | | |
Adjustments (expense) to indemnity reserves on loans sold | | | (37,054 | ) | | | (10,700 | ) | | | (3,047 | ) | | | - | | | | - | | | | - | | | | - | | | | (23,307) | |
| | | | | | | | |
FDIC loss share expense | | | (82,051 | ) | | | - | | | | - | | | | - | | | | - | | | | - | | | | - | | | | (82,051) | |
| | | | | | | | |
Other non-interest income | | | 504,614 | | | | - | | | | - | | | | 162,091 | | | | - | | | | 175,867 | | | | 92,358 | | | | 74,298 | |
| |
| | | | | | | | |
Total non-interest income | | | 810,569 | | | | (72,087 | ) | | | (6,912 | ) | | | 167,947 | | | | - | | | | 175,867 | | | | 92,358 | | | | 453,396 | |
| |
| | | | | | | | |
Other taxes | | | 58,286 | | | | - | | | | - | | | | - | | | | | | | | - | | | | - | | | | 58,286 | |
| | | | | | | | |
Professional fees | | | 289,280 | | | | 5 | | | | - | | | | 856 | | | | - | | | | 250 | | | | - | | | | 288,169 | |
| | | | | | | | |
OREO expense | | | 80,236 | | | | 37,046 | | | | - | | | | - | | | | - | | | | - | | | | - | | | | 43,190 | |
| | | | | | | | |
Other operating expenses | | | 864,784 | | | | - | | | | - | | | | - | | | | - | | | | - | | | | - | | | | 864,784 | |
| |
| | | | | | | | |
Total operating expenses | | | 1,292,586 | | | | 37,051 | | | | - | | | | 856 | | | | - | | | | 250 | | | | - | | | | 1,254,429 | |
| |
| | | | | | | | |
Income (loss) before income tax | | | 348,000 | | | | (257,961 | ) | | | (176,160 | ) | | | 168,593 | | | | - | | | | 175,617 | | | | 92,358 | | | | 345,553 | |
| | | | | | | | |
Income tax (benefit) expense | | | (251,327 | ) | | | (77,388 | ) | | | (68,987 | ) | | | 11,988 | | | | (218,035 | ) | | | 7,789 | | | | 3,945 | | | | 89,361 | |
| |
| | | | | | | | |
Net income (loss) | | | $ 599,327 | | | | $ (180,573 | ) | | | $ (107,173 | ) | | | $ 156,605 | | | | $ 218,035 | | | | $ 167,828 | | | | $ 88,413 | | | $ | 256,192 | |
| |
[1] Covered loans represent loans acquired in the Westernbank FDIC-assisted transaction that are covered under FDIC loss sharing agreements.
[2] Net (loss) gain on sale of loans for the first quarter includes $8.8 million of negative valuation adjustments on loans held for sale which were transferred to held-in-portfolio subsequent to the sale.
[3] Represents the net benefit of $215.6 million for the increase on the net deferred tax asset from the change of the corporate tax rate from 30% to 39% which includes the adjustment for the results of the first quarter of 2013, $7.9 million resulting from the adjustment in tax rate for distributions from EVERTEC from 15% to 4%, offset by an adjustment of $5.5 million on the deferred tax liability related to the covered loans portfolio.
106
Statistical Summary 2009-2013
Statements of Financial Condition
| | | | | | | | | | | | | | | | | | | | |
| | | At December 31, | |
| (In thousands) | | 2013 | | | 2012 | | | 2011 | | | 2010 | | | 2009 | |
| |
Assets: | | | | | | | | | | | | | | | | | | | | |
Cash and due from banks | | $ | 423,211 | | | $ | 439,363 | | | $ | 535,282 | | | $ | 452,373 | | | $ | 677,330 | |
| |
Money market investments: | | | | | | | | | | | | | | | | | | | | |
Federal funds sold and securities purchased under agreements to resell | | | 181,020 | | | | 246,977 | | | | 327,668 | | | | 181,961 | | | | 452,932 | |
Time deposits with other banks | | | 677,433 | | | | 838,603 | | | | 1,048,506 | | | | 797,334 | | | | 549,865 | |
| |
Total money market investments | | | 858,453 | | | | 1,085,580 | | | | 1,376,174 | | | | 979,295 | | | | 1,002,797 | |
| |
Trading account securities, at fair value | | | 339,743 | | | | 314,525 | | | | 436,331 | | | | 546,713 | | | | 462,436 | |
Investment securities available-for-sale, at fair value | | | 5,294,800 | | | | 5,084,201 | | | | 5,009,823 | | | | 5,236,852 | | | | 6,694,714 | |
Investment securities held-to-maturity, at amortized cost | | | 140,496 | | | | 142,817 | | | | 125,383 | | | | 122,354 | | | | 212,962 | |
Other investment securities, at lower of cost or realizable value | | | 181,752 | | | | 185,443 | | | | 179,880 | | | | 163,513 | | | | 164,149 | |
Loans held-for-sale, at lower of cost or fair value | | | 110,426 | | | | 354,468 | | | | 363,093 | | | | 893,938 | | | | 90,796 | |
| |
Loans held-in-portfolio: | | | | | | | | | | | | | | | | | | | | |
Loans not covered under loss sharing agreements with the FDIC | | | 21,704,010 | | | | 21,080,005 | | | | 20,703,192 | | | | 20,834,276 | | | | 23,827,263 | |
Loans covered under loss sharing agreements with the FDIC | | | 2,984,427 | | | | 3,755,972 | | | | 4,348,703 | | | | 4,836,882 | | | | - | |
Less – Unearned income | | | 92,144 | | | | 96,813 | | | | 100,596 | | | | 106,241 | | | | 114,150 | |
Allowance for loan losses | | | 640,555 | | | | 730,607 | | | | 815,308 | | | | 793,225 | | | | 1,261,204 | |
| |
Total loans held-in-portfolio, net | | | 23,955,738 | | | | 24,008,557 | | | | 24,135,991 | | | | 24,771,692 | | | | 22,451,909 | |
| |
FDIC loss share asset | | | 948,608 | | | | 1,399,098 | | | | 1,915,128 | | | | 2,410,219 | | | | - | |
Premises and equipment, net | | | 519,516 | | | | 535,793 | | | | 538,486 | | | | 545,453 | | | | 584,853 | |
Other real estate not covered under loss sharing agreements with the FDIC | | | 135,501 | | | | 266,844 | | | | 172,497 | | | | 161,496 | | | | 125,483 | |
Other real estate covered under loss sharing agreements with the FDIC | | | 168,007 | | | | 139,058 | | | | 109,135 | | | | 57,565 | | | | - | |
Accrued income receivable | | | 131,536 | | | | 125,728 | | | | 125,209 | | | | 150,658 | | | | 126,080 | |
Mortgage servicing assets, at fair value | | | 161,099 | | | | 154,430 | | | | 151,323 | | | | 166,907 | | | | 169,747 | |
Other assets | | | 1,687,558 | | | | 1,569,578 | | | | 1,462,393 | | | | 1,449,887 | | | | 1,324,917 | |
Goodwill | | | 647,757 | | | | 647,757 | | | | 648,350 | | | | 647,387 | | | | 604,349 | |
Other intangible assets | | | 45,132 | | | | 54,295 | | | | 63,954 | | | | 58,696 | | | | 43,803 | |
| |
Total assets | | $ | 35,749,333 | | | $ | 36,507,535 | | | $ | 37,348,432 | | | $ | 38,814,998 | | | $ | 34,736,325 | |
| |
Liabilities and Stockholders’ Equity | | | | | | | | | | | | | | | | | | | | |
Liabilities: | | | | | | | | | | | | | | | | | | | | |
Deposits: | | | | | | | | | | | | | | | | | | | | |
Non-interest bearing | | $ | 5,922,682 | | | $ | 5,794,629 | | | $ | 5,655,474 | | | $ | 4,939,321 | | | $ | 4,495,301 | |
Interest bearing | | | 20,788,463 | | | | 21,205,984 | | | | 22,286,653 | | | | 21,822,879 | | | | 21,429,593 | |
| |
Total deposits | | | 26,711,145 | | | | 27,000,613 | | | | 27,942,127 | | | | 26,762,200 | | | | 25,924,894 | |
| |
Assets sold under agreements to repurchase | | | 1,659,292 | | | | 2,016,752 | | | | 2,141,097 | | | | 2,412,550 | | | | 2,632,790 | |
Other short-term borrowings | | | 401,200 | | | | 636,200 | | | | 296,200 | | | | 364,222 | | | | 7,326 | |
Notes payable | | | 1,584,754 | | | | 1,777,721 | | | | 1,856,372 | | | | 4,170,183 | | | | 2,648,632 | |
Other liabilities | | | 766,792 | | | | 966,249 | | | | 1,193,883 | | | | 1,305,312 | | | | 983,866 | |
| |
Total liabilities | | | 31,123,183 | | | | 32,397,535 | | | | 33,429,679 | | | | 35,014,467 | | | | 32,197,508 | |
| |
Stockholders’ equity: | | | | | | | | | | | | | | | | | | | | |
Preferred stock | | | 50,160 | | | | 50,160 | | | | 50,160 | | | | 50,160 | | | | 50,160 | |
Common stock | | | 1,034 | | | | 1,032 | | | | 1,026 | | | | 1,023 | | | | 640 | |
Surplus | | | 4,170,152 | | | | 4,150,294 | | | | 4,123,898 | | | | 4,103,211 | | | | 2,809,993 | |
Retained earnings (accumulated deficit) | | | 594,430 | | | | 11,826 | | | | (212,726 | ) | | | (347,328 | ) | | | (292,752) | |
Treasury stock – at cost | | | (881 | ) | | | (444 | ) | | | (1,057 | ) | | | (574 | ) | | | (15) | |
Accumulated other comprehensive loss, net of tax | | | (188,745 | ) | | | (102,868 | ) | | | (42,548 | ) | | | (5,961 | ) | | | (29,209) | |
| |
Total stockholders’ equity | | | 4,626,150 | | | | 4,110,000 | | | | 3,918,753 | | | | 3,800,531 | | | | 2,538,817 | |
| |
Total liabilities and stockholders’ equity | | $ | 35,749,333 | | | $ | 36,507,535 | | | $ | 37,348,432 | | | $ | 38,814,998 | | | $ | 34,736,325 | |
| |
107
Statistical Summary 2009-2013
Statements of Operations
| | | | | | | | | | | | | | | | | | | | |
| | | For the years ended December 31, | |
| (In thousands) | | 2013 | | | 2012 | | | 2011 | | | 2010 | | | 2009 | |
| |
| | | | | |
Interest income: | | | | | | | | | | | | | | | | | | | | |
| | | | | |
Loans | | $ | 1,581,612 | | | $ | 1,560,687 | | | $ | 1,696,130 | | | $ | 1,677,316 | | | $ | 1,519,249 | |
| | | | | |
Money market investments | | | 3,464 | | | | 3,703 | | | | 3,596 | | | | 5,384 | | | | 8,570 | |
| | | | | |
Investment securities | | | 141,807 | | | | 168,632 | | | | 205,828 | | | | 238,682 | | | | 291,988 | |
| | | | | |
Trading account securities | | | 21,573 | | | | 22,824 | | | | 35,607 | | | | 27,918 | | | | 35,190 | |
| |
| | | | | |
Total interest income | | | 1,748,456 | | | | 1,755,846 | | | | 1,941,161 | | | | 1,949,300 | | | | 1,854,997 | |
| | | | | |
Less - Interest expense | | | 315,876 | | | | 379,213 | | | | 505,816 | | | | 653,427 | | | | 753,744 | |
| |
| | | | | |
Net interest income | | | 1,432,580 | | | | 1,376,633 | | | | 1,435,345 | | | | 1,295,873 | | | | 1,101,253 | |
| | | | | |
Provision for loan losses - non-covered loans | | | 533,167 | | | | 334,102 | | | | 430,085 | | | | 1,011,880 | | | | 1,405,807 | |
| | | | | |
Provision for loan losses - covered loans | | | 69,396 | | | | 74,839 | | | | 145,635 | | | | - | | | | - | |
| |
| | | | | |
Net interest income after provision for loan losses | | | 830,017 | | | | 967,692 | | | | 859,625 | | | | 283,993 | | | | (304,554) | |
| |
| | | | | |
Mortgage banking activities | | | 71,673 | | | | 84,791 | | | | (4,483 | ) | | | 16,178 | | | | 15,451 | |
| | | | | |
Net gain (loss) and valuation adjustments on investment securities | | | 7,966 | | | | (1,707 | ) | | | 10,844 | | | | 3,992 | | | | 219,546 | |
| | | | | |
Trading account (loss) profit | | | (13,483 | ) | | | 4,478 | | | | 48,098 | | | | 33,017 | | | | 54,061 | |
| | | | | |
Net (loss) gain on sale of loans, including valuation adjustments on loans held-for-sale | | | (49,130 | ) | | | (27,416 | ) | | | 5,270 | | | | 7,884 | | | | (9,535) | |
| | | | | |
Adjustments (expense) to indemnity reserves | | | (37,054 | ) | | | (21,198 | ) | | | (33,068 | ) | | | (72,013 | ) | | | (40,211) | |
| | | | | |
FDIC loss share (expense) income | | | (82,051 | ) | | | (56,211 | ) | | | 66,791 | | | | (25,751 | ) | | | - | |
| | | | | |
Fair value change in equity appreciation instrument | | | - | | | | - | | | | 8,323 | | | | 42,555 | | | | - | |
| | | | | |
Gain on sale of processing and technology business | | | - | | | | - | | | | - | | | | 640,802 | | | | - | |
| | | | | |
Other non-interest income | | | 912,648 | | | | 548,475 | | | | 523,651 | | | | 657,794 | | | | 657,189 | |
| |
| | | | | |
Total non-interest income | | | 810,569 | | | | 531,212 | | | | 625,426 | | | | 1,304,458 | | | | 896,501 | |
| |
| | | | | |
Operating expenses: | | | | | | | | | | | | | | | | | | | | |
| | | | | |
Personnel costs | | | 461,867 | | | | 465,702 | | | | 453,370 | | | | 514,198 | | | | 533,263 | |
| | | | | |
All other operating expenses | | | 830,719 | | | | 814,330 | | | | 765,429 | | | | 828,622 | | | | 620,933 | |
| |
| | | | | |
Total operating expenses | | | 1,292,586 | | | | 1,280,032 | | | | 1,218,799 | | | | 1,342,820 | | | | 1,154,196 | |
| |
| | | | | |
Income (loss) from continuing operations, before income tax | | | 348,000 | | | | 218,872 | | | | 266,252 | | | | 245,631 | | | | (562,249) | |
| | | | | |
Income tax (benefit) expense | | | (251,327 | ) | | | (26,403 | ) | | | 114,927 | | | | 108,230 | | | | (8,302) | |
| |
| | | | | |
Income (loss) from continuing operations | | $ | 599,327 | | | $ | 245,275 | | | $ | 151,325 | | | $ | 137,401 | | | $ | (553,947) | |
| | | | | |
Loss from discontinued operations, net of income tax | | | - | | | | - | | | | - | | | | - | | | | (19,972) | |
| |
| | | | | |
Net Income (Loss) | | $ | 599,327 | | | $ | 245,275 | | | $ | 151,325 | | | $ | 137,401 | | | $ | (573,919) | |
| |
| | | | | |
Net Income (Loss) Applicable to Common Stock | | $ | 595,604 | | | $ | 241,552 | | | $ | 147,602 | | | $ | (54,576 | ) | | $ | 97,377 | |
| |
108
Statistical Summary 2009-2013
Average Balance Sheet and Summary of Net Interest Income
| | | | | | | | | | | | | | | | | | | | | | | | | | | | | | | | | | | | |
| On a Taxable Equivalent Basis* | |
| |
| | | 2013 | | | 2012 | | | 2011 | |
| |
| (Dollars in thousands) | | Average
Balance | | | Interest | | | Average
Rate | | | Average
Balance | | | Interest | | | Average
Rate | | | Average
Balance | | | Interest | | | Average
Rate | |
Assets | | | | | | | | | | | | | | | | | | | | | | | | | | | | | | | | | | | | |
Interest earning assets: | | | | | | | | | | | | | | | | | | | | | | | | | | | | | | | | | | | | |
Money market investments | | $ | 1,036,495 | | | $ | 3,464 | | | | 0.33 | % | | $ | 1,051,373 | | | $ | 3,704 | | | | 0.35 | % | | $ | 1,152,014 | | | $ | 3,597 | | | | 0.31 % | |
| |
U.S. Treasury securities | | | 37,429 | | | | 1,505 | | | | 4.02 | | | | 34,757 | | | | 1,418 | | | | 4.08 | | | | 50,971 | | | | 1,502 | | | | 2.95 | |
Obligations of U.S. Government sponsored entities | | | 1,273,766 | | | | 28,926 | | | | 2.27 | | | | 1,038,829 | | | | 34,881 | | | | 3.36 | | | | 1,180,680 | | | | 49,781 | | | | 4.22 | |
Obligations of Puerto Rico, States and political subdivisions | | | 172,403 | | | | 12,295 | | | | 7.13 | | | | 152,697 | | | | 9,850 | | | | 6.45 | | | | 139,847 | | | | 8,972 | | | | 6.42 | |
Collateralized mortgage obligations and mortgage-backed securities | | | 3,758,610 | | | | 106,377 | | | | 2.83 | | | | 3,752,954 | | | | 121,494 | | | | 3.24 | | | | 3,896,743 | | | | 148,884 | | | | 3.82 | |
Other | | | 245,980 | | | | 12,765 | | | | 5.19 | | | | 247,717 | | | | 14,451 | | | | 5.83 | | | | 226,033 | | | | 15,213 | | | | 6.73 | |
| |
Total investment securities | | | 5,488,188 | | | | 161,868 | | | | 2.95 | | | | 5,226,954 | | | | 182,094 | | | | 3.48 | | | | 5,494,274 | | | | 224,352 | | | | 4.08 | |
| |
Trading account securities | | | 416,538 | | | | 26,026 | | | | 6.25 | | | | 445,881 | | | | 25,909 | | | | 5.81 | | | | 667,277 | | | | 38,850 | | | | 5.82 | |
| |
Non-covered loans | | | 21,506,823 | | | | 1,318,865 | | | | 6.13 | | | | 20,795,156 | | | | 1,279,551 | | | | 6.15 | | | | 21,004,406 | | | | 1,303,199 | | | | 6.20 | |
Covered loans | | | 3,227,719 | | | | 300,745 | | | | 9.32 | | | | 4,050,338 | | | | 301,441 | | | | 7.44 | | | | 4,613,361 | | | | 412,678 | | | | 8.95 | |
| |
Total loans (net of unearned income) | | | 24,734,542 | | | | 1,619,610 | | | | 6.55 | | | | 24,845,494 | | | | 1,580,992 | | | | 6.36 | | | | 25,617,767 | | | | 1,715,877 | | | | 6.70 | |
| |
Total interest earning assets/Interest income | | $ | 31,675,763 | | | $ | 1,810,968 | | | | 5.72 | % | | $ | 31,569,702 | | | $ | 1,792,699 | | | | 5.68 | % | | $ | 32,931,332 | | | $ | 1,982,676 | | | | 6.02 % | |
| |
Total non-interest earning assets | | | 4,591,230 | | | | | | | | | | | | 4,694,329 | | | | | | | | | | | | 5,134,936 | | | | | | | | | |
| |
Total assets from continuing operations | | $ | 36,266,993 | | | | | | | | | | | $ | 36,264,031 | | | | | | | | | | | $ | 38,066,268 | | | | | | | | | |
| |
Total assets from discontinued operations | | | - | | | | - | | | | - | | | | - | | | | - | | | | - | | | | - | | | | - | | | | - | |
| |
Total assets | | $ | 36,266,993 | | | | | | | | | | | $ | 36,264,031 | | | | | | | | | | | $ | 38,066,268 | | | | | | | | | |
| |
Liabilities and Stockholders’ Equity | | | | | | | | | | | | | | | | | | | | | | | | | | | | | | | | | | | | |
Interest bearing liabilities: | | | | | | | | | | | | | | | | | | | | | | | | | | | | | | | | | | | | |
Savings, NOW, money market and other interest bearing demand accounts | | $ | 12,530,326 | | | $ | 35,524 | | | | 0.28 | % | | $ | 12,126,336 | | | $ | 46,430 | | | | 0.38 | % | | $ | 11,525,060 | | | $ | 68,838 | | | | 0.60 % | |
Time deposits | | | 8,513,821 | | | | 101,840 | | | | 1.20 | | | | 9,420,948 | | | | 137,786 | | | | 1.46 | | | | 10,919,907 | | | | 200,956 | | | | 1.84 | |
Short-term borrowings | | | 2,573,057 | | | | 38,433 | | | | 1.49 | | | | 2,565,110 | | | | 46,805 | | | | 1.82 | | | | 2,629,979 | | | | 55,258 | | | | 2.10 | |
Notes payable | | | 1,719,985 | | | | 140,079 | | | | 8.14 | | | | 1,850,514 | | | | 148,192 | | | | 8.01 | | | | 1,834,915 | | | | 148,603 | | | | 8.10 | |
Note issued to the FDIC | | | - | | | | - | | | | - | | | | - | | | | - | | | | - | | | | 1,381,981 | | | | 32,161 | | | | 2.33 | |
| |
| | | | | | | | | |
Total interest bearing liabilities/Interest expense | | | 25,337,189 | | | | 315,876 | | | | 1.25 | | | | 25,962,908 | | | | 379,213 | | | | 1.46 | | | | 28,291,842 | | | | 505,816 | | | | 1.79 | |
| |
Total non-interest bearing liabilities | | | 6,753,455 | | | | | | | | | | | | 6,457,471 | | | | | | | | | | | | 6,041,590 | | | | | | | | | |
| |
Total liabilities from continuing operations | | | 32,090,644 | | | | | | | | | | | | 32,420,379 | | | | | | | | | | | | 34,333,432 | | | | | | | | | |
| |
Total liabilities from discontinued operations | | | - | | | | - | | | | - | | | | - | | | | - | | | | - | | | | - | | | | - | | | | - | |
| |
Total liabilities | | | 32,090,644 | | | | | | | | | | | | 32,420,379 | | | | | | | | | | | | 34,333,432 | | | | | | | | | |
| |
Stockholders’ equity | | | 4,176,349 | | | | | | | | | | | | 3,843,652 | | | | | | | | | | | | 3,732,836 | | | | | | | | | |
| |
Total liabilities and stockholders’ equity | | $ | 36,266,993 | | | | | | | | | | | $ | 36,264,031 | | | | | | | | | | | $ | 38,066,268 | | | | | | | | | |
| |
Net interest income on a taxable equivalent basis | | | | | | $ | 1,495,092 | | | | | | | | | | | $ | 1,413,486 | | | | | | | | | | | $ | 1,476,860 | | | | | |
| |
Cost of funding earning assets | | | | | | | | | | | 1.00 | % | | | | | | | | | | | 1.20 | % | | | | | | | | | | | 1.54 % | |
| |
Net interest margin | | | | | | | | | | | 4.72 | % | | | | | | | | | | | 4.48 | % | | | | | | | | | | | 4.48 % | |
| |
Effect of the taxable equivalent adjustment | | | | | | | 62,512 | | | | | | | | | | | | 36,853 | | | | | | | | | | | | 41,515 | | | | | |
| |
Net interest income per books | | | | | | $ | 1,432,580 | | | | | | | | | | | $ | 1,376,633 | | | | | | | | | | | $ | 1,435,345 | | | | | |
| |
* Shows the effect of the tax exempt status of some loans and investments on their yield, using the applicable statutory income tax rates. The computation considers the interest expense disallowance required by the Puerto Rico Internal Revenue Code. This adjustment is shown in order to compare the yields of the tax exempt and taxable assets on a taxable basis.
Note: Average loan balances include the average balance of non-accruing loans. No interest income is recognized for these loans in accordance with the Corporation’s policy.
109
Statistical Summary 2009-2013
Average Balance Sheet and Summary of Net Interest Income
| | | | | | | | | | | | | | | | | | | | | | | | |
| On a Taxable Equivalent Basis | | | | | | | | | | | | | | | | | | |
| |
| | | 2010 | | | 2009 | |
| |
| (Dollars in thousands) | | Average
Balance | | | Interest | | | Average
Rate | | | Average
Balance | | | Interest | | | Average
Rate | |
Assets | | | | | | | | | | | | | | | | | | | | | | | | |
Interest earning assets: | | | | | | | | | | | | | | | | | | | | | | | | |
Money market investments | | $ | 1,539,046 | | | $ | 5,384 | | | | 0.35 | % | | $ | 1,183,209 | | | $ | 8,573 | | | | 0.72 % | |
| |
U.S. Treasury securities | | | 80,740 | | | | 1,527 | | | | 1.89 | | | | 70,308 | | | | 3,452 | | | | 4.91 | |
Obligations of U.S. Government sponsored entities | | | 1,473,227 | | | | 54,748 | | | | 3.72 | | | | 1,977,460 | | | | 103,303 | | | | 5.22 | |
Obligations of Puerto Rico, States and political subdivisions | | | 228,291 | | | | 11,171 | | | | 4.89 | | | | 342,479 | | | | 22,048 | | | | 6.44 | |
Collateralized mortgage obligations and mortgage-backed securities | | | 4,340,545 | | | | 160,632 | | | | 3.70 | | | | 4,757,407 | | | | 200,616 | | | | 4.22 | |
Other | | | 176,766 | | | | 11,048 | | | | 6.25 | | | | 301,649 | | | | 15,046 | | | | 4.99 | |
| |
Total investment securities | | | 6,299,569 | | | | 239,126 | | | | 3.80 | | | | 7,449,303 | | | | 344,465 | | | | 4.62 | |
| |
Trading account securities | | | 493,628 | | | | 32,333 | | | | 6.55 | | | | 614,827 | | | | 40,771 | | | | 6.63 | |
| |
Non-covered loans | | | 22,456,846 | | | | 1,378,453 | | | | 6.14 | | | | 24,836,067 | | | | 1,540,918 | | | | 6.20 | |
Covered loans | | | 3,364,932 | | | | 303,096 | | | | 9.01 | | | | - | | | | - | | | | - | |
| |
Total loans (net of unearned income) | | | 25,821,778 | | | | 1,681,549 | | | | 6.51 | | | | 24,836,067 | | | | 1,540,918 | | | | 6.20 | |
| |
Total interest earning assets/Interest income | | $ | 34,154,021 | | | $ | 1,958,392 | | | | 5.73 | % | | $ | 34,083,406 | | | $ | 1,934,727 | | | | 5.68 % | |
| |
Total non-interest earning assets | | | 4,224,945 | | | | | | | | | | | | 2,478,103 | | | | | | | | | |
| |
Total assets from continuing operations | | $ | 38,378,966 | | | | | | | | | | | $ | 36,561,509 | | | | | | | | | |
| |
Total assets from discontinued operations | | | - | | | | - | | | | - | | | | 7,861 | | | | | | | | | |
| |
Total assets | | $ | 38,378,966 | | | | | | | | | | | $ | 36,569,370 | | | | | | | | | |
| |
Liabilities and Stockholders’ Equity | | | | | | | | | | | | | | | | | | | | | | | | |
Interest bearing liabilities: | | | | | | | | | | | | | | | | | | | | | | | | |
Savings, NOW, money market and other interest bearing demand accounts | | $ | 10,951,331 | | | $ | 93,842 | | | | 0.86 | % | | $ | 10,342,100 | | | $ | 107,355 | | | | 1.04 % | |
Time deposits | | | 10,967,033 | | | | 257,085 | | | | 2.34 | | | | 12,192,824 | | | | 393,906 | | | | 3.23 | |
Short-term borrowings | | | 2,400,653 | | | | 60,278 | | | | 2.51 | | | | 2,887,727 | | | | 69,357 | | | | 2.40 | |
Notes payable | | | 2,293,878 | | | | 183,701 | | | | 8.01 | | | | 2,945,169 | | | | 183,126 | | | | 6.22 | |
Note issued to the FDIC | | | 2,753,490 | | | | 58,521 | | | | 2.13 | | | | - | | | | - | | | | - | |
| |
| | | | | | |
Total interest bearing liabilities/Interest expense | | | 29,366,385 | | | | 653,427 | | | | 2.23 | | | | 28,367,820 | | | | 753,744 | | | | 2.66 | |
| |
Total non-interest bearing liabilities | | | 5,753,414 | | | | | | | | | | | | 5,338,848 | | | | | | | | | |
| |
Total liabilities from continuing operations | | | 35,119,799 | | | | | | | | | | | | 33,706,668 | | | | | | | | | |
| |
Total liabilities from discontinued operations | | | - | | | | - | | | | - | | | | 10,637 | | | | | | | | | |
| |
Total liabilities | | | 35,119,799 | | | | | | | | | | | | 33,717,305 | | | | | | | | | |
| |
Stockholders’ equity | | | 3,259,167 | | | | | | | | | | | | 2,852,065 | | | | | | | | | |
| |
Total liabilities and stockholders’ equity | | $ | 38,378,966 | | | | | | | | | | | $ | 36,569,370 | | | | | | | | | |
| |
Net interest income on a taxable equivalent basis | | | | | | $ | 1,304,965 | | | | | | | | | | | $ | 1,180,983 | | | | | |
| |
Cost of funding earning assets | | | | | | | | | | | 1.91 | % | | | | | | | | | | | 2.21 % | |
| |
Net interest margin | | | | | | | | | | | 3.82 | % | | | | | | | | | | | 3.47 % | |
| |
Effect of the taxable equivalent adjustment | | | | | | | 9,092 | | | | | | | | | | | | 79,730 | | | | | |
| |
Net interest income per books | | | | | | $ | 1,295,873 | | | | | | | | | | | $ | 1,101,253 | | | | | |
| |
* Shows the effect of the tax exempt status of loans and investments on their yield, using the applicable statutory income tax rates. The computation considers the interest expense disallowance required by the Puerto Rico Internal Revenue Code. This adjustment is shown in order to compare the yield of the tax exempt and taxable assets on a taxable basis.
Note: Average loan balances include the average balance of non-accruing loans. No interest income is recognized for these loans in accordance with the Corporation’s policy.
110
Statistical Summary 2012-2013
Quarterly Financial Data
| | | | | | | | | | | | | | | | | | | | | | | | | | | | | | | | |
| | | 2013 | | | 2012 [1] | |
| | | | |
(In thousands, except per common share information) | | Fourth
Quarter | | | Third
Quarter | | | Second
Quarter | | | First
Quarter | | | Fourth
Quarter | | | Third
Quarter | | | Second
Quarter | | | First Quarter | |
| |
Summary of Operations | | | | | | | | | | | | | | | | | | | | | | | | | | | | | | | | |
Interest income | | $ | 449,076 | | | $ | 431,846 | | | $ | 437,316 | | | $ | 430,218 | | | $ | 438,798 | | | $ | 435,038 | | | $ | 441,089 | | | $ | 440,921 | |
Interest expense | | | 72,734 | | | | 77,640 | | | | 81,597 | | | | 83,905 | | | | 87,381 | | | | 90,599 | | | | 98,910 | | | | 102,323 | |
| |
Net interest income | | | 376,342 | | | | 354,206 | | | | 355,719 | | | | 346,313 | | | | 351,417 | | | | 344,439 | | | | 342,179 | | | | 338,598 | |
Provision for loan losses - non-covered loans | | | 47,729 | | | | 55,230 | | | | 223,908 | | | | 206,300 | | | | 86,256 | | | | 83,589 | | | | 81,743 | | | | 82,514 | |
Provision for loan losses - covered loans | | | 8,907 | | | | 17,433 | | | | 25,500 | | | | 17,556 | | | | (3,445 | ) | | | 22,619 | | | | 37,456 | | | | 18,209 | |
Mortgage banking activities | | | 14,392 | | | | 18,896 | | | | 18,085 | | | | 20,300 | | | | 24,373 | | | | 21,847 | | | | 14,104 | | | | 24,467 | |
Net gain (loss) and valuation adjustments on investment securities | | | 2,110 | | | | - | | | | 5,856 | | | | - | | | | (1,422 | ) | | | 64 | | | | (349 | ) | | | - | |
Trading account (loss) profit | | | (1,547 | ) | | | (6,607 | ) | | | (4,345 | ) | | | (984 | ) | | | (1,562 | ) | | | 5,443 | | | | (292 | ) | | | 889 | |
Gain (loss) on sale of loans, including valuation adjustments on loans held-for-sale | | | 5,402 | | | | 3,454 | | | | 4,733 | | | | (62,719 | ) | | | 3,043 | | | | (1,205 | ) | | | (30,157 | ) | | | 903 | |
Adjustments (expense) to indemnity reserves on loans sold | | | (6,892 | ) | | | (2,387 | ) | | | (11,632 | ) | | | (16,143 | ) | | | (3,208 | ) | | | (8,717 | ) | | | (5,398 | ) | | | (3,875) | |
FDIC loss share (expense) income | | | (37,164 | ) | | | (14,866 | ) | | | (3,755 | ) | | | (26,266 | ) | | | (36,824 | ) | | | (6,707 | ) | | | 2,575 | | | | (15,255) | |
Other non-interest income | | | 214,889 | | | | 293,469 | | | | 284,421 | | | | 119,869 | | | | 166,080 | | | | 120,649 | | | | 128,949 | | | | 132,797 | |
Operating expenses | | | 322,703 | | | | 326,599 | | | | 309,586 | | | | 333,698 | | | | 315,232 | | | | 307,033 | | | | 344,566 | | | | 313,201 | |
| |
Income (loss) before income tax | | | 188,193 | | | | 246,903 | | | | 90,088 | | | | (177,184 | ) | | | 103,854 | | | | 62,572 | | | | (12,154 | ) | | | 64,600 | |
Income tax expense (benefit) | | | 25,162 | | | | 17,768 | | | | (237,380 | ) | | | (56,877 | ) | | | 19,914 | | | | 15,384 | | | | (77,893 | ) | | | 16,192 | |
| |
Net income (loss) | | $ | 163,031 | | | $ | 229,135 | | | $ | 327,468 | | | $ | (120,307 | ) | | $ | 83,940 | | | $ | 47,188 | | | $ | 65,739 | | | $ | 48,408 | |
| |
Net income (loss) applicable to common stock | | $ | 162,100 | | | $ | 228,204 | | | $ | 326,537 | | | $ | (121,237 | ) | | $ | 83,009 | | | $ | 46,257 | | | $ | 64,809 | | | $ | 47,477 | |
| |
Net income (loss) per common share - basic: | | $ | 1.58 | | | $ | 2.22 | | | $ | 3.18 | | | $ | (1.18 | ) | | $ | 0.81 | | | $ | 0.45 | | | $ | 0.63 | | | $ | 0.46 | |
| |
Net income (loss) per common share - diluted: | | $ | 1.57 | | | $ | 2.22 | | | $ | 3.17 | | | $ | (1.18 | ) | | $ | 0.81 | | | $ | 0.45 | | | $ | 0.63 | | | $ | 0.46 | |
| |
Selected Average Balances | | | | | | | | | | | | | | | | | | | | | | | | | | | | | | | | |
(In millions) | | | | | | | | | | | | | | | | | | | | | | | | | | | | | | | | |
Total assets | | $ | 36,035 | | | $ | 36,174 | | | $ | 36,502 | | | $ | 36,362 | | | $ | 36,301 | | | $ | 35,985 | | | $ | 36,217 | | | $ | 36,556 | |
Loans | | | 24,537 | | | | 24,621 | | | | 25,017 | | | | 24,767 | | | | 24,962 | | | | 24,721 | | | | 24,760 | | | | 24,939 | |
Interest earning assets | | | 31,575 | | | | 31,434 | | | | 31,960 | | | | 31,738 | | | | 31,655 | | | | 31,346 | | | | 31,579 | | | | 31,700 | |
Deposits | | | 26,735 | | | | 26,566 | | | | 26,954 | | | | 26,837 | | | | 26,594 | | | | 26,592 | | | | 27,178 | | | | 27,257 | |
Interest-bearing liabilities | | | 24,701 | | | | 25,229 | | | | 25,693 | | | | 25,738 | | | | 25,715 | | | | 25,699 | | | | 26,034 | | | | 26,409 | |
| |
Selected Ratios | | | | | | | | | | | | | | | | | | | | | | | | | | | | | | | | |
Return on assets | | | 1.79 | % | | | 2.51 | % | | | 3.60 | % | | | (1.34 | )% | | | 0.92 | % | | | 0.52 | % | | | 0.73 | % | | | 0.53 % | |
Return on equity | | | 14.59 | | | | 21.64 | | | | 32.77 | | | | (12.58 | ) | | | 8.50 | | | | 4.81 | | | | 6.94 | | | | 5.16 | |
| |
[1] Per share data has been adjusted to retroactively reflect the 1-for-10 reverse stock split effected on May 29, 2012.
Note: Because each reporting period stands on its own the sum of the net income (loss) per common share for the quarters may not equal the net income per common share for the year.
111

Report of Management on Internal Control Over Financial Reporting
The management of Popular, Inc. (the Corporation) is responsible for establishing and maintaining adequate internal control over financial reporting as defined in Rules 13a - 15(f) and 15d - 15(f) under the Securities Exchange Act of 1934 and for our assessment of internal control over financial reporting. The Corporation’s internal control over financial reporting is a process designed to provide reasonable assurance regarding the reliability of financial reporting and the preparation of financial statements for external purposes in accordance with accounting principles generally accepted in the United States of America, and includes controls over the preparation of financial statements in accordance with the instructions to the Consolidated Financial Statements for Bank Holding Companies (Form FR Y-9C) to comply with the reporting requirements of Section 112 of the Federal Deposit Insurance Corporation Improvement Act (FDICIA). The Corporation’s internal control over financial reporting includes those policies and procedures that:
(i) pertain to the maintenance of records that, in reasonable detail, accurately and fairly reflect the transactions and dispositions of the assets of the Corporation;
(ii) provide reasonable assurance that transactions are recorded as necessary to permit preparation of financial statements in accordance with accounting principles generally accepted in the United States of America, and that receipts and expenditures of the Corporation are being made only in accordance with authorizations of management and directors of the Corporation; and
(iii) provide reasonable assurance regarding prevention or timely detection of unauthorized acquisition, use or disposition of the Corporation’s assets that could have a material effect on the financial statements.
Because of its inherent limitations, internal control over financial reporting may not prevent or detect misstatements. Also, projections of any evaluation of effectiveness to future periods are subject to the risk that controls may become inadequate because of changes in conditions, or that the degree of compliance with the policies or procedures may deteriorate.
The management of Popular, Inc. has assessed the effectiveness of the Corporation’s internal control over financial reporting as of December 31, 2013. In making this assessment, management used the criteria set forth in the “Internal Control-Integrated Framework (1992)” issued by the Committee of Sponsoring Organizations of the Treadway Commission (COSO).
Based on our assessment, management concluded that the Corporation maintained effective internal control over financial reporting as of December 31, 2013 based on the criteria referred to above.
The Corporation’s independent registered public accounting firm, PricewaterhouseCoopers, LLP, has audited the effectiveness of the Corporation’s internal control over financial reporting as of December 31, 2013, as stated in their report dated February 28, 2014 which appears herein.
| | | | |

| | | | 
|
Richard L. Carrión | | | | Carlos J. Vázquez |
Chairman of the Board, | | | | Executive Vice President |
President and Chief Executive Officer | | | | and Chief Financial Officer |
112

Report of Independent Registered
Public Accounting Firm
To the Board of Directors and
Stockholders of Popular, Inc.
In our opinion, the accompanying consolidated statements of financial condition and the related consolidated statements of operations, comprehensive income, changes in stockholders’ equity and cash flows present fairly, in all material respects, the financial position of Popular, Inc. and its subsidiaries at December 31, 2013 and 2012, and the results of their operations and their cash flows for each of the three years in the period ended December 31, 2013in conformity with accounting principles generally accepted in the United States of America. Also in our opinion, the Corporation maintained, in all material respects, effective internal control over financial reporting as of December 31, 2013, based on criteria established inInternal Control - Integrated Framework (1992) issued by the Committee of Sponsoring Organizations of the Treadway Commission (COSO). The Corporation’s management is responsible for these financial statements, for maintaining effective internal control over financial reporting and for its assessment of the effectiveness of internal control over financial reporting, included in the accompanying Report of Management on Internal Control Over Financial Reporting. Our responsibility is to express opinions on these financial statements and on the Corporation’s internal control over financial reporting based on our integrated audits. We conducted our audits in accordance with the standards of the Public Company Accounting Oversight Board (United States). Those standards require that we plan and perform the audits to obtain reasonable assurance about whether the financial statements are free of material misstatement and whether effective internal control over financial reporting was maintained in all material respects. Our audits of the financial statements included examining, on a test basis, evidence supporting the amounts and disclosures in the financial statements, assessing the accounting principles used and significant estimates made by management, and evaluating the overall financial statement presentation. Our audit of internal control over financial reporting included obtaining an understanding of internal control over financial reporting, assessing the risk that a material weakness exists, and testing and evaluating the design and operating effectiveness of internal control based on the assessed risk. Our audits also included performing such other procedures as we considered necessary in the circumstances. We believe that our audits provide a reasonable basis for our opinions.
113
A company’s internal control over financial reporting is a process designed to provide reasonable assurance regarding the reliability of financial reporting and the preparation of financial statements for external purposes in accordance with generally accepted accounting principles. Management’s assessment and our audit of Popular, Inc.’s internal control over financial reporting also included controls over the preparation of financial statements in accordance with the instructions to the Consolidated Financial Statements for Bank Holding Companies (Form FR Y-9C) to comply with the reporting requirements of Section 112 of the Federal Deposit Insurance Corporation Improvement Act (FDICIA). A company’s internal control over financial reporting includes those policies and procedures that (i) pertain to the maintenance of records that, in reasonable detail, accurately and fairly reflect the transactions and dispositions of the assets of the company; (ii) provide reasonable assurance that transactions are recorded as necessary to permit preparation of financial statements in accordance with generally accepted accounting principles, and that receipts and expenditures of the company are being made only in accordance with authorizations of management and directors of the company; and (iii) provide reasonable assurance regarding prevention or timely detection of unauthorized acquisition, use, or disposition of the company’s assets that could have a material effect on the financial statements.
Because of its inherent limitations, internal control over financial reporting may not prevent or detect misstatements. Also, projections of any evaluation of effectiveness to future periods are subject to the risk that controls may become inadequate because of changes in conditions, or that the degree of compliance with the policies or procedures may deteriorate.

PRICEWATERHOUSECOOPERS LLP
San Juan, Puerto Rico
February 28, 2014
CERTIFIED PUBLIC ACCOUNTANTS
(OF PUERTO RICO)
License No. 216 Expires Dec. 1, 2016
Stamp E97068 of the P.R.
Society of Certified Public
Accountants has been affixed
to the file copy of this report.
114
POPULAR, INC.
CONSOLIDATED STATEMENTS OF FINANCIAL CONDITION
| | | | | | | | |
| | | December 31, | |
| (In thousands, except share information) | | 2013 | | | 2012 | |
| |
Assets: | | | | | | | | |
Cash and due from banks | | $ | 423,211 | | | $ | 439,363 | |
| |
Money market investments: | | | | | | | | |
Federal funds sold | | | 5,055 | | | | 33,515 | |
Securities purchased under agreements to resell | | | 175,965 | | | | 213,462 | |
Time deposits with other banks | | | 677,433 | | | | 838,603 | |
| |
Total money market investments | | | 858,453 | | | | 1,085,580 | |
| |
Trading account securities, at fair value: | | | | | | | | |
Pledged securities with creditors’ right to repledge | | | 308,978 | | | | 271,624 | |
Other trading securities | | | 30,765 | | | | 42,901 | |
Investment securities available-for-sale, at fair value: | | | | | | | | |
Pledged securities with creditors’ right to repledge | | | 1,286,839 | | | | 1,603,693 | |
Other investment securities available-for-sale | | | 4,007,961 | | | | 3,480,508 | |
Investment securities held-to-maturity, at amortized cost (fair value 2013 - $120,688; 2012 - $144,233) | | | 140,496 | | | | 142,817 | |
Other investment securities, at lower of cost or realizable value (realizable value 2013 - $184,526; 2012 - $187,501) | | | 181,752 | | | | 185,443 | |
Loans held-for-sale, at lower of cost or fair value | | | 110,426 | | | | 354,468 | |
| |
Loans held-in-portfolio: | | | | | | | | |
Loans not covered under loss sharing agreements with the FDIC | | | 21,704,010 | | | | 21,080,005 | |
Loans covered under loss sharing agreements with the FDIC | | | 2,984,427 | | | | 3,755,972 | |
Less – Unearned income | | | 92,144 | | | | 96,813 | |
Allowance for loan losses | | | 640,555 | | | | 730,607 | |
| |
Total loans held-in-portfolio, net | | | 23,955,738 | | | | 24,008,557 | |
| |
FDIC loss share asset | | | 948,608 | | | | 1,399,098 | |
Premises and equipment, net | | | 519,516 | | | | 535,793 | |
Other real estate not covered under loss sharing agreements with the FDIC | | | 135,501 | | | | 266,844 | |
Other real estate covered under loss sharing agreements with the FDIC | | | 168,007 | | | | 139,058 | |
Accrued income receivable | | | 131,536 | | | | 125,728 | |
Mortgage servicing assets, at fair value | | | 161,099 | | | | 154,430 | |
Other assets | | | 1,687,558 | | | | 1,569,578 | |
Goodwill | | | 647,757 | | | | 647,757 | |
Other intangible assets | | | 45,132 | | | | 54,295 | |
| |
Total assets | | $ | 35,749,333 | | | $ | 36,507,535 | |
| |
Liabilities and Stockholders’ Equity | | | | | | | | |
Liabilities: | | | | | | | | |
Deposits: | | | | | | | | |
Non-interest bearing | | $ | 5,922,682 | | | $ | 5,794,629 | |
Interest bearing | | | 20,788,463 | | | | 21,205,984 | |
| |
Total deposits | | | 26,711,145 | | | | 27,000,613 | |
| |
Assets sold under agreements to repurchase | | | 1,659,292 | | | | 2,016,752 | |
Other short-term borrowings | | | 401,200 | | | | 636,200 | |
Notes payable | | | 1,584,754 | | | | 1,777,721 | |
Other liabilities | | | 766,792 | | | | 966,249 | |
| |
Total liabilities | | | 31,123,183 | | | | 32,397,535 | |
| |
Commitments and contingencies (See Note 28) | | | | | | | | |
| |
Stockholders’ equity: | | | | | | | | |
Preferred stock, 30,000,000 shares authorized; 2,006,391 shares issued and outstanding | | | 50,160 | | | | 50,160 | |
Common stock, $0.01 par value; 170,000,000 shares authorized;
103,435,967 shares issued (2012 – 103,193,303) and 103,397,699 shares outstanding (2012 – 103,169,806) | | | 1,034 | | | | 1,032 | |
Surplus | | | 4,170,152 | | | | 4,150,294 | |
Retained earnings | | | 594,430 | | | | 11,826 | |
Treasury stock – at cost, 38,268 shares (2012 – 23,497) | | | (881 | ) | | | (444) | |
Accumulated other comprehensive loss, net of tax | | | (188,745 | ) | | | (102,868) | |
| |
Total stockholders’ equity | | | 4,626,150 | | | | 4,110,000 | |
| |
Total liabilities and stockholders’ equity | | $ | 35,749,333 | | | $ | 36,507,535 | |
| |
The accompanying notes are an integral part of these consolidated financial statements.
115
POPULAR, INC.
CONSOLIDATED STATEMENTS OF OPERATIONS
| | | | | | | | | | | | |
| | | Year ended December 31, | |
| (In thousands, except per share information) | | 2013 | | | 2012 | | | 2011 | |
| |
| | | |
Interest income: | | | | | | | | | | | | |
| | | |
Loans | | $ | 1,581,612 | | | $ | 1,560,687 | | | $ | 1,696,130 | |
| | | |
Money market investments | | | 3,464 | | | | 3,703 | | | | 3,596 | |
| | | |
Investment securities | | | 141,807 | | | | 168,632 | | | | 205,828 | |
| | | |
Trading account securities | | | 21,573 | | | | 22,824 | | | | 35,607 | |
| |
| | | |
Total interest income | | | 1,748,456 | | | | 1,755,846 | | | | 1,941,161 | |
| |
| | | |
Interest expense: | | | | | | | | | | | | |
| | | |
Deposits | | | 137,364 | | | | 184,216 | | | | 269,794 | |
| | | |
Short-term borrowings | | | 38,433 | | | | 46,805 | | | | 55,258 | |
| | | |
Long-term debt | | | 140,079 | | | | 148,192 | | | | 180,764 | |
| |
| | | |
Total interest expense | | | 315,876 | | | | 379,213 | | | | 505,816 | |
| |
| | | |
Net interest income | | | 1,432,580 | | | | 1,376,633 | | | | 1,435,345 | |
| | | |
Provision for loan losses - non-covered loans | | | 533,167 | | | | 334,102 | | | | 430,085 | |
| | | |
Provision for loan losses - covered loans | | | 69,396 | | | | 74,839 | | | | 145,635 | |
| |
| | | |
Net interest income after provision for loan losses | | | 830,017 | | | | 967,692 | | | | 859,625 | |
| |
| | | |
Service charges on deposit accounts | | | 172,909 | | | | 183,026 | | | | 184,940 | |
| | | |
Other service fees | | | 235,125 | | | | 237,865 | | | | 241,000 | |
| | | |
Mortgage banking activities | | | 71,673 | | | | 84,791 | | | | (4,483) | |
| | | |
Net gain (loss) and valuation adjustments on investment securities | | | 7,966 | | | | (1,707 | ) | | | 10,844 | |
| | | |
Trading account (loss) profit | | | (13,483 | ) | | | 4,478 | | | | 48,098 | |
| | | |
Net (loss) gain on sale of loans, including valuation adjustments on loans held-for-sale | | | (49,130 | ) | | | (27,416 | ) | | | 5,270 | |
| | | |
Adjustments (expense) to indemnity reserves on loans sold | | | (37,054 | ) | | | (21,198 | ) | | | (33,068) | |
| | | |
FDIC loss share (expense) income | | | (82,051 | ) | | | (56,211 | ) | | | 66,791 | |
| | | |
Fair value change in equity appreciation instrument | | | - | | | | - | | | | 8,323 | |
| | | |
Other operating income | | | 504,614 | | | | 127,584 | | | | 97,711 | |
| |
| | | |
Total non-interest income | | | 810,569 | | | | 531,212 | | | | 625,426 | |
| |
| | | |
Operating expenses: | | | | | | | | | | | | |
| | | |
Personnel costs | | | 461,867 | | | | 465,702 | | | | 453,370 | |
| | | |
Net occupancy expenses | | | 99,331 | | | | 97,259 | | | | 98,858 | |
| | | |
Equipment expenses | | | 47,483 | | | | 45,290 | | | | 43,840 | |
| | | |
Other taxes | | | 58,286 | | | | 50,120 | | | | 51,885 | |
| | | |
Professional fees | | | 289,280 | | | | 284,325 | | | | 267,582 | |
| | | |
Communications | | | 26,294 | | | | 26,834 | | | | 27,115 | |
| | | |
Business promotion | | | 60,476 | | | | 61,576 | | | | 55,067 | |
| | | |
FDIC deposit insurance | | | 60,513 | | | | 85,697 | | | | 93,728 | |
| | | |
Loss on early extinguishment of debt | | | 3,388 | | | | 25,196 | | | | 8,693 | |
| | | |
Other real estate owned (OREO) expenses | | | 80,236 | | | | 23,520 | | | | 21,778 | |
| | | |
Other operating expenses | | | 95,549 | | | | 104,441 | | | | 87,229 | |
| | | |
Amortization of intangibles | | | 9,883 | | | | 10,072 | | | | 9,654 | |
| |
| | | |
Total operating expenses | | | 1,292,586 | | | | 1,280,032 | | | | 1,218,799 | |
| |
| | | |
Income before income tax | | | 348,000 | | | | 218,872 | | | | 266,252 | |
| | | |
Income tax (benefit) expense | | | (251,327 | ) | | | (26,403 | ) | | | 114,927 | |
| |
| | | |
Net Income | | $ | 599,327 | | | $ | 245,275 | | | $ | 151,325 | |
| |
| | | |
Net Income Applicable to Common Stock | | $ | 595,604 | | | $ | 241,552 | | | $ | 147,602 | |
| |
| | | |
Net Income per Common Share – Basic[1] | | $ | 5.80 | | | $ | 2.36 | | | $ | 1.44 | |
| |
| | | |
Net Income per Common Share – Diluted[1] | | $ | 5.78 | | | $ | 2.35 | | | $ | 1.44 | |
| |
[1] Net income per common share has been adjusted to retroactively reflect the 1-for-10 reverse stock split effected on May 29, 2012.
The accompanying notes are an integral part of these consolidated financial statements.
116
POPULAR, INC.
CONSOLIDATED STATEMENTS OF COMPREHENSIVE INCOME
| | | | | | | | | | | | |
| | | Year ended December 31, | |
| (In thousands) | | 2013 | | | 2012 | | | 2011 | |
| |
| | | |
Net income | | $ | 599,327 | | | $ | 245,275 | | | $ | 151,325 | |
| |
| | | |
Other comprehensive (loss) income before tax: | | | | | | | | | | | | |
| | | |
Foreign currency translation adjustment | | | (4,822 | ) | | | (2,448 | ) | | | (2,762) | |
| | | |
Reclassification adjustment for losses included in net income | | | - | | | | - | | | | 10,084 | |
| | | |
Adjustment of pension and postretirement benefit plans | | | 174,578 | | | | (39,978 | ) | | | (134,364) | |
| | | |
Amortization of net losses | | | 24,674 | | | | 25,159 | | | | 12,973 | |
| | | |
Amortization of prior service cost | | | - | | | | (200 | ) | | | (961) | |
| | | |
Unrealized holding (losses) gains on investments arising during the period | | | (221,043 | ) | | | (59,484 | ) | | | 54,216 | |
| | | |
Reclassification adjustment for losses (gains) included in net income | | | (2,110 | ) | | | 1,707 | | | | (8,044) | |
| | | |
Unrealized net gains (losses) on cash flow hedges | | | 2,286 | | | | (13,509 | ) | | | (11,678) | |
| | | |
Reclassification adjustment for net losses included in net income | | | (1,839 | ) | | | 14,119 | | | | 9,686 | |
| |
| | | |
Other comprehensive (loss) income before tax | | | (28,276 | ) | | | (74,634 | ) | | | (70,850) | |
| | | |
Income tax (expense) benefit | | | (57,601 | ) | | | 14,314 | | | | 34,263 | |
| |
| | | |
Total other comprehensive (loss) income, net of tax | | | (85,877 | ) | | | (60,320 | ) | | | (36,587) | |
| |
| | | |
Comprehensive income, net of tax | | $ | 513,450 | | | $ | 184,955 | | | $ | 114,738 | |
| |
Tax effect allocated to each component of other comprehensive (loss) income: | | | | | | | | | | | | |
| | | Year ended December 31, | |
| (In thousands) | | 2013 | | | 2012 | | | 2011 | |
| |
| | | |
Adjustment of pension and postretirement benefit plans | | $ | (70,306 | ) | | $ | 12,279 | | | $ | 39,978 | |
| | | |
Amortization of net losses | | | (7,402 | ) | | | (7,108 | ) | | | (3,892) | |
| | | |
Amortization of prior service cost | | | - | | | | 60 | | | | 288 | |
| | | |
Unrealized holding (losses) gains on investments arising during the period | | | 19,924 | | | | 9,280 | | | | (4,013) | |
| | | |
Reclassification adjustment for losses (gains) included in net income | | | 317 | | | | (13 | ) | | | 1,219 | |
| | | |
Unrealized net (losses) gains on cash flow hedges | | | (850 | ) | | | 4,052 | | | | 3,589 | |
| | | |
Reclassification adjustment for net gains (losses) included in net income | | | 716 | | | | (4,236 | ) | | | (2,906) | |
| |
| | | |
Income tax (expense) benefit | | $ | (57,601 | ) | | $ | 14,314 | | | $ | 34,263 | |
| |
The accompanying notes are an integral part of these consolidated financial statements.
117
POPULAR, INC.
CONSOLIDATED STATEMENTS OF CHANGES IN STOCKHOLDERS’ EQUITY
| | | | | | | | | | | | | | | | | | | | | | | | | | | | |
| (In thousands) | | Common
stock[1] | | | Preferred
stock | | | Surplus[1] | | | (Accumulated
deficit)
Retained
earnings | | | Treasury
stock | | | Accumulated
other
comprehensive
loss | | | Total | |
| |
Balance at December 31, 2010 | | $ | 1,023 | | | $ | 50,160 | | | $ | 4,103,211 | | | $ | (347,328 | ) | | $ | (574 | ) | | $ | (5,961 | ) | | $ | 3,800,531 | |
Net income | | | | | | | | | | | | | | | 151,325 | | | | | | | | | | | | 151,325 | |
Issuance of stock | | | 3 | | | | | | | | 7,687 | | | | | | | | | | | | | | | | 7,690 | |
Dividends declared: | | | | | | | | | | | | | | | | | | | | | | | | | | | | |
Preferred stock | | | | | | | | | | | | | | | (3,723 | ) | | | | | | | | | | | (3,723) | |
Common stock purchases | | | | | | | | | | | | | | | | | | | (483 | ) | | | | | | | (483) | |
Other comprehensive loss, net of tax | | | | | | | | | | | | | | | | | | | | | | | (36,587 | ) | | | (36,587) | |
Transfer to statutory reserve | | | | | | | | | | | 13,000 | | | | (13,000 | ) | | | | | | | | | | | | |
| |
Balance at December 31, 2011 | | $ | 1,026 | | | $ | 50,160 | | | $ | 4,123,898 | | | $ | (212,726 | ) | | $ | (1,057 | ) | | $ | (42,548 | ) | | $ | 3,918,753 | |
| |
Net income | | | | | | | | | | | | | | | 245,275 | | | | | | | | | | | | 245,275 | |
Issuance of stock | | | 6 | | | | | | | | 9,396 | | | | | | | | | | | | | | | | 9,402 | |
Dividends declared: | | | | | | | | | | | | | | | | | | | | | | | | | | | | |
Preferred stock | | | | | | | | | | | | | | | (3,723 | ) | | | | | | | | | | | (3,723) | |
Common stock purchases | | | | | | | | | | | | | | | | | | | (450 | ) | | | | | | | (450) | |
Common stock reissuance | | | | | | | | | | | | | | | | | | | 1,063 | | | | | | | | 1,063 | |
Other comprehensive loss, net of tax | | | | | | | | | | | | | | | | | | | | | | | (60,320 | ) | | | (60,320) | |
Transfer to statutory reserve | | | | | | | | | | | 17,000 | | | | (17,000 | ) | | | | | | | | | | | | |
| |
Balance at December 31, 2012 | | $ | 1,032 | | | $ | 50,160 | | | $ | 4,150,294 | | | $ | 11,826 | | | $ | (444 | ) | | $ | (102,868 | ) | | $ | 4,110,000 | |
| |
Net income | | | | | | | | | | | | | | | 599,327 | | | | | | | | | | | | 599,327 | |
Issuance of stock | | | 2 | | | | | | | | 6,858 | | | | | | | | | | | | | | | | 6,860 | |
Dividends declared: | | | | | | | | | | | | | | | | | | | | | | | | | | | | |
Preferred stock | | | | | | | | | | | | | | | (3,723 | ) | | | | | | | | | | | (3,723) | |
Common stock purchases | | | | | | | | | | | | | | | | | | | (470 | ) | | | | | | | (470) | |
Common stock reissuance | | | | | | | | | | | | | | | | | | | 33 | | | | | | | | 33 | |
Other comprehensive loss, net of tax | | | | | | | | | | | | | | | | | | | | | | | (85,877 | ) | | | (85,877) | |
Transfer to statutory reserve | | | | | | | | | | | 13,000 | | | | (13,000 | ) | | | | | | | | | | | | |
| |
Balance at December 31, 2013 | | $ | 1,034 | | | $ | 50,160 | | | $ | 4,170,152 | | | $ | 594,430 | | | $ | (881 | ) | | $ | (188,745 | ) | | $ | 4,626,150 | |
| |
[1] Prior periods balances and activity have been adjusted to retroactively reflect the 1-for-10 reverse stock split effected on May 29, 2012. | |
| |
| | | | | | | | | | | | |
| | | Year ended December 31, | | | | |
| |
| Disclosure of changes in number of shares:[1] | | 2013 | | | 2012 | | | 2011 | |
| |
Preferred Stock: | | | | | | | | | | | | |
| |
Balance at beginning and end of year | | | 2,006,391 | | | | 2,006,391 | | | | 2,006,391 | |
| |
Common Stock: | | | | | | | | | | | | |
Balance at beginning of year | | | 103,193,303 | | | | 102,634,640 | | | | 102,292,916 | |
Issuance of stock | | | 242,664 | | | | 558,663 | | | | 341,724 | |
| |
Balance at end of year | | | 103,435,967 | | | | 103,193,303 | | | | 102,634,640 | |
Treasury stock | | | (38,268 | ) | | | (23,497 | ) | | | (44,183) | |
| |
Common Stock – Outstanding | | | 103,397,699 | | | | 103,169,806 | | | | 102,590,457 | |
| |
[1] Share data has been adjusted to retroactively reflect the 1-for-10 reverse stock split effected on May 29, 2012. | |
| |
The accompanying notes are an integral part of these consolidated financial statements.
118
POPULAR, INC.
CONSOLIDATED STATEMENTS OF CASH FLOWS
| | | | | | | | | | | | |
| | | Year ended December 31, | |
| (In thousands) | | 2013 | | | 2012 | | | 2011 | |
| |
Cash flows from operating activities: | | | | | | | | | | | | |
| | | |
Net income | | $ | 599,327 | | | $ | 245,275 | | | $ | 151,325 | |
| |
Adjustments to reconcile net income to net cash provided by operating activities: | | | | | | | | | | | | |
Provision for loan losses | | | 602,563 | | | | 408,941 | | | | 575,720 | |
Amortization of intangibles | | | 9,883 | | | | 10,072 | | | | 9,654 | |
Depreciation and amortization of premises and equipment | | | 48,162 | | | | 46,736 | | | | 46,446 | |
Net accretion of discounts and amortization of premiums and deferred fees | | | (79,004 | ) | | | (37,899 | ) | | | (113,046) | |
Impairment losses on net assets to be disposed of | | | - | | | | - | | | | 4,255 | |
Fair value adjustments on mortgage servicing rights | | | 11,403 | | | | 17,406 | | | | 37,061 | |
Fair value change in equity appreciation instrument | | | - | | | | - | | | | (8,323) | |
FDIC loss share expense (income) | | | 82,051 | | | | 56,211 | | | | (66,791) | |
Amortization of prepaid FDIC assessment | | | - | | | | 32,778 | | | | 93,728 | |
Adjustments (expense) to indemnity reserves on loans sold | | | 37,054 | | | | 21,198 | | | | 33,068 | |
Earnings from investments under the equity method | | | (42,873 | ) | | | (73,478 | ) | | | (33,769) | |
Deferred income tax (benefit) expense | | | (288,754 | ) | | | (135,491 | ) | | | 5,862 | |
(Gain) loss on: | | | | | | | | | | | | |
Disposition of premises and equipment | | | (3,392 | ) | | | (8,619 | ) | | | (5,526) | |
Sale and valuation adjustments of investment securities | | | (2,110 | ) | | | 1,707 | | | | (10,844) | |
Sale of loans, including valuation adjustments on loans held-for-sale and mortgage banking activities | | | 22,411 | | | | (48,765 | ) | | | (30,891) | |
Sale of equity method investment | | | - | | | | - | | | | (16,907) | |
Sale of stock in equity method investee | | | (416,113 | ) | | | - | | | | - | |
Sale of other assets | | | - | | | | (2,545 | ) | | | - | |
Sale of foreclosed assets, including write-downs | | | 50,740 | | | | (4,511 | ) | | | (2,426) | |
Acquisitions of loans held-for-sale | | | (390,018 | ) | | | (417,108 | ) | | | (346,004) | |
Proceeds from sale of loans held-for-sale | | | 218,379 | | | | 325,014 | | | | 165,335 | |
Net originations on loans held-for-sale | | | (1,049,474 | ) | | | (1,233,240 | ) | | | (793,094) | |
Net (increase) decrease in: | | | | | | | | | | | | |
Trading securities | | | 1,430,835 | | | | 1,387,910 | | | | 1,143,029 | |
Accrued income receivable | | | (5,809 | ) | | | (519 | ) | | | 25,449 | |
Other assets | | | 2,827 | | | | (19,390 | ) | | | 24,755 | |
Net increase (decrease) in: | | | | | | | | | | | | |
Interest payable | | | (2,466 | ) | | | (9,164 | ) | | | (12,471) | |
Pension and other postretirement benefits obligation | | | 10,635 | | | | (40,241 | ) | | | (111,288) | |
Other liabilities | | | (26,952 | ) | | | 1,848 | | | | (87,634) | |
| |
Total adjustments | | | 219,978 | | | | 278,851 | | | | 525,348 | |
| |
Net cash provided by operating activities | | | 819,305 | | | | 524,126 | | | | 676,673 | |
| |
Cash flows from investing activities: | | | | | | | | | | | | |
Net decrease (increase) in money market investments | | | 227,127 | | | | 290,594 | | | | (396,879) | |
Purchases of investment securities: | | | | | | | | | | | | |
Available-for-sale | | | (2,257,976 | ) | | | (1,843,922 | ) | | | (1,357,080) | |
Held-to-maturity | | | (250 | ) | | | (25,792 | ) | | | (74,538) | |
Other | | | (178,093 | ) | | | (212,419 | ) | | | (172,775) | |
Proceeds from calls, paydowns, maturities and redemptions of investment securities: | | | | | | | | | | | | |
Available-for-sale | | | 1,823,474 | | | | 1,636,723 | | | | 1,360,386 | |
Held-to-maturity | | | 4,632 | | | | 9,751 | | | | 67,236 | |
Other | | | 181,784 | | | | 206,856 | | | | 154,114 | |
Proceeds from sale of investment securities: | | | | | | | | | | | | |
Available-for-sale | | | 5,438 | | | | 52,058 | | | | 262,443 | |
Other | | | - | | | | - | | | | 5,094 | |
Net repayments on loans | | | 680,819 | | | | 629,006 | | | | 1,136,058 | |
Proceeds from sale of loans | | | 333,021 | | | | 68,396 | | | | 293,109 | |
Acquisition of loan portfolios | | | (1,592,603 | ) | | | (1,357,628 | ) | | | (1,131,388) | |
Net payments from FDIC under loss sharing agreements | | | 396,223 | | | | 462,016 | | | | 561,111 | |
Cash paid related to business acquisitions | | | - | | | | - | | | | (855) | |
Return of capital from equity method investments | | | 491 | | | | 151,196 | | | | - | |
Net proceeds from sale of equity method investment | | | - | | | | - | | | | 31,503 | |
Proceeds from sale of stock in equity method investee | | | 481,377 | | | | - | | | | - | |
Mortgage servicing rights purchased | | | (45 | ) | | | (2,231 | ) | | | (1,732) | |
Acquisition of premises and equipment | | | (38,573 | ) | | | (54,899 | ) | | | (50,043) | |
Proceeds from sale of: | | | | | | | | | | | | |
Premises and equipment | | | 10,090 | | | | 19,841 | | | | 14,939 | |
Other productive assets | | | - | | | | 1,026 | | | | - | |
119
| | | | | | | | | | | | |
Foreclosed assets | | | 226,063 | | | | 206,070 | | | | 198,490 | |
| |
Net cash provided by investing activities | | | 302,999 | | | | 236,642 | | | | 899,193 | |
| |
Cash flows from financing activities: | | | | | | | | | | | | |
Net increase (decrease) in: | | | | | | | | | | | | |
Deposits | | | (323,404 | ) | | | (969,596 | ) | | | 1,179,943 | |
Assets sold under agreements to repurchase | | | (357,460 | ) | | | (124,345 | ) | | | (271,453) | |
Other short-term borrowings | | | (235,000 | ) | | | 340,000 | | | | (68,022) | |
Payments of notes payable | | | (332,031 | ) | | | (214,898 | ) | | | (2,769,477) | |
Proceeds from issuance of notes payable | | | 106,739 | | | | 106,923 | | | | 432,568 | |
Proceeds from issuance of common stock | | | 6,860 | | | | 9,402 | | | | 7,690 | |
Dividends paid | | | (3,723 | ) | | | (3,723 | ) | | | (3,723) | |
Net payments for repurchase of common stock | | | (437 | ) | | | (450 | ) | | | (483) | |
| |
Net cash used in financing activities | | | (1,138,456 | ) | | | (856,687 | ) | | | (1,492,957) | |
| |
Net (decrease) increase in cash and due from banks | | | (16,152 | ) | | | (95,919 | ) | | | 82,909 | |
Cash and due from banks at beginning of period | | | 439,363 | | | | 535,282 | | | | 452,373 | |
| |
Cash and due from banks at end of period | | $ | 423,211 | | | $ | 439,363 | | | $ | 535,282 | |
| |
The accompanying notes are an integral part of these consolidated financial statements.
120
Notes to Consolidated Financial
Statements
| | | | | | | | | | |
| | Note 1 - | | Nature of Operations | | | | | | 122 |
| | Note 2 - | | Summary of Significant Accounting Policies | | | | | | 123 |
| | Note 3 - | | New Accounting Pronouncements | | | | | | 136 |
| | Note 4 - | | Restrictions on Cash and Due from Banks and Certain Securities | | | | | | 138 |
| | Note 5 - | | Securities Purchased under Agreements to Resell | | | | | | 138 |
| | Note 6 - | | Pledged Assets | | | | | | 139 |
| | Note 7 - | | Investment Securities Available-For-Sale | | | | | | 139 |
| | Note 8 - | | Investment Securities Held-to-Maturity | | | | | | 144 |
| | Note 9 - | | Loans | | | | | | 146 |
| | Note 10 - | | Allowance for Loan Losses | | | | | | 155 |
| | Note 11 - | | FDIC Loss Share Asset and True-Up Payment Obligation | | | | | | 175 |
| | Note 12 - | | Mortgage Banking Activities | | | | | | 176 |
| | Note 13 - | | Transfers of Financial Assets and Servicing Assets | | | | | | 177 |
| | Note 14 - | | Premises and Equipment | | | | | | 181 |
| | Note 15 - | | Other Assets | | | | | | 182 |
| | Note 16 - | | Investment in Equity Investees | | | | | | 182 |
| | Note 17 - | | Goodwill and Other Intangible Assets | | | | | | 183 |
| | Note 18 - | | Deposits | | | | | | 188 |
| | Note 19 - | | Assets Sold Under Agreements to Repurchase | | | | | | 188 |
| | Note 20 - | | Other Short-Term Borrowings | | | | | | 189 |
| | Note 21 - | | Notes Payable | | | | | | 190 |
| | Note 22 - | | Offsetting of Financial Assets and Liabilities | | | | | | 191 |
| | Note 23 - | | Trust Preferred Securities | | | | | | 193 |
| | Note 24 - | | Stockholders’ Equity | | | | | | 195 |
| | Note 25 - | | Regulatory Capital Requirements | | | | | | 196 |
| | Note 26 - | | Other Comprehensive Loss | | | | | | 199 |
| | Note 27 - | | Guarantees | | | | | | 201 |
| | Note 28 - | | Commitments and Contingencies | | | | | | 204 |
| | Note 29 - | | Non-consolidated Variable Interest Entities | | | | | | 208 |
| | Note 30 - | | Derivative Instruments and Hedging Activities | | | | | | 211 |
| | Note 31 - | | Related Party Transactions | | | | | | 214 |
| | Note 32 - | | Fair Value Measurement | | | | | | 221 |
| | Note 33 - | | Fair Value of Financial Instruments | | | | | | 229 |
| | Note 34 - | | Employee Benefits | | | | | | 235 |
| | Note 35 - | | Net Income (Loss) per Common Share | | | | | | 244 |
| | Note 36 - | | Rental Expense and Commitments | | | | | | 244 |
| | Note 37 - | | Other Service Fees | | | | | | 245 |
| | Note 38 - | | FDIC Loss Share (Expense) Income | | | | | | 245 |
| | Note 39 - | | Stock-Based Compensation | | | | | | 246 |
| | Note 40 - | | Income Taxes | | | | | | 249 |
| | Note 41 - | | Supplemental Disclosure on the Consolidated Statements of Cash Flows | | | | | | 253 |
| | Note 42 - | | Segment Reporting | | | | | | 254 |
| | Note 43 - | | Subsequent Events | | | | | | 258 |
| | Note 44 - | | Popular, Inc. (Holding company only) Financial Information | | | | | | 258 |
| | Note 45 - | | Condensed Consolidating Financial Information of Guarantor and Issuers of Registered Guaranteed Securities | | | | | | 262 |
121
Note 1 – Nature of operations
Popular, Inc. (the “Corporation”) is a diversified, publicly owned financial holding company subject to the supervision and regulation of the Board of Governors of the Federal Reserve System. The Corporation has operations in Puerto Rico, the United States and the Caribbean. In Puerto Rico, the Corporation provides commercial and retail banking services, including mortgage loan originations, through its principal banking subsidiary, Banco Popular de Puerto Rico (“BPPR”), as well as investment banking, broker-dealer, auto and equipment leasing and financing, and insurance services through specialized subsidiaries. In the U.S. mainland, the Corporation operates Banco Popular North America (“BPNA”), including its wholly-owned subsidiary E-LOAN. BPNA focuses efforts and resources on the core community banking business. BPNA operates branches in New York, California, Illinois, New Jersey and Florida. E-LOAN markets deposit accounts under its name for the benefit of BPNA. The BPNA branches operate under the name of Popular Community Bank. Note 42 to the consolidated financial statements presents information about the Corporation’s business segments.
Effective December 31, 2012, Popular Mortgage, which was a wholly-owned subsidiary of BPPR prior to that date, was merged with and into BPPR as part of an internal reorganization. The Corporation’s mortgage origination business continues to be conducted under the brand name Popular Mortgage.
On April 30, 2010, BPPR entered into a purchase and assumption agreement with the Federal Deposit Insurance Corporation (the “FDIC”) to acquire certain assets and assume certain deposits and liabilities of Westernbank Puerto Rico (“Westernbank”), a Puerto Rico state-chartered bank headquartered in Mayaguez, Puerto Rico (the “Westernbank FDIC-assisted transaction”). Westernbank was a wholly-owned commercial bank subsidiary of W Holding Company, Inc. and operated in Puerto Rico. Refer to Note 11 – FDIC loss share assets and true-up payment obligation, to these consolidated financial statements for detailed information on this business combination.
122
Note 2 – Summary of significant accounting policies
The accounting and financial reporting policies of Popular, Inc. and its subsidiaries (the “Corporation”) conform with accounting principles generally accepted in the United States of America and with prevailing practices within the financial services industry.
The following is a description of the most significant of these policies:
Principles of consolidation
The consolidated financial statements include the accounts of Popular, Inc. and its subsidiaries. Intercompany accounts and transactions have been eliminated in consolidation. In accordance with the consolidation guidance for variable interest entities, the Corporation would also consolidate any variable interest entities (“VIEs”) for which it has a controlling financial interest; and therefore, it is the primary beneficiary. Assets held in a fiduciary capacity are not assets of the Corporation and, accordingly, are not included in the consolidated statements of financial condition.
Unconsolidated investments, in which there is at least 20% ownership, are generally accounted for by the equity method which the Corporation exercises significant influence, with earnings recorded in other operating income. These investments are included in other assets and the Corporation’s proportionate share of income or loss is included in other operating income. Those investments in which there is less than 20% ownership, are generally carried under the cost method of accounting, unless significant influence is exercised. Under the cost method, the Corporation recognizes income when dividends are received. Limited partnerships are accounted for by the equity method unless the investor’s interest is so “minor” that the limited partner may have virtually no influence over partnership operating and financial policies.
Statutory business trusts that are wholly-owned by the Corporation and are issuers of trust preferred securities are not consolidated in the Corporation’s consolidated financial statements.
On May 29, 2012, the Corporation effected a 1-for-10 reverse split of its common stock. The reverse split is described further in Note 24 to these consolidated financial statements. All share and per share information in the consolidated financial statements and accompanying notes have been adjusted to retroactively reflect the 1-for-10 reverse stock split.
During the quarter ended March 31, 2011, the Corporation sold certain residential mortgage loans of BPNA that were reclassified from held-in-portfolio to held-for-sale in December 2010. The loans were sold at a better price than the price used to determine their fair value at the time of reclassification to the held-for-sale category. At the time of sale, the Corporation classified $13.8 million of the impact of the better price as a recovery of the original write-down, which was booked as part of the activity in the allowance for loan losses. This included an out-of-period adjustment of $10.7 million since a portion of the sale was completed just prior to the release of the Corporation’s Form 10-K for the year ended December 31, 2010. After evaluating the quantitative and qualitative aspects of the misstatement and the out-of-period adjustment to the Corporation’s financial results, including consideration of the impact of the one-time adjustment to income tax expense of $103.3 million from the change in tax rate, offset by the $53.6 million tax benefit related to the timing of loan charge-offs for tax purposes described in Note 40 to the Corporation’s consolidated financial statements, management has determined that the misstatement and the out-of-period adjustment are not material to the 2010 and 2011 financial statements, respectively.
Business combinations
Business combinations are accounted for under the acquisition method. Under this method, assets acquired, liabilities assumed and any noncontrolling interest in the acquiree at the acquisition date are measured at their fair values as of the acquisition date. The acquisition date is the date the acquirer obtains control. Also, assets or liabilities arising from noncontractual contingencies are measured at their acquisition date at fair value only if it is more likely than not that they meet the definition of an asset or liability. Adjustments subsequently made to the provisional amounts recorded on the acquisition date as a result of new information obtained about facts and circumstances that existed as of the acquisition date but were known to the Corporation after acquisition will be made retroactively during a measurement period not to exceed one year. Furthermore, acquisition-related restructuring costs that do not meet certain criteria of exit or disposal activities are expensed as incurred. Transaction costs are expensed as incurred. Changes in income tax valuation allowances for acquired deferred tax assets are recognized in earnings subsequent to the measurement period as an adjustment to income tax expense. Contingent consideration classified as an asset or a liability is remeasured to fair value at each reporting date until the contingency is resolved. The changes in fair value of the contingent consideration are recognized in earnings unless the arrangement is a hedging instrument for which changes are initially recognized in other comprehensive income.
There were no significant business combinations during 2013, 2012 or 2011.
123
Deconsolidation of a subsidiary
The Corporation accounts for the deconsolidation of a subsidiary when it ceases to have a controlling financial interest in the subsidiary. Accordingly, it recognizes a gain or loss in results of operations measured as the difference between the sum of the fair value of the consideration received, the fair value of any retained non-controlling investment in the former subsidiary and the carrying amount of any non-controlling interest in the former subsidiary, as compared with the carrying amount of the former subsidiary’s assets and liabilities.
Use of estimates in the preparation of financial statements
The preparation of financial statements in conformity with accounting principles generally accepted in the United States of America requires management to make estimates and assumptions that affect the reported amounts of assets and liabilities and contingent assets and liabilities at the date of the financial statements, and the reported amounts of revenues and expenses during the reporting period. Actual results could differ from those estimates.
Reclassifications
Certain reclassifications have been made to the 2012 and 2011 consolidated financial statements to conform with the 2013 presentation. Such reclassifications did not have an effect on previously reported statement of operations and of cash flows.
Fair value measurements
The Corporation determines the fair values of its financial instruments based on the fair value framework established in the guidance for Fair Value Measurements in ASC Subtopic 820-10, which requires an entity to maximize the use of observable inputs and minimize the use of unobservable inputs when measuring fair value. Fair value is defined as the exchange price that would be received for an asset or paid to transfer a liability (an exit price) in the principal or most advantageous market for the asset or liability in an orderly transaction between market participants on the measurement date. The standard describes three levels of inputs that may be used to measure fair value which are (1) quoted market prices for identical assets or liabilities in active markets, (2) observable market-based inputs or unobservable inputs that are corroborated by market data, and (3) unobservable inputs that are not corroborated by market data. The fair value hierarchy ranks the quality and reliability of the information used to determine fair values.
The guidance in ASC Subtopic 820-10 also addresses measuring fair value in situations where markets are inactive and transactions are not orderly. Transactions or quoted prices for assets and liabilities may not be determinative of fair value when transactions are not orderly, and thus, may require adjustments to estimate fair value. Price quotes based on transactions that are not orderly should be given little, if any, weight in measuring fair value. Price quotes based on transactions that are orderly shall be considered in determining fair value, and the weight given is based on facts and circumstances. If sufficient information is not available to determine if price quotes are based on orderly transactions, less weight should be given to the price quote relative to other transactions that are known to be orderly.
Covered assets
Assets subject to loss sharing agreements with the FDIC, including certain loans and other real estate properties, are labeled “covered” on the consolidated statements of financial condition and throughout the notes to the consolidated financial statements. Loans acquired in the Westernbank FDIC-assisted transaction, except for credit cards, are considered “covered loans” because the Corporation will be reimbursed for 80% of any future losses on these loans subject to the terms of the FDIC loss sharing agreements.
Investment securities
Investment securities are classified in four categories and accounted for as follows:
| | — | | Debt securities that the Corporation has the intent and ability to hold to maturity are classified as securities held-to-maturity and reported at amortized cost. The Corporation may not sell or transfer held-to-maturity securities without calling into question its intent to hold other debt securities to maturity, unless a nonrecurring or unusual event that could not have been reasonably anticipated has occurred. An investment in debt securities is considered impaired if the fair value of the investment is less than its amortized cost. For other-than-temporary impairments the Corporation assesses if it has both the intent and the ability to hold the security for a period of time sufficient to allow for an anticipated recovery in its fair value to its amortized cost. For other-than-temporary impairment not related to a credit loss (defined as the difference between the present value of the cash flows expected to be collected and the amortized cost basis) for a held-to-maturity security is recognized in other comprehensive loss and amortized over the remaining life of the debt security. The amortized cost basis for a debt security is adjusted by the credit loss amount of other-than-temporary impairments. |
124
| | — | | Debt and equity securities classified as trading securities are reported at fair value, with unrealized gains and losses included in non-interest income. |
| | — | | Debt and equity securities (equity securities with readily available fair value) not classified as either securities held-to-maturity or trading securities, and which have a readily available fair value, are classified as securities available-for-sale and reported at fair value, with unrealized gains and losses excluded from earnings and reported, net of taxes, in accumulated other comprehensive income or loss. The specific identification method is used to determine realized gains and losses on securities available-for-sale, which are included in net gains or losses on sale and valuation adjustment of investment securities in the consolidated statements of operations. Declines in the value of debt and equity securities that are considered other-than-temporary reduce the value of the asset, and the estimated loss is recorded in non-interest income. For debt securities, the Corporation assesses whether (a) it has the intent to sell the debt security, or (b) it is more likely than not that it will be required to sell the debt security before its anticipated recovery. If either of these conditions is met, an other-than-temporary impairment on the security is recognized. In instances in which a determination is made that a credit loss (defined as the difference between the present value of the cash flows expected to be collected and the amortized cost basis) exists but the entity does not intend to sell the debt security and it is not more likely than not that the entity will be required to sell the debt security before the anticipated recovery of its remaining amortized cost basis (i.e., the amortized cost basis less any current-period credit loss), the impairment is separated into (a) the amount of the total impairment related to the credit loss, and (b) the amount of the total impairment related to all other factors. The amount of the total other-than-temporary impairment related to the credit loss is recognized in the statement of operations. The amount of the total impairment related to all other factors is recognized in other comprehensive loss. The other-than-temporary impairment analyses for both debt and equity securities are performed on a quarterly basis. |
| | — | | Investments in equity or other securities that do not have readily available fair values are classified as other investment securities in the consolidated statements of financial condition, and are subject to impairment testing, if applicable. These securities are stated at the lower of cost or realizable value. The source of this value varies according to the nature of the investment, and is primarily obtained by the Corporation from valuation analyses prepared by third-parties or from information derived from financial statements available for the corresponding venture capital and mutual funds. Stock that is owned by the Corporation to comply with regulatory requirements, such as Federal Reserve Bank and Federal Home Loan Bank (“FHLB”) stock, is included in this category, and their realizable value equals their cost. |
The amortization of premiums is deducted and the accretion of discounts is added to net interest income based on the interest method over the outstanding period of the related securities. The cost of securities sold is determined by specific identification. Net realized gains or losses on sales of investment securities and unrealized loss valuation adjustments considered other-than-temporary, if any, on securities available-for-sale, held-to-maturity and other investment securities are determined using the specific identification method and are reported separately in the consolidated statements of operations. Purchases and sales of securities are recognized on a trade date basis.
Derivative financial instruments
All derivatives are recognized on the statements of financial condition at fair value. The Corporation’s policy is not to offset the fair value amounts recognized for multiple derivative instruments executed with the same counterparty under a master netting arrangement nor to offset the fair value amounts recognized for the right to reclaim cash collateral (a receivable) or the obligation to return cash collateral (a payable) arising from the same master netting arrangement as the derivative instruments.
When the Corporation enters into a derivative contract, the derivative instrument is designated as either a fair value hedge, cash flow hedge or as a free-standing derivative instrument. For a fair value hedge, changes in the fair value of the derivative instrument and changes in the fair value of the hedged asset or liability or of an unrecognized firm commitment attributable to the hedged risk are recorded in current period earnings. For a cash flow hedge, changes in the fair value of the derivative instrument, to the extent that it is effective, are recorded net of taxes in accumulated other comprehensive income and subsequently reclassified to net income (loss) in the same period(s) that the hedged transaction impacts earnings. The ineffective portion of cash flow hedges is immediately recognized in current earnings. For free-standing derivative instruments, changes in fair values are reported in current period earnings.
Prior to entering a hedge transaction, the Corporation formally documents the relationship between hedging instruments and hedged items, as well as the risk management objective and strategy for undertaking various hedge transactions. This process includes linking all derivative instruments that are designated as fair value or cash flow hedges to specific assets and liabilities on the statements of financial condition or to specific forecasted transactions or firm commitments along with a formal assessment, at both inception of the hedge and on an ongoing basis, as to the effectiveness of the derivative instrument in offsetting changes in fair
125
values or cash flows of the hedged item. Hedge accounting is discontinued when the derivative instrument is not highly effective as a hedge, a derivative expires, is sold, terminated, when it is unlikely that a forecasted transaction will occur or when it is determined that is no longer appropriate. When hedge accounting is discontinued the derivative continues to be carried at fair value with changes in fair value included in earnings.
For non-exchange traded contracts, fair value is based on dealer quotes, pricing models, discounted cash flow methodologies or similar techniques for which the determination of fair may require significant management judgment or estimation.
The fair value of derivative instruments considers the risk of non-performance by the counterparty or the Corporation, as applicable.
The Corporation obtains or pledges collateral in connection with its derivative activities when applicable under the agreement.
Loans
Loans are classified as loans held-in-portfolio when management has the intent and ability to hold the loan for the foreseeable future, or until maturity or payoff. The foreseeable future is a management judgment which is determined based upon the type of loan, business strategies, current market conditions, balance sheet management and liquidity needs. Management’s view of the foreseeable future may change based on changes in these conditions. When a decision is made to sell or securitize a loan that was not originated or initially acquired with the intent to sell or securitize, the loan is reclassified from held-in-portfolio into held-for-sale. Due to changing market conditions or other strategic initiatives, management’s intent with respect to the disposition of the loan may change, and accordingly, loans previously classified as held-for-sale may be reclassified into held-in-portfolio. Loans transferred between loans held-for-sale and held-in-portfolio classifications are recorded at the lower of cost or fair value at the date of transfer.
Purchased loans are accounted at fair value upon acquisition.
Loans held-for-sale are stated at the lower of cost or fair value, cost being determined based on the outstanding loan balance less unearned income, and fair value determined, generally in the aggregate. Fair value is measured based on current market prices for similar loans, outstanding investor commitments, prices of recent sales or discounted cash flow analyses which utilize inputs and assumptions which are believed to be consistent with market participants’ views. The cost basis also includes consideration of deferred origination fees and costs, which are recognized in earnings at the time of sale. Upon reclassification to held-for-sale, credit related fair value adjustments are recorded as a reduction in the allowance for loan losses (“ALLL”). To the extent that the loan’s reduction in value has not already been provided for in the allowance for loan losses, an additional loan loss provision is recorded. Subsequent to reclassification to held-for-sale, the amount, by which cost exceeds fair value, if any, is accounted for as a valuation allowance with changes therein included in the determination of net income (loss) for the period in which the change occurs.
Loans held-in-portfolio are reported at their outstanding principal balances net of any unearned income, charge-offs, unamortized deferred fees and costs on originated loans, and premiums or discounts on purchased loans. Fees collected and costs incurred in the origination of new loans are deferred and amortized using the interest method or a method which approximates the interest method over the term of the loan as an adjustment to interest yield.
The past due status of a loan is determined in accordance with its contractual repayment terms. Furthermore, loans are reported as past due when either interest or principal remains unpaid for 30 days or more in accordance with its contractual repayment terms.
Non-accrual loans are those loans on which the accrual of interest is discontinued. When a loan is placed on non-accrual status, all previously accrued and unpaid interest is charged against income and the loan is accounted for either on a cash-basis method or on the cost-recovery method. Loans designated as non-accruing are returned to accrual status when the Corporation expects repayment of the remaining contractual principal and interest.
Recognition of interest income on commercial and construction loans is discontinued when the loans are 90 days or more in arrears on payments of principal or interest or when other factors indicate that the collection of principal and interest is doubtful. The impaired portion of secured loan past due as to principal and interest is charged-off not later than 365 days past due. However, in the case of a collateral dependent loan individually evaluated for impairment, the excess of the recorded investment over the fair value of the collateral (portion deemed uncollectible) is generally promptly charged-off, but in any event, not later than the quarter following the quarter in which such excess was first recognized. Commercial unsecured loans are charged-off no later than 180 days past due. Recognition of interest income on mortgage loans is generally discontinued when loans are 90 days or more in arrears on payments of principal or interest. The impaired portion of a mortgage loan is charged-off when the loan is 180 days past due. The Corporation discontinues the recognition of interest on residential mortgage loans insured by the Federal Housing Administration (“FHA”) or guaranteed by the U.S. Department of Veterans Affairs (“VA”) when 18-months delinquent as to principal or interest. The principal repayment on these loans is insured. Recognition of interest income on closed-end consumer loans and home equity lines of credit is discontinued when the loans are 90 days or more in arrears on payments of principal or interest.
126
Income is generally recognized on open-end consumer loans, except for home equity lines of credit, until the loans are charged-off. Recognition of interest income for lease financing is ceased when loans are 90 days or more in arrears. Closed-end consumer loans and leases are charged-off when they are 120 days in arrears. Open-end (revolving credit) consumer loans are charged-off when 180 days in arrears. Commercial and consumer overdrafts are generally charged-off no later than 60 days past their due date.
Purchased impaired loans accounted for under ASC Subtopic 310-30 are not considered non-performing and continue to have an accretable yield as long as there is a reasonable expectation about the timing and amount of cash flows expected to be collected. Also, loans charged-off against the non-accretable difference established in purchase accounting are not reported as charge-offs. Charge-offs on loans accounted under ASC Subtopic 310-30 are recorded only to the extent that losses exceed the non-accretable difference established with purchase accounting.
A loan classified as a troubled debt restructuring (“TDR”) is typically in non-accrual status at the time of the modification. The TDR loan continues in non-accrual status until the borrower has demonstrated a willingness and ability to make the restructured loan payments (at least six months of sustained performance after the modification (or one year for loans providing for quarterly or semi-annual payments)) and management has concluded that it is probable that the borrower would not be in payment default in the foreseeable future.
Lease financing
The Corporation leases passenger and commercial vehicles and equipment to individual and corporate customers. The finance method of accounting is used to recognize revenue on lease contracts that meet the criteria specified in the guidance for leases in ASC Topic 840. Aggregate rentals due over the term of the leases less unearned income are included in finance lease contracts receivable. Unearned income is amortized using a method which results in approximate level rates of return on the principal amounts outstanding. Finance lease origination fees and costs are deferred and amortized over the average life of the lease as an adjustment to the interest yield.
Revenue for other leases is recognized as it becomes due under the terms of the agreement.
Loans acquired in an FDIC-assisted transaction
Loans acquired in a business acquisition are recorded at fair value at the acquisition date. Credit discounts are included in the determination of fair value; therefore, an allowance for loan losses is not recorded at the acquisition date.
The Corporation applied the guidance of ASC Subtopic 310-30 to all loans acquired in Westernbank FDIC-assisted transaction (including loans that do not meet scope of ASC Subtopic 310-30), except for credit cards and revolving lines of credit that were expressly scoped out from the application of this guidance since they continued to have revolving privileges after acquisition. Management used its judgment in evaluating factors impacting expected cash flows and probable loss assumptions, including the quality of the loan portfolio, portfolio concentrations, distressed economic conditions, quality of underwriting standards of the acquired institution, reductions in collateral real estate values, among other considerations that could also impact the expected cash inflows on the loans.
Loans accounted for under ASC Subtopic 310-30 represent loans showing evidence of credit deterioration and that it is probable, at the date of acquisition, that the Corporation would not collect all contractually required principal and interest payments. Generally, acquired loans that meet the definition for nonaccrual status fall within the Corporation’s definition of impaired loans under ASC Subtopic 310-30. Also, based on the fair value determined for the acquired portfolio, acquired loans that did not meet the definition of nonaccrual status also resulted in the recognition of a significant discount attributable to credit quality. Accordingly, an election was made by the Corporation to apply the accretable yield method (expected cash flow model of ASC Subtopic 310-30), as a loan with credit deterioration and impairment, instead of the standard loan discount accretion guidance of ASC Subtopic 310-20, for the loans acquired in the Westernbank FDIC-assisted transaction. These loans are disclosed as a loan that was acquired with credit deterioration and impairment.
Under ASC Subtopic 310-30, the covered loans acquired from the FDIC were aggregated into pools based on loans that had common risk characteristics. Each loan pool is accounted for as a single asset with a single composite interest rate and an aggregate expectation of cash flows. Characteristics considered in pooling loans in the FDIC-assisted transaction included loan type, interest rate type, accruing status, amortization type, rate index and source type. Once the pools are defined, the Corporation maintains the integrity of the pool of multiple loans accounted for as a single asset.
Under ASC Subtopic 310-30, the difference between the undiscounted cash flows expected at acquisition and the fair value in the loans, or the “accretable yield,” is recognized as interest income using the effective yield method over the estimated life of the loan if the timing and amount of the future cash flows of the pool is reasonably estimable. The non-accretable difference represents the
127
difference between contractually required principal and interest and the cash flows expected to be collected. Subsequent to the acquisition date, increases in cash flows over those expected at the acquisition date are recognized as interest income prospectively. Decreases in expected cash flows after the acquisition date are recognized by recording an allowance for loan losses.
The fair value discount of lines of credit with revolving privileges that are accounted for pursuant to the guidance of ASC Subtopic 310-20 represents the difference between the contractually required loan payment receivable in excess of the initial investment in the loan. This discount is accreted into interest income over the life of the loan if the loan is in accruing status. Any cash flows collected in excess of the carrying amount of the loan are recognized in earnings at the time of collection. The carrying amount of lines of credit with revolving privileges, which are accounted pursuant to the guidance of ASC Subtopic 310-20, are subject to periodic review to determine the need for recognizing an allowance for loan losses.
Allowance for loan losses
The Corporation follows a systematic methodology to establish and evaluate the adequacy of the allowance for loan losses to provide for inherent losses in the loan portfolio. This methodology includes the consideration of factors such as current economic conditions, portfolio risk characteristics, prior loss experience and results of periodic credit reviews of individual loans. The provision for loan losses charged to current operations is based on this methodology. Loan losses are charged and recoveries are credited to the allowance for loan losses.
The Corporation’s assessment of the allowance for loan losses is determined in accordance with the guidance of loss contingencies in ASC Subtopic 450-20 and loan impairment guidance in ASC Section 310-10-35. Also, the Corporation determines the allowance for loan losses on purchased impaired loans and purchased loans accounted for under ASC Subtopic 310-30 by analogy, by evaluating decreases in expected cash flows after the acquisition date.
The accounting guidance provides for the recognition of a loss allowance for groups of homogeneous loans. The determination for general reserves of the allowance for loan losses includes the following principal factors:
| | — | | Base net loss rates, which are based on the moving average of annualized net loss rates computed over a 3-year historical loss period for the commercial and construction loan portfolios, and an 18-month period for the consumer and mortgage loan portfolios. The base net loss rates are applied by loan type and by legal entity. |
| | — | | Recent loss trend adjustment, which replaces the base loss rate with a 12-month average loss rate for the commercial, construction and legacy loan portfolios and 6-month average loss rate for the consumer and mortgage loan portfolios, when these trends are higher than the respective base loss rates, up to a determined cap in the case of consumer and mortgage loan portfolios. The objective of this adjustment is to allow for a more recent loss trend to be captured and reflected in the ALLL estimation process, while limiting excessive pro-cyclicality on changing economic periods using caps for the consumer and mortgage portfolios given the shorter six month look back window. These caps are calibrated annually at the end of each year and consistently applied until the next annual review. As part of the periodic review of the adequacy of the ALLL models and related assumptions, management monitors and reviews the loan segments for which the caps are being triggered in order to assess the reasonability of the cap in light of the risk profile of the portfolio and current credit and loss trends. Upon the completion of these qualitative reviews, management may make reserve adjustments that may partially or fully override the effect of the caps, if warranted. The caps are determined by measuring historic periods in which the recent loss trend adjustment rates were higher than the base loss rates and setting the cap at a percentile of the historic trend loss rates. |
For the period ended December 31, 2013, the recent loss trend adjustment caps for the consumer and mortgage portfolios were triggered in only one portfolio segment within the Puerto Rico consumer portfolio. Management assessed the impact of the applicable cap through a review of qualitative factors that specifically considered the drivers of recent loss trends and changes to the portfolio composition. The related effect of the aforementioned cap was immaterial for the overall level of the Allowance for Loan and Lease Losses for the Puerto Rico consumer portfolio.
For the period ended December 31, 2012, the recent loss trend adjustment caps for the consumer and mortgage portfolios were triggered in three consumer portfolio segments and one mortgage portfolio segment in the Puerto Rico region, and three consumer portfolio segments in the US region. Management assessed the adequacy of the applicable caps through a review of qualitative factors and recorded a $4 million qualitative offsetting adjustment that reversed the effect of the cap on the overall level of the Allowance for Loan and Lease Losses for the Puerto Rico mortgage portfolio. This offsetting adjustment considered the aforementioned review of qualitative factors, specifically, the 2012 revision to the Corporation’s charge-off policy that resulted in higher loss trends for this portfolio. The related effect of the aforementioned Puerto Rico and US region caps was immaterial for the overall level of the Allowance for Loan and Lease Losses for the corresponding portfolios.
At December 31, 2012, the impact of the use of recent loss trend adjustment caps on the overall level of Allowance for Loan and Lease Losses for the commercial portfolio was immaterial. The use of recent loss trend adjustment caps in the commercial portfolio was eliminated in the second quarter of 2013.
For the period ended December 31, 2013, 27% (2012 – 32%) of the ALLL for BPPR non-covered loan portfolios utilized the recent loss trend adjustment instead of the base loss. The effect of replacing the base loss with the recent loss trend adjustment was mainly concentrated in the commercial multi-family, leasing, and auto loan portfolios for 2013, and in the commercial multi-family, commercial and industrial, construction, credit cards, and personal loan portfolios for 2012.
For the period ended December 31, 2013, 29% (2012 – 8%) of the ALLL for BPNA loan portfolios utilized the recent loss trend adjustment instead of the base loss. The effect of replacing the base loss with the recent loss trend adjustment was mainly concentrated in the commercial multi-family, commercial real estate non-owner occupied, commercial and industrial and legacy loan portfolios for 2013, and in the construction and legacy loan portfolios for 2012.
| | — | | Environmental factors, which include credit and macroeconomic indicators such as unemployment rate, economic activity index and delinquency rates, were adopted to account for current market conditions that are likely to cause estimated credit losses to differ from historical losses. The Corporation reflects the effect of these environmental factors on each loan group as an adjustment that, as appropriate, increases or decreases the historical loss rate applied to each group. Environmental factors provide updated perspective on credit and economic conditions. Regression analysis was used to select these indicators and quantify the effect on the general reserve of the allowance for loan losses. |
During the second quarter of 2013, management enhanced the estimation process for evaluating the adequacy of the general reserve component of the allowance for loan losses. The enhancements to the ALLL methodology, which are described in the paragraphs below, were implemented as of June 30, 2013 and resulted in a net increase to the allowance for loan losses of $11.8 million for the non-covered portfolio and $7.5 million for the covered portfolio.
Management made the following principal changes to the methodology during the second quarter of 2013:
128
| | — | | Incorporated risk ratings to establish a more granular stratification of the commercial, construction and legacy loan portfolios to enhance the homogeneity of the loan classes.Prior to the second quarter enhancements, the Corporation’s loan segmentation was based on product type, line of business and legal entity. During the second quarter of 2013, lines of business were simplified and a regulatory risk classification level was added. These changes increased the homogeneity of each portfolio and captured the higher potential for loan loss in the criticized and substandard accruing categories. |
These enhancements resulted in a decrease to the allowance for loan losses of $42.9 million at June 30, 2013, which consisted of a $35.7 million decrease in the non-covered BPPR segment and a $7.2 million reduction in the BPNA segment.
| | — | | Recalibration and enhancements of the environmental factors adjustment. The environmental factor adjustments are developed by performing regression analyses on selected credit and economic indicators for each applicable loan segment. Prior to the second quarter enhancements, these adjustments were applied in the form of a set of multipliers and weights assigned to credit and economic indicators. During the second quarter of 2013, the environmental factor models used to account for changes in current credit and macroeconomic conditions, were enhanced and recalibrated based on the latest applicable trends. Also, as part of these enhancements, environmental factors are directly applied to the adjusted base loss rates using regression models based on particular credit data for the segment and relevant economic factors. These enhancements result in a more precise adjustment by having recalibrated models with improved statistical analysis and eliminating the multiplier concept that ensures that environmental factors are sufficiently sensitive to changing economic conditions. |
The combined effect of the aforementioned changes to the environmental factors adjustment resulted in an increase to the allowance for loan losses of $52.5 million at June 30, 2013, of which $56.1 million related to the non-covered BPPR segment, offset in part by a $3.6 million reduction in the BPNA segment.
There were additional enhancements to the allowance for loan losses methodology which accounted for an increase of $9.7 million at June 30, 2013 at the BPPR segment. These enhancements included the elimination of the use of a cap for the commercial recent loss adjustment (12-month average), the incorporation of a minimum general reserve assumption for the commercial, construction and legacy portfolios with minimal or zero loss history, and the application of the enhanced ALLL framework to the covered loan portfolio.
A loan is impaired when, based on current information and events, it is probable that the principal and/or interest are not going to be collected according to the original contractual terms of the loan agreement. Current information and events include “environmental” factors, e.g. existing industry, geographical, economic and political factors. Probable means the future event or events which will confirm the loss or impairment of the loan is likely to occur.
According to the accounting guidance criteria for specific impairment of a loan, the Corporation defines as impaired loans those commercial and construction borrowers with total debt greater than or equal to $1 million classified as “Substandard Non-Accrual”, “Doubtful” or “Loss”, as well as non-accrual loans and trouble debt restructurings. Commercial and construction loans that originally met the Corporation’s threshold for impairment identification in a prior period, but due to charge-offs or payments are currently below the $1 million threshold and are still 90 days past due, except for TDRs, are accounted for under the Corporation’s general reserve methodology. Although the accounting codification guidance for specific impairment of a loan excludes large groups of smaller balance homogeneous loans that are collectively evaluated for impairment (e.g. mortgage and consumer loans), it specifically requires that loan modifications considered troubled debt restructurings (“TDRs”) be analyzed under its provisions. An allowance for loan impairment is recognized to the extent that the carrying value of an impaired loan exceeds the present value of the expected future cash flows discounted at the loan’s effective rate, the observable market price of the loan, if available, or the fair value of the collateral if the loan is collateral dependent. The fair value of the collateral is generally based on appraisals. The Corporation requests updated appraisal reports from pre-approved appraisers for loans that are considered impaired following the Corporation’s reappraisals policy. This policy requires updated appraisals for loans secured by real estate (including construction loans) either annually or every two years depending on the total exposure of the borrower. As a general procedure, the Corporation internally reviews appraisals as part of the underwriting and approval process and also for credits considered impaired.
129
Troubled debt restructurings
A restructuring constitutes a TDR when the Corporation separately concludes that both of the following conditions exist: 1) the restructuring constitute a concession and 2) the debtor is experiencing financial difficulties. The concessions stem from an agreement between the creditor and the debtor or are imposed by law or a court. These concessions could include a reduction in the interest rate on the loan, payment extensions, forgiveness of principal, forbearance or other actions intended to maximize collection. A concession has been granted when, as a result of the restructuring, the Corporation does not expect to collect all amounts due, including interest accrued at the original contract rate. If the payment of principal is dependent on the value of collateral, the current value of the collateral is taken into consideration in determining the amount of principal to be collected; therefore, all factors that changed are considered to determine if a concession was granted, including the change in the fair value of the underlying collateral that may be used to repay the loan. Classification of loan modifications as TDRs involves a degree of judgment. Indicators that the debtor is experiencing financial difficulties which are considered include: (i) the borrower is currently in default on any of its debt or it is probable that the borrower would be in payment default on any of its debt in the foreseeable future without the modification; (ii) the borrower has declared or is in the process of declaring bankruptcy; (iii) there is significant doubt as to whether the borrower will continue to be a going concern; (iv) the borrower has securities that have been delisted, are in the process of being delisted, or are under threat of being delisted from an exchange; (v) based on estimates and projections that only encompass the borrower’s current business capabilities, it is forecasted that the entity-specific cash flows will be insufficient to service the debt (both interest and principal) in accordance with the contractual terms of the existing agreement through maturity; and (vi) absent the current modification, the borrower cannot obtain funds from sources other than the existing creditors at an effective interest rate equal to the current market interest rate for similar debt for a non-troubled debtor. The identification of TDRs is critical in the determination of the adequacy of the allowance for loan losses. Loans classified as TDRs may be excluded from TDR status if performance under the restructured terms exists for a reasonable period (at least twelve months of sustained performance) and the loan yields a market rate.
A loan may be restructured in a troubled debt restructuring into two (or more) loan agreements, for example, Note A and Note B. Note A represents the portion of the original loan principal amount that is expected to be fully collected along with contractual interest. Note B represents the portion of the original loan that may be considered uncollectible and charged-off, but the obligation is not forgiven to the borrower. Note A may be returned to accrual status provided all of the conditions for a TDR to be returned to accrual status are met. The modified loans are considered TDRs and thus, are evaluated under the framework of ASC Section 310-10-35 as long as the loans are not part of a pool of loans accounted for under ASC Subtopic 310-30.
Refer to Note 10 to the consolidated financial statements for additional qualitative information on TDRs and the Corporation’s determination of the allowance for loan losses.
Reserve for unfunded commitments
The reserve for unfunded commitments is maintained at a level believed by management to be sufficient to absorb estimated probable losses related to unfunded credit facilities and is included in other liabilities in the consolidated statements of financial condition. The determination of the adequacy of the reserve is based upon an evaluation of the unfunded credit facilities. Net adjustments to the reserve for unfunded commitments are included in other operating expenses in the consolidated statements of operations.
FDIC loss share indemnification asset and true-up payment obligation (contingent consideration)
The FDIC loss share indemnification asset was initially recorded at fair value. Fair value was estimated using projected cash flows related to the loss sharing agreements.
The FDIC loss share indemnification asset for loss share agreements is measured separately from the related covered assets as it is not contractually embedded in the assets and is not transferable with the assets should the assets be sold.
The FDIC loss share indemnification asset is recognized on the same basis as the assets subject to loss share protection. As such, for covered loans accounted pursuant to ASC Subtopic 310-30, decreases in expected reimbursements from the FDIC due to improvements in expected cash flows to be received from borrowers, are recognized in non-interest income prospectively over the life of the FDIC loss sharing agreements. For covered loans accounted for under ASC Subtopic 310-20, as the loan discount recorded as of the acquisition date was accreted into income, a reduction of the related indemnification asset was recorded as a reduction in non-interest income. Increases in expected reimbursements from the FDIC are recognized in non-interest income in the same period that the allowance for credit losses for the related loans is recognized.
The amortization or accretion due to discounting of the loss share asset and changes in expected loss sharing reimbursements is included in non-interest income, particularly in the category of FDIC loss share income (expense).
130
The true-up payment obligation associated with the loss share agreements is accounted for at fair value in accordance with ASC Section 805-30-25-6 as it is considered contingent consideration. The true-up payment obligation is included as part of other liabilities in the consolidated statements of financial condition. Any changes in the carrying value of the obligation are included in the category of FDIC loss share income (expense) in the consolidated statements of operations.
Refer to Note 11 for additional information on the FDIC loss share indemnification asset and true-up payment obligation.
Transfers and servicing of financial assets
The transfer of an entire financial asset, a group of entire financial assets, or a participating interest in an entire financial asset in which the Corporation surrenders control over the assets is accounted for as a sale if all of the following conditions set forth in ASC Topic 860 are met: (1) the assets must be isolated from creditors of the transferor, (2) the transferee must obtain the right (free of conditions that constrain it from taking advantage of that right) to pledge or exchange the transferred assets, and (3) the transferor cannot maintain effective control over the transferred assets through an agreement to repurchase them before their maturity. When the Corporation transfers financial assets and the transfer fails any one of these criteria, the Corporation is prevented from derecognizing the transferred financial assets and the transaction is accounted for as a secured borrowing. For federal and Puerto Rico income tax purposes, the Corporation treats the transfers of loans which do not qualify as “true sales” under the applicable accounting guidance, as sales, recognizing a deferred tax asset or liability on the transaction.
For transfers of financial assets that satisfy the conditions to be accounted for as sales, the Corporation derecognizes all assets sold; recognizes all assets obtained and liabilities incurred in consideration as proceeds of the sale, including servicing assets and servicing liabilities, if applicable; initially measures at fair value assets obtained and liabilities incurred in a sale; and recognizes in earnings any gain or loss on the sale.
The guidance on transfer of financial assets requires a true sale analysis of the treatment of the transfer under state law as if the Corporation was a debtor under the bankruptcy code. A true sale legal analysis includes several legally relevant factors, such as the nature and level of recourse to the transferor, and the nature of retained interests in the loans sold. The analytical conclusion as to a true sale is never absolute and unconditional, but contains qualifications based on the inherent equitable powers of a bankruptcy court, as well as the unsettled state of the common law. Once the legal isolation test has been met, other factors concerning the nature and extent of the transferor’s control over the transferred assets are taken into account in order to determine whether derecognition of assets is warranted.
The Corporation sells mortgage loans to the Government National Mortgage Association (“GNMA”) in the normal course of business and retains the servicing rights. The GNMA programs under which the loans are sold allow the Corporation to repurchase individual delinquent loans that meet certain criteria. At the Corporation’s option, and without GNMA’s prior authorization, the Corporation may repurchase the delinquent loan for an amount equal to 100% of the remaining principal balance of the loan. Once the Corporation has the unconditional ability to repurchase the delinquent loan, the Corporation is deemed to have regained effective control over the loan and recognizes the loan on its balance sheet as well as an offsetting liability, regardless of the Corporation’s intent to repurchase the loan.
Servicing assets
The Corporation periodically sells or securitizes loans while retaining the obligation to perform the servicing of such loans. In addition, the Corporation may purchase or assume the right to service loans originated by others. Whenever the Corporation undertakes an obligation to service a loan, management assesses whether a servicing asset or liability should be recognized. A servicing asset is recognized whenever the compensation for servicing is expected to more than adequately compensate the servicer for performing the servicing. Likewise, a servicing liability would be recognized in the event that servicing fees to be received are not expected to adequately compensate the Corporation for its expected cost. Mortgage servicing assets recorded at fair value are separately presented on the consolidated statements of financial condition.
All separately recognized servicing assets are initially recognized at fair value. For subsequent measurement of servicing rights, the Corporation has elected the fair value method for mortgage loans servicing rights (“MSRs”) while all other servicing assets, particularly those related to Small Business Administration (“SBA”) commercial loans, follow the amortization method. Under the fair value measurement method, MSRs are recorded at fair value each reporting period, and changes in fair value are reported in mortgage banking activities in the consolidated statement of operations. Under the amortization method, servicing assets are amortized in proportion to, and over the period of, estimated servicing income, and assessed for impairment based on fair value at each reporting period. Contractual servicing fees including ancillary income and late fees, as well as fair value adjustments, and impairment losses, if any, are reported in mortgage banking activities in the consolidated statement of operations. Loan servicing
131
fees, which are based on a percentage of the principal balances of the loans serviced, are credited to income as loan payments are collected.
The fair value of servicing rights is estimated by using a cash flow valuation model which calculates the present value of estimated future net servicing cash flows, taking into consideration actual and expected loan prepayment rates, discount rates, servicing costs, and other economic factors, which are determined based on current market conditions.
For purposes of evaluating and measuring impairment of capitalized servicing assets that are accounted under the amortization method, the amount of impairment recognized, if any, is the amount by which the capitalized servicing assets per stratum exceed their estimated fair value. Temporary impairment is recognized through a valuation allowance with changes included in results of operations for the period in which the change occurs. If it is later determined that all or a portion of the temporary impairment no longer exists for a particular stratum, the valuation allowance is reduced through a recovery in earnings. Any fair value in excess of the cost basis of the servicing asset for a given stratum is not recognized. Servicing rights subsequently accounted under the amortization method are also reviewed for other-than-temporary impairment. When the recoverability of an impaired servicing asset accounted under the amortization method is determined to be remote, the unrecoverable portion of the valuation allowance is applied as a direct write-down to the carrying value of the servicing rights, precluding subsequent recoveries.
Premises and equipment
Premises and equipment are stated at cost less accumulated depreciation and amortization. Depreciation is computed on a straight-line basis over the estimated useful life of each type of asset. Amortization of leasehold improvements is computed over the terms of the respective leases or the estimated useful lives of the improvements, whichever is shorter. Costs of maintenance and repairs which do not improve or extend the life of the respective assets are expensed as incurred. Costs of renewals and betterments are capitalized. When assets are disposed of, their cost and related accumulated depreciation are removed from the accounts and any gain or loss is reflected in earnings as realized or incurred, respectively.
The Corporation capitalizes interest cost incurred in the construction of significant real estate projects, which consist primarily of facilities for its own use or intended for lease. The amount of interest cost capitalized is to be an allocation of the interest cost incurred during the period required to substantially complete the asset. The interest rate for capitalization purposes is to be based on a weighted average rate on the Corporation’s outstanding borrowings, unless there is a specific new borrowing associated with the asset. Interest cost capitalized for the years ended December 31, 2013, 2012 and 2011 was not significant.
The Corporation has operating lease arrangements primarily associated with the rental of premises to support its branch network or for general office space. Certain of these arrangements are non-cancellable and provide for rent escalations and renewal options. Rent expense on non-cancellable operating leases with scheduled rent increases are recognized on a straight-line basis over the lease term.
Impairment of long-lived assets
The Corporation evaluates for impairment its long-lived assets to be held and used, and long-lived assets to be disposed of, whenever events or changes in circumstances indicate that the carrying amount of an asset may not be recoverable.
Restructuring costs
A liability for a cost associated with an exit or disposal activity is recognized and measured initially at its fair value in the period in which the liability is incurred. If future service is required for employees to receive the one-time termination benefit, the liability is initially measured at its fair value as of the termination date and recognized over the future service period.
Other real estate
Other real estate, received in satisfaction of debt, is recorded at the lower of cost (carrying value of the loan) or fair value less estimated costs of disposal, by charging the allowance for loan losses. Subsequent to foreclosure, any losses in the carrying value arising from periodic re-evaluations of the properties, and any gains or losses on the sale of these properties are credited or charged to expense in the period incurred and are included as a component of other operating expenses. The cost of maintaining and operating such properties is expensed as incurred.
Updated appraisals or third-party broker price opinions of value (“BPO”) are obtained to adjust the value of the other real estate assets. The frequency depends on the loan type and total credit exposure. Commencing in 2011, the appraisal for a commercial or construction other real estate property with a book value greater than $1 million is updated annually and if lower than $1 million it is updated every two years. For residential mortgage properties, the Corporation requests third-party BPOs or appraisals, generally on an annual basis.
132
Appraisals may be adjusted due to age, collateral inspections, property profiles, or general market conditions. The adjustments applied are based upon internal information such as other appraisals for the type of properties and/or loss severity information that can provide historical trends in the real estate market, and may change from time to time based on market conditions.
Goodwill and other intangible assets
Goodwill is recognized when the purchase price is higher than the fair value of net assets acquired in business combinations under the purchase method of accounting. Goodwill is not amortized, but is tested for impairment at least annually or more frequently if events or circumstances indicate possible impairment using a two-step process at each reporting unit level. The first step of the goodwill impairment test, used to identify potential impairment, compares the fair value of a reporting unit with its carrying amount, including goodwill. If the fair value of a reporting unit exceeds its carrying amount, the goodwill of the reporting unit is not considered impaired and the second step of the impairment test is unnecessary. If needed, the second step consists of comparing the implied fair value of the reporting unit goodwill with the carrying amount of that goodwill. In determining the fair value of a reporting unit, the Corporation generally uses a combination of methods, which include market price multiples of comparable companies and the discounted cash flow analysis. Goodwill impairment losses are recorded as part of operating expenses in the consolidated statement of operations.
Other intangible assets deemed to have an indefinite life are not amortized, but are tested for impairment using a one-step process which compares the fair value with the carrying amount of the asset. In determining that an intangible asset has an indefinite life, the Corporation considers expected cash inflows and legal, regulatory, contractual, competitive, economic and other factors, which could limit the intangible asset’s useful life.
Other identifiable intangible assets with a finite useful life, mainly core deposits, are amortized using various methods over the periods benefited, which range from 4 to 10 years. These intangibles are evaluated periodically for impairment when events or changes in circumstances indicate that the carrying amount may not be recoverable. Impairments on intangible assets with a finite useful life are evaluated under the guidance for impairment or disposal of long-lived assets.
Assets sold / purchased under agreements to repurchase / resell
Repurchase and resell agreements are treated as collateralized financing transactions and are carried at the amounts at which the assets will be subsequently reacquired or resold as specified in the respective agreements.
It is the Corporation’s policy to take possession of securities purchased under agreements to resell. However, the counterparties to such agreements maintain effective control over such securities, and accordingly those securities are not reflected in the Corporation’s consolidated statements of financial condition. The Corporation monitors the fair value of the underlying securities as compared to the related receivable, including accrued interest.
It is the Corporation’s policy to maintain effective control over assets sold under agreements to repurchase; accordingly, such securities continue to be carried on the consolidated statements of financial condition.
The Corporation may require counterparties to deposit additional collateral or return collateral pledged, when appropriate.
Software
Capitalized software is stated at cost, less accumulated amortization. Capitalized software includes purchased software and capitalizable application development costs associated with internally-developed software. Amortization, computed on a straight-line method, is charged to operations over the estimated useful life of the software. Capitalized software is included in “Other assets” in the consolidated statement of financial condition.
Guarantees, including indirect guarantees of indebtedness of others
The Corporation, as a guarantor, recognizes at the inception of a guarantee, a liability for the fair value of the obligation undertaken in issuing the guarantee. Refer to Note 27 to the consolidated financial statements for further disclosures on guarantees.
Treasury stock
Treasury stock is recorded at cost and is carried as a reduction of stockholders’ equity in the consolidated statements of financial condition. At the date of retirement or subsequent reissue, the treasury stock account is reduced by the cost of such stock. At retirement, the excess of the cost of the treasury stock over its par value is recorded entirely to surplus. At reissuance, the difference between the consideration received upon issuance and the specific cost is charged or credited to surplus.
Income Recognition – Insurance agency business
Commissions and fees are recognized when related policies are effective. Additional premiums and rate adjustments are recorded as they occur. Contingent commissions are recorded on the accrual basis when the amount to be received is notified by the
133
insurance company. Commission income from advance business is deferred. An allowance is created for expected adjustments to commissions earned relating to policy cancellations.
Income Recognition – Investment banking revenues and commissions
Investment banking revenue is recorded as follows: underwriting fees at the time the underwriting is completed and income is reasonably determinable; corporate finance advisory fees as earned, according to the terms of the specific contracts; and sales commissions on a trade-date basis. Commission income and expenses related to customers’ securities transactions are recorded on a trade-date basis.
Foreign exchange
Assets and liabilities denominated in foreign currencies are translated to U.S. dollars using prevailing rates of exchange at the end of the period. Revenues, expenses, gains and losses are translated using weighted average rates for the period. The resulting foreign currency translation adjustment from operations for which the functional currency is other than the U.S. dollar is reported in accumulated other comprehensive loss, except for highly inflationary environments in which the effects are included in other operating expenses.
The Corporation holds interests in Centro Financiero BHD, S.A. (“BHD”) in the Dominican Republic. Some of the business of BHD is conducted in the country’s foreign currency. The resulting foreign currency translation adjustment from these operations is reported in accumulated other comprehensive loss. During 2011, the Corporation sold its equity investments in Consorcio de Tarjetas Dominicanas, S.A. (“CONTADO”) and Serfinsa, which businesses were also conducted on their countries foreign currency. Additionally, during 2013, the Corporation sold its investment in Tarjetas y Transacciones en Red Tranred, C.A. (formerly EVERTEC DE VENEZUELA, C.A.) which was written-down during 2011 as the Corporation determined to wind-down those operations.
Refer to the disclosure of accumulated other comprehensive loss included in the Note 26 for the outstanding balances of the foreign currency translation adjustments at December 31, 2013 and 2012.
Income taxes
The Corporation recognizes deferred tax assets and liabilities for the expected future tax consequences of events that have been recognized in the Corporation’s financial statements or tax returns. Deferred income tax assets and liabilities are determined for differences between financial statement and tax bases of assets and liabilities that will result in taxable or deductible amounts in the future. The computation is based on enacted tax laws and rates applicable to periods in which the temporary differences are expected to be recovered or settled.
The guidance for income taxes requires a reduction of the carrying amounts of deferred tax assets by a valuation allowance if, based on the available evidence, it is more likely than not (defined as a likelihood of more than 50 percent) that such assets will not be realized. Accordingly, the need to establish valuation allowances for deferred tax assets is assessed periodically by the Corporation based on the more likely than not realization threshold criterion. In the assessment for a valuation allowance, appropriate consideration is given to all positive and negative evidence related to the realization of the deferred tax assets. This assessment considers, among other matters, all sources of taxable income available to realize the deferred tax asset, including the future reversal of existing temporary differences, the future taxable income exclusive of reversing temporary differences and carryforwards, taxable income in carryback years and tax-planning strategies. In making such assessments, significant weight is given to evidence that can be objectively verified.
The valuation of deferred tax assets requires judgment in assessing the likely future tax consequences of events that have been recognized in the Corporation’s financial statements or tax returns and future profitability. The Corporation’s accounting for deferred tax consequences represents management’s best estimate of those future events.
Positions taken in the Corporation’s tax returns may be subject to challenge by the taxing authorities upon examination. Uncertain tax positions are initially recognized in the financial statements when it is more likely than not the position will be sustained upon examination by the tax authorities. Such tax positions are both initially and subsequently measured as the largest amount of tax benefit that is greater than 50% likely of being realized upon settlement with the tax authority, assuming full knowledge of the position and all relevant facts. Interest on income tax uncertainties is classified within income tax expense in the statement of operations; while the penalties, if any, are accounted for as other operating expenses.
The Corporation accounts for the taxes collected from customers and remitted to governmental authorities on a net basis (excluded from revenues).
Income tax expense or benefit for the year is allocated among continuing operations, discontinued operations, and other comprehensive income, as applicable. The amount allocated to continuing operations is the tax effect of the pretax income or loss
134
from continuing operations that occurred during the year, plus or minus income tax effects of (a) changes in circumstances that cause a change in judgment about the realization of deferred tax assets in future years, (b) changes in tax laws or rates, (c) changes in tax status, and (d) tax-deductible dividends paid to shareholders, subject to certain exceptions.
Employees’ retirement and other postretirement benefit plans
Pension costs are computed on the basis of accepted actuarial methods and are charged to current operations. Net pension costs are based on various actuarial assumptions regarding future experience under the plan, which include costs for services rendered during the period, interest costs and return on plan assets, as well as deferral and amortization of certain items such as actuarial gains or losses. The funding policy is to contribute to the plan as necessary to provide for services to date and for those expected to be earned in the future. To the extent that these requirements are fully covered by assets in the plan, a contribution may not be made in a particular year.
The cost of postretirement benefits, which is determined based on actuarial assumptions and estimates of the costs of providing these benefits in the future, is accrued during the years that the employee renders the required service.
The guidance for compensation retirement benefits of ASC Topic 715 requires the recognition of the funded status of each defined pension benefit plan, retiree health care and other postretirement benefit plans on the statement of financial condition.
Stock-based compensation
The Corporation opted to use the fair value method of recording stock-based compensation as described in the guidance for employee share plans in ASC Subtopic 718-50.
Comprehensive income (loss)
Comprehensive income (loss) is defined as the change in equity of a business enterprise during a period from transactions and other events and circumstances, except those resulting from investments by owners and distributions to owners. The presentation of comprehensive income (loss) is included in separate consolidated statements of comprehensive income (loss).
Net income (loss) per common share
Basic income (loss) per common share is computed by dividing net income (loss) adjusted for preferred stock dividends, including undeclared or unpaid dividends if cumulative, and charges or credits related to the extinguishment of preferred stock or induced conversions of preferred stock, by the weighted average number of common shares outstanding during the year. Diluted income per common share take into consideration the weighted average common shares adjusted for the effect of stock options, restricted stock and warrants on common stock, using the treasury stock method.
Statement of cash flows
For purposes of reporting cash flows, cash includes cash on hand and amounts due from banks.
135
Note 3 – New accounting pronouncements
FASB Accounting Standards Update 2014-04, Receivables-Troubled Debt Restructuring by Creditors (SubTopic 310-40): Reclassification of Residential Real Estate Collateralized Consumer Mortgage Loans upon Foreclosure (“ASU 2014-04”)
The FASB issued ASU 2014-04 in January 2014 which clarifies when a creditor should be considered to have received physical possession of a residential real estate property collateralizing a consumer mortgage loan such that the loan should be derecognized and the real estate property recognized.
The amendments of this ASU clarify that an in substance repossession or foreclosure occurs, and a creditor is considered to have received physical possession of residential real estate property collateralizing a consumer mortgage loan, upon either: a) the creditor obtaining legal title to the residential real estate property upon completion of a foreclosure; or b) the borrower conveying all interest in the residential real estate property to the creditor to satisfy that loan through completion of a deed in lieu of foreclosure or through a similar legal agreement.
The amendment of this guidance requires interim and annual disclosures of both the amount of foreclosed residential real estate property held by the creditor and the recorded investment in consumer mortgage loans collateralized by residential real estate property that are in the process of foreclosure according to local requirements of the applicable jurisdiction.
ASU 2014-04 is effective for annual periods, and interim periods within those years, beginning after December 15, 2014. The amendments in this ASU can be elected using either a modified retrospective transition method or a prospective transition method. Early adoption is permitted.
The Corporation does not anticipate that the adoption of this guidance will have a material effect on its consolidated statements of financial condition or results of operations.
FASB Accounting Standards Update 2013-11, Income Taxes (Topic 740): Presentation of an Unrecognized Tax Benefit When a Net Operating Loss Carryforward, a Similar Tax Loss, or a Tax Credit Carryforward Exists (“ASU 2013-11”)
The FASB issued ASU 2013-11 in July 2013 which requires that an unrecognized tax benefit, or a portion of an unrecognized tax benefit, be presented in the financial statements as a reduction to a deferred tax asset for a net operating loss carryforward, a similar tax loss, or a tax credit carryforward. When a net operating loss, a similar tax loss, or a tax credit carryforward is not available at the reporting date under the tax law of the applicable jurisdiction to settle any additional taxes that would result from the disallowance of a tax position, or the tax law of the applicable jurisdiction does not require the entity to use, and the entity does not intend to use, the deferred tax asset for such purposes, the unrecognized tax benefit should be presented in the financial statements as a liability and should not be combined with deferred tax assets. The assessment of whether a deferred tax asset is available is based on the unrecognized tax benefit and deferred tax asset that exist at the reporting date and should be made presuming disallowance of the tax position at the reporting date. Currently, there is no explicit guidance under U.S. GAAP on the financial statement presentation of an unrecognized tax benefit when a net operating loss carryforward, a similar tax loss, or a tax credit carryforward exists. The amendment of this guidance does not require new recurring disclosures.
ASU 2013-11 is effective for fiscal years, and interim periods within those years, beginning after December 15, 2013. The adoption of this guidance is not expected to have a material effect on the Corporation’s consolidated financial statements.
FASB Accounting Standards Update 2013-10, Derivatives and Hedging (Topic 815): Inclusion of the Fed Funds Swap Rate (or Overnight Index Swap Rate) as a Benchmark Interest Rate for Hedge Accounting Purposes (“ASU 2013-10”)
The FASB issued ASU 2013-10 in July 2013 which permits the use of the Overnight Index Swap Rate (OIS), also referred to as the Fed Funds Effective Swap Rate as a U.S. GAAP benchmark interest rate for hedge accounting purposes under Topic 815. Currently, only the interest rates on direct Treasury obligations of the U.S. government (UST) and the London Interbank Offered Rate (LIBOR) swap rate are considered benchmark interest rates in the United States. This update also removes the restriction on using different benchmark rates for similar hedges. Including the Fed Funds Effective Swap Rate as an acceptable U.S. benchmark interest rate in addition to UST and LIBOR will provide risk managers with a more comprehensive spectrum of interest rate resets to utilize as the designated interest risk component under the hedge accounting guidance in Topic 815.
The amendments of this ASU are effective prospectively for qualifying new or redesignated hedging relationships entered into on or after July 17, 2013.
The adoption of this guidance has not had a material effect on its consolidated statements of financial condition or results of operations.
136
FASB Accounting Standards Update 2013-05, Foreign Currency Matters (Topic 830): Parent’s Accounting for the Cumulative Translation Adjustment Upon Derecognition of Certain Subsidiaries or Groups of Assets within a Foreign Entity or of an Investment in a Foreign Entity (“ASU 2013-05”)
The FASB issued ASU 2013-05 in March 2013 which clarifies the applicable guidance for the release of the cumulative translation adjustment. When a reporting entity ceases to have a controlling financial interest in a subsidiary or group of assets that is a nonprofit activity or a business within a foreign entity, the parent is required to apply the guidance in ASC subtopic 830-30 to release any related cumulative translation adjustment into net income. Accordingly, the cumulative translation adjustment should be released into net income only if the sale or transfer results in the complete or substantially complete liquidation of the foreign entity in which the subsidiary or group of assets has resided.
For an equity method investment that is a foreign entity, the partial sale guidance in ASC Section 830-30-40 still applies. As such, a pro rata portion of the cumulative translation adjustment should be released into net income upon a partial sale of such equity method investment. However, this treatment does not apply to an equity method investment that is not a foreign entity. In those instances, the cumulative translation adjustment is released into net income only if the partial sale represents a complete or substantially complete liquidation of the foreign entity that contains the equity method investment.
Additionally, the amendments in this ASU clarify that the sale of an investment in a foreign entity includes both: (1) events that result in the loss of a controlling financial interest in a foreign entity and (2) events that result in an acquirer obtaining control of an acquiree in which it held an equity interest immediately before the acquisition date. Accordingly, the cumulative translation adjustment should be released into net income upon the occurrence of those events.
ASU 2013-05 is effective for fiscal years and interim periods within those years, beginning on or after December 15, 2013. The amendments should be applied prospectively to derecognition events occurring after the effective date. Prior periods should not be adjusted.
The adoption of this guidance is not expected to have a material effect on the Corporation’s consolidated financial statements.
137
Note 4 - Restrictions on cash and due from banks and certain securities
The Corporation’s banking subsidiaries, BPPR and BPNA, are required by federal and state regulatory agencies to maintain average reserve balances with the Federal Reserve Bank of New York (the “Fed”) or other banks. Those required average reserve balances amounted to $992 million at December 31, 2013 (December 31, 2012 - $952 million). Cash and due from banks, as well as other short-term, highly liquid securities, are used to cover the required average reserve balances.
At December 31, 2013 the Corporation held $44 million in restricted assets in the form of funds deposited in money market accounts, trading account securities and investment securities available for sale (December 31, 2012 - $41 million). The amounts held in trading account securities and investment securities available for sale consist primarily of restricted assets held for the Corporation’s non-qualified retirement plans and fund deposits guaranteeing possible liens or encumbrances over the title of insured properties.
Note 5 - Securities purchased under agreement to resell
The securities purchased underlying the agreements to resell were delivered to, and are held by, the Corporation. The counterparties to such agreements maintain effective control over such securities. The Corporation is permitted by contract to repledge the securities, and has agreed to resell to the counterparties the same or substantially similar securities at the maturity of the agreements.
The fair value of the collateral securities held by the Corporation on these transactions at December 31, was as follows:
| | | | | | | | |
| (In thousands) | | 2013 | | | 2012 | |
| |
| | |
Repledged | | $ | 189,308 | | | $ | 227,245 | |
| | |
Not repledged | | | 20,734 | | | | 13,234 | |
| |
| | |
Total | | $ | 210,042 | | | $ | 240,479 | |
| |
The repledged securities were used as underlying securities for repurchase agreement transactions.
138
Note 6 – Pledged assets
Certain securities and loans were pledged to secure public and trust deposits, assets sold under agreements to repurchase, other borrowings and credit facilities available, derivative positions, and loan servicing agreements. The classification and carrying amount of the Corporation’s pledged assets, in which the secured parties are not permitted to sell or repledge the collateral, were as follows:
| | | | | | | | |
| (In thousands) | | December 31,
2013 | | | December 31,
2012 | |
| |
| | |
Investment securities available-for-sale, at fair value | | $ | 1,638,558 | | | $ | 1,606,683 | |
| | |
Investment securities held-to-maturity, at amortized cost | | | 35,000 | | | | 25,000 | |
| | |
Loans held-for-sale measured at lower of cost or fair value | | | 363 | | | | 132 | |
| | |
Loans held-in-portfolio covered under loss sharing agreements with the FDIC | | | 407,257 | | | | 452,631 | |
| | |
Loans held-in-portfolio not covered under loss sharing agreements with the FDIC | | | 9,108,984 | | | | 8,358,456 | |
| |
| | |
Total pledged assets | | $ | 11,190,162 | | | $ | 10,442,902 | |
| |
Pledged securities that the creditor has the right by custom or contract to repledge are presented separately on the consolidated statements of financial condition.
At December 31, 2013, the Corporation had $ 1.0 billion in investment securities available-for-sale and $ 0.5 billion in loans that served as collateral to secure public funds (December 31, 2012 - $ 1.2 billion and $ 0.3 billion, respectively).
At December 31, 2013, the Corporation’s banking subsidiaries had short-term and long-term credit facilities authorized with the Federal Home Loan Bank system (the “FHLB”) aggregating to $3.0 billion (December 31, 2012 - $2.8 billion). Refer to Notes 20 and 21 to the consolidated financial statements for borrowings outstanding under these credit facilities. At December 31, 2013, the credit facilities authorized with the FHLB were collateralized by $ 4.5 billion in loans held-in-portfolio (December 31, 2012 - $ 3.8 billion). Also, at December 31, 2013, the Corporation’s banking subsidiaries had a borrowing capacity at the Federal Reserve (“Fed”) discount window of $3.4 billion, which remained unused as of such date ( December 31, 2012 - $3.1 billion). The amount available under these credit facilities with the Fed is dependent upon the balance of loans and securities pledged as collateral. At December 31, 2013, the credit facilities with the Fed discount window were collateralized by $ 4.5 billion in loans held-in-portfolio (December 31, 2012 - $ 4.7 billion). These pledged assets are included in the above table and were not reclassified and separately reported in the consolidated statements of financial condition.
In addition, at December 31, 2013 trades receivables from brokers and counterparties amounting to $69 million were pledged to secure repurchase agreements (December 31, 2012 - $133 million).
Note 7 – Investment securities available-for-sale
The following table presents the amortized cost, gross unrealized gains and losses, approximate fair value, weighted average yield and contractual maturities of investment securities available-for-sale at December 31, 2013 and 2012.
| | | | | | | | | | | | | | | | | | | | |
| | | At December 31, 2013 | |
| |
| (In thousands) | | Amortized cost | | | Gross
unrealized
gains | | | Gross
unrealized
losses | | | Fair value | | | Weighted
average
yield | |
| |
U.S. Treasury securities | | | | | | | | | | | | | | | | | | | | |
After 1 to 5 years | | $ | 26,474 | | | $ | 2,008 | | | $ | - | | | $ | 28,482 | | | | 3.85 % | |
| |
Total U.S. Treasury securities | | | 26,474 | | | | 2,008 | | | | - | | | | 28,482 | | | | 3.85 | |
| |
Obligations of U.S. Government sponsored entities | | | | | | | | | | | | | | | | | | | | |
Within 1 year | | | 25,021 | | | | 39 | | | | - | | | | 25,060 | | | | 1.85 | |
After 1 to 5 years | | | 1,087,453 | | | | 1,678 | | | | 12,715 | | | | 1,076,416 | | | | 1.26 | |
After 5 to 10 years | | | 528,611 | | | | 100 | | | | 21,742 | | | | 506,969 | | | | 1.52 | |
After 10 years | | | 23,000 | | | | - | | | | 2,240 | | | | 20,760 | | | | 3.12 | |
| |
Total obligations of U.S. Government sponsored entities | | | 1,664,085 | | | | 1,817 | | | | 36,697 | | | | 1,629,205 | | | | 1.38 | |
| |
Obligations of Puerto Rico, States and political subdivisions | | | | | | | | | | | | | | | | | | | | |
After 1 to 5 years | | | 6,228 | | | | 45 | | | | 85 | | | | 6,188 | | | | 4.64 | |
139
| | | | | | | | | | | | | | | | | | | | |
After 5 to 10 years | | | 23,147 | | | | - | | | | 1,978 | | | | 21,169 | | | | 6.33 | |
After 10 years | | | 48,803 | | | | 29 | | | | 9,812 | | | | 39,020 | | | | 5.84 | |
| |
Total obligations of Puerto Rico, States and political subdivisions | | | 78,178 | | | | 74 | | | | 11,875 | | | | 66,377 | | | | 5.89 | |
| |
Collateralized mortgage obligations - federal agencies | | | | | | | | | | | | | | | | | | | | |
After 1 to 5 years | | | 5,131 | | | | 101 | | | | - | | | | 5,232 | | | | 1.79 | |
After 5 to 10 years | | | 31,613 | | | | 921 | | | | - | | | | 32,534 | | | | 2.98 | |
After 10 years | | | 2,438,021 | | | | 18,532 | | | | 76,023 | | | | 2,380,530 | | | | 2.05 | |
| |
Total collateralized mortgage obligations - federal agencies | | | 2,474,765 | | | | 19,554 | | | | 76,023 | | | | 2,418,296 | | | | 2.06 | |
| |
Collateralized mortgage obligations - private label | | | | | | | | | | | | | | | | | | | | |
After 10 years | | | 509 | | | | 4 | | | | - | | | | 513 | | | | 3.78 | |
| |
Total collateralized mortgage obligations - private label | | | 509 | | | | 4 | | | | - | | | | 513 | | | | 3.78 | |
| |
Mortgage-backed securities | | | | | | | | | | | | | | | | | | | | |
Within 1 year | | | 419 | | | | 24 | | | | - | | | | 443 | | | | 3.14 | |
After 1 to 5 years | | | 15,921 | | | | 833 | | | | - | | | | 16,754 | | | | 4.50 | |
After 5 to 10 years | | | 62,373 | | | | 3,058 | | | | 1,214 | | | | 64,217 | | | | 4.12 | |
After 10 years | | | 1,007,733 | | | | 50,807 | | | | 4,313 | | | | 1,054,227 | | | | 3.93 | |
| |
Total mortgage-backed securities | | | 1,086,446 | | | | 54,722 | | | | 5,527 | | | | 1,135,641 | | | | 3.95 | |
| |
Equity securities (without contractual maturity) | | | 3,178 | | | | 1,109 | | | | 171 | | | | 4,116 | | | | 4.06 | |
| |
Other | | | | | | | | | | | | | | | | | | | | |
After 1 to 5 years | | | 9,638 | | | | - | | | | 141 | | | | 9,497 | | | | 1.68 | |
After 10 years | | | 2,604 | | | | 69 | | | | - | | | | 2,673 | | | | 3.61 | |
| |
Total other | | | 12,242 | | | | 69 | | | | 141 | | | | 12,170 | | | | 2.09 | |
| |
Total investment securities available-for-sale | | $ | 5,345,877 | | | $ | 79,357 | | | $ | 130,434 | | | $ | 5,294,800 | | | | 2.30 % | |
| |
140
| | | | | | | | | | | | | | | | | | | | |
| | | At December 31, 2012 | |
| |
| (In thousands) | | Amortized cost | | | Gross
unrealized
gains | | | Gross
unrealized
losses | | | Fair value | | | Weighted
average
yield | |
| |
U.S. Treasury securities | | | | | | | | | | | | | | | | | | | | |
Within 1 year | | $ | 7,018 | | | $ | 20 | | | $ | - | | | $ | 7,038 | | | | 1.67 % | |
After 1 to 5 years | | | 27,236 | | | | 2,964 | | | | - | | | | 30,200 | | | | 3.83 | |
| |
Total U.S. Treasury securities | | | 34,254 | | | | 2,984 | | | | - | | | | 37,238 | | | | 3.39 | |
| |
Obligations of U.S. Government sponsored entities | | | | | | | | | | | | | | | | | | | | |
Within 1 year | | | 460,319 | | | | 7,614 | | | | - | | | | 467,933 | | | | 3.82 | |
After 1 to 5 years | | | 167,177 | | | | 2,057 | | | | - | | | | 169,234 | | | | 1.59 | |
After 5 to 10 years | | | 456,480 | | | | 3,263 | | | | 592 | | | | 459,151 | | | | 1.74 | |
| |
Total obligations of U.S. Government sponsored entities | | | 1,083,976 | | | | 12,934 | | | | 592 | | | | 1,096,318 | | | | 2.60 | |
| |
Obligations of Puerto Rico, States and political subdivisions | | | | | | | | | | | | | | | | | | | | |
Within 1 year | | | 5,220 | | | | 26 | | | | - | | | | 5,246 | | | | 3.08 | |
After 1 to 5 years | | | 6,254 | | | | 130 | | | | 39 | | | | 6,345 | | | | 4.65 | |
After 5 to 10 years | | | 5,513 | | | | - | | | | 36 | | | | 5,477 | | | | 3.79 | |
After 10 years | | | 37,265 | | | | 648 | | | | - | | | | 37,913 | | | | 5.38 | |
| |
Total obligations of Puerto Rico, States and political subdivisions | | | 54,252 | | | | 804 | | | | 75 | | | | 54,981 | | | | 4.91 | |
| |
Collateralized mortgage obligations - federal agencies | | | | | | | | | | | | | | | | | | | | |
After 1 to 5 years | | | 4,927 | | | | 35 | | | | - | | | | 4,962 | | | | 1.48 | |
After 5 to 10 years | | | 39,897 | | | | 1,794 | | | | - | | | | 41,691 | | | | 2.94 | |
After 10 years | | | 2,270,184 | | | | 50,740 | | | | 512 | | | | 2,320,412 | | | | 2.21 | |
| |
Total collateralized mortgage obligations - federal agencies | | | 2,315,008 | | | | 52,569 | | | | 512 | | | | 2,367,065 | | | | 2.22 | |
| |
Collateralized mortgage obligations - private label | | | | | | | | | | | | | | | | | | | | |
After 10 years | | | 2,414 | | | | 59 | | | | - | | | | 2,473 | | | | 4.59 | |
| |
Total collateralized mortgage obligations - private label | | | 2,414 | | | | 59 | | | | - | | | | 2,473 | | | | 4.59 | |
| |
Mortgage-backed securities | | | | | | | | | | | | | | | | | | | | |
Within 1 year | | | 288 | | | | 13 | | | | - | | | | 301 | | | | 3.47 | |
After 1 to 5 years | | | 3,838 | | | | 191 | | | | - | | | | 4,029 | | | | 4.12 | |
After 5 to 10 years | | | 81,645 | | | | 6,207 | | | | - | | | | 87,852 | | | | 4.71 | |
After 10 years | | | 1,297,585 | | | | 93,509 | | | | 129 | | | | 1,390,965 | | | | 4.18 | |
| |
Total mortgage-backed securities | | | 1,383,356 | | | | 99,920 | | | | 129 | | | | 1,483,147 | | | | 4.21 | |
| |
Equity securities (without contractual maturity) | | | 6,507 | | | | 909 | | | | 10 | | | | 7,406 | | | | 3.46 | |
| |
Other | | | | | | | | | | | | | | | | | | | | |
After 1 to 5 years | | | 9,992 | | | | - | | | | 207 | | | | 9,785 | | | | 1.67 | |
After 5 to 10 years | | | 18,032 | | | | 3,675 | | | | - | | | | 21,707 | | | | 11.00 | |
After 10 years | | | 3,945 | | | | 136 | | | | - | | | | 4,081 | | | | 3.62 | |
| |
Total other | | | 31,969 | | | | 3,811 | | | | 207 | | | | 35,573 | | | | 7.17 | |
| |
Total investment securities available-for-sale | | $ | 4,911,736 | | | $ | 173,990 | | | $ | 1,525 | | | $ | 5,084,201 | | | | 2.94 % | |
| |
The weighted average yield on investment securities available-for-sale is based on amortized cost; therefore, it does not give effect to changes in fair value.
Securities not due on a single contractual maturity date, such as mortgage-backed securities and collateralized mortgage obligations, are classified in the period of final contractual maturity. The expected maturities of collateralized mortgage obligations, mortgage-backed securities and certain other securities may differ from their contractual maturities because they may be subject to prepayments or may be called by the issuer.
The following table presents the aggregate amortized cost and fair value of investment securities available-for-sale at December 31, 2013, by contractual maturity.
| | | | | | | | |
| (In thousands) | | Amortized cost | | | Fair value | |
| |
| | |
Within 1 year | | $ | 25,440 | | | $ | 25,503 | |
| | |
After 1 to 5 years | | | 1,150,845 | | | | 1,142,569 | |
| | |
After 5 to 10 years | | | 645,744 | | | | 624,889 | |
141
| | | | | | | | |
After 10 years | | | 3,520,670 | | | | 3,497,723 | |
| |
| | |
Total | | | 5,342,699 | | | | 5,290,684 | |
| | |
Equity securities | | | 3,178 | | | | 4,116 | |
| |
| | |
Total investment securities available-for-sale | | $ | 5,345,877 | | | $ | 5,294,800 | |
| |
During the year ended December 31, 2013, the Corporation sold equity securities for a realized gain of $2.1 million. Proceeds from the sale of investment securities available-for-sale during 2013 were $ 5.4 million (2012 - $ 52.1 million). Gross realized gains and losses on the sale of investment securities available-for-sale, for the years ended December 31, 2013, 2012 and 2011 were as follows:
| | | | | | | | | | | | |
| | | Years ended December 31, | |
| (In thousands) | | 2013 | | | 2012 | | | 2011 | |
| |
| | | |
Gross realized gains | | $ | 2,110 | | | $ | 65 | | | $ | 8,514 | |
| | | |
Gross realized losses | | | - | | | | (1,684 | ) | | | (130) | |
| |
| | | |
Net realized gains (losses) on sale of investment securities available-for-sale | | $ | 2,110 | | | $ | (1,619 | ) | | $ | 8,384 | |
| |
The following tables present the Corporation’s fair value and gross unrealized losses of investment securities available-for-sale, aggregated by investment category and length of time that individual securities have been in a continuous unrealized loss position, at December 31, 2013, and 2012.
| | | | | | | | | | | | | | | | | | | | | | | | |
| | | At December 31, 2013 | |
| |
| | | Less than 12 months | | | 12 months or more | | | Total | |
| |
| (In thousands) | | Fair value | | | Gross
unrealized
losses | | | Fair value | | | Gross
unrealized
losses | | | Fair value | | | Gross
unrealized
losses | |
| |
| | | | | | |
Obligations of U.S. Government sponsored entities | | $ | 1,326,866 | | | $ | 32,457 | | | $ | 69,257 | | | $ | 4,240 | | | $ | 1,396,123 | | | $ | 36,697 | |
| | | | | | |
Obligations of Puerto Rico, States and political subdivisions | | | 54,256 | | | | 11,685 | | | | 8,330 | | | | 190 | | | | 62,586 | | | | 11,875 | |
| | | | | | |
Collateralized mortgage obligations - federal agencies | | | 1,567,654 | | | | 70,378 | | | | 96,676 | | | | 5,645 | | | | 1,664,330 | | | | 76,023 | |
| | | | | | |
Mortgage-backed securities | | | 105,455 | | | | 4,762 | | | | 7,225 | | | | 765 | | | | 112,680 | | | | 5,527 | |
| | | | | | |
Equity securities | | | 1,657 | | | | 171 | | | | - | | | | - | | | | 1,657 | | | | 171 | |
| | | | | | |
Other | | | - | | | | - | | | | 9,497 | | | | 141 | | | | 9,497 | | | | 141 | |
| |
| | | | | | |
Total investment securities available-for-sale in an unrealized loss position | | $ | 3,055,888 | | | $ | 119,453 | | | $ | 190,985 | | | $ | 10,981 | | | $ | 3,246,873 | | | $ | 130,434 | |
| |
| |
| | | At December 31, 2012 | |
| |
| | | Less than 12 months | | | 12 months or more | | | Total | |
| |
| (In thousands) | | Fair value | | | Gross
unrealized
losses | | | Fair value | | | Gross
unrealized
losses | | | Fair value | | | Gross
unrealized
losses | |
| |
| | | | | | |
Obligations of U.S. Government sponsored entities | | $ | 139,278 | | | $ | 592 | | | $ | - | | | $ | - | | | $ | 139,278 | | | $ | 592 | |
| | | | | | |
Obligations of Puerto Rico, States and political subdivisions | | | 6,229 | | | | 44 | | | | 2,031 | | | | 31 | | | | 8,260 | | | | 75 | |
| | | | | | |
Collateralized mortgage obligations - federal agencies | | | 170,136 | | | | 512 | | | | - | | | | - | | | | 170,136 | | | | 512 | |
| | | | | | |
Mortgage-backed securities | | | 7,411 | | | | 90 | | | | 983 | | | | 39 | | | | 8,394 | | | | 129 | |
| | | | | | |
Equity securities | | | - | | | | - | | | | 51 | | | | 10 | | | | 51 | | | | 10 | |
142
| | | | | | | | | | | | | | | | | | | | | | | | |
Other | | | 9,785 | | | | 207 | | | | - | | | | - | | | | 9,785 | | | | 207 | |
| |
| | | | | | |
Total investment securities available-for-sale in an unrealized loss position | | $ | 332,839 | | | $ | 1,445 | | | $ | 3,065 | | | $ | 80 | | | $ | 335,904 | | | $ | 1,525 | |
| |
As of December 31, 2013, the available-for-sale investment portfolio reflects gross unrealized losses of approximately $130 million, driven by US Agency Collateralized Mortgage Obligations, obligations from the U.S. Government sponsored entities, and obligations of the Puerto Rico Government and its political subdivisions. As part of its analysis for all US Agencies’ securities, management considers the US Agency guarantee. The portfolio of obligations of the Puerto Rico Government is comprised of securities with specific sources of income or revenues identified for repayments. The Corporation performs periodic credit quality reviews on these issuers.
Management evaluates investment securities for other-than-temporary (“OTTI”) declines in fair value on a quarterly basis. Once a decline in value is determined to be other-than-temporary, the value of a debt security is reduced and a corresponding charge to earnings is recognized for anticipated credit losses. Also, for equity securities that are considered other-than-temporarily impaired, the excess of the security’s carrying value over its fair value at the evaluation date is accounted for as a loss in the results of operations. The OTTI analysis requires management to consider various factors, which include, but are not limited to: (1) the length of time and the extent to which fair value has been less than the amortized cost basis, (2) the financial condition of the issuer or issuers, (3) actual collateral attributes, (4) the payment structure of the debt security and the likelihood of the issuer being able to make payments, (5) any rating changes by a rating agency, (6) adverse conditions specifically related to the security, industry, or a geographic area, and (7) management’s intent to sell the debt security or whether it is more likely than not that the Corporation would be required to sell the debt security before a forecasted recovery occurs.
At December 31, 2013, management performed its quarterly analysis of all debt securities in an unrealized loss position. Based on the analyses performed, management concluded that no individual debt security was other-than-temporarily impaired as of such date. At December 31, 2013, the Corporation did not have the intent to sell debt securities in an unrealized loss position and it is not more likely than not that the Corporation will have to sell the investment securities prior to recovery of their amortized cost basis. Also, management evaluated the Corporation’s portfolio of equity securities at December 31, 2013. No other-than-temporary impairment losses on equity securities were recorded during the year ended December 31, 2013. Management has the intent and ability to hold the investments in equity securities that are at a loss position at December 31, 2013, for a reasonable period of time for a forecasted recovery of fair value up to (or beyond) the cost of these investments.
The following table states the name of issuers, and the aggregate amortized cost and fair value of the securities of such issuer (includes available-for-sale and held-to-maturity securities), in which the aggregate amortized cost of such securities exceeds 10% of stockholders’ equity. This information excludes securities backed by the full faith and credit of the U.S. Government. Investments in obligations issued by a state of the U.S. and its political subdivisions and agencies, which are payable and secured by the same source of revenue or taxing authority, other than the U.S. Government, are considered securities of a single issuer.
| | | | | | | | | | | | | | | | |
| | | 2013 | | | 2012 | |
| |
| (In thousands) | | Amortized cost | | | Fair value | | | Amortized cost | | | Fair value | |
| |
| | | | |
FNMA | | $ | 2,318,171 | | | $ | 2,266,610 | | | $ | 1,594,933 | | | $ | 1,634,927 | |
| | | | |
FHLB | | | 336,933 | | | | 326,220 | | | | 520,127 | | | | 528,287 | |
| | | | |
Freddie Mac | | | 1,434,346 | | | | 1,418,216 | | | | 1,198,969 | | | | 1,221,863 | |
| |
143
Note 8 – Investment securities held-to-maturity
The following tables present the amortized cost, gross unrealized gains and losses, approximate fair value, weighted average yield and contractual maturities of investment securities held-to-maturity at December 31, 2013 and 2012.
| | | | | | | | | | | | | | | | | | | | |
| | | At December 31, 2013 | |
| |
| (In thousands) | | Amortized
cost | | | Gross
unrealized
gains | | | Gross
unrealized
losses | | | Fair value | | | Weighted
average
yield | |
| |
Obligations of Puerto Rico, States and political subdivisions | | | | | | | | | | | | | | | | | | | | |
Within 1 year | | $ | 12,570 | | | $ | - | | | $ | 12 | | | $ | 12,558 | | | | 2.06 % | |
After 1 to 5 years | | | 12,060 | | | | - | | | | 984 | | | | 11,076 | | | | 5.91 | |
After 5 to 10 years | | | 20,015 | | | | - | | | | 5,251 | | | | 14,764 | | | | 6.06 | |
After 10 years | | | 69,236 | | | | 257 | | | | 13,179 | | | | 56,314 | | | | 2.43 | |
| |
Total obligations of Puerto Rico, States and political subdivisions | | | 113,881 | | | | 257 | | | | 19,426 | | | | 94,712 | | | | 3.40 | |
| |
Collateralized mortgage obligations - federal agencies | | | | | | | | | | | | | | | | | | | | |
After 10 years | | | 115 | | | | 7 | | | | - | | | | 122 | | | | 5.45 | |
| |
Total collateralized mortgage obligations - federal agencies | | | 115 | | | | 7 | | | | - | | | | 122 | | | | 5.45 | |
| |
Other | | | | | | | | | | | | | | | | | | | | |
Within 1 year | | | 26,000 | | | | - | | | | 645 | | | | 25,355 | | | | 3.41 | |
After 1 to 5 years | | | 500 | | | | - | | | | 1 | | | | 499 | | | | 1.33 | |
| |
Total other | | | 26,500 | | | | - | | | | 646 | | | | 25,854 | | | | 3.37 | |
| |
Total investment securities held-to-maturity | | $ | 140,496 | | | $ | 264 | | | $ | 20,072 | | | $ | 120,688 | | | | 3.40 % | |
| |
| |
| | | At December 31, 2012 | |
| |
| (In thousands) | | Amortized
cost | | | Gross
unrealized
gains | | | Gross
unrealized
losses | | | Fair value | | | Weighted
average
yield | |
| |
Obligations of Puerto Rico, States and political subdivisions | | | | | | | | | | | | | | | | | | | | |
Within 1 year | | $ | 2,420 | | | $ | 8 | | | $ | - | | | $ | 2,428 | | | | 5.74 % | |
After 1 to 5 years | | | 21,335 | | | | 520 | | | | 19 | | | | 21,836 | | | | 3.63 | |
After 5 to 10 years | | | 18,780 | | | | 866 | | | | 5 | | | | 19,641 | | | | 6.03 | |
After 10 years | | | 73,642 | | | | 449 | | | | 438 | | | | 73,653 | | | | 5.35 | |
| |
Total obligations of Puerto Rico, States and political subdivisions | | | 116,177 | | | | 1,843 | | | | 462 | | | | 117,558 | | | | 5.15 | |
| |
Collateralized mortgage obligations - federal agencies | | | | | | | | | | | | | | | | | | | | |
After 10 years | | | 140 | | | | 4 | | | | - | | | | 144 | | | | 5.45 | |
| |
Total collateralized mortgage obligations - federal agencies | | | 140 | | | | 4 | | | | - | | | | 144 | | | | 5.45 | |
| |
Other | | | | | | | | | | | | | | | | | | | | |
Within 1 year | | | 250 | | | | - | | | | - | | | | 250 | | | | 0.86 | |
After 1 to 5 years | | | 26,250 | | | | 31 | | | | - | | | | 26,281 | | | | 3.40 | |
| |
Total other | | | 26,500 | | | | 31 | | | | - | | | | 26,531 | | | | 3.38 | |
| |
Total investment securities held-to-maturity | | $ | 142,817 | | | $ | 1,878 | | | $ | 462 | | | $ | 144,233 | | | | 4.82 % | |
| |
Securities not due on a single contractual maturity date, such as collateralized mortgage obligations, are classified in the period of final contractual maturity. The expected maturities of collateralized mortgage obligations and certain other securities may differ from their contractual maturities because they may be subject to prepayments or may be called by the issuer.
The following table presents the aggregate amortized cost and fair value of investments securities held-to-maturity at December 31, 2013, by contractual maturity.
| | | | | | | | |
| (In thousands) | | Amortized cost | | | Fair value | |
| |
| | |
Within 1 year | | $ | 38,570 | | | $ | 37,913 | |
| | |
After 1 to 5 years | | | 12,560 | | | | 11,575 | |
| | |
After 5 to 10 years | | | 20,015 | | | | 14,764 | |
| | |
After 10 years | | | 69,351 | | | | 56,436 | |
| |
| | |
Total investment securities held-to-maturity | | $ | 140,496 | | | $ | 120,688 | |
| |
144
The following tables present the Corporation’s fair value and gross unrealized losses of investment securities held-to-maturity, aggregated by investment category and length of time that individual securities have been in a continuous unrealized loss position, at December 31, 2013 and 2012:
| | | | | | | | | | | | | | | | | | | | | | | | |
| | | At December 31, 2013 | |
| |
| | | Less than 12 months | | | 12 months or more | | | Total | |
| |
| (In thousands) | | Fair
value | | | Gross
unrealized
losses | | | Fair
value | | | Gross
unrealized
losses | | | Fair
value | | | Gross
unrealized
losses | |
| |
Obligations of Puerto Rico, States and political subdivisions | | $ | 60,028 | | | $ | 12,180 | | | $ | 13,044 | | | $ | 7,246 | | | $ | 73,072 | | | $ | 19,426 | |
Other | | | 24,604 | | | | 646 | | | | - | | | | - | | | | 24,604 | | | | 646 | |
| |
Total investment securities held-to-maturity in an unrealized loss position | | $ | 84,632 | | | $ | 12,826 | | | $ | 13,044 | | | $ | 7,246 | | | $ | 97,676 | | | $ | 20,072 | |
| |
| | | | | | | | | | | | | | | | | | | | | | | | |
| | | At December 31, 2012 | |
| |
| | | Less than 12 months | | | 12 months or more | | | Total | |
| |
| (In thousands) | | Fair
value | | | Gross
unrealized
losses | | | Fair
value | | | Gross
unrealized
losses | | | Fair
value | | | Gross
unrealized
losses | |
| |
Obligations of Puerto Rico, States and political subdivisions | | $ | 2,365 | | | $ | 35 | | | $ | 19,118 | | | $ | 427 | | | $ | 21,483 | | | $ | 462 | |
| |
Total investment securities held-to-maturity in an unrealized loss position | | $ | 2,365 | | | $ | 35 | | | $ | 19,118 | | | $ | 427 | | | $ | 21,483 | | | $ | 462 | |
| |
As indicated in Note 7 to these consolidated financial statements, management evaluates investment securities for OTTI declines in fair value on a quarterly basis.
The “Obligations of Puerto Rico, States and political subdivisions” classified as held-to-maturity at December 31, 2013 are primarily associated with securities issued by municipalities of Puerto Rico and are generally not rated by a credit rating agency. This includes $64 million of securities issued by three municipalities of Puerto Rico that are payable from the real and personal property taxes collected within such municipalities. These bonds have seniority to the payment of operating cost and expenses of the municipality. The portfolio also includes approximately $40 million in securities for which the underlying source of payment is not the central government, but in which it provides a guarantee in the event of default. In February 2014, the three principal nationally recognized rating agencies (Moody’s Investor Services, Standard and Poor’s and Fitch Ratings) downgraded the general-obligation bonds of the Commonwealth and other obligations of Puerto Rico instrumentalities to non-investment grade categories, citing concerns about financial flexibility and a reduced capacity to borrow in the financial markets. The Corporation performs periodic credit quality reviews on these issuers. The Corporation does not have the intent to sell securities held-to-maturity and it is not more likely than not that the Corporation will have to sell these investment securities prior to recovery of their amortized cost basis.
145
Note 9 – Loans
Covered loans acquired in the Westernbank FDIC-assisted transaction, except for lines of credit with revolving privileges, are accounted for by the Corporation in accordance with ASC Subtopic 310-30. Under ASC Subtopic 310-30, the acquired loans were aggregated into pools based on similar characteristics. Each loan pool is accounted for as a single asset with a single composite interest rate and an aggregate expectation of cash flows. The covered loans which are accounted for under ASC Subtopic 310-30 by the Corporation are not considered non-performing and will continue to have an accretable yield as long as there is a reasonable expectation about the timing and amount of cash flows expected to be collected. The Corporation measures additional losses for this portfolio when it is probable the Corporation will be unable to collect all cash flows expected at acquisition plus additional cash flows expected to be collected arising from changes in estimates after acquisition. Lines of credit with revolving privileges that were acquired as part of the Westernbank FDIC-assisted transaction are accounted for under the guidance of ASC Subtopic 310-20, which requires that any differences between the contractually required loan payment receivable in excess of the Corporation’s initial investment in the loans be accreted into interest income. Loans accounted for under ASC Subtopic 310-20 are placed in non-accrual status when past due in accordance with the Corporation’s non-accruing policy and any accretion of discount is discontinued.
The risks on loans acquired in the FDIC-assisted transaction are significantly different from the risks on loans not covered under the FDIC loss sharing agreements because of the loss protection provided by the FDIC. Accordingly, the Corporation presents loans subject to the loss sharing agreements as “covered loans” in the information below and loans that are not subject to the FDIC loss sharing agreements as “non-covered loans”.
For a summary of the accounting policy related to loans, interest recognition and allowance for loan losses refer to the summary of significant accounting policies included in Note 2 to these consolidated financial statements.
The following table presents the composition of non-covered loans held-in-portfolio (“HIP”), net of unearned income, at December 31, 2013 and December 31, 2012.
| | | | | | | | |
| (In thousands) | | December 31, 2013 | | | December 31, 2012 | |
| |
Commercial multi-family | | | $ 1,175,937 | | | | $ 1,021,780 | |
Commercial real estate non-owner occupied | | | 2,970,505 | | | | 2,634,432 | |
Commercial real estate owner occupied | | | 2,166,545 | | | | 2,608,450 | |
Commercial and industrial | | | 3,724,197 | | | | 3,593,540 | |
Construction | | | 206,084 | | | | 252,857 | |
Mortgage | | | 6,681,476 | | | | 6,078,507 | |
Leasing | | | 543,761 | | | | 540,523 | |
Legacy[2] | | | 211,135 | | | | 384,217 | |
Consumer: | | | | | | | | |
Credit cards | | | 1,185,272 | | | | 1,198,213 | |
Home equity lines of credit | | | 478,211 | | | | 491,035 | |
Personal | | | 1,349,119 | | | | 1,388,911 | |
Auto | | | 699,980 | | | | 561,084 | |
Other | | | 219,644 | | | | 229,643 | |
| |
Total loans held-in-portfolio[1] | | | $ 21,611,866 | | | | $ 20,983,192 | |
| |
| [1] | Non-covered loans held-in-portfolio at December 31, 2013 are net of $92 million in unearned income and exclude $110 million in loans held-for-sale (December 31, 2012 - $97 million in unearned income and $354 million in loans held-for-sale). |
| [2] | The legacy portfolio is comprised of commercial loans, construction loans and lease financings related to certain lending products exited by the Corporation as part of restructuring efforts carried out in prior years at the BPNA segment. |
146
The following table presents the composition of covered loans at December 31, 2013 and December 31, 2012.
| | | | | | | | |
| (In thousands) | | December 31, 2013 | | | December 31, 2012 | |
| |
Commercial real estate | | | $ 1,710,229 | | | | $ 2,077,411 | |
Commercial and industrial | | | 102,575 | | | | 167,236 | |
Construction | | | 190,127 | | | | 361,396 | |
Mortgage | | | 934,373 | | | | 1,076,730 | |
Consumer | | | 47,123 | | | | 73,199 | |
| |
Total loans held-in-portfolio | | | $ 2,984,427 | | | | $ 3,755,972 | |
| |
The following table provides a breakdown of loans held-for-sale (“LHFS”) at December 31, 2013 and December 31, 2012 by main categories.
| | | | | | | | |
| (In thousands) | | December 31, 2013 | | | December 31, 2012 | |
| |
| | |
Commercial | | | $ 603 | | | | $ 16,047 | |
| | |
Construction | | | - | | | | 78,140 | |
| | |
Legacy | | | - | | | | 2,080 | |
| | |
Mortgage | | | 109,823 | | | | 258,201 | |
| |
| | |
Total loans held-for-sale | | | $ 110,426 | | | | $ 354,468 | |
| |
During the year ended December 31, 2013, the Corporation recorded purchases (including repurchases) of mortgage loans amounting to $1.9 billion (2012 - $1.5 billion). This includes two bulk purchases of $761 million in mortgage loans to financial institutions in Puerto Rico. During the year ended December 31, 2013, there were no purchases of construction loans (2012 - $1 million). Also, the Corporation recorded purchases of $42 million in consumer loans during the year ended December 31, 2013 (2012 - $265 million). The Corporation recorded purchases of $15 million in commercial loans during the year ended December 31, 2013 (2012 - $18 million).
The Corporation performed whole-loan sales involving approximately $661 million of residential mortgage loans during the year ended December 31, 2013 (2012 - $315 million), these sales included a loan bulk sale with a book value of $435 million. Also, the Corporation securitized approximately $920 million of mortgage loans into Government National Mortgage Association (“GNMA”) mortgage-backed securities during the year ended December 31, 2013 (2012 - $839 million). Furthermore, the Corporation securitized approximately $438 million of mortgage loans into Federal National Mortgage Association (“FNMA”) mortgage-backed securities during the year ended December 31, 2013 (2012 - $454 million). Also, the Corporation securitized approximately $33 million of mortgage loans into Federal Home Loan Mortgage Corporation (“FHLMC”) mortgage-backed securities during the year ended December 31, 2013 (2012 - $38 million). The Corporation sold commercial and construction loans with a book value of approximately $421 million during the year ended December 31, 2013 (2012 - $60 million), these sales included a loan bulk sale with a book value of $401 million.
Non-covered loans
The following tables present non-covered loans held-in-portfolio by loan class that are in non-performing status or are accruing interest but are past due 90 days or more at December 31, 2013 and 2012. Accruing loans past due 90 days or more consist primarily of credit cards, FHA / VA and other insured mortgage loans, and delinquent mortgage loans which are included in the Corporation’s financial statements pursuant to GNMA’s buy-back option program. Servicers of loans underlying GNMA mortgage-backed securities must report as their own assets the defaulted loans that they have the option (but not the obligation) to repurchase, even when they elect not to exercise that option. Also, accruing loans past due 90 days or more include residential conventional loans purchased from another financial institution that, although delinquent, the Corporation has received timely payment from the seller / servicer, and, in some instances, have partial guarantees under recourse agreements. However, residential conventional loans purchased from another financial institution, which are in the process of foreclosure, are classified as non-performing mortgage loans.
147
| | | | | | | | | | | | | | | | | | | | | | | | |
| At December 31, 2013 | |
| |
| | | Puerto Rico | | | U.S. mainland | | | Popular, Inc. | |
| |
| | | | | | |
| (In thousands) | | Non-accrual
loans | | | Accruing
loans past-due
90 days or more | | | Non-accrual
loans | | | Accruing
loans past-due
90 days or more | | | Non-accrual
loans | | | Accruing
loans past-due
90 days or more | |
| |
Commercial multi-family | | $ | 4,944 | | | $ | - | | | $ | 20,894 | | | $ | - | | | $ | 25,838 | | | $ | - | |
Commercial real estate non-owner occupied | | | 41,959 | | | | - | | | | 42,413 | | | | - | | | | 84,372 | | | | - | |
Commercial real estate owner occupied | | | 83,441 | | | | - | | | | 23,507 | | | | - | | | | 106,948 | | | | - | |
Commercial and industrial | | | 55,753 | | | | 556 | | | | 6,142 | | | | - | | | | 61,895 | | | | 556 | |
Construction | | | 18,108 | | | | - | | | | 5,663 | | | | - | | | | 23,771 | | | | - | |
Mortgage[2][3] | | | 206,389 | | | | 395,645 | | | | 26,292 | | | | - | | | | 232,681 | | | | 395,645 | |
Leasing | | | 3,495 | | | | - | | | | - | | | | - | | | | 3,495 | | | | - | |
Legacy | | | - | | | | - | | | | 15,050 | | | | - | | | | 15,050 | | | | - | |
Consumer: | | | | | | | | | | | | | | | | | | | | | | | | |
Credit cards | | | - | | | | 20,313 | | | | 486 | | | | - | | | | 486 | | | | 20,313 | |
Home equity lines of credit | | | - | | | | 147 | | | | 8,632 | | | | - | | | | 8,632 | | | | 147 | |
Personal | | | 17,054 | | | | 54 | | | | 1,591 | | | | - | | | | 18,645 | | | | 54 | |
Auto | | | 10,562 | | | | - | | | | 2 | | | | - | | | | 10,564 | | | | - | |
Other | | | 5,550 | | | | 585 | | | | 21 | | | | - | | | | 5,571 | | | | 585 | |
| |
Total[1] | | $ | 447,255 | | | $ | 417,300 | | | $ | 150,693 | | | $ | - | | | $ | 597,948 | | | $ | 417,300 | |
| |
[1] For purposes of this table non-performing loans exclude $ 1 million in non-performing loans held-for-sale.
[2] Non-covered loans by $43 million accounted for under ASC Subtopic 310-30 are excluded from the above table as they are considered to be performing due to the application of the accretion method, in which these loans will accrete interest income over the remaining life of the loans using estimated cash flow analysis.
[3] It is the Corporation’s policy to report delinquent residential mortgage loans insured by FHA or guaranteed by the VA as accruing loans past due 90 days or more as opposed to non-performing since the principal repayment is insured. These balances include $115 million of residential mortgage loans in Puerto Rico insured by FHA or guaranteed by the VA that are no longer accruing interest as of December 31, 2013. Furthermore, the Corporation has approximately $50 million in reverse mortgage loans in Puerto Rico which are guaranteed by FHA, but which are currently not accruing interest. Due to the guaranteed nature of the loans, it is the Corporation’s policy to exclude these balances from non-performing assets.
| | | | | | | | | | | | | | | | | | | | | | | | |
| At December 31, 2012 | |
| |
| | | Puerto Rico | | | U.S. mainland | | | Popular, Inc. | |
| |
| | | | | | |
| (In thousands) | | Non-accrual
loans | | | Accruing
loans past-due
90 days or more | | | Non-accrual
loans | | | Accruing
loans past-due
90 days or more | | | Non-accrual
loans | | | Accruing
loans past-due
90 days or more | |
| |
Commercial multi-family | | $ | 15,816 | | | $ | - | | | $ | 18,435 | | | $ | - | | | $ | 34,251 | | | $ | - | |
Commercial real estate non-owner occupied | | | 66,665 | | | | - | | | | 78,140 | | | | - | | | | 144,805 | | | | - | |
Commercial real estate owner occupied | | | 315,534 | | | | - | | | | 31,931 | | | | - | | | | 347,465 | | | | - | |
Commercial and industrial | | | 124,717 | | | | 529 | | | | 14,051 | | | | - | | | | 138,768 | | | | 529 | |
Construction | | | 37,390 | | | | - | | | | 5,960 | | | | - | | | | 43,350 | | | | - | |
Mortgage[2] | | | 596,105 | | | | 364,387 | | | | 34,025 | | | | - | | | | 630,130 | | | | 364,387 | |
Leasing | | | 4,865 | | | | - | | | | - | | | | - | | | | 4,865 | | | | - | |
Legacy | | | - | | | | - | | | | 40,741 | | | | - | | | | 40,741 | | | | - | |
Consumer: | | | | | | | | | | | | | | | | | | | | | | | | |
Credit cards | | | - | | | | 22,184 | | | | 505 | | | | - | | | | 505 | | | | 22,184 | |
Home equity lines of credit | | | - | | | | 312 | | | | 7,454 | | | | - | | | | 7,454 | | | | 312 | |
Personal | | | 19,300 | | | | 23 | | | | 1,905 | | | | - | | | | 21,205 | | | | 23 | |
Auto | | | 8,551 | | | | - | | | | 4 | | | | - | | | | 8,555 | | | | - | |
Other | | | 3,036 | | | | 469 | | | | 3 | | | | - | | | | 3,039 | | | | 469 | |
| |
Total[1] | | $ | 1,191,979 | | | $ | 387,904 | | | $ | 233,154 | | | $ | - | | | $ | 1,425,133 | | | $ | 387,904 | |
| |
[1] For purposes of this table non-performing loans exclude $ 96 million in non-performing loans held-for-sale.
[2] It is the Corporation’s policy to report delinquent residential mortgage loans insured by FHA or guaranteed by the VA as accruing loans past due 90 days or more as opposed to non-performing since the principal repayment is insured. These balances include $86 million of residential mortgage loans in Puerto Rico insured by FHA or guaranteed by the VA that are no longer accruing interest as of December 31, 2012.
The following tables present loans by past due status at December 31, 2013 and December 31, 2012 for non-covered loans held-in-portfolio (net of unearned income).
|
| December 31, 2013 |
|
| Puerto Rico |
148
| | | | | | | | | | | | | | | | | | | | | | | | | | |
| |
| | | Past due | | | | | | | | Non-covered loans HIP
Puerto Rico | |
| | | | | | | | | | | |
| (In thousands) | | 30-59 days | | | 60-89 days | | | 90 days
or more | | | Total
past due | | | | | Current | | |
| |
Commercial multi-family | | $ | 446 | | | $ | - | | | $ | 4,944 | | | $ | 5,390 | | | | | $ | 77,013 | | | $ | 82,403 | |
Commercial real estate non-owner occupied | | | 13,889 | | | | 349 | | | | 41,959 | | | | 56,197 | | | | | | 1,808,021 | | | | 1,864,218 | |
Commercial real estate owner occupied | | | 13,725 | | | | 8,318 | | | | 83,441 | | | | 105,484 | | | | | | 1,501,019 | | | | 1,606,503 | |
Commercial and industrial | | | 9,960 | | | | 4,463 | | | | 56,309 | | | | 70,732 | | | | | | 2,841,734 | | | | 2,912,466 | |
Construction | | | 2,329 | | | | - | | | | 18,108 | | | | 20,437 | | | | | | 140,734 | | | | 161,171 | |
Mortgage | | | 316,663 | | | | 154,882 | | | | 645,444 | | | | 1,116,989 | | | | | | 4,283,690 | | | | 5,400,679 | |
Leasing | | | 7,457 | | | | 1,607 | | | | 3,495 | | | | 12,559 | | | | | | 531,202 | | | | 543,761 | |
Consumer: | | | | | | | | | | | | | | | | | | | | | | | | | | |
Credit cards | | | 13,797 | | | | 9,991 | | | | 20,313 | | | | 44,101 | | | | | | 1,125,520 | | | | 1,169,621 | |
Home equity lines of credit | | | 133 | | | | 53 | | | | 147 | | | | 333 | | | | | | 14,845 | | | | 15,178 | |
Personal | | | 12,897 | | | | 6,794 | | | | 17,108 | | | | 36,799 | | | | | | 1,177,085 | | | | 1,213,884 | |
Auto | | | 31,340 | | | | 9,361 | | | | 10,562 | | | | 51,263 | | | | | | 648,228 | | | | 699,491 | |
Other | | | 1,834 | | | | 859 | | | | 6,135 | | | | 8,828 | | | | | | 209,636 | | | | 218,464 | |
| |
Total | | $ | 424,470 | | | $ | 196,677 | | | $ | 907,965 | | | $ | 1,529,112 | | | | | $ | 14,358,727 | | | $ | 15,887,839 | |
| |
|
| December 31, 2013 | |
| |
| U.S. mainland | |
| |
| | | Past due | | | | | | | | | |
| | | | | | | | | | | |
| (In thousands) | | 30-59 days | | | 60-89 days | | | 90 days
or more | | | Total
past due | | | | | Current | | | Loans HIP
U.S. mainland | |
| |
Commercial multi-family | | $ | 3,621 | | | $ | 1,675 | | | $ | 20,894 | | | $ | 26,190 | | | | | $ | 1,067,344 | | | $ | 1,093,534 | |
Commercial real estate non-owner occupied | | | 4,255 | | | | - | | | | 42,413 | | | | 46,668 | | | | | | 1,059,619 | | | | 1,106,287 | |
Commercial real estate owner occupied | | | 657 | | | | 8,452 | | | | 23,507 | | | | 32,616 | | | | | | 527,426 | | | | 560,042 | |
Commercial and industrial | | | 2,331 | | | | 2,019 | | | | 6,142 | | | | 10,492 | | | | | | 801,239 | | | | 811,731 | |
Construction | | | - | | | | - | | | | 5,663 | | | | 5,663 | | | | | | 39,250 | | | | 44,913 | |
Mortgage | | | 30,713 | | | | 9,630 | | | | 26,292 | | | | 66,635 | | | | | | 1,214,162 | | | | 1,280,797 | |
Legacy | | | 9,079 | | | | 2,098 | | | | 15,050 | | | | 26,227 | | | | | | 184,908 | | | | 211,135 | |
Consumer: | | | | | | | | | | | | | | | | | | | | | | | | | | |
Credit cards | | | 285 | | | | 200 | | | | 486 | | | | 971 | | | | | | 14,680 | | | | 15,651 | |
Home equity lines of credit | | | 2,794 | | | | 2,198 | | | | 8,632 | | | | 13,624 | | | | | | 449,409 | | | | 463,033 | |
Personal | | | 3,196 | | | | 826 | | | | 1,591 | | | | 5,613 | | | | | | 129,622 | | | | 135,235 | |
Auto | | | 11 | | | | - | | | | 2 | | | | 13 | | | | | | 476 | | | | 489 | |
Other | | | 43 | | | | 50 | | | | 21 | | | | 114 | | | | | | 1,066 | | | | 1,180 | |
| |
Total | | $ | 56,985 | | | $ | 27,148 | | | $ | 150,693 | | | $ | 234,826 | | | | | $ | 5,489,201 | | | $ | 5,724,027 | |
| |
|
| December 31, 2013 | |
| |
| Popular, Inc. | |
| |
| | | Past due | | | | | Current | | | Non-covered loans HIP
Popular, Inc. | |
| | | | | |
| (In thousands) | | 30-59 days | | | 60-89 days | | | 90 days
or more | | | Total past due | | | | | |
| |
Commercial multi-family | | $ | 4,067 | | | $ | 1,675 | | | $ | 25,838 | | | $ | 31,580 | | | | | $ | 1,144,357 | | | $ | 1,175,937 | |
Commercial real estate non-owner occupied | | | 18,144 | | | | 349 | | | | 84,372 | | | | 102,865 | | | | | | 2,867,640 | | | | 2,970,505 | |
Commercial real estate owner occupied | | | 14,382 | | | | 16,770 | | | | 106,948 | | | | 138,100 | | | | | | 2,028,445 | | | | 2,166,545 | |
Commercial and industrial | | | 12,291 | | | | 6,482 | | | | 62,451 | | | | 81,224 | | | | | | 3,642,973 | | | | 3,724,197 | |
Construction | | | 2,329 | | | | - | | | | 23,771 | | | | 26,100 | | | | | | 179,984 | | | | 206,084 | |
Mortgage | | | 347,376 | | | | 164,512 | | | | 671,736 | | | | 1,183,624 | | | | | | 5,497,852 | | | | 6,681,476 | |
Leasing | | | 7,457 | | | | 1,607 | | | | 3,495 | | | | 12,559 | | | | | | 531,202 | | | | 543,761 | |
Legacy | | | 9,079 | | | | 2,098 | | | | 15,050 | | | | 26,227 | | | | | | 184,908 | | | | 211,135 | |
Consumer: | | | | | | | | | | | | | | | | | | | | | | | | | | |
Credit cards | | | 14,082 | | | | 10,191 | | | | 20,799 | | | | 45,072 | | | | | | 1,140,200 | | | | 1,185,272 | |
Home equity lines of credit | | | 2,927 | | | | 2,251 | | | | 8,779 | | | | 13,957 | | | | | | 464,254 | | | | 478,211 | |
Personal | | | 16,093 | | | | 7,620 | | | | 18,699 | | | | 42,412 | | | | | | 1,306,707 | | | | 1,349,119 | |
Auto | | | 31,351 | | | | 9,361 | | | | 10,564 | | | | 51,276 | | | | | | 648,704 | | | | 699,980 | |
Other | | | 1,877 | | | | 909 | | | | 6,156 | | | | 8,942 | | | | | | 210,702 | | | | 219,644 | |
| |
Total | | $ | 481,455 | | | $ | 223,825 | | | $ | 1,058,658 | | | $ | 1,763,938 | | | | | $ | 19,847,928 | | | $ | 21,611,866 | |
| |
149
| | | | | | | | | | | | | | | | | | | | | | | | |
| December 31, 2012 | |
| |
| Puerto Rico | |
| |
| | | Past due | | | | | | Non-covered loans HIP
Puerto Rico | |
| | | | | | | | | |
| (In thousands) | | 30-59 days | | | 60-89 days | | | 90 days
or more | | | Total
past due | | | Current | | |
| |
Commercial multi-family | | $ | 1,005 | | | $ | - | | | $ | 15,816 | | | $ | 16,821 | | | $ | 98,272 | | | $ | 115,093 | |
Commercial real estate non-owner occupied | | | 10,580 | | | | 4,454 | | | | 66,665 | | | | 81,699 | | | | 1,268,734 | | | | 1,350,433 | |
Commercial real estate owner occupied | | | 28,240 | | | | 13,319 | | | | 315,534 | | | | 357,093 | | | | 1,685,393 | | | | 2,042,486 | |
Commercial and industrial | | | 27,977 | | | | 5,922 | | | | 125,246 | | | | 159,145 | | | | 2,629,127 | | | | 2,788,272 | |
Construction | | | 1,243 | | | | - | | | | 37,390 | | | | 38,633 | | | | 173,634 | | | | 212,267 | |
Mortgage | | | 241,930 | | | | 121,175 | | | | 960,492 | | | | 1,323,597 | | | | 3,625,327 | | | | 4,948,924 | |
Leasing | | | 6,493 | | | | 1,555 | | | | 4,865 | | | | 12,913 | | | | 527,610 | | | | 540,523 | |
Consumer: | | | | | | | | | | | | | | | | | | | | | | | | |
Credit cards | | | 14,521 | | | | 10,614 | | | | 22,184 | | | | 47,319 | | | | 1,135,753 | | | | 1,183,072 | |
Home equity lines of credit | | | 124 | | | | - | | | | 312 | | | | 436 | | | | 16,370 | | | | 16,806 | |
Personal | | | 13,208 | | | | 7,392 | | | | 19,323 | | | | 39,923 | | | | 1,205,859 | | | | 1,245,782 | |
Auto | | | 24,128 | | | | 6,518 | | | | 8,551 | | | | 39,197 | | | | 521,119 | | | | 560,316 | |
Other | | | 2,120 | | | | 536 | | | | 3,505 | | | | 6,161 | | | | 222,192 | | | | 228,353 | |
| |
Total | | $ | 371,569 | | | $ | 171,485 | | | $ | 1,579,883 | | | $ | 2,122,937 | | | $ | 13,109,390 | | | $ | 15,232,327 | |
| |
|
| December 31, 2012 | |
| |
| U.S. mainland | |
| |
| | | Past due | | | | | | | |
| | | | | | | | | | | | |
| (In thousands) | | 30-59 days | | | 60-89 days | | | 90 days
or more | | | Total
past due | | | Current | | | Loans HIP
U.S. mainland | |
| |
Commercial multi-family | | $ | 6,828 | | | $ | 5,067 | | | $ | 18,435 | | | $ | 30,330 | | | $ | 876,357 | | | $ | 906,687 | |
Commercial real estate non-owner occupied | | | 19,032 | | | | 1,309 | | | | 78,140 | | | | 98,481 | | | | 1,185,518 | | | | 1,283,999 | |
Commercial real estate owner occupied | | | 9,979 | | | | 100 | | | | 31,931 | | | | 42,010 | | | | 523,954 | | | | 565,964 | |
Commercial and industrial | | | 12,885 | | | | 1,975 | | | | 14,051 | | | | 28,911 | | | | 776,357 | | | | 805,268 | |
Construction | | | 5,268 | | | | - | | | | 5,960 | | | | 11,228 | | | | 29,362 | | | | 40,590 | |
Mortgage | | | 29,909 | | | | 10,267 | | | | 34,025 | | | | 74,201 | | | | 1,055,382 | | | | 1,129,583 | |
Legacy | | | 15,765 | | | | 20,112 | | | | 40,741 | | | | 76,618 | | | | 307,599 | | | | 384,217 | |
Consumer: | | | | | | | | | | | | | | | | | | | | | | | | |
Credit cards | | | 305 | | | | 210 | | | | 505 | | | | 1,020 | | | | 14,121 | | | | 15,141 | |
Home equity lines of credit | | | 3,937 | | | | 2,506 | | | | 7,454 | | | | 13,897 | | | | 460,332 | | | | 474,229 | |
Personal | | | 2,757 | | | | 1,585 | | | | 1,905 | | | | 6,247 | | | | 136,882 | | | | 143,129 | |
Auto | | | 38 | | | | 3 | | | | 4 | | | | 45 | | | | 723 | | | | 768 | |
Other | | | 41 | | | | 9 | | | | 3 | | | | 53 | | | | 1,237 | | | | 1,290 | |
| |
Total | | $ | 106,744 | | | $ | 43,143 | | | $ | 233,154 | | | $ | 383,041 | | | $ | 5,367,824 | | | $ | 5,750,865 | |
| |
|
| December 31, 2012 | |
| |
| Popular, Inc. | |
| |
| | | Past due | | | | | | Non-covered loans HIP
Popular, Inc. | |
| | | | | | | | | |
| (In thousands) | | 30-59 days | | | 60-89 days | | | 90 days
or more | | | Total past due | | | Current | | |
| |
Commercial multi-family | | $ | 7,833 | | | $ | 5,067 | | | $ | 34,251 | | | $ | 47,151 | | | $ | 974,629 | | | $ | 1,021,780 | |
Commercial real estate non-owner occupied | | | 29,612 | | | | 5,763 | | | | 144,805 | | | | 180,180 | | | | 2,454,252 | | | | 2,634,432 | |
Commercial real estate owner occupied | | | 38,219 | | | | 13,419 | | | | 347,465 | | | | 399,103 | | | | 2,209,347 | | | | 2,608,450 | |
Commercial and industrial | | | 40,862 | | | | 7,897 | | | | 139,297 | | | | 188,056 | | | | 3,405,484 | | | | 3,593,540 | |
Construction | | | 6,511 | | | | - | | | | 43,350 | | | | 49,861 | | | | 202,996 | | | | 252,857 | |
Mortgage | | | 271,839 | | | | 131,442 | | | | 994,517 | | | | 1,397,798 | | | | 4,680,709 | | | | 6,078,507 | |
Leasing | | | 6,493 | | | | 1,555 | | | | 4,865 | | | | 12,913 | | | | 527,610 | | | | 540,523 | |
Legacy | | | 15,765 | | | | 20,112 | | | | 40,741 | | | | 76,618 | | | | 307,599 | | | | 384,217 | |
Consumer: | | | | | | | | | | | | | | | | | | | | | | | | |
Credit cards | | | 14,826 | | | | 10,824 | | | | 22,689 | | | | 48,339 | | | | 1,149,874 | | | | 1,198,213 | |
Home equity lines of credit | | | 4,061 | | | | 2,506 | | | | 7,766 | | | | 14,333 | | | | 476,702 | | | | 491,035 | |
150
| | | | | | | | | | | | | | | | | | | | | | | | |
Personal | | | 15,965 | | | | 8,977 | | | | 21,228 | | | | 46,170 | | | | 1,342,741 | | | | 1,388,911 | |
Auto | | | 24,166 | | | | 6,521 | | | | 8,555 | | | | 39,242 | | | | 521,842 | | | | 561,084 | |
Other | | | 2,161 | | | | 545 | | | | 3,508 | | | | 6,214 | | | | 223,429 | | | | 229,643 | |
| |
Total | | $ | 478,313 | | | $ | 214,628 | | | $ | 1,813,037 | | | $ | 2,505,978 | | | $ | 18,477,214 | | | $ | 20,983,192 | |
| |
The following table provides a breakdown of loans held-for-sale (“LHFS”) in non-performing status at December 31, 2013 and December 31, 2012 by main categories.
| | | | | | | | |
| (In thousands) | | December 31, 2013 | | | December 31, 2012 | |
| |
| | |
Commercial | | $ | 603 | | | $ | 16,047 | |
| | |
Construction | | | - | | | | 78,140 | |
| | |
Legacy | | | - | | | | 2,080 | |
| | |
Mortgage | | | 489 | | | | 53 | |
|
| |
| | |
Total | | $ | 1,092 | | | $ | 96,320 | |
| |
The outstanding principal balance of non-covered loans accounted pursuant to ASC Subtopic 310-30, including amounts charged off by the Corporation, amounted to $197 million at December 31, 2013. At December 31, 2013, none of the acquired non-covered loans accounted under ASC Subtopic 310-30 were considered non-performing loans. Therefore, interest income, through accretion of the difference between the carrying amount of the loans and the expected cash flows, was recognized on all acquired loans.
Changes in the carrying amount and the accretable yield for the non-covered loans accounted pursuant to the ASC Subtopic 310-30, for the year ended December 31, 2013 were as follows:
| | | | |
| Activity in the accretable discount - Non-covered loans ASC 310-30 | |
| |
| | | For the year ended | |
| |
| (In thousands) | | December 31, 2013 | |
| |
Beginning balance | | $ | - | |
Additions | | | 60,805 | |
Accretion | | | (7,396) | |
Change in expected cash flows | | | (4,011) | |
| |
Ending balance | | $ | 49,398 | |
| |
| | | | |
| Carrying amount of non-covered loans accounted for pursuant to ASC 310-30 | |
| |
| | | For the year ended | |
| |
| (In thousands) | | December 31, 2013 | |
| |
| |
Beginning balance | | $ | - | |
| |
Additions | | | 195,283 | |
| |
Accretion | | | 7,396 | |
| |
Collections and charge-offs | | | (29,020) | |
|
| |
| |
Ending balance | | $ | 173,659 | |
| |
Allowance for loan losses ASC 310-30 non-covered loans | | | (14,536) | |
|
| |
| |
Ending balance, net of allowance for loan losses | | $ | 159,123 | |
| |
The components of the net financing leases receivable at December 31, 2013 and 2012 were as follows:
| | | | | | | | |
| (In thousands) | | 2013 | | | 2012 | |
| |
| | |
Total minimum lease payments | | $ | 493,022 | | | $ | 503,447 | |
| | |
Estimated residual value of leased property | | | 134,198 | | | | 129,927 | |
151
| | | | | | | | |
Deferred origination costs, net of fees | | | 7,773 | | | | 6,966 | |
| | |
Less - Unearned financing income | | | 88,230 | | | | 93,157 | |
| |
| | |
Net minimum lease payments | | | 546,763 | | | | 547,183 | |
| | |
Less - Allowance for loan losses | | | 10,737 | | | | 3,475 | |
| |
| | |
Net minimum lease payments, net of allowance for loan losses | | $ | 536,026 | | | $ | 543,708 | |
| |
At December 31, 2013, future minimum lease payments are expected to be received as follows:
| | | | |
| (In thousands) | | | |
| |
| |
2014 | | $ | 130,108 | |
| |
2015 | | | 117,624 | |
| |
2016 | | | 98,924 | |
| |
2017 | | | 80,747 | |
| |
2018 and thereafter | | | 65,619 | |
|
| |
| |
Total | | $ | 493,022 | |
| |
Covered loans
The following table presents covered loans in non-performing status and accruing loans past-due 90 days or more by loan class at December 31, 2013 and December 31, 2012.
| | | | | | | | | | | | | | | | |
| | | December 31, 2013 | | | December 31, 2012 | |
| |
| | | | |
| | | Non-accrual | | | Accruing loans past | | | Non-accrual | | | Accruing loans past | |
| | | | |
| (In thousands) | | loans | | | due 90 days or more | | | loans | | | due 90 days or more | |
| |
| | | | |
Commercial real estate | | $ | 8,345 | | | $ | - | | | $ | 14,628 | | | $ | - | |
| | | | |
Commercial and industrial | | | 7,335 | | | | 456 | | | | 48,743 | | | | 504 | |
| | | | |
Construction | | | 11,872 | | | | - | | | | 8,363 | | | | - | |
| | | | |
Mortgage | | | 1,739 | | | | 69 | | | | 2,147 | | | | - | |
| | | | |
Consumer | | | 90 | | | | 112 | | | | 543 | | | | 265 | |
| |
| | | | |
Total[1] | | $ | 29,381 | | | $ | 637 | | | $ | 74,424 | | | $ | 769 | |
| |
[1] Covered loans accounted for under ASC Subtopic 310-30 are excluded from the above table as they are considered to be performing due to the application of the accretion method, in which these loans will accrete interest income over the remaining life of the loans using estimated cash flow analyses.
The following tables present loans by past due status at December 31, 2013 and December 31, 2012 for covered loans held-in-portfolio. The information considers covered loans accounted for under ASC Subtopic 310-20 and ASC Subtopic 310-30.
| | | | | | | | | | | | | | | | | | | | | | | | |
| December 31, 2013 | |
| |
| | | |
| | | Past due | | | | | | | |
| | | | | | |
| (In thousands) | | 30-59 days | | | 60-89 days | | | 90 days or more | | | Total past due | | | Current | | | Covered loans HIP | |
| |
| | | | | | |
Commercial real estate | | $ | 42,898 | | | $ | 8,745 | | | $ | 374,301 | | | $ | 425,944 | | | $ | 1,284,285 | | | $ | 1,710,229 | |
| | | | | | |
Commercial and industrial | | | 1,584 | | | | 349 | | | | 16,318 | | | | 18,251 | | | | 84,324 | | | | 102,575 | |
| | | | | | |
Construction | | | 399 | | | | - | | | | 178,007 | | | | 178,406 | | | | 11,721 | | | | 190,127 | |
| | | | | | |
Mortgage | | | 50,222 | | | | 23,384 | | | | 165,030 | | | | 238,636 | | | | 695,737 | | | | 934,373 | |
| | | | | | |
Consumer | | | 2,588 | | | | 1,328 | | | | 4,200 | | | | 8,116 | | | | 39,007 | | | | 47,123 | |
| |
| | | | | | |
Total covered loans | | $ | 97,691 | | | $ | 33,806 | | | $ | 737,856 | | | $ | 869,353 | | | $ | 2,115,074 | | | $ | 2,984,427 | |
| |
|
| December 31, 2012 | |
| |
| | | |
| | | Past due | | | | | | | |
152
| | | | | | | | | | | | | | | | | | | | | | | | |
| (In thousands) | | 30-59 days | | | 60-89 days | | | 90 days or more | | | Total past due | | | Current | | | Covered loans HIP | |
| |
Commercial real estate | | $ | 81,386 | | | $ | 41,256 | | | $ | 545,241 | | | $ | 667,883 | | | $ | 1,409,528 | | | $ | 2,077,411 | |
| | | | | | |
Commercial and industrial | | | 3,242 | | | | 551 | | | | 59,554 | | | | 63,347 | | | | 103,889 | | | | 167,236 | |
| | | | | | |
Construction | | | 13 | | | | - | | | | 296,837 | | | | 296,850 | | | | 64,546 | | | | 361,396 | |
| | | | | | |
Mortgage | | | 38,307 | | | | 28,206 | | | | 182,390 | | | | 248,903 | | | | 827,827 | | | | 1,076,730 | |
| | | | | | |
Consumer | | | 1,382 | | | | 1,311 | | | | 11,094 | | | | 13,787 | | | | 59,412 | | | | 73,199 | |
| |
| | | | | | |
Total covered loans | | $ | 124,330 | | | $ | 71,324 | | | $ | 1,095,116 | | | $ | 1,290,770 | | | $ | 2,465,202 | | | $ | 3,755,972 | |
| |
The carrying amount of the covered loans consisted of loans determined to be impaired at the time of acquisition, which are accounted for in accordance with ASC Subtopic 310-30 (“credit impaired loans”), and loans that were considered to be performing at the acquisition date, accounted for by analogy to ASC Subtopic 310-30 (“non-credit impaired loans”), as detailed in the following table.
| | | | | | | | | | | | | | | | | | | | | | | | |
| | | December 31, 2013 | | | December 31, 2012 | |
| |
| | |
| | | Carrying amount | | | Carrying amount | |
| |
| | | | | | |
| (In thousands) | | Non-credit
impaired loans | | | Credit impaired
loans | | | Total | | | Non-credit
impaired loans | | | Credit impaired
loans | | | Total | |
| |
| | | | | | |
Commercial real estate | | $ | 1,483,331 | | | $ | 149,341 | | | $ | 1,632,672 | | | $ | 1,778,594 | | | $ | 185,386 | | | $ | 1,963,980 | |
| | | | | | |
Commercial and industrial | | | 55,192 | | | | 3,069 | | | | 58,261 | | | | 55,396 | | | | 4,379 | | | | 59,775 | |
| | | | | | |
Construction | | | 71,864 | | | | 104,356 | | | | 176,220 | | | | 174,054 | | | | 174,093 | | | | 348,147 | |
| | | | | | |
Mortgage | | | 862,878 | | | | 59,483 | | | | 922,361 | | | | 988,158 | | | | 69,654 | | | | 1,057,812 | |
| | | | | | |
Consumer | | | 35,810 | | | | 2,623 | | | | 38,433 | | | | 55,762 | | | | 6,283 | | | | 62,045 | |
| |
| | | | | | |
Carrying amount | | | 2,509,075 | | | | 318,872 | | | | 2,827,947 | | | | 3,051,964 | | | | 439,795 | | | | 3,491,759 | |
| | | | | | |
Allowance for loan losses | | | (57,594) | | | | (36,321) | | | | (93,915) | | | | (48,365) | | | | (47,042) | | | | (95,407) | |
| |
| | | | | | |
Carrying amount, net of allowance | | $ | 2,451,481 | | | $ | 282,551 | | | $ | 2,734,032 | | | $ | 3,003,599 | | | $ | 392,753 | | | $ | 3,396,352 | |
| |
The outstanding principal balance of covered loans accounted pursuant to ASC Subtopic 310-30, including amounts charged off by the Corporation, amounted to $3.8 billion at December 31, 2013 (2012 - $4.8 billion). At December 31, 2013, none of the acquired loans from the Westernbank FDIC-assisted transaction accounted for under ASC Subtopic 310-30 were considered non-performing loans. Therefore, interest income, through accretion of the difference between the carrying amount of the loans and the expected cash flows, was recognized on all acquired loans.
Changes in the carrying amount and the accretable yield for the covered loans accounted pursuant to the ASC Subtopic 310-30, for the year ended December 31, 2013 and 2012, were as follows:
| | | | | | | | | | | | | | | | | | | | | | | | |
| | | Activity in the accretable discount | |
| |
| | | Covered loans ASC 310-30 | |
| |
| | | For the years ended | |
| | |
| | | December 31, 2013 | | | December 31, 2012 | |
| | | | | | |
| (In thousands) | | Non-credit impaired loans | | | Credit impaired loans | | | Total | | | Non-credit impaired loans | | | Credit impaired loans | | | Total | |
| |
| | | | | | |
Beginning balance | | $ | 1,446,381 | | | $ | 5,288 | | | $ | 1,451,669 | | | $ | 1,428,764 | | | $ | 41,495 | | | $ | 1,470,259 | |
| | | | | | |
Accretion | | | (268,005) | | | | (11,703) | | | | (279,708) | | | | (258,901) | | | | (21,695) | | | | (280,596) | |
| | | | | | |
Change in expected cash flows | | | 119,349 | | | | 17,895 | | | | 137,244 | | | | 276,518 | | | | (14,512) | | | | 262,006 | |
| |
| | | | | | |
Ending balance | | $ | 1,297,725 | | | $ | 11,480 | | | $ | 1,309,205 | | | $ | 1,446,381 | | | $ | 5,288 | | | $ | 1,451,669 | |
| |
153
| | | | | | | | | | | | | | | | | | | | | | | | |
| | | Carrying amount of loans accounted for pursuant to ASC 310-30 | |
| |
| | | For the years ended | |
| | | |
| | | December 31, 2013 | | | December 31, 2012 | | | | |
| | | | | | |
| | | Non-credit | | | Credit | | | | | | Non-credit | | | Credit | | | | |
| | | | | | |
| | | impaired | | | impaired | | | | | | impaired | | | impaired | | | | |
| | | | | | |
| (In thousands) | | loans | | | loans | | | Total | | | loans | | | loans | | | Total | |
| |
| | | | | | |
Beginning balance | | $ | 3,051,964 | | | $ | 439,795 | | | $ | 3,491,759 | | | $ | 3,446,451 | | | $ | 590,020 | | | $ | 4,036,471 | |
| | | | | | |
Accretion | | | 268,005 | | | | 11,703 | | | | 279,708 | | | | 258,901 | | | | 21,695 | | | | 280,596 | |
| | | | | | |
Collections and charge offs | | | (810,894) | | | | (132,626) | | | | (943,520) | | | | (653,388) | | | | (171,920) | | | | (825,308) | |
| |
| | | | | | |
Ending balance | | $ | 2,509,075 | | | $ | 318,872 | | | $ | 2,827,947 | | | $ | 3,051,964 | | | $ | 439,795 | | | $ | 3,491,759 | |
| | | | | | |
Allowance for loan losses | | | | | | | | | | | | | | | | | | | | | | | | |
| | | | | | |
ASC 310-30 covered loans | | | (57,594) | | | | (36,321) | | | | (93,915) | | | | (48,365) | | | | (47,042) | | | | (95,407) | |
| |
| | | | | | |
Ending balance, net of ALLL | | $ | 2,451,481 | | | $ | 282,551 | | | $ | 2,734,032 | | | $ | 3,003,599 | | | $ | 392,753 | | | $ | 3,396,352 | |
| |
The Corporation accounts for lines of credit with revolving privileges under the accounting guidance of ASC Subtopic 310-20, which requires that any differences between the contractually required loans payment receivable in excess of the initial investment in the loans be accreted into interest income over the life of the loans, if the loan is accruing interest. Covered loans accounted for under ASC Subtopic 310-20 amounted to $0.2 billion at December 31, 2013 (2012 - $0.3 billion).
154
Note 10 – Allowance for loan losses
The Corporation’s assessment of the allowance for loan losses is determined in accordance with accounting guidance, specifically loss contingencies guidance in ASC Subtopic 450-20 (general reserve) and loan impairment guidance in ASC Section 310-10-35 (specific reserve).
The accounting guidance provides for the recognition of a loss allowance for groups of homogeneous loans. The determination for general reserves of the allowance for loan losses includes the following principal factors:
| | — | | Base net loss rates, which are based on the moving average of annualized net loss rates computed over a 3-year historical loss period for the commercial and construction loan portfolios, and an 18-month period for the consumer and mortgage loan portfolios. The base net loss rates are applied by loan type and by legal entity. |
| | — | | Recent loss trend adjustment, which replaces the base loss rate with a 12-month average loss rate for the commercial, construction and legacy loan portfolios and 6-month average loss rate for the consumer and mortgage loan portfolios, when these trends are higher than the respective base loss rates, up to a determined cap in the case of consumer and mortgage loan portfolios. The objective of this adjustment is to allow for a more recent loss trend to be captured and reflected in the ALLL estimation process, while limiting excessive pro-cyclicality on changing economic periods using caps for the consumer and mortgage portfolios given the shorter six month look back window. These caps are calibrated annually at the end of each year and consistently applied until the next annual review. As part of the periodic review of the adequacy of the ALLL models and related assumptions, management monitors and reviews the loan segments for which the caps are being triggered in order to assess the reasonability of the cap in light of the risk profile of the portfolio and current credit and loss trends. Upon the completion of these qualitative reviews, management may make reserve adjustments that may partially or fully override the effect of the caps, if warranted. The caps are determined by measuring historic periods in which the recent loss trend adjustment rates were higher than the base loss rates and setting the cap at a percentile of the historic trend loss rates. |
For the period ended December 31, 2013, the recent loss trend adjustment caps for the consumer and mortgage portfolios were triggered in only one portfolio segment within the Puerto Rico consumer portfolio. Management assessed the impact of the applicable cap through a review of qualitative factors that specifically considered the drivers of recent loss trends and changes to the portfolio composition. The related effect of the aforementioned cap was immaterial for the overall level of the Allowance for Loan and Lease Losses for the Puerto Rico consumer portfolio.
For the period ended December 31, 2012, the recent loss trend adjustment caps for the consumer and mortgage portfolios were triggered in three consumer portfolio segments and one mortgage portfolio segment in the Puerto Rico region, and three consumer portfolio segments in the US region. Management assessed the adequacy of the applicable caps through a review of qualitative factors and recorded a $4 million qualitative offsetting adjustment that reversed the effect of the cap on the overall level of the Allowance for Loan and Lease Losses for the Puerto Rico mortgage portfolio. This offsetting adjustment considered the aforementioned review of qualitative factors, specifically, the 2012 revision to the Corporation’s charge-off policy that resulted in higher loss trends for this portfolio. The related effect of the aforementioned Puerto Rico and US region caps was immaterial for the overall level of the Allowance for Loan and Lease Losses for the corresponding portfolios.
At December 31, 2012, the impact of the use of recent loss trend adjustment caps on the overall level of Allowance for Loan and Lease Losses for the commercial portfolio was immaterial. The use of recent loss trend adjustment caps in the commercial portfolio was eliminated in the second quarter of 2013.
For the period ended December 31, 2013, 27% (2012 - 32%) of the ALLL for BPPR non-covered loan portfolios utilized the recent loss trend adjustment instead of the base loss. The effect of replacing the base loss with the recent loss trend adjustment was mainly concentrated in the commercial multi-family, leasing, and auto loan portfolios for 2013, and in the commercial multi-family, commercial and industrial, construction, credit cards, and personal loan portfolios for 2012.
For the period ended December 31, 2013, 29% (2012 – 8%) of the ALLL for BPNA loan portfolios utilized the recent loss trend adjustment instead of the base loss. The effect of replacing the base loss with the recent loss trend adjustment was mainly concentrated in the commercial multi-family, commercial real estate non-owner occupied, commercial and industrial and legacy loan portfolios for 2013, and in the construction and legacy loan portfolios for 2012.
| | — | | Environmental factors, which include credit and macroeconomic indicators such as unemployment rate, economic activity index and delinquency rates, were adopted to account for current market conditions that are likely to cause estimated credit losses to differ from historical losses. The Corporation reflects the effect of these environmental factors on each loan group as an adjustment that, as appropriate, increases or decreases the historical loss rate applied to each group. Environmental factors provide updated perspective on credit and economic conditions. Regression analysis was used to select these indicators and quantify the effect on the general reserve of the allowance for loan losses. |
During the second quarter of 2013, management enhanced the estimation process for evaluating the adequacy of the general reserve component of the allowance for loan losses. The enhancements to the ALLL methodology, which is described in the paragraphs below, was implemented as of June 30, 2013 and resulted in a net increase to the allowance for loan losses of $11.8 million for the non-covered portfolio and $7.5 million for the covered portfolio.
Management made the following principal changes to the methodology during the second quarter of 2013:
| | — | | Incorporated risk ratings to establish a more granular stratification of the commercial, construction and legacy loan portfolios to enhance the homogeneity of the loan classes. Prior to the second quarter enhancements, the Corporation’s loan segmentation was based on product type, line of business and legal entity. During the second quarter of 2013, lines of business were simplified and a regulatory classification level was added. These changes increased the homogeneity of each portfolio and captured the higher potential for loan loss in the criticized and substandard accruing categories. |
155
| | These refinements resulted in a decrease to the allowance for loan losses of $42.9 million at June 30, 2013, which consisted of a $35.7 million decrease in the non-covered BPPR segment and a $7.2 million reduction in the BPNA segment. |
| | — | | Recalibration and enhancements of the environmental factors adjustment. The environmental factor adjustments are developed by performing regression analyses on selected credit and economic indicators for each applicable loan segment. Prior to the second quarter enhancements, these adjustments were applied in the form of a set of multipliers and weights assigned to credit and economic indicators. During the second quarter of 2013, the environmental factor models used to account for changes in current credit and macroeconomic conditions, were enhanced and recalibrated based on the latest applicable trends. Also, as part of these enhancements, environmental factors are directly applied to the adjusted base loss rates using regression models based on particular credit data for the segment and relevant economic factors. These enhancements results in a more precise adjustment by having recalibrated models with improved statistical analysis and eliminating the multiplier concept that ensures that environmental factors are sufficiently sensitive to changing economic conditions. |
The combined effect of the aforementioned changes to the environmental factors adjustment resulted in an increase to the allowance for loan losses of $52.5 million at June 30, 2013, of which $56.1 million relate to the non-covered BPPR segment, offset in part by a $3.6 million reduction in the BPNA segment.
There were additional enhancements to the allowance for loan losses methodology which accounted for an increase of $9.7 million at June 30, 2013 at the BPPR segment. These enhancements included the elimination of the use of a cap for the commercial recent loss adjustment (12-month average), the incorporation of a minimum general reserve assumption for the commercial, construction and legacy portfolios with minimal or zero loss history, and the application of the enhanced ALLL framework to the covered loan portfolio.
The following tables present the changes in the allowance for loan losses for the years ended December 31, 2013 and 2012.
| | | | | | | | | | | | | | | | | | | | | | | | |
| For the year ended December 31, 2013 | |
| |
| Puerto Rico - Non-covered loans | |
| |
| | | | | | |
| (In thousands) | | Commercial | | | Construction | | | Mortgage | | | Leasing | | | Consumer | | | Total | |
| |
| | | | | | |
Allowance for credit losses: | | | | | | | | | | | | | | | | | | | | | | | | |
| | | | | | |
Beginning balance | | $ | 217,615 | | | $ | 5,862 | | | $ | 119,027 | | | $ | 2,894 | | | $ | 99,899 | | | $ | 445,297 | |
| | | | | | |
Provision (reversal of provision) | | | 157,433 | | | | (7,563) | | | | 258,541 | | | | 11,234 | | | | 128,239 | | | | 547,884 | |
| | | | | | |
Charge-offs | | | (112,266) | | | | (6,757) | | | | (49,418) | | | | (6,034) | | | | (113,616) | | | | (288,091) | |
| | | | | | |
Recoveries | | | 26,665 | | | | 15,399 | | | | 1,682 | | | | 2,528 | | | | 38,056 | | | | 84,330 | |
| | | | | | |
Net write-downs related to loans sold | | | (161,297) | | | | (1,846) | | | | (199,502) | | | | - | | | | - | | | | (362,645) | |
| |
| | | | | | |
Ending balance | | $ | 128,150 | | | $ | 5,095 | | | $ | 130,330 | | | $ | 10,622 | | | $ | 152,578 | | | $ | 426,775 | |
| |
|
| For the year ended December 31, 2013 | |
| |
| Puerto Rico - Covered loans | |
| |
| | | | | | |
| (In thousands) | | Commercial | | | Construction | | | Mortgage | | | Leasing | | | Consumer | | | Total | |
| |
| | | | | | |
Allowance for credit losses: | | | | | | | | | | | | | | | | | | | | | | | | |
| | | | | | |
Beginning balance | | $ | 72,060 | | | $ | 9,946 | | | $ | 20,914 | | | $ | - | | | $ | 5,986 | | | $ | 108,906 | |
| | | | | | |
Provision (reversal of provision) | | | (2,255) | | | | 43,653 | | | | 25,706 | | | | - | | | | 2,292 | | | | 69,396 | |
| | | | | | |
Charge-offs | | | (28,422) | | | | (39,730) | | | | (10,679) | | | | - | | | | (3,952) | | | | (82,783) | |
| | | | | | |
Recoveries | | | 815 | | | | 5,622 | | | | 65 | | | | - | | | | 71 | | | | 6,573 | |
| |
| | | | | | |
Ending balance | | $ | 42,198 | | | $ | 19,491 | | | $ | 36,006 | | | $ | - | | | $ | 4,397 | | | $ | 102,092 | |
| |
|
| For the year ended December 31, 2013 | |
| |
| U.S. Mainland | |
| |
| | | | | | |
| (In thousands) | | Commercial | | | Construction | | | Mortgage | | | Legacy | | | Consumer | | | Total | |
| |
156
| | | | | | | | | | | | | | | | | | | | | | | | |
| |
| | | | | | |
Allowance for credit losses: | | | | | | | | | | | | | | | | | | | | | | | | |
| | | | | | |
Beginning balance | | $ | 80,067 | | | $ | 1,567 | | | $ | 30,348 | | | $ | 33,102 | | | $ | 31,320 | | | $ | 176,404 | |
| | | | | | |
Provision (reversal of provision) | | | (9,867) | | | | (1,320) | | | | 4,054 | | | | (21,981) | | | | 14,397 | | | | (14,717) | |
| | | | | | |
Charge-offs | | | (56,070) | | | | - | | | | (10,156) | | | | (22,528) | | | | (25,520) | | | | (114,274) | |
| | | | | | |
Recoveries | | | 32,702 | | | | - | | | | 2,353 | | | | 25,111 | | | | 4,109 | | | | 64,275 | |
| |
| | | | | | |
Ending balance | | $ | 46,832 | | | $ | 247 | | | $ | 26,599 | | | $ | 13,704 | | | $ | 24,306 | | | $ | 111,688 | |
| |
| | | | | | | | | | | | | | | | | | | | | | | | | | | | |
| For the year ended December 31, 2013 | |
| |
| Popular, Inc. | |
| |
| | | | | | | |
| (In thousands) | | Commercial | | | Construction | | | Mortgage | | | Legacy | | | Leasing | | | Consumer | | | Total | |
| |
| | | | | | | |
Allowance for credit losses: | | | | | | | | | | | | | | | | | | | | | | | | | | | | |
| | | | | | | |
Beginning balance | | $ | 369,742 | | | $ | 17,375 | | | $ | 170,289 | | | $ | 33,102 | | | $ | 2,894 | | | $ | 137,205 | | | $ | 730,607 | |
| | | | | | | |
Provision (reversal of provision) | | | 145,311 | | | | 34,770 | | | | 288,301 | | | | (21,981) | | | | 11,234 | | | | 144,928 | | | | 602,563 | |
| | | | | | | |
Charge-offs | | | (196,758) | | | | (46,487) | | | | (70,253) | | | | (22,528) | | | | (6,034) | | | | (143,088) | | | | (485,148) | |
| | | | | | | |
Recoveries | | | 60,182 | | | | 21,021 | | | | 4,100 | | | | 25,111 | | | | 2,528 | | | | 42,236 | | | | 155,178 | |
| | | | | | | |
Net write-down related to loans sold | | | (161,297) | | | | (1,846) | | | | (199,502) | | | | - | | | | - | | | | - | | | | (362,645) | |
| |
| | | | | | | |
Ending balance | | $ | 217,180 | | | $ | 24,833 | | | $ | 192,935 | | | $ | 13,704 | | | $ | 10,622 | | | $ | 181,281 | | | $ | 640,555 | |
| |
| | | | | | | | | | | | | | | | | | | | | | | | |
| For the year ended December 31, 2012 | |
| |
| Puerto Rico - Non-covered loans | |
| |
| | | | | | |
| (In thousands) | | Commercial | | | Construction | | | Mortgage | | | Leasing | | | Consumer | | | Total | |
| |
| | | | | | |
Allowance for credit losses: | | | | | | | | | | | | | | | | | | | | | | | | |
| | | | | | |
Beginning balance | | $ | 255,453 | | | $ | 5,850 | | | $ | 72,322 | | | $ | 4,651 | | | $ | 115,126 | | | $ | 453,402 | |
| | | | | | |
Provision (reversal of provision) | | | 106,802 | | | | (2,271) | | | | 103,482 | | | | (814) | | | | 74,868 | | | | 282,067 | |
| | | | | | |
Charge-offs | | | (185,653) | | | | (3,910) | | | | (59,286) | | | | (4,680) | | | | (120,658) | | | | (374,187) | |
| | | | | | |
Recoveries | | | 41,013 | | | | 6,193 | | | | 2,509 | | | | 3,737 | | | | 30,563 | | | | 84,015 | |
| |
| | | | | | |
Ending balance | | $ | 217,615 | | | $ | 5,862 | | | $ | 119,027 | | | $ | 2,894 | | | $ | 99,899 | | | $ | 445,297 | |
| |
|
| For the year ended December 31, 2012 | |
| |
| Puerto Rico - Covered Loans | |
| |
| | | | | | |
| (In thousands) | | Commercial | | | Construction | | | Mortgage | | | Leasing | | | Consumer | | | Total | |
| |
| | | | | | |
Allowance for credit losses: | | | | | | | | | | | | | | | | | | | | | | | | |
| | | | | | |
Beginning balance | | $ | 94,472 | | | $ | 20,435 | | | $ | 5,310 | | | $ | - | | | $ | 4,728 | | | $ | 124,945 | |
| | | | | | |
Provision | | | 23,847 | | | | 20,006 | | | | 21,513 | | | | - | | | | 9,473 | | | | 74,839 | |
| | | | | | |
Charge-offs | | | (46,290) | | | | (30,556) | | | | (5,909) | | | | - | | | | (8,225) | | | | (90,980) | |
| | | | | | |
Recoveries | | | 31 | | | | 61 | | | | - | | | | - | | | | 10 | | | | 102 | |
| |
| | | | | | |
Ending balance | | $ | 72,060 | | | $ | 9,946 | | | $ | 20,914 | | | $ | - | | | $ | 5,986 | | | $ | 108,906 | |
| |
| | | | | | | | | | | | | | | | | | | | | | | | |
| For the year ended December 31, 2012 | |
| |
| U.S. Mainland | |
| |
| | | | | | |
| (In thousands) | | Commercial | | | Construction | | | Mortgage | | | Legacy | | | Consumer | | | Total | |
| |
| | | | | | |
Allowance for credit losses: | | | | | | | | | | | | | | | | | | | | | | | | |
| | | | | | |
Beginning balance | | $ | 113,979 | | | $ | 2,631 | | | $ | 29,939 | | | $ | 46,228 | | | $ | 44,184 | | | $ | 236,961 | |
| | | | | | |
Provision (reversal of provision) | | | 10,775 | | | | (664) | | | | 15,572 | | | | 3,212 | | | | 23,140 | | | | 52,035 | |
| | | | | | |
Charge-offs | | | (69,364) | | | | (1,659) | | | | (16,708) | | | | (36,529) | | | | (41,045) | | | | (165,305) | |
| | | | | | |
Recoveries | | | 24,711 | | | | 1,259 | | | | 1,545 | | | | 20,191 | | | | 5,041 | | | | 52,747 | |
| | | | | | |
Net (write-down) recovery related to loans transferred to LHFS | | | (34) | | | | - | | | | - | | | | - | | | | - | | | | (34) | |
| |
| | | | | | |
Ending balance | | $ | 80,067 | | | $ | 1,567 | | | $ | 30,348 | | | $ | 33,102 | | | $ | 31,320 | | | $ | 176,404 | |
| |
|
| For the year ended December 31, 2012 |
|
| Popular, Inc. |
|
157
| | | | | | | | | | | | | | | | | | | | | | | | | | | | |
| (In thousands) | | Commercial | | | Construction | | | Mortgage | | | Legacy | | | Leasing | | | Consumer | | | Total | |
| |
| | | | | | | |
Allowance for credit losses: | | | | | | | | | | | | | | | | | | | | | | | | | | | | |
| | | | | | | |
Beginning balance | | $ | 463,904 | | | $ | 28,916 | | | $ | 107,571 | | | $ | 46,228 | | | $ | 4,651 | | | $ | 164,038 | | | $ | 815,308 | |
| | | | | | | |
Provision (reversal of provision) | | | 141,424 | | | | 17,071 | | | | 140,567 | | | | 3,212 | | | | (814) | | | | 107,481 | | | | 408,941 | |
| | | | | | | |
Charge-offs | | | (301,307) | | | | (36,125) | | | | (81,903) | | | | (36,529) | | | | (4,680) | | | | (169,928) | | | | (630,472) | |
| | | | | | | |
Recoveries | | | 65,755 | | | | 7,513 | | | | 4,054 | | | | 20,191 | | | | 3,737 | | | | 35,614 | | | | 136,864 | |
| | | | | | | |
Net (write-down) recovery related to loans transferred to LHFS | | | (34) | | | | - | | | | - | | | | - | | | | - | | | | - | | | | (34) | |
| |
| | | | | | | |
Ending balance | | $ | 369,742 | | | $ | 17,375 | | | $ | 170,289 | | | $ | 33,102 | | | $ | 2,894 | | | $ | 137,205 | | | $ | 730,607 | |
| |
The following table provides the activity in the allowance for loan losses related to covered loans accounted for pursuant to ASC Subtopic 310-30.
| | | | | | | | |
| | | ASC 310-30 Covered loans | |
| | | | |
| |
| | | For the years ended | |
| | | | |
| | |
| (In thousands) | | December 31, 2013 | | | December 31, 2012 | |
| |
| | |
Balance at beginning of period | | | $ 95,407 | | | | $ 83,477 | |
| | |
Provision for loan losses | | | 58,858 | | | | 59,052 | |
| | |
Net charge-offs | | | (60,350) | | | | (47,122) | |
| |
| | |
Balance at end of period | | | $ 93,915 | | | | $ 95,407 | |
| |
The following tables present information at December 31, 2013 and December 31, 2012 regarding loan ending balances and the allowance for loan losses by portfolio segment and whether such loans and the allowance pertains to loans individually or collectively evaluated for impairment.
| | | | | | | | | | | | | | | | | | | | | | | | |
| At December 31, 2013 | |
| |
| Puerto Rico | |
| |
| | | | | | |
| (In thousands) | | Commercial | | | Construction | | | Mortgage | | | Leasing | | | Consumer | | | Total | |
| |
| | | | | | |
Allowance for credit losses: | | | | | | | | | | | | | | | | | | | | | | | | |
| | | | | | |
Specific ALLL non-covered loans | | $ | 16,409 | | | $ | 177 | | | $ | 38,034 | | | $ | 1,053 | | | $ | 29,920 | | | $ | 85,593 | |
| | | | | | |
General ALLL non-covered loans | | | 111,741 | | | | 4,918 | | | | 92,296 | | | | 9,569 | | | | 122,658 | | | | 341,182 | |
| |
| | | | | | |
ALLL - non-covered loans | | | 128,150 | | | | 5,095 | | | | 130,330 | | | | 10,622 | | | | 152,578 | | | | 426,775 | |
| |
| | | | | | |
Specific ALLL covered loans | | | 153 | | | | 140 | | | | - | | | | - | | | | - | | | | 293 | |
| | | | | | |
General ALLL covered loans | | | 42,045 | | | | 19,351 | | | | 36,006 | | | | - | | | | 4,397 | | | | 101,799 | |
| |
| | | | | | |
ALLL - covered loans | | | 42,198 | | | | 19,491 | | | | 36,006 | | | | - | | | | 4,397 | | | | 102,092 | |
| |
| | | | | | |
Total ALLL | | $ | 170,348 | | | $ | 24,586 | | | $ | 166,336 | | | $ | 10,622 | | | $ | 156,975 | | | $ | 528,867 | |
| |
| | | | | | |
Loans held-in-portfolio: | | | | | | | | | | | | | | | | | | | | | | | | |
| | | | | | |
Impaired non-covered loans | | $ | 245,380 | | | $ | 16,823 | | | $ | 399,347 | | | $ | 2,893 | | | $ | 125,342 | | | $ | 789,785 | |
| | | | | | |
Non-covered loans held-in-portfolio excluding impaired loans | | | 6,220,210 | | | | 144,348 | | | | 5,001,332 | | | | 540,868 | | | | 3,191,296 | | | | 15,098,054 | |
| |
| | | | | | |
Non-covered loans held-in-portfolio | | | 6,465,590 | | | | 161,171 | | | | 5,400,679 | | | | 543,761 | | | | 3,316,638 | | | | 15,887,839 | |
| |
| | | | | | |
Impaired covered loans | | | 20,945 | | | | - | | | | - | | | | - | | | | - | | | | 20,945 | |
| | | | | | |
Covered loans held-in-portfolio excluding impaired loans | | | 1,791,859 | | | | 190,127 | | | | 934,373 | | | | - | | | | 47,123 | | | | 2,963,482 | |
| |
| | | | | | |
Covered loans held-in-portfolio | | | 1,812,804 | | | | 190,127 | | | | 934,373 | | | | - | | | | 47,123 | | | | 2,984,427 | |
| |
| | | | | | |
Total loans held-in-portfolio | | $ | 8,278,394 | | | $ | 351,298 | | | $ | 6,335,052 | | | $ | 543,761 | | | $ | 3,363,761 | | | $ | 18,872,266 | |
| |
| | | | | | | | | | | | | | | | | | | | | | | | |
| At December 31, 2013 | |
| |
| U.S. Mainland | |
| |
| | | | | | |
| (In thousands) | | Commercial | | | Construction | | | Mortgage | | | Legacy | | | Consumer | | | Total | |
| |
| | | | | | |
Allowance for credit losses: | | | | | | | | | | | | | | | | | | | | | | | | |
| | | | | | |
Specific ALLL | | $
| -
|
| | $
| -
|
| | $ | 17,633 | | | $
| -
|
| | $ | 280 | | | $ | 17,913 | |
158
| | | | | | | | | | | | | | | | | | | | | | | | |
| | | | | | |
General ALLL | | | 46,832 | | | | 247 | | | | 8,966 | | | | 13,704 | | | | 24,026 | | | | 93,775 | |
| |
| | | | | | |
Total ALLL | | $ | 46,832 | | | $ | 247 | | | $ | 26,599 | | | $ | 13,704 | | | $ | 24,306 | | | $ | 111,688 | |
| |
| | | | | | |
Loans held-in-portfolio: | | | | | | | | | | | | | | | | | | | | | | | | |
| | | | | | |
Impaired loans | | $ | 52,136 | | | $ | 5,663 | | | $ | 52,726 | | | $ | 6,045 | | | $ | 2,361 | | | $ | 118,931 | |
| | | | | | |
Loans held-in-portfolio, excluding impaired loans | | | 3,519,459 | | | | 39,250 | | | | 1,228,071 | | | | 205,090 | | | | 613,227 | | | | 5,605,097 | |
| |
| | | | | | |
Total loans held-in-portfolio | | $ | 3,571,595 | | | $ | 44,913 | | | $ | 1,280,797 | | | $ | 211,135 | | | $ | 615,588 | | | $ | 5,724,028 | |
| |
| | | | | | | | | | | | | | | | | | | | | | | | | | | | |
| At December 31, 2013 | |
| |
| Popular, Inc. | |
| |
| | | | | | | |
| (In thousands) | | Commercial | | | Construction | | | Mortgage | | | Legacy | | | Leasing | | | Consumer | | | Total | |
| |
| | | | | | | |
Allowance for credit losses: | | | | | | | | | | | | | | | | | | | | | | | | | | | | |
| | | | | | | |
Specific ALLL non-covered loans | | $ | 16,409 | | | $ | 177 | | | $ | 55,667 | | | $ | - | | | $ | 1,053 | | | $ | 30,200 | | | $ | 103,506 | |
| | | | | | | |
General ALLL non-covered loans | | | 158,573 | | | | 5,165 | | | | 101,262 | | | | 13,704 | | | | 9,569 | | | | 146,684 | | | | 434,957 | |
| |
| | | | | | | |
ALLL - non-covered loans | | | 174,982 | | | | 5,342 | | | | 156,929 | | | | 13,704 | | | | 10,622 | | | | 176,884 | | | | 538,463 | |
| |
| | | | | | | |
Specific ALLL covered loans | | | 153 | | | | 140 | | | | - | | | | - | | | | - | | | | - | | | | 293 | |
| | | | | | | |
General ALLL covered loans | | | 42,045 | | | | 19,351 | | | | 36,006 | | | | - | | | | - | | | | 4,397 | | | | 101,799 | |
| |
| | | | | | | |
ALLL - covered loans | | | 42,198 | | | | 19,491 | | | | 36,006 | | | | - | | | | - | | | | 4,397 | | | | 102,092 | |
| |
| | | | | | | |
Total ALLL | | $ | 217,180 | | | $ | 24,833 | | | $ | 192,935 | | | $ | 13,704 | | | $ | 10,622 | | | $ | 181,281 | | | $ | 640,555 | |
| |
| | | | | | | |
Loans held-in-portfolio: | | | | | | | | | | | | | | | | | | | | | | | | | | | | |
| | | | | | | |
Impaired non-covered loans | | $ | 297,516 | | | $ | 22,486 | | | $ | 452,073 | | | $ | 6,045 | | | $ | 2,893 | | | $ | 127,703 | | | $ | 908,716 | |
| | | | | | | |
Non-covered loans held-in-portfolio excluding impaired loans | | | 9,739,669 | | | | 183,598 | | | | 6,229,403 | | | | 205,090 | | | | 540,868 | | | | 3,804,523 | | | | 20,703,151 | |
| |
| | | | | | | |
Non-covered loans held-in-portfolio | | | 10,037,185 | | | | 206,084 | | | | 6,681,476 | | | | 211,135 | | | | 543,761 | | | | 3,932,226 | | | | 21,611,867 | |
| |
| | | | | | | |
Impaired covered loans | | | 20,945 | | | | - | | | | - | | | | - | | | | - | | | | - | | | | 20,945 | |
| | | | | | | |
Covered loans held-in-portfolio excluding impaired loans | | | 1,791,859 | | | | 190,127 | | | | 934,373 | | | | - | | | | - | | | | 47,123 | | | | 2,963,482 | |
| |
| | | | | | | |
Covered loans held-in-portfolio | | | 1,812,804 | | | | 190,127 | | | | 934,373 | | | | - | | | | - | | | | 47,123 | | | | 2,984,427 | |
| |
| | | | | | | |
Total loans held-in-portfolio | | $ | 11,849,989 | | | $ | 396,211 | | | $ | 7,615,849 | | | $ | 211,135 | | | $ | 543,761 | | | $ | 3,979,349 | | | $ | 24,596,294 | |
| |
| | | | | | | | | | | | | | | | | | | | | | | | |
| At December 31, 2012 | |
| |
| Puerto Rico | |
| |
| | | | | | |
| (In thousands) | | Commercial | | | Construction | | | Mortgage | | | Leasing | | | Consumer | | | Total | |
| |
| | | | | | |
Allowance for credit losses: | | | | | | | | | | | | | | | | | | | | | | | | |
| | | | | | |
Specific ALLL non-covered loans | | $ | 17,323 | | | $ | 120 | | | $ | 58,572 | | | $ | 1,066 | | | $ | 17,779 | | | $ | 94,860 | |
| | | | | | |
General ALLL non-covered loans | | | 200,292 | | | | 5,742 | | | | 60,455 | | | | 1,828 | | | | 82,120 | | | | 350,437 | |
| |
| | | | | | |
ALLL - non-covered loans | | | 217,615 | | | | 5,862 | | | | 119,027 | | | | 2,894 | | | | 99,899 | | | | 445,297 | |
| |
| | | | | | |
Specific ALLL covered loans | | | 8,505 | | | | - | | | | - | | | | - | | | | - | | | | 8,505 | |
| | | | | | |
General ALLL covered loans | | | 63,555 | | | | 9,946 | | | | 20,914 | | | | - | | | | 5,986 | | | | 100,401 | |
| |
| | | | | | |
ALLL - covered loans | | | 72,060 | | | | 9,946 | | | | 20,914 | | | | - | | | | 5,986 | | | | 108,906 | |
| |
| | | | | | |
Total ALLL | | $ | 289,675 | | | $ | 15,808 | | | $ | 139,941 | | | $ | 2,894 | | | $ | 105,885 | | | $ | 554,203 | |
| |
| | | | | | |
Loans held-in-portfolio: | | | | | | | | | | | | | | | | | | | | | | | | |
| | | | | | |
Impaired non-covered loans | | $ | 447,779 | | | $ | 35,849 | | | $ | 557,137 | | | $ | 4,881 | | | $ | 130,663 | | | $ | 1,176,309 | |
| | | | | | |
Non-covered loans held-in-portfolio excluding impaired loans | | | 5,848,505 | | | | 176,418 | | | | 4,391,787 | | | | 535,642 | | | | 3,103,666 | | | | 14,056,018 | |
| |
| | | | | | |
Non-covered loans held-in-portfolio | | | 6,296,284 | | | | 212,267 | | | | 4,948,924 | | | | 540,523 | | | | 3,234,329 | | | | 15,232,327 | |
| |
| | | | | | |
Impaired covered loans | | | 109,241 | | | | - | | | | - | | | | - | | | | - | | | | 109,241 | |
| | | | | | |
Covered loans held-in-portfolio excluding impaired loans | | | 2,135,406 | | | | 361,396 | | | | 1,076,730 | | | | - | | | | 73,199 | | | | 3,646,731 | |
| |
| | | | | | |
Covered loans held-in-portfolio | | | 2,244,647 | | | | 361,396 | | | | 1,076,730 | | | | - | | | | 73,199 | | | | 3,755,972 | |
| |
| | | | | | |
Total loans held-in-portfolio | | $ | 8,540,931 | | | $ | 573,663 | | | $ | 6,025,654 | | | $ | 540,523 | | | $ | 3,307,528 | | | $ | 18,988,299 | |
| |
159
| | | | | | | | | | | | | | | | | | | | | | | | |
| |
| U.S. Mainland | |
| |
| | | | | | |
| (In thousands) | | Commercial | | | Construction | | | Mortgage | | | Legacy | | | Consumer | | | Total | |
| |
| | | | | | |
Allowance for credit losses: | | | | | | | | | | | | | | | | | | | | | | | | |
| | | | | | |
Specific ALLL | | $ | 25 | | | $ | - | | | $ | 16,095 | | | $ | - | | | $ | 107 | | | $ | 16,227 | |
| | | | | | |
General ALLL | | | 80,042 | | | | 1,567 | | | | 14,253 | | | | 33,102 | | | | 31,213 | | | | 160,177 | |
| |
| | | | | | |
Total ALLL | | $ | 80,067 | | | $ | 1,567 | | | $ | 30,348 | | | $ | 33,102 | | | $ | 31,320 | | | $ | 176,404 | |
| |
| | | | | | |
Loans held-in-portfolio: | | | | | | | | | | | | | | | | | | | | | | | | |
| | | | | | |
Impaired loans | | $ | 79,885 | | | $ | 5,960 | | | $ | 54,093 | | | $ | 18,744 | | | $ | 2,714 | | | $ | 161,396 | |
| | | | | | |
Loans held-in-portfolio, excluding impaired loans | | | 3,482,033 | | | | 34,630 | | | | 1,075,490 | | | | 365,473 | | | | 631,843 | | | | 5,589,469 | |
| |
| | | | | | |
Total loans held-in-portfolio | | $ | 3,561,918 | | | $ | 40,590 | | | $ | 1,129,583 | | | $ | 384,217 | | | $ | 634,557 | | | $ | 5,750,865 | |
| |
| | | | | | | | | | | | | | | | | | | | | | | | | | | | |
| At December 31, 2012 | |
| |
| Popular, Inc. | |
| |
| | | | | | | |
| (In thousands) | | Commercial | | | Construction | | | Mortgage | | | Legacy | | | Leasing | | | Consumer | | | Total | |
| |
| | | | | | | |
Allowance for credit losses: | | | | | | | | | | | | | | | | | | | | | | | | | | | | |
| | | | | | | |
Specific ALLL non-covered loans | | $ | 17,348 | | | $ | 120 | | | $ | 74,667 | | | $ | - | | | $ | 1,066 | | | $ | 17,886 | | | $ | 111,087 | |
| | | | | | | |
General ALLL non-covered loans | | | 280,334 | | | | 7,309 | | | | 74,708 | | | | 33,102 | | | | 1,828 | | | | 113,333 | | | | 510,614 | |
| |
| | | | | | | |
ALLL - non-covered loans | | | 297,682 | | | | 7,429 | | | | 149,375 | | | | 33,102 | | | | 2,894 | | | | 131,219 | | | | 621,701 | |
| |
| | | | | | | |
Specific ALLL covered loans | | | 8,505 | | | | - | | | | - | | | | - | | | | - | | | | - | | | | 8,505 | |
| | | | | | | |
General ALLL covered loans | | | 63,555 | | | | 9,946 | | | | 20,914 | | | | - | | | | - | | | | 5,986 | | | | 100,401 | |
| |
| | | | | | | |
ALLL - covered loans | | | 72,060 | | | | 9,946 | | | | 20,914 | | | | - | | | | - | | | | 5,986 | | | | 108,906 | |
| |
| | | | | | | |
Total ALLL | | $ | 369,742 | | | $ | 17,375 | | | $ | 170,289 | | | $ | 33,102 | | | $ | 2,894 | | | $ | 137,205 | | | $ | 730,607 | |
| |
| | | | | | | |
Loans held-in-portfolio: | | | | | | | | | | | | | | | | | | | | | | | | | | | | |
| | | | | | | |
Impaired non-covered loans | | $ | 527,664 | | | $ | 41,809 | | | $ | 611,230 | | | $ | 18,744 | | | $ | 4,881 | | | $ | 133,377 | | | $ | 1,337,705 | |
| | | | | | | |
Non-covered loans held-in-portfolio excluding impaired loans | | | 9,330,538 | | | | 211,048 | | | | 5,467,277 | | | | 365,473 | | | | 535,642 | | | | 3,735,509 | | | | 19,645,487 | |
| |
| | | | | | | |
Non-covered loans held-in-portfolio | | | 9,858,202 | | | | 252,857 | | | | 6,078,507 | | | | 384,217 | | | | 540,523 | | | | 3,868,886 | | | | 20,983,192 | |
| |
| | | | | | | |
Impaired covered loans | | | 109,241 | | | | - | | | | - | | | | - | | | | - | | | | - | | | | 109,241 | |
| | | | | | | |
Covered loans held-in-portfolio excluding impaired loans | | | 2,135,406 | | | | 361,396 | | | | 1,076,730 | | | | - | | | | - | | | | 73,199 | | | | 3,646,731 | |
| |
| | | | | | | |
Covered loans held-in-portfolio | | | 2,244,647 | | | | 361,396 | | | | 1,076,730 | | | | - | | | | - | | | | 73,199 | | | | 3,755,972 | |
| |
| | | | | | | |
Total loans held-in-portfolio | | $ | 12,102,849 | | | $ | 614,253 | | | $ | 7,155,237 | | | $ | 384,217 | | | $ | 540,523 | | | $ | 3,942,085 | | | $ | 24,739,164 | |
| |
Impaired loans
The following tables present loans individually evaluated for impairment at December 31, 2013 and December 31, 2012.
| | | | | | | | | | | | | | | | | | | | | | | | | | | | | | | | |
| December 31, 2013 | |
| |
| Puerto Rico | |
| |
| | | Impaired Loans – With an Allowance | | | Impaired Loans With No Allowance | | | Impaired Loans - Total | |
| (In thousands) | | Recorded investment | | | Unpaid principal balance | | | Related allowance | | | Recorded investment | | | Unpaid principal balance | | | Recorded investment | | | Unpaid principal balance | | | Related allowance | |
| |
Commercial multi-family | | $ | - | | | $ | - | | | $ | - | | | $ | 3,405 | | | $ | 6,942 | | | $ | 3,405 | | | $ | 6,942 | | | $ | - | |
Commercial real estate non-owner occupied | | | 19,120 | | | | 19,407 | | | | 2,368 | | | | 47,245 | | | | 55,397 | | | | 66,365 | | | | 74,804 | | | | 2,368 | |
Commercial real estate owner occupied | | | 55,826 | | | | 74,420 | | | | 6,473 | | | | 33,749 | | | | 47,545 | | | | 89,575 | | | | 121,965 | | | | 6,473 | |
Commercial and industrial | | | 30,370 | | | | 33,152 | | | | 7,568 | | | | 55,665 | | | | 68,141 | | | | 86,035 | | | | 101,293 | | | | 7,568 | |
Construction | | | 2,324 | | | | 9,047 | | | | 177 | | | | 14,499 | | | | 36,951 | | | | 16,823 | | | | 45,998 | | | | 177 | |
Mortgage | | | 358,437 | | | | 376,393 | | | | 38,034 | | | | 40,910 | | | | 45,181 | | | | 399,347 | | | | 421,574 | | | | 38,034 | |
Leasing | | | 2,893 | | | | 2,893 | | | | 1,053 | | | | - | | | | - | | | | 2,893 | | | | 2,893 | | | | 1,053 | |
Consumer: | | | | | | | | | | | | | | | | | | | | | | | | | | | | | | | | |
Credit cards | | | 45,015 | | | | 45,015 | | | | 8,344 | | | | - | | | | - | | | | 45,015 | | | | 45,015 | | | | 8,344 | |
Personal | | | 78,475 | | | | 78,475 | | | | 21,313 | | | | - | | | | - | | | | 78,475 | | | | 78,475 | | | | 21,313 | |
160
| | | | | | | | | | | | | | | | | | | | | | | | | | | | | | | | |
Auto | | | 1,354 | | | | 1,354 | | | | 171 | | | | - | | | | - | | | | 1,354 | | | | 1,354 | | | | 171 | |
Other | | | 498 | | | | 498 | | | | 92 | | | | - | | | | - | | | | 498 | | | | 498 | | | | 92 | |
Covered loans | | | 12,837 | | | | 17,538 | | | | 293 | | | | 8,108 | | | | 10,063 | | | | 20,945 | | | | 27,601 | | | | 293 | |
| |
Total Puerto Rico | | | $ 607,149 | | | | $ 658,192 | | | | $ 85,886 | | | | $ 203,581 | | | | $ 270,220 | | | | $ 810,730 | | | | $ 928,412 | | | | $ 85,886 | |
| |
| | | | | | | | | | | | | | | | | | | | | | | | | | | | | | | | |
| December 31, 2013 | |
| |
| U.S. mainland | |
| |
| | | Impaired Loans – With an Allowance | | | Impaired Loans With No Allowance | | | Impaired Loans - Total | |
| (In thousands) | | Recorded
investment | | | Unpaid
principal
balance | | | Related
allowance | | | Recorded
investment | | | Unpaid
principal
balance | | | Recorded
investment | | | Unpaid
principal
balance | | | Related
allowance | |
| |
Commercial multi-family | | $ | - | | | $ | - | | | $ | - | | | $ | 7,668 | | | $ | 10,870 | | | $ | 7,668 | | | $ | 10,870 | | | $ | - | |
Commercial real estate non-owner occupied | | | - | | | | - | | | | - | | | | 27,016 | | | | 37,393 | | | | 27,016 | | | | 37,393 | | | | - | |
Commercial real estate owner occupied | | | - | | | | - | | | | - | | | | 15,624 | | | | 19,910 | | | | 15,624 | | | | 19,910 | | | | - | |
Commercial and industrial | | | - | | | | - | | | | - | | | | 1,828 | | | | 1,828 | | | | 1,828 | | | | 1,828 | | | | - | |
Construction | | | - | | | | - | | | | - | | | | 5,663 | | | | 5,663 | | | | 5,663 | | | | 5,663 | | | | - | |
Mortgage | | | 46,192 | | | | 50,570 | | | | 17,633 | | | | 6,534 | | | | 8,513 | | | | 52,726 | | | | 59,083 | | | | 17,633 | |
Legacy | | | - | | | | - | | | | - | | | | 6,045 | | | | 8,715 | | | | 6,045 | | | | 8,715 | | | | - | |
Consumer: | | | | | | | | | | | | | | | | | | | | | | | | | | | | | | | | |
HELOCs | | | - | | | | - | | | | - | | | | 198 | | | | 198 | | | | 198 | | | | 198 | | | | - | |
Auto | | | - | | | | - | | | | - | | | | 88 | | | | 88 | | | | 88 | | | | 88 | | | | - | |
Other | | | 2,075 | | | | 2,075 | | | | 280 | | | | - | | | | - | | | | 2,075 | | | | 2,075 | | | | 280 | |
| |
Total U.S. mainland | | $ | 48,267 | | | $ | 52,645 | | | $ | 17,913 | | | $ | 70,664 | | | $ | 93,178 | | | $ | 118,931 | | | $ | 145,823 | | | $ | 17,913 | |
| |
| | | | | | | | | | | | | | | | | | | | | | | | | | | | | | | | |
| December 31, 2013 | |
| |
| Popular, Inc. | |
| |
| | | Impaired Loans – With an Allowance | | | Impaired Loans With No Allowance | | | Impaired Loans - Total | |
| (In thousands) | | Recorded
investment | | | Unpaid
principal
balance | | | Related
allowance | | | Recorded
investment | | | Unpaid
principal
balance | | | Recorded
investment | | | Unpaid
principal
balance | | | Related
allowance | |
| |
Commercial multi-family | | $ | - | | | $ | - | | | $ | - | | | $ | 11,073 | | | $ | 17,812 | | | $ | 11,073 | | | $ | 17,812 | | | $ | - | |
Commercial real estate non-owner occupied | | | 19,120 | | | | 19,407 | | | | 2,368 | | | | 74,261 | | | | 92,790 | | | | 93,381 | | | | 112,197 | | | | 2,368 | |
Commercial real estate owner occupied | | | 55,826 | | | | 74,420 | | | | 6,473 | | | | 49,373 | | | | 67,455 | | | | 105,199 | | | | 141,875 | | | | 6,473 | |
Commercial and industrial | | | 30,370 | | | | 33,152 | | | | 7,568 | | | | 57,493 | | | | 69,969 | | | | 87,863 | | | | 103,121 | | | | 7,568 | |
Construction | | | 2,324 | | | | 9,047 | | | | 177 | | | | 20,162 | | | | 42,614 | | | | 22,486 | | | | 51,661 | | | | 177 | |
Mortgage | | | 404,629 | | | | 426,963 | | | | 55,667 | | | | 47,444 | | | | 53,694 | | | | 452,073 | | | | 480,657 | | | | 55,667 | |
Legacy | | | - | | | | - | | | | - | | | | 6,045 | | | | 8,715 | | | | 6,045 | | | | 8,715 | | | | - | |
Leasing | | | 2,893 | | | | 2,893 | | | | 1,053 | | | | - | | | | - | | | | 2,893 | | | | 2,893 | | | | 1,053 | |
Consumer: | | | | | | | | | | | | | | | | | | | | | | | | | | | | | | | | |
Credit cards | | | 45,015 | | | | 45,015 | | | | 8,344 | | | | - | | | | - | | | | 45,015 | | | | 45,015 | | | | 8,344 | |
HELOCs | | | - | | | | - | | | | - | | | | 198 | | | | 198 | | | | 198 | | | | 198 | | | | - | |
Personal | | | 78,475 | | | | 78,475 | | | | 21,313 | | | | - | | | | - | | | | 78,475 | | | | 78,475 | | | | 21,313 | |
Auto | | | 1,354 | | | | 1,354 | | | | 171 | | | | 88 | | | | 88 | | | | 1,442 | | | | 1,442 | | | | 171 | |
Other | | | 2,573 | | | | 2,573 | | | | 372 | | | | - | | | | - | | | | 2,573 | | | | 2,573 | | | | 372 | |
Covered loans | | | 12,837 | | | | 17,538 | | | | 293 | | | | 8,108 | | | | 10,063 | | | | 20,945 | | | | 27,601 | | | | 293 | |
| |
Total Popular, Inc. | | $ | 655,416 | | | $ | 710,837 | | | $ | 103,799 | | | $ | 274,245 | | | $ | 363,398 | | | $ | 929,661 | | | $ | 1,074,235 | | | $ | 103,799 | |
| |
| | | | | | | | | | | | | | | | | | | | | | | | | | | | | | | | |
| December 31, 2012 | |
| |
| Puerto Rico | |
| |
| | | Impaired Loans – With an Allowance | | | Impaired Loans With No Allowance | | | Impaired Loans - Total | |
| (In thousands) | | Recorded
investment | | | Unpaid
principal
balance | | | Related
allowance | | | Recorded
investment | | | Unpaid
principal
balance | | | Recorded
investment | | | Unpaid
principal
balance | | | Related
allowance | |
| |
Commercial multi-family | | $ | 271 | | | $ | 288 | | | $ | 6 | | | $ | 13,080 | | | $ | 19,969 | | | $ | 13,351 | | | $ | 20,257 | | | $ | 6 | |
Commercial real estate non-owner occupied | | | 22,332 | | | | 25,671 | | | | 1,354 | | | | 55,320 | | | | 63,041 | | | | 77,652 | | | | 88,712 | | | | 1,354 | |
Commercial real estate owner occupied | | | 100,685 | | | | 149,342 | | | | 12,614 | | | | 121,476 | | | | 167,639 | | | | 222,161 | | | | 316,981 | | | | 12,614 | |
Commercial and industrial | | | 70,216 | | | | 85,508 | | | | 3,349 | | | | 64,399 | | | | 99,608 | | | | 134,615 | | | | 185,116 | | | | 3,349 | |
Construction | | | 1,865 | | | | 3,931 | | | | 120 | | | | 33,984 | | | | 70,572 | | | | 35,849 | | | | 74,503 | | | | 120 | |
Mortgage | | | 517,341 | | | | 539,171 | | | | 58,572 | | | | 39,796 | | | | 42,913 | | | | 557,137 | | | | 582,084 | | | | 58,572 | |
Leasing | | | 4,881 | | | | 4,881 | | | | 1,066 | | | | - | | | | - | | | | 4,881 | | | | 4,881 | | | | 1,066 | |
Consumer: | | | | | | | | | | | | | | | | | | | | | | | | | | | | | | | | |
Credit cards | | | 42,514 | | | | 42,514 | | | | 1,666 | | | | - | | | | - | | | | 42,514 | | | | 42,514 | | | | 1,666 | |
Personal | | | 86,884 | | | | 86,884 | | | | 16,022 | | | | - | | | | - | | | | 86,884 | | | | 86,884 | | | | 16,022 | |
Auto | | | 772 | | | | 772 | | | | 79 | | | | - | | | | - | | | | 772 | | | | 772 | | | | 79 | |
Other | | | 493 | | | | 493 | | | | 12 | | | | - | | | | - | | | | 493 | | | | 493 | | | | 12 | |
161
| | | | | | | | | | | | | | | | | | | | | | | | | | | | | | | | |
Covered loans | | | 64,762 | | | | 64,762 | | | | 8,505 | | | | 44,479 | | | | 44,479 | | | | 109,241 | | | | 109,241 | | | | 8,505 | |
| |
Total Puerto Rico | | $ | 913,016 | | | $ | 1,004,217 | | | $ | 103,365 | | | $ | 372,534 | | | $ | 508,221 | | | $ | 1,285,550 | | | $ | 1,512,438 | | | $ | 103,365 | |
| |
| | | | | | | | | | | | | | | | | | | | | | | | | | | | | | | | |
| December 31, 2012 | |
| |
| U.S. mainland | |
| |
| | | Impaired Loans – With an Allowance | | | Impaired Loans With No Allowance | | | Impaired Loans - Total | |
| (In thousands) | | Recorded
investment | | | Unpaid
principal
balance | | | Related
allowance | | | Recorded
investment | | | Unpaid
principal
balance | | | Recorded
investment | | | Unpaid
principal
balance | | | Related
allowance | |
| |
Commercial multi-family | | $ | 1,327 | | | $ | 1,479 | | | $ | 25 | | | $ | 6,316 | | | $ | 9,898 | | | $ | 7,643 | | | $ | 11,377 | | | $ | 25 | |
Commercial real estate non-owner occupied | | | - | | | | - | | | | - | | | | 45,815 | | | | 64,783 | | | | 45,815 | | | | 64,783 | | | | - | |
Commercial real estate owner occupied | | | - | | | | - | | | | - | | | | 20,369 | | | | 22,968 | | | | 20,369 | | | | 22,968 | | | | - | |
Commercial and industrial | | | - | | | | - | | | | - | | | | 6,058 | | | | 8,026 | | | | 6,058 | | | | 8,026 | | | | - | |
Construction | | | - | | | | - | | | | - | | | | 5,960 | | | | 5,960 | | | | 5,960 | | | | 5,960 | | | | - | |
Mortgage | | | 45,319 | | | | 46,484 | | | | 16,095 | | | | 8,774 | | | | 10,328 | | | | 54,093 | | | | 56,812 | | | | 16,095 | |
Legacy | | | - | | | | - | | | | - | | | | 18,744 | | | | 29,972 | | | | 18,744 | | | | 29,972 | | | | - | |
Consumer: | | | | | | | | | | | | | | | | | | | | | | | | | | | | | | | | |
HELOCs | | | 201 | | | | 201 | | | | 11 | | | | - | | | | - | | | | 201 | | | | 201 | | | | 11 | |
Auto | | | 91 | | | | 91 | | | | 2 | | | | - | | | | - | | | | 91 | | | | 91 | | | | 2 | |
Other | | | 2,422 | | | | 2,422 | | | | 94 | | | | - | | | | - | | | | 2,422 | | | | 2,422 | | | | 94 | |
| |
Total U.S. mainland | | $ | 49,360 | | | $ | 50,677 | | | $ | 16,227 | | | $ | 112,036 | | | $ | 151,935 | | | $ | 161,396 | | | $ | 202,612 | | | $ | 16,227 | |
| |
| | | | | | | | | | | | | | | | | | | | | | | | | | | | | | | | |
| December 31, 2012 | |
| |
| Popular, Inc. | |
| |
| | | Impaired Loans – With an Allowance | | | Impaired Loans With No Allowance | | | Impaired Loans - Total | |
| (In thousands) | | Recorded
investment | | | Unpaid
principal
balance | | | Related
allowance | | | Recorded
investment | | | Unpaid
principal
balance | | | Recorded
investment | | | Unpaid
principal
balance | | | Related
allowance | |
| |
Commercial multi-family | | $ | 1,598 | | | $ | 1,767 | | | $ | 31 | | | $ | 19,396 | | | $ | 29,867 | | | $ | 20,994 | | | $ | 31,634 | | | $ | 31 | |
Commercial real estate non-owner occupied | | | 22,332 | | | | 25,671 | | | | 1,354 | | | | 101,135 | | | | 127,824 | | | | 123,467 | | | | 153,495 | | | | 1,354 | |
Commercial real estate owner occupied | | | 100,685 | | | | 149,342 | | | | 12,614 | | | | 141,845 | | | | 190,607 | | | | 242,530 | | | | 339,949 | | | | 12,614 | |
Commercial and industrial | | | 70,216 | | | | 85,508 | | | | 3,349 | | | | 70,457 | | | | 107,634 | | | | 140,673 | | | | 193,142 | | | | 3,349 | |
Construction | | | 1,865 | | | | 3,931 | | | | 120 | | | | 39,944 | | | | 76,532 | | | | 41,809 | | | | 80,463 | | | | 120 | |
Mortgage | | | 562,660 | | | | 585,655 | | | | 74,667 | | | | 48,570 | | | | 53,241 | | | | 611,230 | | | | 638,896 | | | | 74,667 | |
Legacy | | | - | | | | - | | | | - | | | | 18,744 | | | | 29,972 | | | | 18,744 | | | | 29,972 | | | | - | |
Leasing | | | 4,881 | | | | 4,881 | | | | 1,066 | | | | - | | | | - | | | | 4,881 | | | | 4,881 | | | | 1,066 | |
Consumer: | | | | | | | | | | | | | | | | | | | | | | | | | | | | | | | | |
Credit cards | | | 42,514 | | | | 42,514 | | | | 1,666 | | | | - | | | | - | | | | 42,514 | | | | 42,514 | | | | 1,666 | |
HELOCs | | | 201 | | | | 201 | | | | 11 | | | | - | | | | - | | | | 201 | | | | 201 | | | | 11 | |
Personal | | | 86,884 | | | | 86,884 | | | | 16,022 | | | | - | | | | - | | | | 86,884 | | | | 86,884 | | | | 16,022 | |
Auto | | | 863 | | | | 863 | | | | 81 | | | | - | | | | - | | | | 863 | | | | 863 | | | | 81 | |
Other | | | 2,915 | | | | 2,915 | | | | 106 | | | | - | | | | - | | | | 2,915 | | | | 2,915 | | | | 106 | |
Covered loans | | | 64,762 | | | | 64,762 | | | | 8,505 | | | | 44,479 | | | | 44,479 | | | | 109,241 | | | | 109,241 | | | | 8,505 | |
| |
Total Popular, Inc. | | $ | 962,376 | | | $ | 1,054,894 | | | $ | 119,592 | | | $ | 484,570 | | | $ | 660,156 | | | $ | 1,446,946 | | | $ | 1,715,050 | | | $ | 119,592 | |
| |
The following table presents the average recorded investment and interest income recognized on impaired loans for the years ended December 31, 2013 and 2012.
| | | | | | | | | | | | | | | | | | | | | | | | |
| For the year ended December 31, 2013 | |
| |
| | | Puerto Rico | | | U.S. Mainland | | | Popular, Inc. | |
| (In thousands) | | Average
recorded
investment | | | Interest
income
recognized | | | Average
recorded
investment | | | Interest
income
recognized | | | Average
recorded
investment | | | Interest
income
recognized | |
| |
Commercial multi-family | | $ | 8,356 | | | $ | 259 | | | $ | 7,493 | | | $ | 120 | | | $ | 15,849 | | | $ | 379 | |
Commercial real estate non-owner occupied | | | 58,773 | | | | 2,225 | | | | 36,688 | | | | 223 | | | | 95,461 | | | | 2,448 | |
Commercial real estate owner occupied | | | 125,091 | | | | 2,956 | | | | 19,024 | | | | 150 | | | | 144,115 | | | | 3,106 | |
Commercial and industrial | | | 102,408 | | | | 4,206 | | | | 2,328 | | | | 15 | | | | 104,736 | | | | 4,221 | |
Construction | | | 31,491 | | | | - | | | | 5,821 | | | | - | | | | 37,312 | | | | - | |
Mortgage | | | 461,534 | | | | 25,610 | | | | 53,137 | | | | 1,955 | | | | 514,671 | | | | 27,565 | |
Legacy | | | - | | | | - | | | | 12,957 | | | | - | | | | 12,957 | | | | - | |
Leasing | | | 3,822 | | | | - | | | | - | | | | - | | | | 3,822 | | | | - | |
Consumer: | | | | | | | | | | | | | | | | | | | | | | | | |
Credit cards | | | 40,044 | | | | - | | | | - | | | | - | | | | 40,044 | | | | - | |
HELOCs | | | - | | | | - | | | | 199 | | | | - | | | | 199 | | | | - | |
162
| | | | | | | | | | | | | | | | | | | | | | | | |
Personal | | | 82,687 | | | | - | | | | - | | | | - | | | | 82,687 | | | | - | |
Auto | | | 1,003 | | | | - | | | | 89 | | | | - | | | | 1,092 | | | | - | |
Other | | | 417 | | | | - | | | | 2,260 | | | | - | | | | 2,677 | | | | - | |
Covered loans | | | 42,791 | | | | 1,245 | | | | - | | | | - | | | | 42,791 | | | | 1,245 | |
| |
Total Popular, Inc. | | $ | 958,417 | | | $ | 36,501 | | | $ | 139,996 | | | $ | 2,463 | | | $ | 1,098,413 | | | $ | 38,964 | |
| |
| | | | | | | | | | | | | | | | | | | | | | | | |
| For the year ended December 31, 2012 | |
| |
| | | Puerto Rico | | | U.S. Mainland | | | Popular, Inc. | |
| (In thousands) | | Average
recorded
investment | | | Interest
income
recognized | | | Average
recorded
investment | | | Interest
income
recognized | | | Average
recorded
investment | | | Interest
income
recognized | |
| |
Commercial multi-family | | $ | 14,737 | | | $ | - | | | $ | 9,012 | | | $ | 145 | | | $ | 23,749 | | | $ | 145 | |
Commercial real estate non-owner occupied | | | 64,308 | | | | 1,108 | | | | 58,688 | | | | 1,139 | | | | 122,996 | | | | 2,247 | |
Commercial real estate owner occupied | | | 202,783 | | | | 2,820 | | | | 32,436 | | | | 91 | | | | 235,219 | | | | 2,911 | |
Commercial and industrial | | | 125,373 | | | | 2,267 | | | | 18,344 | | | | 37 | | | | 143,717 | | | | 2,304 | |
Construction | | | 44,276 | | | | 278 | | | | 17,039 | | | | - | | | | 61,315 | | | | 278 | |
Mortgage | | | 450,284 | | | | 25,534 | | | | 52,909 | | | | 1,989 | | | | 503,193 | | | | 27,523 | |
Legacy | | | - | | | | - | | | | 33,786 | | | | 120 | | | | 33,786 | | | | 120 | |
Leasing | | | 5,372 | | | | - | | | | - | | | | - | | | | 5,372 | | | | - | |
Consumer: | | | | | | | | | | | | | | | | | | | | | | | | |
Credit cards | | | 39,574 | | | | - | | | | - | | | | - | | | | 39,574 | | | | - | |
HELOCs | | | - | | | | - | | | | 81 | | | | - | | | | 81 | | | | - | |
Personal | | | 90,949 | | | | - | | | | - | | | | - | | | | 90,949 | | | | - | |
Auto | | | 255 | | | | - | | | | 73 | | | | - | | | | 328 | | | | - | |
Other | | | 2,813 | | | | - | | | | 2,404 | | | | - | | | | 5,217 | | | | - | |
Covered loans | | | 93,820 | | | | 3,587 | | | | - | | | | - | | | | 93,820 | | | | 3,587 | |
| |
Total Popular, Inc. | | $ | 1,134,544 | | | $ | 35,594 | | | $ | 224,772 | | | $ | 3,521 | | | $ | 1,359,316 | | | $ | 39,115 | |
| |
Modifications
Troubled debt restructurings related to non-covered loan portfolios amounted to $ 1.0 billion at December 31, 2013 (December 31, 2012—$ 1.2 billion). The amount of outstanding commitments to lend additional funds to debtors owing receivables whose terms have been modified in troubled debt restructurings amounted $3 million related to the commercial loan portfolio at December 31, 2013 (December 31, 2012—$4 million). There were no outstanding commitments to lend additional funds to debtors owing loans whose terms have been modified in troubled debt restructurings related to construction loan portfolio at December 31, 2013 (December 31, 2012 - $120 thousand).
A modification of a loan constitutes a troubled debt restructuring (“TDR”) when a borrower is experiencing financial difficulty and the modification constitutes a concession.
Commercial and industrial loans modified in a TDR often involve temporary interest-only payments, term extensions, and converting evergreen revolving credit lines to long-term loans. Commercial real estate (“CRE”), which includes multifamily, owner-occupied and non-owner occupied CRE, and construction loans modified in a TDR often involve reducing the interest rate for a limited period of time or the remaining term of the loan, extending the maturity date at an interest rate lower than the current market rate for new debt with similar risk, or reductions in the payment plan. Construction loans modified in a TDR may also involve extending the interest-only payment period.
Residential mortgage loans modified in a TDR are primarily comprised of loans where monthly payments are lowered to accommodate the borrowers’ financial needs for a period of time, normally five years to ten years. After the lowered monthly payment period ends, the borrower reverts back to paying principal and interest per the original terms with the maturity date adjusted accordingly.
Home equity loans modifications are made infrequently and are not offered if the Corporation also holds the first mortgage. Home equity loans modifications are uniquely designed to meet the specific needs of each borrower. Automobile loans modified in a TDR are primarily comprised of loans where the Corporation has lowered monthly payments by extending the term. Credit cards modified in a TDR are primarily comprised of loans where monthly payments are lowered to accommodate the borrowers’ financial needs for a period of time, normally up to 24 months.
As part of its NPL reduction strategy and in order to expedite the resolution of delinquent construction and commercial loans, commencing in 2012, the Corporation routinely enters into liquidation agreements with borrowers and guarantors through the regular legal process, bankruptcy procedures and in certain occasions, out of court transactions. These liquidation agreements, in general, contemplate the following conditions: (1) consent to judgment by the borrowers and guarantors; (2) acknowledgement by
163
the borrower of the debt, its liquidity and maturity; and (3) acknowledgment of the default in payments. The contractual interest rate is not reduced and continues to accrue during the term of the agreement. At the end of the period, the borrower is obligated to remit all amounts due or be subject to the Corporation’s exercise of its foreclosure rights and further collection efforts. Likewise, the borrower’s failure to make stipulated payments will grant the Corporation the ability to exercise its foreclosure rights. This strategy tends to expedite the foreclosure process, resulting in a more effective and efficient collection process. Although in general, these liquidation agreements do not contemplate the forgiveness of principal or interest as debtor is required to cover all outstanding amounts when the agreement becomes due, it could be construed that the Corporation has granted a concession by temporarily accepting a payment schedule that is different from the contractual payment schedule. Accordingly, loans under these program agreements are considered TDRs.
Loans modified in a TDR that are not accounted pursuant to ASC Subtopic 310-30 are typically already in non-accrual status at the time of the modification and partial charge-offs have in some cases already been taken against the outstanding loan balance. The TDR loan continues in non-accrual status until the borrower has demonstrated a willingness and ability to make the restructured loan payments (generally at least six months of sustained performance after the modification (or one year for loans providing for quarterly or semi-annual payments)) and management has concluded that it is probable that the borrower would not be in payment default in the foreseeable future.
Loans modified in a TDR may have the financial effect to the Corporation of increasing the specific allowance for loan losses associated with the loan. Consumer and residential mortgage loans modified under the Corporation’s loss mitigation programs that are determined to be TDRs are individually evaluated for impairment based on an analysis of discounted cash flows.
For consumer and mortgage loans that are modified with regard to payment terms and which constitute TDRs, the discounted cash flow value method is used as the impairment valuation is more appropriately calculated based on the ongoing cash flow from the individuals rather than the liquidation of the asset. The computations give consideration to probability of defaults and loss-given-foreclosure on the related estimated cash flows.
Commercial and construction loans that have been modified as part of loss mitigation efforts are evaluated individually for impairment. The vast majority of the Corporation’s modified commercial loans are measured for impairment using the estimated fair value of the collateral, as these are normally considered as collateral dependent loans. The Corporation may also modified commercial loans at their estimated realizable values determined by discounting the expected future cash flows. Construction loans that have been modified are also accounted for as collateral dependent loans. The Corporation determines the fair value measurement dependent upon its exit strategy for the particular asset(s) acquired in foreclosure.
The following tables present the non-covered and covered loans classified as TDRs according to their accruing status at December 31, 2013 and December 31, 2012.
| | | | | | | | | | | | | | | | | | | | | | | | |
| | | Popular, Inc. | |
| |
| | | Non-Covered Loans | |
| | |
| | | December 31, 2013 | | | December 31, 2012 | |
| | | | |
| | | | | | |
| (In thousands) | | Accruing | | | Non-Accruing | | | Total | | | Accruing | | | Non-Accruing | | | Total | |
| |
| | | | | | |
Commercial | | $ | 109,462 | | | $ | 80,140 | | | $ | 189,602 | | | $ | 105,648 | | | $ | 208,119 | | | $ | 313,767 | |
| | | | | | |
Construction | | | 425 | | | | 10,865 | | | | 11,290 | | | | 2,969 | | | | 10,310 | | | | 13,279 | |
| | | | | | |
Legacy | | | - | | | | 949 | | | | 949 | | | | - | | | | 5,978 | | | | 5,978 | |
| | | | | | |
Mortgage | | | 535,357 | | | | 82,786 | | | | 618,143 | | | | 405,063 | | | | 273,042 | | | | 678,105 | |
| | | | | | |
Leases | | | 270 | | | | 2,623 | | | | 2,893 | | | | 1,726 | | | | 3,155 | | | | 4,881 | |
| | | | | | |
Consumer | | | 116,719 | | | | 10,741 | | | | 127,460 | | | | 125,955 | | | | 8,981 | | | | 134,936 | |
| |
| | | | | | |
Total | | $ | 762,233 | | | $ | 188,104 | | | $ | 950,337 | | | $ | 641,361 | | | $ | 509,585 | | | $ | 1,150,946 | |
| |
| |
| | | Popular, Inc. | |
| |
| | | Covered Loans | |
164
| | | | | | | | | | | | | | | | | | | | | | | | |
| | | | |
| | |
| | | December 31, 2013 | | | December 31, 2012 | |
| | | | |
| | | | | | |
| (In thousands) | | Accruing | | | Non-Accruing | | | Total | | | Accruing | | | Non-Accruing | | | Total | |
| |
| | | | | | |
Commercial | | $ | 7,389 | | | $ | 10,017 | | | $ | 17,406 | | | $ | 46,142 | | | $ | 4,071 | | | $ | 50,213 | |
| | | | | | |
Construction | | | - | | | | 3,464 | | | | 3,464 | | | | - | | | | 7,435 | | | | 7,435 | |
| | | | | | |
Mortgage | | | 146 | | | | 189 | | | | 335 | | | | 149 | | | | 220 | | | | 369 | |
| | | | | | |
Consumer | | | 221 | | | | 22 | | | | 243 | | | | 517 | | | | 106 | | | | 623 | |
| |
| | | | | | |
Total | | $ | 7,756 | | | $ | 13,692 | | | $ | 21,448 | | | $ | 46,808 | | | $ | 11,832 | | | $ | 58,640 | |
| |
The following tables present the loan count by type of modification for those loans modified in a TDR during the year ended December 31, 2013 and 2012.
| | | | | | | | | | | | | | | | |
| |
| Puerto Rico | |
| |
| For the year ended December 31, 2013 | |
| |
| | | | |
| | | Reduction in
interest rate | | | Extension of
maturity date | | | Combination of
reduction in interest
rate and extension
of maturity date | | | Other | |
| |
| | | | |
Commercial real estate non-owner occupied | | | 5 | | | | 5 | | | | - | | | | - | |
| | | | |
Commercial real estate owner occupied | | | 6 | | | | 4 | | | | - | | | | 45 | |
| | | | |
Commercial and industrial | | | 23 | | | | 13 | | | | - | | | | 10 | |
| | | | |
Mortgage | | | 22 | | | | 42 | | | | 341 | | | | 17 | |
| | | | |
Leasing | | | - | | | | 22 | | | | 23 | | | | - | |
| | | | |
Consumer: | | | | | | | | | | | | | | | | |
| | | | |
Credit cards | | | 1,107 | | | | - | | | | - | | | | 989 | |
| | | | |
Personal | | | 923 | | | | 22 | | | | - | | | | 6 | |
| | | | |
Auto | | | - | | | | 11 | | | | - | | | | - | |
| | | | |
Other | | | 71 | | | | - | | | | - | | | | 4 | |
| |
| | | | |
Total | | | 2,157 | | | | 119 | | | | 364 | | | | 1,071 | |
| |
| | | | | | | | | | | | | | | | |
| |
| U.S. mainland | |
| |
| For the year ended December 31, 2013 | |
| |
| | | | |
| | | Reduction in
interest rate | | | Extension of
maturity date | | | Combination of
reduction in interest
rate and extension
of maturity date | | | Other | |
| |
| | | | |
Commercial real estate non-owner occupied | | | - | | | | 2 | | | | 4 | | | | - | |
| | | | |
Commercial real estate owner occupied | | | - | | | | 1 | | | | 1 | | | | - | |
| | | | |
Commercial and industrial | | | - | | | | 1 | | | | - | | | | - | |
| | | | |
Mortgage | | | 1 | | | | 1 | | | | 26 | | | | - | |
| |
| | | | |
Total | | | 1 | | | | 5 | | | | 31 | | | | - | |
| |
|
| |
| Popular, Inc. | |
| |
| For the year ended December 31, 2013 | |
| |
| | | | |
| | | Reduction in
interest rate | | | Extension of
maturity date | | | Combination of
reduction in interest
rate and extension
of maturity date | | | Other | |
| |
| | | | |
Commercial real estate non-owner occupied | | | 5 | | | | 7 | | | | 4 | | | | - | |
| | | | |
Commercial real estate owner occupied | | | 6 | | | | 5 | | | | 1 | | | | 45 | |
| | | | |
Commercial and industrial | | | 23 | | | | 14 | | | | - | | | | 10 | |
| | | | |
Mortgage | | | 23 | | | | 43 | | | | 367 | | | | 17 | |
| | | | |
Leasing | | | - | | | | 22 | | | | 23 | | | | - | |
| | | | |
Consumer: | | | | | | | | | | | | | | | | |
165
| | | | | | | | | | | | | | | | |
| | | | |
Credit cards | | | 1,107 | | | | - | | | | - | | | | 989 | |
| | | | |
Personal | | | 923 | | | | 22 | | | | - | | | | 6 | |
| | | | |
Auto | | | - | | | | 11 | | | | - | | | | - | |
| | | | |
Other | | | 71 | | | | - | | | | - | | | | 4 | |
| |
Total | | | 2,158 | | | | 124 | | | | 395 | | | | 1,071 | |
| |
|
| |
| Puerto Rico | |
| |
| For the year ended December 31, 2012 | |
| |
| | | | |
| | | Reduction in
interest rate | | | Extension of
maturity date | | | Combination of
reduction in interest
rate and extension
of maturity date | | | Other | |
| |
| | | | |
Commercial multi-family | | | - | | | | - | | | | - | | | | 2 | |
| | | | |
Commercial real estate non-owner occupied | | | 9 | | | | 8 | | | | - | | | | 12 | |
| | | | |
Commercial real estate owner occupied | | | 13 | | | | 22 | | | | - | | | | 208 | |
| | | | |
Commercial and industrial | | | 42 | | | | 91 | | | | - | | | | 87 | |
| | | | |
Construction | | | 8 | | | | 1 | | | | - | | | | 1 | |
| | | | |
Mortgage | | | 579 | | | | 147 | | | | 1,548 | | | | 202 | |
| | | | |
Leasing | | | - | | | | 66 | | | | 42 | | | | - | |
| | | | |
Consumer: | | | | | | | | | | | | | | | | |
| | | | |
Credit cards | | | 1,640 | | | | - | | | | - | | | | 1,242 | |
| | | | |
Personal | | | 1,080 | | | | 31 | | | | - | | | | 5 | |
| | | | |
Auto | | | - | | | | 9 | | | | 3 | | | | - | |
| | | | |
Other | | | 62 | | | | - | | | | - | | | | 4 | |
| |
| | | | |
Total | | | 3,433 | | | | 375 | | | | 1,593 | | | | 1,763 | |
| |
|
| |
| U.S. mainland | |
| |
| For the year ended December 31, 2012 | |
| |
| | | | |
| | | Reduction in
interest rate | | | Extension of
maturity date | | | Combination of
reduction in interest
rate and extension
of maturity date | | | Other | |
| |
| | | | |
Commercial multi-family | | | - | | | | - | | | | - | | | | 1 | |
| | | | |
Commercial real estate non-owner occupied | | | 2 | | | | 2 | | | | 5 | | | | 1 | |
| | | | |
Commercial real estate owner occupied | | | - | | | | - | | | | - | | | | 2 | |
| | | | |
Construction | | | - | | | | - | | | | - | | | | 1 | |
| | | | |
Mortgage | | | 4 | | | | 1 | | | | 73 | | | | - | |
| | | | |
Legacy | | | 1 | | | | - | | | | - | | | | 2 | |
| | | | |
Consumer: | | | | | | | | | | | | | | | | |
| | | | |
HELOCs | | | 1 | | | | - | | | | 3 | | | | - | |
| |
| | | | |
Total | | | 8 | | | | 3 | | | | 81 | | | | 7 | |
| |
|
| |
| Popular, Inc. | |
| |
| For the year ended December 31, 2012 | |
| |
| | | | |
| | | Reduction in
interest rate | | | Extension of
maturity date | | | Combination of
reduction in interest
rate and extension
of maturity date | | | Other | |
| |
| | | | |
Commercial multi-family | | | - | | | | - | | | | - | | | | 3 | |
| | | | |
Commercial real estate non-owner occupied | | | 11 | | | | 10 | | | | 5 | | | | 13 | |
| | | | |
Commercial real estate owner occupied | | | 13 | | | | 22 | | | | - | | | | 210 | |
| | | | |
Commercial and industrial | | | 42 | | | | 91 | | | | - | | | | 87 | |
| | | | |
Construction | | | 8 | | | | 1 | | | | - | | | | 2 | |
| | | | |
Mortgage | | | 583 | | | | 148 | | | | 1,621 | | | | 202 | |
| | | | |
Legacy | | | 1 | | | | - | | | | - | | | | 2 | |
| | | | |
Leasing | | | - | | | | 66 | | | | 42 | | | | - | |
| | | | |
Consumer: | | | | | | | | | | | | | | | | |
166
| | | | | | | | | | | | | | | | |
| | | | |
Credit cards | | | 1,640 | | | | - | | | | - | | | | 1,242 | |
| | | | |
HELOCs | | | 1 | | | | - | | | | 3 | | | | - | |
| | | | |
Personal | | | 1,080 | | | | 31 | | | | - | | | | 5 | |
| | | | |
Auto | | | - | | | | 9 | | | | 3 | | | | - | |
| | | | |
Other | | | 62 | | | | - | | | | - | | | | 4 | |
| |
Total | | | 3,441 | | | | 378 | | | | 1,674 | | | | 1,770 | |
| |
The following tables present by class, quantitative information related to loans modified as TDRs during the years ended December 31, 2013 and 2012.
| | | | | | | | | | | | | | | | |
| |
|
| Puerto Rico | |
| |
|
| For the year ended December 31, 2013 | |
| |
| | | | |
| (Dollars in thousands) | | Loan count | | | Pre-modification
outstanding recorded
investment | | | Post-modification
outstanding recorded
investment | | | Increase (decrease) in the
allowance for loan losses as
a result of modification | |
| |
| | | | |
Commercial real estate non-owner occupied | | | 10 | | | $ | 10,729 | | | $ | 9,194 | | | $ | (7) | |
| | | | |
Commercial real estate owner occupied | | | 55 | | | | 29,975 | | | | 25,629 | | | | (1,047) | |
| | | | |
Commercial and industrial | | | 46 | | | | 15,947 | | | | 14,855 | | | | (253) | |
| | | | |
Mortgage | | | 422 | | | | 72,899 | | | | 76,839 | | | | 8,869 | |
| | | | |
Leasing | | | 45 | | | | 928 | | | | 900 | | | | 271 | |
| | | | |
Consumer: | | | | | | | | | | | | | | | | |
| | | | |
Credit cards | | | 2,096 | | | | 16,622 | | | | 19,810 | | | | 2,380 | |
| | | | |
Personal | | | 951 | | | | 15,474 | | | | 15,507 | | | | 3,864 | |
| | | | |
Auto | | | 11 | | | | 122 | | | | 199 | | | | 15 | |
| | | | |
Other | | | 75 | | | | 267 | | | | 264 | | | | 36 | |
| |
| | | | |
Total | | | 3,711 | | | $ | 162,963 | | | $ | 163,197 | | | $ | 14,128 | |
| |
| | | | | | | | | | | | | | | | |
| |
|
| U.S. mainland | |
| |
|
| For the year ended December 31, 2013 | |
| |
| | | | |
| (Dollars in thousands) | | Loan count | | | Pre-modification
outstanding recorded
investment | | | Post-modification
outstanding recorded
investment | | | Increase (decrease) in the
allowance for loan losses as
a result of modification | |
| |
| | | | |
Commercial real estate non-owner occupied | | | 6 | | | $ | 4,798 | | | $ | 4,552 | | | $ | (65) | |
| | | | |
Commercial real estate owner occupied | | | 2 | | | | 1,263 | | | | 836 | | | | (144) | |
| | | | |
Commercial and industrial | | | 1 | | | | 2,125 | | | | 1,060 | | | | (216) | |
| | | | |
Mortgage | | | 28 | | | | 3,240 | | | | 3,395 | | | | 1,099 | |
| |
| | | | |
Total | | | 37 | | | $ | 11,426 | | | $ | 9,843 | | | $ | 674 | |
| |
| | | | | | | | | | | | | | | | |
| |
|
| Popular, Inc. | |
| |
|
| For the year ended December 31, 2013 | |
| |
| | | | |
| (Dollars in thousands) | | Loan count | | | Pre-modification
outstanding recorded
investment | | | Post-modification
outstanding recorded
investment | | | Increase (decrease) in the
allowance for loan losses as
a result of modification | |
| |
| | | | |
Commercial real estate non-owner occupied | | | 16 | | | | 15,527 | | | | 13,746 | | | | (72) | |
| | | | |
Commercial real estate owner occupied | | | 57 | | | | 31,238 | | | | 26,465 | | | | (1,191) | |
| | | | |
Commercial and industrial | | | 47 | | | | 18,072 | | | | 15,915 | | | | (469) | |
| | | | |
Mortgage | | | 450 | | | | 76,139 | | | | 80,234 | | | | 9,968 | |
| | | | |
Leasing | | | 45 | | | | 928 | | | | 900 | | | | 271 | |
| | | | |
Consumer: | | | | | | | | | | | | | | | | |
| | | | |
Credit cards | | | 2,096 | | | | 16,622 | | | | 19,810 | | | | 2,380 | |
| | | | |
Personal | | | 951 | | | | 15,474 | | | | 15,507 | | | | 3,864 | |
| | | | |
Auto | | | 11 | | | | 122 | | | | 199 | | | | 15 | |
| | | | |
Other | | | 75 | | | | 267 | | | | 264 | | | | 36 | |
| |
| | | | |
Total | | | 3,748 | | | $ | 174,389 | | | $ | 173,040 | | | $ | 14,802 | |
| |
167
| | | | | | | | | | | | | | | | |
| |
|
| Puerto Rico | |
| |
|
| For the year ended December 31, 2012 | |
| |
| | | | |
| (Dollars in thousands) | | Loan count | | | Pre-modification
outstanding recorded
investment | | | Post-modification
outstanding recorded
investment | | | Increase (decrease) in the
allowance for loan losses as
a result of modification | |
| |
| | | | |
Commercial multi-family | | | 2 | | | $ | 271 | | | $ | 271 | | | $ | 6 | |
| | | | |
Commercial real estate non-owner occupied | | | 29 | | | | 18,240 | | | | 18,433 | | | | (583) | |
| | | | |
Commercial real estate owner occupied | | | 243 | | | | 83,271 | | | | 82,841 | | | | (113) | |
| | | | |
Commercial and industrial | | | 220 | | | | 77,909 | | | | 64,767 | | | | (6,489) | |
| | | | |
Construction | | | 10 | | | | 6,617 | | | | 5,822 | | | | (212) | |
| | | | |
Mortgage | | | 2,476 | | | | 325,866 | | | | 356,077 | | | | 23,279 | |
| | | | |
Leasing | | | 108 | | | | 1,752 | | | | 1,684 | | | | 217 | |
| | | | |
Consumer: | | | | | | | | | | | | | | | | |
| | | | |
Credit cards | | | 2,882 | | | | 24,193 | | | | 27,822 | | | | 81 | |
| | | | |
Personal | | | 1,116 | | | | 16,875 | | | | 16,931 | | | | 2,743 | |
| | | | |
Auto | | | 12 | | | | 164 | | | | 168 | | | | 4 | |
| | | | |
Other | | | 66 | | | | 240 | | | | 239 | | | | (1) | |
| |
| | | | |
Total | | | 7,164 | | | $ | 555,398 | | | $ | 575,055 | | | $ | 18,932 | |
| |
| | | | | | | | | | | | | | | | |
| |
|
| U.S. mainland | |
| |
|
| For the year ended December 31, 2012 | |
| |
| | | | |
| (Dollars in thousands) | | Loan count | | | Pre-modification
outstanding recorded
investment | | | Post-modification
outstanding recorded
investment | | | Increase (decrease) in the
allowance for loan losses as
a result of modification | |
| |
| | | | |
Commercial multi-family | | | 1 | | | $ | 572 | | | $ | 563 | | | $ | - | |
| | | | |
Commercial real estate non-owner occupied | | | 10 | | | | 16,941 | | | | 18,367 | | | | 219 | |
| | | | |
Commercial real estate owner occupied | | | 2 | | | | 3,051 | | | | 2,547 | | | | (106) | |
| | | | |
Construction | | | 1 | | | | 1,573 | | | | 1,573 | | | | - | |
| | | | |
Mortgage | | | 78 | | | | 8,749 | | | | 8,855 | | | | 1,211 | |
| | | | |
Legacy | | | 3 | | | | 1,272 | | | | 1,267 | | | | (3) | |
| | | | |
Consumer: | | | | | | | | | | | | | | | | |
| | | | |
HELOCs | | | 4 | | | | 583 | | | | 560 | | | | 3 | |
| |
| | | | |
Total | | | 99 | | | $ | 32,741 | | | $ | 33,732 | | | $ | 1,324 | |
| |
| | | | | | | | | | | | | | | | |
| |
|
| Popular, Inc. | |
| |
|
| For the year ended December 31, 2012 | |
| |
| | | | |
| (Dollars in thousands) | | Loan count | | | Pre-modification
outstanding recorded
investment | | | Post-modification
outstanding recorded
investment | | | Increase (decrease) in the
allowance for loan losses as
a result of modification | |
| |
| | | | |
Commercial multi-family | | | 3 | | | $ | 843 | | | $ | 834 | | | $ | 6 | |
| | | | |
Commercial real estate non-owner occupied | | | 39 | | | | 35,181 | | | | 36,800 | | | | (364) | |
| | | | |
Commercial real estate owner occupied | | | 245 | | | | 86,322 | | | | 85,388 | | | | (219) | |
| | | | |
Commercial and industrial | | | 220 | | | | 77,909 | | | | 64,767 | | | | (6,489) | |
| | | | |
Construction | | | 11 | | | | 8,190 | | | | 7,395 | | | | (212) | |
| | | | |
Mortgage | | | 2,554 | | | | 334,615 | | | | 364,932 | | | | 24,490 | |
| | | | |
Legacy | | | 3 | | | | 1,272 | | | | 1,267 | | | | (3) | |
| | | | |
Leasing | | | 108 | | | | 1,752 | | | | 1,684 | | | | 217 | |
| | | | |
Consumer: | | | | | | | | | | | | | | | | |
| | | | |
Credit cards | | | 2,882 | | | | 24,193 | | | | 27,822 | | | | 81 | |
| | | | |
HELOCs | | | 4 | | | | 583 | | | | 560 | | | | 3 | |
| | | | |
Personal | | | 1,116 | | | | 16,875 | | | | 16,931 | | | | 2,743 | |
| | | | |
Auto | | | 12 | | | | 164 | | | | 168 | | | | 4 | |
| | | | |
Other | | | 66 | | | | 240 | | | | 239 | | | | (1) | |
| |
| | | | |
Total | | | 7,263 | | | $ | 588,139 | | | $ | 608,787 | | | $ | 20,256 | |
| |
168
During the years ended December 31, 2013 and 2012, six loans comprising a recorded investment of approximately $165 million and thirteen loans of $134 million, respectively, were restructured into multiple notes (“Note A / B split”). The Corporation recorded approximately $26.6 million and $15.9 million in loan charge-offs as part of the loan restructuring during the year ended December 31, 2013 and 2012, respectively. The renegotiations of these loans were made after analyzing the borrowers’ capacity to repay the debt, collateral and ability to perform under the modified terms. The recorded investment on these commercial TDRs amounted to approximately $130 million at December 31, 2013 (December 31, 2012 - $115 million) with a related allowance for loan losses amounting to approximately $64 million (December 31, 2012 - $267 thousand).
The following tables present by class, TDRs that were subject to payment default and that had been modified as a TDR during the twelve months preceding the default date. Payment default is defined as a restructured loan becoming 90 days past due after being modified, foreclosed or charged-off, whichever occurs first. The recorded investment at December 31, 2013 is inclusive of all partial paydowns and charge-offs since the modification date. Loans modified as a TDR that were fully paid down, charged-off or foreclosed upon by period end are not reported.
| | | | | | | | |
| |
| Puerto Rico | |
| |
| Defaulted during the year ended December 31, 2013 | |
| |
| | |
| (Dollars In thousands) | | Loan count | | | Recorded investment as of first default date | |
| |
Commercial real estate owner occupied | | | 5 | | | | $ 5,733 | |
Commercial and industrial | | | 6 | | | | 1,838 | |
Mortgage | | | 208 | | | | 32,734 | |
Leasing | | | 18 | | | | 279 | |
Consumer: | | | | | | | | |
Credit cards | | | 623 | | | | 5,955 | |
Personal | | | 134 | | | | 1,862 | |
Auto | | | 6 | | | | 145 | |
Other | | | 2 | | | | 21 | |
| |
Total [1] | | | 1,002 | | | | $ 48,567 | |
| |
|
[1] Excludes loans for which the Corporation has entered into liquidation agreements with borrowers and guarantors and is accepting payments which differ from the contractual payment schedule. The Corporation considers these as defaulted loans and does not intent to return them to accrual status. | |
| |
| U.S. mainland | |
| |
| Defaulted during the year ended December 31, 2013 | |
| |
| | |
| (Dollars In thousands) | | Loan count | | | Recorded investment as of first default date | |
| |
Commercial real estate non-owner occupied | | | 3 | | | | $ 2,554 | |
| |
Total | | | 3 | | | | $ 2,554 | |
| |
|
| |
| Popular, Inc. | |
| |
| Defaulted during the year ended December 31, 2013 | |
| |
| | |
| (Dollars In thousands) | | Loan count | | | Recorded investment as of first default date | |
| |
Commercial real estate non-owner occupied | | | 3 | | | | $ 2,554 | |
Commercial real estate owner occupied | | | 5 | | | | 5,733 | |
Commercial and industrial | | | 6 | | | | 1,838 | |
Mortgage | | | 208 | | | | 32,734 | |
Leasing | | | 18 | | | | 279 | |
Consumer: | | | | | | | | |
Credit cards | | | 623 | | | | 5,955 | |
Personal | | | 134 | | | | 1,862 | |
Auto | | | 6 | | | | 145 | |
Other | | | 2 | | | | 21 | |
| |
Total | | | 1,005 | | | | $ 51,121 | |
| |
|
| |
| Puerto Rico | |
| |
| Defaulted during the year ended December 31, 2012 | |
| |
| | |
| (Dollars In thousands) | | Loan count | | | Recorded investment as of first default date | |
| |
Commercial real estate non-owner occupied | | | 1 | | | | $ 1,770 | |
169
| | | | | | | | |
Commercial real estate owner occupied | | | 28 | | | | 9,011 | |
Commercial and industrial | | | 12 | | | | 4,031 | |
Construction | | | 5 | | | | 690 | |
Mortgage | | | 668 | | | | 94,991 | |
Leasing | | | 24 | | | | 455 | |
Consumer: | | | | | | | | |
Credit cards | | | 421 | | | | 3,778 | |
Personal | | | 338 | | | | 2,266 | |
Auto | | | 2 | | | | 28 | |
Other | | | 2 | | | | 8 | |
| |
Total [1] | | | 1,501 | | | | $ 117,028 | |
| |
| [1] Exclude loans for which the Corporation has entered into liquidation agreements with borrowers and guarantors and is accepting payments which differ from the contractual payment schedule. The Corporation considers these as defaulted loans and does not intent to return them to accrual status. | |
| |
|
| |
|
| U.S. mainland | |
| |
| Defaulted during the year ended December 31, 2012 | |
| |
| | |
| (Dollars In thousands) | | Loan count | | | Recorded investment as of first default date | |
| |
Commercial real estate owner occupied | | | 1 | | | | $ 1,935 | |
Mortgage | | | 12 | | | | 1,134 | |
| |
Total | | | 13 | | | | $ 3,069 | |
| |
|
| |
|
| Popular, Inc. | |
| |
| Defaulted during the year ended December 31, 2012 | |
| |
| | |
| (Dollars In thousands) | | Loan count | | | Recorded investment as of first default date | |
| |
Commercial real estate non-owner occupied | | | 1 | | | | $ 1,770 | |
Commercial real estate owner occupied | | | 29 | | | | 10,946 | |
Commercial and industrial | | | 12 | | | | 4,031 | |
Construction | | | 5 | | | | 690 | |
Mortgage | | | 680 | | | | 96,125 | |
Leasing | | | 24 | | | | 455 | |
Consumer: | | | | | | | | |
Credit cards | | | 421 | | | | 3,778 | |
Personal | | | 338 | | | | 2,266 | |
Auto | | | 2 | | | | 28 | |
Other | | | 2 | | | | 8 | |
| |
Total | | | 1,514 | | | | $ 120,097 | |
| |
Commercial, consumer and mortgage loans modified in a TDR are closely monitored for delinquency as an early indicator of possible future default. If loans modified in a TDR subsequently default, the Corporation evaluates the loan for possible further impairment. The allowance for loan losses may be increased or partial charge-offs may be taken to further write-down the carrying value of the loan.
Credit Quality
The Corporation has defined a dual risk rating system to assign a rating to all credit exposures, particularly for the commercial and construction loan portfolios. Risk ratings in the aggregate provide the Corporation’s management the asset quality profile for the loan portfolio. The dual risk rating system provides for the assignment of ratings at the obligor level based on the financial condition of the borrower, and at the credit facility level based on the collateral supporting the transaction. The Corporation’s consumer and mortgage loans are not subject to the dual risk rating system. Consumer and mortgage loans are classified substandard or loss based on their delinquency status. All other consumer and mortgage loans that are not classified as substandard or loss would be considered “unrated”.
The Corporation’s obligor risk rating scales range from rating 1 (Excellent) to rating 14 (Loss). The obligor risk rating reflects the risk of payment default of a borrower in the ordinary course of business.
Pass Credit Classifications:
Pass (Scales 1 through 8) – Loans classified as pass have a well defined primary source of repayment very likely to be sufficient, with no apparent risk, strong financial position, minimal operating risk, profitability, liquidity and capitalization better than industry standards.
170
Watch (Scale 9) – Loans classified as watch have acceptable business credit, but borrower’s operations, cash flow or financial condition evidence more than average risk, requires above average levels of supervision and attention from Loan Officers.
Special Mention (Scale 10) - Loans classified as special mention have potential weaknesses that deserve management’s close attention. If left uncorrected, these potential weaknesses may result in deterioration of the repayment prospects for the loan or of the Corporation’s credit position at some future date.
Adversely Classified Classifications:
Substandard (Scales 11 and 12) - Loans classified as substandard are deemed to be inadequately protected by the current net worth and payment capacity of the obligor or of the collateral pledged, if any. Loans classified as such have well-defined weaknesses that jeopardize the liquidation of the debt. They are characterized by the distinct possibility that the institution will sustain some loss if the deficiencies are not corrected.
Doubtful (Scale 13) - Loans classified as doubtful have all the weaknesses inherent in those classified as substandard, with the additional characteristic that the weaknesses make the collection or liquidation in full, on the basis of currently existing facts, conditions, and values, highly questionable and improbable.
Loss (Scale 14) - Uncollectible and of such little value that continuance as a bankable asset is not warranted. This classification does not mean that the asset has absolutely no recovery or salvage value, but rather it is not practical or desirable to defer writing off this asset even though partial recovery may be effected in the future.
Risk ratings scales 10 through 14 conform to regulatory ratings. The assignment of the obligor risk rating is based on relevant information about the ability of borrowers to service their debts such as current financial information, historical payment experience, credit documentation, public information, and current economic trends, among other factors.
The Corporation periodically reviews loans classified as watch or worse, to evaluate if they are properly classified, and to determine impairment, if any. The frequency of these reviews will depend on the amount of the aggregate outstanding debt, and the risk rating classification of the obligor. In addition, during the renewal process of applicable credit facilities, the Corporation evaluates the corresponding loan grades.
Loans classified as pass credits are excluded from the scope of the review process described above until: (a) they become past due; (b) management becomes aware of deterioration in the creditworthiness of the borrower; or (c) the customer contacts the Corporation for a modification. In these circumstances, the credit facilities are specifically evaluated to assign the appropriate risk rating classification.
The Corporation has a Credit Process Review Group within the Corporate Credit Risk Management Division (“CCRMD”), which performs annual comprehensive credit process reviews of several middle markets, construction, asset-based and corporate banking lending groups in BPPR. This group evaluates the credit risk profile of each originating unit along with each unit’s credit administration effectiveness, including the assessment of the risk rating representative of the current credit quality of the loans, and the evaluation of collateral documentation. The monitoring performed by this group contributes to assess compliance with credit policies and underwriting standards, determine the current level of credit risk, evaluate the effectiveness of the credit management process and identify control deficiencies that may arise in the credit-granting process. Based on its findings, the Credit Process Review Group recommends corrective actions, if necessary, that help in maintaining a sound credit process. CCRMD has contracted an outside loan review firm to perform the credit process reviews for the portfolios of commercial and construction loans in the U.S. mainland operations. The CCRMD participates in defining the review plan with the outside loan review firm and actively participates in the discussions of the results of the loan reviews with the business units. The CCRMD may periodically review the work performed by the outside loan review firm. CCRMD reports the results of the credit process reviews to the Risk Management Committee of the Corporation’s Board of Directors.
The following table presents the outstanding balance, net of unearned income, of non-covered loans held-in-portfolio based on the Corporation’s assignment of obligor risk ratings as defined at December 31, 2013 and 2012.
| | | | | | | | | | | | | | | | |
| December 31, 2013 |
|
| | | | | Special | | | | | | | | | | Pass/ | | |
171
| | | | | | | | | | | | | | | | | | | | | | | | | | | | | | | | |
| (In thousands) | | Watch | | | Mention | | | Substandard | | | Doubtful | | | Loss | | | Sub-total | | | Unrated | | | Total | |
| |
Puerto Rico[1] | | | | | | | | | | | | | | | | | | | | | | | | | | | | | | | | |
| | | | | | | | |
Commercial multi-family | | $ | 2,477 | | | $ | 4,453 | | | $ | 2,343 | | | $ | - | | | $ | - | | | $ | 9,273 | | | $ | 73,130 | | | $ | 82,403 | |
| | | | | | | | |
Commercial real estate non-owner occupied | | | 230,847 | | | | 156,189 | | | | 115,435 | | | | - | | | | 112 | | | | 502,583 | | | | 1,361,635 | | | | 1,864,218 | |
| | | | | | | | |
Commercial real estate owner occupied | | | 231,705 | | | | 134,577 | | | | 305,565 | | | | - | | | | - | | | | 671,847 | | | | 934,656 | | | | 1,606,503 | |
| | | | | | | | |
Commercial and industrial | | | 727,647 | | | | 192,404 | | | | 214,531 | | | | 68 | | | | 446 | | | | 1,135,096 | | | | 1,777,370 | | | | 2,912,466 | |
| |
| | | | | | | | |
Total Commercial | | | 1,192,676 | | | | 487,623 | | | | 637,874 | | | | 68 | | | | 558 | | | | 2,318,799 | | | | 4,146,791 | | | | 6,465,590 | |
| | | | | | | | |
Construction | | | 6,895 | | | | 1,788 | | | | 25,722 | | | | 2,250 | | | | - | | | | 36,655 | | | | 124,516 | | | | 161,171 | |
| | | | | | | | |
Mortgage | | | - | | | | - | | | | 169,239 | | | | - | | | | - | | | | 169,239 | | | | 5,231,440 | | | | 5,400,679 | |
| | | | | | | | |
Leasing | | | - | | | | - | | | | 3,495 | | | | - | | | | - | | | | 3,495 | | | | 540,266 | | | | 543,761 | |
| | | | | | | | |
Consumer: | | | | | | | | | | | | | | | | | | | | | | | | | | | | | | | | |
| | | | | | | | |
Credit cards | | | - | | | | - | | | | 21,044 | | | | - | | | | - | | | | 21,044 | | | | 1,148,577 | | | | 1,169,621 | |
| | | | | | | | |
HELOCs | | | - | | | | - | | | | 665 | | | | - | | | | 2,426 | | | | 3,091 | | | | 12,087 | | | | 15,178 | |
| | | | | | | | |
Personal | | | - | | | | - | | | | 7,483 | | | | - | | | | 141 | | | | 7,624 | | | | 1,206,260 | | | | 1,213,884 | |
| | | | | | | | |
Auto | | | - | | | | - | | | | 10,407 | | | | - | | | | 155 | | | | 10,562 | | | | 688,929 | | | | 699,491 | |
| | | | | | | | |
Other | | | - | | | | - | | | | 2,019 | | | | - | | | | 3,531 | | | | 5,550 | | | | 212,914 | | | | 218,464 | |
| |
| | | | | | | | |
Total Consumer | | | - | | | | - | | | | 41,618 | | | | - | | | | 6,253 | | | | 47,871 | | | | 3,268,767 | | | | 3,316,638 | |
| |
| | | | | | | | |
Total Puerto Rico | | $ | 1,199,571 | | | $ | 489,411 | | | $ | 877,948 | | | $ | 2,318 | | | $ | 6,811 | | | $ | 2,576,059 | | | $ | 13,311,780 | | | $ | 15,887,839 | |
| |
| | | | | | | | |
U.S. mainland | | | | | | | | | | | | | | | | | | | | | | | | | | | | | | | | |
| | | | | | | | |
Commercial multi-family | | $ | 73,481 | | | $ | 11,459 | | | $ | 62,346 | | | $ | - | | | $ | - | | | $ | 147,286 | | | $ | 946,248 | | | $ | 1,093,534 | |
| | | | | | | | |
Commercial real estate non-owner occupied | | | 75,094 | | | | 29,442 | | | | 160,001 | | | | - | | | | - | | | | 264,537 | | | | 841,750 | | | | 1,106,287 | |
| | | | | | | | |
Commercial real estate owner occupied | | | 56,515 | | | | 15,845 | | | | 75,508 | | | | - | | | | - | | | | 147,868 | | | | 412,174 | | | | 560,042 | |
| | | | | | | | |
Commercial and industrial | | | 11,657 | | | | 11,822 | | | | 46,307 | | | | - | | | | - | | | | 69,786 | | | | 741,945 | | | | 811,731 | |
| |
| | | | | | | | |
Total Commercial | | | 216,747 | | | | 68,568 | | | | 344,162 | | | | - | | | | - | | | | 629,477 | | | | 2,942,117 | | | | 3,571,594 | |
| | | | | | | | |
Construction | | | - | | | | - | | | | 20,885 | | | | - | | | | - | | | | 20,885 | | | | 24,028 | | | | 44,913 | |
| | | | | | | | |
Mortgage | | | - | | | | - | | | | 26,292 | | | | - | | | | - | | | | 26,292 | | | | 1,254,505 | | | | 1,280,797 | |
| | | | | | | | |
Legacy | | | 14,948 | | | | 11,593 | | | | 42,622 | | | | - | | | | - | | | | 69,163 | | | | 141,972 | | | | 211,135 | |
| | | | | | | | |
Consumer: | | | | | | | | | | | | | | | | | | | | | | | | | | | | | | | | |
| | | | | | | | |
Credit cards | | | - | | | | - | | | | 486 | | | | - | | | | - | | | | 486 | | | | 15,165 | | | | 15,651 | |
| | | | | | | | |
HELOCs | | | - | | | | - | | | | 3,317 | | | | - | | | | 5,315 | | | | 8,632 | | | | 454,401 | | | | 463,033 | |
| | | | | | | | |
Personal | | | - | | | | - | | | | 1,005 | | | | - | | | | 569 | | | | 1,574 | | | | 133,661 | | | | 135,235 | |
| | | | | | | | |
Auto | | | - | | | | - | | | | - | | | | - | | | | 2 | | | | 2 | | | | 487 | | | | 489 | |
| | | | | | | | |
Other | | | - | | | | - | | | | 20 | | | | - | | | | 1 | | | | 21 | | | | 1,159 | | | | 1,180 | |
| |
| | | | | | | | |
Total Consumer | | | - | | | | - | | | | 4,828 | | | | - | | | | 5,887 | | | | 10,715 | | | | 604,873 | | | | 615,588 | |
| |
| | | | | | | | |
Total U.S. mainland | | $ | 231,695 | | | $ | 80,161 | | | $ | 438,789 | | | $ | - | | | $ | 5,887 | | | $ | 756,532 | | | $ | 4,967,495 | | | $ | 5,724,027 | |
| |
| | | | | | | | |
Popular, Inc. | | | | | | | | | | | | | | | | | | | | | | | | | | | | | | | | |
| | | | | | | | |
Commercial multi-family | | $ | 75,958 | | | $ | 15,912 | | | $ | 64,689 | | | $ | - | | | $ | - | | | $ | 156,559 | | | $ | 1,019,378 | | | $ | 1,175,937 | |
| | | | | | | | |
Commercial real estate non-owner occupied | | | 305,941 | | | | 185,631 | | | | 275,436 | | | | - | | | | 112 | | | | 767,120 | | | | 2,203,385 | | | | 2,970,505 | |
| | | | | | | | |
Commercial real estate owner occupied | | | 288,220 | | | | 150,422 | | | | 381,073 | | | | - | | | | - | | | | 819,715 | | | | 1,346,830 | | | | 2,166,545 | |
| | | | | | | | |
Commercial and industrial | | | 739,304 | | | | 204,226 | | | | 260,838 | | | | 68 | | | | 446 | | | | 1,204,882 | | | | 2,519,315 | | | | 3,724,197 | |
| |
| | | | | | | | |
Total Commercial | | | 1,409,423 | | | | 556,191 | | | | 982,036 | | | | 68 | | | | 558 | | | | 2,948,276 | | | | 7,088,908 | | | | 10,037,184 | |
| | | | | | | | |
Construction | | | 6,895 | | | | 1,788 | | | | 46,607 | | | | 2,250 | | | | - | | | | 57,540 | | | | 148,544 | | | | 206,084 | |
| | | | | | | | |
Mortgage | | | - | | | | - | | | | 195,531 | | | | - | | | | - | | | | 195,531 | | | | 6,485,945 | | | | 6,681,476 | |
| | | | | | | | |
Legacy | | | 14,948 | | | | 11,593 | | | | 42,622 | | | | - | | | | - | | | | 69,163 | | | | 141,972 | | | | 211,135 | |
| | | | | | | | |
Leasing | | | - | | | | - | | | | 3,495 | | | | - | | | | - | | | | 3,495 | | | | 540,266 | | | | 543,761 | |
| | | | | | | | |
Consumer: | | | | | | | | | | | | | | | | | | | | | | | | | | | | | | | | |
| | | | | | | | |
Credit cards | | | - | | | | - | | | | 21,530 | | | | - | | | | - | | | | 21,530 | | | | 1,163,742 | | | | 1,185,272 | |
| | | | | | | | |
HELOCs | | | - | | | | - | | | | 3,982 | | | | - | | | | 7,741 | | | | 11,723 | | | | 466,488 | | | | 478,211 | |
| | | | | | | | |
Personal | | | - | | | | - | | | | 8,488 | | | | - | | | | 710 | | | | 9,198 | | | | 1,339,921 | | | | 1,349,119 | |
| | | | | | | | |
Auto | | | - | | | | - | | | | 10,407 | | | | - | | | | 157 | | | | 10,564 | | | | 689,416 | | | | 699,980 | |
| | | | | | | | |
Other | | | - | | | | - | | | | 2,039 | | | | - | | | | 3,532 | | | | 5,571 | | | | 214,073 | | | | 219,644 | |
| |
| | | | | | | | |
Total Consumer | | | - | | | | - | | | | 46,446 | | | | - | | | | 12,140 | | | | 58,586 | | | | 3,873,640 | | | | 3,932,226 | |
| |
| | | | | | | | |
Total Popular, Inc. | | $ | 1,431,266 | | | $ | 569,572 | | | $ | 1,316,737 | | | $ | 2,318 | | | $ | 12,698 | | | $ | 3,332,591 | | | $ | 18,279,275 | | | $ | 21,611,866 | |
| |
The following table presents the weighted average obligor risk rating at December 31, 2013 for those classifications that consider a range of rating scales.
| | | | | | | | | | |
| Weighted average obligor risk rating Puerto Rico:[1] | | (Scales 11 and 12)
Substandard | | | | (Scales 1 through 8)
Pass | | | |
Commercial multi-family | | 11.33 | | | | | 5.31 | | | |
Commercial real estate non-owner occupied | | 11.38 | | | | | 6.73 | | | |
172
| | | | | | | | | | | | | | | | | | | | | | | | | | | | | | | | |
Commercial real estate owner occupied | | | | | | | | 11.31 | | | | | | | | | | | | | | | | 6.89 | | | | | |
Commercial and industrial | | | | 11.34 | | | | | | | | | | | | | | | | 6.63 | | | | | |
| | | | | | | | | | | | | | | | | | | | | | | | | | | | | | | | |
Total Commercial | | | | | | | | | | | 11.33 | | | | | | | | | | | | | | | | 6.71 | | | | | |
| | | | | | | | | | | | | | | | | | | | | | | | | | | | | | | | |
Construction | | | | | | | | | | | 11.63 | | | | | | | | | | | | | | | | 7.86 | | | | | |
| | | | | | | | | | | | | | | | | | | | | | | | | | | | | | | | |
| | | | | | | | |
| U.S. mainland: | | | | | | | | Substandard | | | | | | | | | | | | Pass | | | | |
Commercial multi-family | | | | | | | | | | | 11.34 | | | | | | | | | | | | | | | | 7.08 | | | | | |
Commercial real estate non-owner occupied | | | | 11.27 | | | | | | | | | | | | | | | | 6.89 | | | | | |
Commercial real estate owner occupied | | | | 11.31 | | | | | | | | | | | | | | | | 7.04 | | | | | |
Commercial and industrial | | | | 11.09 | | | | | | | | | | | | | | | | 6.53 | | | | | |
| | | | | | | | | | | | | | | | | | | | | | | | | | | | | | | | |
Total Commercial | | | | | | | | | | | 11.27 | | | | | | | | | | | | | | | | 6.89 | | | | | |
| | | | | | | | | | | | | | | | | | | | | | | | | | | | | | | | |
Construction | | | | | | | | | | | 11.27 | | | | | | | | | | | | | | | | 7.64 | | | | | |
| | | | | | | | | | | | | | | | | | | | | | | | | | | | | | | | |
Legacy | | | | | | | | | | | 11.24 | | | | | | | | | | | | | | | | 7.72 | | | | | |
| | | | | | | | | | | | | | | | | | | | | | | | | | | | | | | | |
| |
|
| [1] Excludes covered loans acquired in the Westernbank FDIC-assisted transaction. | |
| |
|
| December 31, 2012 | |
| |
| (In thousands) | | Watch | | | Special
Mention | | | Substandard | | | Doubtful | | | Loss | | | Sub-total | | | Pass/ Unrated | | | Total | |
| |
| | | | | | | | |
Puerto Rico[1] | | | | | | | | | | | | | | | | | | | | | | | | | | | | | | | | |
| | | | | | | | |
Commercial multi-family | | $ | 978 | | | $ | 255 | | | $ | 16,736 | | | $ | - | | | $ | - | | | $ | 17,969 | | | $ | 97,124 | | | $ | 115,093 | |
| | | | | | | | |
Commercial real estate non-owner occupied | | | 120,608 | | | | 156,853 | | | | 252,068 | | | | - | | | | - | | | | 529,529 | | | | 820,904 | | | | 1,350,433 | |
| | | | | | | | |
Commercial real estate owner occupied | | | 195,876 | | | | 140,788 | | | | 647,458 | | | | 1,242 | | | | - | | | | 985,364 | | | | 1,057,122 | | | | 2,042,486 | |
| | | | | | | | |
Commercial and industrial | | | 438,758 | | | | 201,660 | | | | 410,026 | | | | 4,162 | | | | 682 | | | | 1,055,288 | | | | 1,732,984 | | | | 2,788,272 | |
|
| |
| | | | | | | | |
Total Commercial | | | 756,220 | | | | 499,556 | | | | 1,326,288 | | | | 5,404 | | | | 682 | | | | 2,588,150 | | | | 3,708,134 | | | | 6,296,284 | |
| | | | | | | | |
Construction | | | 645 | | | | 31,789 | | | | 41,278 | | | | - | | | | - | | | | 73,712 | | | | 138,555 | | | | 212,267 | |
| | | | | | | | |
Mortgage | | | - | | | | - | | | | 569,334 | | | | - | | | | - | | | | 569,334 | | | | 4,379,590 | | | | 4,948,924 | |
| | | | | | | | |
Leasing | | | - | | | | - | | | | 4,742 | | | | - | | | | 123 | | | | 4,865 | | | | 535,658 | | | | 540,523 | |
| | | | | | | | |
Consumer: | | | | | | | | | | | | | | | | | | | | | | | | | | | | | | | | |
| | | | | | | | |
Credit cards | | | - | | | | - | | | | 22,965 | | | | - | | | | - | | | | 22,965 | | | | 1,160,107 | | | | 1,183,072 | |
| | | | | | | | |
HELOCs | | | - | | | | - | | | | 1,333 | | | | - | | | | 3,269 | | | | 4,602 | | | | 12,204 | | | | 16,806 | |
| | | | | | | | |
Personal | | | - | | | | - | | | | 8,203 | | | | - | | | | 77 | | | | 8,280 | | | | 1,237,502 | | | | 1,245,782 | |
| | | | | | | | |
Auto | | | - | | | | - | | | | 8,551 | | | | - | | | | - | | | | 8,551 | | | | 551,765 | | | | 560,316 | |
| | | | | | | | |
Other | | | - | | | | - | | | | 3,036 | | | | - | | | | - | | | | 3,036 | | | | 225,317 | | | | 228,353 | |
|
| |
| | | | | | | | |
Total Consumer | | | - | | | | - | | | | 44,088 | | | | - | | | | 3,346 | | | | 47,434 | | | | 3,186,895 | | | | 3,234,329 | |
|
| |
| | | | | | | | |
Total Puerto Rico | | $ | 756,865 | | | $ | 531,345 | | | $ | 1,985,730 | | | $ | 5,404 | | | $ | 4,151 | | | $ | 3,283,495 | | | $ | 11,948,832 | | | $ | 15,232,327 | |
|
| |
| | | | | | | | |
U.S. mainland | | | | | | | | | | | | | | | | | | | | | | | | | | | | | | | | |
| | | | | | | | |
Commercial multi-family | | $ | 78,490 | | | $ | 22,050 | | | $ | 71,658 | | | $ | - | | | $ | - | | | $ | 172,198 | | | $ | 734,489 | | | $ | 906,687 | |
| | | | | | | | |
Commercial real estate non-owner occupied | | | 108,806 | | | | 55,911 | | | | 204,532 | | | | - | | | | - | | | | 369,249 | | | | 914,750 | | | | 1,283,999 | |
| | | | | | | | |
Commercial real estate owner occupied | | | 22,423 | | | | 6,747 | | | | 113,161 | | | | - | | | | - | | | | 142,331 | | | | 423,633 | | | | 565,964 | |
| | | | | | | | |
Commercial and industrial | | | 24,489 | | | | 8,889 | | | | 65,562 | | | | - | | | | - | | | | 98,940 | | | | 706,328 | | | | 805,268 | |
|
| |
| | | | | | | | |
Total Commercial | | | 234,208 | | | | 93,597 | | | | 454,913 | | | | - | | | | - | | | | 782,718 | | | | 2,779,200 | | | | 3,561,918 | |
| | | | | | | | |
Construction | | | 5,268 | | | | - | | | | 21,182 | | | | - | | | | - | | | | 26,450 | | | | 14,140 | | | | 40,590 | |
| | | | | | | | |
Mortgage | | | - | | | | - | | | | 34,077 | | | | - | | | | - | | | | 34,077 | | | | 1,095,506 | | | | 1,129,583 | |
| | | | | | | | |
Legacy | | | 26,176 | | | | 15,225 | | | | 109,470 | | | | - | | | | - | | | | 150,871 | | | | 233,346 | | | | 384,217 | |
| | | | | | | | |
Consumer: | | | | | | | | | | | | | | | | | | | | | | | | | | | | | | | | |
| | | | | | | | |
Credit cards | | | - | | | | - | | | | 505 | | | | - | | | | - | | | | 505 | | | | 14,636 | | | | 15,141 | |
| | | | | | | | |
HELOCs | | | - | | | | - | | | | 3,150 | | | | - | | | | 4,304 | | | | 7,454 | | | | 466,775 | | | | 474,229 | |
| | | | | | | | |
Personal | | | - | | | | - | | | | 785 | | | | - | | | | 941 | | | | 1,726 | | | | 141,403 | | | | 143,129 | |
| | | | | | | | |
Auto | | | - | | | | - | | | | - | | | | - | | | | 4 | | | | 4 | | | | 764 | | | | 768 | |
| | | | | | | | |
Other | | | - | | | | - | | | | 3 | | | | - | | | | - | | | | 3 | | | | 1,287 | | | | 1,290 | |
|
| |
| | | | | | | | |
Total Consumer | | | - | | | | - | | | | 4,443 | | | | - | | | | 5,249 | | | | 9,692 | | | | 624,865 | | | | 634,557 | |
|
| |
| | | | | | | | |
Total U.S. mainland | | $ | 265,652 | | | $ | 108,822 | | | $ | 624,085 | | | $ | - | | | $ | 5,249 | | | $ | 1,003,808 | | | $ | 4,747,057 | | | $ | 5,750,865 | |
|
| |
| | | | | | | | |
Popular, Inc. | | | | | | | | | | | | | | | | | | | | | | | | | | | | | | | | |
| | | | | | | | |
Commercial multi-family | | $ | 79,468 | | | $ | 22,305 | | | $ | 88,394 | | | $ | - | | | $ | - | | | $ | 190,167 | | | $ | 831,613 | | | $ | 1,021,780 | |
| | | | | | | | |
Commercial real estate non-owner occupied | | | 229,414 | | | | 212,764 | | | | 456,600 | | | | - | | | | - | | | | 898,778 | | | | 1,735,654 | | | | 2,634,432 | |
| | | | | | | | |
Commercial real estate owner occupied | | | 218,299 | | | | 147,535 | | | | 760,619 | | | | 1,242 | | | | - | | | | 1,127,695 | | | | 1,480,755 | | | | 2,608,450 | |
| | | | | | | | |
Commercial and industrial | | | 463,247 | | | | 210,549 | | | | 475,588 | | | | 4,162 | | | | 682 | | | | 1,154,228 | | | | 2,439,312 | | | | 3,593,540 | |
|
| |
| | | | | | | | |
Total Commercial | | | 990,428 | | | | 593,153 | | | | 1,781,201 | | | | 5,404 | | | | 682 | | | | 3,370,868 | | | | 6,487,334 | | | | 9,858,202 | |
| | | | | | | | |
Construction | | | 5,913 | | | | 31,789 | | | | 62,460 | | | | - | | | | - | | | | 100,162 | | | | 152,695 | | | | 252,857 | |
| | | | | | | | |
Mortgage | | | - | | | | - | | | | 603,411 | | | | - | | | | - | | | | 603,411 | | | | 5,475,096 | | | | 6,078,507 | |
173
| | | | | | | | | | | | | | | | | | | | | | | | | | | | | | | | |
Legacy | | | 26,176 | | | | 15,225 | | | | 109,470 | | | | - | | | | - | | | | 150,871 | | | | 233,346 | | | | 384,217 | |
Leasing | | | - | | | | - | | | | 4,742 | | | | - | | | | 123 | | | | 4,865 | | | | 535,658 | | | | 540,523 | |
Consumer: | | | | | | | | | | | | | | | | | | | | | | | | | | | | | | | | |
Credit cards | | | - | | | | - | | | | 23,470 | | | | - | | | | - | | | | 23,470 | | | | 1,174,743 | | | | 1,198,213 | |
HELOCs | | | - | | | | - | | | | 4,483 | | | | - | | | | 7,573 | | | | 12,056 | | | | 478,979 | | | | 491,035 | |
Personal | | | - | | | | - | | | | 8,988 | | | | - | | | | 1,018 | | | | 10,006 | | | | 1,378,905 | | | | 1,388,911 | |
Auto | | | - | | | | - | | | | 8,551 | | | | - | | | | 4 | | | | 8,555 | | | | 552,529 | | | | 561,084 | |
Other | | | - | | | | - | | | | 3,039 | | | | - | | | | - | | | | 3,039 | | | | 226,604 | | | | 229,643 | |
| |
Total Consumer | | | - | | | | - | | | | 48,531 | | | | - | | | | 8,595 | | | | 57,126 | | | | 3,811,760 | | | | 3,868,886 | |
| |
| | | | | | | | |
Total Popular, Inc. | | | $ 1,022,517 | | | | $ 640,167 | | | | $ 2,609,815 | | | | $ 5,404 | | | | $ 9,400 | | | | $ 4,287,303 | | | | $ 16,695,889 | | | | $ 20,983,192 | |
| |
The following table presents the weighted average obligor risk rating at December 31, 2012 for those classifications that consider a range of rating scales. | |
Weighted average obligor risk rating | | | | (Scales 11 and 1 | 2) | | | | | | | | | | | | | | | (Scales 1 throug | h 8) | | | | |
| | | | | | | | |
| Puerto Rico:[1] | | | | | | | | Substandard | | | | | | | | | | | | Pass | | | | |
Commercial multi-family | | | | 11.94 | | | | | | | | | | | | | | | | 5.68 | | | | | |
Commercial real estate non-owner occupied | | | | 11.28 | | | | | | | | | | | | | | | | 6.98 | | | | | |
Commercial real estate owner occupied | | | | 11.51 | | | | | | | | | | | | | | | | 6.93 | | | | | |
Commercial and industrial | | | | 11.35 | | | | | | | | | | | | | | | | 6.69 | | | | | |
| | | | | | | | | | | | | | | | | | | | | | | | | | | | | | | | |
Total Commercial | | | | 11.42 | | | | | | | | | | | | | | | | 6.81 | | | | | |
| | | | | | | | | | | | | | | | | | | | | | | | | | | | | | | | |
Construction | | | | 11.99 | | | | | | | | | | | | | | | | 7.86 | | | | | |
| | | | | | | | | | | | | | | | | | | | | | | | | | | | | | | | |
| | | | | | |
| U.S. mainland: | | | Substandard | | | | | | | | | | | | Pass | | | | |
Commercial multi-family | | | | 11.26 | | | | | | | | | | | | | | | | 7.12 | | | | | |
Commercial real estate non-owner occupied | | | | 11.38 | | | | | | | | | | | | | | | | 7.04 | | | | | |
Commercial real estate owner occupied | | | | 11.28 | | | | | | | | | | | | | | | | 6.64 | | | | | |
Commercial and industrial | | | | 11.19 | | | | | | | | | | | | | | | | 6.73 | | | | | |
| | | | | | | | | | | | | | | | | | | | | | | | | | | | | | | | |
Total Commercial | | | | 11.31 | | | | | | | | | | | | | | | | 6.81 | | | | | |
| | | | | | | | | | | | | | | | | | | | | | | | | | | | | | | | |
Construction | | | | | | | | | | | 11.28 | | | | | | | | | | | | | | | | 7.21 | | | | | |
| | | | | | | | | | | | | | | | | | | | | | | | | | | | | | | | |
Legacy | | | | | | | | | | | 11.30 | | | | | | | | | | | | | | | | 7.48 | | | | | |
| | | | | | | | | | | | | | | | | | | | | | | | | | | | | | | | |
| |
|
| [1] Excludes covered loans acquired in the Westernbank FDIC-assisted transaction. | |
| |
174
Note 11– FDIC loss share asset and true-up payment obligation
In connection with the Westernbank FDIC-assisted transaction, BPPR entered into loss share agreements with the FDIC with respect to the covered loans and other real estate owned. Pursuant to the terms of the loss share agreements, the FDIC’s obligation to reimburse BPPR for losses with respect to covered assets begins with the first dollar of loss incurred. The FDIC reimburses BPPR for 80% of losses with respect to covered assets, and BPPR reimburses the FDIC for 80% of recoveries with respect to losses for which the FDIC paid 80% reimbursement under loss share agreements. The loss share agreement applicable to single-family residential mortgage loans provides for FDIC loss and recoveries sharing for ten years expiring at the end of the quarter ending June 30, 2020. The loss share agreement applicable to commercial (including construction) and consumer loans provides for FDIC loss sharing for five years expiring at the end of the quarter ending June 30, 2015 and BPPR reimbursement to the FDIC for eight years expiring at the end of the quarter ending June 30, 2018, in each case, on the same terms and conditions as described above.
The following table sets forth the activity in the FDIC loss share asset for the periods presented.
| | | | | | | | | | | | |
| | | Year ended December 31, | |
| (In thousands) | | 2013 | | | 2012 | | | 2011 | |
| |
Balance at beginning of year | | $ | 1,399,098 | | | $ | 1,915,128 | | | $ | 2,410,219 | |
Amortization of loss share indemnification asset | | | (161,635) | | | | (129,676) | | | | (10,855) | |
Credit impairment losses to be covered under loss sharing agreements | | | 60,454 | | | | 58,187 | | | | 110,457 | |
Reimbursable expenses | | | 50,985 | | | | 30,771 | | | | 5,093 | |
Decrease due to reciprocal accounting on amortization of contingent liability on unfunded commitments | | | (473) | | | | (969) | | | | (33,221) | |
Net payments to (from) FDIC under loss sharing agreements | | | (396,223) | | | | (462,016) | | | | (561,111) | |
Other adjustments attributable to FDIC loss sharing agreements | | | (3,598) | | | | (12,327) | | | | (5,454) | |
| |
Balance at end of period | | $ | 948,608 | | | $ | 1,399,098 | | | $ | 1,915,128 | |
| |
The following table presents the weighted average life of the loan portfolios subject to the FDIC loss sharing agreement for the years ended December 31, 2013 and December 31, 2012.
| | | | | | | | |
| | | Years ended | |
| | | December 31, 2013 | | | December 31, 2012 | |
| |
Commercial | | | 6.43 years | | | | 7.40 years | |
Consumer | | | 3.13 | | | | 2.91 | |
Construction | | | 1.30 | | | | 2.72 | |
Mortgage | | | 6.91 | | | | 6.97 | |
| |
As part of the loss share agreement, BPPR agreed to make a true-up payment obligation (the “true-up payment”) to the FDIC on the date that is 45 days following the last day (the “true-up measurement date”) of the final shared loss month, or upon the final disposition of all covered assets under the loss sharing agreements in the event losses on the loss sharing agreements fail to reach expected levels. The estimated fair value of such true-up payment obligation is recorded as contingent consideration, which is included in the caption of other liabilities in the consolidated statements of financial condition. Under the loss sharing agreements, BPPR will pay to the FDIC 50% of the excess, if any, of: (i) 20% of the intrinsic loss estimate of $4.6 billion (or $925 million) (as determined by the FDIC) less (ii) the sum of: (A) 25% of the asset discount (per bid) (or ($1.1 billion)); plus (B) 25% of the cumulative shared-loss payments (defined as the aggregate of all of the payments made or payable to BPPR minus the aggregate of all of the payments made or payable to the FDIC); plus (C) the sum of the period servicing amounts for every consecutive twelve-month period prior to and ending on the true-up measurement date in respect of each of the loss sharing agreements during which the loss sharing provisions of the applicable loss sharing agreement is in effect (defined as the product of the simple average of the principal amount of shared loss loans and shared loss assets at the beginning and end of such period times 1%).
The following table provides the fair value and the undiscounted amount of the true-up payment obligation at December 31, 2013 and 2012.
| | | | | | | | |
| (In thousands) | | December 31, 2013 | | | December 31, 2012 | |
| |
Carrying amount (fair value) | | $ | 127,513 | | | $ | 111,519 | |
Undiscounted amount | | $ | 185,372 | | | $ | 178,522 | |
| |
175
The loss share agreements contain specific terms and conditions regarding the management of the covered assets that BPPR must follow in order to receive reimbursement on losses from the FDIC. Under the loss share agreements, BPPR must:
| | • | | manage and administer the covered assets and collect and effect charge-offs and recoveries with respect to such covered assets in a manner consistent with its usual and prudent business and banking practices and, with respect to single family shared-loss loans, the procedures (including collection procedures) customarily employed by BPPR in servicing and administering mortgage loans for its own account and the servicing procedures established by FNMA or the Federal Home Loan Mortgage Corporation (“FHLMC”), as in effect from time to time, and in accordance with accepted mortgage servicing practices of prudent lending institutions; |
| | • | | exercise its best judgment in managing, administering and collecting amounts on covered assets and effecting charge-offs with respect to the covered assets; |
| | • | | use commercially reasonable efforts to maximize recoveries with respect to losses on single family shared-loss assets and best efforts to maximize collections with respect to commercial shared-loss assets; |
| | • | | retain sufficient staff to perform the duties under the loss share agreements; |
| | • | | adopt and implement accounting, reporting, record-keeping and similar systems with respect to the commercial shared-loss assets; |
| | • | | comply with the terms of the modification guidelines approved by the FDIC or another federal agency for any single-family shared-loss loan; |
| | • | | provide notice with respect to proposed transactions pursuant to which a third party or affiliate will manage, administer or collect any commercial shared-loss assets; |
| | • | | file monthly and quarterly certificates with the FDIC specifying the amount of losses, charge-offs and recoveries; and |
| | • | | maintain books and records sufficient to ensure and document compliance with the terms of the loss share agreements. |
Refer to Note 28, Commitment and Contingencies, for additional information on the arbitration proceedings with the FDIC regarding the commercial loss share agreement.
Note 12 – Mortgage banking activities
The caption of mortgage banking activities in the consolidated statements of operations consists of the following categories:
| | | | | | | | | | | | |
| | | Year ended December 31, | |
| | | |
| (In thousands) | | 2013 | | | 2012 | | | 2011 | |
| |
| | | |
Mortgage servicing fees, net of fair value adjustments: | | | | | | | | | | | | |
| | | |
Mortgage servicing fees | | $ | 45,481 | | | $ | 48,176 | | | $ | 49,158 | |
| | | |
Mortgage servicing rights fair value adjustments | | | (11,403) | | | | (17,406) | | | | (37,061) | |
| |
| | | |
Total mortgage servicing fees, net of fair value adjustments | | | 34,078 | | | | 30,770 | | | | 12,097 | |
| |
| | | |
Net gain on sale of loans, including valuation on loans held for sale | | | 26,719 | | | | 76,181 | | | | 25,621 | |
| |
| | | |
Trading account profit (loss) : | | | | | | | | | | | | |
| | | |
Unrealized gains on outstanding derivative positions | | | 746 | | | | 304 | | | | 956 | |
| | | |
Realized gains (losses) on closed derivative positions | | | 10,130 | | | | (22,464) | | | | (43,157) | |
| |
| | | |
Total trading account profit (loss) | | | 10,876 | | | | (22,160) | | | | (42,201) | |
| |
| | | |
Total mortgage banking activities | | $ | 71,673 | | | $ | 84,791 | | | $ | (4,483) | |
| |
176
Note 13 – Transfers of financial assets and servicing assets
The Corporation typically transfers conforming residential mortgage loans in conjunction with GNMA, FNMA and FHLMC securitization transactions whereby the loans are exchanged for cash or securities and servicing rights. The securities issued through these transactions are guaranteed by the corresponding agency and, as such, under seller/service agreements the Corporation is required to service the loans in accordance with the agencies’ servicing guidelines and standards. Substantially, all mortgage loans securitized by the Corporation in GNMA, FNMA and FHLMC securities have fixed rates and represent conforming loans. As seller, the Corporation has made certain representations and warranties with respect to the originally transferred loans and, in some instances, has sold loans with credit recourse to a government-sponsored entity, namely FNMA. Refer to Note 27 to the consolidated financial statements for a description of such arrangements.
No liabilities were incurred as a result of these securitizations during the years ended December 31, 2013 and 2012 because they did not contain any credit recourse arrangements. The Corporation recorded a net gain of $37.3 million and $75.8 million, respectively, during the years ended December 31, 2013 and 2012 related to these securitized residential mortgage loans.
The following tables present the initial fair value of the assets obtained as proceeds from residential mortgage loans securitized during the years ended December 31, 2013 and 2012:
| | | | | | | | | | | | | | | | |
| | | Proceeds obtained during the year ended December 31, 2013 | |
| |
| | | | |
| (In thousands) | | Level 1 | | | Level 2 | | | Level 3 | | | Initial fair value | |
| |
| | | | |
Assets | | | | | | | | | | | | | | | | |
| |
| | | | |
Trading account securities: | | | | | | | | | | | | | | | | |
| | | | |
Mortgage-backed securities - GNMA | | | - | | | | $ 919,980 | | | | - | | | | $ 919,980 | |
| | | | |
Mortgage-backed securities - FNMA | | | - | | | | 438,236 | | | | - | | | | 438,236 | |
| | | | |
Mortgage-backed securities - FHLMC | | | - | | | | 33,378 | | | | - | | | | 33,378 | |
| |
| | | | |
Total trading account securities | | | - | | | | $ 1,391,594 | | | | - | | | | $ 1,391,594 | |
| |
| | | | |
Mortgage servicing rights | | | - | | | | - | | | $ | 17,639 | | | | $17,639 | |
| |
| | | | |
Total | | | - | | | | $ 1,391,594 | | | $ | 17,639 | | | | $ 1,409,233 | |
| |
| |
| | | Proceeds obtained during the year ended December 31, 2012 | |
| |
| | | | |
| (In thousands) | | Level 1 | | | Level 2 | | | Level 3 | | | Initial fair value | |
| |
| | | | |
Assets | | | | | | | | | | | | | | | | |
| |
| | | | |
Trading account securities: | | | | | | | | | | | | | | | | |
| | | | |
Mortgage-backed securities - GNMA | | | - | | | | $ 838,795 | | | | - | | | | $ 838,795 | |
| | | | |
Mortgage-backed securities - FNMA | | | - | | | | 453,697 | | | | - | | | | 453,697 | |
| | | | |
Mortgage-backed securities - FHLMC | | | - | | | | 38,251 | | | | - | | | | 38,251 | |
| |
| | | | |
Total trading account securities | | | - | | | | $ 1,330,743 | | | | - | | | | $ 1,330,743 | |
| |
| | | | |
Mortgage servicing rights | | | - | | | | - | | | $ | 15,793 | | | | $15,793 | |
| |
| | | | |
Total | | | - | | | | $ 1,330,743 | | | $ | 15,793 | | | | $ 1,346,536 | |
| |
During the year ended December 31, 2013 the Corporation retained servicing rights (“MSRs”) on whole loan sales involving approximately $152 million in principal balance outstanding (2012 - $259 million), with net realized gains of approximately $5.3 million (2012 - $12.6 million). All loan sales performed during the year ended December 31, 2013 and 2012 were without credit recourse agreements.
The Corporation recognizes as assets the rights to service loans for others, whether these rights are purchased or result from asset transfers such as sales and securitizations.
The Corporation uses a discounted cash flow model to estimate the fair value of MSRs. The discounted cash flow model incorporates assumptions that market participants would use in estimating future net servicing income, including estimates of
177
prepayment speeds, discount rate, cost to service, escrow account earnings, contractual servicing fee income, prepayment and late fees, among other considerations. Prepayment speeds are adjusted for the Corporation’s loan characteristics and portfolio behavior.
The following table presents the changes in MSRs measured using the fair value method for the years ended December 31, 2013 and 2012.
| | | | | | | | | | |
| Residential MSRs | |
| |
| | | |
| (In thousands) | | 2013 | | | | | 2012 | |
| |
| | | |
Fair value at beginning of period | | $ | 154,430 | | | | | $ | 151,323 | |
| | | |
Purchases | | | 45 | | | | | | 2,231 | |
| | | |
Servicing from securitizations or asset transfers | | | 19,262 | | | | | | 18,495 | |
| | | |
Changes due to payments on loans[1] | | | (22,556) | | | | | | (20,275) | |
| | | |
Sale of servicing assets | | | - | | | | | | (103) | |
| | | |
Reduction due to loan repurchases | | | (3,871) | | | | | | (5,200) | |
| | | |
Changes in fair value due to changes in valuation model inputs or assumptions | | | 15,024 | | | | | | 8,069 | |
| | | |
Other disposals | | | (1,235) | | | | | | (110) | |
| |
| | | |
Fair value at end of period | | $ | 161,099 | | | | | $ | 154,430 | |
| |
[1] Represents changes due to collection / realization of expected cash flows over time. | |
| |
Residential mortgage loans serviced for others were $16.3 billion at December 31, 2013 (2012 - $16.7 billion).
Net mortgage servicing fees, a component of mortgage banking activities in the consolidated statements of operations, include the changes from period to period in the fair value of the MSRs, which may result from changes in the valuation model inputs or assumptions (principally reflecting changes in discount rates and prepayment speed assumptions) and other changes, including changes due to collection / realization of expected cash flows. Mortgage servicing fees, excluding fair value adjustments, for the year ended December 31, 2013 amounted to $45.5 million (2012 - $48.2 million; 2011 - $49.2 million). The banking subsidiaries receive servicing fees based on a percentage of the outstanding loan balance. At December 31, 2013, those weighted average mortgage servicing fees were 0.27% (2012 – 0.28%). Under these servicing agreements, the banking subsidiaries do not generally earn significant prepayment penalty fees on the underlying loans serviced.
The section below includes information on assumptions used in the valuation model of the MSRs, originated and purchased.
Key economic assumptions used in measuring the servicing rights retained at the date of the residential mortgage loan securitizations and whole loan sales by the banking subsidiaries during the years ended December 31, 2013 and 2012 were as follows:
| | | | | | | | |
| | | Year ended | |
| | |
| | | December 31, 2013 | | | December 31, 2012 | |
| |
| | |
Prepayment speed | | | 6.6 % | | | | 6.6 % | |
| | |
Weighted average life | | | 15.2 years | | | | 15.2 years | |
| | |
Discount rate (annual rate) | | | 11.0 % | | | | 11.4 % | |
| |
Key economic assumptions used to estimate the fair value of MSRs derived from sales and securitizations of mortgage loans performed by the banking subsidiaries and the sensitivity to immediate changes in those assumptions at December 31, 2013 and 2012 were as follows:
| | | | |
| Originated MSRs | | |
| |
| | | December 31, |
| | |
| (In thousands) | | 2013 | | 2012 |
|
178
| | | | | | | | | | |
| |
| | | |
Fair value of servicing rights | | $ | 115,753 | | | | | $ | 102,727 | |
| | | |
Weighted average life | | | 12.5 years | | | | | | 10.2 years | |
| | | |
Weighted average prepayment speed (annual rate) | | | 8.0 % | | | | | | 9.8 % | |
| | | |
Impact on fair value of 10% adverse change | | $ | (3,763) | | | | | $ | (3,226) | |
| | | |
Impact on fair value of 20% adverse change | | $ | (7,459) | | | | | $ | (7,018) | |
| | | |
Weighted average discount rate (annual rate) | | | 11.6 % | | | | | | 12.3 % | |
| | | |
Impact on fair value of 10% adverse change | | $ | (4,930) | | | | | $ | (3,518) | |
| | | |
Impact on fair value of 20% adverse change | | $ | (9,595) | | | | | $ | (7,505) | |
| |
The banking subsidiaries also own servicing rights purchased from other financial institutions. The fair value of purchased MSRs, their related valuation assumptions and the sensitivity to immediate changes in those assumptions at December 31, 2013 and 2012 were as follows:
| | | | | | | | |
| Purchased MSRs | |
| | | December 31, | |
| | |
| (In thousands) | | 2013 | | | 2012 | |
| |
| | |
Fair value of servicing rights | | $ | 45,346 | | | $ | 51,703 | |
| | |
Weighted average life | | | 10.9 years | | | | 11.0 years | |
| | |
Weighted average prepayment speed (annual rate) | | | 9.2 % | | | | 9.1 % | |
| | |
Impact on fair value of 10% adverse change | | $ | (1,969) | | | $ | (2,350) | |
| | |
Impact on fair value of 20% adverse change | | $ | (3,478) | | | $ | (4,024) | |
| | |
Weighted average discount rate (annual rate) | | | 10.8 % | | | | 11.4 % | |
| | |
Impact on fair value of 10% adverse change | | $ | (2,073) | | | $ | (2,516) | |
| | |
Impact on fair value of 20% adverse change | | $ | (3,655) | | | $ | (4,317) | |
| |
The sensitivity analyses presented in the tables above for servicing rights are hypothetical and should be used with caution. As the figures indicate, changes in fair value based on a 10 and 20 percent variation in assumptions generally cannot be extrapolated because the relationship of the change in assumption to the change in fair value may not be linear. Also, in the sensitivity tables included herein, the effect of a variation in a particular assumption on the fair value of the retained interest is calculated without changing any other assumption. In reality, changes in one factor may result in changes in another (for example, increases in market interest rates may result in lower prepayments and increased credit losses), which might magnify or counteract the sensitivities.
At December 31, 2013, the Corporation serviced $2.5 billion (2012 - $2.9 billion) in residential mortgage loans subject to credit recourse provision, principally loans associated with FNMA and FHLMC residential mortgage loan securitization programs.
Under the GNMA securitizations, the Corporation, as servicer, has the right to repurchase (but not the obligation), at its option and without GNMA’s prior authorization, any loan that is collateral for a GNMA guaranteed mortgage-backed security when certain delinquency criteria are met. At the time that individual loans meet GNMA’s specified delinquency criteria and are eligible for repurchase, the Corporation is deemed to have regained effective control over these loans if the Corporation was the pool issuer. At December 31, 2013, the Corporation had recorded $48 million in mortgage loans on its consolidated statements of financial condition related to this buy-back option program (2012 - $56 million). As long as the Corporation continues to service the loans that continue to be collateral in a GNMA guaranteed mortgage-backed security, the MSR is recognized by the Corporation. During the year ended December 31, 2013, the Corporation repurchased approximately $209 million of mortgage loans under the GNMA buy-back option program (2012 - $255 million). The determination to repurchase these loans was based on the economic benefits of the transaction, which results in a reduction of the servicing costs for these severely delinquent loans, mostly related to principal and interest advances. Furthermore, due to their guaranteed nature, the risk associated with the loans is low. The Corporation places these loans under its loss mitigation programs and once brought back to current status, these may be either retained in portfolio or re-sold in the secondary market.
The Corporation also has the rights to service a portfolio of Small Business Administration (“SBA”) commercial loans. The SBA servicing rights are measured at the lower of cost or fair value method. The following table presents the activity in the SBA servicing rights for the years ended December 31, 2013 and 2012. During 2013 and 2012, the Corporation did not execute any sale of SBA loans.
179
| | | | | | | | |
| (In thousands) | | 2013 | | | 2012 | |
| |
| | |
Balance at beginning of year | | $ | 695 | | | $ | 1,087 | |
| | |
Amortization | | | (255) | | | | (392) | |
| |
| | |
Balance at end of year | | $ | 440 | | | $ | 695 | |
| |
| | |
Fair value at end of year | | $ | 1,609 | | | $ | 2,414 | |
| |
SBA loans serviced for others were $451 million at December 31, 2013 (2012 - $485 million).
In 2013 weighted average servicing fees on the SBA serviced loans were approximately 1.02% (2012 - 1.03%).
Key economic assumptions used to estimate the fair value of SBA loans and the sensitivity to immediate changes in those assumptions were as follows:
| | | | | | | | |
| SBA Loans | |
| |
| | |
| (In thousands) | | 2013 | | | 2012 | |
| |
| | |
Carrying amount of retained interests | | $ | 440 | | | $ | 695 | |
| | |
Fair value of retained interests | | $ | 1,609 | | | $ | 2,414 | |
| | |
Weighted average life | | | 3.0 | years | | | 3.1 years | |
| | |
Weighted average prepayment speed (annual rate) | | | 7.2 | % | | | 5.6 % | |
| | |
Impact on fair value of 10% adverse change | | $ | (27 | ) | | $ | (33) | |
| | |
Impact on fair value of 20% adverse change | | $ | (56 | ) | | $ | (68) | |
| | |
Weighted average discount rate (annual rate) | | | 13.0 | % | | | 13.0 % | |
| | |
Impact on fair value of 10% adverse change | | $ | (46 | ) | | $ | (72) | |
| | |
Impact on fair value of 20% adverse change | | $ | (94 | ) | | $ | (148) | |
| |
Quantitative information about delinquencies, net credit losses, and components of securitized financial assets and other assets managed together with them by the Corporation, including its own loan portfolio, for the years ended December 31, 2013 and 2012, are disclosed in the following tables. Loans securitized/sold represent loans in which the Corporation has continuing involvement in the form of credit recourse.
| | | | | | | | | | | | |
| 2013 | |
| |
| | | |
| (In thousands) | | Total principal amount of loans, net of unearned | | | Principal amount 60 days or more past due | | | Net credit losses (recoveries) | |
| |
| | | |
Loans (owned and managed): | | | | | | | | | | | | |
| | | |
Commercial | | $ | 10,037,787 | | | $ | 305,488 | | | $ | 270,266 | |
| | | |
Construction | | | 206,084 | | | | 23,771 | | | | (6,796) | |
| | | |
Legacy | | | 211,135 | | | | 17,148 | | | | (2,583) | |
| | | |
Lease financing | | | 543,761 | | | | 5,102 | | | | 3,506 | |
| | | |
Mortgage | | | 9,315,454 | | | | 1,033,419 | | | | 260,682 | |
| | | |
Consumer | | | 3,932,226 | | | | 95,329 | | | | 96,971 | |
| | | |
Covered loans | | | 2,984,427 | | | | 771,662 | | | | 76,210 | |
| | | |
Less: | | | | | | | | | | | | |
| | | |
Loans securitized / sold | | | (2,524,155) | | | | (196,590) | | | | (5,641) | |
| | | |
Loans held-for-sale | | | (110,426) | | | | (1,184) | | | | (362,645) | |
| |
180
| | | | | | | | | | | | |
| |
| | | |
Loans held-in-portfolio | | $ | 24,596,293 | | | $ | 2,054,145 | | | $ | 329,970 | |
| |
| | | | | | | | | | | | |
| 2012 | |
| |
| | | |
| (In thousands) | | Total principal amount of loans, net of unearned | | | Principal amount 60 days or more past due | | | Net credit losses (recoveries) | |
| |
| | | |
Loans (owned and managed): | | | | | | | | | | | | |
| | | |
Commercial | | $ | 9,874,249 | | | $ | 714,411 | | | $ | 189,293 | |
| | | |
Construction | | | 330,997 | | | | 123,170 | | | | (1,883) | |
| | | |
Legacy | | | 386,297 | | | | 60,853 | | | | 16,338 | |
| | | |
Lease financing | | | 540,523 | | | | 6,420 | | | | 943 | |
| | | |
Mortgage | | | 9,269,263 | | | | 1,361,636 | | | | 72,771 | |
| | | |
Consumer | | | 3,868,886 | | | | 93,119 | | | | 126,099 | |
| | | |
Covered loans | | | 3,755,972 | | | | 1,166,426 | | | | 90,878 | |
| | | |
Less: | | | | | | | | | | | | |
| | | |
Loans securitized / sold | | | (2,932,555) | | | | (235,584) | | | | (797) | |
| | | |
Loans held-for-sale | | | (354,468) | | | | (96,360) | | | | (34) | |
| |
| | | |
Loans held-in-portfolio | | $ | 24,739,164 | | | $ | 3,194,091 | | | $ | 493,608 | |
| |
Note 14 - Premises and equipment
The premises and equipment are stated at cost less accumulated depreciation and amortization as follows:
| | | | | | | | | | |
| (In thousands) | | Useful life in years | | 2013 | | | 2012 | |
| |
| | | |
Land | | | | $ | 110,453 | | | $ | 108,851 | |
| |
| | | |
Buildings | | 10-50 | | | 500,474 | | | | 496,621 | |
| | | |
Equipment | | 2-10 | | | 305,814 | | | | 306,925 | |
| | | |
Leasehold improvements | | 3-10 | | | 86,020 | | | | 85,314 | |
| |
| | | |
| | | | | 892,308 | | | | 888,860 | |
| | | |
Less - Accumulated depreciation and amortization | | | | | 488,497 | | | | 472,684 | |
| |
| | | |
Subtotal | | | | | 403,811 | | | | 416,176 | |
| |
| | | |
Construction in progress | | | | | 5,252 | | | | 10,766 | |
| |
| | | |
Total premises and equipment, net | | | | $ | 519,516 | | | $ | 535,793 | |
| |
Depreciation and amortization of premises and equipment for the year 2013 was $48.2 million (2012 -$46.7 million; 2011 - $46.4 million), of which $24.8 million (2012 - $24.2 million; 2011 - $23.8 million) was charged to occupancy expense and $23.4 million (2012 - $22.5 million; 2011 - $22.6 million) was charged to equipment, communications and other operating expenses. Occupancy expense is net of rental income of $26.0 million (2012 - $22.9 million; 2011 - $23.3 million).
181
Note 15 – Other assets
The caption of other assets in the consolidated statements of financial condition consists of the following major categories:
| | | | | | | | |
| (In thousands) | | 2013 | | | 2012 | |
| |
| | |
Net deferred tax assets (net of valuation allowance) | | $ | 761,768 | | | $ | 541,499 | |
| | |
Investments under the equity method | | | 197,006 | | | | 246,776 | |
| | |
Bank-owned life insurance program | | | 228,805 | | | | 233,475 | |
| | |
Prepaid FDIC insurance assessment | | | 383 | | | | 27,533 | |
| | |
Prepaid taxes | | | 91,504 | | | | 88,360 | |
| | |
Other prepaid expenses | | | 67,108 | | | | 60,626 | |
| | |
Derivative assets | | | 34,710 | | | | 41,925 | |
| | |
Trades receivables from brokers and counterparties | | | 71,680 | | | | 137,542 | |
| | |
Others | | | 234,594 | | | | 191,842 | |
| |
| | |
Total other assets | | $ | 1,687,558 | | | $ | 1,569,578 | |
| |
Note 16 - Investments in equity investees
During the year ended December 31, 2013, the Corporation recorded pre-tax earnings of $42.9 million, from its equity investments, compared to $73.5 million year ended December 31, 2012. The carrying value of the Corporation’s equity method investments was $197 million and $247 million at December 31, 2013 and 2012, respectively.
The following table presents aggregated summarized financial information of the Corporation’s equity method investees:
| | | | | | | | | | | | |
| Years ended December 31, | | 2013 | | | 2012 | | | 2011 | |
| |
(in thousands) | | | | | | | | | | | | |
| | | |
Operating results: | | | | | | | | | | | | |
| | | |
Total revenues | | $ | 1,302,637 | | | $ | 796,185 | | | $ | 623,595 | |
| | | |
Total expenses | | | 1,024,713 | | | | 570,450 | | | | 579,186 | |
| | | |
Income tax (benefit) expense | | | 39,301 | | | | (36,914) | | | | (16,656) | |
| |
| | | |
Net income | | $ | 238,623 | | | $ | 262,649 | | | $ | 61,065 | |
| |
| | | | | | | | | | |
| At December 31, | | | | 2013 | | | 2012 | |
| |
(in thousands) | | | | | | | | | | |
| | | |
Balance Sheet: | | | | | | | | | | |
| | | |
Total assets | | | | $ | 5,987,802 | | | $ | 5,652,824 | |
| | | |
Total liabilities | | | | $ | 4,036,484 | | | $ | 3,921,888 | |
| |
Summarized financial information for these investees may be presented on a lag, due to the unavailability of information for the investees, at the respective balance sheet dates.
182
Note 17 – Goodwill and other intangible assets
The changes in the carrying amount of goodwill for the years ended December 31, 2013, and 2012, allocated by reportable segments and corporate group, were as follows (refer to Note 42 for the definition of the Corporation’s reportable segments):
| | | | | | | | | | | | | | | | | | | | |
| 2013 | |
| |
| | | | | |
| | | | | | | | | Purchase | | | | | | | |
| | | | | |
| | | Balance at | | | Goodwill on | | | accounting | | | | | | Balance at | |
| | | | | |
| (In thousands) | | January 1, 2013 | | | acquisition | | | adjustments | | | Other | | | December 31, 2013 | |
| |
Banco Popular de Puerto Rico | | $ | 245,679 | | | $ | - | | | $ | - | | | $ | - | | | $ | 245,679 | |
Banco Popular North America | | | 402,078 | | | | - | | | | - | | | | - | | | | 402,078 | |
| |
Total Popular, Inc. | | $ | 647,757 | | | $ | - | | | $ | - | | | $ | - | | | $ | 647,757 | |
| |
2012 | |
| |
| | | | | |
| | | | | | | | | Purchase | | | | | | | |
| | | | | |
| | | Balance at | | | Goodwill on | | | accounting | | | | | | Balance at | |
| | | | | |
| (In thousands) | | January 1, 2012 | | | acquisition | | | adjustments | | | Other | | | December 31, 2012 | |
| |
| | | | | |
Banco Popular de Puerto Rico | | $ | 246,272 | | | $ | - | | | $ | (439 | ) | | $ | (154) | | | $ | 245,679 | |
| | | | | |
Banco Popular North America | | | 402,078 | | | | - | | | | - | | | | - | | | | 402,078 | |
| |
| | | | | |
Total Popular, Inc. | | $ | 648,350 | | | $ | - | | | $ | (439 | ) | | $ | (154) | | | $ | 647,757 | |
| |
Purchase accounting adjustments consists of adjustments to the value of the assets acquired and liabilities assumed resulting from the completion of appraisals or other valuations, adjustments to initial estimates recorded for transaction costs, if any, and contingent consideration paid during a contractual contingency period.
The following table presents the gross amount of goodwill and accumulated impairment losses by reportable segments.
| | | | | | | | | | | | | | | | | | | | | | | | |
| December 31, 2013 | |
| |
| | | | | | |
| | | Balance at | | | | | | Balance at | | | Balance at | | | | | | Balance at | |
| | | | | | |
| | | January 1, | | | Accumulated | | | January 1, | | | December 31, | | | Accumulated | | | December 31, | |
| | | | | | |
| | | 2013 | | | impairment | | | 2013 | | | 2013 | | | impairment | | | 2013 | |
| | | | | | |
| (In thousands) | | (gross amounts) | | | losses | | | (net amounts) | | | (gross amounts) | | | losses | | | (net amounts) | |
| |
| | | | | | |
Banco Popular de Puerto Rico | | $ | 245,679 | | | $ | - | | | $ | 245,679 | | | $ | 245,679 | | | $ | - | | | $ | 245,679 | |
| | | | | | |
Banco Popular North America | | | 566,489 | | | | 164,411 | | | | 402,078 | | | | 566,489 | | | | 164,411 | | | | 402,078 | |
| |
| | | | | | |
Total Popular, Inc. | | $ | 812,168 | | | $ | 164,411 | | | $ | 647,757 | | | $ | 812,168 | | | $ | 164,411 | | | $ | 647,757 | |
| |
| | | | | | | | | | | | | | | | | | | | | | | | |
| December 31, 2012 | |
| |
| | | | | | |
| | | Balance at | | | | | | Balance at | | | Balance at | | | | | | Balance at | |
| | | | | | |
| | | January 1, | | | Accumulated | | | January 1, | | | December 31, | | | Accumulated | | | December 31, | |
| | | | | | |
| | | 2012 | | | impairment | | | 2012 | | | 2012 | | | impairment | | | 2012 | |
| | | | | | |
| (In thousands) | | (gross amounts) | | | losses | | | (net amounts) | | | (gross amounts) | | | losses | | | (net amounts) | |
| |
| | | | | | |
Banco Popular de Puerto Rico | | $ | 246,272 | | | $ | - | | | $ | 246,272 | | | $ | 245,679 | | | $ | - | | | $ | 245,679 | |
| | | | | | |
Banco Popular North America | | | 566,489 | | | | 164,411 | | | | 402,078 | | | | 566,489 | | | | 164,411 | | | | 402,078 | |
| |
| | | | | | |
Total Popular, Inc. | | $ | 812,761 | | | $ | 164,411 | | | $ | 648,350 | | | $ | 812,168 | | | $ | 164,411 | | | $ | 647,757 | |
| |
The accumulated impairment losses in the BPNA reportable segment are associated with E-LOAN.
183
At December 31, 2013 and 2012, the Corporation had $ 6 million of identifiable intangible assets, with indefinite useful lives, mostly associated withE-LOAN’s trademark.
The following table reflects the components of other intangible assets subject to amortization:
| | | | | | | | | | | | |
| (In thousands) | | Gross Carrying Amount | | | Accumulated Amortization | | | Net Carrying Value | |
| |
| | | |
December 31, 2013 | | | | | | | | | | | | |
| | | |
Core deposits | | $ | 77,885 | | | $ | 51,737 | | | $ | 26,148 | |
| | | |
Other customer relationships | | | 17,555 | | | | 4,712 | | | | 12,843 | |
| | | |
Other intangibles | | | 135 | | | | 107 | | | | 28 | |
| |
| | | |
Total other intangible assets | | $ | 95,575 | | | $ | 56,556 | | | $ | 39,019 | |
| |
| | | |
December 31, 2012 | | | | | | | | | | | | |
| | | |
Core deposits | | $ | 77,885 | | | $ | 43,627 | | | $ | 34,258 | |
| | | |
Other customer relationships | | | 16,835 | | | | 2,974 | | | | 13,861 | |
| | | |
Other intangibles | | | 135 | | | | 73 | | | | 62 | |
| |
| | | |
Total other intangible assets | | $ | 94,855 | | | $ | 46,674 | | | $ | 48,181 | |
| |
During the year ended 2013 the Corporation recognized $720 thousand in other customer relationship intangible asset associated with the purchase of a dwelling and flood insurance portfolio, which is to be amortized to operating expenses over a 5-year period. There were no intangible assets acquired during the year ended 2012.
During the year ended December 31, 2013, the Corporation recognized $ 9.9 million in amortization expense related to other intangible assets with definite useful lives (2012 - $ 10.1 million; 2011 - $ 9.7 million).
The following table presents the estimated amortization of the intangible assets with definite useful lives for each of the following periods:
| | | | |
| (In thousands) | | | |
| |
| |
Year 2014 | | $ | 9,371 | |
| |
Year 2015 | | | 7,228 | |
| |
Year 2016 | | | 6,943 | |
| |
Year 2017 | | | 4,194 | |
| |
Year 2018 | | | 4,102 | |
| |
Results of the Goodwill Impairment Test
The Corporation’s goodwill and other identifiable intangible assets having an indefinite useful life are tested for impairment. Intangibles with indefinite lives are evaluated for impairment at least annually and on a more frequent basis if events or circumstances indicate impairment could have taken place. Such events could include, among others, a significant adverse change in the business climate, an adverse action by a regulator, an unanticipated change in the competitive environment and a decision to change the operations or dispose of a reporting unit.
Under applicable accounting standards, goodwill impairment analysis is a two-step test. The first step of the goodwill impairment test involves comparing the fair value of the reporting unit with its carrying amount, including goodwill. If the fair value of the reporting unit exceeds its carrying amount, goodwill of the reporting unit is considered not impaired; however, if the carrying amount of the reporting unit exceeds its fair value, the second step must be performed. The second step involves calculating an implied fair value of goodwill for each reporting unit for which the first step indicated possible impairment. The implied fair value of goodwill is determined in the same manner as the amount of goodwill recognized in a business combination, which is the excess of the fair
184
value of the reporting unit, as determined in the first step, over the aggregate fair values of the individual assets, liabilities and identifiable intangibles (including any unrecognized intangible assets, such as unrecognized core deposits and trademark) as if the reporting unit was being acquired in a business combination and the fair value of the reporting unit was the price paid to acquire the reporting unit. The Corporation estimates the fair values of the assets and liabilities of a reporting unit, consistent with the requirements of the fair value measurements accounting standard, which defines fair value as the price that would be received to sell an asset or paid to transfer a liability in an orderly transaction between market participants at the measurement date. The fair value of the assets and liabilities reflects market conditions, thus volatility in prices could have a material impact on the determination of the implied fair value of the reporting unit goodwill at the impairment test date. The adjustments to measure the assets, liabilities and intangibles at fair value are for the purpose of measuring the implied fair value of goodwill and such adjustments are not reflected in the consolidated statement of financial condition. If the implied fair value of goodwill exceeds the goodwill assigned to the reporting unit, there is no impairment. If the goodwill assigned to a reporting unit exceeds the implied fair value of the goodwill, an impairment charge is recorded for the excess. An impairment loss recognized cannot exceed the amount of goodwill assigned to a reporting unit, and the loss establishes a new basis in the goodwill. Subsequent reversal of goodwill impairment losses is not permitted under applicable accounting standards.
The Corporation performed the annual goodwill impairment evaluation for the entire organization during the third quarter of 2013 using July 31, 2013 as the annual evaluation date. The reporting units utilized for this evaluation were those that are one level below the business segments, which are the legal entities within the reportable segment. The Corporation assigns goodwill to the reporting units when carrying out a business combination.
In determining the fair value of a reporting unit, the Corporation generally uses a combination of methods, including market price multiples of comparable companies and transactions, as well as discounted cash flow analysis. Management evaluates the particular circumstances of each reporting unit in order to determine the most appropriate valuation methodology. The Corporation evaluates the results obtained under each valuation methodology to identify and understand the key value drivers in order to ascertain that the results obtained are reasonable and appropriate under the circumstances. Elements considered include current market and economic conditions, developments in specific lines of business, and any particular features in the individual reporting units.
The computations require management to make estimates and assumptions. Critical assumptions that are used as part of these evaluations include:
Ÿ a selection of comparable publicly traded companies, based on nature of business, location and size;
Ÿ a selection of comparable acquisition and capital raising transactions;
Ÿ the discount rate applied to future earnings, based on an estimate of the cost of equity;
Ÿ the potential future earnings of the reporting unit; and
Ÿ the market growth and new business assumptions.
For purposes of the market comparable approach, valuations were determined by calculating average price multiples of relevant value drivers from a group of companies that are comparable to the reporting unit being analyzed and applying those price multiples to the value drivers of the reporting unit. Multiples used are minority based multiples and thus, no control premium adjustment is made to the comparable companies market multiples. While the market price multiple is not an assumption, a presumption that it provides an indicator of the value of the reporting unit is inherent in the valuation. The determination of the market comparables also involves a degree of judgment.
For purposes of the discounted cash flows (“DCF”) approach, the valuation is based on estimated future cash flows. The financial projections used in the DCF valuation analysis for each reporting unit are based on the most recent (as of the valuation date) financial projections presented to the Corporation’s Asset / Liability Management Committee (“ALCO”). The growth assumptions included in these projections are based on management’s expectations for each reporting unit’s financial prospects considering economic and industry conditions as well as particular plans of each entity (i.e. restructuring plans, de-leveraging, etc.). The cost of equity used to discount the cash flows was calculated using the Ibbotson Build-Up Method and ranged from 13.5% to 17.34% for the 2013 analysis. The Ibbotson Build-Up Method builds up a cost of equity starting with the rate of return of a “risk-free” asset (20-year U.S. Treasury note) and adds to it additional risk elements such as equity risk premium, size premium and industry risk premium. The resulting discount rates were analyzed in terms of reasonability given the current market conditions and adjustments were made when necessary.
185
For BPNA, the only reporting unit that failed Step 1, the Corporation determined the fair value of Step 1 utilizing a DCF approach and a market value approach. The market value approach is based on a combination of price multiples from comparable companies and multiples from capital raising transactions of comparable companies. The market multiples used included “price to book” and “price to tangible book”. The Step 1 fair value for BPNA under both valuation approaches (market and DCF) was below the carrying amount of its equity book value as of the valuation date (July 31), requiring the completion of Step 2. In accordance with accounting standards, the Corporation performed a valuation of all assets and liabilities of BPNA, including any recognized and unrecognized intangible assets, to determine the fair value of BPNA’s net assets. To complete Step 2, the Corporation subtracted from BPNA’s Step 1 fair value the determined fair value of the net assets to arrive at the implied fair value of goodwill. The results of the Step 2 indicated that the implied fair value of goodwill exceeded the goodwill carrying value of $402 million at July 31, 2013 resulting in no goodwill impairment. The reduction in BPNA’s Step 1 fair value was offset by a reduction in the fair value of its net assets, resulting in an implied fair value of goodwill that exceeds the recorded book value of goodwill.
The analysis of the results for Step 2 indicates that the reduction in the fair value of the reporting unit was mainly attributed to the deteriorated fair value of the loan portfolios and not to the fair value of the reporting unit as a going concern. The current negative performance of the reporting unit is principally related to deteriorated credit quality in its loan portfolio, which is consistent with the results of the Step 2 analysis. The fair value determined for BPNA’s loan portfolio in the July 31, 2013 annual test represented a discount of 15.1%, compared with 18.2% at July 2012. The discount is mainly attributed to market participant’s expected rate of returns.
If the Step 1 fair value of BPNA declines further in the future without a corresponding decrease in the fair value of its net assets or if loan discounts improve without a corresponding increase in the Step 1 fair value, the Corporation may be required to record a goodwill impairment charge. The Corporation engaged a third-party valuator to assist management in the annual evaluation of BPNA’s goodwill (including Step 1 and Step 2) as well as BPNA’s loan portfolios as of the July 31, 2013 valuation date. Management discussed the methodologies, assumptions and results supporting the relevant values for conclusions and determined they were reasonable.
For the BPPR reporting unit, the average estimated fair value calculated in Step 1 using all valuation methodologies exceeded BPPR’s equity value by approximately $387 million in the July 31, 2013 annual test as compared with approximately $222 million at July 31, 2012. This result indicates there would be no indication of impairment on the goodwill recorded in BPPR at July 31, 2013. For the BPNA reporting unit, the estimated implied fair value of goodwill calculated in Step 2 exceeded BPNA’s goodwill carrying value by approximately $557 million as compared to approximately $338 million at July 31, 2012. The increase in the excess of the implied fair value of goodwill over its carrying amount for BPNA is mainly due to an increase in the fair value of the equity of BPNA as calculated in Step 1, which is mainly attributed to improvement in BPNA financial performance and increases in market price comparable companies and transactions. The goodwill balance of BPPR and BPNA, as legal entities, represented approximately 97% of the Corporation’s total goodwill balance as of the July 31, 2013 valuation date.
Furthermore, as part of the analyses, management performed a reconciliation of the aggregate fair values determined for the reporting units to the market capitalization of Popular, Inc. concluding that the fair value results determined for the reporting units in the July 31, 2013 annual assessment were reasonable.
The goodwill impairment evaluation process requires the Corporation to make estimates and assumptions with regard to the fair value of the reporting units. Actual values may differ significantly from these estimates. Such differences could result in future impairment of goodwill that would, in turn, negatively impact the Corporation’s results of operations and the reporting units where the goodwill is recorded. Declines in the Corporation’s market capitalization could increase the risk of goodwill impairment in the future.
Management monitors events or changes in circumstances between annual tests to determine if these events or changes in circumstances would more likely than not reduce the fair value of a reporting unit below its carrying amount.
At December 31, 2013 and 2012, other than goodwill, the Corporation had $ 6 million of identifiable intangible assets, with indefinite useful lives, mostly associated with E-LOAN’S trademark.
The valuation of the E-LOAN trademark was performed using the “relief-from-royalty” valuation approach. The basis of the “relief-from-royalty” method is that, by virtue of having ownership of the trademark, the Corporation is relieved from having to pay a royalty, usually expressed as a percentage of revenue, for the use of trademark. The main attributes involved in the valuation of this intangible asset include the royalty rate, revenue projections that benefit from the use of this intangible, after-tax royalty savings derived from the ownership of the intangible, and the discount rate to apply to the projected benefits to arrive at the present value of
186
this intangible. Since estimates are an integral part of this trademark impairment analysis, changes in these estimates could have a significant impact on the calculated fair value. There were no impairments recognized during the years ended December 31, 2013 and 2012 related to E-LOAN’s trademark.
187
Note 18 – Deposits
Total interest bearing deposits as of the end of the periods presented consisted of:
| | | | | | | | |
| | | December 31, | |
| | |
| (In thousands) | | 2013 | | | 2012 | |
| |
| | |
Savings accounts | | $ | 6,839,126 | | | $ | 6,694,014 | |
| | |
NOW, money market and other interest bearing demand deposits | | | 5,637,985 | | | | 5,601,261 | |
| |
| | |
Total savings, NOW, money market and other interest bearing demand deposits | | | 12,477,111 | | | | 12,295,275 | |
| |
| | |
Certificates of deposit: | | | | | | | | |
| | |
Under $100,000 | | | 5,101,711 | | | | 5,666,973 | |
| | |
$100,000 and over | | | 3,209,641 | | | | 3,243,736 | |
| |
| | |
Total certificates of deposit | | | 8,311,352 | | | | 8,910,709 | |
| |
| | |
Total interest bearing deposits | | $ | 20,788,463 | | | $ | 21,205,984 | |
| |
A summary of certificates of deposit by maturity at December 31, 2013 follows:
| | | | |
| (In thousands) | | | |
| |
| |
2014 | | $ | 5,387,569 | |
| |
2015 | | | 1,287,615 | |
| |
2016 | | | 653,010 | |
| |
2017 | | | 430,024 | |
| |
2018 | | | 481,849 | |
| |
2019 and thereafter | | | 71,285 | |
| |
| |
Total certificates of deposit | | $ | 8,311,352 | |
| |
At December 31, 2013, the Corporation had brokered deposits amounting to $ 2.4 billion (2012 - $ 2.8 billion).
The aggregate amount of overdrafts in demand deposit accounts that were reclassified to loans was $10 million at December 31, 2013 (2012 - $17 million).
Note 19 – Assets sold under agreements to repurchase
The following table summarizes certain information on assets sold under agreements to repurchase at December 31, 2013 and 2012:
| | | | | | | | |
| (Dollars in thousands) | | 2013 | | | 2012 | |
| |
| | |
Assets sold under agreements to repurchase | | $ | 1,659,292 | | | $ | 2,016,752 | |
| |
| | |
Maximum aggregate balance outstanding at any month-end | | $ | 2,269,565 | | | $ | 2,113,557 | |
| |
| | |
Average monthly aggregate balance outstanding | | $ | 1,844,061 | | | $ | 1,885,207 | |
| |
| | |
Weighted average interest rate: | | | | | | | | |
| | |
For the year | | | 1.92 % | | | | 2.33 % | |
| | |
At December 31 | | | 2.07 % | | | | 1.91 % | |
| |
188
The repurchase agreements outstanding at December 31, 2013 were collateralized by $ 1.3 billion in investment securities available for sale, $ 309 million in trading securities and $ 70 million in securities sold not yet delivered in other assets (2012 - $ 1.6 billion in investment securities available for sale, $ 272 million in trading securities and $133 million in securities sold not yet delivered in other assets). It is the Corporation’s policy to maintain effective control over assets sold under agreements to repurchase; accordingly, such securities continue to be carried on the consolidated statement of financial condition.
In addition, there were repurchase agreements outstanding collateralized by $ 189 million (2012 - $ 227 million) in securities purchased underlying agreements to resell to which the Corporation has the right to repledge. It is the Corporation’s policy to take possession of securities purchased under agreements to resell. However, the counterparties to such agreements maintain effective control over such securities, and accordingly are not reflected in the Corporation’s consolidated statements of financial condition.
The following table presents the liability associated with the repurchase transactions (including accrued interest), their maturities and weighted average interest rates. Also, it includes the carrying value and approximate market value of the collateral (including accrued interest) at December 31, 2013 and 2012. The information excludes repurchase agreement transactions which were collateralized with securities or other assets held-for-trading purposes or which have been obtained under agreements to resell.
| | | | | | | | | | | | | | | | | | | | | | | | | | | | | | | | |
| | | 2013 | | | 2012 | |
| |
| | | | | | | | |
| (Dollars in thousands) | | Repurchase liability | | | Carrying value of collateral | | | Market value of collateral | | | Weighted average interest rate | | | Repurchase liability | | | Carrying value of collateral | | | Market value of collateral | | | Weighted average interest rate | |
| |
| | | | | | | | |
Obligations of U.S. government sponsored entities | | | | | | | | | | | | | �� | | | | | | | | | | | | | | | | | | | |
| | | | | | | | |
Within 30 days | | $ | 64,109 | | | $ | 67,721 | | | $ | 67,721 | | | | 0.23 | % | | $ | 160,288 | | | $ | 163,934 | | | $ | 163,934 | | | | 0.40 % | |
| | | | | | | | |
After 30 to 90 days | | | - | | | | - | | | | - | | | | - | | | | 7,312 | | | | 7,102 | | | | 7,102 | | | | 0.60 | |
| | | | | | | | |
After 90 days | | | 156,092 | | | | 177,031 | | | | 177,031 | | | | 4.89 | | | | 119,120 | | | | 143,502 | | | | 143,502 | | | | 4.88 | |
| |
| | | | | | | | |
Total obligations of U.S. government sponsored entities | | | 220,201 | | | | 244,752 | | | | 244,752 | | | | 3.53 | | | | 286,720 | | | | 314,538 | | | | 314,538 | | | | 2.27 | |
| |
| | | | | | | | |
Mortgage-backed securities | | | | | | | | | | | | | | | | | | | | | | | | | | | | | | | | |
| | | | | | | | |
Within 30 days | | | 23,998 | | | | 26,591 | | | | 26,591 | | | | 0.46 | | | | 43,107 | | | | 47,307 | | | | 47,307 | | | | 0.54 | |
| | | | | | | | |
After 30 to 90 days | | | - | | | | - | | | | - | | | | - | | | | 98,887 | | | | 105,903 | | | | 105,903 | | | | 0.60 | |
| | | | | | | | |
After 90 days | | | 240,313 | | | | 286,166 | | | | 286,166 | | | | 3.61 | | | | 320,780 | | | | 380,900 | | | | 380,900 | | | | 3.75 | |
| |
| | | | | | | | |
Total mortgage-backed securities | | | 264,311 | | | | 312,757 | | | | 312,757 | | | | 3.32 | | | | 462,774 | | | | 534,110 | | | | 534,110 | | | | 2.78 | |
| |
| | | | | | | | |
Collateralized mortgage obligations | | | | | | | | | | | | | | | | | | | | | | | | | | | | | | | | |
| | | | | | | | |
Within 30 days | | | 235,306 | | | | 267,120 | | | | 267,120 | | | | 0.39 | | | | 330,000 | | | | 365,404 | | | | 365,404 | | | | 0.53 | |
| | | | | | | | |
After 30 to 90 days | | | 103,754 | | | | 114,643 | | | | 114,643 | | | | 0.44 | | | | 69,856 | | | | 76,516 | | | | 76,516 | | | | 0.60 | |
| | | | | | | | |
After 90 days | | | 322,881 | | | | 370,197 | | | | 370,197 | | | | 4.24 | | | | 287,038 | | | | 341,687 | | | | 341,687 | | | | 4.24 | |
| |
| | | | | | | | |
Total collateralized mortgage obligations | | | 661,941 | | | | 751,960 | | | | 751,960 | | | | 2.28 | | | | 686,894 | | | | 783,607 | | | | 783,607 | | | | 2.09 | |
| |
| | | | | | | | |
Total | | $ | 1,146,453 | | | $ | 1,309,469 | | | $ | 1,309,469 | | | | 2.76 | % | | $ | 1,436,388 | | | $ | 1,632,255 | | | $ | 1,632,255 | | | | 2.35 % | |
| |
Note 20 – Other short-term borrowings
The following table presents a breakdown of other short-term borrowings at December 31, 2013 and 2012.
| | | | | | | | |
| (In thousands) | | 2013 | | | 2012 | |
| |
| | |
Advances with the FHLB paying interest at maturity, at fixed rates ranging from 0.38% to 0.44% (2012 - 0.32% to 0.44%) | | $ | 400,000 | | | $ | 635,000 | |
| | |
Others | | | 1,200 | | | | 1,200 | |
| |
189
| | | | | | | | |
| |
| | |
Total other short-term borrowings | | $ | 401,200 | | | $ | 636,200 | |
| |
The maximum aggregate balance outstanding at any month-end was approximately $ 1,226 million (2012 - $ 1,356 million). The weighted average interest rate of other short-term borrowings at December 31, 2013 was 0.38% (2012 – 0.41%). The average aggregate balance outstanding during the year was approximately $ 729 million (2012 - $680 million). The weighted average interest rate during the year was 0.41% (2012 – 0.42%).
Note 21 presents additional information with respect to available credit facilities.
Note 21 – Notes payable
Notes payable outstanding at December 31, 2013 and 2012, consisted of the following:
| | | | | | | | | | |
| (In thousands) | | | | 2013 | | | 2012 | |
| |
| | | |
Advances with the FHLB maturing from 2014 to 2021 paying interest at monthly fixed rates ranging from 0.27% to 4.19% (2012 - 0.63% to 4.95%) | | | | $ | 589,229 | | | $ | 577,490 | |
| | | |
Term notes maturing in 2014 paying interest semiannually at fixed rate of 7.47% (2012 - 5.25% to 7.86%) | | | | | 675 | | | | 236,620 | |
| | | |
Term notes maturing in 2014 paying interest monthly at a floating rate of 3.00% over the 10-year U.S. Treasury note rate[1] | | | | | 14 | | | | 133 | |
| | | |
Junior subordinated deferrable interest debentures (related to trust preferred securities) maturing from 2027 to 2034 with fixed interest rates ranging from 6.125% to 8.327% (Refer to Note 23) | | | | | 439,800 | | | | 439,800 | |
| | | |
Junior subordinated deferrable interest debentures (related to trust preferred securities) ($936,000 less discount of $404,460 as of 2013 and $436,530 at 2012) with no stated maturity and a contractual fixed interest rate of 5.00% until, but excluding December 5, 2013 and 9.00% thereafter (Refer to Note 23)[2] | | | | | 531,540 | | | | 499,470 | |
| | | |
Others | | | | | 23,496 | | | | 24,208 | |
| |
| | | |
Total notes payable | | | | $ | 1,584,754 | | | $ | 1,777,721 | |
| |
[1] Note: The 10-year U.S. Treasury note rate at December 31, 2013 and December 31, 2012 was 3.03% and 1.76%, respectively.
[2] The debentures are perpetual and may be redeemed by the Corporation at any time, subject to the consent of the Board of Governors of the Federal Reserve System. The discount on the debentures is being amortized over an estimated 30-year term that started in August 2009. The effective interest rate taking into account the discount accretion was approximately 16% at December 31, 2013 and 2012.
The following table presents the aggregate amounts by contractual maturities of notes payable at December 31, 2013.
| | | | |
| Year | | (In thousands) | |
| |
| |
2014 | | $ | 127,308 | |
| |
2015 | | | 29,044 | |
| |
2016 | | | 215,201 | |
| |
2017 | | | 79,034 | |
| |
2018 | | | 125,547 | |
190
| | | | |
| |
Later years | | | 477,080 | |
| |
No stated maturity | | | 936,000 | |
| |
| |
Subtotal | | | 1,989,214 | |
| |
Less: Discount | | | 404,460 | |
| |
| |
Total notes payable | | $ | 1,584,754 | |
| |
At December 31, 2013, the Corporation had borrowing facilities available with the FHLB whereby the Corporation could borrow up to $3.0 billion based on the assets pledged with the FHLB at that date (2012 - $2.8 billion). The FHLB advances at December 31, 2013 are collateralized with mortgage loans, and do not have restrictive covenants or callable features. The maximum borrowing capacity is dependent on certain computations as determined by the FHLB, which consider the amount and type of assets available for collateral.
Also, the Corporation has a borrowing facility at the discount window of the Federal Reserve Bank of New York. At December 31, 2013, the borrowing capacity at the discount window approximated $3.4 billion (2012 - $3.1 billion), which remained unused at December 31, 2013 and 2012. The facility is a collateralized source of credit that is highly reliable even under difficult market conditions.
Note 22 – Offsetting of financial assets and liabilities
The following tables present the potential effect of rights of setoff associated with the Corporation’s recognized financial assets and liabilities at December 31, 2013 and December 31, 2012.
| | | | | | | | | | | | | | | | | | | | | | | | | | | | |
| As of December 31, 2013 | |
| |
| | | | | | | | | | | | Gross Amounts Not Offset in the
Statement of Financial Position | | | | |
| |
| | | | | | | |
| (In thousands) | | Gross Amount
of Recognized
Assets | | | Gross Amounts
Offset in the
Statement of
Financial
Position | | | Net Amounts of
Assets
Presented in the
Statement of
Financial
Position | | | Financial
Instruments | | | Securities
Collateral
Received | | | Cash
Collateral
Received | | | Net Amount | |
| |
| | | | | | | |
Derivatives | | $ | 34,793 | | | $ | - | | | $ | 34,793 | | | $ | 1,220 | | | $ | - | | | $ | - | | | $ | 33,573 | |
| | | | | | | |
Reverse repurchase agreements | | | 175,965 | | | | - | | | | 175,965 | | | | - | | | | 175,965 | | | | - | | | | - | |
| |
| | | | | | | |
Total | | $ | 210,758 | | | $ | - | | | $ | 210,758 | | | $ | 1,220 | | | $ | 175,965 | | | $ | - | | | $ | 33,573 | |
| |
As of December 31, 2013 | |
| |
| | |
| | | | Gross Amounts Not Offset in the
Statement of Financial Position | | | | |
| |
| | | | | | | |
| (In thousands) | | Gross Amount
of Recognized
Liabilities | | | Gross Amounts
Offset in the
Statement of
Financial
Position | | | Net Amounts of
Liabilities
Presented in the
Statement of
Financial
Position | | | Financial
Instruments | | | Securities
Collateral
Pledged | | | Cash
Collateral
Pledged | | | Net Amount | |
| |
| | | | | | | |
Derivatives | | $ | 32,378 | | | $ | - | | | $ | 32,378 | | | $ | 1,220 | | | $ | 14,003 | | | $ | - | | | $ | 17,155 | |
| | | | | | | |
Repurchase agreements | | | 1,659,292 | | | | - | | | | 1,659,292 | | | | - | | | | 1,659,292 | | | | - | | | | - | |
| |
| | | | | | | |
Total | | $ | 1,691,670 | | | $ | - | | | $ | 1,691,670 | | | $ | 1,220 | | | $ | 1,673,295 | | | $ | - | | | $ | 17,155 | |
| |
191
| | | | | | | | | | | | | | | | | | | | | | | | | | | | |
| As of December 31, 2012 | |
| |
| | |
| | | | Gross Amounts Not Offset in the
Statement of Financial Position | | | | |
| |
| | | | | | | |
| (In thousands) | | Gross Amount
of Recognized
Assets | | | Gross Amounts
Offset in the
Statement of
Financial
Position | | | Net Amounts of
Assets
Presented in the
Statement of
Financial
Position | | | Financial
Instruments | | | Securities
Collateral
Received | | | Cash
Collateral
Received | | | Net Amount | |
| |
| | | | | | | |
Derivatives | | $ | 41,935 | | | $ | - | | | $ | 41,935 | | | $ | 649 | | | $ | 1,770 | | | $ | - | | | $ | 39,516 | |
| | | | | | | |
Reverse repurchase agreements | | | 213,462 | | | | - | | | | 213,462 | | | | 1,041 | | | | 212,421 | | | | - | | | | - | |
| |
| | | | | | | |
Total | | $ | 255,397 | | | $ | - | | | $ | 255,397 | | | $ | 1,690 | | | $ | 214,191 | | | $ | - | | | $ | 39,516 | |
| |
As of December 31, 2012 | |
| |
| | |
| | | | Gross Amounts Not Offset in the
Statement of Financial Position | | | | |
| |
| | | | | | | |
| (In thousands) | | Gross Amount
of Recognized
Liabilities | | | Gross Amounts
Offset in the
Statement of
Financial
Position | | | Net Amounts of
Liabilities
Presented in the
Statement of
Financial
Position | | | Financial
Instruments | | | Securities
Collateral
Pledged | | | Cash
Collateral
Received | | | Net Amount | |
| |
| | | | | | | |
Derivatives | | $ | 42,585 | | | $ | - | | | $ | 42,585 | | | $ | 649 | | | $ | 30,390 | | | $ | - | | | $ | 11,546 | |
| | | | | | | |
Repurchase agreements | | | 2,016,752 | | | | - | | | | 2,016,752 | | | | 1,041 | | | | 2,015,711 | | | | - | | | | - | |
| |
| | | | | | | |
Total | | $ | 2,059,337 | | | $ | - | | | $ | 2,059,337 | | | $ | 1,690 | | | $ | 2,046,101 | | | $ | - | | | $ | 11,546 | |
| |
The Corporation’s derivatives are subject to agreements which allow a right of set-off with each respective counterparty. In addition, the Corporation’s Repurchase Agreements and Reverse Repurchase Agreements have a right of set-off with the respective counterparty under the supplemental terms of the Master Repurchase Agreements. In an event of default each party has a right of set-off against the other party for amounts owed in the related agreement and any other amount or obligation owed in respect of any other agreement or transaction between them.
192
Note 23 – Trust preferred securities
At December 31, 2013 and December 31, 2012, four statutory trusts established by the Corporation (BanPonce Trust I, Popular Capital Trust I, Popular North America Capital Trust I and Popular Capital Trust II) had issued trust preferred securities (also referred to as “capital securities”) to the public. The proceeds from such issuances, together with the proceeds of the related issuances of common securities of the trusts (the “common securities”), were used by the trusts to purchase junior subordinated deferrable interest debentures (the “junior subordinated debentures”) issued by the Corporation. In August 2009, the Corporation established the Popular Capital Trust III for the purpose of exchanging the shares of Series C preferred stock held by the U.S. Treasury at the time for trust preferred securities issued by this trust. In connection with this exchange, the trust used the Series C preferred stock, together with the proceeds of issuance and sale of common securities of the trust, to purchase junior subordinated debentures issued by the Corporation.
The sole assets of the five trusts consisted of the junior subordinated debentures of the Corporation and the related accrued interest receivable. These trusts are not consolidated by the Corporation pursuant to accounting principles generally accepted in the United States of America.
The junior subordinated debentures are included by the Corporation as notes payable in the consolidated statements of financial condition, while the common securities issued by the issuer trusts are included as other investment securities. The common securities of each trust are wholly-owned, or indirectly wholly-owned, by the Corporation.
The following table presents financial data pertaining to the different trusts at December 31, 2013 and December 31, 2012.
| | | | | | | | | | | | | | | | | | | | |
| (Dollars in thousands) | | | | | | | | | | | | | | | |
| |
| Issuer | | BanPonce
Trust I | | | Popular
Capital Trust I | | | Popular
North America
Capital Trust I | | | Popular
Capital Trust Il | | | Popular Capital Trust III | |
| |
| | | | | |
Capital securities | | $ | 52,865 | | | $ | 181,063 | | | $ | 91,651 | | | $ | 101,023 | | | $ | 935,000 | |
Distribution rate | | | 8.327 | % | | | 6.700 | % | | | 6.564 | % | | | 6.125 | % | |
| 5.000% until,
but excluding
December 5,
2013 and
9.000%
thereafter |
|
Common securities | | $ | 1,637 | | | $ | 5,601 | | | $ | 2,835 | | | $ | 3,125 | | | $ | 1,000 | |
Junior subordinated debentures aggregate liquidation amount | | $ | 54,502 | | | $ | 186,664 | | | $ | 94,486 | | | $ | 104,148 | | | $ | 936,000 | |
Stated maturity date | |
| February
2027 |
| |
| November
2033 |
| |
| September
2034 |
| |
| December
2034 |
| | | Perpetual | |
Reference notes | | | [1],[3],[6] | | | | [2],[4],[5] | | | | [1],[3],[5] | | | | [2],[4],[5] | | | | [2],[4],[7],[8] | |
| |
[1] Statutory business trust that is wholly-owned by Popular North America and indirectly wholly-owned by the Corporation.
[2] Statutory business trust that is wholly-owned by the Corporation.
[3] The obligations of PNA under the junior subordinated debentures and its guarantees of the capital securities under the trust are fully and unconditionally guaranteed on a subordinated basis by the Corporation to the extent set forth in the applicable guarantee agreement.
[4] These capital securities are fully and unconditionally guaranteed on a subordinated basis by the Corporation to the extent set forth in the applicable guarantee agreement.
[5] The Corporation has the right, subject to any required prior approval from the Federal Reserve, to redeem after certain dates or upon the occurrence of certain events mentioned below, the junior subordinated debentures at a redemption price equal to 100% of the principal amount, plus accrued and unpaid interest to the date of redemption. The maturity of the junior subordinated debentures may be shortened at the option of the Corporation prior to their stated maturity dates (i) on or after the stated optional redemption dates stipulated in the agreements, in whole at any time or in part from time to time, or (ii) in whole, but not in part, at any time within 90 days following the occurrence and during the continuation of a tax event, an investment company event or a capital treatment event as set forth in the indentures relating to the capital securities, in each case subject to regulatory approval.
[6] Same as [5] above, except that the investment company event does not apply for early redemption.
[7] The debentures are perpetual and may be redeemed by Popular at any time, subject to the consent of the Board of Governors of the Federal Reserve System.
193
[8] Carrying value of junior subordinated debentures of $ 532 million at December 31, 2013 ($ 936 million aggregate liquidation amount, net of $ 404 million discount) and $ 499 million at December 31, 2012 ($ 936 million aggregate liquidation amount, net of $ 437 million discount).
In July 2013, the Board of Governors of the Federal Reserve System approved final rules (“New Capital Rules”) to establish a new comprehensive regulatory capital framework for all U.S. banking organizations. The New Capital Rules generally implement the Basel Committee on Banking Supervision’s (the “Basel Committee”) December 2010 final capital framework referred to as “Basel III” for strengthening international capital standards and several changes to the U.S. regulatory capital regime required by the Dodd-Frank Wall Street Reform and Consumer Protection on Act (“Dodd-Frank”). The New Capital Rules require that capital instruments such as trust preferred securities be phased-out of Tier 1 capital. The Corporation’s Tier I capital level at December 31, 2013 included $ 427 million of trust preferred securities that are subject to the phase-out provisions of the New Capital Rules. The Corporation would be allowed to include only 25% of such trust preferred securities in Tier I capital as of January 1, 2015 and 0% as of January 1, 2016 and thereafter. The New Capital Rules also permanently grandfathers as Tier 2 capital such trust preferred securities. The trust preferred securities issued to the U.S. Treasury pursuant to the Emergency Economic Stabilization Act of 2008 are exempt from the phase-out provision.
On October 18, 2013, the Corporation submitted a formal application to the Federal Reserve of New York to redeem the $935 million in trust preferred securities due under the Troubled Assets Relief Program (“TARP”), discussed in Note 23 to the accompanying financial statements. While there can be no assurance that the Corporation will be approved to repay TARP, nor on the timing of this event, if the Corporation is approved and repays TARP in full, a non-cash charge to earnings would be recorded for the unamortized portion of the discount associated with this debt, which at December 31, 2013 had a balance of $404 million.
194
Note 24 – Stockholders’ equity
The Corporation has 30,000,000 shares of authorized preferred stock that may be issued in one or more series, and the shares of each series shall have such rights and preferences as shall be fixed by the Board of Directors when authorizing the issuance of that particular series. The Corporation’s shares of preferred stock issued and outstanding at December 31, 2013 and 2012 consisted of:
| | — | | 6.375% non-cumulative monthly income preferred stock, 2003 Series A, no par value, liquidation preference value of $25 per share. Holders on record of the 2003 Series A Preferred Stock are entitled to receive, when, as and if declared by the Board of Directors of the Corporation or an authorized committee thereof, out of funds legally available, non-cumulative cash dividends at the annual rate per share of 6.375% of their liquidation preference value, or $0.1328125 per share per month. These shares of preferred stock are perpetual, nonconvertible, have no preferential rights to purchase any securities of the Corporation and are redeemable solely at the option of the Corporation with the consent of the Board of Governors of the Federal Reserve System. The redemption price per share is $25.00. The shares of 2003 Series A Preferred Stock have no voting rights, except for certain rights in instances when the Corporation does not pay dividends for a defined period. These shares are not subject to any sinking fund requirement. Cash dividends declared and paid on the 2003 Series A Preferred Stock amounted to $1.4 million for the year ended December 31, 2013, 2012 and 2011. Outstanding shares of 2003 Series A Preferred Stock amounted to 885,726 at December 31, 2013, 2012 and 2011. |
| | — | | 8.25% non-cumulative monthly income preferred stock, 2008 Series B, no par value, liquidation preference value of $25 per share. The shares of 2008 Series B Preferred Stock were issued in May 2008. Holders of record of the 2008 Series B Preferred Stock are entitled to receive, when, as and if declared by the Board of Directors of the Corporation or an authorized committee thereof, out of funds legally available, non-cumulative cash dividends at the annual rate per share of 8.25% of their liquidation preferences, or $0.171875 per share per month. These shares of preferred stock are perpetual, nonconvertible, have no preferential rights to purchase any securities of the Corporation and are redeemable solely at the option of the Corporation with the consent of the Board of Governors of the Federal Reserve System beginning on May 28, 2013. The redemption price per share is $25.50 from May 28, 2013 through May 28, 2014, $25.25 from May 28, 2014 through May 28, 2015 and $25.00 from May 28, 2015 and thereafter. Cash dividends declared and paid on the 2008 Series B Preferred Stock amounted to $ 2.3 million for the year ended December 31, 2013, 2012 and 2011. Outstanding shares of 2008 Series B Preferred Stock amounted to 1,120,665 at December 31, 2013, 2012 and 2011. |
As part of the Series C Preferred Stock transaction with the U.S. Treasury effected on December 5, 2008, the Corporation issued to the U.S. Treasury a warrant to purchase 2,093,284 shares of the Corporation’s common stock at an exercise price of $67 per share, which continues to be outstanding in full and without amendment at December 31, 2013. The warrant is immediately exercisable, subject to certain restrictions, and has a 10-year term. The exercise price and number of shares subject to the warrant are both subject to anti-dilution adjustments. The U.S. Treasury may not exercise voting power with respect to shares of common stock issued upon exercise of the warrant. The trust preferred securities issued to the U.S. Treasury, which are described in Note 23 to the financial statements, the warrant or the shares issuable upon exercise of the warrant are not subject to any contractual restriction on transfer.
The Corporation’s common stock trades on the NASDAQ Stock Market LLC (the “NASDAQ”) under the symbol BPOP. The Corporation voluntarily delisted its 2003 Series A and 2008 Series B Preferred Stock from the NASDAQ effective October 8, 2009.
On May 29, 2012, the Corporation effected a 1-for-10 reverse split of its common stock previously approved by the Corporation’s stockholders on April 27, 2012. Upon the effectiveness of the reverse split, each 10 shares of authorized and outstanding common stock were reclassified and combined into one new share of common stock. Popular, Inc.’s common stock began trading on a split-adjusted basis on May 30, 2012. All share and per share information in the consolidated financial statements and accompanying notes have been retroactively adjusted to reflect the 1-for-10 reverse stock split.
In connection with the reverse stock split, the Corporation amended its Restated Certificate of Incorporation to reduce the number of shares of its authorized common stock from 1,700,000,000 to 170,000,000.
The reverse stock split did not affect the par value of a share of the Corporation’s common stock.
At the effective date of the reverse stock split, the stated capital attributable to common stock on the Corporation’s consolidated statement of financial condition was reduced by dividing the amount of the stated capital prior to the reverse stock split by 10, and the additional paid-in capital (surplus) was credited with the amount by which the stated capital was reduced. This was also reflected retroactively for prior periods presented in the financial statements.
The Corporation’s common stock ranks junior to all series of preferred stock as to dividend rights and / or as to rights on liquidation, dissolution or winding up of the Corporation. Dividends on each series of preferred stocks are payable if declared. The Corporation’s
195
ability to declare or pay dividends on, or purchase, redeem or otherwise acquire, its common stock is subject to certain restrictions in the event that the Corporation fails to pay or set aside full dividends on the preferred stock for the latest dividend period. The ability of the Corporation to pay dividends in the future is limited by regulatory requirements and approval, the Corporation’s agreements with the U.S. Treasury, legal availability of funds, recent and projected financial results, capital levels and liquidity of the Corporation, general business conditions and other factors deemed relevant by the Corporation’s Board of Directors.
During the years ended December 31, 2013, 2012 and 2011 the Corporation did not declare dividends on its common stock.
The Banking Act of the Commonwealth of Puerto Rico requires that a minimum of 10% of BPPR’s net income for the year be transferred to a statutory reserve account until such statutory reserve equals the total of paid-in capital on common and preferred stock. Any losses incurred by a bank must first be charged to retained earnings and then to the reserve fund. Amounts credited to the reserve fund may not be used to pay dividends without the prior consent of the Puerto Rico Commissioner of Financial Institutions. The failure to maintain sufficient statutory reserves would preclude BPPR from paying dividends. BPPR’s statutory reserve fund amounted to $ 445 million at December 31, 2013 (2012 - $ 432 million; 2011 - $ 415 million). During 2013, $ 13 million was transferred to the statutory reserve account (2012 - $ 17 million, 2011 - $ 13 million). BPPR was in compliance with the statutory reserve requirement in 2013, 2012 and 2011.
Note 25 – Regulatory capital requirements
The Corporation and its banking subsidiaries are subject to various regulatory capital requirements imposed by the federal banking agencies. Failure to meet minimum capital requirements can lead to certain mandatory and additional discretionary actions by regulators that, if undertaken, could have a direct material effect on the Corporation’s consolidated financial statements. Under capital adequacy guidelines and the regulatory framework for prompt corrective action, the Federal Reserve Board and the other bank regulators have adopted quantitative measures which assign risk weightings to assets and off-balance sheet items and also define and set minimum regulatory capital requirements. Rules adopted by the federal banking agencies provide that a depository institution will be deemed to be well capitalized if it maintains a leverage ratio of at least 5%, a Tier 1 risk-based capital ratio of at least 6% and a total risk-based ratio of at least 10%. Management has determined that at December 31, 2013 and 2012, the Corporation exceeded all capital adequacy requirements to which it is subject.
At December 31, 2013 and 2012, BPPR and BPNA were well-capitalized under the regulatory framework for prompt corrective action. At December 31, 2013, management believes that there were no conditions or events since the most recent notification date that could have changed the institution’s category.
The Corporation has been designated by the Federal Reserve Board as a Financial Holding Company (“FHC”) and is eligible to engage in certain financial activities permitted under the Gramm-Leach-Bliley Act of 1999.
The following tables present the Corporation’s risk-based capital and leverage ratios at December 31, 2013 and 2012.
| | | | | | | | | | | | | | | | |
| | | Actual | | | Capital adequacy minimum
requirement | |
| (Dollars in thousands) | | Amount | | | Ratio | | | Amount | | | Ratio | |
| |
| | | 2013 | |
| | | | |
Total Capital (to Risk-Weighted Assets): | | | | | | | | | | | | | | | | |
| | | | |
Corporation | | $ | 4,761,555 | | | | 20.42 | % | | $ | 1,865,494 | | | | 8 | % |
| | | | |
BPPR | | | 2,607,018 | | | | 14.76 | | | | 1,413,292 | | | | 8 | |
| | | | |
BPNA | | | 1,400,740 | | | | 25.47 | | | | 439,908 | | | | 8 | |
| | | | |
Tier I Capital (to Risk-Weighted Assets): | | | | | | | | | | | | | �� | | | |
| | | | |
Corporation | | $ | 4,464,742 | | | | 19.15 | % | | $ | 932,747 | | | | 4 | % |
| | | | |
BPPR | | | 2,381,347 | | | | 13.48 | | | | 706,646 | | | | 4 | |
| | | | |
BPNA | | | 1,331,471 | | | | 24.21 | | | | 219,954 | | | | 4 | |
| | | | |
Tier I Capital (to Average Assets): | | | | | | | | | | | | | | | | |
196
| | | | | | | | | | | | | | | | |
Corporation | | $ | 4,464,742 | | | | 12.85 | % | | $ | 1,042,384 | | | | 3 % | |
| | | | |
| | | | | | | | | | | 1,389,845 | | | | 4 | |
| | | | |
BPPR | | | 2,381,347 | | | | 9.21 | | | | 775,562 | | | | 3 | |
| | | | |
| | | | | | | | | | | 1,034,083 | | | | 4 | |
| | | | |
BPNA | | | 1,331,471 | | | | 15.92 | | | | 250,931 | | | | 3 | |
| | | | |
| | | | | | | | | | | 334,575 | | | | 4 | |
| |
| | |
| | | Actual | | | Capital adequacy minimum
requirement | |
| (Dollars in thousands) | | Amount | | | Ratio | | | Amount | | | Ratio | |
| |
| | | 2012 | |
| |
| | | | |
Total Capital (to Risk-Weighted Assets): | | | | | | | | | | | | | | | | |
| | | | |
Corporation | | $ | 4,357,148 | | | | 18.63 | % | | $ | 1,871,326 | | | | 8 % | |
| | | | |
BPPR | | | 2,699,339 | | | | 15.25 | | | | 1,415,630 | | | | 8 | |
| | | | |
BPNA | | | 1,290,343 | | | | 24.04 | | | | 429,387 | | | | 8 | |
| | | | |
Tier I Capital (to Risk-Weighted Assets): | | | | | | | | | | | | | | | | |
| | | | |
Corporation | | $ | 4,058,242 | | | | 17.35 | % | | $ | 935,663 | | | | 4 % | |
| | | | |
BPPR | | | 2,288,076 | | | | 12.93 | | | | 707,815 | | | | 4 | |
| | | | |
BPNA | | | 1,221,893 | | | | 22.77 | | | | 214,693 | | | | 4 | |
| | | | |
Tier I Capital (to Average Assets): | | | | | | | | | | | | | | | | |
| | | | |
Corporation | | $ | 4,058,242 | | | | 11.52 | % | | $ | 1,056,785 | | | | 3 % | |
| | | | |
| | | | | | | | | | | 1,409,047 | | | | 4 | |
| | | | |
BPPR | | | 2,288,076 | | | | 8.65 | | | | 793,517 | | | | 3 | |
| | | | |
| | | | | | | | | | | 1,058,023 | | | | 4 | |
| | | | |
BPNA | | | 1,221,893 | | | | 15.00 | | | | 244,390 | | | | 3 | |
| | | | |
| | | | | | | | | | | 325,853 | | | | 4 | |
| |
The following table presents the minimum amounts and ratios for the Corporation’s banks to be categorized as well-capitalized under prompt corrective action.
| | | | | | | | | | | | | | | | |
| | | 2013 | | | 2012 | |
| |
| (In thousands) | | Amount | | | Ratio | | | Amount | | | Ratio | |
| |
| | | | |
Total Capital (to Risk-Weighted Assets): | | | | | | | | | | | | | | | | |
| | | | |
BPPR | | $ | 1,766,615 | | | | 10 | % | | $ | 1,769,537 | | | | 10 % | |
| | | | |
BPNA | | | 549,885 | | | | 10 | | | | 536,733 | | | | 10 | |
| | | | |
Tier I Capital (to Risk-Weighted Assets): | | | | | | | | | | | | | | | | |
| | | | |
BPPR | | $ | 1,059,969 | | | | 6 | % | | $ | 1,061,722 | | | | 6 % | |
| | | | |
BPNA | | | 329,931 | | | | 6 | | | | 322,040 | | | | 6 | |
| | | | |
Tier I Capital (to Average Assets): | | | | | | | | | | | | | | | | |
| | | | |
BPPR | | $ | 1,292,604 | | | | 5 | % | | $ | 1,322,529 | | | | 5 % | |
197
198
Note 26 – Other comprehensive loss
The following table presents changes in accumulated other comprehensive loss by component for the years ended December 31, 2013, 2012, and 2011.
| | | | | | | | | | | | | | |
| | | Changes in Accumulated Other Comprehensive Loss by Component [1] | |
| | |
| | | | | Year ended December 31, | |
| (In thousands) | | | | 2013 | | | 2012 | | | 2011 | |
| |
| | | | |
Foreign currency translation | | Beginning Balance | | $ | (31,277 | ) | | $ | (28,829 | ) | | $ | (36,151) | |
| | | |
| | | | |
| | Other comprehensive loss before reclassifications | | | (4,822 | ) | | | (2,448 | ) | | | (2,762) | |
| | | | |
| | Amounts reclassified from accumulated other comprehensive loss | | | - | | | | - | | | | 10,084 | |
| | | |
| | | | |
| | Net change | | | (4,822 | ) | | | (2,448 | ) | | | 7,322 | |
| | | |
| | | | |
| | Ending balance | | $ | (36,099 | ) | | $ | (31,277 | ) | | $ | (28,829) | |
| | | |
| | | | |
Adjustment of pension and postretirement benefit plans | | Beginning Balance | | $ | (225,846) | | | $ | (216,058) | | | $ | (130,080) | |
| | | |
| | | | |
| | Other comprehensive income (loss) before reclassifications | | | 104,272 | | | | (27,699) | | | | (94,386) | |
| | | | |
| | Amounts reclassified from accumulated other comprehensive loss for amortization of net losses | | | 17,272 | | | | 18,051 | | | | 9,081 | |
| | | | |
| | Amounts reclassified from accumulated other comprehensive loss for amortization of prior service cost | | | - | | | | (140 | ) | | | (673) | |
| | | |
| | | | |
| | Net change | | | 121,544 | | | | (9,788 | ) | | | (85,978) | |
| | | |
| | | | |
| | Ending balance | | $ | (104,302 | ) | | $ | (225,846 | ) | | $ | (216,058) | |
| | | |
| | | | |
Unrealized net holding gains (losses) on investments | | Beginning Balance | | $ | 154,568 | | | $ | 203,078 | | | $ | 159,700 | |
| | | |
| | | | |
| | Other comprehensive (loss) gain before reclassifications | | | (201,119 | ) | | | (50,204 | ) | | | 50,203 | |
| | | | |
| | Amounts reclassified from accumulated other comprehensive income | | | (1,793 | ) | | | 1,694 | | | | (6,825) | |
| | | |
| | | | |
| | Net change | | | (202,912 | ) | | | (48,510 | ) | | | 43,378 | |
| | | |
| | | | |
| | Ending balance | | $ | (48,344 | ) | | $ | 154,568 | | | $ | 203,078 | |
| | | |
| | | | |
Unrealized net gains (losses) on cash flow hedges | | Beginning Balance | | $ | (313 | ) | | $ | (739 | ) | | $ | 570 | |
| | | |
| | | | |
| | Other comprehensive income (loss) before reclassifications | | | 1,436 | | | | (9,457 | ) | | | (8,089) | |
| | | | |
| | Amounts reclassified from other accumulated other comprehensive loss | | | (1,123 | ) | | | 9,883 | | | | 6,780 | |
| | | |
| | | | |
| | Net change | | | 313 | | | | 426 | | | | (1,309) | |
| | | |
199
| | | | | | | | | | | | | | |
| | | |
| | | | |
| | Ending balance | | $ | - | | | $ | (313) | | | $ | (739) | |
| | | |
| | | | |
| | Total | | $ | (188,745) | | | $ | (102,868) | | | $ | (42,548) | |
| | | |
[1] All amounts presented are net of tax.
The following table presents the amounts reclassified out of each component of accumulated other comprehensive loss for the years ended December 31, 2013, 2012, and 2011.
| | | | | | | | | | | | | | |
| | | Reclassifications Out of Accumulated Other Comprehensive Loss | |
| | | Affected Line Item in the | | Year ended December 31, | |
| (In thousands) | | Consolidated Statements of Operations | | 2013 | | | 2012 | | | 2011 | |
| |
| | | | |
Foreign currency translation | | | | | | | | | | | | | | |
| | | | |
Cumulative translation adjustment reclassified into earnings | | Other operating income | | $ | - | | | $ | - | | | $ | (10,084) | |
| | | |
| | | | |
| | Total before tax | | | - | | | | - | | | | (10,084) | |
| | | |
| | | | |
| | Total net of tax | | $ | - | | | $ | - | | | $ | (10,084) | |
| | | |
| | | | |
Adjustment of pension and postretirement benefit plans | | | | | | | | | | | | | | |
| | | | |
Amortization of net losses | | Personnel costs | | $ | (24,674 | ) | | $ | (25,159 | ) | | $ | (12,973) | |
| | | | |
Amortization of prior service cost | | Personnel costs | | | - | | | | 200 | | | | 961 | |
| | | |
| | | | |
| | Total before tax | | | (24,674 | ) | | | (24,959 | ) | | | (12,012) | |
| | | |
| | | | |
| | Income tax benefit | | | 7,402 | | | | 7,048 | | | | 3,604 | |
| | | |
| | | | |
| | Total net of tax | | $ | (17,272 | ) | | $ | (17,911 | ) | | $ | (8,408) | |
| | | |
| | | | |
Unrealized holding gains on investments | | | | | | | | | | | | | | |
| | | | |
Realized gain (loss) on sale of securities | | Net gain (loss) on sale and valuation adjustments of investment securities | | $ | 2,110 | | | $ | (1,707 | ) | | $ | 8,044 | |
| | | |
| | | | |
| | Total before tax | | | 2,110 | | | | (1,707 | ) | | | 8,044 | |
| | | |
| | | | |
| | Income tax (expense) benefit | | | (317 | ) | | | 13 | | | | (1,219) | |
| | | |
| | | | |
| | Total net of tax | | $ | 1,793 | | | $ | (1,694 | ) | | $ | 6,825 | |
| | | |
| | | | |
Unrealized net losses on cash flow hedges | | | | | | | | | | | | | | |
| | | | |
Forward contracts | | Mortgage banking activities | | $ | 1,839 | | | $ | (14,119 | ) | | $ | (9,686 | ) |
| | | |
| | | | |
| | Total before tax | | | 1,839 | | | | (14,119 | ) | | | (9,686) | |
| | | |
| | | | |
| | Income tax (expense) benefit | | | (716 | ) | | | 4,236 | | | | 2,906 | |
| | | |
| | | | |
| | Total net of tax | | $ | 1,123 | | | $ | (9,883 | ) | | $ | (6,780) | |
| | | |
| | | | |
| | Total reclassification adjustments, net of tax | | $ | (14,356 | ) | | $ | (29,488 | ) | | $ | (18,447) | |
| | | |
200
Note 27 – Guarantees
The Corporation has obligations upon the occurrence of certain events under financial guarantees provided in certain contractual agreements as summarized below.
The Corporation issues financial standby letters of credit and has risk participation in standby letters of credit issued by other financial institutions, in each case to guarantee the performance of various customers to third parties. If the customers failed to meet its financial or performance obligation to the third party under the terms of the contract, then, upon their request, the Corporation would be obligated to make the payment to the guaranteed party. At December 31, 2013, the Corporation recorded a liability of $0.4 million (December 31, 2012 - $0.6 million), which represents the unamortized balance of the obligations undertaken in issuing the guarantees under the standby letters of credit. In accordance with the provisions of ASC Topic 460, the Corporation recognizes at fair value the obligation at inception of the standby letters of credit. The fair value approximates the fee received from the customer for issuing such commitments. These fees are deferred and are recognized over the commitment period. The contracts amount in standby letters of credit outstanding at December 31, 2013 and 2012, shown in Note 28, represent the maximum potential amount of future payments that the Corporation could be required to make under the guarantees in the event of nonperformance by the customers. These standby letters of credit are used by the customers as a credit enhancement and typically expire without being drawn upon. The Corporation’s standby letters of credit are generally secured, and in the event of nonperformance by the customers, the Corporation has rights to the underlying collateral provided, which normally includes cash, marketable securities, real estate, receivables, and others. Management does not anticipate any material losses related to these instruments.
Also, the Corporation securitized mortgage loans into guaranteed mortgage-backed securities subject to lifetime credit recourse on the loans that serve as collateral for the mortgage-backed securities. Also, from time to time, the Corporation may sell, in bulk sale transactions, residential mortgage loans and Small Business Administration (“SBA”) commercial loans subject to credit recourse or to certain representations and warranties from the Corporation to the purchaser. These representations and warranties may relate, for example, to borrower creditworthiness, loan documentation, collateral, prepayment and early payment defaults. The Corporation may be required to repurchase the loans under the credit recourse agreements or representation and warranties.
At December 31, 2013, the Corporation serviced $2.5 billion (December 31, 2012 - $2.9 billion) in residential mortgage loans subject to credit recourse provisions, principally loans associated with FNMA and FHLMC residential mortgage loan securitization programs. In the event of any customer default, pursuant to the credit recourse provided, the Corporation is required to repurchase the loan or reimburse the third party investor for the incurred loss. The maximum potential amount of future payments that the Corporation would be required to make under the recourse arrangements in the event of nonperformance by the borrowers is equivalent to the total outstanding balance of the residential mortgage loans serviced with recourse and interest, if applicable. During 2013, the Corporation repurchased approximately $ 126 million of unpaid principal balance in mortgage loans subject to the credit recourse provisions (2012 - $ 157 million). In the event of nonperformance by the borrower, the Corporation has rights to the underlying collateral securing the mortgage loan. The Corporation suffers losses on these loans when the proceeds from a foreclosure sale of the property underlying a defaulted mortgage loan are less than the outstanding principal balance of the loan plus any uncollected interest advanced and the costs of holding and disposing the related property. At December 31, 2013, the Corporation’s liability established to cover the estimated credit loss exposure related to loans sold or serviced with credit recourse amounted to $ 41 million (December 31, 2012 - $ 52 million). The following table shows the changes in the Corporation’s liability of estimated losses from these credit recourses agreements, included in the consolidated statements of financial condition during the years ended December 31, 2013 and 2012.
| | | | | | | | |
| (In thousands) | | 2013 | | | 2012 | |
| |
| | |
Balance as of beginning of period | | $ | 51,673 | | | $ | 58,659 | |
| | |
Provision for recourse liability | | | 21,793 | | | | 16,153 | |
| | |
Net charge-offs / terminations | | | (32,003 | ) | | | (23,139) | |
| |
| | |
Balance as of end of period | | $ | 41,463 | | | $ | 51,673 | |
| |
The probable losses to be absorbed under the credit recourse arrangements are recorded as a liability when the loans are sold and are updated by accruing or reversing expense (categorized in the line item “adjustments (expense) to indemnity reserves on loans sold” in the consolidated statements of operations) throughout the life of the loan, as necessary, when additional relevant
201
information becomes available. The methodology used to estimate the recourse liability is a function of the recourse arrangements given and considers a variety of factors, which include actual defaults and historical loss experience, foreclosure rate, estimated future defaults and the probability that a loan would be delinquent. Statistical methods are used to estimate the recourse liability. Expected loss rates are applied to different loan segmentations. The expected loss, which represents the amount expected to be lost on a given loan, considers the probability of default and loss severity. The probability of default represents the probability that a loan in good standing would become 90 days delinquent within the following twelve-month period. Regression analysis quantifies the relationship between the default event and loan-specific characteristics, including credit scores, loan-to-value ratios, and loan aging, among others.
When the Corporation sells or securitizes mortgage loans, it generally makes customary representations and warranties regarding the characteristics of the loans sold. The Corporation’s mortgage operations in Puerto Rico group conforming mortgage loans into pools which are exchanged for FNMA and GNMA mortgage-backed securities, which are generally sold to private investors, or are sold directly to FNMA or other private investors for cash. As required under the government agency programs, quality review procedures are performed by the Corporation to ensure that asset guideline qualifications are met. To the extent the loans do not meet specified characteristics, the Corporation may be required to repurchase such loans or indemnify for losses and bear any subsequent loss related to the loans. Repurchases under representation and warranty arrangements in which the Corporation’s Puerto Rico banking subsidiaries were obligated to repurchase the loans amounted to $ 4.7 million in unpaid principal balance with losses amounting to $ 1.0 million for the year ended December 31, 2013 ($ 3.2 million and $0.5 million, respectively, at December 31, 2012). A substantial amount of these loans reinstate to performing status or have mortgage insurance, and thus the ultimate losses on the loans are not deemed significant.
During the quarter ended June 30, 2013, the Corporation established a reserve for certain specific representation and warranties made in connection with BPPR’s sale of non-performing mortgage loans. The purchaser’s sole remedy under the indemnity clause is to seek monetary damages from BPPR, for a maximum of $16.3 million. BPPR recognized a reserve of approximately $3.0 million, representing its best estimate of the loss that would be incurred in connection with this indemnification. BPPR’s obligations under this clause end one year after the closing except to any claim asserted prior to such termination date.
During the quarter ended March 31, 2013, the Corporation established a reserve for certain specific representation and warranties made in connection with BPPR’s sale of commercial and construction loans, and commercial and single family real estate owned. The purchaser’s sole remedy under the indemnity clause is to seek monetary damages from BPPR, for a maximum of $18.0 million. BPPR is not required to repurchase any of the assets. BPPR recognized a reserve of approximately $10.7 million, representing its best estimate of the loss that would be incurred in connection with this indemnification. BPPR’s obligations under this clause end one year after the closing except to any claim asserted prior to such termination date.
Also, during the quarter ended June 30, 2011, the Corporation’s banking subsidiary, BPPR, reached an agreement (the “June 2011 agreement”) with the FDIC, as receiver for a local Puerto Rico institution, and the financial institution with respect to a loan servicing portfolio that BPPR services since 2008, related to FHLMC and GNMA pools. The loans were originated and sold by the financial institution and the servicing rights were transferred to BPPR in 2008. As part of the 2008 servicing agreement, the financial institution was required to repurchase from BPPR any loans that BPPR, as servicer, was required to repurchase from the investors under representation and warranty obligations. As part of the June 2011 agreement, the Corporation received cash to discharge the financial institution from any repurchase obligation and other claims over the related serviced portfolio, for which the Corporation recorded a representation and warranty reserve. At December 31, 2013, this reserve amounted to $ 6.2 million and the related portfolio amounted approximately to $2.4 billion (December 31, 2012 - $ 7.6 million and $2.9 billion, respectively).
The following table presents the changes in the Corporation’s liability for estimated losses associated with the indemnifications and representations and warranties related to loans sold by BPPR for the years ended December 31, 2013 and 2012.
| | | | | | | | |
| (In thousands) | | 2013 | | | 2012 | |
| |
| | |
Balance as of beginning of period | | $ | 7,587 | | | $ | 8,522 | |
| | |
Additions for new sales | | | 13,747 | | | | - | |
| | |
Provision (reversal) for representation and warranties | | | (332 | ) | | | (25) | |
| | |
Net charge-offs | | | (1,725 | ) | | | (910) | |
| |
| | |
Balance as of end of period | | $ | 19,277 | | | $ | 7,587 | |
| |
202
In addition, at December 31, 2013, the Corporation has reserves for customary representation and warranties related to loans sold by its U.S. subsidiary E-LOAN prior to 2009. These loans had been sold to investors on a servicing released basis subject to certain representation and warranties. Although the risk of loss or default was generally assumed by the investors, the Corporation made certain representations relating to borrower creditworthiness, loan documentation and collateral, which if not correct, may result in requiring the Corporation to repurchase the loans or indemnify investors for any related losses associated to these loans. At December 31, 2013, the Corporation’s reserve for estimated losses from such representation and warranty arrangements amounted to $ 7 million, which was included as part of other liabilities in the consolidated statement of financial condition (December 31, 2012 - $ 8 million). E-LOAN is no longer originating and selling loans since the subsidiary ceased these activities in 2008. On a quarterly basis, the Corporation reassesses its estimate for expected losses associated to E-LOAN’s customary representation and warranty arrangements. The analysis incorporates expectations on future disbursements based on quarterly repurchases and make-whole events. The analysis also considers factors such as the average length-time between the loan’s funding date and the loan repurchase date, as observed in the historical loan data. Make-whole events are typically defaulted cases in which the investor attempts to recover by collateral or guarantees, and the seller is obligated to cover any impaired or unrecovered portion of the loan. Claims have been predominantly for first mortgage agency loans and principally consist of underwriting errors related to undisclosed debt or missing documentation. The following table presents the changes in the Corporation’s liability for estimated losses associated with customary representations and warranties related to loans sold by E-LOAN, included in the consolidated statement of financial condition for the years ended December 31, 2013 and 2012.
| | | | | | | | |
| (In thousands) | | 2013 | | | 2012 | |
| |
| | |
Balance as of beginning of period | | $ | 7,740 | | | $ | 10,625 | |
| | |
Provision for (reversal of) representation and warranties | | | 267 | | | | (1,836) | |
| | |
Net charge-offs / terminations | | | (1,431 | ) | | | (1,049) | |
| |
| | |
Balance as of end of period | | $ | 6,576 | | | $ | 7,740 | |
| |
Servicing agreements relating to the mortgage-backed securities programs of FNMA and GNMA, and to mortgage loans sold or serviced to certain other investors, including FHLMC, require the Corporation to advance funds to make scheduled payments of principal, interest, taxes and insurance, if such payments have not been received from the borrowers. At December 31, 2013, the Corporation serviced $16.3 billion in mortgage loans for third-parties, including the loans serviced with credit recourse (December 31, 2012 - $16.7 billion). The Corporation generally recovers funds advanced pursuant to these arrangements from the mortgage owner, from liquidation proceeds when the mortgage loan is foreclosed or, in the case of FHA/VA loans, under the applicable FHA and VA insurance and guarantees programs. However, in the meantime, the Corporation must absorb the cost of the funds it advances during the time the advance is outstanding. The Corporation must also bear the costs of attempting to collect on delinquent and defaulted mortgage loans. In addition, if a defaulted loan is not cured, the mortgage loan would be canceled as part of the foreclosure proceedings and the Corporation would not receive any future servicing income with respect to that loan. At December 31, 2013, the outstanding balance of funds advanced by the Corporation under such mortgage loan servicing agreements was approximately $29 million (December 31, 2012 - $19 million). To the extent the mortgage loans underlying the Corporation’s servicing portfolio experience increased delinquencies, the Corporation would be required to dedicate additional cash resources to comply with its obligation to advance funds as well as incur additional administrative costs related to increases in collection efforts.
Popular, Inc. Holding Company (“PIHC”) fully and unconditionally guarantees certain borrowing obligations issued by certain of its wholly-owned consolidated subsidiaries amounting to $ 0.2 billion at December 31, 2013 (December 31, 2012 - $ 0.5 billion). In addition, at December 31, 2013 and December 31, 2012, PIHC fully and unconditionally guaranteed on a subordinated basis $ 1.4 billion of capital securities (trust preferred securities) issued by wholly-owned issuing trust entities to the extent set forth in the applicable guarantee agreement. Refer to Note 23 to the consolidated financial statements for further information on the trust preferred securities.
203
Note 28 – Commitments and contingencies
Off-balance sheet risk
The Corporation is a party to financial instruments with off-balance sheet credit risk in the normal course of business to meet the financial needs of its customers. These financial instruments include loan commitments, letters of credit, and standby letters of credit. These instruments involve, to varying degrees, elements of credit and interest rate risk in excess of the amount recognized in the consolidated statements of financial condition.
The Corporation’s exposure to credit loss in the event of nonperformance by the other party to the financial instrument for commitments to extend credit, standby letters of credit and financial guarantees written is represented by the contractual notional amounts of those instruments. The Corporation uses the same credit policies in making these commitments and conditional obligations as it does for those reflected on the consolidated statements of financial condition.
Financial instruments with off-balance sheet credit risk, whose contract amounts represent potential credit risk as of the end of the periods presented were as follows:
| | | | | | | | |
| (In thousands) | | December 31, 2013 | | | December 31, 2012 | |
| |
| | |
Commitments to extend credit: | | | | | | | | |
| | |
Credit card lines | | $ | 4,594,676 | | | $ | 4,379,071 | |
| | |
Commercial lines of credit | | | 2,569,377 | | | | 2,044,382 | |
| | |
Other unused credit commitments | | | 326,874 | | | | 351,537 | |
| | |
Commercial letters of credit | | | 3,059 | | | | 20,634 | |
| | |
Standby letters of credit | | | 78,948 | | | | 127,519 | |
| | |
Commitments to originate or fund mortgage loans | | | 47,722 | | | | 41,187 | |
| |
At December 31, 2013, the Corporation maintained a reserve of approximately $7 million for potential losses associated with unfunded loan commitments related to commercial and consumer lines of credit (December 31, 2012 - $5 million).
Other commitments
At December 31, 2013, the Corporation also maintained other non-credit commitments for $10 million, primarily for the acquisition of other investments (December 31, 2012 - $10 million).
Business concentration
Since the Corporation’s business activities are currently concentrated primarily in Puerto Rico, its results of operations and financial condition are dependent upon the general trends of the Puerto Rico economy and, in particular, the residential and commercial real estate markets. The concentration of the Corporation’s operations in Puerto Rico exposes it to greater risk than other banking companies with a wider geographic base. Its asset and revenue composition by geographical area is presented in Note 42 to the consolidated financial statements.
The Corporation’s loan portfolio is diversified by loan category. However, approximately $13.4 billion, or 62% of the Corporation’s loan portfolio not covered under the FDIC loss sharing agreements, excluding loans held-for-sale, at December 31, 2013, consisted of real estate related loans, including residential mortgage loans, construction loans and commercial loans secured by commercial real estate (December 31, 2012 - $13.3 billion, or 64%).
At December 31, 2013, the Corporation’s direct exposure to the Puerto Rico government, instrumentalities and municipalities amounted $1.2 billion, of which approximately $950 million is outstanding. Of the amount outstanding, $789 million consists of loans and $161 million are securities. From this amount, $527 million represents obligations from the Government of Puerto Rico and public corporations that are either collateralized loans or obligations that have a specific source of income or revenues identified for their repayment. Some of these obligations consist of senior and subordinated loans to public corporations that obtain revenues from rates charged for services or products, such as water and electric power utilities. Public corporations have varying degrees of independence from the central Government and many receive appropriations or other payments from it. The remaining $423 million represents obligations from various municipalities in Puerto Rico for which, in most cases, the good faith, credit and unlimited taxing power of the applicable municipality has been pledged to their repayment. These municipalities are required by law to levy special
204
property taxes in such amounts as shall be required for the payment of all of its general obligation bonds and loans. These loans have seniority to the payment of operating cost and expenses of the municipality.
In addition, at December 31, 2013, the Corporation had $360 million in indirect exposure to loans or securities that are payable by non-governmental entities, but which carry a government guarantee to cover any shortfall in collateral in the event of borrower default. These included $274 million in residential mortgage loans that are guaranteed by the Puerto Rico Housing Finance Authority (December 31, 2012 - $294 million). These mortgage loans are secured by the underlying properties and the guarantees serve to cover shortfalls in collateral in the event of a borrower default. Also, the Corporation had $52 million in Puerto Rico pass-through housing bonds backed by FNMA, GNMA or residential loans CMO’s, and $34 million of industrial development notes.
Other contingencies
As indicated in Note 11 to the consolidated financial statements, as part of the loss sharing agreements related to the Westernbank FDIC-assisted transaction, the Corporation agreed to make a true-up payment to the FDIC on the date that is 45 days following the last day of the final shared loss month, or upon the final disposition of all covered assets under the loss sharing agreements in the event losses on the loss sharing agreements fail to reach expected levels. The fair value of the true-up payment obligation was estimated at $128 million at December 31, 2013 (December 31, 2012 - $112 million).
Legal Proceedings
The nature of Popular’s business ordinarily results in a certain number of claims, litigation, investigations, and legal and administrative cases and proceedings. When the Corporation determines it has meritorious defenses to the claims asserted, it vigorously defends itself. The Corporation will consider the settlement of cases (including cases where it has meritorious defenses) when, in management’s judgment, it is in the best interest of both the Corporation and its shareholders to do so.
On at least a quarterly basis, Popular assesses its liabilities and contingencies in connection with outstanding legal proceedings utilizing the latest information available. For matters where it is probable that the Corporation will incur a material loss and the amount can be reasonably estimated, the Corporation establishes an accrual for the loss. Once established, the accrual is adjusted on at least a quarterly basis as appropriate to reflect any relevant developments. For matters where a material loss is not probable or the amount of the loss cannot be estimated, no accrual is established.
In certain cases, exposure to loss exists in excess of the accrual to the extent such loss is reasonably possible, but not probable. Management believes and estimates that the aggregate range of reasonably possible losses (with respect to those matters where such limits may be determined, in excess of amounts accrued), for current legal proceedings ranges from $0 to approximately $39.8 million as of December 31, 2013. For certain other cases, management cannot reasonably estimate the possible loss at this time. Any estimate involves significant judgment, given the varying stages of the proceedings (including the fact that many of them are currently in preliminary stages), the existence of multiple defendants in several of the current proceedings whose share of liability has yet to be determined, the numerous unresolved issues in many of the proceedings, and the inherent uncertainty of the various potential outcomes of such proceedings. Accordingly, management’s estimate will change from time-to-time, and actual losses may be more or less than the current estimate.
While the final outcome of legal proceedings is inherently uncertain, based on information currently available, advice of counsel, and available insurance coverage, management believes that the amount it has already accrued is adequate and any incremental liability arising from the Corporation’s legal proceedings will not have a material adverse effect on the Corporation’s consolidated financial position as a whole. However, in the event of unexpected future developments, it is possible that the ultimate resolution of these matters, if unfavorable, may be material to the Corporation’s consolidated financial position in a particular period.
Ongoing Class Action Litigation
Banco Popular de Puerto Rico and Banco Popular North America are currently defendants in three class action lawsuits:
On November 21, 2012, BPNA was served with a putative class action complaint captionedValle v. Popular Community Bankfiled in the New York State Supreme Court (New York County). Plaintiffs, existing BPNA customers, allege among other things that BPNA has engaged in unfair and deceptive acts and trade practices relative to the assessment of overdraft fees and payment processing on consumer deposit accounts. The complaint further alleges that BPNA improperly disclosed its consumer overdraft
205
policies and, additionally, that the overdraft rates and fees assessed by BPNA violate New York’s usury laws. The complaint seeks unspecified damages, including punitive damages, interest, disbursements, and attorneys’ fees and costs. BPNA removed the case to federal court (S.D.N.Y.), and plaintiffs subsequently filed a motion to remand the action to state court, which the Court has granted on August 6, 2013. A motion to dismiss was filed on September 9, 2013. On October 25, 2013, plaintiffs filed an amended complaint seeking to limit the putative class to New York account holders. A motion to dismiss the amended complaint was filed on February 14, 2014.
Between December 2013 and January 2014, BPPR, BPNA and Popular, Inc., along with two executive officers, were served with a putative class action complaint captionedQuiles et al. v. Banco Popular de Puerto Rico et al. Plaintiffs essentially allege that they and others, who have been employed by the Defendants as “bank tellers” and other similarly titled positions, were generally paid only for scheduled work time, rather than all time actually worked. The Complaint seeks to maintain a collective action under the Fair Labor Standards Act on behalf of all individuals who were employed or are currently employed by the Defendants in Puerto Rico, the Virgin Islands, New York, New Jersey, Florida, California, and Illinois as hourly paid, non-exempt, bank tellers or other similarly titled positions at any time during the past three years and alleges the following claims under the Fair Labor Standards Act against all Defendants: (i) failure to pay overtime premiums; and (ii) that the failure to pay was willful. Similar claims are brought under Puerto Rico law on behalf of all individuals who were employed or are currently employed by BPPR in Puerto Rico as hourly paid, non-exempt, bank tellers or other similarly titled positions at any time during the past three years. On January 31, 2014, the Popular defendants filed an answer to the complaint. On February 24, 2014, the parties reached an agreement to dismiss the complaint against BPNA and the named BPNA executive officer without prejudice.
On August 22, 2013, BPNA was served with a putative class action complaint captionedCrissen v. Gupta, filed in the United States District Court for the Southern District of Indiana. The complaint alleges that BPNA, together with a BPNA commercial customer, purportedly engaged in a conspiracy to fraudulently inflate the amounts of money required to redeem property tax lien certificates in connection with certain Indiana real properties. Plaintiff is seeking actual damages against defendants in excess of $2 million, in addition to treble and punitive damages, based on alleged violations of the Racketeer Influenced and Corrupt Organizations (“RICO”) Act and various other state law claims. A motion to dismiss the complaint was filed on October 21, 2013. On January 28, 2014, the Court granted BPNA’s motion to dismiss in its entirety with prejudice.
Other Significant Proceedings
As described under “Note 11 – FDIC loss share asset and true-up payment obligation”, in connection with the Westernbank FDIC-assisted transaction, on April 30, 2010, BPPR entered into loss share agreements with the FDIC with respect to the covered loans and other real estate owned that it acquired in the transaction. Pursuant to the terms of the loss share agreements, the FDIC’s obligation to reimburse BPPR for losses with respect to covered assets begins with the first dollar of loss incurred. The FDIC reimburses BPPR for 80% of losses with respect to covered assets, and BPPR reimburses the FDIC for 80% of recoveries with respect to losses for which the FDIC paid 80% reimbursement under those loss share agreements. The loss share agreements contain specific terms and conditions regarding the management of the covered assets that BPPR must follow in order to receive reimbursement for losses from the FDIC. BPPR believes that it has complied with such terms and conditions. The loss share agreement applicable to the commercial late stage real-estate-collateral-dependent loans described below provides for loss sharing by the FDIC through the quarter ending June 30, 2015 and for reimbursement to the FDIC through the quarter ending June 30, 2018.
For the quarters ended June 30, 2010 through March 31, 2012, BPPR received reimbursement for loss-share claims submitted to the FDIC, including charge-offs for certain commercial late stage real-estate-collateral-dependent loans calculated in accordance with BPPR’s charge-off policy for non-covered assets. When BPPR submitted its shared-loss claim in connection with the June 30, 2012 quarter, however, the FDIC refused to reimburse BPPR for a portion of the claim because of a difference related to the methodology for the computation of charge-offs for certain commercial late stage real-estate-collateral-dependent loans. In accordance with the terms of the commercial loss share agreement, BPPR applied a methodology for charge-offs for late stage real-estate-collateral-dependent loans that conforms to its regulatory supervisory criteria and is calculated in accordance with BPPR’s charge-off policy for non-covered assets. The FDIC has stated that it believes that BPPR should use a different methodology for those charge-offs. Notwithstanding the FDIC’s refusal to reimburse BPPR for certain shared-loss claims, BPPR has continued to submit shared-loss claims for quarters subsequent to June 30, 2012. As of December 31, 2013, BPPR had unreimbursed shared-loss claims of $247.0 million under the commercial loss share agreement with the FDIC. On February 14, 2014, BPPR received a payment of $78.9 million related to reimbursable shared-loss claims from the FDIC. After giving effect to this payment, BPPR has
206
unreimbursed shared-loss claims amounting to $168.1 million, including $158.1 million related to commercial late stage real-estate-collateral-dependent loans, determined in accordance with BPPR’s regulatory supervisory criteria and BPPR’s charge-off policy for non-covered assets. If the reimbursement amount for these claims were calculated in accordance with the FDIC’s preferred methodology for late stage real-estate-collateral-dependent loans, the amount of such claims would be reduced by approximately $144.4 million.
BPPR’s loss share agreements with the FDIC specify that disputes can be submitted to arbitration before a review board under the commercial arbitration rules of the American Arbitration Association. On July 31, 2013, BPPR filed a statement of claim with the American Arbitration Association requesting that the review board determine certain matters relating to the loss-share claims under the commercial loss share agreement with the FDIC, including that the review board award BPPR the amounts owed under its unpaid quarterly certificates. The statement of claim also requests reimbursement of certain valuation adjustments for discounts to appraised values, costs to sell troubled assets and other items. The review board is comprised of one arbitrator appointed by BPPR, one arbitrator appointed by the FDIC and a third arbitrator selected by agreement of those arbitrators.
To the extent that we are not able to successfully resolve this matter through the arbitration process described above, a material difference could result in the timing and amount of charge-offs recorded by us and the amount of charge-offs reimbursed by the FDIC under the commercial loss share agreement. That could require us to make a material adjustment to the value of our loss share assets and the related true up payment obligation to the FDIC, and could have a material adverse effect on our financial results for the period in which such adjustment is taken.
207
Note 29 – Non-consolidated variable interest entities
The Corporation is involved with four statutory trusts which it established to issue trust preferred securities to the public. Also, it established Popular Capital Trust III for the purpose of exchanging Series C preferred stock shares held by the U.S. Treasury for trust preferred securities issued by this trust. These trusts are deemed to be variable interest entities (“VIEs”) since the equity investors at risk have no substantial decision-making rights. The Corporation does not hold any variable interest in the trusts, and therefore, cannot be the trusts’ primary beneficiary. Furthermore, the Corporation concluded that it did not hold a controlling financial interest in these trusts since the decisions of the trusts are predetermined through the trust documents and the guarantee of the trust preferred securities is irrelevant since in substance the sponsor is guaranteeing its own debt.
Also, the Corporation is involved with various special purpose entities mainly in guaranteed mortgage securitization transactions, including GNMA, FNMA and FHLMC. These special purpose entities are deemed to be VIEs since they lack equity investments at risk. The Corporation’s continuing involvement in these guaranteed loan securitizations includes owning certain beneficial interests in the form of securities as well as the servicing rights retained. The Corporation is not required to provide additional financial support to any of the variable interest entities to which it has transferred the financial assets. The mortgage-backed securities, to the extent retained, are classified in the Corporation’s consolidated statements of financial condition as available-for-sale or trading securities. The Corporation concluded that, essentially, these entities (FNMA, GNMA, and FHLMC) control the design of their respective VIEs, dictate the quality and nature of the collateral, require the underlying insurance, set the servicing standards via the servicing guides and can change them at will, and can remove a primary servicer with cause, and without cause in the case of FNMA and FHLMC. Moreover, through their guarantee obligations, agencies (FNMA, GNMA, and FHLMC) have the obligation to absorb losses that could be potentially significant to the VIE.
ASU 2009-17 requires that an ongoing primary beneficiary assessment should be made to determine whether the Corporation is the primary beneficiary of any of the VIEs it is involved with. The conclusion on the assessment of these trusts and guaranteed mortgage securitization transactions has not changed since their initial evaluation. The Corporation concluded that it is still not the primary beneficiary of these VIEs, and therefore, these VIEs are not required to be consolidated in the Corporation’s financial statements at December 31, 2013.
The Corporation holds variable interests in these VIEs in the form of agency mortgage-backed securities and collateralized mortgage obligations, including those securities originated by the Corporation and those acquired from third parties. Additionally, the Corporation holds agency mortgage-backed securities, agency collateralized mortgage obligations and private label collateralized mortgage obligations issued by third party VIEs in which it has no other form of continuing involvement. Refer to Note 32 to the consolidated financial statements for additional information on the debt securities outstanding at December 31, 2013 and 2012, which are classified as available-for-sale and trading securities in the Corporation’s consolidated statement of financial condition. In addition, the Corporation may retain the right to service the transferred loans in those government-sponsored special purpose entities (“SPEs”) and may also purchase the right to service loans in other government-sponsored SPEs that were transferred to those SPEs by a third-party. Pursuant to ASC Subtopic 810-10, the servicing fees that the Corporation receives for its servicing role are considered variable interests in the VIEs since the servicing fees are subordinated to the principal and interest that first needs to be paid to the mortgage-backed securities’ investors and to the guaranty fees that need to be paid to the federal agencies.
The following table presents the carrying amount and classification of the assets related to the Corporation’s variable interests in non-consolidated VIEs and the maximum exposure to loss as a result of the Corporation’s involvement as servicer with non-consolidated VIEs at December 31, 2013 and 2012.
| | | | | | | | |
| (In thousands) | | 2013 | | | 2012 | |
| |
| | |
Assets | | | | | | | | |
| |
| | |
Servicing assets: | | | | | | | | |
| | |
Mortgage servicing rights | | $ | 113,437 | | | $ | 105,246 | |
| |
| | |
Total servicing assets | | $ | 113,437 | | | $ | 105,246 | |
| |
| | |
Other assets: | | | | | | | | |
| | |
Servicing advances | | $ | 1,416 | | | $ | 1,106 | |
| |
| | |
Total other assets | | $ | 1,416 | | | $ | 1,106 | |
| |
208
| | | | | | | | |
| |
| | |
Total assets | | $ | 114,853 | | | $ | 106,352 | |
| |
| | |
Maximum exposure to loss | | $ | 114,853 | | | $ | 106,352 | |
| |
The size of the non-consolidated VIEs, in which the Corporation has a variable interest in the form of servicing fees, measured as the total unpaid principal balance of the loans, amounted to $9.2 billion at December 31, 2013 ($9.2 billion at December 31, 2012).
Maximum exposure to loss represents the maximum loss, under a worst case scenario, that would be incurred by the Corporation, as servicer for the VIEs, assuming all loans serviced are delinquent and that the value of the Corporation’s interests and any associated collateral declines to zero, without any consideration of recovery. The Corporation determined that the maximum exposure to loss includes the fair value of the MSRs and the assumption that the servicing advances at December 31, 2013 and 2012 will not be recovered. The agency debt securities are not included as part of the maximum exposure to loss since they are guaranteed by the related agencies.
In September of 2011, BPPR sold construction and commercial real estate loans with a fair value of $148 million, and most of which were non-performing, to a newly created joint venture, PRLP 2011 Holdings, LLC. The joint venture is majority owned by Caribbean Property Group (“CPG”), Goldman Sachs & Co. and East Rock Capital LLC. The joint venture was created for the limited purpose of acquiring the loans from BPPR; servicing the loans through a third-party servicer; ultimately working out, resolving and/or foreclosing the loans; and indirectly owning, operating, constructing, developing, leasing and selling any real properties acquired by the joint venture through deed in lieu of foreclosure, foreclosure, or by resolution of any loan.
BPPR provided financing to the joint venture for the acquisition of the loans in an amount equal to the sum of 57% of the purchase price of the loans, or $84 million, and $2 million of closing costs, for a total acquisition loan of $86 million (the “acquisition loan”). The acquisition loan has a 5-year maturity and bears a variable interest at 30-day LIBOR plus 300 basis points and is secured by a pledge of all of the acquiring entity’s assets. In addition, BPPR provided the joint venture with a non-revolving advance facility (the “advance facility”) of $68.5 million to cover unfunded commitments and costs-to-complete related to certain construction projects, and a revolving working capital line (the “working capital line”) of $20 million to fund certain operating expenses of the joint venture. Cash proceeds received by the joint venture are first used to cover debt service payments for the acquisition loan, advance facility, and the working capital line described above which must be paid in full before proceeds can be used for other purposes. The distributable cash proceeds are determined based on a pro-rata basis in accordance with the respective equity ownership percentages. BPPR’s equity interest in the joint venture ranks pari-passu with those of other parties involved. As part of the transaction executed in September 2011, BPPR received $ 48 million in cash and a 24.9% equity interest in the joint venture. The Corporation is not required to provide any other financial support to the joint venture.
BPPR accounted for this transaction as a true sale pursuant to ASC Subtopic 860-10 and thus recognized the cash received, its equity investment in the joint venture, and the acquisition loan provided to the joint venture and derecognized the loans sold.
The Corporation has determined that PRLP 2011 Holdings, LLC is a VIE but it is not the primary beneficiary. All decisions are made by CPG (or an affiliate thereof) (the “Manager”), except for certain limited material decisions which would require the unanimous consent of all members. The Manager is authorized to execute and deliver on behalf of the joint venture any and all documents, contracts, certificates, agreements and instruments, and to take any action deemed necessary in the benefit of the joint venture. Also, the Manager delegates the day-to-day management and servicing of the loans to CPG Island Servicing, LLC, an affiliate of CPG, which contracted Archon, an affiliate of Goldman Sachs, to act as subservicer, but it has the responsibility to oversee such servicing responsibilities.
The Corporation holds variable interests in this VIE in the form of the 24.9% equity interest and the financing provided to the joint venture. The equity interest is accounted for using the equity method of accounting pursuant to ASC Subtopic 323-10.
The initial fair value of the Corporation’s equity interest in the joint venture was determined based on the fair value of the loans and real estate owned transferred to the joint venture of $148 million which represented the purchase price of the loans agreed by the parties and was an arm’s-length transaction between market participants in accordance with ASC Topic 820, reduced by the acquisition loan provided by BPPR to the joint venture, for a total net equity of $63 million. Accordingly, the 24.9% equity interest held by the Corporation was valued at $16 million. Thus, the fair value of the equity interest is considered a Level 2 fair value measurement since the inputs were based on observable market inputs.
209
The following table presents the carrying amount and classification of the assets related to the Corporation’s variable interests in the non-consolidated VIE, PRLP 2011 Holdings, LLC and its maximum exposure to loss at December 31:
| | | | | | | | |
| (In thousands) | | 2013 | | | 2012 | |
| |
| | |
Assets | | | | | | | | |
| |
| | |
Loans held-in-portfolio: | | | | | | | | |
| | |
Acquisition loan | | $ | 3,233 | | | $ | 52,963 | |
| | |
Working capital line advances | | | 390 | | | | - | |
| | |
Advance facility advances | | | 16,024 | | | | 7,077 | |
| |
| | |
Total loans held-in-portfolio | | $ | 19,647 | | | $ | 60,040 | |
| |
| | |
Accrued interest receivable | | $ | 65 | | | $ | 163 | |
| | |
Other assets: | | | | | | | | |
| | |
Investment in PRLP 2011 Holdings LLC | | $ | 26,596 | | | $ | 22,747 | |
| |
| | |
Total assets | | $ | 46,308 | | | $ | 82,950 | |
| |
| | |
Deposits | | $ | (3,621 | ) | | $ | (7,103) | |
| |
| | |
Total liabilities | | $ | (3,621 | ) | | $ | (7,103) | |
| |
| | |
Total net assets | | $ | 42,687 | | | $ | 75,847 | |
| |
| | |
Maximum exposure to loss | | $ | 42,687 | | | $ | 75,847 | |
| |
The Corporation determined that the maximum exposure to loss under a worst case scenario at December 31, 2013 would be not recovering the carrying amount of the acquisition loan, the advances on the advance facility and working capital line, if any, and the equity interest held by the Corporation, net of the deposits.
On March 25, 2013, BPPR completed a sale of assets with a book value of $509.0 million, of which $500.6 million were in non-performing status, comprised of commercial and construction loans, and commercial and single family real estate owned, with a combined unpaid principal balance on loans and appraised value of other real estate owned of approximately $987.0 million to a newly created joint venture, PR Asset Portfolio 2013-1 International, LLC. The joint venture is majority owned by Caribbean Property Group LLC (“CPG”) and certain affiliates of Perella Weinberg Partners’Asset Based Value Strategy. The joint venture was created for the limited purpose of acquiring the loans from BPPR; servicing the loans through a third-party servicer; ultimately working out, resolving and/or foreclosing the loans; and indirectly owning, operating, constructing, developing, leasing and selling any real properties acquired by the joint venture through deed in lieu of foreclosure, foreclosure, or by resolution of any loan.
BPPR provided financing to the joint venture for the acquisition of the assets in an amount equal to the sum of 57% of the purchase price of the assets, and closing costs, for a total acquisition loan of $182.4 million (the “acquisition loan”). The acquisition loan has a 5-year maturity and bears a variable interest at 30-day LIBOR plus 300 basis points and is secured by a pledge of all of the acquiring entity’s assets. In addition, BPPR provided the joint venture with a non-revolving advance facility (the “advance facility”) of $35.0 million to cover unfunded commitments and costs-to-complete related to certain construction projects, and a revolving working capital line (the “working capital line”) of $30.0 million to fund certain operating expenses of the joint venture. Cash proceeds received by the joint venture are first used to cover debt service payments for the acquisition loan, advance facility, and the working capital line described above which must be paid in full before proceeds can be used for other purposes. The distributable cash proceeds are determined based on a pro-rata basis in accordance with the respective equity ownership percentages. BPPR’s equity interest in the joint venture ranks pari-passu with those of other parties involved. As part of the transaction executed in March 2013, BPPR received $92.3 million in cash and a 24.9% equity interest in the joint venture. The Corporation is not required to provide any other financial support to the joint venture.
BPPR accounted for this transaction as a true sale pursuant to ASC Subtopic 860-10 and thus recognized the cash received, its equity investment in the joint venture, and the acquisition loan provided to the joint venture and derecognized the loans and real estate owned sold.
The Corporation has determined that PR Asset Portfolio 2013-1 International, LLC is a VIE but the Corporation is not the primary beneficiary. All decisions are made by CPG (or an affiliate thereof) (the “Manager”), except for certain limited material decisions which would require the unanimous consent of all members. The Manager is authorized to execute and deliver on behalf of the joint venture any and all documents, contracts, certificates, agreements and instruments, and to take any action deemed necessary in
210
the benefit of the joint venture. Also, the Manager delegates the day-to-day management and servicing of the loans to PR Asset Portfolio Servicing International, LLC, an affiliate of CPG.
The initial fair value of the Corporation’s equity interest in the joint venture was determined based on the fair value of the loans and real estate owned transferred to the joint venture of $306 million which represented the purchase price of the loans agreed by the parties and was an arm’s-length transaction between market participants in accordance with ASC Topic 820, reduced by the acquisition loan provided by BPPR to the joint venture, for a total net equity of $124 million. Accordingly, the 24.9% equity interest held by the Corporation was valued at $31 million. Thus, the fair value of the equity interest is considered a Level 2 fair value measurement since the inputs were based on observable market inputs.
The Corporation holds variable interests in this VIE in the form of the 24.9% equity interest (the “Investment in PR Asset Portfolio 2013-1 International, LLC”) and the financing provided to the joint venture. The equity interest is accounted for under the equity method of accounting pursuant to ASC Subtopic 323-10.
The following table presents the carrying amount and classification of the assets and liabilities related to the Corporation’s variable interests in the non-consolidated VIE, PR Asset Portfolio 2013-1 International, LLC, and its maximum exposure to loss at December 31, 2013.
| | | | |
| (In thousands) | | December 31, 2013 | |
| |
| |
Assets | | | | |
| |
| |
Loans held-in-portfolio: | | | | |
| |
Acquisition loan | | $ | 157,660 | |
| |
Advances under the working capital line | | | 1,196 | |
| |
Advances under the advance facility | | | 1,427 | |
| |
| |
Total loans held-in-portfolio | | $ | 160,283 | |
| |
| |
Accrued interest receivable | | $ | 436 | |
| |
Other assets: | | | | |
| |
Investment in PR Asset Portfolio 2013-1 International, LLC | | $ | 30,478 | |
| |
| |
Total assets | | $ | 191,197 | |
| |
| |
Deposits | | $ | (20,808) | |
| |
| |
Total liabilities | | $ | (20,808) | |
| |
| |
Total net assets | | $ | 170,389 | |
| |
| |
Maximum exposure to loss | | $ | 170,389 | |
| |
The Corporation determined that the maximum exposure to loss under a worst case scenario at December 31, 2013 would be not recovering the carrying amount of the acquisition loan, the advances on the advance facility and working capital line, if any, and the equity interest held by the Corporation, net of deposits.
Note 30 – Derivative instruments and hedging activities
The use of derivatives is incorporated as part of the Corporation’s overall interest rate risk management strategy to minimize significant unplanned fluctuations in earnings and cash flows that are caused by interest rate volatility. The Corporation’s goal is to manage interest rate sensitivity by modifying the repricing or maturity characteristics of certain balance sheet assets and liabilities so that the net interest income is not materially affected by movements in interest rates. The Corporation uses derivatives in its trading activities to facilitate customer transactions, and as a means of risk management. As a result of interest rate fluctuations, hedged fixed and variable interest rate assets and liabilities will appreciate or depreciate in fair value. The effect of this unrealized appreciation or depreciation is expected to be substantially offset by the Corporation’s gains or losses on the derivative instruments that are linked to these hedged assets and liabilities. As a matter of policy, the Corporation does not use highly leveraged derivative instruments for interest rate risk management.
By using derivative instruments, the Corporation exposes itself to credit and market risk. If a counterparty fails to fulfill its performance obligations under a derivative contract, the Corporation’s credit risk will equal the fair value of the derivative asset.
211
Generally, when the fair value of a derivative contract is positive, this indicates that the counterparty owes the Corporation, thus creating a repayment risk for the Corporation. To manage the level of credit risk, the Corporation deals with counterparties of good credit standing, enters into master netting agreements whenever possible and, when appropriate, obtains collateral. On the other hand, when the fair value of a derivative contract is negative, the Corporation owes the counterparty and, therefore, the fair value of derivatives liabilities incorporates nonperformance risk or the risk that the obligation will not be fulfilled.
The credit risk attributed to the counterparty’s nonperformance risk is incorporated in the fair value of the derivatives. Additionally, as required by the fair value measurements guidance, the fair value of the Corporation’s own credit standing is considered in the fair value of the derivative liabilities. During the year ended December 31, 2013, inclusion of the credit risk in the fair value of the derivatives resulted in gain of $0.5 million (2012 – loss of $ 0.5 million; 2011 –gain of $ 1.1 million) resulting from the Corporation’s credit standing adjustment and a gain of $1.0 million (2012 – gain of $3.4 million; 2011 – loss of $1.7 million) from the assessment of the counterparties’ credit risk.
Market risk is the adverse effect that a change in interest rates, currency exchange rates, or implied volatility rates might have on the value of a financial instrument. The Corporation manages the market risk associated with interest rates and, to a limited extent, with fluctuations in foreign currency exchange rates by establishing and monitoring limits for the types and degree of risk that may be undertaken.
Pursuant to the Corporation’s accounting policy, the fair value of derivatives is not offset with the amounts for the right to reclaim cash collateral or the obligation to return cash collateral. At December 31, 2013, the amount recognized for the right to reclaim cash collateral under master netting agreements was $19 million and no amount was recognized for the obligation to return cash collateral (December 31, 2012 - $ 46 million and $ 1 million, respectively).
Certain of the Corporation’s derivative instruments include financial covenants tied to the corresponding banking subsidiary’s well-capitalized status and credit rating. These agreements could require exposure collateralization, early termination or both. The aggregate fair value of all derivative instruments with contingent features that were in a liability position at December 31, 2013 was $15 million (December 31, 2012 - $ 31 million). Based on the contractual obligations established on these derivative instruments, the Corporation has fully collateralized these positions by pledging collateral of $19 million at December 31, 2013 (December 31, 2012 - $ 46 million).
Financial instruments designated as cash flow hedges or non-hedging derivatives outstanding at December 31, 2013 and December 31, 2012 were as follows:
| | | | | | | | | | | | | | | | | | | | | | | | | | | | |
| |
| | | |
| | | Notional amount | | | Derivative assets | | | Derivative liabilities | |
| |
| | | | | |
| | | At December 31, | | | Statement of condition | | Fair value at December 31, | | | Statement of condition | | Fair value at December 31, | |
| | | | | | | | |
| (In thousands) | | 2013 | | | 2012 | | | classification | | 2013 | | | 2012 | | | classification | | 2013 | | | 2012 | |
| |
| | | | | | | | |
Derivatives designated as hedging instruments: | | | | | | | | | | | | | | | | | | | | | | | | | | | | |
| | | | | | | | |
Forward contracts | | $ | - | | | $ | 281,000 | | | Other assets | | $ | - | | | $ | 31 | | | Other liabilities | | $ | - | | | $ | 521 | |
| |
| | | | | | | | |
Total derivatives designated as hedging instruments | | $ | - | | | $ | 281,000 | | | | | $ | - | | | $ | 31 | | | | | $ | - | | | $ | 521 | |
| |
| | | | | | | | |
Derivatives not designated as hedging instruments: | | | | | | | | | | | | | | | | | | | | | | | | | | | | |
| | | | | | | | |
Forward contracts | | $ | 129,600 | | | $ | 53,100 | | | Trading account securities | | $ | 83 | | | $ | 10 | | | Other liabilities | | $ | 20 | | | $ | 18 | |
| | | | | | | | |
Forward contracts | | | 152,800 | | | | - | | | Other assets | | | 658 | | | | - | | | Other liabilities | | | 25 | | | | - | |
| | | | | | | | |
Interest rate swaps | | | 283,440 | | | | 766,668 | | | Other assets | | | 13,289 | | | | 28,136 | | | Other liabilities | | | 15,196 | | | | 31,008 | |
212
| | | | | | | | | | | | | | | | | | | | | | | | | | | | |
| | | | | | | | |
Foreign currency forward contracts | | | - | | | | 143 | | | Other assets | | | - | | | | 2 | | | Other liabilities | | | - | | | | 1 | |
| | | | | | | | |
Interest rate caps | | | 97,338 | | | | - | | | Other assets | | | 1,192 | | | | - | | | Other liabilities | | | 1,192 | | | | - | |
| | | | | | | | |
Indexed options on deposits | | | 85,729 | | | | 86,389 | | | Other assets | | | 19,571 | | | | 13,756 | | | - | | | - | | | | - | |
| | | | | | | | |
Bifurcated embedded options | | | 83,087 | | | | 83,620 | | | - | | | - | | | | - | | | Interest bearing deposits | | | 15,945 | | | | 11,037 | |
| |
| | | | | | | | |
Total derivatives not designated as hedging instruments: | | $ | 831,994 | | | $ | 989,920 | | | | | $ | 34,793 | | | $ | 41,904 | | | | | $ | 32,378 | | | $ | 42,064 | |
| |
| | | | | | | | |
Total derivative assets and liabilities | | $ | 831,994 | | | $ | 1,270,920 | | | | | $ | 34,793 | | | $ | 41,935 | | | | | $ | 32,378 | | | $ | 42,585 | |
| |
Cash Flow Hedges
The Corporation utilizes forward contracts to hedge the sale of mortgage-backed securities with duration terms over one month. Interest rate forwards are contracts for the delayed delivery of securities, which the seller agrees to deliver on a specified future date at a specified price or yield. These forward contracts are hedging a forecasted transaction and thus qualify for cash flow hedge accounting. Changes in the fair value of the derivatives are recorded in other comprehensive income (loss). The Corporation did not have any derivative that qualified to be accounted for as a cash flow hedge outstanding at December 31, 2013.
For cash flow hedges, net gains (losses) on derivative contracts that are reclassified from accumulated other comprehensive income (loss) to current period earnings are included in the line item in which the hedged item is recorded and during the period in which the forecasted transaction impacts earnings, as presented in the tables below.
| | | | | | | | | | | | | | |
| Year ended December 31, 2013 | |
| |
| | | | |
| (In thousands) | | Amount of net gain (loss)
recognized in OCI on derivatives (effective portion) | | | Classification in the statement of operations of the net gain (loss) reclassified from AOCI into income (effective portion, ineffective portion, and amount excluded from effectiveness testing) | | Amount of net gain (loss) reclassified from AOCI into income (effective portion) | | | Amount of net gain (loss) recognized in income on derivatives (ineffective portion and amount excluded from effectiveness testing) | |
| |
| | | | |
Forward contracts | | $ | 2,286 | | | Mortgage banking activities | | $ | 1,839 | | | $ | 577 | |
| |
| | | | |
Total | | $ | 2,286 | | | | | $ | 1,839 | | | $ | 577 | |
| |
|
| Year ended December 31, 2012 | |
| |
| | | | |
| (In thousands) | | Amount of net gain (loss)
recognized in OCI on
derivatives (effective
portion) | | | Classification in the statement of
operations of the net gain (loss)
reclassified from AOCI into income
(effective portion, ineffective portion,
and amount excluded from
effectiveness testing) | | Amount of net gain (loss)
reclassified from AOCI into
income (effective portion) | | | Amount of net gain (loss)
recognized in income on
derivatives (ineffective
portion and amount
excluded from
effectiveness testing) | |
| |
| | | | |
Forward contracts | | $ | (13,509) | | | Mortgage banking activities | | $ | 14,119 | | | $ | (44) | |
| |
| | | | |
Total | | $ | (13,509) | | | | | $ | 14,119 | | | $ | (44) | |
| |
|
| Year ended December 31, 2011 | |
| |
| | | | |
| (In thousands) | | Amount of net gain (loss)
recognized in OCI on
derivatives (effective
portion) | | | Classification in the statement of
operations of the net gain (loss)
reclassified from AOCI into income
(effective portion, ineffective portion,
and amount excluded from
effectiveness testing) | | Amount of net gain (loss)
reclassified from AOCI into
income (effective portion) | | | Amount of net gain (loss)
recognized in income on
derivatives (ineffective
portion and amount
excluded from
effectiveness testing) | |
| |
213
| | | | | | | | | | | | | | |
| |
| | | | |
Forward contracts | | $ | (11,678) | | | Mortgage banking activities | | $ | 9,686 | | | $ | (116) | |
| |
| | | | |
Total | | $ | (11,678) | | | | | $ | 9,686 | | | $ | (116) | |
| |
Fair Value Hedges
At December 31, 2013 and 2012, there were no derivatives designated as fair value hedges.
Non-Hedging Activities
For the year ended December 31, 2013, the Corporation recognized a gain of $ 11.1 million (2012 – loss of $ 4.8 million; 2011 – loss of $ 33.0 million) related to its non-hedging derivatives, as detailed in the table below.
| | | | | | | | | | | | | | |
| | | Amount of Net Gain (Loss) Recognized in Income on Derivatives | |
| | | | |
| (In thousands) | | Classification of Net Gain (Loss) Recognized in Income on Derivatives | | Year ended December 31, 2013 | | | Year ended December 31, 2012 | | | Year ended December 31, 2011 | |
| |
| | | | |
Forward contracts | | Mortgage banking activities | | $ | 9,039 | | | $ | (8,046) | | | $ | (32,517) | |
| | | | |
Interest rate swaps | | Other operating income | | | 965 | | | | 2,953 | | | | (1,382) | |
| | | | |
Foreign currency forward contracts | | Other operating income | | | 18 | | | | 31 | | | | 23 | |
| | | | |
Foreign currency forward contracts | | Interest expense | | | (1) | | | | (5) | | | | 3 | |
| | | | |
Indexed options on deposits | | Interest expense | | | 5,296 | | | | 1,965 | | | | (20) | |
| | | | |
Bifurcated embedded options | | Interest expense | | | (4,230) | | | | (1,735) | | | | 920 | |
| |
| | | | |
Total | | | | $ | 11,087 | | | $ | (4,837) | | | $ | (32,973) | |
| |
Forward Contracts
The Corporation has forward contracts to sell mortgage-backed securities, which are accounted for as trading derivatives. Changes in their fair value are recognized in mortgage banking activities.
Interest Rates Swaps and Foreign Currency and Exchange Rate Commitments
In addition to using derivative instruments as part of its interest rate risk management strategy, the Corporation also utilizes derivatives, such as interest rate swaps and foreign exchange forward contracts, in its capacity as an intermediary on behalf of its customers. The Corporation minimizes its market risk and credit risk by taking offsetting positions under the same terms and conditions with credit limit approvals and monitoring procedures. Market value changes on these swaps and other derivatives are recognized in earnings in the period of change.
Interest Rate Caps and Floors
The Corporation enters into interest rate caps and floors as an intermediary on behalf of its customers and simultaneously takes offsetting positions under the same terms and conditions, thus minimizing its market and credit risks.
Index and Embedded Options
The Corporation offers certain customers’ deposits whose return are tied to the performance of the Standard and Poor’s (“S&P 500”) stock market indexes, and other deposits whose returns are tied to other stock market indexes or other equity securities performance. The Corporation bifurcated the related options embedded within these customers’ deposits from the host contract in accordance with ASC Subtopic 815-15. In order to limit the Corporation’s exposure to changes in these indexes, the Corporation purchases index options which returns are tied to the same indexes from major broker dealer companies in the over the counter market. Accordingly, the embedded options and the related index options are marked-to-market through earnings.
Note 31 – Related party transactions
The Corporation grants loans to its directors, executive officers and certain related individuals or organizations in the ordinary course of business. The activity and balance of these loans were as follows:
214
| | | | | | | | | | | | |
| (In thousands) | | Executive
Officers | | | Directors | | | Total | |
| |
Balance at December 31, 2011 | | $ | 5,460 | | | $ | 100,088 | | | $ | 105,548 | |
New loans | | | 311 | | | | 51,623 | | | | 51,934 | |
Payments | | | (786) | | | | (36,667) | | | | (37,453) | |
Other changes | | | (38) | | | | (6,837) | | | | (6,875) | |
| |
Balance at December 31, 2012 | | $ | 4,947 | | | $ | 108,207 | | | $ | 113,154 | |
New loans | | | 239 | | | | 40,827 | | | | 41,066 | |
Payments | | | (301) | | | | (51,720) | | | | (52,021) | |
Other changes | | | 24,828 | | | | (30,473) | | | | (5,645) | |
| |
Balance at December 31, 2013 | | $ | 29,713 | | | $ | 66,841 | | | $ | 96,554 | |
| |
The amounts reported as “other changes” include items such as changes in the status of those who are considered related parties and a reclassification of a loan acquired as part of the Westernbank acquisition with a carrying value of $25 million as a loan related to an executive officer instead of to a director. This loan was previously classified as related to a director because both a former director (who ceased being a director in 2013) and an executive officer were related parties of the borrower entity.
At December 31, 2013, the Corporation’s banking subsidiaries held deposits from related parties, excluding EVERTEC, amounting to $20 million (2012 - $ 23 million).
From time to time, the Corporation, in the ordinary course of business, obtains services from related parties or makes contributions to non-profit organizations that have some association with the Corporation. Management believes the terms of such arrangements are consistent with arrangements entered into with independent third parties.
During 2013, the Corporation engaged, in the ordinary course of business, the legal services of a law firm in Puerto Rico, in which the Secretary of the Board of Directors of Popular, Inc. acted as senior counsel or as partner. The fees paid to this law firm for the year 2013 amounted to approximately $1.1 million (2012 - $1.9 million).
For the year ended December 31, 2013, the Corporation made contributions of approximately $0.7 million to Banco Popular Foundations, which are not-for-profit corporations dedicated to philanthropic work (2012 - $0.6 million).
A director of the Corporation until April, 2013 and entities controlled by him has a series of loan relationships with BPPR, which were restructured in March 2012. The aggregate amount of the credit facilities restructured approximated $1.8 million, of which approximately $1.5 million was outstanding at the time of the restructuring. As part of the restructuring, certain lines of credit were converted to term loans. The modified credit facilities are considered troubled debt restructurings because of the approved term extensions which could be viewed as an accommodation to a borrower to ensure continued compliance with its obligations. During 2012, one of the credit facilities with an outstanding balance of $0.3 million was paid in full. As of December 31, 2013 the term loans had an aggregate outstanding balance of $1.1 million.
In October 2007, a corporation, in which a family member of a former director and nephew of the Corporation’s chief executive officer owns a 50% equity interest, obtained a $3.9 million loan from BPPR to acquire a parcel of property on which it intended to develop a residential project in Puerto Rico. Certain of the director’s family members personally guaranteed the loan. The borrower also obtained a $.3 million unsecured line of credit from BPPR. The loan went into default and BPPR commenced foreclosure and collection proceedings against both the borrower and the guarantors in April 2010. The loan and line of credit were sold to an unrelated third party in March 2013, as part of a bulk sale on non-performing assets. The loan had a carrying value of $2 million at the time of the sale.
In June 2006, family members of a director of the Corporation, obtained an $.8 million mortgage loan from Popular Mortgage, Inc., secured by a residential property. The director was not a director of the Corporation at the time the loan was made. In March, 2012 the loan was restructured under the Corporation’s loss mitigation program. The balance due on the loan at December 31, 2013 was approximately $0.9 million.
In November 2007, family members of the chief executive officer and member of the Board of Directors of the Corporation, obtained a $1.35 million mortgage loan from Popular Mortgage, secured by a residential property. The borrowers became delinquent on their payments commencing in September 2009 and after exhausting various collection and loss mitigation efforts BPPR commenced foreclosure procedures in October 2011. The balance due on the loan at December 31, 2012, including accumulated interest, was approximately $1.7 million. At December 31, 2012, the Corporation had recorded a loss of approximately $.5 million on this loan. The loan was sold in June 2013, to an unrelated third party, as part of a bulk sale of non-performing assets.
215
On September 30, 2013, BPPR sold certain non-performing commercial loans for $15.7 million to an affiliate of one of the Corporation’s shareholders. As part of this transaction, this affiliated entity also acquired a majority interest in two of BPPR’s borrowers. These borrowers had construction loans which were syndicated and had an outstanding unpaid principal balance due to BPPR aggregating to $13.2 million at the date of the transaction. These loans were restructured with an extension of maturity and an accrued interest discharge by BPPR of $2.0 million. Separately, BPPR entered into an agreement to sell two undeveloped parcels of land, for $2.7 million, to an entity controlled by this shareholder.
The Corporation has had loan transactions with the Corporation’s directors and officers, and with their associates, and proposes to continue such transactions in the ordinary course of its business, on substantially the same terms, including interest rates and collateral, as those prevailing for comparable loan transactions with third parties, except as disclosed above. Except as discussed above, the extensions of credit have not involved and do not currently involve more than normal risks of collection or present other unfavorable features.
216
Related party transactions with EVERTEC, as an affiliate
The Corporation has an investment in EVERTEC, Inc. (“EVERTEC”), which provides various processing and information technology services to the Corporation and its subsidiaries and gives BPPR access to the ATH network owned and operated by EVERTEC.
During 2013 the Corporation participated as a selling stockholder in the Initial Public Offering (“IPO”), completed on April 12, 2013, and subsequent offerings executed by EVERTEC during the third and fourth quarters. In connection with its IPO, EVERTEC refinanced its outstanding debt and Popular received payment in full for its portion of the EVERTEC debt held by it. As part of the offering completed during the fourth quarter, EVERTEC repurchased from the underwriters 3,690,036 shares of its common stock being sold by the selling stockholders in the offering, resulting in a reduction in its capital of approximately $75.0 million. As a result of these transactions Popular recognized an after tax gain of $412.8 million, generated $585 million in net cash proceeds and retained a stake of 14.9% (2012 - 48.5%) in EVERTEC, which has a book value of $19.9 million as of December 31, 2013. The Corporation continues to have significant influence over EVERTEC. Accordingly, the investment in EVERTEC is accounted for under the equity method and is evaluated for impairment if events or circumstances indicate that a decrease in value of the investment has occurred that is other than temporary.
The Corporation received $4.4 million in dividend distributions during the year ended December 31, 2013 from its investments in EVERTEC’s holding company. During the year ended December 31, 2012, net capital distributions received from EVERTEC amounted to $155 million, which included $5 million in dividend distributions. The Corporation’s equity in EVERTEC is presented in the table which follows and is included as part of “other assets” in the consolidated statement of financial condition.
| | | | | | | | |
| (In thousands) | | December 31, 2013 | | | December 31, 2012 | |
| |
Equity investment in EVERTEC | | $ | 19,931 | | | $ | 73,916 | |
| |
The Corporation had the following financial condition balances outstanding with EVERTEC at December 31, 2013 and 2012. Items that represent liabilities to the Corporation are presented with parenthesis.
| | | | | | | | | | |
| | | | | December 31, | |
| | | |
| | | |
| (In thousands) | | | | 2013 | | | 2012 | |
| |
| | | |
Investment securities | | | | $ | - | | | $ | 35,000 | |
| | | |
Loans | | | | | - | | | | 53,589 | |
| | | |
Accounts receivable (Other assets) | | | | | 8,634 | | | | 4,085 | |
| | | |
Deposits | | | | | (14,289) | | | | (19,968) | |
| | | |
Accounts payable (Other liabilities) | | | | | (15,862) | | | | (16,582) | |
| |
| | | |
Net total | | | | $ | (21,517) | | | $ | 56,124 | |
| |
The Corporation’s proportionate share of income or loss from EVERTEC is included in other operating income in the consolidated statements of operations since October 1, 2010. The following table presents the Corporation’s proportionate share of EVERTEC’s income (loss) and changes in stockholders’ equity for the years ended December 31, 2013, 2012 and 2011.
| | | | | | | | | | | | | | | | | | |
| | | | | Year ended December 31, | |
| | | | | | |
| (In thousands) | | | | 2013 | | | | | 2012 | | | | | 2011 | |
| |
Share of (loss) income from investment in EVERTEC | | $ | | | (3,762 | ) | | | | $ | 38,461 | | | | | $ | 13,936 | |
Share of other changes in EVERTEC’s stockholders’ equity | | | | | 18,965 | | | | | | (187 | ) | | | | | - | |
| |
Share of EVERTEC’s changes in equity recognized in income | | $ | | | 15,203 | | | | | $ | 38,274 | | | | | $ | 13,936 | |
| |
The following tables present the impact of transactions and service payments between the Corporation and EVERTEC (as an affiliate) and their impact on the results of operations for the years ended December 31, 2013, 2012 and 2011. Items that represent expenses to the Corporation are presented with parenthesis.
217
| | | | | | | | | | | | | | |
| | | Year ended | | | |
| | | | | | |
| (In thousands) | | December 31, 2013 | | | December 31,
2012 | | | December 31,
2011 | | | Category |
|
| | | | |
Interest income on loan to EVERTEC | | $ | 2,490 | | | $ | 3,373 | | | $ | 3,619 | | | Interest income |
| | | | |
Interest income on investment securities issued by EVERTEC | | | 1,269 | | | | 3,850 | | | | 3,850 | | | Interest income |
| | | | |
Interest expense on deposits | | | (128) | | | | (267) | | | | (627) | | | Interest expense |
| | | | |
ATH and credit cards interchange income from services to EVERTEC | | | 25,571 | | | | 25,188 | | | | 27,300 | | | Other service fees |
| | | | |
Debt prepayment penalty paid by EVERTEC | | | 5,856 | | | | - | | | | - | | | Net gain (loss) and valuation adjustments on investment securities |
| | | | |
Consulting fee paid by EVERTEC | | | 9,854 | | | | - | | | | - | | | Other operating income |
| | | | |
Rental income charged to EVERTEC | | | 6,560 | | | | 6,647 | | | | 7,063 | | | Net occupancy |
| | | | |
Processing fees on services provided by EVERTEC | | | (155,521) | | | | (150,677) | | | | (149,156) | | | Professional fees |
| | | | |
Other services provided to EVERTEC | | | 843 | | | | 751 | | | | 1,382 | | | Other operating expenses |
|
| | | | |
Total | | $ | (103,206) | | | $ | (111,135) | | | $ | (106,569) | | | |
|
At December 31, 2012, EVERTEC had certain performance bonds outstanding, which were guaranteed by the Corporation under a general indemnity agreement between the Corporation and the insurance companies issuing the bonds. EVERTEC’s performance bonds guaranteed by the Corporation amounted to approximately $1.0 million at December 31, 2012 and expired during the quarter ended June 30, 2013. Also, EVERTEC has a letter of credit issued by BPPR, for an amount of $3.6 million at December 31, 2013 (2012 - $2.9 million). The Corporation also agreed to maintain outstanding this letter of credit for a 5-year period which expires on September 30, 2015. EVERTEC and the Corporation entered into a Reimbursement Agreements, in which EVERTEC will reimburse the Corporation for any losses incurred by the Corporation in connection with the performance bonds and the letter of credit. Possible losses resulting from these agreements are considered insignificant.
During the second quarter of 2013, the Corporation discontinued the elimination of its proportionate ownership share of intercompany transactions with EVERTEC from their respective revenue and expense categories to reflect them as an equity pick-up adjustment in other operating income. The consolidated statements of operations for all period presented have been adjusted to reflect this change. This change had no impact on the Corporation’s net income and did not have a material effect on its consolidated financial statements. The following tables presents the impact of the change in the Corporation’s results for all comparative prior periods presented.
| | | | | | | | | | | | | | |
| | | | | Year ended December 31, | |
| | | | | | |
| (In thousands) | | | | 2013 | | | 2012 | | | 2011 | |
| |
Share of EVERTEC’s changes in equity recognized in income | | $ | | | 15,203 | | | $ | 38,274 | | | $ | 13,936 | |
Intra-company eliminations considered in other operating income (detailed in next table) | | | | | (15,378 | ) | | | (53,449 | ) | | | (52,218 | ) |
| |
Share of EVERTEC’s changes in equity, net of eliminations | | $ | | | (175 | ) | | $ | (15,175 | ) | | $ | (38,282 | ) |
| |
| | | | | | | | | | | | | | | | | | | | | | | | | | | | | | | | | | | | | | |
| | | December 31, 2013 | | | December 31, 2012 | | | December 31, 2011 | | | |
| | | | | | | | | | |
| (In thousands) | | As
currently
reported | | | Impact of
eliminations | | | Amounts net of
eliminations | | | As
currently
reported | | | Impact of
eliminations | | | Amounts net of
eliminations | | | As
currently
reported | | | Impact of
eliminations | | | Amounts net of
eliminations | | | Category |
|
| | | | | | | | | | |
Interest income on loan to EVERTEC | | $ | 2,490 | | | $ | (371) | | | $ | 2,119 | | | $ | 3,373 | | | $ | (1,621) | | | $ | 1,752 | | | $ | 3,619 | | | $ | (1,773) | | | $ | 1,846 | | | Interest income |
| | | | | | | | | | |
Interest income on investment securities issued by EVERTEC | | | 1,269 | | | | (189) | | | | 1,080 | | | | 3,850 | | | | (1,851) | | | | 1,999 | | | | 3,850 | | | | (1,887) | | | | 1,963 | | | Interest income |
| | | | | | | | | | |
Interest expense on deposits | | | (128) | | | | 19 | | | | (109) | | | | (267) | | | | 127 | | | | (140) | | | | (627) | | | | 307 | | | | (320) | | | Interest expense |
| | | | | | | | | | |
ATH and credit cards interchange income from services to EVERTEC | | | 25,571 | | | | (3,810) | | | | 21,761 | | | | 25,188 | | | | (12,090) | | | | 13,098 | | | | 27,300 | | | | (13,377) | | | | 13,923 | | | Other service fees |
218
| | | | | | | | | | | | | | | | | | | | | | | | | | | | | | | | | | | | | | |
Debt prepayment penalty paid by EVERTEC | | | 5,856 | | | | (873) | | | | 4,983 | | | | - | | | | - | | | | - | | | | - | | | | - | | | | - | | | Net gain (loss) and valuation adjustments on investment securities |
| | | | | | | | | | |
Consulting fee paid by EVERTEC | | | 9,854 | | | | (1,468) | | | | 8,386 | | | | - | | | | - | | | | - | | | | - | | | | - | | | | - | | | Other operating income |
| | | | | | | | | | |
Rental income charged to EVERTEC | | | 6,560 | | | | (977) | | | | 5,583 | | | | 6,647 | | | | (3,193) | | | | 3,454 | | | | 7,063 | | | | (3,461) | | | | 3,602 | | | Net occupancy |
| | | | | | | | | | |
Processing fees on services provided by EVERTEC | | | (155,521) | | | | 23,173 | | | | (132,348) | | | | (150,677) | | | | 72,435 | | | | (78,242) | | | | (149,156) | | | | 73,086 | | | | (76,070) | | | Professional fees |
| | | | | | | | | | |
Other services provided to EVERTEC | | | 843 | | | | (126) | | | | 717 | | | | 751 | | | | (358) | | | | 393 | | | | 1,382 | | | | (677) | | | | 705 | | | Other operating expenses |
|
| | | | | | | | | | |
| Total | | $ | (103,206) | | | $ | 15,378 | | | $ | (87,828) | | | $ | (111,135) | | | $ | 53,449 | | | $ | (57,686) | | | $ | (106,569) | | | $ | 52,218 | | | $ | (54,351) | | | |
|
PRLP 2011 Holdings LLC
As indicated in Note 29 to the consolidated financial statements, the Corporation holds a 24.9% equity interest in PRLP 2011 Holdings, LLC and currently provides certain financing to the joint venture as well as holds certain deposits from the entity.
The Corporation’s equity in PRLP 2011 Holdings, LLC is presented in the table which follows and is included as part of “other assets” in the consolidated statements of financial condition.
| | | | | | | | |
| (In thousands) | | December 31, 2013 | | | December 31, 2012 | |
| |
Equity investment in PRLP 2011 Holdings, LLC | | $ | 26,596 | | | $ | 22,747 | |
| |
The Corporation had the following financial condition balances outstanding with PRLP 2011 Holdings, LLC at December 31, 2013 and 2012.
| | | | | | | | |
| (In thousands) | | At December 31, 2013 | | | At December 31, 2012 | |
| |
| | |
Loans | | | $ 19,647 | | | | $ 60,040 | |
| | |
Accrued interest receivable | | | 65 | | | | 163 | |
| | |
Deposits (non-interest bearing) | | | (3,621) | | | | (7,103) | |
| |
| | |
Net total | | | $ 16,091 | | | | $ 53,100 | |
| |
The Corporation’s proportionate share of income or loss from PRLP 2011 Holdings, LLC is included in other operating income in the consolidated statements of operations. The following table presents the Corporation’s proportionate share of income (loss) from PRLP 2011 Holdings, LLC for the years ended December 31, 2013 and 2012.
| | | | | | | | | | |
| | | | | Year ended December 31, | |
| | | | | | |
| (In thousands) | | | | 2013 | | | 2012 | |
| |
Share of income from the equity investment in PRLP 2011 Holdings, LLC | | $ | | | 3,347 | | | $ | 7,128 | |
| |
The following table presents transactions between the Corporation and PRLP 2011 Holdings, LLC and their impact on the Corporation’s results of operations for the years ended December 31, 2013 and 2012.
| | | | | | | | | | | | | | |
| | | | | Year ended December 31, | | | | |
| | | | | | | | | | |
| (In thousands) | | | | 2013 | | | 2012 | | | Category | |
| |
| | | | |
Interest income on loan to PRLP 2011 Holdings, LLC | | $ | | | 1,162 | | | $ | 2,688 | | | | Interest income | |
| |
219
PR Asset Portfolio 2013-1 International, LLC
As indicated in Note 29 to the consolidated financial statements, effective March 2013 the Corporation holds a 24.9% equity interest in PR Asset Portfolio 2013-1 International, LLC and currently provides certain financing to the joint venture as well as holds certain deposits from the entity.
The Corporation’s equity in PR Asset Portfolio 2013-1 International, LLC is presented in the table which follows and is included as part of “other assets” in the consolidated statements of financial condition.
| | | | |
| (In thousands) | | December 31, 2013 | |
| |
Equity investment in PR Asset Portfolio 2013-1 International, LLC | | $ | 30,478 | |
| |
The Corporation had the following financial condition balances outstanding with PR Asset Portfolio 2013-1 International, LLC, at December 31, 2013.
| | | | |
| (In thousands) | | At December 31, 2013 | |
| |
| |
Loans | | | $ 160,283 | |
| |
Accrued interest receivable | | | 436 | |
| |
Deposits | | | (20,808) | |
| |
Net total | | | $ 139,911 | |
| |
The Corporation’s proportionate share of income or loss from PR Asset Portfolio 2013-1 International, LLC is included in other operating income in the consolidated statements of operations. The following table presents the Corporation’s proportionate share of income (loss) from PR Asset Portfolio 2013-1 International, LLC for year ended December 31, 2013.
| | | | |
| | | Year ended | |
| (In thousands) | | December 31, 2013 | |
| |
| |
Share of loss from the equity investment in PR Asset Portfolio 2013-1 International, LLC | | $ | (1,979) | |
| |
The following table presents transactions between the Corporation and PR Asset Portfolio 2013-1 International, LLC and their impact on the Corporation’s results of operations for the year ended December 31, 2013.
| | | | | | | | |
| | | Year ended | | | | |
| | |
| (In thousands) | | December 31, 2013 | | | Category | |
| |
| | |
Interest income on loan to PR Asset Portfolio 2013-1 International, LLC | | | $ 2,966 | | | | Interest income | |
| | |
Servicing fee paid by PR Asset Portfolio 2013-1 International, LLC | | | 150 | | | | Other service fees | |
| |
| | |
Total | | | $ 3,116 | | | | | |
| |
220
Note 32 –Fair value measurement
ASC Subtopic 820-10 “Fair Value Measurements and Disclosures” establishes a fair value hierarchy that prioritizes the inputs to valuation techniques used to measure fair value into three levels in order to increase consistency and comparability in fair value measurements and disclosures. The hierarchy is broken down into three levels based on the reliability of inputs as follows:
| | — | | Level 1- Unadjusted quoted prices in active markets for identical assets or liabilities that the Corporation has the ability to access at the measurement date. Valuation on these instruments does not necessitate a significant degree of judgment since valuations are based on quoted prices that are readily available in an active market. |
| | — | | Level 2- Quoted prices other than those included in Level 1 that are observable either directly or indirectly. Level 2 inputs include quoted prices for similar assets or liabilities in active markets, quoted prices for identical or similar assets or liabilities in markets that are not active, or other inputs that are observable or that can be corroborated by observable market data for substantially the full term of the financial instrument. |
| | — | | Level 3- Inputs are unobservable and significant to the fair value measurement. Unobservable inputs reflect the Corporation’s own assumptions about assumptions that market participants would use in pricing the asset or liability. |
The Corporation maximizes the use of observable inputs and minimizes the use of unobservable inputs by requiring that the observable inputs be used when available. Fair value is based upon quoted market prices when available. If listed prices or quotes are not available, the Corporation employs internally-developed models that primarily use market-based inputs including yield curves, interest rates, volatilities, and credit curves, among others. Valuation adjustments are limited to those necessary to ensure that the financial instrument’s fair value is adequately representative of the price that would be received or paid in the marketplace. These adjustments include amounts that reflect counterparty credit quality, the Corporation’s credit standing, constraints on liquidity and unobservable parameters that are applied consistently.
The estimated fair value may be subjective in nature and may involve uncertainties and matters of significant judgment for certain financial instruments. Changes in the underlying assumptions used in calculating fair value could significantly affect the results.
Fair Value on a Recurring and Nonrecurring Basis
The following fair value hierarchy tables present information about the Corporation’s assets and liabilities measured at fair value on a recurring basis at December 31, 2013 and 2012 and on a nonrecurring basis in periods subsequent to initial recognition for the years ended December 31, 2013, 2012, and 2011:
| | | | | | | | | | | | | | | | |
| At December 31, 2013 | |
| |
| | | | |
| (In thousands) | | Level 1 | | | Level 2 | | | Level 3 | | | Total | |
| |
| | | | |
RECURRING FAIR VALUE MEASUREMENTS | | | | | | | | | | | | | | | | |
| |
| | | | |
Assets | | | | | | | | | | | | | | | | |
| |
| | | | |
Investment securities available-for-sale: | | | | | | | | | | | | | | | | |
| |
U.S. Treasury securities | | $ | - | | | $ | 28,482 | | | $ | - | | | $ | 28,482 | |
| | | | |
Obligations of U.S. Government sponsored entities | | | - | | | | 1,629,205 | | | | - | | | | 1,629,205 | |
Obligations of Puerto Rico, States and political subdivisions | | | - | | | | 66,377 | | | | - | | | | 66,377 | |
| | | | |
Collateralized mortgage obligations - federal agencies | | | - | | | | 2,418,296 | | | | - | | | | 2,418,296 | |
Collateralized mortgage obligations - private label | | | - | | | | 513 | | | | - | | | | 513 | |
| | | | |
Mortgage-backed securities | | | - | | | | 1,129,118 | | | | 6,523 | | | | 1,135,641 | |
Equity securities | | | 412 | | | | 3,704 | | | | - | | | | 4,116 | |
| | | | |
Other | | | - | | | | 12,170 | | | | - | | | | 12,170 | |
| |
Total investment securities available-for-sale | | $ | 412 | | | $ | 5,287,865 | | | $ | 6,523 | | | $ | 5,294,800 | |
| |
| | | | |
Trading account securities, excluding derivatives: | | | | | | | | | | | | | | | | |
| |
Obligations of Puerto Rico, States and political subdivisions | | $ | - | | | $ | 7,586 | | | $ | - | | | $ | 7,586 | |
| | | | |
Collateralized mortgage obligations | | | - | | | | 426 | | | | 1,423 | | | | 1,849 | |
221
| | | | | | | | | | | | | | | | |
Mortgage-backed securities - federal agencies | | | - | | | | 302,952 | | | | 9,799 | | | | 312,751 | |
Other | | | - | | | | 15,545 | | | | 1,929 | | | | 17,474 | |
| |
Total trading account securities | | $ | - | | | $ | 326,509 | | | $ | 13,151 | | | $ | 339,660 | |
| |
| | | | |
Mortgage servicing rights | | $ | - | | | $ | - | | | $ | 161,099 | | | $ | 161,099 | |
Derivatives | | | - | | | | 34,793 | | | | - | | | | 34,793 | |
| |
| | | | |
Total assets measured at fair value on a recurring basis | | $ | 412 | | | $ | 5,649,167 | | | $ | 180,773 | | | $ | 5,830,352 | |
| |
Liabilities | | | | | | | | | | | | | | | | |
| |
| | | | |
Derivatives | | $ | - | | | $ | (32,378) | | | $ | - | | | $ | (32,378) | |
Contingent consideration | | | - | | | | - | | | | (128,299) | | | | (128,299) | |
| |
| | | | |
Total liabilities measured at fair value on a recurring basis | | $ | - | | | $ | (32,378) | | | $ | (128,299) | | | $ | (160,677) | |
| |
|
| At December 31, 2012 | |
| |
| | | | |
| (In thousands) | | Level 1 | | | Level 2 | | | Level 3 | | | Total | |
| |
| | | | |
RECURRING FAIR VALUE MEASUREMENTS | | | | | | | | | | | | | | | | |
| |
| | | | |
Assets | | | | | | | | | | | | | | | | |
| |
| | | | |
Investment securities available-for-sale: | | | | | | | | | | | | | | | | |
| |
| | | | |
U.S. Treasury securities | | $ | - | | | $ | 37,238 | | | $ | - | | | $ | 37,238 | |
| | | | |
Obligations of U.S. Government sponsored entities | | | - | | | | 1,096,318 | | | | - | | | | 1,096,318 | |
| | | | |
Obligations of Puerto Rico, States and political subdivisions | | | - | | | | 54,981 | | | | - | | | | 54,981 | |
| | | | |
Collateralized mortgage obligations - federal agencies | | | - | | | | 2,367,065 | | | | - | | | | 2,367,065 | |
| | | | |
Collateralized mortgage obligations - private label | | | - | | | | 2,473 | | | | - | | | | 2,473 | |
| | | | |
Mortgage-backed securities | | | - | | | | 1,476,077 | | | | 7,070 | | | | 1,483,147 | |
| | | | |
Equity securities | | | 3,827 | | | | 3,579 | | | | - | | | | 7,406 | |
| | | | |
Other | | | - | | | | 35,573 | | | | - | | | | 35,573 | |
| |
| | | | |
Total investment securities available-for-sale | | $ | 3,827 | | | $ | 5,073,304 | | | $ | 7,070 | | | $ | 5,084,201 | |
| |
| | | | |
Trading account securities, excluding derivatives: | | | | | | | | | | | | | | | | |
| |
| | | | |
Obligations of Puerto Rico, States and political subdivisions | | $ | - | | | $ | 24,801 | | | $ | - | | | $ | 24,801 | |
| | | | |
Collateralized mortgage obligations | | | - | | | | 618 | | | | 2,499 | | | | 3,117 | |
| | | | |
Mortgage-backed securities - federal agencies | | | - | | | | 251,046 | | | | 11,817 | | | | 262,863 | |
| | | | |
Other | | | - | | | | 21,494 | | | | 2,240 | | | | 23,734 | |
| |
| | | | |
Total trading account securities | | $ | - | | | $ | 297,959 | | | $ | 16,556 | | | $ | 314,515 | |
| |
| | | | |
Mortgage servicing rights | | $ | - | | | $ | - | | | $ | 154,430 | | | $ | 154,430 | |
| | | | |
Derivatives | | | - | | | | 41,935 | | | | - | | | | 41,935 | |
| |
| | | | |
Total assets measured at fair value on a recurring basis | | $ | 3,827 | | | $ | 5,413,198 | | | $ | 178,056 | | | $ | 5,595,081 | |
| |
| | | | |
Liabilities | | | | | | | | | | | | | | | | |
| |
| | | | |
Derivatives | | $ | - | | | $ | (42,585) | | | $ | - | | | $ | (42,585) | |
| | | | |
Contingent consideration | | | - | | | | - | | | | (112,002) | | | | (112,002) | |
| |
| | | | |
Total liabilities measured at fair value on a recurring basis | | $ | - | | | $ | (42,585) | | | $ | (112,002) | | | $ | (154,587) | |
| |
| | | | | | | | |
| Year ended December 31, 2013 |
|
| | | | |
| (In thousands) | | Level 1 | | Level 2 | | Level 3 | | Total |
|
222
| | | | | | | | | | | | | | | | | | | | |
NONRECURRING FAIR VALUE MEASUREMENTS | | | | | | | | | | | | | | | | | | | | |
| |
Assets | | | | | | | | | | | | | | | | | |
| Write-
downs |
|
| |
| | | | | |
Loans[1] | | $ | - | | | $ | - | | | $ | 25,673 | | | $ | 25,673 | | | $ | (21,348) | |
Loans held-for-sale[2] | | | - | | | | - | | | | - | | | | - | | | | (364,820) | |
| | | | | |
Other real estate owned[3] | | | - | | | | 2,849 | | | | 84,732 | | | | 87,581 | | | | (43,861) | |
Other foreclosed assets[3] | | | - | | | | - | | | | 638 | | | | 638 | | | | (617) | |
| |
Total assets measured at fair value on a nonrecurring basis | | $ | - | | | $ | 2,849 | | | $ | 111,043 | | | $ | 113,892 | | | $ | (430,646) | |
| |
[1] Relates mostly to certain impaired collateral dependent loans. The impairment was measured based on the fair value of the collateral, which is derived from appraisals that take into consideration prices in observed transactions involving similar assets in similar locations, in accordance with the provisions of ASC Section 310-10-35.Costs to sell are excluded from the reported fair value amount.
[2] Relates to lower of cost or fair value adjustments on loans held-for-sale and loans transferred from loans held-in-portfolio to loans held-for-sale. Costs to sell are excluded from the reported fair value amount.
[3] Represents the fair value of foreclosed real estate and other collateral owned that were written down to their fair value. Costs to sell are excluded from the reported fair value amount.
| | | | | | | | | | | | | | | | | | | | | | |
| Year ended December 31, 2012 | | | |
| | | |
| | | | | | |
| (In thousands) | | Level 1 | | | Level 2 | | | Level 3 | | | Total | | | | | | |
| | | |
| | | | | | |
NONRECURRING FAIR VALUE MEASUREMENTS | | | | | | | | | | | | | | | | | | | | | | |
| | | |
Assets | | | | | | | | | | | | | | | | | | | Write-downs | | | |
| | | |
| | | | | | |
Loans[1] | | $ | - | | | $ | - | | | $ | 10,445 | | | $ | 10,445 | | | $ | (23,972) | | | |
Loans held-for-sale[2] | | | - | | | | - | | | | 93,429 | | | | 93,429 | | | | (43,937) | | | |
| | | | | | |
Other real estate owned[3] | | | - | | | | - | | | | 111,425 | | | | 111,425 | | | | (32,783) | | | |
Other foreclosed assets[3] | | | - | | | | - | | | | 128 | | | | 128 | | | | (360) | | | |
| | | | | | |
Long-lived assets held-for-sale[4] | | | - | | | | - | | | | - | | | | - | | | | (123) | | | |
| | | |
Total assets measured at fair value on a nonrecurring basis | | $ | - | | | $ | - | | | $ | 215,427 | | | $ | 215,427 | | | $ | (101,175) | | | |
|
[1] Relates mostly to certain impaired collateral dependent loans. The impairment was measured based on the fair value of the collateral, which is derived from appraisals that take into consideration prices in observed transactions involving similar assets in similar locations, in accordance with the provisions of ASC Section 310-10-35.Costs to sell are excluded from the reported fair value amount.
[2] Relates to lower of cost or fair value adjustments on loans held-for-sale and loans transferred from loans held-in-portfolio to loans held-for-sale. Costs to sell are excluded from the reported fair value amount.
[3] Represents the fair value of foreclosed real estate and other collateral owned that were written down to their fair value. Costs to sell are excluded from the reported fair value amount.
[4] Represents the fair value of long-lived assets held-for-sale that were written down to their fair value.
| | | | | | | | | | | | | | | | | | | | | | |
| |
| Year ended December 31, 2011 | | | |
| | | |
| | | | | | |
| (In thousands) | | Level 1 | | | Level 2 | | | Level 3 | | | Total | | | | | | |
| | | |
| | | | | | |
NONRECURRING FAIR VALUE MEASUREMENTS | | | | | | | | | | | | | | | | | | | | | | |
| | | |
Assets | | | | | | | | | | | | | | | | | |
| Write-
downs |
| | |
| | | |
| | | | | | |
Loans[1] | | $ | - | | | $ | - | | | $ | 95,978 | | | $ | 95,978 | | | $ | (5,863) | | | |
Loans held-for-sale[2] | | | - | | | | - | | | | 83,915 | | | | 83,915 | | | | (30,094) | | | |
| | | | | | |
Other real estate owned[3] | | | - | | | | - | | | | 91,432 | | | | 91,432 | | | | (22,923) | | | |
Other foreclosed assets[3] | | | - | | | | - | | | | 377 | | | | 377 | | | | (708) | | | |
| | | |
Total assets measured at fair value on a nonrecurring basis | | $ | - | | | $ | - | | | $ | 271,702 | | | $ | 271,702 | | | $ | (59,588) | | | |
|
[1] Relates mostly to certain impaired collateral dependent loans. The impairment was measured based on the fair value of the collateral, which is derived from appraisals that take into consideration prices in observed transactions involving similar assets in similar locations, in accordance with the provisions of ASC Section 310-10-35.Costs to sell are excluded from the reported fair value amount.
[2] Relates to lower of cost or fair value adjustments on loans held-for-sale and loans transferred from loans held-in-portfolio to loans held-for-sale. Costs to sell are excluded from the reported fair value amount.
[3] Represents the fair value of foreclosed real estate and other collateral owned that were written down to their fair value. Costs to sell are excluded from the reported fair value amount.
223
The following tables present the changes in Level 3 assets and liabilities measured at fair value on a recurring basis for the years ended December 31, 2013, 2012, and 2011.
| | | | | | | | | | | | | | | | | | | | | | | | | | | | | | | | |
| Year ended December 31, 2013 | |
| |
| (In thousands) | | MBS classified
as investment
securities
available-
for-sale | | | CMOs
classified
as trading
account
securities | | | MBS
classified as
trading account
securities | | | Other
securities
classified
as trading
account
securities | | | Mortgage
servicing
rights | | | Total assets | | | Contingent
consideration | | | Total
liabilities | |
| |
Balance at January 1, 2013 | | $ | 7,070 | | | $ | 2,499 | | | $ | 11,817 | | | $ | 2,240 | | | $ | 154,430 | | | $ | 178,056 | | | $ | (112,002) | | | $ | (112,002) | |
Gains (losses) included in earnings | | | (7) | | | | (18) | | | | (39) | | | | (311) | | | | (11,403) | | | | (11,778) | | | | (16,297) | | | | (16,297) | |
Gains (losses) included in OCI | | | (40) | | | | - | | | | - | | | | - | | | | - | | | | (40) | | | | - | | | | - | |
Purchases | | | - | | | | 25 | | | | 859 | | | | - | | | | 19,307 | | | | 20,191 | | | | - | | | | - | |
Sales | | | - | | | | (802) | | | | (100) | | | | - | | | | - | | | | (902) | | | | - | | | | - | |
Settlements | | | (500) | | | | (281) | | | | (2,738) | | | | - | | | | (1,235) | | | | (4,754) | | | | - | | | | - | |
| |
Balance at December 31, 2013 | | $ | 6,523 | | | $ | 1,423 | | | $ | 9,799 | | | $ | 1,929 | | | $ | 161,099 | | | $ | 180,773 | | | $ | (128,299) | | | $ | (128,299) | |
| |
Changes in unrealized gains (losses) included in earnings relating to assets still held at December 31, 2013 | | $ | - | | | $ | (4) | | | $ | 159 | | | $ | 14 | | | $ | 15,024 | | | $ | 15,193 | | | $ | (16,297) | | | $ | (16,297) | |
| |
|
| Year ended December 31, 2012 | |
| |
| (In thousands) | | MBS classified
as investment
securities
available-
for-sale | | | CMOs
classified
as trading
account
securities | | | MBS
classified as
trading account
securities | | | Other
securities
classified
as trading
account
securities | | | Mortgage
servicing
rights | | | Total
assets | | | Contingent
consideration | | | Total
liabilities | |
| |
Balance at January 1, 2012 | | $ | 7,435 | | | $ | 2,808 | | | $ | 21,777 | | | $ | 4,036 | | | $ | 151,323 | | | $ | 187,379 | | | $ | (99,762) | | | $ | (99,762) | |
Gains (losses) included in earnings | | | (6) | | | | 30 | | | | 680 | | | | (123) | | | | (17,406) | | | | (16,825) | | | | (12,600) | | | | (12,600) | |
Gains (losses) included in OCI | | | 66 | | | | - | | | | - | | | | - | | | | - | | | | 66 | | | | - | | | | - | |
Purchases | | | - | | | | 608 | | | | 6,499 | | | | 2,116 | | | | 20,726 | | | | 29,949 | | | | - | | | | - | |
Sales | | | - | | | | (250) | | | | (9,824) | | | | (1,834) | | | | (103) | | | | (12,011) | | | | - | | | | - | |
Settlements | | | (425) | | | | (697) | | | | (2,104) | | | | (1,955) | | | | (110) | | | | (5,291) | | | | 360 | | | | 360 | |
Transfers into Level 3 | | | - | | | | - | | | | 2,405 | | | | - | | | | - | | | | 2,405 | | | | - | | | | - | |
Transfers out of Level 3 | | | - | | | | - | | | | (7,616) | | | | - | | | | - | | | | (7,616) | | | | - | | | | - | |
| |
Balance at December 31, 2012 | | $ | 7,070 | | | $ | 2,499 | | | $ | 11,817 | | | $ | 2,240 | | | $ | 154,430 | | | $ | 178,056 | | | $ | (112,002) | | | $ | (112,002) | |
| |
| | | | | | | | |
Changes in unrealized gains (losses) included in earnings relating to assets still held at December 31, 2012 | | $ | - | | | $ | 23 | | | $ | (165) | | | $ | (333) | | | $ | 8,130 | | | $ | 7,655 | | | $ | (13,347) | | | $ | (13,347) | |
| |
|
| Year ended December 31, 2011 | |
| |
| (In thousands) | | MBS classified
as investment
securities
available-
for-sale | | | CMOs
classified
as trading
account
securities | | | MBS
classified as
trading account
securities | | | Other
securities
classified
as trading
account
securities | | | Mortgage
servicing
rights | | | Total
assets | | | Contingent
consideration | | | Total
liabilities | |
| |
Balance at January 1, 2011 | | $ | 7,759 | | | $ | 2,746 | | | $ | 20,238 | | | $ | 2,810 | | | $ | 166,907 | | | $ | 200,460 | | | $ | (92,994) | | | $ | (92,994) | |
Initial fair value on acquisition | | | - | | | | - | | | | - | | | | - | | | | - | | | | - | | | | (688) | | | | (688) | |
Gains (losses) included in earnings | | | (7) | | | | 21 | | | | 108 | | | | 459 | | | | (37,061) | | | | (36,480) | | | | (6,080) | | | | (6,080) | |
Gains (losses) included in OCI | | | (18) | | | | - | | | | - | | | | - | | | | - | | | | (18) | | | | - | | | | - | |
Purchases | | | - | | | | 752 | | | | 13,395 | | | | 3,263 | | | | 21,703 | | | | 39,113 | | | | - | | | | - | |
Sales | | | - | | | | (341) | | | | (9,956) | | | | (2,449) | | | | - | | | | (12,746) | | | | - | | | | - | |
Settlements | | | (299) | | | | (370) | | | | (2,008) | | | | (47) | | | | (226) | | | | (2,950) | | | | - | | | | - | |
| |
Balance at December 31, 2011 | | $ | 7,435 | | | $ | 2,808 | | | $ | 21,777 | | | $ | 4,036 | | | $ | 151,323 | | | $ | 187,379 | | | $ | (99,762) | | | $ | (99,762) | |
| |
Changes in unrealized gains (losses) included in earnings relating to assets still held | | | | | | | | | | | | | | | | | | | | | | | | | | | | | | | | |
at December 31, 2011 | | $ | - | | | $ | 7 | | | $ | 133 | | | $ | 698 | | | $ | (20,188) | | | $ | (19,350) | | | $ | (6,380) | | | $ | (6,380) | |
| |
224
There were no transfers in and/or out of Level 1, Level 2, or Level 3 for financial instruments measured at fair value on a recurring basis during the year ended December 31, 2013 and 2011. There were no transfers in and/or out of Level 1 for financial instruments measured at fair value on a recurring basis during the year ended December 31, 2012. There were $ 2 million in transfers from Level 2 to Level 3 and $ 8 million in transfers from Level 3 to Level 2 for financial instruments measured at fair value on a recurring basis during the year ended December 31, 2012. The transfers from Level 2 to Level 3 of trading mortgage-backed securities were the result of a change in valuation technique to a matrix pricing model, based on indicative prices provided by brokers. The transfers from Level 3 to Level 2 of trading mortgage-backed securities resulted from observable market data becoming available for these securities. The Corporation’s policy is to recognize transfers as of the end of the reporting period.
Gains and losses (realized and unrealized) included in earnings for the years ended December 31, 2013, 2012, and 2011 for Level 3 assets and liabilities included in the previous tables are reported in the consolidated statement of operations as follows:
| | | | | | | | | | | | | | | | | | | | | | | | |
| | | 2013 | | | 2012 | | | 2011 | |
| |
| | | Total Changes in unrealized | | | Total Changes in unrealized | | | Total Changes in unrealized | |
| | | gains (losses) | | | gains (losses) | | | gains (losses) | | | gains (losses) | | | gains (losses) | | | gains (losses) | |
| | | included | | | relating to assets still | | | included | | | relating to assets still | | | included | | | relating to assets still | |
| (In thousands) | | in earnings | | | held at reporting date | | | in earnings | | | held at reporting date | | | in earnings | | | held at reporting date | |
| |
| | | | | | |
Interest income | | $ | (7) | | | $ | - | | | $ | (6) | | | $ | - | | | $ | (7) | | | $ | - | |
FDIC loss share (expense) income | | | (15,994) | | | | (15,994) | | | | (13,178) | | | | (13,178) | | | | (6,304) | | | | (6,304) | |
Mortgage Banking Activities | | | (11,403) | | | | 15,024 | | | | (17,406) | | | | 8,130 | | | | (37,061) | | | | (20,188) | |
Trading account (loss) profit | | | (368) | | | | 169 | | | | 587 | | | | (475) | | | | 588 | | | | 838 | |
Other operating income | | | (303) | | | | (303) | | | | 578 | | | | (169) | | | | 224 | | | | (76) | |
| |
Total | | $ | (28,075) | | | $ | (1,104) | | | $ | (29,425) | | | $ | (5,692) | | | $ | (42,560) | | | $ | (25,730) | |
| |
The following table includes quantitative information about significant unobservable inputs used to derive the fair value of Level 3 instruments, excluding those instruments for which the unobservable inputs were not developed by the Corporation such as prices of prior transactions and/or unadjusted third-party pricing sources.
| | | | | | | | | | |
|
| | | Fair Value at | | | | | | | Weighted |
| (In thousands) | | December 31,
2013 | | | Valuation
Technique | | Unobservable
Inputs | | Average (Range) |
|
Collateralized | | | | | | Discounted | | Weighted average life | | 2.6 years (0.8 - 5.1 years) |
mortgage | | | | | | cash flow | | Yield | | 4.3% (1.5% - 4.7%) |
obligations - trading | | $ | 1,423 | | | model | | Constant prepayment rate | | 24.5% (21.0% - 25.7%) |
|
Other - trading | | | | | | Discounted | | Weighted average life | | 5.5 years |
| | | | | | cash flow | | Yield | | 12.0 % |
| | $ | 915 | | | model | | Constant prepayment rate | | 10.8 % |
|
Mortgage servicing | | | | | | Discounted | | Prepayment speed | | 8.4% (0% - 23.0%) |
rights | | | | | | cash flow | | Weighted average life | | 12.0 years (0 - 18.8 years) |
| | $ | 161,099 | | | model | | Discount rate | | 11.4% (9.5% - 15.0%) |
|
Contingent | | | | | | Discounted | | Credit loss rate on covered loans | | 15.6% (0.0% - 100.0%) |
consideration | | | | | | cash flow | | Risk premium component | | |
| | $ | (128,299) | | | model | | of discount rate | | 3.3 % |
|
Loans held-in-portfolio | | | | | | External | | Haircut applied on | | |
| | $ | 24,583 [1] | | | Appraisal | | external appraisals | | 22.2% (10.0% - 38.2%) |
|
Other real estate owned | | | | | | External | | Haircut applied on | | |
| | $ | 20,695 [2] | | | Appraisal | | external appraisals | | 24.9% (10.0% - 40.0%) |
|
Other foreclosed assets | | | | | | External | | Haircut applied on | | |
| | $ | 439 [3] | | �� | Appraisal | | external appraisals | | 1.9% (1.0% - 2.0%) |
|
[1] Loans held-in-portfolio in which haircuts were not applied to external appraisals were excluded from this table.
[2] Other real estate owned in which haircuts were not applied to external appraisals were excluded from this table.
[3] Other foreclosed assets in which haircuts were not applied to external appraisals were excluded from this table.
225
The significant unobservable inputs used in the fair value measurement of the Corporation’s collateralized mortgage obligations and interest-only collateralized mortgage obligation (reported as “other”), which are classified in the “trading” category, are yield, constant prepayment rate, and weighted average life. Significant increases (decreases) in any of those inputs in isolation would result in significantly lower (higher) fair value measurement. Generally, a change in the assumption used for the constant prepayment rate will generate a directionally opposite change in the weighted average life. For example, as the average life is reduced by a higher constant prepayment rate, a lower yield will be realized, and when there is a reduction in the constant prepayment rate, the average life of these collateralized mortgage obligations will extend, thus resulting in a higher yield. These particular financial instruments are valued internally by the Corporation’s investment banking and broker-dealer unit utilizing internal valuation techniques. The unobservable inputs incorporated into the internal discounted cash flow models used to derive the fair value of collateralized mortgage obligations and interest-only collateralized mortgage obligation (reported as “other”), which are classified in the “trading” category, are reviewed by the Corporation’s Corporate Treasury unit on a quarterly basis. In the case of Level 3 financial instruments which fair value is based on broker quotes, the Corporation’s Corporate Treasury unit reviews the inputs used by the broker-dealers for reasonableness utilizing information available from other published sources and validates that the fair value measurements were developed in accordance with ASC Topic 820. The Corporate Treasury unit also substantiates the inputs used by validating the prices with other broker-dealers, whenever possible.
The significant unobservable inputs used in the fair value measurement of the Corporation’s mortgage servicing rights are constant prepayment rates and discount rates. Increases in interest rates may result in lower prepayments. Discount rates vary according to products and / or portfolios depending on the perceived risk. Increases in discount rates result in a lower fair value measurement. The Corporation’s Corporate Comptroller’s unit is responsible for determining the fair value of MSRs, which is based on discounted cash flow methods based on assumptions developed by an external service provider, except for prepayment speeds, which are adjusted internally for the local market based on historical experience. The Corporation’s Corporate Treasury unit validates the economic assumptions developed by the external service provider on a quarterly basis. In addition, an analytical review of prepayment speeds is performed quarterly by the Corporate Comptroller’s unit. Significant variances in prepayment speeds are investigated by the Corporate Treasury unit. The Corporation’s MSR Committee analyzes changes in fair value measurements of MSRs and approves the valuation assumptions at each reporting period. Changes in valuation assumptions must also be approved by the MSR Committee. The fair value of MSRs are compared with those of the external service provider on a quarterly basis in order to validate if the fair values are within the materiality thresholds established by management to monitor and investigate material deviations. Back-testing is performed to compare projected cash flows with actual historical data to ascertain the reasonability of the projected net cash flow results.
Following is a description of the Corporation’s valuation methodologies used for assets and liabilities measured at fair value. The disclosure requirements exclude certain financial instruments and all non-financial instruments. Accordingly, the aggregate fair value amounts of the financial instruments disclosed do not represent management’s estimate of the underlying value of the Corporation.
Trading Account Securities and Investment Securities Available-for-Sale
| | — | | U.S. Treasury securities: The fair value of U.S. Treasury securities is based on yields that are interpolated from the constant maturity treasury curve. These securities are classified as Level 2. |
| | — | | Obligations of U.S. Government sponsored entities: The Obligations of U.S. Government sponsored entities include U.S. agency securities, which fair value is based on an active exchange market and on quoted market prices for similar securities. The U.S. agency securities are classified as Level 2. |
| | — | | Obligations of Puerto Rico, States and political subdivisions: Obligations of Puerto Rico, States and political subdivisions include municipal bonds. The bonds are segregated and the like characteristics divided into specific sectors. Market inputs used in the evaluation process include all or some of the following: trades, bid price or spread, two sided markets, quotes, benchmark curves including but not limited to Treasury benchmarks, LIBOR and swap curves, market data feeds such as those obtained from municipal market sources, discount and capital rates, and trustee reports. The municipal bonds are classified as Level 2. |
| | — | | Mortgage-backed securities: Certain agency mortgage-backed securities (“MBS”) are priced based on a bond’s theoretical value derived from similar bonds defined by credit quality and market sector. Their fair value incorporates an option |
226
| | adjusted spread. The agency MBS are classified as Level 2. Other agency MBS such as GNMA Puerto Rico Serials are priced using an internally-prepared pricing matrix with quoted prices from local brokers dealers. These particular MBS are classified as Level 3. |
| | — | | Collateralized mortgage obligations: Agency and private-label collateralized mortgage obligations (“CMOs”) are priced based on a bond’s theoretical value derived from similar bonds defined by credit quality and market sector and for which fair value incorporates an option adjusted spread. The option adjusted spread model includes prepayment and volatility assumptions, ratings (whole loans collateral) and spread adjustments. These CMOs are classified as Level 2. Other CMOs, due to their limited liquidity, are classified as Level 3 due to the insufficiency of inputs such as broker quotes, executed trades, credit information and cash flows. |
| | — | | Equity securities: Equity securities with quoted market prices obtained from an active exchange market are classified as Level 1. Other equity securities that do not trade in highly liquid markets are classified as Level 2. |
| | — | | Corporate securities and debentures from a not-for-profit organization (included as “other” in the “available-for-sale” category): Given that the quoted prices are for similar instruments, these securities are classified as Level 2. |
| | — | | Corporate securities, commercial paper, mutual funds, and other equity securities (included as “other” in the “trading account securities” category): Quoted prices for these security types are obtained from broker dealers. Given that the quoted prices are for similar instruments or do not trade in highly liquid markets, these securities are classified as Level 2. The important variables in determining the prices of Puerto Rico tax-exempt mutual fund shares are net asset value, dividend yield and type of assets in the fund. All funds trade based on a relevant dividend yield taking into consideration the aforementioned variables. In addition, demand and supply also affect the price. Corporate securities that trade less frequently or are in distress are classified as Level 3. |
Mortgage servicing rights
Mortgage servicing rights (“MSRs”) do not trade in an active market with readily observable prices. MSRs are priced internally using a discounted cash flow model. The discounted cash flow model incorporates assumptions that market participants would use in estimating future net servicing income, including portfolio characteristics, prepayments assumptions, discount rates, delinquency and foreclosure rates, late charges, other ancillary revenues, cost to service and other economic factors. Prepayment speeds are adjusted for the Corporation’s loan characteristics and portfolio behavior. Due to the unobservable nature of certain valuation inputs, the MSRs are classified as Level 3.
Derivatives
Interest rate swaps, interest rate caps and indexed options are traded in over-the-counter active markets. These derivatives are indexed to an observable interest rate benchmark, such as LIBOR or equity indexes, and are priced using an income approach based on present value and option pricing models using observable inputs. Other derivatives are liquid and have quoted prices, such as forward contracts or “to be announced securities” (“TBAs”). All of these derivatives are classified as Level 2. The non-performance risk is determined using internally-developed models that consider the collateral held, the remaining term, and the creditworthiness of the entity that bears the risk, and uses available public data or internally-developed data related to current spreads that denote their probability of default.
Contingent consideration liability
The fair value of the true-up payment obligation (contingent consideration) to the FDIC as it relates to the Westernbank FDIC-assisted transaction was estimated using projected cash flows related to the loss sharing agreements at the true-up measurement date. It took into consideration the intrinsic loss estimate, asset premium/discount, cumulative shared loss payments, and the cumulative servicing amount related to the loan portfolio. Refer to Note 11 to the consolidated financial statements for a description of the formula established in the loss share agreements for determining the true-up payment.
On a quarterly basis, management evaluates and revises the estimated credit loss rates that are used to determine expected cash flows on the covered loan pools. The expected credit losses on the loan pools are used to determine the loss share cash flows expected to be paid to the FDIC when the true-up payment is due.
The true-up payment obligation was discounted using a term rate consistent with the time remaining until the payment is due. The discount rate was an estimate of the sum of the risk-free benchmark rate for the term remaining before the true-up payment is due and a risk premium to account for the credit risk profile of BPPR. The risk premium was calculated based on a 12-month trailing average spread of the yields on corporate bonds with credit ratings similar to BPPR.
227
Loans held-in-portfolio considered impaired under ASC Section 310-10-35 that are collateral dependent
The impairment is measured based on the fair value of the collateral, which is derived from appraisals that take into consideration prices in observed transactions involving similar assets in similar locations, in accordance with the provisions of ASC Section 310-10-35, and which could be subject to internal adjustments based on the age of the appraisal. Currently, the associated loans considered impaired are classified as Level 3.
Loans measured at fair value pursuant to lower of cost or fair value adjustments
Loans measured at fair value on a nonrecurring basis pursuant to lower of cost or fair value were priced based on secondary market prices and discounted cash flow models which incorporate internally-developed assumptions for prepayments and credit loss estimates. These loans are classified as Level 3.
Other real estate owned and other foreclosed assets
Other real estate owned includes real estate properties securing mortgage, consumer, and commercial loans. Other foreclosed assets include automobiles securing auto loans. The fair value of foreclosed assets may be determined using an external appraisal, broker price opinion, internal valuation or binding offer. The majority of these foreclosed assets are classified as Level 3 since they are subject to internal adjustments. Certain foreclosed assets which are measured based on binding offers are classified as Level 2.
228
Note 33 – Fair value of financial instruments
The fair value of financial instruments is the amount at which an asset or obligation could be exchanged in a current transaction between willing parties, other than in a forced or liquidation sale. Fair value estimates are made at a specific point in time based on the type of financial instrument and relevant market information. Many of these estimates involve various assumptions and may vary significantly from amounts that could be realized in actual transactions.
The information about the estimated fair values of financial instruments presented hereunder excludes all nonfinancial instruments and certain other specific items.
For those financial instruments with no quoted market prices available, fair values have been estimated using present value calculations or other valuation techniques, as well as management’s best judgment with respect to current economic conditions, including discount rates, estimates of future cash flows, and prepayment assumptions.
The fair values reflected herein have been determined based on the prevailing interest rate environment at December 31, 2013 and December 31, 2012, as applicable. In different interest rate environments, fair value estimates can differ significantly, especially for certain fixed rate financial instruments. In addition, the fair values presented do not attempt to estimate the value of the Corporation’s fee generating businesses and anticipated future business activities, that is, they do not represent the Corporation’s value as a going concern. Accordingly, the aggregate fair value amounts presented do not represent the underlying value of the Corporation.
Following is a description of the Corporation’s valuation methodologies and inputs used to estimate the fair values for each class of financial assets and liabilities not measured at fair value, but for which the fair value is disclosed. The disclosure requirements exclude certain financial instruments and all non-financial instruments. Accordingly, the aggregate fair value amounts of the financial instruments disclosed do not represent management’s estimate of the underlying value of the Corporation. For a description of the valuation methodologies and inputs used to estimate the fair value for each class of financial assets and liabilities measured at fair value, refer to Note 32.
Cash and due from banks
Cash and due from banks include cash on hand, cash items in process of collection, and non-interest bearing deposits due from other financial institutions. The carrying amount of cash and due from banks is a reasonable estimate of its fair value. Cash and due from banks are classified as Level 1.
Money market investments
Investments in money market instruments include highly liquid instruments with an average maturity of three months or less. For this reason, they carry a low risk of changes in value as a result of changes in interest rates, and the carrying amount approximates their fair value. Money market investments include federal funds sold, securities purchased under agreements to resell, time deposits with other banks, and cash balances, including those held at the Federal Reserve. These money market investments are classified as Level 2, except for cash balances which generate interest, including those held at the Federal Reserve, which are classified as Level 1.
Investment securities held-to-maturity
| | — | | Obligations of Puerto Rico, States and political subdivisions: Municipal bonds include Puerto Rico public municipalities debt and bonds collateralized by second mortgages under the Home Purchase Stimulus Program. Puerto Rico public municipalities debt was valued internally based on benchmark treasury notes and a credit spread derived from comparable Puerto Rico government trades and recent issuances. Puerto Rico public municipalities debt is classified as Level 3. Given that the fair value of municipal bonds collateralized by second mortgages was based on internal yield and prepayment speed assumptions, these municipal bonds are classified as Level 3. |
| | — | | Agency collateralized mortgage obligation: The fair value of the agency collateralized mortgage obligation (“CMO”), which is guaranteed by GNMA, was based on internal yield and prepayment speed assumptions. This agency CMO is classified as Level 3. |
| | — | | Other: Other securities include foreign and corporate debt. Given that the fair value was based on quoted prices for similar instruments, foreign debt is classified as Level 2. The fair value of corporate debt, which is collateralized by municipal |
229
| | bonds of Puerto Rico, was internally derived from benchmark treasury notes and a credit spread based on comparable Puerto Rico government trades, similar securities, and/or recent issuances. Corporate debt is classified as Level 3. |
Other investment securities
| | — | | Federal Home Loan Bank capital stock: Federal Home Loan Bank (FHLB) capital stock represents an equity interest in the FHLB of New York. It does not have a readily determinable fair value because its ownership is restricted and it lacks a market. Since the excess stock is repurchased by the FHLB at its par value, the carrying amount of FHLB capital stock approximates fair value. Thus, these stocks are classified as Level 2. |
| | — | | Federal Reserve Bank capital stock: Federal Reserve Bank (FRB) capital stock represents an equity interest in the FRB of New York. It does not have a readily determinable fair value because its ownership is restricted and it lacks a market. Since the canceled stock is repurchased by the FRB for the amount of the cash subscription paid, the carrying amount of FRB capital stock approximates fair value. Thus, these stocks are classified as Level 2. |
| | — | | Trust preferred securities: These securities represent the equity-method investment in the common stock of these trusts. Book value is the same as fair value for these securities since the fair value of the junior subordinated debentures is the same amount as the fair value of the trust preferred securities issued to the public. The equity-method investment in the common stock of these trusts is classified as Level 2, except for that of Popular Capital Trust III (Troubled Asset Relief Program) which is classified as Level 3. Refer to Note 23 for additional information on these trust preferred securities. |
| | — | | Other investments: Other investments include private equity method investments and Visa Class B common stock held by the Corporation. Since there are no observable market values, private equity method investments are classified as Level 3. The Visa Class B common stock was priced by applying the quoted price of Visa Class A common stock, net of a liquidity adjustment, to the as converted number of Class A common shares since these Class B common shares are restricted and not convertible to Class A common shares until pending litigation is resolved. Thus, these stocks are classified as Level 3. |
Loans held-for-sale
The fair value of certain impaired loans held-for-sale was based on a discounted cash flow model that assumes that no principal payments are received prior to the effective average maturity date, that the outstanding unpaid principal balance is reduced by a monthly net loss rate, and that the remaining unpaid principal balance is received as a lump sum principal payment at the effective average maturity date. The remaining unpaid principal balance expected to be received, which is based on the prior 12-month cash payment experience of these loans and their expected collateral recovery, was discounted using the interest rate currently offered to clients for the origination of comparable loans. These loans were classified as Level 3. As of December 31, 2013, no loans were valued under this methodology. For loans held-for-sale originated with the intent to sell in the secondary market, its fair value was determined using similar characteristics of loans and secondary market prices assuming the conversion to mortgage-backed securities. Given that the valuation methodology uses internal assumptions based on loan level data, these loans are classified as Level 3. The fair value of certain other loans held-for-sale is based on bids received from potential buyers; binding offers; or external appraisals, net of internal adjustments and estimated costs to sell. Loans held-for-sale based on binding offers are classified as Level 2. Loans held-for-sale based on indicative offers and/or external appraisals are classified as Level 3.
Loans held-in-portfolio
The fair values of the loans held-in-portfolio have been determined for groups of loans with similar characteristics. Loans were segregated by type such as commercial, construction, residential mortgage, consumer, and credit cards. Each loan category was further segmented based on loan characteristics, including interest rate terms, credit quality and vintage. Generally, fair values were estimated based on an exit price by discounting expected cash flows for the segmented groups of loans using a discount rate that considers interest, credit and expected return by market participant under current market conditions. Additionally, prepayment, default and recovery assumptions have been applied in the mortgage loan portfolio valuations. Generally accepted accounting principles do not require a fair valuation of the lease financing portfolio, therefore it is included in the loans total at its carrying amount. Loans held-in-portfolio are classified as Level 3.
FDIC loss share asset
230
Fair value of the FDIC loss share asset was estimated using projected net losses related to the loss sharing agreements, which are expected to be reimbursed by the FDIC. The projected net losses were discounted using the U.S. Government agency curve. The loss share asset is classified as Level 3.
Deposits
| | — | | Demand deposits: The fair value of demand deposits, which have no stated maturity, was calculated based on the amount payable on demand as of the respective dates. These demand deposits include non-interest bearing demand deposits, savings, NOW, and money market accounts. Thus, these deposits are classified as Level 2. |
| | — | | Time deposits: The fair value of time deposits was calculated based on the discounted value of contractual cash flows using interest rates being offered on time deposits with similar maturities. The non-performance risk was determined using internally-developed models that consider, where applicable, the collateral held, amounts insured, the remaining term, and the credit premium of the institution. For certain 5-year certificates of deposit in which customers may withdraw their money anytime with no penalties or charges, the fair value of these certificates of deposit incorporate an early cancellation estimate based on historical experience. Time deposits are classified as Level 2. |
Assets sold under agreements to repurchase
| | — | | Securities sold under agreements to repurchase (structured and non-structured): Securities sold under agreements to repurchase with short-term maturities approximate fair value because of the short-term nature of those instruments. Resell and repurchase agreements with long-term maturities were valued using discounted cash flows based on the three-month LIBOR. In determining the non-performance credit risk valuation adjustment, the collateralization levels of these long-term securities sold under agreements to repurchase were considered. In the case of callable structured repurchase agreements, the callable feature is not considered when determining the fair value of those repurchase agreements, since there is a remote possibility, based on forward rates, that the investor will call back these agreements before maturity since it is not expected that the interest rates would rise more than the specified interest rate of these agreements. Securities sold under agreements to repurchase (structured and non-structured) are classified as Level 2. |
Other short-term borrowings
The carrying amount of other short-term borrowings approximate fair value because of the short-term maturity of those instruments or because they carry interest rates which approximate market. Thus, these other short-term borrowings are classified as Level 2.
Notes payable
| | — | | FHLB advances: The fair value of FHLB advances was based on the discounted value of contractual cash flows over their contractual term. In determining the non-performance credit risk valuation adjustment, the collateralization levels of these advances were considered. These advances are classified as Level 2. |
| | — | | Medium-term notes: The fair value of publicly-traded medium-term notes was determined using recent trades of similar transactions. Publicly-traded medium-term notes are classified as Level 2. The fair value of non-publicly traded debt was based on remaining contractual cash outflows, discounted at a rate commensurate with the non-performance credit risk of the Corporation, which is subjective in nature. Non-publicly traded debt is classified as Level 3. |
| | — | | Junior subordinated deferrable interest debentures (related to trust preferred securities): The fair value of junior subordinated interest debentures was determined using recent trades of similar transactions. Thus, these junior subordinated deferrable interest debentures are classified as Level 2. |
| | — | | Junior subordinated deferrable interest debentures (Troubled Asset Relief Program): The fair value of junior subordinated deferrable interest debentures was based on the discounted value of contractual cash flows over their contractual term. The discount rate was based on the rate at which a similar security was priced in the open market. Thus, these junior subordinated deferrable interest debentures are classified as Level 3. |
231
| | — | | Others: The other category includes capital lease obligations. Generally accepted accounting principles do not require a fair valuation of capital lease obligations, therefore; it is included at its carrying amount. Capital lease obligations are classified as Level 3. |
Commitments to extend credit and letters of credit
Commitments to extend credit were valued using the fees currently charged to enter into similar agreements. For those commitments where a future stream of fees is charged, the fair value was estimated by discounting the projected cash flows of fees on commitments. Since the fair value of commitments to extend credit varies depending on the undrawn amount of the credit facility, fees are subject to constant change, and cash flows are dependent on the creditworthiness of borrowers, commitments to extend credit are classified as Level 3. The fair value of letters of credit was based on fees currently charged on similar agreements. Given that the fair value of letters of credit constantly vary due to fees being subject to constant change and whether the fees are received depends on the creditworthiness of the account parties, letters of credit are classified as Level 3.
The following tables present the carrying or notional amounts, as applicable, and estimated fair values for financial instruments with their corresponding level in the fair value hierarchy.
| | | | | | | | | | | | | | | | | | | | |
| | | | | | December 31, 2013 | | | | | | | |
| |
| (In thousands) | | Carrying
amount | | | Level 1 | | | Level 2 | | | Level 3 | | | Fair value | |
| |
| | | | | |
Financial Assets: | | | | | | | | | | | | | | | | | | | | |
| | | | | |
Cash and due from banks | | $ | 423,211 | | | $ | 423,211 | | | $ | - | | | $ | - | | | $ | 423,211 | |
| | | | | |
Money market investments | | | 858,453 | | | | 677,033 | | | | 181,420 | | | | - | | | | 858,453 | |
| | | | | |
Trading account securities, excluding derivatives[1] | | | 339,660 | | | | - | | | | 326,509 | | | | 13,151 | | | | 339,660 | |
| | | | | |
Investment securities available-for-sale[1] | | | 5,294,800 | | | | 412 | | | | 5,287,865 | | | | 6,523 | | | | 5,294,800 | |
| | | | | |
Investment securities held-to-maturity: | | | | | | | | | | | | | | | | | | | | |
| | | | | |
Obligations of Puerto Rico, States and political subdivisions | | | 113,881 | | | | - | | | | - | | | | 94,712 | | | | 94,712 | |
| | | | | |
Collateralized mortgage obligation-federal agency | | | 115 | | | | - | | | | - | | | | 122 | | | | 122 | |
| | | | | |
Other | | | 26,500 | | | | - | | | | 1,500 | | | | 24,354 | | | | 25,854 | |
| |
| | | | | |
Total investment securities held-to-maturity | | $ | 140,496 | | | $ | - | | | $ | 1,500 | | | $ | 119,188 | | | $ | 120,688 | |
| |
| | | | | |
Other investment securities: | | | | | | | | | | | | | | | | | | | | |
| | | | | |
FHLB stock | | $ | 85,245 | | | $ | - | | | $ | 85,245 | | | $ | - | | | $ | 85,245 | |
| | | | | |
FRB stock | | | 80,385 | | | | - | | | | 80,385 | | | | - | | | | 80,385 | |
| | | | | |
Trust preferred securities | | | 14,197 | | | | - | | | | 13,197 | | | | 1,000 | | | | 14,197 | |
| | | | | |
Other investments | | | 1,925 | | | | - | | | | - | | | | 4,699 | | | | 4,699 | |
| |
| | | | | |
Total other investment securities | | $ | 181,752 | | | $ | - | | | $ | 178,827 | | | $ | 5,699 | | | $ | 184,526 | |
| |
| | | | | |
Loans held-for-sale | | $ | 110,426 | | | $ | - | | | $ | 3,155 | | | $ | 109,405 | | | $ | 112,560 | |
| | | | | |
Loans not covered under loss sharing agreement with the FDIC | | | 21,073,403 | | | | - | | | | - | | | | 19,070,337 | | | | 19,070,337 | |
| | | | | |
Loans covered under loss sharing agreements with the FDIC | | | 2,882,335 | | | | - | | | | - | | | | 3,404,128 | | | | 3,404,128 | |
| | | | | |
FDIC loss share asset | | | 948,608 | | | | - | | | | - | | | | 837,131 | | | | 837,131 | |
| | | | | |
Mortgage servicing rights | | | 161,099 | | | | - | | | | - | | | | 161,099 | | | | 161,099 | |
| | | | | |
Derivatives | | | 34,793 | | | | - | | | | 34,793 | | | | - | | | | 34,793 | |
| |
| | | | |
| | | | | | December 31, 2013 | | | | | | | |
| |
| (In thousands) | | Carrying
amount | | | Level 1 | | | Level 2 | | | Level 3 | | | Fair value | |
| |
| | | | | |
Financial Liabilities: | | | | | | | | | | | | | | | | | | | | |
232
| | | | | | | | | | | | | | | | | | | | |
Deposits: | | | | | | | | | | | | | | | | | | | | |
| | | | | |
Demand deposits | | $ | 18,399,793 | | | $ | - | | | $ | 18,399,793 | | | $ | - | | | $ | 18,399,793 | |
| | | | | |
Time deposits | | | 8,311,352 | | | | - | | | | 8,367,410 | | | | - | | | | 8,367,410 | |
| |
| | | | | |
Total deposits | | $ | 26,711,145 | | | $ | - | | | $ | 26,767,203 | | | $ | - | | | $ | 26,767,203 | |
| |
| | | | | |
Assets sold under agreements to repurchase: | | | | | | | | | | | | | | | | | | | | |
| | | | | |
Securities sold under agreements to repurchase | | $ | 1,021,102 | | | $ | - | | | $ | 1,025,628 | | | $ | - | | | $ | 1,025,628 | |
| | | | | |
Structured repurchase agreements | | | 638,190 | | | | - | | | | 694,422 | | | | - | | | | 694,422 | |
| |
| | | | | |
Total assets sold under agreements to repurchase | | $ | 1,659,292 | | | $ | - | | | $ | 1,720,050 | | | $ | - | | | $ | 1,720,050 | |
| |
| | | | | |
Other short-term borrowings[2] | | $ | 401,200 | | | $ | - | | | $ | 401,200 | | | $ | - | | | $ | 401,200 | |
| | | | | |
Notes payable: | | | | | | | | | | | | | | | | | | | | |
| | | | | |
FHLB advances | | | 589,229 | | | | - | | | | 604,976 | | | | - | | | | 604,976 | |
| | | | | |
Medium-term notes | | | 689 | | | | - | | | | - | | | | 716 | | | | 716 | |
| | | | | |
Junior subordinated deferrable interest debentures (related to trust preferred securities) | | | 439,800 | | | | - | | | | 348,222 | | | | - | | | | 348,222 | |
| | | | | |
Junior subordinated deferrable interest debentures (Troubled Asset Relief Program) | | | 531,540 | | | | - | | | | - | | | | 1,006,638 | | | | 1,006,638 | |
| | | | | |
Others | | | 23,496 | | | | - | | | | - | | | | 23,496 | | | | 23,496 | |
| |
| | | | | |
Total notes payable | | $ | 1,584,754 | | | $ | - | | | $ | 953,198 | | | $ | 1,030,850 | | | $ | 1,984,048 | |
| |
| | | | | |
Derivatives | | $ | 32,378 | | | $ | - | | | $ | 32,378 | | | $ | - | | | $ | 32,378 | |
| |
| | | | | |
Contingent consideration | | $ | 128,299 | | | $ | - | | | $ | - | | | $ | 128,299 | | | $ | 128,299 | |
| |
| | | | | |
| (In thousands) | | Notional
amount | | | Level 1 | | | Level 2 | | | Level 3 | | | Fair value | |
| |
| | | | | |
Commitments to extend credit | | $ | 7,490,927 | | | $ | - | | | $ | - | | | $ | 2,571 | | | $ | 2,571 | |
| | | | | |
Letters of credit | | | 82,007 | | | | - | | | | - | | | | 901 | | | | 901 | |
| |
[1] Refer to Note 32 to the consolidated financial statements for the fair value by class of financial asset and its hierarchy level. | | | | | |
[2] Refer to Note 20 to the consolidated financial statements for the composition of short-term borrowings. | | | | | |
| |
| | | | |
| | | | | | December 31, 2012 | | | | | | | |
| |
| (In thousands) | | Carrying
amount | | | Level 1 | | | Level 2 | | | Level 3 | | | Fair value | |
| |
| | | | | |
Financial Assets: | | | | | | | | | | | | | | | | | | | | |
| | | | | |
Cash and due from banks | | $ | 439,363 | | | $ | 439,363 | | | $ | - | | | $ | - | | | $ | 439,363 | |
| | | | | |
Money market investments | | | 1,085,580 | | | | 839,007 | | | | 246,573 | | | | - | | | | 1,085,580 | |
| | | | | |
Trading account securities, excluding derivatives[1] | | | 314,515 | | | | - | | | | 297,959 | | | | 16,556 | | | | 314,515 | |
| | | | | |
Investment securities available-for-sale[1] | | | 5,084,201 | | | | 3,827 | | | | 5,073,304 | | | | 7,070 | | | | 5,084,201 | |
| | | | | |
Investment securities held-to-maturity: | | | | | | | | | | | | | | | | | | | | |
| | | | | |
Obligations of Puerto Rico, States and political subdivisions | | | 116,177 | | | | - | | | | - | | | | 117,558 | | | | 117,558 | |
| | | | | |
Collateralized mortgage obligation-federal agency | | | 140 | | | | - | | | | - | | | | 144 | | | | 144 | |
| | | | | |
Other | | | 26,500 | | | | - | | | | 1,500 | | | | 25,031 | | | | 26,531 | |
| |
| | | | | |
Total investment securities | | | | | | | | | | | | | | | | | | | | |
233
| | | | | | | | | | | | | | | | | | | | |
held-to-maturity | | $ | 142,817 | | | $ | - | | | $ | 1,500 | | | $ | 142,733 | | | $ | 144,233 | |
| |
| | | | | |
Other investment securities: | | | | | | | | | | | | | | | | | | | | |
| | | | | |
FHLB stock | | $ | 89,451 | | | $ | - | | | $ | 89,451 | | | $ | - | | | $ | 89,451 | |
| | | | | |
FRB stock | | | 79,878 | | | | - | | | | 79,878 | | | | - | | | | 79,878 | |
| | | | | |
Trust preferred securities | | | 14,197 | | | | - | | | | 13,197 | | | | 1,000 | | | | 14,197 | |
| | | | | |
Other investments | | | 1,917 | | | | - | | | | - | | | | 3,975 | | | | 3,975 | |
| |
| | | | | |
Total other investment securities | | $ | 185,443 | | | $ | - | | | $ | 182,526 | | | $ | 4,975 | | | $ | 187,501 | |
| |
| | | | | |
Loans held-for-sale | | $ | 354,468 | | | $ | - | | | $ | 4,779 | | | $ | 376,582 | | | $ | 381,361 | |
| | | | | |
Loans not covered under loss sharing agreement with the FDIC | | | 20,361,491 | | | | - | | | | - | | | | 17,424,038 | | | | 17,424,038 | |
| | | | | |
Loans covered under loss sharing agreements with the FDIC | | | 3,647,066 | | | | - | | | | - | | | | 3,925,440 | | | | 3,925,440 | |
| | | | | |
FDIC loss share asset | | | 1,399,098 | | | | - | | | | - | | | | 1,241,579 | | | | 1,241,579 | |
| | | | | |
Mortgage servicing rights | | | 154,430 | | | | - | | | | - | | | | 154,430 | | | | 154,430 | |
| | | | | |
Derivatives | | | 41,935 | | | | - | | | | 41,935 | | | | - | | | | 41,935 | |
| | | | | |
| | | | | | | | | | | | | | | | | | | | |
| |
| | | | | |
| (In thousands) | | Carrying amount | | | Level 1 | | | Level 2 | | | Level 3 | | | Fair value | |
| |
| | | | | |
Financial Liabilities: | | | | | | | | | | | | | | | | | | | | |
| | | | | |
Deposits: | | | | | | | | | | | | | | | | | | | | |
| | | | | |
Demand deposits | | $ | 18,089,904 | | | $ | - | | | $ | 18,089,904 | | | $ | - | | | $ | 18,089,904 | |
| | | | | |
Time deposits | | | 8,910,709 | | | | - | | | | 8,994,363 | | | | - | | | | 8,994,363 | |
| |
| | | | | |
Total deposits | | $ | 27,000,613 | | | $ | - | | | $ | 27,084,267 | | | $ | - | | | $ | 27,084,267 | |
| |
| | | | | |
Assets sold under agreements to repurchase: | | | | | | | | | | | | | | | | | | | | |
| | | | | |
Securities sold under agreements to repurchase | | $ | 1,378,562 | | | $ | - | | | $ | 1,385,237 | | | $ | - | | | $ | 1,385,237 | |
| | | | | |
Structured repurchase agreements | | | 638,190 | | | | - | | | | 720,620 | | | | - | | | | 720,620 | |
| |
| | | | | |
Total assets sold under agreements to repurchase | | $ | 2,016,752 | | | $ | - | | | $ | 2,105,857 | | | $ | - | | | $ | 2,105,857 | |
| |
| | | | | |
Other short-term borrowings[2] | | $ | 636,200 | | | $ | - | | | $ | 636,200 | | | $ | - | | | $ | 636,200 | |
| | | | | |
Notes payable: | | | | | | | | | | | | | | | | | | | | |
| | | | | |
FHLB advances | | | 577,490 | | | | - | | | | 608,313 | | | | - | | | | 608,313 | |
| | | | | |
Medium-term notes | | | 236,753 | | | | - | | | | 243,351 | | | | 3,843 | | | | 247,194 | |
| | | | | |
Junior subordinated deferrable interest debentures (related to trust preferred securities) | | | 439,800 | | | | - | | | | 363,659 | | | | - | | | | 363,659 | |
| | | | | |
Junior subordinated deferrable interest debentures (Troubled Asset Relief Program) | | | 499,470 | | | | - | | | | - | | | | 824,458 | | | | 824,458 | |
| | | | | |
Others | | | 24,208 | | | | - | | | | - | | | | 24,208 | | | | 24,208 | |
| |
| | | | | |
Total notes payable | | $ | 1,777,721 | | | $ | - | | | $ | 1,215,323 | | | $ | 852,509 | | | $ | 2,067,832 | |
| |
| | | | | |
Derivatives | | $ | 42,585 | | | $ | - | | | $ | 42,585 | | | $ | - | | | $ | 42,585 | |
| |
| | | | | |
Contingent consideration | | $ | 112,002 | | | $ | - | | | $ | - | | | $ | 112,002 | | | $ | 112,002 | |
| |
| | | | | |
| (In thousands) | | Notional
amount | | | Level 1 | | | Level 2 | | | Level 3 | | | Fair value | |
| |
| | | | | |
Commitments to extend credit | | $ | 6,774,990 | | | $ | - | | | $ | - | | | $ | 2,858 | | | $ | 2,858 | |
| | | | | |
Letters of credit | | | 148,153 | | | | - | | | | - | | | | 1,544 | | | | 1,544 | |
| |
234
| [1] | Refer to Note 32 to the consolidated financial statements for the fair value by class of financial asset and its hierarchy level. |
| [2] | Refer to Note 20 to the consolidated financial statements for the composition of short-term borrowings. |
Note 34 – Employee benefits
Pension and benefit restoration plans
Certain employees of BPPR are covered by non-contributory defined benefit pension plans. Pension benefits are based on age, years of credited service, and final average compensation.
BPPR’s non-contributory, defined benefit retirement plan is currently closed to new hires and to employees who at December 31, 2005 were under 30 years of age or were credited with less than 10 years of benefit service. Effective May 1, 2009, the accrual of the benefits under the BPPR retirement plan (the “P.R. Plans”) were frozen to all participants. Pursuant to the amendment, the retirement plan participants will not receive any additional credit for compensation earned and service performed after April 30, 2009 for purposes of calculating benefits under the retirement plan. The retirement plan’s benefit formula is based on a percentage of average final compensation and years of service. Normal retirement age under the retirement plans is age 65 with 5 years of service. Pension costs are funded in accordance with minimum funding standards under the Employee Retirement Income Security Act of 1974 (“ERISA”). Benefits under the BPPR retirement plan are subject to the U.S. and PR Internal Revenue Code limits on compensation and benefits. Benefits under restoration plans restore benefits to selected employees that are limited under the retirement plan due to U.S. and PR Internal Revenue Code limits and a compensation definition that excludes amounts deferred pursuant to nonqualified arrangements. The freeze applied to the restoration plan as well.
In October 2011, the Corporation implemented a voluntary retirement program for retirement-eligible active participants of the pension plan. Under the voluntary retirement program, a participant who elected to retire as of February 1, 2012 was provided a benefit equal to one-year of their current base pay rate. Approximately, 958 participants were eligible for the voluntary retirement program and 369 participants retired under the program. Participants could elect to receive their program benefit in the form of a lump sum on February 1, 2012 or as an immediate annuity commencing on such date. The pension plan benefit obligation reflects the retirement for all employees who accepted the voluntary retirement program.
During 2013 the Corporation offered a Lump Sum Distribution to terminated vested participants whose deferred pension has a current value of up to $40 thousand. The acceptance of this offer was voluntary and relieved the Corporation of all future obligations related to the terminated vested participants who accepted the offer. Approximately 1,859 participants were eligible to elect the Lump Sum Distribution and 1,081 participants accepted the offer.
The Corporation’s funding policy is to make annual contributions to the plans, when necessary, in amounts which fully provide for all benefits as they become due under the plans.
The Corporation’s pension fund investment strategy is to invest in a prudent manner for the exclusive purpose of providing benefits to participants. A well defined internal structure has been established to develop and implement a risk-controlled investment strategy that is targeted to produce a total return that, when combined with the bank’s contributions to the fund, will maintain the fund’s ability to meet all required benefit obligations. Risk is controlled through diversification of asset types, such as investments in domestic and international equities and fixed income.
Equity investments include various types of stock and index funds. Also, this category includes Popular, Inc.’s common stock. Fixed income investments include U.S. Government securities and other U.S. agencies’ obligations, corporate bonds, mortgage loans, mortgage-backed securities and index funds, among others. A designated committee periodically reviews the performance of the pension plans’ investments and assets allocation. The Trustee and the money managers are allowed to exercise investment discretion, subject to limitations established by the pension plans’ investment policies. The plans forbid money managers to enter into derivative transactions, unless approved by the Trustee.
The overall expected long-term rate-of-return-on-assets assumption reflects the average rate of earnings expected on the funds invested or to be invested to provide for the benefits included in the benefit obligation. The assumption has been determined by reflecting expectations regarding future rates of return for the plan assets, with consideration given to the distribution of the investments by asset class and historical rates of return for each individual asset class. This process is reevaluated at least on an annual basis and if market, actuarial and economic conditions change, adjustments to the rate of return may come into place.
The plans’ target allocation based on market value for years 2013 and 2012, by asset category, is summarized in the table below.
| | | | | | | | |
| | | Minimum allotment | | | Maximum allotment | |
| |
| | |
Equity | | | 0 % | | | | 70 % | |
| | |
Debt securities | | | 0 % | | | | 100 % | |
235
| | | | | | | | |
Cash and cash equivalents | | | 0 % | | | | 100 % | |
| |
The following table presents the composition of the assets of the pension and benefit restoration plans.
| | | | | | | | |
| |
| | |
| (In thousands) | | 2013 | | | 2012 | |
| |
| | |
Obligations of the U.S. Government and its agencies | | $ | 198,992 | | | $ | 162,542 | |
| | |
Corporate bonds and debentures | | | 43,885 | | | | 43,006 | |
| | |
Equity securities | | | 238,792 | | | | 268,669 | |
| | |
Index fund - equity | | | 33,347 | | | | 31,133 | |
| | |
Index fund - fixed income | | | - | | | | 2,548 | |
| | |
Foreign equity fund | | | 87,336 | | | | 86,947 | |
| | |
Foreign index fund | | | 43,711 | | | | 19,847 | |
| | |
Commodity fund | | | 16,451 | | | | 19,088 | |
| | |
Mortgage-backed securities | | | 12,950 | | | | 10,479 | |
| | |
Private equity investments | | | 922 | | | | 1,428 | |
| | |
Cash and cash equivalents | | | 27,456 | | | | 16,773 | |
| | |
Accrued investment income | | | 1,640 | | | | 1,420 | |
| |
| | |
Total assets | | $ | 705,482 | | | $ | 663,880 | |
| |
Until September 30, 2013 certain assets of the plans were maintained, for investment purposes only in a Master Trust (the “Master Trust”). Neither the pension or benefit restoration plan had any interest in the specific assets of the Master Trust, but maintained beneficial interests in such assets. The Master Trust was managed by the Trust Division of BPPR and by several investment managers.
At December 31, 2012, the pension and restoration plans’ interest in the net assets of the Master Trust was 100%. At September 30, 2013 the Master Trust was dissolved and all the investments were allocated to the plans based on their relative interest on the net assets of the Master Trust.
The following table sets forth by level, within the fair value hierarchy, the plans’ assets at fair value at December 31, 2013 and 2012.
| | | | | | | | | | | | | | | | | | | | | | | | | | | | | | | | |
| | | | | | 2013 | | | | | | | | | 2012 | | | | |
| |
| | | | | | | | |
| (In thousands) | | Level 1 | | | Level 2 | | | Level 3 | | | Total | | | Level 1 | | | Level 2 | | | Level 3 | | | Total | |
| |
| | | | | | | | |
Obligations of the U.S. Government and its agencies | | $ | - | �� | | $ | 198,992 | | | $ | - | | | $ | 198,992 | | | $ | - | | | $ | 162,542 | | | $ | - | | | $ | 162,542 | |
| | | | | | | | |
Corporate bonds and debentures | | | - | | | | 43,885 | | | | - | | | | 43,885 | | | | - | | | | 43,006 | | | | - | | | | 43,006 | |
| | | | | | | | |
Equity securities | | | 238,792 | | | | - | | | | - | | | | 238,792 | | | | 268,669 | | | | - | | | | - | | | | 268,669 | |
| | | | | | | | |
Index fund - equity | | | 33,347 | | | | - | | | | - | | | | 33,347 | | | | 31,133 | | | | - | | | | - | | | | 31,133 | |
| | | | | | | | |
Index fund - fixed income | | | - | | | | - | | | | - | | | | - | | | | - | | | | 2,548 | | | | - | | | | 2,548 | |
| | | | | | | | |
Foreign equity fund | | | - | | | | 87,336 | | | | - | | | | 87,336 | | | | - | | | | 86,947 | | | | - | | | | 86,947 | |
| | | | | | | | |
Foreign index fund | | | - | | | | 43,711 | | | | - | | | | 43,711 | | | | - | | | | 19,847 | | | | - | | | | 19,847 | |
| | | | | | | | |
Commodity fund | | | - | | | | 16,451 | | | | - | | | | 16,451 | | | | - | | | | 19,088 | | | | - | | | | 19,088 | |
| | | | | | | | |
Mortgage-backed securities | | | - | | | | 12,950 | | | | - | | | | 12,950 | | | | - | | | | 10,479 | | | | - | | | | 10,479 | |
| | | | | | | | |
Private equity investments | | | - | | | | - | | | | 922 | | | | 922 | | | | - | | | | - | | | | 1,428 | | | | 1,428 | |
| | | | | | | | |
Cash and cash equivalents | | | 27,456 | | | | - | | | | - | | | | 27,456 | | | | 16,773 | | | | - | | | | - | | | | 16,773 | |
236
| | | | | | | | | | | | | | | | | | | | | | | | | | | | | | | | |
Accrued investment income | | | - | | | | - | | | | 1,640 | | | | 1,640 | | | | - | | | | - | | | | 1,420 | | | | 1,420 | |
| |
| | | | | | | | |
Total assets | | $ | 299,595 | | | $ | 403,325 | | | $ | 2,562 | | | $ | 705,482 | | | $ | 316,575 | | | $ | 344,457 | | | $ | 2,848 | | | $ | 663,880 | |
| |
The closing prices reported in the active markets in which the securities are traded are used to value the investments.
Following is a description of the valuation methodologies used for investments measured at fair value:
| | — | | Obligations of U.S. Government and its agencies - The fair value of Obligations of U.S. Government and agencies obligations is based on an active exchange market and is based on quoted market prices for similar securities. These securities are classified as Level 2. U.S. agency structured notes are priced based on a bond’s theoretical value from similar bonds defined by credit quality and market sector and for which the fair value incorporates an option adjusted spread in deriving their fair value. These securities are classified as Level 2. |
| | — | | Corporate bonds and debentures - Corporate bonds and debentures are valued at fair value at the closing price reported in the active market in which the bond is traded. These securities are classified as Level 2. |
| | — | | Equity securities - Equity securities with quoted market prices obtained from an active exchange market and high liquidity are classified as Level 1. |
| | — | | Investments in index funds - Equity with quoted market prices obtained from an active exchange market and high liquidity are classified as Level 1. |
| | — | | Investments in index funds – Fixed income, foreign equity, foreign index and commodity funds are valued at the net asset value (NAV) of shares held by the plan at year end. These securities are classified as Level 2. |
| | — | | Mortgage-backed securities - Certain agency mortgage and other asset backed securities (“MBS”) are priced based on a bond’s theoretical value from similar bonds defined by credit quality and market sector. Their fair value incorporates an option adjusted spread. The agency MBS are classified as Level 2. |
| | — | | Private equity investments - Private equity investments include an investment in a private equity fund. The fund value is recorded at its net asset value (NAV) which is affected by the changes in the fair market value of the investments held in the fund. This fund is classified as Level 3. |
| | — | | Cash and cash equivalents - The carrying amount of cash and cash equivalents is a reasonable estimate of the fair value since it is available on demand or due to their short-term maturity. |
| | — | | Accrued investment income – Given the short-term nature of these assets, their carrying amount approximates fair value. Since there is a lack of observable inputs related to instrument specific attributes, these are reported as Level 3. |
The preceding valuation methods may produce a fair value calculation that may not be indicative of net realizable value or reflective of future fair values. Furthermore, although the plan believes its valuation methods are appropriate and consistent with other market participants, the use of different methodologies or assumptions to determine the fair value of certain financial instruments could result in a different fair value measurement at the reporting date.
The following table presents the change in Level 3 assets measured at fair value.
| | | | | | | | |
| (In thousands) | | 2013 | | | 2012 | |
| |
| | |
Balance at beginning of year | | $ | 2,848 | | | $ | 3,448 | |
| | |
Actual return on plan assets: | | | | | | | | |
| | |
Change in unrealized (loss) gain relating to instruments still held at the reporting date | | | (286 | ) | | | (446) | |
| | |
Settlements | | | - | | | | (154) | |
| |
| | |
Balance at end of year | | $ | 2,562 | | | $ | 2,848 | |
| |
There were no transfers in and/or out of Level 3 for financial instruments measured at fair value on a recurring basis during the years ended December 31, 2013 and 2012. There were no transfers in and/or out of Level 1 and Level 2 during the years ended December 31, 2013 and 2012.
237
Information on the shares of common stock held by the pension and restoration plans is provided in the table that follows.
| | | | | | | | |
| | | 2013 | | | 2012 | |
| |
| | |
Shares of Popular, Inc. common stock | | | 274,572 | | | | 274,572 | |
| | |
Fair value of shares of Popular, Inc. common stock | | $ | 7,888,454 | | | $ | 5,708,352 | |
| | |
Dividends paid on shares of Popular, Inc. common stock held by the plan | | $ | - | | | $ | - | |
| |
The following table sets forth the aggregate status of the plans and the amounts recognized in the consolidated financial statements at December 31, 2013 and 2012.
| | | | | | | | | | | | | | | | |
| | | Pension plan | | | Benefit restoration plans | |
| |
| | | | |
| (In thousands) | | 2013 | | | 2012 | | | 2013 | | | 2012 | |
| |
| | | | |
Change in benefit obligation: | | | | | | | | | | | | | | | | |
| | | | |
Benefit obligation at beginning of year | | $ | 751,605 | | | $ | 706,449 | | | $ | 40,051 | | | $ | 36,439 | |
| | | | |
Interest cost | | | 27,863 | | | | 29,981 | | | | 1,493 | | | | 1,572 | |
| | | | |
Actuarial (gain) loss | | | (76,997 | ) | | | 64,103 | | | | (4,169 | ) | | | 3,287 | |
| | | | |
Benefits paid | | | (49,075 | ) | | | (48,928 | ) | | | (1,279 | ) | | | (1,247) | |
| |
| | | | |
Benefit obligation at end of year | | $ | 653,396 | | | $ | 751,605 | | | $ | 36,096 | | | $ | 40,051 | |
| |
| | | | |
Change in fair value of plan assets: | | | | | | | | | | | | | | | | |
| | | | |
Fair value of plan assets at beginning of year | | $ | 625,519 | | | $ | 551,141 | | | $ | 30,616 | | | $ | 28,382 | |
| | | | |
Actual return on plan assets | | | 94,855 | | | | 65,306 | | | | 4,795 | | | | 3,430 | |
| | | | |
Employer contributions | | | - | | | | 58,000 | | | | 51 | | | | 51 | |
| | | | |
Benefits paid | | | (49,075 | ) | | | (48,928 | ) | | | (1,279 | ) | | | (1,247) | |
| |
| | | | |
Fair value of plan assets at end of year | | $ | 671,299 | | | $ | 625,519 | | | $ | 34,183 | | | $ | 30,616 | |
| |
| | | | |
Amounts recognized in accumulated other comprehensive loss: | | | | | | | | | | | | | | | | |
| | | | |
Net loss | | $ | 147,677 | | | $ | 297,765 | | | $ | 6,928 | | | $ | 15,055 | |
| |
| | | | |
Accumulated other comprehensive loss (AOCL) | | $ | 147,677 | | | $ | 297,765 | | | $ | 6,928 | | | $ | 15,055 | |
| |
| | | | |
Reconciliation of net assets (liabilities): | | | | | | | | | | | | | | | | |
| | | | |
Net liabilities at beginning of year | | $ | (126,086 | ) | | $ | (155,308 | ) | | $ | (9,434 | ) | | $ | (8,057) | |
| | | | |
Amount recognized in AOCL at beginning of year, pre-tax | | | 297,765 | | | | 281,431 | | | | 15,055 | | | | 14,387 | |
| |
| | | | |
Amount prepaid at beginning of year | | | 171,679 | | | | 126,123 | | | | 5,621 | | | | 6,330 | |
| | | | |
Net periodic benefit cost | | | (6,099 | ) | | | (12,444 | ) | | | (656 | ) | | | (760) | |
| | | | |
Contributions | | | - | | | | 58,000 | | | | 51 | | | | 51 | |
| |
| | | | |
Amount prepaid at end of year | | | 165,580 | | | | 171,679 | | | | 5,016 | | | | 5,621 | |
| | | | |
Amount recognized in AOCL | | | (147,677 | ) | | | (297,765 | ) | | | (6,928 | ) | | | (15,055) | |
| |
| | | | |
Net assets (liabilities) at end of year | | $ | 17,903 | | | $ | (126,086 | ) | | $ | (1,912 | ) | | $ | (9,434) | |
| |
The table below presents a breakdown of the plans’ assets and liabilities at December 31, 2013 and 2012.
| | | | | | | | | | | | | | | | |
| | | Pension plan | | | Benefit restoration plans | |
| |
| | | | |
| (In thousands) | | 2013 | | | 2012 | | | 2013 | | | 2012 | |
| |
| | | | |
Non-current assets | | $ | 17,903 | | | $ | - | | | $ | 504 | | | $ | - | |
238
| | | | | | | | | | | | | | | | |
Current liabilities | | | - | | | | - | | | | 51 | | | | 51 | |
| | | | |
Non-current liabilities | | | - | | | | 126,086 | | | | 2,365 | | | | 9,384 | |
| |
The following table presents the funded status of the plans at year end December 31, 2013 and 2012.
| | | | | | | | | | | | | | | | | | | | | | | | |
| | | Pension Plan | | | Tax Qualified Restoration Plan | | | Benefit Restoration Plan | |
| | | | | | |
| (In thousands) | | 2013 | | | 2012 | | | 2013 | | | 2012 | | | 2013 | | | 2012 | |
| |
| | | | | | |
Benefit obligation at end of year | | $ | (653,396 | ) | | $ | (751,605 | ) | | $ | (33,679 | ) | | $ | (37,461 | ) | | $ | (2,416 | ) | | $ | (2,589) | |
| | | | | | |
Fair value of plan assets at end of year | | | 671,299 | | | | 625,519 | | | | 34,183 | | | | 30,616 | | | | - | | | | - | |
| |
| | | | | | |
Funded status at year end | | $ | 17,903 | | | $ | (126,086 | ) | | $ | 504 | | | $ | (6,845 | ) | | $ | (2,416 | ) | | $ | (2,589) | |
| |
The following table presents the change in accumulated other comprehensive loss (“AOCL”), pre-tax, for the years ended December 31, 2013 and 2012.
| | | | | | | | | | | | | | | | |
| (In thousands) | | Pension plan | | | Benefit restoration plans | |
| |
| | | | |
| | | 2013 | | | 2012 | | | 2013 | | | 2012 | |
| |
| | | | |
Accumulated other comprehensive loss at beginning of year | | $ | 297,765 | | | $ | 281,431 | | | $ | 15,055 | | | $ | 14,387 | |
| |
| | | | |
Increase (decrease) in AOCL: | | | | | | | | | | | | | | | | |
| | | | |
Recognized during the year: | | | | | | | | | | | | | | | | |
| | | | |
Amortization of actuarial losses | | | (21,452 | ) | | | (21,703 | ) | | | (1,330 | ) | | | (1,294 | ) |
| | | | |
Occurring during the year: | | | | | | | | | | | | | | | | |
| | | | |
Net actuarial (gains) losses | | | (128,636 | ) | | | 38,037 | | | | (6,797 | ) | | | 1,962 | |
| |
| | | | |
Total (decrease) increase in AOCL | | | (150,088 | ) | | | 16,334 | | | | (8,127 | ) | | | 668 | |
| |
| | | | |
Accumulated other comprehensive loss at end of year | | $ | 147,677 | | | $ | 297,765 | | | $ | 6,928 | | | $ | 15,055 | |
| |
The following table presents the amounts in accumulated other comprehensive loss that are expected to be recognized as components of net periodic benefit cost during 2014.
| | | | | | | | |
| (In thousands) | | Pension plan | | | Benefit restoration plans | |
| |
| | |
Net loss | | $ | 8,075 | | | $ | 431 | |
| |
The following table presents information for plans with an accumulated benefit obligation in excess of plan assets.
| | | | | | | | | | | | | | | | |
| | | Pension plan | | | Benefit restoration plans | |
| | | | |
| (In thousands) | | 2013 | | | 2012 | | | 2013 | | | 2012 | |
| |
| | | | |
Projected benefit obligation | | $ | - | | | $ | 751,605 | | | $ | 2,416 | | | $ | 40,051 | |
| | | | |
Accumulated benefit obligation | | | - | | | | 751,605 | | | | 2,416 | | | | 40,051 | |
| | | | |
Fair value of plan assets | | | - | | | | 625,519 | | | | - | | | | 30,616 | |
| |
| |
The following table presents information for plans with an accumulated benefits obligation less than plan assets. | | | | | |
| | |
| | | Pension plan | | | Benefit restoration plans | |
| | | | |
| (In thousands) | | 2013 | | | 2012 | | | 2013 | | | 2012 | |
| |
| | | | |
Projected benefit obligation | | $ | 653,396 | | | $ | - | | | $ | 33,680 | | | $ | - | |
| | | | |
Accumulated benefit obligation | | | 653,396 | | | | - | | | | 33,680 | | | | - | |
239
| | | | | | | | | | | | | | | | |
Fair value of plan assets | | | 671,299 | | | | - | | | | 34,183 | | | | - | |
| |
The actuarial assumptions used to determine the benefit obligations at year-end were as follows:
| | | | | | | | | | | | | | | | |
| | | Pension plan | | | Benefit restoration plans | |
| | | | |
| | | 2013 | | | 2012 | | | 2013 | | | 2012 | |
| |
| | | | |
Discount rate | | | 4.70 | % | | | 3.80 | % | | | 4.70 | % | | | 3.80 % | |
| |
The following table presents the actuarial assumptions used to determine the components of net periodic benefit cost.
| | | | | | | | | | | | | | | | | | | | | | | | |
| | | Pension plan | | | Benefit restoration plans | |
| | | | | | |
| | | 2013 | | | 2012 | | | 2011 | | | 2013 | | | 2012 | | | 2011 | |
| |
| | | | | | |
Discount rate | | | 3.80 | % | | | 4.40 | % | | | 5.30 | % | | | 3.80 | % | | | 4.40 | % | | | 5.30 % | |
| | | | | | |
Expected return on plan assets | | | 7.25 | % | | | 7.60 | % | | | 8.00 | % | | | 7.25 | % | | | 7.60 | % | | | 8.00 % | |
| |
The following table presents the components of net periodic benefit cost.
| | | | | | | | | | | | | | | | | | | | | | | | |
| | | Pension plan | | | Benefit restoration plans | |
| | | | | | |
| (In thousands) | | 2013 | | | 2012 | | | 2011 | | | 2013 | | | 2012 | | | 2011 | |
| |
| | | | | | |
Interest cost | | $ | 27,863 | | | $ | 29,981 | | | $ | 31,139 | | | $ | 1,493 | | | $ | 1,572 | | | $ | 1,581 | |
| | | | | | |
Expected return on plan assets | | | (43,216 | ) | | | (39,240 | ) | | | (43,361 | ) | | | (2,167 | ) | | | (2,105 | ) | | | (1,803) | |
| | | | | | |
Recognized net actuarial loss | | | 21,452 | | | | 21,703 | | | | 11,314 | | | | 1,330 | | | | 1,294 | | | | 591 | |
| |
| | | | | | |
Net periodic benefit (credit) cost | | | 6,099 | | | | 12,444 | | | | (908 | ) | | | 656 | | | | 761 | | | | 369 | |
| | | | | | |
Termination benefit loss | | | - | | | | - | | | | 15,559 | | | | - | | | | - | | | | - | |
| |
| | | | | | |
Total benefit cost | | $ | 6,099 | | | $ | 12,444 | | | $ | 14,651 | | | $ | 656 | | | $ | 761 | | | $ | 369 | |
| |
The Corporation expects to pay the following contributions to the benefit plans during 2014.
| | | | |
| (In thousands) | | 2014 | |
| |
| |
Pension plan | | $ | - | |
| |
Benefit restoration plans | | $ | 51 | |
| |
Benefit payments projected to be made from the pension and benefit restoration plans are presented in the table below.
| | | | | | | | |
| (In thousands) | | Pension plan | | | Benefit restoration plans | |
| |
| | |
2014 | | $ | 36,850 | | | $ | 1,604 | |
| | |
2015 | | | 36,755 | | | | 1,862 | |
| | |
2016 | | | 37,323 | | | | 1,983 | |
| | |
2017 | | | 37,999 | | | | 2,102 | |
| | |
2018 | | | 38,606 | | | | 2,182 | |
| | |
2019 - 2023 | | | 199,925 | | | | 11,829 | |
| |
Postretirement health care benefits
In addition to providing pension benefits, BPPR provides certain health care benefits for certain retired employees. Regular employees of BPPR, hired before February 1, 2000, may become eligible for health care benefits, provided they reach retirement
240
age while working for BPPR. Certain employees who elected to retire as of February 1, 2012 under the voluntary retirement program were also eligible to receive postretirement health care benefits.
The Corporation amended the postretirement health care benefits plan effective January 1, 2014 to increase the participant’s share of the plan cost. The postretirement health care benefit obligation as of December 31, 2013 reflects such amendments to the plan.
The following table presents the status of the Corporation’s unfunded postretirement health care benefit plan and the related amounts recognized in the consolidated financial statements at December 31, 2013 and 2012.
| | | | | | | | |
| (In thousands) | | 2013 | | | 2012 | |
| |
| | |
Change in benefit obligation: | | | | | | | | |
| | |
Benefit obligation at beginning of the year | | $ | 183,611 | | | $ | 180,989 | |
| | |
Service cost | | | 2,257 | | | | 2,190 | |
| | |
Interest cost | | | 6,848 | | | | 7,801 | |
| | |
Amendments | | | (18,670 | ) | | | - | |
| | |
Benefits paid | | | (7,066 | ) | | | (7,348) | |
| | |
Actuarial (gain) loss | | | (21,248 | ) | | $ | (21) | |
| |
| | |
Benefit obligation end of year | | $ | 145,732 | | | | 183,611 | |
| |
| | |
Amounts recognized in accumulated other comprehensive loss: | | | | | | | | |
| | |
Net prior service cost | | $ | (18,670 | ) | | $ | - | |
| | |
Net loss | | | 12,346 | | | | 35,486 | |
| |
| | |
Accumulated other comprehensive (gain) loss | | $ | (6,324 | ) | | $ | 35,486 | |
| |
| | |
Reconciliation of net liability: | | | | | | | | |
| | |
Net liability at beginning of year | | $ | (183,611 | ) | | $ | (180,989) | |
| | |
Amount recognized in accumulated other comprehensive loss at beginning of year, pre-tax | | | 35,486 | | | | 37,469 | |
| |
| | |
Amount accrued at beginning of year | | | (148,125 | ) | | | (143,520) | |
| | |
Net periodic benefit cost | | | (10,997 | ) | | | (11,953) | |
| | |
Contributions | | | 7,066 | | | | 7,348 | |
| |
| | |
Amount accrued at end of year | | | (152,056 | ) | | | (148,125) | |
| | |
Amount recognized in accumulated other comprehensive gain (loss) | | | 6,324 | | | | (35,486) | |
| |
| | |
Net liability at end of year | | $ | (145,732 | ) | | $ | (183,611) | |
| |
|
The table below presents a breakdown of the liability associated with the postretirement health care benefit plan. | |
| |
| | |
| (In thousands) | | 2013 | | | 2012 | |
| |
| | |
Current liabilities | | $ | 6,199 | | | $ | 6,811 | |
| | |
Non-current liabilities | | | 139,532 | | | | 176,800 | |
| |
|
The following table presents the funded status of the postretirement health care benefit plan at year end December 31, 2013 and 2012. | |
| | |
| (In thousands) | | 2013 | | | 2012 | |
| |
| | |
Benefit obligation at end of year | | $ | (145,732 | ) | | $ | (183,611) | |
| | |
| Fair value of plan assets at end of year | | | - | | | | - | |
| |
| | |
Funded status at year end | | | (145,732 | ) | | | (183,611) | |
| |
The following table presents the changes in accumulated other comprehensive loss (income), pre-tax, for the postretirement health care benefit plan.
241
| | | | | | | | |
| (In thousands) | | 2013 | | | 2012 | |
| |
| | |
Accumulated other comprehensive loss at beginning of year | | $ | 35,486 | | | $ | 37,469 | |
| |
| | |
Increase (decrease) in accumulated other comprehensive loss: | | | | | | | | |
| | |
Recognized during the year: | | | | | | | | |
| | |
Prior service credit | | | - | | | | 200 | |
| | |
Amortization of actuarial losses | | | (1,892 | ) | | | (2,162) | |
| | |
Occurring during the year: | | | | | | | | |
| | |
Prior service cost (credit) | | | (18,670 | ) | | | - | |
| | |
Net actuarial (gains) losses | | | (21,248 | ) | | | (21) | |
| |
| | |
Total increase (decrease) in accumulated other comprehensive loss | | | (41,810 | ) | | | (1,983) | |
| |
| | |
Accumulated other comprehensive (income) loss at end of year | | $ | (6,324 | ) | | $ | 35,486 | |
| |
The following table presents the amounts in accumulated other comprehensive loss that are expected to be recognized as components of net periodic benefit cost for the postretirement health care benefit plan during 2014.
| | | | |
| (In thousands) | | 2014 | |
| |
| |
Net prior service credit | | $ | (3,800) | |
| |
The following table presents the components of net periodic postretirement health care benefit cost.
| | | | | | | | | | | | |
| (In thousands) | | 2013 | | | 2012 | | | 2011 | |
| |
| | | |
Service cost | | $ | 2,257 | | | $ | 2,190 | | | $ | 2,016 | |
| | | |
Interest cost | | | 6,848 | | | | 7,801 | | | | 8,543 | |
| | | |
Amortization of prior service credit | | | - | | | | (200 | ) | | | (961) | |
| | | |
Recognized net actuarial loss (gain) | | | 1,892 | | | | 2,162 | | | | 1,068 | |
| |
| | | |
Net periodic benefit cost | | | 10,997 | | | | 11,953 | | | | 10,666 | |
| | | |
Temporary deviation loss | | | - | | | | - | | | | 437 | |
| |
| | | |
Total benefit cost | | $ | 10,997 | | | $ | 11,953 | | | $ | 11,103 | |
| |
The following tables present the discount rate and assumed health care cost trend rates used to determine the benefit obligation and the net periodic benefit cost for the postretirement health care benefit plan.
| | | | | | | | | | | | |
| To determine benefit obligation: | | 2013 | | | 2012 | | | | |
| |
| | | |
Discount rate | | | 4.80 | % | | | 3.80 | % | | | | |
| | | |
Initial health care cost trend rates | | | 7.50 | % | | | 6.50 | % | | | | |
| | | |
Ultimate health care cost trend rate | | | 5.00 | % | | | 5.00 | % | | | | |
| | | |
Year that the ultimate trend rate is reached | | | 2019 | | | | 2016 | | | | | |
| |
| | | |
| To determine net periodic benefit cost: | | 2013 | | | 2012 | | | 2011 | |
| |
| | | |
Discount rate | | | 3.80 | % | | | 4.40 | % | | | 5.30 % | |
| | | |
Initial health care cost trend rates: | | | | | | | | | | | | |
| | | |
Medicare Advantage plans | | | 6.50 | % | | | 25.00 | % | | | 25.00 % | |
| | | |
All other plans | | | 6.50 | | | | 7.00 | | | | 6.50 | |
242
| | | | | | | | | | | | |
Ultimate health care cost trend rate | | | 5.00 | % | | | 5.00 | % | | | 5.00 | % |
| | | |
Year that the ultimate trend rate is reached | | | 2016 | | | | 2016 | | | | 2014 | |
Assumed health care trend rates generally have a significant effect on the amounts reported for a health care plan. The following table presents the effects of changes in the assumed health care cost trend rates.
| | | | | | | | |
| (In thousands) | | 1-percentage point increase | | | 1-percentage point decrease | |
| |
| | |
Effect on total service cost and interest cost components | | $ | 290 | | | $ | (363) | |
| | |
Effect on postretirement benefit obligation | | $ | 5,635 | | | $ | (6,684) | |
| |
The following table presents information for the postretirement health care benefit plan with an accumulated benefit obligation in excess of plan assets.
| | | | | | | | |
| (In thousands) | | 2013 | | | 2012 | |
| |
| | |
Projected benefit obligation | | $ | 145,732 | | | $ | 183,611 | |
| | |
Accumulated benefit obligation | | | 145,732 | | | | 183,611 | |
| | |
Fair value of plan assets | | | - | | | | - | |
| |
The Corporation expects to contribute $6.2 million to the postretirement benefit plan in 2014 to fund current benefit payment requirements.
Benefit payments projected to be made on the postretirement health care benefit plan are presented in the following table.
| | | | |
| (In thousands) | | | |
| |
| |
2014 | | $ | 6,199 | |
| |
2015 | | | 6,358 | |
| |
2016 | | | 6,662 | |
| |
2017 | | | 7,094 | |
| |
2018 | | | 7,499 | |
| |
2019 - 2023 | | | 42,500 | |
| |
Savings plans
The Corporation also provides defined contribution savings plans pursuant to Section 1081.01(d) of the Puerto Rico Internal Revenue Code and Section 401(k) of the U.S. Internal Revenue Code, as applicable, for substantially all the employees of the Corporation. Investments in the plans are participant-directed, and employer matching contributions are determined based on the specific provisions of each plan. Employees are fully vested in the employer’s contribution after five years of service. Effective March 20, 2009, the savings plans were amended to suspend the employer matching contribution to the plan. This matching contribution was restored on April 2013. The cost of providing these benefits in the year ended December 31, 2013 was $3.6 million. The Corporation did not incur costs associated to the matching contributions during the years ended December 31, 2012 and 2011.
The plans held 1,939,089 (2012 – 2,046,162) shares of common stock of the Corporation with a market value of approximately $55.7 million at December 31, 2013 (2012 - $42.5 million).
243
Note 35 – Net income (loss) per common share
The following table sets forth the computation of net income (loss) per common share (“EPS”), basic and diluted, for the years ended December 31, 2013, 2012 and 2011:
| | | | | | | | | | | | |
| (In thousands, except per share information) | | 2013 | | | 2012 | | | 2011 | |
| |
| | | |
Net income | | $ | 599,327 | | | $ | 245,275 | | | $ | 151,325 | |
| | | |
Preferred stock dividends | | | (3,723 | ) | | | (3,723 | ) | | | (3,723) | |
| |
| | | |
Net income (loss) applicable to common stock | | $ | 595,604 | | | $ | 241,552 | | | $ | 147,602 | |
| |
| | | |
Average common shares outstanding | | | 102,693,685 | | | | 102,429,755 | | | | 102,179,393 | |
| | | |
Average potential dilutive common shares | | | 367,790 | | | | 223,855 | | | | 110,103 | |
| |
| | | |
Average common shares outstanding - assuming dilution | | | 103,061,475 | | | | 102,653,610 | | | | 102,289,496 | |
| |
| | | |
Basic EPS | | $ | 5.80 | | | $ | 2.36 | | | $ | 1.44 | |
| |
| | | |
Dilutive EPS | | $ | 5.78 | | | $ | 2.35 | | | $ | 1.44 | |
| |
Note: All periods presented reflect the 1-for-10 reverse stock split effected on May 29, 2012. | |
| |
Potential common shares consist of common stock issuable under the assumed exercise of stock options and restricted stock awards using the treasury stock method. This method assumes that the potential common shares are issued and the proceeds from exercise, in addition to the amount of compensation cost attributed to future services, are used to purchase common stock at the exercise date. The difference between the number of potential shares issued and the shares purchased is added as incremental shares to the actual number of shares outstanding to compute diluted earnings per share. Warrants, stock options, and restricted stock awards that result in lower potential shares issued than shares purchased under the treasury stock method are not included in the computation of dilutive earnings per share since their inclusion would have an antidilutive effect in earnings per common share.
For the year ended December 31, 2013, there were 102,389 weighted average antidilutive stock options outstanding (2012 – 165,342; 2011 – 209,288). Additionally, the Corporation has outstanding a warrant issued to the U.S. Treasury to purchase 2,093,284 shares of common stock, which have an antidilutive effect at December 31, 2013.
Note 36 – Rental expense and commitments
At December 31, 2013, the Corporation was obligated under a number of non-cancelable leases for land, buildings, and equipment which require rentals as follows:
| | | | |
| |
| |
| Year | | Minimum
payments[1] | |
| |
| |
| | | (In thousands) | |
| |
2014 | | $ | 37,188 | |
| |
2015 | | | 35,192 | |
| |
2016 | | | 31,825 | |
| |
2017 | | | 25,815 | |
| |
2018 | | | 20,858 | |
| |
Later years | | | 146,474 | |
| |
| |
| | $ | 297,352 | |
| |
[1] Minimum payments have not been reduced by minimum non-cancelable sublease rentals due in the future of $6.2 million at December 31, 2013. | |
| |
Total rental expense for all operating leases, except those with terms of a month or less that were not renewed, for the year ended December 31, 2013 was $ 40.3 million (2012 - $ 44.3 million; 2011 - $ 49.9 million), which is included in net occupancy, equipment and communication expenses, according to their nature.
244
Note 37 – Other service fees
The following table presents the major categories of other service fees for the years ended December 31, 2013, 2012 and 2011.
| | | | | | | | | | | | |
| |
| | | |
| (In thousands) | | 2013 | | | 2012 | | | 2011 | |
| |
| | | |
Debit card fees | | $ | 43,262 | | | $ | 44,852 | | | $ | 59,342 | |
| | | |
Insurance fees | | | 55,323 | | | | 53,825 | | | | 54,390 | |
| | | |
Credit card fees and discounts | | | 66,309 | | | | 61,576 | | | | 52,544 | |
| | | |
Sale and administration of investment products | | | 35,272 | | | | 37,766 | | | | 34,388 | |
| | | |
Trust fees | | | 17,285 | | | | 16,353 | | | | 15,333 | |
| | | |
Processing fees | | | - | | | | 6,330 | | | | 6,839 | |
| | | |
Other fees | | | 17,674 | | | | 17,163 | | | | 18,164 | |
| |
| | | |
Total other service fees | | $ | 235,125 | | | $ | 237,865 | | | $ | 241,000 | |
| |
Note 38 – FDIC loss share (expense) income
The caption of FDIC loss share (expense) income in the consolidated statements of operations consists of the following major categories:
| | | | | | | | | | | | |
| | | Year ended December 31, | |
| | | |
(In thousands) | | 2013 | | | 2012 | | | 2011 | |
| |
| | | |
Amortization of loss share indemnification asset | | $ | (161,635 | ) | | $ | (129,676 | ) | | $ | (10,855 | ) |
| | | |
80% mirror accounting on credit impairment losses[1] | | | 60,454 | | | | 58,187 | | | | 110,457 | |
| | | |
80% mirror accounting on reimbursable expenses | | | 50,985 | | | | 30,771 | | | | 5,093 | |
| | | |
80% mirror accounting on recoveries on covered assets, including rental income on OREOs, subject to reimbursement to the FDIC | | | (16,057 | ) | | | (2,979 | ) | | | - | |
| | | |
80% mirror accounting on amortization of contingent liability on unfunded commitments | | | (473 | ) | | | (969 | ) | | | (33,221) | |
| | | |
Change in true-up payment obligation | | | (15,993 | ) | | | (13,178 | ) | | | (6,304) | |
| | | |
Other | | | 668 | | | | 1,633 | | | | 1,621 | |
| |
| | | |
Total FDIC loss share (expense) income | | $ | (82,051 | ) | | $ | (56,211 | ) | | $ | 66,791 | |
| |
|
| [1] Reductions in expected cash flows for ASC 310-30 loans, which may impact the provision for loan losses, may consider reductions in both principal and interest cash flow expectations. The amount covered under the FDIC loss sharing agreements for interest not collected from borrowers is limited under the agreements (approximately 90 days); accordingly, these amounts are not subject fully to the 80% mirror accounting. | |
| |
245
Note 39 - Stock-based compensation
The Corporation maintained a Stock Option Plan (the “Stock Option Plan”), which permitted the granting of incentive awards in the form of qualified stock options, incentive stock options, or non-statutory stock options of the Corporation. In April 2004, the Corporation’s shareholders adopted the Popular, Inc. 2004 Omnibus Incentive Plan (the “Incentive Plan”), which replaced and superseded the Stock Option Plan. The adoption of the Incentive Plan did not alter the original terms of the grants made under the Stock Option Plan prior to the adoption of the Incentive Plan.
Stock Option Plan
Employees and directors of the Corporation or any of its subsidiaries were eligible to participate in the Stock Option Plan. The Board of Directors or the Compensation Committee of the Board had the absolute discretion to determine the individuals that were eligible to participate in the Stock Option Plan. This plan provided for the issuance of Popular, Inc.’s common stock at a price equal to its fair market value at the grant date, subject to certain plan provisions. The shares are to be made available from authorized but unissued shares of common stock or treasury stock. The Corporation’s policy has been to use authorized but unissued shares of common stock to cover each grant. The maximum option term is ten years from the date of grant. Unless an option agreement provides otherwise, all options granted are 20% exercisable after the first year and an additional 20% is exercisable after each subsequent year, subject to an acceleration clause at termination of employment due to retirement.
| | | | | | | | | | | | | | | | | | | | |
| (Not in thousands) | |
| |
| | | | | |
Exercise price range per share | | Options outstanding | | | Weighted-average
exercise price of
options outstanding | | | Weighted-average
remaining life of options
outstanding in years | | | Options exercisable (fully
vested) | | | Weighted-average
exercise price of
options exercisable | |
| |
| | | | | |
$ 201.75 - $ 272.00 | | | 100,437 | | | | $ 253.64 | | | | 0.53 | | | | 100,437 | | | | $ 253.64 | |
| |
There was no intrinsic value of options outstanding and exercisable at December 31, 2013, 2012 and 2011.
The following table summarizes the stock option activity and related information:
| | | | | | | | |
| (Not in thousands) | | Options outstanding | | | Weighted-average
exercise price | |
| |
| | |
Outstanding at January 1, 2011 | | | 227,518 | | | $ | 206.71 | |
| | |
Granted | | | - | | | | - | |
| | |
Exercised | | | - | | | | - | |
| | |
Forfeited | | | - | | | | - | |
| | |
Expired | | | (20,572) | | | | 195.48 | |
| |
| | |
Outstanding at December 31, 2011 | | | 206,946 | | | $ | 207.83 | |
| | |
Granted | | | - | | | | - | |
| | |
Exercised | | | - | | | | - | |
| | |
Forfeited | | | - | | | | - | |
| | |
Expired | | | (45,960) | | | | 155.68 | |
| |
| | |
Outstanding at December 31, 2012 | | | 160,986 | | | $ | 222.71 | |
| | |
Granted | | | - | | | | - | |
| | |
Exercised | | | - | | | | - | |
| | |
Forfeited | | | - | | | | - | |
| | |
Expired | | | (60,549) | | | | 171.42 | |
| |
| | |
Outstanding at December 31, 2013 | | | 100,437 | | | $ | 253.64 | |
| |
There was no stock option expense recognized for the years ended December 31, 2013, 2012 and 2011.
Incentive Plan
246
The Incentive Plan permits the granting of incentive awards in the form of Annual Incentive Awards, Long-term Performance Unit Awards, Stock Options, Stock Appreciation Rights, Restricted Stock, Restricted Units or Performance Shares. Participants in the Incentive Plan are designated by the Compensation Committee of the Board of Directors (or its delegate as determined by the Board). Employees and directors of the Corporation and/or any of its subsidiaries are eligible to participate in the Incentive Plan.
Under the Incentive Plan, the Corporation has issued restricted shares, which become vested based on the employees’ continued service with Popular. Unless otherwise stated in an agreement, the compensation cost associated with the shares of restricted stock is determined based on a two-prong vesting schedule. The first part is vested ratably over five years commencing at the date of grant and the second part is vested at termination of employment after attainment of 55 years of age and 10 years of service. The five-year vesting part is accelerated at termination of employment after attaining 55 years of age and 10 years of service. The restricted shares granted consistent with the requirements of the Troubled Asset Relief Program (“TARP”) Interim Final Rule vest in two years from grant date.
The following table summarizes the restricted stock activity under the Incentive Plan for members of management.
| | | | | | | | |
| (Not in thousands) | | Restricted stock | | | Weighted-average
grant date fair value | |
| |
| | |
Non-vested at January 1, 2011 | | | 113,174 | | | $ | 36.06 | |
| | |
Granted | | | 155,945 | | | | 32.35 | |
| | |
Vested | | | (5,156) | | | | 89.97 | |
| | |
Forfeited | | | (22,029) | | | | 42.03 | |
| |
| | |
Non-vested at December 31, 2011 | | | 241,934 | | | $ | 31.98 | |
| | |
Granted | | | 359,427 | | | | 17.72 | |
| | |
Vested | | | (96,353) | | | | 37.61 | |
| | |
Forfeited | | | (13,785) | | | | 26.59 | |
| |
| | |
Non-vested at December 31, 2012 | | | 491,223 | | | $ | 20.59 | |
| | |
Granted | | | 229,131 | | | | 28.20 | |
| | |
Vested | | | (131,324) | | | | 31.23 | |
| | |
Forfeited | | | (3,783) | | | | 24.63 | |
| |
| | |
Non-vested at December 31, 2013 | | | 585,247 | | | $ | 21.16 | |
| |
During the year ended December 31, 2013, 229,131 shares of restricted stock (2012 - 359,427; 2011 - 155,945) were awarded to management under the Incentive Plan, from which 165,304 shares (2012 - 253,170; 2011 - 111,045) were awarded to management consistent with the requirements of the TARP Interim Final Rule.
During the year ended December 31, 2013, the Corporation recognized $ 5.3 million of restricted stock expense related to management incentive awards, with a tax benefit of $ 1.7 million (2012 - $ 4.3 million, with a tax benefit of $ 1.1 million; 2011 - $ 2.2 million, with a tax benefit of $ 0.5 million). During the year ended December 31, 2013, the fair market value of the restricted stock vested was $4.0 million at grant date and $3.6 million at vesting date. This triggers a shortfall, net of windfalls, of $0.1 million that was recorded as an additional income tax expense at the applicable income tax rate. No income tax expense was recorded for the U.S. employees due to the valuation allowance of the deferred tax asset. The total unrecognized compensation cost related to non-vested restricted stock awards to members of management at December 31, 2013 was $ 6.4 million and is expected to be recognized over a weighted-average period of 2.1 years.
The following table summarizes the restricted stock activity under the Incentive Plan for members of the Board of Directors:
| | | | |
| (Not in thousands) | | Restricted stock | | Weighted-average grant date fair value |
|
247
| | | | | | | | |
| |
| | |
Nonvested at January 1, 2011 | | | - | | | | - | |
| | |
Granted | | | 30,163 | | | $ | 26.72 | |
| | |
Vested | | | (30,163) | | | | 26.72 | |
| | |
Forfeited | | | - | | | | - | |
| |
| | |
Non-vested at December 31, 2011 | | | - | | | | - | |
| | |
Granted | | | 41,174 | | | $ | 16.37 | |
| | |
Vested | | | (41,174) | | | | 16.37 | |
| | |
Forfeited | | | - | | | | - | |
| |
| | |
Non-vested at December 31, 2012 | | | - | | | | - | |
| | |
Granted | | | 20,930 | | | $ | 29.43 | |
| | |
Vested | | | (20,930) | | | | 29.43 | |
| | |
Forfeited | | | - | | | | - | |
| |
| | |
Non-vested at December 31, 2013 | | | - | | | | - | |
| |
During the year ended December 31, 2013, the Corporation granted 20,930 shares of restricted stock to members of the Board of Directors of Popular, Inc., which became vested at grant date (2012 - 41,174; 2011 – 30,163). During this period, the Corporation recognized $0.5 million of restricted stock expense related to these restricted stock grants, with a tax benefit of $0.2 million (2012 - $0.4 million, with a tax benefit of $0.1 million; 2011 - $0.5 million, with a tax benefit of $0.1 million). The fair value at vesting date of the restricted stock vested during the year ended December 31, 2013 for directors was $0.6 million.
248
Note 40 – Income taxes
The components of income tax (benefit) expense for the years ended December 31, are summarized in the following table.
| | | | | | | | | | | | |
| (In thousands) | | 2013 | | | 2012 | | | 2011 | |
| |
| | | |
Current income tax expense: | | | | | | | | | | | | |
| | | |
Puerto Rico | | $ | 27,118 | | | $ | 108,090 | | | $ | 107,343 | |
| | | |
Federal and States | | | 10,309 | | | | 998 | | | | 1,722 | |
| |
| | | |
Subtotal | | | 37,427 | | | | 109,088 | | | | 109,065 | |
| |
| | | |
Deferred income tax (benefit) expense: | | | | | | | | | | | | |
| | | |
Puerto Rico | | | (90,796 | ) | | | (138,632 | ) | | | (99,636) | |
| | | |
Federal and States | | | (491 | ) | | | 3,141 | | | | 2,211 | |
| | | |
Adjustment for enacted changes in income tax laws | | | (197,467 | ) | | | - | | | | 103,287 | |
| |
| | | |
Subtotal | | | (288,754 | ) | | | (135,491 | ) | | | 5,862 | |
| |
| | | |
Total income tax (benefit) expense | | $ | (251,327 | ) | | $ | (26,403 | ) | | $ | 114,927 | |
| |
The reasons for the difference between the income tax (benefit) expense applicable to income before provision for income taxes and the amount computed by applying the statutory tax rate in Puerto Rico, were as follows:
| | | | | | | | | | | | | | | | | | | | | | | | | | |
| | | | | 2013 | | | 2012 | | | 2011 | |
| | | | | | |
| (In thousands) | | | | Amount | | | % of pre-tax income | | | Amount | | | % of pre-tax income | | | Amount | | | % of pre-tax income | |
| |
| | | | | | | |
Computed income tax at statutory rates | | $ | | | 135,720 | | | | 39 | % | | $ | 65,662 | | | | 30 | % | | $ | 79,876 | | | | 30 % | |
| | | | | | | |
Benefit of net tax exempt interest income | | | | | (36,993) | | | | (11) | | | | (25,540) | | | | (12) | | | | (31,379) | | | | (12) | |
| | | | | | | |
Effect of income subject to preferential tax rate [1] | | | | | (137,793) | | | | (40) | | | | (78,132) | | | | (36) | | | | (1,852) | | | | (1) | |
| | | | | | | |
Deferred tax asset valuation allowance | | | | | (32,990) | | | | (9) | | | | 166 | | | | - | | | | 7,192 | | | | 3 | |
| | | | | | | |
Non-deductible expenses | | | | | 32,115 | | | | 9 | | | | 23,093 | | | | 11 | | | | 21,756 | | | | 8 | |
| | | | | | | |
Difference in tax rates due to multiple jurisdictions | | | | | (12,029) | | | | (3) | | | | (6,034) | | | | (3) | | | | (8,555) | | | | (3) | |
| | | | | | | |
Initial adjustment in deferred tax due to change in tax rate | | | | | (197,467) | | | | (57) | | | | - | | | | - | | | | 103,287 | | | | 39 | |
| | | | | | | |
Recognition of tax benefits from previous years [2] | | | | | - | | | | - | | | | - | | | | - | | | | (53,615) | | | | (20) | |
| | | | | | | |
Unrecognized tax benefits | | | | | (7,727) | | | | (2) | | | | (8,985) | | | | (4) | | | | (5,160) | | | | (2) | |
| | | | | | | |
Others | | | | | 5,837 | | | | 2 | | | | 3,367 | | | | 2 | | | | 3,377 | | | | 1 | |
| |
| | | | | | | |
Income tax (benefit) expense | | $ | | | (251,327) | | | | (72) | % | | $ | (26,403) | | | | (12) | % | | $ | 114,927 | | | | 43 % | |
| |
[1] Includes the impact of the Closing Agreement with the P.R. Treasury signed in June 2012, the tax expense related to a gain on the sale of EVERTEC shares and income from investments in subsidiaries subject to preferential tax rates.
[2] Represents the impact of the Ruling and Closing Agreement with the P.R. Treasury signed in June 2011.
The results for the year ended December 31, 2013 reflect a tax benefit of $197.5 million, and a corresponding increase in the net deferred tax assets of the Puerto Rico operations as a result of the increase in the marginal tax rate from 30% to 39%. On June 30, 2013 the Governor of Puerto Rico signed Act Number 40 which includes several amendments to the Puerto Rico Internal Revenue Code. Among the most significant changes applicable to corporations was the increase in the marginal tax rate from 30% to 39%
249
effective for taxable years beginning after December 31, 2012. In addition, the Corporation recorded an income tax benefit of $146.4 million in connection with the loss generated on the Puerto Rico operations by the sales of non-performing assets that took place during the year 2013 and a tax expense of $23.7 million related to the gain realized on the sale of a portion of EVERTEC’s shares which was taxable at a preferential tax rate according to Act Number 73 of May 28, 2008, known as “Economic Incentives Act for the Development of Puerto Rico”.
The results for the year ended December 31, 2012 reflect a tax benefit of $72.9 million recorded during the second quarter, related to the reduction of the deferred tax liability on the estimated gains for tax purposes related to the loans acquired from Westernbank (the “Acquired Loans”). In June 2012, the Puerto Rico Department of the Treasury (the “P.R. Treasury”) and the Corporation entered into a Closing Agreement (the “Closing Agreement”) to clarify that the Acquired Loans are a capital asset and any gain resulting from such loans will be taxed at the capital gain tax rate of 15% instead of the ordinary income tax rate of 30%, thus reducing the deferred tax liability on the estimated gain and recognizing an income tax benefit for accounting purposes.
Deferred income taxes reflect the net tax effects of temporary differences between the carrying amounts of assets and liabilities for financial reporting purposes and their tax bases. Significant components of the Corporation’s deferred tax assets and liabilities at December 31 were as follows:
| | | | | | | | |
| (In thousands) | | December 31, 2013 | | | December 31, 2012 | |
| |
| | |
Deferred tax assets: | | | | | | | | |
| | |
Tax credits available for carryforward | | $ | 8,195 | | | $ | 2,666 | |
| | |
Net operating loss and other carryforward available | | | 1,269,523 | | | | 1,201,174 | |
| | |
Postretirement and pension benefits | | | 51,742 | | | | 97,276 | |
| | |
Deferred loan origination fees | | | 7,718 | | | | 6,579 | |
| | |
Allowance for loan losses | | | 760,956 | | | | 592,664 | |
| | |
Deferred gains | | | 9,313 | | | | 10,528 | |
| | |
Accelerated depreciation | | | 7,577 | | | | 6,699 | |
| | |
Intercompany deferred gains | | | 3,235 | | | | 3,891 | |
| | |
Other temporary differences | | | 34,443 | | | | 31,864 | |
| |
| | |
Total gross deferred tax assets | | | 2,152,702 | | | | 1,953,341 | |
| |
| | |
Deferred tax liabilities: | | | | | | | | |
| | |
Differences between the assigned values and the tax basis of assets and liabilities recognized in purchase business combinations | | | 37,938 | | | | 37,281 | |
| | |
Difference in outside basis between financial and tax reporting on sale of a business | | | 349 | | | | 6,400 | |
| | |
FDIC-assisted transaction | | | 79,381 | | | | 53,351 | |
| | |
Unrealized net gain on trading and available-for-sale securities | | | 3,822 | | | | 51,002 | |
| | |
Deferred loan origination costs | | | 554 | | | | 3,459 | |
| | |
Other temporary differences | | | 13,038 | | | | 10,142 | |
| |
| | |
Total gross deferred tax liabilities | | | 135,082 | | | | 161,635 | |
| |
| | |
Valuation allowance | | | 1,257,977 | | | | 1,260,542 | |
| |
| | |
Net deferred tax asset | | $ | 759,643 | | | $ | 531,164 | |
| |
The net deferred tax asset shown in the table above at December 31, 2013 is reflected in the consolidated statements of financial condition as $ 762 million in net deferred tax assets (in the “other assets” caption) (2012 - $ 541 million in deferred tax asset in the “other assets” caption) and $2 million in deferred tax liabilities (in the “other liabilities” caption) (2012 - $10 million in deferred tax liabilities in the “other liabilities” caption), reflecting the aggregate deferred tax assets or liabilities of individual tax-paying subsidiaries of the Corporation.
Included as part of the other carryforwards available are $47.2 million related to contributions to Banco Popular de Puerto Rico qualified pension plan and $61.1 million of other net operating loss carryforwards (“NOLs”) primarily related to the loss on sale of non-performing assets that have no expiration date since they were realize through a single member limited liability company. Additionally, the deferred tax asset related to the NOLs outstanding at December 31, 2013 expires as follows:
250
| | | | |
| (In thousands) | | | |
| |
| |
2016 | | $ | 7,263 | |
| |
2017 | | | 8,542 | |
| |
2018 | | | 14,722 | |
| |
2019 | | | 1 | |
| |
2020 | | | 757 | |
| |
2021 | | | 375 | |
| |
2022 | | | 970 | |
| |
2023 | | | 1,248 | |
| |
2027 | | | 65,165 | |
| |
2028 | | | 510,675 | |
| |
2029 | | | 195,014 | |
| |
2030 | | | 193,707 | |
| |
2031 | | | 136,657 | |
| |
2032 | | | 25,043 | |
| |
2033 | | | 1,057 | |
| |
| |
| | $ | 1,161,196 | |
| |
A deferred tax asset should be reduced by a valuation allowance if based on the weight of all available evidence, it is more likely than not (a likelihood of more than 50%) that some portion or the entire deferred tax asset will not be realized. The valuation allowance should be sufficient to reduce the deferred tax asset to the amount that is more likely than not to be realized. The determination of whether a deferred tax asset is realizable is based on weighting all available evidence, including both positive and negative evidence. The realization of deferred tax assets, including carryforwards and deductible temporary differences, depends upon the existence of sufficient taxable income of the same character during the carryback or carryforward period. The analysis considers all sources of taxable income available to realize the deferred tax asset, including the future reversal of existing taxable temporary differences, future taxable income exclusive of reversing temporary differences and carryforwards, taxable income in prior carryback years and tax-planning strategies.
The Corporation recorded a valuation allowance in the year 2008 since in consideration of the requirement of ASC 740 management considered that it is more likely than not that all of the U.S. operation deferred tax asset will not be realized. For purposes of assessing the realization of the deferred tax assets in the U.S. mainland management evaluates and weights all available positive and negative evidence. The Corporation’s U.S. mainland operations are no longer in a cumulative loss position for the three-year period ended December 31, 2013 taking into account taxable income exclusive of reversing temporary differences. This represents positive evidence within management’s evaluation. The assessment as of December 31, 2013 considers the book income for 2013 and excludes the loss recorded during the fourth quarter of 2010, which previously drove the cumulative loss position. The book income for 2013 was significantly impacted by a reversal of the loan loss provision due to the improved credit quality of the loan portfolios. However, the U.S. mainland operations did not report taxable income for any of the three years evaluated. Future realization of the deferred tax assets ultimately depends on the existence of sufficient taxable income of the appropriate character within the carryforward period available under the tax law. The lack of taxable income together with the uncertainties regarding future performance represents strong negative evidence within management’s evaluation. After weighting of all positive and negative evidence management concluded, as of the reporting date, that it is more likely than not that the Corporation will not be able to realize any portion of the deferred tax assets, considering the criteria of ASC Topic 740.
At December 31, 2013, the Corporation’s net deferred tax assets related to its Puerto Rico operations amounted to $790 million
The Corporation’s Puerto Rico Banking operation is not in a cumulative three year loss position and has sustained profitability during the years 2012 and 2013, exclusive of the loss generated on the sales of non performing assets that took place in 2013 which is not a continuing condition of the operations. This is considered a strong piece of objectively verifiable positive evidence that out weights any negative evidence considered by management in the evaluation of the
251
realization of the deferred tax asset. Based on this evidence, the Corporation has concluded that it is more likely than not that such net deferred tax asset of the Puerto Rico operations will be realized.
Under the Puerto Rico Internal Revenue Code, the Corporation and its subsidiaries are treated as separate taxable entities and are not entitled to file consolidated tax returns. The Code provides a dividends-received deduction of 100% on dividends received from “controlled” subsidiaries subject to taxation in Puerto Rico and 85% on dividends received from other taxable domestic corporations.
The Corporation’s federal income tax provision for 2013 was $4.4 million (2012 – $4.4 million; 2011 – $ 1.1 million). The intercompany settlement of taxes paid is based on tax sharing agreements which generally allocate taxes to each entity based on a separate return basis.
The following table presents a reconciliation of unrecognized tax benefits.
| | | | |
| (In millions) | | | |
| |
| |
Balance at January 1, 2012 | | $ | 19.5 | |
| |
Additions for tax positions related to 2012 | | | 1.1 | |
| |
Reduction for tax positions of current year | | | (0.2) | |
| |
Reduction as a result of lapse of statute of limitations | | | (6.3) | |
| |
Reduction for tax positions of prior years | | | (0.7) | |
| |
| |
Balance at December 31, 2012 | | $ | 13.4 | |
| |
Additions for tax positions related to 2013 | | | 1.2 | |
| |
Additions for tax positions taken in prior years | | | 0.9 | |
| |
Reduction as a result of lapse of statute of limitations | | | (5.7) | |
| |
| |
Balance at December 31, 2013 | | $ | 9.8 | |
| |
At December 31, 2013, the total amount of interest recognized in the statement of financial condition approximated $3.6 million (2012 - $4.3 million). The total interest expense recognized during 2013 was $1.4 million (2012 - $1.2 million). Management determined that, as of December 31, 2013 and 2012, there was no need to accrue for the payment of penalties. The Corporation’s policy is to report interest related to unrecognized tax benefits in income tax expense, while the penalties, if any, are reported in other operating expenses in the consolidated statements of operations.
After consideration of the effect on U.S. federal tax of unrecognized U.S. state tax benefits, the total amount of unrecognized tax benefits, including U.S. and Puerto Rico that, if recognized, would affect the Corporation’s effective tax rate, was approximately $11.9 million at December 31, 2013 (2012 - $16.9 million).
The amount of unrecognized tax benefits may increase or decrease in the future for various reasons including adding amounts for current tax year positions, expiration of open income tax returns due to the statute of limitations, changes in management’s judgment about the level of uncertainty, status of examinations, litigation and legislative activity, and the addition or elimination of uncertain tax positions.
The Corporation and its subsidiaries file income tax returns in Puerto Rico, the U.S. federal jurisdiction, various U.S. states and political subdivisions, and foreign jurisdictions. As of December 31, 2013, the following years remain subject to examination: U.S. Federal jurisdiction – 2010 through 2013 and Puerto Rico – 2009 through 2013. The Corporation anticipates a reduction in the total amount of unrecognized tax benefits within the next 12 months, which could amount to approximately $7.6 million.
252
Note 41 – Supplemental disclosure on the consolidated statements of cash flows
Additional disclosures on cash flow information and non-cash activities for the years ended December 31, 2013, 2012 and 2011 are listed in the following table:
| | | | | | | | | | | | |
| (In thousands) | | 2013 | | | 2012 | | | 2011 | |
| |
| | | |
Income taxes paid | | $ | 51,047 | | | $ | 189,468 | | | $ | 171,818 | |
| | | |
Interest paid | | | 318,342 | | | | 388,250 | | | | 517,980 | |
| | | |
Non-cash activities: | | | | | | | | | | | | |
| | | |
Loans transferred to other real estate | | $ | 228,009 | | | $ | 294,993 | | | $ | 229,064 | |
| | | |
Loans transferred to other property | | | 33,997 | | | | 25,685 | | | | 26,148 | |
| |
| | | |
Total loans transferred to foreclosed assets | | | 262,006 | | | | 320,678 | | | | 255,212 | |
| | | |
Transfers from loans held-in-portfolio to loans held-for-sale | | | 448,143 | | | | 141,378 | | | | 122,326 | |
| | | |
Transfers from loans held-for-sale to loans held-in-portfolio | | | 27,016 | | | | 10,325 | | | | 28,535 | |
| | | |
Loans securitized into investment securities[1] | | | 1,391,594 | | | | 1,330,743 | | | | 1,101,800 | |
| | | |
Trades receivables from brokers and counterparties | | | 71,680 | | | | 137,542 | | | | 69,535 | |
| | | |
Recognition of mortgage servicing rights on securitizations or asset transfers | | | 19,262 | | | | 18,495 | | | | 19,971 | |
| | | |
Loans sold to a joint venture in exchange for an acquisition loan and an equity interest in the joint venture | | | 194,514 | | | | - | | | | 102,353 | |
| |
| |
[1] Includes loans securitized into trading securities and subsequently sold before year end. | | | | | |
| |
253
Note 42 – Segment reporting
The Corporation’s corporate structure consists of two reportable segments – Banco Popular de Puerto Rico and Banco Popular North America.
Management determined the reportable segments based on the internal reporting used to evaluate performance and to assess where to allocate resources. The segments were determined based on the organizational structure, which focuses primarily on the markets the segments serve, as well as on the products and services offered by the segments.
Banco Popular de Puerto Rico:
Given that Banco Popular de Puerto Rico constitutes a significant portion of the Corporation’s results of operations and total assets at December 31, 2013, additional disclosures are provided for the business areas included in this reportable segment, as described below:
| | — | | Commercial banking represents the Corporation’s banking operations conducted at BPPR, which are targeted mainly to corporate, small and middle size businesses. It includes aspects of the lending and depository businesses, as well as other finance and advisory services. BPPR allocates funds across business areas based on duration matched transfer pricing at market rates. This area also incorporates income related with the investment of excess funds, as well as a proportionate share of the investment function of BPPR. |
| | — | | Consumer and retail banking represents the branch banking operations of BPPR which focus on retail clients. It includes the consumer lending business operations of BPPR, as well as the lending operations of Popular Auto and Popular Mortgage. Popular Auto focuses on auto and lease financing, while Popular Mortgage focuses principally on residential mortgage loan originations. The consumer and retail banking area also incorporates income related with the investment of excess funds from the branch network, as well as a proportionate share of the investment function of BPPR. |
| | — | | Other financial services include the trust and asset management service units of BPPR, the brokerage and investment banking operations of Popular Securities, and the insurance agency and reinsurance businesses of Popular Insurance, Popular Insurance V.I., Popular Risk Services, and Popular Life Re. Most of the services that are provided by these subsidiaries generate profits based on fee income. |
Banco Popular North America:
Banco Popular North America’s reportable segment consists of the banking operations of BPNA, E-LOAN, Popular Equipment Finance, Inc. and Popular Insurance Agency, U.S.A. BPNA operates through a retail branch network in the U.S. mainland under the name of Popular Community Bank, while E-LOAN supports BPNA’s deposit gathering through its online platform. All direct lending activities at E-LOAN were ceased during the fourth quarter of 2008. Popular Equipment Finance, Inc. also holds a running-off loan portfolio as this subsidiary ceased originating loans during 2009. Popular Insurance Agency, U.S.A. offers investment and insurance services across the BPNA branch network.
The Corporate group consists primarily of the holding companies: Popular, Inc., Popular North America, Popular International Bank and certain of the Corporation’s investments accounted for under the equity method, including EVERTEC and Centro Financiero BHD, S.A. The Corporate group also includes the expenses of certain corporate areas that are identified as critical to the organization: Finance, Risk Management and Legal.
The accounting policies of the individual operating segments are the same as those of the Corporation. Transactions between reportable segments are primarily conducted at market rates, resulting in profits that are eliminated for reporting consolidated results of operations.
The tables that follow present the results of operations and total assets by reportable segments:
| | | | | | | | | | | | |
| |
| December 31, 2013 | |
| |
| | | |
| (In thousands) | | Banco Popular de Puerto Rico | | | Banco Popular North America | | | Intersegment Eliminations | |
| |
Net interest income | | $ | 1,260,537 | | | $ | 280,271 | | | $ | - | |
Provision (reversal of provision) for loan losses | | | 616,883 | | | | (14,718) | | | | - | |
254
| | | | | | | | | | | | |
Non-interest income | | | 281,894 | | | | 55,808 | | | | - | |
Amortization of intangibles | | | 7,162 | | | | 2,721 | | | | - | |
Depreciation expense | | | 38,282 | | | | 9,237 | | | | - | |
Other operating expenses | | | 943,444 | | | | 219,493 | | | | - | |
Income tax (benefit) expense | | | (236,898) | | | | 2,795 | | | | - | |
| |
| | | |
Net income | | $ | 173,558 | | | $ | 116,551 | | | $ | - | |
| |
| | | |
Segment assets | | $ | 26,883,073 | | | $ | 8,724,784 | | | $ | (24,609) | |
| |
| | | | | | | | | | | | | | | | |
| |
| December 31, 2013 | |
| |
| (In thousands) | | Reportable Segments | | | Corporate | | | Eliminations | | | Total Popular, Inc. | |
| |
Net interest income (expense) | | $ | 1,540,808 | | | $ | (108,228) | | | $ | - | | | $ | 1,432,580 | |
Provision for loan losses | | | 602,165 | | | | 398 | | | | - | | | | 602,563 | |
Non-interest income | | | 337,702 | | | | 475,663 | | | | (2,796) | | | | 810,569 | |
Amortization of intangibles | | | 9,883 | | | | - | | | | - | | | | 9,883 | |
Depreciation expense | | | 47,519 | | | | 643 | | | | - | | | | 48,162 | |
Loss on early extinguishment of debt | | | - | | | | 3,388 | | | | - | | | | 3,388 | |
Other operating expenses | | | 1,162,937 | | | | 70,997 | | | | (2,781) | | | | 1,231,153 | |
Income tax benefit | | | (234,103) | | | | (17,082) | | | | (142) | | | | (251,327) | |
| |
| | | | |
Net income | | $ | 290,109 | | | $ | 309,091 | | | $ | 127 | | | $ | 599,327 | |
| |
| | | | |
Segment assets | | $ | 35,583,248 | | | $ | 5,495,498 | | | $ | (5,329,413) | | | $ | 35,749,333 | |
| |
| | | | | | | | | | | | |
| |
| December 31, 2012 | |
| |
| (In thousands) | | Banco Popular de Puerto Rico | | | Banco Popular North America | | | Intersegment Eliminations | |
| |
Net interest income | | $ | 1,199,210 | | | $ | 281,686 | | | $ | - | |
Provision for loan losses | | | 356,496 | | | | 52,041 | | | | - | |
Non-interest income | | | 401,417 | | | | 56,864 | | | | - | |
Amortization of intangibles | | | 7,351 | | | | 2,721 | | | | - | |
Depreciation expense | | | 37,321 | | | | 8,157 | | | | - | |
Loss on early extinguishment of debt | | | 25,196 | | | | - | | | | - | |
Other operating expenses | | | 903,677 | | | | 225,893 | | | | - | |
Income tax (benefit) expense | | | (20,245) | | | | 3,745 | | | | - | |
| |
| | | |
Net income | | $ | 290,831 | | | $ | 45,993 | | | $ | - | |
| |
| | | |
Segment assets | | $ | 27,600,235 | | | $ | 8,651,790 | | | $ | (31,792) | |
| |
| | | | | | | | | | | | | | | | |
| |
| December 31, 2012 | |
| |
| (In thousands) | | Reportable Segments | | | Corporate | | | Eliminations | | | Total Popular, Inc. | |
| |
Net interest income (expense) | | $ | 1,480,896 | | | $ | (104,750) | | | $ | 487 | | | $ | 1,376,633 | |
Provision for loan losses | | | 408,537 | | | | 404 | | | | - | | | | 408,941 | |
Non-interest income | | | 458,281 | | | | 76,156 | | | | (3,225) | | | | 531,212 | |
Amortization of intangibles | | | 10,072 | | | | - | | | | - | | | | 10,072 | |
Depreciation expense | | | 45,478 | | | | 1,258 | | | | - | | | | 46,736 | |
Loss on early extinguishment of debt | | | 25,196 | | | | - | | | | - | | | | 25,196 | |
Other operating expenses | | | 1,129,570 | | | | 71,579 | | | | (3,121) | | | | 1,198,028 | |
Income tax benefit | | | (16,500) | | | | (9,945) | | | | 42 | | | | (26,403) | |
| |
| | | | |
Net income (loss) | | $ | 336,824 | | | $ | (91,890) | | | $ | 341 | | | $ | 245,275 | |
| |
| | | | |
Segment assets | | $ | 36,220,233 | | | $ | 5,308,327 | | | $ | (5,021,025) | | | $ | 36,507,535 | |
| |
| | | | | | | | | | | | |
| |
| December 31, 2011 | |
| |
| (In thousands) | | Banco Popular de Puerto Rico | | | Banco Popular North America | | | Intersegment Eliminations | |
| |
Net interest income | | $ | 1,240,700 | | | $ | 295,602 | | | $ | - | |
Provision for loan losses | | | 487,238 | | | | 88,482 | | | | - | |
255
| | | | | | | | | | | | |
Non-interest income | | | 488,459 | | | | 74,896 | | | | - | |
Amortization of intangibles | | | 6,933 | | | | 2,721 | | | | - | |
Depreciation expense | | | 37,180 | | | | 7,665 | | | | - | |
Loss on early extinguishment of debt | | | 693 | | | | - | | | | - | |
Other operating expenses | | | 845,821 | | | | 237,967 | | | | - | |
Income tax expense | | | 119,819 | | | | 3,745 | | | | - | |
| |
| | | |
Net income | | $ | 231,475 | | | $ | 29,918 | | | $ | - | |
| |
| | | |
Segment assets | | $ | 28,423,064 | | | $ | 8,581,209 | | | $ | (26,447) | |
| |
| | | | | | | | | | | | | | | | |
| |
December 31, 2011 | |
| |
| | | Reportable | | | | | | | | | | |
| (In thousands) | | Segments | | | Corporate | | | Eliminations | | | Total Popular, Inc. | |
| |
Net interest income (expense) | | $ | 1,536,302 | | | $ | (101,607) | | | $ | 650 | | | $ | 1,435,345 | |
Provision for loan losses | | | 575,720 | | | | - | | | | - | | | | 575,720 | |
Non-interest income | | | 563,355 | | | | 64,642 | | | | (2,571) | | | | 625,426 | |
Amortization of intangibles | | | 9,654 | | | | - | | | | - | | | | 9,654 | |
Depreciation expense | | | 44,845 | | | | 1,601 | | | | - | | | | 46,446 | |
Loss on early extinguishment of debt | | | 693 | | | | 8,000 | | | | - | | | | 8,693 | |
Other operating expenses | | | 1,083,788 | | | | 73,415 | | | | (3,197) | | | | 1,154,006 | |
Income tax expense (benefit) | | | 123,564 | | | | (9,145) | | | | 508 | | | | 114,927 | |
| |
| | | | |
Net income (loss) | | $ | 261,393 | | | $ | (110,836) | | | $ | 768 | | | $ | 151,325 | |
| |
| | | | |
Segment assets | | $ | 36,977,826 | | | $ | 5,348,638 | | | $ | (4,978,032) | | | $ | 37,348,432 | |
| |
Additional disclosures with respect to the Banco Popular de Puerto Rico reportable segment are as follows:
| | | | | | | | | | | | | | | | | | | | |
| |
| December 31, 2013 | |
| |
| Banco Popular de Puerto Rico | |
| |
| (In thousands) | | Commercial Banking | | | Consumer and Retail Banking | | | Other Financial Services | | | Eliminations | | | Total Banco Popular de Puerto Rico | |
| |
| | | | | |
Net interest income | | $ | 493,836 | | | $ | 757,039 | | | $ | 9,662 | | | $ | - | | | $ | 1,260,537 | |
| | | | | |
Provision for loan losses | | | 180,228 | | | | 436,655 | | | | - | | | | - | | | | 616,883 | |
| | | | | |
Non-interest (expense) income | | | (41,362) | | | | 224,080 | | | | 99,243 | | | | (67) | | | | 281,894 | |
| | | | | |
Amortization of intangibles | | | 4 | | | | 6,837 | | | | 321 | | | | - | | | | 7,162 | |
| | | | | |
Depreciation expense | | | 16,083 | | | | 20,981 | | | | 1,218 | | | | - | | | | 38,282 | |
| | | | | |
Other operating expenses | | | 296,319 | | | | 578,903 | | | | 68,289 | | | | (67) | | | | 943,444 | |
| | | | | |
Income tax (benefit) expense | | | (66,747) | | | | (182,471) | | | | 12,320 | | | | - | | | | (236,898) | |
| |
| | | | | |
Net income | | $ | 26,587 | | | $ | 120,214 | | | $ | 26,757 | | | $ | - | | | $ | 173,558 | |
| |
| | | | | |
Segment assets | | $ | 10,803,992 | | | $ | 18,083,293 | | | $ | 576,299 | | | $ | (2,580,511) | | | $ | 26,883,073 | |
| |
|
| |
| December 31, 2012 | |
| |
| Banco Popular de Puerto Rico | |
| |
| (In thousands) | | Commercial Banking | | | Consumer and Retail Banking | | | Other Financial Services | | | Eliminations | | | Total Banco Popular de Puerto Rico | |
| |
Net interest income | | $ | 424,467 | | | $ | 762,857 | | | $ | 11,882 | | | $ | 4 | | | $ | 1,199,210 | |
Provision for loan losses | | | 149,597 | | | | 206,899 | | | | - | | | | - | | | | 356,496 | |
Non-interest income | | | 19,426 | | | | 269,190 | | | | 112,949 | | | | (148) | | | | 401,417 | |
Amortization of intangibles | | | 13 | | | | 6,833 | | | | 505 | | | | - | | | | 7,351 | |
Depreciation expense | | | 16,840 | | | | 19,522 | | | | 959 | | | | - | | | | 37,321 | |
Loss on early extinguishment of debt | | | 8,037 | | | | 17,159 | | | | - | | | | - | | | | 25,196 | |
Other operating expenses | | | 279,358 | | | | 555,797 | | | | 68,670 | | | | (148) | | | | 903,677 | |
Income tax (benefit) expense | | | (33,068) | | | | (1,460) | | | | 14,281 | | | | 2 | | | | (20,245) | |
| |
256
| | | | | | | | | | | | | | | | | | | | |
| |
| | | | | |
Net income | | $ | 23,116 | | | $ | 227,297 | | | $ | 40,416 | | | $ | 2 | | | $ | 290,831 | |
| |
| | | | | |
Segment assets | | $ | 12,770,793 | | | $ | 19,668,009 | | | $ | 632,676 | | | $ | (5,471,243) | | | $ | 27,600,235 | |
| |
|
| |
December 31, 2011 | |
| |
Banco Popular de Puerto Rico | |
| |
| (In thousands) | | Commercial Banking | | | Consumer and Retail Banking | | | Other Financial Services | | | Eliminations | | | Total Banco Popular de Puerto Rico | |
| |
Net interest income | | $ | 501,946 | | | $ | 727,050 | | | $ | 11,600 | | | $ | 104 | | | $ | 1,240,700 | |
Provision for loan losses | | | 356,905 | | | | 130,333 | | | | - | | | | - | | | | 487,238 | |
Non-interest income | | | 173,764 | | | | 209,100 | | | | 105,632 | | | | (37) | | | | 488,459 | |
Amortization of intangibles | | | 103 | | | | 6,175 | | | | 655 | | | | - | | | | 6,933 | |
Depreciation expense | | | 16,928 | | | | 19,297 | | | | 955 | | | | - | | | | 37,180 | |
Loss on early extinguishment of debt | | | 693 | | | | - | | | | - | | | | - | | | | 693 | |
Other operating expenses | | | 257,830 | | | | 523,423 | | | | 64,759 | | | | (191) | | | | 845,821 | |
Income tax expense | | | 38,332 | | | | 67,678 | | | | 13,707 | | | | 102 | | | | 119,819 | |
| |
| | | | | |
Net income | | $ | 4,919 | | | $ | 189,244 | | | $ | 37,156 | | | $ | 156 | | | $ | 231,475 | |
| |
| | | | | |
Segment assets | | $ | 13,643,862 | | | $ | 20,035,526 | | | $ | 1,225,247 | | | $ | (6,481,571) | | | $ | 28,423,064 | |
| |
Additional disclosures with respect to the Banco Popular North America reportable segments are as follows:
| | | | | | | | | | | | | | | | |
| |
| December 31, 2013 | |
| |
| Banco Popular North America | |
| |
| (In thousands) | | Banco Popular North America | | | E-LOAN | | | Eliminations | | | Total Banco
Popular North America | |
| |
Net interest income | | $ | 277,235 | | | $ | 3,036 | | | $ | - | | | $ | 280,271 | |
(Reversal of provision) provision for loan losses | | | (17,541) | | | | 2,823 | | | | - | | | | (14,718) | |
Non-interest income | | | 55,389 | | | | 419 | | | | - | | | | 55,808 | |
Amortization of intangibles | | | 2,721 | | | | - | | | | - | | | | 2,721 | |
Depreciation expense | | | 9,237 | | | | - | | | | - | | | | 9,237 | |
Other operating expenses | | | 217,053 | | | | 2,440 | | | | - | | | | 219,493 | |
Income tax expense (benefit) | | | 4,012 | | | | (1,217) | | | | - | | | | 2,795 | |
| |
| | | | |
Net income (loss) | | $ | 117,142 | | | $ | (591) | | | $ | - | | | $ | 116,551 | |
| |
| | | | |
Segment assets | | $ | 9,453,934 | | | $ | 315,712 | | | $ | (1,044,862) | | | $ | 8,724,784 | |
| |
|
| |
| December 31, 2012 | |
| |
| Banco Popular North America | |
| |
| (In thousands) | | Banco Popular North America | | | E-LOAN | | | Eliminations | | | Total Banco Popular North America | |
| |
Net interest income | | $ | 278,228 | | | $ | 3,458 | | | $ | - | | | $ | 281,686 | |
Provision for loan losses | | | 36,841 | | | | 15,200 | | | | - | | | | 52,041 | |
Non-interest income | | | 53,749 | | | | 3,115 | | | | - | | | | 56,864 | |
Amortization of intangibles | | | 2,721 | | | | - | | | | - | | | | 2,721 | |
Depreciation expense | | | 8,157 | | | | - | | | | - | | | | 8,157 | |
Other operating expenses | | | 223,069 | | | | 2,824 | | | | - | | | | 225,893 | |
Income tax expense | | | 3,745 | | | | - | | | | - | | | | 3,745 | |
| |
| | | | |
Net income (loss) | | $ | 57,444 | | | $ | (11,451) | | | $ | - | | | $ | 45,993 | |
| |
| | | | |
Segment assets | | $ | 9,378,779 | | | $ | 367,362 | | | $ | (1,094,351) | | | $ | 8,651,790 | |
| |
257
| | | | | | | | | | | | | | | | |
| |
Banco Popular North America | |
| |
| (In thousands) | | Banco Popular North America | | | E-LOAN | | | Eliminations | | | Total Banco Popular North America | |
| |
Net interest income | | $ | 294,224 | | | $ | 1,378 | | | $ | - | | | $ | 295,602 | |
Provision for loan losses | | | 61,753 | | | | 26,729 | | | | - | | | | 88,482 | |
Non-interest income | | | 69,269 | | | | 5,627 | | | | - | | | | 74,896 | |
Amortization of intangibles | | | 2,721 | | | | - | | | | - | | | | 2,721 | |
Depreciation expense | | | 7,665 | | | | - | | | | - | | | | 7,665 | |
Other operating expenses | | | 229,998 | | | | 7,969 | | | | - | | | | 237,967 | |
Income tax expense | | | 3,745 | | | | - | | | | - | | | | 3,745 | |
| |
| | | | |
Net income (loss) | | $ | 57,611 | | | $ | (27,693 | ) | | $ | - | | | $ | 29,918 | |
| |
| | | | |
Segment assets | | $ | 9,289,507 | | | $ | 418,436 | | | $ | (1,126,734 | ) | | $ | 8,581,209 | |
| |
| | | | | | | | | | | | |
Geographic Information | |
| | | |
| (In thousands) | | 2013 | | | 2012 | | | 2011 | |
| |
| | | |
Revenues:[1] | | | | | | | | | | | | |
| | | |
Puerto Rico | | $ | 1,838,657 | | | $ | 1,492,796 | | | $ | 1,620,020 | |
| | | |
United States | | | 325,857 | | | | 316,906 | | | | 347,460 | |
| | | |
Other | | | 78,635 | | | | 98,143 | | | | 93,291 | |
| |
| | | |
Total consolidated revenues | | $ | 2,243,149 | | | $ | 1,907,845 | | | $ | 2,060,771 | |
| |
[1] Total revenues include net interest income, service charges on deposit accounts, other service fees, mortgage banking activities, net gain (loss) and valuation adjustments on investment securities, trading account (loss) profit, net (loss) gain on sale of loans and valuation adjustments on loans held-for-sale, adjustments to indemnity reserves on loans sold, FDIC loss share (expense) income and other operating income.
| | | | | | | | | | | | | | | | | | | | |
Selected Balance Sheet Information | |
| | | | | | | |
| (In thousands) | | 2013 | | | | | | | 2012 | | | | | | | 2011 | |
| |
| | | | | | | |
Puerto Rico | | | | | | | | | | | | | | | | | | | | |
| | | | | | | |
Total assets | | $ | 25,714,758 | | | | | | | $ | 26,582,248 | | | | | | | $ | 27,410,644 | |
| | | | | | | |
Loans | | | 18,107,764 | | | | | | | | 18,484,977 | | | | | | | | 18,594,751 | |
| | | | | | | |
Deposits | | | 19,730,408 | | | | | | | | 19,984,830 | | | | | | | | 20,696,606 | |
| | | | | | | |
United States | | | | | | | | | | | | | | | | | | | | |
| | | | | | | |
Total assets | | $ | 8,897,535 | | | | | | | $ | 8,816,143 | | | | | | | $ | 8,708,709 | |
| | | | | | | |
Loans | | | 5,839,115 | | | | | | | | 5,852,705 | | | | | | | | 5,845,359 | |
| | | | | | | |
Deposits | | | 6,007,159 | | | | | | | | 6,049,168 | | | | | | | | 6,151,959 | |
| | | | | | | |
Other | | | | | | | | | | | | | | | | | | | | |
| | | | | | | |
Total assets | | $ | 1,137,040 | | | | | | | $ | 1,109,144 | | | | | | | $ | 1,229,079 | |
| | | | | | | |
Loans | | | 759,840 | | | | | | | | 755,950 | | | | | | | | 874,282 | |
| | | | | | | |
Deposits[1] | | | 973,578 | | | | | | | | 966,615 | | | | | | | | 1,093,562 | |
| |
[1] Represents deposits from BPPR operations located in the US and British Virgin Islands. | |
| |
Note 43 - Subsequent events
Subsequent events are events and transactions that occur after the balance sheet date but before the financial statements are issued. The effects of subsequent events and transactions are recognized in the financial statements when they provide additional evidence about conditions that existed at the balance sheet date. The Corporation has evaluated events and transactions occurring subsequent to December 31, 2013.
On February 1, 2014, Centro Financiero BHD (“BHD”), one of the Corporation’s equity method investees based in the Dominican Republic, completed a merger transaction in which it acquired the net assets of Centro Financiero León. Centro Financiero León was the holding company of Banco León, the fourth largest bank in terms of assets in the Dominican Republic. In connection with the transaction, BHD issued additional shares which diluted the Corporation’s equity participation from 19.99% to 15.79%. As a result of this transaction, the Corporation expects to recognize a net gain during the first quarter of 2014, due to BHD’s increase in net assets. The gain would be partially offset by the impact of the reclassification from other comprehensive income into earnings of the cumulative foreign currency translation adjustment due to the reduction in the Corporation’s ownership percentage.
As of the date these financial statements are being issued, the amount of the net gain cannot be determined due to the difference in the accounting basis at which this transaction is recorded in the Dominican Republic. The Corporation’s investment in BHD had a book value of $84 million as of December 31, 2013.
Note 44 - Popular, Inc. (holding company only) financial information
The following condensed financial information presents the financial position of Popular, Inc. Holding Company only at December 31, 2013 and 2012, and the results of its operations and cash flows for each of the three years in the period ended December 31, 2013.
| | | | | | | | |
| Condensed Statements of Condition | | | | | | |
| | | December 31, | |
| |
(In thousands) | | 2013 | | | 2012 | |
| |
| | |
ASSETS | | | | | | | | |
| | |
Cash and due from banks (includes $10,411 due from bank subsidiary (2012 - $915)) | | $ | 10,595 | | | $ | 1,103 | |
| | |
Money market investments | | | 18,721 | | | | 18,574 | |
258
| | | | | | | | |
| | |
Trading account securities | | | 1,353 | | | | 1,259 | |
| | |
Investment securities available-for-sale, at fair value (2012 - includes $38,675 in securities from affiliate at fair value) | | | 204 | | | | 42,383 | |
| | |
Investment securities held-to-maturity, at amortized cost (2012 - includes $185,000 in subordinated notes from BPPR) | | | - | | | | 185,000 | |
| | |
Other investment securities, at lower of cost or realizable value (includes $9,725 in common securities from statutory trusts)[1] | | | 10,850 | | | | 10,850 | |
| | |
Investment in BPPR and subsidiaries, at equity | | | 3,127,745 | | | | 2,809,521 | |
| | |
Investment in Popular North America and subsidiaries, at equity | | | 1,511,335 | | | | 1,244,732 | |
| | |
Investment in other non-bank subsidiaries, at equity | | | 217,486 | | | | 231,704 | |
| | |
Advances to subsidiaries | | | 519,500 | | | | 230,300 | |
| | |
Loans to affiliates | | | - | | | | 53,589 | |
| | |
Other loans | | | 1,592 | | | | 2,191 | |
| | |
Less - Allowance for loan losses | | | 304 | | | | 241 | |
| | |
Premises and equipment | | | 2,135 | | | | 2,495 | |
| | |
Investment in equity method investees | | | 41,248 | | | | 93,128 | |
| | |
Other assets (includes $1,085 due from subsidiaries and affiliate (2012 - $2,007)) | | | 25,947 | | | | 21,876 | |
| |
| | |
Total assets | | $ | 5,488,407 | | | $ | 4,948,464 | |
| |
LIABILITIES AND STOCKHOLDERS’ EQUITY | | | | | | | | |
| | |
Notes payable | | $ | 822,351 | | | $ | 790,282 | |
| | |
Other liabilities (includes $929 due to subsidiaries and affiliate (2012 - $1,558)) | | | 39,906 | | | | 48,182 | |
| | |
Stockholders’ equity | | | 4,626,150 | | | | 4,110,000 | |
| |
| | |
Total liabilities and stockholders’ equity | | $ | 5,488,407 | | | $ | 4,948,464 | |
| |
|
[1] Refer to Note 23 to the consolidated financial statements for information on the statutory trusts. | |
| |
| | | | | | | | | | | | |
| Condensed Statements of Operations | | | | | | | | | |
| | | Year ended December 31, | |
| |
(In thousands) | | 2013 | | | 2012 | | | 2011 | |
| |
| | | |
Income: | | | | | | | | | | | | |
| | | |
Dividends from subsidiaries | | $ | 37,000 | | | $ | 5,000 | | | $ | 20,000 | |
| | | |
Interest income (includes $17,551 due from subsidiaries and affiliates (2012 - $22,891; 2011 - $24,800)) | | | 17,793 | | | | 23,038 | | | | 25,145 | |
| | | |
Earnings from investments in equity method investees | | | 17,308 | | | | 40,505 | | | | 14,186 | |
| | | |
Other operating income | | | 425,968 | | | | 1,461 | | | | 8,959 | |
| | | |
Gain on sale and valuation adjustment of investment securities | | | 7,966 | | | | - | | | | - | |
| | | |
Trading account profit | | | 161 | | | | 214 | | | | - | |
| |
| | | |
Total income | | | 506,196 | | | | 70,218 | | | | 68,290 | |
| |
| | | |
Expenses: | | | | | | | | | | | | |
| | | |
Interest expense | | | 101,245 | | | | 95,898 | | | | 94,615 | |
| | | |
Provision for loan losses | | | 398 | | | | 404 | | | | - | |
| | | |
Loss on early extinguishment of debt | | | - | | | | - | | | | 8,000 | |
| | | |
Operating expenses (include expenses for services provided by subsidiaries and affiliate of $8,412 (2012 - $9,487; 2011 - $8,459)), net of reimbursement by subsidiaries for services provided by parent of $60,402 (2012 - $58,577; 2011 - $56,671) | | | 700 | | | | 1,705 | | | | 1,066 | |
| |
| | | |
Total expenses | | | 102,343 | | | | 98,007 | | | | 103,681 | |
| |
| | | |
Income (loss) before income taxes and equity in undistributed earnings of subsidiaries | | | 403,853 | | | | (27,789) | | | | (35,391) | |
| | | |
Income taxes | | | 1,412 | | | | 1,702 | | | | 2,786 | |
| |
| | | |
Income (loss) before equity in undistributed earnings of subsidiaries | | | 402,441 | | | | (29,491) | | | | (38,177) | |
| | | |
Equity in undistributed earnings of subsidiaries | | | 196,886 | | | | 274,766 | | | | 189,502 | |
| |
| | | |
Net income | | $ | 599,327 | | | $ | 245,275 | | | $ | 151,325 | |
| |
| | | |
Comprehensive income, net of tax | | $ | 513,450 | | | $ | 184,955 | | | $ | 114,738 | |
| |
|
| Condensed Statements of Cash Flows |
259
| | | | | | | | | | | | |
| | | Year ended December 31, | |
| |
(In thousands) | | 2013 | | | 2012 | | | 2011 | |
| |
| | | |
Cash flows from operating activities: | | | | | | | | | | | | |
| | | |
Net income | | $ | 599,327 | | | $ | 245,275 | | | $ | 151,325 | |
| |
| | | |
Adjustments to reconcile net income to net cash used in operating activities: | | | | | | | | | | | | |
| | | |
Equity in undistributed earnings of subsidiaries and dividends from subsidiaries | | | (196,886) | | | | (274,766) | | | | (189,502) | |
| | | |
Provision for loan losses | | | 398 | | | | 404 | | | | - | |
| | | |
Net accretion of discounts and amortization of premiums and deferred fees | | | 30,467 | | | | 29,058 | | | | 25,042 | |
| | | |
Earnings from investments under the equity method | | | (17,308) | | | | (40,505) | | | | (14,186) | |
| | | |
Deferred income tax (benefit) expense | | | (10,937) | | | | (14,109) | | | | 13,965 | |
| | | |
(Gain) loss on: | | | | | | | | | | | | |
| | | |
Sale and valuation adjustments of investment securities | | | (2,110) | | | | - | | | | - | |
| | | |
Sale of equity method investments | | | - | | | | - | | | | (5,493) | |
| | | |
Sale of stock in equity method investee | | | (416,113) | | | | - | | | | - | |
| | | |
Net (increase) decrease in: | | | | | | | | | | | | |
| | | |
Trading securities | | | (94) | | | | (1,259) | | | | - | |
| | | |
Other assets | | | 7,747 | | | | 9,351 | | | | 7,563 | |
| | | |
Net increase (decrease) in: | | | | | | | | | | | | |
| | | |
Interest payable | | | 2,704 | | | | - | | | | (3,467) | |
| | | |
Other liabilities | | | (5,507) | | | | 2,581 | | | | (84,434) | |
| |
| | | |
Total adjustments | | | (607,639) | | | | (289,245) | | | | (250,512) | |
| |
| | | |
Net cash used in operating activities | | | (8,312) | | | | (43,970) | | | | (99,187) | |
| |
| | | |
Cash flows from investing activities: | | | | | | | | | | | | |
| | | |
Net (increase) decrease in money market investments | | | (147) | | | | 23,665 | | | | (42,237) | |
| | | |
Purchases of investment securities: | | | | | | | | | | | | |
| | | |
Held-to-maturity | | | - | | | | - | | | | (37,093) | |
| | | |
Proceeds from calls, paydowns, maturities and redemptions of investment securities: | | | | | | | | | | | | |
| | | |
Available-for-sale | | | 35,000 | | | | - | | | | - | |
| | | |
Held-to-maturity | | | - | | | | - | | | | 62,980 | |
| | | |
Proceeds from sale of investment securities: | | | | | | | | | | | | |
| | | |
Available-for-sale | | | 5,438 | | | | - | | | | - | |
| | | |
Capital contribution to subsidiaries | | | (272,500) | | | | (103,500) | | | | - | |
| | | |
Net (increase) decrease in advances to subsidiaries and affiliates | | | (234,014) | | | | (36,400) | | | | 226,546 | |
| | | |
Net repayments (originations) on other loans | | | 269 | | | | 138 | | | | (131) | |
| | | |
Return of capital from equity method investments | | | - | | | | 150,194 | | | | - | |
| | | |
Net proceeds from sale of equity method investments | | | - | | | | - | | | | (10,690) | |
| | | |
Proceeds from sale of stock in equity method investee | | | 481,377 | | | | - | | | | - | |
| | | |
Acquisition of premises and equipment | | | (352) | | | | (691) | | | | (594) | |
| | | |
Proceeds from sale of: | | | | | | | | | | | | |
| | | |
Premises and equipment | | | 33 | | | | 73 | | | | 135 | |
| |
| | | |
Net cash provided by investing activities | | | 15,104 | | | | 33,479 | | | | 198,916 | |
| |
| | | |
Cash flows from financing activities: | | | | | | | | | | | | |
| | | |
Payments of notes payable and subordinated notes | | | - | | | | - | | | | (100,000) | |
| | | |
Proceeds from issuance of common stock | | | 6,860 | | | | 9,402 | | | | 7,690 | |
| | | |
Dividends paid | | | (3,723) | | | | (3,723) | | | | (3,723) | |
| | | |
Net payments for repurchase of common stock | | | (437) | | | | (450) | | | | (483) | |
| | | |
Return of capital | | | - | | | | - | | | | 1,514 | |
| |
| | | |
Net cash provided by (used in) financing activities | | | 2,700 | | | | 5,229 | | | | (95,002) | |
| |
| | | |
Net increase (decrease) in cash and due from banks | | | 9,492 | | | | (5,262) | | | | 4,727 | |
| | | |
Cash and due from banks at beginning of period | | | 1,103 | | | | 6,365 | | | | 1,638 | |
| |
| | | |
Cash and due from banks at end of period | | $ | 10,595 | | | $ | 1,103 | | | $ | 6,365 | |
| |
Popular, Inc. (parent company only) received dividend distributions from its direct equity method investees amounting to $4 million for the year ended December 31, 2013 (2012 - net capital distributions of $155 million, including $5 million in dividend distributions).
260
Notes payable represent junior subordinated debentures issued by the Corporation that are associated to capital securities issued by the Popular Capital Trust I, Popular Capital Trust II and Popular Capital Trust III. Refer to Note 23 for a description of significant provisions related to these junior subordinated debentures. The following table presents the aggregate amounts by contractual maturities of notes payable at December 31, 2013:
| | | | |
| Year | | (In thousands) | |
| |
| |
2014 | | $ | - | |
| |
2015 | | | - | |
| |
2016 | | | - | |
| |
2017 | | | - | |
| |
2018 | | | - | |
| |
Later years | | | 290,811 | |
| |
No stated maturity | | | 936,000 | |
| |
| |
Subtotal | | | 1,226,811 | |
| |
Less: Discount | | | (404,460) | |
| |
| |
Total | | $ | 822,351 | |
| |
261
Note 45 – Condensed consolidating financial information of guarantor and issuers of registered guaranteed securities
The following condensed consolidating financial information presents the financial position of Popular, Inc. Holding Company (“PIHC”) (parent only), Popular North America, Inc. (“PNA”) and all other subsidiaries of the Corporation at December 31, 2013 and 2012, and the results of their operations and cash flows for periods ended December 31, 2013, 2012 and 2011.
PNA is an operating, wholly-owned subsidiary of PIHC and is the holding company of its wholly-owned subsidiaries: Equity One, Inc. and Banco Popular North America (“BPNA”), including BPNA’s wholly-owned subsidiaries Popular Equipment Finance, Inc., Popular Insurance Agency, U.S.A., and E-LOAN, Inc.
PIHC fully and unconditionally guarantees all registered debt securities issued by PNA.
Popular International Bank, Inc. (“PIBI”) is a wholly-owned subsidiary of PIHC and is the holding company of its wholly-owned subsidiaries Popular Insurance V.I., Inc. In July 2013, the Corporation completed the sale of Tarjetas y Transacciones en Red Tranred,C.A., which was a wholly owned subsidiary of PIBI. Effective January 1, 2012, PNA, which was a wholly-owned subsidiary of PIBI prior to that date, became a direct wholly-owned subsidiary of PIHC after an internal reorganization. Since the internal reorganization, PIBI is no longer a bank holding company and is no longer a potential issuer of the Corporation’s debt securities. PIBI has no outstanding registered debt securities that would also be guaranteed by PIHC.
A potential source of income for PIHC consists of dividends from BPPR and BPNA. Under existing federal banking regulations any dividend from BPPR or BPNA to the PIHC could be made if the total of all dividends declared by each entity during the calendar year would not exceed the total of its net income for that year, as defined by the Federal Reserve Board, combined with its retained net income for the preceding two years, less any required transfers to surplus or to a fund for the retirement of any preferred stock. At December 31, 2013, BPPR could have declared a dividend of approximately $504 million (December 31, 2012—$404 million). However, on July 25, 2011, PIHC and BPPR entered into a Memorandum of Understanding with the Federal Reserve Bank of New York and the Office of the Commissioner of Financial Institutions of Puerto Rico that requires the approval of these entities prior to the payment of any dividends by BPPR to PIHC. BPNA could not declare any dividends without the approval of the Federal Reserve Board.
262
Condensed Consolidating Statement of Financial Condition
| | | | | | | | | | | | | | | | | | | | | | | | |
| | | At December 31, 2013 | |
| |
| (In thousands) | | Popular Inc. Holding Co. | | | PNA Holding Co. | | | | | All other subsidiaries and eliminations | | | | | Elimination entries | | | Popular, Inc. Consolidated | |
| |
| | | | | | | |
Assets: | | | | | | | | | | | | | | | | | | | | | | | | |
| | | | | | | |
Cash and due from banks | | $ | 10,595 | | | $ | 616 | | | | | $ | 422,967 | | | | | $ | (10,967) | | | $ | 423,211 | |
| | | | | | | |
Money market investments | | | 18,721 | | | | 4,804 | | | | | | 839,732 | | | | | | (4,804) | | | | 858,453 | |
| | | | | | | |
Trading account securities, at fair value | | | 1,353 | | | | - | | | | | | 338,390 | | | | | | - | | | | 339,743 | |
| | | | | | | |
Investment securities available-for-sale, at fair value | | | 204 | | | | - | | | | | | 5,294,596 | | | | | | - | | | | 5,294,800 | |
| | | | | | | |
Investment securities held-to-maturity, at amortized cost | | | - | | | | - | | | | | | 140,496 | | | | | | - | | | | 140,496 | |
| | | | | | | |
Other investment securities, at lower of cost or realizable value | | | 10,850 | | | | 4,492 | | | | | | 166,410 | | | | | | - | | | | 181,752 | |
| | | | | | | |
Investment in subsidiaries | | | 4,856,566 | | | | 1,670,809 | | | | | | - | | | | | | (6,527,375) | | | | - | |
| | | | | | | |
Loans held-for-sale, at lower of cost or fair value | | | - | | | | - | | | | | | 110,426 | | | | | | - | | | | 110,426 | |
| |
| | | | | | | |
Loans held-in-portfolio: | | | | | | | | | | | | | | | | | | | | | | | | |
| | | | | | | |
Loans not covered under loss sharing agreements with the FDIC | | | 521,092 | | | | - | | | | | | 21,702,418 | | | | | | (519,500) | | | | 21,704,010 | |
| | | | | | | |
Loans covered under loss sharing agreements with the FDIC | | | - | | | | - | | | | | | 2,984,427 | | | | | | - | | | | 2,984,427 | |
| | | | | | | |
Less - Unearned income | | | - | | | | - | | | | | | 92,144 | | | | | | - | | | | 92,144 | |
| | | | | | | |
Allowance for loan losses | | | 304 | | | | - | | | | | | 640,251 | | | | | | - | | | | 640,555 | |
| |
| | | | | | | |
Total loans held-in-portfolio, net | | | 520,788 | | | | - | | | | | | 23,954,450 | | | | | | (519,500) | | | | 23,955,738 | |
| |
| | | | | | | |
FDIC loss share asset | | | - | | | | - | | | | | | 948,608 | | | | | | - | | | | 948,608 | |
| | | | | | | |
Premises and equipment, net | | | 2,135 | | | | - | | | | | | 517,381 | | | | | | - | | | | 519,516 | |
| | | | | | | |
Other real estate not covered under loss sharing agreements with the FDIC | | | - | | | | - | | | | | | 135,501 | | | | | | - | | | | 135,501 | |
| | | | | | | |
Other real estate covered under loss sharing agreements with the FDIC | | | - | | | | - | | | | | | 168,007 | | | | | | - | | | | 168,007 | |
| | | | | | | |
Accrued income receivable | | | 64 | | | | 114 | | | | | | 131,368 | | | | | | (10) | | | | 131,536 | |
| | | | | | | |
Mortgage servicing assets, at fair value | | | - | | | | - | | | | | | 161,099 | | | | | | - | | | | 161,099 | |
| | | | | | | |
Other assets | | | 66,577 | | | | 19,407 | | | | | | 1,642,760 | | | | | | (41,186) | | | | 1,687,558 | |
| | | | | | | |
Goodwill | | | - | | | | - | | | | | | 647,757 | | | | | | - | | | | 647,757 | |
| | | | | | | |
Other intangible assets | | | 554 | | | | - | | | | | | 44,578 | | | | | | - | | | | 45,132 | |
| |
| | | | | | | |
Total assets | | $ | 5,488,407 | | | $ | 1,700,242 | | | | | $ | 35,664,526 | | | | | $ | (7,103,842) | | | $ | 35,749,333 | |
| |
| | | | | | | |
Liabilities and Stockholders’ Equity | | | | | | | | | | | | | | | | | | | | | | | | |
| | | | | | | |
Liabilities: | | | | | | | | | | | | | | | | | | | | | | | | |
| | | | | | | |
Deposits: | | | | | | | | | | | | | | | | | | | | | | | | |
| | | | | | | |
Non-interest bearing | | $ | - | | | $ | - | | | | | $ | 5,933,649 | | | | | $ | (10,967) | | | $ | 5,922,682 | |
| | | | | | | |
Interest bearing | | | - | | | | - | | | | | | 20,793,267 | | | | | | (4,804) | | | | 20,788,463 | |
| |
| | | | | | | |
Total deposits | | | - | | | | - | | | | | | 26,726,916 | | | | | | (15,771) | | | | 26,711,145 | |
| |
| | | | | | | |
Assets sold under agreements to repurchase | | | - | | | | - | | | | | | 1,659,292 | | | | | | - | | | | 1,659,292 | |
| | | | | | | |
Other short-term borrowings | | | - | | | | - | | | | | | 920,700 | | | | | | (519,500) | | | | 401,200 | |
| | | | | | | |
Notes payable | | | 822,351 | | | | 149,663 | | | | | | 612,740 | | | | | | - | | | | 1,584,754 | |
| | | | | | | |
Other liabilities | | | 39,906 | | | | 39,245 | | | | | | 728,899 | | | | | | (41,258) | | | | 766,792 | |
| |
| | | | | | | |
Total liabilities | | | 862,257 | | | | 188,908 | | | | | | 30,648,547 | | | | | | (576,529) | | | | 31,123,183 | |
| |
| | | | | | | |
Stockholders’ equity: | | | | | | | | | | | | | | | | | | | | | | | | |
| | | | | | | |
Preferred stock | | | 50,160 | | | | - | | | | | | - | | | | | | - | | | | 50,160 | |
| | | | | | | |
Common stock | | | 1,034 | | | | 2 | | | | | | 56,079 | | | | | | (56,081) | | | | 1,034 | |
263
| | | | | | | | | | | | | | | | | | | | | | | | |
| | | | | | | |
Surplus | | | 4,161,625 | | | | 4,479,208 | | | | | | 6,056,774 | | | | | | (10,527,455) | | | | 4,170,152 | |
| | | | | | | |
Retained earnings (accumulated deficit) | | | 602,957 | | | | (2,940,509) | | | | | | (907,972) | | | | | | 3,839,954 | | | | 594,430 | |
| | | | | | | |
Treasury stock, at cost | | | (881) | | | | - | | | | | | - | | | | | | - | | | | (881) | |
| | | | | | | |
Accumulated other comprehensive loss, net of tax | | | (188,745) | | | | (27,367) | | | | | | (188,902) | | | | | | 216,269 | | | | (188,745) | |
| |
| | | | | | | |
Total stockholders’ equity | | | 4,626,150 | | | | 1,511,334 | | | | | | 5,015,979 | | | | | | (6,527,313) | | | | 4,626,150 | |
| |
| | | | | | | |
Total liabilities and stockholders’ equity | | $ | 5,488,407 | | | $ | 1,700,242 | | | | | $ | 35,664,526 | | | | | $ | (7,103,842) | | | $ | 35,749,333 | |
| |
264
Condensed Consolidating Statement of Financial Condition
| | | | | | | | | | | | | | | | | | | | |
| | | At December 31, 2012 | |
| |
| (In thousands) | | Popular, Inc. Holding Co. | | | PNA Holding Co. | | | All other subsidiaries and eliminations | | | Elimination entries | | | Popular, Inc. Consolidated | |
| |
| | | | | |
Assets: | | | | | | | | | | | | | | | | | | | | |
| | | | | |
Cash and due from banks | | $ | 1,103 | | | $ | 624 | | | $ | 439,552 | | | $ | (1,916) | | | $ | 439,363 | |
| | | | | |
Money market investments | | | 18,574 | | | | 867 | | | | 1,067,006 | | | | (867) | | | | 1,085,580 | |
| | | | | |
Trading account securities, at fair value | | | 1,259 | | | | - | | | | 313,266 | | | | - | | | | 314,525 | |
| | | | | |
Investment securities available-for-sale, at fair value | | | 42,383 | | | | - | | | | 5,058,786 | | | | (16,968) | | | | 5,084,201 | |
| | | | | |
Investment securities held-to-maturity, at amortized cost | | | 185,000 | | | | - | | | | 142,817 | | | | (185,000) | | | | 142,817 | |
| | | | | |
Other investment securities, at lower of cost or realizable value | | | 10,850 | | | | 4,492 | | | | 170,101 | | | | - | | | | 185,443 | |
| | | | | |
Investment in subsidiaries | | | 4,285,957 | | | | 1,653,636 | | | | - | | | | (5,939,593) | | | | - | |
| | | | | |
Loans held-for-sale, at lower of cost or fair value | | | - | | | | - | | | | 354,468 | | | | - | | | | 354,468 | |
| |
| | | | | |
Loans held-in-portfolio: | | | | | | | | | | | | | | | | | | | | |
| | | | | |
Loans not covered under loss sharing agreements with the FDIC | | | 286,080 | | | | - | | | | 21,050,205 | | | | (256,280) | | | | 21,080,005 | |
| | | | | |
Loans covered under loss sharing agreements with the FDIC | | | - | | | | - | | | | 3,755,972 | | | | - | | | | 3,755,972 | |
| | | | | |
Less - Unearned income | | | - | | | | - | | | | 96,813 | | | | - | | | | 96,813 | |
| | | | | |
Allowance for loan losses | | | 241 | | | | - | | | | 730,366 | | | | - | | | | 730,607 | |
| |
| | | | | |
Total loans held-in-portfolio, net | | | 285,839 | | | | - | | | | 23,978,998 | | | | (256,280) | | | | 24,008,557 | |
| |
| | | | | |
FDIC loss share asset | | | - | | | | - | | | | 1,399,098 | | | | - | | | | 1,399,098 | |
| | | | | |
Premises and equipment, net | | | 2,495 | | | | 115 | | | | 533,183 | | | | - | | | | 535,793 | |
| | | | | |
Other real estate not covered under loss sharing agreements with the FDIC | | | - | | | | - | | | | 266,844 | | | | - | | | | 266,844 | |
| | | | | |
Other real estate covered under loss sharing agreements with the FDIC | | | - | | | | - | | | | 139,058 | | | | - | | | | 139,058 | |
| | | | | |
Accrued income receivable | | | 1,675 | | | | 112 | | | | 124,266 | | | | (325) | | | | 125,728 | |
| | | | | |
Mortgage servicing assets, at fair value | | | - | | | | - | | | | 154,430 | | | | - | | | | 154,430 | |
| | | | | |
Other assets | | | 112,775 | | | | 12,614 | | | | 1,457,852 | | | | (13,663) | | | | 1,569,578 | |
| | | | | |
Goodwill | | | - | | | | - | | | | 647,757 | | | | - | | | | 647,757 | |
| | | | | |
Other intangible assets | | | 554 | | | | - | | | | 53,741 | | | | - | | | | 54,295 | |
| |
| | | | | |
Total assets | | $ | 4,948,464 | | | $ | 1,672,460 | | | $ | 36,301,223 | | | $ | (6,414,612) | | | $ | 36,507,535 | |
| |
| | | | | |
Liabilities and Stockholders’ Equity | | | | | | | | | | | | | | | | | | | | |
| | | | | |
Liabilities: | | | | | | | | | | | | | | | | | | | | |
| | | | | |
Deposits: | | | | | | | | | | | | | | | | | | | | |
| | | | | |
Non-interest bearing | | $ | - | | | $ | - | | | $ | 5,796,992 | | | $ | (2,363) | | | $ | 5,794,629 | |
| | | | | |
Interest bearing | | | - | | | | - | | | | 21,216,085 | | | | (10,101) | | | | 21,205,984 | |
| |
| | | | | |
Total deposits | | | - | | | | - | | | | 27,013,077 | | | | (12,464) | | | | 27,000,613 | |
| |
| | | | | |
Assets sold under agreements to repurchase | | | - | | | | - | | | | 2,016,752 | | | | - | | | | 2,016,752 | |
| | | | | |
Other short-term borrowings | | | - | | | | - | | | | 866,500 | | | | (230,300) | | | | 636,200 | |
| | | | | |
Notes payable | | | 790,282 | | | | 385,609 | | | | 601,830 | | | | - | | | | 1,777,721 | |
| | | | | |
Subordinated notes | | | - | | | | - | | | | 185,000 | | | | (185,000) | | | | - | |
| | | | | |
Other liabilities | | | 48,182 | | | | 42,120 | | | | 923,138 | | | | (47,191) | | | | 966,249 | |
| |
| | | | | |
Total liabilities | | | 838,464 | | | | 427,729 | | | | 31,606,297 | | | | (474,955) | | | | 32,397,535 | |
| |
| | | | | |
Stockholders’ equity: | | | | | | | | | | | | | | | | | | | | |
| | | | | |
Preferred stock | | | 50,160 | | | | - | | | | - | | | | - | | | | 50,160 | |
265
| | | | | | | | | | | | | | | | | | | | |
Common stock | | | 1,032 | | | | 2 | | | | 55,628 | | | | (55,630) | | | | 1,032 | |
| | | | | |
Surplus | | | 4,141,767 | | | | 4,206,708 | | | | 5,859,926 | | | | (10,058,107) | | | | 4,150,294 | |
| | | | | |
Retained earnings (accumulated deficit) | | | 20,353 | | | | (3,012,365) | | | | (1,114,802) | | | | 4,118,640 | | | | 11,826 | |
| | | | | |
Treasury stock, at cost | | | (444) | | | | - | | | | - | | | | - | | | | (444) | |
| | | | | |
Accumulated other comprehensive (loss) income, net of tax | | | (102,868) | | | | 50,386 | | | | (105,826) | | | | 55,440 | | | | (102,868) | |
| |
| | | | | |
Total stockholders’ equity | | | 4,110,000 | | | | 1,244,731 | | | | 4,694,926 | | | | (5,939,657) | | | | 4,110,000 | |
| |
| | | | | |
Total liabilities and stockholders’ equity | | $ | 4,948,464 | | | $ | 1,672,460 | | | $ | 36,301,223 | | | $ | (6,414,612) | | | $ | 36,507,535 | |
| |
266
Condensed Consolidating Statement of Operations
| | | | | | | | | | | | | | | | | | | | |
| | | Year ended December 31, 2013 | |
| |
| | | | | |
| | | | | | | | | All other | | | | | | | |
| | | | | |
| | | Popular, Inc. | | | PNA | | | subsidiaries and | | | Elimination | | | Popular, Inc. | |
| | | | | |
| (In thousands) | | Holding Co. | | | Holding Co. | | | eliminations | | | entries | | | Consolidated | |
| |
| | | | | |
Interest and dividend income: | | | | | | | | | | | | | | | | | | | | |
| | | | | |
Dividend income from subsidiaries | | $ | 37,000 | | | $ | - | | | $ | - | | | $ | (37,000) | | | $ | - | |
| | | | | |
Loans | | | 4,543 | | | | - | | | | 1,579,042 | | | | (1,973) | | | | 1,581,612 | |
| | | | | |
Money market investments | | | 127 | | | | 5 | | | | 3,462 | | | | (130) | | | | 3,464 | |
| | | | | |
Investment securities | | | 13,123 | | | | 322 | | | | 139,427 | | | | (11,065) | | | | 141,807 | |
| | | | | |
Trading account securities | | | - | | | | - | | | | 21,573 | | | | - | | | | 21,573 | |
| |
| | | | | |
Total interest and dividend income | | | 54,793 | | | | 327�� | | | | 1,743,504 | | | | (50,168) | | | | 1,748,456 | |
| |
| | | | | |
Interest expense: | | | | | | | | | | | | | | | | | | | | |
| | | | | |
Deposits | | | - | | | | - | | | | 137,369 | | | | (5) | | | | 137,364 | |
| | | | | |
Short-term borrowings | | | - | | | | 974 | | | | 39,558 | | | | (2,099) | | | | 38,433 | |
| | | | | |
Long-term debt | | | 101,245 | | | | 24,249 | | | | 25,650 | | | | (11,065) | | | | 140,079 | |
| |
| | | | | |
Total interest expense | | | 101,245 | | | | 25,223 | | | | 202,577 | | | | (13,169) | | | | 315,876 | |
| |
| | | | | |
Net interest (expense) income | | | (46,452) | | | | (24,896) | | | | 1,540,927 | | | | (36,999) | | | | 1,432,580 | |
| | | | | |
Provision for loan losses- non-covered loans | | | 398 | | | | - | | | | 532,769 | | | | - | | | | 533,167 | |
| | | | | |
Provision for loan losses- covered loans | | | - | | | | - | | | | 69,396 | | | | - | | | | 69,396 | |
| |
| | | | | |
Net interest (expense) income after provision for loan losses | | | (46,850) | | | | (24,896) | | | | 938,762 | | | | (36,999) | | | | 830,017 | |
| |
| | | | | |
Service charges on deposit accounts | | | - | | | | - | | | | 172,909 | | | | - | | | | 172,909 | |
| | | | | |
Other service fees | | | - | | | | - | | | | 237,922 | | | | (2,797) | | | | 235,125 | |
| | | | | |
Mortgage banking activities | | | - | | | | - | | | | 71,673 | | | | - | | | | 71,673 | |
| | | | | |
Net gain and valuation adjustments on investment securities | | | 7,966 | | | | - | | | | - | | | | - | | | | 7,966 | |
| | | | | |
Trading account profit (loss) | | | 161 | | | | - | | | | (13,644) | | | | - | | | | (13,483) | |
| | | | | |
Net loss on sale of loans, including valuation adjustments on loans held-for-sale | | | - | | | | - | | | | (49,130) | | | | - | | | | (49,130) | |
| | | | | |
Adjustments (expense) to indemnity reserves on loans sold | | | - | | | | - | | | | (37,054) | | | | - | | | | (37,054) | |
| | | | | |
FDIC loss share (expense) income | | | - | | | | - | | | | (82,051) | | | | - | | | | (82,051) | |
| | | | | |
Other operating income | | | 443,276 | | | | 4,012 | | | | 57,326 | | | | - | | | | 504,614 | |
| |
| | | | | |
Total non-interest income | | | 451,403 | | | | 4,012 | | | | 357,951 | | | | (2,797) | | | | 810,569 | |
| |
| | | | | |
Operating expenses: | | | | | | | | | | | | | | | | | | | | |
| | | | | |
Personnel costs | | | 31,086 | | | | - | | | | 430,781 | | | | - | | | | 461,867 | |
| | | | | |
Net occupancy expenses | | | 3,685 | | | | 2 | | | | 95,644 | | | | - | | | | 99,331 | |
| | | | | |
Equipment expenses | | | 4,084 | | | | - | | | | 43,399 | | | | - | | | | 47,483 | |
| | | | | |
Other taxes | | | 413 | | | | - | | | | 57,873 | | | | - | | | | 58,286 | |
| | | | | |
Professional fees | | | 13,099 | | | | 72 | | | | 276,334 | | | | (225) | | | | 289,280 | |
| | | | | |
Communications | | | 421 | | | | - | | | | 25,873 | | | | - | | | | 26,294 | |
| | | | | |
Business promotion | | | 1,838 | | | | - | | | | 58,638 | | | | - | | | | 60,476 | |
| | | | | |
FDIC deposit insurance | | | - | | | | - | | | | 60,513 | | | | - | | | | 60,513 | |
| | | | | |
Loss on early extinguishment of debt | | | - | | | | 3,388 | | | | - | | | | - | | | | 3,388 | |
| | | | | |
Other real estate owned (OREO) expenses | | | - | | | | - | | | | 80,236 | | | | - | | | | 80,236 | |
| | | | | |
Other operating expenses | | | (53,926) | | | | 434 | | | | 151,596 | | | | (2,555) | | | | 95,549 | |
| | | | | |
Amortization of intangibles | | | - | | | | - | | | | 9,883 | | | | - | | | | 9,883 | |
| |
| | | | | |
Total operating expenses | | | 700 | | | | 3,896 | | | | 1,290,770 | | | | (2,780) | | | | 1,292,586 | |
| |
| | | | | |
Income (loss) before income tax and equity in earnings of subsidiaries | | | 403,853 | | | | (24,780) | | | | 5,943 | | | | (37,016) | | | | 348,000 | |
| | | | | |
Income tax expense (benefit) | | | 1,412 | | | | (1,710) | | | | (250,887) | | | | (142) | | | | (251,327) | |
| | | | |
267
| | | | | | | | | | | | | | | | | | | | |
| |
| | | | | |
Income (loss) before equity in earnings of subsidiaries | | | 402,441 | | | | (23,070) | | | | 256,830 | | | | (36,874) | | | | 599,327 | |
| | | | | |
Equity in undistributed earnings of subsidiaries | | | 196,886 | | | | 94,926 | | | | - | | | | (291,812) | | | | - | |
| |
| | | | | |
Net Income | | $ | 599,327 | | | $ | 71,856 | | | $ | 256,830 | | | $ | (328,686) | | | $ | 599,327 | |
| |
| | | | | |
Comprehensive income (loss), net of tax | | $ | 513,450 | | | $ | (5,897) | | | $ | 173,754 | | | $ | (167,857) | | | $ | 513,450 | |
| |
268
Condensed Consolidating Statement of Operations
| | | | | | | | | | | | | | | | | | | | |
| | | Year ended December 31, 2012 | |
| |
| | | | | |
| | | | | | | | | All other | | | | | | | |
| | | | | |
| | | Popular, Inc. | | | PNA | | | subsidiaries and | | | Elimination | | | Popular, Inc. | |
| | | | | |
| (In thousands) | | Holding Co. | | | Holding Co. | | | eliminations | | | entries | | | Consolidated | |
| |
| | | | | |
Interest and dividend income: | | | | | | | | | | | | | | | | | | | | |
| | | | | |
Dividend income from subsidiaries | | $ | 5,000 | | | $ | - | | | $ | - | | | $ | (5,000) | | | $ | - | |
| | | | | |
Loans | | | 6,733 | | | | - | | | | 1,557,346 | | | | (3,392) | | | | 1,560,687 | |
| | | | | |
Money market investments | | | 14 | | | | 25 | | | | 3,707 | | | | (43) | | | | 3,703 | |
| | | | | |
Investment securities | | | 16,291 | | | | 322 | | | | 163,179 | | | | (11,160) | | | | 168,632 | |
| | | | | |
Trading account securities | | | - | | | | - | | | | 22,824 | | | | - | | | | 22,824 | |
| |
| | | | | |
Total interest and dividend income | | | 28,038 | | | | 347 | | | | 1,747,056 | | | | (19,595) | | | | 1,755,846 | |
| |
| | | | | |
Interest expense: | | | | | | | | | | | | | | | | | | | | |
| | | | | |
Deposits | | | - | | | | - | | | | 184,241 | | | | (25) | | | | 184,216 | |
| | | | | |
Short-term borrowings | | | 6 | | | | 151 | | | | 50,058 | | | | (3,410) | | | | 46,805 | |
| | | | | |
Long-term debt | | | 95,892 | | | | 32,183 | | | | 31,765 | | | | (11,648) | | | | 148,192 | |
| |
| | | | | |
Total interest expense | | | 95,898 | | | | 32,334 | | | | 266,064 | | | | (15,083) | | | | 379,213 | |
| |
| | | | | |
Net interest (expense) income | | | (67,860) | | | | (31,987) | | | | 1,480,992 | | | | (4,512) | | | | 1,376,633 | |
| | | | | |
Provision for loan losses- non-covered loans | | | 404 | | | | - | | | | 333,698 | | | | - | | | | 334,102 | |
| | | | | |
Provision for loan losses- covered loans | | | - | | | | - | | | | 74,839 | | | | - | | | | 74,839 | |
| |
| | | | | |
Net interest (expense) income after provision for loan losses | | | (68,264) | | | | (31,987) | | | | 1,072,455 | | | | (4,512) | | | | 967,692 | |
| |
| | | | | |
Service charges on deposit accounts | | | - | | | | - | | | | 183,026 | | | | - | | | | 183,026 | |
| | | | | |
Other service fees | | | - | | | | - | | | | 241,089 | | | | (3,224) | | | | 237,865 | |
| | | | | |
Mortgage banking activities | | | - | | | | - | | | | 84,791 | | | | - | | | | 84,791 | |
| | | | | |
Net loss and valuation adjustments on investment securities | | | - | | | | - | | | | (1,707) | | | | - | | | | (1,707) | |
| | | | | |
Trading account profit | | | 214 | | | | - | | | | 4,264 | | | | - | | | | 4,478 | |
| | | | | |
Net loss on sale of loans, including valuation adjustments on loans held-for-sale | | | - | | | | - | | | | (27,416) | | | | - | | | | (27,416) | |
| | | | | |
Adjustments (expense) to indemnity reserves on loans sold | | | - | | | | - | | | | (21,198) | | | | - | | | | (21,198) | |
| | | | | |
FDIC loss share (expense) income | | | - | | | | - | | | | (56,211) | | | | - | | | | (56,211) | |
| | | | | |
Other operating income | | | 41,966 | | | | 707 | | | | 84,911 | | | | - | | | | 127,584 | |
| |
| | | | | |
Total non-interest income | | | 42,180 | | | | 707 | | | | 491,549 | | | | (3,224) | | | | 531,212 | |
| |
| | | | | |
Operating expenses: | | | | | | | | | | | | | | | | | | | | |
| | | | | |
Personnel costs | | | 29,779 | | | | - | | | | 435,923 | | | | - | | | | 465,702 | |
| | | | | |
Net occupancy expenses | | | 3,434 | | | | 3 | | | | 93,822 | | | | - | | | | 97,259 | |
| | | | | |
Equipment expenses | | | 3,831 | | | | - | | | | 41,459 | | | | - | | | | 45,290 | |
| | | | | |
Other taxes | | | 2,209 | | | | - | | | | 47,911 | | | | - | | | | 50,120 | |
| | | | | |
Professional fees | | | 11,042 | | | | 42 | | | | 273,997 | | | | (756) | | | | 284,325 | |
| | | | | |
Communications | | | 464 | | | | - | | | | 26,370 | | | | - | | | | 26,834 | |
| | | | | |
Business promotion | | | 1,823 | | | | - | | | | 59,753 | | | | - | | | | 61,576 | |
| | | | | |
FDIC deposit insurance | | | - | | | | - | | | | 85,697 | | | | - | | | | 85,697 | |
| | | | | |
Loss on early extinguishment of debt | | | - | | | | - | | | | 25,196 | | | | - | | | | 25,196 | |
| | | | | |
Other real estate owned (OREO) expenses | | | - | | | | - | | | | 23,520 | | | | - | | | | 23,520 | |
| | | | | |
Other operating expenses | | | (50,877) | | | | 441 | | | | 157,242 | | | | (2,365) | | | | 104,441 | |
| | | | | |
Amortization of intangibles | | | - | | | | - | | | | 10,072 | | | | - | | | | 10,072 | |
| |
| | | | | |
Total operating expenses | | | 1,705 | | | | 486 | | | | 1,280,962 | | | | (3,121) | | | | 1,280,032 | |
| |
| | | | | |
(Loss) income before income tax and equity in earnings of subsidiaries | | | (27,789) | | | | (31,766) | | | | 283,042 | | | | (4,615) | | | | 218,872 | |
| | | | | |
Income tax expense (benefit) | | | 1,702 | | | | - | | | | (28,147) | | | | 42 | | | | (26,403) | |
| |
269
| | | | | | | | | | | | | | | | | | | | |
| |
| | | | | |
(Loss) income before equity in earnings of subsidiaries | | | (29,491) | | | | (31,766) | | | | 311,189 | | | | (4,657) | | | | 245,275 | |
| | | | | |
Equity in undistributed earnings of subsidiaries | | | 274,766 | | | | 32,883 | | | | - | | | | (307,649) | | | | - | |
| |
| | | | | |
Net Income | | $ | 245,275 | | | $ | 1,117 | | | $ | 311,189 | | | $ | (312,306) | | | $ | 245,275 | |
| |
| | | | | |
Comprehensive income (loss), net of tax | | $ | 184,955 | | | $ | (5,444) | | | $ | 248,507 | | | $ | (243,063) | | | $ | 184,955 | |
| |
270
Condensed Consolidating Statement of Operations
| | | | | | | | | | | | | | | | | | | | |
| | | Year ended December 31, 2011 | |
| |
| | | | | |
| | | | | | | | | All other | | | | | | | |
| | | | | |
| | | Popular, Inc. | | | PNA | | | subsidiaries and | | | Elimination | | | Popular, Inc. | |
| | | | | |
| (In thousands) | | Holding Co. | | | Holding Co. | | | eliminations | | | entries | | | Consolidated | |
| |
| | | | | |
Interest and Dividend Income: | | | | | | | | | | | | | | | | | | | | |
| | | | | |
Dividend income from subsidiaries | | $ | 20,000 | | | $ | - | | | $ | - | | | $ | (20,000) | | | $ | - | |
| | | | | |
Loans | | | 8,913 | | | | - | | | | 1,692,065 | | | | (4,848) | | | | 1,696,130 | |
| | | | | |
Money market investments | | | 8 | | | | 4 | | | | 3,646 | | | | (62) | | | | 3,596 | |
| | | | | |
Investment securities | | | 16,224 | | | | 322 | | | | 200,279 | | | | (10,997) | | | | 205,828 | |
| | | | | |
Trading account securities | | | - | | | | - | | | | 35,607 | | | | - | | | | 35,607 | |
| |
| | | | | |
Total interest and dividend income | | | 45,145 | | | | 326 | | | | 1,931,597 | | | | (35,907) | | | | 1,941,161 | |
| |
| | | | | |
Interest Expense: | | | | | | | | | | | | | | | | | | | | |
| | | | | |
Deposits | | | - | | | | - | | | | 269,798 | | | | (4) | | | | 269,794 | |
| | | | | |
Short-term borrowings | | | 50 | | | | 883 | | | | 59,230 | | | | (4,905) | | | | 55,258 | |
| | | | | |
Long-term debt | | | 94,565 | | | | 31,438 | | | | 66,409 | | | | (11,648) | | | | 180,764 | |
| |
| | | | | |
Total interest expense | | | 94,615 | | | | 32,321 | | | | 395,437 | | | | (16,557) | | | | 505,816 | |
| |
| | | | | |
Net interest (expense) income | | | (49,470) | | | | (31,995) | | | | 1,536,160 | | | | (19,350) | | | | 1,435,345 | |
| | | | | |
Provision for loan losses- non-covered loans | | | - | | | | - | | | | 430,085 | | | | - | | | | 430,085 | |
| | | | | |
Provision for loan losses- covered loans | | | - | | | | - | | | | 145,635 | | | | - | | | | 145,635 | |
| |
| | | | | |
Net interest (expense) income after provision for loan losses | | | (49,470) | | | | (31,995) | | | | 960,440 | | | | (19,350) | | | | 859,625 | |
| |
| | | | | |
Service charges on deposit accounts | | | - | | | | - | | | | 184,940 | | | | - | | | | 184,940 | |
| | | | | |
Other service fees | | | - | | | | - | | | | 243,571 | | | | (2,571) | | | | 241,000 | |
| | | | | |
Mortgage banking activities | | | - | | | | - | | | | (4,483) | | | | - | | | | (4,483) | |
| | | | | |
Net gain and valuation adjustments on investment securities | | | - | | | | - | | | | 10,844 | | | | - | | | | 10,844 | |
| | | | | |
Trading account profit | | | - | | | | - | | | | 48,098 | | | | - | | | | 48,098 | |
| | | | | |
Net gain on sale of loans, including valuation adjustments on loans held-for-sale | | | - | | | | - | | | | 5,270 | | | | - | | | | 5,270 | |
| | | | | |
Adjustments (expense) to indemnity reserves on loans sold | | | - | | | | - | | | | (33,068) | | | | - | | | | (33,068) | |
| | | | | |
FDIC loss share (expense) income | | | - | | | | - | | | | 66,791 | | | | - | | | | 66,791 | |
| | | | | |
Fair value change in equity appreciation instrument | | | - | | | | - | | | | 8,323 | | | | - | | | | 8,323 | |
| | | | | |
Other operating income (loss) | | | 23,145 | | | | (499) | | | | 75,065 | | | | - | | | | 97,711 | |
| |
| | | | | |
Total non-interest income (loss) | | | 23,145 | | | | (499) | | | | 605,351 | | | | (2,571) | | | | 625,426 | |
| |
| | | | | |
Operating Expenses: | | | | | | | | | | | | | | | | | | | | |
| | | | | |
Personnel costs | | | 28,524 | | | | - | | | | 424,846 | | | | - | | | | 453,370 | |
| | | | | |
Net occupancy expenses | | | 3,396 | | | | 3 | | | | 95,459 | | | | - | | | | 98,858 | |
| | | | | |
Equipment expenses | | | 3,210 | | | | - | | | | 40,630 | | | | - | | | | 43,840 | |
| | | | | |
Other taxes | | | 2,269 | | | | - | | | | 49,616 | | | | - | | | | 51,885 | |
| | | | | |
Professional fees | | | 10,820 | | | | 11 | | | | 256,994 | | | | (243) | | | | 267,582 | |
| | | | | |
Communications | | | 421 | | | | 10 | | | | 26,684 | | | | - | | | | 27,115 | |
| | | | | |
Business promotion | | | 1,894 | | | | - | | | | 53,173 | | | | - | | | | 55,067 | |
| | | | | |
FDIC deposit insurance | | | - | | | | - | | | | 93,728 | | | | - | | | | 93,728 | |
| | | | | |
Loss on early extinguishment of debt | | | 8,000 | | | | - | | | | 693 | | | | - | | | | 8,693 | |
| | | | | |
Other real estate owned (OREO) expenses | | | - | | | | - | | | | 21,778 | | | | - | | | | 21,778 | |
| | | | | |
Other operating expenses | | | (49,468) | | | | 443 | | | | 139,209 | | | | (2,955) | | | | 87,229 | |
| | | | | |
Amortization of intangibles | | | - | | | | - | | | | 9,654 | | | | - | | | | 9,654 | |
| |
| | | | | |
Total operating expenses | | | 9,066 | | | | 467 | | | | 1,212,464 | | | | (3,198) | | | | 1,218,799 | |
| |
| | | | | |
(Loss) income before income tax and equity in earnings of subsidiaries | | | (35,391) | | | | (32,961) | | | | 353,327 | | | | (18,723) | | | | 266,252 | |
271
| | | | | | | | | | | | | | | | | | | | |
Income tax expense (benefit) | | | 2,786 | | | | (955) | | | | 112,588 | | | | 508 | | | | 114,927 | |
| |
| | | | | |
(Loss) income before equity in earnings of subsidiaries | | | (38,177) | | | | (32,006) | | | | 240,739 | | | | (19,231) | | | | 151,325 | |
| | | | | |
Equity in undistributed earnings of subsidiaries | | | 189,502 | | | | 19,206 | | | | - | | | | (208,708) | | | | - | |
| |
| | | | | |
Net Income (Loss) | | $ | 151,325 | | | $ | (12,800) | | | $ | 240,739 | | | $ | (227,939) | | | $ | 151,325 | |
| |
| | | | | |
Comprehensive income, net of tax | | $ | 114,738 | | | $ | 18,812 | | | $ | 203,779 | | | $ | (222,591) | | | $ | 114,738 | |
| |
272
Condensed Consolidating Statement of Cash Flows
| | | | | | | | | | | | | | | | | | | | |
| | | Year ended December 31, 2013 | |
| |
| (In thousands) | | Popular, Inc.
Holding Co. | | | PNA
Holding Co. | | | All other
subsidiaries
and eliminations | | | Elimination
entries | | | Popular, Inc.
Consolidated | |
| |
| | | | | |
Cash flows from operating activities: | | | | | | | | | | | | | | | | | | | | |
| | | | | |
Net income | | $ | 599,327 | | | $ | 71,856 | | | $ | 256,830 | | | $ | (328,686) | | | $ | 599,327 | |
| |
| | | | | |
Adjustments to reconcile net income to net cash (used in) provided by operating activities: | | | | | | | | | | | | | | | | | | | | |
| | | | | |
Equity in undistributed earnings of subsidiaries | | | (196,886) | | | | (94,926) | | | | - | | | | 291,812 | | | | - | |
Provision for loan losses | | | 398 | | | | - | | | | 602,165 | | | | - | | | | 602,563 | |
Amortization of intangibles | | | - | | | | - | | | | 9,883 | | | | - | | | | 9,883 | |
Depreciation and amortization of premises and equipment | | | 641 | | | | 2 | | | | 47,519 | | | | - | | | | 48,162 | |
Net accretion of discounts and amortization of premiums and deferred fees | | | 30,467 | | | | 444 | | | | (109,915) | | | | - | | | | (79,004) | |
Fair value adjustments on mortgage servicing rights | | | - | | | | - | | | | 11,403 | | | | - | | | | 11,403 | |
FDIC loss share expense | | | - | | | | - | | | | 82,051 | | | | - | | | | 82,051 | |
Adjustments (expense) to indemnity reserves on loans sold | | | - | | | | - | | | | 37,054 | | | | - | | | | 37,054 | |
Earnings from investments under the equity method | | | (17,308) | | | | (3,946) | | | | (21,619) | | | | - | | | | (42,873) | |
Deferred income tax benefit | | | (10,937) | | | | (1,710) | | | | (275,965) | | | | (142) | | | | (288,754) | |
Loss (gain) on: | | | | | | | | | | | | | | | | | | | | |
Disposition of premises and equipment | | | 49 | | | | (66) | | | | (3,375) | | | | - | | | | (3,392) | |
Sale and valuation adjustments of investment securities | | | (2,110) | | | | - | | | | - | | | | - | | | | (2,110) | |
Sale of loans, including valuation adjustments on loans held for sale and mortgage banking activities | | | - | | | | - | | | | 22,411 | | | | - | | | | 22,411 | |
Sale of stock in equity method investee | | | (416,113) | | | | - | | | | - | | | | - | | | | (416,113) | |
Sale of foreclosed assets, including write-downs | | | - | | | | - | | | | 50,740 | | | | - | | | | 50,740 | |
Acquisitions of loans held-for-sale | | | - | | | | - | | | | (390,018) | | | | - | | | | (390,018) | |
Proceeds from sale of loans held-for-sale | | | - | | | | - | | | | 218,379 | | | | - | | | | 218,379 | |
Net originations on loans held-for-sale | | | - | | | | - | | | | (1,049,474) | | | | - | | | | (1,049,474) | |
Net (increase) decrease in: | | | | | | | | | | | | | | | | | | | | |
Trading securities | | | (94) | | | | - | | | | 1,430,929 | | | | - | | | | 1,430,835 | |
Accrued income receivable | | | 1,612 | | | | (2) | | | | (7,104) | | | | (315) | | | | (5,809) | |
Other assets | | | 5,445 | | | | (1,818) | | | | (3,027) | | | | 2,227 | | | | 2,827 | |
Net increase (decrease) in: | | | | | | | | | | | | | | | | | | | | |
Interest payable | | | 2,704 | | | | (506) | | | | (4,663) | | | | (1) | | | | (2,466) | |
Pension and other postretirement benefits obligations | | | - | | | | - | | | | 10,635 | | | | - | | | | 10,635 | |
Other liabilities | | | (5,507) | | | | (2,370) | | | | (17,179) | | | | (1,896) | | | | (26,952) | |
| |
Total adjustments | | | (607,639) | | | | (104,898) | | | | 640,830 | | | | 291,685 | | | | 219,978 | |
| |
Net cash (used in) provided by operating activities | | | (8,312) | | | | (33,042) | | | | 897,660 | | | | (37,001) | | | | 819,305 | |
| |
| | | | | |
Cash flows from investing activities: | | | | | | | | | | | | | | | | | | | | |
Net (increase) decrease in money market investments | | | (147) | | | | (3,937) | | | | 227,274 | | | | 3,937 | | | | 227,127 | |
Purchases of investment securities: | | | | | | | | | | | | | | | | | | | | |
Available-for-sale | | | - | | | | - | | | | (2,257,976) | | | | - | | | | (2,257,976) | |
Held-to-maturity | | | - | | | | - | | | | (250) | | | | - | | | | (250) | |
Other | | | - | | | | - | | | | (178,093) | | | | - | | | | (178,093) | |
Proceeds from calls, paydowns, maturities and redemptions of investment securities: | | | | | | | | | | | | | | | | | | | | |
Available-for-sale | | | 35,000 | | | | - | | | | 1,788,474 | | | | - | | | | 1,823,474 | |
Held-to-maturity | | | - | | | | - | | | | 4,632 | | | | - | | | | 4,632 | |
Other | | | - | | | | - | | | | 181,784 | | | | - | | | | 181,784 | |
Proceeds from sale of investment securities: | | | | | | | | | | | | | | | | | | | | |
Available for sale | | | 5,438 | | | | - | | | | - | | | | - | | | | 5,438 | |
Net (disbursements) repayments on loans | | | (233,745) | | | | - | | | | 625,364 | | | | 289,200 | | | | 680,819 | |
Proceeds from sale of loans | | | - | | | | - | | | | 333,021 | | | | - | | | | 333,021 | |
Acquisition of loan portfolios | | | - | | | | - | | | | (1,592,603) | | | | - | | | | (1,592,603) | |
Net payments from FDIC under loss sharing | | | | | | | | | | | | | | | | | | | | |
273
| | | | | | | | | | | | | | | | | | | | |
agreements | | | - | | | | - | | | | 396,223 | | | | - | | | | 396,223 | |
Return of capital from equity method investments | | | - | | | | 491 | | | | - | | | | - | | | | 491 | |
Proceeds from sale of stock in equity method investee | | | 481,377 | | | | - | | | | - | | | | - | | | | 481,377 | |
Capital contribution to subsidiary | | | (272,500) | | | | - | | | | - | | | | 272,500 | | | | - | |
Mortgage servicing rights purchased | | | - | | | | - | | | | (45) | | | | - | | | | (45) | |
Acquisition of premises and equipment | | | (352) | | | | - | | | | (38,221) | | | | - | | | | (38,573) | |
Proceeds from sale of: | | | | | | | | | | | | | | | | | | | | |
Premises and equipment | | | 33 | | | | 180 | | | | 9,877 | | | | - | | | | 10,090 | |
Foreclosed assets | | | - | | | | - | | | | 226,063 | | | | - | | | | 226,063 | |
| |
Net cash provided by (used in) investing activities | | | 15,104 | | | | (3,266) | | | | (274,476) | | | | 565,637 | | | | 302,999 | |
| |
| | | | | |
Cash flows from financing activities: | | | | | | | | | | | | | | | | | | | | |
Net increase (decrease) in: | | | | | | | | | | | | | | | | | | | | |
Deposits | | | - | | | | - | | | | (310,417) | | | | (12,987) | | | | (323,404) | |
Assets sold under agreements to repurchase | | | - | | | | - | | | | (357,460) | | | | - | | | | (357,460) | |
Other short-term borrowings | | | - | | | | - | | | | 54,200 | | | | (289,200) | | | | (235,000) | |
Payments of notes payable | | | - | | | | (236,200) | | | | (95,831) | | | | - | | | | (332,031) | |
Proceeds from issuance of notes payable | | | - | | | | - | | | | 106,739 | | | | - | | | | 106,739 | |
Proceeds from issuance of common stock | | | 6,860 | | | | - | | | | - | | | | - | | | | 6,860 | |
Dividends paid to parent company | | | - | | | | - | | | | (37,000) | | | | 37,000 | | | | - | |
Dividends paid | | | (3,723) | | | | - | | | | - | | | | - | | | | (3,723) | |
Net payments for repurchase of common stock | | | (437) | | | | - | | | | - | | | | - | | | | (437) | |
Capital contribution from parent | | | - | | | | 272,500 | | | | - | | | | (272,500) | | | | - | |
| |
Net cash provided by (used in) financing activities | | | 2,700 | | | | 36,300 | | | | (639,769) | | | | (537,687) | | | | (1,138,456) | |
| |
Net increase (decrease) in cash and due from banks | | | 9,492 | | | | (8) | | | | (16,585) | | | | (9,051) | | | | (16,152) | |
Cash and due from banks at beginning of period | | | 1,103 | | | | 624 | | | | 439,552 | | | | (1,916) | | | | 439,363 | |
| |
Cash and due from banks at end of period | | $ | 10,595 | | | $ | 616 | | | $ | 422,967 | | | $ | (10,967) | | | $ | 423,211 | |
| |
274
Condensed Consolidating Statement of Cash Flows
| | | | | | | | | | | | | | | | | | | | |
| | | Year ended December 31, 2012 | |
| |
| (In thousands) | | Popular, Inc. Holding Co. | | | PNA
Holding Co. | | | All other
subsidiaries
and eliminations | | | Elimination entries | | | Popular, Inc. Consolidated | |
| |
| | | | | |
Cash flows from operating activities: | | | | | | | | | | | | | | | | | | | | |
| | | | | |
Net income | | $ | 245,275 | | | $ | 1,117 | | | $ | 311,189 | | | $ | (312,306) | | | $ | 245,275 | |
| |
| | | | | |
Adjustments to reconcile net income to net cash (used in) provided by operating activities: | | | | | | | | | | | | | | | | | | | | |
| | | | | |
Equity in undistributed earnings of subsidiaries | | | (274,766) | | | | (32,883) | | | | - | | | | 307,649 | | | | - | |
Provision for loan losses | | | 404 | | | | - | | | | 408,537 | | | | - | | | | 408,941 | |
Amortization of intangibles | | | - | | | | - | | | | 10,072 | | | | - | | | | 10,072 | |
Depreciation and amortization of premises and equipment | | | 653 | | | | 3 | | | | 46,080 | | | | - | | | | 46,736 | |
Net accretion of discounts and amortization of premiums and deferred fees | | | 29,058 | | | | 112 | | | | (66,582) | | | | (487) | | | | (37,899) | |
Fair value adjustments on mortgage servicing rights | | | - | | | | - | | | | 17,406 | | | | - | | | | 17,406 | |
FDIC loss share expense | | | - | | | | - | | | | 56,211 | | | | - | | | | 56,211 | |
Amortization of prepaid FDIC assessment | | | - | | | | - | | | | 32,778 | | | | - | | | | 32,778 | |
Adjustments (expense) to indemnity reserves on loans sold | | | - | | | | - | | | | 21,198 | | | | - | | | | 21,198 | |
Earnings from investments under the equity method | | | (40,505) | | | | (706) | | | | (32,267) | | | | - | | | | (73,478) | |
Deferred income tax benefit | | | (14,109) | | | | - | | | | (121,424) | | | | 42 | | | | (135,491) | |
Loss (gain) on: | | | | | | | | | | | | | | | | | | | | |
Disposition of premises and equipment | | | 2 | | | | - | | | | (8,621) | | | | - | | | | (8,619) | |
Sale and valuation adjustments of investment securities | | | - | | | | - | | | | 1,707 | | | | - | | | | 1,707 | |
Sale of loans, including valuation adjustments on loans held for sale and mortgage banking activities | | | - | | | | - | | | | (48,765) | | | | - | | | | (48,765) | |
Sale of other assets | | | - | | | | - | | | | (2,545) | | | | - | | | | (2,545) | |
Sale of foreclosed assets, including write-downs | | | - | | | | - | | | | (4,511) | | | | - | | | | (4,511) | |
Acquisitions of loans held-for-sale | | | - | | | | - | | | | (417,108) | | | | - | | | | (417,108) | |
Proceeds from sale of loans held-for-sale | | | - | | | | - | | | | 325,014 | | | | - | | | | 325,014 | |
Net disbursements on loans held-for-sale | | | - | | | | - | | | | (1,233,240) | | | | - | | | | (1,233,240) | |
Net (increase) decrease in: | | | | | | | | | | | | | | | | | | | | |
Trading securities | | | (1,259) | | | | - | | | | 1,389,169 | | | | - | | | | 1,387,910 | |
Accrued income receivable | | | (163) | | | | - | | | | (405) | | | | 49 | | | | (519) | |
Other assets | | | 8,859 | | | | 313 | | | | (11,972) | | | | (16,590) | | | | (19,390) | |
Net increase (decrease) in: | | | | | | | | | | | | | | | | | | | | |
Interest payable | | | - | | | | (126) | | | | (9,091) | | | | 53 | | | | (9,164) | |
Pension and other postretirement benefits obligations | | | - | | | | - | | | | (40,241) | | | | - | | | | (40,241) | |
Other liabilities | | | 2,581 | | | | (25) | | | | (473) | | | | (235) | | | | 1,848 | |
| |
Total adjustments | | | (289,245) | | | | (33,312) | | | | 310,927 | | | | 290,481 | | | | 278,851 | |
| |
Net cash (used in) provided by operating activities | | | (43,970) | | | | (32,195) | | | | 622,116 | | | | (21,825) | | | | 524,126 | |
| |
| | | | | |
Cash flows from investing activities: | | | | | | | | | | | | | | | | | | | | |
Net decrease (increase) in money market investments | | | 23,665 | | | | (315) | | | | 290,990 | | | | (23,746) | | | | 290,594 | |
Purchases of investment securities: | | | | | | | | | | | | | | | | | | | | |
Available-for-sale | | | - | | | | - | | | | (1,843,922) | | | | - | | | | (1,843,922) | |
Held-to-maturity | | | - | | | | - | | | | (25,792) | | | | - | | | | (25,792) | |
Other | | | - | | | | - | | | | (212,419) | | | | - | | | | (212,419) | |
Proceeds from calls, paydowns, maturities and redemptions of investment securities: | | | | | | | | | | | | | | | | | | | | |
Available-for-sale | | | - | | | | - | | | | 1,636,723 | | | | - | | | | 1,636,723 | |
Held-to-maturity | | | - | | | | - | | | | 9,751 | | | | - | | | | 9,751 | |
Other | | | - | | | | - | | | | 206,856 | | | | - | | | | 206,856 | |
Proceeds from sale of investment securities: | | | | | | | | | | | | | | | | | | | | |
Available for sale | | | - | | | | - | | | | 52,058 | | | | - | | | | 52,058 | |
Net (disbursements) repayments on loans | | | (36,262) | | | | - | | | | 628,963 | | | | 36,305 | | | | 629,006 | |
Proceeds from sale of loans | | | - | | | | - | | | | 68,396 | | | | - | | | | 68,396 | |
275
| | | | | | | | | | | | | | | | | | | | |
Acquisition of loan portfolios | | | - | | | | - | | | | (1,357,628) | | | | - | | | | (1,357,628) | |
Net payments from FDIC under loss sharing agreements | | | - | | | | - | | | | 462,016 | | | | - | | | | 462,016 | |
Return of capital from equity method investments | | | 150,194 | | | | 1,002 | | | | - | | | | - | | | | 151,196 | |
Capital contribution to subsidiary | | | (103,500) | | | | - | | | | - | | | | 103,500 | | | | - | |
Mortgage servicing rights purchased | | | - | | | | - | | | | (2,231) | | | | - | | | | (2,231) | |
Acquisition of premises and equipment | | | (691) | | | | - | | | | (54,208) | | | | - | | | | (54,899) | |
Proceeds from sale of: | | | | | | | | | | | | | | | | | | | | |
Premises and equipment | | | 73 | | | | - | | | | 19,768 | | | | - | | | | 19,841 | |
Other productive assets | | | - | | | | - | | | | 1,026 | | | | - | | | | 1,026 | |
Foreclosed assets | | | - | | | | - | | | | 206,070 | | | | - | | | | 206,070 | |
| |
Net cash provided by investing activities | | | 33,479 | | | | 687 | | | | 86,417 | | | | 116,059 | | | | 236,642 | |
| |
| | | | | |
Cash flows from financing activities: | | | | | | | | | | | | | | | | | | | | |
Net increase (decrease) in: | | | | | | | | | | | | | | | | | | | | |
Deposits | | | - | | | | - | | | | (991,097) | | | | 21,501 | | | | (969,596) | |
Assets sold under agreements to repurchase | | | - | | | | - | | | | (148,405) | | | | 24,060 | | | | (124,345) | |
Other short-term borrowings | | | - | | | | (30,500) | | | | 406,900 | | | | (36,400) | | | | 340,000 | |
Payments of notes payable | | | - | | | | (41,800) | | | | (173,098) | | | | - | | | | (214,898) | |
Proceeds from issuance of notes payable | | | - | | | | - | | | | 106,923 | | | | - | | | | 106,923 | |
Proceeds from issuance of common stock | | | 9,402 | | | | - | | | | - | | | | - | | | | 9,402 | |
Dividends paid to parent company | | | - | | | | - | | | | (5,000) | | | | 5,000 | | | | - | |
Dividends paid | | | (3,723) | | | | - | | | | - | | | | - | | | | (3,723) | |
Payments for repurchase of common stock | | | (450) | | | | - | | | | - | | | | - | | | | (450) | |
Capital contribution from parent | | | - | | | | 103,500 | | | | - | | | | (103,500) | | | | - | |
| |
Net cash provided by (used in) financing activities | | | 5,229 | | | | 31,200 | | | | (803,777) | | | | (89,339) | | | | (856,687) | |
| |
| | | | | |
Net decrease in cash and due from banks | | | (5,262) | | | | (308) | | | | (95,244) | | | | 4,895 | | | | (95,919) | |
Cash and due from banks at beginning of period | | | 6,365 | | | | 932 | | | | 534,796 | | | | (6,811) | | | | 535,282 | |
| |
Cash and due from banks at end of period | | $ | 1,103 | | | $ | 624 | | | $ | 439,552 | | | $ | (1,916) | | | $ | 439,363 | |
| |
276
Condensed Consolidating Statement of Cash Flows
| | | | | | | | | | | | | | | | | | | | |
| | | Year ended December 31, 2011 | |
| |
| (In thousands) | | Popular, Inc. Holding Co. | | | PNA Holding Co. | | | All other
subsidiaries and eliminations | | | Elimination
entries | | | Popular, Inc. Consolidated | |
| |
| | | | | |
Cash flows from operating activities: | | | | | | | | | | | | | | | | | | | | |
| | | | | |
Net income (loss) | | $ | 151,325 | | | $ | (12,800) | | | $ | 240,739 | | | $ | (227,939) | | | $ | 151,325 | |
| |
| | | | | |
Adjustments to reconcile net income (loss) to net cash (used in) provided by operating activities: | | | | | | | | | | | | | | | | | | | | |
| | | | | |
Equity in undistributed earnings of subsidiaries | | | (189,502) | | | | (19,206) | | | | - | | | | 208,708 | | | | - | |
Provision for loan losses | | | - | | | | - | | | | 575,720 | | | | - | | | | 575,720 | |
Amortization of intangibles | | | - | | | | - | | | | 9,654 | | | | - | | | | 9,654 | |
Depreciation and amortization of premises and equipment | | | 750 | | | | 3 | | | | 45,693 | | | | - | | | | 46,446 | |
Net accretion of discounts and amortization of premiums and deferred fees | | | 25,042 | | | | 176 | | | | (137,614) | | | | (650) | | | | (113,046) | |
Impairment losses on net assets to be disposed of | | | - | | | | - | | | | 4,255 | | | | - | | | | 4,255 | |
Fair value adjustments on mortgage servicing rights | | | - | | | | - | | | | 37,061 | | | | - | | | | 37,061 | |
Fair value change in equity appreciation instrument | | | - | | | | - | | | | (8,323) | | | | - | | | | (8,323) | |
FDIC loss share income | | | - | | | | - | | | | (66,791) | | | | - | | | | (66,791) | |
Amortization of prepaid FDIC assessment | | | - | | | | - | | | | 93,728 | | | | - | | | | 93,728 | |
Adjustments (expense) to indemnity reserves on loans sold | | | - | | | | - | | | | 33,068 | | | | - | | | | 33,068 | |
(Earnings) losses from investments under the equity method | | | (14,186) | | | | 500 | | | | (20,083) | | | | - | | | | (33,769) | |
Deferred income tax expense (benefit) | | | 13,965 | | | | (932) | | | | (7,679) | | | | 508 | | | | 5,862 | |
Loss (gain) on: | | | | | | | | | | | | | | | | | | | | |
Disposition of premises and equipment | | | 7 | | | | - | | | | (5,533) | | | | - | | | | (5,526) | |
Sale and valuation adjustments of investment securities | | | - | | | | - | | | | (10,844) | | | | - | | | | (10,844) | |
Sale of loans, including valuation adjustments on loans held for sale and mortgage banking activities | | | - | | | | - | | | | (30,891) | | | | - | | | | (30,891) | |
Sale of equity method investments | | | (5,493) | | | | - | | | | (11,414) | | | | - | | | | (16,907) | |
Sale of foreclosed assets, including write-downs | | | - | | | | - | | | | (2,426) | | | | - | | | | (2,426) | |
Acquisitions of loans held-for-sale | | | - | | | | - | | | | (346,004) | | | | - | | | | (346,004) | |
Proceeds from sale of loans held-for-sale | | | - | | | | - | | | | 165,335 | | | | - | | | | 165,335 | |
Net disbursements on loans held-for-sale | | | - | | | | - | | | | (793,094) | | | | - | | | | (793,094) | |
Net (increase) decrease in: | | | | | | | | | | | | | | | | | | | | |
Trading securities | | | - | | | | - | | | | 1,143,029 | | | | - | | | | 1,143,029 | |
Accrued income receivable | | | (2) | | | | - | | | | 25,240 | | | | 211 | | | | 25,449 | |
Other assets | | | 6,808 | | | | 2,316 | | | | 8,511 | | | | 7,120 | | | | 24,755 | |
Net increase (decrease) in: | | | | | | | | | | | | | | | | | | | | |
Interest payable | | | (3,467) | | | | (56) | | | | (8,949) | | | | 1 | | | | (12,471) | |
Pension and other postretirement benefits obligations | | | - | | | | - | | | | (111,288) | | | | - | | | | (111,288) | |
Other liabilities | | | (84,434) | | | | (2,354) | | | | (2,901) | | | | 2,055 | | | | (87,634) | |
| |
Total adjustments | | | (250,512) | | | | (19,553) | | | | 577,460 | | | | 217,953 | | | | 525,348 | |
| |
Net cash (used in) provided by operating activities | | | (99,187) | | | | (32,353) | | | | 818,199 | | | | (9,986) | | | | 676,673 | |
| |
| | | | | |
Cash flows from investing activities: | | | | | | | | | | | | | | | | | | | | |
| | | | | |
Net increase in money market investments | | | (42,237) | | | | (291) | | | | (378,703) | | | | 24,352 | | | | (396,879) | |
Purchases of investment securities: | | | | | | | | | | | | | | | | | | | | |
Available-for-sale | | | - | | | | - | | | | (1,357,080) | | | | - | | | | (1,357,080) | |
Held-to-maturity | | | (37,093) | | | | - | | | | (37,445) | | | | - | | | | (74,538) | |
Other | | | - | | | | - | | | | (172,775) | | | | - | | | | (172,775) | |
Proceeds from calls, paydowns, maturities and redemptions of investment securities: | | | | | | | | | | | | | | | | | | | | |
Available-for-sale | | | - | | | | - | | | | 1,360,386 | | | | - | | | | 1,360,386 | |
Held-to-maturity | | | 62,980 | | | | - | | | | 4,256 | | | | - | | | | 67,236 | |
Other | | | - | | | | - | | | | 154,114 | | | | - | | | | 154,114 | |
Proceeds from sale of investment securities: | | | | | | | | | | | | | | | | | | | | |
277
| | | | | | | | | | | | | | | | | | | | |
Available for sale | | | - | | | | - | | | | 262,443 | | | | - | | | | 262,443 | |
Other | | | - | | | | - | | | | 5,094 | | | | - | | | | 5,094 | |
Net repayments on loans | | | 226,415 | | | | - | | | | 1,130,350 | | | | (220,707) | | | | 1,136,058 | |
Proceeds from sale of loans | | | - | | | | - | | | | 293,109 | | | | - | | | | 293,109 | |
Acquisition of loan portfolios | | | - | | | | - | | | | (1,131,388) | | | | - | | | | (1,131,388) | |
Net payments from FDIC under loss sharing agreements | | | - | | | | - | | | | 561,111 | | | | - | | | | 561,111 | |
Cash paid related to business acquisitions | | | - | | | | - | | | | (855) | | | | - | | | | (855) | |
Net proceeds from sale of equity method investments | | | (10,690) | | | | - | | | | 42,193 | | | | - | | | | 31,503 | |
Capital contribution to subsidiary | | | - | | | | - | | | | (37,000) | | | | 37,000 | | | | - | |
Mortgage servicing rights purchased | | | - | | | | - | | | | (1,732) | | | | - | | | | (1,732) | |
Acquisition of premises and equipment | | | (594) | | | | - | | | | (49,449) | | | | - | | | | (50,043) | |
Proceeds from sale of: | | | | | | | | | | | | | | | | | | | | |
Premises and equipment | | | 135 | | | | - | | | | 14,804 | | | | - | | | | 14,939 | |
Foreclosed assets | | | - | | | | - | | | | 198,490 | | | | - | | | | 198,490 | |
| |
Net cash provided by (used in) investing activities | | | 198,916 | | | | (291) | | | | 859,923 | | | | (159,355) | | | | 899,193 | |
| |
| | | | | |
Cash flows from financing activities: | | | | | | | | | | | | | | | | | | | | |
Net increase (decrease) in: | | | | | | | | | | | | | | | | | | | | |
Deposits | | | - | | | | - | | | | 1,192,089 | | | | (12,146) | | | | 1,179,943 | |
Assets sold under agreements to repurchase | | | - | | | | - | | | | (247,393) | | | | (24,060) | | | | (271,453) | |
Other short-term borrowings | | | - | | | | (2,000) | | | | (284,322) | | | | 218,300 | | | | (68,022) | |
Payments of notes payable | | | (100,000) | | | | (3,000) | | | | (2,666,477) | | | | - | | | | (2,769,477) | |
Proceeds from issuance of notes payable | | | - | | | | - | | | | 432,568 | | | | - | | | | 432,568 | |
Proceeds from issuance of common stock | | | 7,690 | | | | - | | | | - | | | | - | | | | 7,690 | |
Dividends paid to parent company | | | - | | | | - | | | | (20,000) | | | | 20,000 | | | | - | |
Dividends paid | | | (3,723) | | | | - | | | | - | | | | - | | | | (3,723) | |
Payments for repurchase of common stock | | | (483) | | | | - | | | | - | | | | - | | | | (483) | |
Return of capital | | | 1,514 | | | | - | | | | (1,514) | | | | - | | | | - | |
Capital contribution from parent | | | - | | | | 37,000 | | | | - | | | | (37,000) | | | | - | |
| |
Net cash (used in) provided by financing activities | | | (95,002) | | | | 32,000 | | | | (1,595,049) | | | | 165,094 | | | | (1,492,957) | |
| |
| | | | | |
Net increase (decrease) in cash and due from banks | | | 4,727 | | | | (644) | | | | 83,073 | | | | (4,247) | | | | 82,909 | |
Cash and due from banks at beginning of period | | | 1,638 | | | | 1,576 | | | | 451,723 | | | | (2,564) | | | | 452,373 | |
| |
Cash and due from banks at end of period | | $ | 6,365 | | | $ | 932 | | | $ | 534,796 | | | $ | (6,811) | | | $ | 535,282 | |
| |
278