Exhibit 13.1
Exhibit 13.1 BPPR POPULAR® ANNUAL REPORT INFORME ANUAL 2015

CONTENTS ÍNDICE
| | |
| Year in Review | | 1 |
| 25-Year Historical Financial Summary | | 4 |
| Management & Board of Directors | | 6 |
| Resumen del Año | | 7 |
| Resumen Financiero Histórico – 25 Años | | 10 |
| Gerencia y Junta de Directores | | 12 |
Popular, inc. (NASDAQ:BPOP) is a full-service financial provider based in Puerto Rico, with operations in Puerto Rico, the Virgin Islands and the United States. In Puerto Rico, Popular is the leading banking institution, by both assets and deposits, and ranks among the largest 50 banks in the U.S. by assets. CORPORATE INFORMATION Independent Registered Public Accounting Firm: PricewaterhouseCoopers LLP The company’s Form 10-K, proxy statement, corporate social responsibility report, as any other financial information, is available on our website http://annualreport.popular.com ANNUAL MEETING The 2016 Annual Stockholders’ Meeting of Popular, Inc. will be held on Tuesday, April 26, at 9:00 a.m. at the penthouse of the Popular Center Building, San Juan, Puerto Rico. Popular, Inc. (NASDAQ:BPOP) es un proveedor de servicios financieros con sede en Puerto Rico y operaciones en Puerto Rico, Islas Vírgenes y Estados Unidos. En Puerto Rico es la institución bancaria líder, tanto en activos como en depósitos, y se encuentra entre los 50 bancos más grandes de Estados Unidos por total de activos. INFORMACIÓN CORPORATIVA Firma registrada de Contabilidad Pública Independiente: PricewaterhouseCoopers LLP El Formulario 10-K, proxy, reporte de responsabilidad social, así como otra información financiera, están disponibles en nuestra página de Internet http://reporteanual.popular.com REUNIÓN ANUAL La Reunión Anual de Accionistas 2016 de Popular, Inc., se llevará a cabo el martes, 26 de abril, a las 9:00 a.m. en el piso PH de Popular Center, San Juan, Puerto Rico.

ANNUAL REPORT INFORME ANUAL 2015 POPULAR, INC. YEAR IN REVIEW “I am pleased to report that 2015 was a year of positive results and important achievements for Popular.” We strengthened our operations both in Puerto Rico and mainland United States, successfully managed credit quality, delivered solid financial results and further improved our capital position, despite the continued economic weakness in Puerto Rico and the uncertainty created by its ongoing fiscal crisis. We reported net income of $895 million for the year. This figure includes, among other significant items, the impact of the partial recapture of our deferred tax asset related to our operations in the United States. After adjusting for these items, net income totaled $375 million, compared to an adjusted net income of $301 million in 2014, representing an increase of 25%. These results were mainly driven by the impact of the accounting on the covered loan portfolio acquired in the Westernbank Federal Deposit Insurance Corporation (FDIC)-assisted transaction, lower provision for loan losses, higher fee income from our mortgage and insurance business lines and the contribution from the Doral Bank transaction offset in part by a higher effective tax rate. Credit quality remained stable in Puerto Rico despite the difficult economic environment, which, combined with excellent credit quality metrics in the United States business, translated into stable results on a consolidated level. Total non-performing assets at year-end stood at $843 million or 2.36% of assets, compared to $933 million or 2.82% of assets in 2014. Net charge-offs were stable and inflows into non-performing loans decreased when compared to the previous year. While encouraged by this stability, we remain attentive to economic trends. We are comfortable with the structure and size of our exposure to the Puerto Rico government. The majority of our direct exposure is in loans to municipalities with independent sources of revenue, not publicly traded securities of the central government or its public corporations. Our total outstanding exposure to the central government and public corporations represents only 1.9% of our total Tier 1 capital. We continue to monitor this portfolio closely and will make future adjustments as needed, while selectively participating in funding the Puerto Rico government’s capital needs where we feel the risk/reward is appropriate. In addition to a positive financial performance, we achieved significant milestones, including the Doral Bank transaction, the completion of the restructuring of our operations in the RICHARD L. CARRIÓN Chairman of the Board and Chief Executive Officer, Popular, Inc. United States and the reinstatement of a quarterly common stock dividend. In February of 2015, Popular acquired over $2 billion in assets from the FDIC as Receiver for Doral Bank. As part of the transaction, Banco Popular de Puerto Rico (BPPR) acquired eight branches, approximately $800 million in loans and $1 billion in deposits. BPPR also acquired $5 billion in mortgage servicing rights and Doral’s insurance agency portfolio. In the transaction, Popular Community Bank (PCB) acquired three branches in New York City, approximately $880 million in loans and $1.2 billion in deposits. Aside from the additional earning assets, the transaction was strategically significant since it solidified our leading position in Puerto Rico and provided additional momentum to our operations in the United States. The integration of the acquired operations was well executed, completing all systems conversions within a short period after the closing of the transaction. In 2015 we completed the restructuring of our operations in the United States. In 2014, we sold our California, Chicago and Central Florida regions to focus our business on the New York Metro and Miami regions and began the transfer of most support functions to Puerto Rico. We successfully completed the operational restructuring during the first half of 2015, leveraging our infrastructure and lower cost structure in Puerto Rico to reduce the number of back 1
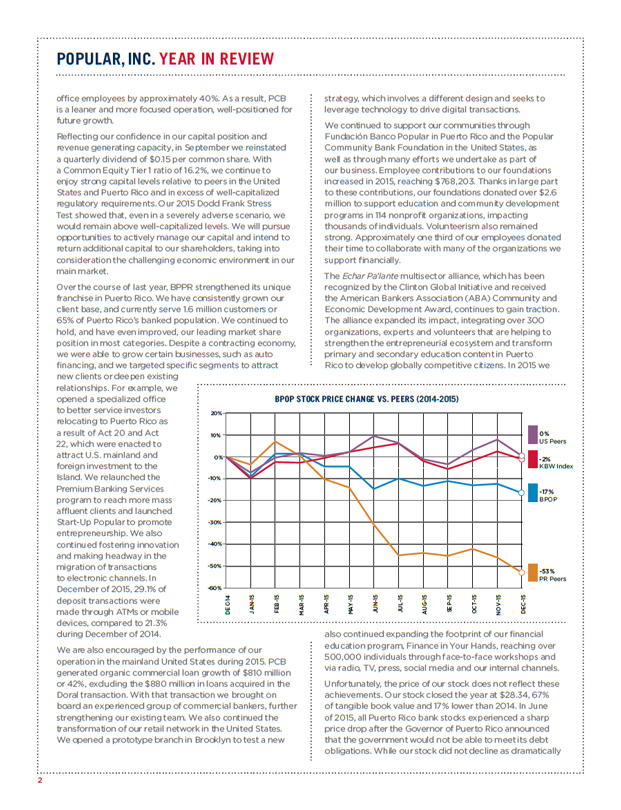
POPULAR, INC. YEAR IN REVIEW office employees by approximately 40%. As a result, PCB is a leaner and more focused operation, well-positioned for future growth. Reflecting our confidence in our capital position and revenue generating capacity, in September we reinstated a quarterly dividend of $0.15 per common share. With a Common Equity Tier 1 ratio of 16.2%, we continue to enjoy strong capital levels relative to peers in the United States and Puerto Rico and in excess of well-capitalized regulatory requirements. Our 2015 Dodd Frank Stress Test showed that, even in a severely adverse scenario, we would remain above well-capitalized levels. We will pursue opportunities to actively manage our capital and intend to return additional capital to our shareholders, taking into consideration the challenging economic environment in our main market. Over the course of last year, BPPR strengthened its unique franchise in Puerto Rico. We have consistently grown our client base, and currently serve 1.6 million customers or 65% of Puerto Rico’s banked population. We continued to hold, and have even improved, our leading market share position in most categories. Despite a contracting economy, we were able to grow certain businesses, such as auto financing, and we targeted specific segments to attract new clients or deepen existing relationships. For example, we opened a specialized office to better service investors relocating to Puerto Rico as a result of Act 20 and Act 22, which were enacted to attract U.S. mainland and foreign investment to the Island. We relaunched the Premium Banking Services program to reach more mass affluent clients and launched Start-Up Popular to promote entrepreneurship. We also continued fostering innovation and making headway in the migration of transactions to electronic channels. In December of 2015, 29.1% of deposit transactions were made through ATMs or mobile devices, compared to 21.3% during December of 2014. We are also encouraged by the performance of our operation in the mainland United States during 2015. PCB generated organic commercial loan growth of $810 million or 42%, excluding the $880 million in loans acquired in the Doral transaction. With that transaction we brought on board an experienced group of commercial bankers, further strengthening our existing team. We also continued the transformation of our retail network in the United States. We opened a prototype branch in Brooklyn to test a new strategy, which involves a different design and seeks to leverage technology to drive digital transactions. We continued to support our communities through Fundación Banco Popular in Puerto Rico and the Popular Community Bank Foundation in the United States, as well as through many efforts we undertake as part of our business. Employee contributions to our foundations increased in 2015, reaching $768,203. Thanks in large part to these contributions, our foundations donated over $2.6 million to support education and community development programs in 114 nonprofit organizations, impacting thousands of individuals. Volunteerism also remained strong. Approximately one third of our employees donated their time to collaborate with many of the organizations we support financially. The Echar Pa’lante multisector alliance, which has been recognized by the Clinton Global Initiative and received the American Bankers Association (ABA) Community and Economic Development Award, continues to gain traction. The alliance expanded its impact, integrating over 300 organizations, experts and volunteers that are helping to strengthen the entrepreneurial ecosystem and transform primary and secondary education content in Puerto Rico to develop globally competitive citizens. In 2015 we also continued expanding the footprint of our financial education program, Finance in Your Hands, reaching over 500,000 individuals through face-to-face workshops and via radio, TV, press, social media and our internal channels. Unfortunately, the price of our stock does not reflect these achievements. Our stock closed the year at $28.34, 67% of tangible book value and 17% lower than 2014. In June of 2015, all Puerto Rico bank stocks experienced a sharp price drop after the Governor of Puerto Rico announced that the government would not be able to meet its debt obligations. While our stock did not decline as dramatically BPOP STOCK PRICE CHANGE VS. PEERS (2014-2015) 20% 10% 0% US Peers 0% -2% KBW Index -17% BPOP -10% -20% -30% -40% -50% -53% PR Peers -60% DEC-14 JAN-15 FEB-15 MAR-15 APR-15 MAY-15 JUN-15 JUL-15 AUG-15 SEP-15 OCT-15 NOV-15 DEC -15 2

ANNUAL REPORT INFORME ANUAL 2015 as other local banks, we were not able to regain the lost ground when compared to the KBW NASDAQ Bank Index, which declined by 2% during 2015. It is clear that the Puerto Rico fiscal and economic situation and the related uncertainty stemming from it are hurting our stock price and overshadowing our solid financial results, limited government exposure and the reinstatement of the quarterly dividend. Puerto Rico is at a crossroads. Having nearly exhausted all potential sources of liquidity, even after resorting to unsustainable emergency measures, the government will soon run out of money to meet its obligations. Changes are inevitable and cannot be postponed any longer. An effective long-term solution for Puerto Rico’s fiscal and economic troubles must include three components: a legal framework to restructure Puerto Rico’s public debt in an orderly fashion, an effective fiscal oversight and control mechanism and stimulus measures to jumpstart the economy. These three components are like the legs of a three-legged stool – all necessary and not one of them sufficient by itself. The failure to include any one of these components will render the other two ineffective. Problems that took decades to create cannot be solved in months, or through the small or isolated efforts of one group or another. A real solution will require local and federal action, support from the executive and legislative branches, backing from all political parties and the active participation of all sectors of Puerto Rico society. While we have no direct control of the external environment or government actions, we remain involved and committed to doing everything in our power to be a positive influence, contribute in the search for long-term solutions and serve as a force that promotes economic growth on the Island. All the achievements I have shared with you are the result of the work of a team of talented and dedicated colleagues. The challenging situation in Puerto Rico, as well as the changes in our operations in the United States, have demanded a remarkable level of agility and commitment from our employees. As in the past, they have met these challenges head on and delivered results. I want to express my heartfelt gratitude to them for their efforts and to our management team for their leadership. During 2015 we expanded our Senior Management Team (SMT) to include two areas that, due to their strategic importance, merit direct representation at the organization’s highest level. Camille Burckhart, who has been a part of Popular since 2001 and has been leading the technology group for five years, was named Chief Information and Digital Officer. Manuel Chinea, who has 27 years of service at Popular and ample experience both in our Puerto Rico and mainland United States operations, joined the Senior Management Team as Chief Operating Officer of Popular Community Bank. Camille and Manuel have excelled throughout their careers at Popular not only for their solid performance, but also for demonstrating outstanding leadership skills. I also take this opportunity to thank our Board of Directors for their guidance and support. We are fortunate to be able to count on the counsel of such an experienced and dedicated group of professionals. Finally, I’d like to thank our customers in Puerto Rico, the Virgin Islands, New York, New Jersey and Florida for trusting us with their business and reiterate our commitment to meeting their current and future needs. As I look back to the last five years, I cannot help but feel proud of all we have accomplished, particularly under challenging circumstances. We have refocused our loan portfolio on business lines with a lower loss content, reduced non-performing assets through several bulk sales and the timely resolution of impaired loans, completed two FDIC-assisted acquisitions in Puerto Rico, restructured our operations in the United States, raised approximately $2 billion in common equity, repaid TARP and reinstated our common dividend. We are well prepared for the challenges that lie ahead. Popular’s story is to a large extent linked to Puerto Rico, its economy and its future. We are aware of that and remain committed to working to improve the Island’s prospects. But Popular’s is also a story of a solid organization that has navigated through a complex environment and has emerged as a stronger, better capitalized and more diversified institution. While we are pleased with these achievements, we are far from satisfied. We are committed to continue building on this solid foundation and delivering strong results for the benefit of all our stakeholders. RICHARD L. CARRIÓN Chairman of the Board and Chief Executive Officer Popular, Inc. 2015 HIGHLIGHTS ADJUSTED NET INCOME $375 MILLION ORGANIC COMMERCIAL LOAN GROWTH IN US 42% REINSTATEMENT OF QUARTERLY DIVIDENDS $0.15 share per common ROBUST CAPITAL METRICS 16.2% Common Equity Tier I 3
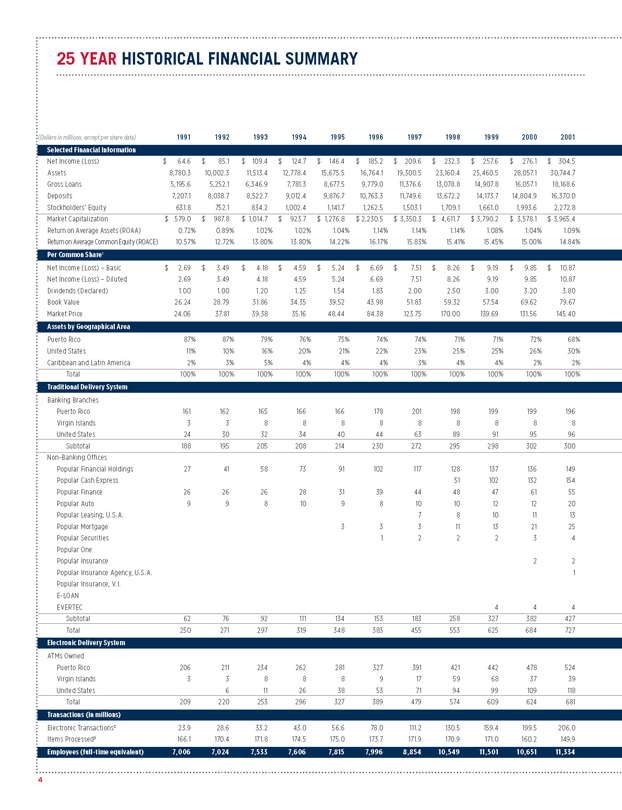
25 YEAR HISTORICAL FINANCIAL SUMMARY (Dollars in millions, except per share data) 1991 1992 1993 1994 1995 1996 1997 1998 1999 2000 2001 Selected Financial Information Net Income (Loss) $64.6 $85.1 $109.4 $124.7 $146.4 $185.2 $209.6 $232.3 $257.6 $276.1 $304.5 Assets 8,780.3 10,002.3 11,513.4 12,778.4 15,675.5 16,764.1 19,300.5 23,160.4 25,460.5 28,057.1 30,744.7 Gross Loans 5,195.6 5,252.1 6,346.9 7,781.3 8,677.5 9,779.0 11,376.6 13,078.8 14,907.8 16,057.1 18,168.6 Deposits 7,207.1 8,038.7 8,522.7 9,012.4 9,876.7 10,763.3 11,749.6 13,672.2 14,173.7 14,804.9 16,370.0 Stockholders’ Equity 631.8 752.1 834.2 1,002.4 1,141.7 1,262.5 1,503.1 1,709.1 1,661.0 1,993.6 2,272.8 Market Capitalization $579.0 $987.8 $1,014.7 $923.7 $1,276.8 $2,230.5 $3,350.3 $4,611.7 $3,790.2 $3,578.1 $3,965.4 Return on Average Assets (ROAA) 0.72% 0.89% 1.02% 1.02% 1.04% 1.14% 1.14% 1.14% 1.08% 1.04% 1.09% Return on Average Common Equity (ROACE) 10.57% 12.72% 13.80% 13.80% 14.22% 16.17% 15.83% 15.41% 15.45% 15.00% 14.84% Per Common Share 1 Net Income (Loss) – Basic $2.69 $3.49 $4.18 $4.59 $5.24 $6.69 $7.51 $8.26 $9.19 $9.85 $10.87 Net Income (Loss) – Diluted 2.69 3.49 4.18 4.59 5.24 6.69 7.51 8.26 9.19 9.85 10.87 Dividends (Declared) 1.00 1.00 1.20 1.25 1.54 1.83 2.00 2.50 3.00 3.20 3.80 Book Value 26.24 28.79 31.86 34.35 39.52 43.98 51.83 59.32 57.54 69.62 79.67 Market Price 24.06 37.81 39.38 35.16 48.44 84.38 123.75 170.00 139.69 131.56 145.40 Assets by Geographical Area Puerto Rico 87% 87% 79% 76% 75% 74% 74% 71% 71% 72% 68% United States 11% 10% 16% 20% 21% 22% 23% 25% 25% 26% 30% Caribbean and Latin America 2% 3% 5% 4% 4% 4% 3% 4% 4% 2% 2% Total 100% 100% 100% 100% 100% 100% 100% 100% 100% 100% 100% Traditional Delivery System Banking Branches Puerto Rico 161 162 165 166 166 178 201 198 199 199 196 Virgin Islands 3 3 8 8 8 8 8 8 8 8 8 United States 24 30 32 34 40 44 63 89 91 95 96 Subtotal 188 195 205 208 214 230 272 295 298 302 300 Non-Banking Offices Popular Financial Holdings 27 41 58 73 91 102 117 128 137 136 149 Popular Cash Express 51 102 132 154 Popular Finance 26 26 26 28 31 39 44 48 47 61 55 Popular Auto 9 9 8 10 9 8 10 10 12 12 20 Popular Leasing, U.S.A. 7 8 10 11 13 Popular Mortgage 3 3 3 11 13 21 25 Popular Securities 1 2 2 2 3 4 Popular One Popular Insurance 2 2 Popular Insurance Agency, U.S.A. 1 Popular Insurance, V.I. E-LOAN EVERTEC 4 4 4 Subtotal 62 76 92 111 134 153 183 258 327 382 427 Total 250 271 297 319 348 383 455 553 625 684 727 Electronic Delivery System ATMs Owned Puerto Rico 206 211 234 262 281 327 391 421 442 478 524 Virgin Islands 3 3 8 8 8 9 17 59 68 37 39 United States 6 11 26 38 53 71 94 99 109 118 Total 209 220 253 296 327 389 479 574 609 624 681 Transactions (in millions) Electronic Transactions 2 23.9 28.6 33.2 43.0 56.6 78.0 111.2 130.5 159.4 199.5 206.0 Items Processed 3 166.1 170.4 171.8 174.5 175.0 173.7 171.9 170.9 171.0 160.2 149.9 Employees (full-time equivalent) 7,006 7,024 7,533 7,606 7,815 7,996 8,854 10,549 11,501 10,651 11,334 4
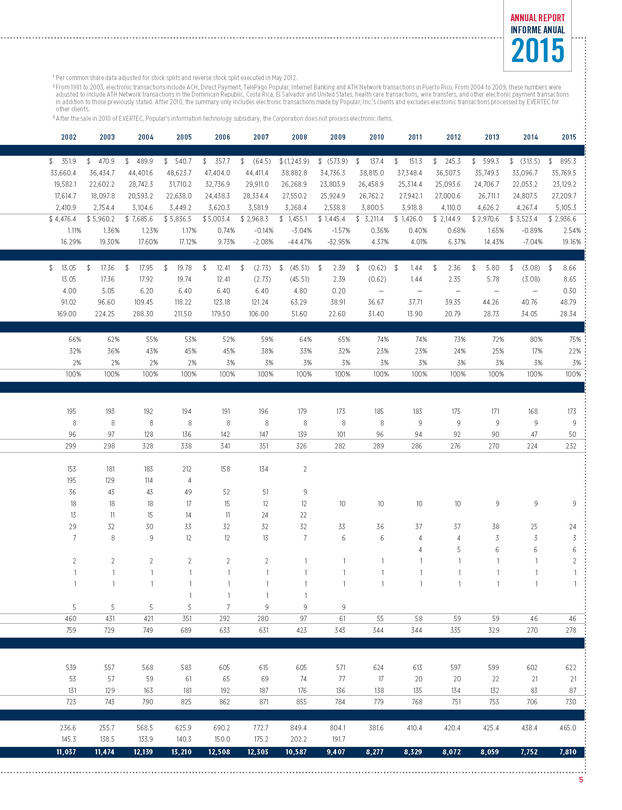
ANNUAL REPORT INFORME ANUAL 2015 1 Per common share data adjusted for stock splits and reverse stock split executed in May 2012. 2 From 1981 to 2003, electronic transactions include ACH, Direct Payment, TelePago Popular, Internet Banking and ATH Network transactions in Puerto Rico. From 2004 to 2009, these numbers were adjusted to include ATH Network transactions in the Dominican Republic, Costa Rica, El Salvador and United States, health care transactions, wire transfers, and other electronic payment transactions in addition to those previously stated. After 2010, the summary only includes electronic transactions made by Popular, Inc.’s clients and excludes electronic transactions processed by EVERTEC for other clients. 3 After the sale in 2010 of EVERTEC, Popular’s information technology subsidiary, the Corporation does not process electronic items. 2002 2003 2004 2005 2006 2007 2008 2009 2010 2011 2012 2013 2014 2015 $351.9 $470.9 $489.9 $540.7 $357.7 $(64.5) $(1,243.9) $(573.9) $137.4 $151.3 $245.3 $599.3 $(313.5) $895.3 33,660.4 36,434.7 44,401.6 48,623.7 47,404.0 44,411.4 38,882.8 34,736.3 38,815.0 37,348.4 36,507.5 35,749.3 33,096.7 35,769.5 19,582.1 22,602.2 28,742.3 31,710.2 32,736.9 29,911.0 26,268.9 23,803.9 26,458.9 25,314.4 25,093.6 24,706.7 22,053.2 23,129.2 17,614.7 18,097.8 20,593.2 22,638.0 24,438.3 28,334.4 27,550.2 25,924.9 26,762.2 27,942.1 27,000.6 26,711.1 24,807.5 27,209.72,410.9 2,754.4 3,104.6 3,449.2 3,620.3 3,581.9 3,268.4 2,538.8 3,800.5 3,918.8 4,110.0 4,626.2 4,267.4 5,105.3 $4,476.4 $5,960.2 $7,685.6 $5,836.5 $5,003.4 $2,968.3 $1,455.1 $1,445.4 $3,211.4 $1,426.0 $2,144.9 $2,970.6 $3,523.4 $2,936.6 1.11% 1.36% 1.23% 1.17% 0.74% -0.14% -3.04% -1.57% 0.36% 0.40% 0.68% 1.65% -0.89% 2.54% 16.29% 19.30% 17.60% 17.12% 9.73% -2.08% -44.47% -32.95% 4.37% 4.01% 6.37% 14.43% -7.04% 19.16% $13.05 $17.36 $17.95 $19.78 $12.41 $(2.73) $(45.51) $2.39 $(0.62) $1.44 $2.36 $5.80 $(3.08) $8.66 13.05 17.36 17.92 19.74 12.41 (2.73) (45.51) 2.39 (0.62) 1.44 2.35 5.78 (3.08) 8.65 4.00 5.05 6.20 6.40 6.40 6.40 4.80 0.20 — — — — — 0.30 91.02 96.60 109.45 118.22 123.18 121.24 63.29 38.91 36.67 37.71 39.35 44.26 40.76 48.79 169.00 224.25 288.30 211.50 179.50 106.00 51.60 22.60 31.40 13.90 20.79 28.73 34.05 28.34 66% 62% 55% 53% 52% 59% 64% 65% 74% 74% 73% 72% 80% 75% 32% 36% 43% 45% 45% 38% 33% 32% 23% 23% 24% 25% 17% 22% 2% 2% 2% 2% 3% 3% 3% 3% 3% 3% 3% 3% 3% 3% 100% 100% 100% 100% 100% 100% 100% 100% 100% 100% 100% 100% 100% 100% 195 193 192 194 191 196 179 173 185 183 175 171 168 173 8 8 8 8 8 8 8 8 8 9 9 9 9 9 96 97 128 136 142 147 139 101 96 94 92 90 47 50 299 298 328 338 341 351 326 282 289 286 276 270 224 232 153 181 183 212 158 134 2 195 129 114 4 36 43 43 49 52 51 9 18 18 18 17 15 12 12 10 10 10 10 9 9 9 13 11 15 14 11 24 22 29 32 30 33 32 32 32 33 36 37 37 38 25 24 7 8 9 12 12 13 7 6 6 4 4 3 3 3 4 5 6 6 6 2 2 2 2 2 2 1 1 1 1 1 1 1 2 1 1 1 1 1 1 1 1 1 1 1 1 1 1 1 1 1 1 1 1 1 1 1 1 1 1 1 1 1 1 1 1 5 5 5 5 7 9 9 9 460 431 421 351 292 280 97 61 55 58 59 59 46 46 759 729 749 689 633 631 423 343 344 344 335 329 270 278 539 557 568 583 605 615 605 571 624 613 597 599 602 622 53 57 59 61 65 69 74 77 17 20 20 22 21 21 131 129 163 181 192 187 176 136 138 135 134 132 83 87 723 743 790 825 862 871 855 784 779 768 751 753 706 730 236.6 255.7 568.5 625.9 690.2 772.7 849.4 804.1 381.6 410.4 420.4 425.4 438.4 465.0 145.3 138.5 133.9 140.3 150.0 175.2 202.2 191.7 11,037 11,474 12,139 13,210 12,508 12,303 10,587 9,407 8,277 8,329 8,072 8,059 7,752 7,810 5

POPULAR, INC. MANAGEMENT & BOARD OF DIRECTORS
SENIOR MANAGEMENT TEAM RICHARD L. CARRIÓN Chairman of the Board & Chief Executive Officer Popular, Inc.
IGNACIO ALVAREZ President & Chief Operating Officer Popular, Inc. and Banco Popular de Puerto Rico President Popular Community Bank
CAMILLE BURCKHART Executive Vice President & Chief Information and Digital Officer Technology & Digital Strategy Group Popular, Inc.
MANUEL A. CHINEA Executive Vice President Popular, Inc. Chief Operating Officer Popular Community Bank
JAVIER D. FERRER Executive Vice President, Chief Legal Officer & Corporate Secretary General Counsel & Corporate Matters Group Popular, Inc.
ILEANA GONZÁLEZ Executive Vice President Commercial Credit Administration Group Banco Popular de Puerto Rico
JUAN O. GUERRERO Executive Vice President Financial and Insurance Services Group Banco Popular de Puerto Rico
GILBERTO MONZÓN Executive Vice President Individual Credit Group Banco Popular de Puerto Rico
EDUARDO J. NEGRÓN Executive Vice President Administration Group Popular, Inc.
NÉSTOR O. RIVERA Executive Vice President Retail Banking Group Banco Popular de Puerto Rico
ELI S. SEPÚLVEDA Executive Vice President Commercial Credit Group Banco Popular de Puerto Rico
LIDIO V. SORIANO Executive Vice President & Chief Risk Officer Corporate Risk Management Group Popular, Inc.
CARLOS J. VÁZQUEZ Executive Vice President & Chief Financial Officer Popular, Inc.
BOARD OF DIRECTORS
RICHARD L. CARRIÓN Chairman of the Board & Chief Executive Officer Popular, Inc.
JOAQUÍN E. BACARDÍ, III President & Chief Executive Officer Bacardí Corporation
ALEJANDRO M. BALLESTER President Ballester Hermanos, Inc.
JOHN W. DIERCKSEN Principal Greycrest, LLC
MARÍA LUISA FERRÉ President & Chief Executive Officer Grupo Ferré Rangel
DAVID E. GOEL Managing General Partner Matrix Capital Management Company, LP
C. KIM GOODWIN Private Investor
WILLIAM J. TEUBER JR. Vice Chairman EMC Corporation
CARLOS A. UNANUE President Goya de Puerto Rico
6

ANNUAL REPORT
INFORME ANUAL
2015
POPULAR, INC.
RESUMEN DEL AÑO
“Me complace informarles que el 2015 fue un ańo de resultados positivos y logros importantes para Popular.”
Fortalecimos nuestras operaciones en Puerto Rico y Estados Unidos, administramos exitosamente la calidad del crédito, generamos sólidos resultados financieros y mejoramos nuestra posición de capital, a pesar de la continua debilidad económica en Puerto Rico y la incertidumbre creada por la crisis fiscal.
Reportamos un ingreso neto de $895 millones. Esta cifra incluye, entre otras partidas importantes, el impacto de un reverso parcial de la reserva de nuestro activo de contribuciones diferidas relacionado con nuestras operaciones en Estados Unidos. Luego de hacer ajustes por estas partidas, el ingreso neto totalizó $375 millones, en comparación con un ingreso neto ajustado de $301 millones en 2014, lo cual representa un aumento de 25%. Estos resultados se deben principalmente al impacto contable de la cartera de préstamos garantizados de Westernbank comprados en la adquisición asistida por el Federal Deposit Insurance Corporation (FDIC), una menor provisión para pérdidas en préstamos, mayores ingresos de nuestros negocios de hipotecas y seguros y la contribución de la transacción de Doral, parcialmente contrarrestados por una tasa contributiva efectiva más alta.
La calidad del crédito permaneció estable en Puerto Rico a pesar del difícil ambiente económico, lo cual, en combinación con las excelentes métricas de calidad de crédito en Estados Unidos, se tradujo en resultados estables a nivel consolidado. Al cierre del año, el total de activos no acumulativos era de $843 millones o 2.36% de los activos, en comparación con $933 millones o 2.82% de los activos en el 2014. Las pérdidas netas en préstamos se mantuvieron estables y la cantidad de préstamos que se tornaron en préstamos no acumulativos se redujo en comparación con el año anterior. Aunque nos sentimos alentados por esta estabilidad, permanecemos atentos a las tendencias de la economía.
Nos sentimos cómodos con la estructura y el tamaño de nuestra exposición al gobierno de Puerto Rico. La mayor parte de nuestra exposición directa consiste de préstamos a municipios con fuentes independientes de ingresos y no de valores del gobierno central o sus corporaciones públicas. El total de nuestra exposición vigente correspondiente al gobierno central y las corporaciones públicas representa sólo el 1.9% del capital básico (Tier 1 Capital). Continuamos monitoreando de cerca esta cartera y haremos ajustes en el futuro según sea necesario, a la misma vez que participaremos selectivamente en el financiamiento de las necesidades de capital del gobierno de Puerto Rico cuando determinemos que la relación entre el riesgo y recompensa es apropiada.
RICHARD L. CARRIÓN
Presidente de la Junta de Directores y Principal Oficial Ejecutivo, Popular, Inc.
Además de un desempeño financiero positivo, alcanzamos metas significativas, incluyendo la transacción de Doral Bank, la finalización de la restructuración de nuestras operaciones en Estados Unidos y el restablecimiento de un dividendo trimestral sobre la acción común.
En febrero de 2015, Popular adquirió más de $2,000 millones en activos de la FDIC como síndico liquidador de Doral Bank. Como parte de la transacción, Banco Popular de Puerto Rico (BPPR) adquirió ocho sucursales, aproximadamente $800 millones en préstamos y $1,000 millones en depósitos. BPPR también adquirió $5,000 millones en derechos para el servicio de hipotecas y la cartera de la agencia de seguros de Doral. Popular Community Bank (PCB) adquirió tres sucursales en Nueva York, aproximadamente $880 millones en préstamos y $1,200 millones en depósitos. Aparte de los activos adicionales, la transacción fue extremadamente importante desde un punto de vista estratégico ya que consolidó nuestra posición de liderazgo en Puerto Rico y dio un impulso adicional a nuestras operaciones en Estados Unidos. La integración de las operaciones adquiridas fue bien ejecutada, completando todas las conversiones en un corto período después de culminada la transacción.
En el 2015 terminamos la reestructuración de nuestras operaciones en los Estados Unidos. En el 2014, vendimos nuestras regiones de California, Chicago y Florida Central para enfocar nuestro negocio en las regiones de Nueva York Metro y Miami, y comenzamos la transferencia de la mayoría de las funciones de apoyo a Puerto Rico. Finalizamos con
7
POPULAR, INC. RESUMEN DEL AÑO
éxito la restructuración operacional durante la primera mitad del 2015, aprovechando la infraestructura existente y la estructura de costos menores en Puerto Rico para reducir el número de empleados de apoyo en un 40%. Como resultado, PCB es una operación más ágil y enfocada, que está bien posicionada para crecimiento en el futuro.
Como reflejo de la confianza que tenemos en nuestra posición de capital y capacidad de generar ingresos, en septiembre restablecimos un dividendo trimestral de $0.15 por acción común. Con una relación de capital básico (Common Equity Tier 1 ratio) de 16.2%, continuamos disfrutando fuertes niveles de capital en comparación con nuestros pares en Estados Unidos y Puerto Rico, al igual que mantenemos capital en exceso de los requisitos reglamentarios de buena capitalización. Nuestros resultados del Dodd Frank Stress Test demostraron que, aun en un escenario severamente adverso, nos mantendríamos sobre el nivel de capitalización saludable. Buscaremos oportunidades para administrar activamente nuestro capital y tenemos intención de devolver capital adicional a nuestros accionistas, tomando en consideración el desafiante ambiente económico de nuestro principal mercado.
Durante el año pasado, Banco Popular fortaleció aún más su franquicia en Puerto Rico. Aumentamos consistentemente nuestra base de clientes y actualmente servimos a 1.6 millones de clientes o el 65% de la población que utiliza servicios bancarios. Seguimos manteniendo, y en la mayoría de las categorías hemos mejorado, nuestra posición de liderazgo en participación de mercado. A pesar de una economía en contracción, logramos crecer algunos de nuestros negocios, tales como el financiamiento de autos, y nos enfocamos en segmentos específicos para atraer nuevos clientes o profundizar relaciones existentes. Por ejemplo, inauguramos una oficina especializada para servir mejor a inversionistas que se mudan a Puerto Rico como resultado de la Ley 20 y la Ley 22, dirigidas a atraer inversión de Estados Unidos y extranjera a la Isla. Rediseñamos el programa de Servicios Bancarios Premium para llegar a más clientes afluentes y lanzamos Start-Up Popular para promover el empresarismo. También continuamos innovando y haciendo avances en la migración de transacciones a canales electrónicos. En diciembre de 2015, el 29.1% de las transacciones de depósitos se hicieron a través de cajeros automáticos o dispositivos móviles, en comparación con el 21.3% durante diciembre de 2014.
Nos sentimos alentados además por el desempeño que tuvo nuestra operación en los Estados Unidos durante el 2015. En préstamos comerciales, PCB logró un crecimiento orgánico de $810 millones o 42%, excluyendo los $880 millones en préstamos adquiridos en la transacción de Doral. Con esta transacción trajimos a bordo un grupo experimentado de banqueros comerciales, que fortaleció aún más el equipo existente. También continuamos transformando nuestra red de distribución en Estados Unidos. Inauguramos una sucursal prototipo en Brooklyn para probar una nueva estrategia que incluye un diseño diferente que busca promover las transacciones digitales.
Continuamos apoyando a nuestras comunidades a través de la Fundación Banco Popular en Puerto Rico y Popular Community Bank Foundation en Estados Unidos, al igual que a través de muchos esfuerzos que realizamos como parte de nuestro negocio. La contribución voluntaria de los empleados a nuestras fundaciones aumentó en el 2015, alcanzando $768,203. Gracias a estas aportaciones, ambas fundaciones donaron, en total, sobre $2.6 millones a 114 organizaciones sin fines de lucro en apoyo de la educación y programas de desarrollo comunitario, impactando miles de personas. El voluntariado permanece fuerte. Aproximadamente una tercera parte de nuestros empleados dio de su tiempo para colaborar con organizaciones que apoyamos financieramente.
La alianza multisectorial Echar Pa’lante, que ha sido reconocida por el Clinton Global Iniatitive y recipiente del American Bankers Association Community and Economic Development Award, continúa fortaleciéndose. La alianza expandió su alcance, integrando sobre 300 organizaciones, expertos y voluntarios que están ayudando a fortalecer el espíritu empresarial y a transformar el currículo de la educación elemental y secundaria en Puerto Rico para desarrollar ciudadanos competitivos de clase mundial. En el 2015 continuamos ampliando la huella de nuestro programa de educación financiera, Finanzas en tus Manos, llegando a sobre 500,000 personas a través de talleres y medios de comunicación, como radio, televisión, prensa, redes sociales y canales internos.
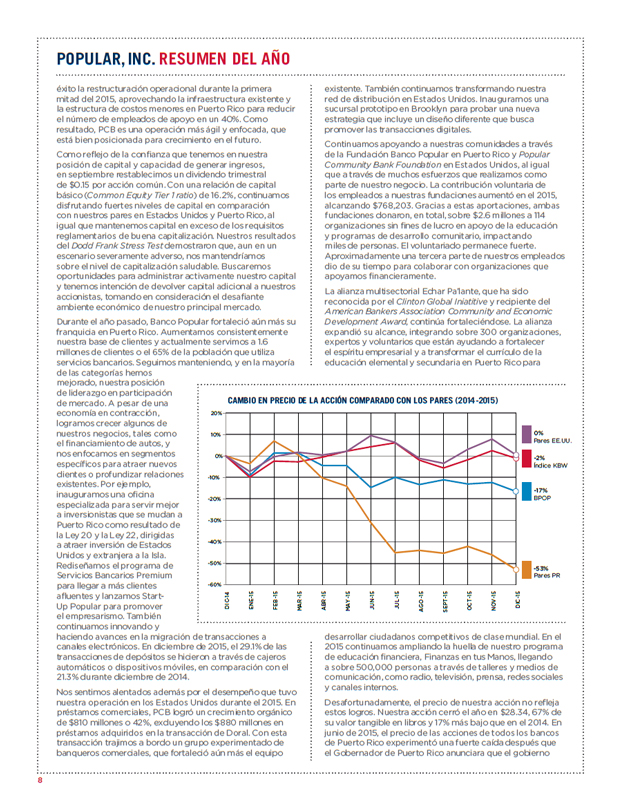
Desafortunadamente, el precio de nuestra acción no refleja estos logros. Nuestra acción cerró el ańo en $28.34, 67% de su valor tangible en libros y 17% más bajo que en el 2014. En junio de 2015, el precio de las acciones de todos los bancos de Puerto Rico experimentó una fuerte caída después que el Gobernador de Puerto Rico anunciara que el gobierno
CAMBIO EN PRECIO DE LA ACCIÓN COMPARADO CON LOS PARES (2014-2015)
20% 10% 0% -10% -20% -30% -40% -50% -60%
0%
Pares EE.UU.
-2%
Índice KBW
-17%
-53%
Pares PR
DIC-14 ENE-15 FEB-15 MAR-15 ABR-15 MAY-15 JUN-15 JUL-15 AGO-15 SEPT-15 OCT-15 NOV-15 DIC-15
8
ANNUAL REPORT
INFORME ANUAL
2015
no sería capaz de cumplir con sus obligaciones de deuda. Aunque nuestra acción no declinó tan dramáticamente como la de otros bancos, no pudimos recuperar el terreno perdido al compararla con el Índice Bancario KBW NASDAQ, que disminuyó un 2% durante el 2015. Es evidente que las preocupaciones relacionadas con la situación económica y fiscal de Puerto Rico, y la incertidumbre que ésta causa, están afectando el precio de nuestra acción y pesando más que nuestros sólidos resultados financieros, baja exposición al gobierno y el restablecimiento de nuestro dividendo trimestral.
Puerto Rico está en una encrucijada. Tras haber agotado todas sus fuentes potenciales de liquidez, y luego de implantar medidas insostenibles de emergencia, pronto el gobierno no tendrá dinero para cumplir con sus obligaciones. Los cambios son inevitables y ya no podrán ser pospuestos. Una solución efectiva a largo plazo para los problemas fiscales y económicos de Puerto Rico debe incluir tres componentes: un marco legal para restructurar la deuda pública de Puerto Rico de una manera ordenada, un mecanismo efectivo de supervisión y control fiscal, y los estímulos necesarios para reactivar la economía. Estos componentes son como las tres patas de un taburete – todos son necesarios y ninguno es suficiente por sí solo. De no incluirse uno de esos componentes, los otros dos serán inefectivos.
Los problemas que tomaron varias décadas en crearse no se pueden solucionar en meses, o mediante esfuerzos pequeños y aislados de uno u otro grupo. Una solución real requerirá acción local y federal, apoyo de las ramas ejecutiva y legislativa, respaldo de todos los partidos políticos y la participación activa de todos los sectores de la sociedad puertorriqueña. Aunque no tenemos control directo del ambiente externo ni de las acciones gubernamentales, nos mantenemos involucrados y comprometidos con hacer todo lo posible para ser una influencia positiva, contribuir a la búsqueda de soluciones a largo plazo y continuar siendo una fuerza que promueve el desarrollo económico de la Isla.
Todos los logros que he compartido con ustedes son el resultado del trabajo de un equipo de compañeros talentosos y dedicados. La situación desafiante en Puerto Rico, al igual que los cambios en nuestras operaciones en Estados Unidos, ha requerido un nivel excepcional de agilidad y compromiso de parte de nuestros empleados. Como han hecho en el pasado, enfrentaron estos retos de frente y generaron resultados. Les extiendo a ellos mi más sincero agradecimiento por sus esfuerzos y a nuestro equipo gerencial por su liderazgo.
Durante el 2015 expandimos el Consejo Gerencial para incluir dos áreas que, debido a su importancia estratégica, ameritan una representación directa en el nivel más alto de la organización. Camille Burckhart, quien forma parte de Popular desde el 2001 y ha liderado el grupo de tecnología por los pasados cinco años, fue nombrada Principal Oficial de Informática y Estrategia Digital. Manuel Chinea, quien tiene 27 años de servicio con Popular y una amplia experiencia tanto en las operaciones de Puerto Rico como en las de Estados Unidos, se unió al Consejo Gerencial como Principal Oficial de Operaciones de Popular Community Bank. A través de los años, Camille y Manuel han tenido carreras destacadas en Popular, no solo por un sólido desempeño, sino también por demostrar extraordinarias destrezas de liderazgo.
Aprovecho esta oportunidad para agradecer a nuestra Junta de Directores por su dirección y apoyo. Somos afortunados de contar con el consejo de un grupo de profesionales tan experimentados y dedicados.
También, quiero dar las gracias a nuestros clientes en Puerto Rico, Islas Vírgenes, Nueva York, Nueva Jersey y Florida por confiarnos su negocio y reiteramos nuestro compromiso con atender sus necesidades actuales y futuras.
Cuando miro atrás a los pasados cinco años, no puedo evitar sentirme orgulloso de todo lo que hemos logrado, particularmente bajo circunstancias retantes. Reenfocamos nuestra cartera de préstamos en líneas de negocio con un menor contenido de pérdidas, redujimos los activos no acumulativos a través de varias ventas de grupos de activos y la resolución oportuna de préstamos no productivos, completamos dos adquisiciones asistidas por el FDIC en Puerto Rico, reestructuramos nuestras operaciones en Estados Unidos, levantamos aproximadamente $2,000 millones en capital común, repagamos el TARP y restauramos nuestro dividendo a las acciones comunes. Estamos listos para los retos venideros.
La historia de Popular está muy ligada a Puerto Rico, su economía y su futuro. Conscientes de eso, seguimos comprometidos a trabajar para mejorar el panorama de la Isla. Nuestra historia ilustra también una organización sólida que ha navegado a través de un ambiente complejo, y ha resurgido como una institución más fuerte, mejor capitalizada y más diversificada.
Aunque nos sentimos complacidos con estos logros, estamos lejos de estar satisfechos. Seguimos comprometidos con seguir construyendo sobre esta base sólida y generando resultados sólidos para beneficio de nuestros accionistas, clientes, empleados y comunidades que servimos.
RICHARD L. CARRIÓN
Presidente de la Junta de Directores y Principal Oficial Ejecutivo
Popular, Inc.
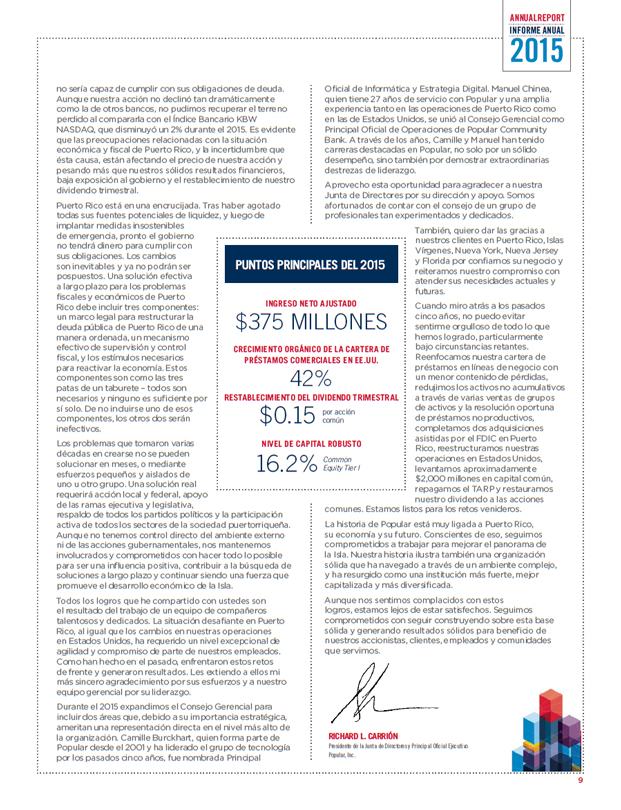
PUNTOS PRINCIPALES DEL 2015
INGRESO NETO AJUSTADO
$375 MILLONES
CRECIMIENTO ORGÁNICO DE LA CARTERA DE
PRÉSTAMOS COMERCIALES EN EE.UU.
42%
RESTABLECIMIENTO DEL DIVIDENDO TRIMESTRAL
por acción
$0.15 común
NIVEL DE CAPITAL ROBUSTO
Common
16.2% Equity Tier I
9
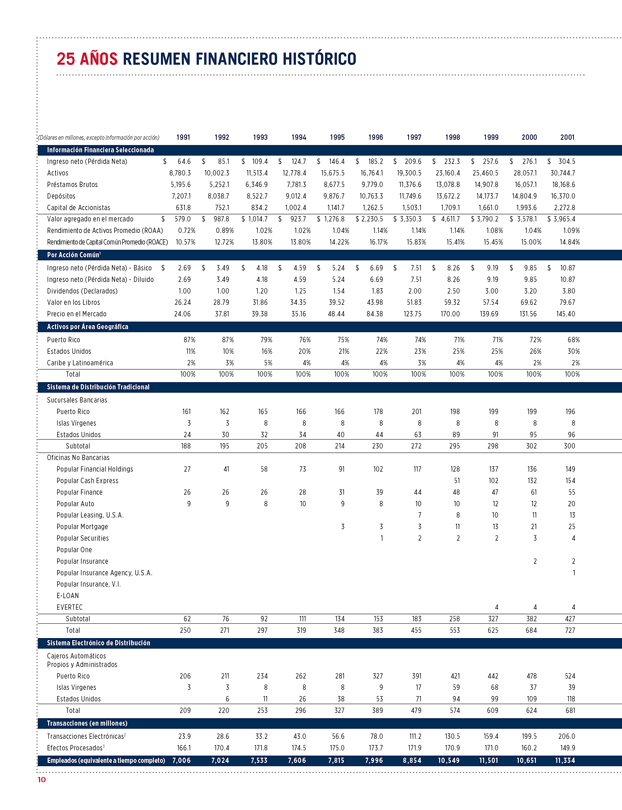
25 AÑOS RESUMEN FINANCIERO HISTÓRICO
(Dólares en millones, excepto información por acción) 1991 1992 1993 1994 1995 1996 1997 1998 1999 2000 2001
Información Financiera Seleccionada
Ingreso neto (Pérdida Neta) $ 64.6 $ 85.1 $ 109.4 $ 124.7 $ 146.4 $ 185.2 $ 209.6 $ 232.3 $ 257.6 $ 276.1 $ 304.5
Activos 8,780.3 10,002.3 11,513.4 12,778.4 15,675.5 16,764.1 19,300.5 23,160.4 25,460.5 28,057.1 30,744.7
Préstamos Brutos 5,195.6 5,252.1 6,346.9 7,781.3 8,677.5 9,779.0 11,376.6 13,078.8 14,907.8 16,057.1 18,168.6
Depósitos 7,207.1 8,038.7 8,522.7 9,012.4 9,876.7 10,763.3 11,749.6 13,672.2 14,173.7 14,804.9 16,370.0
Capital de Accionistas 631.8 752.1 834.2 1,002.4 1,141.7 1,262.5 1,503.1 1,709.1 1,661.0 1,993.6 2,272.8
Valor agregado en el mercado $ 579.0 $ 987.8 $ 1,014.7 $ 923.7 $ 1,276.8 $ 2,230.5 $ 3,350.3 $ 4,611.7 $ 3,790.2 $ 3,578.1 $ 3,965.4
Rendimiento de Activos Promedio (ROAA) 0.72% 0.89% 1.02% 1.02% 1.04% 1.14% 1.14% 1.14% 1.08% 1.04% 1.09%
Rendimiento de Capital Común Promedio (ROACE) 10.57% 12.72% 13.80% 13.80% 14.22% 16.17% 15.83% 15.41% 15.45% 15.00% 14.84%
Por Acción Común 1
Ingreso neto (Pérdida Neta) - Básico $ 2.69 $ 3.49 $ 4.18 $ 4.59 $ 5.24 $ 6.69 $ 7.51 $ 8.26 $ 9.19 $ 9.85 $ 10.87
Ingreso neto (Pérdida Neta) - Diluido 2.69 3.49 4.18 4.59 5.24 6.69 7.51 8.26 9.19 9.85 10.87
Dividendos (Declarados) 1.00 1.00 1.20 1.25 1.54 1.83 2.00 2.50 3.00 3.20 3.80
Valor en los Libros 26.24 28.79 31.86 34.35 39.52 43.98 51.83 59.32 57.54 69.62 79.67
Precio en el Mercado 24.06 37.81 39.38 35.16 48.44 84.38 123.75 170.00 139.69 131.56 145.40
Activos por Área Geográfica
Puerto Rico 87% 87% 79% 76% 75% 74% 74% 71% 71% 72% 68%
Estados Unidos 11% 10% 16% 20% 21% 22% 23% 25% 25% 26% 30%
Caribe y Latinoamérica 2% 3% 5% 4% 4% 4% 3% 4% 4% 2% 2%
Total 100% 100% 100% 100% 100% 100% 100% 100% 100% 100% 100%
Sistema de Distribución Tradicional
Sucursales Bancarias
Puerto Rico 161 162 165 166 166 178 201 198 199 199 196
Islas Vírgenes 3 3 8 8 8 8 8 8 8 8 8
Estados Unidos 24 30 32 34 40 44 63 89 91 95 96
Subtotal 188 195 205 208 214 230 272 295 298 302 300
Oficinas No Bancarias
Popular Financial Holdings 27 41 58 73 91 102 117 128 137 136 149
Popular Cash Express 51 102 132 154
Popular Finance 26 26 26 28 31 39 44 48 47 61 55
Popular Auto 9 9 8 10 9 8 10 10 12 12 20
Popular Leasing, U.S.A. 7 8 10 11 13
Popular Mortgage 3 3 3 11 13 21 25
Popular Securities 1 2 2 2 3 4
Popular One
Popular Insurance 2 2
Popular Insurance Agency, U.S.A. 1
Popular Insurance, V.I.
E-LOAN
EVERTEC 4 4 4
Subtotal 62 76 92 111 134 153 183 258 327 382 427
Total 250 271 297 319 348 383 455 553 625 684 727
Sistema Electrónico de Distribución
Cajeros Automáticos
Propios y Administrados
Puerto Rico 206 211 234 262 281 327 391 421 442 478 524
Islas Virgenes 3 3 8 8 8 9 17 59 68 37 39
Estados Unidos 6 11 26 38 53 71 94 99 109 118
Total 209 220 253 296 327 389 479 574 609 624 681
Transacciones (en millones)
Transacciones Electrónicas2 23.9 28.6 33.2 43.0 56.6 78.0 111.2 130.5 159.4 199.5 206.0
Efectos Procesados3 166.1 170.4 171.8 174.5 175.0 173.7 171.9 170.9 171.0 160.2 149.9
Empleados (equivalente a tiempo completo) 7,006 7,024 7,533 7,606 7,815 7,996 8,854 10,549 11,501 10,651 11,334
10
ANNUAL REPORT
INFORME ANUAL
2015
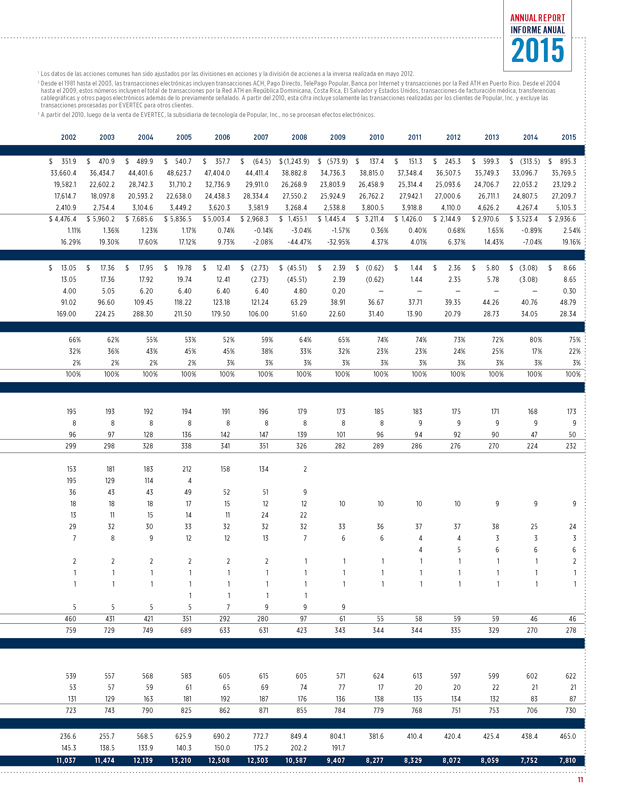
1 Los datos de las acciones comunes han sido ajustados por las divisiones en acciones y la división de acciones a la inversa realizada en mayo 2012.
2 Desde el 1981 hasta el 2003, las transacciones electrónicas incluyen transacciones ACH, Pago Directo, TelePago Popular, Banca por Internet y transacciones por la Red ATH en Puerto Rico. Desde el 2004 hasta el 2009, estos números incluyen el total de transacciones por la Red ATH en República Dominicana, Costa Rica, El Salvador y Estados Unidos, transacciones de facturación médica, transferencias cablegráficas y otros pagos electrónicos además de lo previamente señalado. A partir del 2010, esta cifra incluye solamente las transacciones realizadas por los clientes de Popular, Inc. y excluye las transacciones procesadas por EVERTEC para otros clientes.
3 A partir del 2010, luego de la venta de EVERTEC, la subsidiaria de tecnología de Popular, Inc., no se procesan efectos electrónicos.
2002 2003 2004 2005 2006 2007 2008 2009 2010 2011 2012 2013 2014 2015
$ 351.9 $ 470.9 $ 489.9 $ 540.7 $ 357.7 $ (64.5) $ (1,243.9) $ (573.9) $ 137.4 $ 151.3 $ 245.3 $ 599.3 $ (313.5) $ 895.3
33,660.4 36,434.7 44,401.6 48,623.7 47,404.0 44,411.4 38,882.8 34,736.3 38,815.0 37,348.4 36,507.5 35,749.3 33,096.7 35,769.5
19,582.1 22,602.2 28,742.3 31,710.2 32,736.9 29,911.0 26,268.9 23,803.9 26,458.9 25,314.4 25,093.6 24,706.7 22,053.2 23,129.2
17,614.7 18,097.8 20,593.2 22,638.0 24,438.3 28,334.4 27,550.2 25,924.9 26,762.2 27,942.1 27,000.6 26,711.1 24,807.5 27,209.7
2,410.9 2,754.4 3,104.6 3,449.2 3,620.3 3,581.9 3,268.4 2,538.8 3,800.5 3,918.8 4,110.0 4,626.2 4,267.4 5,105.3
$ 4,476.4 $ 5,960.2 $ 7,685.6 $ 5,836.5 $ 5,003.4 $ 2,968.3 $ 1,455.1 $ 1,445.4 $ 3,211.4 $ 1,426.0 $ 2,144.9 $ 2,970.6 $ 3,523.4 $ 2,936.6
1.11% 1.36% 1.23% 1.17% 0.74% -0.14% -3.04% -1.57% 0.36% 0.40% 0.68% 1.65% -0.89% 2.54%
16.29% 19.30% 17.60% 17.12% 9.73% -2.08% -44.47% -32.95% 4.37% 4.01% 6.37% 14.43% -7.04% 19.16%
$ 13.05 $ 17.36 $ 17.95 $ 19.78 $ 12.41 $ (2.73) $ (45.51) $ 2.39 $ (0.62) $ 1.44 $ 2.36 $ 5.80 $ (3.08) $ 8.66
13.05 17.36 17.92 19.74 12.41 (2.73) (45.51) 2.39 (0.62) 1.44 2.35 5.78 (3.08) 8.65
4.00 5.05 6.20 6.40 6.40 6.40 4.80 0.20 – – – – – 0.30
91.02 96.60 109.45 118.22 123.18 121.24 63.29 38.91 36.67 37.71 39.35 44.26 40.76 48.79
169.00 224.25 288.30 211.50 179.50 106.00 51.60 22.60 31.40 13.90 20.79 28.73 34.05 28.34
66% 62% 55% 53% 52% 59% 64% 65% 74% 74% 73% 72% 80% 75%
32% 36% 43% 45% 45% 38% 33% 32% 23% 23% 24% 25% 17% 22%
2% 2% 2% 2% 3% 3% 3% 3% 3% 3% 3% 3% 3% 3%
100% 100% 100% 100% 100% 100% 100% 100% 100% 100% 100% 100% 100% 100%
195 193 192 194 191 196 179 173 185 183 175 171 168 173
8 8 8 8 8 8 8 8 8 9 9 9 9 9
96 97 128 136 142 147 139 101 96 94 92 90 47 50
299 298 328 338 341 351 326 282 289 286 276 270 224 232
153 181 183 212 158 134 2
195 129 114 4
36 43 43 49 52 51 9
18 18 18 17 15 12 12 10 10 10 10 9 9 9
13 11 15 14 11 24 22
29 32 30 33 32 32 32 33 36 37 37 38 25 24
7 8 9 12 12 13 7 6 6 4 4 3 3 3
4 5 6 6 6
2 2 2 2 2 2 1 1 1 1 1 1 1 2
1 1 1 1 1 1 1 1 1 1 1 1 1 1
1 1 1 1 1 1 1 1 1 1 1 1 1 1
1 1 1 1
5 5 5 5 7 9 9 9
460 431 421 351 292 280 97 61 55 58 59 59 46 46
759 729 749 689 633 631 423 343 344 344 335 329 270 278
539 557 568 583 605 615 605 571 624 613 597 599 602 622
53 57 59 61 65 69 74 77 17 20 20 22 21 21
131 129 163 181 192 187 176 136 138 135 134 132 83 87
723 743 790 825 862 871 855 784 779 768 751 753 706 730
236.6 255.7 568.5 625.9 690.2 772.7 849.4 804.1 381.6 410.4 420.4 425.4 438.4 465.0
145.3 138.5 133.9 140.3 150.0 175.2 202.2 191.7
11,037 11,474 12,139 13,210 12,508 12,303 10,587 9,407 8,277 8,329 8,072 8,059 7,752 7,810
11

POPULAR, INC. GERENCIA Y JUNTA DE DIRECTORES
EQUIPO GERENCIAL EJECUTIVO RICHARD L. CARRIÓN Presidente de la Junta de Directores y Principal Oficial Ejecutivo Popular, Inc. IGNACIO ALVAREZ Presidente y Principal Oficial de Operaciones Popular, Inc. y Banco Popular de Puerto Rico Presidente Popular Community Bank
CAMILLE BURCKHART MANUEL A. CHINEA JAVIER D. FERRER
Vicepresidenta Ejecutiva y Vicepresidente Ejecutivo Vicepresidente Ejecutivo, Principal
Principal Oficial de Informática y Popular, Inc. Oficial Legal y Secretario Corporativo
Estrategia Digital Principal Oficial de Operaciones Grupo de Consejería General y
Grupo de Tecnología y Popular Community Bank Asuntos Corporativos
Estrategia Digital Popular, Inc.
Popular, Inc.
ILEANA GONZÁLEZ JUAN O. GUERRERO GILBERTO MONZÓN
Vicepresidenta Ejecutiva Vicepresidente Ejecutivo Vicepresidente Ejecutivo
Grupo de Administración Grupo de Servicios Grupo de Crédito a Individuo
de Crédito Comercial Financieros y Seguros Banco Popular de Puerto Rico
Banco Popular de Puerto Rico Banco Popular de Puerto Rico
EDUARDO J. NEGRÓN NÉSTOR O. RIVERA ELI S. SEPÚLVEDA
Vicepresidente Ejecutivo Vicepresidente Ejecutivo Vicepresidente Ejecutivo
Grupo de Administración Grupo de Banca Individual Grupo de Crédito Comercial
Popular, Inc. Banco Popular de Puerto Rico Banco Popular de Puerto Rico
LIDIO V. SORIANO CARLOS J. VÁZQUEZ
Vicepresidente Ejecutivo y Vicepresidente Ejecutivo
Principal Oficial de Riesgo y Principal Oficial
Grupo Corporativo de Manejo Financiero
de Riesgo Popular, Inc.
Popular, Inc.
JUNTA DE DIRECTORES
RICHARD L. CARRIÓN JOAQUÍN E. BACARDÍ, III ALEJANDRO M. BALLESTER
Presidente de la Junta Presidente y Principal Presidente
de Directores y Principal Oficial Ejecutivo Ballester Hermanos, Inc.
Oficial Ejecutivo Bacardí Corporation
Popular, Inc.
JOHN W. DIERCKSEN MARÍA LUISA FERRÉ DAVID E. GOEL
Principal Presidenta y Principal Socio Gerente General
Greycrest, LLC Oficial Ejecutiva Matrix Capital Management
Grupo Ferré Rangel Company, LP
C. KIM GOODWIN WILLIAM J. TEUBER JR. CARLOS A. UNANUE
Inversionista Privada Vicepresidente Ejecutivo Presidente
EMC Corporation Goya de Puerto Rico
12

BPPR POPULAR®
P.O. BOX 362708 | SAN JUAN, PUERTO RICO 00936-2708
Financial Review and
Supplementary Information
1
Management’s Discussion and
Analysis of Financial Condition
and Results of Operations
2
The following Management’s Discussion and Analysis (“MD&A”) provides information which management believes is necessary for understanding the financial performance of Popular, Inc. and its subsidiaries (the “Corporation” or “Popular”). All accompanying tables, consolidated financial statements, and corresponding notes included in this “Financial Review and SupplementaryInformation - 2015 Annual Report” (“the report”) should be considered an integral part of this MD&A.
FORWARD-LOOKING STATEMENTS
The information included in this report contains certain forward-looking statements within the meaning of the Private Securities Litigation Reform Act of 1995. These forward-looking statements may relate to Popular, Inc’s (“Popular”, the “Corporation”, “we”, “us”, “our”) financial condition, results of operations, plans, objectives, future performance and business, including, but not limited to, statements with respect to the adequacy of the allowance for loan losses, delinquency trends, market risk and the impact of interest rate changes, capital market conditions, capital adequacy and liquidity, the anticipated impacts of our acquisition of certain assets and deposits (other than certain brokered deposits) of Doral Bank from the Federal Deposit Insurance Corporation (“FDIC”) as receiver, including transaction expenses and our expectation that the transaction will be accretive, and the effect of legal proceedings and new accounting standards on the Corporation’s financial condition and results of operations. All statements contained herein that are not clearly historical in nature are forward-looking, and the words “anticipate”, “believe”, “continues”, “expect”, “estimate”, “intend”, “project” and similar expressions and future or conditional verbs such as “will”, “would”, “should”, “could”, “might”, “can”, “may” or similar expressions are generally intended to identify forward-looking statements.
Forward-looking statements are not guarantees of future performance are based on management’s current expectations and, by their nature, involve certain risks, uncertainties, estimates and assumptions by management that are difficult to predict. Various factors, some of which are beyond the Corporation’s control, could cause actual results to differ materially from those expressed in, or implied by, such forward-looking statements. Factors that might cause such a difference include, but are not limited to, the rate of growth in the economy and employment levels, as well as general business and economic conditions in the geographic areas we serve; changes in interest rates, as well as the magnitude of such changes; the fiscal and monetary policies of the federal government and its agencies; changes in federal bank regulatory and supervisory policies, including required levels of capital and the impact of proposed capital standards on our capital ratios; the impact of the Dodd-Frank Wall Street Reform and Consumer Protection Act (Financial Reform Act) on the Corporation’s businesses, business practices and costs of operations; regulatory approvals that may be necessary to undertake certain actions or consummate strategic transactions such as acquisitions and dispositions; the relative strength or weakness of the consumer and commercial credit sectors and of the real estate markets in Puerto Rico and the other markets in which borrowers are located; the impact of the Commonwealth of Puerto Rico’s fiscal crisis, and the measures taken and to be taken by the Puerto Rico Government, on the economy and our business, and the ability of the Government to manage this crisis in an orderly manner; the performance of the stock and bond markets; competition in the financial services industry; additional FDIC assessments; and possible legislative, tax or regulatory changes; and risks related to the Doral transaction, including our ability to maintain customer relationships and risks associated with the limited amount of diligence able to be conducted by a buyer in an FDIC transaction. Other possible events or factors that could cause results or performance to differ materially from those expressed in these forward-looking statements include the following: negative economic conditions that adversely affect the housing prices, the job market, consumer confidence and spending habits which may affect, among other things, the level of non-performing assets, charge-offs and provision expense; risks associated with maintaining customer relationships from our acquisition of certain assets and deposits (other than certain brokered deposits) of Doral Bank from the FDIC as receiver; changes in interest rates and market liquidity which may reduce interest margins, impact funding sources and affect our ability to originate and distribute financial products in the primary and secondary markets; changes in market rates and prices which may adversely impact the value of financial assets and liabilities; liabilities resulting from litigation and regulatory investigations; changes in accounting standards, rules and interpretations; our ability to grow our core businesses; decisions to downsize, sell or close units or otherwise change our business mix; and management’s ability to identify and manage these and other risks. Moreover, the outcome of legal proceedings, as discussed in “Part I, Item 3. Legal Proceedings”, is inherently uncertain and depends on judicial interpretations of law and the findings of regulators, judges and juries.
All forward-looking statements included in this report are based upon information available to the Corporation as of the date of this report, and other than as required by law, including the requirements of applicable securities laws, management assumes no obligation to update or revise any such forward-looking statements to reflect occurrences or unanticipated events or circumstances after the date of such statements.
The description of the Corporation’s business and risk factors contained in Item 1 and 1A of its Form 10-K for the year ended December 31, 2015 discusses additional information about the business of the Corporation and the material risk factors that, in addition to the other information in this report, readers should consider.
3
OVERVIEW
The Corporation is a diversified, publicly-owned financial holding company subject to the supervision and regulation of the Board of Governors of the Federal Reserve System. The Corporation has operations in Puerto Rico, the United States (“U.S.”) mainland, and the U.S. and British Virgin Islands. In Puerto Rico, the Corporation provides retail, mortgage and commercial banking services through its principal banking subsidiary, Banco Popular de Puerto Rico (“BPPR”), as well as investment banking, broker-dealer, auto and equipment leasing and financing, and insurance services through specialized subsidiaries. Effective December 31, 2012, Popular Mortgage, which was a wholly-owned subsidiary of BPPR prior to that date, was merged with and into BPPR as part of an internal reorganization. The Corporation’s mortgage origination business continues to be conducted under the brand name Popular Mortgage, a division of BPPR. In the U.S. mainland, the Corporation operates Banco Popular North America (“BPNA”), including its wholly-owned subsidiary E-LOAN. The BPNA franchise operates under the brand name of Popular Community Bank. BPNA focuses efforts and resources on the core community banking business. BPNA operates branches in New York, New Jersey and Southern Florida. E-LOAN markets deposit accounts under its name for the benefit of BPNA. Note 44 to the consolidated financial statements presents information about the Corporation’s business segments.
The Corporation has several investments which accounts for under the equity method. These include the 15.54% interest in EVERTEC, a 15.84% interest in Centro Financiero BHD Leon, S.A. (“BHD Leon”), a 24.9% interest in PR Asset Portfolio 2013-1 International, LLC and a 24.9% interest in PRLP 2011 Holdings LLP, among other investments in limited partnerships which mainly hold investment securities. EVERTEC provides transaction processing services throughout the Caribbean and Latin America, including servicing many of the Corporation’s systems infrastructure and transaction processing businesses. BHD León is a diversified financial services institution operating in the Dominican Republic. PR Asset Portfolio 2013-1 International, LLC is a joint venture to which the Corporation sold construction and commercial loans and commercial and residential real estate owned assets, most of which were non-performing, with a fair value of $306 million during the year 2013. PRLP 2011 Holdings LLP is a joint venture to which the Corporation sold construction and commercial loans, most of which were non-performing, with a fair value of $148 million during the year 2011. For the year ended December 31, 2015, the Corporation recorded approximately $24.4 million in earnings from these investments on an aggregate basis. The carrying amounts of these investments as of December 31, 2015 were $212.8 million. Refer to Note 20 to the consolidated financial statements for additional information of the Corporation’s investments at equity.
Significant events
Acquisition of certain assets and deposits of Doral Bank from the FDIC as receiver
On February 27, 2015, BPPR, in an alliance with co-bidders, including BPNA, acquired certain assets and assumed all non-brokered deposits of Doral Bank (“Doral”) from the Federal Deposit Insurance Corporation (“FDIC”), as receiver (the “Doral Bank Transaction”).
After taking into account the transfers to unaffiliated alliance co-bidders, BPPR and PCB assumed deposits amounting to approximately $2.2 billion and acquired commercial and residential loans amounting to approximately $1.7 billion, substantially all of which were in performing status. Additionally, the acquisition included approximately $0.6 billion in investment securities, cash and other assets. There is no loss-sharing arrangement with the FDIC on the acquired assets.
In connection with the Doral Bank Transaction, during the second quarter of 2015, BPPR completed the acquisition of mortgage servicing rights on three pools of residential mortgage loans serviced for Ginnie Mae, Fannie Mae and Freddie Mac, with an unpaid principal balance of approximately $5.0 billion, from the FDIC as receiver for Doral Bank. The aggregate purchase price for the mortgage servicing rights and related servicing advances was approximately $56 million.
As a result of the Doral Bank Transaction, the Corporation recorded goodwill of approximately $163 million and a core deposit intangible asset of approximately $13 million. Refer to Note 5, Business Combination, to the consolidated financial statements for a detail of the assets and liabilities, fair value estimates and goodwill recorded in connection with the Doral Bank Transaction.
4
Other assets acquired from Doral
During 2015, the Corporation acquired the Doral Insurance Agency portfolio, as part of a separate bidding process after Doral Financial Corporation filed for bankruptcy. As a result of this acquisition, the Corporation recorded $17.3 million in customer relationship intangibles.
The Corporation also acquired mortgage servicing rights for a portfolio previously serviced by Doral Bank, with approximately $873 million in unpaid principal balance, in connection with a pre-existing backup servicing agreement. As a result, the fair value of the Corporation’s mortgage servicing rights reflected an increase of approximately $4.4 million. The Corporation also purchased the servicing advances related to this portfolio from the FDIC, as receiver of Doral Bank, for a price of $46.6 million.
Reinstatement of quarterly cash dividend
During the third quarter of 2015, the Corporation reinstated the quarterly cash dividend on its outstanding common stock. Cash dividends of $0.15 per share were declared during the third and fourth quarters of 2015 and were subsequently paid on October 7, 2015 and January 4, 2016, respectively. This represented a quarterly cash dividend of $15.5 million for each quarter.
Restructuring of the U.S. Operations
The Corporation completed its centralization of certain back office operations of PCB in Puerto Rico and New York. The Corporation incurred $45.1 million in restructuring charges of which approximately $26.7 million were incurred during 2014 and $18.4 million during 2015 related to this restructuring plan.
During 2014, the Corporation completed the sale of its California, Central Florida and Illinois regions, as part of the reorganization of its U.S. operations. The operating results from these regions have been separately presented for all periods as discontinued operations in this MD&A.
Expiration of the commercial shared-loss arrangement with the FDIC
The shared-loss arrangement under the commercial loss share agreement with the FDIC related to the loans acquired from Westernbank as part of the FDIC assisted transaction in 2010 expired on June 30, 2015. Loans with a carrying amount at June 30, 2015 of approximately $248.7 million, which were reclassified to “non-covered” in the accompanying statement of financial condition, are subject to the resolution of several arbitration proceedings currently ongoing with the FDIC. Until the disputes are finally resolved, the terms of the commercial loss share agreement will remain in effect with respect to any such items under dispute. As of December 31, 2015, losses amounting to $149 million related to these assets are reflected in the FDIC indemnification asset as a receivable from the FDIC. Refer to additional information of these disputes on Note 30, Commitments and Contingencies, to the accompanying financial statements.
Partial reversal of the deferred tax asset valuation allowance
During the year ended December 31, 2015, the Corporation recorded a partial reversal of the valuation allowance on its deferred tax assets from its U.S. operations for approximately $589.0 million. The Corporation concluded that it is more likely than not that a portion of the total of $1.2 billion on deferred tax assets at the U.S. operations, comprised mainly of net operating losses (“NOLs”) will be realized. The Corporation based its determination on its estimated earnings for the remaining carryforward period – eighteen years beginning with the 2016 fiscal year – available to utilize the deferred tax asset to reduce its income tax obligations.
The increase in the net deferred tax asset did not have a material impact on regulatory capital. However, it increased the tangible book value per common share by $5.68.
Adjusted results of operations – Non-GAAP financial measure
The Corporation prepares its Consolidated Financial Statements using accounting principles generally accepted in the U.S. (“U.S. GAAP” or, the “reported basis”). In addition to analyzing the Corporation’s results on a reported basis, management monitors the
5
performance of the Corporation on an “adjusted basis” and excludes the impact of certain transactions on the results of its operations. Throughout this MD&A, the Corporation presents a discussion of its financial results excluding the impact of these events to arrive at the “adjusted results”. Management believes that the “adjusted results” provide meaningful information about the underlying performance of the Corporation’s ongoing operations. The “adjusted results” are a Non-GAAP financial measure. Refer to Tables 54 through 58, for a reconciliation of the reported results to the “adjusted results” for the years ended December 31, 2015, 2014 and 2013.
Non-GAAP financial measures used by the Corporation may not be comparable to similarly named non-GAAP financial measures used by other companies.
Financial highlights for the year ended December 31, 2015
The Corporation’s net income for the year ended December 31, 2015 amounted to $895.3 million, compared to a net loss of $313.5 million and net income of $599.3 million, for 2014 and 2013, respectively. For the year 2014, the Corporation’s results reflected a net loss from discontinued operations of $123.0 million, which include a goodwill impairment charge of $186.5 million and the net gain on the sale of the U.S. regional operations amounting to $33.8 million.
Net income from continuing operations for the year ended December 31, 2015 include $18.4 million in restructuring charges related to the U.S. operations; the impact of net expenses associated with the Doral Bank Transaction amounting to $17.9 million; an other-than-temporary impairment charge of $14.4 million on the portfolio of Puerto Rico government investment securities; a write-down of the FDIC indemnification asset of $10.9 million; a fair value gain of $4.4 million associated with a portfolio of MSRs acquired in connection with a backup servicing agreement; losses on proposed bulk sales of loans acquired from Westernbank of $15.2 million; a loss of $5.9 million from a bulk sale of non-covered loans; a net loss of $4.4 million on a bulk sale of covered OREOs completed during the year and a partial reversal of the valuation allowance on its deferred tax assets from its U.S. operations for approximately $589.0 million.
Net loss from continuing operations for the year ended December 31, 2014 was $190.5 million, compared to a net income of $558.8 million for 2013. The continuing operations for the year 2014 reflect a $414.1 million expense related to the amortization of the discount associated with the TARP funds which were repaid during 2014; a positive adjustment of $12.5 million in the amortization of the FDIC indemnification asset to reverse the impact of accelerated amortization expense recorded in prior periods; and the impact of the BPNA reorganization which included losses on bulk sales of non-performing assets totalling $11.1 million, a $39.8 million expense related to the refinancing of structured repos and restructuring charges of $26.7 million. In addition, during 2014 the Corporation recorded an income tax expense of $20.0 million related to the change in the capital gains tax rate from 15% to 20% and a $8.0 million charge to record a valuation allowance on the deferred tax asset at the holding company, offset by an income tax benefit of $23.4 million resulting from the Closing Agreement with the PR Treasury Department related to the treatment of certain charge-offs for the loans acquired from Westernbank.
Excluding the impact of the above mentioned transactions, detailed in Tables 54 and 55 the adjusted net income from continuing operations for the year ended December 31, 2015 was $374.8 million, compared to $300.7 million for 2014. Refer to Tables 54 and 55 for the reconciliation to the adjusted, Non-GAAP net income.
Table 1 provides selected financial data for the past five years. For purposes of the discussions, assets subject to loss sharing agreements with the FDIC, including loans and other real estate owned, are referred to as “covered assets” or “covered loans” since the Corporation expects to be reimbursed for 80% of any future losses on those assets, subject to the terms of the FDIC loss sharing agreements.
6
Table 1 - Selected Financial Data
| | | | | | | | | | | | | | | | | | | | |
| | | Years ended December 31, | |
(Dollars in thousands, except per common share data) | | 2015 | | | 2014 | | | 2013 | | | 2012 | | | 2011 | |
CONDENSED STATEMENTS OF OPERATIONS | | | | | | | | | | | | | | | | | | | | |
Interest income | | $ | 1,603,014 | | | $ | 1,633,543 | | | $ | 1,647,940 | | | $ | 1,644,386 | | | $ | 1,806,408 | |
Interest expense | | | 194,031 | | | | 688,471 | | | | 303,366 | | | | 362,759 | | | | 484,860 | |
| | | | | | | | | | | | | | | | | | | | |
Net interest income | | | 1,408,983 | | | | 945,072 | | | | 1,344,574 | | | | 1,281,627 | | | | 1,321,548 | |
| | | | | | | | | | | | | | | | | | | | |
Provision for loan losses: | | | | | | | | | | | | | | | | | | | | |
Non-covered loans | | | 217,458 | | | | 223,999 | | | | 536,710 | | | | 322,234 | | | | 395,853 | |
Covered loans | | | 24,020 | | | | 46,135 | | | | 69,396 | | | | 74,839 | | | | 145,635 | |
Non-interest income | | | 519,541 | | | | 386,515 | | | | 791,013 | | | | 511,489 | | | | 603,842 | |
Operating expenses | | | 1,288,221 | | | | 1,193,684 | | | | 1,221,990 | | | | 1,214,989 | | | | 1,143,860 | |
Income tax (benefit) expense | | | (495,172 | ) | | | 58,279 | | | | (251,327 | ) | | | (26,403 | ) | | | 114,927 | |
| | | | | | | | | | | | | | | | | | | | |
Income (loss) from continuing operations | | | 893,997 | | | | (190,510 | ) | | | 558,818 | | | | 207,457 | | | | 125,115 | |
Income (loss) from discontinued operations, net of tax | | | 1,347 | | | | (122,980 | ) | | | 40,509 | | | | 37,818 | | | | 26,210 | |
| | | | | | | | | | | | | | | | | | | | |
Net income (loss) | | $ | 895,344 | | | $ | (313,490 | ) | | $ | 599,327 | | | $ | 245,275 | | | $ | 151,325 | |
| | | | | | | | | | | | | | | | | | | | |
Net income (loss) applicable to common stock | | $ | 891,621 | | | $ | (317,213 | ) | | $ | 595,604 | | | $ | 241,552 | | | $ | 147,602 | |
| | | | | | | | | | | | | | | | | | | | |
PER COMMON SHARE DATA[1] | | | | | | | | | | | | | | | | | | | | |
Net income (loss): | | | | | | | | | | | | | | | | | | | | |
Basic: | | | | | | | | | | | | | | | | | | | | |
From continuing operations | | $ | 8.65 | | | $ | (1.88 | ) | | $ | 5.41 | | | $ | 1.99 | | | $ | 1.19 | |
From discontinued operations | | | 0.01 | | | | (1.20 | ) | | | 0.39 | | | | 0.37 | | | | 0.25 | |
| | | | | | | | | | | | | | | | | | | | |
Total | | $ | 8.66 | | | $ | (3.08 | ) | | $ | 5.80 | | | $ | 2.36 | | | $ | 1.44 | |
| | | | | | | | | | | | | | | | | | | | |
Diluted: | | | | | | | | | | | | | | | | | | | | |
From continuing operations | | $ | 8.64 | | | $ | (1.88 | ) | | $ | 5.39 | | | $ | 1.98 | | | $ | 1.19 | |
From discontinued operations | | | 0.01 | | | | (1.20 | ) | | | 0.39 | | | | 0.37 | | | | 0.25 | |
| | | | | | | | | | | | | | | | | | | | |
Total | | $ | 8.65 | | | $ | (3.08 | ) | | $ | 5.78 | | | $ | 2.35 | | | $ | 1.44 | |
| | | | | | | | | | | | | | | | | | | | |
Dividends declared | | $ | 0.30 | | | $ | — | | | $ | — | | | $ | — | | | $ | — | |
Book Value | | | 48.79 | | | | 40.76 | | | | 44.26 | | | | 39.35 | | | | 37.71 | |
Market Price | | | 28.34 | | | | 34.05 | | | | 28.73 | | | | 20.79 | | | | 13.90 | |
Outstanding shares: | | | | | | | | | | | | | | | | | | | | |
Average - basic | | | 102,967,186 | | | | 102,848,792 | | | | 102,693,685 | | | | 102,429,755 | | | | 102,179,393 | |
Average - assuming dilution | | | 103,124,309 | | | | 102,848,792 | | | | 103,061,475 | | | | 102,653,610 | | | | 102,289,496 | |
End of period | | | 103,618,976 | | | | 103,476,847 | | | | 103,397,699 | | | | 103,169,806 | | | | 102,590,457 | |
AVERAGE BALANCES | | | | | | | | | | | | | | | | | | | | |
Net loans[2] | | $ | 23,045,308 | | | $ | 22,366,750 | | | $ | 22,799,878 | | | $ | 22,786,545 | | | $ | 23,156,980 | |
Earning assets | | | 31,451,081 | | | | 29,897,273 | | | | 29,741,099 | | | | 29,510,753 | | | | 30,470,545 | |
Total assets | | | 35,186,305 | | | | 35,181,857 | | | | 36,266,993 | | | | 36,264,031 | | | | 38,066,268 | |
Deposits[4] | | | 26,778,582 | | | | 24,647,355 | | | | 24,571,382 | | | | 24,702,622 | | | | 25,185,910 | |
Borrowings | | | 2,757,334 | | | | 3,514,203 | | | | 4,291,861 | | | | 4,414,483 | | | | 5,845,407 | |
Total stockholders’ equity | | | 4,704,862 | | | | 4,555,752 | | | | 4,176,349 | | | | 3,843,652 | | | | 3,732,836 | |
PERIOD END BALANCE | | | | | | | | | | | | | | | | | | | | |
Net loans[2] | | $ | 23,129,230 | | | $ | 22,053,217 | | | $ | 24,706,719 | | | $ | 25,093,632 | | | $ | 25,314,392 | |
Allowance for loan losses | | | 537,111 | | | | 601,792 | | | | 640,555 | | | | 730,607 | | | | 815,308 | |
Earning assets | | | 31,717,124 | | | | 29,594,365 | | | | 31,521,963 | | | | 31,906,198 | | | | 32,441,983 | |
Total assets | | | 35,769,534 | | | | 33,096,695 | | | | 35,749,333 | | | | 36,507,535 | | | | 37,348,432 | |
Deposits | | | 27,209,723 | | | | 24,807,535 | | | | 26,711,145 | | | | 27,000,613 | | | | 27,942,127 | |
Borrowings | | | 2,433,654 | | | | 3,004,685 | | | | 3,645,246 | | | | 4,430,673 | | | | 4,293,669 | |
Total stockholders’ equity | | | 5,105,324 | | | | 4,267,382 | | | | 4,626,150 | | | | 4,110,000 | | | | 3,918,753 | |
SELECTED RATIOS | | | | | | | | | | | | | | | | | | | | |
Net interest margin (taxable equivalent basis)[3] | | | 4.74 | % | | | 4.96 | % | | | 4.73 | % | | | 4.47 | % | | | 4.48 | % |
Return on average total assets | | | 2.54 | | | | (0.89 | ) | | | 1.65 | | | | 0.68 | | | | 0.40 | |
Return on average common stockholders’ equity | | | 19.16 | | | | (7.04 | ) | | | 14.43 | | | | 6.37 | | | | 4.01 | |
Tier I Capital to risk-adjusted assets | | | 16.21 | | | | 18.13 | | | | 19.15 | | | | 17.35 | | | | 15.97 | |
Total Capital to risk-adjusted assets | | | 18.78 | | | | 19.41 | | | | 20.42 | | | | 18.63 | | | | 17.25 | |
| [1] | Per share data is based on the average number of shares outstanding during the periods, except for the book value and market price which are based on the information at the end of the periods. All per share data has been adjusted to retroactively reflect the 1-for-10 reverse stock split effected on May 29, 2012. |
7
| [2] | Includes loans held-for-sale and covered loans. |
| [3] | Net interest margin for the year ended December 31, 2014 excludes the impact of the cost associated with the refinancing of structured repos at BPNA and the accelerated amortization of the discount related to the TARP funds amounting to $39.2 million and $414.1 million, respectively. The U.S. GAAP net interest margin for the year ended December 31, 2014, on a taxable equivalent basis, was 3.45%. Refer additional information on the Net Interest Income section of this MD&A and to the reconciliation in Table 6. |
| [4] | Average deposits exclude average derivatives. |
On April 30, 2010, BPPR acquired certain assets and assumed certain liabilities of Westernbank from the FDIC in an assisted transaction. Table 2 provides a summary of the gross revenues derived from the assets acquired in the FDIC-assisted transaction during 2015, 2014 and 2013.
Table 2 - Financial Information - Westernbank FDIC-Assisted Transaction
| | | | | | | | | | | | |
| | | Years ended December 31, | |
(In thousands) | | 2015 | | | 2014 | | | 2013 | |
Interest income on WB loans | | $ | 208,779 | | | $ | 293,610 | | | $ | 300,745 | |
| | | | | | | | | | | | |
FDIC loss share income (expense): | | | | | | | | | | | | |
Amortization of loss share indemnification asset | | | (66,238 | ) | | | (189,959 | ) | | | (161,635 | ) |
Reversal of accelerated amortization in prior periods | | | — | | | | 12,492 | | | | — | |
80% mirror accounting on credit impairment losses[1] | | | 15,658 | | | | 32,038 | | | | 60,454 | |
80% mirror accounting on reimbursable expenses | | | 73,205 | | | | 58,117 | | | | 50,985 | |
80% mirror accounting on recoveries on covered assets, including rental income on OREOs, subject to reimbursement to the FDIC | | | (13,836 | ) | | | (13,124 | ) | | | (16,057 | ) |
80% mirror accounting on amortization of contingent liability on unfunded commitments | | | — | | | | — | | | | (473 | ) |
Change in true-up payment obligation | | | 9,559 | | | | (1,791 | ) | | | (15,993 | ) |
Other | | | 1,714 | | | | (797 | ) | | | 668 | |
| | | | | | | | | | | | |
Total FDIC loss share income (expense) | | | 20,062 | | | | (103,024 | ) | | | (82,051 | ) |
| | | | | | | | | | | | |
Amortization of contingent liability on unfunded commitments (included in other operating income) | | | — | | | | — | | | | 593 | |
| | | | | | | | | | | | |
Total revenues | | | 228,841 | | | | 190,586 | | | | 219,287 | |
| | | | | | | | | | | | |
Provision for loan losses | | | 54,113 | | | | 46,135 | | | | 69,396 | |
| | | | | | | | | | | | |
Total revenues less provision for loan losses | | $ | 174,728 | | | $ | 144,451 | | | $ | 149,891 | |
| | | | | | | | | | | | |
| [1] | Reductions in expected cash flows for ASC 310-30 loans, which may impact the provision for loan losses, may consider reductions in both principal and interest cash flow expectations. The amount covered under the FDIC loss sharing agreements for interest not collected from borrowers is limited under the agreements (approximately 90 days); accordingly, these amounts are not subject fully to the 80% mirror accounting. |
| | | | | | | | | | | | |
Average balances | |
| | | Years ended December 31, | |
(In millions) | | 2015 | | | 2014 | | | 2013 | |
Loans | | $ | 2,333 | | | $ | 2,771 | | | $ | 3,228 | |
FDIC loss share asset | | | 362 | | | | 748 | | | | 1,310 | |
Interest income on Westernbank loans for the year 2015 amounted to $ 209 million versus $ 294 million in 2014, reflecting a yield of 8.95 % versus 10.60 %, for each year respectively. This portfolio, due to its nature, should continue to decline as scheduled payments are received and workout arrangements are made.
The FDIC loss share reflected an income of $ 20 million for 2015, compared to an expense of $ 103 million for 2014. Excluding the impact of the transactions detailed in Tables 54 and 55, this line reflected an income of $13.4 million for 2015, or a positive variance of $128.9 million, compared to the previous year. This was mainly the result of lower amortization of the indemnification asset by $135 million, a positive variance in the valuation of the true-up payment obligation of $11 million, partially offset by lower mirror accounting on credit impairment losses of $16 million. For 2014, when compared to 2013 this line reflected a negative variance of $ 21 million due to higher amortization of the indemnification asset by $28 million and lower mirror accounting on credit impairment losses by $28 million, partially offset by lower unfavorable variance in the valuation of the true up payment obligation by $14 million and higher mirror accounting on reimbursable expenses by $7 million.
8
Although an increase in cash flows increases the accretable yield to be recognized over the life of the loans, it also has the effect of lowering the realizable value of the loss share asset since the Corporation would receive lower FDIC payments under the loss share agreements. This is reflected in the amortization of the loss share asset.
The discussion that follows provides highlights of the Corporation’s results of operations for the year ended December 31, 2015 compared to the results of operations of 2014. It also provides some highlights with respect to the Corporation’s financial condition, credit quality, capital and liquidity. Table 3 presents a five-year summary of the components of net income (loss) as a percentage of average total assets.
Table 3 - Components of Net Income (Loss) as a Percentage of Average Total Assets
| | | | | | | | | | | | | | | | | | | | |
| | | 2015 | | | 2014 | | | 2013 | | | 2012 | | | 2011 | |
Net interest income | | | 4.00 | % | | | 2.69 | % | | | 3.71 | % | | | 3.54 | % | | | 3.47 | % |
Provision for loan losses | | | (0.69 | ) | | | (0.77 | ) | | | (1.67 | ) | | | (1.10 | ) | | | (1.42 | ) |
Mortgage banking activities | | | 0.23 | | | | 0.09 | | | | 0.21 | | | | 0.23 | | | | (0.01 | ) |
Net gain and valuation adjustments on investment securities | | | — | | | | — | | | | 0.02 | | | | — | | | | 0.03 | |
Other-than-temporary impairment losses on investment securities | | | (0.04 | ) | | | — | | | | — | | | | — | | | | — | |
Net gain (loss) on sale of loans, including valuation adjustments on loans held-for-sale | | | — | | | | 0.12 | | | | (0.15 | ) | | | (0.08 | ) | | | 0.01 | |
Adjustments (expense) to indemnity reserves | | | (0.05 | ) | | | (0.12 | ) | | | (0.10 | ) | | | (0.06 | ) | | | (0.09 | ) |
Trading account (loss) profit | | | (0.01 | ) | | | 0.01 | | | | (0.04 | ) | | | 0.01 | | | | 0.13 | |
FDIC loss share income (expense) | | | 0.06 | | | | (0.29 | ) | | | (0.23 | ) | | | (0.15 | ) | | | 0.17 | |
Fair value change in equity appreciation instrument | | | — | | | | — | | | | — | | | | — | | | | 0.02 | |
Other non-interest income | | | 1.29 | | | | 1.29 | | | | 2.47 | | | | 1.46 | | | | 1.32 | |
| | | | | | | | | | | | | | | | | | | | |
Total net interest income and non-interest income, net of provision for loan losses | | | 4.79 | | | | 3.02 | | | | 4.22 | | | | 3.85 | | | | 3.63 | |
Operating expenses | | | (3.66 | ) | | | (3.39 | ) | | | (3.37 | ) | | | (3.34 | ) | | | (3.00 | ) |
| | | | | | | | | | | | | | | | | | | | |
Income (loss) from continuing operations before income tax | | | 1.13 | | | | (0.37 | ) | | | 0.85 | | | | 0.51 | | | | 0.63 | |
Income tax (benefit) expense | | | (1.41 | ) | | | 0.17 | | | | (0.69 | ) | | | (0.07 | ) | | | 0.30 | |
| | | | | | | | | | | | | | | | | | | | |
Income (loss) from continuing operations | | | 2.54 | | | | (0.54 | ) | | | 1.54 | | | | 0.58 | | | | 0.33 | |
(Loss) income from discontinued operations, net of tax | | | — | | | | (0.35 | ) | | | 0.11 | | | | 0.10 | | | | 0.07 | |
| | | | | | | | | | | | | | | | | | | | |
Net income (loss) | | | 2.54 | % | | | (0.89 | )% | | | 1.65 | % | | | 0.68 | % | | | 0.40 | % |
| | | | | | | | | | | | | | | | | | | | |
Net interest income from the continuing business, on a taxable equivalent basis, for the year ended December 31, 2015 was $1.5 billion compared to $1.0 billion in 2014. Excluding the impact of the repayment of TARP funds and the refinancing of structured repos in the U.S., the net interest income, on a taxable equivalent basis, in 2014 was $1.5 billion. Net interest margin, on a taxable equivalent basis was 4.74% in 2015, compared to 3.45% in 2014; excluding the above mentioned interest expense charges related to the repayment of TARP funds and the refinancing of structured repos in the U.S., the net interest margin for 2014 was 4.96%. Although the adjusted net interest income on a taxable equivalent basis increased by $7.3 million, the adjusted net interest margin decreased by 22 basis points largely due to a lower volume of Westernbank loans which had a yield of 8.95% and 10.60% for the years ended December 31, 2015 and 2014, respectively; partially offset by a higher volume of earning assets reflecting the impact of the Doral Bank Transaction, net of the related liabilities assumed; and lower cost of funds. Refer to the Net Interest Income section of this MD&A for a discussion of the major variances in net interest income, including yields and costs.
The Corporation’s total provision for loan losses totaled $241.5 million for the year ended December 31, 2015, compared with $270.1 million for 2014, and $606.1 million for 2013. The provision for loan losses for the non-covered loan portfolio totaled $217.5 million for the year ended December 31, 2015, compared to $224.0 million for the year ended December 31, 2014. The decrease of $6.5 million was mainly driven by a decrease of $26.0 million in the Puerto Rico non-covered portfolio, partially offset by an unfavorable variance at BPNA of $19.5 million. The decrease of $26.0 million for Puerto Rico was mainly related to the impact of higher reserves during 2014 for Puerto Rico’s government exposures and to account for weakened macroeconomic and fiscal
9
conditions, offset by a provision of $30.1 million for Westernbank loans, classified as covered until June 30, 2015, which includes a $15.2 million impairment on loans the Corporation has sold or intends to sell and are subject to the ongoing arbitration with the FDIC. Excluding the $15.2 million of impairments recorded on Westernbank loans and the $5.8 million from the bulk sale of loans, the provision for the Puerto Rico non-covered portfolio declined by $47.0 million. BPNA’s provision for loan losses for the year ended December 31, 2015 was $0.6 million, while for 2014 it was release of $18.9 million, reflecting strong credit metrics and the de-risking of the U.S. portfolios.
Total non-performing assets, including non-performing covered assets, were $843 million at December 31, 2015, decreasing by approximately $90 million, or 10%, from December 31, 2014. This decline was driven by a reduction of $74 million in OREOs as a result of aggressive disposition strategies, including the a bulk sale of covered OREO’s with a book value of $37 million during the second quarter of 2015. Non-covered non-performing loans held-in-portfolio decreased by $29 million when compared to December 31, 2014, mostly driven by lower commercial non-performing loans in the BPPR segment. Despite challenging economic and fiscal conditions in the Puerto Rico market, credit metrics remained stable. These stable trends were the result of aggressive loss mitigation efforts, resolutions, restructurings, and non-performing loans sales, which have improved the risk profile of the loan portfolios.
Refer to the Provision for Loan Losses and Credit Risk Management and Loan Quality section of this MD&A for information on the allowance for loan losses, non-performing assets, troubled debt restructurings, net charge-offs and credit quality metrics.
Non-interest income for the year ended December 31, 2015 amounted to $519.6 million, an increase of $133.0 million, compared with 2014. Excluding the impact of certain events detailed in Tables 54 and 55 Adjusted Results (Non-GAAP), non-interest income increased by $147.7 million. The increase reflects a positive variance in the FDIC loss share income (expense) of $128.9 million, mainly due to lower amortization of the indemnification asset; higher mortgage banking fees by $46.0 million due to higher servicing fees, positive variance in the fair value adjustment of the MSRs and lower losses on derivatives; and a lower provision for loans sold with credit recourse by $22.0 million; partially offset by lower gain on sale of loans due to the several bulk loan sales completed by BPNA in 2014.
Refer to the Non-Interest Income section of this MD&A for additional information on the major variances of the different categories of non-interest income.
Total operating expenses for the year 2015 amounted to $1.3 billion, an increase of $94.5 million, when compared with the previous year. Excluding the impact of certain events detailed in Tables 54 and 55 Adjusted Results (Non-GAAP), operating expenses increased by $57.8 million compared with the year ended December 31, 2014, mainly due to higher personnel costs by $54.7 million due to higher salaries, incentives and pension related expense at BPPR; higher OREO expenses by $14.0 million, mainly at BPPR; higher professional fees by $11.4 million due to programming, application processing and hosting expenses and the impact of the recently enacted business-to-business sales tax in Puerto Rico; partially offset by lower other taxes by $17.1 million mainly due to elimination of the Puerto Rico gross revenue tax and lower municipal license tax. Refer to the Operating Expenses section of this MD&A for additional explanations on the major variances in the different categories of operating expenses.
Income tax benefit amounted to $495.2 million for the year ended December 31, 2015, compared with an income tax expense of $58.3 million for the previous year. The increase in income tax benefit was primarily due to a tax benefit of $589.0 million recorded during the year 2015 as a result of the partial reversal of the valuation allowance on the Corporation’s deferred tax asset from it’s U.S. operations. Refer to the Income Taxes section in this MD&A and Note 42 to the consolidated financial statements for additional information on income taxes.
At December 31, 2015, the Corporation’s total assets were $35.8 billion, compared with $33.1 billion at December 31, 2014, an increase of $2.7 billion, or 8%. The increase is mainly driven by an increase in the Corporation’s loan portfolio as a result of the Doral Bank Transaction and an increase in investment securities. Total earning assets at December 31, 2015 amounted to $31.7 billion, an increase of $2.1 billion, or 7%, compared with December 31, 2014.
Investment securities available-for-sale and held-to-maturity increased by $746 million, mainly at BPPR, due to an increase in mortgage-backed securities and U.S. Treasury securities, partially offset by decreases in obligations from U.S. Government Sponsored Entities and CMOs.
10
The Corporation’s total loan portfolio amounted to $23.1 billion at December 31, 2015, compared to $22.1 billion at December 31, 2014. Excluding the balance at December 31, 2015 of $1.3 billion in loans acquired as part of the Doral Bank Transaction, the total loan portfolio decreased by $256 million mainly in the covered loans portfolio due to the normal run-off and loan resolutions, partially offset by an increase in the non-covered loans driven by higher origination volumes in commercial loans at BPNA.
Loans held-for-sale increased by $31 million mainly due to an increase in commercial loans held-for-sale driven by the reclassification during the second quarter of a $45 million public sector credit of BPPR, net of the related write-down of $30 million.
Deposits amounted to $27.2 billion at December 31, 2015, compared with $24.8 billion at December 31, 2014. Table 15 presents a breakdown of deposits by major categories. Excluding the $1.4 billion balance as of December 31, 2015 of the deposits assumed as part of the Doral Bank Transaction, total deposits increased by $1.0 billion mainly at BPNA by $680 million mostly due to higher time deposits and brokered deposits, and at BPPR by $300 million due mainly to higher demand and savings deposits. The Corporation’s borrowings amounted to $2.4 billion at December 31, 2015, compared with $3.0 billion at December 31, 2014. The decline in borrowings is mainly due to lower balance of repos and advances from the Federal Home Loan Bank of NY.
Refer to Table 14 in the Statement of Financial Condition Analysis section of this MD&A for the percentage allocation of the composition of the Corporation’s financing to total assets.
Stockholders’ equity totaled $5.1 billion at December 31, 2015, compared with $4.3 billion at December 31, 2014. The Corporation continues to be well-capitalized at December 31, 2015. The Common Equity Tier 1 Capital ratio at December 31, 2015 was 16.21%. The Tier 1 Capital ratio at December 31, 2015 was 16.21%, compared to 18.13% at December 31,2014.
In summary, during 2015, the Corporation continued to execute on its strategic efforts to strengthen its operations and profitability. The Doral Bank Transaction further strengthened the Corporation’s earnings potential, aligned with its asset acquisition strategy in Puerto Rico and the U.S. The reinstatement of the quarterly dividend was also a significant milestone during the year. The Corporation continues to benefit from its stake in EVERTEC and BHD León, the second largest bank in the Dominican Republic, and improved performance of its U.S. operations.
Moving forward, the Corporation will continue to look for opportunities to execute on its growth strategy, complementing its organic growth with strategic portfolio acquisitions. Credit quality continues to be an area of focus as the Corporation manages its classified portfolios amidst a challenging economic environment in Puerto Rico.
For further discussion of operating results, financial condition and business risks refer to the narrative and tables included herein.
The shares of the Corporation’s common stock are traded on the NASDAQ Global Select Market under the symbol BPOP. Table 4 shows the Corporation’s common stock performance on a quarterly basis during the last five years.
11
Table 4 - Common Stock Performance
| | | | | | | | | | | | | | | | | | | | | | | | | | | | |
| | | Market Price | | | Cash Dividends
Declared per Share | | | Book Value
Per Share | | | Dividend
Yield[1] | | | Price/
Earnings
Ratio | | | Market/Book
Ratio | |
| | | High | | | Low | | | | | | |
2015 | | | | | | | | | | | | | | $ | 48.79 | | | | 0.97 | % | | | 3.27x | | | | 58.09 | % |
4th quarter | | $ | 32.39 | | | $ | 26.96 | | | $ | 0.15 | | | | | | | | | | | | | | | | | |
3rd quarter | | | 31.49 | | | | 27.19 | | | | 0.15 | | | | | | | | | | | | | | | | | |
2nd quarter | | | 35.45 | | | | 28.86 | | | | — | | | | | | | | | | | | | | | | | |
1st quarter | | | 35.58 | | | | 30.52 | | | | — | | | | | | | | | | | | | | | | | |
| | | | | | | |
2014 | | | | | | | | | | | | | | | 40.76 | | | | N.M. | | | | (11.06 | ) | | | 83.54 | |
4th quarter | | $ | 34.14 | | | $ | 27.34 | | | $ | — | | | | | | | | | | | | | | | | | |
3rd quarter | | | 34.64 | | | | 29.44 | | | | — | | | | | | | | | | | | | | | | | |
2nd quarter | | | 34.18 | | | | 28.93 | | | | — | | | | | | | | | | | | | | | | | |
1st quarter | | | 31.50 | | | | 25.50 | | | | — | | | | | | | | | | | | | | | | | |
| | | | | | | |
2013 | | | | | | | | | | | | | | | 44.26 | | | | N.M. | | | | 4.95 | | | | 64.91 | |
4th quarter | | $ | 29.17 | | | $ | 24.07 | | | $ | — | | | | | | | | | | | | | | | | | |
3rd quarter | | | 34.20 | | | | 26.25 | | | | — | | | | | | | | | | | | | | | | | |
2nd quarter | | | 30.60 | | | | 26.88 | | | | — | | | | | | | | | | | | | | | | | |
1st quarter | | | 28.92 | | | | 21.70 | | | | — | | | | | | | | | | | | | | | | | |
| | | | | | | |
2012 | | | | | | | | | | | | | | | 39.35 | | | | N.M. | | | | 8.85 | | | | 52.83 | |
4th quarter | | $ | 20.90 | | | $ | 17.42 | | | $ | — | | | | | | | | | | | | | | | | | |
3rd quarter | | | 18.74 | | | | 13.55 | | | | — | | | | | | | | | | | | | | | | | |
2nd quarter | | | 21.20 | | | | 13.58 | | | | — | | | | | | | | | | | | | | | | | |
1st quarter | | | 23.00 | | | | 14.30 | | | | — | | | | | | | | | | | | | | | | | |
| | | | | | | |
2011 | | | | | | | | | | | | | | | 37.71 | | | | N.M. | | | | 9.65 | | | | 36.86 | |
4th quarter | | $ | 19.00 | | | $ | 11.15 | | | $ | — | | | | | | | | | | | | | | | | | |
3rd quarter | | | 28.30 | | | | 13.70 | | | | — | | | | | | | | | | | | | | | | | |
2nd quarter | | | 32.40 | | | | 26.30 | | | | — | | | | | | | | | | | | | | | | | |
1st quarter | | | 35.33 | | | | 28.70 | | | | — | | | | | | | | | | | | | | | | | |
| [1] | Based on the average high and low market price for the four quarters. |
Note: All per share data has been adjusted to retroactively reflect the 1-for-10 reverse stock split effected on May 29, 2012.
N.M. – Not meaningful.
CRITICAL ACCOUNTING POLICIES / ESTIMATES
The accounting and reporting policies followed by the Corporation and its subsidiaries conform with generally accepted accounting principles (“GAAP”) in the United States of America and general practices within the financial services industry. The Corporation’s significant accounting policies are described in detail in Note 2 to the consolidated financial statements and should be read in conjunction with this section.
Critical accounting policies require management to make estimates and assumptions, which involve significant judgment about the effect of matters that are inherently uncertain and that involve a high degree of subjectivity. These estimates are made under facts and circumstances at a point in time and changes in those facts and circumstances could produce actual results that differ from those estimates. The following MD&A section is a summary of what management considers the Corporation’s critical accounting policies / estimates.
Fair Value Measurement of Financial Instruments
The Corporation measures fair value as required by ASC Subtopic 820-10 “Fair Value Measurements and Disclosures”, which defines fair value as the exchange price that would be received for an asset or paid to transfer a liability in the principal or most advantageous market for the asset or liability in an orderly transaction between market participants on the measurement date. The Corporation currently measures at fair value on a recurring basis its trading assets, available-for-sale securities, derivatives, mortgage servicing rights and contingent consideration. Occasionally, the Corporation may be required to record at fair value other assets on a nonrecurring basis, such as loans held-for-sale, impaired loans held-in-portfolio that are collateral dependent and certain other assets. These nonrecurring fair value adjustments typically result from the application of lower of cost or fair value accounting or write-downs of individual assets.
12
The Corporation categorizes its assets and liabilities measured at fair value under the three-level hierarchy. The level within the hierarchy is based on whether the inputs to the valuation methodology used for fair value measurement are observable. The hierarchy is broken down into three levels based on the reliability of inputs as follows:
| | • | | Level 1- Unadjusted quoted prices in active markets for identical assets or liabilities that the Corporation has the ability to access at the measurement date. No significant degree of judgment for these valuations is needed, as they are based on quoted prices that are readily available in an active market. |
| | • | | Level 2- Quoted prices other than those included in Level 1 that are observable either directly or indirectly. Level 2 inputs include quoted prices for similar assets or liabilities in active markets, quoted prices for identical or similar assets or liabilities in markets that are not active, and other inputs that are observable or that can be corroborated by observable market data for substantially the full term of the financial instrument. |
| | • | | Level 3- Unobservable inputs that are supported by little or no market activity and that are significant to the fair value measurement of the financial asset or liability. Unobservable inputs reflect the Corporation’s own assumptions about what market participants would use to price the asset or liability, including assumptions about risk. The inputs are developed based on the best available information, which might include the Corporation’s own data such as internally-developed models and discounted cash flow analyses. |
The Corporation requires the use of observable inputs when available, in order to minimize the use of unobservable inputs to determine fair value. The inputs or methodologies used for valuing securities are not necessarily an indication of the risk associated with investing on those securities. The amount of judgment involved in estimating the fair value of a financial instrument depends upon the availability of quoted market prices or observable market parameters. In addition, it may be affected by other factors such as the type of instrument, the liquidity of the market for the instrument, transparency around the inputs to the valuation, as well as the contractual characteristics of the instrument.
If listed prices or quotes are not available, the Corporation employs valuation models that primarily use market-based inputs including yield curves, interest rate curves, volatilities, credit curves, and discount, prepayment and delinquency rates, among other considerations. When market observable data is not available, the valuation of financial instruments becomes more subjective and involves substantial judgment. The need to use unobservable inputs generally results from diminished observability of both actual trades and assumptions resulting from the lack of market liquidity for those types of loans or securities. When fair values are estimated based on modeling techniques such as discounted cash flow models, the Corporation uses assumptions such as interest rates, prepayment speeds, default rates, loss severity rates and discount rates. Valuation adjustments are limited to those necessary to ensure that the financial instrument’s fair value is adequately representative of the price that would be received or paid in the marketplace.
The fair value measurements and disclosures guidance in ASC Subtopic 820-10 also addresses measuring fair value in situations where markets are inactive and transactions are not orderly. Transactions or quoted prices for assets and liabilities may not be determinative of fair value when transactions are not orderly and thus may require adjustments to estimate fair value. Price quotes based on transactions that are not orderly should be given little, if any, weight in measuring fair value. Price quotes based upon transactions that are orderly shall be considered in determining fair value and the weight given is based on facts and circumstances. If sufficient information is not available to determine if price quotes are based upon orderly transactions, less weight should be given to the price quote relative to other transactions that are known to be orderly.
The lack of liquidity is incorporated into the fair value measurement based on the type of asset measured and the valuation methodology used. An illiquid market is one in which little or no observable activity has occurred or one that lacks willing buyers or willing sellers. Discounted cash flow techniques incorporate forecasting of expected cash flows discounted at appropriate market discount rates which reflect the lack of liquidity in the market which a market participant would consider. Broker quotes used for fair value measurements inherently reflect any lack of liquidity in the market since they represent an exit price from the perspective of the market participants.
Management believes that fair values are reasonable and consistent with the fair value measurement guidance based on the Corporation’s internal validation procedure and consistency of the processes followed, which include obtaining market quotes when possible or using valuation techniques that incorporate market-based inputs.
13
Refer to Note 34 to the consolidated financial statements for information on the Corporation’s fair value measurement disclosures required by the applicable accounting standard. At December 31, 2015, approximately $ 6.1 billion, or 97%, of the assets measured at fair value on a recurring basis used market-based or market-derived valuation methodology and, therefore, were classified as Level 1 or Level 2. The majority of instruments measured at fair value were classified as Level 2, including U.S. Treasury securities, obligations of U.S. Government sponsored entities, obligations of Puerto Rico, States and political subdivisions, most mortgage-backed securities (“MBS”) and collateralized mortgage obligations (“CMOs”), and derivative instruments. U.S. Treasury securities were valued based on yields that were interpolated from the constant maturity treasury curve. Obligations of U.S. Government sponsored entities were priced based on an active exchange market and on quoted prices for similar securities. Obligations of Puerto Rico, States and political subdivisions were valued based on trades, bid price or spread, two sided markets, quotes, benchmark curves, market data feeds, discount and capital rates and trustee reports. MBS and CMOs were priced based on a bond’s theoretical value from similar bonds defined by credit quality and market sector. Refer to the Derivatives section below for a description of the valuation techniques used to value these derivative instruments.
The remaining 3% of assets measured at fair value on a recurring basis at December 31, 2015 were classified as Level 3 since their valuation methodology considered significant unobservable inputs. The financial assets measured as Level 3 included mostly Puerto Rico tax-exempt GNMA mortgage-backed securities and mortgage servicing rights (“MSRs”). GNMA tax exempt mortgage-backed securities are priced using a local demand price matrix prepared from local dealer quotes, and other local investments such as corporate securities and local mutual funds which are priced by local dealers. MSRs, on the other hand, are priced internally using a discounted cash flow model which considers servicing fees, portfolio characteristics, prepayment assumptions, delinquency rates, late charges, other ancillary revenues, cost to service and other economic factors. Additionally, the Corporation reported $ 113 million of financial assets that were measured at fair value on a nonrecurring basis at December 31, 2015, all of which were classified as Level 3 in the hierarchy.
Broker quotes used for fair value measurements inherently reflect any lack of liquidity in the market since they represent an exit price from the perspective of the market participants. Financial assets that were fair valued using broker quotes amounted to $ 18 million at December 31, 2015, of which $ 8 million were Level 3 assets and $ 10 million were Level 2 assets. Level 3 assets consisted principally of tax-exempt GNMA mortgage-backed securities. Fair value for these securities was based on an internally-prepared matrix derived from an average of two indicative local broker quotes. The main input used in the matrix pricing was non-binding local broker quotes obtained from limited trade activity. Therefore, these securities were classified as Level 3.
There were no transfers in and/or out of Level 1, Level 2, or Level 3 for financial instruments measured at fair value on a recurring basis during the years ended December 31, 2015, 2014, and 2013. The Corporation’s policy is to recognize transfers as of the end of the reporting period.
Trading Account Securities and Investment Securities Available-for-Sale
The majority of the values for trading account securities and investment securities available-for-sale are obtained from third-party pricing services and are validated with alternate pricing sources when available. Securities not priced by a secondary pricing source are documented and validated internally according to their significance to the Corporation’s financial statements. Management has established materiality thresholds according to the investment class to monitor and investigate material deviations in prices obtained from the primary pricing service provider and the secondary pricing source used as support for the valuation results. During the year ended December 31, 2015, the Corporation did not adjust any prices obtained from pricing service providers or broker dealers.
Inputs are evaluated to ascertain that they consider current market conditions, including the relative liquidity of the market. When a market quote for a specific security is not available, the pricing service provider generally uses observable data to derive an exit price for the instrument, such as benchmark yield curves and trade data for similar products. To the extent trading data is not available, the pricing service provider relies on specific information including dialogue with brokers, buy side clients, credit ratings, spreads to established benchmarks and transactions on similar securities, to draw correlations based on the characteristics of the evaluated instrument. If for any reason the pricing service provider cannot observe data required to feed its model, it discontinues pricing the instrument. During the year ended December 31, 2015, none of the Corporation’s investment securities were subject to pricing discontinuance by the pricing service providers. The pricing methodology and approach of our primary pricing service providers is concluded to be consistent with the fair value measurement guidance.
Furthermore, management assesses the fair value of its portfolio of investment securities at least on a quarterly basis, which includes analyzing changes in fair value that have resulted in losses that may be considered other-than-temporary. Factors considered include, for example, the nature of the investment, severity and duration of possible impairments, industry reports, sector credit ratings, economic environment, creditworthiness of the issuers and any guarantees.
14
Securities are classified in the fair value hierarchy according to product type, characteristics and market liquidity. At the end of each period, management assesses the valuation hierarchy for each asset or liability measured. The fair value measurement analysis performed by the Corporation includes validation procedures and review of market changes, pricing methodology, assumption and level hierarchy changes, and evaluation of distressed transactions.
At December 31, 2015, the Corporation’s portfolio of trading and investment securities available-for-sale amounted to $ 6.1 billion and represented 96% of the Corporation’s assets measured at fair value on a recurring basis. At December 31, 2015, net unrealized losses on the trading securities approximated $6 million and net unrealized losses on available-for-sale investment securities portfolio approximated to $ 10 million. Fair values for most of the Corporation’s trading and investment securities available-for-sale were classified as Level 2. Trading and investment securities available-for-sale classified as Level 3, which were the securities that involved the highest degree of judgment, represent less than 1% of the Corporation’s total portfolio of trading and investment securities available-for-sale.
Mortgage Servicing Rights
Mortgage servicing rights (“MSRs”), which amounted to $ 211 million at December 31, 2015, and are primarily related to residential mortgage loans originated in Puerto Rico, do not trade in an active, open market with readily observable prices. Fair value is estimated based upon discounted net cash flows calculated from a combination of loan level data and market assumptions. The valuation model combines loans with common characteristics that impact servicing cash flows (e.g. investor, remittance cycle, interest rate, product type, etc.) in order to project net cash flows. Market valuation assumptions include prepayment speeds, discount rate, cost to service, escrow account earnings, and contractual servicing fee income, among other considerations. Prepayment speeds are derived from market data that is more relevant to the U.S. mainland loan portfolios and, thus, are adjusted for the Corporation’s loan characteristics and portfolio behavior since prepayment rates in Puerto Rico have been historically lower. Other assumptions are, in the most part, directly obtained from third-party providers. Disclosure of two of the key economic assumptions used to measure MSRs, which are prepayment speed and discount rate, and a sensitivity analysis to adverse changes to these assumptions, is included in Note 16 to the consolidated financial statements.
Derivatives
Derivatives, such as interest rate swaps, interest rate caps and indexed options, are traded in over-the-counter active markets. These derivatives are indexed to an observable interest rate benchmark, such as LIBOR or equity indexes, and are priced using an income approach based on present value and option pricing models using observable inputs. Other derivatives are liquid and have quoted prices, such as forward contracts or “to be announced securities” (“TBAs”). All of these derivatives held by the Corporation were classified as Level 2. Valuations of derivative assets and liabilities reflect the values associated with counterparty risk and nonperformance risk, respectively. The non-performance risk, which measures the Corporation’s own credit risk, is determined using internally-developed models that consider the net realizable value of the collateral posted, remaining term, and the creditworthiness or credit standing of the Corporation. The counterparty risk is also determined using internally-developed models which incorporate the creditworthiness of the entity that bears the risk, net realizable value of the collateral received, and available public data or internally-developed data to determine their probability of default. To manage the level of credit risk, the Corporation employs procedures for credit approvals and credit limits, monitors the counterparties’ credit condition, enters into master netting agreements whenever possible and, when appropriate, requests additional collateral. During the year ended December 31, 2015, inclusion of credit risk in the fair value of the derivatives resulted in a net loss of $0.5 million recorded in the other operating income and interest expense captions of the consolidated statement of operations, which consisted of a loss of $0.8 million resulting from the Corporation’s own credit standing adjustment and a gain of $0.3 million from the assessment of the counterparties’ credit risk.
Contingent consideration liability
The fair value of the true-up payment obligation (contingent consideration) to the FDIC as it relates to the Westernbank FDIC-assisted transaction amounted to $ 120 million at December 31, 2015. The fair value was estimated using projected cash flows related to the loss sharing agreements at the true-up measurement date, taking into consideration the intrinsic loss estimate, asset premium/discount, cumulative shared loss payments, and the cumulative servicing amount related to the loan portfolio. Refer to Note 14 to the consolidated financial statements for a description of the true-up payment formula. The true-up payment obligation was discounted using a term rate consistent with the time remaining until the payment is due. The discount rate was an estimate of the sum of the risk-free benchmark rate for the term remaining before the true-up payment is due and a risk premium to account for the credit risk profile of BPPR. The risk premium was calculated using a three day average of Popular, Inc.’s 5-year note issuance.
15
Loans held-in-portfolio considered impaired under ASC Section 310-10-35 that are collateral dependent
The impairment is measured based on the fair value of the collateral, which is derived from appraisals that take into consideration prices in observed transactions involving similar assets in similar locations, size and supply and demand. The challenging conditions of the housing markets continue to affect the market activity related to real estate properties. These collateral dependent impaired loans are classified as Level 3 and are reported as a nonrecurring fair value measurement.
Loans measured at fair value pursuant to lower of cost or fair value adjustments
Loans measured at fair value on a nonrecurring basis pursuant to lower of cost or fair value were priced based on secondary market prices and discounted cash flow models which incorporate internally-developed assumptions for prepayments and credit loss estimates. These loans are classified as Level 3.
Other real estate owned and other foreclosed assets
Other real estate owned includes real estate properties securing mortgage, consumer, and commercial loans. Other foreclosed assets include primarily automobiles securing auto loans. The fair value of foreclosed assets may be determined using an external appraisal, broker price opinion, internal valuation or binding offer. The majority of these foreclosed assets is classified as Level 3 since they are subject to internal adjustments and reported as a nonrecurring fair value measurement.
Loans and Allowance for Loan Losses
Interest on loans is accrued and recorded as interest income based upon the principal amount outstanding.
Non-accrual loans are those loans on which the accrual of interest is discontinued. When a loan is placed on non-accrual status, all previously accrued and unpaid interest is charged against income and the loan is accounted for either on a cash-basis method or on the cost-recovery method. Loans designated as non-accruing are returned to accrual status when the Corporation expects repayment of the remaining contractual principal and interest. The determination as to the ultimate collectability of the loan’s balance may involve management’s judgment in the evaluation of the borrower’s financial condition and prospects for repayment.
Refer to the MD&A section titled Credit Risk Management and Loan Quality, particularly the Non-performing assets sub-section, for a detailed description of the Corporation’s non-accruing and charge-off policies by major loan categories.
One of the most critical and complex accounting estimates is associated with the determination of the allowance for loan losses. The provision for loan losses charged to current operations is based on this determination. The Corporation’s assessment of the allowance for loan losses is determined in accordance with accounting guidance, specifically guidance of loss contingencies in ASC Subtopic 450-20 and loan impairment guidance in ASC Section 310-10-35.
The accounting guidance provides for the recognition of a loss allowance for groups of homogeneous loans. The determination for general reserves of the allowance for loan losses includes the following principal factors:
| | • | | Base net loss rates, which are based on the moving average of annualized net loss rates computed over a 5-year historical loss period for the commercial and construction loan portfolios, and an 18-month period for the consumer and mortgage loan portfolios. The base net loss rates are applied by loan type and by legal entity. |
| | • | | Recent loss trend adjustment, which replaces the base loss rate with a 12-month average loss rate, when these trends are higher than the respective base loss rates. The objective of this adjustment is to allow for a more recent loss trend to be captured and reflected in the ALLL estimation process. |
For the period ended December 31, 2015, 15% (December 31, 2014- 50%) of the ALLL for BPPR non-covered loan portfolios utilized the recent loss trend adjustment instead of the base loss. The effect of replacing the base loss with the recent loss trend adjustment was mainly concentrated in the commercial and industrial, mortgage, and commercial multi-family loan portfolios for 2015, and in the commercial multi-family, commercial and industrial, personal and auto loan portfolios for 2014.
For the period ended December 31, 2015, 4% (December 31, 2014 - 21%) of the ALLL for BPNA loan portfolios utilized the recent loss trend adjustment instead of the base loss. The effect of replacing the base loss with the recent loss trend adjustment was concentrated in the consumer loan portfolio for 2015 and in the commercial and industrial loan portfolio for 2014.
16
| | • | | Environmental factors, which include credit and macroeconomic indicators such as unemployment rate, economic activity index and delinquency rates are adopted to account for current market conditions that are likely to cause estimated credit losses to differ from historical losses. The Corporation reflects the effect of these environmental factors on each loan group as an adjustment that, as appropriate, increases the historical loss rate applied to each group. Environmental factors provide updated perspective on credit and economic conditions. Regression analysis is used to select these indicators and quantify the effect on the general reserve of the allowance for loan losses. |
During the second quarter of 2015, management completed the annual review of the components of the ALLL models. As part of this review management updated core metrics and revised certain components related to the estimation process for evaluating the adequacy of the general reserve of the allowance for loan losses. These enhancements to the ALLL methodology, which are described in the paragraphs below, were implemented as of June 30, 2015 and resulted in a net decrease to the allowance for loan losses of $ 1.9 million for the non-covered portfolio. The effect of the aforementioned enhancements was immaterial for the covered loans portfolio.
Management made the following principal enhancements to the methodology during the second quarter of 2015:
| | • | | Increased the historical look-back period for determining the base loss rates for commercial and construction loans. The Corporation increased the look-back period for assessing historical loss trends applicable to the determination of commercial and construction loan net charge-offs from 36 months to 60 months. Given the current overall commercial and construction credit quality improvements, including lower loss trends, management concluded that a 60-month look-back period for the base loss rates aligns the Corporation’s allowance for loan losses methodology to maintain adequate loss observations in its main general reserve component. |
The combined effect of the aforementioned enhancements to the base loss rates resulted in an increase to the allowance for loan losses of $19.6 million at June 30, 2015, of which $17.9 million related to the non-covered BPPR segment and $1.7 million related to the BPNA segment.
| | • | | Annual review and recalibration of the environmental factors adjustment. The environmental factor adjustments are developed by performing regression analyses on selected credit and economic indicators for each applicable loan segment. During the second quarter of 2015, the environmental factor models used to account for changes in current credit and macroeconomic conditions were reviewed and recalibrated based on the latest applicable trends. |
The combined effect of the aforementioned recalibration and enhancements to the environmental factors adjustment resulted in a decrease to the allowance for loan losses of $21.4 million at June 30, 2015, of which $20.5 million related to the non-covered BPPR segment and $1 million related to the BPNA segment.
According to the loan impairment accounting guidance in ASC Section 310-10-35, a loan is impaired when, based on current information and events, it is probable that the principal and/or interest are not going to be collected according to the original contractual terms of the loan agreement. Current information and events include “environmental” factors, e.g. existing industry, geographical, economic and political factors. Probable means the future event or events which will confirm the loss or impairment of the loan is likely to occur.
The Corporation defines commercial and construction impaired loans as borrowers with total debt greater than or equal to $1 million with 90 days or more past due, as well as all loans whose terms have been modified in a troubled debt restructuring (“TDRs”). In addition, larger commercial and construction loans ($1 million and over) that exhibit probable or observed credit weaknesses are subject to individual review and thus evaluated for impairment. Commercial and construction loans that originally met the Corporation’s threshold for impairment identification in a prior period, but due to charge-offs or payments are currently below the $1 million threshold and are still 90 days past due, except for TDRs, are accounted for under the Corporation’s general reserve methodology. Although the accounting codification guidance for specific impairment of a loan excludes large groups of smaller balance homogeneous loans that are collectively evaluated for impairment (e.g. mortgage and consumer loans), it specifically
17
requires that loan modifications considered TDRs be analyzed under its provisions. An allowance for loan impairment is recognized to the extent that the carrying value of an impaired loan exceeds the present value of the expected future cash flows discounted at the loan’s effective rate, the observable market price of the loan, if available, or the fair value of the collateral if the loan is collateral dependent.
The fair value of the collateral on commercial and construction loans is generally derived from appraisals. The Corporation periodically requires updated appraisal reports for loans that are considered impaired. The frequency of updated appraisals depends on total debt outstanding and type of collateral. Currently, for commercial and construction loans secured by real estate, if the borrower’s total debt is equal to or greater than $1 million, the appraisal is updated annually. If the borrower’s total debt is less than $1 million, the appraisal is updated at least every two years.
As a general procedure, the Corporation internally reviews appraisals as part of the underwriting and approval process and also for credits considered impaired following certain materiality benchmarks. Appraisals may be adjusted due to their age, property conditions, geographical area or general market conditions. The adjustments applied are based upon internal information, like other appraisals and/or loss severity information that can provide historical trends in the real estate market. Discount rates used may change from time-to-time based on management’s estimates. Refer to the Credit Risk Management and Loan Quality section of this MD&A for more detailed information on the Corporation’s collateral value estimation for other real estate.
The Corporation’s management evaluates the adequacy of the allowance for loan losses on a quarterly basis following a systematic methodology in order to provide for known and inherent risks in the loan portfolio. In developing its assessment of the adequacy of the allowance for loan losses, the Corporation must rely on estimates and exercise judgment regarding matters where the ultimate outcome is unknown such as economic developments affecting specific customers, industries or markets. Other factors that can affect management’s estimates are the years of historical data to include when estimating losses, the level of volatility of losses in a specific portfolio, changes in underwriting standards, financial accounting standards and loan impairment measurement, among others. Changes in the financial condition of individual borrowers, in economic conditions, in historical loss experience and in the condition of the various markets in which collateral may be sold may all affect the required level of the allowance for loan losses. Consequently, the business, financial condition, liquidity, capital and results of operations could also be affected.
The collateral dependent method is generally used for the impairment determination on commercial and construction loans since the expected realizable value of the loan is based upon the proceeds received from the liquidation of the collateral property. For commercial properties, the “as is” value or the “income approach” value is used depending on the financial condition of the subject borrower and/or the nature of the subject collateral. In most cases, impaired commercial loans do not have reliable or sustainable cash flow to use the discounted cash flow valuation method. On construction loans, “as developed” collateral values are used when the loan is originated since the assumption is that the cash flow of the property once leased or sold will provide sufficient funds to repay the loan. In the case of many impaired construction loans, the “as developed” collateral value is also used since completing the project reflects the best exit strategy in terms of potential loss reduction. In these cases, the costs to complete are considered as part of the impairment determination. As a general rule, the appraisal valuation used by the Corporation for impaired construction loans is based on discounted value to a single purchaser, discounted sell out or “as is” depending on the condition and status of the project and the performance of the same.
A restructuring constitutes a TDR when the Corporation separately concludes that both of the following conditions exist: (i) the restructuring constitutes a concession and (ii) the debtor is experiencing financial difficulties. The concessions stem from an agreement between the creditor and the debtor or are imposed by law or a court. These concessions could include a reduction in the interest rate on the loan, payment extensions, forgiveness of principal, forbearance or other actions intended to maximize collection. A concession has been granted when, as a result of the restructuring, the Corporation does not expect to collect all amounts due, including interest accrued at the original contract rate. If the payment of principal is dependent on the value of collateral, the current value of the collateral is taken into consideration in determining the amount of principal to be collected; therefore, all factors that changed are considered to determine if a concession was granted, including the change in the fair value of the underlying collateral that may be used to repay the loan. In addition, in order to expedite the resolution of delinquent construction and commercial loans, the Corporation routinely enters into liquidation agreements with borrowers and guarantors through the regular legal process, bankruptcy procedures and in certain occasions, out of Court transactions. These liquidation agreements, in general, contemplate the following conditions: (1) consent to judgment by the borrowers and guarantors; (2) acknowledgement by the borrower of debt, its liquidity and maturity; (3) acknowledgement of the default payments. The contractual interest rate is not reduced and continues to accrue during the term of the agreement. At the end of the period, borrower is obligated to remit all amounts due or be subject to the Corporation’s exercise of its foreclosure rights and further collection efforts. Likewise, the borrower’s failure to make stipulated payments will grant the Corporation the ability to exercise its foreclosure rights. This strategy
18
procures to expedite the foreclosure process, resulting in a more effective and efficient collection process. Although in general, these liquidation agreements do not contemplate the forgiveness of principal or interest as debtor is required to cover all outstanding amounts when the agreement becomes due, it could be construed that the Corporation has granted a concession by temporarily accepting a payment schedule that is different from the contractual payment schedule. Accordingly, loans under this program are considered TDRs.
Classification of loan modifications as TDRs involves a degree of judgment. Indicators that the debtor is experiencing financial difficulties which are considered include: (i) the borrower is currently in default on any of its debt or it is probable that the borrower would be in payment default on any of its debt in the foreseeable future without the modification; (ii) the borrower has declared or is in the process of declaring bankruptcy; (iii) there is significant doubt as to whether the borrower will continue to be a going concern; (iv) the borrower has securities that have been delisted, are in the process of being delisted, or are under threat of being delisted from an exchange; (v) based on estimates and projections that only encompass the borrower’s current business capabilities, it is forecasted that the entity-specific cash flows will be insufficient to service the debt (both interest and principal) in accordance with the contractual terms of the existing agreement through maturity; and (vi) absent the current modification, the borrower cannot obtain funds from sources other than the existing creditors at an effective interest rate equal to the current market interest rate for similar debt for a non-troubled debtor. The identification of TDRs is critical in the determination of the adequacy of the allowance for loan losses. Loans classified as TDRs are excluded from TDR status if performance under the restructured terms exists for a reasonable period (at least twelve months of sustained performance) and the loan yields a market rate.
For mortgage and other consumer loans that are modified with regard to payment terms and which constitute TDRs, the discounted cash flow value method is used as the impairment valuation is more appropriately calculated based on the ongoing cash flow from the individuals rather than the liquidation of the collateral asset. The computations give consideration to probability of default and loss-given default on the related estimated cash flows.
Acquisition Accounting for Covered Loans and Related Indemnification Asset
The Corporation accounted for the Westernbank FDIC-assisted transaction under the accounting guidance of ASC Topic 805,Business Combinations, which requires the use of the purchase method of accounting. All identifiable assets and liabilities acquired were initially recorded at fair value. No allowance for loan losses related to the acquired loans was recorded on the acquisition date as the fair value of the loans acquired incorporated assumptions regarding credit risk. Loans acquired were recorded at fair value in accordance with the fair value methodology prescribed in ASC Topic 820, exclusive of the shared-loss agreements with the FDIC. These fair value estimates associated with the loans included estimates related to expected prepayments and the amount and timing of expected principal, interest and other cash flows.
Because the FDIC has agreed to reimburse the Corporation for losses related to the acquired loans in the Westernbank FDIC-assisted transaction, subject to certain provisions specified in the agreements, an indemnification asset was recorded at fair value at the acquisition date. The indemnification asset was recognized at the same time as the indemnified loans, and is measured on the same basis, subject to collectability or contractual limitations. The loss share indemnification asset on the acquisition date reflected the reimbursements expected to be received from the FDIC, using an appropriate discount rate, which reflected counterparty credit risk and other uncertainties.
The initial valuation of these loans and related indemnification asset required management to make subjective judgments concerning estimates about how the acquired loans would perform in the future using valuation methods, including discounted cash flow analyses and independent third-party appraisals. Factors that may significantly affect the initial valuation included, among others, market-based and industry data related to expected changes in interest rates, assumptions related to probability and severity of credit losses, estimated timing of credit losses including the timing of foreclosure and liquidation of collateral, expected prepayment rates, required or anticipated loan modifications, unfunded loan commitments, the specific terms and provisions of any loss share agreements, and specific industry and market conditions that may impact discount rates and independent third-party appraisals.
The Corporation applied the guidance of ASC Subtopic 310-30 to all loans acquired in the Westernbank FDIC-assisted transaction (including loans that do not meet the scope of ASC Subtopic 310-30), except for credit cards and revolving lines of credit. ASC Subtopic 310-30 provides two specific criteria that have to be met in order for a loan to be within its scope: (1) credit deterioration on the loan from its inception until the acquisition date and (2) that it is probable that not all of the contractual cash flows will be collected on the loan. Once in the scope of ASC Subtopic 310-30, the credit portion of the fair value discount on an acquired loan cannot be accreted into income until the acquirer has assessed that it expects to receive more cash flows on the loan than initially anticipated.
19
Acquired loans that meet the definition of nonaccrual status fall within the Corporation’s definition of impaired loans under ASC Subtopic 310-30. It is possible that performing loans would not meet criteria number 1 above related to evidence of credit deterioration since the date of loan origination, and therefore not fall within the scope of ASC Subtopic 310-30. Based on the fair value determined for the acquired portfolio, acquired loans that did not meet the Corporation’s definition of non-accrual status also resulted in the recognition of a significant discount attributable to credit quality.
Given the significant discount related to credit in the valuation of the Westernbank acquired portfolio, the Corporation considered two possible options for the performing loans (1) accrete the entire fair value discount (including the credit portion) using the interest method over the life of the loan in accordance with ASC Subtopic 310-20; or (2) analogize to ASC Subtopic 310-30 and only accrete the portion of the fair value discount unrelated to credit.
Pursuant to an AICPA letter dated December 18, 2009, the AICPA summarized the SEC Staff’s view regarding the accounting in subsequent periods for discount accretion associated with loan receivables acquired in a business combination or asset purchase. Regarding the accounting for such loan receivables, in the absence of further standard setting, the AICPA understands that the SEC Staff would not object to an accounting policy based on contractual cash flows (Option 1 - ASC Subtopic 310-20 approach) or an accounting policy based on expected cash flows (Option 2 – ASC Subtopic 310-30 approach). As such, the Corporation considered the two allowable options as follows:
| | • | | Option 1 - Since the credit portion of the fair value discount is associated with an expectation of cash flows that an acquirer does not expect to receive over the life of the loan, it does not appear appropriate to accrete that portion over the life of the loan as doing so could eventually overstate the acquirer’s expected value of the loan and ultimately result in recognizing income (i.e. through the accretion of the yield) on a portion of the loan it does not expect to receive. Therefore, the Corporation does not believe this is an appropriate method to apply. |
| | • | | Option 2 – The Corporation believes analogizing to ASC Subtopic 310-30 is the more appropriate option to follow in accounting for the credit portion of the fair value discount. By doing so, the loan is only being accreted up to the value that the acquirer expected to receive at acquisition of the loan. |
Based on the above, the Corporation elected Option 2 – the ASC Subtopic 310-30 approach to the outstanding balance for all the acquired loans in the Westernbank FDIC-assisted transaction with the exception of revolving lines of credit with active privileges as of the acquisition date, which are explicitly scoped out by the ASC Subtopic 310-30 accounting guidance. New advances / draws after the acquisition date under existing credit lines that did not have revolving privileges as of the acquisition date, particularly for construction loans, will effectively be treated as a “new” loan for accounting purposes and accounted for under the provisions of ASC Subtopic 310-20, resulting in a hybrid accounting for the overall construction loan balance.
Management used judgment in evaluating factors impacting expected cash flows and probable loss assumptions, including the quality of the loan portfolio, portfolio concentrations, distressed economic conditions in Puerto Rico, quality of underwriting standards of the acquired institution, reductions in collateral real estate values, and material weaknesses disclosed by the acquired institution, including matters related to credit quality review and appraisal report review.
At April 30, 2010, the acquired loans accounted for pursuant to ASC Subtopic 310-30 by the Corporation totaled $4.9 billion which represented undiscounted unpaid contractually-required principal and interest balances of $9.9 billion reduced by a discount of $5.0 billion resulting from acquisition date fair value adjustments. The non-accretable discount on loans accounted for under ASC Subtopic 310-30 amounted to $3.4 billion or approximately 68% of the total discount, thus indicating a significant amount of expected credit losses on the acquired portfolios.
Pursuant to ASC Section 310-20-15-5, the Corporation aggregated loans acquired in the FDIC-assisted transaction into pools with common risk characteristics for purposes of applying the recognition, measurement and disclosure provisions of this subtopic. Each loan pool is accounted for as a single asset with a single composite interest rate and an aggregate expectation of cash flows. Characteristics considered in pooling loans in the Westernbank FDIC-assisted transaction included loan type, interest rate type, accruing status, amortization type, rate index and source type. Once the pools are defined, the Corporation maintains the integrity of the pool of multiple loans accounted for as a single asset.
Under ASC Subtopic 310-30, the difference between the undiscounted cash flows expected at acquisition and the fair value of the loans, or the “accretable yield,” is recognized as interest income using the effective yield method over the estimated life of the loan if
20
the timing and amount of the future cash flows of the pool is reasonably estimable. The non-accretable difference represents the difference between contractually required principal and interest and the cash flows expected to be collected. Subsequent to the acquisition date, increases in cash flows over those expected at the acquisition date are recognized as interest income prospectively as an adjustment to accretable yield over the pool’s remaining life. Decreases in expected cash flows after the acquisition date are generally recognized by recording an allowance for loan losses.
The fair value discount of lines of credit with revolving privileges that are accounted for pursuant to the guidance of ASC Subtopic 310-20, represented the difference between the contractually required loan payment receivable in excess of the initial investment in the loan. Any cash flows collected in excess of the carrying amount of the loan are recognized in earnings at the time of collection. The carrying amount of lines of credit with revolving privileges, which are accounted pursuant to the guidance of ASC Subtopic 310-20, are subject to periodic review to determine the need for recognizing an allowance for loan losses.
The FDIC loss share indemnification asset for loss share agreements is measured separately from the related covered assets as it is not contractually embedded in the assets and is not transferable with the assets should the assets be sold.
The FDIC loss share indemnification asset is recognized on the same basis as the assets subject to loss share protection, except that the amortization / accretion terms differ for each asset. For covered loans accounted for pursuant to ASC Subtopic 310-30, decreases in expected reimbursements from the FDIC due to improvements in expected cash flows to be received from borrowers are recognized in non-interest income prospectively over the life of the FDIC loss sharing agreements. For covered loans accounted for under ASC Subtopic 310-20, as the loan discount recorded as of the acquisition date was accreted into income, a reduction of the related indemnification asset was recorded as a reduction in non-interest income. Increases in expected reimbursements from the FDIC are recognized in non-interest income in the same period that the allowance for credit losses for the related loans is recognized.
Over the life of the acquired loans that are accounted under ASC Subtopic 310-30, the Corporation continues to estimate cash flows expected to be collected on individual loans or on pools of loans sharing common risk characteristics. The Corporation evaluates at each balance sheet date whether the present value of its loans determined using the effective interest rates has decreased based on revised estimated cash flows and if so, recognizes a provision for loan loss in its consolidated statement of operations and an allowance for loan losses in its consolidated statement of financial condition. For any increases in cash flows expected to be collected from borrowers, the Corporation adjusts the amount of accretable yield recognized on the loans on a prospective basis over the pool’s remaining life.
The evaluation of estimated cash flows expected to be collected subsequent to acquisition on loans accounted pursuant to ASC Subtopic 310-30 and inherent losses on loans accounted pursuant to ASC Subtopic 310-20 require the continued usage of key assumptions and estimates. Given the current economic environment, the Corporation must apply judgment to develop its estimates of cash flows considering the impact of home price and property value changes, changing loss severities and prepayment speeds. Decreases in the expected cash flows for ASC Subtopic 310-30 loans and decreases in the net realizable value of ASC Subtopic 310-20 loans will generally result in a charge to the provision for credit losses resulting in an increase to the allowance for loan losses. These estimates are particularly sensitive to changes in loan credit quality.
The amount that the Corporation realizes on the covered loans and related indemnification assets could differ materially from the carrying value reflected in these financial statements, based upon the timing and amount of collections on the acquired loans in future periods. The Corporation’s losses on these assets may be mitigated to the extent covered under the specific terms and provisions of the loss share agreements.
Income Taxes
Income taxes are accounted for using the asset and liability method. Under this method, deferred tax assets and liabilities are recognized based on the future tax consequences attributable to temporary differences between the financial statement carrying amounts of existing assets and liabilities and their respective tax basis, and attributable to operating loss and tax credit carryforwards. Deferred tax assets and liabilities are measured using enacted tax rates expected to apply in the years in which the temporary differences are expected to be recovered or paid. The effect on deferred tax assets and liabilities of a change in tax rates is recognized in earnings in the period when the changes are enacted.
The calculation of periodic income taxes is complex and requires the use of estimates and judgments. The Corporation has recorded two accruals for income taxes: (i) the net estimated amount currently due or to be received from taxing jurisdictions,
21
including any reserve for potential examination issues, and (ii) a deferred income tax that represents the estimated impact of temporary differences between how the Corporation recognizes assets and liabilities under accounting principles generally accepted in the United States (GAAP), and how such assets and liabilities are recognized under the tax code. Differences in the actual outcome of these future tax consequences could impact the Corporation’s financial position or its results of operations. In estimating taxes, management assesses the relative merits and risks of the appropriate tax treatment of transactions taking into consideration statutory, judicial and regulatory guidance.
A deferred tax asset should be reduced by a valuation allowance if based on the weight of all available evidence, it is more likely than not (a likelihood of more than 50%) that some portion or the entire deferred tax asset will not be realized. The valuation allowance should be sufficient to reduce the deferred tax asset to the amount that is more likely than not to be realized. The determination of whether a deferred tax asset is realizable is based on weighting all available evidence, including both positive and negative evidence. The realization of deferred tax assets, including carryforwards and deductible temporary differences, depends upon the existence of sufficient taxable income of the same character during the carryback or carryforward period. The realization of deferred tax assets requires the consideration of all sources of taxable income available to realize the deferred tax asset, including the future reversal of existing temporary differences, future taxable income exclusive of reversing temporary differences and carryforwards, taxable income in carryback years and tax-planning strategies.
Management evaluates the realization of the deferred tax asset by taxing jurisdiction, the US mainland operations are evaluated as a whole since a consolidated income tax return is filed; on the other hand, the deferred tax asset related to the Puerto Rico operations is evaluated on an entity by entity basis, since no consolidation is allowed in the income tax filing. Accordingly, this evaluation is composed of three major components: US mainland operations, Puerto Rico banking operations and Holding Company.
During the year ended December 31, 2015, after weighting all positive and negative evidence, the Corporation concluded that it is more likely than not that a portion of the total deferred tax asset from the U.S. operations, amounting to $1.2 billion and comprised mainly of net operating losses, will be realized. The Corporation based this determination on its estimated earnings for the remaining carryforward period of eighteen years beginning with the 2016 fiscal year, available to utilize the deferred tax asset, to reduce its income tax obligations. The recent historical level of book income adjusted by permanent differences, together with the estimated earnings after the reorganization of the U.S. operations and additional estimated earnings from the Doral Bank Transaction were objective positive evidence considered by the Corporation. As of December 31, 2015, the U.S. operations are not in a three year loss cumulative position, taking into account taxable income exclusive of reversing temporary differences. All of these factors led management to conclude that it is more likely than not that a portion of the deferred tax asset from its U.S. operations will be realized. Accordingly, the Corporation recorded a partial reversal of the valuation allowance on the deferred tax asset from the U.S. operations amounting to $589.0 million. Management will continue to evaluate the realization of the deferred tax asset each quarter and adjust as any changes arises.
At December 31, 2015, the Corporation’s net deferred tax assets related to its Puerto Rico operations amounted to $752 million. The Corporation’s Puerto Rico Banking operation is not in a cumulative loss position and has sustained profitability for the three year period ended December 31, 2015. This is considered a strong piece of objectively verifiable positive evidence that out weights any negative evidence considered by management in the evaluation of the realization of the deferred tax asset. Based on this evidence and management’s estimate of future taxable income, the Corporation has concluded that it is more likely than not that such net deferred tax asset of the Puerto Rico Banking operations will be realized.
After the payment of TARP, the interest expense that is paid on the newly issued $450 million subordinated notes which partially funded the repayment of TARP funds in 2014, bearing interest at 7%, is tax deductible contrary to the interest expense payable on the note issued to the U.S. Treasury under TARP. Based on this new fact pattern the Holding Company is expecting to have losses for income tax purposes exclusive of reversing temporary differences. Since as required by ASC 740 the historical information should be supplemented by all currently available information about future years, the expected losses in future years is considered by management a strong negative evidence that will suggest that income in future years will be insufficient to support the realization of all deferred tax asset. After weighting of all positive and negative evidence management concluded, as of the reporting date, that it is more likely than not that the Holding Company will not be able to realize any portion of the deferred tax assets, considering the criteria of ASC Topic 740. Accordingly, a valuation allowance on the deferred tax asset of $30 million was recorded as of December 31, 2015.
22
Under the Puerto Rico Internal Revenue Code, the Corporation and its subsidiaries are treated as separate taxable entities and are not entitled to file consolidated tax returns. The Code provides a dividends-received deduction of 100% on dividends received from “controlled” subsidiaries subject to taxation in Puerto Rico and 85% on dividends received from other taxable domestic corporations.
Changes in the Corporation’s estimates can occur due to changes in tax rates, new business strategies, newly enacted guidance, and resolution of issues with taxing authorities regarding previously taken tax positions. Such changes could affect the amount of accrued taxes. The Corporation has made tax payments in accordance with estimated tax payments rules. Any remaining payment will not have any significant impact on liquidity and capital resources.
The valuation of deferred tax assets requires judgment in assessing the likely future tax consequences of events that have been recognized in the financial statements or tax returns and future profitability. The accounting for deferred tax consequences represents management’s best estimate of those future events. Changes in management’s current estimates, due to unanticipated events, could have a material impact on the Corporation’s financial condition and results of operations.
The Corporation establishes tax liabilities or reduces tax assets for uncertain tax positions when, despite its assessment that its tax return positions are appropriate and supportable under local tax law, the Corporation believes it may not succeed in realizing the tax benefit of certain positions if challenged. In evaluating a tax position, the Corporation determines whether it is more-likely-than-not that the position will be sustained upon examination, including resolution of any related appeals or litigation processes, based on the technical merits of the position. The Corporation’s estimate of the ultimate tax liability contains assumptions based on past experiences, and judgments about potential actions by taxing jurisdictions as well as judgments about the likely outcome of issues that have been raised by taxing jurisdictions. The tax position is measured as the largest amount of benefit that is greater than 50% likely of being realized upon ultimate settlement. The Corporation evaluates these uncertain tax positions each quarter and adjusts the related tax liabilities or assets in light of changing facts and circumstances, such as the progress of a tax audit or the expiration of a statute of limitations. The Corporation believes the estimates and assumptions used to support its evaluation of uncertain tax positions are reasonable.
After consideration of the effect on U.S. federal tax of unrecognized U.S. state tax benefits, the total amount of unrecognized tax benefits, including U.S. and Puerto Rico that, if recognized, would affect the Corporation’s effective tax rate, was approximately $11.2 million at December 31, 2015 (2014 - $9.8 million). Refer to Note 42 to the consolidated financial statements for further information on this subject matter. The Corporation anticipates a reduction in the total amount of unrecognized tax benefits within the next 12 months, which could amount to approximately $2.8 million.
The amount of unrecognized tax benefits may increase or decrease in the future for various reasons including adding amounts for current tax year positions, expiration of open income tax returns due to the statutes of limitation, changes in management’s judgment about the level of uncertainty, status of examinations, litigation and legislative activity and the addition or elimination of uncertain tax positions. Although the outcome of tax audits is uncertain, the Corporation believes that adequate amounts of tax, interest and penalties have been provided for any adjustments that are expected to result from open years. From time to time, the Corporation is audited by various federal, state and local authorities regarding income tax matters. Although management believes its approach in determining the appropriate tax treatment is supportable and in accordance with the accounting standards, it is possible that the final tax authority will take a tax position that is different than the tax position reflected in the Corporation’s income tax provision and other tax reserves. As each audit is conducted, adjustments, if any, are appropriately recorded in the consolidated financial statement in the period determined. Such differences could have an adverse effect on the Corporation’s income tax provision or benefit, or other tax reserves, in the reporting period in which such determination is made and, consequently, on the Corporation’s results of operations, financial position and / or cash flows for such period.
Goodwill
The Corporation’s goodwill and other identifiable intangible assets having an indefinite useful life are tested for impairment. Intangibles with indefinite lives are evaluated for impairment at least annually, and on a more frequent basis, if events or circumstances indicate impairment could have taken place. Such events could include, among others, a significant adverse change in the business climate, an adverse action by a regulator, an unanticipated change in the competitive environment and a decision to change the operations or dispose of a reporting unit.
Under applicable accounting standards, goodwill impairment analysis is a two-step test. The first step of the goodwill impairment test involves comparing the fair value of the reporting unit with its carrying amount, including goodwill. If the fair value of the reporting unit exceeds its carrying amount, goodwill of the reporting unit is not considered impaired; however, if the carrying amount of the
23
reporting unit exceeds its fair value, the second step must be performed. The second step involves calculating an implied fair value of goodwill for each reporting unit for which the first step indicated possible impairment. The implied fair value of goodwill is determined in the same manner as the amount of goodwill recognized in a business combination, which is the excess of the fair value of the reporting unit, as determined in the first step, over the aggregate fair values of the individual assets, liabilities and identifiable intangibles (including any unrecognized intangible assets, such as unrecognized core deposits and trademark) as if the reporting unit was being acquired in a business combination and the fair value of the reporting unit was the price paid to acquire the reporting unit. The Corporation estimates the fair values of the assets and liabilities of a reporting unit, consistent with the requirements of the fair value measurements accounting standard, which defines fair value as the price that would be received to sell an asset or paid to transfer a liability in an orderly transaction between market participants at the measurement date. The fair value of the assets and liabilities reflects market conditions, thus volatility in prices could have a material impact on the determination of the implied fair value of the reporting unit goodwill at the impairment test date. The adjustments to measure the assets, liabilities and intangibles at fair value are for the purpose of measuring the implied fair value of goodwill and such adjustments are not reflected in the consolidated statement of condition. If the implied fair value of goodwill exceeds the goodwill assigned to the reporting unit, there is no impairment. If the goodwill assigned to a reporting unit exceeds the implied fair value of the goodwill, an impairment charge is recorded for the excess. An impairment loss recognized cannot exceed the amount of goodwill assigned to a reporting unit, and the loss establishes a new basis in the goodwill. Subsequent reversal of goodwill impairment losses is not permitted under applicable accounting standards.
At December 31, 2015, goodwill amounted to $626 million. Note 21 to the consolidated financial statements provides the assignment of goodwill by reportable segment.
The Corporation performed the annual goodwill impairment evaluation for the entire organization during the third quarter of 2015 using July 31, 2015 as the annual evaluation date. The reporting units utilized for this evaluation were those that are one level below the business segments, which are the legal entities within the reportable segment. The Corporation assigns goodwill to the reporting units when carrying out a business combination.
In determining the fair value of a reporting unit, the Corporation generally uses a combination of methods, including market price multiples of comparable companies and transactions, as well as discounted cash flow analysis. Management evaluates the particular circumstances of each reporting unit in order to determine the most appropriate valuation methodology. The Corporation evaluates the results obtained under each valuation methodology to identify and understand the key value drivers in order to ascertain that the results obtained are reasonable and appropriate under the circumstances. Elements considered include current market and economic conditions, developments in specific lines of business, and any particular features in the individual reporting units.
The computations require management to make estimates and assumptions. Critical assumptions that are used as part of these evaluations include:
| | • | | a selection of comparable publicly traded companies, based on nature of business, location and size; |
| | • | | a selection of comparable acquisition and capital raising transactions; |
| | • | | the discount rate applied to future earnings, based on an estimate of the cost of equity; |
| | • | | the potential future earnings of the reporting unit; and |
| | • | | the market growth and new business assumptions. |
For purposes of the market comparable approach, valuations were determined by calculating average price multiples of relevant value drivers from a group of companies that are comparable to the reporting unit being analyzed and applying those price multiples to the value drivers of the reporting unit. Multiples used are minority based multiples and thus, no control premium adjustment is made to the comparable companies market multiples. While the market price multiple is not an assumption, a presumption that it provides an indicator of the value of the reporting unit is inherent in the valuation. The determination of the market comparables also involves a degree of judgment.
For purposes of the discounted cash flows (“DCF”) approach, the valuation is based on estimated future cash flows. The financial projections used in the DCF valuation analysis for each reporting unit are based on the most recent (as of the valuation date) financial projections presented to the Corporation’s Asset / Liability Management Committee (“ALCO”). The growth assumptions
24
included in these projections are based on management’s expectations for each reporting unit’s financial prospects considering economic and industry conditions as well as particular plans of each entity (i.e. restructuring plans, de-leveraging, etc.). The cost of equity used to discount the cash flows was calculated using the Ibbotson Build-Up Method and ranged from 11.64% to 15.52% for the 2015 analysis. The Ibbotson Build-Up Method builds up a cost of equity starting with the rate of return of a “risk-free” asset (20-year U.S. Treasury note) and adds to it additional risk elements such as equity risk premium, size premium and industry risk premium. The resulting discount rates were analyzed in terms of reasonability given the current market conditions and adjustments were made when necessary.
For BPNA reporting unit, the average estimated fair value calculated in Step 1, using all valuation methodologies exceeded BPNA’s equity value by approximately $92 million in the July 31, 2015 annual test and by $205 million in the July 31, 2014 annual test. Accordingly, there is no indication of impairment of goodwill recorded in BPNA at July 31, 2015 and there is no need for a Step 2 analysis.
For the BPPR reporting unit, the average estimated fair value calculated in Step 1 using all valuation methodologies exceeded BPPR’s equity value by approximately $180 million in the July 31, 2015 annual test as compared with approximately $337 million at July 31, 2014 . This result indicates there would be no indication of impairment on the goodwill recorded in BPPR at July 31, 2015. The goodwill balance of BPPR and BPNA, as legal entities, represented approximately 96% of the Corporation’s total goodwill balance as of the July 31, 2015 valuation date.
Furthermore, as part of the analyses, management performed a reconciliation of the aggregate fair values determined for the reporting units to the market capitalization of Popular, Inc. concluding that the fair value results determined for the reporting units in the July 31, 2015 annual assessment were reasonable.
The goodwill impairment evaluation process requires the Corporation to make estimates and assumptions with regard to the fair value of the reporting units. Actual values may differ significantly from these estimates. Such differences could result in future impairment of goodwill that would, in turn, negatively impact the Corporation’s results of operations and the reporting units where the goodwill is recorded. Declines in the Corporation’s market capitalization could increase the risk of goodwill impairment in the future.
Management monitors events or changes in circumstances between annual tests to determine if these events or changes in circumstances would more likely than not reduce the fair value of a reporting unit below its carrying amount. There has been a significant decline in the Corporation’s stock price since the fourth quarter of 2015, attributed to macro economic conditions in the global markets as well as the continued weakness in the Puerto Rico economy. This represented a triggering event which required management to conduct a goodwill impairment analysis as of December 31, 2015. The Corporation used the same methodology as for the annual impairment test, including a reconciliation of the aggregate fair values determined for the reporting units to the market capitalization of Popular, Inc.
For the BPNA reporting unit, the average estimated fair value calculated in Step 1 using all valuation methodologies was below BPNA’s equity value by approximately $171 million in the December 31, 2015 test. Accordingly, management proceeded to perform the Step 2 analysis. The Corporation performed a valuation of all assets and liabilities of BPNA, including any recognized and unrecognized intangible assets, to determine the fair value of BPNA’s net assets. To complete Step 2, the Corporation subtracted from BPNA’s Step 1 fair value the determined fair value of the net assets to arrive at the implied fair value of goodwill. The results of Step 2 indicated that the implied fair value of goodwill exceeded the goodwill carrying value by $197 million resulting in no goodwill impairment.
For the BPPR reporting unit, the average estimated fair value calculated in Step 1 using all valuation methodologies exceeded BPPR’s equity value by approximately $313 million in the December 31, 2015 test. This result indicates there is no indication of impairment on the goodwill recorded in BPPR at December 31, 2015 and there is no need for a Step 2 analysis.
Further declines in the Corporation’s stock price, related to macroeconomic conditions in the global market as well as the weakness in the Puerto Rico economy may lead to an impairment of goodwill.
Pension and Postretirement Benefit Obligations
The Corporation provides pension and restoration benefit plans for certain employees of various subsidiaries. The Corporation also provides certain health care benefits for retired employees of BPPR. The non-contributory defined pension and benefit restoration plans (“the Plans”) are frozen with regards to all future benefit accruals.
The estimated benefit costs and obligations of the pension and postretirement benefit plans are impacted by the use of subjective assumptions, which can materially affect recorded amounts, including expected returns on plan assets, discount rates, termination rates, retirement rates and health care trend rates. Management applies judgment in the determination of these factors, which normally undergo evaluation against current industry practice and the actual experience of the Corporation. The Corporation uses
25
an independent actuarial firm for assistance in the determination of the pension and postretirement benefit costs and obligations. Detailed information on the Plans and related valuation assumptions are included in Note 36 to the consolidated financial statements.
The Corporation periodically reviews its assumption for the long-term expected return on pension plan assets. The Plans’ assets fair value at December 31, 2015 was $644.4 million. The expected return on plan assets is determined by considering various factors, including a total fund return estimate based on a weighted-average of estimated returns for each asset class in the plan. Asset class returns are estimated using current and projected economic and market factors such as real rates of return, inflation, credit spreads, equity risk premiums and excess return expectations.
As part of the review, the Corporation’s independent consulting actuaries performed an analysis of expected returns based on the plan’s asset expected allocation for the year 2016 using the Willis Towers Watson US Expected Return Estimator. This analysis is reviewed by the Corporation and used as a tool to develop expected rates of return, together with other data. This forecast reflects the actuarial firm’s view of expected long-term rates of return for each significant asset class or economic indicator; for example, 8.5% for large cap stocks, 8.8% for small cap stocks, 8.9% for international stocks, 3.8% for aggregate fixed-income securities and 4.5% for long government/credit at January 1, 2016. A range of expected investment returns is developed, and this range relies both on forecasts and on broad-market historical benchmarks for expected returns, correlations, and volatilities for each asset class.
As a consequence of recent reviews, the Corporation decreased its expected return on plan assets for year 2016 to 6.875%. The expected rate of returns of 7.00% and 7.25% had been used for 2015 and 2014, respectively. Since the expected return assumption is on a long-term basis, it is not materially impacted by the yearly fluctuations (either positive or negative) in the actual return on assets.
Pension expense for the Plans amounted to $3.8 million in 2015. The total pension expense included a credit of $46.6 million for the expected return on assets.
Pension expense is sensitive to changes in the expected return on assets. For example, decreasing the expected rate of return for 2016 from 6.875% to 6.625% would increase the projected 2016 expense for the Banco Popular de Puerto Rico Retirement Plan, the Corporation’s largest plan, by approximately $1.5 million.
If the projected benefit obligation exceeds the fair value of plan assets, the Corporation shall recognize a liability equal to the unfunded projected benefit obligation and vice versa, if the fair value of plan assets exceeds the projected benefit obligation, the Corporation recognizes an asset equal to the overfunded projected benefit obligation. This asset or liability may result in a taxable or deductible temporary difference and its tax effect shall be recognized as an income tax expense or benefit which shall be allocated to various components of the financial statements, including other comprehensive income. The determination of the fair value of pension plan obligations involves judgment, and any changes in those estimates could impact the Corporation’s consolidated statement of financial condition. The valuation of pension plan obligations is discussed above. Management believes that the fair value estimates of the pension plan assets are reasonable given the valuation methodologies used to measure the investments at fair value as described in Note 34. Also, the compositions of the plan assets are primarily in equity and debt securities, which have readily determinable quoted market prices.
Effective December 31, 2015, the Corporation changed its estimate of the service and interest cost components of net periodic benefit cost for its pension and postretirement benefits plans. Previously, the Corporation estimated the service and interest cost components utilizing a single weighted-average discount rate derived from the yield curve used to measure the benefit obligation. The new estimate utilizes a full yield curve approach in the estimation of these components by applying the specific spot rates along the yield curve used in the determination of the benefit obligation to their underlying projected cash flows. The new estimate provides a more precise measurement of service and interest costs by improving the correlation between projected benefit cash flows and their corresponding spot rates. The change does not affect the measurement of the Corporation’s pension and postretirement benefit obligations and it is accounted for as a change in accounting estimate, which is applied prospectively. The Corporation uses the Willis Towers Watson RATE: Link (10/90) Model to discount the expected projected cash flows of the plans. As a result of this change, the Corporation used an equivalent single weighted average discount rate of 4.27% for the Banco Popular de Puerto Rico Retirement Plan, 4.23% for the Tax Qualified Retirement Restoration Plan, 4.20% for the Benefit Restoration Plan and 4.37% for the Retiree Health Care Benefit Plan to determine the benefit obligations at December 31, 2015, compared with 3.90% for the three pension plans and 4.00% for the postretirement health care benefit plan at December 31, 2014. For year 2016, the change in estimate is expected to reduce the pension and postretirement net periodic benefit plan cost (for the four plans) by approximately $6.9 million.
26
A 50 basis point decrease in the assumed equivalent single discount rate to determine the benefit obligation of 4.27% as of the beginning of 2016 would increase the projected 2016 expense for the Banco Popular de Puerto Rico Retirement Plan by approximately $2.0 million. The change would not affect the minimum required contribution to the Plan.
The postretirement health care benefit plan was unfunded (no assets were held by the plan) at December 31, 2015. The Corporation had an accrual for postretirement benefit costs of $166.0 million at December 31, 2015 using an equivalent single discount rate of 4.37%. Assumed health care trend rates may have significant effects on the amounts reported for the health care plan. Note 36 to the consolidated financial statements provides information on the assumed rates considered by the Corporation and on the sensitivity that a one-percentage point change in the assumed rate may have on specified cost components and the postretirement benefit obligation of the Corporation.
STATEMENT OF OPERATIONS ANALYSIS
Net Interest Income
Net interest income is the difference between the revenue generated from earning assets less the interest cost of funding those assets. Several risk factors might affect net interest income including market driven events, changes in volumes and repricing characteristics of assets and liabilities, as well as strategic decisions made by the Corporation’s management. Net interest income from the continuing business, on a taxable equivalent basis, for the year ended December 31, 2015 was $1,492 million compared to $1,032 million in 2014. During the year 2014, upon repayment of TARP, the Corporation recognized $414.1 million as interest expense from the accelerated amortization of the related discount and deferred costs, and $39.2 million recognized as interest expense associated to the refinancing of $638 million in long term structured repos in the U.S. with a cost of 4.41%, which were replaced with lower cost short term repos of a similar amount. These transactions occurred in the third quarter of 2014 and the benefit of lower interest expense has a full year impact in 2015. Excluding the effect of these transactions, the net interest income of the Corporation on a taxable equivalent basis for 2014 was $1,485 million.
The average key index rates for the years 2013 through 2015 were as follows:
| | | | | | | | | | | | |
| | | 2015 | | | 2014 | | | 2013 | |
Prime rate | | | 3.26 | % | | | 3.25 | % | | | 3.25 | % |
Fed funds rate | | | 0.13 | | | | 0.08 | | | | 0.07 | |
3-month LIBOR | | | 0.32 | | | | 0.23 | | | | 0.27 | |
3-month Treasury Bill | | | 0.04 | | | | 0.05 | | | | 0.05 | |
10-year Treasury | | | 2.13 | | | | 2.53 | | | | 2.36 | |
FNMA 30-year | | | 2.92 | | | | 3.41 | | | | 3.61 | |
Net interest income on a taxable equivalent basis – Non-GAAP financial measure
The interest earning assets include investment securities and loans that are exempt from income tax, principally in Puerto Rico. The main sources of tax-exempt interest income are certain investments in obligations of the U.S. Government, its agencies and sponsored entities, and certain obligations of the Commonwealth of Puerto Rico and its agencies and assets held by the Corporation’s international banking entities. To facilitate the comparison of all interest related to these assets, the interest income has been converted to a taxable equivalent basis, using the applicable statutory income tax rates for each period. The taxable equivalent computation considers the interest expense and other related expense disallowances required by the Puerto Rico tax law. Under this law, the exempt interest can be deducted up to the amount of taxable income. Net interest income on a taxable equivalent basis is a non-GAAP financial measure. Management believes that this presentation provides meaningful information since it facilitates the comparison of revenues arising from taxable and exempt sources. Tables 5 and 6 present the net interest income on a taxable equivalent basis and present the impact of the taxable equivalent adjustment to reconcile to the net interest income as presented in the Corporations’ financial statements under U.S.GAAP.
Average outstanding securities balances are based upon amortized cost excluding any unrealized gains or losses on securities available-for-sale. Non-accrual loans have been included in the respective average loans and leases categories. Loan fees collected
27
and costs incurred in the origination of loans are deferred and amortized over the term of the loan as an adjustment to interest yield. Prepayment penalties, late fees collected and the amortization of premiums / discounts on purchased loans are also included as part of the loan yield. Interest income for the period ended December 31, 2015 included a favorable impact, excluding the discount accretion on covered loans accounted for under ASC Subtopic 310-30, of $16.7 million, related to those items, compared to a favorable impact of $4.5 million for the same period in 2014. The $12.2 million increase from 2014 to 2015 resulted mainly from the amortization of the discount from the Doral acquired loans.
Table 5 presents the different components of the Corporation’s net interest income, on a taxable equivalent basis, for the year ended December 31, 2015, as compared with the same period in 2014, segregated by major categories of interest earning assets and interest bearing liabilities. The acquisition of Doral assets and liabilities at the end of February 2015 is the most significant event impacting net interest income in 2015. Net interest margin, on a taxable equivalent basis was 4.74% in 2015, compared to 3.45% in 2014; excluding the above mentioned non-recurring interest expense charges related to the repayment of TARP funds and the refinancing of structured repos in the U.S., the adjusted net interest margin for 2014 was 4.96%. Although net interest income on a taxable equivalent basis increased by $7.3 million the adjusted net interest margin decreased by 22 basis points mainly due to:
| | • | | Lower volume by $438 million from WB loans which carried a yield of 8.95% and 10.60% for the year ended December 31, 2015 and 2014, respectively. This portfolio, due to its nature, will continue to decline as scheduled payments are received and workout arrangements are made. |
| | • | | Lower volume of trading account securities due to decreased securitization activity. |
These negative variances were partially offset by:
| | • | | Higher volume of earning assets by $1.6 billion mostly related to the assets acquired in the Doral transaction, net of the related liabilities assumed in the transaction and increased volumes in Puerto Rico. |
| | • | | Lower cost of borrowings due to the repayment of TARP funds and the refinancing of U.S. structured repos, as described above. Partially offsetting this favorable variance is the issuance in 2014 of $450 million of senior notes at 7%, which were used to partially fund the repayment of TARP. |
| | • | | Lower volume of borrowed money due to the above mentioned repayment of TARP and refinancing of structured repos as well as other maturities that have not been substituted due mainly to a higher volume of deposits, both interest and non-interest bearing. |
During 2014, the Corporation completed the sale of its California, Central Florida and Illinois regions, as part of the reorganization of its U.S. operations. The operating results from these regions have been separately presented for all periods as discontinued operations, as required by U.S. GAAP. The 2013 levels and yields have been adjusted to exclude the net interest income and respective volumes of assets and liabilities from the regions sold to present comparable results.
Net interest margin, on a taxable equivalent basis was 3.45% in 2014; excluding the above mentioned non recurring interest expense charges related to the repayment of TARP funds and the refinancing of structured repos in the U.S., the net interest margin was 4.96% compared to 4.73% for 2013. The main variances are discussed below:
| | • | | Higher yield from commercial loans mainly related to new or repriced loans at higher yields, particularly loans to the Puerto Rico public sector. |
| | • | | A higher yield from mortgage loans due to a reversal of $5.9 million of interest from reverse mortgages at BPPR during the third quarter of 2013 which had been accrued in excess of the amount insured by FHA. Higher volume of consumer loans, mainly auto loans from Popular Auto. |
| | • | | A higher yield from covered loans due to higher expected cash flows which are reflected in the accretable yield to be recognized over the average life of the loans and loan resolutions during 2014; partially offset by the change in the estimated life of certain commercial loans that resulted in an extension of the period in which the accretion of income will be recorded. The positive variance in yield was partially offset by a lower proportion of covered loans to total earning assets. This portfolio, due to its nature, will continue to decline as scheduled payments are received and workout arrangements are made. For a detailed movement of covered loans refer to Note 12 of this Annual Report. |
28
| | • | | Lower cost of interest bearing deposits, mainly individual certificates of deposits, IRAs and brokered CDs related to renewal of maturities in a low interest rate environment and management’s efforts to reduce deposit costs. |
| | • | | A lower cost of borrowings due to the repayment of TARP funds and the refinancing of U.S. structured repos, as described above. Also, during the third quarter of 2013, $233.2 million in senior notes were repaid with an average cost of approximately 7.77%. These positive variances were partially offset by the issuance of $450 million of senior notes at 7%, which were used to partially fund the repayment of TARP. |
These positive variances were partially offset by a lower yield from leases due mainly to new activity at lower rates.
Average earning assets increased $156 million when compared with 2013 mainly a higher volume of investment securities and consumer loans primarily related to Popular Auto initiatives, partially offset by a lower volume of construction loans and a reduction in the covered loan portfolio as mentioned above.
Average interest bearing liabilities decreased $864 million in 2014 mainly as a result of a lower volume of borrowed money and broker CDs due to lower funding needs, partially offset by higher volume of non maturity deposits. Also, for 2014 there was a higher volume of non interest bearing sources of funds, which helped improve the net interest margin.
29
Table 5 - Analysis of Levels & Yields on a Taxable Equivalent Basis from Continuing Operations (Non-GAAP)
Years ended December 31,
| | | | | | | | | | | | | | | | | | | | | | | | | | | | | | | | | | | | | | | | | | | | |
| Average Volume | | | Average Yields / Costs | | | | | Interest | | | Variance
Attributable to | |
| 2015 | | | 2014 | | | Variance | | | 2015 | | | 2014 | | | Variance | | | | | 2015 | | | 2014 | | | Variance | | | Rate | | | Volume | |
| (In millions) | | | | | | | | | | | | | | (In thousands) | |
| | | | | | | | | | | |
| $ | 2,382 | | | $ | 1,305 | | | $ | 1,077 | | | | 0.30 | % | | | 0.32 | % | | | (0.02 | )% | | Money market investments | | $ | 7,244 | | | $ | 4,224 | | | $ | 3,020 | | | $ | 397 | | | $ | 2,623 | |
| | 5,815 | | | | 5,886 | | | | (71 | ) | | | 2.80 | | | | 2.75 | | | | 0.05 | | | Investment securities | | | 162,620 | | | | 162,008 | | | | 612 | | | | (3,358 | ) | | | 3,970 | |
| | 209 | | | | 340 | | | | (131 | ) | | | 6.24 | | | | 6.16 | | | | 0.08 | | | Trading securities | | | 13,064 | | | | 20,914 | | | | (7,850 | ) | | | 280 | | | | (8,130 | ) |
| | | | | | | | | | | | | | | | | | | | | | | | | | | | | | | | | | | | | | | | | | | | |
| | 8,406 | | | | 7,531 | | | | 875 | | | | 2.18 | | | | 2.49 | | | | (0.31 | ) | | Total money market, investment and trading securities | | | 182,928 | | | | 187,146 | | | | (4,218 | ) | | | (2,681 | ) | | | (1,537 | ) |
| | | | | | | | | | | | | | | | | | | | | | | | | | | | | | | | | | | | | | | | | | | | |
| | | | | | | | | | | | | | | | | | | | | | | | Loans: | | | | | | | | | | | | | | | | | | | | |
| | 8,705 | | | | 8,347 | | | | 358 | | | | 5.10 | | | | 5.12 | | | | (0.02 | ) | | Commercial | | | 444,307 | | | | 427,314 | | | | 16,993 | | | | (1,290 | ) | | | 18,283 | |
| | 616 | | | | 199 | | | | 417 | | | | 6.00 | | | | 6.78 | | | | (0.78 | ) | | Construction | | | 36,939 | | | | 13,482 | | | | 23,457 | | | | (1,718 | ) | | | 25,175 | |
| | 589 | | | | 547 | | | | 42 | | | | 6.91 | | | | 7.33 | | | | (0.42 | ) | | Leasing | | | 40,749 | | | | 40,135 | | | | 614 | | | | (2,340 | ) | | | 2,954 | |
| | 6,978 | | | | 6,641 | | | | 337 | | | | 5.39 | | | | 5.40 | | | | (0.01 | ) | | Mortgage | | | 376,308 | | | | 358,597 | | | | 17,711 | | | | (472 | ) | | | 18,183 | |
| | 3,824 | | | | 3,861 | | | | (37 | ) | | | 10.37 | | | | 10.36 | | | | 0.01 | | | Consumer | | | 396,411 | | | | 399,941 | | | | (3,530 | ) | | | 419 | | | | (3,949 | ) |
| | | | | | | | | | | | | | | | | | | | | | | | | | | | | | | | | | | | | | | | | | | | |
| | 20,712 | | | | 19,595 | | | | 1,117 | | | | 6.25 | | | | 6.33 | | | | (0.08 | ) | | Sub-total loans | | | 1,294,714 | | | | 1,239,469 | | | | 55,245 | | | | (5,401 | ) | | | 60,646 | |
| | 2,333 | | | | 2,771 | | | | (438 | ) | | | 8.95 | | | | 10.60 | | | | (1.65 | ) | | WB loans | | | 208,779 | | | | 293,610 | | | | (84,831 | ) | | | (36,727 | ) | | | (48,104 | ) |
| | | | | | | | | | | | | | | | | | | | | | | | | | | | | | | | | | | | | | | | | | | | |
| | 23,045 | | | | 22,366 | | | | 679 | | | | 6.52 | | | | 6.85 | | | | (0.33 | ) | | Total loans | | | 1,503,493 | | | | 1,533,079 | | | | (29,586 | ) | | | (42,128 | ) | | | 12,542 | |
| | | | | | | | | | | | | | | | | | | | | | | | | | | | | | | | | | | | | | | | | | | | |
| | | | | | | | | | | |
| $ | 31,451 | | | $ | 29,897 | | | $ | 1,554 | | | | 5.36 | % | | | 5.75 | % | | | (0.39 | )% | | Total earning assets | | $ | 1,686,421 | | | $ | 1,720,225 | | | $ | (33,804 | ) | | $ | (44,809 | ) | | $ | 11,005 | |
| | | | | | | | | | | | | | | | | | | | | | | | | | | | | | | | | | | | | | | | | | | | |
| | | | | | | | | | | |
| | | | | | | | | | | | | | | | | | | | | | | | Interest bearing deposits: | | | | | | | | | | | | | | | | | | | | |
| $ | 5,447 | | | $ | 4,825 | | | $ | 622 | | | | 0.35 | % | | | 0.32 | % | | | 0.03 | % | | NOW and money market [1] | | $ | 19,061 | | | $ | 15,523 | | | $ | 3,538 | | | $ | 1,608 | | | $ | 1,930 | |
| | 7,027 | | | | 6,733 | | | | 294 | | | | 0.23 | | | | 0.22 | | | | 0.01 | | | Savings | | | 16,211 | | | | 14,664 | | | | 1,547 | | | | 856 | | | | 691 | |
| | 8,158 | | | | 7,556 | | | | 602 | | | | 0.89 | | | | 0.99 | | | | (0.10 | ) | | Time deposits | | | 72,262 | | | | 74,900 | | | | (2,638 | ) | | | (7,065 | ) | | | 4,427 | |
| | | | | | | | | | | | | | | | | | | | | | | | | | | | | | | | | | | | | | | | | | | | |
| | 20,632 | | | | 19,114 | | | | 1,518 | | | | 0.52 | | | | 0.55 | | | | (0.03 | ) | | Total deposits | | | 107,534 | | | | 105,087 | | | | 2,447 | | | | (4,601 | ) | | | 7,048 | |
| | | | | | | | | | | | | | | | | | | | | | | | | | | | | | | | | | | | | | | | | | | | |
| | 1,028 | | | | 1,887 | | | | (859 | ) | | | 0.73 | | | | 1.49 | | | | (0.76 | ) | | Short-term borrowings [2] | | | 7,512 | | | | 28,123 | | | | (20,611 | ) | | | (10,846 | ) | | | (9,765 | ) |
| | — | | | | 267 | | | | (267 | ) | | | — | | | | 16.05 | | | | (16.05 | ) | | TARP funds [3] | | | — | | | | 42,906 | | | | (42,906 | ) | | | — | | | | (42,906 | ) |
| | 1,729 | | | | 1,360 | | | | 369 | | | | 4.57 | | | | 4.34 | | | | 0.23 | | | Other medium and long-term debt | | | 78,986 | | | | 59,034 | | | | 19,952 | | | | 710 | | | | 19,242 | |
| | | | | | | | | | | | | | | | | | | | | | | | | | | | | | | | | | | | | | | | | | | | |
| | 23,389 | | | | 22,628 | | | | 761 | | | | 0.83 | | | | 1.04 | | | | (0.21 | ) | | Total interest bearing liabilities | | | 194,032 | | | | 235,150 | | | | (41,118 | ) | | | (14,737 | ) | | | (26,381 | ) |
| | | | | | | | | | | | | | | | | | | | | | | | | | | | | | | | | | | | | | | | | | | | |
| | 6,147 | | | | 5,534 | | | | 613 | | | | | | | | | | | | | | | Non-interest bearing demand deposits | | | | | | | | | | | | | | | | | | | | |
| | 1,915 | | | | 1,735 | | | | 180 | | | | | | | | | | | | | | | Other sources of funds | | | | | | | | | | | | | | | | | | | | |
| | | | | | | | | | | | | | | | | | | | | | | | | | | | | | | | | | | | | | | | | | | | |
| | | | | | | | | | | |
| $ | 31,451 | | | $ | 29,897 | | | $ | 1,554 | | | | 0.62 | % | | | 0.79 | % | | | (0.17 | )% | | Total source of funds | | | 194,032 | | | | 235,150 | | | | (41,118 | ) | | | (14,737 | ) | | | (26,381 | ) |
| | | | | | | | | | | | | | | | | | | | | | | | | | | | | | | | | | | | | | | | | | | | |
| | | | | | | | | | | |
| | | | | | | | | | | | | 4.74 | % | | | 4.96 | % | | | (0.22 | )% | | Adjusted net interest margin/ income on a taxable equivalent basis | | | 1,492,389 | | | | 1,485,075 | | | | 7,314 | | | $ | (30,072 | ) | | $ | 37,386 | |
| | | | | | | | | | | | | | | | | | | | | | | | | | | | | | | | | | | | | | | | | | | | |
| | | | | | | | | | | | | 4.53 | % | | | 4.71 | % | | | (0.18 | )% | | Adjusted net interest spread | | | | | | | | | | | | | | | | | | | | |
| | | | | | | | | | | | | | | | | | | | | | | | | | | | | | | | | | | | | | | | | | | | |
| | | | | | | | | | | |
| | | | | | | | | | | | | | | | | | | | | | | | Accelerated amortization of TARP discount and BPNA repo refinancing fees | | | — | | | | 453,321 | | | | (453,321 | ) | | | | | | | | |
| | | | | | | | | | | | | 4.74 | % | | | 3.45 | % | | | 1.29 | % | | Net interest margin/ income on a taxable equivalent basis | | $ | 1,492,389 | | | $ | 1,031,754 | | | $ | 460,635 | | | | | | | | | |
| | | | | | | | | | | | | | | | | | | | | | | | | | | | | | | | | | | | | | | | | | | | |
| | | | | | | | | | | | | | | | Taxable equivalent adjustment | | | 83,406 | | | | 86,682 | | | | (3,276 | ) | | | | | | | | |
| | | | | | | | | | | | | | | | | | | | | | | | | | | | | | | | | | | | | | | | | | | | |
| | | | | | | | | | | | | | | | Net interest income | | $ | 1,408,983 | | | $ | 945,072 | | | $ | 463,911 | | | | | | | | | |
| | | | | | | | | | | | | | | | | | | | | | | | | | | | | | | | | | | | | | | | | | | | |
30
Note: The changes that are not due solely to volume or rate are allocated to volume and rate based on the proportion of the change in each category.
| [1] | Includes interest bearing demand deposits corresponding to certain government entities in Puerto Rico. |
| [2] | Cost of short-term borrowings for the year ended December 31, 2014 excludes the impact of the fees related to PCB repo refinancing. Cost of short-term borrowings including such fees would have been 3.57%. |
| [3] | Cost of TARP funds excludes the impact of the accelerated amortization. Total cost of TARP funds for the year ended December 31, 2014 including the accelerated amortization of TARP discount would have been 170.91%. |
31
Table 6 - Analysis of Levels & Yields on a Taxable Equivalent Basis from Continuing Operations (Non-GAAP)
Years ended December 31,
| | | | | | | | | | | | | | | | | | | | | | | | | | | | | | | | | | | | | | | | | | | | |
| Average Volume | | | Average Yields / Costs | | | | | Interest | | | Variance
Attributable to | |
| 2014 | | | 2013 | | | Variance | | | 2014 | | | 2013 | | | Variance | | | | | 2014 | | | 2013 | | | Variance | | | Rate | | | Volume | |
| (In millions) | | | | | | | | | | | | | | (In thousands) | |
| | | | | | | | | | | |
| $ | 1,305 | | | $ | 1,036 | | | $ | 269 | | | | 0.32 | % | | | 0.33 | % | | | (0.01 | )% | | Money market investments | | $ | 4,224 | | | $ | 3,464 | | | $ | 760 | | | $ | 267 | | | $ | 493 | |
| | 5,886 | | | | 5,488 | | | | 398 | | | | 2.75 | | | | 2.95 | | | | (0.20 | ) | | Investment securities | | | 162,008 | | | | 161,868 | | | | 140 | | | | 728 | | | | (588 | ) |
| | 340 | | | | 417 | | | | (77 | ) | | | 6.16 | | | | 6.25 | | | | (0.09 | ) | | Trading securities | | | 20,914 | | | | 26,026 | | | | (5,112 | ) | | | (366 | ) | | | (4,746 | ) |
| | | | | | | | | | | | | | | | | | | | | | | | | | | | | | | | | | | | | | | | | | | | |
| | 7,531 | | | | 6,941 | | | | 590 | | | | 2.49 | | | | 2.76 | | | | (0.27 | ) | | Total money market, investment and trading securities | | | 187,146 | | | | 191,358 | | | | (4,212 | ) | | | 629 | | | | (4,841 | ) |
| | | | | | | | | | | | | | | | | | | | | | | | | | | | | | | | | | | | | | | | | | | | |
| | | | | | | | | | | | | | | | | | | | | | | | Loans: | | | | | | | | | | | | | | | | | | | | |
| | 8,347 | | | | 8,284 | | | | 63 | | | | 5.12 | | | | 4.97 | | | | 0.15 | | | Commercial | | | 427,314 | | | | 412,083 | | | | 15,231 | | | | 12,116 | | | | 3,115 | |
| | 199 | | | | 319 | | | | (120 | ) | | | 6.78 | | | | 4.73 | | | | 2.05 | | | Construction | | | 13,482 | | | | 15,076 | | | | (1,594 | ) | | | 5,210 | | | | (6,804 | ) |
| | 547 | | | | 540 | | | | 7 | | | | 7.33 | | | | 8.07 | | | | (0.74 | ) | | Leasing | | | 40,135 | | | | 43,542 | | | | (3,407 | ) | | | (4,034 | ) | | | 627 | |
| | 6,641 | | | | 6,688 | | | | (47 | ) | | | 5.40 | | | | 5.33 | | | | 0.07 | | | Mortgage | | | 358,597 | | | | 356,739 | | | | 1,858 | | | | 4,377 | | | | (2,519 | ) |
| | 3,861 | | | | 3,741 | | | | 120 | | | | 10.36 | | | | 10.45 | | | | (0.09 | ) | | Consumer | | | 399,941 | | | | 390,909 | | | | 9,032 | | | | (1,869 | ) | | | 10,901 | |
| | | | | | | | | | | | | | | | | | | | | | | | | | | | | | | | | | | | | | | | | | | | |
| | 19,595 | | | | 19,572 | | | | 23 | | | | 6.33 | | | | 6.22 | | | | 0.11 | | | Sub-total loans | | | 1,239,469 | | | | 1,218,349 | | | | 21,120 | | | | 15,800 | | | | 5,320 | |
| | 2,771 | | | | 3,228 | | | | (457 | ) | | | 10.60 | | | | 9.32 | | | | 1.28 | | | WB loans | | | 293,610 | | | | 300,745 | | | | (7,135 | ) | | | 33,600 | | | | (40,735 | ) |
| | | | | | | | | | | | | | | | | | | | | | | | | | | | | | | | | | | | | | | | | | | | |
| | 22,366 | | | | 22,800 | | | | (434 | ) | | | 6.85 | | | | 6.66 | | | | 0.19 | | | Total loans | | | 1,533,079 | | | | 1,519,094 | | | | 13,985 | | | | 49,400 | | | | (35,415 | ) |
| | | | | | | | | | | | | | | | | | | | | | | | | | | | | | | | | | | | | | | | | | | | |
| | | | | | | | | | | |
| $ | 29,897 | | | $ | 29,741 | | | $ | 156 | | | | 5.75 | % | | | 5.75 | % | | | — | % | | Total earning assets | | $ | 1,720,225 | | | $ | 1,710,452 | | | $ | 9,773 | | | $ | 50,029 | | | $ | (40,256 | ) |
| | | | | | | | | | | | | | | | | | | | | | | | | | | | | | | | | | | | | | | | | | | | |
| | | | | | | | | | | |
| | | | | | | | | | | | | | | | | | | | | | | | Interest bearing deposits: | | | | | | | | | | | | | | | | | | | | |
| $ | 4,825 | | | $ | 4,658 | | | $ | 167 | | | | 0.32 | % | | | 0.34 | % | | | (0.02 | )% | | NOW and money market [1] | | $ | 15,523 | | | $ | 15,718 | | | $ | (195 | ) | | $ | (629 | ) | | $ | 434 | |
| | 6,733 | | | | 6,585 | | | | 148 | | | | 0.22 | | | | 0.23 | | | | (0.01 | ) | | Savings | | | 14,664 | | | | 15,361 | | | | (697 | ) | | | (987 | ) | | | 290 | |
| | 7,556 | | | | 7,957 | | | | (401 | ) | | | 0.99 | | | | 1.18 | | | | (0.19 | ) | | Time deposits | | | 74,900 | | | | 93,778 | | | | (18,878 | ) | | | (12,693 | ) | | | (6,185 | ) |
| | | | | | | | | | | | | | | | | | | | | | | | | | | | | | | | | | | | | | | | | | | | |
| | 19,114 | | | | 19,200 | | | | (86 | ) | | | 0.55 | | | | 0.65 | | | | (0.10 | ) | | Total deposits | | | 105,087 | | | | 124,857 | | | | (19,770 | ) | | | (14,309 | ) | | | (5,461 | ) |
| | | | | | | | | | | | | | | | | | | | | | | | | | | | | | | | | | | | | | | | | | | | |
| | 1,887 | | | | 2,572 | | | | (685 | ) | | | 1.49 | | | | 1.49 | | | | — | | | Short-term borrowings [2] | | | 28,123 | | | | 38,430 | | | | (10,307 | ) | | | (5,504 | ) | | | (4,803 | ) |
| | 267 | | | | 515 | | | | (248 | ) | | | 16.05 | | | | 15.98 | | | | 0.07 | | | TARP funds [3] | | | 42,906 | | | | 82,345 | | | | (39,439 | ) | | | 348 | | | | (39,787 | ) |
| | 1,360 | | | | 1,205 | | | | 155 | | | | 4.34 | | | | 4.79 | | | | (0.45 | ) | | Other medium and long-term debt | | | 59,034 | | | | 57,734 | | | | 1,300 | | | | (4,720 | ) | | | 6,020 | |
| | | | | | | | | | | | | | | | | | | | | | | | | | | | | | | | | | | | | | | | | | | | |
| | 22,628 | | | | 23,492 | | | | (864 | ) | | | 1.04 | | | | 1.29 | | | | (0.25 | ) | | Total interest bearing liabilities | | | 235,150 | | | | 303,366 | | | | (68,216 | ) | | | (24,185 | ) | | | (44,031 | ) |
| | | | | | | | | | | | | | | | | | | | | | | | | | | | | | | | | | | | | | | | | | | | |
| | 5,534 | | | | 5,371 | | | | 163 | | | | | | | | | | | | | | | Non-interest bearing demand deposits | | | | | | | | | | | | | | | | | | | | |
| | 1,735 | | | | 878 | | | | 857 | | | | | | | | | | | | | | | Other sources of funds | | | | | | | | | | | | | | | | | | | | |
| | | | | | | | | | | | | | | | | | | | | | | | | | | | | | | | | | | | | | | | | | | | |
| | | | | | | | | | | |
| $ | 29,897 | | | $ | 29,741 | | | $ | 156 | | | | 0.79 | % | | | 1.02 | % | | | (0.23 | )% | | Total source of funds | | | 235,150 | | | | 303,366 | | | | (68,216 | ) | | | (24,185 | ) | | | (44,031 | ) |
| | | | | | | | | | | | | | | | | | | | | | | | | | | | | | | | | | | | | | | | | | | | |
| | | | | | | | | | | | | 4.96 | % | | | 4.73 | % | | | 0.23 | % | | Adjusted net interest margin/income on a taxable equivalent basis | | | 1,485,075 | | | | 1,407,086 | | | | 77,989 | | | $ | 74,214 | | | $ | 3,775 | |
| | | | | | | | | | | | | | | | | | | | | | | | | | | | | | | | | | | | | | | | | | | | |
| | | | | | | | | | | | | 4.71 | % | | | 4.46 | % | | | 0.25 | % | | Adjusted net interest spread | | | | | | | | | | | | | | | | | | | | |
| | | | | | | | | | | | | | | | | | | | | | | | | | | | | | | | | | | | | | | | | | | | |
| | | | | | | | | | | | | | | | | | | | | | | | Accelerated amortization of TARP discount and BPNA repo refinancing fees | | | 453,321 | | | | — | | | | 453,321 | | | | | | | | | |
| | | | | | | | | | | | | 3.45 | % | | | 4.73 | % | | | (1.28 | )% | | Net interest margin/income on a taxable equivalent basis | | $ | 1,031,754 | | | $ | 1,407,086 | | | $ | (375,332 | ) | | | | | | | | |
| | | | | | | | | | | | | | | | | | | | | | | | | | | | | | | | | | | | | | | | | | | | |
| | | | | | | | | | | | | | | | Taxable equivalent adjustment | | | 86,682 | | | | 62,512 | | | | 24,170 | | | | | | | | | |
| | | | | | | | | | | | | | | | | | | | | | | | | | | | | | | | | | | | | | | | | | | | |
| | | | | | | | | | | | | | | | Net interest income | | $ | 945,072 | | | $ | 1,344,574 | | | $ | (399,502 | ) | | | | | | | | |
| | | | | | | | | | | | | | | | | | | | | | | | | | | | | | | | | | | | | | | | | | | | |
32
Note: The changes that are not due solely to volume or rate are allocated to volume and rate based on the proportion of the change in each category.
| [1] | Includes interest bearing demand deposits corresponding to certain government entities in Puerto Rico. |
| [2] | Cost of short-term borrowings for the year ended December 31, 2014 excludes the impact of the fees related to PCB repo refinancing. Cost of short-term borrowings including such fees would have been 3.57%. |
| [3] | Cost of TARP funds excludes the impact of the accelerated amortization. Total cost of TARP funds for the year ended December 31, 2014 including the accelerated amortization of TARP discount would have been 170.91%. |
Provision for Loan Losses
The Corporation’s total provision for loan losses totaled $241.5 million for the year ended December 31, 2015, compared with $270.1 million for 2014, and $606.1 million for 2013. The provision for loan losses for the non-covered loan portfolio totaled $217.5 million for the year ended December 31, 2015, compared to $224.0 million for the year ended December 31, 2014. The decrease of $6.5 million was mainly driven by a decrease of $26.0 million in the Puerto Rico non-covered portfolio, partially offset by an unfavorable variance at BPNA of $19.5 million. BPNA’s provision for loan losses for the year ended December 31, 2015 was $0.6 million, while for 2014 it was a release of $18.9 million.
The provision for loan losses for the Puerto Rico non-covered portfolio amounted to $216.8 million for the year ended December 31, 2015, compared to $242.8 million for the year ended December 31, 2014. The decrease of $26.0 million was mainly related to the impacts of higher reserves for Puerto Rico’s government exposures and the weakened macroeconomic and fiscal conditions during 2014, offset by a provision of $30.1 million for Westernbank loans, classified as covered until June 30, 2015, which includes a $15.2 million impairment on loans the Corporation has sold or intends to sell and are subject to the ongoing arbitration with the FDIC. The provision for 2015 also includes a $5.8 million impact related to commercial loans sold during the fourth quarter with book value of $34 million. Excluding the $15.2 million of impairments recorded on Westernbank loans and $5.8 million related to commercial loans sold, the provision for the Puerto Rico non-covered portfolio declined by $47.0 million. Additionally, the review of the ALLL methodology resulted in a net decrease of $2.6 million for the BPPR segment, compared to a reserve release of $14.9 million in 2014. Net charge-offs increased by $30.7 million from the previous year mostly driven by $31.1 million in commercial charge-offs, most of which were specifically reserved in 2014.
The provision for loan losses for the U.S operations amounted to $0.6 million for the year ended December 31, 2015 compared to a provision reversal of $18.9 million for the year ended December 31, 2014. Low provision levels were the result of strong credit quality, low levels of net charge-offs during 2015, and the de-risking of the U.S. loan portfolios. The annual review of the ALLL methodology resulted in a net increase of approximately $0.7 million during the second quarter of 2015, compared to a $3.8 million reserve release in the same quarter in 2014. The provision for 2014 included $12.8 million associated with bulk sales of loans.
The provision for the covered portfolio was $24.0 million for the year ended December 31, 2015, compared to $46.1 million for same period of the previous year. The decrease of $22.1 million was mainly due the reclassification to non-covered loans of the non-single family loans that were previously covered by the commercial loss agreement with the FDIC in the second quarter of 2015. The effect of the aforementioned enhancements to the allowance for loan losses methodology was immaterial for the covered loans portfolio in 2015 and 2014.
The provision for loan losses for the non-covered loan portfolio totaled $224.0 million for the year ended December 31, 2014, compared to $536.7 million for the year ended December 31, 2013. Excluding $35.7 million in write-downs, net charge-offs decreased by $49.2 million from the prior year, primarily driven by a reduction of $54.3 million in commercial net charge-offs. The provision for 2013 includes the impact of $318.0 million recorded in connection with a bulk loan sale completed during 2013.
The provision for the Puerto Rico non-covered portfolio amounted to $242.9 million for the year ended December 31, 2014, compared to $547.9 million for the year ended December 31, 2013. The decrease of $305.0 million was predominantly driven by the above mentioned impact of $318.1 million related to the bulk loan sales completed during 2013. Excluding the bulk sales impact, the provision increased by $13.1 million mainly led by environmental factors due to challenging economic conditions in Puerto Rico and the effect of downgrades in the internal risk ratings of certain large corporate and public sector relationships, in part offset by a $14.9 million reserve release as part of the annual review of the components of the ALLL models during the second quarter of 2014. Net charge-offs decreased by $23.3 million from the previous year mostly driven by lower commercial net charge-offs of $46.2 million, in part offset by an increase of $21.1 million in the consumer portfolio net charge-offs, which for 2013 included a recovery of $8.9 million associated with the sale of a portfolio of previously charged-off loans.
33
The U.S. continuing operations recorded a provision release of $18.9 million for the year ended December 31, 2014, compared to a release of $11.2 million for the same period in 2013. The provision for 2014 includes an impact of $12.8 million related to loan sales or loans transferred to loans-held-for sale. Excluding the effect of these transactions, the provision for 2014 would have amounted to a release of $31.7 million, or $20.5 million higher release than in 2013. This reversal of provision was prompted by improved credit quality trends, the de-risking of the U.S. portfolio and the effect of a $3.8 million reserve release as part of the annual review of the components of the ALLL models during the second quarter of 2014. Net charge-offs decreased by $25.9 million from the previous year driven by improvements in all portfolios.
The provision for the covered portfolio was $46.1 million for the year ended December 31, 2014, compared to $69.4 million for same period of the previous year. This decrease of $23.3 million was due to lower impairment losses on commercial loan pools accounted for under ASC 310-30 and the impact of a $7.5 million reserve increase related to the enhancements to the allowance for loan losses methodology implemented during the second quarter of 2013. These positive variances were offset by the $0.8 million reserve increase recorded during the second quarter of 2014, as part of the annual review of the components of the ALLL models.
Refer to the Credit Risk Management and Loan Quality sections of this MD&A for a detailed analysis of net charge-offs, non-performing assets, the allowance for loan losses and selected loan losses statistics.
Non-Interest Income
For the year ended December 31, 2015, non-interest income increased by $133.0 million when compared with the previous year. Excluding the impact of certain events detailed in tables 54 and 55 Adjusted Results (Non-GAAP), non-interest income increased by $147.7 million, principally due to the following:
| | • | | Favorable variance in the FDIC loss share income (expense) by $128.9 million, principally due to lower amortization of the indemnification asset and a positive variance in the true-up payment obligation, partially offset by lower mirror accounting on credit impairment losses. Refer to Table 2 for a breakdown of FDIC loss share (expense) income by major categories; |
| | • | | Higher income from mortgage banking activities by $46.0 million mainly due to higher servicing fees of $16.9 million mainly driven by fees from the servicing portfolio acquired as part of the Doral Bank Transaction, and a favorable variance in the fair value adjustments on mortgage servicing rights of $12.4 million, in addition to lower realized net losses on closed derivatives positions of $11.8 million. Refer to Note 15 for additional details on mortgage banking activities; |
| | • | | Lower provision for indemnity reserves by $22.0 million due to lower reserves for loans sold with credit recourse at BPPR and the reversal during 2015 of $5.0 million related to certain specific representation and warranties reserve established in connection with BPPR’s bulk sale of commercial and construction loans, and commercial single family real estate owned completed in 2013, and |
| | • | | Higher other service fees by $10.8 million mainly due to higher insurance fees, including fees from the portfolio acquired from the Doral insurance agency. |
These unfavorable variances were partially offset by the following:
| | • | | Lower net gain on sale of loans, including valuation adjustments on loans held-for-sale, by $38.4 million due to last year’s BPNA segment gains from individual commercial NPL’s sales completed in 2014; and |
| | • | | Lower other operating income by $15.1 million principally due to lower aggregated net earnings from investments under the equity method by $15.2 million. |
The results for the year ended December 31, 2015 include an other-than-temporary impairment charge on the portfolio of Puerto Rico government investment securities available-for-sale of $14.4 million. These securities had an amortized cost of approximately $41.1 million and a market value of $26.6 million. Based on the fiscal and economic situation in Puerto Rico, together with the government’s announcements regarding its ability to pay its debt and its intention to pursue a comprehensive debt restructuring, the Corporation determined that the unrealized loss, a portion of which had been in an unrealized loss for a period exceeding twelve months, was other-than-temporary. These securities, for which an other-than-temporary impairment was recorded, were sold during the third quarter of 2015, resulting in a realized gain of $0.1 million.
For the year ended December 31, 2014, non-interest income decreased by $404.5 million when compared with the previous year. The FDIC indemnity asset amortization for the year 2014 included a benefit of approximately $12.5 million to reverse the impact of
34
accelerated amortization expense recorded in prior periods. This amount was recognized as expense over the remaining portion of the loss sharing agreement that expired in the quarter ending June 30, 2015. Excluding the impact of the $12.5 million FDIC indemnity asset amortization adjustment and certain events during 2014, detailed in Table 55 and the impact of the NPA’s sales and the impact of EVERTEC’s public offerings during 2013, which resulted in a net increase to non-interest income of $357 million, non-interest income decreased by $61.5 million principally due to the following.
| | • | | Lower income from mortgage banking activities by $41.0 million mainly due to an unfavorable variance in the realized (losses) / gains on closed derivatives positions, in addition to an unfavorable variance in the fair value adjustment of mortgage servicing rights. Refer to Note 15 for additional details on mortgage banking activities; |
| | • | | Higher FDIC loss share expense by $33.5 million, principally due to higher amortization of the indemnification asset due to a decrease in expected losses, and lower mirror accounting income on credit impairment losses; partially offset by lower unfavorable valuation adjustment on the true up payment obligation and higher mirror accounting income on reimbursable expenses. Refer to Table 2 for a breakdown of FDIC loss share (expense) income by major categories; |
| | • | | Higher provision for indemnity reserves by $17.3 million, excluding the provision of $13.7 million related to the bulk sales of NPA’s during 2013, due to reserves for loans sold with credit recourse, mainly at BPPR; |
| | • | | Lower service charges on deposit accounts of $4.2 million due to lower volume of overdrafts and other transaction fees; and |
| | • | | Lower other service fees by $4.1 million due to a decline in the market value of assets under management, mainly Puerto Rico Government obligations and closed-end funds, which drove lower investment management fees and mutual funds administration fees. |
These unfavorable variances were partially offset by the following:
| | • | | Higher net gains on sale of loans, net of valuation adjustments by $26.4 million, excluding the impact of the NPAs sales mentioned above, mostly driven by BPNA individual sales of non-performing commercial loans during 2014; and |
| | • | | A favorable variance in the trading account profit / (loss) caption of $17.8 million mainly at the BPPR segment due to inventory positions mark downs in 2013 (mostly Puerto Rico government obligations and closed-end funds), and a favorable variance in the realized and unrealized gains / (losses) on outstanding mortgage-backed securities, mainly market driven at BPPR. |
Operating Expenses
Table 7 provides a breakdown of operating expenses by major categories.
35
Table 7 - Operating Expenses
| | | | | | | | | | | | | | | | | | | | |
| | | Years ended December 31, | |
(In thousands) | | 2015 | | | 2014 | | | 2013 | | | 2012 | | | 2011 | |
Personnel costs: | | | | | | | | | | | | | | | | | | | | |
Salaries | | $ | 304,618 | | | $ | 281,252 | | | $ | 276,072 | | | $ | 279,590 | | | $ | 282,460 | |
Commissions, incentives and other bonuses | | | 79,305 | | | | 59,138 | | | | 57,060 | | | | 51,320 | | | | 40,987 | |
Pension, postretirement and medical insurance | | | 44,059 | | | | 32,416 | | | | 55,106 | | | | 64,325 | | | | 59,671 | |
Other personnel costs, including payroll taxes | | | 49,537 | | | | 45,873 | | | | 40,459 | | | | 39,098 | | | | 38,797 | |
| | | | | | | | | | | | | | | | | | | | |
Total personnel costs | | | 477,519 | | | | 418,679 | | | | 428,697 | | | | 434,333 | | | | 421,915 | |
| | | | | | | | | | | | | | | | | | | | |
Net occupancy expenses | | | 86,888 | | | | 86,707 | | | | 86,651 | | | | 84,687 | | | | 84,966 | |
Equipment expenses | | | 60,110 | | | | 48,917 | | | | 46,028 | | | | 43,618 | | | | 42,238 | |
Other taxes | | | 39,797 | | | | 56,918 | | | | 58,028 | | | | 49,844 | | | | 51,628 | |
Professional fees: | | | | | | | | | | | | | | | | | | | | |
Collections, appraisals and other credit related fees | | | 23,098 | | | | 26,257 | | | | 32,727 | | | | 41,029 | | | | 30,261 | |
Programming, processing and other technology services | | | 191,895 | | | | 173,814 | | | | 174,921 | | | | 169,927 | | | | 164,716 | |
Other professional fees | | | 93,992 | | | | 81,984 | | | | 70,479 | | | | 60,052 | | | | 61,248 | |
| | | | | | | | | | | | | | | | | | | | |
Total professional fees | | | 308,985 | | | | 282,055 | | | | 278,127 | | | | 271,008 | | | | 256,225 | |
| | | | | | | | | | | | | | | | | | | | |
Communications | | | 25,146 | | | | 25,684 | | | | 25,385 | | | | 25,687 | | | | 25,343 | |
Business promotion | | | 52,076 | | | | 54,016 | | | | 59,453 | | | | 60,784 | | | | 53,200 | |
FDIC deposit insurance | | | 27,626 | | | | 40,307 | | | | 56,728 | | | | 82,065 | | | | 87,942 | |
Loss on early extinguishment of debt | | | — | | | | 532 | | | | 3,388 | | | | 25,196 | | | | 8,693 | |
Other real estate owned (OREO) expenses | | | 85,568 | | | | 49,611 | | | | 79,658 | | | | 28,823 | | | | 20,900 | |
Other operating expenses: | | | | | | | | | | | | | | | | | | | | |
Credit and debit card processing, volume, interchange and other expenses | | | 22,854 | | | | 21,588 | | | | 19,901 | | | | 18,789 | | | | 16,552 | |
Transportation and travel | | | 7,644 | | | | 6,474 | | | | 6,973 | | | | 6,284 | | | | 6,753 | |
Printing and supplies | | | 3,767 | | | | 3,732 | | | | 3,185 | | | | 4,195 | | | | 4,805 | |
Operational losses | | | 20,663 | | | | 18,543 | | | | 17,954 | | | | 23,681 | | | | 12,682 | |
All other | | | 40,147 | | | | 45,036 | | | | 43,863 | | | | 47,834 | | | | 42,276 | |
| | | | | | | | | | | | | | | | | | | | |
Total other operating expenses | | | 95,075 | | | | 95,373 | | | | 91,876 | | | | 100,783 | | | | 83,068 | |
| | | | | | | | | | | | | | | | | | | | |
Amortization of intangibles | | | 11,019 | | | | 8,160 | | | | 7,971 | | | | 8,161 | | | | 7,742 | |
Restructuring costs | | | 18,412 | | | | 26,725 | | | | — | | | | — | | | | — | |
| | | | | | | | | | | | | | | | | | | | |
Total operating expenses | | $ | 1,288,221 | | | $ | 1,193,684 | | | $ | 1,221,990 | | | $ | 1,214,989 | | | $ | 1,143,860 | |
| | | | | | | | | | | | | | | | | | | | |
Personnel costs to average assets | | | 1.36 | % | | | 1.19 | % | | | 1.18 | % | | | 1.20 | % | | | 1.11 | % |
Operating expenses to average assets | | | 3.66 | | | | 3.39 | | | | 3.37 | | | | 3.35 | | | | 3.00 | |
Employees (full-time equivalent) | | | 7,810 | | | | 7,752 | | | | 8,059 | | | | 8,072 | | | | 8,329 | |
Average assets per employee (in millions) | | $ | 4.51 | | | $ | 4.54 | | | $ | 4.50 | | | $ | 4.49 | | | $ | 4.57 | |
Operating expenses for the year ended December 31, 2015 increased by $94.5 million, or 8%, when compared with the year ended December 31, 2014. Operating expenses for 2015 included restructuring charges related to the U.S. operations for $18.4 million, Doral Transactions expenses for $28.5 million and $22.0 million of loss on bulk sale of covered OREOs. For the year 2014, operating expenses included restructuring charges related to the U.S. operations for $26.7 million, executive compensation costs for $3.0 million, lease cancellation costs for $1.9 million and early debt extinguishment costs for $532 thousand. Excluding the impact of the aforementioned events, detailed in tables 54 and 55, operating expenses increased by $57.8 million compared with the year ended December 31, 2014, driven primarily by:
| | • | | Higher personnel cost by $54.7 million, mainly due to higher salaries and incentive compensation, higher share based compensation and higher pension expense at BPPR related to adjustments to the mortality table and discount rate used for actuarial assumptions; |
36
| | • | | An increase in OREO expense by $14.0 million mainly at BPPR due to higher write-downs on mortgage properties and loss on sale on OREO properties; |
| | • | | Higher professional fees by $11.4 million, due to higher programming, application processing and hosting expenses including the impact of the recently enacted business-to-business sales tax in Puerto Rico; and |
| | • | | An increase in equipment expense by $10.5 million mainly due to higher software maintenance expenses at BPPR. |
The above variances were partially offset by:
| | • | | Lower other taxes by $17.1 million mainly due to elimination of the Puerto Rico gross revenue tax and lower municipal license tax; and |
| | • | | A decrease in FDIC deposit insurance by $12.7 million, mainly due to improvements in the risk profile of the Corporation. |
Operating expenses for the year ended December 31, 2014 decreased by $28.3 million, or 2%, when compared with the year ended December 31, 2013. For the year 2013, operating expenses included $37.0 million in OREO expenses related to the bulk sale of non-performing assets and $1.1 million in professional services mainly related to EVERTEC’s public offerings. Excluding the impact of the aforementioned events for 2014 and 2013, operating expenses decreased by $22.3 million compared with the year ended December 31, 2013, driven primarily by:
| | • | | Lower FDIC deposit insurance by $16.4 million, reflecting lower levels of high risk assets; |
| | • | | A decrease in personnel costs by $13.0 million, mainly due to lower pension, postretirement and medical services due to changes to actuarial assumptions effective for the year 2014 resulting in lower amortization of pension costs and lower medical life insurance expense; partially offset by higher salaries and other personnel costs; and |
| | • | | Lower loss on extinguishment of debt by $3.4 million, mainly due to the early cancellation of medium term notes during 2013. |
The above variances were partially offset by:
| | • | | An increase in OREO expenses by $7.0 million mainly due to due to higher write downs on OREO properties, offset by higher gains on sales of mainly commercial and construction properties; and |
| | • | | Higher professional fees by $5.0 million, mainly at BPPR due to higher legal fees mostly as a result of the FDIC arbitration proceedings and other corporate matters. |
INCOME TAXES
Income tax benefit amounted to $495.2 million for the year ended December 31, 2015, compared with an income tax expense of $58.3 million for the previous year. The increase in income tax benefit was primarily due to a tax benefit of $589.0 million recorded during the year 2015 as a result of the partial reversal of the valuation allowance on the Corporation’s deferred tax asset from the U.S. operations.
During the year ended December 31, 2014 the Corporation recognized an income tax expense of $20.0 million mainly related to the deferred tax liability associated with the portfolio acquired from Westernbank as a result of the increase in the income tax for capital gains from 15% to 20%. During the second quarter of 2014, the Corporation entered into a Closing Agreement with the Puerto Rico Department of the Treasury (the “Agreement”). The Agreement, among other matters, was related to the income tax treatment of certain charge-offs related to the loans acquired from Westernbank as part of the FDIC assisted transaction in the year 2010. As a result of the Agreement, the Corporation recorded a tax benefit of $23.4 million due to a reduction in the deferred tax liability associated with Westernbank loan portfolio. Additionally, during 2014, an initial valuation allowance on the deferred tax asset of approximately $8 million was recorded at the Holding Company, due to the difference in the tax treatment of the interest expense related to the TARP funds and the $450 million in senior notes issued, bearing interest at 7%.
Income tax expense for the year ended December 31, 2014 was $58.3 million, compared with an income tax benefit of $251.3 million for 2013. The increase in income tax expense was primarily due to the recognition during the year 2013 of a tax benefit of $197.5 million and a corresponding increase in the net deferred tax asset of the Puerto Rico operations as a result of the increase in the statutory corporate income tax rate from 30% to 39% introduced as part of the amendments to the Puerto Rico Internal Revenue
37
Code effective for taxable years beginning after December 31, 2012. In addition, during 2013 the Corporation recorded an income tax benefit due to the loss generated on the Puerto Rico operations by the sales of non-performing assets net of the gain realized on the sale of a portion of EVERTEC’s shares which was taxable at a preferential tax rate according to Act Number 73 of May 28, 2008 known as “Economic Incentives Act for the Development of Puerto Rico”.
Refer to Note 42 to the consolidated financial statements for additional information on income taxes.
Fourth Quarter Results
The Corporation recognized net income of $137.4 million for the quarter ended December 31, 2015, compared with a net income of $48.8 million for the same quarter of 2014. The variance in the quarterly results was mainly driven by the $44.1 million partial reversal of the valuation allowance of a portion of the deferred tax asset at the U.S. operations recorded in the fourth quarter of 2015 and a decrease of $18.8 million on interest expense from short-term borrowings mainly driven by the refinancing of $638 million in structured repos at a 4.41% rate to short term, lower cost repos in 2014.
Net interest income for the fourth quarter of 2015 amounted to $352.5 million, compared with $326.9 million for the fourth quarter of 2014. The increase in net interest income was primarily due to a decrease of $18.8 million on interest expense from short-term borrowings mainly driven by the previously mentioned refinancing of $638 million in structured repos at BPNA at lower rates, and a $6.9 million increase on interest income from loans mainly due to the impact from loans acquired in the first quarter of 2015 as part of the Doral Bank Transaction, which had a carrying value of $1.3 billion as of December 31, 2015.
The provision for loan losses amounted to $58.5 million for the quarter ended December 31, 2015, compared to $48.0 million for the fourth quarter of 2014. The increase of $10.5 million is mainly at BPPR due to the impairment recorded in the fourth quarter of 2015 of $10.9 million for Westernbank loans which the Corporation sold or has the intent to sell and are subject to ongoing arbitration with the FDIC, and to reserve releases recorded during the fourth quarter of 2014 for the covered loans portfolio and at the BPNA segment, reflecting improved credit metrics; partially offset by lower provisions during 2015 for the BPPR non-covered portfolio, excluding the impact of the reclassified Westernbank loans.
Non-interest income amounted to $132.4 million for the quarter ended December 31, 2015, compared with $103.4 million for the same quarter in 2014. The increase in non-interest income was mainly driven by a $14.3 million favorable variance in FDIC loss share expense due to lower amortization of the indemnification asset and a $14.7 million increase in mortgage banking activities income due to a favorable variance in the valuation of MSRs and lower losses on derivative activities.
Operating expenses totaled $305.8 million for the quarter ended December 31, 2015, compared with $330.0 million for the same quarter in the previous year. The decrease is due mainly to lower restructuring costs by $12.9 million as the Corporation completed the reorganization of the U.S. operations during the first two quarters of 2015, and lower OREO expenses by $10.0 million mainly due to lower write-downs.
Income tax benefit amounted to $16.8 million for the quarter ended December 31, 2015, compared with income tax expense of $12.5 million for the same quarter of 2014. The favorable variance was mainly due to the previously mentioned $44.1 million partial reversal of the valuation allowance of a portion of the deferred tax asset at the U.S. operations recorded in the fourth quarter of 2015, which was partially offset by higher income tax expense at BPPR.
REPORTABLE SEGMENT RESULTS
The Corporation’s reportable segments for managerial reporting purposes consist of Banco Popular de Puerto Rico and Banco Popular North America. A Corporate group has been defined to support the reportable segments. For managerial reporting purposes, the costs incurred by the Corporate group are not allocated to the reportable segments.
For a description of the Corporation’s reportable segments, including additional financial information and the underlying management accounting process, refer to Note 44 to the consolidated financial statements.
The Corporate group reported a net loss of $71.9 million for the year ended December 31, 2015, compared with a net loss of $510.2 million for the year ended December 31, 2014. Excluding the $414.1 million amortization acceleration during 2014 of the discount
38
and deferred costs related to the TARP debt and the related tax impact of $15.4 million, the Corporate group had a positive variance of $39.6 million mainly due to interest expense savings of $26.2 million related to the pay-off of the TARP debt and higher income tax benefit in 2015 when compared to the prior year.
Highlights on the earnings results for the reportable segments are discussed below:
Banco Popular de Puerto Rico
The Banco Popular de Puerto Rico reportable segment’s net income amounted to $318.4 million for the year ended December 31, 2015, compared with $274.3 million for the year ended December 31, 2014. The principal factors that contributed to the positive variance in the financial results included the following:
| | • | | lower net interest income by $57.3 million, or 4% mainly impacted by lower interest income from loans by $57.4 million, largely from the WB portfolio by $84.8 million mostly due to lower levels by $438 million from run-off and loan resolutions, partially offset by higher income from mortgage loans by $29.3 million mainly due to the higher levels by $536 million driven by the mortgage loans portfolio acquired as part of the Doral Bank Transaction. The net interest margin in 2015 was 4.87% compared to 5.35% in the prior year; |
| | • | | lower provision for loan losses by $48.4 million. Excluding impairment charges of $15.2 million in 2015 related to WB loans sold or which the Corporation has the intent to sell and are subject to the ongoing arbitration with the FDIC and a loss of $5.9 million from a bulk sale of non-covered loans, provision for loan losses decreased by $69.4 million, or 24%, mostly from the non-covered loans portfolio by $47.3 million mainly related to the impact in 2014 of higher reserves for Puerto Rico’s government exposures and to the impact of weakened macroeconomic and fiscal conditions, offset by a provision of $30.1 million for Westernbank loans, classified as covered until June 30, 2015. The provision for the covered portfolio decreased by $22.1 million mainly due to the reclassification to non-covered loans of the non-single family loans that were previously covered by the commercial loss agreement with the FDIC in the second quarter of 2015; |
| | • | | higher non-interest income by $181.5 million, or 64%, mainly due to: |
| | • | | favorable variance in FDIC loss share income by $123.1 million due principally to lower amortization of the indemnification asset and a positive variance in the true-up payment obligation, partially offset by lower mirror accounting on credit impairment losses; |
| | • | | higher mortgage banking activities by $51.1 million. Excluding the $4.4 million income related to the mortgage servicing rights acquired for a portfolio previously serviced by Doral Bank for which the Corporation acted as a back-up servicer, and $0.8 million of fees charged for loan servicing cost to the FDIC, mortgage banking activities increased by $45.9 million mostly due to higher servicing fees by $17.7 million mainly driven by fees from the servicing portfolio acquired as part of the Doral Bank Transaction, a favorable variance in the MSR valuation of $12.4 million, and lower hedging losses by $11.8 million; and |
| | • | | favorable variance on adjustments to indemnity reserves by $24.1 million due to lower reserves for loans sold with credit recourse at BPPR and the reversal during 2015 of $5.0 million related to certain specific representation and warranties reserves established in connection with BPPR’s bulk sale of commercial and construction loans, and commercial single family real estate owned completed in 2013. |
The positive impact in non-interest income detailed above was partially offset by:
| | • | | Other-than-temporary impairment of $14.4 million in 2015 recorded on Puerto Rico government investment securities available-for-sale. |
| | • | | higher operating expenses by $90.4 million, or 10%, mainly due to: |
| | • | | higher personnel costs by $52.7 million mainly due to higher salaries and incentive compensation including $11.1 million related to additional personnel costs as a result of the Doral Bank Transaction, higher share based compensation and higher pension expense due to adjustments in 2014 to the mortality table and discount rate used for actuarial assumptions; |
| | • | | an increase of $25.6 million in professional fees. Excluding $13.1 million in fees directly related to the Doral Bank Transaction, professional fees increased by $12.5 million mainly due to higher programming, application processing and hosting expenses in part due to the recently enacted business-to-business sales tax in Puerto Rico; and |
| | • | | an increase of $29.1 million in OREO expense. Excluding the impact of the $22.0 million loss on a bulk sale of covered OREOs completed in 2015, OREO expense increased by $7.2 million mainly due to higher write-downs and losses on sale of OREO properties. |
39
The unfavorable variances in operating expenses were partially offset by lower other operating taxes by $15.0 million mainly due to the elimination of the Puerto Rico gross revenue tax and lower municipal license tax.
| | • | | higher income tax expense by $38.1 million. Excluding the impact of the $20.0 million income tax expense recorded in 2014 for the increase in the income tax rate for capital gains from 15% to 20%, and the net effect on income tax expense from the non-recurring transactions disclosed in Tables 54 and 55, income taxes increased by $81.2 million mainly due to higher taxable income. |
The main factors that contributed to the variance in the financial results for the year ended December 31, 2014, when compared with 2013, included the following:
| | • | | higher net interest income by $28.4 million, or 2% mainly impacted by lower interest expense from borrowings by $16.8 million, or lower interest cost by 191 basis points, mainly from the conversion into shares of common stock of $185 million in subordinated notes due to Popular, Inc. during 2013. Also, the cost of deposits decreased by $12.3 million or 8 basis points, due to lower levels and rates on IRA deposits and brokered CD’s. The decreases in interest expense were slightly offset by a $0.8 million decrease in interest income; |
| | • | | lower provision for loan losses by $327.7 million, or 53%, mostly due to the decrease in the provision for loan losses on the non-covered loan portfolio of $304.4, which was mainly due to the incremental provision of $318.0 million related to the bulk sales of non-performing loans during 2013. Excluding the impact of the 2013 bulk sales, the provision for loan losses declined by $9.7 million or 3% to $289.2 million, due to reserve releases from the annual review of the components of the allowance for loan losses; |
| | • | | higher non-interest income by $1.4 million, or less than 1% mainly due to: |
| | • | | favorable variance on sale of loans by $62.5 million due to the impact of the bulk sales of non-performing loans completed during 2013; and |
| | • | | higher trading account profits by $18.0 million due to inventory positions mark downs in 2013 (mostly Puerto Rico government obligations and closed-end funds) and a favorable variance in the realized and unrealized gains/losses on outstanding mortgage-backed securities. |
The positive impact in non-interest income detailed above was partially offset by:
| | • | | lower mortgage banking activities by $40.8 million due to higher losses on closed derivative positions and unfavorable fair value adjustments on mortgage servicing rights, offset by higher gains on sale of loans; |
| | • | | higher FDIC loss share expense by $21.0 million due to higher amortization of the indemnification asset and lower mirror accounting on credit impairment losses and reimbursable expenses, offset by the positive adjustment of $12.5 million related to the amortization of the indemnification asset; |
| | • | | lower other operating income by $6.5 million due to lower income from equity investments and lower underwriting income from the broker dealer; and |
| | • | | lower other service fees by $4.4 million due to a decline in the market value of assets under management, mainly Puerto Rico Government obligations and closed-end funds, which drive lower investment management fees and mutual funds administration fees. |
| | • | | lower operating expenses by $58.2 million, or 6%, mainly due to: |
| | • | | a decrease of $31.0 million in OREO expenses primarily related to the loss of $37.0 million recorded in 2013 on the bulk sale of commercial and single family real estate owned assets, which was partially offset by higher expenses; |
| | • | | a decrease of $17.3 million in personnel costs due to lower pension and post retirement expenses from changes to actuarial assumptions in pension obligations; and |
| | • | | a decrease of $16.5 million in FDIC deposit insurance due to a lower level of high risk assets. |
The favorable variances in operating expenses were partially offset by higher other operating expenses by $10.1 million due to higher provision for unused commitments.
| | • | | higher income tax expense by $314.9 million, mainly due to the $197.5 million benefit recognized in 2013 for the increase on the net deferred tax asset due to the change in the corporate tax rate in P.R. from 30% to 39%, as well as the tax benefits derived from the 2013 losses on the bulk sales of non-performing assets. |
40
Banco Popular North America
For the year ended December 31, 2015, the reportable segment of Banco Popular North America reported net income of $648.6 million, compared with $77.5 million for the year ended December 31, 2014. The principal factors that contributed to the variance in the financial results included the following:
| | • | | higher net interest income by $81.7 million. Excluding the impact in 2014 of $39.3 million in fees associated with the refinancing of $638 million in long term structured repos, net interest income increased by $42.4 million mainly due to higher interest income from loans by $37.3 million driven by loans acquired as part of the Doral Bank Transaction in 2015, and lower interest expense from short term borrowings by $20.5 million mainly due to lower cost by 301 basis points and lower levels by $464 million due to the repos refinancing mentioned above. This was partially offset by lower income from investment securities by $11.9 million, due mainly to lower levels by $449 million, mostly from MBS and CMO securities. The BPNA reportable segment’s net interest margin was 3.90% for 2015 compared with 2.74% for the same period in 2014, or an adjusted net interest margin of 3.42%, excluding the repo financing impact; |
| | • | | unfavorable variance in the provision for loan losses by $19.5 million. Excluding the $12.8 million impact from loan sales or loans transferred to loans held-for-sale in 2014, the provision variance was $32.3 million higher than in 2014. This unfavorable variance is mostly driven by reversals of provision recorded in 2014 due to the de-risking of the US portfolio, which was reflected in 2015 as the BPNA segment provision amounted to $0.6 million for the year; |
| | • | | lower non-interest income by $41.7 million, mostly due to a decrease of $37.6 million in gains from sales of loans due to the sales of non-performing commercial loans during 2014, and an unfavorable variance of $2.1 million in adjustments to indemnity reserves; and |
| | • | | higher operating expenses by $2.6 million. Excluding restructuring costs in both periods, and costs of $6.9 million in 2015 directly related the Doral Bank Transaction, operating expenses increased by $6.5 million due to higher OREO expense by $6.8 million mostly due to higher losses on sales of OREO and subsequent write-downs. |
| | • | | Income taxes favorable variance of $583.8 million. Excluding the $589 million partial reversal of the valuation allowance of a portion of its deferred tax asset during 2015, income taxes at the BPNA segment increased by $5.2 million. |
The main factors that contributed to the variance in the financial results for the year ended December 31, 2014, when compared with 2013, included the following:
| | • | | higher net interest income by $4.7 million, excluding the impact of the repo refinancing mentioned above, impacted by lower interest expense from deposits by $7.4 million, or a lower cost of 19 basis points, driven by the renewal of maturities from time deposits at lower prevailing rates, and lower interest expense from short term borrowings by $7.3 million, or a lower cost of 91 basis points, due to the repos refinancing mentioned above. This was partially offset by lower income from loans by $6.2 million and lower income from investment securities by $3.6 million, both due mainly to lower levels. The BPNA reportable segment’s net interest margin was 2.74% for 2014 and the adjusted net interest margin was 3.42%, excluding the repo refinancing impact, compared with 3.20% for the same period in 2013; |
| | • | | favorable variance in the provision for loan losses by $7.7 million, which includes the previously mentioned impact of $12.8 million related to loan sales or loans transferred to loans held-for-sale. Excluding the effect of these transactions, the provision would have amounted to a release of $31.7 million, or $20.5 million higher release than in 2013. This reversal of provision was prompted by improved credit quality trends, the de-risking of the US portfolio and the effect of a $3.8 million reserve release as part of the annual review of the components of the ALLL models during the second quarter of 2014; |
| | • | | higher non-interest income by $28.1 million, or 77%, mostly due to an increase of $30.8 million in gains from sales of loans due to higher volume of sales of non-performing commercial loans during 2014. This was partially offset by a $2.8 million decrease on service charges on deposit accounts; and |
| | • | | lower operating expenses by $3.2 million, excluding $26.7 million in restructuring charges, due to lower personnel costs by $8.9 million, partially offset by increases of $2.7 million in professional fees and $2.1 million in other operating expenses. |
41
STATEMENT OF FINANCIAL CONDITION ANALYSIS
Assets
At December 31, 2015, the Corporation’s total assets were $35.8 billion, compared with $33.1 billion at December 31, 2014. Refer to the consolidated financial statements included in this 2015 Annual Report for the Corporation’s consolidated statements of financial condition at December 31, 2015 and December 31, 2014. Also, refer to the Statistical Summary 2011-2015 in this MD&A for condensed statements of financial condition for the past five years.
Money market, trading and investment securities
Money market investments amounted to $2.2 billion at December 31, 2015 compared with $1.8 billion at the same date in 2014. The increase was mainly due to an increase of $431 million in time deposits with the Federal Reserve Bank of New York, partially offset by a decrease of $55 million at BPPR in securities purchased under agreements to resell.
Trading account securities amounted to $72 million at December 31, 2015 compared with $139 million at December 31, 2014. The decrease in trading account securities was at the BPPR segment, mainly mortgage backed securities. Refer to the Market / Interest Rate Risk section of this MD&A included in the Risk Management section for a table that provides a breakdown of the trading portfolio by security type.
Investment securities available-for-sale and held-to-maturity amounted to $6.2 billion at December 31, 2015 compared with $5.4 billion at 2014. Table 8 provides a breakdown of the Corporation’s portfolio of investment securities available-for-sale (“AFS”) and held-to-maturity (“HTM”) on a combined basis at December 31, 2015 and 2014. Notes 10 and 11 to the consolidated financial statements provide additional information with respect to the Corporation’s investment securities AFS and HTM.
Investment securities available-for-sale and held-to-maturity increased by $746 million, mainly at BPPR. The increase was mainly from mortgage-backed securities and U.S. Treasury securities, which increased by $1.4 billion and $483 million, respectively, partially offset by decreases in obligations from U.S. Government Sponsored Entities and CMOs of $785 million and $349 million, respectively.
Table 8 - Breakdown of Investment Securities Available-for-Sale and Held-to-Maturity
| | | | | | | | |
(In thousands) | | December 31, 2015 | | | December 31, 2014 | |
U.S. Treasury securities | | $ | 1,183,328 | | | $ | 700,154 | |
Obligations of U.S. Government sponsored entities | | | 939,641 | | | | 1,724,973 | |
Obligations of Puerto Rico, States and political subdivisions | | | 121,176 | | | | 163,285 | |
Collateralized mortgage obligations | | | 1,560,923 | | | | 1,910,127 | |
Mortgage-backed securities | | | 2,344,196 | | | | 904,362 | |
Equity securities | | | 2,398 | | | | 2,622 | |
Others | | | 12,233 | | | | 12,806 | |
| | | | | | | | |
Total investment securities AFS and HTM | | $ | 6,163,895 | | | $ | 5,418,329 | |
| | | | | | | | |
Loans
Refer to Table 9 for a breakdown of the Corporation’s loan portfolio, the principal category of earning assets. The Corporation’s total loan portfolio amounted to $23.1 billion at December 31, 2015, compared to $22.1 billion at December 31, 2014. Excluding the balance at December 31, 2015 of $1.3 billion in loans acquired as part of the Doral Bank Transaction, the total loan portfolio decreased by $256 million mainly in the covered loans portfolio. Excluding the reclassification of $1.5 billion to the non-covered category, the covered loans portfolio decreased by $382 million mostly due to the continuation of loan resolutions and the normal portfolio run-off. This decrease was partially offset by an increase in the non-covered loans portfolio of $95 million, excluding the impact of the Doral Bank Transaction, mainly from the commercial loans portfolio at BPNA. Refer to Note 12 for detailed information about the Corporation’s loan portfolio composition and loan purchases and sales.
42
Table 9 - Loans Ending Balances
| | | | | | | | | | | | | | | | | | | | |
| | | At December 31, | |
(in thousands) | | 2015 | | | 2014 | | | 2013 | | | 2012 | | | 2011 | |
Loans not covered under FDIC loss sharing agreements: | | | | | | | | | | | | | | | | | | | | |
Commercial | | $ | 10,099,163 | | | $ | 8,134,267 | | | $ | 10,037,184 | | | $ | 9,858,202 | | | $ | 9,973,327 | |
Construction | | | 681,106 | | | | 251,820 | | | | 206,084 | | | | 252,857 | | | | 239,939 | |
Legacy[1] | | | 64,436 | | | | 80,818 | | | | 211,135 | | | | 384,217 | | | | 648,409 | |
Lease financing | | | 627,650 | | | | 564,389 | | | | 543,761 | | | | 540,523 | | | | 548,706 | |
Mortgage | | | 7,036,081 | | | | 6,502,886 | | | | 6,681,476 | | | | 6,078,507 | | | | 5,518,460 | |
Consumer | | | 3,837,679 | | | | 3,870,271 | | | | 3,932,226 | | | | 3,868,886 | | | | 3,673,755 | |
| | | | | | | | | | | | | | | | | | | | |
Total non-covered loans held-in-portfolio | | | 22,346,115 | | | | 19,404,451 | | | | 21,611,866 | | | | 20,983,192 | | | | 20,602,596 | |
| | | | | | | | | | | | | | | | | | | | |
Loans covered under FDIC loss sharing agreements: | | | | | | | | | | | | | | | | | | | | |
Commercial | | | — | | | | 1,614,781 | | | | 1,812,804 | | | | 2,244,647 | | | | 2,512,742 | |
Construction | | | — | | | | 70,336 | | | | 190,127 | | | | 361,396 | | | | 546,826 | |
Mortgage | | | 627,102 | | | | 822,986 | | | | 934,373 | | | | 1,076,730 | | | | 1,172,954 | |
Consumer | | | 19,013 | | | | 34,559 | | | | 47,123 | | | | 73,199 | | | | 116,181 | |
| | | | | | | | | | | | | | | | | | | | |
Loans covered under FDIC loss sharing agreements | | | 646,115 | | | | 2,542,662 | | | | 2,984,427 | | | | 3,755,972 | | | | 4,348,703 | |
| | | | | | | | | | | | | | | | | | | | |
Total loans held-in-portfolio | | | 22,992,230 | | | | 21,947,113 | | | | 24,596,293 | | | | 24,739,164 | | | | 24,951,299 | |
| | | | | | | | | | | | | | | | | | | | |
Loans held-for-sale: | | | | | | | | | | | | | | | | | | | | |
Commercial | | | 45,074 | | | | 309 | | | | 603 | | | | 16,047 | | | | 25,730 | |
Construction | | | 95 | | | | — | | | | — | | | | 78,140 | | | | 236,045 | |
Legacy[1] | | | — | | | | 319 | | | | — | | | | 2,080 | | | | 468 | |
Mortgage | | | 91,831 | | | | 100,166 | | | | 109,823 | | | | 258,201 | | | | 100,850 | |
Consumer | | | — | | | | 5,310 | | | | — | | | | — | | | | — | |
| | | | | | | | | | | | | | | | | | | | |
Total loans held-for-sale | | | 137,000 | | | | 106,104 | | | | 110,426 | | | | 354,468 | | | | 363,093 | |
| | | | | | | | | | | | | | | | | | | | |
Total loans | | $ | 23,129,230 | | | $ | 22,053,217 | | | $ | 24,706,719 | | | $ | 25,093,632 | | | $ | 25,314,392 | |
| | | | | | | | | | | | | | | | | | | | |
| [1] | The legacy portfolio is comprised of commercial loans, construction loans and lease financings related to certain lending products exited by the Corporation as part of restructuring efforts carried out in prior years at the BPNA reportable segment. |
Non-covered loans held-in-portfolio
Non-covered loans held-in-portfolio increased by $2.9 billion from December 31, 2014. Excluding the balance at December 31, 2015 of $1.3 billion loans acquired as part of the Doral Bank Transaction, discussed in Note 5 to the consolidated financial statements, and the previously mentioned reclassification to non-covered loans of $1.5 billion, non-covered loans held-in-portfolio increased by $95 million, mainly due to the following:
| | • | | An increase in commercial and construction loans of $215 million and $54 million, respectively, due mainly to higher origination activity at BPNA; and |
| | • | | An increase in lease financing of $63 million, due mainly to higher originations at BPPR. |
Partially offset by:
| | • | | A decrease in mortgage loans of $169 million, due mainly to lower origination activity at BPPR; and |
| | • | | A decline in consumer loans of $52 million, mainly at BPPR due to lower origination of personal loans. |
Covered loans
Loans covered under the FDIC loss sharing agreements are presented in a separate line item in Table 9. The risks on covered loans are significantly different as a result of the loss protection provided by the FDIC. The loss share portion of the loss share agreement applicable to commercial (including construction) and consumer loans (excluding residential) expired on June 30, 2015. Accordingly, loans with a carrying amount of $1.5 billion as of June 30, 2015 were reclassified from “covered” to “non-covered” because they are no longer subject to the shared-loss arrangements with the FDIC. As of December 31, 2015, the Corporation’s covered loans portfolio amounted to $646 million, comprised mainly of residential mortgage loans.
43
Tables 10 and 11 provide the activity in the carrying amount and accretable yield on the covered loans accounted for under ASC Subtopic 310-30. The outstanding accretable yield has been impacted by increases in cash flow expectations on the loan pools based on quarterly revisions of the portfolio. The increase in the accretable yield is recognized as interest income using the effective yield method over the estimated life in each applicable loan pool.
Refer to Table 9 for a breakdown of the covered loans by major loan type categories
Loans held-for-sale
Loans held-for-sale increased by $31 million mainly due an increase in commercial loans held-for-sale driven by the reclassification during the second quarter of a $45 million public sector credit of BPPR net of the related write-down of $30 million, for which the sale was subject, among other conditions, to the approval of the syndicate’s agent bank. The sale agreement was terminated on July 29, 2015 pursuant to its terms after the parties were not able to obtain the approval of the agent bank on terms acceptable to the assignee. However, at December 31, 2015, the loan has a carrying value of $42 million and remains classified as held-for-sale as the Corporation maintains its ability and its intent to sell the loan.
Covered loans
Covered loans were initially recorded at fair value. Their carrying value approximated $646 million at December 31, 2015, compared to $2.5 billion at December 31, 2014. Excluding the previously mentioned reclassification of $1.5 billion loans from covered to non-covered, covered loans decreased by $382 million due to loan resolutions and the normal portfolio run-off. The covered loans portfolio composition changed significantly as a result of the reclassification of $1.5 billion loans from covered to non-covered. As of December 31, 2015 approximately 97% of the covered loans are mortgage loans and 3% are consumer loans secured by single family residential real estate, compared to 64% commercial loans, 3% construction loans, 32% mortgage loans and 1% consumer loans as of December 31, 2014. A substantial amount of the covered loans, or approximately $642 million of their carrying value at December 31, 2015, was accounted for under ASC Subtopic 310-30.
FDIC loss share asset
As indicated in the Critical Accounting Policies / Estimates section of this MD&A, the Corporation recorded the FDIC loss share asset, measured separately from the covered loans, as part of the Westernbank FDIC-assisted transaction. Based on the accounting guidance in ASC Topic 805, at each reporting date subsequent to the initial recording of the indemnification asset, the Corporation measures the indemnification asset on the same basis as the covered loans and assesses its collectability.
The amount to be ultimately collected for the indemnification asset is dependent upon the performance of the underlying covered assets, the passage of time, claims submitted to the FDIC and the Corporation’s compliance with the terms of the loss sharing agreements. Refer to Note 14 to the consolidated financial statements for additional information on the FDIC loss share agreements.
Table 10 - Activity in the Carrying Amount of Westernbank Loans Accounted for Under ASC 310-30
| | | | | | | | |
| | | Years ended
December 31, | |
(In thousands) | | 2015 | | | 2014 | |
Beginning balance | | $ | 2,444,172 | | | $ | 2,827,947 | |
Accretion | | | 202,966 | | | | 284,472 | |
Collections / charge-offs | | | (672,637 | ) | | | (668,247 | ) |
| | | | | | | | |
Ending balance | | $ | 1,974,501 | | | $ | 2,444,172 | |
Allowance for loan losses (ALLL) | | | (63,563 | ) | | | (78,846 | ) |
| | | | | | | | |
Ending balance, net of ALLL | | $ | 1,910,938 | | | $ | 2,365,326 | |
| | | | | | | | |
44
Table 11 - Activity in the Accretable Yield on Westernbank Loans Accounted for Under ASC 310-30
| | | | | | | | |
| | | Years ended December 31, | |
(In thousands) | | 2015 | | | 2014 | |
Beginning balance | | $ | 1,271,337 | | | $ | 1,309,205 | |
Accretion [1] | | | (202,966 | ) | | | (284,472 | ) |
Change in expected cash flows | | | 44,087 | | | | 246,604 | |
| | | | | | | | |
Ending balance | | $ | 1,112,458 | | | $ | 1,271,337 | |
| | | | | | | | |
| [1] | Positive to earnings, which is included in interest income. |
The loan discount accretion in 2015 and 2014, which is recorded in interest income, resulted principally from higher cash flows expectations and loan resolutions, for some of which the Corporation had estimated significantly higher losses. These cash flows resulted in a faster recognition of the corresponding loan pool’s accretable yield.
Although the reduction in estimated loan losses increases the accretable yield to be recognized over the life of the loans, it also has the effect of lowering the realizable value of the loss share asset since the Corporation would receive lower FDIC payments under the loss share agreements.
Table 12 sets forth the activity in the FDIC loss share asset for the years ended December 31, 2015, 2014 and 2013.
Table 12 - Activity of Loss Share Asset
| | | | | | | | | | | | |
| | | Years ended December 31, | |
(In thousands) | | 2015 | | | 2014 | | | 2013 | |
Balance at beginning of year | | $ | 542,454 | | | $ | 909,414 | | | $ | 1,382,335 | |
Amortization of loss share indemnification asset | | | (66,238 | ) | | | (189,959 | ) | | | (161,635 | ) |
Reversal of accelerated amortization | | | — | | | | 12,492 | | | | — | |
Credit impairment losses to be covered under loss sharing agreements | | | 15,658 | | | | 32,038 | | | | 60,454 | |
Reimbursable expenses | | | 73,205 | | | | 58,117 | | | | 50,985 | |
Decrease due to reciprocal accounting on amortization of contingent liability on unfunded commitments | | | — | | | | — | | | | (473 | ) |
Net payments from FDIC under loss sharing agreements | | | (247,976 | ) | | | (256,498 | ) | | | (396,223 | ) |
Other adjustments attributable to FDIC loss sharing agreements | | | (6,882 | ) | | | (23,150 | ) | | | (26,029 | ) |
| | | | | | | | | | | | |
Balance at end of period | | $ | 310,221 | | | $ | 542,454 | | | $ | 909,414 | |
| | | | | | | | | | | | |
Table 13 - Activity in the Remaining FDIC Loss Share Asset Discount
| | | | | | | | | | | | |
| | | Years ended December 31, | |
(In thousands) | | 2015 | | | 2014 | | | 2013 | |
Balance at beginning of period[1] | | $ | 53,095 | | | $ | 103,691 | | | $ | 141,800 | |
Amortization of negative discount[2] | | | (66,238 | ) | | | (189,959 | ) | | | (161,635 | ) |
Impact of lower projected losses | | | 39,243 | | | | 139,363 | | | | 123,526 | |
| | | | | | | | | | | | |
Balance at end of period | | $ | 26,100 | | | $ | 53,095 | | | $ | 103,691 | |
| | | | | | | | | | | | |
| [1] | Positive balance represents negative discount (debit to assets), while a negative balance represents a discount (credit to assets). |
| [2] | Amortization results in a negative impact to non-interest income, while a positive balance results in a positive impact to non-interest income, particularly FDIC loss share income / expense. |
The Corporation revises its expected cash flows and estimated credit losses on a quarterly basis. The lowered loss estimates requires the Corporation to amortize the loss share asset to its currently lower expected collectible balance, thus resulting in negative accretion. Due to the shorter life of the indemnity asset compared with the expected life of the covered loans, this negative accretion temporarily offsets the benefit of higher cash flows accounted through the accretable yield on the loans.
Other real estate owned
Other real estate owned represents real estate property received in satisfaction of debt. At December 31, 2015, OREO decreased to $192 million from $266 million at December 31, 2014 mainly driven by higher sales, which include a bulk sale of covered commercial properties during the second quarter of 2015 of $37 million, and lower additions. Refer to Note 18 to the consolidated financial statements for the activity in other real estate owned. The amounts included as “covered other real estate” are subject to the FDIC loss sharing agreements.
45
Other assets
Other assets increased by $555 million from December 31, 2014 to December 31, 2015 principally due to higher net deferred tax assets, net of valuation allowance, by $490 million due to the partial reversal of the valuation allowance on its deferred tax assets from its U.S. operations for approximately $589 million. Also contributing to the increase in other assets was higher accounts receivables related to the mortgage servicing operation by $88 million, which includes escrow servicing advances, claims, and interest and principal advances to GNMA and FNMA for delinquent mortgage loans in the MBS pools. These increases in other assets were partially offset by a decrease of $13 million in investments under the equity method, mainly due to capital distributions received during 2015 amounting to $34 million, partially offset by equity pick-ups amounting to $24 million, and lower prepaid taxes by $17 million mainly at BPPR.
Refer to Note 19 to the consolidated financial statements for the composition of Other Assets, and to Notes 20 and 33 for additional information on the Corporation’s investments under the equity method.
Deposits and Borrowings
The composition of the Corporation’s financing to total assets at December 31, 2015 and December 31, 2014 is included in Table 14.
Table 14 - Financing to Total Assets
| | | | | | | | | | | | | | | | | | | | |
| | | December 31, | | | December 31, | | | % increase (decrease) | | | % of total assets | |
(In millions) | | 2015 | | | 2014 | | | from 2014 to 2015 | | | 2015 | | | 2014 | |
Non-interest bearing deposits | | $ | 6,402 | | | $ | 5,784 | | | | 10.7 | % | | | 17.9 | % | | | 17.5 | % |
Interest-bearing core deposits | | | 15,641 | | | | 14,775 | | | | 5.9 | | | | 43.7 | | | | 44.6 | |
Other interest-bearing deposits | | | 5,167 | | | | 4,249 | | | | 21.6 | | | | 14.4 | | | | 12.8 | |
Fed funds purchased and repurchase agreements | | | 762 | | | | 1,272 | | | | (40.1 | ) | | | 2.1 | | | | 3.8 | |
Other short-term borrowings | | | 1 | | | | 21 | | | | (95.2 | ) | | | — | | | | 0.1 | |
Notes payable | | | 1,671 | | | | 1,712 | | | | (2.4 | ) | | | 4.7 | | | | 5.2 | |
Other liabilities | | | 1,019 | | | | 1,012 | | | | 0.7 | | | | 2.9 | | | | 3.1 | |
Liabilities from discontinued operations | | | 2 | | | | 5 | | | | (60.0 | ) | | | — | | | | — | |
Stockholders’ equity | | | 5,105 | | | | 4,267 | | | | 19.6 | | | | 14.3 | | | | 12.9 | |
Deposits
Table 15 - Deposits Ending Balances
| | | | | | | | | | | | | | | | | | | | |
(In thousands) | | 2015 | | | 2014 | | | 2013 | | | 2012 | | | 2011 | |
Demand deposits [1] | | $ | 7,221,238 | | | $ | 6,606,060 | | | $ | 6,590,963 | | | $ | 6,442,739 | | | $ | 6,256,530 | |
Savings, NOW and money market deposits (non-brokered) | | | 11,440,693 | | | | 10,320,782 | | | | 11,255,309 | | | | 11,190,335 | | | | 10,762,869 | |
Savings, NOW and money market deposits (brokered) | | | 382,424 | | | | 406,248 | | | | 553,521 | | | | 456,830 | | | | 212,688 | |
Time deposits (non-brokered) | | | 7,274,157 | | | | 5,960,401 | | | | 6,478,103 | | | | 6,541,660 | | | | 7,552,434 | |
Time deposits (brokered CDs) | | | 891,211 | | | | 1,514,044 | | | | 1,833,249 | | | | 2,369,049 | | | | 3,157,606 | |
| | | | | | | | | | | | | | | | | | | | |
Total deposits | | $ | 27,209,723 | | | $ | 24,807,535 | | | $ | 26,711,145 | | | $ | 27,000,613 | | | $ | 27,942,127 | |
| | | | | | | | | | | | | | | | | | | | |
| [1] | Includes interest and non-interest bearing demand deposits. |
46
At December 31, 2015, the Corporation’s total deposits amounted to $27.2 billion, compared to $24.8 billion at December 31, 2014. Excluding the $1.4 billion balance as of December 31, 2015 of the deposits assumed as part of the Doral Bank Transaction, total deposits increased by $979 million mainly at BPNA by $680 million mostly due to higher time deposits and brokered deposits, and at BPPR by $299 million due mainly to higher demand and savings deposits. Refer to Table 15 for a breakdown of the Corporation’s deposits at December 31, 2015 and December 31, 2014, and to Note 5 to the consolidated financial statements for detailed information on the Doral Bank Transaction.
Borrowings
The Corporation’s borrowings amounted to $2.4 billion at December 31, 2015, compared with $3.0 billion at December 31, 2014. The decrease in borrowings was mostly due to lower balances of repurchase agreements and advances from the Federal Home Loan Bank of New York, which includes the maturity of a $300 million long-term FHLB advance at BPPR during the third quarter of 2015.
Refer to the Off-Balance Sheet Arrangements and Other Commitments section in this MD&A for additional information on the Corporation’s contractual obligations at December 31, 2015.
Other liabilities
The Corporation’s other liabilities amounted to $1.0 billion at December 31, 2015, an increase of $7 million when compared to December 31, 2014. The increase in other liabilities was mainly driven by an increase of $59 million in the liability for delinquent GNMA loans for which the Corporation has the right but not the obligation to repurchase due to lower repurchase activity and an increase of $16 million in dividends payable as the Corporation declared dividends during the fourth quarter of 2015, which were paid in January 2016. These increases were partially offset by decreases of $33 million in deferred tax liabilities at BPNA, a reduction in accrued income tax payable of $12 million mainly at BPPR, a decrease of $8 million in reserves for representation and warranties and of $7 million in reserve for sundry losses.
Refer to Note 42 to the consolidated financial statements, which provides additional information with respect to the Corporation’s Income Taxes, and to Note 29, which provides additional information with respect to Guarantees, including the recourse liability.
Stockholders’ Equity
Stockholders’ equity totaled $5.1 billion at December 31, 2015, compared with $4.3 billion at December 31, 2014. The increase was principally due to net income of $895 million recorded for the year, partially offset by common and preferred dividends amounting to $31 million and $4 million, respectively, as well as an increase of $27 million in accumulated other comprehensive loss. The increase in accumulated other comprehensive loss was due mainly to an increase in unrealized losses in securities available-for-sale by $18 million, unfavorable translation adjustments during the year amounting to $3 million related to its investment in BHD León, and a $6 million pension liability increase.
During the third quarter of 2015 the Corporation reinstated the quarterly cash dividend on its outstanding common stock. Cash dividends of $0.15 per share were paid on October 7, 2015 and January 4, 2016 to shareholders on record at the close of business on September 29, 2015 and December 22, 2015, respectively. This represents a quarterly payout of approximately $15.5 million. Refer to the consolidated statements of financial condition and of stockholders’ equity for information on the composition of stockholders’ equity. Also, refer to Note 28 for a detail of the accumulated other comprehensive income (loss), an integral component of stockholders’ equity.
REGULATORY CAPITAL
The Corporation and the Banks, BPPR and BPNA are required to comply with the applicable capital adequacy standards established by the Federal Reserve. The current risk-based capital standards applicable to the Corporation and the Banks are based on the final capital framework of Basel III. The capital rules of Basel III which became effective on January 1, 2015 introduced a new capital measure called “Common Equity Tier 1” (“CET1”) and specify that Tier 1 capital consist of CET1 and “Additional Tier 1 Capital” instruments meeting specified requirements. Prior to January 1, 2015, the risk-based capital standards applicable to the
47
Corporation and the Banks were based on Basel I. Table 16 presents the Corporation’s capital adequacy information for the years 2011 through 2015 under the regulatory guidance applicable during those years. Note 27 to the consolidated financial statements presents further information on the Corporation’s regulatory capital requirements, including the regulatory capital ratios of its depository institutions, BPPR and BPNA. The Corporation continues to exceed the well-capitalized guidelines under the federal banking regulations.
Table 16 - Capital Adequacy Data
| | | | | | | | | | | | | | | | | | | | |
| | | At December 31, | |
(Dollars in thousands) | | 2015 | | | 2014 | | | 2013 | | | 2012 | | | 2011 | |
Risk-based capital: | | | | | | | | | | | | | | | | | | | | |
Common Equity Tier 1 capital | | $ | 4,049,576 | | | | (A) | | | | (A) | | | | (A) | | | | (A) | |
| | | | | | | | | | | | | | | | | | | | |
Tier 1 capital | | $ | 4,049,576 | | | $ | 3,849,891 | | | $ | 4,464,742 | | | $ | 4,058,242 | | | $ | 3,899,593 | |
Supplementary (Tier 2) capital | | | 642,833 | | | | 272,347 | | | | 296,813 | | | | 298,906 | | | | 312,477 | |
| | | | | | | | | | | | | | | | | | | | |
Total capital | | $ | 4,692,409 | | | $ | 4,122,238 | | | $ | 4,761,555 | | | $ | 4,357,148 | | | $ | 4,212,070 | |
| | | | | | | | | | | | | | | | | | | | |
Total risk-weighted assets | | $ | 24,987,144 | | | $ | 21,233,902 | | | $ | 23,318,674 | | | $ | 23,391,572 | | | $ | 24,414,323 | |
| | | | | | | | | | | | | | | | | | | | |
Adjusted average quarterly assets | | $ | 34,253,625 | | | $ | 32,250,173 | | | $ | 34,746,137 | | | $ | 35,226,183 | | | $ | 35,783,749 | |
| | | | | | | | | | | | | | | | | | | | |
Ratios: | | | | | | | | | | | | | | | | | | | | |
Common Equity Tier 1 capital | | | 16.21 | % | | | (A) | | | | (A) | | | | (A) | | | | (A) | |
Tier 1 capital | | | 16.21 | | | | 18.13 | % | | | 19.15 | % | | | 17.35 | % | | | 15.97 | % |
Total capital | | | 18.78 | | | | 19.41 | | | | 20.42 | | | | 18.63 | | | | 17.25 | |
Leverage ratio | | | 11.82 | | | | 11.94 | | | | 12.85 | | | | 11.52 | | | | 10.90 | |
Average equity to assets | | | 13.37 | | | | 12.95 | | | | 11.52 | | | | 10.60 | | | | 9.81 | |
Average tangible equity to assets | | | 11.95 | | | | 11.45 | | | | 9.78 | | | | 8.82 | | | | 8.10 | |
Average equity to loans | | | 20.42 | | | | 19.17 | | | | 16.88 | | | | 15.47 | | | | 14.57 | |
| (A) | Common equity tier 1 capital measured was introduced by the Basel III Capital Rules which became effective on January 1, 2015. Common equity tier 1 capital is not applicable under the previous Basel 1 capital rules that were applicable in the previous years. |
The reduction in the regulatory capital ratios on December 31, 2015 compared to the other years despite the increase in regulatory capital was mostly due to the increase in risk-weight assets driven by the Doral Bank acquired assets, the expiration of the commercial loans loss sharing agreement which required a higher risk-weight percentage and to particular assets and off-balance sheet items which are assigned a higher risk weight percentage under Basel III rules, including for example, certain exposures past due 90 days or more, and high volatility commercial real estate loans.
To be considered “well-capitalized” an institution had to maintain a total capital ratio of 10%, a Tier 1 capital ratio of 8%, a CET1 capital ratio of 6.5% and a leverage ratio of 5%. The Corporation’s ratios presented in Table 16 show that the Corporation was “well capitalized” for regulatory purposes, the highest classification, under Basel III for 2015 and for all other years presented under Basel I. BPPR and BPNA were also well-capitalized for all years presented.
The Basel III Capital Rules also introduce a new 2.5% “capital conservation buffer”, composed entirely of CET1, on top of the three minimum risk-weighted asset ratios. The capital conservation buffer is designed to absorb losses during periods of economic stress. Banking institutions with a ratio of CET1 to risk-weighted assets above the minimum but below the capital conservation buffer will
48
face constraints on dividends, equity repurchases and compensation based on the amount of the shortfall. Thus, when fully phased-in on January 1, 2019, Popular, BPPR and BPNA will be required to maintain such an additional capital conservation buffer of 2.5% of CET1, effectively resulting in minimum ratios of (i) CET1 to risk-weighted assets of at least 7%, (ii) Tier 1 capital to risk-weighted assets of at least 8.5%, and (iii) Total capital to risk-weighted assets of at least 10.5%.
The Basel III capital rules require the phase out of non-qualifying Tier 1 capital instruments such as trust preferred securities. At December 31, 2015, the Corporation has $ 427 million of trust preferred securities that are subject to the phase-out provisions of the Basel III Capital Rules. Beginning on January 1, 2015, approximately $320 million of trust preferred securities no longer qualified for Tier 1 capital treatment, but instead qualified for Tier 2 capital treatment. On January 1, 2016 all $427 million of the outstanding trust preferred securities will lose Tier 1 treatment, and will be reclassified to Tier 2 capital.
Table 17 reconciles the Corporation’s total common stockholders’ equity to common equity Tier 1 capital.
Table 17 - Reconciliation Common Equity Tier 1 Capital
| | | | | | | | |
| | | At December 31, | |
(In thousands) | | 2015 | | | 2014 | |
Common stockholders’ equity | | $ | 5,055,164 | | | $ | 4,217,222 | |
AOCI related adjustments due to opt-out election | | | 220,956 | | | | 197,040 | |
Goodwill, net of associated deferred tax liability (DTL) | | | (564,323 | ) | | | (412,455 | ) |
Intangible assets, net of associated DTLs | | | (22,222 | ) | | | (35,315 | ) |
Deferred tax assets and other deductions | | | (639,999 | ) | | | (593,363 | ) |
| | | | | | | | |
Common equity tier 1 capital | | $ | 4,049,576 | | | $ | 3,373,129 | |
| | | | | | | | |
Common equity tier 1 capital to risk-weighted assets[1] | | | 16.21 | % | | | 15.89 | % |
| | | | | | | | |
| [1] | Common equity tier 1 capital was not formally defined in the federal banking regulations in effect at December 31, 2014, thus common equity tier 1 capital presented in the table above for December 31, 2014 is considered a management internally-defined measurement. Common equity tier 1 capital measured was introduced by the Basel III Capital Rules which became effective on January 1, 2015. |
Non-GAAP financial measures
The tangible common equity ratio and tangible book value per common share, which are presented in the table that follows, are non-GAAP measures. Management and many stock analysts use the tangible common equity ratio and tangible book value per common share in conjunction with more traditional bank capital ratios to compare the capital adequacy of banking organizations with significant amounts of goodwill or other intangible assets, typically stemming from the use of the purchase accounting method of accounting for mergers and acquisitions. Neither tangible common equity nor tangible assets or related measures should be considered in isolation or as a substitute for stockholders’ equity, total assets or any other measure calculated in accordance with generally accepted accounting principles in the United States of America (“GAAP”). Moreover, the manner in which the Corporation calculates its tangible common equity, tangible assets and any other related measures may differ from that of other companies reporting measures with similar names.
Table 18 provides a reconciliation of total stockholders’ equity to tangible common equity and total assets to tangible assets at December 31, 2015 and 2014.
49
Table 18 - Reconciliation Tangible Common Equity and Assets
| | | | | | | | |
| | | At December 31, | |
(In thousands, except share or per share information) | | 2015 | | | 2014 | |
Total stockholders’ equity | | $ | 5,105,324 | | | $ | 4,267,382 | |
Less: Preferred stock | | | (50,160 | ) | | | (50,160 | ) |
Less: Goodwill | | | (626,388 | ) | | | (465,676 | ) |
Less: Other intangibles | | | (58,109 | ) | | | (37,595 | ) |
| | | | | | | | |
Total tangible common equity | | $ | 4,370,667 | | | $ | 3,713,951 | |
| | | | | | | | |
Total assets | | $ | 35,769,534 | | | $ | 33,096,695 | |
Less: Goodwill | | | (626,388 | ) | | | (465,676 | ) |
Less: Other intangibles | | | (58,109 | ) | | | (37,595 | ) |
| | | | | | | | |
Total tangible assets | | $ | 35,085,037 | | | $ | 32,593,424 | |
| | | | | | | | |
Tangible common equity to tangible assets at end of period | | | 12.46 | % | | | 11.39 | % |
Common shares outstanding at end of period | | | 103,618,976 | | | | 103,476,847 | |
Tangible book value per common share | | $ | 42.18 | | | $ | 35.89 | |
OFF-BALANCE SHEET ARRANGEMENTS AND OTHER COMMITMENTS
In the ordinary course of business, the Corporation engages in financial transactions that are not recorded on the balance sheet, or may be recorded on the balance sheet in amounts that are different than the full contract or notional amount of the transaction. As a provider of financial services, the Corporation routinely enters into commitments with off-balance sheet risk to meet the financial needs of its customers. These commitments may include loan commitments and standby letters of credit. These commitments are subject to the same credit policies and approval process used for on-balance sheet instruments. These instruments involve, to varying degrees, elements of credit and interest rate risk in excess of the amount recognized in the statement of financial position. Other types of off-balance sheet arrangements that the Corporation enters in the ordinary course of business include derivatives, operating leases and provision of guarantees, indemnifications, and representation and warranties. Refer to Note 29 for a detailed discussion related to the Corporation’s obligations under credit recourse and representation and warranties arrangements.
Contractual Obligations and Commercial Commitments
The Corporation has various financial obligations, including contractual obligations and commercial commitments, which require future cash payments on debt and lease agreements. Also, in the normal course of business, the Corporation enters into contractual arrangements whereby it commits to future purchases of products or services from third parties. Obligations that are legally binding agreements, whereby the Corporation agrees to purchase products or services with a specific minimum quantity defined at a fixed, minimum or variable price over a specified period of time, are defined as purchase obligations.
Purchase obligations include major legal and binding contractual obligations outstanding at the end of 2015, primarily for services, equipment and real estate construction projects. Services include software licensing and maintenance, facilities maintenance, supplies purchasing, and other goods or services used in the operation of the business. Generally, these contracts are renewable or cancelable at least annually, although in some cases the Corporation has committed to contracts that may extend for several years to secure favorable pricing concessions.
As previously indicated, the Corporation also enters into derivative contracts under which it is required either to receive or pay cash, depending on changes in interest rates. These contracts are carried at fair value on the consolidated statements of financial condition with the fair value representing the net present value of the expected future cash receipts and payments based on market rates of interest as of the statement of condition date. The fair value of the contract changes daily as interest rates change. The Corporation may also be required to post additional collateral on margin calls on the derivatives and repurchase transactions.
At December 31, 2015, the aggregate contractual cash obligations, including purchase obligations and borrowings, by maturities, are presented in Table 19.
50
Table 19 - Contractual Obligations
| | | | | | | | | | | | | | | | | | | | |
| | | Payments Due by Period | |
(In millions) | | Less than 1 year | | | 1 to 3 years | | | 3 to 5 years | | | After 5 years | | | Total | |
Certificates of deposits | | $ | 4,896 | | | $ | 1,772 | | | $ | 1,428 | | | $ | 69 | | | $ | 8,165 | |
Federal funds purchased and repurchase agreements | | | 762 | | | | — | | | | — | | | | — | | | | 762 | |
Other short-term borrowings | | | 1 | | | | — | | | | — | | | | — | | | | 1 | |
Long-term debt | | | 253 | | | | 223 | | | | 630 | | | | 545 | | | | 1,651 | |
Purchase obligations | | | 106 | | | | 36 | | | | 15 | | | | — | | | | 157 | |
Annual rental commitments under operating leases | | | 36 | | | | 57 | | | | 49 | | | | 140 | | | | 282 | |
Capital leases | | | 1 | | | | 2 | | | | 3 | | | | 13 | | | | 19 | |
| | | | | | | | | | | | | | | | | | | | |
Total contractual cash obligations | | $ | 6,055 | | | $ | 2,090 | | | $ | 2,125 | | | $ | 767 | | | $ | 11,037 | |
| | | | | | | | | | | | | | | | | | | | |
Under the Corporation’s repurchase agreements, Popular is required to deposit cash or qualifying securities to meet margin requirements. To the extent that the value of securities previously pledged as collateral declines because of changes in interest rates, the Corporation will be required to deposit additional cash or securities to meet its margin requirements, thereby adversely affecting its liquidity.
At December 31, 2015, the Corporation’s liability on its pension, restoration and postretirement benefit plans amounted to approximately $299 million, compared with $285 million at December 31, 2014. The Corporation’s expected contributions to the pension and benefit restoration plans are minimal, while the expected contributions to the postretirement benefit plan to fund current benefit payment requirements are estimated at $6.4 million for 2016. Obligations to these plans are based on current and projected obligations of the plans, performance of the plan assets, if applicable, and any participant contributions. Refer to Note 36 to the consolidated financial statements for further information on these plans. Management believes that the effect of the pension and postretirement plans on liquidity is not significant to the Corporation’s overall financial condition. The BPPR’s non-contributory defined pension and benefit restoration plans are frozen with regards to all future benefit accruals.
At December 31, 2015, the liability for uncertain tax positions was $9.0 million, compared with $7.9 million as of the end of 2014. This liability represents an estimate of tax positions that the Corporation has taken in its tax returns which may ultimately not be sustained upon examination by the tax authorities. The ultimate amount and timing of any future cash settlements cannot be predicted with reasonable certainty. Under the statute of limitations, the liability for uncertain tax positions expires as follows: 2016 - $3.0 million, 2017 - $0.8 million, 2018 - $1.1 million, 2019 - $1.1 million, and 2020 - $1.5 million, additionally $1.4 million not subject to statute of limitation. As a result of examinations, the Corporation anticipates a reduction in the total amount of unrecognized tax benefits within the next 12 months, which could amount to approximately $2.8 million.
The Corporation also utilizes lending-related financial instruments in the normal course of business to accommodate the financial needs of its customers. The Corporation’s exposure to credit losses in the event of nonperformance by the other party to the financial instrument for commitments to extend credit, standby letters of credit and commercial letters of credit is represented by the contractual notional amount of these instruments. The Corporation uses credit procedures and policies in making those commitments and conditional obligations as it does in extending loans to customers. Since many of the commitments expire without being drawn upon or a default occurring, the total contractual amounts are not representative of the Corporation’s actual future credit exposure or liquidity requirements for these commitments.
51
The following table presents the contractual amounts related to the Corporation’s off-balance sheet lending and other activities at December 31, 2015:
Table 20 - Off-Balance Sheet Lending and Other Activities
| | | | | | | | | | | | | | | | | | | | |
| | | Amount of commitment - Expiration Period | |
(In millions) | | 2016 | | | 2017 - 2018 | | | 2019 - 2020 | | | 2021 - thereafter | | | Total | |
Commitments to extend credit | | $ | 6,586 | | | $ | 699 | | | $ | 79 | | | $ | 70 | | | $ | 7,434 | |
Commercial letters of credit | | | 2 | | | | — | | | | — | | | | — | | | | 2 | |
Standby letters of credit | | | 24 | | | | 26 | | | | — | | | | — | | | | 50 | |
Commitments to originate or fund mortgage loans | | | 20 | | | | 1 | | | | — | | | | — | | | | 21 | |
Unfunded investment obligations | | | 9 | | | | — | | | | — | | | | — | | | | 9 | |
| | | | | | | | | | | | | | | | | | | | |
Total | | $ | 6,641 | | | $ | 726 | | | $ | 79 | | | $ | 70 | | | $ | 7,516 | |
| | | | | | | | | | | | | | | | | | | | |
RISK MANAGEMENT
Managing risk is an essential component of the Corporation’s business. Risk identification and monitoring are key elements in overall risk management. The following principal risks, which have been incorporated into the Corporation’s risk management program, include:
| | • | | Credit Risk – Potential for default or loss resulting from an obligor’s failure to meet the terms of any contract with the Corporation or any of its subsidiaries, or failure otherwise to perform as agreed. Credit risk arises from all activities where success depends on counterparty, issuer, or borrower performance. |
| | • | | Interest Rate Risk (“IRR”) – The risk to earnings or capital arising from changes in interest rates. Interest rate risk arises from differences between the timing of rate changes and the timing of cash flows (repricing risk); from changing rate relationships among different yield curves affecting bank lending and borrowing activities (basis risk); from changing rate relationships across the spectrum of maturities (yield curve risk); and from interest related options embedded in bank products (options risk). Both the accounting perspective (i.e. the effect on the Corporation’s earnings) and the economic perspective (i.e., the effect on the market value of the Corporation’s portfolio equity) are considered. |
| | • | | Market Risk – Potential for loss resulting from changes in market prices of the assets or liabilities in the Corporation’s or in any of its subsidiaries’ portfolios. Market prices may arise from market-making, dealing and position taking activities in interest rate, foreign exchange, equity and commodity market. |
| | • | | Liquidity Risk – Potential for loss resulting from the Corporation or its subsidiaries not being able to meet their financial obligations when they come due. This could be a result of market conditions, the ability of the Corporation to liquidate assets or manage or diversify various funding sources. This risk also encompasses the possibility that an instrument cannot be closed out or sold at its economic value, which might be a result of stress in the market or in a specific security type given its credit, volume and maturity. |
| | • | | Operational Risk – Possibility that inadequate or failed systems and internal controls or procedures, human error, fraud or external influences such as disasters, can cause losses. It includes the risk for those processes that have been outsourced to third parties and the risk of the inadequate use of models. |
| | • | | Compliance Risk and Legal Risk – Potential for loss resulting from violations of or non-conformance with laws, rules, regulations, prescribed practices, existing contracts or ethical standards. |
| | • | | Strategic Risk – Potential for loss arising from adverse business decisions or improper implementation of business decisions. Also, it incorporates how management analyzes external factors that impact the strategic direction of the Corporation. |
| | • | | Reputational Risk – Potential for loss arising from negative public opinion. |
The Corporation’s Board of Directors (the “Board”) has established a Risk Management Committee (“RMC”) to undertake the responsibilities of overseeing and approving the Corporation’s Risk Management Program, as well as the Corporation’s Capital Plan. The Capital Plan is a plan to maintain sufficient regulatory capital at the Corporation, BPPR and BPNA, which considers current and future regulatory capital requirements, expected future profitability and credit trends and, at least, two macroeconomic scenarios, including a base and stress scenario.
52
The RMC, as an oversight body, monitors and approves the overall business strategies, and corporate policies to identify, measure, monitor and control risks while maintaining the effectiveness and efficiency of the business and operational processes. As an approval body for the Corporation, the RMC reviews and approves relevant risk management policies and critical processes. Also, it periodically reports to the Board about its activities.
The Board and RMC have delegated to the Corporation’s management the implementation of the risk management processes. This implementation is split into two separate but coordinated efforts that include (i) business and / or operational units who identify, manage and control the risks resulting from their activities, and (ii) a Risk Management Group (“RMG”). In general, the RMG is mandated with responsibilities such as assessing and reporting to the Corporation’s management and RMC the risk positions of the Corporation; developing and implementing mechanisms, policies and procedures to identify, measure and monitor risks; implementing measurement mechanisms and infrastructure to achieve effective risk monitoring; developing and implementing the necessary management information and reporting mechanisms; and monitoring and testing the adequacy of the Corporation’s policies, strategies and guidelines.
The RMG is responsible for the overall coordination of risk management efforts throughout the Corporation and is composed of three reporting divisions: (i) Credit Risk Management, (ii) Compliance Management, and (iii) Financial and Operational Risk Management. The latter includes an Enterprise Risk Management function that facilitates, among other aspects, the identification, coordination, and management of multiple and cross-enterprise risks. The Corporation’s Model Validation and Loan Review group, which reports directly to the RMC and administratively to the Credit Risk Officer, also provides important risk management functions by validating critical models used in the Corporation and by assessing the adequacy of the Corporation’s loan risk guidelines.
Additionally, the Internal Auditing Division provides an independent assessment of the Corporation’s internal control structure and related systems and processes.
Moreover, management oversight of the Corporation’s risk-taking and risk management activities is conducted through management committees:
| | • | | CRESCO (Credit Strategy Committee) – Manages the Corporation’s overall credit exposure and approves credit policies, standards and guidelines that define, quantify, and monitor credit risk. Through this committee, management reviews asset quality ratios, trends and forecasts, problem loans, establishes the provision for loan losses and assesses the methodology and adequacy of the allowance for loan losses on a quarterly basis. |
| | • | | ALCO (Asset / Liability Management Committee) – Oversees and approves the policies and processes designed to ensure sound market risk and balance sheet strategies, including the interest rate, liquidity, investment and trading policies. The ALCO monitors the capital position and plan for the Corporation and approves all capital management strategies, including capital market transactions and capital distributions. The ALCO also monitors forecasted results and their impact on capital, liquidity, and net interest margin of the Corporation. |
| | • | | ORCO (Operational Risk Committee) – Monitors operational risk management activities to ensure the development and consistent application of operational risk policies, processes and procedures that measure, limit and manage the Corporation’s operational risks while maintaining the effectiveness and efficiency of the operating and businesses’ processes. |
| | • | | Compliance Committees – Monitors regulatory compliance activities to ensure to compliance with legal and regulatory requirements and the Corporation’s policies. |
| | • | | ERM (Enterprise Management Committee) – Monitors Market, Interest, Liquidity, Compliance, Regulatory, Legal, Strategic, Operational (including Information Security & Cyber), and Reputational risks in the Risk Appetite Statement (RAS) and within the Corporation’s ERM framework. |
There are other management committees such as the Fair Lending, Section 23A & B, New Products, Fiduciary Risk, and the BSA/Anti-Money Laundering Committees, among others, which provide oversight of specific business risks.
Market / Interest Rate Risk
The financial results and capital levels of the Corporation are constantly exposed to market, interest rate and liquidity risks. The ALCO and the Corporate Finance Group are responsible for planning and executing the Corporation’s market, interest rate risk, funding activities and strategy, and for implementing the policies and procedures approved by the RMC and the ALCO. In addition, the Financial and Operational Risk Management Division is responsible for the independent monitoring and reporting of adherence
53
with established policies, and enhancing and strengthening controls surrounding interest, liquidity and market risk. The ALCO generally meets on a weekly basis and reviews the Corporation’s current and forecasted asset and liability levels as well as desired pricing strategies and other relevant financial management and interest rate and risk topics. Also, on a monthly basis the ALCO reviews various interest rate risk sensitivity metrics, ratios and portfolio information, including but not limited to, the Corporation’s liquidity positions, projected sources and uses of funds, interest rate risk positions and economic conditions.
Market risk refers to the risk of a reduction in the Corporation’s capital due to changes in the market valuation of its assets and/or liabilities.
Most of the assets subject to market valuation risk are securities in the investment portfolio classified available for sale. Refer to Notes 10 and 11 for further information on the investment portfolio. Investment securities classified as available for sale amounted to $6.1 billion as of December 31, 2015. Other assets subject to market risk include loans held-for-sale, which amounted to $137 million, the mortgage servicing rights (“MSRs”) which amounted to $211 million and securities classified as “trading” which amounted to $72 million, as of December 31, 2015.
Liabilities subject to market risk include the FDIC clawback obligation, which amounted to $ 120 million at December 31, 2015.
The Corporation’s market risk is independently measured and reported by the Financial and Operational Risk Management Division and is reviewed by the Risk Management Committee of the Board.
Management believes that market risk is not a material source of risk at the Corporation. A significant portion of the Corporation’s financial activities is concentrated in Puerto Rico, which has been going through a challenging economic cycle. Refer to the Geographic and Government Risk section of this MD&A for some highlights on the current status of the Puerto Rico economy.
Interest Rate Risk (“IRR”)
The Corporation’s net interest income is subject to various categories of interest rate risk, including repricing, basis, yield curve and option risks. In managing interest rate risk, management may alter the mix of floating and fixed rate assets and liabilities, change pricing schedules, adjust maturities through sales and purchases of investment securities, and enter into derivative contracts, among other alternatives.
Interest rate risk management is an active process that encompasses monitoring loan and deposit flows complemented by investment and funding activities. Effective management of interest rate risk begins with understanding the dynamic characteristics of assets and liabilities and determining the appropriate rate risk position given line of business forecasts, management objectives, market expectations and policy constraints.
Management utilizes various tools to assess IRR, including simulation modeling, static gap analysis, and Economic Value of Equity (EVE). The three methodologies complement each other and are used jointly in the evaluation of the Corporation’s IRR. Simulation modeling is prepared for a five year period, which in conjunction with the EVE analysis, provides Management a better view of long term IRR.
Net interest income simulation analysis performed by legal entity and on a consolidated basis is a tool used by the Corporation in estimating the potential change in net interest income resulting from hypothetical changes in interest rates. Sensitivity analysis is calculated using a simulation model which incorporates actual balance sheet figures detailed by maturity and interest yields or costs.
Management assesses interest rate risk by comparing various net interest income simulations under different interest rate scenarios that differ in direction of interest rate changes, the degree of change over time, the speed of change and the projected shape of the yield curve. For example, the types of rate scenarios processed during the year included economic most likely scenarios, flat rates, yield curve twists, + 200 and + 400 basis points parallel ramps and + 200 basis points parallel shocks. Management also performs analyses to isolate and measure basis and prepayment risk exposures.
The asset and liability management group performs validation procedures on various assumptions used as part of the sensitivity analysis as well as validations of results on a monthly basis. In addition, the model and processes used to assess IRR are subject to third-party validations according to the guidelines established in the Model Governance and Validation policy. Due to the importance of critical assumptions in measuring market risk, the risk models incorporate third-party developed data for critical assumptions such
54
as prepayment speeds on mortgage loans and mortgage-backed securities, estimates on the duration of the Corporation’s deposits and interest rate scenarios.
The Corporation processes net interest income simulations under interest rate scenarios in which the yield curve is assumed to rise and decline instantaneously by the same amount. The rising rate scenarios considered in these market risk simulations reflect parallel changes of 200 and 400 basis points during the twelve-month period ending December 31, 2016. Under a 200 basis points rising rate scenario, 2016 projected net interest income increases by $94 million, while under a 400 basis points rising rate scenario, 2016 projected net interest income increases by $186 million. These scenarios were compared against the Corporation’s flat or unchanged interest rates forecast scenario. Simulation analyses are based on many assumptions, including relative levels of market interest rates, interest rate spreads, loan prepayments and deposit decay. Thus, they should not be relied upon as indicative of actual results. Further, the estimates do not contemplate actions that management could take to respond to changes in interest rates. By their nature, these forward-looking computations are only estimates and may be different from what may actually occur in the future.
Static gap analysis measures the volume of assets and liabilities maturing or repricing at a future point in time. Static gap reports stratify all of the Corporation’s assets, liabilities and off-balance sheet positions according to the instrument’s maturity, repricing characteristics and optionality, assuming no new business. The repricing volumes typically include adjustments for anticipated future asset prepayments and for differences in sensitivity to market rates. The volume of assets and liabilities repricing during future periods, particularly within one year, is used as one short-term indicator of IRR. Depending on the duration and repricing characteristics, changes in interest rates could either increase or decrease the level of net interest income. For any given period, the pricing structure of the assets and liabilities is generally matched when an equal amount of such assets and liabilities mature or reprice in that period. Any mismatch of interest earning assets and interest bearing liabilities is known as a gap position. A positive gap denotes asset sensitivity, which means that an increase in interest rates could have a positive effect on net interest income, while a decrease in interest rates could have a negative effect on net interest income. As shown in Table 21, at December 31, 2015, the Corporation’s one-year cumulative positive gap was $4.3 billion, or 13.6 % of total earning assets. This compares with $5.3 billion or 17.8%, respectively, at December 31, 2014. The change in the one-year cumulative gap position was influenced by a lower level of short-term borrowings that resulted mainly from cash inflows and lower volume of assets and higher level of capital from operations. These static measurements do not reflect the results of any projected activity and are best used as early indicators of potential interest rate exposures. They do not incorporate possible actions that could be taken to manage the Corporation’s IRR, nor do they capture the basis risks that might be included within the cumulative gap, given possible changes in the spreads between asset rates and the rates used to fund them.
55
Table 21 - Interest Rate Sensitivity
| | | | | | | | | | | | | | | | | | | | | | | | | | | | | | | | | | | | |
| | | At December 31, 2015 | |
| | | By repricing dates | |
(Dollars in thousands) | | 0-30 days | | | Within 31 -
90 days | | | After three
months but
within six
months | | | After six
months but
within nine
months | | | After nine
months but
within one
year | | | After one
year but
within two
years | | | After two
years | | | Non-interest
bearing
funds | | | Total | |
Assets: | | | | | | | | | | | | | | | | | | | | | | | | | | | | | | | | | | | | |
Money market investments | | $ | 2,168,592 | | | $ | 10,500 | | | $ | 1,000 | | | $ | — | | | $ | — | | | $ | — | | | $ | — | | | $ | — | | | $ | 2,180,092 | |
Investment and trading securities | | | 178,583 | | | | 159,413 | | | | 195,475 | | | | 144,333 | | | | 152,987 | | | | 1,507,863 | | | $ | 4,069,148 | | | | — | | | | 6,407,802 | |
Loans | | | 6,632,028 | | | | 834,658 | | | | 826,010 | | | | 766,022 | | | | 812,672 | | | | 2,370,572 | | | | 10,887,268 | | | | — | | | | 23,129,230 | |
Other assets | | | — | | | | — | | | | — | | | | — | | | | — | | | | — | | | | — | | | | 4,052,410 | | | | 4,052,410 | |
| | | | | | | | | | | | | | | | | | | | | | | | | | | | | | | | | | | | |
Total | | | 8,979,203 | | | | 1,004,571 | | | | 1,022,485 | | | | 910,355 | | | | 965,659 | | | | 3,878,435 | | | | 14,956,416 | | | | 4,052,410 | | | | 35,769,534 | |
| | | | | | | | | | | | | | | | | | | | | | | | | | | | | | | | | | | | |
Liabilities and stockholders’ equity: | | | | | | | | | | | | | | | | | | | | | | | | | | | | | | | | | | | | |
Savings, NOW and money market and other interest bearing demand deposits | | | 1,041,273 | | | | 263,053 | | | | 384,183 | | | | 371,653 | | | | 385,811 | | | | 1,291,310 | | | | 8,905,557 | | | | — | | | | 12,642,840 | |
Certificates of deposit | | | 1,306,833 | | | | 1,149,687 | | | | 1,158,704 | | | | 755,919 | | | | 747,354 | | | | 1,233,733 | | | | 1,813,138 | | | | — | | | | 8,165,368 | |
Federal funds purchased and assets sold under agreements to repurchase | | | 424,142 | | | | 172,195 | | | | 61,801 | | | | — | | | | 104,007 | | | | — | | | | — | | | | — | | | | 762,145 | |
Other short-term borrowings | | | 1,200 | | | | — | | | | — | | | | — | | | | — | | | | — | | | | — | | | | — | | | | 1,200 | |
Notes payable | | | 32,995 | | | | 75,182 | | | | 107,776 | | | | 13,838 | | | | 23,923 | | | | 85,773 | | | | 1,330,822 | | | | — | | | | 1,670,309 | |
Non-interest bearing deposits | | | — | | | | — | | | | — | | | | — | | | | — | | | | — | | | | — | | | | 6,401,515 | | | | 6,401,515 | |
Other non-interest bearing liabilities | | | — | | | | — | | | | — | | | | — | | | | — | | | | — | | | | — | | | | 1,020,833 | | | | 1,020,833 | |
Stockholders’ equity | | | — | | | | — | | | | — | | | | — | | | | — | | | | — | | | | — | | | | 5,105,324 | | | | 5,105,324 | |
| | | | | | | | | | | | | | | | | | | | | | | | | | | | | | | | | | | | |
Total | | $ | 2,806,443 | | | $ | 1,660,117 | | | $ | 1,712,464 | | | $ | 1,141,410 | | | $ | 1,261,095 | | | $ | 2,610,816 | | | $ | 12,049,517 | | | $ | 12,527,672 | | | $ | 35,769,534 | |
| | | | | | | | | | | | | | | | | | | | | | | | | | | | | | | | | | | | |
Interest rate sensitive gap | | | 6,172,760 | | | | (655,546 | ) | | | (689,979 | ) | | | (231,055 | ) | | | (295,436 | ) | | | 1,267,619 | | | | 2,906,899 | | | | (8,475,262 | ) | | | — | |
Cumulative interest rate sensitive gap | | | 6,172,760 | | | | 5,517,214 | | | | 4,827,235 | | | | 4,596,180 | | | | 4,300,744 | | | | 5,568,363 | | | | 8,475,262 | | | | — | | | | — | |
Cumulative interest rate sensitive gap to earning assets | | | 19.46 | % | | | 17.40 | % | | | 15.22 | % | | | 14.49 | % | | | 13.56 | % | | | 17.56 | % | | | 26.72 | % | | | — | | | | — | |
The Corporation estimates the sensitivity of economic value of equity to changes in interest rates. EVE is equal to the estimated present value of the Corporation’s assets minus the estimated present value of the liabilities. This sensitivity analysis is a useful tool to measure long-term IRR because it captures the impact of up or down rate changes in expected cash flows, including principal and interest, from all future periods.
EVE sensitivity calculated using interest rate shock scenarios is estimated on a quarterly basis. The shock scenarios consist of a +/- 200 and 400 basis points parallel shocks. Management has defined limits for the increases / decreases in EVE sensitivity resulting from the shock scenarios.
The Corporation maintains an overall interest rate risk management strategy that incorporates the use of derivative instruments to minimize significant unplanned fluctuations in net interest income or market value that are caused by interest rate volatility. The market value of these derivatives is subject to interest rate fluctuations and counterparty credit risk adjustments which could have a positive or negative effect in the Corporation’s earnings.
The Corporation’s loan and investment portfolios are subject to prepayment risk, which results from the ability of a third-party to repay debt obligations prior to maturity. Prepayment risk also could have a significant impact on the duration of mortgage-backed securities and collateralized mortgage obligations, since prepayments could shorten (or lower prepayments could extend) the weighted average life of these portfolios. Table 22, which presents the maturity distribution of earning assets, takes into consideration prepayment assumptions.
56
Table 22 - Maturity Distribution of Earning Assets
| | | | | | | | | | | | | | | | | | | | | | | | |
| | | As of December 31, 2015 | | | | |
| | | Maturities | | | | |
| | | | | | After one year
through five years | | | After five years | | | | |
(In thousands) | | One year
or less | | | Fixed
interest rates | | | Variable
interest rates | | | Fixed interest
rates | | | Variable interest
rates | | | Total | |
| | | | | | |
Money market securities | | $ | 2,180,092 | | | | — | | | | — | | | | — | | | | — | | | $ | 2,180,092 | |
Investment and trading securities | | | 783,282 | | | $ | 3,771,274 | | | $ | 55,873 | | | $ | 1,591,284 | | | $ | 31,443 | | | | 6,233,156 | |
Loans: | | | | | | | | | | | | | | | | | | | | | | | | |
Commercial | | | 2,678,369 | | | | 1,885,481 | | | | 2,264,730 | | | | 939,060 | | | | 1,090,479 | | | | 8,858,119 | |
Construction | | | 522,474 | | | | 10,873 | | | | 117,802 | | | | 10,483 | | | | 12,531 | | | | 674,163 | |
Lease financing | | | 218,319 | | | | 392,198 | | | | — | | | | 18,500 | | | | — | | | | 629,017 | |
Consumer | | | 2,048,245 | | | | 1,434,440 | | | | 173,550 | | | | 64,379 | | | | 104,856 | | | | 3,825,470 | |
Mortgage | | | 747,215 | | | | 1,626,077 | | | | 126,174 | | | | 4,310,182 | | | | 219,373 | | | | 7,029,021 | |
| | | | | | | | | | | | | | | | | | | | | | | | |
Subtotal loans | | | 6,214,622 | | | | 5,349,069 | | | | 2,682,256 | | | | 5,342,604 | | | | 1,427,239 | | | | 21,015,790 | |
Westernbank loans | | | 901,290 | | | | 549,197 | | | | 316,875 | | | | 274,241 | | | | 71,837 | | | | 2,113,440 | |
| | | | | | | | | | | | | | | | | | | | | | | | |
Total earning assets | | $ | 10,079,286 | | | $ | 9,669,540 | | | $ | 3,055,004 | | | $ | 7,208,129 | | | $ | 1,530,519 | | | $ | 31,542,478 | |
| | | | | | | | | | | | | | | | | | | | | | | | |
| Note: | Equity securities available-for-sale and other investment securities, including Federal Reserve Bank stock and Federal Home Loan Bank stock held by the Corporation, are not included in this table. |
Loans held-for-sale have been allocated according to the expected sale date.
Covered loans
The loans acquired in the Westernbank FDIC-assisted transaction were initially recorded at estimated fair values. As expressed in the Critical Accounting Policies / Estimates section of this MD&A, most of the covered loans have an accretable yield. The accretable yield includes the future interest expected to be collected over the remaining life of the acquired loans and the purchase premium or discount. The remaining life includes the effects of estimated prepayments and expected credit losses. For covered loans accounted for under ASC Subtopic 310-30, the Corporation is required to periodically evaluate its estimate of cash flows expected to be collected. These evaluations, performed quarterly, require the continued usage of key assumptions and estimates. Management must apply judgment to develop its estimates of cash flows for those covered loans given the impact of home price and property value changes, changes in interest rates and loss severities and prepayment speeds. Decreases in the expected cash flows by pool will generally result in a charge to the provision for credit losses resulting in an increase to the allowance for loan losses, while increases in the expected cash flows of a pool will generally result in an increase in interest income over the remaining life of the loan, or pool of loans.
Trading
The Corporation engages in trading activities in the ordinary course of business at its subsidiaries, Banco Popular de Puerto Rico and Popular Securities. Popular Securities’ trading activities consist primarily of market-making activities to meet expected customers’ needs related to its retail brokerage business and purchases and sales of U.S. Government and government sponsored securities with the objective of realizing gains from expected short-term price movements. BPPR’s trading activities consist primarily of holding U.S. Government sponsored mortgage-backed securities classified as “trading” and hedging the related market risk with “TBA” (to-be-announced) market transactions. The objective is to derive spread income from the portfolio and not to benefit from short-term market movements. In addition, BPPR uses forward contracts or TBAs to hedge its securitization pipeline. Risks related to variations in interest rates and market volatility are hedged with TBAs that have characteristics similar to that of the forecasted security and its conversion timeline.
57
At December 31, 2015, the Corporation held trading securities with a fair value of $72 million, representing approximately 0.2% of the Corporation’s total assets, compared with $139 million and 0.4% at December 31, 2014. As shown in Table 23, the trading portfolio consists principally of mortgage-backed securities relating to BPPR’s mortgage activities described above, which at December 31, 2015 were investment grade securities. As of December 31, 2015, the trading portfolio also included $6.0 million in Puerto Rico government obligations and shares of closed-end funds that invest primarily in Puerto Rico government obligations (December 31, 2014 - $9.9 million). Trading instruments are recognized at fair value, with changes resulting from fluctuations in market prices, interest rates or exchange rates reported in current period earnings. The Corporation recognized a net trading account loss of $4.7 million for the year ended December 31, 2015, compared with a gain of $4.4 million for 2014. Table 23 provides the composition of the trading portfolio at December 31, 2015 and December 31, 2014.
Table 23 - Trading Portfolio
| | | | | | | | | | | | | | | | |
| | | December 31, 2015 | | | December 31, 2014 | |
(Dollars in thousands) | | Amount | | | Weighted
Average Yield [1] | | | Amount | | | Weighted
Average Yield [1] | |
Mortgage-backed securities | | $ | 51,155 | | | | 5.22 | % | | $ | 110,692 | | | | 6.19 | % |
Collateralized mortgage obligations | | | 2,054 | | | | 5.06 | | | | 1,636 | | | | 5.01 | |
Puerto Rico government obligations | | | 4,590 | | | | 5.41 | | | | 7,954 | | | | 5.23 | |
Interest-only strips | | | 687 | | | | 12.10 | | | | 769 | | | | 12.11 | |
Other | | | 13,173 | | | | 3.31 | | | | 17,476 | | | | 3.26 | |
| | | | | | | | | | | | | | | | |
Total | | $ | 71,659 | | | | 4.94 | % | | $ | 138,527 | | | | 5.78 | % |
| | | | | | | | | | | | | | | | |
| [1] | Not on a taxable equivalent basis. |
The Corporation’s trading activities are limited by internal policies. For each of the two subsidiaries, the market risk assumed under trading activities is measured by the 5-day net value-at-risk (“VAR”), with a confidence level of 99%. The VAR measures the maximum estimated loss that may occur over a 5-day holding period, given a 99% probability.
The Corporation’s trading portfolio had a 5-day VAR of approximately $0.7 million for the last week in December 31, 2015. There are numerous assumptions and estimates associated with VAR modeling, and actual results could differ from these assumptions and estimates. Backtesting is performed to compare actual results against maximum estimated losses, in order to evaluate model and assumptions accuracy.
In the opinion of management, the size and composition of the trading portfolio does not represent a significant source of market risk for the Corporation.
Derivatives
Derivatives may be used by the Corporation as part of its overall interest rate risk management strategy to minimize significant unexpected fluctuations in earnings and cash flows that are caused by fluctuations in interest rates. Derivative instruments that the Corporation may use include, among others, interest rate swaps, caps, floors, indexed options, and forward contracts. The Corporation does not use highly leveraged derivative instruments in its interest rate risk management strategy. The Corporation enters into interest rate swaps, interest rate caps and foreign exchange contracts for the benefit of commercial customers. Credit risk embedded in these transactions is reduced by requiring appropriate collateral from counterparties and entering into netting agreements whenever possible. All outstanding derivatives are recognized in the Corporation’s consolidated statement of condition at their fair value. Refer to Note 32 to the consolidated financial statements for further information on the Corporation’s involvement in derivative instruments and hedging activities.
The Corporation’s derivative activities are entered primarily to offset the impact of market volatility on the economic value of assets or liabilities. The net effect on the market value of potential changes in interest rates of derivatives and other financial instruments is analyzed. The effectiveness of these hedges is monitored to ascertain that the Corporation is reducing market risk as expected. Derivative transactions are generally executed with instruments with a high correlation to the hedged asset or liability. The
58
underlying index or instrument of the derivatives used by the Corporation is selected based on its similarity to the asset or liability being hedged. As a result of interest rate fluctuations, fixed and variable interest rate hedged assets and liabilities will appreciate or depreciate in fair value. The effect of this unrealized appreciation or depreciation is expected to be substantially offset by the Corporation’s gains or losses on the derivative instruments that are linked to these hedged assets and liabilities. Management will assess if circumstances warrant liquidating or replacing the derivatives position in the hypothetical event that high correlation is reduced. Based on the Corporation’s derivative instruments outstanding at December 31, 2015, it is not anticipated that such a scenario would have a material impact on the Corporation’s financial condition or results of operations.
Certain derivative contracts also present credit risk and liquidity risk because the counterparties may not comply with the terms of the contract, or the collateral obtained might be illiquid or become so. The Corporation controls credit risk through approvals, limits and monitoring procedures, and through master netting and collateral agreements whenever possible. Further, as applicable under the terms of the master agreements, the Corporation may obtain collateral, where appropriate, to reduce credit risk. The credit risk attributed to the counterparty’s nonperformance risk is incorporated in the fair value of the derivatives. Additionally, as required by the fair value measurements guidance, the fair value of the Corporation’s own credit standing is considered in the fair value of the derivative liabilities. During the year ended December 31, 2015, inclusion of the credit risk in the fair value of the derivatives resulted in a net loss of $0.5 million (2014 – net gain of $1.1 million; 2013 – net gain of $1.5 million), which consisted of a loss of $0.8 million (2014 – loss of $ 0.1 million; 2013 – gain of $ 0.5 million) resulting from the Corporation’s credit standing adjustment and a gain of $0.3 million (2014 – gain of $ 1.2 million; 2013 – gain of $1.0 million) from the assessment of the counterparties’ credit risk. At December 31, 2015, the Corporation had $10 million (2014 - $ 15 million) recognized for the right to reclaim cash collateral posted. On the other hand, the Corporation did not have any obligation to return cash collateral received at December 31, 2015 and 2014.
The Corporation performs appropriate due diligence and monitors the financial condition of counterparties that represent a significant volume of credit exposure. Additionally, the Corporation has exposure limits to prevent any undue funding exposure.
Cash Flow Hedges
The Corporation manages the variability of cash payments due to interest rate fluctuations by the effective use of derivatives designated as cash flow hedges and that are linked to specified hedged assets and liabilities. The cash flow hedges relate to forward contracts or TBA mortgage-backed securities that are sold and bought for future settlement to hedge mortgage-backed securities and loans prior to securitization. The seller agrees to deliver on a specified future date a specified instrument at a specified price or yield. These securities are hedging a forecasted transaction and are designated for cash flow hedge accounting. The notional amount of derivatives designated as cash flow hedges at December 31, 2015 amounted to $110 million (2014 - $93 million).
Refer to Note 32 to the consolidated financial statements for additional quantitative information on these derivative contracts.
Fair Value Hedges
The Corporation did not have any derivatives designated as fair value hedges during the years ended December 31, 2015 and 2014.
Trading and Non-Hedging Derivative Activities
The Corporation enters into derivative positions based on market expectations or to benefit from price differentials between financial instruments and markets mostly to economically hedge a related asset or liability. The Corporation also enters into various derivatives to provide these types of derivative products to customers. These free-standing derivatives are carried at fair value with changes in fair value recorded as part of the results of operations for the period.
Following is a description of the most significant of the Corporation’s derivative activities that are not designated for hedge accounting. Refer to Note 32 to the consolidated financial statements for additional quantitative and qualitative information on these derivative instruments.
At December 31, 2015, the Corporation had outstanding $ 189 million (2014- $ 238 million) in notional amount of interest rate swap agreements with a net negative fair value of $0.4 million (2014 – net negative fair value of $0.7 million), which were not designated as accounting hedges. These swaps were entered in the Corporation’s capacity as an intermediary on behalf of its customers and their offsetting swap position.
59
For the year ended December 31, 2015, the impact of the mark-to-market of interest rate swaps not designated as accounting hedges was a net increase in earnings of approximately $ 0.3 million, recorded in the other operating income category of the consolidated statement of operations, compared with an earnings increase of approximately $ 1.2 million and $ 1.0 million, in 2014 and in 2013 respectively.
At December 31, 2015 and 2014, the Corporation did not have any forward contracts outstanding not designated as accounting hedges. For the year ended December 31, 2015, the impact of the mark-to-market of the forward contracts not designated as accounting hedges was a reduction to non-interest income of $ 0.4 million (2014 - loss of $ 10.9 million; 2013 - gain of $ 9.0 million), which was included in the category of mortgage banking activities in the consolidated statement of operations.
Furthermore, the Corporation has over-the-counter option contracts which are utilized in order to limit the Corporation’s exposure on customer deposits whose returns are tied to the S&P 500 or to certain other equity securities or commodity indexes. The Corporation offers certificates of deposit with returns linked to these indexes to its retail customers, principally in connection with individual retirement accounts (IRAs), and certificates of deposit. At December 31, 2015, these deposits amounted to $ 86 million (2014 - $ 83 million), or less than 1% (2014 – less than 1%) of the Corporation’s total deposits. In these certificates, the customer’s principal is guaranteed by the Corporation and insured by the FDIC to the maximum extent permitted by law. The instruments pay a return based on the increase of these indexes, as applicable, during the term of the instrument. Accordingly, this product gives customers the opportunity to invest in a product that protects the principal invested but allows the customer the potential to earn a return based on the performance of the indexes.
The risk of issuing certificates of deposit with returns tied to the applicable indexes is economically hedged by the Corporation. BPPR and BPNA purchase indexed options from financial institutions with strong credit standings, whose return is designed to match the return payable on the certificates of deposit issued by these banking subsidiaries. By hedging the risk in this manner, the effective cost of these deposits is fixed. The contracts have a maturity and an index equal to the terms of the pool of retail deposits that they are economically hedging.
The purchased option contracts are initially accounted for at cost (i.e., amount of premium paid) and recorded as a derivative asset. The derivative asset is marked-to-market on a quarterly basis with changes in fair value charged to earnings. The deposits are hybrid instruments containing embedded options that must be bifurcated in accordance with the derivatives and hedging activities guidance. The initial value of the embedded option (component of the deposit contract that pays a return based on changes in the applicable indexes) is bifurcated from the related certificate of deposit and is initially recorded as a derivative liability and a corresponding discount on the certificate of deposit is recorded. Subsequently, the discount on the deposit is accreted and included as part of interest expense while the bifurcated option is marked-to-market with changes in fair value charged to earnings.
The purchased indexed options are used to economically hedge the bifurcated embedded option. These option contracts do not qualify for hedge accounting, and therefore, cannot be designated as accounting hedges. At December 31, 2015, the notional amount of the indexed options on deposits approximated $ 90 million (2014 - $ 87 million) with a fair value of $ 13 million (asset) (2014 - $ 17 million) while the embedded options had a notional value of $ 86 million (2014 - $ 83 million) with a fair value of $ 10 million (liability) (2014 - $ 13 million).
Refer to Note 32 to the consolidated financial statements for a description of other non-hedging derivative activities utilized by the Corporation during 2015 and 2014.
Foreign Exchange
The Corporation holds an interest in BHD León in the Dominican Republic, which is an investment accounted for under the equity method. The Corporation’s carrying value of the equity interest in BHD León approximated $117 million at December 31, 2015. This business is conducted in the country’s foreign currency. The resulting foreign currency translation adjustment, from operations for which the functional currency is other than the U.S. dollar, is reported in accumulated other comprehensive loss in the consolidated statements of condition, except for highly-inflationary environments in which the effects would be included in the consolidated statements of operations. At December 31, 2015, the Corporation had approximately $36 million in an unfavorable foreign currency translation adjustment as part of accumulated other comprehensive loss, compared with an unfavorable adjustment of $33 million at December 31, 2014 and $36 million at December 31, 2013.
60
Liquidity
The objective of effective liquidity management is to ensure that the Corporation has sufficient liquidity to meet all of its financial obligations, finance expected future growth and maintain a reasonable safety margin for cash commitments under both normal and stressed market conditions. The Board is responsible for establishing the Corporation’s tolerance for liquidity risk, including approving relevant risk limits and policies. The Board has delegated the monitoring of these risks to the RMC and the ALCO. The management of liquidity risk, on a long-term and day-to-day basis, is the responsibility of the Corporate Treasury Division. The Corporation’s Corporate Treasurer is responsible for implementing the policies and procedures approved by the Board and for monitoring the Corporation’s liquidity position on an ongoing basis. Also, the Corporate Treasury Division coordinates corporate wide liquidity management strategies and activities with the reportable segments, oversees policy breaches and manages the escalation process. The Financial and Operational Risk Management Division is responsible for the independent monitoring and reporting of adherence with established policies.
An institution’s liquidity may be pressured if, for example, its credit rating is downgraded, it experiences a sudden and unexpected substantial cash outflow, or some other event causes counterparties to avoid exposure to the institution. Factors that the Corporation does not control, such as the economic outlook, adverse ratings of its principal markets and regulatory changes, could also affect its ability to obtain funding.
Liquidity is managed by the Corporation at the level of the holding companies that own the banking and non-banking subsidiaries. It is also managed at the level of the banking and non-banking subsidiaries. The Corporation has adopted policies and limits to monitor more effectively the Corporation’s liquidity position and that of the banking subsidiaries. Additionally, contingency funding plans are used to model various stress events of different magnitudes and affecting different time horizons that assist management in evaluating the size of the liquidity buffers needed if those stress events occur. However, such models may not predict accurately how the market and customers might react to every event, and are dependent on many assumptions.
During the quarter ended September 30, 2015, the Corporation reinstated the quarterly cash dividend on its outstanding common stock. A cash dividend of $0.15 per share was paid on October 7, 2015 and January 4, 2016 to shareholders of record at the close of business on September 29, 2015 and December 22, 2015, respectively. This represents a quarterly payout of approximately $15.5 million.
As discussed in Note 5 - Business Combinations, on February 27, 2015 the Corporation acquired certain assets and all deposits (except brokered deposits) from Doral Bank. This included approximately $ 1.5 billion in loans, approximately $ 173 million in securities available for sale and $ 2.2 billion in deposits.
Deposits, including customer deposits, brokered deposits and public funds deposits, continue to be the most significant source of funds for the Corporation, funding 76% of the Corporation’s total assets at December 31, 2015 and 75% at December 31, 2014. The ratio of total ending loans to deposits was 85% at December 31, 2015, compared to 89% at December 31, 2014. In addition to traditional deposits, the Corporation maintains borrowing arrangements. At December 31, 2015, these borrowings consisted primarily of $712 million in assets sold under agreement to repurchase, $762 million in advances with the FHLB, $440 million in junior subordinated deferrable interest debentures related to trust preferred securities and $450 million in term notes issued to partially fund the repayment of TARP funds. A detailed description of the Corporation’s borrowings, including their terms, is included in Note 23 to the consolidated financial statements. Also, the consolidated statements of cash flows in the accompanying consolidated financial statements provide information on the Corporation’s cash inflows and outflows.
The following sections provide further information on the Corporation’s major funding activities and needs, as well as the risks involved in these activities. A detailed description of the Corporation’s borrowings and available lines of credit, including its terms, is included in Note 23 to the consolidated financial statements. Also, the consolidated statements of cash flows in the accompanying consolidated financial statements provide information on the Corporation’s cash inflows and outflows.
Banking Subsidiaries
Primary sources of funding for the Corporation’s banking subsidiaries (BPPR and BPNA), or “the banking subsidiaries,” include retail and commercial deposits, brokered deposits, unpledged investment securities, and, to a lesser extent, loan sales. In addition, the Corporation maintains borrowing facilities with the FHLB and at the discount window of the Federal Reserve Board (the “FED”), and has a considerable amount of collateral pledged that can be used to quickly raise funds under these facilities.
61
The principal uses of funds for the banking subsidiaries include loan originations, investment portfolio purchases, loan purchases and repurchases, repayment of outstanding obligations (including deposits), and operational expenses. Also, the banking subsidiaries assume liquidity risk related to collateral posting requirements for certain activities mainly in connection with contractual commitments, recourse provisions, servicing advances, derivatives, credit card licensing agreements and support to several mutual funds administered by BPPR.
During the quarters ended September 30, 2015 and December 31, 2015, BPPR declared cash dividends of $17.2 million, a portion of which was used by Popular, Inc. for the payments of the cash dividends on its outstanding common stock made on October 7, 2015 and January 4, 2016, as mentioned above. During the quarter ended December 31, 2015, the Corporation’s U.S. bank subsidiary BPNA declared a $200 million cash dividend to Popular North America, $158 million of which was contributed by Popular North America to Popular Holding Company.
Note 46 to the consolidated financial statements provides a consolidating statement of cash flows which includes the Corporation’s banking subsidiaries as part of the “All other subsidiaries and eliminations” column.
The banking subsidiaries maintain sufficient funding capacity to address large increases in funding requirements such as deposit outflows. This capacity is comprised mainly of available liquidity derived from secured funding sources, as well as on-balance sheet liquidity in the form of cash balances maintained at the Fed and unused secured lines held at the Fed and FHLB, in addition to liquid unpledged securities. The Corporation has established liquidity guidelines that require the banking subsidiaries to have sufficient liquidity to cover all short-term borrowings and a portion of deposits.
The Corporation’s ability to compete successfully in the marketplace for deposits, excluding brokered deposits, depends on various factors, including pricing, service, convenience and financial stability as reflected by operating results, credit ratings (by nationally recognized credit rating agencies), and importantly, FDIC deposit insurance. Although a downgrade in the credit ratings of the Corporation’s banking subsidiaries may impact their ability to raise retail and commercial deposits or the rate that it is required to pay on such deposits, management does not believe that the impact should be material. Deposits at all of the Corporation’s banking subsidiaries are federally insured (subject to FDIC limits) and this is expected to mitigate the potential effect of a downgrade in the credit ratings.
Deposits are a key source of funding as they tend to be less volatile than institutional borrowings and their cost is less sensitive to changes in market rates. Refer to Table 15 for a breakdown of deposits by major types. Core deposits are generated from a large base of consumer, corporate and institutional customers. Core deposits include all non-interest bearing deposits, savings deposits and certificates of deposit under $100,000, excluding brokered deposits with denominations under $100,000. Core deposits have historically provided the Corporation with a sizable source of relatively stable and low-cost funds. Core deposits totaled $22.0 billion, or 81 % of total deposits, at December 31, 2015, compared with $20.6 billion, or 83% of total deposits, at December 31, 2014. Core deposits financed 69% of the Corporation’s earning assets at December 31, 2015 and December 31, 2014.
Certificates of deposit with denominations of $100,000 and over at December 31, 2015 totaled $4.2 billion, or 15% of total deposits (December 31, 2014 - $3.3 billion, or 13% of total deposits). Their distribution by maturity at December 31, 2015 is presented in the table that follows:
Table 24 - Distribution by Maturity of Certificate of Deposits of $100,000 and Over
| | | | |
(In thousands) | | | |
3 months or less | | $ | 1,590,779 | |
3 to 6 months | | | 508,120 | |
6 to 12 months | | | 832,080 | |
Over 12 months | | | 1,220,030 | |
| | | | |
Total | | $ | 4,151,009 | |
| | | | |
Average deposits, including brokered deposits, for the year ended December 31, 2015 represented 85% of average earning assets, compared with 82% and 85% for the years ended December 31, 2014 and 2013, respectively. Table 25 summarizes average deposits for the past five years.
62
Table 25 - Average Total Deposits
| | | | | | | | | | | | | | | | | | | | |
| | | For the years ended December 31, | |
(In thousands) | | 2015 | | | 2014 | | | 2013 | | | 2012 | | | 2011 | |
Non-interest bearing demand deposits | | $ | 6,146,504 | | | $ | 5,533,649 | | | $ | 5,728,228 | | | $ | 5,356,649 | | | $ | 5,058,424 | |
| | | | | | | | | | | | | | | | | | | | |
Savings accounts | | | 7,027,238 | | | | 6,733,195 | | | | 6,792,137 | | | | 6,571,133 | | | | 6,320,825 | |
| | | | | | | | | | | | | | | | | | | | |
NOW, money market and other interest bearing demand accounts | | | 5,446,933 | | | | 4,824,402 | | | | 5,738,189 | | | | 5,555,203 | | | | 5,204,235 | |
| | | | | | | | | | | | | | | | | | | | |
Certificates of deposit: | | | | | | | | | | | | | | | | | | | | |
Under $100,000 | | | 3,537,307 | | | | 3,708,622 | | | | 4,817,831 | | | | 5,276,389 | | | | 5,966,089 | |
$100,000 and over | | | 3,755,412 | | | | 3,107,735 | | | | 2,995,175 | | | | 3,375,846 | | | | 4,026,042 | |
| | | | | | | | | | | | | | | | | | | | |
Certificates of deposit | | | 7,292,719 | | | | 6,816,357 | | | | 7,813,006 | | | | 8,652,235 | | | | 9,992,131 | |
Other time deposits | | | 865,189 | | | | 739,752 | | | | 700,815 | | | | 768,713 | | | | 927,776 | |
| | | | | | | | | | | | | | | | | | | | |
Total interest bearing deposits | | | 20,632,079 | | | | 19,113,706 | | | | 21,044,147 | | | | 21,547,284 | | | | 22,444,967 | |
| | | | | | | | | | | | | | | | | | | | |
Total average deposits | | $ | 26,778,583 | | | $ | 24,647,355 | | | $ | 26,772,375 | | | $ | 26,903,933 | | | $ | 27,503,391 | |
| | | | | | | | | | | | | | | | | | | | |
At December 31, 2015 approximately 4% of the Corporation’s assets were financed by brokered deposits, as compared to 6% at December 31, 2014. The Corporation had $ 1.3 billion in brokered deposits at December 31, 2015 and $1.9 billion in December 31, 2014. In the event that any of the Corporation’s banking subsidiaries’ regulatory capital ratios fall below those required by a well-capitalized institution or are subject to capital restrictions by the regulators, that banking subsidiary faces the risk of not being able to raise or maintain brokered deposits and faces limitations on the rate paid on deposits, which may hinder the Corporation’s ability to effectively compete in its retail markets and could affect its deposit raising efforts.
To the extent that the banking subsidiaries are unable to obtain sufficient liquidity through core deposits, the Corporation may meet its liquidity needs through short-term borrowings by pledging securities for borrowings under repurchase agreements, by pledging additional loans and securities through the available secured lending facilities, or by selling liquid assets. These measures are subject to availability of collateral.
The Corporation’s banking subsidiaries have the ability to borrow funds from the FHLB. At December 31, 2015 and December 31, 2014, the banking subsidiaries had credit facilities authorized with the FHLB aggregating to $3.9 billion and $3.7 billion, respectively, based on assets pledged with the FHLB at those dates. Outstanding borrowings under these credit facilities totaled $762 million at December 31, 2015 and $822 million at December 31, 2014. Such advances are collateralized by loans held-in-portfolio, do not have restrictive covenants and do not have any callable features. At December 31, 2015 the credit facilities authorized with the FHLB were collateralized by $ 4.7 billion in loans held-in-portfolio, compared with $4.5 billion at December 31, 2014. Refer to Note 23 to the consolidated financial statements for additional information on the terms of FHLB advances outstanding.
At December 31, 2015 and December 31, 2014, the Corporation’s borrowing capacity at the Fed’s Discount Window amounted to approximately $1.3 billion and $2.1 billion, respectively, which remained unused as of both dates. The amount available under this borrowing facility is dependent upon the balance of performing loans, securities pledged as collateral and the haircuts assigned to such collateral. At December 31, 2015 and December 31, 2014, this credit facility with the Fed was collateralized by $ 2.5 billion and $4.1 billion, respectively, in loans held-in-portfolio.
At December 31, 2015, management believes that the banking subsidiaries had sufficient current and projected liquidity sources to meet their anticipated cash flow obligations, as well as special needs and off-balance sheet commitments, in the ordinary course of business and have sufficient liquidity resources to address a stress event. Although the banking subsidiaries have historically been able to replace maturing deposits and advances, no assurance can be given that they would be able to replace those funds in the future if the Corporation’s financial condition or general market conditions were to deteriorate. The Corporation’s financial flexibility will be severely constrained if its banking subsidiaries are unable to maintain access to funding or if adequate financing is not available to accommodate future financing needs at acceptable interest rates. The banking subsidiaries also are required to deposit cash or qualifying securities to meet margin requirements. To the extent that the value of securities previously pledged as collateral declines because of market changes, the Corporation will be required to deposit additional cash or securities to meet its margin requirements, thereby adversely affecting its liquidity. Finally, if management is required to rely more heavily on more expensive funding sources to meet its future growth, revenues may not increase proportionately to cover costs. In this case, profitability would be adversely affected.
63
Westernbank FDIC-assisted Transaction and Impact on Liquidity
The effects of the loss sharing agreements on cash flows and operating results will depend primarily on the ability of the borrowers whose loans are covered by the loss sharing agreements to make payments over time and our ability to receive reimbursements for losses from the FDIC. As the loss sharing agreements are in effect for a period of ten years for one-to-four family loans and five years for commercial, construction and consumer loans (with periods commencing on April 30, 2010), changing economic conditions will likely impact the timing of future charge-offs and the resulting reimbursements from the FDIC. Management believes that any recapture of interest income and recognition of cash flows from the borrowers or received from the FDIC on the claims filed may be recognized unevenly over this period, as management exhausts its collection efforts under the Corporation’s normal practices.
BPPR’s liquidity may also be impacted by the loan payment performance and timing of claims made and receipt of reimbursements under the FDIC loss sharing agreements. Please refer to the Legal Proceedings section of Note 30 to the consolidated financial statements and to Part II, Item 1A- Risk factors herein for a discussion of the settlement of a contractual dispute between BPPR and the FDIC which has impacted the timing of the payment of claims under the loss share agreements.
Bank Holding Companies
The principal sources of funding for the holding companies include cash on hand, investment securities, dividends received from banking and non-banking subsidiaries (subject to regulatory limits and authorizations) asset sales, credit facilities available from affiliate banking subsidiaries and proceeds from potential securities offerings.
The principal use of these funds include the repayment of debt, and interest payments to holders of senior debt and junior subordinated deferrable interest (related to trust preferred securities) and capitalizing its banking subsidiaries.
During the year ended December 31, 2015, Popular Holding Company (“PIHC”) received $34.4 million in dividends from BPPR and $4.7 million in dividends from EVERTEC’s parent company. PIHC also received $9.3 million in dividends from its investment in BHD León, $11.5 million in distributions from its investment in PRB Investors LP, which represented a return of capital, and $52.0 million in dividends from its non-banking subsidiaries. During the quarter ended December 31, 2015, the Corporation’s U.S. bank subsidiary BPNA declared a $200 million cash dividend to Popular North America (“PNA”), $158 million of which was contributed by PNA to PIHC.
Another use of liquidity at the parent holding company is the payment of dividends on its outstanding stock. As mentioned above, during the quarter ended September 30, 2015, the Corporation reinstated the quarterly cash dividend on its outstanding common stock. Cash dividends of $0.15 per share were paid on October 7, 2015 and January 4, 2016 to shareholders of record at the close of business on September 29, 2015 and December 22, 2015, respectively. This represents a quarterly payout of approximately $15.5 million. The dividends for the Corporation’s Series A and Series B preferred stock amounted to $3.7 million for the year ended December 31, 2015. The preferred stock dividends paid were financed by issuing new shares of common stock to the participants of the Corporation’s qualified employee savings plans.
The BHC’s have in the past borrowed in the money markets and in the corporate debt market primarily to finance their non-banking subsidiaries, however, the cash needs of the Corporation’s non-banking subsidiaries other than to repay indebtedness and interest are now minimal. These sources of funding have become more costly due to the reductions in the Corporation’s credit ratings. The Corporation’s principal credit ratings are below “investment grade” which affects the Corporation’s ability to raise funds in the capital markets. The Corporation has an automatic shelf registration statement filed and effective with the Securities and Exchange Commission, which permits the Corporation to issue an unspecified amount of debt or equity securities.
Note 46 to the consolidated financial statements provides a statement of condition, of operations and of cash flows for the two BHC’s.
The outstanding balance of notes payable at the BHC’s amounted to $890 million at December 31, 2015 and December 31, 2014. The repayment of the BHC’s obligations represents a potential cash need which is expected to be met with a combination of internal liquidity resources stemming mainly from future dividend receipts and new borrowings.
The contractual maturities of the BHC’s notes payable at December 31, 2015 are presented in Table 26.
64
Table 26 - Distribution of BHC’s Notes Payable by Contractual Maturity
| | | | |
Year | | (In thousands) | |
2016 | | $ | — | |
2017 | | | — | |
2018 | | | — | |
2019 | | | 450,000 | |
2020 | | | — | |
Later years | | | 439,800 | |
| | | | |
Total | | $ | 889,800 | |
| | | | |
As indicated previously, the BHC did not issue new registered debt in the capital markets during the year ended December 31, 2015.
The BHCs liquidity position continues to be adequate with sufficient cash on hand, investments and other sources of liquidity which are expected to be enough to meet all BHCs obligations during the foreseeable future.
Non-banking subsidiaries
The principal sources of funding for the non-banking subsidiaries include internally generated cash flows from operations, loan sales, repurchase agreements, and borrowed funds from their direct parent companies or the holding companies. The principal uses of funds for the non-banking subsidiaries include repayment of maturing debt, operational expenses and payment of dividends to the BHCs. The liquidity needs of the non-banking subsidiaries are minimal since most of them are funded internally from operating cash flows or from intercompany borrowings from their holding companies, BPPR or BPNA.
Other Funding Sources and Capital
The investment securities portfolio provides an additional source of liquidity, which may be realized through either securities sales or repurchase agreements. The Corporation’s investment securities portfolio consists primarily of liquid U.S. government investment securities, sponsored U.S. agency securities, government sponsored mortgage-backed securities, and collateralized mortgage obligations that can be used to raise funds in the repo markets. At December 31, 2015, the investment and trading securities portfolios, as shown in Table 22, totaled $6.2 billion, of which $0.8 billion, or 13%, had maturities of one year or less. Mortgage-related investments in Table 22 are presented based on expected maturities, which may differ from contractual maturities, since they could be subject to prepayments. The availability of the repurchase agreement would be subject to having sufficient unpledged collateral available at the time the transactions are to be consummated, in addition to overall liquidity and risk appetite of the various counterparties. The Corporation’s unpledged investment and trading securities, excluding other investment securities, amounted to $ 3.0 billion at December 31, 2015 and $2.7 billion at December 31, 2014. A substantial portion of these securities could be used to raise financing quickly in the U.S. money markets or from secured lending sources.
Additional liquidity may be provided through loan maturities, prepayments and sales. The loan portfolio can also be used to obtain funding in the capital markets. In particular, mortgage loans and some types of consumer loans, have secondary markets which the Corporation could use. The maturity distribution of the total loan portfolio at December 31, 2015 is presented in Table 22. As of that date, $7.1 billion, or 31% of the loan portfolio was expected to mature within one year, compared with $7.4 billion, or 33% of the loan portfolio in the previous year. The contractual maturities of loans have been adjusted to include prepayments based on historical data and prepayment trends.
Risks to Liquidity
Total lines of credit outstanding are not necessarily a measure of the total credit available on a continuing basis. Some of these lines could be subject to collateral requirements, standards of creditworthiness, leverage ratios and other regulatory requirements, among other factors. Derivatives, such as those embedded in long-term repurchase transactions or interest rate swaps, and off-balance sheet exposures, such as recourse, performance bonds or credit card arrangements, are subject to collateral requirements. As their fair value increases, the collateral requirements may increase, thereby reducing the balance of unpledged securities.
The importance of the Puerto Rico market for the Corporation is an additional risk factor that could affect its financing activities. In the case of a deterioration in economic conditions in Puerto Rico, the credit quality of the Corporation could be affected and result in higher credit costs. The Puerto Rico economy continues to face various challenges, including significant pressures in some sectors of the residential real estate market. Refer to the Geographic and Government Risk section of this MD&A for some highlights on the current status of the Puerto Rico economy.
65
Factors that the Corporation does not control, such as the economic outlook and credit ratings of its principal markets and regulatory changes, could also affect its ability to obtain funding. In order to prepare for the possibility of such scenario, management has adopted contingency plans for raising financing under stress scenarios when important sources of funds that are usually fully available are temporarily unavailable. These plans call for using alternate funding mechanisms, such as the pledging of certain asset classes and accessing secured credit lines and loan facilities put in place with the FHLB and the Fed.
The credit ratings of Popular’s debt obligations are a relevant factor for liquidity because they impact the Corporation’s ability to borrow in the capital markets, its cost and access to funding sources. Credit ratings are based on the financial strength, credit quality and concentrations in the loan portfolio, the level and volatility of earnings, capital adequacy, the quality of management, the liquidity of the balance sheet, the availability of a significant base of core retail and commercial deposits, and the Corporation’s ability to access a broad array of wholesale funding sources, among other factors.
The Corporation’s banking subsidiaries have historically not used unsecured capital market borrowings to finance its operations, and therefore are less sensitive to the level and changes in the Corporation’s overall credit ratings. At the BHCs, the volume of capital market borrowings has declined substantially, as the non-banking lending businesses that it had historically funded have been shut down and the need to raise unsecured senior debt has been substantially reduced.
Obligations Subject to Rating Triggers or Collateral Requirements
The Corporation’s banking subsidiaries currently do not use borrowings that are rated by the major rating agencies, as these banking subsidiaries are funded primarily with deposits and secured borrowings. The banking subsidiaries had $20 million in deposits at December 31, 2015 that are subject to rating triggers.
Some of the Corporation’s derivative instruments include financial covenants tied to the bank’s well-capitalized status and certain formal regulatory actions. These agreements could require exposure collateralization, early termination or both. The fair value of derivative instruments in a liability position subject to financial covenants approximated $4 million at December 31, 2015, with the Corporation providing collateral totaling $10 million to cover the net liability position with counterparties on these derivative instruments.
In addition, certain mortgage servicing and custodial agreements that BPPR has with third parties include rating covenants. In the event of a credit rating downgrade, the third parties have the right to require the institution to engage a substitute cash custodian for escrow deposits and/or increase collateral levels securing the recourse obligations. Also, as discussed in the Guarantees section of this MD&A, the Corporation services residential mortgage loans subject to credit recourse provisions. Certain contractual agreements require the Corporation to post collateral to secure such recourse obligations if the institution’s required credit ratings are not maintained. Collateral pledged by the Corporation to secure recourse obligations amounted to approximately $81 million at December 31, 2015. The Corporation could be required to post additional collateral under the agreements. Management expects that it would be able to meet additional collateral requirements if and when needed. The requirements to post collateral under certain agreements or the loss of escrow deposits could reduce the Corporation’s liquidity resources and impact its operating results.
Credit Risk Management and Loan Quality
Credit risk occurs any time funds are advanced, committed, invested or otherwise exposed. Credit risk arises primarily from the Corporation’s lending activities, as well as from other on-balance sheet and off-balance sheet credit instruments. Credit risk management is based on analyzing the creditworthiness of the borrower or counterparty, the adequacy of underlying collateral given current events and conditions, and the existence and strength of any guarantor support.
Business activities that expose the Corporation to credit risk are managed within the Board’s established limits that consider factors, such as maintaining a prudent balance of risk-taking across diversified risk types and business units (compliance with regulatory guidance, considering factors such as concentrations and loan-to-value ratios), controlling the exposure to lower credit quality assets, and limiting growth in, and overall exposure to, any product or risk segment where the Corporation does not have sufficient experience and a proven ability to predict credit losses.
The significant changes in the economic conditions and the resulting changes in the borrower’s profile over the past several years requires the Corporation to continue to focus on the identification, monitoring and managing of its credit risk. The Corporation manages credit risk by maintaining sound underwriting standards, monitoring and evaluating loan portfolio quality, its trends and
66
collectability, and assessing reserves and loan concentrations. Also, credit risk is mitigated by implementing and monitoring lending policies and collateral requirements, and instituting credit review procedures to ensure appropriate actions to comply with laws and regulations. The Corporation’s credit policies require prompt identification and quantification of asset quality deterioration or potential loss in order to ensure the adequacy of the allowance for loan losses. Included in these policies, primarily determined by the amount, type of loan and risk characteristics of the credit facility, are various approval levels and lending limit constraints, ranging from the branch or department level to those that are more centralized. When considered necessary, the Corporation requires collateral to support credit extensions and commitments, which is generally in the form of real estate and personal property, cash on deposit and other highly liquid instruments.
The Corporation’s Credit Strategy Committee (“CRESCO”) is management’s top policy-making body with respect to credit-related matters and credit strategies. CRESCO reviews the activities of each subsidiary, in the detail that it deems appropriate, to ensure a proactive and coordinated management of credit granting, credit exposures and credit procedures. CRESCO’s principal functions include reviewing the adequacy of the allowance for loan losses and periodically approving appropriate provisions, monitoring compliance with charge-off policy, establishing portfolio diversification standards, yield and quality standards, establishing credit exposure reporting standards, monitoring asset quality, and approving credit policies and amendments thereto for the subsidiaries and/or business lines, including special lending approval authorities when and if appropriate. The analysis of the allowance adequacy is presented to the Risk Management Committee of the Board of Directors for review, consideration and ratification on a quarterly basis.
The Corporation also has a Corporate Credit Risk Management Division (“CCRMD”). CCRMD is a centralized unit, independent of the lending function. The CCRMD’s functions include identifying, measuring and controlling credit risk independently from the business units, evaluating the credit risk rating system and reviewing the adequacy of the allowance for loan losses in accordance with GAAP and regulatory standards. CCRMD also ensures that the subsidiaries comply with the credit policies and applicable regulations, and monitors credit underwriting standards. Also, the CCRMD performs ongoing monitoring of the portfolio, including potential areas of concern for specific borrowers and/or geographic regions. The CCRMD has strengthened its quantitative measurement capabilities, part of continued improvements to the credit risk management processes.
Effective in April 2015, the Corporate Loan Review Unit was separated from the CCRMD, and incorporated into a new division named Corporate Loan Review and Model Risk Monitoring (“CLR & MRM”). Through the Commercial Loan Review Unit at the Corporate Loan Review Department (“CLRD”), CLR & MRM evaluates compliance with the Bank’s Commercial Credit Norms and Procedures and the precision of risk rating accuracy. The CLRD performs annual credit process reviews of several commercial portfolios, including small and middle market, construction, asset-based and corporate banking lending groups in BPPR, as well as BPNA’s commercial and construction portfolios. This group evaluates the credit risk profile of each originating unit along with each unit’s credit administration effectiveness, including the assessment of the risk rating representative of the current credit quality of the loans, and the evaluation of credit and collateral documentation. The monitoring performed by CLRD contributes to assess compliance with credit policies and underwriting standards, to determine the current level of credit risk, to evaluate the effectiveness of the credit management process and to identify control deficiencies that may arise in the credit-origination and management processes. Based on its findings, CLRD develops recommendations to implement corrective actions, if necessary, that help in maintaining a sound credit process and that credit risk is kept at an acceptable level. The Loan Review Department reports the results of the credit process reviews to the Risk Management Committee of the Corporation’s Board of Directors. The Corporation’s Commercial Credit Administration Group includes the Special Loans Division, the Commercial Credit Operations Division and the Loss-Sharing Agreement Administration Group. This unit focuses on maximizing the value of the Corporation’s special loans and other real estate owned of the commercial portfolio, as well as the FDIC covered loans portfolio.
At December 31, 2015, the Corporation’s credit exposure was centered in its $23.1 billion total loan portfolio, which represented 73% of its earning assets. The portfolio composition for the last five years is presented in Table 9.
The Corporation issues certain credit-related off-balance sheet financial instruments including commitments to extend credit, standby letters of credit and commercial letters of credit to meet the financing needs of its customers. For these financial instruments, the contract amount represents the credit risk associated with failure of the counterparty to perform in accordance with the terms and conditions of the contract and the decline in value of the underlying collateral. The credit risk associated with these financial instruments varies depending on the counterparty’s creditworthiness and the value of any collateral held. Refer to Note 31 to the consolidated financial statements and to the Contractual Obligations and Commercial Commitments section of this MD&A for the Corporation’s involvement in these credit-related activities.
At December 31, 2015, the Corporation maintained a reserve of approximately $10 million for potential losses associated with unfunded loan commitments related to commercial and consumer lines of credit (2014 - $13 million).
67
The Corporation is also exposed to credit risk by using derivative instruments but manages the level of risk by only dealing with counterparties of good credit standing, entering into master netting agreements whenever possible and, when appropriate, obtaining collateral. Refer to Note 32 to the consolidated financial statements for further information on the Corporation’s involvement in derivative instruments and hedging activities, and the Derivatives sub-section included under Risk Management in this MD&A.
The Corporation may also encounter risk of default in relation to its investment securities portfolio. Refer to Notes 10 and 11 for the composition of the investment securities available-for-sale and held-to-maturity. The investment securities portfolio held by the Corporation at December 31, 2015 are mostly Obligations of U.S. Government sponsored entities, collateralized mortgage obligations, mortgage-backed securities and Obligations of Puerto Rico, States and political subdivisions.
The Corporation’s credit risk exposure is spread among individual consumers, small and medium businesses, as well as corporate borrowers engaged in a wide variety of industries. Of these commercial lending relationships, 264 have an aggregate exposure of $10 million or more. At December 31, 2015, highly leveraged transactions and credit facilities to finance real estate ventures or business acquisitions amounted to $117 million (2014 - $156 million), and there are no loans to less developed countries. The Corporation limits its exposure to concentrations of credit risk by the nature of its lending limits.
The Corporation has a significant portfolio of commercial loans, mostly secured by commercial real estate properties. Due to their nature, these loans entail a higher credit risk than consumer and residential mortgage loans, since they are larger in size, may have less collateral coverage, higher concentrated risk in a single borrower and are generally more sensitive to economic downturns. General economic conditions and numerous other factors continue to create volatility in collateral values and have increased the possibility that additional losses may have to be recognized with respect to the Corporation’s current nonperforming assets. Furthermore, given the current slowdown in the real estate market, particularly in Puerto Rico, the properties securing these loans may be difficult to dispose of, if foreclosed.
Historically, the levels of real estate prices in Puerto Rico were more stable than in other U.S. markets. Nevertheless, the current economic environment has accelerated the devaluation of properties. In addition, demographic trends is also impacting the demand for housing and hence the devaluation of properties. Over the last few years, as the recession has continued, outmigration has accelerated leading lower housing demand in Puerto Rico. Further declines in property values could impact the credit quality of the loan portfolios in Puerto Rico as the value of the collateral underlying the loans is the primary source of repayment in the event of foreclosure. Lower real estate values could increase the provision for loan losses, loan delinquencies, foreclosures and the cost of repossessing and disposing of real estate collateral.
Over the past several years, the Corporation has focused in de-risking its loan portfolios by reducing its exposure in asset classes with historically high loss content. In Puerto Rico, the construction portfolio has been reduced significantly standing at only $101 million in December 31, 2015. In the U.S., during the second half of 2014, the divesture of its regional operations in California, Illinois, and Central Florida, as well as the sale of certain non-performing and legacy assets were completed, as part of the U.S. operations reorganization. Furthermore, the Corporation has significantly curtailed the production of non-traditional mortgages as it ceased originating subprime consumer loans and non-conventional mortgage loans in its U.S. mainland operations. This shift in the risk profile of the credit portfolios has strengthened the Corporation and its better positioned to operate in Puerto Rico’s complex environment. The Corporation continues to analyze and monitor the higher risk segments of its portfolios, and although deemed appropriately sized and within the risk tolerance limits, remains attentive to changes in trends.
Management continues to refine the Corporation’s credit standards to meet the changing economic environment. The Corporation has strengthened its underwriting criteria, as well as enhanced its line management, collection strategies and problem loan management process. The commercial lending and administration groups continue strengthening critical areas to manage more effectively the current scenario, focusing strategies on critical steps in the origination and portfolio management processes to ensure the quality of incoming loans as well as to detect and manage potential problem loans early. The consumer lending group has also tightened the underwriting standards across all business lines and reduced its exposure in areas that are more likely to be impacted under the current economic conditions.
Geographic and government risk
The Corporation is exposed to geographic and government risk. The Corporation’s assets and revenue composition by geographical area and by business segment reporting are presented in Note 44 to the consolidated financial statements. A significant portion of our financial activities and credit exposure is concentrated in Puerto Rico, which entered into a recession in the second quarter of
68
2006. Puerto Rico’s gross national product contracted in real terms in every year between fiscal year 2007 and fiscal year 2011 (inclusive), grew by 0.5% in fiscal year 2012 and decreased by 0.2% and 0.9% in fiscal years 2013 and 2014, respectively. The changes in the gross national product in fiscal years 2012, 2013 and 2014 also have to be analyzed in light of the large amount of governmental stimulus and deficit spending in those fiscal years. According to the Puerto Rico Planning Board’s baseline scenario projections, for fiscal years 2015 and 2016, gross national product is projected to further contract by 0.9% and 1.2%, respectively. The latest Government Development Bank for Puerto Rico (“GDB”) Economic Activity Index, which is a coincident indicator of ongoing economic activity, reflected a 1.6% reduction in the average for fiscal year 2015 (July 2014 to June 2015), compared to the prior fiscal year. For the first six months of fiscal year 2016, the Economic Activity Index remained essentially flat when compared to the same period of the prior fiscal year.
The Commonwealth of Puerto Rico (the “Commonwealth”) is experiencing a severe fiscal crisis resulting from persistent and significant budget deficits, a high debt burden, the continuing economic contraction and lack of access to the capital markets, among other factors. Budget deficits were historically covered with bond financings, loans from GDB and extraordinary one-time revenue measures. As a result of multiple downgrades of the Commonwealth and its instrumentalities’ obligations to below investment grade ratings since February 2014 and ongoing liquidity constraints at the Commonwealth central government level and GDB, the Commonwealth’s ability to finance future budget deficits is expected to be very limited, if any.
The Government’s most recent estimate of the budget deficit for fiscal year 2015 is approximately $703 million. For fiscal year 2016, the Government approved a $9.8 billion budget, which is $235 million higher than the approved budget for fiscal year 2015 due primarily to a significant increase in debt service payments and special pension contributions. In December 2015, however, the Government revised its revenue estimate for fiscal year 2016 downward by $508 million, to approximately $9.3 billion.
In order to confront its liquidity constraints and this decrease in revenues, while continuing to provide essential services and comply with constitutional obligations for the payment of general obligation bonds, the Government has been forced to implement certain extraordinary measures. These measures include, among others: (i) requiring advance payment to the Treasury Department from the two largest government retirement systems of funds required for the payment of retirement benefits to participants (instead of the usual reimbursements made by the retirement systems to the Treasury Department for pension benefit payments made by the Treasury Department on behalf of the retirement systems); (ii) placing $400 million of tax and revenue anticipation notes with certain Commonwealth instrumentalities to fund fiscal year 2016 working capital needs; (iii) suspending during fiscal year 2016 Commonwealth set-asides required by Act No. 39 of May 13, 1976, as amended, for the payment of its general obligation debt; (iv) retaining certain tax revenues that were assigned to particular public corporations and redirecting those revenues to pay general obligation debt of the Commonwealth (commonly referred to as the exercise of the clawback of revenues); (v) delaying the payment of third-party payables or amounts due to public corporations; (vi) deferring the disbursement of certain budgetary appropriations; and (vii) delaying the payment of income tax refunds. Some of these measures are unsustainable and have significant negative economic effects. Also, since these measures are not sufficient to address the Commonwealth’s liquidity needs, the Commonwealth has indicated it will need to implement additional measures.
The Commonwealth also did not appropriate in the approved budget for fiscal year 2016 the funds necessary to pay principal of and interest on bonds issued by the Puerto Rico Public Finance Corporation (“PFC”), a subsidiary of GDB, which reflects the Commonwealth’s serious liquidity constraints. As a result, in fiscal year 2016, PFC has not paid debt service on approximately $1.1 billion of bonds payable solely from Commonwealth legislative appropriations. As of February 1, 2016, missed payments amount to approximately $86.5 million. In addition, as a result of the clawback of revenues mentioned above, other public corporations (including the Infrastructure Financing Authority, the Highways and Transportation Authority and the Convention Center District Authority) were not able to meet their debt obligations due on January 1, 2016 or did so using moneys previously held by the bond indenture trustees in reserves or other accounts.
Further in response to the fiscal crisis, the Commonwealth has also enacted various revenue raising and expense reduction measures, the principal one on the revenue side being an increase in the sales and use tax (“SUT”) rate pursuant to Act 72-2015, enacted on May 29, 2015. Effective July 1, 2015, transactions that were subject to the 7% SUT have been subject to an 11.5% SUT (10.5% collected on behalf of the Puerto Rico Sales Tax Financing Corporation and the Commonwealth, of which 0.5% goes to a special fund for the benefit of the municipalities, and 1% collected by the municipalities). Act 72-2015 also provides for a transition to a value added tax (“VAT”) to substitute the central government’s portion of the SUT, subject to certain conditions. The SUT will be in effect until March 31, 2016, unless the Secretary of Treasury extends the effectiveness of the SUT for an additional 60 day period. In addition, from October 1, 2015 and until March 31, 2016: (i) business-to-business transactions that are currently taxable
69
are subject to an 11.5% SUT, (ii) certain business-to-business services and designated professional services that were previously exempt from SUT are subject to a Commonwealth SUT of 4% (but no municipal SUT will apply to these services), and (iii) specific services are exempt from SUT. After March 31, 2016 (or the extended sunset date provided for the SUT at the discretion of the Secretary of Treasury), all transactions subject to the SUT will be subject to a new VAT of 10.5% plus a 1% municipal SUT.
On the expense side, the measures have included a comprehensive reform of the principal pension system of the Commonwealth, which is severely underfunded and faces asset depletion in the near future, and the enactment of a fiscal emergency law that freezes benefits under collective bargaining agreements and formula appropriations to various governmental entities and other branches of the central government, among various expense control measures.
All of these measures, however, have been insufficient to address the current fiscal crisis and the Commonwealth has indicated that it will not have sufficient liquidity before the end of this fiscal year (ending on June 30, 2016) to meet all of its debt service obligations while continuing to provide essential services to the residents of Puerto Rico.
In response to the continued fiscal and economic challenges, the Government of Puerto Rico engaged a group of former IMF economists to analyze the Commonwealth’s economic and financial stability and growth prospects. The group’s final report, commonly known as the “Krueger Report,” was delivered to the Governor of Puerto Rico on June 28, 2015 and states that Puerto Rico faces an acute crisis in the face of faltering economic activity, fiscal solvency and debt sustainability, and institutional credibility. Some of the report’s principal conclusions are as follows: (i) the economic problems of Puerto Rico are structural, not cyclical, and are not going away without structural reforms, (ii) fiscal deficits are much larger than assumed and are set to deteriorate, (iii) the central government deficits (as measured in the report) over the coming years imply an unsustainable trajectory of large financing gaps, and (iv) Puerto Rico’s public debt cannot be made sustainable without growth, nor can growth occur in the face of structural obstacles and doubts about debt sustainability.
The report concludes that, even after factoring in a substantial fiscal effort, a large residual financing gap persists into the next decade, implying a need for debt relief. To close the financing gap, the government would need to seek relief from a significant but progressively declining proportion of principal and interest falling due during fiscal years 2016-2024. The report acknowledges that any debt restructuring would be challenging as there is no precedent of this scale and scope, but concludes that, from an economic perspective, the fact remains that the central government faces large financing gaps even with substantial adjustment efforts (as there are limits to how much expenditures can be cut or taxes raised).
On June 29, 2015, the Governor of Puerto Rico issued an Executive Order to create the Puerto Rico Fiscal and Economic Recovery Working Group (the “Working Group”). The Working Group was created to consider the measures necessary, including the measures recommended in the Krueger Report, to address the fiscal crisis of the Commonwealth and to develop and recommend to the Governor of Puerto Rico a fiscal and economic adjustment plan.
On September 9, 2015, the Working Group presented a draft of the Fiscal and Economic Growth Plan (the “FEGP”), which was subsequently updated on January 18, 2016. The FEGP projects that, absent further corrective action, the Commonwealth’s cumulative five-year financing gap for fiscal years 2016 to 2020 will be approximately $27.9 billion ($63.4 billion for the ten-year projection period), and that this financing gap could be reduced to approximately $16.1 billion ($23.9 billion for the ten-year projection period) through a combination of identified revenue increases and expense reduction measures and assuming a level of economic growth. With approximately $33 billion of debt service over the next ten years, the FEGP concludes that the Commonwealth will not have sufficient projected surplus to pay its scheduled debt service and that a debt restructuring is necessary to avoid a disorderly default and allow the Commonwealth to implement the structural reforms and growth initiatives identified in the FEGP. The FEGP also concludes that, unless economic growth can be achieved, the Commonwealth’s debt is not sustainable. The FEGP also states that without the emergency measures taken in fiscal year 2016, which have significantly increased the economic burden on taxpayers and third party suppliers, the Commonwealth would have already exhausted its liquidity and that, in any case, it will not have sufficient resources at the end of the fiscal year to meet its debt obligations. The FEGP does not include the debt of Puerto Rico’s municipalities. The FEGP contemplates, however, as part of the expense reduction measures, that the government will gradually reduce subsidies provided to the municipalities by the central government. The FEGP is publicly available in GDB’s website.
In January 2016, Government officials and advisors met with the advisors to the Commonwealth’s creditors to present the Commonwealth’s restructuring proposal, which was subsequently made public. The proposal seeks an orderly restructuring of the
70
Commonwealth’s direct debt and other tax-supported debt issued by certain public corporations, amounting to approximately $49.2 billion, in order to provide the Commonwealth the necessary debt relief to enable it to confront the significant projected shortfalls contemplated in the FEGP. The proposal contemplates an exchange of existing securities for two new classes of securities, a “base bond” with a fixed interest rate and amortization schedule and a “growth bond,” which would be payable if the Commonwealth’s revenues exceed certain levels. The proposal also contemplates no interest payments until fiscal year 2018 and no principal payments until fiscal year 2021. The proposal would have the following benefits for the Commonwealth, among others: (1) preservation of the ability to provide essential goods and services to the residents of Puerto Rico, (2) time and capital necessary to implement the FEGP’s structural reforms and “growth” initiatives, (3) financial flexibility to rebuild depleted cash resources and pay down suppliers whose payables are past due and taxpayers to whom refunds are owed, as well as making adequate pension contributions, and (4) achievement of a sustainable debt structure for the long term. The Commonwealth believes the proposal also offers creditor significant benefits, including improved liquidity and better collateral security for the restructured debt, as well as a structure to resolve potential inter-creditor disputes. There can be no assurance, however, that the Commonwealth will be able to successfully consummate its proposal or any other debt restructuring without some Federal restructuring authority, in particular given the large amount of targeted debt and extremely complex nature of these credits.
On October 21, 2015, the Obama Administration released a proposal to address Puerto Rico’s urgent fiscal crisis. The proposal states that Puerto Rico is in the midst of an economic and fiscal crisis that requires Congressional action and makes the following recommendations: (i) Congress should extend Chapter 9 of the U.S. Bankruptcy Code to Puerto Rico, and also provide a broader legal framework to allow for a comprehensive restructuring of Puerto Rico’s liabilities, (ii) Congress should provide independent fiscal oversight to ensure Puerto Rico adheres to its recovery plan and fully implements proposed reforms, (iii) Congress should provide a long-term solution to Puerto Rico’s historically inadequate Medicaid treatment, and (iv) Congress should extend to Puerto Rico certain proven measures to reward work and stimulate growth, such as the Earned Income Tax Credit. Since October 2015, the two houses of the United States Congress have held various hearings on Puerto Rico’s economy and debt, and various options to address Puerto Rico’s fiscal crisis are under consideration, including the establishment of a Federal fiscal control board and providing broad based restructuring activity.
The Commonwealth’s public corporations and instrumentalities are also facing financial challenges. On June 28, 2014, Governor Alejandro García Padilla signed into law the Puerto Rico Public Corporation Debt Enforcement and Recovery Act (the “Recovery Act”) which provides a framework for certain public corporations, including the Puerto Rico Electric Power Authority (“PREPA”), the Puerto Rico Aqueduct and Sewer Authority and the Puerto Rico Highways and Transportation Authority, to restructure their debt obligations in order to ensure that the services they provide to the public are not interrupted. Puerto Rico’s municipalities were not made eligible for the Recovery Act.
In July 2014, certain holders of PREPA bonds and an investment manager, on behalf of funds which hold PREPA bonds, filed separate lawsuits in the United States District Court for the District of Puerto Rico (the “District Court”) seeking a declaratory judgment that the Recovery Act violates several provisions of the United States Constitution. The District Court consolidated the actions. On February 6, 2015, the District Court issued an opinion and order declaring the Recovery Act unconstitutional and stating that it was preempted by the federal Bankruptcy Code. The District Court permanently enjoined the Commonwealth officers from enforcing the Recovery Act. The Commonwealth filed an expedited appeal before the United States Court of Appeals for the First Circuit and, on July 6, 2015, the Court of Appeals affirmed the lower court’s decision. The Commonwealth filed a petition for certiorari in the United States Supreme Court, which was granted on December 4, 2015. Oral arguments will be held on March 22, 2016.
On February 11, 2015, the Puerto Rico Resident Commissioner introduced a bill in the U.S. House of Representatives to permit the Government of Puerto Rico to authorize Puerto Rico municipalities and public corporations to restructure their debt obligations under Chapter 9 of the United States Bankruptcy Code. On July 15, 2015, Senator Richard Blumenthal filed a companion bill in the United States Senate. The Commonwealth and GDB have expressed their support for this amendment to the United States Bankruptcy Code. On February 26, 2015, public hearings were held to consider the bill. At this time it is unclear if the bill will be approved and, if it is approved, whether its effects will be retroactive or not.
In August 2014, as a result of PREPA’s inability to comply with certain scheduled debt payments, PREPA entered into forbearance agreements with certain bondholders, municipal bond insurers, and lenders (including BPPR) pursuant to which the forbearing creditors agreed to forbear from exercising certain rights and remedies under their applicable debt instruments. On November 5, 2015, PREPA announced that it had entered into a restructuring support agreement with certain creditors setting forth the economic terms of a recovery plan. Execution of the transactions set forth in the restructuring support agreement was subject to a number of
71
material conditions, including the enactment of legislation by January 22, 2016. When such condition was not met, the restructuring support agreement automatically terminated. On January 27, 2016, PREPA and certain creditors, including monoline bond insurers that were not party to the original restructuring support agreement, entered into a new restructuring support agreement, also subject to various material conditions, including the approval of legislation by February 16, 2016. With respect to PREPA’s credit facilities, the restructuring support agreement contemplates that the lenders, which hold approximately $700 million of matured debt, would convert their existing credit facilities into term loans to be repaid over six years in accordance with an amortization schedule. Although legislation was approved by the February 16, 2016 deadline, there can be no assurance, however, that the conditions to the restructuring support agreement will be met. At December 31, 2015, BPPR’s is a lender in PREPA’s syndicated credit facility and BPPR’s exposure was $42.3 million, as shown in Note 30 to the consolidated financial statements.
The lingering effects of the prolonged recession are still reflected in limited loan demand, an increase in the rate of foreclosures and delinquencies on mortgage loans granted in Puerto Rico. If global or local economic conditions worsen or the Government of Puerto Rico is unable to manage its fiscal crisis, including consummating an orderly restructuring of its debt obligations while continuing to provide essential services, those adverse effects could continue or worsen in ways that we are not able to predict. Any reduction in consumer spending as a result of these issues may also adversely impact our interest and non-interest revenues.
At December 31, 2015, the Corporation’s direct exposure to the Puerto Rico government and its instrumentalities and municipalities amounted to $ 669 million, of which approximately $ 578 million is outstanding. Of the amount outstanding, $ 502 million consists of loans and $ 76 million are securities. Of this amount, $ 76 million represents obligations from the Government of Puerto Rico and public corporations that are either collateralized loans or obligations that have a specific source of income or revenues identified for their repayment. Some of these obligations consist of senior and subordinated loans to public corporations that obtain revenues from rates charged for services or products, such as public utilities. Public corporations have varying degrees of independence from the central Government and many receive appropriations or other payments from it. The remaining $ 502 million represents obligations from various municipalities in Puerto Rico for which, in most cases, the good faith, credit and unlimited taxing power of the applicable municipality has been pledged to their repayment. These municipalities are required by law to levy special property taxes in such amounts as shall be required for the payment of all of its general obligation bonds and loans. These loans have seniority to the payment of operating cost and expenses of the municipality. If the Government of Puerto Rico and its instrumentalities are unable to manage their fiscal crisis and refinance their debt in an orderly manner, there could be further downgrades of the ratings of these obligations and the value of these obligations could be adversely affected, resulting in losses to us. Refer to Note 30 to the consolidated financial statements for information regarding the maturities of the loans outstanding.
In addition, at December 31, 2015, the Corporation had $394 million in indirect exposure to loans or securities that are payable by non-governmental entities, but which carry a government guarantee to cover any shortfall in collateral in the event of borrower default. These included $316 million in residential mortgage loans that are guaranteed by the Puerto Rico Housing Finance Authority. These mortgage loans are secured by the underlying properties and the guarantees serve to cover shortfalls in collateral in the event of a borrower default. Also, the Corporation had $50 million in Puerto Rico pass-through housing bonds backed by FNMA, GNMA or residential loans CMO’s, and $28 million of industrial development notes.
As further detailed in Notes 10 and 11 to the consolidated financial statements, a substantial portion of the Corporation’s investment securities represented exposure to the U.S. Government in the form of U.S. Government sponsored entities, as well as agency mortgage-backed and U.S. Treasury securities. In addition, $876 million of residential mortgages and $106 million in commercial loans were insured or guaranteed by the U.S. Government or its agencies at December 31, 2015. The Corporation does not have any exposure to European sovereign debt.
Non-Performing Assets
Non-performing assets include primarily past-due loans that are no longer accruing interest, including renegotiated loans, and real estate property acquired through foreclosure. A summary, including certain credit quality metrics, is presented in Table 27.
The Corporation’s non-accruing and charge-off policies by major categories of loan portfolios are as follows:
| | • | | Commercial and construction loans - recognition of interest income on commercial and construction loans is discontinued when the loans are 90 days or more in arrears on payments of principal or interest or when other factors indicate that the collection of principal and interest is doubtful. The impaired portions of secured loans past due as to principal and interest is charged-off not later than 365 days past due. However, in the case of collateral dependent loans individually evaluated |
72
| | for impairment, the excess of the recorded investment over the fair value of the collateral (portion deemed uncollectible) is generally promptly charged-off, but in any event, not later than the quarter following the quarter in which such excess was first recognized. Commercial unsecured loans are charged-off no later than 180 days past due. Overdrafts are generally charged-off no later than 60 days past their due date. |
| | • | | Lease financing - recognition of interest income for lease financing is ceased when loans are 90 days or more in arrears. Leases are charged-off when they are 120 days in arrears. |
| | • | | Mortgage loans - recognition of interest income on mortgage loans is generally discontinued when loans are 90 days or more in arrears on payments of principal or interest. The impaired portion of a mortgage loan is charged-off when the loan is 180 days past due. The Corporation discontinues the recognition of interest income on residential mortgage loans insured by the Federal Housing Administration (“FHA”) or guaranteed by the U.S. Department of Veterans Affairs (“VA”) when 15 months delinquent as to principal or interest. The principal repayment on these loans is insured. |
| | • | | Consumer loans - recognition of interest income on closed-end consumer loans and home-equity lines of credit is discontinued when the loans are 90 days or more in arrears on payments of principal or interest. Income is generally recognized on open-end consumer loans, except for home equity lines of credit, until the loans are charged-off. Closed-end consumer loans are charged-off when they are 120 days in arrears. Open-end consumer loans are charged-off when they are 180 days in arrears. Overdrafts are generally charged-off no later than 60 days past their due date. |
| | • | | Troubled debt restructurings (“TDRs”) - loans classified as TDRs are typically in non-accrual status at the time of the modification. The TDR loan continues in non-accrual status until the borrower has demonstrated a willingness and ability to make the restructured loan payments (generally at least six months of sustained performance after the modification (or one year for loans providing for quarterly or semi-annual payments)) and management has concluded that it is probable that the borrower would not be in payment default in the foreseeable future. |
| | • | | Loans accounted for under ASC Subtopic 310-30 by the Corporation, are not considered non-performing and will continue to have an accretable yield as long as there is a reasonable expectation about the timing and amount of cash flows expected to be collected. |
| | • | | Loans acquired in the Westernbank FDIC-assisted transaction, except for revolving lines of credit, are accounted for by the Corporation in accordance with ASC Subtopic 310-30. Under ASC Subtopic 310-30, the acquired loans were aggregated into pools based on similar characteristics. Each loan pool is accounted for as a single asset with a single composite interest rate and an aggregate expectation of cash flows. The loans, which are accounted for under ASC Subtopic 310-30 by the Corporation, are not considered non-performing and will continue to have an accretable yield as long as there is a reasonable expectation about the timing and amount of cash flows expected to be collected. Also, loans charged-off against the non-accretable difference established in purchase accounting are not reported as charge-offs. Charge-offs will be recorded only to the extent that losses exceed the purchase accounting estimates. |
On June 30, 2015, the shared-loss arrangement under the commercial loss share agreement with the FDIC related to the loans acquired from Westernbank as part of the FDIC assisted transaction in 2010 expired. Accordingly, loans and OREO’s with balances of $1.5 billion in loans and $18 million, respectively, as of June 30, 2015, were reclassified as “non-covered” in the accompanying statement of financial condition, because they are no longer subject to the shared-loss payments by the FDIC. However, included in these balances were approximately $248.7 million of loans that are subject to the resolution of several arbitration proceedings currently ongoing with the FDIC. Loans and OREO’s that remain covered under the terms of the single-family loss share agreement continue to be presented as covered assets in the accompanying tables and credit metrics as of December 31, 2015.
Because of the application of ASC Subtopic 310-30 to the Westernbank acquired loans and the loss protection provided by the FDIC which limits the risks on the covered loans, the Corporation has determined to provide certain quality metrics in this MD&A that exclude such covered loans to facilitate the comparison between loan portfolios and across periods. Given the amount of covered loans that are past due but still accruing due to the accounting under ASC Subtopic 310-30, the Corporation believes the inclusion of these loans in certain asset quality ratios in the numerator or denominator (or both) would result in a distortion to these ratios. In addition, because charge-offs related to the acquired loans are recorded against the non-accretable balance, the net charge-off ratio including the acquired loans is lower for the single-family loan portfolios that which includes covered loans. The inclusion of these loans in the asset quality ratios could result in a lack of comparability across periods, and could negatively impact comparability with other portfolios that were not impacted by acquisition accounting. The Corporation believes that the presentation of asset quality measures, excluding covered loans and related amounts from both the numerator and denominator, provides a better perspective into underlying trends related to the quality of its loan portfolio.
73
Total non-performing assets, including non-performing covered assets, were $843 million at December 31, 2015, decreasing by approximately $90 million, or 10%, from December 31, 2014, of which $74 million were related to OREOs as a result of aggressive disposition strategies, including a bulk sale of covered OREO’s with a book value of $37 million during the second quarter of 2015. Non-covered non-performing loans held-in-portfolio decreased by $29 million when compared to December 31, 2014, mostly driven by lower commercial non-performing loans in the BPPR segment. Despite challenging economic and fiscal conditions in the Puerto Rico market, credit metrics remained stable. These stable trends were the result of aggressive loss mitigation efforts, resolutions, restructurings, and non-performing loans sales, which have improved the risk profile of the loan portfolios.
At December 31, 2015, non-performing loans secured by real estate held-in-portfolio, excluding covered loans, amounted to $504 million in the Puerto Rico operations and $22 million in the U.S. mainland operations. These figures compare to $482 million in the Puerto Rico operations and $35 million in the U.S. mainland operations at December 31, 2014. In addition to the non-performing loans included in Table 27, at December 31, 2015, there were $160 million of non-covered performing loans, mostly commercial loans, which in management’s opinion, are currently subject to potential future classification as non-performing and are considered impaired, compared with $146 million at December 31, 2014.
Table 27 - Non-Performing Assets
| | | | | | | | | | | | | | | | | | | | |
| | | At December 31, | |
(Dollars in thousands) | | 2015 | | | 2014 | | | 2013 | | | 2012 | | | 2011 | |
Non-accrual loans: | | | | | | | | | | | | | | | | | | | | |
Commercial | | $ | 181,816 | | | $ | 260,225 | | | $ | 279,053 | | | $ | 665,289 | | | $ | 830,092 | |
Construction | | | 3,550 | | | | 13,812 | | | | 23,771 | | | | 43,350 | | | | 96,286 | |
Legacy[1] | | | 3,649 | | | | 1,545 | | | | 15,050 | | | | 40,741 | | | | 75,660 | |
Leasing | | | 3,009 | | | | 3,102 | | | | 3,495 | | | | 4,865 | | | | 5,642 | |
Mortgage | | | 351,471 | | | | 304,913 | | | | 232,681 | | | | 630,130 | | | | 686,502 | |
Consumer | | | 58,304 | | | | 46,886 | | | | 43,898 | | | | 40,758 | | | | 43,668 | |
| | | | | | | | | | | | | | | | | | | | |
Total non-performing loans held-in-portfolio, excluding covered loans | | | 601,799 | | | | 630,483 | | | | 597,948 | | | | 1,425,133 | | | | 1,737,850 | |
Non-performing loans held-for-sale[2] | | | 45,169 | | | | 18,899 | | | | 1,092 | | | | 96,320 | | | | 262,302 | |
Other real estate owned (“OREO”), excluding covered OREO | | | 155,231 | | | | 135,500 | | | | 135,501 | | | | 266,844 | | | | 172,497 | |
| | | | | | | | | | | | | | | | | | | | |
Total non-performing assets, excluding covered assets | | $ | 802,199 | | | $ | 784,882 | | | $ | 734,541 | | | $ | 1,788,297 | | | $ | 2,172,649 | |
Covered loans and OREO[3] | | | 40,571 | | | | 148,099 | | | | 197,388 | | | | 213,483 | | | | 201,348 | |
| | | | | | | | | | | | | | | | | | | | |
Total non-performing assets | | $ | 842,770 | | | $ | 932,981 | | | $ | 931,929 | | | $ | 2,001,780 | | | $ | 2,373,997 | |
| | | | | | | | | | | | | | | | | | | | |
Accruing loans past-due 90 days or more[4] [5] | | $ | 446,725 | | | $ | 447,990 | | | $ | 418,028 | | | $ | 388,712 | | | $ | 316,614 | |
| | | | | | | | | | | | | | | | | | | | |
Excluding covered loans:[6] | | | | | | | | | | | | | | | | | | | | |
Non-performing loans to loans held-in-portfolio | | | 2.69 | % | | | 3.25 | % | | | 2.77 | % | | | 6.79 | % | | | 8.44 | % |
| | | | | | | | | | | | | | | | | | | | |
Including covered loans: | | | | | | | | | | | | | | | | | | | | |
Non-performing loans to loans held-in-portfolio | | | 2.63 | | | | 2.95 | | | | 2.55 | | | | 6.06 | | | | 7.33 | |
Interest lost | | $ | 27,644 | | | $ | 23,413 | | | $ | 29,766 | | | $ | 86,442 | | | $ | 103,390 | |
| | | | | | | | | | | | | | | | | | | | |
| [1] | The legacy portfolio is comprised of commercial loans, construction loans and lease financings related to certain lending products exited by the Corporation as part of restructuring efforts carried out in prior years at the BPNA reportable segment. |
| [2] | Non-performing loans held-for-sale consist of $45 million in commercial loans and $95 thousand in construction loans at December 31, 2015 (December 31, 2014 - $14.0 million in mortgage loans, $309 thousand in commercial loans and $4.5 million in consumer loans). |
| [3] | The amount consists of $4 million in non-performing loans accounted for under ASC Subtopic 310-20 and $37 million in covered OREO at December 31, 2015 (December 31, 2014 - $18 million and $130 million, respectively). It excludes covered loans accounted for under ASC Subtopic 310-30 as they are considered to be performing due to the application of the accretion method, in which these loans will accrete interest income over the remaining life of the loans using estimated cash flow analyses. |
| [4] | The carrying value of covered loans accounted for under ASC Subtopic 310-30 that are contractually 90 days or more past due was $81 million at December 31, 2015 (December 31, 2014 - $0.5 billion). This amount is excluded from the above table as the covered loans’ accretable yield interest recognition is independent from the underlying contractual loan delinquency status. |
| [5] | It is the Corporation’s policy to report delinquent residential mortgage loans insured by FHA or guaranteed by the VA as accruing loans past due 90 days or more as opposed to non-performing since the principal repayment is insured. These balances include $164 million and $125 million, |
74
| | respectively, of residential mortgage loans insured by FHA or guaranteed by the VA that are no longer accruing interest as of December 31, 2015 and December 31, 2014. Furthermore, the Corporation has approximately $70 million in reverse mortgage loans which are guaranteed by FHA, but which are currently not accruing interest. Due to the guaranteed nature of the loans, it is the Corporation’s policy to exclude these balances from non-performing assets (December 31, 2013 - $66 million). |
| [6] | These asset quality ratios have been adjusted to remove the impact of covered loans. Appropriate adjustments to the numerator and denominator have been reflected in the calculation of these ratios. Management believes the inclusion of acquired loans in certain asset quality ratios that include non-performing assets, past due loans or net charge-offs in the numerator and denominator results in distortions of these ratios and they may not be comparable to other periods presented or to other portfolios that were not impacted by purchase accounting. |
Another key measure used to evaluate and monitor the Corporation’s asset quality is loan delinquencies. Loans delinquent 30 days or more and delinquencies, as a percentage of their related portfolio category at December 31, 2015 and 2014, are presented below.
Table 28 - Loan Delinquencies
| | | | | | | | |
(Dollars in millions) | | 2015 | | | 2014 | |
Loans delinquent 30 days or more | | $ | 2,360 | | | $ | 2,524 | |
| | | | | | | | |
Total delinquencies as a percentage of total loans: | | | | | | | | |
Commercial | | | 5.63 | % | | | 3.91 | % |
Construction | | | 2.09 | | | | 6.80 | |
Legacy | | | 8.49 | | | | 5.45 | |
Lease financing | | | 1.99 | | | | 1.97 | |
Mortgage | | | 20.00 | | | | 19.99 | |
Consumer | | | 4.46 | | | | 4.27 | |
Covered loans | | | 20.76 | | | | 27.02 | |
Loans held-for-sale | | | 33.64 | | | | 20.11 | |
| | | | | | | | |
Total | | | 10.20 | % | | | 11.45 | % |
| | | | | | | | |
Accruing loans past due 90 days or more are composed primarily of credit cards, residential mortgage loans insured by FHA / VA, and delinquent mortgage loans included in the Corporation’s financial statements pursuant to GNMA’s buy-back option program. Servicers of loans underlying GNMA mortgage-backed securities must report as their own assets the defaulted loans that they have the option to purchase, even when they elect not to exercise that option. Also, accruing loans past due 90 days or more include residential conventional loans purchased from other financial institutions that, although delinquent, the Corporation has received timely payment from the sellers / servicers, and, in some instances, have partial guarantees under recourse agreements.
Refer to Table 31 for a summary of the activity in the allowance for loan losses and selected loan losses statistics for the past 5 years.
75
Table 29 - Activity in Non-Performing Loans Held-in-Portfolio (Excluding Consumer and Covered Loans)
| | | | | | | | | | | | |
| | | For the year ended December 31, 2015 | |
(Dollars in thousands) | | BPPR | | | BPNA | | | Popular, Inc. | |
Beginning balance | | $ | 567,351 | | | $ | 13,144 | | | $ | 580,495 | |
Plus: | | | | | | | | | | | | |
New non-performing loans | | | 526,084 | | | | 60,488 | | | | 586,572 | |
Advances on existing non-performing loans | | | — | | | | 534 | | | | 534 | |
Reclassification from covered loans | | | 8,075 | | | | — | | | | 8,075 | |
Less: | | | | | | | | | | | | |
Non-performing loans transferred to OREO | | | (36,794 | ) | | | (766 | ) | | | (37,560 | ) |
Non-performing loans charged-off | | | (159,249 | ) | | | (3,991 | ) | | | (163,240 | ) |
Loans returned to accrual status / loan collections | | | (319,741 | ) | | | (42,103 | ) | | | (361,844 | ) |
Loans transferred to held-for-sale | | | (44,996 | ) | | | 1,565 | | | | (43,431 | ) |
Non-performing loans sold | | | (21,345 | ) | | | — | | | | (21,345 | ) |
Other transfers out of non-performing | | | — | | | | (7,770 | ) | | | (7,770 | ) |
| | | | | | | | | | | | |
Ending balance NPLs | | $ | 519,385 | | | $ | 21,101 | | | $ | 540,486 | |
| | | | | | | | | | | | |
Table 30 - Activity in Non-Performing Loans Held-in-Portfolio (Excluding Consumer and Covered Loans)
| | | | | | | | | | | | |
| | | For the year ended December 31, 2014 | |
(Dollars in thousands) | | BPPR | | | BPNA | | | Popular, Inc. | |
Beginning balance | | $ | 410,594 | | | $ | 139,961 | | | $ | 550,555 | |
Plus: | | | | | | | | | | | | |
New non-performing loans | | | 643,216 | | | | 56,230 | | | | 699,446 | |
Advances on existing non-performing loans | | | — | | | | 1,257 | | | | 1,257 | |
Less: | | | | | | | | | | | | |
Non-performing loans transferred to OREO | | | (21,290 | ) | | | (2,915 | ) | | | (24,205 | ) |
Non-performing loans charged-off | | | (89,138 | ) | | | (22,207 | ) | | | (111,345 | ) |
Loans returned to accrual status / loan collections | | | (369,275 | ) | | | (62,774 | ) | | | (432,049 | ) |
Loans transferred to held-for-sale | | | — | | | | (96,180 | ) | | | (96,180 | ) |
Non-performing loans transferred from (to) discontinued operations | | | — | | | | (228 | ) | | | (228 | ) |
Non-performing mortgage loans reclassified to non-performing consumer loans | | | (6,756 | ) | | | — | | | | (6,756 | ) |
| | | | | | | | | | | | |
Ending balance NPLs | | $ | 567,351 | | | $ | 13,144 | | | $ | 580,495 | |
| | | | | | | | | | | | |
76
Table 31 - Allowance for Loan Losses and Selected Loan Losses Statistics
| | | | | | | | | | | | | | | | | | | | | | | | | | | | | | | | | | | | |
| | | 2015 | | | 2014 | | | 2013 | |
(Dollars in thousands) | | Non-covered
loans | | | Covered
loans | | | Total | | | Non-covered
loans [4] | | | Covered
loans | | | Total [4] | | | Non-covered
loans [4] | | | Covered
loans | | | Total [4] | |
Balance at the beginning of year | | $ | 519,719 | | | $ | 82,073 | | | $ | 601,792 | | | $ | 538,463 | | | $ | 102,092 | | | $ | 640,555 | | | $ | 621,701 | | | $ | 108,906 | | | $ | 730,607 | |
| | | | | | | | | |
Provision for loan losses- Continuing operations | | | 217,458 | | | | 24,020 | | | | 241,478 | | | | 223,999 | | | | 46,135 | | | | 270,134 | | | | 536,710 | | | | 69,396 | | | | 606,106 | |
| | | | | | | | | |
Provision for loan losses (reversal of provision) - Discontinued operations | | | — | | | | — | | | | — | | | | (6,764 | ) | | | — | | | | (6,764 | ) | | | (3,543 | ) | | | — | | | | (3,543 | ) |
| | | | | | | | | | | | | | | | | | | | | | | | | | | | | | | | | | | | |
| | | 737,177 | | | | 106,093 | | | | 843,270 | | | | 755,698 | | | | 148,227 | | | | 903,925 | | | | 1,154,868 | | | | 178,302 | | | | 1,333,170 | |
| | | | | | | | | | | | | | | | | | | | | | | | | | | | | | | | | | | | |
Charged-offs: | | | | | | | | | | | | | | | | | | | | | | | | | | | | | | | | | | | | |
Commercial | | | 107,168 | | | | 37,936 | | | | 145,104 | | | | 87,030 | | | | 34,741 | | | | 121,771 | | | | 138,383 | | | | 28,423 | | | | 166,806 | |
Construction | | | 13,628 | | | | 25,086 | | | | 38,714 | | | | 1,722 | | | | 36,223 | | | | 37,945 | | | | 6,757 | | | | 39,729 | | | | 46,486 | |
Legacy [1] | | | 2,019 | | | | — | | | | 2,019 | | | | 8,071 | | | | — | | | | 8,071 | | | | 17,423 | | | | — | | | | 17,423 | |
Leasing | | | 5,561 | | | | — | | | | 5,561 | | | | 6,028 | | | | — | | | | 6,028 | | | | 6,034 | | | | — | | | | 6,034 | |
Mortgage | | | 54,966 | | | | 6,158 | | | | 61,124 | | | | 48,906 | | | | 9,156 | | | | 58,062 | | | | 59,573 | | | | 10,679 | | | | 70,252 | |
Consumer | | | 119,891 | | | | 853 | | | | 120,744 | | | | 138,348 | | | | (2,589 | ) | | | 135,759 | | | | 135,238 | | | | 3,952 | | | | 139,190 | |
| | | | | | | | | |
Discontinued operations | | | — | | | | — | | | | — | | | | 4,452 | | | | — | | | | 4,452 | | | | 38,957 | | | | — | | | | 38,957 | |
| | | | | | | | | | | | | | | | | | | | | | | | | | | | | | | | | | | | |
| | | 303,233 | | | | 70,033 | | | | 373,266 | | | | 294,557 | | | | 77,531 | | | | 372,088 | | | | 402,365 | | | | 82,783 | | | | 485,148 | |
| | | | | | | | | | | | | | | | | | | | | | | | | | | | | | | | | | | | |
Recoveries: | | | | | | | | | | | | | | | | | | | | | | | | | | | | | | | | | | | | |
Commercial | | | 37,120 | | | | 6,504 | | | | 43,624 | | | | 46,543 | | | | 1,835 | | | | 48,378 | | | | 43,598 | | | | 816 | | | | 44,414 | |
Construction | | | 14,514 | | | | 4,700 | | | | 19,214 | | | | 5,468 | | | | 8,537 | | | | 14,005 | | | | 15,399 | | | | 5,621 | | | | 21,020 | |
Legacy [1] | | | 4,779 | | | | — | | | | 4,779 | | | | 17,141 | | | | — | | | | 17,141 | | | | 21,320 | | | | — | | | | 21,320 | |
Leasing | | | 2,258 | | | | — | | | | 2,258 | | | | 2,067 | | | | — | | | | 2,067 | | | | 2,528 | | | | — | | | | 2,528 | |
Mortgage | | | 2,696 | | | | 930 | | | | 3,626 | | | | 3,710 | | | | 714 | | | | 4,424 | | | | 4,034 | | | | 65 | | | | 4,099 | |
Consumer | | | 30,366 | | | | 842 | | | | 31,208 | | | | 29,528 | | | | 291 | | | | 29,819 | | | | 41,674 | | | | 71 | | | | 41,745 | |
| | | | | | | | | |
Discontinued operations | | | — | | | | — | | | | — | | | | 9,997 | | | | — | | | | 9,997 | | | | 20,052 | | | | — | | | | 20,052 | |
| | | | | | | | | | | | | | | | | | | | | | | | | | | | | | | | | | | | |
| | | 91,733 | | | | 12,976 | | | | 104,709 | | | | 114,454 | | | | 11,377 | | | | 125,831 | | | | 148,605 | | | | 6,573 | | | | 155,178 | |
| | | | | | | | | | | | | | | | | | | | | | | | | | | | | | | | | | | | |
Net loans charged-offs (recoveries): | | | | | | | | | | | | | | | | | | | | | | | | | | | | | | | | | | | | |
Commercial | | | 70,048 | | | | 31,432 | | | | 101,480 | | | | 40,487 | | | | 32,906 | | | | 73,393 | | | | 94,785 | | | | 27,607 | | | | 122,392 | |
Construction | | | (886 | ) | | | 20,386 | | | | 19,500 | | | | (3,746 | ) | | | 27,686 | | | | 23,940 | | | | (8,642 | ) | | | 34,108 | | | | 25,466 | |
Legacy [1] | | | (2,760 | ) | | | — | | | | (2,760 | ) | | | (9,070 | ) | | | — | | | | (9,070 | ) | | | (3,897 | ) | | | — | | | | (3,897 | ) |
Leasing | | | 3,303 | | | | — | | | | 3,303 | | | | 3,961 | | | | — | | | | 3,961 | | | | 3,506 | | | | — | | | | 3,506 | |
Mortgage | | | 52,270 | | | | 5,228 | | | | 57,498 | | | | 45,196 | | | | 8,442 | | | | 53,638 | | | | 55,539 | | | | 10,614 | | | | 66,153 | |
Consumer | | | 89,525 | | | | 11 | | | | 89,536 | | | | 108,820 | | | | (2,880 | ) | | | 105,940 | | | | 93,564 | | | | 3,881 | | | | 97,445 | |
| | | | | | | | | |
Discontinued operations | | | — | | | | — | | | | — | | | | (5,545 | ) | | | — | | | | (5,545 | ) | | | 18,905 | | | | — | | | | 18,905 | |
| | | | | | | | | | | | | | | | | | | | | | | | | | | | | | | | | | | | |
| | | 211,500 | | | | 57,057 | | | | 268,557 | | | | 180,103 | | | | 66,154 | | | | 246,257 | | | | 253,760 | | | | 76,210 | | | | 329,970 | |
| | | | | | | | | | | | | | | | | | | | | | | | | | | | | | | | | | | | |
Net write-downs [2] | | | (35,779 | ) | | | (1,823 | ) | | | (37,602 | ) | | | (35,674 | ) | | | — | | | | (35,674 | ) | | | (362,645 | ) | | | — | | | | (362,645 | ) |
| | | | | | | | | | | | | | | | | | | | | | | | | | | | | | | | | | | | |
Balance transferred from covered to non-covered loans | | | 13,037 | | | | (13,037 | ) | | | — | | | | — | | | | — | | | | — | | | | — | | | | — | | | | — | |
| | | | | | | | | | | | | | | | | | | | | | | | | | | | | | | | | | | | |
| | | | | | | | | |
Net write-downs related to loans transferred to discontinued operations | | | — | | | | — | | | | — | | | | (20,202 | ) | | | — | | | | (20,202 | ) | | | — | | | | — | | | | — | |
| | | | | | | | | | | | | | | | | | | | | | | | | | | | | | | | | | | | |
| | | | | | | | | |
Balance at end of year | | $ | 502,935 | | | $ | 34,176 | | | $ | 537,111 | | | $ | 519,719 | | | $ | 82,073 | | | $ | 601,792 | | | $ | 538,463 | | | $ | 102,092 | | | $ | 640,555 | |
| | | | | | | | | | | | | | | | | | | | | | | | | | | | | | | | | | | | |
Loans held-in-portfolio: | | | | | | | | | | | | | | | | | | | | | | | | | | | | | | | | | | | | |
Outstanding at year end | | $ | 22,346,115 | | | | | | | $ | 22,992,230 | | | $ | 19,404,451 | | | | | | | $ | 21,947,113 | | | $ | 21,611,866 | | | | | | | $ | 24,596,293 | |
Average | | | 21,497,403 | | | | | | | | 22,925,237 | | | | 19,990,182 | | | | | | | | 22,760,961 | | | | 21,354,143 | | | | | | | | 24,581,862 | |
Ratios: | | | | | | | | | | | | | | | | | | | | | | | | | | | | | | | | | | | | |
Allowance for loan losses to loans held-in-portfolio | | | 2.25 | % | | | | | | | 2.34 | % | | | 2.68 | % | | | | | | | 2.74 | % | | | 2.49 | % | | | | | | | 2.60 | % |
| | | | | | | | | |
Recoveries to charge-offs | | | 30.25 | | | | | | | | 28.05 | | | | 38.86 | | | | | | | | 33.82 | | | | 36.93 | | | | | | | | 31.99 | |
Net charge-offs to average loans held-in-portfolio | | | 0.98 | | | | | | | | 1.17 | | | | 0.90 | | | | | | | | 1.08 | | | | 1.19 | | | | | | | | 1.34 | |
| | | | | | | | | |
Allowance for loans losses to net charge-offs | | | 2.38 x | | | | | | | | 2.00 x | | | | 2.89 x | | | | | | | | 2.44 x | | | | 2.12 x | | | | | | | | 1.94 x | |
| | | | | | | | | |
Provision for loan losses to: | | | | | | | | | | | | | | | | | | | | | | | | | | | | | | | | | | | | |
Net charge-offs [3] | | | 1.03 | | | | | | | | 0.90 | | | | 1.17 | | | | | | | | 1.04 | | | | 0.85 | | | | | | | | 0.86 | |
Average loans held-in-portfolio | | | 1.01 | % | | | | | | | 1.05 | % | | | 1.05 | % | | | | | | | 1.13 | % | | | 2.50 | % | | | | | | | 2.45 | % |
| | | | | | | | | |
Allowance to non performing loans held-in-portfolio | | | 83.57 | | | | | | | | 88.68 | | | | 82.43 | | | | | | | | 92.82 | | | | 90.05 | | | | | | | | 103.78 | |
| [1] | The legacy portfolio is comprised of commercial loans, construction loans and lease financings related to certain lending products exited by the Corporation as part of restructuring efforts carried out in prior years at the BPNA segment. |
| [2] | Net write-downs are related to loans sold or transferred to held-for-sale. |
| [3] | Excluding the provision for loans losses and net write-down related to loans sold or reclassified to held-for-sale. |
| [4] | Prior periods provision for loan losses and net charge-offs presented in this table has been retrospectively adjusted for the impact of the discontinued operations for comparative purposes. Loans (ending and average) balances and credit quality ratios for prior periods included in this table has not been retrospectively adjusted for the impact of the discontinued operations. |
77
Table 31(continued) - Allowance for Loan Losses and Selected Loan Losses Statistics
| | | | | | | | | | | | | | | | | | | | | | | | |
| | | 2012 | | | 2011 | |
(Dollars in thousands) | | Non-covered
loans [4] | | | Covered
loans | | | Total [4] | | | Non-covered
loans [4] | | | Covered
loans | | | Total [4] | |
Balance at the beginning of year | | $ | 690,363 | | | $ | 124,945 | | | $ | 815,308 | | | $ | 793,225 | | | $ | — | | | $ | 793,225 | |
Provision for loan losses - Continuing operations | | | 322,240 | | | | 74,839 | | | | 397,079 | | | | 395,937 | | | | 145,635 | | | | 541,572 | |
Provision for loan losses - Discontinued operations | | | 11,862 | | | | — | | | | 11,862 | | | | 34,148 | | | | — | | | | 34,148 | |
| | | | | | | | | | | | | | | | | | | | | | | | |
| | | 1,024,465 | | | | 199,784 | | | | 1,224,249 | | | | 1,223,310 | | | | 145,635 | | | | 1,368,945 | |
| | | | | | | | | | | | | | | | | | | | | | | | |
Commercial | | | 209,935 | | | | 46,290 | | | | 256,225 | | | | 257,027 | | | | 13,774 | | | | 270,801 | |
Construction | | | 3,936 | | | | 30,556 | | | | 34,492 | | | | 18,921 | | | | 4,353 | | | | 23,274 | |
Legacy [1] | | | 31,113 | | | | — | | | | 31,113 | | | | 71,466 | | | | — | | | | 71,466 | |
Leasing | | | 4,680 | | | | — | | | | 4,680 | | | | 6,527 | | | | — | | | | 6,527 | |
Mortgage | | | 75,994 | | | | 5,909 | | | | 81,903 | | | | 45,785 | | | | 826 | | | | 46,611 | |
Consumer | | | 156,694 | | | | 8,225 | | | | 164,919 | | | | 189,864 | | | | 3,253 | | | | 193,117 | |
Discontinued operations | | | 57,140 | | | | — | | | | 57,140 | | | | 81,915 | | | | — | | | | 81,915 | |
| | | | | | | | | | | | | | | | | | | | | | | | |
| | | 539,492 | | | | 90,980 | | | | 630,472 | | | | 671,505 | | | | 22,206 | | | | 693,711 | |
| | | | | | | | | | | | | | | | | | | | | | | | |
Recoveries: | | | | | | | | | | | | | | | | | | | | | | | | |
Commercial | | | 51,285 | | | | 31 | | | | 51,316 | | | | 41,836 | | | | — | | | | 41,836 | |
Construction | | | 7,411 | | | | 61 | | | | 7,472 | | | | 9,924 | | | | 1,500 | | | | 11,424 | |
Legacy [1] | | | 16,260 | | | | — | | | | 16,260 | | | | 21,313 | | | | — | | | | 21,313 | |
Leasing | | | 3,737 | | | | — | | | | 3,737 | | | | 3,083 | | | | — | | | | 3,083 | |
Mortgage | | | 4,054 | | | | — | | | | 4,054 | | | | 3,974 | | | | 15 | | | | 3,989 | |
Consumer | | | 35,022 | | | | 10 | | | | 35,032 | | | | 40,243 | | | | 1 | | | | 40,244 | |
Discontinued operations | | | 18,993 | | | | — | | | | 18,993 | | | | 17,084 | | | | — | | | | 17,084 | |
| | | | | | | | | | | | | | | | | | | | | | | | |
| | | 136,762 | | | | 102 | | | | 136,864 | | | | 137,457 | | | | 1,516 | | | | 138,973 | |
| | | | | | | | | | | | | | | | | | | | | | | | |
Net loans charged-offs (recoveries): | | | | | | | | | | | | | | | | | | | | | | | | |
Commercial | | | 158,650 | | | | 46,259 | | | | 204,909 | | | | 215,191 | | | | 13,774 | | | | 228,965 | |
Construction | | | (3,475 | ) | | | 30,495 | | | | 27,020 | | | | 8,997 | | | | 2,853 | | | | 11,850 | |
Legacy [1] | | | 14,853 | | | | — | | | | 14,853 | | | | 50,153 | | | | — | | | | 50,153 | |
Leasing | | | 943 | | | | — | | | | 943 | | | | 3,444 | | | | — | | | | 3,444 | |
Mortgage | | | 71,940 | | | | 5,909 | | | | 77,849 | | | | 41,811 | | | | 811 | | | | 42,622 | |
Consumer | | | 121,672 | | | | 8,215 | | | | 129,887 | | | | 149,621 | | | | 3,252 | | | | 152,873 | |
Discontinued operations | | | 38,147 | | | | — | | | | 38,147 | | | | 64,831 | | | | — | | | | 64,831 | |
| | | | | | | | | | | | | | | | | | | | | | | | |
| | | 402,730 | | | | 90,878 | | | | 493,608 | | | | 534,048 | | | | 20,690 | | | | 554,738 | |
| | | | | | | | | | | | | | | | | | | | | | | | |
Net write-downs [2] | | | (34 | ) | | | — | | | | (34 | ) | | | 1,101 | | | | — | | | | 1,101 | |
| | | | | | | | | | | | | | | | | | | | | | | | |
Balance at end of year | | $ | 621,701$ | | | $ | 108,906 | | | $ | 730,607 | | | $ | 690,363 | | | $ | 124,945 | | | $ | 815,308 | |
| | | | | | | | | | | | | | | | | | | | | | | | |
Loans held-in-portfolio: | | | | | | | | | | | | | | | | | | | | | | | | |
Outstanding at year end | | $ | 20,983,192 | | | | | | | $ | 24,739,164 | | | $ | 20,602,596 | | | | | | | $ | 24,951,299 | |
Average | | | 20,477,264 | | | | | | | | 24,527,602 | | | | 20,496,966 | | | | | | | | 25,110,328 | |
Ratios: | | | | | | | | | | | | | | | | | | | | | | | | |
Allowance for loan losses to loans held-in-portfolio | | | 2.96 | % | | | | | | | 2.95 | % | | | 3.35 | % | | | | | | | 3.27 | % |
Recoveries to charge-offs | | | 25.35 | | | | | | | | 21.71 | | | | 20.47 | | | | | | | | 20.03 | |
Net charge-offs to average loans held-in-portfolio | | | 1.97 | | | | | | | | 2.01 | | | | 2.61 | | | | | | | | 2.21 | |
Allowance for loans losses to net charge-offs | | | 1.54 x | | | | | | | | 1.48 x | | | | 1.29 x | | | | | | | | 1.47 x | |
Provision for loan losses to: | | | | | | | | | | | | | | | | | | | | | | | | |
Net charge-offs [3] | | | 0.83 | | | | | | | | 0.83 | | | | 0.81 | | | | | | | | 1.04 | |
Average loans held-in-portfolio | | | 1.63 | % | | | | | | | 1.67 | % | | | 2.10 | % | | | | | | | 2.29 | % |
Allowance to non performing loans held-in-portfolio | | | 43.62 | | | | | | | | 48.72 | | | | 39.73 | | | | | | | | 44.76 | |
| [1] | The legacy portfolio is comprised of commercial loans, construction loans and lease financing related to certain lending products exited by the Corporation as part of restructuring efforts carried out in prior years at the BPNA segment. |
| [2] | Net write-downs are related to loans sold or transferred to held-for-sale. |
| [3] | Excluding the provision for loans losses and net write-down related to loans sold or reclassified to held-for-sale. |
| [4] | Prior periods provision for loan losses and net charge-offs presented in this table has been retrospectively adjusted for the impact of the discontinued operations for comparative purposes. Loans (ending and average) balances and credit quality ratios for prior periods included in this table has not been retrospectively adjusted for the impact of the discontinued operations. |
For the year ended December 31, 2015, total non-performing loan inflows, excluding consumer loans, decreased by $114 million, or 16%, when compared to the inflows for the year 2014. Inflows of non-performing loans held-in-portfolio at the BPPR segment decreased by $117 million, or 18%, compared to the inflows for the year 2014, mostly related to lower commercial inflows of $99 million in the BPPR segment. Refer to Table 31 for a summary of the activity in the allowance for loan losses and selected loan losses statistics for the past 5 years.
78
The following table presents net charge-offs to average loans held-in-portfolio (“HIP”) ratios by loan category for the years ended December 31, 2015, 2014 and 2013:
Table 32 - Net Charge-Offs (Recoveries) to Average Loans HIP (Non-covered loans)
| | | | | | | | | | | | |
| | | 2015 | | | 2014 | | | 2013 | |
Commercial | | | 0.74 | % | | | 0.40 | % | | | 1.11 | % |
Construction | | | (0.14 | ) | | | (2.22 | ) | | | (3.13 | ) |
Lease financing | | | 0.56 | | | | 0.73 | | | | 0.65 | |
Legacy | | | (3.79 | ) | | | (7.01 | ) | | | (0.99 | ) |
Mortgage | | | 0.75 | | | | 0.69 | | | | 0.85 | |
Consumer | | | 2.34 | | | | 2.81 | | | | 2.50 | |
| | | | | | | | | | | | |
Total | | | 0.98 | % | | | 0.90 | % | | | 1.19 | % |
| | | | | | | | | | | | |
Net charge-offs, excluding covered loans, for the year ended December 31, 2015, increased by $31.4 million, or 17%, when compared to 2014, but decreased by $42.3 million, or 17%, when compared to 2013. The increase from the year ended December 31, 2014 was mainly reflective of higher commercial net charge-offs in the BPPR segment of $34.5 million, impacted by $31.1 million in charge-offs during the fourth quarter of 2015 of five large relationships.
Overall, the Corporation continued to exhibit a stable credit performance in an increasingly challenging operating environment given the continuing weakness in the Puerto Rico economy. During 2015, some credit metrics were impacted by a few specific large borrowers, the failure and acquisition of Doral Bank, and the reclassification to non-covered of the non-single family loans upon the expiration on June 30, 2015 of the commercial loss share agreement with the FDIC. The U.S. segment continued to exhibit strong credit quality during the year, with low levels of non-performing loans and charge-offs. The Corporation continues to closely monitor the performance of its portfolios and is focused in taking measures to minimize risks.
The discussions in the sections that follow assess credit quality performance for the year ended 2015 for each of the Corporation’s non-covered loan portfolios.
Commercial loans
Non-covered non-performing commercial loans held-in-portfolio decreased by $78 million, or 30%, from December 31, 2014, and $97 million, or 35%, from December 31, 2013. The decrease from December 31, 2014 was largely driven by an $80 million decline in the BPPR segment. During the second quarter of 2015, the Corporation agreed to sell a $75 million non-accrual public sector credit at BPPR and accordingly transferred it to held-for-sale. The aggregate write-down on loans transferred to held-for-sale during the second quarter was of approximately $30.5 million, of which $29.0 million was previously reserved. The sale was subject, among other conditions, to the approval of the syndicate’s agent bank. The sale agreement was terminated on July 29, 2015 pursuant to its terms after the parties were not able to obtain the approval of the agent bank on terms acceptable to the assignee. However, at December 31, 2015, the loan remains classified as held-for-sale as the Corporation maintains its ability and intent to sell the loan. Furthermore, during the fourth quarter of 2015, loans with a book value of $34 million were sold, of which approximately $21 million were non-accruing, coupled with higher net charge-off activity. These reductions were offset by the addition to non-accrual of a small number of large commercial loans, the most significant having a carrying value of $36 million. The aggregate write-down on commercial loans sold during the fourth quarter of 2015 was $7.9 million, of which $2.1 million was previously reserved. The percentage of non-performing commercial loans held-in-portfolio to commercial loans held-in-portfolio decreased to 1.80% at December 31, 2015 from 3.20% at December 31, 2014 and 2.78% at December 31, 2013.
79
Tables 33 and 34 present the changes in the non-performing commercial loans held-in-portfolio for the years ended December 31, 2015 and 2014 for the BPPR (excluding covered loans) and BPNA segments.
Table 33 - Activity in Non-Performing Commercial Loans Held-In-Portfolio (Excluding Covered Loans)
| | | | | | | | | | | | |
| | | For the year ended December 31, 2015 | |
(In thousands) | | BPPR | | | BPNA | | | Popular, Inc. | |
Beginning Balance - NPLs | | $ | 257,910 | | | $ | 2,315 | | | $ | 260,225 | |
Plus: | | | | | | | | | | | | |
New non-performing loans | | | 153,682 | | | | 14,880 | | | | 168,562 | |
Advances on existing non-performing loans | | | — | | | | 389 | | | | 389 | |
Reclassification from covered loans | | | 7,395 | | | | — | | | | 7,395 | |
Less: | | | | | | | | | | | | |
Non-performing loans transferred to OREO | | | (6,342 | ) | | | — | | | | (6,342 | ) |
Non-performing loans charged-off | | | (118,601 | ) | | | (1,286 | ) | | | (119,887 | ) |
Loans returned to accrual status / loan collections | | | (49,801 | ) | | | (4,141 | ) | | | (53,942 | ) |
Loans transferred to held-for-sale | | | (44,996 | ) | | | (473 | ) | | | (45,469 | ) |
Non-performing loans sold | | | (21,345 | ) | | | — | | | | (21,345 | ) |
Non-performing loans transferred from (to) discontinued operations | | | — | | | | (7,770 | ) | | | (7,770 | ) |
| | | | | | | | | | | | |
Ending balance - NPLs | | $ | 177,902 | | | $ | 3,914 | | | $ | 181,816 | |
| | | | | | | | | | | | |
Table 34 - Activity in Non-Performing Commercial Loans Held-in-Portfolio (Excluding Covered Loans)
| | | | | | | | | | | | |
| | | For the year ended December 31, 2014 | |
(In thousands) | | BPPR | | | BPNA | | | Popular, Inc. | |
Beginning Balance - NPLs | | $ | 186,097 | | | $ | 92,956 | | | $ | 279,053 | |
Plus: | | | | | | | | | | | | |
New non-performing loans | | | 252,292 | | | | 30,668 | | | | 282,960 | |
Advances on existing non-performing loans | | | — | | | | 957 | | | | 957 | |
Less: | | | | | | | | | | | | |
Non-performing loans transferred to OREO | | | (12,581 | ) | | | — | | | | (12,581 | ) |
Non-performing loans charged-off | | | (52,232 | ) | | | (13,963 | ) | | | (66,195 | ) |
Loans returned to accrual status / loan collections | | | (115,666 | ) | | | (35,953 | ) | | | (151,619 | ) |
Loans transferred to held-for-sale | | | — | | | | (72,216 | ) | | | (72,216 | ) |
Non-performing loans transferred from (to) discontinued operations | | | — | | | | (134 | ) | | | (134 | ) |
| | | | | | | | | | | | |
Ending balance - NPLs | | $ | 257,910 | | | $ | 2,315 | | | $ | 260,225 | |
| | | | | | | | | | | | |
For the year ended December 31, 2015, inflows of commercial non-performing loans held-in-portfolio at the BPPR segment decreased by $99 million, or 39%, when compared to inflows for the same period in 2014. The additions for 2014 included a $75 million impact of the aforementioned public sector borrower. Inflows of commercial non-performing loans held-in-portfolio at the BPNA segment decreased by $16 million, compared to inflows for the year 2014. These reductions were driven by improvements in the underlying quality of the loan portfolio.
80
Table 35 provides information on commercial non-performing loans and net charge-offs for the years ended December 31, 2015, December 31, 2014, and December 31, 2013 for the BPPR (excluding the Westernbank covered loan portfolio) and BPNA segments.
Table 35 - Non-Performing Commercial Loans and Net Charge-offs (Excluding Covered Loans)
| | | | | | | | | | | | | | | | | | | | | | | | | | | | | | | | | | | | |
| | | BPPR | | | BPNA | | | Popular, Inc. | |
(Dollars in thousands) | | December 31,
2015 | | | December 31,
2014 | | | December 31,
2013 | | | December 31,
2015 | | | December 31,
2014 | | | December 31,
2013 | | | December 31,
2015 | | | December 31,
2014 | | | December 31,
2013 | |
| | | | | | | | | |
Non-performing commercial loans | | $ | 177,902 | | | $ | 257,910 | | | $ | 186,097 | | | $ | 3,914 | | | $ | 2,315 | | | $ | 92,956 | | | $ | 181,816 | | | $ | 260,225 | | | $ | 279,053 | |
| | | | | | | | | |
Non-performing commercial loans to commercial loans HIP | | | 2.41 | % | | | 4.05 | % | | | 2.88 | % | | | 0.14 | % | | | 0.13 | % | | | 2.60 | % | | | 1.80 | % | | | 3.20 | % | | | 2.78 | % |
| | | |
| | | BPPR | | | BPNA | | | Popular, Inc. | |
| | | For the year ended | | | For the year ended | | | For the year ended | |
(Dollars in thousands) | | December 31,
2015 | | | December 31,
2014 | | | December 31,
2013 | | | December 31,
2015 | | | December 31,
2014 | | | December 31,
2013 | | | December 31,
2015 | | | December 31,
2014 | | | December 31,
2013 | |
| | | | | | | | | |
Commercial loan net charge-offs (recoveries) | | $ | 73,890 | | | $ | 39,382 | | | $ | 85,601 | | | $ | (3,842 | ) | | $ | (4,574 | ) | | $ | 23,368 | | | $ | 70,048 | | | $ | 34,808 | | | $ | 108,969 | |
| | | | | | | | | |
Commercial loan net charge-offs (recoveries) to average commercial loans HIP | | | 1.05 | % | | | 0.62 | % | | | 1.37 | % | | | (0.16 | )% | | | (0.20 | )% | | | 0.65 | % | | | 0.74 | % | | | 0.40 | % | | | 1.11 | % |
There is one commercial loan relationships greater than $10 million in non-accrual status at December 31, 2015 with an outstanding aggregate balance of $36 million, compared with two commercial loan relationships with an outstanding aggregate balance of $88 million at December 31, 2014.
Commercial loan net charge-offs, excluding net charge-offs for covered loans, increased by $35.2 million, compared to December 31, 2014, but decreased by $38.9 million when compared to December 31, 2013. The increase from December 31, 2014 was mostly driven by higher net charge-offs in the BPPR segment of $34.5 million, of which $31.1 million were recorded during the fourth quarter of 2015, related to five large relationships for which reserves were recorded in prior periods. For the year ended December 31, 2015, the charge-offs associated with collateral dependent impaired commercial loans amounted to approximately $60.0 million at the BPPR segment. The BPNA segment continued to show low levels of charge-offs reflective of improvements in credit quality.
The Corporation’s commercial loan portfolio secured by real estate (“CRE”), excluding covered loans, amounted to $6.6 billion at December 31, 2015, of which $2.1 billion was secured with owner occupied properties, compared with $4.7 billion and $1.7 billion, respectively, at December 31, 2014. CRE non-performing loans, excluding covered loans, amounted to $142 million at December 31, 2015, compared with $129 million at December 31, 2014. The CRE non-performing loans ratios for the BPPR and BPNA segments were 3.00% and 0.03%, respectively, at December 31, 2015, compared with 3.60% and 0.07%, respectively, at December 31, 2014. The decrease in the ratio was primarily due to the impact of approximately $1.2 billion in CRE loans transferred from the covered category, of which $5 million were in NPL status.
Construction loans
Non-covered non-performing construction loans held-in-portfolio decreased by $10 million when compared with December 31, 2014, and $20 million when compared to the same period in 2013, mostly concentrated in the BPPR segment. This decrease was mostly related to loan resolutions. Stable credit trends in the construction portfolio are the result of de-risking strategies executed by the Corporation over the past several years to reduce its exposure in asset classes with historically high losses. The ratio of non-performing construction loans to construction loans held-in-portfolio, excluding covered loans, decreased to 0.52% at December 31, 2015 from 5.48% at December 31, 2014, and 11.53% at December 31, 2013. The decrease in the ratio was in part due to the impact of the Doral acquired construction portfolio of approximately $270 million on the total loan base, coupled with portfolio growth in the BPNA segment.
81
Tables 36 and 37 present changes in non-performing construction loans held-in-portfolio for the years ended December 31, 2015 and 2014 for the BPPR (excluding covered loans) and BPNA segments.
Table 36 - Activity in Non-Performing Construction Loans Held-In-Portfolio (Excluding Covered Loans)
| | | | | | | | | | | | |
| | | For the year ended December 31, 2015 | |
(In thousands) | | BPPR | | | BPNA | | | Popular, Inc. | |
Beginning Balance - NPLs | | $ | 13,812 | | | $ | — | | | $ | 13,812 | |
Plus: | | | | | | | | | | | | |
New non-performing loans | | | 486 | | | | 9,522 | | | | 10,008 | |
Reclassification from covered loans | | | 112 | | | | — | | | | 112 | |
Less: | | | | | | | | | | | | |
Non-performing loans transferred to OREO | | | (2,194 | ) | | | — | | | | (2,194 | ) |
Non-performing loans charged-off | | | (138 | ) | | | — | | | | (138 | ) |
Loans returned to accrual status / loan collections | | | (8,528 | ) | | | (9,522 | ) | | | (18,050 | ) |
| | | | | | | | | | | | |
Ending balance - NPLs | | $ | 3,550 | | | $ | — | | | $ | 3,550 | |
| | | | | | | | | | | | |
Table 37 - Activity in Non-Performing Construction Loans Held-in-Portfolio (Excluding Covered Loans)
| | | | | | | | | | | | |
| | | For the year ended December 31, 2014 | |
(In thousands) | | BPPR | | | BPNA | | | Popular, Inc. | |
Beginning Balance - NPLs | | $ | 18,108 | | | $ | 5,663 | | | $ | 23,771 | |
Plus: | | | | | | | | | | | | |
New non-performing loans | | | 9,485 | | | | — | | | | 9,485 | |
Less: | | | | | | | | | | | | |
Non-performing loans charged-off | | | (1,687 | ) | | | — | | | | (1,687 | ) |
Loans returned to accrual status / loan collections | | | (12,094 | ) | | | (5,663 | ) | | | (17,757 | ) |
| | | | | | | | | | | | |
Ending balance - NPLs | | $ | 13,812 | | | $ | — | | | $ | 13,812 | |
| | | | | | | | | | | | |
Construction loan net charge-offs (recoveries), excluding net charge-offs for covered loans, amounted to net recoveries of $886 thousand for the year ended December 31, 2015, compared to net recoveries of $3.7 million for the year ended December 31, 2014 and $8.6 million in December 31, 2013 . For the year ended December 31, 2015, charge-offs associated with collateral dependent impaired construction loans were $4.5 million in the BPPR segment.
82
Table 38 provides information on construction non-performing loans and net charge-offs for the BPPR and BPNA (excluding the covered loan portfolio) segments for the years ended December 31, 2015, December 31, 2014, and December 31, 2013.
Table 38 - Non-Performing Construction Loans and Net Charge-offs (Excluding Covered Loans)
| | | | | | | | | | | | | | | | | | | | | | | | |
| | | BPPR | | BPNA | | | Popular, Inc. |
(Dollars in thousands) | | December 31,
2015 | | December 31,
2014 | | December 31,
2013 | | December 31,
2015 | | | December 31,
2014 | | | December 31,
2013 | | | December 31,
2015 | | December 31,
2014 | | December 31,
2013 |
Non-performing construction loans | | $ 3,550 | | $ 13,812 | | $ 18,108 | | $ | — | | | $ | — | | | $ | 5,663 | | | $ 3,550 | | $ 13,812 | | $ 23,771 |
| | | | | | | | | |
Non-performing construction loans to construction loans HIP | | 3.52% | | 8.67% | | 11.24% | | | — | % | | | — | % | | | 12.61 | % | | 0.52% | | 5.48% | | 11.53% |
| | | |
| | | BPPR | | BPNA | | | Popular, Inc. |
| | | For the year ended | | For the year ended | | | For the year ended |
(Dollars in thousands) | | December 31,
2015 | | December 31,
2014 | | December 31,
2013 | | December 31,
2015 | | | December 31,
2014 | | | December 31,
2013 | | | December 31,
2015 | | December 31,
2014 | | December 31,
2013 |
| | | | | | | | | |
Construction loan net (recoveries) charge-offs | | $ (886) | | $ (3,509) | | $ (8,642) | | $ | — | | | $ | (237 | ) | | $ | — | | | $ (886) | | $ (3,746) | | $ (8,642) |
| | | | | | | | | |
Construction loan net (recoveries) charge-offs to average construction loans HIP | | (0.76)% | | (2.42)% | | (3.57)% | | | — | % | | | (0.99 | )% | | | — | % | | (0.14)% | | (2.22)% | | (3.13)% |
Mortgage loans
Non-covered non-performing mortgage loans held-in-portfolio increased by $47 million when compared to December 31, 2014, and $119 million when compared to 2013. The increase from 2014 was mainly driven by an increase of $42 million in the BPPR segment, which included the addition of $17 million of loans previously guaranteed by Doral Bank under servicing agreement that required Doral to advance principal and interest payments irrespective of borrower delinquencies. The percentage of non-performing mortgage loans held-in-portfolio to mortgage loans held-in-portfolio increased to 5.00% at December 31, 2015 from 4.69% at December 31, 2014, and 3.48% at December 31, 2013.
Tables 39 and 40 present changes in non-performing mortgage loans held-in-portfolio for the years ended December 31, 2015 and 2014 for the BPPR (excluding covered loans) and BPNA segments.
Table 39 - Activity in Non-Performing Mortgage Loans Held-in-Portfolio (Excluding Covered Loans)
| | | | | | | | | | | | |
| | | For the year ended December 31, 2015 | |
(In thousands) | | BPPR | | | BPNA | | | Popular, Inc. | |
Beginning Balance - NPLs | | $ | 295,629 | | | $ | 9,284 | | | $ | 304,913 | |
Plus: | | | | | | | | | | | | |
| | | |
New non-performing loans | | | 371,916 | | | | 31,113 | | | | 403,029 | |
Reclassification from covered loans | | | 568 | | | | — | | | | 568 | |
| | | |
Less: | | | | | | | | | | | | |
| | | |
Non-performing loans transferred to OREO | | | (28,258 | ) | | | (766 | ) | | | (29,024 | ) |
Non-performing loans charged-off | | | (40,510 | ) | | | (1,259 | ) | | | (41,769 | ) |
Loans returned to accrual status / loan collections | | | (261,412 | ) | | | (26,872 | ) | | | (288,284 | ) |
Loans transferred to held-for-sale | | | — | | | | 2,038 | | | | 2,038 | |
| | | | | | | | | | | | |
Ending balance - NPLs | | $ | 337,933 | | | $ | 13,538 | | | $ | 351,471 | |
| | | | | | | | | | | | |
83
Table 40 - Activity in Non-Performing Mortgage Loans Held-in-Portfolio (Excluding Covered Loans)
| | | | | | | | | | | | |
| | | For the year ended December 31, 2014 | |
(In thousands) | | BPPR | | | BPNA | | | Popular, Inc. | |
Beginning Balance - NPLs | | $ | 206,389 | | | $ | 26,292 | | | $ | 232,681 | |
Plus: | | | | | | | | | | | | |
| | | |
New non-performing loans | | | 381,439 | | | | 19,558 | | | | 400,997 | |
| | | |
Less: | | | | | | | | | | | | |
| | | |
Non-performing loans transferred to OREO | | | (8,709 | ) | | | (2,726 | ) | | | (11,435 | ) |
Non-performing loans charged-off | | | (35,219 | ) | | | (2,007 | ) | | | (37,226 | ) |
Loans returned to accrual status / loan collections | | | (241,515 | ) | | | (12,548 | ) | | | (254,063 | ) |
Loans transferred to held-for-sale | | | — | | | | (19,285 | ) | | | (19,285 | ) |
Non-performing loans reclassified to non-performing consumer loans | | | (6,756 | ) | | | — | | | | (6,756 | ) |
| | | | | | | | | | | | |
Ending balance - NPLs | | $ | 295,629 | | | $ | 9,284 | | | $ | 304,913 | |
| | | | | | | | | | | | |
For the year ended December 31, 2015, inflows of mortgage non-performing loans held-in-portfolio at the BPPR segment decreased by $10 million, or 2%, when compared to inflows for the same period in 2014. Inflows of mortgage non-performing loans held-in-portfolio at the BPNA segment increased by $12 million, when compared to inflows for the same period in 2014, mainly due to regular migration to late delinquency.
Mortgage loan net charge-offs, excluding net charge-offs for covered loans, increased by $7.1 million when compared with the year ended December 31, 2014, but decreasing by $3.3 million when compared to 2013. Net charge-off activity derived mainly from loans in the BPPR segment. The net charge-offs in the BPNA segment continued at low levels, reflective of the improved risk profile of the portfolio, strengthened by the sale of certain non-performing and classified assets during the year 2014. For the year ended December 31, 2015, charge-offs associated with mortgage loans individually evaluated for impairment amounted to $9.9 million in the BPPR segment.
Table 41 provides information on mortgage non-performing loans and net charge-offs for the BPPR and BPNA (excluding the covered loan portfolio) segments for the years ended December 31, 2015, 2014, and 2013.
Table 41 - Non-Performing Mortgage Loans and Net Charge-offs (Excluding Covered Loans)
| | | | | | | | | | | | | | | | | | | | | | | | | | | | | | | | | | | | |
| | | BPPR | | | BPNA | | | Popular, Inc. | |
(Dollars in thousands) | | December
31, 2015 | | | December
31, 2014 | | | December
31, 2013 | | | December
31, 2015 | | | December
31, 2014 | | | December
31, 2013 | | | December
31, 2015 | | | December
31, 2014 | | | December
31, 2013 | |
Non-performing mortgage loans | | $ | 337,933 | | | $ | 295,629 | | | $ | 206,389 | | | $ | 13,538 | | | $ | 9,284 | | | $ | 26,292 | | | $ | 351,471 | | | $ | 304,913 | | | $ | 232,681 | |
| | | | | | | | | |
Non-performing mortgage loans to mortgage loans HIP | | | 5.52 | % | | | 5.42 | % | | | 3.82 | % | | | 1.49 | % | | | 0.88 | % | | | 2.05 | % | | | 5.00 | % | | | 4.69 | % | | | 3.48 | % |
| | | | | | | | | | | | | | | | | | | | | | | | | | | | | | | | | | | | |
| | | |
| | | BPPR | | | BPNA | | | Popular, Inc. | |
| | | For the year ended | | | For the year ended | | | For the year ended | |
(Dollars in thousands) | | December
31, 2015 | | | December
31, 2014 | | | December
31, 2013 | | | December
31, 2015 | | | December
31, 2014 | | | December
31, 2013 | | | December
31, 2015 | | | December
31, 2014 | | | December
31, 2013 | |
Mortgage loan net charge-offs | | $ | 50,991 | | | $ | 44,000 | | | $ | 47,736 | | | $ | 1,279 | | | $ | 1,196 | | | $ | 7,803 | | | $ | 52,270 | | | $ | 45,196 | | | $ | 55,539 | |
| | | | | | | | | |
Mortgage loan net charge-offs to average mortgage loans HIP | | | 0.85 | % | | | 0.82 | % | | | 0.89 | % | | | 0.13 | % | | | 0.10 | % | | | 0.64 | % | | | 0.75 | % | | | 0.69 | % | | | 0.85 | % |
| | | | | | | | | | | | | | | | | | | | | | | | | | | | | | | | | | | | |
84
Consumer loans
Non-covered non-performing consumer loans held-in-portfolio increased by $11 million when compared to December 31, 2014, and $14 million, when compared to 2013. The increase when compared to December 31, 2014 was the result of an increase of $12 million in the BPPR segment, mainly related to a single relationship in part collateralized with P.R. securities.
For the year ended December 31, 2015, the BPPR segment inflows of consumer non-performing loans held-in-portfolio, increased by $3 million, or 3%, when compared to inflows for the same period of 2014, mostly related to the abovementioned single $17 million relationship. Inflows of consumer non-performing loans held-in-portfolio at the BPNA segment amounted to $13 million, a decrease of $7 million, or 33% when compared to inflows for 2014.
The Corporation’s consumer net charge-offs decreased by $20.1 million for the year ended December 31, 2015, when compared with 2014, and $7.4 million when compared to 2013. The decrease when compared to December 31, 2014 was reflective of a reduction in the BPPR segment of $12.8 million prompted by improvements in the auto loan portfolio, coupled with a $5.0 million recovery from the sale of a portfolio of previously charged-off credit cards, and auto loans. In the BPNA segment, consumer net charge-offs improved by $7.3 million. For the year ended December 31, 2015, charge-offs associated with consumer loans individually evaluated for impairment amounted to $14.9 million in the BPPR segment.
Table 42 provides information on consumer non-performing loans and net charge-offs by segments.
Table 42 - Non-Performing Consumer Loans and Net Charge-offs (Excluding Covered Loans)
| | | | | | | | | | | | | | | | | | | | | | | | | | | | | | | | | | | | |
| | | BPPR | | | BPNA | | | Popular, Inc. | |
(Dollars in thousands) | | December 31,
2015 | | | December 31,
2014 | | | December 31,
2013 | | | December 31,
2015 | | | December 31,
2014 | | | December 31,
2013 | | | December 31,
2015 | | | December 31,
2014 | | | December 31,
2013 | |
Non-performing consumer loans | | $ | 52,440 | | | $ | 40,930 | | | $ | 33,166 | | | $ | 5,864 | | | $ | 5,956 | | | $ | 10,732 | | | $ | 58,304 | | | $ | 46,886 | | | $ | 43,898 | |
| | | | | | | | | |
Non-performing consumer loans to consumer loans HIP | | | 1.57 | % | | | 1.21 | % | | | 1.00 | % | | | 1.19 | % | | | 1.24 | % | | | 1.74 | % | | | 1.52 | % | | | 1.21 | % | | | 1.63 | % |
| | | |
| | | BPPR | | | BPNA | | | Popular, Inc. | |
| | | For the year ended | | | For the year ended | | | For the year ended | |
(Dollars in thousands) | | December 31,
2015 | | | December 31,
2014 | | | December 31,
2013 | | | December 31,
2015 | | | December 31,
2014 | | | December 31,
2013 | | | December 31,
2015 | | | December 31,
2014 | | | December 31,
2013 | |
Consumer loan net charge-offs | | $ | 83,876 | | | $ | 96,655 | | | $ | 75,560 | | | $ | 5,649 | | | $ | 12,971 | | | $ | 21,411 | | | $ | 89,525 | | | $ | 109,626 | | | $ | 96,971 | |
| | | | | | | | | |
Consumer loan net charge-offs to average consumer loans HIP | | | 2.49 | % | | | 2.86 | % | | | 2.32 | % | | | 1.21 | % | | | 2.50 | % | | | 3.43 | % | | | 2.34 | % | | | 2.81 | % | | | 2.50 | % |
Troubled debt restructurings
The Corporation’s TDR loans, excluding covered loans, increased by $44 million, or 4%, from December 31, 2014. TDRs in accruing status increased by $99 million from December 31, 2014, due to sustained borrower performance, while non-accruing TDRs decreased by $55 million.
At December 31, 2015, the Corporation’s commercial loan TDRs, excluding covered loans, for BPPR amounted to $255 million of which $88 million were in non-performing status. This compares with $303 million, of which $150 million were in non-performing status at December 31, 2014.
At December 31, 2015, the Corporation’s construction loan TDRs, excluding covered loans, for the BPPR segment amounted to $2 million, of which $2 million were in non-performing status. This compares with $6 million, of which $5 million were in non-performing status at December 31, 2014.
85
At December 31, 2015, the mortgage loan TDRs for the BPPR and BPNA segments amounted to $768 million (including $359 million guaranteed by U.S. sponsored entities) and $7 million, respectively, of which $128 million and $2 million, respectively, were in non-performing status. This compares with $669 million (including $290 million guaranteed by U.S. sponsored entities) and $4 million, respectively, of which $115 million and $987 thousand were in non-performing status at December 31, 2014.
At December 31, 2015, the consumer loan TDRs for the BPPR and BPNA segments amounted to $115 million and $2 million, respectively, of which $13 million and $239 thousand, respectively, were in non-performing status, compared with $120 million and $2 million, respectively, of which $15 million and $35 thousand, respectively, were in non-performing status at December 31, 2014.
Refer to Note 13 to the consolidated financial statements for additional information on modifications considered troubled debt restructurings, including certain qualitative and quantitative data about troubled debt restructurings performed in the past twelve months.
Allowance for Loan Losses
Non-Covered Loan Portfolio
The allowance for loan losses, which represents management’s estimate of credit losses inherent in the loan portfolio, is maintained at a sufficient level to provide for estimated credit losses on individually evaluated loans as well as estimated credit losses inherent in the remainder of the loan portfolio. The Corporation’s management evaluates the adequacy of the allowance for loan losses on a quarterly basis. In this evaluation, management considers current economic conditions and the resulting impact on Popular Inc.’s loan portfolio, the composition of the portfolio by loan type and risk characteristics, historical loss experience, results of periodic credit reviews of individual loans, regulatory requirements and loan impairment measurement, among other factors.
The Corporation must rely on estimates and exercise judgment regarding matters where the ultimate outcome is unknown, such as economic developments affecting specific customers, industries or markets. Other factors that can affect management’s estimates are the years of historical data when estimating losses, changes in underwriting standards, financial accounting standards and loan impairment measurements, among others. Changes in the financial condition of individual borrowers, in economic conditions, in historical loss experience and in the condition of the various markets in which collateral may be sold may all affect the required level of the allowance for loan losses. Consequently, the business financial condition, liquidity, capital and results of operations could also be affected. Refer to the Critical Accounting Policies / Estimates section of this MD&A for a description of the Corporation’s allowance for loan losses methodology.
86
The following tables set forth information concerning the composition of the Corporation’s allowance for loan losses (“ALLL”) at December 31, 2015, December 31, 2014, and December 2013 by loan category and by whether the allowance and related provisions were calculated individually pursuant to the requirements for specific impairment or through a general valuation allowance.
Table 43 - Composition of the Allowance for Loan Losses
| | | | | | | | | | | | | | | | | | | | | | | | | | | | |
December 31, 2015 | |
(Dollars in thousands) | | Commercial | | | Construction | | | Legacy [3] | | | Leasing | | | Mortgage | | | Consumer | | | Total[2] | |
Specific ALLL | | $ | 49,243 | | | $ | 264 | | | $ | — | | | $ | 573 | | | $ | 44,029 | | | $ | 23,963 | | | $ | 118,072 | |
Impaired loans[1] | | $ | 337,133 | | | $ | 2,481 | | | $ | — | | | $ | 2,404 | | | $ | 471,932 | | | $ | 111,836 | | | $ | 925,786 | |
| | | | | | | |
Specific ALLL to impaired loans[1] | | | 14.61 | % | | | 10.64 | % | | | — | % | | | 23.84 | % | | | 9.33 | % | | | 21.43 | % | | | 12.75 | % |
| | | | | | | | | | | | | | | | | | | | | | | | | | | | |
General ALLL | | $ | 147,590 | | | $ | 8,605 | | | $ | 2,687 | | | $ | 10,420 | | | $ | 89,283 | | | $ | 126,278 | | | $ | 384,863 | |
Loans held-in-portfolio, excluding impaired loans[1] | | $ | 9,762,030 | | | $ | 678,625 | | | $ | 64,436 | | | $ | 625,246 | | | $ | 6,564,149 | | | $ | 3,725,843 | | | $ | 21,420,329 | |
General ALLL to loans held-in-portfolio, excluding impaired loans [1] | | | 1.51 | % | | | 1.27 | % | | | 4.17 | % | | | 1.67 | % | | | 1.36 | % | | | 3.39 | % | | | 1.80 | % |
| | | | | | | | | | | | | | | | | | | | | | | | | | | | |
Total ALLL | | $ | 196,833 | | | $ | 8,869 | | | $ | 2,687 | | | $ | 10,993 | | | $ | 133,312 | | | $ | 150,241 | | | $ | 502,935 | |
Total non-covered loans held-in-portfolio[1] | | $ | 10,099,163 | | | $ | 681,106 | | | $ | 64,436 | | | $ | 627,650 | | | $ | 7,036,081 | | | $ | 3,837,679 | | | $ | 22,346,115 | |
| | | | | | | |
ALLL to loans held-in-portfolio[1] | | | 1.95 | % | | | 1.30 | % | | | 4.17 | % | | | 1.75 | % | | | 1.89 | % | | | 3.91 | % | | | 2.25 | % |
| | | | | | | | | | | | | | | | | | | | | | | | | | | | |
| [1] | Excludes covered loans acquired on the Westernbank FDIC-assisted transaction. |
| [2] | Excludes covered loans acquired on the Westernbank FDIC-assisted transaction. At December 31, 2015, the general allowance on the covered loans amounted to $34.2 million. |
| [3] | The legacy portfolio is comprised of commercial loans, construction loans and lease financings related to certain lending products exited by the Corporation as part of restructuring efforts carried out in prior years at the BPNA reportable segment. |
Table 44 - Composition of the Allowance for Loan Losses
| | | | | | | | | | | | | | | | | | | | | | | | | | | | |
December 31, 2014 | |
(Dollars in thousands) | | Commercial | | | Construction | | | Legacy [3] | | | Leasing | | | Mortgage | | | Consumer | | | Total[2] | |
Specific ALLL | | $ | 64,736 | | | $ | 363 | | | $ | — | | | $ | 770 | | | $ | 46,111 | | | $ | 28,161 | | | $ | 140,141 | |
Impaired loans[1] | | $ | 357,161 | | | $ | 13,268 | | | $ | — | | | $ | 3,023 | | | $ | 435,824 | | | $ | 117,732 | | | $ | 927,008 | |
| | | | | | | |
Specific ALLL to impaired loans[1] | | | 18.13 | % | | | 2.74 | % | | | — | % | | | 25.47 | % | | | 10.58 | % | | | 23.92 | % | | | 15.12 | % |
General ALLL | | $ | 146,501 | | | $ | 6,307 | | | $ | 2,944 | | | $ | 6,361 | | | $ | 77,211 | | | $ | 140,254 | | | $ | 379,578 | |
Loans held-in-portfolio, excluding impaired loans[1] | | $ | 7,777,106 | | | $ | 238,552 | | | $ | 80,818 | | | $ | 561,366 | | | $ | 6,067,062 | | | $ | 3,752,539 | | | $ | 18,477,443 | |
General ALLL to loans held-in-portfolio, excluding impaired loans[1] | | | 1.88 | % | | | 2.64 | % | | | 3.64 | % | | | 1.13 | % | | | 1.27 | % | | | 3.74 | % | | | 2.05 | % |
Total ALLL | | $ | 211,237 | | | $ | 6,670 | | | $ | 2,944 | | | $ | 7,131 | | | $ | 123,322 | | | $ | 168,415 | | | $ | 519,719 | |
Total non-covered loans held-in-portfolio[1] | | $ | 8,134,267 | | | $ | 251,820 | | | $ | 80,818 | | | $ | 564,389 | | | $ | 6,502,886 | | | $ | 3,870,271 | | | $ | 19,404,451 | |
| | | | | | | |
ALLL to loans held-in-portfolio[1] | | | 2.60 | % | | | 2.65 | % | | | 3.64 | % | | | 1.26 | % | | | 1.90 | % | | | 4.35 | % | | | 2.68 | % |
| [1] | Excludes covered loans acquired on the Westernbank FDIC-assisted transaction. |
| [2] | Excludes covered loans acquired on the Westernbank FDIC-assisted transaction. At December 31, 2014, the general allowance on the covered loans amounted to $82.1 million while the specific reserve amounted to $5 thousand. |
| [3] | The legacy portfolio is comprised of commercial loans, construction loans and lease financings related to certain lending products exited by the Corporation as part of restructuring efforts carried out in prior years at the BPNA reportable segment. |
87
Table 45 - Composition of the Allowance for Loan Losses
| | | | | | | | | | | | | | | | | | | | | | | | | | | | |
December 31, 2013 | |
(Dollars in thousands) | | Commercial | | | Construction | | | Legacy [3] | | | Leasing | | | Mortgage | | | Consumer | | | Total[2] | |
Specific ALLL | | $ | 16,409 | | | $ | 177 | | | $ | — | | | $ | 1,053 | | | $ | 55,667 | | | $ | 30,200 | | | $ | 103,506 | |
Impaired loans[1] | | $ | 297,516 | | | $ | 22,486 | | | $ | 6,045 | | | $ | 2,893 | | | $ | 452,073 | | | $ | 127,703 | | | $ | 908,716 | |
| | | | | | | |
Specific ALLL to impaired loans[1] | | | 5.52 | % | | | 0.79 | % | | | — | % | | | 36.40 | % | | | 12.31 | % | | | 23.65 | % | | | 11.39 | % |
General ALLL | | $ | 158,573 | | | $ | 5,165 | | | $ | 13,704 | | | $ | 9,569 | | | $ | 101,262 | | | $ | 146,684 | | | $ | 434,957 | |
Loans held-in-portfolio, excluding impaired loans[1] | | $ | 9,739,669 | | | $ | 183,598 | | | $ | 205,090 | | | $ | 540,868 | | | $ | 6,229,403 | | | $ | 3,804,523 | | | $ | 20,703,151 | |
General ALLL to loans held-in-portfolio, excluding impaired loans[1] | | | 1.63 | % | | | 2.81 | % | | | 6.68 | % | | | 1.77 | % | | | 1.63 | % | | | 3.86 | % | | | 2.10 | % |
Total ALLL | | $ | 174,982 | | | $ | 5,342 | | | $ | 13,704 | | | $ | 10,622 | | | $ | 156,929 | | | $ | 176,884 | | | $ | 538,463 | |
Total non-covered loans held-in-portfolio[1] | | $ | 10,037,185 | | | $ | 206,084 | | | $ | 211,135 | | | $ | 543,761 | | | $ | 6,681,476 | | | $ | 3,932,226 | | | $ | 21,611,867 | |
| | | | | | | |
ALLL to loans held-in-portfolio[1] | | | 1.74 | % | | | 2.59 | % | | | 6.49 | % | | | 1.95 | % | | | 2.35 | % | | | 4.50 | % | | | 2.49 | % |
| [1] | Excludes covered loans acquired on the Westernbank FDIC-assisted transaction. |
| [2] | Excludes covered loans acquired on the Westernbank FDIC-assisted transaction. At December 31, 2013, the general allowance on the covered loans amounted to $101.8 million while the specific reserve amounted to $0.3 million. |
| [3] | The legacy portfolio is comprised of commercial loans, construction loans and lease financings related to certain lending products exited by the Corporation as part of restructuring efforts carried out in prior years at the BPNA reportable segment. |
Table 46 details the breakdown of the allowance for loan losses by loan categories. The breakdown is made for analytical purposes, and it is not necessarily indicative of the categories in which future loan losses may occur.
Table 46 - Allocation of the Allowance for Loan Losses
| | | | | | | | | | | | | | | | | | | | | | | | | | | | | | | | | | | | | | | | |
At December 31, | |
| | | 2015 | | | 2014 | | | 2013 | | | 2012 | | | 2011 | |
(Dollars in millions) | | ALLL | | | % of loans
in each
category to
total loans | | | ALLL | | | % of loans
in each
category to
total loans | | | ALLL | | | % of loans
in each
category to
total loans | | | ALLL | | | % of loans
in each
category to
total loans | | | ALLL | | | % of loans
in each
category to
total loans | |
Commercial | | $ | 196.8 | | | | 45.2 | % | | $ | 211.2 | | | | 41.9 | % | | $ | 175.0 | | | | 46.4 | % | | $ | 297.7 | | | | 47.0 | % | | $ | 369.4 | | | | 48.4 | % |
Construction | | | 8.9 | | | | 3.0 | | | | 6.7 | | | | 1.3 | | | | 5.3 | | | | 1.0 | | | | 7.4 | | | | 1.2 | | | | 8.5 | | | | 1.2 | |
Legacy | | | 2.7 | | | | 0.3 | | | | 3.0 | | | | 0.4 | | | | 13.7 | | | | 1.0 | | | | 33.1 | | | | 1.8 | | | | 46.2 | | | | 3.1 | |
Leasing | | | 11.0 | | | | 2.8 | | | | 7.1 | | | | 2.9 | | | | 10.6 | | | | 2.5 | | | | 2.9 | | | | 2.6 | | | | 4.7 | | | | 2.7 | |
Mortgage | | | 133.3 | | | | 31.5 | | | | 123.3 | | | | 33.5 | | | | 156.9 | | | | 30.9 | | | | 149.4 | | | | 29.0 | | | | 102.3 | | | | 26.8 | |
Consumer | | | 150.2 | | | | 17.2 | | | | 168.4 | | | | 20.0 | | | | 176.9 | | | | 18.2 | | | | 131.2 | | | | 18.4 | | | | 159.3 | | | | 17.8 | |
| | | | | | | | | | | | | | | | | | | | | | | | | | | | | | | | | | | | | | | | |
Total[1] | | $ | 502.9 | | | | 100.0 | % | | $ | 519.7 | | | | 100.0 | % | | $ | 538.4 | | | | 100.0 | % | | $ | 621.7 | | | | 100.0 | % | | $ | 690.4 | | | | 100.0 | % |
| | | | | | | | | | | | | | | | | | | | | | | | | | | | | | | | | | | | | | | | |
| [1] | Note: For purposes of this table the term loans refers to loans held-in-portfolio excluding covered loans and held-for-sale. |
At December 31, 2015, the allowance for loan losses, excluding covered loans, decreased by $17 million when compared with December 31, 2014, primarily driven by reductions in the BPPR segment as a result of charge-offs or write-downs of commercial loans reserved in 2014, offset by an allowance of $34 million related to the Westernbank’s loans transferred from the covered category in the second quarter of 2015. The ratio of the allowance for loan losses to loans held-in-portfolio decreased to 2.25% of non-covered loans held-in-portfolio at December 31, 2015, compared with 2.68% at December 31, 2014, and 2.49% at December 31, 2013. The ratio of the allowance to non-performing loans held-in-portfolio was stable at 83.57% at December 31, 2015, compared with 82.43% at December 31, 2014, and 90.05% at December 31, 2013.
88
At December 31, 2015, the allowance for loan losses for non-covered loans at the BPPR segment totaled $470 million, or 2.67% of non-covered loans held-in-portfolio, compared with $489 million, or 3.07% of non-covered loans held-in-portfolio, at December 31, 2014, and $427 million, or 2.69% in 2013. The ratio of the allowance to non-performing loans held-in-portfolio was 81.75% at December 31, 2015, compared with 80.00% at December 31, 2014, and 95.42% in 2013.
The allowance for loan losses at the BPNA segment increased slightly to $33 million, or 0.69% of loans held-in-portfolio, compared with $31 million, or 0.88% of loans held-in-portfolio, at December 31, 2014 and $112 million, or 1.95% in 2013, driven by strong credit quality. The ratio of the allowance to non-performing loans held-in-portfolio was 122.43% at December 31, 2015, compared with 160.13% at December 31, 2014, and 74.12% in 2013.
The allowance for loan losses for commercial loans held-in-portfolio, excluding covered loans, decreased by $14 million from December 31, 2014, and increased $22 million from December 31, 2013. The allowance for loan losses for commercial loans in the BPPR segment, excluding the allowance for covered loans, totaled $187 million, or 2.54% of non-covered commercial loans held-in-portfolio, at December 31, 2015, compared with $202 million, or 3.16%, at December 31, 2014, and $128 million, or 1.98% at December 31, 2013. The decrease of $15 million from December 31, 2014 was mainly due to charge-offs of previously reserved loans, including the aforementioned $29 million write-down related to a public sector borrower transferred to loans held-for-sale, offset by an allowance of $30 million related to the Westernbank’s loans transferred from the covered category in the second quarter of 2015. The decrease in the allowance to loans ratio was also due to the impact of the reclassified covered loans. At the BPNA segment, the allowance for loan losses for the commercial loan portfolio amounted to $10 million or 0.36% of commercial loans held-in-portfolio at December 31, 2015, increasing slightly by $260 thousand when compared to December 31, 2014. The allowance for loan losses for the commercial loan portfolio amounted to $47 million, or 1.31%, at December 31, 2013. The decrease from December 31, 2013 was mostly driven by continued improvement in credit quality trends and the sale of its regional operations. The Corporation’s ratio of allowance to non-performing loans held-in-portfolio in the commercial loan category was 108.26% at December 31, 2015, compared with 81.18% at December 31, 2014, and 62.71% at December 31, 2013.
The allowance for loan losses for construction loans held-in-portfolio, excluding covered loans, increased slightly by $2 million from December 31, 2014, and $4 million from 2013. The allowance for loan losses for construction loans in the BPPR segment, excluding the allowance for covered loans, has remained stable at $5 million, or 4.91% of non-covered construction loans held-in-portfolio, at December 31, 2015, compared with $5 million, or 3.44%, at December 31, 2014, and $5 million or 3.16% in December 31, 2013. At the BPNA segment, the allowance for loan losses of the construction loan portfolio totaled $4 million, or 0.67% of construction loans held-in-portfolio, at December 31, 2015, compared with $1 million, or 1.28%, at December 31, 2014, and $247 thousand or 0.55% for December 31, 2013. The Corporation’s ratio of allowance to non-performing loans held-in portfolio in the construction loan category was 249.83% at December 31, 2015, compared with 48.29% at December 31, 2014, and 22.47% at December 31, 2013. Stable allowance levels in the construction portfolio result from de-risking strategies executed by the Corporation over the past several years.
The allowance for loan losses for mortgage loans held-in-portfolio, excluding covered loans, increased by $10 million from December 31, 2014, but decreased by $24 million from December 31, 2013. The allowance for loan losses for mortgage loans in the BPPR segment totaled $128 million, or 2.09% of mortgage loans held-in-portfolio, excluding covered loans, at December 31, 2015, compared with $121 million, or 2.22%, respectively, at December 31, 2014, and $130 million or 2.41% at December 31, 2013. The increase was consistent with current credit quality trends, including higher non-performing loans. The decrease in the ratio was due to the impact of Doral bank acquired mortgage loans in the loan base. At the BPNA segment, the allowance for loan losses for the mortgage loan portfolio increased to $5 million, or 0.55% of mortgage loans held-in-portfolio, at December 31, 2015, compared with $2 million, or 0.23%, at December 31, 2014, and $14 million, or 1.07% at December 31, 2013. Low allowance levels corresponds to the sale of certain classified loans, including mortgage TDRs and non-performing loans during 2014.
The allowance for loan losses for the consumer portfolio, excluding covered loans, decreased by $18 million from December 31, 2014, and $27 million from 2013. The allowance for loan losses of the non-covered consumer loan portfolio in the BPPR segment was at $139 million, or 4.15% of that portfolio, at December 31, 2015, compared with $154 million, or 4.55%, at December 31, 2014, and $153 million, or 4.60% at December 31, 2013, consistent with improvements in the net charge-off trend. At the BPNA segment, the allowance for loan losses of the consumer loan portfolio totaled $12 million, or 2.34% of consumer loans, at December 31, 2015, compared with $14 million, or 2.98%, at December 31, 2014, and $24 million, or 3.95% at December 31, 2013.
89
The following table presents the Corporation’s recorded investment in non-covered loans that were considered impaired and related valuation allowance at December 31, 2015, 2014, and 2013.
Table 47 - Impaired Loans (Non-Covered Loans) and the Related Valuation Allowance
| | | | | | | | | | | | | | | | | | | | | | | | |
| | | 2015 | | | 2014 | | | 2013 | |
(In millions) | | Recorded
Investment[1] | | | Valuation
Allowance[2] | | | Recorded
Investment[1] | | | Valuation
Allowance [2] | | | Recorded
Investment [1] | | | Valuation
Allowance [2] | |
Impaired loans: | | | | | | | | | | | | | | | | | | | | | | | | |
Valuation allowance | | $ | 807.4 | | | $ | 118.1 | | | $ | 831.5 | | | $ | 140.1 | | | $ | 642.6 | | | $ | 103.5 | |
No valuation allowance required | | | 118.4 | | | | — | | | | 95.5 | | | | — | | | | 266.1 | | | | — | |
| | | | | | | | | | | | | | | | | | | | | | | | |
Total impaired loans | | $ | 925.8 | | | $ | 118.1 | | | $ | 927.0 | | | $ | 140.1 | | | $ | 908.7 | | | $ | 103.5 | |
| | | | | | | | | | | | | | | | | | | | | | | | |
| [1] | Excludes covered loans acquired on the Westernbank FDIC-assisted transaction. |
| [2] | Excludes the specific reserve related to covered loans acquired on the Westernbank FDIC-assisted transaction which amounted to $0.3 million, $5 thousand and none at December 31, 2013, 2014 and 2015, respectively. |
Table 48 - Activity in Specific ALLL for the Year Ended December 31, 2015
| | | | | | | | | | | | | | | | | | | | | | | | | | | | |
(In thousands) | | Commercial | | | Construction | | | Mortgage | | | Legacy | | | Consumer | | | Leasing | | | Total | |
Beginning balance | | $ | 64,736 | | | $ | 363 | | | $ | 46,111 | | | $ | — | | | $ | 28,161 | | | $ | 770 | | | $ | 140,141 | |
Provision for impaired loans (reversal of provision) -Continuing operations | | | 82,391 | | | | 4,400 | | | | 7,907 | | | | 34 | | | | 10,866 | | | | (58 | ) | | | 105,540 | |
| | | | | | | |
Net charge-offs | | | (59,976 | ) | | | (4,499 | ) | | | (9,989 | ) | | | (34 | ) | | | (15,064 | ) | | | (139 | ) | | | (89,701 | ) |
| | | | | | | |
Net (write-downs) recoveries | | | (37,908 | ) | | | — | | | | — | | | | — | | | | — | | | | — | | | | (37,908 | ) |
| | | | | | | | | | | | | | | | | | | | | | | | | | | | |
Specific allowance for loan losses at December 31, 2015 | | $ | 49,243 | | | $ | 264 | | | $ | 44,029 | | | $ | — | | | $ | 23,963 | | | $ | 573 | | | $ | 118,072 | |
| | | | | | | | | | | | | | | | | | | | | | | | | | | | |
Table 49 - Activity in Specific ALLL for the Year Ended December 31, 2014
| | | | | | | | | | | | | | | | | | | | | | | | | | | | |
(In thousands) | | Commercial | | | Construction | | | Mortgage | | | Legacy | | | Consumer | | | Leasing | | | Total | |
Beginning balance | | $ | 16,409 | | | $ | 177 | | | $ | 55,667 | | | $ | — | | | $ | 30,200 | | | $ | 1,053 | | | $ | 103,506 | |
Provision for impaired loans (reversal of provision) | | | 78,340 | | | | 2,444 | | | | (276 | ) | | | — | | | | 13,800 | | | | (273 | ) | | | 94,035 | |
Reversal of provision for impaired loans - Discontinued operations | | | — | | | | — | | | | — | | | | — | | | | (70 | ) | | | — | | | | (70 | ) |
| | | | | | | |
Net charge-offs | | | (30,013 | ) | | | (2,258 | ) | | | (9,280 | ) | | | — | | | | (15,769 | ) | | | (10 | ) | | | (57,330 | ) |
| | | | | | | | | | | | | | | | | | | | | | | | | | | | |
Specific allowance for loan losses at December 31, 2014 | | $ | 64,736 | | | $ | 363 | | | $ | 46,111 | | | $ | — | | | $ | 28,161 | | | $ | 770 | | | $ | 140,141 | |
| | | | | | | | | | | | | | | | | | | | | | | | | | | | |
The table that follows presents the approximate amount and percentage of non-covered impaired loans for which the Corporation relied on appraisals dated more than one year old for purposes of impairment requirements at December 31, 2015.
90
Table 50 - Non-Covered Impaired Loans With Appraisals Dated 1 Year Or Older
| | | | | | | | | | | | |
December 31, 2015 | |
| | | Total Impaired Loans – Held-in-portfolio (HIP) | | | | |
(In thousands) | | Count | | | Outstanding Principal
Balance | | | Impaired Loans with
Appraisals Over One-
Year Old [1] | |
Commercial | | | 118 | | | $ | 281,478 | | | | 29 | % |
| [1] | Based on outstanding balance of total impaired loans. |
Table 51 - Non-Covered Impaired Loans With Appraisals Dated 1 Year Or Older
| | | | | | | | | | | | |
December 31, 2014 | |
| | | Total Impaired Loans – Held-in-portfolio (HIP) | | | | |
(In thousands) | | Count | | | Outstanding Principal
Balance | | | Impaired Loans with
Appraisals Over One-
Year Old [1] | |
Commercial | | | 140 | | | $ | 303,128 | | | | 12 | % |
Construction | | | 6 | | | | 10,693 | | | | 79 | |
| [1] | Based on outstanding balance of total impaired loans. |
The percentage of the Corporation’s impaired construction loans that were relied upon “as developed” and “as is” for the periods ended December 31, 2015 and 2014 are presented in the tables below.
Table 52 - Impaired Construction Loans Relied Upon “As is” or “As Developed”
| | | | | | | | | | | | | | | | | | | | | | | | | | | | |
December 31, 2015 | |
| | | “As is” | | | “As developed” | |
(In thousands) | | Count | | | Amount in $ | | | As a % of total
construction
impaired loans HIP | | | Count | | | Amount in $ | | | As a % of total
construction
impaired loans HIP | | | Average % of
completion | |
Loans held-in-portfolio | | | 6 | | | $ | 2,481 | | �� | | 100 | % | | | — | | | $ | — | | | | — | % | | | — | % |
Table 53 - Impaired Construction Loans Relied Upon “As is” or “As Developed”
| | | | | | | | | | | | | | | | | | | | | | | | | | | | |
December 31, 2014 | |
| | | “As is” | | | “As developed” | |
(In thousands) | | Count | | | Amount in $ | | | As a % of total
construction
impaired loans HIP | | | Count | | | Amount in $ | | | As a % of total
construction
impaired loans HIP | | | Average % of
completion | |
Loans held-in-portfolio | | | 7 | | | $ | 7,653 | | | | 58 | % | | | 2 | | | $ | 5,616 | | | | 42 | % | | | 87 | % |
At December 31, 2015, the Corporation accounted for $2 million impaired construction loans under the “as is” value. At December 31, 2015, there were no impaired construction loans under the “as developed” value.
Costs to complete are deducted from the subject “as developed” collateral value on impaired construction loans. Impairment determinations are calculated following the collateral dependent method, comparing the outstanding principal balance of the respective impaired construction loan against the expected realizable value of the subject collateral. Realizable values of subject collaterals have been defined as the “as developed” appraised value less costs to complete, costs to sell and discount factors. Costs to complete represent an estimate of the amount of money to be disbursed to complete a particular phase of a construction project. Costs to sell have been determined as a percentage of the subject collateral value, to cover related collateral disposition costs (e.g. legal and commission fees). Discount factors may be applied to the appraised amounts due to age or general market conditions.
91
Allowance for loan losses– Covered loan portfolio
The Corporation’s allowance for loan losses for the covered loan portfolio acquired in the Westernbank FDIC-assisted transaction amounted to $34 million at December 31, 2015, compared to $82 million at December 31, 2014. This decrease was mainly due to the expiration of the commercial loans share agreement with the FDIC on June 30, 2015. Accordingly, approximately $1.4 billion in loans were considered as non-covered as of December 31, 2015. As of June 30, 2015, an allowance of $13 million was transferred from covered to non-covered category. This allowance covers the estimated credit loss exposure related to: (i) acquired loans accounted for under ASC Subtopic 310-30, which required an allowance for loan losses of $34 million at December 31, 2015, compared with $79 million at December 31, 2014, or $94 million in December 31, 2013; and (ii) acquired loans accounted for under ASC Subtopic 310-20, which required an allowance for loan losses of $182 thousand at December 31, 2015, $3 million at December 31, 2014 and $8 million at December 31, 2013.
Decreases in expected cash flows after the acquisition date for loans (pools) accounted for under ASC Subtopic 310-30 are recognized by recording an allowance for loan losses in the current period. For purposes of loans accounted for under ASC Subtopic 310-20 and new loans originated as a result of loan commitments assumed, the Corporation’s assessment of the allowance for loan losses is determined in accordance with the accounting guidance of loss contingencies in ASC Subtopic 450-20 (general reserve for inherent losses) and loan impairment guidance in ASC Section 310-10-35 for loans individually evaluated for impairment. Concurrently, the Corporation records an increase in the FDIC loss share asset for the expected reimbursement from the FDIC under the loss sharing agreements.
Enterprise Risk and Operational Risk Management
The Financial and Operational Risk Management Division (the “FORM Division”) is responsible for overseeing the implementation of the Enterprise Risk Management (ERM) framework, as well as developing and overseeing the implementation of risk programs and reporting that facilitate a broad integrated view of risks. The FORM Division also leads the ongoing development of a strong risk management culture and the framework that support effective risk governance. For new products and initiatives, the Corporate Compliance Division has put in place processes to ensure that an appropriate standard readiness assessment is performed before launching a new product or initiative. Similar procedures are followed with the Treasury Division for transactions involving the purchase and sale of assets.
Operational risk can manifest itself in various ways, including errors, fraud, cyber attacks, business interruptions, inappropriate behavior of employees, and failure to perform in a timely manner, among others. These events can potentially result in financial losses and other damages to the Corporation, including reputational harm. The successful management of operational risk is particularly important to a diversified financial services company like Popular because of the nature, volume and complexity of its various businesses.
To monitor and control operational risk and mitigate related losses, the Corporation maintains a system of comprehensive policies and controls. The Corporation’s Operational Risk Committee (ORCO), which is composed of senior level representatives from the business lines and corporate functions, provides executive oversight to facilitate consistency of effective policies, best practices, controls and monitoring tools for managing and assessing all types of operational risks across the Corporation. The FORM Division, within the Corporation’s Risk Management Group, serves as ORCO’s operating arm and is responsible for establishing baseline processes to measure, monitor, limit and manage operational risk. In addition, the Auditing Division provides oversight about policy compliance and ensures adequate attention is paid to correct the identified issues.
Operational risks fall into two major categories: business specific and corporate-wide affecting all business lines. The primary responsibility for the day-to-day management of business specific risks relies on business unit managers. Accordingly, business unit managers are responsible for ensuring that appropriate risk containment measures, including corporate-wide or business segment specific policies and procedures, controls and monitoring tools, are in place to minimize risk occurrence and loss exposures. Examples of these include personnel management practices, data reconciliation processes, transaction processing monitoring and analysis and contingency plans for systems interruptions. To manage corporate-wide risks, specialized functions, such as Legal, Information Security, Business Continuity and Outsourcing Risk Management, and Finance and Compliance, among others, assist the business units in the development and implementation of risk management practices specific to the needs of the individual businesses.
92
Operational risk management plays a different role in each category. For business specific risks, the FORM Division works with the segments to ensure consistency in policies, processes, and assessments. With respect to corporate-wide risks, such as information security, business continuity and outsourcing risk management, legal and compliance, the risks are assessed and a consolidated corporate view is developed and communicated to the business level. Procedures exist that are designed to ensure that policies relating to conduct, ethics, and business practices are followed. We continually monitor the system of internal controls, data processing systems, and corporate-wide processes and procedures to manage operational risk at appropriate, cost-effective levels. An additional level of review is applied to current and potential regulation and its impact on business processes, to ensure that appropriate controls are put in place to address regulation requirements. Today’s threats to customer information and information systems are complex, more wide spread, continually emerging, and increasing at a rapid pace. The Corporation continuously monitors these threats and, to date, we have not experienced any material losses as a result of cyber attacks.
ADOPTION OF NEW ACCOUNTING STANDARDS AND ISSUED BUT NOT YET EFFECTIVE ACCOUNTING STANDARDS
Refer to Note 3, “New Accounting Pronouncements” to the consolidated financial statements.
93
Adjusted results of operations – Non-GAAP Financial Measure
The Corporation prepares its Consolidated Financial Statements using accounting principles generally accepted in the U.S. (“U.S. GAAP”), the (“reported basis”). In addition to analyzing the Corporation’s results on a reported basis, management monitors the performance of the Corporation on an “adjusted basis” and excludes the impact of certain transactions on the results of its operations. Through this MD&A, the Corporation presents a discussion of its financial results excluding the impact of these events to arrive at the “adjusted results”. Management believes that the “adjusted basis” provides meaningful information about the underlying performance of the Corporation’s ongoing operations. The “adjusted results” are a Non-GAAP financial measure. Refer to the following tables for a reconciliation of the reported results to the “adjusted results” for the years ended December 31, 2015, 2014 and 2013.
94
Table 54 - Adjusted Consolidated Statement of Operations for the Year Ended December 31, 2015 (Non-GAAP)
| | | | | | | | | | | | | | | | | | | | | | | | | | | | | | | | | | | | | | | | | | | | |
| | | | | | For the year ended December 31, 2015 | |
(In thousands) | | Actual
Results
(U.S.
GAAP) | | | BPNA
Reorganization
[2] | | | Doral
Transaction
[3] | | | OTTI
[4] | | | Reversal of
DTA - U.S.
Operations
[5] | | | Loss on
Bulk Sale
of Covered
OREOs [6] | | | Adjustment
to FDIC
Indemnification
Asset [7] | | | MSRs
Acquired
[8] | | | Impairment
of Loans
Under
Proposed
Portfolio
Sale [9] | | | Bulk Sale
[10] | | | Adjusted
Results
(Non-
GAAP) | |
Net interest income | | $ | 1,408,983 | | | $ | — | | | $ | — | | | $ | — | | | $ | — | | | $ | — | | | $ | — | | | $ | — | | | $ | — | | | $ | — | | | $ | 1,408,983 | |
Provision for loan losses – non-covered loans | | | 217,458 | | | | — | | | | — | | | | — | | | | — | | | | — | | | | — | | | | — | | | | 15,190 | | | | 5,852 | | | | 196,416 | |
Provision for loan losses – covered loans [1] | | | 24,020 | | | | — | | | | — | | | | — | | | | — | | | | — | | | | — | | | | — | | | | — | | | | — | | | | 24,020 | |
| | | | | | | | | | | | | | | | | | | | | | | | | | | | | | | | | | | | | | | | | | | | |
Net interest income after provision for loan losses | | | 1,167,505 | | | | — | | | | — | | | | — | | | | — | | | | — | | | | — | | | | — | | | | (15,190 | ) | | | (5,852 | ) | | | 1,188,547 | |
Mortgage banking activities | | | 81,802 | | | | — | | | | 844 | | | | — | | | | — | | | | — | | | | — | | | | 4,378 | | | | — | | | | — | | | | 76,580 | |
| | | | | | | | | | | |
Other-than-temporary impairment losses on investment securities | | | (14,445 | ) | | | — | | | | — | | | | (14,445 | ) | | | — | | | | — | | | | — | | | | — | | | | — | | | | — | | | | — | |
FDIC loss share income (expense) | | | 20,062 | | | | — | | | | — | | | | — | | | | — | | | | 17,566 | | | | (10,887 | ) | | | — | | | | — | | | | — | | | | 13,383 | |
Other non-interest income | | | 432,122 | | | | — | | | | 2,072 | | | | — | | | | — | | | | — | | | | — | | | | — | | | | — | | | | — | | | | 430,050 | |
| | | | | | | | | | | | | | | | | | | | | | | | | | | | | | | | | | | | | | | | | | | | |
Total non-interest income | | | 519,541 | | | | — | | | | 2,916 | | | | (14,445 | ) | | | — | | | | 17,566 | | | | (10,887 | ) | | | 4,378 | | | | — | | | | — | | | | 520,013 | |
| | | | | | | | | | | | | | | | | | | | | | | | | | | | | | | | | | | | | | | | | | | | |
Personnel costs | | | 477,519 | | | | — | | | | 7,103 | | | | — | | | | — | | | | — | | | | — | | | | — | | | | — | | | | — | | | | 470,416 | |
Net occupancy expenses | | | 86,888 | | | | — | | | | 4,103 | | | | — | | | | — | | | | — | | | | — | | | | — | | | | — | | | | — | | | | 82,785 | |
Equipment expenses | | | 60,110 | | | | — | | | | 725 | | | | — | | | | — | | | | — | | | | — | | | | — | | | | — | | | | — | | | | 59,385 | |
Professional fees | | | 308,985 | | | | — | | | | 15,481 | | | | — | | | | — | | | | — | | | | — | | | | — | | | | — | | | | — | | | | 293,504 | |
Communications | | | 25,146 | | | | — | | | | 70 | | | | — | | | | — | | | | — | | | | — | | | | — | | | | — | | | | — | | | | 25,076 | |
Business promotion | | | 52,076 | | | | — | | | | 501 | | | | — | | | | — | | | | — | | | | — | | | | — | | | | — | | | | — | | | | 51,575 | |
Other real estate owned (OREO) expenses | | | 85,568 | | | | — | | | | — | | | | — | | | | — | | | | 21,957 | | | | — | | | | — | | | | — | | | | — | | | | 63,611 | |
Amortization of intangibles | | | 11,019 | | | | — | | | | — | | | | — | | | | — | | | | — | | | | — | | | | — | | | | — | | | | — | | | | 11,019 | |
| | | | | | | | | | | |
Restructuring costs | | | 18,412 | | | | 18,412 | | | | — | | | | — | | | | — | | | | — | | | | — | | | | — | | | | — | | | | — | | | | — | |
Other operating expenses | | | 162,498 | | | | — | | | | 509 | | | | — | | | | — | | | | — | | | | — | | | | — | | | | — | | | | — | | | | 161,989 | |
| | | | | | | | | | | | | | | | | | | | | | | | | | | | | | | | | | | | | | | | | | | | |
Total operating expenses | | | 1,288,221 | | | | 18,412 | | | | 28,492 | | | | — | | | | — | | | | 21,957 | | | | — | | | | — | | | | — | | | | — | | | | 1,219,360 | |
| | | | | | | | | | | | | | | | | | | | | | | | | | | | | | | | | | | | | | | | | | | | |
| | | | | | | | | | | |
Income from continuing operations before income tax | | | 398,825 | | | | (18,412 | ) | | | (25,576 | ) | | | (14,445 | ) | | | — | | | | (4,391 | ) | | | (10,887 | ) | | | 4,378 | | | | (15,190 | ) | | | (5,852 | ) | | | 489,200 | |
Income tax (benefit) expense | | | (495,172 | ) | | | — | | | | (7,690 | ) | | | (2,486 | ) | | | (589,030 | ) | | | (1,712 | ) | | | (2,177 | ) | | | 1,707 | | | | (5,924 | ) | | | (2,282 | ) | | | 114,422 | |
| | | | | | | | | | | | | | | | | | | | | | | | | | | | | | | | | | | | | | | | | | | | |
Income from continuing operations | | $ | 893,997 | | | $ | (18,412 | ) | | $ | (17,886 | ) | | $ | (11,959 | ) | | $ | 589,030 | | | $ | (2,679 | ) | | $ | (8,710 | ) | | $ | 2,671 | | | $ | (9,266 | ) | | $ | (3,570 | ) | | $ | 374,778 | |
| | | | | | | | | | | | | | | | | | | | | | | | | | | | | | | | | | | | | | | | | | | | |
Income from discontinued operations, net of tax | | $ | 1,347 | | | $ | 1,347 | | | $ | — | | | $ | — | | | $ | — | | | $ | — | | | $ | — | | | $ | — | | | $ | — | | | $ | — | | | $ | — | |
| | | | | | | | | | | | | | | | | | | | | | | | | | | | | | | | | | | | | | | | | | | | |
Net income | | $ | 895,344 | | | $ | (17,065 | ) | | $ | (17,886 | ) | | $ | (11,959 | ) | | $ | 589,030 | | | $ | (2,679 | ) | | $ | (8,710 | ) | | $ | 2,671 | | | $ | (9,266 | ) | | $ | (3,570 | ) | | $ | 374,778 | |
| | | | | | | | | | | | | | | | | | | | | | | | | | | | | | | | | | | | | | | | | | | | |
| [1] | Covered loans represent loans acquired in the Westernbank FDIC-assisted transaction that are covered under an FDIC loss-sharing agreement. |
95
| [2] | Represents restructuring charges associated with the reorganization of BPNA. |
| [3] | Includes approximately $0.8 million of fees charged for loan servicing cost to the FDIC, $2.1 million of fees charged for services provided to the alliance co-bidders, personnel costs related to former Doral Bank employees retained on a temporary basis and incentive compensation for an aggregate of $7.1 million, building rent expense of Doral Bank’s administrative offices for $4.1 million, professional fees and business promotion expenses directly associated with the Doral Bank Transaction and systems conversion for $16.0 million and other expenses, including equipment, business promotions and communications, of $1.3 million |
| [4] | Represents an other than temporary impairment (“OTTI”) recorded on Puerto Rico government investment securities available-for-sale. These securities had an amortized cost of approximately $41.1 million and a market value of $26.6 million. Based on the fiscal and economic situation in Puerto Rico, together with the government’s announcements regarding its ability to pay its debt, the Corporation determined that the unrealized loss, a portion of which had been in an unrealized loss for a period exceeding twelve months, was other than temporary. |
| [5] | Represents the partial reversal of the valuation allowance of a portion of the deferred tax asset amounting to approximately $1.2 billion, at the U.S. operations. |
| [6] | Represents the loss on a bulk sale of covered OREOs completed in the second quarter and the related mirror accounting of the 80% reimbursable from the FDIC. |
| [7] | The year’s negative amortization of the FDIC’s Indemnification Asset included a $10.9 million expense related to losses incurred by the corporation that were not claimed to the FDIC before the expiration of the loss-share portion of the agreement on June 30, 2015, and that are not subject to the ongoing arbitrations. |
| [8] | Represents the fair value of mortgage servicing rights acquired for a portfolio previously serviced by Doral Bank, for which the Corporation acted as a backup servicer, under a pre-existing contract. |
| [9] | Represents impairment based on the estimated fair value of loans acquired from Westernbank, that the Corporation has the intent to sell and are subject to the ongoing arbitration with the FDIC. |
| [10] | Represents the impact of a bulk sale of loans at the BPPR segment, which had a book value of approximately $34.4 million. |
96
Table 55 - Adjusted Consolidated Statement of Operations for Year Ended December 31, 2014 (Non-GAAP)
| | | | | | | | | | | | | | | | | | | | | | | | | | | | |
| | | For the year ended December 31, 2014 | |
(In thousands) | | Actual Results
(U.S. GAAP) | | | TARP repayment
discount amortization
and Income Tax
adjustments [2] | | | BPNA
Reorganization
[3] | | | Income Tax
Adjustments [4] | | | Indemnification
Asset
Adjustment [5] | | | Other
Adjustments
[6] | | | Adjusted Results
(Non-GAAP) | |
| | | | | | | |
Net interest income | | $ | 945,072 | | | $ | (414,068 | ) | | $ | (39,254 | ) | | $ | — | | | $ | — | | | $ | — | | | $ | 1,398,394 | |
Provision for loan losses – non-covered loans | | | 223,999 | | | | — | | | | 12,828 | | | | — | | | | — | | | | — | | | | 211,171 | |
Provision for loan losses – covered loans [1] | | | 46,135 | | | | — | | | | — | | | | — | | | | — | | | | — | | | | 46,135 | |
| | | | | | | | | | | | | | | | | | | | | | | | | | | | |
Net interest income after provision for loan losses | | | 674,938 | | | | (414,068 | ) | | | (52,082 | ) | | | — | | | | — | | | | — | | | | 1,141,088 | |
Mortgage banking activities | | | 30,615 | | | | — | | | | — | | | | — | | | | — | | | | — | | | | 30,615 | |
Net gain on sale of loans, including valuation adjustments on loans held-for-sale | | | 40,591 | | | | — | | | | 1,684 | | | | — | | | | — | | | | — | | | | 38,907 | |
FDIC loss-share income (expense) | | | (103,024 | ) | | | — | | | | — | | | | — | | | | 12,492 | | | | — | | | | (115,516 | ) |
Other non-interest income | | | 418,333 | | | | — | | | | — | | | | — | | | | — | | | | — | | | | 418,333 | |
| | | | | | | | | | | | | | | | | | | | | | | | | | | | |
Total non-interest income | | | 386,515 | | | | — | | | | 1,684 | | | | — | | | | 12,492 | | | | — | | | | 372,339 | |
| | | | | | | | | | | | | | | | | | | | | | | | | | | | |
Personnel costs | | | 418,679 | | | | — | | | | — | | | | — | | | | — | | | | 2,974 | | | | 415,705 | |
Net occupancy expenses | | | 86,707 | | | | — | | | | — | | | | — | | | | — | | | | 1,895 | | | | 84,812 | |
Equipment expenses | | | 48,917 | | | | — | | | | — | | | | — | | | | — | | | | — | | | | 48,917 | |
Loss on early extinguishment of debt | | | 532 | | | | — | | | | 532 | | | | — | | | | — | | | | — | | | | — | |
Professional fees | | | 282,055 | | | | — | | | | — | | | | — | | | | — | | | | — | | | | 282,055 | |
Communications | | | 25,684 | | | | — | | | | — | | | | — | | | | — | | | | — | | | | 25,684 | |
Business promotion | | | 54,016 | | | | — | | | | — | | | | — | | | | — | | | | — | | | | 54,016 | |
Other real estate owned (OREO) expenses | | | 49,611 | | | | — | | | | — | | | | — | | | | — | | | | — | | | | 49,611 | |
Restructuring costs | | | 26,725 | | | | — | | | | 26,725 | | | | — | | | | — | | | | — | | | | — | |
Other operating expenses | | | 200,758 | | | | — | | | | — | | | | — | | | | — | | | | — | | | | 200,758 | |
| | | | | | | | | | | | | | | | | | | | | | | | | | | | |
Total operating expenses | | | 1,193,684 | | | | — | | | | 27,257 | | | | — | | | | — | | | | 4,869 | | | | 1,161,558 | |
| | | | | | | | | | | | | | | | | | | | | | | | | | | | |
(Loss) income from continuing operations before income tax | | | (132,231 | ) | | | (414,068 | ) | | | (77,655 | ) | | | — | | | | 12,492 | | | | (4,869 | ) | | | 351,869 | |
Income tax expense | | | 58,279 | | | | (15,393 | ) | | | — | | | | 20,048 | | | | 2,498 | | | | — | | | | 51,126 | |
| | | | | | | | | | | | | | | | | | | | | | | | | | | | |
(Loss) income from continuing operations | | $ | (190,510 | ) | | $ | (398,675 | ) | | $ | (77,655 | ) | | $ | (20,048 | ) | | $ | 9,994 | | | $ | (4,869 | ) | | $ | 300,743 | |
| | | | | | | | | | | | | | | | | | | | | | | | | | | | |
| | | | | | | |
(Loss) income from discontinued operations, net of tax | | $ | (122,980 | ) | | $ | — | | | $ | (122,980 | ) | | $ | — | | | $ | — | | | $ | — | | | $ | — | |
| | | | | | | | | | | | | | | | | | | | | | | | | | | | |
Net (loss) income | | $ | (313,490 | ) | | $ | (398,675 | ) | | $ | (200,635 | ) | | $ | (20,048 | ) | | $ | 9,994 | | | $ | (4,869 | ) | | $ | 300,743 | |
| | | | | | | | | | | | | | | | | | | | | | | | | | | | |
| [1] | Covered loans represent loans acquired in the Westernbank FDIC-assisted transaction that are covered under an FDIC loss-sharing agreement. |
| [2] | Income tax adjustments include a benefit of approximately $23.4 million related to a Closing Agreement with the PR Department of Treasury, completed during the second quarter of 2014 and the negative impact of the deferred tax asset valuation allowance of approximately $8.0 million recorded at the Holding Company, due to the difference in the tax treatment of the interest expense related to the TARP funds and the newly issued $450 million senior notes. |
| [3] | Includes the aggregated impact of $39.8 million refinancing fees of structured repos, net loss of $11.1 million in bulk loan sales and $26.7 million in restructuring incurred in connection with the reorganization of PCB. |
97
| [4] | On July 1, 2014, the Government of Puerto Rico approved an amendment to the Internal Revenue Code, which , among other things, changed the income tax rate for capital gains for 15% to 20%. As a result, the Corporation recognized an income tax expense of $20.0 million, mainly related to the deferred tax liability associated with the portfolio acquired from Westernbank. |
| [5] | The FDIC indemnity asset amortization included a positive adjustment of $12.5 million to reverse the impact of accelerated amortization expense recorded in prior periods. |
| [6] | Represents the impact of the compensation package granted upon separation of an officer of the Corporation equal to approximately $3.0 million and represents the net loss on the early cancellation of a lease at BPNA $1.9 million. |
Table 56-Adjusted Consolidated Statement of Operations (Non-GAAP) - Comparative
| | | | | | | | | | | | |
| | | Adjusted Results (Non-GAAP)
for the years ended | |
(In thousands) | | December 31,
2015 | | | December 31,
2014 | | | Variance | |
Net interest income | | $ | 1,408,983 | | | $ | 1,398,394 | | | $ | 10,589 | |
Provision for loan losses – non-covered loans | | | 196,416 | | | | 211,171 | | | | (14,755 | ) |
Provision for loan losses – covered loans [1] | | | 24,020 | | | | 46,135 | | | | (22,115 | ) |
| | | | | | | | | | | | |
Net interest income after provision for loan losses | | | 1,188,547 | | | | 1,141,088 | | | | 47,459 | |
Mortgage banking activities | | | 76,580 | | | | 30,615 | | | | 45,965 | |
Net gain and valuation adjustments of investment securities | | | 141 | | | | 38,907 | | | | (38,766 | ) |
FDIC loss share income (expense) | | | 13,383 | | | | (115,516 | ) | | | 128,899 | |
Other non-interest income | | | 429,909 | | | | 418,333 | | | | 11,576 | |
| | | | | | | | | | | | |
Total non-interest income | | | 520,013 | | | | 372,339 | | | | 147,674 | |
| | | | | | | | | | | | |
Personnel costs | | | 470,416 | | | | 415,705 | | | | 54,711 | |
Net occupancy expenses | | | 82,785 | | | | 84,812 | | | | (2,027 | ) |
Equipment expenses | | | 59,385 | | | | 48,917 | | | | 10,468 | |
Professional fees | | | 293,504 | | | | 282,055 | | | | 11,449 | |
Communications | | | 25,076 | | | | 25,684 | | | | (608 | ) |
Business promotion | | | 51,575 | | | | 54,016 | | | | (2,441 | ) |
Other real estate owned (OREO) expenses | | | 63,611 | | | | 49,611 | | | | 14,000 | |
Other operating expenses | | | 173,008 | | | | 200,758 | | | | (27,750 | ) |
| | | | | | | | | | | | |
Total operating expenses | | | 1,219,360 | | | | 1,161,558 | | | | 57,802 | |
| | | | | | | | | | | | |
Income from continuing operations before income tax | | | 489,200 | | | | 351,869 | | | | 137,331 | |
Income tax expense (benefit) | | | 114,422 | | | | 51,126 | | | | 63,296 | |
| | | | | | | | | | | | |
Income from continuing operations | | $ | 374,778 | | | $ | 300,743 | | | $ | 74,035 | |
| | | | | | | | | | | | |
Net income | | $ | 374,778 | | | $ | 300,743 | | | $ | 74,035 | |
| | | | | | | | | | | | |
| [1] | Covered loans represent loans acquired in the Westernbank FDIC-assisted transaction that are covered under an FDIC loss-sharing agreement. |
98
Table 57—Adjusted Consolidated Statement of Operations for Year Ended December 31, 2013 (Non-GAAP)
| | | | | | | | | | | | | | | | | | | | | | | | | | | | |
| | | For the year ended December 31, 2013 | |
(In thousands) | | Actual
Results
(U.S. GAAP) | | | Impact of
Sale of
NPAs [2] | | | Impact of
Sale of
NPLs | | | Income Tax
Adjustments [3] | | | Impact of
EVERTEC’s PO | | | BPNA
Reorganization | | | Adjusted
Results
(Non-GAAP) | |
Net interest income | | $ | 1,344,574 | | | $ | — | | | $ | — | | | $ | — | | | $ | 1,502 | | | $ | — | | | $ | 1,343,072 | |
Provision for loan losses – non-covered loans | | | 536,710 | | | | 148,823 | | | | 169,248 | | | | — | | | | — | | | | — | | | | 218,639 | |
Provision for loan losses – covered loans [1] | | | 69,396 | | | | — | | | | — | | | | — | | | | — | | | | — | | | | 69,396 | |
| | | | | | | | | | | | | | | | | | | | | | | | | | | | |
Net interest income after provision for loan losses | | | 738,468 | | | | (148,823 | ) | | | (169,248 | ) | | | — | | | | 1,502 | | | | — | | | | 1,055,037 | |
Mortgage banking activities | | | 71,657 | | | | — | | | | — | | | | — | | | | — | | | | — | | | | 71,657 | |
Net gain and valuation adjustments on investments securities | | | 7,966 | | | | — | | | | — | | | | — | | | | 5,856 | | | | — | | | | 2,110 | |
Net (loss) gain on sale of loans, including valuation adjustments on loans held-for-sale | | | (52,708 | ) | | | (61,387 | ) | | | (3,865 | ) | | | — | | | | — | | | | — | | | | 12,544 | |
Adjustments (expense) to indemnity reserves on loans sold | | | (37,054 | ) | | | (10,700 | ) | | | (3,047 | ) | | | — | | | | — | | | | — | | | | (23,307 | ) |
FDIC loss-share expense | | | (82,051 | ) | | | — | | | | — | | | | — | | | | — | | | | — | | | | (82,051 | ) |
Other non-interest income | | | 883,203 | | | | — | | | | — | | | | — | | | | 430,316 | | | | — | | | | 452,887 | |
| | | | | | | | | | | | | | | | | | | | | | | | | | | | |
Total non-interest income | | | 791,013 | | | | (72,087 | ) | | | (6,912 | ) | | | — | | | | 436,172 | | | | — | | | | 433,840 | |
| | | | | | | | | | | | | | | | | | | | | | | | | | | | |
Personnel costs | | | 428,697 | | | | — | | | | — | | | | — | | | | — | | | | — | | | | 428,697 | |
Net occupancy expenses | | | 86,651 | | | | — | | | | — | | | | — | | | | — | | | | — | | | | 86,651 | |
Equipment expenses | | | 46,028 | | | | — | | | | — | | | | — | | | | — | | | | — | | | | 46,028 | |
Loss on early extinguishment of debt | | | 3,388 | | | | — | | | | — | | | | — | | | | — | | | | — | | | | 3,388 | |
Professional fees | | | 278,127 | | | | 5 | | | | — | | | | — | | | | 1,106 | | | | — | | | | 277,016 | |
Communications | | | 25,385 | | | | — | | | | — | | | | — | | | | — | | | | — | | | | 25,385 | |
Business promotion | | | 59,453 | | | | — | | | | — | | | | — | | | | — | | | | — | | | | 59,453 | |
Other real estate owned (OREO) expenses | | | 79,658 | | | | 37,046 | | | | — | | | | — | | | | — | | | | — | | | | 42,612 | |
Other operating expenses | | | 214,603 | | | | — | | | | — | | | | — | | | | — | | | | — | | | | 214,603 | |
| | | | | | | | | | | | | | | | | | | | | | | | | | | | |
Total operating expenses | | | 1,221,990 | | | | 37,051 | | | | — | | | | — | | | | 1,106 | | | | — | | | | 1,183,833 | |
| | | | | | | | | | | | | | | | | | | | | | | | | | | | |
Income (loss) from continuing operations before income tax | | | 307,491 | | | | (257,961 | ) | | | (176,160 | ) | | | — | | | | 436,568 | | | | — | | | | 305,044 | |
Income tax (benefit) expense | | | (251,327 | ) | | | (77,388 | ) | | | (68,987 | ) | | | (218,035 | ) | | | 23,722 | | | | — | | | | 89,361 | |
| | | | | | | | | | | | | | | | | | | | | | | | | | | | |
Income (loss) from continuing operations | | $ | 558,818 | | | $ | (180,573 | ) | | $ | (107,173 | ) | | $ | 218,035 | | | $ | 412,846 | | | $ | — | | | $ | 215,683 | |
| | | | | | | | | | | | | | | | | | | | | | | | | | | | |
Income from discontinued operations, net of tax | | $ | 40,509 | | | $ | — | | | $ | — | | | $ | — | | | $ | — | | | $ | 40,509 | | | $ | — | |
| | | | | | | | | | | | | | | | | | | | | | | | | | | | |
Net income (loss) | | $ | 599,327 | | | $ | (180,573 | ) | | $ | (107,173 | ) | | $ | 218,035 | | | $ | 412,846 | | | $ | 40,509 | | | $ | 215,683 | |
| | | | | | | | | | | | | | | | | | | | | | | | | | | | |
| [1] | Covered loans represent loans acquired in the Westernbank FDIC-assisted transaction that are covered under an FDIC loss-sharing agreement. |
| [2] | Net (loss) gain on sale of loans for the first quarter includes $8.8 million of negative valuation adjustments on loans held-for-sale which were transferred to held-in-portfolio subsequent to the sale. |
| [3] | Represents the net benefit of $215.6 million n for the increase on the net deferred tax asset from the change of the corporate tax return from 30% to 39% which includes the adjustment for the result of the first quarter of 2013, $7.9 million resulting from the adjustment in tax rate for distribution from EVERTEC from 15% to 4%, offset by an adjustment of $5.5 million on the deferred tax liability related to the covered loans portfolio. |
99
Table 58 —Adjusted Consolidated Statement of Operations (Non-GAAP) —Comparative
| | | | | | | | | | | | |
| | | Adjusted Results (Non-GAAP)
for the years ended | |
(In thousands) | | December 31,
2014 | | | December 31,
2013 | | | Variance | |
Net interest income | | $ | 1,398,394 | | | $ | 1,343,072 | | | $ | 55,322 | |
Provision for loan losses – non-covered loans | | | 211,171 | | | | 218,639 | | | | (7,468 | ) |
Provision for loan losses – covered loans [1] | | | 46,135 | | | | 69,396 | | | | (23,261 | ) |
| | | | | | | | | | | | |
Net interest income after provision for loan losses | | | 1,141,088 | | | | 1,055,037 | | | | 86,051 | |
Mortgage banking activities | | | 30,615 | | | | 71,657 | | | | (41,042 | ) |
Net gain and valuation adjustments of investment securities | | | 38,907 | | | | 2,110 | | | | 36,797 | |
FDIC loss share expense | | | (115,516 | ) | | | (82,051 | ) | | | (33,465 | ) |
Other non-interest income | | | 418,333 | | | | 442,124 | | | | (23,791 | ) |
| | | | | | | | | | | | |
Total non-interest income | | | 372,339 | | | | 433,840 | | | | (61,501 | ) |
| | | | | | | | | | | | |
Personnel costs | | | 415,705 | | | | 428,697 | | | | (12,992 | ) |
Net occupancy expenses | | | 84,812 | | | | 86,651 | | | | (1,839 | ) |
Equipment expenses | | | 48,917 | | | | 46,028 | | | | 2,889 | |
Professional fees | | | 282,055 | | | | 277,016 | | | | 5,039 | |
Communications | | | 25,684 | | | | 25,385 | | | | 299 | |
Business promotion | | | 54,016 | | | | 59,453 | | | | (5,437 | ) |
Other real estate owned (OREO) expenses | | | 49,611 | | | | 42,612 | | | | 6,999 | |
Other operating expenses | | | 200,758 | | | | 217,991 | | | | (17,233 | ) |
| | | | | | | | | | | | |
Total operating expenses | | | 1,161,558 | | | | 1,183,833 | | | | (22,275 | ) |
| | | | | | | | | | | | |
Income from continuing operations before income tax | | | 351,869 | | | | 305,044 | | | | 46,825 | |
Income tax expense | | | 51,126 | | | | 89,361 | | | | (38,235 | ) |
| | | | | | | | | | | | |
Income from continuing operations | | $ | 300,743 | | | $ | 215,683 | | | $ | 85,060 | |
| | | | | | | | | | | | |
Net income | | $ | 300,743 | | | $ | 215,683 | | | $ | 85,060 | |
| | | | | | | | | | | | |
| [1] | Covered loans represent loans acquired in the Westernbank FDIC-assisted transaction that are covered under an FDIC loss-sharing agreement. |
100
Statistical Summary 2011-2015
Statements of Financial Condition
| | | | | | | | | | | | | | | | | | | | |
| | | At December 31, | |
(In thousands) | | 2015 | | | 2014 | | | 2013 | | | 2012 | | | 2011 | |
Assets: | | | | | | | | | | | | | | | | | | | | |
Cash and due from banks | | $ | 363,674 | | | $ | 381,095 | | | $ | 423,211 | | | $ | 439,363 | | | $ | 535,282 | |
| | | | | | | | | | | | | | | | | | | | |
Money market investments: | | | | | | | | | | | | | | | | | | | | |
Federal funds sold and securities purchased under agreements to resell | | | 96,338 | | | | 151,134 | | | | 181,020 | | | | 246,977 | | | | 327,668 | |
Time deposits with other banks | | | 2,083,754 | | | | 1,671,252 | | | | 677,433 | | | | 838,603 | | | | 1,048,506 | |
| | | | | | | | | | | | | | | | | | | | |
Total money market investments | | | 2,180,092 | | | | 1,822,386 | | | | 858,453 | | | | 1,085,580 | | | | 1,376,174 | |
| | | | | | | | | | | | | | | | | | | | |
Trading account securities, at fair value | | | 71,659 | | | | 138,527 | | | | 339,743 | | | | 314,525 | | | | 436,331 | |
Investment securities available-for-sale, at fair value | | | 6,062,992 | | | | 5,315,159 | | | | 5,294,800 | | | | 5,084,201 | | | | 5,009,823 | |
Investment securities held-to-maturity, at amortized cost | | | 100,903 | | | | 103,170 | | | | 140,496 | | | | 142,817 | | | | 125,383 | |
Other investment securities, at lower of cost or realizable value | | | 172,248 | | | | 161,906 | | | | 181,752 | | | | 185,443 | | | | 179,880 | |
Loans held-for-sale, at lower of cost or fair value | | | 137,000 | | | | 106,104 | | | | 110,426 | | | | 354,468 | | | | 363,093 | |
| | | | | | | | | | | | | | | | | | | | |
Loans held-in-portfolio: | | | | | | | | | | | | | | | | | | | | |
Loans not covered under loss-sharing agreements with the FDIC | | | 22,453,813 | | | | 19,498,286 | | | | 21,704,010 | | | | 21,080,005 | | | | 20,703,192 | |
Loans covered under loss-sharing agreements with the FDIC | | | 646,115 | | | | 2,542,662 | | | | 2,984,427 | | | | 3,755,972 | | | | 4,348,703 | |
Less – Unearned income | | | 107,698 | | | | 93,835 | | | | 92,144 | | | | 96,813 | | | | 100,596 | |
Allowance for loan losses | | | 537,111 | | | | 601,792 | | | | 640,555 | | | | 730,607 | | | | 815,308 | |
| | | | | | | | | | | | | | | | | | | | |
Total loans held-in-portfolio, net | | | 22,455,119 | | | | 21,345,321 | | | | 23,955,738 | | | | 24,008,557 | | | | 24,135,991 | |
| | | | | | | | | | | | | | | | | | | | |
FDIC loss-share asset | | | 310,221 | | | | 542,454 | | | | 948,608 | | | | 1,399,098 | | | | 1,915,128 | |
Premises and equipment, net | | | 502,611 | | | | 494,581 | | | | 519,516 | | | | 535,793 | | | | 538,486 | |
Other real estate not covered under loss-sharing agreements with the FDIC | | | 155,231 | | | | 135,500 | | | | 135,501 | | | | 266,844 | | | | 172,497 | |
Other real estate covered under loss-sharing agreements with the FDIC | | | 36,685 | | | | 130,266 | | | | 168,007 | | | | 139,058 | | | | 109,135 | |
Accrued income receivable | | | 124,234 | | | | 121,818 | | | | 131,536 | | | | 125,728 | | | | 125,209 | |
Mortgage servicing assets, at fair value | | | 211,405 | | | | 148,694 | | | | 161,099 | | | | 154,430 | | | | 151,323 | |
Other assets | | | 2,200,963 | | | | 1,646,443 | | | | 1,687,558 | | | | 1,569,578 | | | | 1,462,393 | |
Goodwill | | | 626,388 | | | | 465,676 | | | | 647,757 | | | | 647,757 | | | | 648,350 | |
Other intangible assets | | | 58,109 | | | | 37,595 | | | | 45,132 | | | | 54,295 | | | | 63,954 | |
| | | | | | | | | | | | | | | | | | | | |
Total assets | | $ | 35,769,534 | | | $ | 33,096,695 | | | $ | 35,749,333 | | | $ | 36,507,535 | | | $ | 37,348,432 | |
| | | | | | | | | | | | | | | | | | | | |
Liabilities and Stockholders’ Equity | | | | | | | | | | | | | | | | | | | | |
Liabilities: | | | | | | | | | | | | | | | | | | | | |
Deposits: | | | | | | | | | | | | | | | | | | | | |
Non-interest bearing | | $ | 6,401,515 | | | $ | 5,783,748 | | | $ | 5,922,682 | | | $ | 5,794,629 | | | $ | 5,655,474 | |
Interest bearing | | | 20,808,208 | | | | 19,023,787 | | | | 20,788,463 | | | | 21,205,984 | | | | 22,286,653 | |
| | | | | | | | | | | | | | | | | | | | |
Total deposits | | | 27,209,723 | | | | 24,807,535 | | | | 26,711,145 | | | | 27,000,613 | | | | 27,942,127 | |
| | | | | | | | | | | | | | | | | | | | |
Federal funds purchased and assets sold under agreements to repurchase | | | 762,145 | | | | 1,271,657 | | | | 1,659,292 | | | | 2,016,752 | | | | 2,141,097 | |
Other short-term borrowings | | | 1,200 | | | | 21,200 | | | | 401,200 | | | | 636,200 | | | | 296,200 | |
Notes payable | | | 1,670,309 | | | | 1,711,828 | | | | 1,584,754 | | | | 1,777,721 | | | | 1,856,372 | |
Other liabilities | | | 1,019,018 | | | | 1,012,029 | | | | 766,792 | | | | 966,249 | | | | 1,193,883 | |
Liabilities from discontinued operations | | | 1,815 | | | | 5,064 | | | | — | | | | — | | | | — | |
| | | | | | | | | | | | | | | | | | | | |
Total liabilities | | | 30,664,210 | | | | 28,829,313 | | | | 31,123,183 | | | | 32,397,535 | | | | 33,429,679 | |
| | | | | | | | | | | | | | | | | | | | |
Stockholders’ equity: | | | | | | | | | | | | | | | | | | | | |
Preferred stock | | | 50,160 | | | | 50,160 | | | | 50,160 | | | | 50,160 | | | | 50,160 | |
Common stock | | | 1,038 | | | | 1,036 | | | | 1,034 | | | | 1,032 | | | | 1,026 | |
Surplus | | | 4,229,156 | | | | 4,196,458 | | | | 4,170,152 | | | | 4,150,294 | | | | 4,123,898 | |
Retained earnings (accumulated deficit) | | | 1,087,957 | | | | 253,717 | | | | 594,430 | | | | 11,826 | | | | (212,726 | ) |
Treasury stock – at cost | | | (6,101 | ) | | | (4,117 | ) | | | (881 | ) | | | (444 | ) | | | (1,057 | ) |
Accumulated other comprehensive loss, net of tax | | | (256,886 | ) | | | (229,872 | ) | | | (188,745 | ) | | | (102,868 | ) | | | (42,548 | ) |
| | | | | | | | | | | | | | | | | | | | |
Total stockholders’ equity | | | 5,105,324 | | | | 4,267,382 | | | | 4,626,150 | | | | 4,110,000 | | | | 3,918,753 | |
| | | | | | | | | | | | | | | | | | | | |
Total liabilities and stockholders’ equity | | $ | 35,769,534 | | | $ | 33,096,695 | | | $ | 35,749,333 | | | $ | 36,507,535 | | | $ | 37,348,432 | |
| | | | | | | | | | | | | | | | | | | | |
101
Statistical Summary 2011-2015
Statements of Operations
| | | | | | | | | | | | | | | | | | | | |
| | | For the years ended December 31, | |
(In thousands) | | 2015 | | | 2014 | | | 2013 | | | 2012 | | | 2011 | |
Interest income: | | | | | | | | | | | | | | | | | | | | |
Loans | | $ | 1,458,706 | | | $ | 1,478,750 | | | $ | 1,481,096 | | | $ | 1,449,227 | | | $ | 1,561,377 | |
Money market investments | | | 7,243 | | | | 4,224 | | | | 3,464 | | | | 3,703 | | | | 3,596 | |
Investment securities | | | 126,064 | | | | 132,631 | | | | 141,807 | | | | 168,632 | | | | 205,828 | |
Trading account securities | | | 11,001 | | | | 17,938 | | | | 21,573 | | | | 22,824 | | | | 35,607 | |
| | | | | | | | | | | | | | | | | | | | |
Total interest income | | | 1,603,014 | | | | 1,633,543 | | | | 1,647,940 | | | | 1,644,386 | | | | 1,806,408 | |
Less - Interest expense | | | 194,031 | | | | 688,471 | | | | 303,366 | | | | 362,759 | | | | 484,860 | |
| | | | | | | | | | | | | | | | | | | | |
Net interest income | | | 1,408,983 | | | | 945,072 | | | | 1,344,574 | | | | 1,281,627 | | | | 1,321,548 | |
Provision for loan losses - non-covered loans | | | 217,458 | | | | 223,999 | | | | 536,710 | | | | 322,234 | | | | 395,853 | |
Provision for loan losses - covered loans | | | 24,020 | | | | 46,135 | | | | 69,396 | | | | 74,839 | | | | 145,635 | |
| | | | | | | | | | | | | | | | | | | | |
Net interest income after provision for loan losses | | | 1,167,505 | | | | 674,938 | | | | 738,468 | | | | 884,554 | | | | 780,060 | |
| | | | | | | | | | | | | | | | | | | | |
Mortgage banking activities | | | 81,802 | | | | 30,615 | | | | 71,657 | | | | 84,771 | | | | (4,505 | ) |
Net gain (loss) and valuation adjustments on investment securities | | | 141 | | | | (870 | ) | | | 7,966 | | | | (1,707 | ) | | | 10,844 | |
Other-than-temporary impairment losses on investment securities | | | (14,445 | ) | | | — | | | | — | | | | — | | | | — | |
Trading account (loss) profit | | | (4,723 | ) | | | 4,358 | | | | (13,483 | ) | | | 4,478 | | | | 48,098 | |
Net gain (loss) on sale of loans, including valuation adjustments on loans held-for-sale | | | 542 | | | | 40,591 | | | | (52,708 | ) | | | (29,414 | ) | | | 4,054 | |
Adjustments (expense) to indemnity reserves | | | (18,628 | ) | | | (40,629 | ) | | | (37,054 | ) | | | (21,198 | ) | | | (33,068 | ) |
FDIC loss-share income (expense) | | | 20,062 | | | | (103,024 | ) | | | (82,051 | ) | | | (56,211 | ) | | | 66,791 | |
Fair value change in equity appreciation instrument | | | — | | | | — | | | | — | | | | — | | | | 8,323 | |
Other non-interest income | | | 454,790 | | | | 455,474 | | | | 896,686 | | | | 530,770 | | | | 503,305 | |
| | | | | | | | | | | | | | | | | | | | |
Total non-interest income | | | 519,541 | | | | 386,515 | | | | 791,013 | | | | 511,489 | | | | 603,842 | |
| | | | | | | | | | | | | | | | | | | | |
Operating expenses: | | | | | | | | | | | | | | | | | | | | |
Personnel costs | | | 477,519 | | | | 418,679 | | | | 428,697 | | | | 434,333 | | | | 421,915 | |
All other operating expenses | | | 810,702 | | | | 775,005 | | | | 793,293 | | | | 780,656 | | | | 721,945 | |
| | | | | | | | | | | | | | | | | | | | |
Total operating expenses | | | 1,288,221 | | | | 1,193,684 | | | | 1,221,990 | | | | 1,214,989 | | | | 1,143,860 | |
| | | | | | | | | | | | | | | | | | | | |
Income (loss) from continuing operations, before income tax | | | 398,825 | | | | (132,231 | ) | | | 307,491 | | | | 181,054 | | | | 240,042 | |
Income tax (benefit) expense | | | (495,172 | )�� | | | 58,279 | | | | (251,327 | ) | | | (26,403 | ) | | | 114,927 | |
| | | | | | | | | | | | | | | | | | | | |
Income (loss) from continuing operations | | $ | 893,997 | | | $ | (190,510 | ) | | $ | 558,818 | | | $ | 207,457 | | | $ | 125,115 | |
Income (loss) from discontinued operations, net of income tax | | | 1,347 | | | | (122,980 | ) | | | 40,509 | | | | 37,818 | | | | 26,210 | |
| | | | | | | | | | | | | | | | | | | | |
Net Income (Loss) | | $ | 895,344 | | | $ | (313,490 | ) | | $ | 599,327 | | | $ | 245,275 | | | $ | 151,325 | |
| | | | | | | | | | | | | | | | | | | | |
Net Income (Loss) Applicable to Common Stock | | $ | 891,621 | | | $ | (317,213 | ) | | $ | 595,604 | | | $ | 241,552 | | | $ | 147,602 | |
| | | | | | | | | | | | | | | | | | | | |
102
Statistical Summary 2011-2015
Average Balance Sheet and Summary of Net Interest Income
| | | | | | | | | | | | | | | | | | | | | | | | | | | | | | | | | | | | |
On a Taxable Equivalent Basis* | |
| | | 2015 | | | 2014 | | | 2013 | |
| (Dollars in thousands) | | Average
Balance | | | Interest | | | Average
Rate | | | Average
Balance | | | Interest | | | Average
Rate | | | Average
Balance | | | Interest | | | Average
Rate | |
Assets | | | | | | | | | | | | | | | | | | | | | | | | | | | | | | | | | | | | |
Interest earning assets: | | | | | | | | | | | | | | | | | | | | | | | | | | | | | | | | | | | | |
Money market investments | | $ | 2,382,045 | | | $ | 7,244 | | | | 0.30 | % | | $ | 1,305,326 | | | $ | 4,224 | | | | 0.32 | % | | $ | 1,036,495 | | | $ | 3,464 | | | | 0.33 | % |
| | | | | | | | | | | | | | | | | | | | | | | | | | | | | | | | | | | | |
U.S. Treasury securities | | | 921,249 | | | | 13,559 | | | | 1.47 | | | | 264,393 | | | | 4,730 | | | | 1.79 | | | | 37,429 | | | | 1,505 | | | | 4.02 | |
Obligations of U.S. Government sponsored entities | | | 1,278,469 | | | | 21,962 | | | | 1.72 | | | | 2,006,170 | | | | 31,913 | | | | 1.59 | | | | 1,273,766 | | | | 28,926 | | | | 2.27 | |
Obligations of Puerto Rico, States and political subdivisions | | | 159,110 | | | | 11,776 | | | | 7.40 | | | | 188,125 | | | | 13,450 | | | | 7.15 | | | | 172,403 | | | | 12,295 | | | | 7.13 | |
Collateralized mortgage obligations and mortgage-backed securities | | | 3,275,702 | | | | 105,562 | | | | 3.22 | | | | 3,231,806 | | | | 101,650 | | | | 3.15 | | | | 3,758,610 | | | | 106,377 | | | | 2.83 | |
Other | | | 179,928 | | | | 9,761 | | | | 5.42 | | | | 195,139 | | | | 10,265 | | | | 5.26 | | | | 245,980 | | | | 12,765 | | | | 5.19 | |
| | | | | | | | | | | | | | | | | | | | | | | | | | | | | | | | | | | | |
Total investment securities | | | 5,814,458 | | | | 162,620 | | | | 2.80 | | | | 5,885,633 | | | | 162,008 | | | | 2.75 | | | | 5,488,188 | | | | 161,868 | | | | 2.95 | |
| | | | | | | | | | | | | | | | | | | | | | | | | | | | | | | | | | | | |
Trading account securities | | | 209,270 | | | | 13,064 | | | | 6.24 | | | | 339,563 | | | | 20,914 | | | | 6.16 | | | | 416,538 | | | | 26,026 | | | | 6.25 | |
| | | | | | | | | | | | | | | | | | | | | | | | | | | | | | | | | | | | |
Loans | | | 20,712,524 | | | | 1,294,714 | | | | 6.25 | | | | 19,595,972 | | | | 1,239,469 | | | | 6.33 | | | | 19,572,159 | | | | 1,218,349 | | | | 6.22 | |
WB loans | | | 2,332,784 | | | | 208,779 | | | | 8.95 | | | | 2,770,779 | | | | 293,610 | | | | 10.60 | | | | 3,227,719 | | | | 300,745 | | | | 9.32 | |
| | | | | | | | | | | | | | | | | | | | | | | | | | | | | | | | | | | | |
Total loans (net of unearned income) | | | 23,045,308 | | | | 1,503,493 | | | | 6.52 | | | | 22,366,751 | | | | 1,533,079 | | | | 6.85 | | | | 22,799,878 | | | | 1,519,094 | | | | 6.66 | |
| | | | | | | | | | | | | | | | | | | | | | | | | | | | | | | | | | | | |
Total interest earning assets/Interest income | | $ | 31,451,081 | | | $ | 1,686,421 | | | | 5.36 | % | | $ | 29,897,273 | | | $ | 1,720,225 | | | | 5.75 | % | | $ | 29,741,099 | | | $ | 1,710,452 | | | | 5.75 | % |
| | | | | | | | | | | | | | | | | | | | | | | | | | | | | | | | | | | | |
Total non-interest earning assets | | | 3,735,224 | | | | | | | | | | | | 3,758,897 | | | | | | | | | | | | 4,362,183 | | | | | | | | | |
| | | | | | | | | | | | | | | | | | | | | | | | | | | | | | | | | | | | |
Total assets from continuing operations | | $ | 35,186,305 | | | | | | | | | | | $ | 33,656,170 | | | | | | | | | | | $ | 34,103,282 | | | | | | | | | |
| | | | | | | | | | | | | | | | | | | | | | | | | | | | | | | | | | | | |
Total assets from discontinued operations | | | — | | | | — | | | | — | | | | 1,525,687 | | | | — | | | | — | | | | 2,163,711 | | | | — | | | | — | |
| | | | | | | | | | | | | | | | | | | | | | | | | | | | | | | | | | | | |
Total assets | | $ | 35,186,305 | | | | | | | | | | | $ | 35,181,857 | | | | | | | | | | | $ | 36,266,993 | | | | | | | | | |
| | | | | | | | | | | | | | | | | | | | | | | | | | | | | | | | | | | | |
Liabilities and Stockholders’ Equity | | | | | | | | | | | | | | | | | | | | | | | | | | | | | | | | | | | | |
Interest bearing liabilities: | | | | | | | | | | | | | | | | | | | | | | | | | | | | | | | | | | | | |
Savings, NOW, money market and other interest bearing demand accounts | | $ | 12,474,170 | | | $ | 35,272 | | | | 0.28 | % | | $ | 11,557,597 | | | $ | 30,187 | | | | 0.26 | % | | $ | 11,243,095 | | | $ | 31,080 | | | | 0.28 | % |
Time deposits | | | 8,157,908 | | | | 72,262 | | | | 0.89 | | | | 7,556,109 | | | | 74,900 | | | | 0.99 | | | | 7,956,922 | | | | 93,777 | | | | 1.18 | |
Short-term borrowings | | | 1,028,406 | | | | 7,512 | | | | 0.73 | | | | 1,886,662 | | | | 67,376 | | | | 3.57 | | | | 2,571,875 | | | | 38,430 | | | | 1.49 | |
Notes payable | | | 1,728,928 | | | | 78,986 | | | | 4.57 | | | | 1,627,541 | | | | 516,008 | | | | 31.70 | | | | 1,719,985 | | | | 140,079 | | | | 8.14 | |
| | | | | | | | | | | | | | | | | | | | | | | | | | | | | | | | | | | | |
| | | | | | | | | |
Total interest bearing liabilities/ Interest expense | | | 23,389,412 | | | | 194,032 | | | | 0.83 | | | | 22,627,909 | | | | 688,471 | | | | 3.04 | | | | 23,491,877 | | | | 303,366 | | | | 1.29 | |
| | | | | | | | | | | | | | | | | | | | | | | | | | | | | | | | | | | | |
Total non-interest bearing liabilities | | | 7,089,940 | | | | | | | | | | | | 6,409,810 | | | | | | | | | | | | 6,390,174 | | | | | | | | | |
| | | | | | | | | | | | | | | | | | | | | | | | | | | | | | | | | | | | |
Total liabilities from continuing operations | | | 30,479,352 | | | | | | | | | | | | 29,037,719 | | | | | | | | | | | | 29,882,051 | | | | | | | | | |
| | | | | | | | | | | | | | | | | | | | | | | | | | | | | | | | | | | | |
Total liabilities from discontinued operations | | | 2,091 | | | | — | | | | — | | | | 1,588,386 | | | | — | | | | — | | | | 2,208,593 | | | | — | | | | — | |
| | | | | | | | | | | | | | | | | | | | | | | | | | | | | | | | | | | | |
Total liabilities | | | 30,481,443 | | | | | | | | | | | | 30,626,105 | | | | | | | | | | | | 32,090,644 | | | | | | | | | |
| | | | | | | | | | | | | | | | | | | | | | | | | | | | | | | | | | | | |
Stockholders’ equity | | | 4,704,862 | | | | | | | | | | | | 4,555,752 | | | | | | | | | | | | 4,176,349 | | | | | | | | | |
| | | | | | | | | | | | | | | | | | | | | | | | | | | | | | | | | | | | |
Total liabilities and stockholders’ equity | | $ | 35,186,305 | | | | | | | | | | | $ | 35,181,857 | | | | | | | | | | | $ | 36,266,993 | | | | | | | | | |
| | | | | | | | | | | | | | | | | | | | | | | | | | | | | | | | | | | | |
Net interest income on a taxable equivalent basis | | | | | | $ | 1,492,389 | | | | | | | | | | | $ | 1,031,754 | | | | | | | | | | | $ | 1,407,086 | | | | | |
| | | | | | | | | | | | | | | | | | | | | | | | | | | | | | | | | | | | |
Cost of funding earning assets | | | | | | | | | | | 0.62 | % | | | | | | | | | | | 2.30 | % | | | | | | | | | | | 1.02 | % |
| | | | | | | | | | | | | | | | | | | | | | | | | | | | | | | | | | | | |
Net interest margin | | | | | | | | | | | 4.74 | % | | | | | | | | | | | 3.45 | % | | | | | | | | | | | 4.73 | % |
| | | | | | | | | | | | | | | | | | | | | | | | | | | | | | | | | | | | |
Effect of the taxable equivalent adjustment | | | | | | | 83,406 | | | | | | | | | | | | 86,682 | | | | | | | | | | | | 62,512 | | | | | |
| | | | | | | | | | | | | | | | | | | | | | | | | | | | | | | | | | | | |
Net interest income per books | | | | | | $ | 1,408,983 | | | | | | | | | | | $ | 945,072 | | | | | | | | | | | $ | 1,344,574 | | | | | |
| | | | | | | | | | | | | | | | | | | | | | | | | | | | | | | | | | | | |
| * | Shows the effect of the tax exempt status of some loans and investments on their yield, using the applicable statutory income tax rates. The computation considers the interest expense disallowance required by the Puerto Rico Internal Revenue Code. This adjustment is shown in order to compare the yields of the tax exempt and taxable assets on a taxable basis. |
Note: Average loan balances include the average balance of non-accruing loans. No interest income is recognized for these loans in accordance with the Corporation’s policy.
103
Statistical Summary 2011-2015
Average Balance Sheet and Summary of Net Interest Income
| | | | | | | | | | | | | | | | | | | | | | | | |
On a Taxable Equivalent Basis | |
| | | 2012 | | | 2011 | |
| (Dollars in thousands) | | Average
Balance | | | Interest | | | Average
Rate | | | Average
Balance | | | Interest | | | Average
Rate | |
Assets | | | | | | | | | | | | | | | | | | | | | | | | |
Interest earning assets: | | | | | | | | | | | | | | | | | | | | | | | | |
Money market investments | | $ | 1,051,373 | | | $ | 3,704 | | | | 0.35 | % | | $ | 1,152,014 | | | $ | 3,597 | | | | 0.31 | % |
| | | | | | | | | | | | | | | | | | | | | | | | |
U.S. Treasury securities | | | 34,757 | | | | 1,418 | | | | 4.08 | | | | 50,971 | | | | 1,502 | | | | 2.95 | |
Obligations of U.S. Government sponsored entities | | | 1,038,829 | | | | 34,881 | | | | 3.36 | | | | 1,180,680 | | | | 49,781 | | | | 4.22 | |
Obligations of Puerto Rico, States and political subdivisions | | | 152,697 | | | | 9,850 | | | | 6.45 | | | | 139,847 | | | | 8,972 | | | | 6.42 | |
Collateralized mortgage obligations and mortgage-backed securities | | | 3,752,954 | | | | 121,494 | | | | 3.24 | | | | 3,896,743 | | | | 148,884 | | | | 3.82 | |
Other | | | 247,717 | | | | 14,451 | | | | 5.83 | | | | 226,033 | | | | 15,213 | | | | 6.73 | |
| | | | | | | | | | | | | | | | | | | | | | | | |
Total investment securities | | | 5,226,954 | | | | 182,094 | | | | 3.48 | | | | 5,494,274 | | | | 224,352 | | | | 4.08 | |
| | | | | | | | | | | | | | | | | | | | | | | | |
Trading account securities | | | 445,881 | | | | 25,909 | | | | 5.81 | | | | 667,277 | | | | 38,850 | | | | 5.82 | |
| | | | | | | | | | | | | | | | | | | | | | | | |
Loans | | | 18,736,207 | | | | 1,168,091 | | | | 6.23 | | | | 18,543,619 | | | | 1,168,446 | | | | 6.30 | |
WB loans | | | 4,050,338 | | | | 301,441 | | | | 7.44 | | | | 4,613,361 | | | | 412,678 | | | | 8.95 | |
| | | | | | | | | | | | | | | | | | | | | | | | |
Total loans (net of unearned income) | | | 22,786,545 | | | | 1,469,532 | | | | 6.45 | | | | 23,156,980 | | | | 1,581,124 | | | | 6.83 | |
| | | | | | | | | | | | | | | | | | | | | | | | |
Total interest earning assets/Interest income | | $ | 29,510,753 | | | $ | 1,681,239 | | | | 5.70 | % | | $ | 30,470,545 | | | $ | 1,847,923 | | | | 6.06 | % |
| | | | | | | | | | | | | | | | | | | | | | | | |
Total non-interest earning assets | | | 4,486,835 | | | | | | | | | | | | 4,958,125 | | | | | | | | | |
| | | | | | | | | | | | | | | | | | | | | | | | |
Total assets from continuing operations | | $ | 33,997,588 | | | | | | | | | | | $ | 35,428,670 | | | | | | | | | |
| | | | | | | | | | | | | | | | | | | | | | | | |
Total assets from discontinued operations | | | 2,266,443 | | | | — | | | | — | | | | 2,637,598 | | | | — | | | | — | |
| | | | | | | | | | | | | | | | | | | | | | | | |
Total assets | | $ | 36,264,031 | | | | | | | | | | | $ | 38,066,268 | | | | | | | | | |
| | | | | | | | | | | | | | | | | | | | | | | | |
Liabilities and Stockholders’ Equity | | | | | | | | | | | | | | | | | | | | | | | | |
Interest bearing liabilities: | | | | | | | | | | | | | | | | | | | | | | | | |
Savings, NOW, money market and other interest bearing demand accounts | | $ | 10,834,812 | | | $ | 40,069 | | | | 0.37 | % | | $ | 10,204,438 | | | $ | 61,004 | | | | 0.60 | % |
Time deposits | | | 8,835,308 | | | | 127,696 | | | | 1.45 | | | | 10,233,566 | | | | 187,838 | | | | 1.84 | |
Short-term borrowings | | | 2,563,970 | | | | 46,802 | | | | 1.83 | | | | 2,628,511 | | | | 55,255 | | | | 2.10 | |
Notes payable | | | 1,850,514 | | | | 148,192 | | | | 8.01 | | | | 1,834,915 | | | | 148,603 | | | | 8.10 | |
Note issued to the FDIC | | | — | | | | — | | | | — | | | | 1,381,981 | | | | 32,161 | | | | 2.33 | |
| | | | | | | | | | | | | | | | | | | | | | | | |
| | | | | | |
Total interest bearing liabilities/Interest expense | | | 24,084,604 | | | | 362,759 | | | | 1.51 | | | | 26,283,411 | | | | 484,861 | | | | 1.84 | |
| | | | | | | | | | | | | | | | | | | | | | | | |
Total non-interest bearing liabilities | | | 6,130,890 | | | | | | | | | | | | 5,728,630 | | | | | | | | | |
| | | | | | | | | | | | | | | | | | | | | | | | |
Total liabilities from continuing operations | | | 30,215,494 | | | | | | | | | | | | 32,012,041 | | | | | | | | | |
| | | | | | | | | | | | | | | | | | | | | | | | |
Total liabilities from discontinued operations | | | 2,204,885 | | | | — | | | | — | | | | 2,321,391 | | | | — | | | | — | |
| | | | | | | | | | | | | | | | | | | | | | | | |
Total liabilities | | | 32,420,379 | | | | | | | | | | | | 34,333,432 | | | | | | | | | |
| | | | | | | | | | | | | | | | | | | | | | | | |
Stockholders’ equity | | | 3,843,652 | | | | | | | | | | | | 3,732,836 | | | | | | | | | |
| | | | | | | | | | | | | | | | | | | | | | | | |
Total liabilities and stockholders’ equity | | $ | 36,264,031 | | | | | | | | | | | $ | 38,066,268 | | | | | | | | | |
| | | | | | | | | | | | | | | | | | | | | | | | |
Net interest income on a taxable equivalent basis | | | | | | $ | 1,318,480 | | | | | | | | | | | $ | 1,363,062 | | | | | |
| | | | | | | | | | | | | | | | | | | | | | | | |
Cost of funding earning assets | | | | | | | | | | | 1.23 | % | | | | | | | | | | | 1.59 | % |
| | | | | | | | | | | | | | | | | | | | | | | | |
Net interest margin | | | | | | | | | | | 4.47 | % | | | | | | | | | | | 4.47 | % |
| | | | | | | | | | | | | | | | | | | | | | | | |
Effect of the taxable equivalent adjustment | | | | | | | 36,853 | | | | | | | | | | | | 41,515 | | | | | |
| | | | | | | | | | | | | | | | | | | | | | | | |
Net interest income per books | | | | | | $ | 1,281,627 | | | | | | | | | | | $ | 1,321,547 | | | | | |
| | | | | | | | | | | | | | | | | | | | | | | | |
| * | Shows the effect of the tax exempt status of loans and investments on their yield, using the applicable statutory income tax rates. The computation considers the interest expense disallowance required by the Puerto Rico Internal Revenue Code. This adjustment is shown in order to compare the yield of the tax exempt and taxable assets on a taxable basis. |
Note: Average loan balances include the average balance of non-accruing loans. No interest income is recognized for these loans in accordance with the Corporation’s policy.
104
Statistical Summary 2014-2015
Quarterly Financial Data
| | | | | | | | | | | | | | | | | | | | | | | | | | | | | | | | |
| | | 2015 | | | 2014 | |
(In thousands, except per common share information) | | Fourth
Quarter | | | Third
Quarter | | | Second
Quarter | | | First
Quarter | | | Fourth
Quarter | | | Third
Quarter | | | Second
Quarter | | | First
Quarter | |
| | | | | | | | |
Summary of Operations | | | | | | | | | | | | | | | | | | | | | | | | | | | | | | | | |
Interest income | | $ | 401,357 | | | $ | 401,282 | | | $ | 410,301 | | | $ | 390,074 | | | $ | 391,935 | | | $ | 401,199 | | | $ | 421,450 | | | $ | 418,959 | |
Interest expense | | | 48,857 | | | | 50,547 | | | | 47,748 | | | | 46,879 | | | | 65,074 | | | | 74,778 | | | | 480,831 | | | | 67,788 | |
| | | | | | | | | | | | | | | | | | | | | | | | | | | | | | | | |
Net interest income (expense) | | | 352,500 | | | | 350,735 | | | | 362,553 | | | | 343,195 | | | | 326,861 | | | | 326,421 | | | | (59,381 | ) | | | 351,171 | |
Provision for loan losses - non-covered loans | | | 57,711 | | | | 69,568 | | | | 60,468 | | | | 29,711 | | | | 51,637 | | | | 68,166 | | | | 50,074 | | | | 54,122 | |
Provision (reversal) for loan losses - covered loans | | | 820 | | | | (2,890 | ) | | | 15,766 | | | | 10,324 | | | | (3,646 | ) | | | 12,463 | | | | 11,604 | | | | 25,714 | |
Mortgage banking activities | | | 23,430 | | | | 24,195 | | | | 21,325 | | | | 12,852 | | | | 8,747 | | | | 14,402 | | | | 3,788 | | | | 3,678 | |
Net gain (loss) and valuation adjustments on investment securities | | | — | | | | 136 | | | | 5 | | | | — | | | | 893 | | | | (1,763 | ) | | | — | | | | — | |
Other-than-temporary impairment losses on investment securities | | | — | | | | — | | | | (14,445 | ) | | | — | | | | — | | | | — | | | | — | | | | — | |
Trading account (loss) profit | | | (1,631 | ) | | | (398 | ) | | | (3,108 | ) | | | 414 | | | | 586 | | | | 740 | | | | 1,055 | | | | 1,977 | |
Net (loss) gain on sale of loans, including valuation adjustments on loans held-for-sale | | | (60 | ) | | | — | | | | 681 | | | | (79 | ) | | | 10,946 | | | | 15,593 | | | | 9,659 | | | | 4,393 | |
Adjustments (expense) to indemnity reserves on loans sold | | | (8,647 | ) | | | (5,874 | ) | | | 419 | | | | (4,526 | ) | | | (13,348 | ) | | | (9,480 | ) | | | (7,454 | ) | | | (10,347 | ) |
FDIC loss-share (expense) income | | | (4,359 | ) | | | 1,207 | | | | 19,075 | | | | 4,139 | | | | (18,693 | ) | | | (4,864 | ) | | | (55,261 | ) | | | (24,206 | ) |
Other non-interest income | | | 123,705 | | | | 111,843 | | | | 116,807 | | | | 102,435 | | | | 114,233 | | | | 109,702 | | | | 111,002 | | | | 120,537 | |
Operating expenses | | | 305,808 | | | | 306,897 | | | | 363,174 | | | | 312,342 | | | | 330,006 | | | | 310,640 | | | | 275,439 | | | | 277,599 | |
| | | | | | | | | | | | | | | | | | | | | | | | | | | | | | | | |
Income (loss) from continuing operations before income tax | | | 120,599 | | | | 108,269 | | | | 63,904 | | | | 106,053 | | | | 52,228 | | | | 59,482 | | | | (333,709 | ) | | | 89,768 | |
Income tax (benefit) expense | | | (16,827 | ) | | | 22,620 | | | | (533,533 | ) | | | 32,568 | | | | 12,472 | | | | 26,667 | | | | (4,124 | ) | | | 23,264 | |
| | | | | | | | | | | | | | | | | | | | | | | | | | | | | | | | |
Income (loss) from continuing operations | | $ | 137,426 | | | $ | 85,649 | | | $ | 597,437 | | | $ | 73,485 | | | $ | 39,756 | | | $ | 32,815 | | | $ | (329,585 | ) | | $ | 66,504 | |
| | | | | | | | | | | | | | | | | | | | | | | | | | | | | | | | |
(Loss) income from discontinued operations, net of tax | | | — | | | | (9 | ) | | | 15 | | | | 1,341 | | | | 9,086 | | | | 29,758 | | | | (181,729 | ) | | | 19,905 | |
Net income (loss) | | $ | 137,426 | | | $ | 85,640 | | | $ | 597,452 | | | $ | 74,826 | | | $ | 48,842 | | | $ | 62,573 | | | $ | (511,314 | ) | | $ | 86,409 | |
| | | | | | | | | | | | | | | | | | | | | | | | | | | | | | | | |
Net income (loss) applicable to common stock | | $ | 136,495 | | | $ | 84,709 | | | $ | 596,521 | | | $ | 73,896 | | | $ | 47,911 | | | $ | 61,643 | | | $ | (512,245 | ) | | $ | 85,478 | |
| | | | | | | | | | | | | | | | | | | | | | | | | | | | | | | | |
Net income (loss) per common share - basic: | | $ | 1.32 | | | $ | 0.82 | | | $ | 5.80 | | | $ | 0.72 | | | $ | 0.47 | | | $ | 0.60 | | | $ | (4.98 | ) | | $ | 0.83 | |
| | | | | | | | | | | | | | | | | | | | | | | | | | | | | | | | |
Net income (loss) per common share - diluted: | | $ | 1.32 | | | $ | 0.82 | | | $ | 5.79 | | | $ | 0.72 | | | $ | 0.46 | | | $ | 0.60 | | | $ | (4.98 | ) | | $ | 0.83 | |
| | | | | | | | | | | | | | | | | | | | | | | | | | | | | | | | |
Dividends Declared per Common Share | | $ | 0.15 | | | $ | 0.15 | | | $ | — | | | $ | — | | | $ | — | | | $ | — | | | $ | — | | | $ | — | |
| | | | | | | | | | | | | | | | | | | | | | | | | | | | | | | | |
Selected Average Balances | | | | | | | | | | | | | | | | | | | | | | | | | | | | | | | | |
| | | | | | | | |
| (In millions) | | | | | | | | | | | | | | | | | | | | | | | | |
Total assets | | $ | 35,576 | | | $ | 35,840 | | | $ | 35,577 | | | $ | 33,806 | | | $ | 33,309 | | | $ | 35,024 | | | $ | 36,236 | | | $ | 36,196 | |
Loans | | | 23,131 | | | | 23,148 | | | | 23,390 | | | | 22,505 | | | | 22,044 | | | | 22,263 | | | | 22,563 | | | | 22,604 | |
Interest earning assets | | | 31,733 | | | | 31,815 | | | | 31,965 | | | | 30,272 | | | | 29,265 | | | | 29,764 | | | | 30,402 | | | | 30,169 | |
Deposits | | | 27,110 | | | | 27,103 | | | | 27,330 | | | | 25,593 | | | | 24,629 | | | | 24,656 | | | | 24,775 | | | | 24,559 | |
Interest-bearing liabilities | | | 23,298 | | | | 23,816 | | | | 23,932 | | | | 22,499 | | | | 21,977 | | | | 22,776 | | | | 22,933 | | | | 22,834 | |
| | | | | | | | | | | | | | | | | | | | | | | | | | | | | | | | |
Selected Ratios | | | | | | | | | | | | | | | | | | | | | | | | | | | | | | | | |
Return on assets | | | 1.53 | % | | | 0.95 | % | | | 6.74 | % | | | 0.90 | % | | | 0.58 | % | | | 0.71 | % | | | (5.66 | )% | | | 0.97 | % |
Return on equity | | | 10.77 | | | | 6.79 | | | | 54.93 | | | | 7.02 | | | | 4.41 | | | | 5.75 | | | | (43.04 | ) | | | 7.39 | |
| | | | | | | | | | | | | | | | | | | | | | | | | | | | | | | | |
| [1] | Per share data has been adjusted to retroactively reflect the 1-for-10 reverse stock split effected on May 29, 2012. |
Note:Because each reporting period stands on its own the sum of the net income (loss) per common share for the quarters may not equal to the net income (loss) per common share for the year.
105

Report of Management on Internal Control Over Financial Reporting
The management of Popular, Inc. (the Corporation) is responsible for establishing and maintaining adequate internal control over financial reporting as defined in Rules 13a - 15(f) and 15d - 15(f) under the Securities Exchange Act of 1934 and for our assessment of internal control over financial reporting. The Corporation’s internal control over financial reporting is a process designed to provide reasonable assurance regarding the reliability of financial reporting and the preparation of financial statements for external purposes in accordance with accounting principles generally accepted in the United States of America, and includes controls over the preparation of financial statements in accordance with the instructions to the Consolidated Financial Statements for Bank Holding Companies (Form FR Y-9C) to comply with the reporting requirements of Section 112 of the Federal Deposit Insurance Corporation Improvement Act (FDICIA). The Corporation’s internal control over financial reporting includes those policies and procedures that:
(i) pertain to the maintenance of records that, in reasonable detail, accurately and fairly reflect the transactions and dispositions of the assets of the Corporation;
(ii) provide reasonable assurance that transactions are recorded as necessary to permit preparation of financial statements in accordance with accounting principles generally accepted in the United States of America, and that receipts and expenditures of the Corporation are being made only in accordance with authorizations of management and directors of the Corporation; and
(iii) provide reasonable assurance regarding prevention or timely detection of unauthorized acquisition, use or disposition of the Corporation’s assets that could have a material effect on the financial statements.
Because of its inherent limitations, internal control over financial reporting may not prevent or detect misstatements. Also, projections of any evaluation of effectiveness to future periods are subject to the risk that controls may become inadequate because of changes in conditions, or that the degree of compliance with the policies or procedures may deteriorate.
The management of Popular, Inc. has assessed the effectiveness of the Corporation’s internal control over financial reporting as of December 31, 2015. In making this assessment, management used the criteria set forth in the Internal Control-Integrated Framework (2013) issued by the Committee of Sponsoring Organizations of the Treadway Commission (COSO).
Based on our assessment, management concluded that the Corporation maintained effective internal control over financial reporting as of December 31, 2015 based on the criteria referred to above.
The Corporation’s independent registered public accounting firm, PricewaterhouseCoopers LLP, has audited the effectiveness of the Corporation’s internal control over financial reporting as of December 31, 2015, as stated in their report dated February 29, 2016 which appears herein.
| | |
 | |  |
| |
| Richard L. Carrión | | Carlos J. Vázquez |
| Chairman of the Board | | Executive Vice President |
| and Chief Executive Officer | | and Chief Financial Officer |
106

Report of Independent Registered
Public Accounting Firm
To the Board of Directors and
Stockholders of Popular, Inc.
In our opinion, the accompanying consolidated statements of financial condition and the related consolidated statements of operations, comprehensive (loss) income, changes in stockholders’ equity and cash flows present fairly, in all material respects, the financial position of Popular, Inc. and its subsidiaries at December 31, 2015 and 2014, and the results of their operations and their cash flows for each of the three years in the period ended December 31, 2015in conformity with accounting principles generally accepted in the United States of America. Also in our opinion, the Corporation maintained, in all material respects, effective internal control over financial reporting as of December 31, 2015, based on criteria established inInternal Control - Integrated Framework (2013) issued by the Committee of Sponsoring Organizations of the Treadway Commission (COSO). The Corporation’s management is responsible for these financial statements, for maintaining effective internal control over financial reporting and for its assessment of the effectiveness of internal control over financial reporting, included in the accompanying Report of Management on Internal Control Over Financial Reporting. Our responsibility is to express opinions on these financial statements and on the Corporation’s internal control over financial reporting based on our integrated audits. We conducted our audits in accordance with the standards of the Public Company Accounting Oversight Board (United States). Those standards require that we plan and perform the audits to obtain reasonable assurance about whether the financial statements are free of material misstatement and whether effective internal control over financial reporting was maintained in all material respects. Our audits of the financial statements included examining, on a test basis, evidence supporting the amounts and disclosures in the financial statements, assessing the accounting principles used and significant estimates made by management, and evaluating the overall financial statement presentation. Our audit of internal control over financial reporting included obtaining an understanding of internal control over financial reporting, assessing the risk that a material weakness exists, and testing and evaluating the design and operating effectiveness of internal control based on the assessed risk. Our audits also included performing such other procedures as we considered necessary in the circumstances. We believe that our audits provide a reasonable basis for our opinions.
107
A company’s internal control over financial reporting is a process designed to provide reasonable assurance regarding the reliability of financial reporting and the preparation of financial statements for external purposes in accordance with generally accepted accounting principles. Management’s assessment and our audit of Popular, Inc.’s internal control over financial reporting also included controls over the preparation of financial statements in accordance with the instructions to the Consolidated Financial Statements for Bank Holding Companies (Form FR Y-9C) to comply with the reporting requirements of Section 112 of the Federal Deposit Insurance Corporation Improvement Act (FDICIA). A company’s internal control over financial reporting includes those policies and procedures that (i) pertain to the maintenance of records that, in reasonable detail, accurately and fairly reflect the transactions and dispositions of the assets of the company; (ii) provide reasonable assurance that transactions are recorded as necessary to permit preparation of financial statements in accordance with generally accepted accounting principles, and that receipts and expenditures of the company are being made only in accordance with authorizations of management and directors of the company; and (iii) provide reasonable assurance regarding prevention or timely detection of unauthorized acquisition, use, or disposition of the company’s assets that could have a material effect on the financial statements.
Because of its inherent limitations, internal control over financial reporting may not prevent or detect misstatements. Also, projections of any evaluation of effectiveness to future periods are subject to the risk that controls may become inadequate because of changes in conditions, or that the degree of compliance with the policies or procedures may deteriorate.

PRICEWATERHOUSECOOPERS LLP
San Juan, Puerto Rico
February 29, 2016
CERTIFIED PUBLIC ACCOUNTANTS
(OF PUERTO RICO)
License No. LLP-216 Expires Dec. 1, 2016
Stamp E199602 of the P.R. Society of
Certified Public Accountants has been
affixed to the file copy of this report
108
POPULAR, INC.
CONSOLIDATED STATEMENTS OF FINANCIAL CONDITION
| | | | | | | | |
(In thousands, except share information) | | December 31,
2015 | | | December 31,
2014 | |
Assets: | | | | | | | | |
Cash and due from banks | | $ | 363,674 | | | $ | 381,095 | |
| | | | | | | | |
Money market investments: | | | | | | | | |
Securities purchased under agreements to resell | | | 96,338 | | | | 151,134 | |
Time deposits with other banks | | | 2,083,754 | | | | 1,671,252 | |
| | | | | | | | |
Total money market investments | | | 2,180,092 | | | | 1,822,386 | |
| | | | | | | | |
Trading account securities, at fair value: | | | | | | | | |
Pledged securities with creditors’ right to repledge | | | 19,506 | | | | 80,945 | |
Other trading securities | | | 52,153 | | | | 57,582 | |
Investment securities available-for-sale, at fair value: | | | | | | | | |
Pledged securities with creditors’ right to repledge | | | 739,045 | | | | 1,020,529 | |
Other investment securities available-for-sale | | | 5,323,947 | | | | 4,294,630 | |
Investment securities held-to-maturity, at amortized cost (fair value 2015 - $82,889; 2014 - $94,199) | | | 100,903 | | | | 103,170 | |
Other investment securities, at lower of cost or realizable value (realizable value 2015 - $175,291; 2014 - $165,024) | | | 172,248 | | | | 161,906 | |
Loans held-for-sale, at lower of cost or fair value | | | 137,000 | | | | 106,104 | |
| | | | | | | | |
Loans held-in-portfolio: | | | | | | | | |
Loans not covered under loss-sharing agreements with the FDIC | | | 22,453,813 | | | | 19,498,286 | |
Loans covered under loss-sharing agreements with the FDIC | | | 646,115 | | | | 2,542,662 | |
Less – Unearned income | | | 107,698 | | | | 93,835 | |
Allowance for loan losses | | | 537,111 | | | | 601,792 | |
| | | | | | | | |
Total loans held-in-portfolio, net | | | 22,455,119 | | | | 21,345,321 | |
| | | | | | | | |
FDIC loss-share asset | | | 310,221 | | | | 542,454 | |
Premises and equipment, net | | | 502,611 | | | | 494,581 | |
Other real estate not covered under loss-sharing agreements with the FDIC | | | 155,231 | | | | 135,500 | |
Other real estate covered under loss-sharing agreements with the FDIC | | | 36,685 | | | | 130,266 | |
Accrued income receivable | | | 124,234 | | | | 121,818 | |
Mortgage servicing assets, at fair value | | | 211,405 | | | | 148,694 | |
Other assets | | | 2,200,963 | | | | 1,646,443 | |
Goodwill | | | 626,388 | | | | 465,676 | |
Other intangible assets | | | 58,109 | | | | 37,595 | |
| | | | | | | | |
Total assets | | $ | 35,769,534 | | | $ | 33,096,695 | |
| | | | | | | | |
Liabilities and Stockholders’ Equity | | | | | | | | |
Liabilities: | | | | | | | | |
Deposits: | | | | | | | | |
Non-interest bearing | | $ | 6,401,515 | | | $ | 5,783,748 | |
Interest bearing | | | 20,808,208 | | | | 19,023,787 | |
| | | | | | | | |
Total deposits | | | 27,209,723 | | | | 24,807,535 | |
| | | | | | | | |
Federal funds purchased and assets sold under agreements to repurchase | | | 762,145 | | | | 1,271,657 | |
Other short-term borrowings | | | 1,200 | | | | 21,200 | |
Notes payable | | | 1,670,309 | | | | 1,711,828 | |
Other liabilities | | | 1,019,018 | | | | 1,012,029 | |
Liabilities from discontinued operations (Refer to Note 4) | | | 1,815 | | | | 5,064 | |
| | | | | | | | |
Total liabilities | | | 30,664,210 | | | | 28,829,313 | |
| | | | | | | | |
Commitments and contingencies (Refer to Note 30) | | | | | | | | |
Stockholders’ equity: | | | | | | | | |
Preferred stock, 30,000,000 shares authorized; 2,006,391shares issued and outstanding | | | 50,160 | | | | 50,160 | |
Common stock, $0.01 par value; 170,000,000 shares authorized; 103,816,185 shares issued (2014 - 103,614,553) and 103,618,976 shares outstanding (2014 - 103,476,847) | | | 1,038 | | | | 1,036 | |
Surplus | | | 4,229,156 | | | | 4,196,458 | |
Retained earnings | | | 1,087,957 | | | | 253,717 | |
Treasury stock - at cost, 197,209 shares (2014 - 137,706) | | | (6,101 | ) | | | (4,117 | ) |
Accumulated other comprehensive loss, net of tax | | | (256,886 | ) | | | (229,872 | ) |
| | | | | | | | |
Total stockholders’ equity | | | 5,105,324 | | | | 4,267,382 | |
| | | | | | | | |
Total liabilities and stockholders’ equity | | $ | 35,769,534 | | | $ | 33,096,695 | |
| | | | | | | | |
The accompanying notes are an integral part of these consolidated financial statements.
109
POPULAR, INC.
CONSOLIDATED STATEMENTS OF OPERATIONS
| | | | | | | | | | | | |
| | | Years ended December 31, | |
(In thousands, except per share information) | | 2015 | | | 2014 | | | 2013 | |
Interest income: | | | | | | | | | | | | |
Loans | | $ | 1,458,706 | | | $ | 1,478,750 | | | $ | 1,481,096 | |
Money market investments | | | 7,243 | | | | 4,224 | | | | 3,464 | |
Investment securities | | | 126,064 | | | | 132,631 | | | | 141,807 | |
Trading account securities | | | 11,001 | | | | 17,938 | | | | 21,573 | |
| | | | | | | | | | | | |
Total interest income | | | 1,603,014 | | | | 1,633,543 | | | | 1,647,940 | |
| | | | | | | | | | | | |
Interest expense: | | | | | | | | | | | | |
Deposits | | | 107,533 | | | | 105,087 | | | | 124,857 | |
Short-term borrowings | | | 7,512 | | | | 67,376 | | | | 38,430 | |
Long-term debt | | | 78,986 | | | | 516,008 | | | | 140,079 | |
| | | | | | | | | | | | |
Total interest expense | | | 194,031 | | | | 688,471 | | | | 303,366 | |
| | | | | | | | | | | | |
Net interest income | | | 1,408,983 | | | | 945,072 | | | | 1,344,574 | |
Provision for loan losses - non-covered loans | | | 217,458 | | | | 223,999 | | | | 536,710 | |
Provision for loan losses - covered loans | | | 24,020 | | | | 46,135 | | | | 69,396 | |
| | | | | | | | | | | | |
Net interest income after provision for loan losses | | | 1,167,505 | | | | 674,938 | | | | 738,468 | |
| | | | | | | | | | | | |
Service charges on deposit accounts | | | 160,108 | | | | 158,637 | | | | 162,870 | |
Other service fees (Refer to Note 39) | | | 236,090 | | | | 225,265 | | | | 229,351 | |
Mortgage banking activities (Refer to Note 15) | | | 81,802 | | | | 30,615 | | | | 71,657 | |
Net gain (loss) and valuation adjustments on investment securities | | | 141 | | | | (870 | ) | | | 7,966 | |
Other-than-temporary impairment losses on investment securities | | | (14,445 | ) | | | — | | | | — | |
Trading account (loss) profit | | | (4,723 | ) | | | 4,358 | | | | (13,483 | ) |
Net gain (loss) on sale of loans, including valuation adjustments on loans held-for-sale | | | 542 | | | | 40,591 | | | | (52,708 | ) |
Adjustments (expense) to indemnity reserves on loans sold | | | (18,628 | ) | | | (40,629 | ) | | | (37,054 | ) |
FDIC loss-share income (expense) (Refer to Note 40) | | | 20,062 | | | | (103,024 | ) | | | (82,051 | ) |
Other operating income | | | 58,592 | | | | 71,572 | | | | 504,465 | |
| | | | | | | | | | | | |
Total non-interest income | | | 519,541 | | | | 386,515 | | | | 791,013 | |
| | | | | | | | | | | | |
Operating expenses: | | | | | | | | | | | | |
Personnel costs | | | 477,519 | | | | 418,679 | | | | 428,697 | |
Net occupancy expenses | | | 86,888 | | | | 86,707 | | | | 86,651 | |
Equipment expenses | | | 60,110 | | | | 48,917 | | | | 46,028 | |
Other taxes | | | 39,797 | | | | 56,918 | | | | 58,028 | |
Professional fees | | | 308,985 | | | | 282,055 | | | | 278,127 | |
Communications | | | 25,146 | | | | 25,684 | | | | 25,385 | |
Business promotion | | | 52,076 | | | | 54,016 | | | | 59,453 | |
FDIC deposit insurance | | | 27,626 | | | | 40,307 | | | | 56,728 | |
Loss on early extinguishment of debt | | | — | | | | 532 | | | | 3,388 | |
Other real estate owned (OREO) expenses | | | 85,568 | | | | 49,611 | | | | 79,658 | |
Other operating expenses | | | 95,075 | | | | 95,373 | | | | 91,876 | |
Amortization of intangibles | | | 11,019 | | | | 8,160 | | | | 7,971 | |
Restructuring costs (Refer to Note 6) | | | 18,412 | | | | 26,725 | | | | — | |
| | | | | | | | | | | | |
Total operating expenses | | | 1,288,221 | | | | 1,193,684 | | | | 1,221,990 | |
| | | | | | | | | | | | |
Income (loss) from continuing operations before income tax | | | 398,825 | | | | (132,231 | ) | | | 307,491 | |
Income tax (benefit) expense | | | (495,172 | ) | | | 58,279 | | | | (251,327 | ) |
| | | | | | | | | | | | |
Income (loss) from continuing operations | | | 893,997 | | | | (190,510 | ) | | | 558,818 | |
Income (loss) from discontinued operations, net of tax (Refer to Note 4) | | | 1,347 | | | | (122,980 | ) | | | 40,509 | |
| | | | | | | | | | | | |
Net Income (Loss) | | $ | 895,344 | | | $ | (313,490 | ) | | $ | 599,327 | |
| | | | | | | | | | | | |
Net Income (Loss) Applicable to Common Stock | | $ | 891,621 | | | $ | (317,213 | ) | | $ | 595,604 | |
| | | | | | | | | | | | |
Net Income (Loss) per Common Share – Basic | | | | | | | | | | | | |
Net income (loss) from continuing operations | | | 8.65 | | | | (1.88 | ) | | | 5.41 | |
Net income (loss) from discontinued operations | | | 0.01 | | | | (1.20 | ) | | | 0.39 | |
| | | | | | | | | | | | |
Net Income (Loss) per Common Share – Basic | | $ | 8.66 | | | $ | (3.08 | ) | | $ | 5.80 | |
| | | | | | | | | | | | |
Net Income (Loss) per Common Share – Diluted | | | | | | | | | | | | |
Net income (loss) from continuing operations | | | 8.64 | | | | (1.88 | ) | | | 5.39 | |
Net income (loss) from discontinued operations | | | 0.01 | | | | (1.20 | ) | | | 0.39 | |
| | | | | | | | | | | | |
Net Income (Loss) per Common Share – Diluted | | $ | 8.65 | | | $ | (3.08 | ) | | $ | 5.78 | |
| | | | | | | | | | | | |
Dividends Declared per Common Share | | $ | 0.30 | | | $ | — | | | $ | — | |
| | | | | | | | | | | | |
The accompanying notes are an integral part of these consolidated financial statements.
110
POPULAR, INC.
CONSOLIDATED STATEMENTS OF COMPREHENSIVE INCOME (LOSS)
| | | | | | | | | | | | |
| | | Years ended December 31, | |
(In thousands) | | 2015 | | | 2014 | | | 2013 | |
Net income (loss) | | $ | 895,344 | | | $ | (313,490 | ) | | $ | 599,327 | |
| | | | | | | | | | | | |
Other comprehensive loss before tax: | | | | | | | | | | | | |
Foreign currency translation adjustment | | | (3,098 | ) | | | (4,451 | ) | | | (4,822 | ) |
Reclassification adjustment for losses included in net income | | | — | | | | 7,718 | | | | — | |
Adjustment of pension and postretirement benefit plans | | | (26,283 | ) | | | (160,679 | ) | | | 174,578 | |
Amortization of net losses | | | 20,100 | | | | (8,505 | ) | | | 24,674 | |
Amortization of prior service cost | | | (3,800 | ) | | | 3,800 | | | | — | |
Unrealized holding (losses) gains on investments arising during the period | | | (32,440 | ) | | | 57,401 | | | | (221,043 | ) |
Other-than-temporary impairment included in net income | | | 14,445 | | | | — | | | | — | |
Reclassification adjustment for (gains) losses included in net income | | | (141 | ) | | | 870 | | | | (2,110 | ) |
Unrealized net (losses) gains on cash flow hedges | | | (4,376 | ) | | | (6,613 | ) | | | 2,286 | |
Reclassification adjustment for net losses (gains) included in net income | | | 4,702 | | | | 6,091 | | | | (1,839 | ) |
| | | | | | | | | | | | |
Other comprehensive loss before tax | | | (30,891 | ) | | | (104,368 | ) | | | (28,276 | ) |
Income tax benefit (expense) | | | 3,877 | | | | 63,241 | | | | (57,601 | ) |
| | | | | | | | | | | | |
Total other comprehensive loss, net of tax | | | (27,014 | ) | | | (41,127 | ) | | | (85,877 | ) |
| | | | | | | | | | | | |
Comprehensive income (loss), net of tax | | $ | 868,330 | | | $ | (354,617 | ) | | $ | 513,450 | |
| | | | | | | | | | | | |
Tax effect allocated to each component of other comprehensive loss:
| | | | | | | | | | | | |
| | | Years ended December 31, | |
(In thousands) | | 2015 | | | 2014 | | | 2013 | |
Adjustment of pension and postretirement benefit plans | | $ | 10,251 | | | $ | 62,664 | | | $ | (70,306 | ) |
Amortization of net losses | | | (7,839 | ) | | | 3,317 | | | | (7,402 | ) |
Amortization of prior service cost | | | 1,482 | | | | (1,482 | ) | | | — | |
Unrealized holding (losses) gains on investments arising during the period | | | 2,569 | | | | (1,414 | ) | | | 19,924 | |
Other-than-temporary impairment included in net income | | | (2,486 | ) | | | — | | | | — | |
Reclassification adjustment for (gains) losses included in net income | | | 28 | | | | (48 | ) | | | 317 | |
Unrealized net (losses) gains on cash flow hedges | | | 1,707 | | | | 2,579 | | | | (850 | ) |
Reclassification adjustment for net losses (gains) included in net income | | | (1,835 | ) | | | (2,375 | ) | | | 716 | |
| | | | | | | | | | | | |
Income tax benefit (expense) | | $ | 3,877 | | | $ | 63,241 | | | $ | (57,601 | ) |
| | | | | | | | | | | | |
The accompanying notes are an integral part of these consolidated financial statements.
111
POPULAR, INC.
CONSOLIDATED STATEMENTS OF CHANGES IN STOCKHOLDERS’ EQUITY
| | | | | | | | | | | | | | | | | | | | | | | | | | | | |
(In thousands) | | Common
stock | | | Preferred
stock | | | Surplus | | | Retained
earnings | | | Treasury
stock | | | Accumulated
other
comprehensive
loss | | | Total | |
Balance at December 31, 2012 | | $ | 1,032 | | | $ | 50,160 | | | $ | 4,150,294 | | | $ | 11,826 | | | $ | (444 | ) | | $ | (102,868 | ) | | $ | 4,110,000 | |
Net income | | | | | | | | | | | | | | | 599,327 | | | | | | | | | | | | 599,327 | |
Issuance of stock | | | 2 | | | | | | | | 6,858 | | | | | | | | | | | | | | | | 6,860 | |
Dividends declared: | | | | | | | | | | | | | | | | | | | | | | | | | | | | |
Preferred stock | | | | | | | | | | | | | | | (3,723 | ) | | | | | | | | | | | (3,723 | ) |
Common stock purchases | | | | | | | | | | | | | | | | | | | (470 | ) | | | | | | | (470 | ) |
Common stock reissuance | | | | | | | | | | | | | | | | | | | 33 | | | | | | | | 33 | |
Other comprehensive loss, net of tax | | | | | | | | | | | | | | | | | | | | | | | (85,877 | ) | | | (85,877 | ) |
Transfer to statutory reserve | | | | | | | | | | | 13,000 | | | | (13,000 | ) | | | | | | | | | | | — | |
| | | | | | | | | | | | | | | | | | | | | | | | | | | | |
Balance at December 31, 2013 | | $ | 1,034 | | | $ | 50,160 | | | $ | 4,170,152 | | | $ | 594,430 | | | $ | (881 | ) | | $ | (188,745 | ) | | $ | 4,626,150 | |
| | | | | | | | | | | | | | | | | | | | | | | | | | | | |
Net loss | | | | | | | | | | | | | | | (313,490 | ) | | | | | | | | | | | (313,490 | ) |
Issuance of stock | | | 2 | | | | | | | | 5,392 | | | | | | | | | | | | | | | | 5,394 | |
Tax windfall benefit on vesting of restricted stock | | | | | | | | | | | 414 | | | | | | | | | | | | | | | | 414 | |
Repurchase of TARP-related warrants | | | | | | | | | | | (3,000 | ) | | | | | | | | | | | | | | | (3,000 | ) |
Dividends declared: | | | | | | | | | | | | | | | | | | | | | | | | | | | | |
Preferred stock | | | | | | | | | | | | | | | (3,723 | ) | | | | | | | | | | | (3,723 | ) |
Common stock purchases | | | | | | | | | | | | | | | | | | | (3,272 | ) | | | | | | | (3,272 | ) |
Common stock reissuance | | | | | | | | | | | | | | | | | | | 36 | | | | | | | | 36 | |
Other comprehensive loss, net of tax | | | | | | | | | | | | | | | | | | | | | | | (41,127 | ) | | | (41,127 | ) |
Transfer to statutory reserve | | | | | | | | | | | 23,500 | | | | (23,500 | ) | | | | | | | | | | | — | |
| | | | | | | | | | | | | | | | | | | | | | | | | | | | |
Balance at December 31, 2014 | | $ | 1,036 | | | $ | 50,160 | | | $ | 4,196,458 | | | $ | 253,717 | | | $ | (4,117 | ) | | $ | (229,872 | ) | | $ | 4,267,382 | |
| | | | | | | | | | | | | | | | | | | | | | | | | | | | |
Net income | | | | | | | | | | | | | | | 895,344 | | | | | | | | | | | | 895,344 | |
Issuance of stock | | | 2 | | | | | | | | 6,224 | | | | | | | | | | | | | | | | 6,226 | |
Tax windfall benefit on vesting of restricted stock | | | | | | | | | | | 169 | | | | | | | | | | | | | | | | 169 | |
Dividends declared: | | | | | | | | | | | | | | | | | | | | | | | | | | | | |
Common stock | | | | | | | | | | | | | | | (31,076 | ) | | | | | | | | | | | (31,076 | ) |
Preferred stock | | | | | | | | | | | | | | | (3,723 | ) | | | | | | | | | | | (3,723 | ) |
Common stock purchases | | | | | | | | | | | | | | | | | | | (2,086 | ) | | | | | | | (2,086 | ) |
Common stock reissuance | | | | | | | | | | | | | | | | | | | 102 | | | | | | | | 102 | |
Other comprehensive loss, net of tax | | | | | | | | | | | | | | | | | | | | | | | (27,014 | ) | | | (27,014 | ) |
Transfer to statutory reserve | | | | | | | | | | | 26,305 | | | | (26,305 | ) | | | | | | | | | | | — | |
| | | | | | | | | | | | | | | | | | | | | | | | | | | | |
Balance at December 31, 2015 | | $ | 1,038 | | | $ | 50,160 | | | $ | 4,229,156 | | | $ | 1,087,957 | | | $ | (6,101 | ) | | $ | (256,886 | ) | | $ | 5,105,324 | |
| | | | | | | | | | | | | | | | | | | | | | | | | | | | |
| | | | | | | | | | | | |
| | | Years ended December 31, | |
| | | 2015 | | | 2014 | | | 2013 | |
Disclosure of changes in number of shares: | | | | | | | | | | | | |
Preferred Stock: | | | | | | | | | | | | |
| | | | | | | | | | | | |
Balance at beginning and end of year | | | 2,006,391 | | | | 2,006,391 | | | | 2,006,391 | |
| | | | | | | | | | | | |
Common Stock: | | | | | | | | | | | | |
Balance at beginning of year | | | 103,614,553 | | | | 103,435,967 | | | | 103,193,303 | |
Issuance of stock | | | 201,632 | | | | 178,586 | | | | 242,664 | |
| | | | | | | | | | | | |
Balance at end of year | | | 103,816,185 | | | | 103,614,553 | | | | 103,435,967 | |
Treasury stock | | | (197,209 | ) | | | (137,706 | ) | | | (38,268 | ) |
| | | | | | | | | | | | |
Common Stock – Outstanding | | | 103,618,976 | | | | 103,476,847 | | | | 103,397,699 | |
| | | | | | | | | | | | |
The accompanying notes are an integral part of these consolidated financial statements.
112
POPULAR, INC.
CONSOLIDATED STATEMENTS OF CASH FLOWS
| | | | | | | | | | | | |
| | | Years ended December 31, | |
(In thousands) | | 2015 | | | 2014 | | | 2013 | |
Cash flows from operating activities: | | | | | | | | | | | | |
Net income (loss) | | $ | 895,344 | | | $ | (313,490 | ) | | $ | 599,327 | |
| | | | | | | | | | | | |
Adjustments to reconcile net income (loss) to net cash provided by operating activities: | | | | | | | | | | | | |
Provision for loan losses | | | 241,478 | | | | 263,369 | | | | 602,563 | |
Goodwill impairment losses | | | — | | | | 186,511 | | | | — | |
Amortization of intangibles | | | 11,019 | | | | 9,434 | | | | 9,883 | |
Depreciation and amortization of premises and equipment | | | 47,474 | | | | 47,137 | | | | 48,162 | |
Net accretion of discounts and amortization of premiums and deferred fees | | | (73,496 | ) | | | 278,576 | | | | (79,004 | ) |
Other-than-temporary impairment on investment securities | | | 14,445 | | | | — | | | | — | |
Fair value adjustments on mortgage servicing rights | | | 7,904 | | | | 24,683 | | | | 11,403 | |
FDIC loss-share (income) expense | | | (20,062 | ) | | | 103,024 | | | | 82,051 | |
Adjustments (expense) to indemnity reserves on loans sold | | | 18,628 | | | | 40,629 | | | | 37,054 | |
Earnings from investments under the equity method | | | (24,373 | ) | | | (39,578 | ) | | | (42,873 | ) |
Deferred income tax (benefit) expense | | | (519,128 | ) | | | 43,512 | | | | (288,754 | ) |
(Gain) loss on: | | | | | | | | | | | | |
Disposition of premises and equipment | | | (3,629 | ) | | | (1,716 | ) | | | (3,392 | ) |
Sale and valuation adjustments of investment securities | | | (141 | ) | | | 870 | | | | (2,110 | ) |
Sale of loans, including valuation adjustments on loans held-for-sale and mortgage banking activities | | | (35,013 | ) | | | (88,724 | ) | | | 22,411 | |
Sale of stock in equity method investee | | | — | | | | — | | | | (416,113 | ) |
Sale of foreclosed assets, including write-downs | | | 60,378 | | | | 28,005 | | | | 50,740 | |
Disposal of discontinued business | | | — | | | | (38,355 | ) | | | — | |
Acquisitions of loans held-for-sale | | | (401,991 | ) | | | (308,600 | ) | | | (390,018 | ) |
Proceeds from sale of loans held-for-sale | | | 124,111 | | | | 123,375 | | | | 218,379 | |
Net originations on loans held-for-sale | | | (792,821 | ) | | | (753,312 | ) | | | (1,049,474 | ) |
Net decrease (increase) in: | | | | | | | | | | | | |
Trading securities | | | 1,083,683 | | | | 1,105,374 | | | | 1,430,835 | |
Accrued income receivable | | | 5,392 | | | | 9,719 | | | | (5,809 | ) |
Other assets | | | 100,133 | | | | 132,500 | | | | 2,827 | |
Net increase (decrease) in: | | | | | | | | | | | | |
Interest payable | | | 528 | | | | (707 | ) | | | (2,466 | ) |
Pension and other postretirement benefits obligation | | | 3,252 | | | | (10,171 | ) | | | 10,635 | |
Other liabilities | | | (72,980 | ) | | | 30,937 | | | | (26,952 | ) |
| | | | | | | | | | | | |
Total adjustments | | | (225,209 | ) | | | 1,186,492 | | | | 219,978 | |
| | | | | | | | | | | | |
Net cash provided by operating activities | | | 670,135 | | | | 873,002 | | | | 819,305 | |
| | | | | | | | | | | | |
Cash flows from investing activities: | | | | | | | | | | | | |
Net (increase) decrease in money market investments | | | (357,706 | ) | | | (963,933 | ) | | | 227,127 | |
Purchases of investment securities: | | | | | | | | | | | | |
Available-for-sale | | | (2,014,315 | ) | | | (2,001,940 | ) | | | (2,257,976 | ) |
Held-to-maturity | | | (750 | ) | | | (1,000 | ) | | | (250 | ) |
Other | | | (40,847 | ) | | | (110,010 | ) | | | (178,093 | ) |
Proceeds from calls, paydowns, maturities and redemptions of investment securities: | | | | | | | | | | | | |
Available-for-sale | | | 1,362,712 | | | | 1,722,650 | | | | 1,823,474 | |
Held-to-maturity | | | 4,856 | | | | 39,962 | | | | 4,632 | |
Other | | | 46,341 | | | | 92,752 | | | | 181,784 | |
Proceeds from sale of investment securities: | | | | | | | | | | | | |
Available-for-sale | | | 96,760 | | | | 310,210 | | | | 5,438 | |
Other | | | 14,950 | | | | 37,104 | | | | — | |
Net repayments on loans | | | 431,676 | | | | 775,900 | | | | 680,819 | |
Proceeds from sale of loans | | | 30,160 | | | | 355,145 | | | | 333,021 | |
Acquisition of loan portfolios | | | (338,447 | ) | | | (389,067 | ) | | | (1,592,603 | ) |
Acquisition of trademark | | | (50 | ) | | | — | | | | — | |
Net payments from FDIC under loss sharing agreements | | | 247,976 | | | | 256,498 | | | | 396,223 | |
Net cash received and acquired from business combination | | | 731,279 | | | | — | | | | — | |
Acquisition of servicing advances | | | (61,304 | ) | | | — | | | | — | |
Cash paid related to business acquisitions | | | (17,250 | ) | | | (6,330 | ) | | | — | |
Return of capital from equity method investments | | | 13,329 | | | | — | | | | 491 | |
Proceeds from sale of stock in equity method investee | | | — | | | | — | | | | 481,377 | |
Net cash disbursed from disposal of discontinued business | | | — | | | | (205,895 | ) | | | — | |
Mortgage servicing rights purchased | | | (2,400 | ) | | | — | | | | (45 | ) |
Acquisition of premises and equipment | | | (62,656 | ) | | | (51,046 | ) | | | (38,573 | ) |
Proceeds from sale of: | | | | | | | | | | | | |
Premises and equipment | | | 12,880 | | | | 14,337 | | | | 10,090 | |
Foreclosed assets | | | 141,145 | | | | 150,115 | | | | 226,063 | |
| | | | | | | | | | | | |
Net cash provided by investing activities | | | 238,339 | | | | 25,452 | | | | 302,999 | |
| | | | | | | | | | | | |
Cash flows from financing activities: | | | | | | | | | | | | |
Net increase (decrease) in: | | | | | | | | | | | | |
Deposits | | | 207,338 | | | | 109,015 | | | | (323,404 | ) |
Federal funds purchased and assets sold under agreements to repurchase | | | (509,512 | ) | | | (387,635 | ) | | | (357,460 | ) |
Other short-term borrowings | | | (148,215 | ) | | | (380,000 | ) | | | (235,000 | ) |
Payments of notes payable | | | (737,889 | ) | | | (1,059,290 | ) | | | (332,031 | ) |
Proceeds from issuance of notes payable | | | 277,398 | | | | 781,905 | | | | 106,739 | |
Proceeds from issuance of common stock | | | 6,226 | | | | 5,394 | | | | 6,860 | |
Dividends paid | | | (19,257 | ) | | | (3,723 | ) | | | (3,723 | ) |
Repurchase of TARP - related warrants | | | — | | | | (3,000 | ) | | | — | |
Net payments for repurchase of common stock | | | (1,984 | ) | | | (3,236 | ) | | | (437 | ) |
| | | | | | | | | | | | |
Net cash used in financing activities | | | (925,895 | ) | | | (940,570 | ) | | | (1,138,456 | ) |
| | | | | | | | | | | | |
Net decrease in cash and due from banks | | | (17,421 | ) | | | (42,116 | ) | | | (16,152 | ) |
Cash and due from banks at beginning of period | | | 381,095 | | | | 423,211 | | | | 439,363 | |
| | | | | | | | | | | | |
Cash and due from banks at end of period | | $ | 363,674 | | | $ | 381,095 | | | $ | 423,211 | |
| | | | | | | | | | | | |
The accompanying notes are an integral part of these consolidated financial statements.
The Consolidated Statement of Cash Flows for the periods ended December 31, 2015, 2014 and 2013 include the cash flows from operating, investing and financing activities associated with discontinued operations.
113
Notes to Consolidated Financial
Statements
114
Note 1 – Nature of operations and basis of presentation
Nature of Operations
Popular, Inc. (the “Corporation”) is a diversified, publicly owned financial holding company subject to the supervision and regulation of the Board of Governors of the Federal Reserve System. The Corporation has operations in Puerto Rico, the United States and the Caribbean. In Puerto Rico, the Corporation provides retail, mortgage and commercial banking services, through its principal banking subsidiary, Banco Popular de Puerto Rico (“BPPR”), as well as investment banking, broker-dealer, auto and equipment leasing and financing, and insurance services through specialized subsidiaries. In the U.S. mainland, the Corporation operates Banco Popular North America (“BPNA”), including its wholly-owned subsidiary E-LOAN. BPNA focuses efforts and resources on the core community banking business. BPNA operates branches in New York, New Jersey and South Florida. E-LOAN markets deposit accounts under its name for the benefit of BPNA. Refer to Note 4 for discussion of the sales of the Illinois, Central Florida and California regional operations during the year ended December 31, 2014. The BPNA branches operate under the name of Popular Community Bank. Note 44 to the consolidated financial statements presents information about the Corporation’s business segments.
On February 27, 2015, BPPR, in an alliance with other bidders, including BPNA, acquired certain assets and all deposits (other than certain brokered deposits) of former Doral Bank (“Doral”) from the Federal Deposit Insurance Corporation (FDIC), as receiver (the “Doral Bank Transaction”). Under the FDIC’s bidding format, BPPR was the lead bidder and party to the purchase and assumption agreement with the FDIC covering all assets and deposits acquired by it and its alliance co-bidders. BPPR entered into back to back purchase and assumption agreements with the alliance co-bidders for the transfer of certain assets and deposits. Refer to Note 5 for further details on the Doral Bank Transaction.
Basis of Presentation
As discussed in Note 4, prior periods presented in the consolidated statement of operations as well as the related note disclosures covering income and expense amounts have been retrospectively adjusted for the impact of the discontinued operations for comparative purposes.
During the year ended December 31, 2014, the Corporation recorded an out-of-period adjustment to correct an error in the amortization expense of the FDIC indemnification asset recorded during the years 2012 and 2013. The FDIC indemnity asset amortization for the year ended December 31, 2014, included a benefit of approximately $12.5 million to reverse the impact of accelerated amortization expense recorded during prior periods. This amount was recognized as expense over the remaining portion of the Loss Sharing Agreement that expired in the quarter ending June 30, 2015. After evaluating the quantitative and qualitative aspects of the error and the out-of-period adjustment to the Corporation’s financial results, management has determined that the misstatement and the out-of-period adjustment are not material to the 2012, 2013 and 2014 financial statements, respectively.
115
Note 2 – Summary of significant accounting policies
The accounting and financial reporting policies of Popular, Inc. and its subsidiaries (the “Corporation”) conform with accounting principles generally accepted in the United States of America and with prevailing practices within the financial services industry.
The following is a description of the most significant of these policies:
Principles of consolidation
The consolidated financial statements include the accounts of Popular, Inc. and its subsidiaries. Intercompany accounts and transactions have been eliminated in consolidation. In accordance with the consolidation guidance for variable interest entities, the Corporation would also consolidate any variable interest entities (“VIEs”) for which it has a controlling financial interest; and therefore, it is the primary beneficiary. Assets held in a fiduciary capacity are not assets of the Corporation and, accordingly, are not included in the consolidated statements of financial condition.
Unconsolidated investments, in which there is at least 20% ownership, are generally accounted for by the equity method which the Corporation exercises significant influence, with earnings recorded in other operating income. These investments are included in other assets and the Corporation’s proportionate share of income or loss is included in other operating income. Those investments in which there is less than 20% ownership, are generally carried under the cost method of accounting, unless significant influence is exercised. Under the cost method, the Corporation recognizes income when dividends are received. Limited partnerships are accounted for by the equity method unless the investor’s interest is so “minor” that the limited partner may have virtually no influence over partnership operating and financial policies.
Statutory business trusts that are wholly-owned by the Corporation and are issuers of trust preferred securities are not consolidated in the Corporation’s consolidated financial statements.
Discontinued Operations
Components of the Corporation that will be disposed of by sale, where the Corporation does not have a significant continuing involvement in the operations after the disposal, are accounted for as discontinued operations. The results of operations of the discontinued operations exclude allocations of corporate overhead. Refer to Note 4 - Discontinued Operations, for additional information on the discontinued operations.
Business combinations
Business combinations are accounted for under the acquisition method. Under this method, assets acquired, liabilities assumed and any noncontrolling interest in the acquiree at the acquisition date are measured at their fair values as of the acquisition date. The acquisition date is the date the acquirer obtains control. Also, assets or liabilities arising from noncontractual contingencies are measured at their acquisition date at fair value only if it is more likely than not that they meet the definition of an asset or liability. Acquisition-related restructuring costs that do not meet certain criteria of exit or disposal activities are expensed as incurred. Transaction costs are expensed as incurred. Changes in income tax valuation allowances for acquired deferred tax assets are recognized in earnings subsequent to the measurement period as an adjustment to income tax expense. Contingent consideration classified as an asset or a liability is remeasured to fair value at each reporting date until the contingency is resolved. The changes in fair value of the contingent consideration are recognized in earnings unless the arrangement is a hedging instrument for which changes are initially recognized in other comprehensive income.
The Corporation determined that the acquisition of certain assets and assumption of certain liabilities in connection with the Doral Bank Transaction, completed during the year ended December 31, 2015, constitutes a business combination as defined by the Financial Accounting Standards Board (“FASB”) Codification (“ASC”) Topic 805 “Business Combinations”.
During the fourth quarter of 2015, the Corporation early adopted ASU 2015-16 “Business Combination”. Accordingly, adjustments to the initial fair value estimates identified during the measurement period are being recognized in the reporting period in which the adjustment amounts are determined. Refer to Note 5 to the consolidated financial statements for the related disclosures in connection with the Doral Bank Transaction.
There were no significant business combinations during 2014 and 2013.
Deconsolidation of a subsidiary
The Corporation accounts for the deconsolidation of a subsidiary when it ceases to have a controlling financial interest in the subsidiary. Accordingly, it recognizes a gain or loss in results of operations measured as the difference between the sum of the fair value of the consideration received, the fair value of any retained non-controlling investment in the former subsidiary and the carrying amount of any noncontrolling interest in the former subsidiary, as compared with the carrying amount of the former subsidiary’s assets and liabilities.
116
Use of estimates in the preparation of financial statements
The preparation of financial statements in conformity with accounting principles generally accepted in the United States of America requires management to make estimates and assumptions that affect the reported amounts of assets and liabilities and contingent assets and liabilities at the date of the financial statements, and the reported amounts of revenues and expenses during the reporting period. Actual results could differ from those estimates.
Fair value measurements
The Corporation determines the fair values of its financial instruments based on the fair value framework established in the guidance for Fair Value Measurements in ASC Subtopic 820-10, which requires an entity to maximize the use of observable inputs and minimize the use of unobservable inputs when measuring fair value. Fair value is defined as the exchange price that would be received for an asset or paid to transfer a liability (an exit price) in the principal or most advantageous market for the asset or liability in an orderly transaction between market participants on the measurement date. The standard describes three levels of inputs that may be used to measure fair value which are (1) quoted market prices for identical assets or liabilities in active markets, (2) observable market-based inputs or unobservable inputs that are corroborated by market data, and (3) unobservable inputs that are not corroborated by market data. The fair value hierarchy ranks the quality and reliability of the information used to determine fair values.
The guidance in ASC Subtopic 820-10 also addresses measuring fair value in situations where markets are inactive and transactions are not orderly. Transactions or quoted prices for assets and liabilities may not be determinative of fair value when transactions are not orderly, and thus, may require adjustments to estimate fair value. Price quotes based on transactions that are not orderly should be given little, if any, weight in measuring fair value. Price quotes based on transactions that are orderly shall be considered in determining fair value, and the weight given is based on facts and circumstances. If sufficient information is not available to determine if price quotes are based on orderly transactions, less weight should be given to the price quote relative to other transactions that are known to be orderly.
Covered assets
Assets subject to loss sharing agreements with the FDIC, including certain loans and other real estate properties, are labeled “covered” on the consolidated statements of financial condition and throughout the notes to the consolidated financial statements. Loans acquired in the Westernbank FDIC-assisted transaction, except for credit cards, which remain subject to the terms of the FDIC loss sharing agreement, are considered “covered loans” because the Corporation will be reimbursed for 80% of any future losses on these loans subject to the terms of such agreement.
Investment securities
Investment securities are classified in four categories and accounted for as follows:
| | • | | Debt securities that the Corporation has the intent and ability to hold to maturity are classified as securities held-to-maturity and reported at amortized cost. The Corporation may not sell or transfer held-to-maturity securities without calling into question its intent to hold other debt securities to maturity, unless a nonrecurring or unusual event that could not have been reasonably anticipated has occurred. An investment in debt securities is considered impaired if the fair value of the investment is less than its amortized cost. For other-than-temporary impairments the Corporation assesses if it has both the intent and the ability to hold the security for a period of time sufficient to allow for an anticipated recovery in its fair value to its amortized cost. For other-than-temporary impairment not related to a credit loss (defined as the difference between the present value of the cash flows expected to be collected and the amortized cost basis) for a held-to-maturity security is recognized in other comprehensive loss and amortized over the remaining life of the debt security. The amortized cost basis for a debt security is adjusted by the credit loss amount of other-than-temporary impairments. |
| | • | | Debt and equity securities classified as trading securities are reported at fair value, with unrealized gains and losses included in non-interest income. |
| | • | | Debt and equity securities (equity securities with readily available fair value) not classified as either securities held-to-maturity or trading securities, and which have a readily available fair value, are classified as securities available-for-sale |
117
| | and reported at fair value, with unrealized gains and losses excluded from earnings and reported, net of taxes, in accumulated other comprehensive income or loss. The specific identification method is used to determine realized gains and losses on securities available-for-sale, which are included in net gains or losses on sale and valuation adjustment of investment securities in the consolidated statements of operations. Declines in the value of debt and equity securities that are considered other-than-temporary reduce the value of the asset, and the estimated loss is recorded in non-interest income. For debt securities, the Corporation assesses whether (a) it has the intent to sell the debt security, or (b) it is more likely than not that it will be required to sell the debt security before its anticipated recovery. If either of these conditions is met, an other-than-temporary impairment on the security is recognized. In instances in which a determination is made that a credit loss (defined as the difference between the present value of the cash flows expected to be collected and the amortized cost basis) exists but the entity does not intend to sell the debt security and it is not more likely than not that the entity will be required to sell the debt security before the anticipated recovery of its remaining amortized cost basis (i.e., the amortized cost basis less any current-period credit loss), the impairment is separated into (a) the amount of the total impairment related to the credit loss, and (b) the amount of the total impairment related to all other factors. The amount of the total other-than-temporary impairment related to the credit loss is recognized in the statement of operations. The amount of the total impairment related to all other factors is recognized in other comprehensive loss. The other-than-temporary impairment analyses for both debt and equity securities are performed on a quarterly basis. |
| | • | | Investments in equity or other securities that do not have readily available fair values are classified as other investment securities in the consolidated statements of financial condition, and are subject to impairment testing, if applicable. These securities are stated at the lower of cost or realizable value. The source of this value varies according to the nature of the investment, and is primarily obtained by the Corporation from valuation analyses prepared by third-parties or from information derived from financial statements available for the corresponding venture capital and mutual funds. Stock that is owned by the Corporation to comply with regulatory requirements, such as Federal Reserve Bank and Federal Home Loan Bank (“FHLB”) stock, is included in this category, and their realizable value equals their cost. |
The amortization of premiums is deducted and the accretion of discounts is added to net interest income based on the interest method over the outstanding period of the related securities. The cost of securities sold is determined by specific identification. Net realized gains or losses on sales of investment securities and unrealized loss valuation adjustments considered other-than-temporary, if any, on securities available-for-sale, held-to-maturity and other investment securities are determined using the specific identification method and are reported separately in the consolidated statements of operations. Purchases and sales of securities are recognized on a trade date basis.
Derivative financial instruments
All derivatives are recognized on the statements of financial condition at fair value. The Corporation’s policy is not to offset the fair value amounts recognized for multiple derivative instruments executed with the same counterparty under a master netting arrangement nor to offset the fair value amounts recognized for the right to reclaim cash collateral (a receivable) or the obligation to return cash collateral (a payable) arising from the same master netting arrangement as the derivative instruments.
When the Corporation enters into a derivative contract, the derivative instrument is designated as either a fair value hedge, cash flow hedge or as a free-standing derivative instrument. For a fair value hedge, changes in the fair value of the derivative instrument and changes in the fair value of the hedged asset or liability or of an unrecognized firm commitment attributable to the hedged risk are recorded in current period earnings. For a cash flow hedge, changes in the fair value of the derivative instrument, to the extent that it is effective, are recorded net of taxes in accumulated other comprehensive income and subsequently reclassified to net income (loss) in the same period(s) that the hedged transaction impacts earnings. The ineffective portion of cash flow hedges is immediately recognized in current earnings. For free-standing derivative instruments, changes in fair values are reported in current period earnings.
Prior to entering a hedge transaction, the Corporation formally documents the relationship between hedging instruments and hedged items, as well as the risk management objective and strategy for undertaking various hedge transactions. This process includes linking all derivative instruments that are designated as fair value or cash flow hedges to specific assets and liabilities on the statements of financial condition or to specific forecasted transactions or firm commitments along with a formal assessment, at both inception of the hedge and on an ongoing basis, as to the effectiveness of the derivative instrument in offsetting changes in fair values or cash flows of the hedged item. Hedge accounting is discontinued when the derivative instrument is not highly effective as a hedge, a derivative expires, is sold, terminated, when it is unlikely that a forecasted transaction will occur or when it is determined that it is no longer appropriate. When hedge accounting is discontinued the derivative continues to be carried at fair value with changes in fair value included in earnings.
118
For non-exchange traded contracts, fair value is based on dealer quotes, pricing models, discounted cash flow methodologies or similar techniques for which the determination of fair value may require significant management judgment or estimation.
The fair value of derivative instruments considers the risk of non-performance by the counterparty or the Corporation, as applicable.
The Corporation obtains or pledges collateral in connection with its derivative activities when applicable under the agreement.
Loans
Loans are classified as loans held-in-portfolio when management has the intent and ability to hold the loan for the foreseeable future, or until maturity or payoff. The foreseeable future is a management judgment which is determined based upon the type of loan, business strategies, current market conditions, balance sheet management and liquidity needs. Management’s view of the foreseeable future may change based on changes in these conditions. When a decision is made to sell or securitize a loan that was not originated or initially acquired with the intent to sell or securitize, the loan is reclassified from held-in-portfolio into held-for-sale. Due to changing market conditions or other strategic initiatives, management’s intent with respect to the disposition of the loan may change, and accordingly, loans previously classified as held-for-sale may be reclassified into held-in-portfolio. Loans transferred between loans held-for-sale and held-in-portfolio classifications are recorded at the lower of cost or fair value at the date of transfer.
Purchased loans are accounted at fair value upon acquisition. Credit discounts are included in the determination of fair value; therefore, an allowance for loan losses is not recorded at the acquisition date.
Loans held-for-sale are stated at the lower of cost or fair value, cost being determined based on the outstanding loan balance less unearned income, and fair value determined, generally in the aggregate. Fair value is measured based on current market prices for similar loans, outstanding investor commitments, prices of recent sales or discounted cash flow analyses which utilize inputs and assumptions which are believed to be consistent with market participants’ views. The cost basis also includes consideration of deferred origination fees and costs, which are recognized in earnings at the time of sale. Upon reclassification to held-for-sale, credit related fair value adjustments are recorded as a reduction in the allowance for loan losses (“ALLL”). To the extent that the loan’s reduction in value has not already been provided for in the allowance for loan losses, an additional loan loss provision is recorded. Subsequent to reclassification to held-for-sale, the amount, by which cost exceeds fair value, if any, is accounted for as a valuation allowance with changes therein included in the determination of net income (loss) for the period in which the change occurs.
Loans held-in-portfolio are reported at their outstanding principal balances net of any unearned income, charge-offs, unamortized deferred fees and costs on originated loans, and premiums or discounts on purchased loans. Fees collected and costs incurred in the origination of new loans are deferred and amortized using the interest method or a method which approximates the interest method over the term of the loan as an adjustment to interest yield.
The past due status of a loan is determined in accordance with its contractual repayment terms. Furthermore, loans are reported as past due when either interest or principal remains unpaid for 30 days or more in accordance with its contractual repayment terms.
Non-accrual loans are those loans on which the accrual of interest is discontinued. When a loan is placed on non-accrual status, all previously accrued and unpaid interest is charged against income and the loan is accounted for either on a cash-basis method or on the cost-recovery method. Loans designated as non-accruing are returned to accrual status when the Corporation expects repayment of the remaining contractual principal and interest.
Recognition of interest income on commercial and construction loans is discontinued when the loans are 90 days or more in arrears on payments of principal or interest or when other factors indicate that the collection of principal and interest is doubtful. The impaired portion of secured loan past due as to principal and interest is charged-off not later than 365 days past due. However, in the case of a collateral dependent loan individually evaluated for impairment, the excess of the recorded investment over the fair value of the collateral (portion deemed uncollectible) is generally promptly charged-off, but in any event, not later than the quarter following the quarter in which such excess was first recognized. Commercial unsecured loans are charged-off no later than 180 days past due. Recognition of interest income on mortgage loans is generally discontinued when loans are 90 days or more in arrears on payments of principal or interest. The impaired portion of a mortgage loan is charged-off when the loan is 180 days past due. The Corporation discontinues the recognition of interest on residential mortgage loans insured by the Federal Housing Administration (“FHA”) or guaranteed by the U.S. Department of Veterans Affairs (“VA”) when 15-months delinquent as to principal or interest. The principal repayment on these loans is insured. Recognition of interest income on closed-end consumer loans and home equity lines of credit is discontinued when the loans are 90 days or more in arrears on payments of principal or interest. Income is generally recognized on open-end consumer loans, except for home equity lines of credit, until the loans are charged-off. Recognition of interest income for lease financing is ceased when loans are 90 days or more in arrears. Closed-end consumer loans and leases are charged-off when they are 120 days in arrears. Open-end (revolving credit) consumer loans are charged-off when 180 days in arrears. Commercial and consumer overdrafts are generally charged-off no later than 60 days past their due date.
119
Purchased impaired loans accounted for under ASC Subtopic 310-30 are not considered non-performing and continue to have an accretable yield as long as there is a reasonable expectation about the timing and amount of cash flows expected to be collected. Also, loans charged-off against the non-accretable difference established in purchase accounting are not reported as charge-offs. Charge-offs on loans accounted under ASC Subtopic 310-30 are recorded only to the extent that losses exceed the non-accretable difference established with purchase accounting.
A loan classified as a troubled debt restructuring (“TDR”) is typically in non-accrual status at the time of the modification. The TDR loan continues in non-accrual status until the borrower has demonstrated a willingness and ability to make the restructured loan payments (at least six months of sustained performance after the modification (or one year for loans providing for quarterly or semi-annual payments)) and management has concluded that it is probable that the borrower would not be in payment default in the foreseeable future.
Lease financing
The Corporation leases passenger and commercial vehicles and equipment to individual and corporate customers. The finance method of accounting is used to recognize revenue on lease contracts that meet the criteria specified in the guidance for leases in ASC Topic 840. Aggregate rentals due over the term of the leases less unearned income are included in finance lease contracts receivable. Unearned income is amortized using a method which results in approximate level rates of return on the principal amounts outstanding. Finance lease origination fees and costs are deferred and amortized over the average life of the lease as an adjustment to the interest yield.
Revenue for other leases is recognized as it becomes due under the terms of the agreement.
Loans acquired as part of the Westernbank FDIC-assisted transaction
Loans acquired in a business acquisition are recorded at fair value at the acquisition date. Credit discounts are included in the determination of fair value; therefore, an allowance for loan losses is not recorded at the acquisition date.
The Corporation applied the guidance of ASC Subtopic 310-30 to all loans acquired in Westernbank FDIC-assisted transaction (including loans that do not meet scope of ASC Subtopic 310-30), except for credit cards and revolving lines of credit that were expressly scoped out from the application of this guidance since they continued to have revolving privileges after acquisition. Management used its judgment in evaluating factors impacting expected cash flows and probable loss assumptions, including the quality of the loan portfolio, portfolio concentrations, distressed economic conditions, quality of underwriting standards of the acquired institution, reductions in collateral real estate values, among other considerations that could also impact the expected cash inflows on the loans.
Loans accounted for under ASC Subtopic 310-30 represent loans showing evidence of credit deterioration and that it is probable, at the date of acquisition, that the Corporation would not collect all contractually required principal and interest payments. Generally, acquired loans that meet the definition for nonaccrual status fall within the Corporation’s definition of impaired loans under ASC Subtopic 310-30. Also, based on the fair value determined for the acquired portfolio, acquired loans that did not meet the definition of nonaccrual status also resulted in the recognition of a significant discount attributable to credit quality. Accordingly, an election was made by the Corporation to apply the accretable yield method (expected cash flow model of ASC Subtopic 310-30), as a loan with credit deterioration and impairment, instead of the standard loan discount accretion guidance of ASC Subtopic 310-20, for the loans acquired in the Westernbank FDIC-assisted transaction. These loans are disclosed as a loan that was acquired with credit deterioration and impairment.
Loans acquired as part of the Doral Bank FDIC-assisted transaction
Certain residential mortgage loans and commercial loans acquired as part of the Doral Bank Transaction were considered impaired. Accordingly, the Corporation applied the guidance of ASC Subtopic 310-30. Refer to Note 12 to the consolidated financial statements for additional information with respect to the loans acquired as part of the Doral Bank Transaction that were considered impaired.
Under ASC Subtopic 310-30, the loans acquired from the FDIC were aggregated into pools based on loans that had common risk characteristics. Each loan pool is accounted for as a single asset with a single composite interest rate and an aggregate expectation of cash flows. Characteristics considered in pooling loans in the FDIC-assisted transaction included loan type, interest rate type, accruing status, amortization type, rate index and source type. Once the pools are defined, the Corporation maintains the integrity of the pool of multiple loans accounted for as a single asset.
120
Under ASC Subtopic 310-30, the difference between the undiscounted cash flows expected at acquisition and the fair value in the loans, or the “accretable yield,” is recognized as interest income using the effective yield method over the estimated life of the loan if the timing and amount of the future cash flows of the pool is reasonably estimable. The non-accretable difference represents the difference between contractually required principal and interest and the cash flows expected to be collected. Subsequent to the acquisition date, increases in cash flows over those expected at the acquisition date are recognized as interest income prospectively. Decreases in expected cash flows after the acquisition date are recognized by recording an allowance for loan losses.
The fair value discount of lines of credit with revolving privileges that are accounted for pursuant to the guidance of ASC Subtopic 310-20 represents the difference between the contractually required loan payment receivable in excess of the initial investment in the loan. This discount is accreted into interest income over the life of the loan if the loan is in accruing status. Any cash flows collected in excess of the carrying amount of the loan are recognized in earnings at the time of collection. The carrying amount of lines of credit with revolving privileges, which are accounted pursuant to the guidance of ASC Subtopic 310-20, are subject to periodic review to determine the need for recognizing an allowance for loan losses.
Allowance for loan losses
The Corporation follows a systematic methodology to establish and evaluate the adequacy of the allowance for loan losses to provide for inherent losses in the loan portfolio. This methodology includes the consideration of factors such as current economic conditions, portfolio risk characteristics, prior loss experience and results of periodic credit reviews of individual loans. The provision for loan losses charged to current operations is based on this methodology. Loan losses are charged and recoveries are credited to the allowance for loan losses.
The Corporation’s assessment of the allowance for loan losses is determined in accordance with the guidance of loss contingencies in ASC Subtopic 450-20 and loan impairment guidance in ASC Section 310-10-35. Also, the Corporation determines the allowance for loan losses on purchased impaired loans and purchased loans accounted for under ASC Subtopic 310-30 by analogy, by evaluating decreases in expected cash flows after the acquisition date.
The accounting guidance provides for the recognition of a loss allowance for groups of homogeneous loans. The determination for general reserves of the allowance for loan losses includes the following principal factors:
| | • | | Base net loss rates, which are based on the moving average of annualized net loss rates computed over a 5-year historical loss period for the commercial and construction loan portfolios, and an 18-month period for the consumer and mortgage loan portfolios. The base net loss rates are applied by loan type and by legal entity. |
| | • | | Recent loss trend adjustment, which replaces the base loss rate with a 12-month average loss rate, when these trends are higher than the respective base loss rates. The objective of this adjustment is to allow for a more recent loss trend to be captured and reflected in the ALLL estimation process. |
For the period ended December 31, 2015, 15% (December 31, 2014 - 50%) of the ALLL for BPPR non-covered loan portfolios utilized the recent loss trend adjustment instead of the base loss. The effect of replacing the base loss with the recent loss trend adjustment was mainly concentrated in the commercial and industrial, mortgage, and commercial multi-family loan portfolios for 2015, and in the commercial multi-family, commercial and industrial, personal and auto loan portfolios for 2014.
For the period ended December 31, 2015, 4% (December 31, 2014 - 21%) of the ALLL for BPNA loan portfolios utilized the recent loss trend adjustment instead of the base loss. The effect of replacing the base loss with the recent loss trend adjustment was concentrated in the consumer loan portfolio for 2015 and in the commercial and industrial loan portfolio for 2014.
Environmental factors, which include credit and macroeconomic indicators such as unemployment rate, economic activity index and delinquency rates, adopted to account for current market conditions that are likely to cause estimated credit losses to differ from historical losses. The Corporation reflects the effect of these environmental factors on each loan group as an adjustment that, as appropriate, increases the historical loss rate applied to each group. Environmental factors provide updated perspective on credit and economic conditions. Regression analysis is used to select these indicators and quantify the effect on the general reserve of the allowance for loan losses. During the second quarter of 2015, management completed the annual review of the components of the ALLL models. As part of this review management updated core metrics and revised certain components related to the estimation
121
process for evaluating the adequacy of the general reserve of the allowance for loan losses. These enhancements to the ALLL methodology, which are described in the paragraphs below, were implemented as of June 30, 2015 and resulted in a net decrease to the allowance for loan losses of $ 1.9 million for the non-covered portfolio. The effect of the aforementioned enhancements was immaterial for the covered loans portfolio.
Management made the following principal enhancements to the methodology during the second quarter of 2015:
| | • | | Increased the historical look-back period for determining the base loss rates for commercial and construction loans. The Corporation increased the look-back period for assessing historical loss trends applicable to the determination of commercial and construction loan net charge-offs from 36 months to 60 months. Given the current overall commercial and construction credit quality improvements, including lower loss trends, management concluded that a 60-month look-back period for the base loss rates aligns the Corporation’s allowance for loan losses methodology to maintain adequate loss observations in its main general reserve component. |
The combined effect of the aforementioned enhancements to the base loss rates resulted in an increase to the allowance for loan losses of $19.6 million at June 30, 2015, of which $17.9 million related to the non-covered BPPR segment and $1.7 million related to the BPNA segment.
| | • | | Annual review and recalibration of the environmental factors adjustment. The environmental factor adjustments are developed by performing regression analyses on selected credit and economic indicators for each applicable loan segment. During the second quarter of 2015, the environmental factor models used to account for changes in current credit and macroeconomic conditions were reviewed and recalibrated based on the latest applicable trends. |
The combined effect of the aforementioned recalibration and enhancements to the environmental factors adjustment resulted in a decrease to the allowance for loan losses of $21.5 million at June 30, 2015, of which $20.5 million related to the non-covered BPPR segment and $1 million related to the BPNA segment.
According to the loan impairment accounting guidance in ASC Section 310-10-35, a loan is impaired when, based on current information and events, it is probable that the principal and/or interest are not going to be collected according to the original contractual terms of the loan agreement. Current information and events include “environmental” factors, e.g. existing industry, geographical, economic and political factors. Probable means the future event or events which will confirm the loss or impairment of the loan is likely to occur.
The Corporation defines commercial and construction impaired loans as borrowers with total debt greater than or equal to $1 million with 90 days or more past due, as well as all loans whose terms have been modified in a troubled debt restructuring (“TDRs”). In addition, larger commercial and construction loans ($1 million and over) that exhibit probable or observed credit weaknesses are subject to individual review and thus evaluated for impairment. Commercial and construction loans that originally met the Corporation’s threshold for impairment identification in a prior period, but due to charge-offs or payments are currently below the $1 million threshold and are still 90 days past due, except for TDRs, are accounted for under the Corporation’s general reserve methodology. Although the accounting codification guidance for specific impairment of a loan excludes large groups of smaller balance homogeneous loans that are collectively evaluated for impairment (e.g. mortgage and consumer loans), it specifically requires that loan modifications considered troubled debt restructurings (“TDRs”) be analyzed under its provisions. An allowance for loan impairment is recognized to the extent that the carrying value of an impaired loan exceeds the present value of the expected future cash flows discounted at the loan’s effective rate, the observable market price of the loan, if available, or the fair value of the collateral if the loan is collateral dependent. The fair value of the collateral is generally based on appraisals. Appraisals may be adjusted due to their age, and the type, location, and condition of the property or area or general market conditions to reflect the expected change in value between the effective date of the appraisal and the impairment measurement date. The Corporation requests updated appraisal reports from pre-approved appraisers for loans that are considered impaired following the Corporation’s reappraisals policy. This policy requires updated appraisals for loans secured by real estate (including construction loans) either annually or every two years depending on the total exposure of the borrower. As a general procedure, the Corporation internally reviews appraisals as part of the underwriting and approval process and also for credits considered impaired.
122
Troubled debt restructurings
A restructuring constitutes a TDR when the Corporation separately concludes that both of the following conditions exist: 1) the restructuring constitute a concession and 2) the debtor is experiencing financial difficulties. The concessions stem from an agreement between the creditor and the debtor or are imposed by law or a court. These concessions could include a reduction in the interest rate on the loan, payment extensions, forgiveness of principal, forbearance or other actions intended to maximize collection. A concession has been granted when, as a result of the restructuring, the Corporation does not expect to collect all amounts due, including interest accrued at the original contract rate. If the payment of principal is dependent on the value of collateral, the current value of the collateral is taken into consideration in determining the amount of principal to be collected; therefore, all factors that changed are considered to determine if a concession was granted, including the change in the fair value of the underlying collateral that may be used to repay the loan. Classification of loan modifications as TDRs involves a degree of judgment. Indicators that the debtor is experiencing financial difficulties which are considered include: (i) the borrower is currently in default on any of its debt or it is probable that the borrower would be in payment default on any of its debt in the foreseeable future without the modification; (ii) the borrower has declared or is in the process of declaring bankruptcy; (iii) there is significant doubt as to whether the borrower will continue to be a going concern; (iv) the borrower has securities that have been delisted, are in the process of being delisted, or are under threat of being delisted from an exchange; (v) based on estimates and projections that only encompass the borrower’s current business capabilities, it is forecasted that the entity-specific cash flows will be insufficient to service the debt (both interest and principal) in accordance with the contractual terms of the existing agreement through maturity; and (vi) absent the current modification, the borrower cannot obtain funds from sources other than the existing creditors at an effective interest rate equal to the current market interest rate for similar debt for a non-troubled debtor. The identification of TDRs is critical in the determination of the adequacy of the allowance for loan losses. Loans classified as TDRs may be excluded from TDR status if performance under the restructured terms exists for a reasonable period (at least twelve months of sustained performance) and the loan yields a market rate.
A loan may be restructured in a troubled debt restructuring into two (or more) loan agreements, for example, Note A and Note B. Note A represents the portion of the original loan principal amount that is expected to be fully collected along with contractual interest. Note B represents the portion of the original loan that may be considered uncollectible and charged-off, but the obligation is not forgiven to the borrower. Note A may be returned to accrual status provided all of the conditions for a TDR to be returned to accrual status are met. The modified loans are considered TDRs and thus, are evaluated under the framework of ASC Section 310-10-35 as long as the loans are not part of a pool of loans accounted for under ASC Subtopic 310-30.
Refer to Note 13 to the consolidated financial statements for additional qualitative information on TDRs and the Corporation’s determination of the allowance for loan losses.
Reserve for unfunded commitments
The reserve for unfunded commitments is maintained at a level believed by management to be sufficient to absorb estimated probable losses related to unfunded credit facilities and is included in other liabilities in the consolidated statements of financial condition. The determination of the adequacy of the reserve is based upon an evaluation of the unfunded credit facilities. Net adjustments to the reserve for unfunded commitments are included in other operating expenses in the consolidated statements of operations.
FDIC loss share indemnification asset and true-up payment obligation (contingent consideration)
The FDIC loss share indemnification asset was initially recorded at fair value. Fair value was estimated using projected cash flows related to the loss sharing agreements.
The FDIC loss share indemnification asset for loss share agreements is measured separately from the related covered assets as it is not contractually embedded in the assets and is not transferable with the assets should the assets be sold.
The FDIC loss share indemnification asset is recognized on the same basis as the assets subject to loss share protection. As such, for covered loans accounted pursuant to ASC Subtopic 310-30, decreases in expected reimbursements from the FDIC due to improvements in expected cash flows to be received from borrowers, are recognized in non-interest income prospectively over the life of the FDIC loss sharing agreements. For covered loans accounted for under ASC Subtopic 310-20, as the loan discount recorded as of the acquisition date was accreted into income, a reduction of the related indemnification asset was recorded as a reduction in non-interest income. Increases in expected reimbursements from the FDIC are recognized in non-interest income in the same period that the allowance for credit losses for the related loans is recognized.
The amortization or accretion due to discounting of the loss share asset and changes in expected loss sharing reimbursements is included in non-interest income, particularly in the category of FDIC loss share income (expense).
123
The true-up payment obligation associated with the loss share agreements is accounted for at fair value in accordance with ASC Section 805-30-25-6 as it is considered contingent consideration. The true-up payment obligation is included as part of other liabilities in the consolidated statements of financial condition. Any changes in the carrying value of the obligation are included in the category of FDIC loss share income (expense) in the consolidated statements of operations.
Refer to Note 14 for additional information on the FDIC loss share indemnification asset and true-up payment obligation.
Transfers and servicing of financial assets
The transfer of an entire financial asset, a group of entire financial assets, or a participating interest in an entire financial asset in which the Corporation surrenders control over the assets is accounted for as a sale if all of the following conditions set forth in ASC Topic 860 are met: (1) the assets must be isolated from creditors of the transferor, (2) the transferee must obtain the right (free of conditions that constrain it from taking advantage of that right) to pledge or exchange the transferred assets, and (3) the transferor cannot maintain effective control over the transferred assets through an agreement to repurchase them before their maturity. When the Corporation transfers financial assets and the transfer fails any one of these criteria, the Corporation is prevented from derecognizing the transferred financial assets and the transaction is accounted for as a secured borrowing. For federal and Puerto Rico income tax purposes, the Corporation treats the transfers of loans which do not qualify as “true sales” under the applicable accounting guidance, as sales, recognizing a deferred tax asset or liability on the transaction.
For transfers of financial assets that satisfy the conditions to be accounted for as sales, the Corporation derecognizes all assets sold; recognizes all assets obtained and liabilities incurred in consideration as proceeds of the sale, including servicing assets and servicing liabilities, if applicable; initially measures at fair value assets obtained and liabilities incurred in a sale; and recognizes in earnings any gain or loss on the sale.
The guidance on transfer of financial assets requires a true sale analysis of the treatment of the transfer under state law as if the Corporation was a debtor under the bankruptcy code. A true sale legal analysis includes several legally relevant factors, such as the nature and level of recourse to the transferor, and the nature of retained interests in the loans sold. The analytical conclusion as to a true sale is never absolute and unconditional, but contains qualifications based on the inherent equitable powers of a bankruptcy court, as well as the unsettled state of the common law. Once the legal isolation test has been met, other factors concerning the nature and extent of the transferor’s control over the transferred assets are taken into account in order to determine whether derecognition of assets is warranted.
The Corporation sells mortgage loans to the Government National Mortgage Association (“GNMA”) in the normal course of business and retains the servicing rights. The GNMA programs under which the loans are sold allow the Corporation to repurchase individual delinquent loans that meet certain criteria. At the Corporation’s option, and without GNMA’s prior authorization, the Corporation may repurchase the delinquent loan for an amount equal to 100% of the remaining principal balance of the loan. Once the Corporation has the unconditional ability to repurchase the delinquent loan, the Corporation is deemed to have regained effective control over the loan and recognizes the loan on its balance sheet as well as an offsetting liability, regardless of the Corporation’s intent to repurchase the loan.
Servicing assets
The Corporation periodically sells or securitizes loans while retaining the obligation to perform the servicing of such loans. In addition, the Corporation may purchase or assume the right to service loans originated by others. Whenever the Corporation undertakes an obligation to service a loan, management assesses whether a servicing asset or liability should be recognized. A servicing asset is recognized whenever the compensation for servicing is expected to more than adequately compensate the servicer for performing the servicing. Likewise, a servicing liability would be recognized in the event that servicing fees to be received are not expected to adequately compensate the Corporation for its expected cost. Mortgage servicing assets recorded at fair value are separately presented on the consolidated statements of financial condition.
All separately recognized servicing assets are initially recognized at fair value. For subsequent measurement of servicing rights, the Corporation has elected the fair value method for mortgage loans servicing rights (“MSRs”). Under the fair value measurement method, MSRs are recorded at fair value each reporting period, and changes in fair value are reported in mortgage banking activities in the consolidated statement of operations. Contractual servicing fees including ancillary income and late fees, as well as fair value adjustments, and impairment losses, if any, are reported in mortgage banking activities in the consolidated statement of operations. Loan servicing fees, which are based on a percentage of the principal balances of the loans serviced, are credited to income as loan payments are collected.
124
The fair value of servicing rights is estimated by using a cash flow valuation model which calculates the present value of estimated future net servicing cash flows, taking into consideration actual and expected loan prepayment rates, discount rates, servicing costs, and other economic factors, which are determined based on current market conditions.
Premises and equipment
Premises and equipment are stated at cost less accumulated depreciation and amortization. Depreciation is computed on a straight-line basis over the estimated useful life of each type of asset. Amortization of leasehold improvements is computed over the terms of the respective leases or the estimated useful lives of the improvements, whichever is shorter. Costs of maintenance and repairs which do not improve or extend the life of the respective assets are expensed as incurred. Costs of renewals and betterments are capitalized. When assets are disposed of, their cost and related accumulated depreciation are removed from the accounts and any gain or loss is reflected in earnings as realized or incurred, respectively.
The Corporation capitalizes interest cost incurred in the construction of significant real estate projects, which consist primarily of facilities for its own use or intended for lease. The amount of interest cost capitalized is to be an allocation of the interest cost incurred during the period required to substantially complete the asset. The interest rate for capitalization purposes is to be based on a weighted average rate on the Corporation’s outstanding borrowings, unless there is a specific new borrowing associated with the asset. Interest cost capitalized for the years ended December 31, 2015, 2014 and 2013 was not significant.
The Corporation has operating lease arrangements primarily associated with the rental of premises to support its branch network or for general office space. Certain of these arrangements are non-cancellable and provide for rent escalations and renewal options. Rent expense on non-cancellable operating leases with scheduled rent increases are recognized on a straight-line basis over the lease term.
Impairment of long-lived assets
The Corporation evaluates for impairment its long-lived assets to be held and used, and long-lived assets to be disposed of, whenever events or changes in circumstances indicate that the carrying amount of an asset may not be recoverable.
Restructuring costs
A liability for a cost associated with an exit or disposal activity is recognized and measured initially at its fair value in the period in which the liability is incurred. If future service is required for employees to receive the one-time termination benefit, the liability is initially measured at its fair value as of the termination date and recognized over the future service period.
Other real estate
Other real estate, received in satisfaction of a loan, is recorded at fair value less estimated costs of disposal. The difference between the carrying amount of the loan and the fair value less cost to sell is recorded as an adjustment to the allowance for loan losses. Subsequent to foreclosure, any losses in the carrying value arising from periodic re-evaluations of the properties, and any gains or losses on the sale of these properties are credited or charged to expense in the period incurred and are included as OREO expenses. The cost of maintaining and operating such properties is expensed as incurred.
Updated appraisals are obtained to adjust the value of the other real estate assets. The frequency depends on the loan type and total credit exposure. The appraisal for a commercial or construction other real estate property with a book value greater than $1 million is updated annually and if lower than $1 million it is updated every two years. For residential mortgage properties, the Corporation requests appraisals, generally on an annual basis.
Appraisals may be adjusted due to age, collateral inspections, property profiles, or general market conditions. The adjustments applied are based upon internal information such as other appraisals for the type of properties and/or loss severity information that can provide historical trends in the real estate market, and may change from time to time based on market conditions.
Goodwill and other intangible assets
Goodwill is recognized when the purchase price is higher than the fair value of net assets acquired in business combinations under the purchase method of accounting. Goodwill is not amortized, but is tested for impairment at least annually or more frequently if events or circumstances indicate possible impairment using a two-step process at each reporting unit level. The first step of the goodwill impairment test, used to identify potential impairment, compares the fair value of a reporting unit with its carrying amount, including goodwill. If the fair value of a reporting unit exceeds its carrying amount, the goodwill of the reporting unit is not considered impaired and the second step of the impairment test is unnecessary. If needed, the second step consists of comparing the implied fair value of the reporting unit goodwill with the carrying amount of that goodwill. In determining the fair value of a reporting unit, the Corporation generally uses a combination of methods, which include market price multiples of comparable companies and the discounted cash flow analysis. Goodwill impairment losses are recorded as part of operating expenses in the consolidated statement of operations.
125
Other intangible assets deemed to have an indefinite life are not amortized, but are tested for impairment using a one-step process which compares the fair value with the carrying amount of the asset. In determining that an intangible asset has an indefinite life, the Corporation considers expected cash inflows and legal, regulatory, contractual, competitive, economic and other factors, which could limit the intangible asset’s useful life.
Other identifiable intangible assets with a finite useful life, mainly core deposits, are amortized using various methods over the periods benefited, which range from 4 to 10 years. These intangibles are evaluated periodically for impairment when events or changes in circumstances indicate that the carrying amount may not be recoverable. Impairments on intangible assets with a finite useful life are evaluated under the guidance for impairment or disposal of long-lived assets.
Assets sold / purchased under agreements to repurchase / resell
Repurchase and resell agreements are treated as collateralized financing transactions and are carried at the amounts at which the assets will be subsequently reacquired or resold as specified in the respective agreements.
It is the Corporation’s policy to take possession of securities purchased under agreements to resell. However, the counterparties to such agreements maintain effective control over such securities, and accordingly those securities are not reflected in the Corporation’s consolidated statements of financial condition. The Corporation monitors the fair value of the underlying securities as compared to the related receivable, including accrued interest.
It is the Corporation’s policy to maintain effective control over assets sold under agreements to repurchase; accordingly, such securities continue to be carried on the consolidated statements of financial condition.
The Corporation may require counterparties to deposit additional collateral or return collateral pledged, when appropriate.
Software
Capitalized software is stated at cost, less accumulated amortization. Capitalized software includes purchased software and capitalizable application development costs associated with internally-developed software. Amortization, computed on a straight-line method, is charged to operations over the estimated useful life of the software. Capitalized software is included in “Other assets” in the consolidated statement of financial condition.
Guarantees, including indirect guarantees of indebtedness of others
The Corporation, as a guarantor, recognizes at the inception of a guarantee, a liability for the fair value of the obligation undertaken in issuing the guarantee. Refer to Note 29 to the consolidated financial statements for further disclosures on guarantees.
Treasury stock
Treasury stock is recorded at cost and is carried as a reduction of stockholders’ equity in the consolidated statements of financial condition. At the date of retirement or subsequent reissue, the treasury stock account is reduced by the cost of such stock. At retirement, the excess of the cost of the treasury stock over its par value is recorded entirely to surplus. At reissuance, the difference between the consideration received upon issuance and the specific cost is charged or credited to surplus.
Income Recognition – Insurance agency business
Commissions and fees are recognized when related policies are effective. Additional premiums and rate adjustments are recorded as they occur. Contingent commissions are recorded on an accrual basis when the amount to be received is notified by the insurance company. Commission income from advance business is deferred. An allowance is created for expected adjustments to commissions earned relating to policy cancellations.
Income Recognition – Investment banking revenues and commissions
Investment banking revenue is recorded as follows: underwriting fees at the time the underwriting is completed and income is reasonably determinable; corporate finance advisory fees as earned, according to the terms of the specific contracts; and sales commissions on a trade-date basis. Commission income and expenses related to customers’ securities transactions are recorded on a trade-date basis.
Foreign exchange
Assets and liabilities denominated in foreign currencies are translated to U.S. dollars using prevailing rates of exchange at the end of the period. Revenues, expenses, gains and losses are translated using weighted average rates for the period. The resulting foreign currency translation adjustment from operations for which the functional currency is other than the U.S. dollar is reported in accumulated other comprehensive loss, except for highly inflationary environments in which the effects are included in other operating expenses.
126
The Corporation holds interests in Centro Financiero BHD León, S.A. (“BHD León”) in the Dominican Republic. The business of BHD León is mainly conducted in their country’s foreign currency. The resulting foreign currency translation adjustment from these operations is reported in accumulated other comprehensive loss. During 2014, BHD León entered into a merger agreement with Grupo Financiero León, as part of this transaction BHD León issued additional stock which had a dilutive effect of Popular’s equity participation. Refer to Note 19, Other Assets, for additional information. Therefore, a pro rata portion of the accumulated translation adjustment component of the equity attributable to this equity method investment was recognized as a loss through earnings.
Refer to the disclosure of accumulated other comprehensive loss included in Note 28.
Income taxes
The Corporation recognizes deferred tax assets and liabilities for the expected future tax consequences of events that have been recognized in the Corporation’s financial statements or tax returns. Deferred income tax assets and liabilities are determined for differences between financial statement and tax bases of assets and liabilities that will result in taxable or deductible amounts in the future. The computation is based on enacted tax laws and rates applicable to periods in which the temporary differences are expected to be recovered or settled.
The guidance for income taxes requires a reduction of the carrying amounts of deferred tax assets by a valuation allowance if, based on the available evidence, it is more likely than not (defined as a likelihood of more than 50 percent) that such assets will not be realized. Accordingly, the need to establish valuation allowances for deferred tax assets is assessed periodically by the Corporation based on the more likely than not realization threshold criterion. In the assessment for a valuation allowance, appropriate consideration is given to all positive and negative evidence related to the realization of the deferred tax assets. This assessment considers, among other matters, all sources of taxable income available to realize the deferred tax asset, including the future reversal of existing temporary differences, the future taxable income exclusive of reversing temporary differences and carryforwards, taxable income in carryback years and tax-planning strategies. In making such assessments, significant weight is given to evidence that can be objectively verified.
The valuation of deferred tax assets requires judgment in assessing the likely future tax consequences of events that have been recognized in the Corporation’s financial statements or tax returns and future profitability. The Corporation’s accounting for deferred tax consequences represents management’s best estimate of those future events.
Positions taken in the Corporation’s tax returns may be subject to challenge by the taxing authorities upon examination. Uncertain tax positions are initially recognized in the financial statements when it is more likely than not the position will be sustained upon examination by the tax authorities. Such tax positions are both initially and subsequently measured as the largest amount of tax benefit that is greater than 50% likely of being realized upon settlement with the tax authority, assuming full knowledge of the position and all relevant facts. Interest on income tax uncertainties is classified within income tax expense in the statement of operations; while the penalties, if any, are accounted for as other operating expenses.
The Corporation accounts for the taxes collected from customers and remitted to governmental authorities on a net basis (excluded from revenues).
Income tax expense or benefit for the year is allocated among continuing operations, discontinued operations, and other comprehensive income, as applicable. The amount allocated to continuing operations is the tax effect of the pre-tax income or loss from continuing operations that occurred during the year, plus or minus income tax effects of (a) changes in circumstances that cause a change in judgment about the realization of deferred tax assets in future years, (b) changes in tax laws or rates, (c) changes in tax status, and (d) tax-deductible dividends paid to shareholders, subject to certain exceptions.
Employees’ retirement and other postretirement benefit plans
Pension costs are computed on the basis of accepted actuarial methods and are charged to current operations. Net pension costs are based on various actuarial assumptions regarding future experience under the plan, which include costs for services rendered during the period, interest costs and return on plan assets, as well as deferral and amortization of certain items such as actuarial gains or losses. Effective December 31, 2015, the Corporation changed its estimate of the service and interest cost components of net periodic benefit cost for its pension and postretirement benefits plans. Previously, the Corporation estimated the service and interest cost components utilizing a single weighted-average discount rate derived from the yield curve used to measure the benefit obligation. The new estimate utilizes a full yield curve approach in the estimation of these components by applying the specific spot rates along the yield curve used in the determination of the benefit obligation to their underlying projected cash flows. The new
127
estimate provides a more precise measurement of service and interest costs by improving the correlation between projected benefit cash flows and their corresponding spot rates. The change does not affect the measurement of the Corporation’s pension and postretirement benefit obligations and it is accounted for as a change in accounting estimate, which is applied prospectively. Additional information of the projected impact for 2016 resulting from the change in estimate of the service and interest cost components of net periodic benefit cost for its pension and postretirement benefits plans is included in Note 36 to the consolidated financial statements.
The funding policy is to contribute to the plan as necessary to provide for services to date and for those expected to be earned in the future. To the extent that these requirements are fully covered by assets in the plan, a contribution may not be made in a particular year.
The cost of postretirement benefits, which is determined based on actuarial assumptions and estimates of the costs of providing these benefits in the future, is accrued during the years that the employee renders the required service.
The guidance for compensation retirement benefits of ASC Topic 715 requires the recognition of the funded status of each defined pension benefit plan, retiree health care and other postretirement benefit plans on the statement of financial condition.
Stock-based compensation
The Corporation opted to use the fair value method of recording stock-based compensation as described in the guidance for employee share plans in ASC Subtopic 718-50.
Comprehensive income (loss)
Comprehensive income (loss) is defined as the change in equity of a business enterprise during a period from transactions and other events and circumstances, except those resulting from investments by owners and distributions to owners. The presentation of comprehensive income (loss) is included in separate consolidated statements of comprehensive income (loss).
Net income (loss) per common share
Basic income (loss) per common share is computed by dividing net income (loss) adjusted for preferred stock dividends, including undeclared or unpaid dividends if cumulative, and charges or credits related to the extinguishment of preferred stock or induced conversions of preferred stock, by the weighted average number of common shares outstanding during the year. Diluted income per common share take into consideration the weighted average common shares adjusted for the effect of stock options, restricted stock and warrants on common stock, using the treasury stock method.
Statement of cash flows
For purposes of reporting cash flows, cash includes cash on hand and amounts due from banks.
128
Note 3 – New accounting pronouncements
FASB Accounting Standards Update (“ASU”) 2016-02, Leases (Topic 842)
The FASB issued ASU 2016-02 in February 2016, which supersedes ASC Topic 840 and sets out the principles for the recognition, measurement, presentation and disclosure of leases for both lessors and lessees. The new standard requires lessees to apply a dual approach, classifying leases as either finance or operating leases based on the principle of whether or not the lease is effectively a financed purchase by the lessee. This classification will determine whether lease expense is recognized based on an effective interest method or on a straight-line basis over the term of the lease, respectively. A lessee is also required to record a right-of-use asset and a lease liability for all leases with a term greater than 12 months regardless of their classification. Leases with a term of 12 months or less will be accounted for similar to existing guidance for operating leases today. The new standard requires lessors to account for leases using an approach that is substantially equivalent to existing guidance for sales-type leases, direct financing leases and operating leases.
The amendments of this Update are effective for fiscal years, and interim periods within those fiscal years, beginning after December 15, 2018, with early adoption permitted.
The ASU is expected to impact the Corporation’s consolidated financial statements since the Corporation has certain operating and land lease arrangements for which it is the lessee. The Corporation is currently evaluating the impact that the adoption of this accounting pronouncement will have on its consolidated financial statements.
FASB Accounting Standards Update (“ASU”) 2016-01, Financial Instruments - Overall (Subtopic 825-10): Recognition and Measurement of Financial Assets and Financial Liabilities
The FASB issued ASU 2016-01 in January 2016, which primarily affects the accounting for equity investments and financial liabilities under the fair value option as follows: require equity investments (except those accounted for under the equity method of accounting or those that result in consolidation of the investee) to be measured at fair value with changes in fair value recognized in net income; simplify the impairment assessment of equity investments without readily determinable fair values; require changes in fair value due to instrument-specific credit risk to be presented separately in other comprehensive income for financial liabilities under the fair value option; and clarify that the need for a valuation allowance on a deferred tax asset related to available-for-sale securities should be evaluated in combination with the entity’s other deferred tax assets. In addition, the ASU also impacts the presentation and disclosure requirements of financial instruments.
The amendments of this Update are effective for fiscal years, and interim periods within those fiscal years, beginning after December 15, 2017. Early adoption can only be elected for the provision to record credit-related fair value changes for financial liabilities under the fair value option through other comprehensive income for those financial statements of fiscal years and interim periods that have not yet been issued.
The Corporation is currently evaluating the impact that the adoption of this accounting pronouncement will have on its consolidated financial statements.
FASB Accounting Standards Update (“ASU”) 2015-17, Income Taxes (Topic 740): Balance Sheet Classification of Deferred Taxes
The FASB issued ASU 2015-17 in November 2015, which requires that all deferred tax assets and liabilities, along with any related valuation allowance, be classified as noncurrent on the statement of financial condition.
The amendments of this ASU are effective for fiscal years, and interim periods within those fiscal years, beginning after December 15, 2016. Early application is permitted for all entities as of the beginning of an interim or annual reporting period.
The adoption of this guidance impacts the presentation in the statement of financial condition and will not have an impact on the Corporation’s consolidated financial statements since the Corporation does not present a classified statement of financial condition.
129
FASB Accounting Standards Update (“ASU”) 2015-16, Business Combination - (Topic 805): Simplifying the Accounting for Measurement-Period Adjustments
The FASB issued ASU 2015-16 in September 2015, which eliminates the requirement to retrospectively adjust and revise prior period financial statements for measurement period adjustments related to a business combination. The new guidance requires an acquirer to recognize adjustments to provisional amounts that are identified during the measurement period in the reporting period in which the adjustment amounts are determined. The cumulative impact of measurement period adjustments on current and prior periods, including the prior period impact on depreciation, amortization, and other income statement items and their related tax effects, is now required to be recognized in the period the adjustment amount is determined and within the respective financial statement line items affected.
The new guidance requires an acquirer to disclose the nature and amount of measurement period adjustments. In addition, the amendments in this Update require an entity to present separately on the face of the income statement or disclose in the notes the portion of the amount recorded in current-period earnings by line item that would have been recorded in previous reporting periods if the adjustment to the provisional amounts had been recognized as of the acquisition date.
The amendments of this ASU are effective for fiscal years, and interim periods within those fiscal years, beginning after December 15, 2015. The amendments in this Update should be applied prospectively to adjustments to provisional amounts that occur after the effective date of this Update with earlier application permitted for financial statements that have not been issued.
The Corporation early adopted this accounting pronouncement during the fourth quarter of 2015, and as a result the new guidance was used in connection with certain measurement period adjustments identified for the Doral Bank Transaction. Refer to Note 5, Business Combination, for disclosures related to the Doral Bank Transaction.
FASB Accounting Standards Update 2015-15, Interest- Imputation of Interest (Subtopic 835-30): Presentation and Subsequent Measurement of Debt Issuance Costs Associated with Line-of-Credit Arrangements
The FASB issued ASU 2015-15 in August 2015 since ASU 2015-03 does not address presentation or subsequent measurement of debt issuance costs related to line-of-credit arrangements. Given the absence of authoritative guidance within ASU 2015-03, the SEC staff clarified that it would not object to an entity deferring and presenting debt issuance costs as an asset and subsequently amortizing the deferred debt issuance costs ratably over the term of the line-of-credit arrangement, regardless of whether there are any outstanding borrowings on the line-of-credit arrangement.
The Corporation does not anticipate that the adoption of this accounting pronouncement will have a material impact on the presentation of its consolidated statements of financial condition or on its results of operations.
FASB Accounting Standards Update 2015-14, Revenue from Contracts with Customers (Topic 606): Deferral of the Effective Date
The FASB issued ASU 2015-14 in August 2015, which defers the effective date of ASU 2014-09 for all entities by one year. Therefore, ASU 2014-09 is now effective for fiscal years, and interim periods within those fiscal years, beginning after December 15, 2017. Earlier application is permitted only as of annual reporting periods, and interim periods within those fiscal years, beginning after December 15, 2016. The Corporation is currently evaluating the impact that the adoption of this guidance will have on the presentation and disclosures in its consolidated financial statements.
FASB Accounting Standards Update 2015-09, Insurance - (Topic 944): Disclosures about Short-Duration Contracts
In June 2015, the FASB issued Accounting Standards Update 2015-09, Disclosure about Short-Duration Contracts, which applies toall insurance entities that issue short-duration contracts. The amendment requires, among other things, additional disclosures about the liability for unpaid claims and claim adjustment expenses. The amendments also require insurance entities to disclose information about significant changes in methodologies and assumptions used to calculate the liability for unpaid claims and claim adjustment expenses, including reasons for the change and the effects on the financial statements.
The amendments in this update are effective for annual periods beginning after December 15, 2015, and interim periods within annual periods beginning after December 15, 2016.
The Corporation does not anticipate that the adoption of this accounting pronouncement will have a significant impact on its consolidated financial statements.
130
FASB Accounting Standards Update 2015-07, Fair Value Measurement – (Topic 820): Disclosures for Investment in Certain Entities That Calculate Net Asset Value per Share (or Its Equivalent) (“ASU 2015-07”)
The FASB issued ASU 2015-07 in May 2015, which removes the requirement to categorize within the fair value hierarchy all investments for which fair value is measured using the net asset value per share practical expedient. Currently, investments valued using the practical expedient are categorized within the fair value hierarchy on the basis of whether the investment is redeemable with the investee at net asset value on the measurement date, never redeemable with the investee at net asset value, or redeemable with the investee at a future date. For investments that are redeemable with the investee at a future date, a reporting entity must take into account the length of time until those investments become redeemable to determine the classification within the fair value hierarchy. There is diversity in practice related to how certain investment measured at net asset value with redemption dates in the future are categorized within the fair value hierarchy.
The amendments also remove the requirement to make certain disclosures for all investments that are eligible to be measured at fair value using the net asset value per share practical expedient. Those disclosures are limited to investments for which the entity has elected to measure the fair value using that practical expedient.
The amendments of this ASU are effective for fiscal years, and interim periods within those fiscal years, beginning after December 31, 2015. Early adoption is permitted. A reporting entity should apply the amendments retrospectively to all periods presented. The retrospective approach requires that an investment for which fair value is measured using the net asset value per share practical expedient be removed from the fair value hierarchy in all periods presented in an entity’s financial statements.
The adoption of this guidance impacts presentation disclosures only and will not have an impact on the Corporation’s consolidated statement of financial condition or results of operations.
FASB Accounting Standards Update 2015-05, Intangibles – Goodwill and Other Internal-Use Software (Subtopic 350-40): Customer’s Accounting for Fees Paid in a Cloud Computing Arrangement (“ASU 2015-05”)
The FASB issued ASU 2015-05 in April 2015, which provides guidance about a customer’s accounting for fees paid in a cloud computing arrangement. The amendments in this ASU provide guidance to customers about whether a cloud computing arrangement includes a software license. If a cloud computing arrangement includes a software license, then the customer should account for the software license element of the arrangement consistent with the acquisition of other software licenses. If a cloud computing arrangement does not include a software license, the customer should account for the arrangement as a service contract. This guidance will not change the accounting for service contracts. All software licenses within the scope of ASC Subtopic 350-40 will be accounted for consistent with other licenses of intangible assets.
The amendments of this Update are effective for fiscal years, and interim periods within those fiscal years, beginning after December 31, 2015. Early adoption is permitted. An entity can adopt the amendments either prospectively to all arrangements entered into or materially modified after the effective date, or retrospectively.
The Corporation is currently evaluating the impact that the adoption of this accounting pronouncement will have on its consolidated financial statements.
FASB Accounting Standards Update 2015-04, Compensation – Retirement Benefits (Topic 715): Practical Expedient for the Measurement Date of an Employer’s Defined Benefit Obligation and Plan Assets (“ASU 2015-04”)
The FASB issued ASU 2015-04 in April 2015, which simplifies the measurement of benefit plan assets and obligations. For an entity with a fiscal year-end that does not coincide with a month-end, the amendments in this ASU provides a practical expedient that permits the entity to measure defined benefit plan assets and obligations using the month-end that is closest to the entity’s fiscal year-end and apply that practical expedient from year to year. The practical expedient should be applied consistently to all plans if an entity has more than one plan.
For an entity that has a significant event in an interim period that calls for a remeasurement of defined benefit plan assets and obligation, the amendments in this ASU also provide a practical expedient that permits the entity to remeasure define plan assets and obligations using the month-end that is closest to the date of the significant event.
An entity is required to disclose the accounting policy election and the date used to measure defined benefit plan assets and obligations in accordance with the amendments of this ASU. Employee benefit plans are not within the scope of these amendments.
The amendments of this Update are effective for fiscal years, and interim periods within those fiscal years, beginning after December 31, 2015. Early adoption is permitted. The amendments in this ASU should be applied prospectively.
131
The Corporation does not expect that the adoption of this accounting pronouncement will have a significant impact on its financial statements.
FASB Accounting Standards Update 2015-03, Interest – Imputation of Interest (Subtopic 835-30): Simplifying the Presentation of Debt Issuance Costs (“ASU 2015-03”)
The FASB issued ASU 2015-03 in April 2015, which simplifies the presentation of debt issuance costs. The amendments in this ASU require that debt issuance costs related to a recognized debt liability be presented in the balance sheet as a direct reduction from the carrying amount of that debt liability, consistent with debt discounts. Having different balance sheet presentation requirements for debt issuance costs and debt discount and premium creates unnecessary complexity. The recognition and measurement guidance for debt issuance costs are not affected by the amendments of this Update.
The amendments of this Update are effective for financial statements issued for fiscal years beginning after December 31, 2015, and interim periods within fiscal years beginning after December 31, 2016. Early adoption is permitted for financial statements that have not been previously issued.
An entity should apply the new guidance on a retrospective basis, wherein the balance sheet of each individual period presented should be adjusted to reflect the period-specific effects of applying the new guidance. Upon transition, an entity is required to comply with the applicable disclosures for a change in an accounting principle.
The Corporation‘s current policy is to record debt issuance costs as a deferred asset, and accordingly, it will need to reclassify this balance upon adoption. However, this balance sheet reclassification is not expected to have a material impact in the Corporation’s consolidated financial statements.
FASB Accounting Standards Update 2015-02, Consolidation (Topic 810): Amendment to the Consolidation Analysis (“ASU 2015-02”)
The FASB issued ASU 2015-02 in February 2015, which changes the analysis that a reporting entity must perform to determine whether it should consolidate certain legal entities. All legal entities are subject to reevaluation under the revised consolidation model. Specifically, the amendments:
| | 1) | Modify the evaluation of whether limited partnerships and similar legal entities are variable interest entities (VIEs) or voting interest entities |
| | 2) | Eliminate the presumption that a general partner should consolidate a limited partnership |
| | 3) | Affect the consolidation analysis of reporting entities that are involved with VIEs, particularly those that have fee arrangements and related party relationships |
| | 4) | Provide a scope exception from consolidation guidance for reporting entities with interest in legal entities that are required to comply with or operate in accordance with requirements that are similar to those in Rule 2a-7 of the Investment Company Act of 1940 for registered money market funds. |
The amendments of this Update are effective for fiscal years, and interim periods within those fiscal years, beginning after December 31, 2015. Early adoption is permitted, including adoption in an interim period. If an entity early adopts in an interim period, any adjustment should be reflected as of the beginning of the fiscal year of that includes that interim period.
The amendments may be applied using a modified retrospective approach by recording a cumulative-effect adjustment to equity as of the beginning of the fiscal year of adoption. A reporting entity may also apply the amendments of this ASU retrospectively.
The Corporation is currently evaluating the impact that the adoption of this accounting pronouncement will have on its consolidated financial statements.
FASB Accounting Standards Update 2015-01, Income Statement – Extraordinary and Unusual Items (Subtopic 225-20): Simplifying Income Statement Presentation by Eliminating the Concept of Extraordinary Items (“ASU 2015-01”)
The FASB issued ASU 2015-01 in January 2015, which eliminates from GAAP the concept of extraordinary items. Presently, an event or transaction is presumed to be an ordinary and usual activity of the reporting entity unless evidence clearly supports the classification as an extraordinary item. If an event or transaction meets the criteria for extraordinary classification, an entity is required to segregate the extraordinary item from the results of ordinary operations and show the item separately in the income statement, net of tax, after income from continuing operations. The entity is also required to disclose applicable income taxes and either present or disclose earnings-per-share data applicable to the extraordinary item.
132
Eliminating the concept of extraordinary items will save time and reduce costs for preparers because they will not have to assess whether a particular event or transaction event is extraordinary. This will alleviate uncertainty for preparers, auditors, and regulators because auditors and regulators no longer will need to evaluate whether a preparer treated an unusual and/or infrequent item appropriately.
The presentation and disclosure guidance for items that are unusual in nature and occur infrequently will be retained and will be expanded to include items that are both unusual in nature and infrequently occurring.
The amendments of this Update are effective for fiscal years, and interim periods within those fiscal years, beginning after December 31, 2015. The amendments may be applied prospectively or retrospectively to all prior periods presented in the financial statements. Early adoption is permitted provided is applied from the beginning of the fiscal year of adoption.
The Corporation does not anticipate that the adoption of this accounting pronouncement will have a material effect on its consolidated statements of financial condition, results of operations or presentation and disclosures.
FASB Accounting Standards Update 2014-16, Derivatives and Hedging (Topic 815): Determining Whether the Host Contract in a Hybrid Financial Instrument Issued in the Form of a Share is more Akin to Debt or to Equity (“ASU 2014-16”)
The FASB issued ASU 2014-16 in November 2014, which intends to eliminate the use of different methods in practice and thereby reduce existing diversity under GAAP in the accounting for hybrid financial instruments issued in the form of a share. An entity should determine the nature of the host contract by considering the economic characteristics and risks of the entire hybrid financial instrument, including the embedded derivative feature that is being evaluated for separate accounting from the host contract. In evaluating the stated and implied substantive terms and features, the existence or omission of any single term or feature does not necessarily determine the economic characteristics and risks of the host contract. Although an individual term or feature may weigh more heavily in the evaluation on the basis of facts and circumstances, an entity should use judgment based on an evaluation of all relevant terms and features.
The amendment in this ASU does not change the current criteria in GAAP for determining when separation of certain embedded derivative features in a hybrid financial instrument is required. An entity will continue to evaluate whether the economic characteristics and risks of the embedded derivative feature are clearly and closely related to those of the host contract, among other relevant criteria.
The amendments in the ASU are effective for annual periods, and interim periods within those annual periods, beginning in the first quarter of 2016. Early adoption is permitted. The effects of initially adopting the amendments of this ASU should be applied on a modified retrospective basis to existing hybrid financial instruments issued in the form of a share as of the beginning of the fiscal year for which the amendments are effective. Retrospective application is permitted to all relevant prior periods.
The Corporation does not anticipate that the adoption of this accounting pronouncement will have a material effect on its consolidated statements of financial condition or results of operations.
FASB Accounting Standards Update 2014-15, Presentation of Financial Statements – Going Concern (Subtopic 205-40): Disclosure of Uncertainties about an Entity’s Ability as a Going Concern (“ASU 2014-15”)
The FASB issued ASU 2014-15 in August 2014, which provides guidance in GAAP about management’s responsibility to evaluate whether there is substantial doubt about an entity’s ability to continue as a going concern and to provide the related footnote disclosures. These amendments should reduce diversity in the timing and content of footnote disclosures.
In connection with preparing financial statements for each annual and interim reporting period, an entity’s management should evaluate whether there are conditions or events, considered in the aggregate, that raise substantial doubt about the entity’s ability to continue as a going concern within one year after the date that the financial statements are issued (or within one year after the date that the financial statements are available to be issued when applicable).
When management identifies conditions or events that raise substantial doubt about an entity’s ability to continue as a going concern, management should consider whether its plans that are intended to mitigate those relevant conditions or events will alleviate the substantial doubt. The mitigating effect of management’s plans should be considered only to the extent that (1) it is probable that the plans will be effectively implemented and, if so, (2) it is probable that the plans will mitigate the conditions or events that raise substantial doubt about the entity’s ability to continue as a going concern.
133
The amendments in this Update are effective for the annual period ending after December 15, 2016, and for annual periods and interim periods thereafter. Early application is permitted.
The Corporation does not anticipate that the adoption of this guidance will have a material effect on its consolidated statements of financial condition, results of operations or presentation and disclosures.
FASB Accounting Standards Update 2014-13, Consolidation (Topic 810): Measuring the Financial Assets and the Financial Liabilities of a Consolidated Collateralized Financial Entity (“ASU 2014-13”)
The FASB issued ASU 2014-13 in August 2014, which intends to clarify that when a reporting entity that consolidates a collateralized financing entity may elect to measure the financial assets and the financial liabilities of that collateralized financing entity using either the measurement alternative included in this Update or Topic 820 on fair value measurement. When the measurement alternative is not elected, the amendments of this Update clarify that the fair value of the financial assets and the fair value of the financial liabilities of the consolidated collateralized financing entity should be measured using the requirements of Topic 820 and any differences in the fair value of the financial assets and the fair value of the financial liabilities of that entity should be reflected in earnings and attributed to the reporting entity in the consolidated statement of income.
When a reporting entity elects the measurement alternative included in this Update for a collateralized financing entity, the reporting entity should measure both the financial assets and the financial liabilities of that entity in its consolidated financial statements using the more observable of the fair value of the financial assets and the fair value of the financial liabilities.
The amendments in the ASU are effective in the first quarter of 2016. Early adoption is permitted as of the beginning of an annual period. The amendments of this ASU can be applied using a modified retrospective approach by recording a cumulative-effect adjustment to equity as of the beginning of the annual period of adoption. A reporting entity also may apply the amendments retrospectively to all relevant prior periods beginning with the annual period in which the amendments of ASU 2009-17 were initially adopted.
The Corporation does not anticipate that the adoption of this accounting pronouncement guidance will have a material effect on its consolidated statements of financial condition or results of operations.
FASB Accounting Standards Update 2014-12, Compensation – Stock Compensation (Topic 718): Accounting for Share-Based Payments When the Terms of an Award Provide That a Performance Target Could Be Achieved after the Requisite Service Period (“ASU 2014-12”)
The FASB issued ASU 2014-12 in June 2014, which intends to resolve the diverse accounting treatment of awards with a performance target that could be achieved after an employee completes the requisite service period. That is, the employee would be eligible to vest in the award regardless of whether the employee is rendering service on the date the performance target is achieved.
The amendments of the ASU require that a performance target that affects vesting and that could be achieved after the requisite service period be treated as a performance condition. As such, the performance target should not be reflected in estimating the grant-date fair value of the award.
Compensation cost should be recognized in the period in which it becomes probable that the performance target will be achieved and should represent the compensation cost attributable to the periods for which the requisite service has already been rendered. If the performance target becomes probable of being achieved before the end of the requisite service period, the remaining unrecognized compensation cost should be recognized prospectively over the remaining requisite service period.
The amendments in the ASU are effective in the first quarter of 2016. Early adoption is permitted. The amendments of this ASU can be applied (a) prospectively to all awards granted or modified after the effective date or (b) retrospectively to all awards with performance targets outstanding at the beginning of the period of adoption and to all new or modified awards thereafter.
The Corporation does not anticipate that the adoption of this guidance will have a material effect on its consolidated statements of financial condition or results of operations.
FASB Accounting Standards Update 2014-09, Revenue from Contracts with Customers (Topic 606); (“ASU 2014-09”)
The FASB issued ASU 2014-09 in May 2014, which clarifies the principles for recognizing revenue and develop a common revenue standard that would (1) remove inconsistencies and weaknesses in revenue requirements, (2) provide a more robust framework for addressing revenue issues, (3) improve comparability of revenue recognition practices across entities, industries, jurisdictions, and capital markets, (4) provide more useful information to users of financial statement through improved disclosure requirements and (5) simplify the preparation of financial statements by reducing the number of requirements to which an entity must refer. ASU 2014-09 amends the ASC Codification and creates a new Topic 606, Revenue from Contracts with Customers.
134
The core principle of the guidance is that an entity should recognize revenue to depict the transfer of promised goods or services to customers in an amount that reflects the consideration to which the entity expects to be entitled in exchange for those goods or services.
In addition, the new guidance requires disclosures to enable users of financial statements to understand the nature, timing, and uncertainty of revenue and cash flows arising from contracts with customers. Qualitative and quantitative information is required about contract with customers, significant judgments and changes in judgments, and assets recognized from the cost to obtain or fulfill a contract.
The amendments in this ASU were originally effective in the first quarter of 2017. However, in August 2015, the FASB issued ASU 2015-14, which defers the effective date until January 1, 2018.
The Corporation is currently evaluating the impact that the adoption of this guidance will have on the presentation and disclosures in its consolidated financial statements.
135
Note 4 – Discontinued operations
During the year ended December 31, 2014, the Corporation completed the sale of its California, Illinois and Central Florida regional operations to three different buyers.
The regional operations sold constituted a business, as defined in ASC 805-10-55. Accordingly, the decision to sell these businesses resulted in the discontinuance of each of their respective operations and classification as held-for-sale. For financial reporting purposes, the results of the discontinued operations are presented as “Assets / Liabilities from discontinued operations” in the consolidated statement of condition and “(Loss) income from discontinued operations, net of tax” in the consolidated statement of operations. As required by ASC 205-20, current and prior periods presented in the consolidated statement of operations as well as the related note disclosures covering income and expense amounts have been retrospectively adjusted for the impact of the discontinued operations for comparative purposes.
During the quarter ended June 30, 2014, the Corporation recorded non-cash impairment charge of $187 million related to the goodwill allocated, on a relative fair value basis, to these operations. However, this non-cash charge had no impact on the Corporation’s tangible capital or regulatory capital ratios.
After the sale of these three regions, at December 31, 2015, there were no assets held within the discontinued operations. As of December 31, 2015, liabilities within discontinued operations amounted to approximately $1.8 million, mainly comprised of the indemnity reserve related to the California regional sale.
The following table provides the components of net income (loss) from the discontinued operations for the years ended December 31, 2015 and 2014.
| | | | | | | | |
| | | Years ended December 31, | |
(In thousands) | | 2015 | | | 2014 | |
| | |
Net interest income | | $ | — | | | $ | 61,352 | |
Provision (reversal) for loan losses | | | — | | | | (6,764 | ) |
Net gain on sale of regions | | | — | | | | 33,829 | |
Other non-interest income | | | — | | | | 27,823 | |
| | | | | | | | |
Total non-interest income | | | — | | | | 61,652 | |
| | | | | | | | |
Operating expenses: | | | | | | | | |
Personnel costs | | | — | | | | 36,675 | |
Net occupancy expenses | | | — | | | | 3,086 | |
Professional fees (reversal) | | | (1,348 | ) | | | 15,642 | |
Goodwill impairment charge | | | — | | | | 186,511 | |
Other operating expenses | | | 1 | | | | 10,834 | |
| | | | | | | | |
Total operating expenses | | | (1,347 | ) | | | 252,748 | |
| | | | | | | | |
Net income (loss) from discontinued operations | | $ | 1,347 | | | $ | (122,980 | ) |
| | | | | | | | |
136
Note 5 – Business combination
On February 27, 2015, BPPR, in an alliance with co-bidders, including BPNA, acquired certain assets and all deposits (other than certain brokered deposits) of former Doral Bank from the Federal Deposit Insurance Corporation (FDIC), as receiver.
Under the FDIC’s bidding format, BPPR was the lead bidder and party to the purchase and assumption agreement with the FDIC covering all assets and deposits acquired by it and its alliance co-bidders. BPPR entered into back to back purchase and assumption agreements with the alliance co-bidders for the transfer of certain assets and deposits. The other co-bidders that formed part of the alliance led by BPPR were FirstBank Puerto Rico, Centennial Bank, and a vehicle formed by J.C. Flowers III LP. BPPR entered into transition service agreements with each of the alliance co-bidders.
After taking into account the transfers to the unaffiliated alliance co-bidders, BPPR and BPNA assumed an aggregate of approximately $2.2 billion in deposits and acquired an aggregate of approximately $1.7 billion in commercial and residential loans, excluding the effects of purchase accounting adjustments.
BPPR assumed approximately $574 million in deposits associated with eight Puerto Rico branches of Doral Bank and approximately $425 million from its online deposit platform, and approximately $799 million in Puerto Rico residential and commercial loans.
BPNA assumed approximately $1.2 billion in deposits in three New York branches of Doral Bank, and acquired approximately $880 million in commercial loans primarily in the New York metropolitan area.
There is no loss-sharing arrangement with the FDIC on the acquired assets.
On February 27, 2015, the FDIC, as receiver for Doral Bank, accepted BPPR’s bid for the purchase of the mortgage servicing rights on three pools of residential mortgage loans of approximately $5.0 billion in unpaid principal balance for a purchase price initially estimated at $48.6 million. As of February 27, 2015, the transfers of the mortgage servicing rights were subject to a number of specified closing conditions, including the consent of each of Ginnie Mae, Fannie Mae and Freddie Mac in a form acceptable to BPPR, and other customary closing conditions. Therefore, the fair value as of February 27, 2015 was recorded as a contingent asset as part of other assets in the Consolidated Statement of Condition. During the second quarter of 2015, BPPR completed the acquisition of the mortgage servicing rights pools on the three pools for an aggregate purchase price of $56.2 million, including certain servicing advances purchased. As a result of the completion of these transactions, during the second quarter of 2015 BPPR reclassified the contingent asset from other assets to mortgage servicing rights.
During the fourth quarter of 2015 the Corporation early adopted ASU 2015-16 “Business Combination”. Accordingly, adjustments to the initial fair value estimates identified during the measurement period are being recognized in the reporting period in which the adjustment amounts are determined. Pursuant to ASU 2015-16, adjustments were made effective in the fourth quarter of 2015 to the estimated fair values of assets and liabilities assumed with the Doral Bank Transaction to reflect new information obtained during the measurement period (as defined by ASC Topic 805) about facts and circumstances that existed as of the acquisition date that, if known, would have affected the acquisition-date fair value measurements. The fair values assigned to the assets acquired and liabilities assumed are subject to refinement up to one year after the closing date of the acquisition as new information relative to closing date fair values become available, and thus the recognized goodwill may increase or decrease.
During the second and third quarters of 2015, retrospective adjustments were made to the estimated fair values of certain assets and liabilities assumed with the Doral Bank Transaction to reflect new information obtained about facts and circumstances that existed as of the acquisition date. The retrospective adjustments resulted in a decrease of $2.1 million to the initial fair value estimate of the mortgage servicing rights, a decrease in other liabilities assumed of $0.5 million and, an increase of $2.6 million in the receivable from the FDIC related to the acquisition cost of deposits, all of which were adjusted against goodwill.
137
The following table presents the fair values of major classes of identifiable assets acquired and liabilities assumed by the Corporation as of February 27, 2015.
| | | | | | | | | | | | | | | | |
(In thousands) | | Book value prior to
purchase accounting
adjustments | | | Fair value
adjustments | | | Additional
consideration[1] | | | As recorded by
Popular, Inc. | |
Assets: | | | | | | | | | | | | | | | | |
Cash and due from banks | | $ | 339,633 | | | $ | — | | | $ | — | | | $ | 339,633 | |
Investment in available-for-sale securities | | | 172,706 | | | | — | | | | — | | | | 172,706 | |
Investments in FHLB stock | | | 30,785 | | | | — | | | | — | | | | 30,785 | |
Loans | | | 1,679,792 | | | | (161,218 | ) | | | — | | | | 1,518,574 | |
Accrued income receivable | | | 7,808 | | | | — | | | | — | | | | 7,808 | |
Receivable from the FDIC | | | — | | | | — | | | | 480,137 | | | | 480,137 | |
Core deposit intangible | | | 23,572 | | | | (10,762 | ) | | | — | | | | 12,810 | |
Other assets | | | 67,676 | | | | 7,569 | | | | — | | | | 75,245 | |
| | | | | | | | | | | | | | | | |
Total assets | | $ | 2,321,972 | | | $ | (164,411 | ) | | $ | 480,137 | | | $ | 2,637,698 | |
| | | | | | | | | | | | | | | | |
| | | | |
Liabilities: | | | | | | | | | | | | | | | | |
Deposits | | $ | 2,193,404 | | | $ | 9,987 | | | $ | — | | | $ | 2,203,391 | |
Advances from the Federal Home Loan Bank | | | 542,000 | | | | 5,187 | | | | — | | | | 547,187 | |
Other liabilities | | | 50,728 | | | | (511 | ) | | | — | | | | 50,217 | |
| | | | | | | | | | | | | | | | |
Total liabilities | | $ | 2,786,132 | | | $ | 14,663 | | | $ | — | | | $ | 2,800,795 | |
| | | | | | | | | | | | | | | | |
Excess of liabilities assumed over assets acquired | | $ | 464,160 | | | | | | | | | | | | | |
Aggregate fair value adjustments | | | | | | $ | (179,074 | ) | | | | | | | | |
| | | | | | | | | | | | | | | | |
Additional consideration | | | | | | | | | | $ | 480,137 | | | | | |
| | | | | | | | | | | | | | | | |
Goodwill on acquisition | | | | | | | | | | | | | | $ | 163,097 | |
| | | | | | | | | | | | | | | | |
| [1] | The additional consideration represents the cash to be received from the FDIC for the difference between the net liabilities assumed and the net premium paid on the transaction. |
The following table presents the principal changes in fair value as previously reported in the Corporation’s Form 10-Q as of September 30, 2015 and the revised amounts recorded during the measurement period.
| | | | | | | | | | | | |
(In thousands) | | February 27, 2015
As recasted[a] | | | February 27, 2015
As previously
reported[b] | | | Change | |
Assets: | | | | | | | | | | | | |
Loans | | $ | 1,518,574 | [c] | | $ | 1,665,756 | | | $ | (147,182 | ) |
Goodwill | | | 163,097 | | | | 41,633 | | | | 121,464 | |
Core deposit intangible | | | 12,810 | | | | 23,572 | | | | (10,762 | ) |
Receivable from the FDIC | | | 480,137 | [c] | | | 441,721 | | | | 38,416 | |
Other assets | | | 626,177 | | | | 626,177 | | | | — | |
| | | | | | | | | | | | |
Total assets | | $ | 2,800,795 | | | $ | 2,798,859 | | | $ | 1,936 | |
| | | | | | | | | | | | |
| | | |
Liabilities: | | | | | | | | | | | | |
Deposits | | $ | 2,203,391 | | | $ | 2,201,455 | | | $ | 1,936 | |
Advances from the Federal Home Loan Bank | | | 547,187 | | | | 547,187 | | | | — | |
Other liabilities | | | 50,217 | | | | 50,217 | | | | — | |
| | | | | | | | | | | | |
Total liabilities | | $ | 2,800,795 | | | $ | 2,798,859 | | | $ | 1,936 | |
| | | | | | | | | | | | |
| [a] | Amounts reported include retrospective adjustments during the measurement period, in accordance with U.S. GAAP, related to the Doral Bank Transaction. |
| [b] | Amounts are presented as previously reported in the Form 10-Q as of September 30, 2015. |
| [c] | Balances recasted include a reclassification to the Receivable from the FDIC of approximately $38.4 million of loans that were subsequently determined to be excluded from the Doral Bank Transaction and repurchased by the FDIC. |
138
The decline in the fair value of the loans from the preliminary estimated amounts is mainly attributed to higher estimated credit losses on the portfolio of taxi medallion loans acquired by BPNA, which had an unpaid principal balance of $248.6 million and a revised fair value of $154.9 million. This remeasurement resulted in a negative adjustment of approximately $76.9 million to this portfolio. The main factors that influenced the revised estimated credit losses included borrower concentration in the portfolio, review of collateral values and borrowers’ payment capacity after a more thorough due diligence process.
The impact in the results of operations for the period from February 28, 2015 through December 31, 2015 as a result of the recasting was an increase in net income of $3.4 million, as detailed in the following table.
| | | | |
(In thousands) | | Impact in results
of Operations | |
| |
Interest Income - Loans (amortization of loan discount) | | $ | 607 | |
Interest Expense - Deposits (amortization of deposits interest expense) | | | (1,345 | ) |
| | | | |
Net Interest Income | | | 1,952 | |
| | | | |
Non Interest Income - Gain on Sale of Loans | | | 833 | |
Other Operating Expenses - Amortization of Intangibles | | | (628 | ) |
| | | | |
Income Before Taxes | | $ | 3,413 | |
| | | | |
The operating results of the Corporation for the year ended December 31, 2015 includes the operating results produced by the acquired assets and assumed liabilities. This includes for the year ended on December 31, 2015 approximately $108.2 million in gross revenues and approximately $67.5 million in operating expenses, of which $28.5 million are expenses directly associated with the Doral Bank Transaction. The Corporation believes that given the amount of assets and liabilities assumed, the size of the operations acquired in relation to Popular’s operations and the significant amount of fair value adjustments, the historical results of Doral Bank are not meaningful to Popular’s results, and thus no pro forma information is presented.
The following is a description of the methods used to determine the fair values of significant assets acquired and liabilities assumed on the Doral Bank Transaction:
Loans
Fair values of loans were based on a discounted cash flow methodology. Certain loans were valued individually, while other loans were valued as pools. Aggregation into pools considered characteristics such as loan type, payment term, rate type and accruing status. Principal and interest projections considered prepayment rates and credit loss expectations. The discount rates were developed based on the relative risk of the cash flows, taking into account principally the loan type, market rates as of the valuation date, liquidity expectations, and the expected life of the loans.
Mortgage Servicing Rights (recorded as Contingent Asset at February 27, 2015)
The Corporation uses a discounted cash flow model to estimate the fair value of mortgage servicing rights. The discounted cash flow model incorporates assumptions that market participants would use in estimating future net servicing income, including estimates of prepayment speeds, discount rate, cost to service, escrow account earnings, contractual servicing fee income, prepayment and late fees, among other considerations. The mortgage servicing rights from the Doral Bank Transaction were recorded at the BPPR reportable segment.
Goodwill
The amount of goodwill is the residual difference in the fair value of liabilities assumed and net consideration paid to the FDIC over the fair value of the assets acquired. The goodwill created by this transaction is driven by the deployment of capital with meaningful earnings accretion and significant cost savings opportunities. In addition to strengthening the Corporation’s Puerto Rico franchise,
139
the transaction grows the U.S. business through the addition of an attractive commercial platform. The goodwill is deductible for income tax purposes. The goodwill from the Doral Bank Transaction was assigned to the BPPR and BPNA reportable segments based on the relative fair value of the assets acquired and liabilities assumed.
Core deposit intangible
This intangible asset represents the value of the relationships that Doral Bank had with its deposit customers. The fair value of this intangible asset was estimated based on a discounted cash flow methodology that gave appropriate consideration to expected customer attrition rates, cost of the core deposit base, interest costs, and the net maintenance cost attributable to customer deposits, and the cost of alternative funds. The core deposit intangible asset will be amortized over a period of ten years.
Deposits
The fair values used for the demand deposits that comprise the transaction accounts acquired, which have no stated maturity and include non-interest bearing demand deposits, savings, NOW, and money market accounts, by definition equal the amount payable on demand at the reporting date. The fair values for time deposits were estimated using a discounted cash flow calculation that applies interest rates currently offered to comparable time deposits with similar maturities, and also accounts for the non-performance risk by using internally-developed models that consider, where applicable, the remaining term and the credit premium of the institution.
140
Note 6 – Restructuring plan
As discussed in Note 4, in connection with the sale of the operations of the California, Illinois and Central Florida regions, the Corporation has relocated certain back office operations, previously conducted in these regions, to Puerto Rico and New York. The Corporation has undertaken a restructuring plan (the “PCB Restructuring Plan”) to eliminate and re-locate employment positions, terminate contracts and incur other costs associated with moving the operations to Puerto Rico and New York. The Corporation has incurred restructuring charges of approximately $45.1 million, of which approximately $26.7 million were incurred during 2014 and $18.4 million during 2015. As of December 31, 2015, the restructuring related to the U.S. operations has been substantially completed. The Corporation does not anticipate any significant restructuring expenses to be incurred prospectively.
The following table details the expenses recorded by the Corporation that were associated with the PCB Restructuring Plan:
| | | | | | | | |
| | | Years ended December 31, | |
(In thousands) | | 2015 | | | 2014 | |
Personnel costs | | $ | 12,937 | | | $ | 17,516 | |
Net occupancy expenses | | | 3,476 | | | | 3,905 | |
Equipment expenses | | | 247 | | | | 457 | |
Professional fees | | | 724 | | | | 3,133 | |
Other operating expenses | | | 1,028 | | | | 1,714 | |
| | | | | | | | |
Total restructuring costs | | $ | 18,412 | | | $ | 26,725 | |
| | | | | | | | |
The following table presents the activity in the reserve for the restructuring costs associated with the PCB Restructuring Plan:
| | | | | | | | |
(In thousands) | | 2015 | | | 2014 | |
| | | | | | | | |
Beginning balance | | $ | 13,536 | | | $ | — | |
Charges expensed during the period | | | 7,840 | | | | 14,785 | |
Payments made during the period | | | (20,756 | ) | | | (1,249 | ) |
| | | | | | | | |
Ending balance | | $ | 620 | | | $ | 13,536 | |
| | | | | | | | |
141
Note 7 - Restrictions on cash and due from banks and certain securities
The Corporation’s banking subsidiaries, BPPR and BPNA, are required by federal and state regulatory agencies to maintain average reserve balances with the Federal Reserve Bank of New York (the “Fed”) or other banks. Those required average reserve balances amounted to $ 1.1 billion at December 31, 2015 (December 31, 2014 - $ 1.0 billion). Cash and due from banks, as well as other short-term, highly liquid securities, are used to cover the required average reserve balances.
At December 31, 2015, the Corporation held $44 million in restricted assets in the form of funds deposited in money market accounts, trading account securities and investment securities available for sale (December 31, 2014 - $45 million). The amounts held in trading account securities and investment securities available for sale consist primarily of restricted assets held for the Corporation’s non-qualified retirement plans and fund deposits guaranteeing possible liens or encumbrances over the title of insured properties.
Note 8 - Securities purchased under agreements to resell
The securities purchased underlying the agreements to resell were delivered to, and are held by, the Corporation. The counterparties to such agreements maintain effective control over such securities. The Corporation is permitted by contract to repledge the securities, and has agreed to resell to the counterparties the same or substantially similar securities at the maturity of the agreements.
The fair value of the collateral securities held by the Corporation on these transactions at December 31, was as follows:
| | | | | | | | |
(In thousands) | | 2015 | | | 2014 | |
Repledged | | $ | — | | | $ | 145,866 | |
Not repledged | | | 111,545 | | | | 33,258 | |
| | | | | | | | |
Total | | $ | 111,545 | | | $ | 179,124 | |
| | | | | | | | |
The repledged securities were used as underlying securities for repurchase agreement transactions.
142
Note 9 – Pledged assets
Certain securities and loans were pledged to secure public and trust deposits, assets sold under agreements to repurchase, other borrowings and credit facilities available, derivative positions, and loan servicing agreements. The classification and carrying amount of the Corporation’s pledged assets, in which the secured parties are not permitted to sell or repledge the collateral, were as follows:
| | | | | | | | |
(In thousands) | | December 31,2015 | | | December 31,2014 | |
Investment securities available-for-sale, at fair value | | $ | 2,382,811 | | | $ | 1,700,820 | |
Investment securities held-to-maturity, at amortized cost | | | 57,170 | | | | 60,515 | |
Loans held-in-portfolio covered under loss-sharing agreements with the FDIC | | | 385,633 | | | | 480,441 | |
Loans held-in-portfolio not covered under loss-sharing agreements with the FDIC | | | 7,322,181 | | | | 8,820,204 | |
| | | | | | | | |
Total pledged assets | | $ | 10,147,795 | | | $ | 11,061,980 | |
| | | | | | | | |
Pledged securities that the creditor has the right by custom or contract to repledge are presented separately on the consolidated statements of financial condition.
At December 31, 2015, the Corporation had $ 1.5 billion in investment securities available-for-sale and $ 0.5 billion in loans that served as collateral to secure public funds (December 31, 2014 - $ 0.7 billion and $ 0.7 billion, respectively).
At December 31, 2015, the Corporation’s banking subsidiaries had short-term and long-term credit facilities authorized with the Federal Home Loan Bank system (the “FHLB”) aggregating to $3.9 billion (December 31, 2014 - $3.7 billion). Refer to Note 23 to the consolidated financial statements for borrowings outstanding under these credit facilities. At December 31, 2015, the credit facilities authorized with the FHLB were collateralized by $ 4.7 billion in loans held-in-portfolio (December 31, 2014 - $ 4.5 billion). Also, at December 31, 2015, the Corporation’s banking subsidiaries had a borrowing capacity at the Federal Reserve (“Fed”) discount window of $1.3 billion, which remained unused as of such date (December 31, 2014 - $2.1 billion). The amount available under these credit facilities with the Fed is dependent upon the balance of loans and securities pledged as collateral. At December 31, 2015, the credit facilities with the Fed discount window were collateralized by $ 2.5 billion in loans held-in-portfolio (December 31, 2014 - $ 4.1 billion). These pledged assets are included in the above table and were not reclassified and separately reported in the consolidated statements of financial condition.
143
Note 10 – Investment securities available-for-sale
The following table presents the amortized cost, gross unrealized gains and losses, approximate fair value, weighted average yield and contractual maturities of investment securities available-for-sale at December 31, 2015 and 2014.
| | | | | | | | | | | | | | | | | | | | |
| | | At December 31, 2015 | |
(In thousands) | | Amortized
cost | | | Gross
unrealized
gains | | | Gross
unrealized
losses | | | Fair
value | | | Weighted
average
yield | |
U.S. Treasury securities | | | | | | | | | | | | | | | | | | | | |
Within 1 year | | $ | 24,861 | | | $ | 335 | | | $ | — | | | $ | 25,196 | | | | 4.31 | % |
After 1 to 5 years | | | 1,149,807 | | | | 365 | | | | 1,999 | | | | 1,148,173 | | | | 1.03 | |
After 5 to 10 years | | | 9,937 | | | | 22 | | | | — | | | | 9,959 | | | | 1.99 | |
| | | | | | | | | | | | | | | | | | | | |
Total U.S. Treasury securities | | | 1,184,605 | | | | 722 | | | | 1,999 | | | | 1,183,328 | | | | 1.11 | |
| | | | | | | | | | | | | | | | | | | | |
Obligations of U.S. Government sponsored entities | | | | | | | | | | | | | | | | | | | | |
After 1 to 5 years | | | 919,819 | | | | 1,337 | | | | 4,808 | | | | 916,348 | | | | 1.33 | |
After 5 to 10 years | | | 250 | | | | 1 | | | | — | | | | 251 | | | | 5.64 | |
After 10 years | | | 23,000 | | | | 42 | | | | — | | | | 23,042 | | | | 3.22 | |
| | | | | | | | | | | | | | | | | | | | |
Total obligations of U.S. Government sponsored entities | | | 943,069 | | | | 1,380 | | | | 4,808 | | | | 939,641 | | | | 1.38 | |
| | | | | | | | | | | | | | | | | | | | |
Obligations of Puerto Rico, States and political subdivisions | | | | | | | | | | | | | | | | | | | | |
After 1 to 5 years | | | 7,227 | | | | — | | | | 199 | | | | 7,028 | | | | 3.94 | |
After 5 to 10 years | | | 5,925 | | | | — | | | | 2,200 | | | | 3,725 | | | | 4.02 | |
After 10 years | | | 18,585 | | | | — | | | | 6,979 | | | | 11,606 | | | | 6.99 | |
| | | | | | | | | | | | | | | | | | | | |
Total obligations of Puerto Rico, States and political subdivisions | | | 31,737 | | | | — | | | | 9,378 | | | | 22,359 | | | | 5.74 | |
| | | | | | | | | | | | | | | | | | | | |
Collateralized mortgage obligations - federal agencies | | | | | | | | | | | | | | | | | | | | |
After 1 to 5 years | | | 21,446 | | | | 594 | | | | 37 | | | | 22,003 | | | | 2.81 | |
After 5 to 10 years | | | 44,585 | | | | 733 | | | | — | | | | 45,318 | | | | 2.85 | |
After 10 years | | | 1,518,662 | | | | 8,137 | | | | 33,283 | | | | 1,493,516 | | | | 1.99 | |
| | | | | | | | | | | | | | | | | | | | |
Total collateralized mortgage obligations - federal agencies | | | 1,584,693 | | | | 9,464 | | | | 33,320 | | | | 1,560,837 | | | | 2.02 | |
| | | | | | | | | | | | | | | | | | | | |
Mortgage-backed securities | | | | | | | | | | | | | | | | | | | | |
After 1 to 5 years | | | 22,015 | | | | 987 | | | | 8 | | | | 22,994 | | | | 4.65 | |
After 5 to 10 years | | | 256,097 | | | | 4,866 | | | | 1,197 | | | | 259,766 | | | | 2.51 | |
After 10 years | | | 2,039,217 | | | | 34,839 | | | | 12,620 | | | | 2,061,436 | | | | 2.83 | |
| | | | | | | | | | | | | | | | | | | | |
Total mortgage-backed securities | | | 2,317,329 | | | | 40,692 | | | | 13,825 | | | | 2,344,196 | | | | 2.81 | |
| | | | | | | | | | | | | | | | | | | | |
Equity securities (without contractual maturity) | | | 1,350 | | | | 1,053 | | | | 5 | | | | 2,398 | | | | 7.92 | |
| | | | | | | | | | | | | | | | | | | | |
Other | | | | | | | | | | | | | | | | | | | | |
After 1 to 5 years | | | 8,911 | | | | — | | | | 28 | | | | 8,883 | | | | 1.71 | |
After 5 to 10 years | | | 1,311 | | | | 39 | | | | — | | | | 1,350 | | | | 3.62 | |
| | | | | | | | | | | | | | | | | | | | |
Total other | | | 10,222 | | | | 39 | | | | 28 | | | | 10,233 | | | | 1.95 | |
| | | | | | | | | | | | | | | | | | | | |
Total investment securities available-for-sale | | $ | 6,073,005 | | | $ | 53,350 | | | $ | 63,363 | | | $ | 6,062,992 | | | | 2.07 | % |
| | | | | | | | | | | | | | | | | | | | |
144
| | | | | | | | | | | | | | | | | | | | |
| | | At December 31, 2014 | |
(In thousands) | | Amortized
cost | | | Gross
unrealized
gains | | | Gross
unrealized
losses | | | Fair
value | | | Weighted
average
yield | |
U.S. Treasury securities | | | | | | | | | | | | | | | | | | | | |
After 1 to 5 years | | $ | 698,003 | | | $ | 2,226 | | | $ | 75 | | | $ | 700,154 | | | | 1.14 | % |
| | | | | | | | | | | | | | | | | | | | |
Total U.S. Treasury securities | | | 698,003 | | | | 2,226 | | | | 75 | | | | 700,154 | | | | 1.14 | |
| | | | | | | | | | | | | | | | | | | | |
Obligations of U.S. Government sponsored entities | | | | | | | | | | | | | | | | | | | | |
Within 1 year | | | 42,140 | | | | 380 | | | | — | | | | 42,520 | | | | 1.61 | |
After 1 to 5 years | | | 1,603,245 | | | | 1,168 | | | | 9,936 | | | | 1,594,477 | | | | 1.26 | |
After 5 to 10 years | | | 67,373 | | | | 58 | | | | 2,271 | | | | 65,160 | | | | 1.72 | |
After 10 years | | | 23,000 | | | | — | | | | 184 | | | | 22,816 | | | | 3.18 | |
| | | | | | | | | | | | | | | | | | | | |
Total obligations of U.S. Government sponsored entities | | | 1,735,758 | | | | 1,606 | | | | 12,391 | | | | 1,724,973 | | | | 1.31 | |
| | | | | | | | | | | | | | | | | | | | |
Obligations of Puerto Rico, States and political subdivisions | | | | | | | | | | | | | | | | | | | | |
Within 1 year | | | 2,765 | | | | 17 | | | | — | | | | 2,782 | | | | 3.83 | |
After 1 to 5 years | | | 1,024 | | | | 38 | | | | — | | | | 1,062 | | | | 8.40 | |
After 5 to 10 years | | | 22,552 | | | | 2 | | | | 2,331 | | | | 20,223 | | | | 5.82 | |
After 10 years | | | 48,823 | | | | 40 | | | | 11,218 | | | | 37,645 | | | | 6.22 | |
| | | | | | | | | | | | | | | | | | | | |
Total obligations of Puerto Rico, States and political subdivisions | | | 75,164 | | | | 97 | | | | 13,549 | | | | 61,712 | | | | 6.04 | |
| | | | | | | | | | | | | | | | | | | | |
Collateralized mortgage obligations - federal agencies | | | | | | | | | | | | | | | | | | | | |
After 1 to 5 years | | | 3,687 | | | | 87 | | | | — | | | | 3,774 | | | | 2.66 | |
After 5 to 10 years | | | 25,202 | | | | 985 | | | | — | | | | 26,187 | | | | 2.93 | |
After 10 years | | | 1,905,763 | | | | 13,109 | | | | 38,803 | | | | 1,880,069 | | | | 2.03 | |
| | | | | | | | | | | | | | | | | | | | |
Total collateralized mortgage obligations - federal agencies | | | 1,934,652 | | | | 14,181 | | | | 38,803 | | | | 1,910,030 | | | | 2.04 | |
| | | | | | | | | | | | | | | | | | | | |
Mortgage-backed securities | | | | | | | | | | | | | | | | | | | | |
After 1 to 5 years | | | 27,339 | | | | 1,597 | | | | — | | | | 28,936 | | | | 4.68 | |
After 5 to 10 years | | | 147,182 | | | | 7,314 | | | | 1 | | | | 154,495 | | | | 3.51 | |
After 10 years | | | 676,567 | | | | 45,047 | | | | 683 | | | | 720,931 | | | | 3.93 | |
| | | | | | | | | | | | | | | | | | | | |
Total mortgage-backed securities | | | 851,088 | | | | 53,958 | | | | 684 | | | | 904,362 | | | | 3.88 | |
| | | | | | | | | | | | | | | | | | | | |
Equity securities (without contractual maturity) | | | 1,351 | | | | 1,271 | | | | — | | | | 2,622 | | | | 5.03 | |
| | | | | | | | | | | | | | | | | | | | |
Other | | | | | | | | | | | | | | | | | | | | |
After 1 to 5 years | | | 9,277 | | | | 10 | | | | — | | | | 9,287 | | | | 1.69 | |
After 5 to 10 years | | | 1,957 | | | | 62 | | | | — | | | | 2,019 | | | | 3.63 | |
| | | | | | | | | | | | | | | | | | | | |
Total other | | | 11,234 | | | | 72 | | | | — | | | | 11,306 | | | | 2.03 | |
| | | | | | | | | | | | | | | | | | | | |
Total investment securities available-for-sale | | $ | 5,307,250 | | | $ | 73,411 | | | $ | 65,502 | | | $ | 5,315,159 | | | | 2.04 | % |
| | | | | | | | | | | | | | | | | | | | |
The weighted average yield on investment securities available-for-sale is based on amortized cost; therefore, it does not give effect to changes in fair value.
Securities not due on a single contractual maturity date, such as mortgage-backed securities and collateralized mortgage obligations, are classified in the period of final contractual maturity. The expected maturities of collateralized mortgage obligations, mortgage-backed securities and certain other securities may differ from their contractual maturities because they may be subject to prepayments or may be called by the issuer.
145
The following table presents the aggregate amortized cost and fair value of investment securities available-for-sale at December 31, 2015 by contractual maturity.
| | | | | | | | |
(In thousands) | | Amortized cost | | | Fair value | |
Within 1 year | | $ | 24,861 | | | $ | 25,196 | |
After 1 to 5 years | | | 2,129,225 | | | | 2,125,429 | |
After 5 to 10 years | | | 318,105 | | | | 320,369 | |
After 10 years | | | 3,599,464 | | | | 3,589,600 | |
| | | | | | | | |
Total | | | 6,071,655 | | | | 6,060,594 | |
Equity securities | | | 1,350 | | | | 2,398 | |
| | | | | | | | |
Total investment securities available-for-sale | | $ | 6,073,005 | | | $ | 6,062,992 | |
| | | | | | | | |
During the year ended December 31, 2015, the Corporation sold U.S. agency securities and obligations from the Puerto Rico government and its political subdivisions. The proceeds from these sales were $ 96.8 million. During the year ended December 31, 2014, the Corporation sold U.S. agency securities, mortgage-backed securities and collateralized mortgage obligations with an approximate amortized cost of $311.1 million. The proceeds from these sales were $ 310.2 million. Gross realized gains and losses on the sale of investment securities available-for-sale, for the years ended December 31, 2015, 2014 and 2013 were as follows:
| | | | | | | | | | | | |
| | | Years ended December 31, | |
(In thousands) | | 2015 | | | 2014 | | | 2013 | |
Gross realized gains | | $ | 226 | | | $ | 4,461 | | | $ | 2,110 | |
Gross realized losses | | | (85 | ) | | | (5,331 | ) | | | — | |
| | | | | | | | | | | | |
Net realized gains (losses) on sale of investment securities available-for-sale | | $ | 141 | | | $ | (870 | ) | | $ | 2,110 | |
| | | | | | | | | | | | |
The following tables present the Corporation’s fair value and gross unrealized losses of investment securities available-for-sale, aggregated by investment category and length of time that individual securities have been in a continuous unrealized loss position, at December 31, 2015, and 2014.
| | | | | | | | | | | | | | | | | | | | | | | | |
| | | At December 31, 2015 | |
| | | Less than 12 months | | | 12 months or more | | | Total | |
(In thousands) | | Fair value | | | Gross
unrealized
losses | | | Fair
value | | | Gross
unrealized
losses | | | Fair
value | | | Gross
unrealized
losses | |
U.S. Treasury securities | | $ | 589,689 | | | $ | 1,999 | | | $ | — | | | $ | — | | | $ | 589,689 | | | $ | 1,999 | |
Obligations of U.S. Government sponsored entities | | | 390,319 | | | | 2,128 | | | | 181,744 | | | | 2,680 | | | | 572,063 | | | | 4,808 | |
Obligations of Puerto Rico, States and political subdivisions | | | 884 | | | | 164 | | | | 19,490 | | | | 9,214 | | | | 20,374 | | | | 9,378 | |
Collateralized mortgage obligations - federal agencies | | | 331,501 | | | | 4,446 | | | | 814,195 | | | | 28,874 | | | | 1,145,696 | | | | 33,320 | |
Mortgage-backed securities | | | 1,641,663 | | | | 12,992 | | | | 22,362 | | | | 833 | | | | 1,664,025 | | | | 13,825 | |
Equity securities | | | 45 | | | | 5 | | | | — | | | | — | | | | 45 | | | | 5 | |
Other | | | 8,883 | | | | 28 | | | | — | | | | — | | | | 8,883 | | | | 28 | |
| | | | | | | | | | | | | | | | | | | | | | | | |
Total investment securities available-for-sale in an | | | | | | | | | | | | | | | | | | | | | | | | |
unrealized loss position | | $ | 2,962,984 | | | $ | 21,762 | | | $ | 1,037,791 | | | $ | 41,601 | | | $ | 4,000,775 | | | $ | 63,363 | |
| | | | | | | | | | | | | | | | | | | | | | | | |
146
| | | | | | | | | | | | | | | | | | | | | | | | |
| | | At December 31, 2014 | |
| | | Less than 12 months | | | 12 months or more | | | Total | |
(In thousands) | | Fair
value | | | Gross
unrealized
losses | | | Fair
value | | | Gross
unrealized
losses | | | Fair
value | | | Gross
unrealized
losses | |
U.S. Treasury securities | | $ | 49,465 | | | $ | 75 | | | $ | — | | | $ | — | | | $ | 49,465 | | | $ | 75 | |
Obligations of U.S. Government sponsored entities | | | 888,325 | | | | 6,866 | | | | 429,835 | | | | 5,525 | | | | 1,318,160 | | | | 12,391 | |
Obligations of Puerto Rico, States and political subdivisions | | | 14,419 | | | | 3,031 | | | | 41,084 | | | | 10,518 | | | | 55,503 | | | | 13,549 | |
Collateralized mortgage obligations - federal agencies | | | 539,658 | | | | 13,774 | | | | 733,814 | | | | 25,029 | | | | 1,273,472 | | | | 38,803 | |
Mortgage-backed securities | | | 457 | | | | 4 | | | | 25,486 | | | | 680 | | | | 25,943 | | | | 684 | |
| | | | | | | | | | | | | | | | | | | | | | | | |
Total investment securities available-for-sale in an unrealized loss position | | $ | 1,492,324 | | | $ | 23,750 | | | $ | 1,230,219 | | | $ | 41,752 | | | $ | 2,722,543 | | | $ | 65,502 | |
| | | | | | | | | | | | | | | | | | | | | | | | |
As of December 31, 2015, the available-for-sale investment portfolio reflects gross unrealized losses of approximately $63 million, driven by U.S. Agency collateralized mortgage obligations, mortgage-backed securities and obligations of the Puerto Rico Government and its political subdivisions. As part of its analysis for all U.S. Agencies’ securities, management considers the U.S. Agency guarantee. The portfolio of obligations of the Puerto Rico Government is mostly comprised of securities with specific sources of income or revenues identified for repayments. The Corporation performs periodic credit quality reviews on these issuers.
Management evaluates investment securities for other-than-temporary (“OTTI”) declines in fair value on a quarterly basis. Once a decline in value is determined to be other-than-temporary, the value of a debt security is reduced and a corresponding charge to earnings is recognized for anticipated credit losses. Also, for equity securities that are considered other-than-temporarily impaired, the excess of the security’s carrying value over its fair value at the evaluation date is accounted for as a loss in the results of operations. The OTTI analysis requires management to consider various factors, which include, but are not limited to: (1) the length of time and the extent to which fair value has been less than the amortized cost basis, (2) the financial condition of the issuer or issuers, (3) actual collateral attributes, (4) the payment structure of the debt security and the likelihood of the issuer being able to make payments, (5) any rating changes by a rating agency, (6) adverse conditions specifically related to the security, industry, or a geographic area, and (7) management’s intent to sell the debt security or whether it is more likely than not that the Corporation would be required to sell the debt security before a forecasted recovery occurs. At December 31, 2015, management performed its quarterly analysis of all debt securities in an unrealized loss position.
During the second quarter of 2015, the Corporation recognized an other-than-temporary impairment charge of $14.4 million on its portfolio of investment securities available-for-sale classified as obligations from the Puerto Rico government and its political subdivisions. At June 30, 2015 these securities were rated Caa2 and CCC- by Moody’s and S&P, respectively. Notwithstanding the payment priorities established by the Puerto Rico Constitution for these securities, Puerto Rico’s fiscal and economic situation, together with the Government’s announcements regarding its ability to pay its debt and its intention to pursue a comprehensive debt restructuring, led management to conclude that the unrealized losses on these government securities were other-than-temporary. The Corporation determined that the entire balance of the unrealized loss carried by these securities was attributed to estimated credit losses. Accordingly, the other-than-temporary impairment was recognized in its entirety in the accompanying consolidated statement of operations and no amount remained recognized in the accompanying statement of other comprehensive income related to these specific securities. These securities, for which an other-than-temporary impairment was recorded, were sold during the third quarter of 2015, resulting in a realized gain of $0.1 million. The proceeds from this sale were $26.8 million.
Further negative evidence impacting the liquidity and sources of repayment of the obligations of Puerto Rico and its political subdivisions, could result in a further charge to earnings to recognize estimated credit losses determined to be other-than-temporary. At December 31, 2015, the Corporation did not have the intent to sell debt securities in an unrealized loss position and it is not more likely than not that the Corporation will have to sell the investment securities prior to recovery of their amortized cost basis.
147
The following table states the name of issuers, and the aggregate amortized cost and fair value of the securities of such issuer (includes available-for-sale and held-to-maturity securities), in which the aggregate amortized cost of such securities exceeds 10% of stockholders’ equity. This information excludes securities backed by the full faith and credit of the U.S. Government. Investments in obligations issued by a state of the U.S. and its political subdivisions and agencies, which are payable and secured by the same source of revenue or taxing authority, other than the U.S. Government, are considered securities of a single issuer.
| | | | | | | | | | | | | | | | |
| | | 2015 | | | 2014 | |
(In thousands) | | Amortized cost | | | Fair value | | | Amortized cost | | | Fair value | |
FNMA | | $ | 2,649,860 | | | $ | 2,633,899 | | | $ | 1,746,807 | | | $ | 1,736,987 | |
FHLB | | | 340,119 | | | | 338,700 | | | | 737,149 | | | | 732,894 | |
Freddie Mac | | | 1,088,691 | | | | 1,079,956 | | | | 1,117,865 | | | | 1,112,485 | |
148
Note 11 – Investment securities held-to-maturity
The following tables present the amortized cost, gross unrealized gains and losses, approximate fair value, weighted average yield and contractual maturities of investment securities held-to-maturity at December 31, 2015 and 2014.
| | | | | | | | | | | | | | | | | | | | |
| | | At December 31, 2015 | |
(In thousands) | | Amortized
cost | | | Gross
unrealized
gains | | | Gross
unrealized
losses | | | Fair
value | | | Weighted
average
yield | |
Obligations of Puerto Rico, States and political subdivisions | | | | | | | | | | | | | | | | | | | | |
Within 1 year | | $ | 2,920 | | | $ | — | | | $ | 291 | | | $ | 2,629 | | | | 5.90 | % |
After 1 to 5 years | | | 13,655 | | | | — | | | | 5,015 | | | | 8,640 | | | | 5.98 | |
After 5 to 10 years | | | 20,020 | | | | — | | | | 8,020 | | | | 12,000 | | | | 6.14 | |
After 10 years | | | 62,222 | | | | 3,604 | | | | 8,280 | | | | 57,546 | | | | 2.08 | |
| | | | | | | | | | | | | | | | | | | | |
Total obligations of Puerto Rico, States and political subdivisions | | | 98,817 | | | | 3,604 | | | | 21,606 | | | | 80,815 | | | | 3.55 | |
| | | | | | | | | | | | | | | | | | | | |
Collateralized mortgage obligations - federal agencies | | | | | | | | | | | | | | | | | | | | |
After 5 to 10 years | | | 86 | | | | 5 | | | | — | | | | 91 | | | | 5.45 | |
| | | | | | | | | | | | | | | | | | | | |
Total collateralized mortgage obligations - federal agencies | | | 86 | | | | 5 | | | | — | | | | 91 | | | | 5.45 | |
| | | | | | | | | | | | | | | | | | | | |
Other | | | | | | | | | | | | | | | | | | | | |
After 1 to 5 years | | | 2,000 | | | | — | | | | 17 | | | | 1,983 | | | | 1.81 | |
| | | | | | | | | | | | | | | | | | | | |
Total other | | | 2,000 | | | | — | | | | 17 | | | | 1,983 | | | | 1.81 | |
| | | | | | | | | | | | | | | | | | | | |
Total investment securities held-to-maturity | | $ | 100,903 | | | $ | 3,609 | | | $ | 21,623 | | | $ | 82,889 | | | | 3.52 | % |
| | | | | | | | | | | | | | | | | | | | |
| | | | | | | | | | | | | | | | | | | | |
| | | At December 31, 2014 | |
(In thousands) | | Amortized
cost | | | Gross
unrealized
gains | | | Gross
unrealized
losses | | | Fair
value | | | Weighted
average
yield | |
Obligations of Puerto Rico, States and political subdivisions | | | | | | | | | | | | | | | | | | | | |
Within 1 year | | $ | 2,740 | | | $ | — | | | $ | 8 | | | $ | 2,732 | | | | 5.84 | % |
After 1 to 5 years | | | 12,830 | | | | — | | | | 764 | | | | 12,066 | | | | 5.95 | |
After 5 to 10 years | | | 21,325 | | | | — | | | | 6,003 | | | | 15,322 | | | | 6.09 | |
After 10 years | | | 64,678 | | | | 3,342 | | | | 5,543 | | | | 62,477 | | | | 2.22 | |
| | | | | | | | | | | | | | | | | | | | |
Total obligations of Puerto Rico, States and political subdivisions | | | 101,573 | | | | 3,342 | | | | 12,318 | | | | 92,597 | | | | 3.60 | |
| | | | | | | | | | | | | | | | | | | | |
Collateralized mortgage obligations - federal agencies | | | | | | | | | | | | | | | | | | | | |
After 5 to 10 years | | | 97 | | | | 5 | | | | — | | | | 102 | | | | 5.45 | |
| | | | | | | | | | | | | | | | | | | | |
Total collateralized mortgage obligations - federal agencies | | | 97 | | | | 5 | | | | — | | | | 102 | | | | 5.45 | |
| | | | | | | | | | | | | | | | | | | | |
Other | | | | | | | | | | | | | | | | | | | | |
Within 1 year | | | 250 | | | | — | | | | — | | | | 250 | | | | 1.33 | |
After 1 to 5 years | | | 1,250 | | | | — | | | | — | | | | 1,250 | | | | 1.10 | |
| | | | | | | | | | | | | | | | | | | | |
Total other | | | 1,500 | | | | — | | | | — | | | | 1,500 | | | | 1.14 | |
| | | | | | | | | | | | | | | | | | | | |
Total investment securities held-to-maturity | | $ | 103,170 | | | $ | 3,347 | | | $ | 12,318 | | | $ | 94,199 | | | | 3.57 | % |
| | | | | | | | | | | | | | | | | | | | |
Securities not due on a single contractual maturity date, such as collateralized mortgage obligations, are classified in the period of final contractual maturity. The expected maturities of collateralized mortgage obligations and certain other securities may differ from their contractual maturities because they may be subject to prepayments or may be called by the issuer.
149
The following table presents the aggregate amortized cost and fair value of investments securities held-to-maturity at December 31, 2015 by contractual maturity.
| | | | | | | | |
(In thousands) | | Amortized cost | | | Fair value | |
Within 1 year | | $ | 2,920 | | | $ | 2,629 | |
After 1 to 5 years | | | 15,655 | | | | 10,623 | |
After 5 to 10 years | | | 20,106 | | | | 12,091 | |
After 10 years | | | 62,222 | | | | 57,546 | |
| | | | | | | | |
Total investment securities held-to-maturity | | $ | 100,903 | | | $ | 82,889 | |
| | | | | | | | |
The following tables present the Corporation’s fair value and gross unrealized losses of investment securities held-to-maturity, aggregated by investment category and length of time that individual securities have been in a continuous unrealized loss position, at December 31, 2015 and 2014:
| | | | | | | | | | | | | | | | | | | | | | | | |
| | | At December 31, 2015 | |
| | | Less than 12 months | | | 12 months or more | | | Total | |
(In thousands) | | Fair
value | | | Gross
unrealized
losses | | | Fair
value | | | Gross
unrealized
losses | | | Fair
value | | | Gross
unrealized
losses | |
Obligations of Puerto Rico, States and political subdivisions | | $ | — | | | $ | — | | | $ | 33,334 | | | $ | 21,606 | | | $ | 33,334 | | | $ | 21,606 | |
Other | | | 1,483 | | | | 17 | | | | — | | | | — | | | | 1,483 | | | | 17 | |
| | | | | | | | | | | | | | | | | | | | | | | | |
Total investment securities held-to-maturity in an unrealized loss position | | $ | 1,483 | | | $ | 17 | | | $ | 33,334 | | | $ | 21,606 | | | $ | 34,817 | | | $ | 21,623 | |
| | | | | | | | | | | | | | | | | | | | | | | | |
| | | | | | | | | | | | | | | | | | | | | | | | |
| | | At December 31, 2014 | |
| | | Less than 12 months | | | 12 months or more | | | Total | |
(In thousands) | | Fair
value | | | Gross
unrealized
losses | | | Fair
value | | | Gross
unrealized
losses | | | Fair
value | | | Gross
unrealized
losses | |
Obligations of Puerto Rico, States and political subdivisions | | $ | 373 | | | $ | 2 | | | $ | 45,969 | | | $ | 12,316 | | | $ | 46,342 | | | $ | 12,318 | |
| | | | | | | | | | | | | | | | | | | | | | | | |
Total investment securities held-to-maturity in an unrealized loss position | | $ | 373 | | | $ | 2 | | | $ | 45,969 | | | $ | 12,316 | | | $ | 46,342 | | | $ | 12,318 | |
| | | | | | | | | | | | | | | | | | | | | | | | |
As indicated in Note 10 to these consolidated financial statements, management evaluates investment securities for OTTI declines in fair value on a quarterly basis.
The “Obligations of Puerto Rico, States and political subdivisions” classified as held-to-maturity at December 31, 2015 are primarily associated with securities issued by municipalities of Puerto Rico and are generally not rated by a credit rating agency. This includes $57 million of securities issued by three municipalities of Puerto Rico that are payable from the real and personal property taxes collected within such municipalities. These bonds have seniority to the payment of operating cost and expenses of the municipality. The portfolio also includes approximately $42 million in securities for which the underlying source of payment is not the central government, but in which it provides a guarantee in the event of default.
The Corporation performs periodic credit quality reviews on these issuers. The Corporation does not have the intent to sell securities held-to-maturity and it is not more likely than not that the Corporation will have to sell these investment securities prior to recovery of their amortized cost basis.
150
Note 12 – Loans
Loans acquired in the Westernbank FDIC-assisted transaction, except for lines of credit with revolving privileges, are accounted for by the Corporation in accordance with ASC Subtopic 310-30. Under ASC Subtopic 310-30, the acquired loans were aggregated into pools based on similar characteristics. Each loan pool is accounted for as a single asset with a single composite interest rate and an aggregate expectation of cash flows. The loans which are accounted for under ASC Subtopic 310-30 by the Corporation are not considered non-performing and will continue to have an accretable yield as long as there is a reasonable expectation about the timing and amount of cash flows expected to be collected. The Corporation measures additional losses for this portfolio when it is probable the Corporation will be unable to collect all cash flows expected at acquisition plus additional cash flows expected to be collected arising from changes in estimates after acquisition. Lines of credit with revolving privileges that were acquired as part of the Westernbank FDIC-assisted transaction are accounted for under the guidance of ASC Subtopic 310-20, which requires that any differences between the contractually required loan payment receivable in excess of the Corporation’s initial investment in the loans be accreted into interest income. Loans accounted for under ASC Subtopic 310-20 are placed in non-accrual status when past due in accordance with the Corporation’s non-accruing policy and any accretion of discount is discontinued.
The risks on loans acquired in the FDIC-assisted transaction are significantly different from the risks on loans not covered under the FDIC loss sharing agreements because of the loss protection provided by the FDIC. Accordingly, the Corporation presents loans subject to the loss sharing agreements as “covered loans” in the information below and loans that are not subject to the FDIC loss sharing agreements as “non-covered loans”. The FDIC loss sharing agreements expired on June 30, 2015 for commercial (including construction) and consumer loans, and expires on June 30, 2020 for single-family residential mortgage loans, as explained in Note 14.
As a result of the expiration of the shared-loss arrangement under the commercial loss share agreement on June 30, 2015, approximately $1.5 billion in loans and $18 million in OREOs were reclassified as “non-covered” in the accompanying statement of financial condition during the quarter ended June 30, 2015, because they are no longer subject to the shared-loss payments by the FDIC. However, included in these balances were loans with carrying amount at June 30, 2015 of approximately $248.7 million that are subject to the resolution of several arbitration proceedings currently ongoing with the FDIC related primarily to (i) the FDIC’s denial of reimbursements for certain charge-offs claimed by BPPR with respect to certain loans and the treatment of those loans as “shared-loss assets” under the commercial loss share agreement; and (ii) the denial by the FDIC of portfolio sale proposals submitted by BPPR pursuant to the applicable commercial shared loss agreement provision governing portfolio sales. Until the disputes described above are finally resolved, the terms of the commercial loss share agreement will remain in effect with respect to any such items under dispute. Refer to additional information of these disputes on Note 30, Commitment and Contingencies.
For a summary of the accounting policy related to loans, interest recognition and allowance for loan losses refer to the summary of significant accounting policies included in Note 2 to these consolidated financial statements.
Change in non-accrual accounting policy for guaranteed residential mortgage loans
During the quarter ended September 30, 2015, the Corporation changed its policy on interest income recognition for residential mortgage loans guaranteed by the Federal Housing Administration (“FHA”) or the Veterans Administration (“VA”). Previously, the Corporation discontinued the recognition of interest income on these loans when they were 18-months delinquent as to principal or interest. The Corporation modified its policy to discontinue the recognition of interest when 15-months delinquent as to principal or interest. This change in estimate was based on an analysis of historical collections from these agencies. This change in policy resulted in the reversal of previously accrued interest amounting to approximately $1.9 million during the year ended December 31, 2015.
151
The following table presents the composition of non-covered loans held-in-portfolio (“HIP”), net of unearned income, at December 31, 2015 and 2014.
| | | | | | | | |
(In thousands) | | December 31, 2015 | | | December 31, 2014 | |
Commercial multi-family | | $ | 826,079 | | | $ | 487,280 | |
Commercial real estate non-owner occupied | | | 3,632,115 | | | | 2,526,146 | |
Commercial real estate owner occupied | | | 2,111,588 | | | | 1,667,267 | |
Commercial and industrial | | | 3,529,381 | | | | 3,453,574 | |
Construction | | | 681,106 | | | | 251,820 | |
Mortgage | | | 7,036,081 | | | | 6,502,886 | |
Leasing | | | 627,650 | | | | 564,389 | |
Legacy[2] | | | 64,436 | | | | 80,818 | |
Consumer: | | | | | | | | |
Credit cards | | | 1,142,280 | | | | 1,155,229 | |
Home equity lines of credit | | | 315,172 | | | | 366,162 | |
Personal | | | 1,375,461 | | | | 1,375,452 | |
Auto | | | 815,978 | | | | 767,369 | |
Other | | | 188,788 | | | | 206,059 | |
| | | | | | | | |
Total loans held-in-portfolio[1] | | $ | 22,346,115 | | | $ | 19,404,451 | |
| | | | | | | | |
| [1] | Non-covered loans held-in-portfolio at December 31, 2015 are net of $108 million in unearned income and exclude $137 million in loans held-for-sale (December 31, 2014 - $94 million in unearned income and $106 million in loans held-for-sale). |
| [2] | The legacy portfolio is comprised of commercial loans, construction loans and lease financings related to certain lending products exited by the Corporation as part of restructuring efforts carried out in prior years at the BPNA segment. |
152
The following table presents the composition of covered loans at December 31, 2015 and 2014.
| | | | | | | | |
(In thousands) | | December 31, 2015 | | | December 31, 2014 | |
Commercial real estate | | $ | — | | | $ | 1,511,472 | |
Commercial and industrial | | | — | | | | 103,309 | |
Construction | | | — | | | | 70,336 | |
Mortgage | | | 627,102 | | | | 822,986 | |
Consumer | | | 19,013 | | | | 34,559 | |
| | | | | | | | |
Total covered loans held-in-portfolio | | $ | 646,115 | | | $ | 2,542,662 | |
| | | | | | | | |
The following table provides a breakdown of loans held-for-sale (“LHFS”) at December 31, 2015 and 2014 by main categories.
| | | | | | | | |
(In thousands) | | December 31, 2015 | | | December 31, 2014 | |
Commercial | | $ | 45,074 | | | $ | 309 | |
Construction | | | 95 | | | | — | |
Legacy | | | — | | | | 319 | |
Mortgage | | | 91,831 | | | | 100,166 | |
Consumer | | | — | | | | 5,310 | |
| | | | | | | | |
Total loans held-for-sale | | $ | 137,000 | | | $ | 106,104 | |
| | | | | | | | |
Excluding the impact of the Doral Bank Transaction, during the year ended December 31, 2015, the Corporation recorded purchases (including repurchases) of mortgage loans amounting to $588 million (2014 - $574 million). Also, the Corporation purchased consumer loans amounting to $72 million during 2015 (2014 - $92 million). Purchases of commercial loans amounted to $55 million for the year 2015 (2014 - $24 million).
The Corporation performed whole-loan sales involving approximately $98 million of residential mortgage loans during the year ended December 31, 2015 (December 31, 2014 - $185 million). Also, during the year ended December 31, 2015, the Corporation securitized approximately $869 million of mortgage loans into Government National Mortgage Association (“GNMA”) mortgage-backed securities and $219 million of mortgage loans into Federal National Mortgage Association (“FNMA”) mortgage-backed securities, compared to $675 million and $225 million, respectively, during the year ended December 31, 2014. The Corporation sold commercial and construction loans with a book value of approximately $43 million during the year ended December 31, 2015 (December 31, 2014 - $260 million).
Non-covered loans
The following tables present non-covered loans held-in-portfolio by loan class that are in non-performing status or are accruing interest but are past due 90 days or more at December 31, 2015 and 2014. Accruing loans past due 90 days or more consist primarily of credit cards, FHA / VA and other insured mortgage loans, and delinquent mortgage loans which are included in the Corporation’s financial statements pursuant to GNMA’s buy-back option program. Servicers of loans underlying GNMA mortgage-backed securities must report as their own assets the defaulted loans that they have the option (but not the obligation) to repurchase, even when they elect not to exercise that option.
153
| | | | | | | | | | | | | | | | | | | | | | | | |
At December 31, 2015 | |
| | | Puerto Rico | | | U.S. mainland | | | Popular, Inc. | |
(In thousands) | | Non-accrual
loans | | | Accruing loans
past-due 90
days or more [1] | | | Non-accrual
loans | | | Accruing
loans past-due
90 days or more [1] | | | Non-accrual
loans | | | Accruing loans
past-due 90
days or more | |
Commercial multi-family | | $ | 1,062 | | | $ | — | | | $ | — | | | $ | — | | | $ | 1,062 | | | $ | — | |
Commercial real estate non-owner occupied | | | 33,720 | | | | — | | | | 253 | | | | — | | | | 33,973 | | | | — | |
Commercial real estate owner occupied | | | 106,449 | | | | — | | | | 221 | | | | — | | | | 106,670 | | | | — | |
Commercial and industrial | | | 36,671 | | | | 555 | | | | 3,440 | | | | — | | | | 40,111 | | | | 555 | |
Construction | | | 3,550 | | | | — | | | | — | | | | — | | | | 3,550 | | | | — | |
Mortgage[3] | | | 337,933 | | | | 426,094 | | | | 13,538 | | | | — | | | | 351,471 | | | | 426,094 | |
Leasing | | | 3,009 | | | | — | | | | — | | | | — | | | | 3,009 | | | | — | |
Legacy | | | — | | | | — | | | | 3,649 | | | | — | | | | 3,649 | | | | — | |
Consumer: | | | | | | | | | | | | | | | | | | | | | | | | |
Credit cards | | | — | | | | 19,098 | | | | 437 | | | | — | | | | 437 | | | | 19,098 | |
Home equity lines of credit | | | — | | | | 394 | | | | 4,176 | | | | — | | | | 4,176 | | | | 394 | |
Personal | | | 22,102 | | | | 523 | | | | 1,240 | | | | — | | | | 23,342 | | | | 523 | |
Auto | | | 11,640 | | | | — | | | | 6 | | | | — | | | | 11,646 | | | | — | |
Other | | | 18,698 | | | | 61 | | | | 5 | | | | — | | | | 18,703 | | | | 61 | |
| | | | | | | | | | | | | | | | | | | | | | | | |
Total[2] | | $ | 574,834 | | | $ | 446,725 | | | $ | 26,965 | | | $ | — | | | $ | 601,799 | | | $ | 446,725 | |
| | | | | | | | | | | | | | | | | | | | | | | | |
| [1] | Non-covered loans of $268 million accounted for under ASC Subtopic 310-30 are excluded from the above table as they are considered to be performing due to the application of the accretion method, in which these loans will accrete interest income over the remaining life of the loans using estimated cash flow analysis. |
| [2] | For purposes of this table non-performing loans exclude $ 45 million in non-performing loans held-for-sale. |
| [3] | It is the Corporation’s policy to report delinquent residential mortgage loans insured by FHA or guaranteed by the VA as accruing loans past due 90 days or more as opposed to non-performing since the principal repayment is insured. These balances include $164 million of residential mortgage loans in Puerto Rico insured by FHA or guaranteed by the VA that are no longer accruing interest as of December 31, 2015. Furthermore, the Corporation has approximately $70 million in reverse mortgage loans in Puerto Rico which are guaranteed by FHA, but which are currently not accruing interest. Due to the guaranteed nature of the loans, it is the Corporation’s policy to exclude these balances from non-performing assets. |
| | | | | | | | | | | | | | | | | | | | | | | | |
At December 31, 2014 | |
| | | Puerto Rico | | | U.S. mainland | | | Popular, Inc. | |
(In thousands) | | Non-accrual
loans | | | Accruing loans
past-due 90
days or more [1] | | | Non-accrual
loans | | | Accruing
loans past-due
90 days or more | | | Non-accrual
loans | | | Accruing loans
past-due 90
days or more | |
Commercial multi-family | | $ | 2,199 | | | $ | — | | | $ | — | | | $ | — | | | $ | 2,199 | | | $ | — | |
Commercial real estate non-owner occupied | | | 33,452 | | | | — | | | | — | | | | — | | | | 33,452 | | | | — | |
Commercial real estate owner occupied | | | 92,648 | | | | — | | | | 805 | | | | — | | | | 93,453 | | | | — | |
Commercial and industrial | | | 129,611 | | | | 494 | | | | 1,510 | | | | — | | | | 131,121 | | | | 494 | |
Construction | | | 13,812 | | | | — | | | | — | | | | — | | | | 13,812 | | | | — | |
Mortgage[3] | | | 295,629 | | | | 426,387 | | | | 9,284 | | | | — | | | | 304,913 | | | | 426,387 | |
Leasing | | | 3,102 | | | | — | | | | — | | | | — | | | | 3,102 | | | | — | |
Legacy | | | — | | | | — | | | | 1,545 | | | | — | | | | 1,545 | | | | — | |
Consumer: | | | | | | | | | | | | | | | | | | | | | | | | |
Credit cards | | | — | | | | 20,368 | | | | 449 | | | | — | | | | 449 | | | | 20,368 | |
Home equity lines of credit | | | — | | | | 21 | | | | 4,090 | | | | — | | | | 4,090 | | | | 21 | |
Personal | | | 25,678 | | | | 10 | | | | 1,410 | | | | — | | | | 27,088 | | | | 10 | |
Auto | | | 11,387 | | | | — | | | | — | | | | — | | | | 11,387 | | | | — | |
Other | | | 3,865 | | | | 682 | | | | 7 | | | | — | | | | 3,872 | | | | 682 | |
| | | | | | | | | | | | | | | | | | | | | | | | |
Total[2] | | $ | 611,383 | | | $ | 447,962 | | | $ | 19,100 | | | $ | — | | | $ | 630,483 | | | $ | 447,962 | |
| | | | | | | | | | | | | | | | | | | | | | | | |
| [1] | Non-covered loans by $59 million accounted for under ASC Subtopic 310-30 are excluded from the above table as they are considered to be performing due to the application of the accretion method, in which these loans will accrete interest income over the remaining life of the loans using estimated cash flow analysis. |
| [2] | For purposes of this table non-performing loans exclude $ 19 million in non-performing loans held-for-sale. |
| [3] | It is the Corporation’s policy to report delinquent residential mortgage loans insured by FHA or guaranteed by the VA as accruing loans past due 90 days or more as opposed to non-performing since the principal repayment is insured. These balances include $125 million of residential mortgage loans in Puerto Rico insured by FHA or guaranteed by the VA that are no longer accruing interest as of December 31, 2014. Furthermore, the Corporation has approximately $66 million in reverse mortgage loans in Puerto Rico which are guaranteed by FHA, but which are currently not accruing interest. Due to the guaranteed nature of the loans, it is the Corporation’s policy to exclude these balances from non-performing assets. |
154
The following tables present loans by past due status at December 31, 2015 and 2014 for non-covered loans held-in-portfolio (net of unearned income).
| | | | | | | | | | | | | | | | | | | | | | | | |
December 31, 2015 | |
Puerto Rico | |
| | | Past due | | | | | | Non-covered | |
| | | 30-59 | | | 60-89 | | | 90 days | | | Total | | | | | | loans HIP | |
(In thousands) | | days | | | days | | | or more | | | past due | | | Current | | | Puerto Rico | |
Commercial multi-family | | $ | 459 | | | $ | 217 | | | $ | 1,316 | | | $ | 1,992 | | | $ | 130,154 | | | $ | 132,146 | |
Commercial real estate non-owner occupied | | | 166,732 | | | | 12,520 | | | | 84,982 | | | | 264,234 | | | | 2,404,858 | | | | 2,669,092 | |
Commercial real estate owner occupied | | | 14,245 | | | | 5,624 | | | | 138,778 | | | | 158,647 | | | | 1,750,597 | | | | 1,909,244 | |
Commercial and industrial | | | 6,010 | | | | 6,059 | | | | 38,464 | | | | 50,533 | | | | 2,607,204 | | | | 2,657,737 | |
Construction | | | 238 | | | | 253 | | | | 13,738 | | | | 14,229 | | | | 86,719 | | | | 100,948 | |
Mortgage | | | 344,858 | | | | 162,341 | | | | 863,869 | | | | 1,371,068 | | | | 4,756,423 | | | | 6,127,491 | |
Leasing | | | 7,844 | | | | 1,630 | | | | 3,009 | | | | 12,483 | | | | 615,167 | | | | 627,650 | |
Consumer: | | | | | | | | | | | | | | | | | | | | | | | | |
Credit cards | | | 11,078 | | | | 9,414 | | | | 19,098 | | | | 39,590 | | | | 1,088,755 | | | | 1,128,345 | |
Home equity lines of credit | | | 186 | | | | 292 | | | | 394 | | | | 872 | | | | 9,816 | | | | 10,688 | |
Personal | | | 13,756 | | | | 7,889 | | | | 22,625 | | | | 44,270 | | | | 1,158,565 | | | | 1,202,835 | |
Auto | | | 33,554 | | | | 7,500 | | | | 11,640 | | | | 52,694 | | | | 763,256 | | | | 815,950 | |
Other | | | 1,069 | | | | 298 | | | | 19,232 | | | | 20,599 | | | | 167,885 | | | | 188,484 | |
| | | | | | | | | | | | | | | | | | | | | | | | |
Total | | $ | 600,029 | | | $ | 214,037 | | | $ | 1,217,145 | | | $ | 2,031,211 | | | $ | 15,539,399 | | | $ | 17,570,610 | |
| | | | | | | | | | | | | | | | | | | | | | | | |
|
December 31, 2015 | |
U.S. mainland | |
| | | Past due | | | | | | | |
| | | 30-59 | | | 60-89 | | | 90 days | | | Total | | | | | | Loans HIP | |
(In thousands) | | days | | | days | | | or more | | | past due | | | Current | | | U.S. mainland | |
Commercial multi-family | | $ | 33 | | | $ | 253 | | | $ | — | | | $ | 286 | | | $ | 693,647 | | | $ | 693,933 | |
Commercial real estate non-owner occupied | | | 160 | | | | — | | | | 253 | | | | 413 | | | | 962,610 | | | | 963,023 | |
Commercial real estate owner occupied | | | 1,490 | | | | 429 | | | | 221 | | | | 2,140 | | | | 200,204 | | | | 202,344 | |
Commercial and industrial | | | 13,647 | | | | 1,526 | | | | 75,575 | | | | 90,748 | | | | 780,896 | | | | 871,644 | |
Construction | | | — | | | | — | | | | — | | | | — | | | | 580,158 | | | | 580,158 | |
Mortgage | | | 18,957 | | | | 3,424 | | | | 13,538 | | | | 35,919 | | | | 872,671 | | | | 908,590 | |
Legacy | | | 1,160 | | | | 662 | | | | 3,649 | | | | 5,471 | | | | 58,965 | | | | 64,436 | |
Consumer: | | | | | | | | | | | | | | | | | | | | | | | | |
Credit cards | | | 327 | | | | 134 | | | | 437 | | | | 898 | | | | 13,037 | | | | 13,935 | |
Home equity lines of credit | | | 3,149 | | | | 1,114 | | | | 4,176 | | | | 8,439 | | | | 296,045 | | | | 304,484 | |
Personal | | | 1,836 | | | | 690 | | | | 1,240 | | | | 3,766 | | | | 168,860 | | | | 172,626 | |
Auto | | | — | | | | — | | | | 6 | | | | 6 | | | | 22 | | | | 28 | |
Other | | | — | | | | 10 | | | | 5 | | | | 15 | | | | 289 | | | | 304 | |
| | | | | | | | | | | | | | | | | | | | | | | | |
Total | | $ | 40,759 | | | $ | 8,242 | | | $ | 99,100 | | | $ | 148,101 | | | $ | 4,627,404 | | | $ | 4,775,505 | |
| | | | | | | | | | | | | | | | | | | | | | | | |
155
| | | | | | | | | | | | | | | | | | | | | | | | |
December 31, 2015 | |
Popular, Inc. | |
| | | Past due | | | | | | Non-covered | |
| | | 30-59 | | | 60-89 | | | 90 days | | | Total | | | | | | loans HIP | |
(In thousands) | | days | | | days | | | or more | | | past due | | | Current | | | Popular, Inc. | |
Commercial multi-family | | $ | 492 | | | $ | 470 | | | $ | 1,316 | | | $ | 2,278 | | | $ | 823,801 | | | $ | 826,079 | |
Commercial real estate non-owner occupied | | | 166,892 | | | | 12,520 | | | | 85,235 | | | | 264,647 | | | | 3,367,468 | | | | 3,632,115 | |
Commercial real estate owner occupied | | | 15,735 | | | | 6,053 | | | | 138,999 | | | | 160,787 | | | | 1,950,801 | | | | 2,111,588 | |
Commercial and industrial | | | 19,657 | | | | 7,585 | | | | 114,039 | | | | 141,281 | | | | 3,388,100 | | | | 3,529,381 | |
Construction | | | 238 | | | | 253 | | | | 13,738 | | | | 14,229 | | | | 666,877 | | | | 681,106 | |
Mortgage | | | 363,815 | | | | 165,765 | | | | 877,407 | | | | 1,406,987 | | | | 5,629,094 | | | | 7,036,081 | |
Leasing | | | 7,844 | | | | 1,630 | | | | 3,009 | | | | 12,483 | | | | 615,167 | | | | 627,650 | |
Legacy | | | 1,160 | | | | 662 | | | | 3,649 | | | | 5,471 | | | | 58,965 | | | | 64,436 | |
Consumer: | | | | | | | | | | | | | | | | | | | | | | | | |
Credit cards | | | 11,405 | | | | 9,548 | | | | 19,535 | | | | 40,488 | | | | 1,101,792 | | | | 1,142,280 | |
Home equity lines of credit | | | 3,335 | | | | 1,406 | | | | 4,570 | | | | 9,311 | | | | 305,861 | | | | 315,172 | |
Personal | | | 15,592 | | | | 8,579 | | | | 23,865 | | | | 48,036 | | | | 1,327,425 | | | | 1,375,461 | |
Auto | | | 33,554 | | | | 7,500 | | | | 11,646 | | | | 52,700 | | | | 763,278 | | | | 815,978 | |
Other | | | 1,069 | | | | 308 | | | | 19,237 | | | | 20,614 | | | | 168,174 | | | | 188,788 | |
| | | | | | | | | | | | | | | | | | | | | | | | |
Total | | $ | 640,788 | | | $ | 222,279 | | | $ | 1,316,245 | | | $ | 2,179,312 | | | $ | 20,166,803 | | | $ | 22,346,115 | |
| | | | | | | | | | | | | | | | | | | | | | | | |
| | | | | | | | | | | | | | | | | | | | | | | | |
December 31, 2014 | |
Puerto Rico | |
| | | Past due | | | | | | Non-covered | |
| | | 30-59 | | | 60-89 | | | 90 days | | | Total | | | | | | loans HIP | |
(In thousands) | | days | | | days | | | or more | | | past due | | | Current | | | Puerto Rico | |
Commercial multi-family | | $ | 221 | | | $ | 69 | | | $ | 2,199 | | | $ | 2,489 | | | $ | 77,588 | | | $ | 80,077 | |
Commercial real estate non-owner occupied | | | 9,828 | | | | 121 | | | | 33,452 | | | | 43,401 | | | | 1,970,178 | | | | 2,013,579 | |
Commercial real estate owner occupied | | | 8,954 | | | | 7,709 | | | | 92,648 | | | | 109,311 | | | | 1,364,051 | | | | 1,473,362 | |
Commercial and industrial | | | 18,498 | | | | 5,269 | | | | 130,105 | | | | 153,872 | | | | 2,653,913 | | | | 2,807,785 | |
Construction | | | 2,497 | | | | — | | | | 13,812 | | | | 16,309 | | | | 143,075 | | | | 159,384 | |
Mortgage | | | 304,319 | | | | 167,219 | | | | 780,678 | | | | 1,252,216 | | | | 4,198,285 | | | | 5,450,501 | |
Leasing | | | 6,779 | | | | 1,246 | | | | 3,102 | | | | 11,127 | | | | 553,262 | | | | 564,389 | |
Consumer: | | | | | | | | | | | | | | | | | | | | | | | | |
Credit cards | | | 13,715 | | | | 9,290 | | | | 20,368 | | | | 43,373 | | | | 1,096,791 | | | | 1,140,164 | |
Home equity lines of credit | | | 137 | | | | 159 | | | | 21 | | | | 317 | | | | 13,083 | | | | 13,400 | |
Personal | | | 13,479 | | | | 6,646 | | | | 25,688 | | | | 45,813 | | | | 1,216,720 | | | | 1,262,533 | |
Auto | | | 34,238 | | | | 8,397 | | | | 11,387 | | | | 54,022 | | | | 713,274 | | | | 767,296 | |
Other | | | 1,009 | | | | 209 | | | | 4,547 | | | | 5,765 | | | | 199,879 | | | | 205,644 | |
| | | | | | | | | | | | | | | | | | | | | | | | |
Total | | $ | 413,674 | | | $ | 206,334 | | | $ | 1,118,007 | | | $ | 1,738,015 | | | $ | 14,200,099 | | | $ | 15,938,114 | |
| | | | | | | | | | | | | | | | | | | | | | | | |
156
| | | | | | | | | | | | | | | | | | | | | | | | |
December 31, 2014 | |
U.S. mainland | |
| | | Past due | | | | | | | |
| | | 30-59 | | | 60-89 | | | 90 days | | | Total | | | | | | Loans HIP | |
(In thousands) | | days | | | days | | | or more | | | past due | | | Current | | | U.S. mainland | |
Commercial multi-family | | $ | 87 | | | $ | 376 | | | $ | — | | | $ | 463 | | | $ | 406,740 | | | $ | 407,203 | |
Commercial real estate non-owner occupied | | | 1,478 | | | | — | | | | — | | | | 1,478 | | | | 511,089 | | | | 512,567 | |
Commercial real estate owner occupied | | | 45 | | | | 3,631 | | | | 805 | | | | 4,481 | | | | 189,424 | | | | 193,905 | |
Commercial and industrial | | | 1,133 | | | | 123 | | | | 1,510 | | | | 2,766 | | | | 643,023 | | | | 645,789 | |
Construction | | | 810 | | | | — | | | | — | | | | 810 | | | | 91,626 | | | | 92,436 | |
Mortgage | | | 29,582 | | | | 8,646 | | | | 9,284 | | | | 47,512 | | | | 1,004,873 | | | | 1,052,385 | |
Legacy | | | 929 | | | | 1,931 | | | | 1,545 | | | | 4,405 | | | | 76,413 | | | | 80,818 | |
Consumer: | | | | | | | | | | | | | | | | | | | | | | | | |
Credit cards | | | 314 | | | | 246 | | | | 449 | | | | 1,009 | | | | 14,056 | | | | 15,065 | |
Home equity lines of credit | | | 5,036 | | | | 1,025 | | | | 4,090 | | | | 10,151 | | | | 342,611 | | | | 352,762 | |
Personal | | | 2,476 | | | | 893 | | | | 1,410 | | | | 4,779 | | | | 108,140 | | | | 112,919 | |
Auto | | | — | | | | — | | | | — | | | | — | | | | 73 | | | | 73 | |
Other | | | 10 | | | | 4 | | | | 7 | | | | 21 | | | | 394 | | | | 415 | |
| | | | | | | | | | | | | | | | | | | | | | | | |
Total | | $ | 41,900 | | | $ | 16,875 | | | $ | 19,100 | | | $ | 77,875 | | | $ | 3,388,462 | | | $ | 3,466,337 | |
| | | | | | | | | | | | | | | | | | | | | | | | |
|
December 31, 2014 | |
Popular, Inc. | |
| | | Past due | | | | | | Non-covered | |
| | | 30-59 | | | 60-89 | | | 90 days | | | Total | | | | | | loans HIP | |
(In thousands) | | days | | | days | | | or more | | | past due | | | Current | | | Popular, Inc. | |
Commercial multi-family | | $ | 308 | | | $ | 445 | | | $ | 2,199 | | | $ | 2,952 | | | $ | 484,328 | | | $ | 487,280 | |
Commercial real estate non-owner occupied | | | 11,306 | | | | 121 | | | | 33,452 | | | | 44,879 | | | | 2,481,267 | | | | 2,526,146 | |
Commercial real estate owner occupied | | | 8,999 | | | | 11,340 | | | | 93,453 | | | | 113,792 | | | | 1,553,475 | | | | 1,667,267 | |
Commercial and industrial | | | 19,631 | | | | 5,392 | | | | 131,615 | | | | 156,638 | | | | 3,296,936 | | | | 3,453,574 | |
Construction | | | 3,307 | | | | — | | | | 13,812 | | | | 17,119 | | | | 234,701 | | | | 251,820 | |
Mortgage | | | 333,901 | | | | 175,865 | | | | 789,962 | | | | 1,299,728 | | | | 5,203,158 | | | | 6,502,886 | |
Leasing | | | 6,779 | | | | 1,246 | | | | 3,102 | | | | 11,127 | | | | 553,262 | | | | 564,389 | |
Legacy | | | 929 | | | | 1,931 | | | | 1,545 | | | | 4,405 | | | | 76,413 | | | | 80,818 | |
Consumer: | | | | | | | | | | | | | | | | | | | | | | | | |
Credit cards | | | 14,029 | | | | 9,536 | | | | 20,817 | | | | 44,382 | | | | 1,110,847 | | | | 1,155,229 | |
Home equity lines of credit | | | 5,173 | | | | 1,184 | | | | 4,111 | | | | 10,468 | | | | 355,694 | | | | 366,162 | |
Personal | | | 15,955 | | | | 7,539 | | | | 27,098 | | | | 50,592 | | | | 1,324,860 | | | | 1,375,452 | |
Auto | | | 34,238 | | | | 8,397 | | | | 11,387 | | | | 54,022 | | | | 713,347 | | | | 767,369 | |
Other | | | 1,019 | | | | 213 | | | | 4,554 | | | | 5,786 | | | | 200,273 | | | | 206,059 | |
| | | | | | | | | | | | | | | | | | | | | | | | |
Total | | $ | 455,574 | | | $ | 223,209 | | | $ | 1,137,107 | | | $ | 1,815,890 | | | $ | 17,588,561 | | | $ | 19,404,451 | |
| | | | | | | | | | | | | | | | | | | | | | | | |
The following table provides a breakdown of loans held-for-sale (“LHFS”) in non-performing status at December 31, 2015 and 2014 by main categories.
| | | | | | | | |
(In thousands) | | December 31, 2015 | | | December 31, 2014 | |
Commercial | | $ | 45,074 | | | $ | 309 | |
Construction | | | 95 | | | | — | |
Mortgage | | | — | | | | 14,041 | |
Consumer | | | — | | | | 4,549 | |
| | | | | | | | |
Total | | $ | 45,169 | | | $ | 18,899 | |
| | | | | | | | |
157
The following table presents loans acquired as part of the Doral Bank Transaction accounted for under ASC subtopic 310-20 as of the February 27, 2015 acquisition date:
| | | | |
(In thousands) | | | |
Fair value of loans accounted under ASC Subtopic 310-20 | | $ | 1,178,543 | |
Gross contractual amounts receivable (principal and interest) | | $ | 1,666,695 | |
Estimate of contractual cash flows not expected to be collected | | $ | 34,646 | |
The components of the net financing leases receivable at December 31, 2015 and 2014 were as follows:
| | | | | | | | |
(In thousands) | | 2015 | | | 2014 | |
Total minimum lease payments | | $ | 548,438 | | | $ | 497,895 | |
Estimated residual value of leased property | | | 175,458 | | | | 149,079 | |
Deferred origination costs, net of fees | | | 8,553 | | | | 8,727 | |
Less - Unearned financing income | | | 103,433 | | | | 89,552 | |
| | | | | | | | |
Net minimum lease payments | | | 629,016 | | | | 566,149 | |
Less - Allowance for loan losses | | | 11,022 | | | | 7,184 | |
| | | | | | | | |
Net minimum lease payments, net of allowance for loan losses | | $ | 617,994 | | | $ | 558,965 | |
| | | | | | | | |
At December 31, 2015, future minimum lease payments are expected to be received as follows:
| | | | |
(In thousands) | | | |
2016 | | $ | 130,801 | |
2017 | | | 120,298 | |
2018 | | | 106,723 | |
2019 | | | 75,846 | |
2020 and thereafter | | | 114,770 | |
| | | | |
Total | | $ | 548,438 | |
| | | | |
Covered loans
The following table presents covered loans in non-performing status and accruing loans past-due 90 days or more by loan class at December 31, 2015 and 2014.
| | | | | | | | | | | | | | | | |
| | | December 31, 2015 | | | December 31, 2014 | |
| | | Non-accrual | | | Accruing loans past | | | Non-accrual | | | Accruing loans past | |
(In thousands) | | loans | | | due 90 days or more | | | loans | | | due 90 days or more | |
Commercial real estate | | $ | — | | | $ | — | | | $ | 8,810 | | | $ | — | |
Commercial and industrial | | | — | | | | — | | | | 1,142 | | | | — | |
Construction | | | — | | | | — | | | | 2,770 | | | | — | |
Mortgage | | | 3,790 | | | | — | | | | 4,376 | | | | 28 | |
Consumer | | | 97 | | | | — | | | | 735 | | | | — | |
| | | | | | | | | | | | | | | | |
Total[1] | | $ | 3,887 | | | $ | — | | | $ | 17,833 | | | $ | 28 | |
| | | | | | | | | | | | | | | | |
| [1] | Covered loans accounted for under ASC Subtopic 310-30 are excluded from the above table as they are considered to be performing due to the application of the accretion method, in which these loans will accrete interest income over the remaining life of the loans using estimated cash flow analyses. |
158
The following tables present loans by past due status at December 31, 2015 and 2014 for covered loans held-in-portfolio. The information considers covered loans accounted for under ASC Subtopic 310-20 and ASC Subtopic 310-30.
| | | | | | | | | | | | | | | | | | | | | | | | |
December 31, 2015 | |
| | | Past due | | | | | | | |
| | | 30-59 | | | 60-89 | | | 90 days | | | Total | | | | | | Covered | |
(In thousands) | | days | | | days | | | or more | | | past due | | | Current | | | loans HIP | |
Mortgage | | $ | 31,413 | | | $ | 16,593 | | | $ | 83,132 | | | $ | 131,138 | | | $ | 495,964 | | | $ | 627,102 | |
Consumer | | | 1,246 | | | | 444 | | | | 1,283 | | | | 2,973 | | | | 16,040 | | | | 19,013 | |
| | | | | | | | | | | | | | | | | | | | | | | | |
Total covered loans | | $ | 32,659 | | | $ | 17,037 | | | $ | 84,415 | | | $ | 134,111 | | | $ | 512,004 | | | $ | 646,115 | |
| | | | | | | | | | | | | | | | | | | | | | | | |
|
December 31, 2014 | |
| | | Past due | | | | | | | |
| | | 30-59 | | | 60-89 | | | 90 days | | | Total | | | | | | Covered | |
(In thousands) | | days | | | days | | | or more | | | past due | | | Current | | | loans HIP | |
Commercial real estate | | $ | 98,559 | | | $ | 12,597 | | | $ | 291,010 | | | $ | 402,166 | | | $ | 1,109,306 | | | $ | 1,511,472 | |
Commercial and industrial | | | 512 | | | | 7 | | | | 7,756 | | | | 8,275 | | | | 95,034 | | | | 103,309 | |
Construction | | | — | | | | 384 | | | | 58,665 | | | | 59,049 | | | | 11,287 | | | | 70,336 | |
Mortgage | | | 45,764 | | | | 23,531 | | | | 143,140 | | | | 212,435 | | | | 610,551 | | | | 822,986 | |
Consumer | | | 1,884 | | | | 747 | | | | 2,532 | | | | 5,163 | | | | 29,396 | | | | 34,559 | |
| | | | | | | | | | | | | | | | | | | | | | | | |
Total covered loans | | $ | 146,719 | | | $ | 37,266 | | | $ | 503,103 | | | $ | 687,088 | | | $ | 1,855,574 | | | $ | 2,542,662 | |
| | | | | | | | | | | | | | | | | | | | | | | | |
The Corporation accounts for lines of credit with revolving privileges under the accounting guidance of ASC Subtopic 310-20, which requires that any differences between the contractually required loans payment receivable in excess of the initial investment in the loans be accreted into interest income over the life of the loans, if the loan is accruing interest. Covered loans accounted for under ASC Subtopic 310-20 amounted to $10 million at December 31, 2015 (December 31, 2014 - $0.1 billion).
Loans acquired with deteriorated credit quality accounted for under ASC 310-30
The following provides information of loans acquired with evidence of credit deterioration as of the acquisition date, accounted for under the guidance of ASC 310-30.
Loans acquired from Westernbank as part of an FDIC-assisted transaction
The carrying amount of the Westernbank loans consisted of loans determined to be impaired at the time of acquisition, which are accounted for in accordance with ASC Subtopic 310-30 (“credit impaired loans”), and loans that were considered to be performing at the acquisition date, accounted for by analogy to ASC Subtopic 310-30 (“non-credit impaired loans”), as detailed in the following table.
159
| | | | | | | | | | | | | | | | | | | | | | | | |
| | | December 31, 2015 [1] | | | December 31, 2014 | |
| | | Carrying amount | | | Carrying amount | |
(In thousands) | | Non-credit
impaired loans | | | Credit impaired
loans | | | Total | | | Non-credit
impaired loans | | | Credit impaired
loans | | | Total | |
Commercial real estate | | $ | 1,114,368 | | | $ | 35,393 | | | $ | 1,149,761 | | | $ | 1,392,482 | | | $ | 90,202 | | | $ | 1,482,684 | |
Commercial and industrial | | | 84,765 | | | | 519 | | | | 85,284 | | | | 57,059 | | | | 2,197 | | | | 59,256 | |
Construction | | | 8,943 | | | | 6,027 | | | | 14,970 | | | | 32,836 | | | | 32,409 | | | | 65,245 | |
Mortgage | | | 667,023 | | | | 33,090 | | | | 700,113 | | | | 764,148 | | | | 45,829 | | | | 809,977 | |
Consumer | | | 23,047 | | | | 1,326 | | | | 24,373 | | | | 25,617 | | | | 1,393 | | | | 27,010 | |
| | | | | | | | | | | | | | | | | | | | | | | | |
Carrying amount | | | 1,898,146 | | | | 76,355 | | | | 1,974,501 | | | | 2,272,142 | | | | 172,030 | | | | 2,444,172 | |
Allowance for loan losses | | | (59,753 | ) | | | (3,810 | ) | | | (63,563 | ) | | | (52,798 | ) | | | (26,048 | ) | | | (78,846 | ) |
| | | | | | | | | | | | | | | | | | | | | | | | |
Carrying amount, net of allowance | | $ | 1,838,393 | | | $ | 72,545 | | | $ | 1,910,938 | | | $ | 2,219,344 | | | $ | 145,982 | | | $ | 2,365,326 | |
| | | | | | | | | | | | | | | | | | | | | | | | |
| [1] | The carrying amount of loans acquired from Westernbank and accounted for under ASC 310-30 which remains subject to the loss sharing agreement with the FDIC amounted to approximately $636 million as of December 31,2015. |
The outstanding principal balance of Westernbank loans accounted pursuant to ASC Subtopic 310-30, amounted to $2.4 billion at December 31, 2015 (December 31, 2014 - $3.1 billion). At December 31, 2015, none of the acquired loans from the Westernbank FDIC-assisted transaction accounted for under ASC Subtopic 310-30 were considered non-performing loans. Therefore, interest income, through accretion of the difference between the carrying amount of the loans and the expected cash flows, was recognized on all acquired loans.
Changes in the carrying amount and the accretable yield for the Westernbank loans accounted pursuant to the ASC Subtopic 310-30, for the years ended December 31, 2015 and 2014, were as follows:
| | | | | | | | | | | | | | | | | | | | | | | | |
| | | Activity in the accretable yield | |
| | | Westernbank loans ASC 310-30 | |
| | | For the years ended | |
| | | December 31, 2015 | | | December 31, 2014 | |
| | | Non-credit | | | Credit | | | | | | Non-credit | | | Credit | | | | |
| | | impaired | | | impaired | | | | | | impaired | | | impaired | | | | |
(In thousands) | | loans | | | loans | | | Total | | | loans | | | loans | | | Total | |
Beginning balance | | $ | 1,265,752 | | | $ | 5,585 | | | $ | 1,271,337 | | | $ | 1,297,725 | | | $ | 11,480 | | | $ | 1,309,205 | |
Accretion | | | (192,826 | ) | | | (10,140 | ) | | | (202,966 | ) | | | (268,063 | ) | | | (16,409 | ) | | | (284,472 | ) |
Change in expected cash flows | | | 32,806 | | | | 11,281 | | | | 44,087 | | | | 236,090 | | | | 10,514 | | | | 246,604 | |
| | | | | | | | | | | | | | | | | | | | | | | | |
Ending balance | | $ | 1,105,732 | | | $ | 6,726 | | | $ | 1,112,458 | | | $ | 1,265,752 | | | $ | 5,585 | | | $ | 1,271,337 | |
| | | | | | | | | | | | | | | | | | | | | | | | |
160
| | | | | | | | | | | | | | | | | | | | | | | | |
| | | Carrying amount of Westernbank loans accounted for pursuant to ASC 310-30 | |
| | | For the years ended | |
| | | December 31, 2015 [1] | | | December 31, 2014 | |
| | | Non-credit | | | Credit | | | | | | Non-credit | | | Credit | | | | |
| | | impaired | | | impaired | | | | | | impaired | | | impaired | | | | |
(In thousands) | | loans | | | loans | | | Total | | | loans | | | loans | | | Total | |
Beginning balance | | $ | 2,272,142 | | | $ | 172,030 | | | $ | 2,444,172 | | | $ | 2,509,075 | | | $ | 318,872 | | | $ | 2,827,947 | |
Accretion | | | 192,826 | | | | 10,140 | | | | 202,966 | | | | 268,063 | | | | 16,409 | | | | 284,472 | |
Collections and charge offs | | | (566,822 | ) | | | (105,815 | ) | | | (672,637 | ) | | | (504,996 | ) | | | (163,251 | ) | | | (668,247 | ) |
| | | | | | | | | | | | | | | | | | | | | | | | |
Ending balance | | $ | 1,898,146 | | | $ | 76,355 | | | $ | 1,974,501 | | | $ | 2,272,142 | | | $ | 172,030 | | | $ | 2,444,172 | |
Allowance for loan losses ASC 310-30 Westernbank loans | | | (59,753 | ) | | | (3,810 | ) | | | (63,563 | ) | | | (52,798 | ) | | | (26,048 | ) | | | (78,846 | ) |
| | | | | | | | | | | | | | | | | | | | | | | | |
Ending balance, net of ALLL | | $ | 1,838,393 | | | $ | 72,545 | | | $ | 1,910,938 | | | $ | 2,219,344 | | | $ | 145,982 | | | $ | 2,365,326 | |
| | | | | | | | | | | | | | | | | | | | | | | | |
| [1] | The carrying amount of loans acquired from Westernbank and accounted for under ASC 310-30 which remain subject to the loss sharing agreement with the FDIC amounted to approximately $636 million as of December 31, 2015. |
Other loans acquired with deteriorated credit quality
The outstanding principal balance of other acquired loans accounted pursuant to ASC Subtopic 310-30, amounted to $710 million at December 31, 2015 (December 31, 2014 - $243 million). At December 31, 2015, none of the other acquired loans accounted under ASC Subtopic 310-30 were considered non-performing loans. Therefore, interest income, through accretion of the difference between the carrying amount of the loans and the expected cash flows, was recognized on all acquired loans.
Changes in the carrying amount and the accretable yield for the other acquired loans accounted pursuant to the ASC Subtopic 310-30, for the years ended December 31, 2015 and 2014 were as follows:
| | | | | | | | |
Activity in the accretable yield - Other acquired loans ASC 310-30 | |
| | | For the years ended | |
(In thousands) | | December 31, 2015 | | | December 31, 2014 | |
Beginning balance | | $ | 116,304 | | | $ | 49,398 | |
Additions | | | 132,273 | | | | 19,190 | |
Accretion | | | (29,277 | ) | | | (10,074 | ) |
Change in expected cash flows | | | 1,828 | | | | 57,790 | |
| | | | | | | | |
Ending balance | | $ | 221,128 | | | $ | 116,304 | |
| | | | | | | | |
| | | | | | | | |
Carrying amount of other acquired loans accounted for pursuant to ASC 310-30 | |
| | | For the years ended | |
(In thousands) | | December 31, 2015 | | | December 31, 2014 | |
Beginning balance | | $ | 212,763 | | | $ | 173,659 | |
Additions | | | 386,679 | | | | 58,799 | |
Accretion | | | 29,277 | | | | 10,074 | |
Collections and charge-offs | | | (64,669 | ) | | | (29,769 | ) |
| | | | | | | | |
Ending balance | | $ | 564,050 | | | $ | 212,763 | |
Allowance for loan losses ASC 310-30 non-covered loans | | | (19,276 | ) | | | (16,159 | ) |
| | | | | | | | |
Ending balance, net of allowance for loan losses | | $ | 544,774 | | | $ | 196,604 | |
| | | | | | | | |
161
The following table presents loans acquired as part of the Doral Bank Transaction accounted for pursuant to ASC Subtopic 310-30 at the February 27, 2015 acquisition date.
| | | | |
(In thousands) | | | |
Contractually-required principal and interest | | $ | 560,833 | |
Non-accretable difference | | | 107,446 | |
| | | | |
Cash flows expected to be collected | | | 453,387 | |
Accretable yield | | | 113,977 | |
| | | | |
Fair value of loans accounted for under ASC Subtopic 310-30 | | $ | 339,410 | |
| | | | |
162
Note 13 – Allowance for loan losses
The Corporation follows a systematic methodology to establish and evaluate the adequacy of the allowance for loan losses to provide for inherent losses in the loan portfolio. This methodology includes the consideration of factors such as current economic conditions, portfolio risk characteristics, prior loss experience and results of periodic credit reviews of individual loans. The provision for loan losses charged to current operations is based on this methodology. Loan losses are charged and recoveries are credited to the allowance for loan losses.
The Corporation’s assessment of the allowance for loan losses is determined in accordance with the guidance of loss contingencies in ASC Subtopic 450-20 and loan impairment guidance in ASC Section 310-10-35. Also, the Corporation determines the allowance for loan losses on purchased impaired loans and purchased loans accounted for under ASC Subtopic 310-30, by evaluating decreases in expected cash flows after the acquisition date.
The accounting guidance provides for the recognition of a loss allowance for groups of homogeneous loans. The determination for general reserves of the allowance for loan losses includes the following principal factors:
| | • | | Base net loss rates, which are based on the moving average of annualized net loss rates computed over a 5-year historical loss period for the commercial and construction loan portfolios, and an 18-month period for the consumer and mortgage loan portfolios. The base net loss rates are applied by loan type and by legal entity. |
| | • | | Recent loss trend adjustment, which replaces the base loss rate with a 12-month average loss rate, when these trends are higher than the respective base loss rates. The objective of this adjustment is to allow for a more recent loss trend to be captured and reflected in the ALLL estimation process. |
For the period ended December 31, 2015, 15% (December 31, 2014- 50%) of the ALLL for BPPR non-covered loan portfolios utilized the recent loss trend adjustment instead of the base loss. The effect of replacing the base loss with the recent loss trend adjustment was mainly concentrated in the commercial and industrial, mortgage, and commercial multi-family loan portfolios for 2015, and in the commercial multi-family, commercial and industrial, personal and auto loan portfolios for 2014.
For the period ended December 31, 2015, 4% (December 31, 2014 - 21%) of the ALLL for BPNA loan portfolios utilized the recent loss trend adjustment instead of the base loss. The effect of replacing the base loss with the recent loss trend adjustment was concentrated in the consumer loan portfolio for 2015 and in the commercial and industrial loan portfolio for 2014.
Environmental factors, which include credit and macroeconomic indicators such as unemployment rate, economic activity index and delinquency rates, adopted to account for current market conditions that are likely to cause estimated credit losses to differ from historical losses. The Corporation reflects the effect of these environmental factors on each loan group as an adjustment that, as appropriate, increases the historical loss rate applied to each group. Environmental factors provide updated perspective on credit and economic conditions. Regression analysis is used to select these indicators and quantify the effect on the general reserve of the allowance for loan losses.
During the second quarter of 2015, management completed the annual review of the components of the ALLL models. As part of this review management updated core metrics and revised certain components related to the estimation process for evaluating the adequacy of the general reserve of the allowance for loan losses. These enhancements to the ALLL methodology, which are described in the paragraphs below, were implemented as of June 30, 2015 and resulted in a net decrease to the allowance for loan losses of $ 1.9 million for the non-covered portfolio. The effect of the aforementioned enhancements was immaterial for the covered loans portfolio.
Management made the following principal enhancements to the methodology during the second quarter of 2015:
| | • | | Increased the historical look-back period for determining the base loss rates for commercial and construction loans. The Corporation increased the look-back period for assessing historical loss trends applicable to the determination of commercial and construction loan net charge-offs from 36 months to 60 months. Given the current overall commercial and construction credit quality improvements, including lower loss trends, management concluded that a 60-month look-back period for the base loss rates aligns the Corporation’s allowance for loan losses methodology to maintain adequate loss observations in its main general reserve component. |
163
The combined effect of the aforementioned enhancements to the base loss rates resulted in an increase to the allowance for loan losses of $19.6 million at June 30, 2015, of which $17.9 million related to the non-covered BPPR segment and $1.7 million related to the BPNA segment.
| | • | | Annual review and recalibration of the environmental factors adjustment. The environmental factor adjustments are developed by performing regression analyses on selected credit and economic indicators for each applicable loan segment. During the second quarter of 2015, the environmental factor models used to account for changes in current credit and macroeconomic conditions were reviewed and recalibrated based on the latest applicable trends. |
The combined effect of the aforementioned recalibration and enhancements to the environmental factors adjustment resulted in a decrease to the allowance for loan losses of $21.5 million at June 30, 2015, of which $20.5 million related to the non-covered BPPR segment and $1 million related to the BPNA segment.
The following tables present the changes in the allowance for loan losses for the years ended December 31, 2015 and 2014.
| | | | | | | | | | | | | | | | | | | | | | | | |
For the year ended December 31, 2015 | |
Puerto Rico - Non-covered loans | |
(In thousands) | | Commercial | | | Construction | | | Mortgage | | | Leasing | | | Consumer | | | Total | |
Allowance for credit losses: | | | | | | | | | | | | | | | | | | | | | | | | |
Beginning balance | | $ | 201,589 | | | $ | 5,483 | | | $ | 120,860 | | | $ | 7,131 | | | $ | 154,072 | | | $ | 489,135 | |
Provision (reversal of provision) | | | 88,680 | | | | (2,836 | ) | | | 57,876 | | | | 7,165 | | | | 65,947 | | | | 216,832 | |
Charge-offs | | | (105,716 | ) | | | (13,628 | ) | | | (53,296 | ) | | | (5,561 | ) | | | (110,384 | ) | | | (288,585 | ) |
Recoveries | | | 31,826 | | | | 14,514 | | | | 2,305 | | | | 2,258 | | | | 26,508 | | | | 77,411 | |
Net write-downs related to loans transferred to held-for-sale | | | (37,907 | ) | | | — | | | | — | | | | — | | | | — | | | | (37,907 | ) |
Allowance transferred from covered loans | | | 8,453 | | | | 1,424 | | | | 582 | | | | — | | | | 2,578 | | | | 13,037 | |
| | | | | | | | | | | | | | | | | | | | | | | | |
Ending balance | | $ | 186,925 | | | $ | 4,957 | | | $ | 128,327 | | | $ | 10,993 | | | $ | 138,721 | | | $ | 469,923 | |
| | | | | | | | | | | | | | | | | | | | | | | | |
| | | | | | | | | | | | | | | | | | | | | | | | |
For the year ended December 31, 2015 | |
Puerto Rico - Covered loans | |
(In thousands) | | Commercial | | | Construction | | | Mortgage | | | Leasing | | | Consumer | | | Total | |
Allowance for credit losses: | | | | | | | | | | | | | | | | | | | | | | | | |
Beginning balance | | $ | 30,871 | | | $ | 7,202 | | | $ | 40,948 | | | $ | — | | | $ | 3,052 | | | $ | 82,073 | |
Provision (reversal of provision) | | | 10,115 | | | | 15,150 | | | | (1,011 | ) | | | — | | | | (234 | ) | | | 24,020 | |
Charge-offs | | | (37,936 | ) | | | (25,086 | ) | | | (6,158 | ) | | | — | | | | (853 | ) | | | (70,033 | ) |
Recoveries | | | 6,504 | | | | 4,700 | | | | 930 | | | | — | | | | 842 | | | | 12,976 | |
Net write-downs related to loans transferred to held-for-sale | | | (1,101 | ) | | | (542 | ) | | | (160 | ) | | | — | | | | (20 | ) | | | (1,823 | ) |
Allowance transferred to non-covered loans | | | (8,453 | ) | | | (1,424 | ) | | | (582 | ) | | | — | | | | (2,578 | ) | | | (13,037 | ) |
| | | | | | | | | | | | | | | | | | | | | | | | |
Ending balance | | $ | — | | | $ | — | | | $ | 33,967 | | | $ | — | | | $ | 209 | | | $ | 34,176 | |
| | | | | | | | | | | | | | | | | | | | | | | | |
| | | | | | | | | | | | | | | | | | | | | | | | |
For the year ended December 31, 2015 | |
U.S. Mainland - Continuing Operations | |
(In thousands) | | Commercial | | | Construction | | | Mortgage | | | Legacy | | | Consumer | | | Total | |
Allowance for credit losses: | | | | | | | | | | | | | | | | | | | | | | | | |
Beginning balance | | $ | 9,648 | | | $ | 1,187 | | | $ | 2,462 | | | $ | 2,944 | | | $ | 14,343 | | | $ | 30,584 | |
Provision (reversal of provision) | | | (3,582 | ) | | | 2,725 | | | | (1,727 | ) | | | (3,017 | ) | | | 6,227 | | | | 626 | |
Charge-offs | | | (1,452 | ) | | | — | | | | (1,670 | ) | | | (2,019 | ) | | | (9,507 | ) | | | (14,648 | ) |
Recoveries | | | 5,294 | | | | — | | | | 391 | | | | 4,779 | | | | 3,858 | | | | 14,322 | |
Net recovery (write-down) related to loans transferred to held-for-sale | | | — | | | | — | | | | 5,529 | | | | — | | | | (3,401 | ) | | | 2,128 | |
| | | | | | | | | | | | | | | | | | | | | | | | |
Ending balance | | $ | 9,908 | | | $ | 3,912 | | | $ | 4,985 | | | $ | 2,687 | | | $ | 11,520 | | | $ | 33,012 | |
| | | | | | | | | | | | | | | | | | | | | | | | |
164
| | | | | | | | | | | | | | | | | | | | | | | | | | | | |
For the year ended December 31, 2015 | |
Popular, Inc. | |
(In thousands) | | Commercial | | | Construction | | | Mortgage | | | Legacy | | | Leasing | | | Consumer | | | Total | |
Allowance for credit losses: | | | | | | | | | | | | | | | | | | | | | | | | | | | | |
Beginning balance | | $ | 242,108 | | | $ | 13,872 | | | $ | 164,270 | | | $ | 2,944 | | | $ | 7,131 | | | $ | 171,467 | | | $ | 601,792 | |
Provision (reversal of provision) | | | 95,213 | | | | 15,039 | | | | 55,138 | | | | (3,017 | ) | | | 7,165 | | | | 71,940 | | | | 241,478 | |
Charge-offs | | | (145,104 | ) | | | (38,714 | ) | | | (61,124 | ) | | | (2,019 | ) | | | (5,561 | ) | | | (120,744 | ) | | | (373,266 | ) |
Recoveries | | | 43,624 | | | | 19,214 | | | | 3,626 | | | | 4,779 | | | | 2,258 | | | | 31,208 | | | | 104,709 | |
| | | | | | | |
Net (write-down) recovery related to loans transferred to held-for-sale | | | (39,008 | ) | | | (542 | ) | | | 5,369 | | | | — | | | | — | | | | (3,421 | ) | | | (37,602 | ) |
| | | | | | | | | | | | | | | | | | | | | | | | | | | | |
Ending balance | | $ | 196,833 | | | $ | 8,869 | | | $ | 167,279 | | | $ | 2,687 | | | $ | 10,993 | | | $ | 150,450 | | | $ | 537,111 | |
| | | | | | | | | | | | | | | | | | | | | | | | | | | | |
| | | | | | | | | | | | | | | | | | | | | | | | |
For the year ended December 31, 2014 | |
Puerto Rico - Non-covered loans | |
(In thousands) | | Commercial | | | Construction | | | Mortgage | | | Leasing | | | Consumer | | | Total | |
Allowance for credit losses: | | | | | | | | | | | | | | | | | | | | | | | | |
Beginning balance | | $ | 128,150 | | | $ | 5,095 | | | $ | 130,330 | | | $ | 10,622 | | | $ | 152,578 | | | $ | 426,775 | |
Provision (reversal of provision) | | | 112,821 | | | | (3,121 | ) | | | 34,530 | | | | 470 | | | | 98,149 | | | | 242,849 | |
Charge-offs | | | (70,402 | ) | | | (1,722 | ) | | | (45,389 | ) | | | (6,028 | ) | | | (122,400 | ) | | | (245,941 | ) |
Recoveries | | | 31,020 | | | | 5,231 | | | | 1,389 | | | | 2,067 | | | | 25,745 | | | | 65,452 | |
| | | | | | | | | | | | | | | | | | | | | | | | |
Ending balance | | $ | 201,589 | | | $ | 5,483 | | | $ | 120,860 | | | $ | 7,131 | | | $ | 154,072 | | | $ | 489,135 | |
| | | | | | | | | | | | | | | | | | | | | | | | |
| | | | | | | | | | | | | | | | | | | | | | | | |
For the year ended December 31, 2014 | |
Puerto Rico - Covered Loans | |
(In thousands) | | Commercial | | | Construction | | | Mortgage | | | Leasing | | | Consumer | | | Total | |
Allowance for credit losses: | | | | | | | | | | | | | | | | | | | | | | | | |
Beginning balance | | $ | 42,198 | | | $ | 19,491 | | | $ | 36,006 | | | $ | — | | | $ | 4,397 | | | $ | 102,092 | |
Provision (reversal of provision) | | | 21,579 | | | | 15,397 | | | | 13,384 | | | | — | | | | (4,225 | ) | | | 46,135 | |
Charge-offs | | | (34,741 | ) | | | (36,223 | ) | | | (9,156 | ) | | | — | | | | 2,589 | | | | (77,531 | ) |
Recoveries | | | 1,835 | | | | 8,537 | | | | 714 | | | | — | | | | 291 | | | | 11,377 | |
| | | | | | | | | | | | | | | | | | | | | | | | |
Ending balance | | $ | 30,871 | | | $ | 7,202 | | | $ | 40,948 | | | $ | — | | | $ | 3,052 | | | $ | 82,073 | |
| | | | | | | | | | | | | | | | | | | | | | | | |
165
| | | | | | | | | | | | | | | | | | | | | | | | |
For the year ended December 31, 2014 | |
U.S. Mainland - Continuing Operations | |
(In thousands) | | Commercial | | | Construction | | | Mortgage | | | Legacy | | | Consumer | | | Total | |
Allowance for credit losses: | | | | | | | | | | | | | | | | | | | | | | | | |
Beginning balance | | $ | 24,930 | | | $ | 214 | | | $ | 26,599 | | | $ | 11,335 | | | $ | 19,205 | | | $ | 82,283 | |
Allowance transferred from discontinued operations | | | 7,984 | | | | — | | | | — | | | | — | | | | — | | | | 7,984 | |
Provision (reversal of provision) | | | (2,979 | ) | | | 736 | | | | (15,410 | ) | | | (8,611 | ) | | | 7,414 | | | | (18,850 | ) |
Charge-offs | | | (16,628 | ) | | | — | | | | (3,517 | ) | | | (8,071 | ) | | | (15,948 | ) | | | (44,164 | ) |
Recoveries | | | 15,523 | | | | 237 | | | | 2,321 | | | | 17,141 | | | | 3,783 | | | | 39,005 | |
| | | | | | |
Net (write-down) recovery related to loans transferred to LHFS | | | (19,182 | ) | | | — | | | | (7,531 | ) | | | (8,850 | ) | | | (111 | ) | | | (35,674 | ) |
| | | | | | | | | | | | | | | | | | | | | | | | |
Ending balance | | $ | 9,648 | | | $ | 1,187 | | | $ | 2,462 | | | $ | 2,944 | | | $ | 14,343 | | | $ | 30,584 | |
| | | | | | | | | | | | | | | | | | | | | | | | |
|
For the year ended December 31, 2014 | |
U.S. Mainland - Discontinued Operations | |
(In thousands) | | Commercial | | | Construction | | | Mortgage | | | Legacy | | | Consumer | | | Total | |
Allowance for credit losses: | | | | | | | | | | | | | | | | | | | | | | | | |
Beginning balance | | $ | 21,902 | | | $ | 33 | | | $ | — | | | $ | 2,369 | | | $ | 5,101 | | | $ | 29,405 | |
Allowance transferred to continuing operations | | | (7,984 | ) | | | — | | | | — | | | | — | | | | — | | | | (7,984 | ) |
Provision (reversal of provision) | | | (2,831 | ) | | | (226 | ) | | | — | | | | (1,812 | ) | | | (1,895 | ) | | | (6,764 | ) |
Charge-offs | | | (2,995 | ) | | | — | | | | — | | | | (557 | ) | | | (900 | ) | | | (4,452 | ) |
Recoveries | | | 8,283 | | | | 220 | | | | — | | | | 1,400 | | | | 94 | | | | 9,997 | |
| | | | | | |
Net write-downs related to loans transferred to discontinued operations | | | (16,375 | ) | | | (27 | ) | | | — | | | | (1,400 | ) | | | (2,400 | ) | | | (20,202 | ) |
| | | | | | | | | | | | | | | | | | | | | | | | |
Ending balance | | $ | — | | | $ | — | | | $ | — | | | $ | — | | | $ | — | | | $ | — | |
| | | | | | | | | | | | | | | | | | | | | | | | |
| | | | | | | | | | | | | | | | | | | | | | | | | | | | |
For the year ended December 31, 2014 | |
Popular, Inc. | |
(In thousands) | | Commercial | | | Construction | | | Mortgage | | | Legacy | | | Leasing | | | Consumer | | | Total | |
Allowance for credit losses: | | | | | | | | | | | | | | | | | | | | | | | | | | | | |
Beginning balance | | $ | 217,180 | | | $ | 24,833 | | | $ | 192,935 | | | $ | 13,704 | | | $ | 10,622 | | | $ | 181,281 | | | $ | 640,555 | |
Provision (reversal of provision) | | | 128,590 | | | | 12,786 | | | | 32,504 | | | | (10,423 | ) | | | 470 | | | | 99,443 | | | | 263,370 | |
Charge-offs | | | (124,766 | ) | | | (37,945 | ) | | | (58,062 | ) | | | (8,628 | ) | | | (6,028 | ) | | | (136,659 | ) | | | (372,088 | ) |
Recoveries | | | 56,661 | | | | 14,225 | | | | 4,424 | | | | 18,541 | | | | 2,067 | | | | 29,913 | | | | 125,831 | |
| | | | | | | |
Net write-down related to loans transferred to LHFS | | | (19,182 | ) | | | — | | | | (7,531 | ) | | | (8,850 | ) | | | — | | | | (111 | ) | | | (35,674 | ) |
| | | | | | | |
Net write-downs related to loans transferred to discontinued operations | | | (16,375 | ) | | | (27 | ) | | | — | | | | (1,400 | ) | | | — | | | | (2,400 | ) | | | (20,202 | ) |
| | | | | | | | | | | | | | | | | | | | | | | | | | | | |
Ending balance | | $ | 242,108 | | | $ | 13,872 | | | $ | 164,270 | | | $ | 2,944 | | | $ | 7,131 | | | $ | 171,467 | | | $ | 601,792 | |
| | | | | | | | | | | | | | | | | | | | | | | | | | | | |
The following table provides the activity in the allowance for loan losses related to Westernbank loans accounted for pursuant to ASC Subtopic 310-30.
| | | | | | | | |
| | | ASC 310-30 Westernbank loans | |
| | | For the years ended | |
(In thousands) | | December 31, 2015 | | | December 31, 2014 | |
Balance at beginning of period | | $ | 78,846 | | | $ | 93,915 | |
Provision for loan losses | | | 46,643 | | | | 48,559 | |
Net charge-offs | | | (61,926 | ) | | | (63,628 | ) |
| | | | | | | | |
Balance at end of period | | $ | 63,563 | | | $ | 78,846 | |
| | | | | | | | |
166
The following tables present information at December 31, 2015 and December 31, 2014 regarding loan ending balances and the allowance for loan losses by portfolio segment and whether such loans and the allowance pertains to loans individually or collectively evaluated for impairment.
| | | | | | | | | | | | | | | | | | | | | | | | |
At December 31, 2015 | |
Puerto Rico | |
(In thousands) | | Commercial | | | Construction | | | Mortgage | | | Leasing | | | Consumer | | | Total | |
Allowance for credit losses: | | | | | | | | | | | | | | | | | | | | | | | | |
Specific ALLL non-covered loans | | $ | 49,243 | | | $ | 264 | | | $ | 42,965 | | | $ | 573 | | | $ | 23,478 | | | $ | 116,523 | |
General ALLL non-covered loans | | | 137,682 | | | | 4,693 | | | | 85,362 | | | | 10,420 | | | | 115,243 | | | | 353,400 | |
| | | | | | | | | | | | | | | | | | | | | | | | |
ALLL - non-covered loans | | | 186,925 | | | | 4,957 | | | | 128,327 | | | | 10,993 | | | | 138,721 | | | | 469,923 | |
| | | | | | | | | | | | | | | | | | | | | | | | |
Specific ALLL covered loans | | | — | | | | — | | | | — | | | | — | | | | — | | | | — | |
General ALLL covered loans | | | — | | | | — | | | | 33,967 | | | | — | | | | 209 | | | | 34,176 | |
| | | | | | | | | | | | | | | | | | | | | | | | |
ALLL - covered loans | | | — | | | | — | | | | 33,967 | | | | — | | | | 209 | | | | 34,176 | |
| | | | | | | | | | | | | | | | | | | | | | | | |
Total ALLL | | $ | 186,925 | | | $ | 4,957 | | | $ | 162,294 | | | $ | 10,993 | | | $ | 138,930 | | | $ | 504,099 | |
| | | | | | | | | | | | | | | | | | | | | | | | |
| | | | | | |
Loans held-in-portfolio: | | | | | | | | | | | | | | | | | | | | | | | | |
Impaired non-covered loans | | $ | 337,133 | | | $ | 2,481 | | | $ | 465,117 | | | $ | 2,404 | | | $ | 109,660 | | | $ | 916,795 | |
Non-covered loans held-in-portfolio excluding impaired loans | | | 7,031,086 | | | | 98,467 | | | | 5,662,374 | | | | 625,246 | | | | 3,236,642 | | | | 16,653,815 | |
| | | | | | | | | | | | | | | | | | | | | | | | |
Non-covered loans held-in-portfolio | | | 7,368,219 | | | | 100,948 | | | | 6,127,491 | | | | 627,650 | | | | 3,346,302 | | | | 17,570,610 | |
| | | | | | | | | | | | | | | | | | | | | | | | |
Impaired covered loans | | | — | | | | — | | | | — | | | | — | | | | — | | | | — | |
Covered loans held-in-portfolio excluding impaired loans | | | — | | | | — | | | | 627,102 | | | | — | | | | 19,013 | | | | 646,115 | |
| | | | | | | | | | | | | | | | | | | | | | | | |
Covered loans held-in-portfolio | | | — | | | | — | | | | 627,102 | | | | — | | | | 19,013 | | | | 646,115 | |
| | | | | | | | | | | | | | | | | | | | | | | | |
Total loans held-in-portfolio | | $ | 7,368,219 | | | $ | 100,948 | | | $ | 6,754,593 | | | $ | 627,650 | | | $ | 3,365,315 | | | $ | 18,216,725 | |
| | | | | | | | | | | | | | | | | | | | | | | | |
| | | | | | | | | | | | | | | | | | | | | | | | |
At December 31, 2015 | |
U.S. Mainland | |
(In thousands) | | Commercial | | | Construction | | | Mortgage | | | Legacy | | | Consumer | | | Total | |
Allowance for credit losses: | | | | | | | | | | | | | | | | | | | | | | | | |
Specific ALLL | | $ | — | | | $ | — | | | $ | 1,064 | | | $ | — | | | $ | 485 | | | $ | 1,549 | |
General ALLL | | | 9,908 | | | | 3,912 | | | | 3,921 | | | | 2,687 | | | | 11,035 | | | | 31,463 | |
| | | | | | | | | | | | | | | | | | | | | | | | |
Total ALLL | | $ | 9,908 | | | $ | 3,912 | | | $ | 4,985 | | | $ | 2,687 | | | $ | 11,520 | | | $ | 33,012 | |
| | | | | | | | | | | | | | | | | | | | | | | | |
| | | | | | |
Loans held-in-portfolio: | | | | | | | | | | | | | | | | | | | | | | | | |
Impaired loans | | $ | — | | | $ | — | | | $ | 6,815 | | | $ | — | | | $ | 2,176 | | | $ | 8,991 | |
Loans held-in-portfolio, excluding impaired loans | | | 2,730,944 | | | | 580,158 | | | | 901,775 | | | | 64,436 | | | | 489,201 | | | | 4,766,514 | |
| | | | | | | | | | | | | | | | | | | | | | | | |
Total loans held-in-portfolio | | $ | 2,730,944 | | | $ | 580,158 | | | $ | 908,590 | | | $ | 64,436 | | | $ | 491,377 | | | $ | 4,775,505 | |
| | | | | | | | | | | | | | | | | | | | | | | | |
167
| | | | | | | | | | | | | | | | | | | | | | | | | | | | |
At December 31, 2015 | |
Popular, Inc. | |
(In thousands) | | Commercial | | | Construction | | | Mortgage | | | Legacy | | | Leasing | | | Consumer | | | Total | |
Allowance for credit losses: | | | | | | | | | | | | | | | | | | | | | | | | | | | | |
Specific ALLL non-covered loans | | $ | 49,243 | | | $ | 264 | | | $ | 44,029 | | | $ | — | | | $ | 573 | | | $ | 23,963 | | | $ | 118,072 | |
General ALLL non-covered loans | | | 147,590 | | | | 8,605 | | | | 89,283 | | | | 2,687 | | | | 10,420 | | | | 126,278 | | | | 384,863 | |
| | | | | | | | | | | | | | | | | | | | | | | | | | | | |
ALLL - non-covered loans | | | 196,833 | | | | 8,869 | | | | 133,312 | | | | 2,687 | | | | 10,993 | | | | 150,241 | | | | 502,935 | |
| | | | | | | | | | | | | | | | | | | | | | | | | | | | |
Specific ALLL covered loans | | | — | | | | — | | | | — | | | | — | | | | — | | | | — | | | | — | |
General ALLL covered loans | | | — | | | | — | | | | 33,967 | | | | — | | | | — | | | | 209 | | | | 34,176 | |
| | | | | | | | | | | | | | | | | | | | | | | | | | | | |
ALLL - covered loans | | | — | | | | — | | | | 33,967 | | | | — | | | | — | | | | 209 | | | | 34,176 | |
| | | | | | | | | | | | | | | | | | | | | | | | | | | | |
Total ALLL | | $ | 196,833 | | | $ | 8,869 | | | $ | 167,279 | | | $ | 2,687 | | | $ | 10,993 | | | $ | 150,450 | | | $ | 537,111 | |
| | | | | | | | | | | | | | | | | | | | | | | | | | | | |
| | | | | | | |
Loans held-in-portfolio: | | | | | | | | | | | | | | | | | | | | | | | | | | | | |
Impaired non-covered loans | | $ | 337,133 | | | $ | 2,481 | | | $ | 471,932 | | | $ | — | | | $ | 2,404 | | | $ | 111,836 | | | $ | 925,786 | |
Non-covered loans held-in-portfolio excluding impaired loans | | | 9,762,030 | | | | 678,625 | | | | 6,564,149 | | | | 64,436 | | | | 625,246 | | | | 3,725,843 | | | | 21,420,329 | |
| | | | | | | | | | | | | | | | | | | | | | | | | | | | |
Non-covered loans held-in-portfolio | | | 10,099,163 | | | | 681,106 | | | | 7,036,081 | | | | 64,436 | | | | 627,650 | | | | 3,837,679 | | | | 22,346,115 | |
| | | | | | | | | | | | | | | | | | | | | | | | | | | | |
Impaired covered loans | | | — | | | | — | | | | — | | | | — | | | | — | | | | — | | | | — | |
Covered loans held-in-portfolio excluding impaired loans | | | — | | | | — | | | | 627,102 | | | | — | | | | — | | | | 19,013 | | | | 646,115 | |
| | | | | | | | | | | | | | | | | | | | | | | | | | | | |
Covered loans held-in-portfolio | | | — | | | | — | | | | 627,102 | | | | — | | | | — | | | | 19,013 | | | | 646,115 | |
| | | | | | | | | | | | | | | | | | | | | | | | | | | | |
Total loans held-in-portfolio | | $ | 10,099,163 | | | $ | 681,106 | | | $ | 7,663,183 | | | $ | 64,436 | | | $ | 627,650 | | | $ | 3,856,692 | | | $ | 22,992,230 | |
| | | | | | | | | | | | | | | | | | | | | | | | | | | | |
| | | | | | | | | | | | | | | | | | | | | | | | |
At December 31, 2014 | |
Puerto Rico | |
(In thousands) | | Commercial | | | Construction | | | Mortgage | | | Leasing | | | Consumer | | | Total | |
Allowance for credit losses: | | | | | | | | | | | | | | | | | | | | | | | | |
Specific ALLL non-covered loans | | $ | 64,736 | | | $ | 363 | | | $ | 45,838 | | | $ | 770 | | | $ | 27,796 | | | $ | 139,503 | |
General ALLL non-covered loans | | | 136,853 | | | | 5,120 | | | | 75,022 | | | | 6,361 | | | | 126,276 | | | | 349,632 | |
| | | | | | | | | | | | | | | | | | | | | | | | |
ALLL - non-covered loans | | | 201,589 | | | | 5,483 | | | | 120,860 | | | | 7,131 | | | | 154,072 | | | | 489,135 | |
| | | | | | | | | | | | | | | | | | | | | | | | |
Specific ALLL covered loans | | | 5 | | | | — | | | | — | | | | — | | | | — | | | | 5 | |
General ALLL covered loans | | | 30,866 | | | | 7,202 | | | | 40,948 | | | | — | | | | 3,052 | | | | 82,068 | |
| | | | | | | | | | | | | | | | | | | | | | | | |
ALLL - covered loans | | | 30,871 | | | | 7,202 | | | | 40,948 | | | | — | | | | 3,052 | | | | 82,073 | |
| | | | | | | | | | | | | | | | | | | | | | | | |
Total ALLL | | $ | 232,460 | | | $ | 12,685 | | | $ | 161,808 | | | $ | 7,131 | | | $ | 157,124 | | | $ | 571,208 | |
| | | | | | | | | | | | | | | | | | | | | | | | |
| | | | | | |
Loans held-in-portfolio: | | | | | | | | | | | | | | | | | | | | | | | | |
Impaired non-covered loans | | $ | 356,911 | | | $ | 13,268 | | | $ | 431,569 | | | $ | 3,023 | | | $ | 115,759 | | | $ | 920,530 | |
Non-covered loans held-in-portfolio excluding impaired loans | | | 6,017,892 | | | | 146,116 | | | | 5,018,932 | | | | 561,366 | | | | 3,273,278 | | | | 15,017,584 | |
| | | | | | | | | | | | | | | | | | | | | | | | |
Non-covered loans held-in-portfolio | | | 6,374,803 | | | | 159,384 | | | | 5,450,501 | | | | 564,389 | | | | 3,389,037 | | | | 15,938,114 | |
| | | | | | | | | | | | | | | | | | | | | | | | |
Impaired covered loans | | | 4,487 | | | | 2,419 | | | | — | | | | — | | | | — | | | | 6,906 | |
Covered loans held-in-portfolio excluding impaired loans | | | 1,610,294 | | | | 67,917 | | | | 822,986 | | | | — | | | | 34,559 | | | | 2,535,756 | |
| | | | | | | | | | | | | | | | | | | | | | | | |
Covered loans held-in-portfolio | | | 1,614,781 | | | | 70,336 | | | | 822,986 | | | | — | | | | 34,559 | | | | 2,542,662 | |
| | | | | | | | | | | | | | | | | | | | | | | | |
Total loans held-in-portfolio | | $ | 7,989,584 | | | $ | 229,720 | | | $ | 6,273,487 | | | $ | 564,389 | | | $ | 3,423,596 | | | $ | 18,480,776 | |
| | | | | | | | | | | | | | | | | | | | | | | | |
168
| | | | | | | | | | | | | | | | | | | | | | | | |
At December 31, 2014 | |
U.S. Mainland | |
(In thousands) | | Commercial | | | Construction | | | Mortgage | | | Legacy | | | Consumer | | | Total | |
Allowance for credit losses: | | | | | | | | | | | | | | | | | | | | | | | | |
Specific ALLL | | $ | — | | | $ | — | | | $ | 273 | | | $ | — | | | $ | 365 | | | $ | 638 | |
General ALLL | | | 9,648 | | | | 1,187 | | | | 2,189 | | | | 2,944 | | | | 13,978 | | | | 29,946 | |
| | | | | | | | | | | | | | | | | | | | | | | | |
Total ALLL | | $ | 9,648 | | | $ | 1,187 | | | $ | 2,462 | | | $ | 2,944 | | | $ | 14,343 | | | $ | 30,584 | |
| | | | | | | | | | | | | | | | | | | | | | | | |
| | | | | | |
Loans held-in-portfolio: | | | | | | | | | | | | | | | | | | | | | | | | |
Impaired loans | | $ | 250 | | | $ | — | | | $ | 4,255 | | | $ | — | | | $ | 1,973 | | | $ | 6,478 | |
Loans held-in-portfolio, excluding impaired loans | | | 1,759,214 | | | | 92,436 | | | | 1,048,130 | | | | 80,818 | | | | 479,261 | | | | 3,459,859 | |
| | | | | | | | | | | | | | | | | | | | | | | | |
Total loans held-in-portfolio | | $ | 1,759,464 | | | $ | 92,436 | | | $ | 1,052,385 | | | $ | 80,818 | | | $ | 481,234 | | | $ | 3,466,337 | |
| | | | | | | | | | | | | | | | | | | | | | | | |
| | | | | | | | | | | | | | | | | | | | | | | | | | | | |
At December 31, 2014 | |
Popular, Inc. | |
(In thousands) | | Commercial | | | Construction | | | Mortgage | | | Legacy | | | Leasing | | | Consumer | | | Total | |
Allowance for credit losses: | | | | | | | | | | | | | | | | | | | | | | | | | | | | |
Specific ALLL non-covered loans | | $ | 64,736 | | | $ | 363 | | | $ | 46,111 | | | $ | — | | | $ | 770 | | | $ | 28,161 | | | $ | 140,141 | |
General ALLL non-covered loans | | | 146,501 | | | | 6,307 | | | | 77,211 | | | | 2,944 | | | | 6,361 | | | | 140,254 | | | | 379,578 | |
| | | | | | | | | | | | | | | | | | | | | | | | | | | | |
ALLL - non-covered loans | | | 211,237 | | | | 6,670 | | | | 123,322 | | | | 2,944 | | | | 7,131 | | | | 168,415 | | | | 519,719 | |
| | | | | | | | | | | | | | | | | | | | | | | | | | | | |
Specific ALLL covered loans | | | 5 | | | | — | | | | — | | | | — | | | | — | | | | — | | | | 5 | |
General ALLL covered loans | | | 30,866 | | | | 7,202 | | | | 40,948 | | | | — | | | | — | | | | 3,052 | | | | 82,068 | |
| | | | | | | | | | | | | | | | | | | | | | | | | | | | |
ALLL - covered loans | | | 30,871 | | | | 7,202 | | | | 40,948 | | | | — | | | | — | | | | 3,052 | | | | 82,073 | |
| | | | | | | | | | | | | | | | | | | | | | | | | | | | |
Total ALLL | | $ | 242,108 | | | $ | 13,872 | | | $ | 164,270 | | | $ | 2,944 | | | $ | 7,131 | | | $ | 171,467 | | | $ | 601,792 | |
| | | | | | | | | | | | | | | | | | | | | | | | | | | | |
| | | | | | | |
Loans held-in-portfolio: | | | | | | | | | | | | | | | | | | | | | | | | | | | | |
Impaired non-covered loans | | $ | 357,161 | | | $ | 13,268 | | | $ | 435,824 | | | $ | — | | | $ | 3,023 | | | $ | 117,732 | | | $ | 927,008 | |
Non-covered loans held-in-portfolio excluding impaired loans | | | 7,777,106 | | | | 238,552 | | | | 6,067,062 | | | | 80,818 | | | | 561,366 | | | | 3,752,539 | | | | 18,477,443 | |
| | | | | | | | | | | | | | | | | | | | | | | | | | | | |
Non-covered loans held-in-portfolio | | | 8,134,267 | | | | 251,820 | | | | 6,502,886 | | | | 80,818 | | | | 564,389 | | | | 3,870,271 | | | | 19,404,451 | |
| | | | | | | | | | | | | | | | | | | | | | | | | | | | |
Impaired covered loans | | | 4,487 | | | | 2,419 | | | | — | | | | — | | | | — | | | | — | | | | 6,906 | |
Covered loans held-in-portfolio excluding impaired loans | | | 1,610,294 | | | | 67,917 | | | | 822,986 | | | | — | | | | — | | | | 34,559 | | | | 2,535,756 | |
| | | | | | | | | | | | | | | | | | | | | | | | | | | | |
Covered loans held-in-portfolio | | | 1,614,781 | | | | 70,336 | | | | 822,986 | | | | — | | | | — | | | | 34,559 | | | | 2,542,662 | |
| | | | | | | | | | | | | | | | | | | | | | | | | | | | |
Total loans held-in-portfolio | | $ | 9,749,048 | | | $ | 322,156 | | | $ | 7,325,872 | | | $ | 80,818 | | | $ | 564,389 | | | $ | 3,904,830 | | | $ | 21,947,113 | |
| | | | | | | | | | | | | | | | | | | | | | | | | | | | |
169
Impaired loans
The following tables present loans individually evaluated for impairment at December 31, 2015 and December 31, 2014.
| | | | | | | | | | | | | | | | | | | | | | | | | | | | | | | | |
December 31, 2015 | |
Puerto Rico | |
| | | Impaired Loans – With an | | | Impaired Loans | | | | | | | | | | |
| | | Allowance | | | With No Allowance | | | Impaired Loans - Total | |
| | | | | | Unpaid | | | | | | | | | Unpaid | | | | | | Unpaid | | | | |
| | | Recorded | | | principal | | | Related | | | Recorded | | | principal | | | Recorded | | | principal | | | Related | |
(In thousands) | | investment | | | balance | | | allowance | | | investment | | | balance | | | investment | | | balance | | | allowance | |
Commercial real estate non-owner occupied | | $ | 102,199 | | | $ | 106,466 | | | $ | 30,980 | | | $ | 13,779 | | | $ | 23,896 | | | $ | 115,978 | | | $ | 130,362 | | | $ | 30,980 | |
Commercial real estate owner occupied | | | 118,253 | | | | 137,193 | | | | 12,564 | | | | 38,955 | | | | 63,383 | | | | 157,208 | | | | 200,576 | | | | 12,564 | |
Commercial and industrial | | | 42,043 | | | | 43,629 | | | | 5,699 | | | | 21,904 | | | | 32,922 | | | | 63,947 | | | | 76,551 | | | | 5,699 | |
Construction | | | 2,481 | | | | 7,878 | | | | 264 | | | | — | | | | — | | | | 2,481 | | | | 7,878 | | | | 264 | |
Mortgage | | | 424,885 | | | | 468,240 | | | | 42,965 | | | | 40,232 | | | | 45,881 | | | | 465,117 | | | | 514,121 | | | | 42,965 | |
Leasing | | | 2,404 | | | | 2,404 | | | | 573 | | | | — | | | | — | | | | 2,404 | | | | 2,404 | | | | 573 | |
Consumer: | | | | | | | | | | | | | | | | | | | | | | | | | | | | | | | | |
Credit cards | | | 38,734 | | | | 38,734 | | | | 6,675 | | | | — | | | | — | | | | 38,734 | | | | 38,734 | | | | 6,675 | |
Personal | | | 68,509 | | | | 68,509 | | | | 16,365 | | | | — | | | | — | | | | 68,509 | | | | 68,509 | | | | 16,365 | |
Auto | | | 1,893 | | | | 1,893 | | | | 338 | | | | — | | | | — | | | | 1,893 | | | | 1,893 | | | | 338 | |
Other | | | 524 | | | | 525 | | | | 100 | | | | — | | | | — | | | | 524 | | | | 525 | | | | 100 | |
| | | | | | | | | | | | | | | | | | | | | | | | | | | | | | | | |
Total Puerto Rico | | $ | 801,925 | | | $ | 875,471 | | | $ | 116,523 | | | $ | 114,870 | | | $ | 166,082 | | | $ | 916,795 | | | $ | 1,041,553 | | | $ | 116,523 | |
| | | | | | | | | | | | | | | | | | | | | | | | | | | | | | | | |
| | | | | | | | | | | | | | | | | | | | | | | | | | | | | | | | |
December 31, 2015 | |
U.S. mainland | |
| | | Impaired Loans – With an | | | Impaired Loans | | | | | | | | | | |
| | | Allowance | | | With No Allowance | | | Impaired Loans - Total | |
| | | | | | Unpaid | | | | | | | | | Unpaid | | | | | | Unpaid | | | | |
| | | Recorded | | | principal | | | Related | | | Recorded | | | principal | | | Recorded | | | principal | | | Related | |
(In thousands) | | investment | | | balance | | | allowance | | | investment | | | balance | | | investment | | | balance | | | allowance | |
Mortgage | | $ | 4,143 | | | $ | 5,018 | | | $ | 1,064 | | | $ | 2,672 | | | $ | 3,574 | | | $ | 6,815 | | | $ | 8,592 | | | $ | 1,064 | |
Consumer: | | | | | | | | | | | | | | | | | | | | | | | | | | | | | | | | |
HELOCs | | | 778 | | | | 796 | | | | 259 | | | | 783 | | | | 783 | | | | 1,561 | | | | 1,579 | | | | 259 | |
Personal | | | 534 | | | | 534 | | | | 226 | | | | 81 | | | | 81 | | | | 615 | | | | 615 | | | | 226 | |
| | | | | | | | | | | | | | | | | | | | | | | | | | | | | | | | |
Total U.S. mainland | | $ | 5,455 | | | $ | 6,348 | | | $ | 1,549 | | | $ | 3,536 | | | $ | 4,438 | | | $ | 8,991 | | | $ | 10,786 | | | $ | 1,549 | |
| | | | | | | | | | | | | | | | | | | | | | | | | | | | | | | | |
| | | | | | | | | | | | | | | | | | | | | | | | | | | | | | | | |
December 31, 2015 | |
Popular, Inc. | |
| | | Impaired Loans – With an | | | Impaired Loans | | | | | | | | | | |
| | | Allowance | | | With No Allowance | | | Impaired Loans - Total | |
| | | | | | Unpaid | | | | | | | | | Unpaid | | | | | | Unpaid | | | | |
| | | Recorded | | | principal | | | Related | | | Recorded | | | principal | | | Recorded | | | principal | | | Related | |
(In thousands) | | investment | | | balance | | | allowance | | | investment | | | balance | | | investment | | | balance | | | allowance | |
Commercial real estate non-owner occupied | | $ | 102,199 | | | $ | 106,466 | | | $ | 30,980 | | | $ | 13,779 | | | $ | 23,896 | | | $ | 115,978 | | | $ | 130,362 | | | $ | 30,980 | |
Commercial real estate owner occupied | | | 118,253 | | | | 137,193 | | | | 12,564 | | | | 38,955 | | | | 63,383 | | | | 157,208 | | | | 200,576 | | | | 12,564 | |
Commercial and industrial | | | 42,043 | | | | 43,629 | | | | 5,699 | | | | 21,904 | | | | 32,922 | | | | 63,947 | | | | 76,551 | | | | 5,699 | |
Construction | | | 2,481 | | | | 7,878 | | | | 264 | | | | — | | | | — | | | | 2,481 | | | | 7,878 | | | | 264 | |
Mortgage | | | 429,028 | | | | 473,258 | | | | 44,029 | | | | 42,904 | | | | 49,455 | | | | 471,932 | | | | 522,713 | | | | 44,029 | |
Leasing | | | 2,404 | | | | 2,404 | | | | 573 | | | | — | | | | — | | | | 2,404 | | | | 2,404 | | | | 573 | |
Consumer: | | | | | | | | | | | | | | | | | | | | | | | | | | | | | | | | |
Credit Cards | | | 38,734 | | | | 38,734 | | | | 6,675 | | | | — | | | | — | | | | 38,734 | | | | 38,734 | | | | 6,675 | |
HELOCs | | | 778 | | | | 796 | | | | 259 | | | | 783 | | | | 783 | | | | 1,561 | | | | 1,579 | | | | 259 | |
Personal | | | 69,043 | | | | 69,043 | | | | 16,591 | | | | 81 | | | | 81 | | | | 69,124 | | | | 69,124 | | | | 16,591 | |
Auto | | | 1,893 | | | | 1,893 | | | | 338 | | | | — | | | | — | | | | 1,893 | | | | 1,893 | | | | 338 | |
Other | | | 524 | | | | 525 | | | | 100 | | | | — | | | | — | | | | 524 | | | | 525 | | | | 100 | |
| | | | | | | | | | | | | | | | | | | | | | | | | | | | | | | | |
Total Popular, Inc. | | $ | 807,380 | | | $ | 881,819 | | | $ | 118,072 | | | $ | 118,406 | | | $ | 170,520 | | | $ | 925,786 | | | $ | 1,052,339 | | | $ | 118,072 | |
| | | | | | | | | | | | | | | | | | | | | | | | | | | | | | | | |
170
| | | | | | | | | | | | | | | | | | | | | | | | | | | | | | | | |
December 31, 2014 | |
Puerto Rico | |
| | | Impaired Loans – With an | | | Impaired Loans | | | | | | | | | | |
| | | Allowance | | | With No Allowance | | | Impaired Loans - Total | |
| | | | | | Unpaid | | | | | | | | | Unpaid | | | | | | Unpaid | | | | |
| | | Recorded | | | principal | | | Related | | | Recorded | | | principal | | | Recorded | | | principal | | | Related | |
(In thousands) | | investment | | | balance | | | allowance | | | investment | | | balance | | | investment | | | balance | | | allowance | |
Commercial real estate non-owner occupied | | $ | 50,324 | | | $ | 53,154 | | | $ | 5,182 | | | $ | 7,929 | | | $ | 7,929 | | | $ | 58,253 | | | $ | 61,083 | | | $ | 5,182 | |
Commercial real estate owner occupied | | | 114,163 | | | | 127,855 | | | | 16,770 | | | | 14,897 | | | | 16,110 | | | | 129,060 | | | | 143,965 | | | | 16,770 | |
Commercial and industrial | | | 145,633 | | | | 148,204 | | | | 42,784 | | | | 23,965 | | | | 31,722 | | | | 169,598 | | | | 179,926 | | | | 42,784 | |
Construction | | | 2,575 | | | | 7,980 | | | | 363 | | | | 10,693 | | | | 28,994 | | | | 13,268 | | | | 36,974 | | | | 363 | |
Mortgage | | | 395,911 | | | | 426,502 | | | | 45,838 | | | | 35,658 | | | | 39,248 | | | | 431,569 | | | | 465,750 | | | | 45,838 | |
Leasing | | | 3,023 | | | | 3,023 | | | | 770 | | | | — | | | | — | | | | 3,023 | | | | 3,023 | | | | 770 | |
Consumer: | | | | | | | | | | | | | | | | | | | | | | | | | | | | | | | | |
Credit cards | | | 41,477 | | | | 41,477 | | | | 8,023 | | | | — | | | | — | | | | 41,477 | | | | 41,477 | | | | 8,023 | |
Personal | | | 71,825 | | | | 71,825 | | | | 19,410 | | | | — | | | | — | | | | 71,825 | | | | 71,825 | | | | 19,410 | |
Auto | | | 1,932 | | | | 1,932 | | | | 262 | | | | — | | | | — | | | | 1,932 | | | | 1,932 | | | | 262 | |
Other | | | 525 | | | | 525 | | | | 101 | | | | — | | | | — | | | | 525 | | | | 525 | | | | 101 | |
Covered loans | | | 2,419 | | | | 7,500 | | | | 5 | | | | 4,487 | | | | 4,487 | | | | 6,906 | | | | 11,987 | | | | 5 | |
| | | | | | | | | | | | | | | | | | | | | | | | | | | | | | | | |
Total Puerto Rico | | $ | 829,807 | | | $ | 889,977 | | | $ | 139,508 | | | $ | 97,629 | | | $ | 128,490 | | | $ | 927,436 | | | $ | 1,018,467 | | | $ | 139,508 | |
| | | | | | | | | | | | | | | | | | | | | | | | | | | | | | | | |
| | | | | | | | | | | | | | | | | | | | | | | | | | | | | | | | |
December 31, 2014 | |
U.S. mainland | |
| | | Impaired Loans – With an | | | Impaired Loans | | | | | | | | | | |
| | | Allowance | | | With No Allowance | | | Impaired Loans - Total | |
| | | | | | Unpaid | | | | | | | | | Unpaid | | | | | | Unpaid | | | | |
| | | Recorded | | | principal | | | Related | | | Recorded | | | principal | | | Recorded | | | principal | | | Related | |
(In thousands) | | investment | | | balance | | | allowance | | | investment | | | balance | | | investment | | | balance | | | allowance | |
Commercial and industrial | | $ | — | | | $ | — | | | $ | — | | | $ | 250 | | | $ | 250 | | | $ | 250 | | | $ | 250 | | | $ | — | |
Mortgage | | | 3,049 | | | | 3,443 | | | | 273 | | | | 1,206 | | | | 2,306 | | | | 4,255 | | | | 5,749 | | | | 273 | |
Consumer: | | | | | | | | | | | | | | | | | | | | | | | | | | | | | | | | |
HELOCs | | | 1,095 | | | | 1,095 | | | | 362 | | | | 791 | | | | 791 | | | | 1,886 | | | | 1,886 | | | | 362 | |
Other | | | 3 | | | | 3 | | | | 3 | | | | 84 | | | | — | | | | 87 | | | | 3 | | | | 3 | |
| | | | | | | | | | | | | | | | | | | | | | | | | | | | | | | | |
Total U.S. mainland | | $ | 4,147 | | | $ | 4,541 | | | $ | 638 | | | $ | 2,331 | | | $ | 3,347 | | | $ | 6,478 | | | $ | 7,888 | | | $ | 638 | |
| | | | | | | | | | | | | | | | | | | | | | | | | | | | | | | | |
| | | | | | | | | | | | | | | | | | | | | | | | | | | | | | | | |
December 31, 2014 | |
Popular, Inc. | |
| | | Impaired Loans – With an | | | Impaired Loans | | | | | | | | | | |
| | | Allowance | | | With No Allowance | | | Impaired Loans - Total | |
| | | | | | Unpaid | | | | | | | | | Unpaid | | | | | | Unpaid | | | | |
| | | Recorded | | | principal | | | Related | | | Recorded | | | principal | | | Recorded | | | principal | | | Related | |
(In thousands) | | investment | | | balance | | | allowance | | | investment | | | balance | | | investment | | | balance | | | allowance | |
Commercial real estate non-owner occupied | | $ | 50,324 | | | $ | 53,154 | | | $ | 5,182 | | | $ | 7,929 | | | $ | 7,929 | | | $ | 58,253 | | | $ | 61,083 | | | $ | 5,182 | |
Commercial real estate owner occupied | | | 114,163 | | | | 127,855 | | | | 16,770 | | | | 14,897 | | | | 16,110 | | | | 129,060 | | | | 143,965 | | | | 16,770 | |
Commercial and industrial | | | 145,633 | | | | 148,204 | | | | 42,784 | | | | 24,215 | | | | 31,972 | | | | 169,848 | | | | 180,176 | | | | 42,784 | |
Construction | | | 2,575 | | | | 7,980 | | | | 363 | | | | 10,693 | | | | 28,994 | | | | 13,268 | | | | 36,974 | | | | 363 | |
Mortgage | | | 398,960 | | | | 429,945 | | | | 46,111 | | | | 36,864 | | | | 41,554 | | | | 435,824 | | | | 471,499 | | | | 46,111 | |
Leasing | | | 3,023 | | | | 3,023 | | | | 770 | | | | — | | | | — | | | | 3,023 | | | | 3,023 | | | | 770 | |
Consumer: | | | | | | | | | | | | | | | | | | | | | | | | | | | | | | | | |
Credit Cards | | | 41,477 | | | | 41,477 | | | | 8,023 | | | | — | | | | — | | | | 41,477 | | | | 41,477 | | | | 8,023 | |
HELOCs | | | 1,095 | | | | 1,095 | | | | 362 | | | | 791 | | | | 791 | | | | 1,886 | | | | 1,886 | | | | 362 | |
Personal | | | 71,825 | | | | 71,825 | | | | 19,410 | | | | — | | | | — | | | | 71,825 | | | | 71,825 | | | | 19,410 | |
Auto | | | 1,932 | | | | 1,932 | | | | 262 | | | | — | | | | — | | | | 1,932 | | | | 1,932 | | | | 262 | |
Other | | | 528 | | | | 528 | | | | 104 | | | | 84 | | | | — | | | | 612 | | | | 528 | | | | 104 | |
Covered loans | | | 2,419 | | | | 7,500 | | | | 5 | | | | 4,487 | | | | 4,487 | | | | 6,906 | | | | 11,987 | | | | 5 | |
| | | | | | | | | | | | | | | | | | | | | | | | | | | | | | | | |
Total Popular, Inc. | | $ | 833,954 | | | $ | 894,518 | | | $ | 140,146 | | | $ | 99,960 | | | $ | 131,837 | | | $ | 933,914 | | | $ | 1,026,355 | | | $ | 140,146 | |
| | | | | | | | | | | | | | | | | | | | | | | | | | | | | | | | |
171
The following tables present the average recorded investment and interest income recognized on impaired loans for the years ended December 31, 2015 and 2014.
| | | | | | | | | | | | | | | | | | | | | | | | |
For the years ended December 31, 2015 | |
| | | Puerto Rico | | | U.S. Mainland | | | Popular, Inc. | |
| | | Average | | | Interest | | | Average | | | Interest | | | Average | | | Interest | |
| | | recorded | | | income | | | recorded | | | income | | | recorded | | | income | |
(In thousands) | | investment | | | recognized | | | investment | | | recognized | | | investment | | | recognized | |
Commercial multi-family | | $ | 606 | | | $ | — | | | $ | — | | | $ | — | | | $ | 606 | | | $ | — | |
Commercial real estate non-owner occupied | | | 107,442 | | | | 5,062 | | | | — | | | | — | | | | 107,442 | | | | 5,062 | |
Commercial real estate owner occupied | | | 138,651 | | | | 6,936 | | | | — | | | | — | | | | 138,651 | | | | 6,936 | |
Commercial and industrial | | | 121,315 | | | | 4,001 | | | | 50 | | | | — | | | | 121,365 | | | | 4,001 | |
Construction | | | 6,350 | | | | 88 | | | | — | | | | — | | | | 6,350 | | | | 88 | |
Mortgage | | | 450,122 | | | | 16,128 | | | | 5,279 | | | | 89 | | | | 455,401 | | | | 16,217 | |
Legacy | | | — | | | | — | | | | 509 | | | | — | | | | 509 | | | | — | |
Leasing | | | 2,710 | | | | — | | | | — | | | | — | | | | 2,710 | | | | — | |
Consumer: | | | | | | | | | | | | | | | | | | | | | | | | |
Credit cards | | | 40,239 | | | | — | | | | — | | | | — | | | | 40,239 | | | | — | |
HELOCs | | | — | | | | — | | | | 1,660 | | | | — | | | | 1,660 | | | | — | |
Personal | | | 70,046 | | | | — | | | | 427 | | | | — | | | | 70,473 | | | | — | |
Auto | | | 2,005 | | | | — | | | | — | | | | — | | | | 2,005 | | | | — | |
Other | | | 561 | | | | — | | | | 17 | | | | — | | | | 578 | | | | — | |
Covered loans | | | 3,527 | | | | 153 | | | | — | | | | — | | | | 3,527 | | | | 153 | |
| | | | | | | | | | | | | | | | | | | | | | | | |
Total Popular, Inc. | | $ | 943,574 | | | $ | 32,368 | | | $ | 7,942 | | | $ | 89 | | | $ | 951,516 | | | $ | 32,457 | |
| | | | | | | | | | | | | | | | | | | | | | | | |
| | | | | | | | | | | | | | | | | | | | | | | | |
For the years ended December 31, 2014 | |
| | | Puerto Rico | | | U.S. Mainland | | | Popular, Inc. | |
| | | Average | | | Interest | | | Average | | | Interest | | | Average | | | Interest | |
| | | recorded | | | income | | | recorded | | | income | | | recorded | | | income | |
(In thousands) | | investment | | | recognized | | | investment | | | recognized | | | investment | | | recognized | |
Commercial multi-family | | $ | 1,539 | | | $ | — | | | $ | 2,657 | | | $ | — | | | $ | 4,196 | | | $ | — | |
Commercial real estate non-owner occupied | | | 70,154 | | | | 2,719 | | | | 9,264 | | | | — | | | | 79,418 | | | | 2,719 | |
Commercial real estate owner occupied | | | 114,893 | | | | 3,994 | | | | 5,778 | | | | — | | | | 120,671 | | | | 3,994 | |
Commercial and industrial | | | 130,940 | | | | 7,852 | | | | 955 | | | | — | | | | 131,895 | | | | 7,852 | |
Construction | | | 18,418 | | | | — | | | | 1,133 | | | | — | | | | 19,551 | | | | — | |
Mortgage | | | 415,188 | | | | 19,319 | | | | 33,686 | | | | 1,187 | | | | 448,874 | | | | 20,506 | |
Legacy | | | — | | | | — | | | | 2,920 | | | | — | | | | 2,920 | | | | — | |
Leasing | | | 2,747 | | | | — | | | | — | | | | — | | | | 2,747 | | | | — | |
Consumer: | | | | | | | | | | | | | | | | | | | | | | | | |
Credit cards | | | 42,345 | | | | — | | | | — | | | | — | | | | 42,345 | | | | — | |
HELOCs | | | — | | | | — | | | | 1,768 | | | | — | | | | 1,768 | | | | — | |
Personal | | | 74,593 | | | | — | | | | — | | | | — | | | | 74,593 | | | | — | |
Auto | | | 1,884 | | | | — | | | | 52 | | | | — | | | | 1,936 | | | | — | |
Other | | | 748 | | | | — | | | | 452 | | | | — | | | | 1,200 | | | | — | |
Covered loans | | | 8,763 | | | | 469 | | | | — | | | | — | | | | 8,763 | | | | 469 | |
| | | | | | | | | | | | | | | | | | | | | | | | |
Total Popular, Inc. | | $ | 882,212 | | | $ | 34,353 | | | $ | 58,665 | | | $ | 1,187 | | | $ | 940,877 | | | $ | 35,540 | |
| | | | | | | | | | | | | | | | | | | | | | | | |
Modifications
Troubled debt restructurings related to non-covered loan portfolios amounted to $ 1.2 billion at December 31, 2015 (December 31, 2014 - $ 1.1 billion). The amount of outstanding commitments to lend additional funds to debtors owing receivables whose terms have been modified in troubled debt restructurings amounted $11 million related to the commercial loan portfolio and none in the construction loan portfolio at December 31, 2015 (December 31, 2014 - $5 million and $1 million, respectively).
A modification of a loan constitutes a troubled debt restructuring (“TDR”) when a borrower is experiencing financial difficulty and the modification constitutes a concession. For a summary of the accounting policy related to TDRs, refer to the summary of significant accounting policies included in Note 2 to these consolidated financial statements.
Commercial and industrial loans modified in a TDR often involve temporary interest-only payments, term extensions, and converting evergreen revolving credit lines to long-term loans. Commercial real estate (“CRE”), which includes multifamily, owner-occupied and non-owner occupied CRE, and construction loans modified in a TDR often involve reducing the interest rate for a limited period of time or the remaining term of the loan, extending the maturity date at an interest rate lower than the current market rate for new debt with similar risk, or reductions in the payment plan. Construction loans modified in a TDR may also involve extending the interest-only payment period.
Residential mortgage loans modified in a TDR are primarily comprised of loans where monthly payments are lowered to accommodate the borrowers’ financial needs for a period of time, normally five years to ten years. After the lowered monthly payment period ends, the borrower reverts back to paying principal and interest per the original terms with the maturity date adjusted accordingly.
172
Home equity loans modifications are made infrequently and are not offered if the Corporation also holds the first mortgage. Home equity loans modifications are uniquely designed to meet the specific needs of each borrower. Automobile loans modified in a TDR are primarily comprised of loans where the Corporation has lowered monthly payments by extending the term. Credit cards modified in a TDR are primarily comprised of loans where monthly payments are lowered to accommodate the borrowers’ financial needs for a period of time, normally up to 24 months.
As part of its NPL reduction strategy and in order to expedite the resolution of delinquent construction and commercial loans, commencing in 2012, the Corporation routinely enters into liquidation agreements with borrowers and guarantors through the regular legal process, bankruptcy procedures and in certain occasions, out of court transactions. These liquidation agreements, in general, contemplate the following conditions: (1) consent to judgment by the borrowers and guarantors; (2) acknowledgement by the borrower of the debt, its liquidity and maturity; and (3) acknowledgment of the default in payments. The contractual interest rate is not reduced and continues to accrue during the term of the agreement. At the end of the period, the borrower is obligated to remit all amounts due or be subject to the Corporation’s exercise of its foreclosure rights and further collection efforts. Likewise, the borrower’s failure to make stipulated payments will grant the Corporation the ability to exercise its foreclosure rights. This strategy tends to expedite the foreclosure process, resulting in a more effective and efficient collection process. Although in general, these liquidation agreements do not contemplate the forgiveness of principal or interest as debtor is required to cover all outstanding amounts when the agreement becomes due, it could be construed that the Corporation has granted a concession by temporarily accepting a payment schedule that is different from the contractual payment schedule. Accordingly, loans under these program agreements are considered TDRs.
Loans modified in a TDR that are not accounted pursuant to ASC Subtopic 310-30 are typically already in non-accrual status at the time of the modification and partial charge-offs have in some cases already been taken against the outstanding loan balance. The TDR loan continues in non-accrual status until the borrower has demonstrated a willingness and ability to make the restructured loan payments (generally at least six months of sustained performance after the modification (or one year for loans providing for quarterly or semi-annual payments)) and management has concluded that it is probable that the borrower would not be in payment default in the foreseeable future.
Loans modified in a TDR may have the financial effect to the Corporation of increasing the specific allowance for loan losses associated with the loan. Consumer and residential mortgage loans modified under the Corporation’s loss mitigation programs that are determined to be TDRs are individually evaluated for impairment based on an analysis of discounted cash flows.
For consumer and mortgage loans that are modified with regard to payment terms and which constitute TDRs, the discounted cash flow value method is used as the impairment valuation is more appropriately calculated based on the ongoing cash flow from the individuals rather than the liquidation of the asset. The computations give consideration to probability of defaults and loss-given-foreclosure on the related estimated cash flows.
Commercial and construction loans that have been modified as part of loss mitigation efforts are evaluated individually for impairment. The vast majority of the Corporation’s modified commercial loans are measured for impairment using the estimated fair value of the collateral, as these are normally considered as collateral dependent loans. The Corporation may also measure commercial loans at their estimated realizable values determined by discounting the expected future cash flows. Construction loans that have been modified are also accounted for as collateral dependent loans. The Corporation determines the fair value measurement dependent upon its exit strategy for the particular asset(s) acquired in foreclosure.
173
The following tables present the non-covered and covered loans classified as TDRs according to their accruing status at December 31, 2015 and December 31, 2014.
| | | | | | | | | | | | | | | | | | | | | | | | | | | | | | | | |
| | | Popular, Inc. | |
| | | Non-Covered Loans | |
| | | December 31, 2015 | | | December 31, 2014 | |
(In thousands) | | Accruing | | | Non-Accruing | | | Total | | | Related
Allowance | | | Accruing | | | Non-Accruing | | | Total | | | Related
Allowance | |
Commercial | | $ | 166,415 | | | $ | 88,117 | | | $ | 254,532 | | | $ | 37,355 | | | $ | 153,380 | | | $ | 150,069 | | | $ | 303,449 | | | $ | 57,465 | |
Construction | | | 221 | | | | 2,259 | | | | 2,480 | | | | 264 | | | | 453 | | | | 5,488 | | | | 5,941 | | | | 363 | |
Mortgage | | | 644,013 | | | | 130,483 | | | | 774,496 | | | | 44,029 | | | | 556,346 | | | | 116,465 | | | | 672,811 | | | | 46,111 | |
Leases | | | 1,791 | | | | 609 | | | | 2,400 | | | | 573 | | | | 775 | | | | 2,248 | | | | 3,023 | | | | 770 | |
Consumer | | | 104,630 | | | | 12,805 | | | | 117,435 | | | | 23,963 | | | | 107,530 | | | | 14,848 | | | | 122,378 | | | | 28,161 | |
| | | | | | | | | | | | | | | | | | | | | | | | | | | | | | | | |
Total | | $ | 917,070 | | | $ | 234,273 | | | $ | 1,151,343 | | | $ | 106,184 | | | $ | 818,484 | | | $ | 289,118 | | | $ | 1,107,602 | | | $ | 132,870 | |
| | | | | | | | | | | | | | | | | | | | | | | | | | | | | | | | |
| | | | | | | | | | | | | | | | | | | | | | | | | | | | | | | | |
| | | Popular, Inc. | |
| | | Covered Loans | |
| | | December 31, 2015 | | | December 31, 2014 | |
(In thousands) | | Accruing | | | Non-Accruing | | | Total | | | Related
Allowance | | | Accruing | | | Non-Accruing | | | Total | | | Related
Allowance | |
Commercial | | $ | — | | | $ | — | | | $ | — | | | $ | — | | | $ | 1,689 | | | $ | 3,257 | | | $ | 4,946 | | | $ | — | |
Construction | | | — | | | | — | | | | — | | | | — | | | | — | | | | 2,419 | | | | 2,419 | | | | — | |
Mortgage | | | 3,328 | | | | 3,268 | | | | 6,596 | | | | — | | | | 3,629 | | | | 3,990 | | | | 7,619 | | | | — | |
Consumer | | | — | | | | — | | | | — | | | | — | | | | 26 | | | | 5 | | | | 31 | | | | — | |
| | | | | | | | | | | | | | | | | | | | | | | | | | | | | | | | |
Total | | $ | 3,328 | | | $ | 3,268 | | | $ | 6,596 | | | $ | — | | | $ | 5,344 | | | $ | 9,671 | | | $ | 15,015 | | | $ | — | |
| | | | | | | | | | | | | | | | | | | | | | | | | | | | | | | | |
The following tables present the loan count by type of modification for those loans modified in a TDR during the years ended December 31, 2015 and 2014.
| | | | | | | | | | | | | | | | |
Puerto Rico | |
For the year ended December 31, 2015 | |
| | | Reduction in
interest rate | | | Extension of
maturity date | | | Combination of
reduction in interest
rate and extension
of maturity date | | | Other | |
Commercial multi-family | | | — | | | | 2 | | | | — | | | | — | |
Commercial real estate non-owner occupied | | | 9 | | | | 12 | | | | — | | | | — | |
Commercial real estate owner occupied | | | 39 | | | | 20 | | | | — | | | | — | |
Commercial and industrial | | | 32 | | | | 18 | | | | — | | | | — | |
Construction | | | 1 | | | | 1 | | | | — | | | | — | |
Mortgage | | | 57 | | | | 53 | | | | 392 | | | | 112 | |
Leasing | | | — | | | | 7 | | | | 16 | | | | — | |
Consumer: | | | | | | | | | | | | | | | | |
Credit cards | | | 802 | | | | — | | | | — | | | | 700 | |
Personal | | | 1,012 | | | | 29 | | | | — | | | | 1 | |
Auto | | | — | | | | 11 | | | | 3 | | | | — | |
Other | | | 49 | | | | — | | | | — | | | | — | |
| | | | | | | | | | | | | | | | |
Total | | | 2,001 | | | | 153 | | | | 411 | | | | 813 | |
| | | | | | | | | | | | | | | | |
174
| | | | | | | | | | | | | | | | |
U.S. mainland | |
For the year ended December 31, 2015 | |
| | | Reduction in
interest rate | | | Extension of
maturity date | | | Combination of
reduction in interest
rate and extension
of maturity date | | | Other | |
Mortgage | | | — | | | | 3 | | | | 26 | | | | 1 | |
Consumer: | | | | | | | | | | | | | | | | |
HELOCs | | | — | | | | 1 | | | | 1 | | | | 2 | |
Personal | | | — | | | | 2 | | | | — | | | | — | |
| | | | | | | | | | | | | | | | |
Total | | | — | | | | 6 | | | | 27 | | | | 3 | |
| | | | | | | | | | | | | | | | |
| | | | | | | | | | | | | | | | |
Popular, Inc. | |
For the year ended December 31, 2015 | |
| | | Reduction in
interest rate | | | Extension of
maturity date | | | Combination of
reduction in interest
rate and extension
of maturity date | | | Other | |
Commercial multi-family | | | — | | | | 2 | | | | — | | | | — | |
Commercial real estate non-owner occupied | | | 9 | | | | 12 | | | | — | | | | — | |
Commercial real estate owner occupied | | | 39 | | | | 20 | | | | — | | | | — | |
Commercial and industrial | | | 32 | | | | 18 | | | | — | | | | — | |
Construction | | | 1 | | | | 1 | | | | — | | | | — | |
Mortgage | | | 57 | | | | 56 | | | | 418 | | | | 113 | |
Leasing | | | — | | | | 7 | | | | 16 | | | | — | |
Consumer: | | | | | | | | | | | | | | | | |
Credit cards | | | 802 | | | | — | | | | — | | | | 700 | |
HELOCs | | | — | | | | 1 | | | | 1 | | | | 2 | |
Personal | | | 1,012 | | | | 31 | | | | — | | | | 1 | |
Auto | | | — | | | | 11 | | | | 3 | | | | — | |
Other | | | 49 | | | | — | | | | — | | | | — | |
| | | | | | | | | | | | | | | | |
Total | | | 2,001 | | | | 159 | | | | 438 | | | | 816 | |
| | | | | | | | | | | | | | | | |
| | | | | | | | | | | | | | | | |
Puerto Rico | |
For the year ended December 31, 2014 | |
| | | Reduction in
interest rate | | | Extension of
maturity date | | | Combination of
reduction in interest
rate and extension
of maturity date | | | Other | |
Commercial real estate non-owner occupied | | | 5 | | | | 8 | | | | — | | | | — | |
Commercial real estate owner occupied | | | 25 | | | | 12 | | | | — | | | | — | |
Commercial and industrial | | | 37 | | | | 43 | | | | — | | | | — | |
Construction | | | — | | | | 4 | | | | — | | | | — | |
Mortgage | | | 52 | | | | 61 | | | | 413 | | | | 142 | |
Leasing | | | — | | | | 15 | | | | 48 | | | | — | |
Consumer: | | | | | | | | | | | | | | | | |
Credit cards | | | 1,070 | | | | — | | | | — | | | | 653 | |
Personal | | | 955 | | | | 71 | | | | — | | | | 6 | |
Auto | | | — | | | | 13 | | | | 5 | | | | — | |
Other | | | 103 | | | | — | | | | — | | | | 2 | |
| | | | | | | | | | | | | | | | |
Total | | | 2,247 | | | | 227 | | | | 466 | | | | 803 | |
| | | | | | | | | | | | | | | | |
175
| | | | | | | | | | | | | | | | |
U.S. mainland | |
For the year ended December 31, 2014 | |
| | | Reduction in
interest rate | | | Extension of
maturity date | | | Combination of
reduction in interest
rate and extension
of maturity date | | | Other | |
Mortgage | | | — | | | | — | | | | 18 | | | | — | |
Consumer: | | | | | | | | | | | | | | | | |
HELOCs | | | 5 | | | | — | | | | — | | | | — | |
| | | | | | | | | | | | | | | | |
Total | | | 5 | | | | — | | | | 18 | | | | — | |
| | | | | | | | | | | | | | | | |
| | | | | | | | | | | | | | | | |
Popular, Inc. | |
For the year ended December 31, 2014 | |
| | | Reduction in
interest rate | | | Extension of
maturity date | | | Combination of
reduction in interest
rate and extension
of maturity date | | | Other | |
Commercial real estate non-owner occupied | | | 5 | | | | 8 | | | | — | | | | — | |
Commercial real estate owner occupied | | | 25 | | | | 12 | | | | — | | | | — | |
Commercial and industrial | | | 37 | | | | 43 | | | | — | | | | — | |
Construction | | | — | | | | 4 | | | | — | | | | — | |
Mortgage | | | 52 | | | | 61 | | | | 431 | | | | 142 | |
Leasing | | | — | | | | 15 | | | | 48 | | | | — | |
Consumer: | | | | | | | | | | | | | | | | |
Credit cards | | | 1,070 | | | | — | | | | — | | | | 653 | |
HELOCs | | | 5 | | | | — | | | | — | | | | — | |
Personal | | | 955 | | | | 71 | | | | — | | | | 6 | |
Auto | | | — | | | | 13 | | | | 5 | | | | — | |
Other | | | 103 | | | | — | | | | — | | | | 2 | |
| | | | | | | | | | | | | | | | |
Total | | | 2,252 | | | | 227 | | | | 484 | | | | 803 | |
| | | | | | | | | | | | | | | | |
The following tables present by class, quantitative information related to loans modified as TDRs during the years ended December 31, 2015 and 2014.
| | | | | | | | | | | | | | | | |
Puerto Rico | |
For the year ended December 31, 2015 | |
| (Dollars in thousands) | | Loan count | | | Pre-modification
outstanding recorded
investment | | | Post-modification
outstanding recorded
investment | | | Increase (decrease) in the
allowance for loan losses as
a result of modification | |
Commercial multi-family | | | 2 | | | $ | 551 | | | $ | 551 | | | $ | 2 | |
Commercial real estate non-owner occupied | | | 21 | | | | 69,442 | | | | 69,595 | | | | 14,339 | |
Commercial real estate owner occupied | | | 59 | | | | 20,323 | | | | 19,195 | | | | 889 | |
Commercial and industrial | | | 50 | | | | 22,818 | | | | 23,757 | | | | (6,994 | ) |
Construction | | | 2 | | | | 308 | | | | 298 | | | | (170 | ) |
Mortgage | | | 614 | | | | 50,789 | | | | 66,715 | | | | 5,304 | |
Leasing | | | 23 | | | | 651 | | | | 651 | | | | 148 | |
Consumer: | | | | | | | | | | | | | | | | |
Credit cards | | | 1,502 | | | | 12,857 | | | | 14,552 | | | | 2,238 | |
Personal | | | 1,042 | | | | 17,641 | | | | 17,704 | | | | 3,768 | |
Auto | | | 14 | | | | 142 | | | | 199 | | | | 35 | |
Other | | | 49 | | | | 121 | | | | 132 | | | | 20 | |
| | | | | | | | | | | | | | | | |
Total | | | 3,378 | | | $ | 195,643 | | | $ | 213,349 | | | $ | 19,579 | |
| | | | | | | | | | | | | | | | |
176
| | | | | | | | | | | | | | | | |
U.S. mainland | |
For the year ended December 31, 2015 | |
(Dollars in thousands) | | Loan count | | | Pre-modification
outstanding recorded
investment | | | Post-modification
outstanding recorded
investment | | | Increase (decrease) in the
allowance for loan losses as
a result of modification | |
Mortgage | | | 30 | | | $ | 2,786 | | | $ | 3,812 | | | $ | 824 | |
Consumer: | | | | | | | | | | | | | | | | |
HELOCs | | | 4 | | | | 197 | | | | 295 | | | | 79 | |
Personal | | | 2 | | | | 30 | | | | 30 | | | | 3 | |
| | | | | | | | | | | | | | | | |
Total | | | 36 | | | $ | 3,013 | | | $ | 4,137 | | | $ | 906 | |
| | | | | | | | | | | | | | | | |
| | | | | | | | | | | | | | | | |
Popular, Inc. | |
For the years ended December 31, 2015 | |
(Dollars in thousands) | | Loan count | | | Pre-modification
outstanding recorded
investment | | | Post-modification
outstanding recorded
investment | | | Increase (decrease) in the
allowance for loan losses as
a result of modification | |
Commercial multi-family | | | 2 | | | $ | 551 | | | $ | 551 | | | $ | 2 | |
Commercial real estate non-owner occupied | | | 21 | | | | 69,442 | | | | 69,595 | | | | 14,339 | |
Commercial real estate owner occupied | | | 59 | | | | 20,323 | | | | 19,195 | | | | 889 | |
Commercial and industrial | | | 50 | | | | 22,818 | | | | 23,757 | | | | (6,994 | ) |
Construction | | | 2 | | | | 308 | | | | 298 | | | | (170 | ) |
Mortgage | | | 644 | | | | 53,575 | | | | 70,527 | | | | 6,128 | |
Leasing | | | 23 | | | | 651 | | | | 651 | | | | 148 | |
Consumer: | | | | | | | | | | | | | | | | |
Credit cards | | | 1,502 | | | | 12,857 | | | | 14,552 | | | | 2,238 | |
HELOCs | | | 4 | | | | 197 | | | | 295 | | | | 79 | |
Personal | | | 1,044 | | | | 17,671 | | | | 17,734 | | | | 3,771 | |
Auto | | | 14 | | | | 142 | | | | 199 | | | | 35 | |
Other | | | 49 | | | | 121 | | | | 132 | | | | 20 | |
| | | | | | | | | | | | | | | | |
Total | | | 3,414 | | | $ | 198,656 | | | $ | 217,486 | | | $ | 20,485 | |
| | | | | | | | | | | | | | | | |
| | | | | | | | | | | | | | | | |
Puerto Rico | |
For the year ended December 31, 2014 | |
(Dollars in thousands) | | Loan count | | | Pre-modification
outstanding recorded
investment | | | Post-modification
outstanding recorded
investment | | | Increase (decrease) in the
allowance for loan losses as
a result of modification | |
Commercial real estate non-owner occupied | | | 13 | | | $ | 17,565 | | | $ | 17,645 | | | $ | (865 | ) |
Commercial real estate owner occupied | | | 37 | | | | 48,403 | | | | 47,754 | | | | 2,002 | |
Commercial and industrial | | | 80 | | | | 130,818 | | | | 129,561 | | | | 6,728 | |
Construction | | | 4 | | | | 11,358 | | | | 11,485 | | | | (570 | ) |
Mortgage | | | 668 | | | | 98,771 | | | | 98,031 | | | | 4,292 | |
Leasing | | | 63 | | | | 1,628 | | | | 1,632 | | | | 361 | |
Consumer: | | | | | | | | | | | | | | | | |
Credit cards | | | 1,723 | | | | 14,207 | | | | 16,193 | | | | 2,584 | |
Personal | | | 1,032 | | | | 17,814 | | | | 17,881 | | | | 3,935 | |
Auto | | | 18 | | | | 278 | | | | 289 | | | | 16 | |
Other | | | 105 | | | | 325 | | | | 319 | | | | 57 | |
| | | | | | | | | | | | | | | | |
Total | | | 3,743 | | | $ | 341,167 | | | $ | 340,790 | | | $ | 18,540 | |
| | | | | | | | | | | | | | | | |
177
| | | | | | | | | | | | | | | | |
U.S. mainland | |
For the year ended December 31, 2014 | |
(Dollars in thousands) | | Loan count | | | Pre-modification
outstanding recorded
investment | | | Post-modification
outstanding recorded
investment | | | Increase (decrease) in the
allowance for loan losses as
a result of modification | |
Mortgage | | | 18 | | | $ | 2,342 | | | $ | 2,603 | | | $ | 364 | |
Consumer: | | | | | | | | | | | | | | | | |
HELOCs | | | 5 | | | | 251 | | | | 250 | | | | 67 | |
| | | | | | | | | | | | | | | | |
Total | | | 23 | | | $ | 2,593 | | | $ | 2,853 | | | $ | 431 | |
| | | | | | | | | | | | | | | | |
| | | | | | | | | | | | | | | | |
Popular, Inc. | |
For the year ended December 31, 2014 | |
(Dollars in thousands) | | Loan count | | | Pre-modification
outstanding recorded
investment | | | Post-modification
outstanding recorded
investment | | | Increase (decrease) in the
allowance for loan losses as
a result of modification | |
Commercial real estate non-owner occupied | | | 13 | | | $ | 17,565 | | | $ | 17,645 | | | $ | (865 | ) |
Commercial real estate owner occupied | | | 37 | | | | 48,403 | | | | 47,754 | | | | 2,002 | |
Commercial and industrial | | | 80 | | | | 130,818 | | | | 129,561 | | | | 6,728 | |
Construction | | | 4 | | | | 11,358 | | | | 11,485 | | | | (570 | ) |
Mortgage | | | 686 | | | | 101,113 | | | | 100,634 | | | | 4,656 | |
Leasing | | | 63 | | | | 1,628 | | | | 1,632 | | | | 361 | |
Consumer: | | | | | | | | | | | | | | | | |
Credit cards | | | 1,723 | | | | 14,207 | | | | 16,193 | | | | 2,584 | |
HELOCs | | | 5 | | | | 251 | | | | 250 | | | | 67 | |
Personal | | | 1,032 | | | | 17,814 | | | | 17,881 | | | | 3,935 | |
Auto | | | 18 | | | | 278 | | | | 289 | | | | 16 | |
Other | | | 105 | | | | 325 | | | | 319 | | | | 57 | |
| | | | | | | | | | | | | | | | |
Total | | | 3,766 | | | $ | 343,760 | | | $ | 343,643 | | | $ | 18,971 | |
| | | | | | | | | | | | | | | | |
During the years ended December 31, 2015 and 2014, eleven loans with an aggregate unpaid principal balance of $10.8 million and six loans of $10.1 million, respectively, were restructured into multiple notes (“Note A / B split”). The Corporation recorded $747 thousand charge-offs as part of those loan restructurings during the twelve months ended December 31, 2015 (December 31, 2014 - $2.1 million). The restructuring of those loans was made after analyzing the borrowers’ capacity to repay the debt, collateral and ability to perform under the modified terms. The recorded investment on those commercial TDRs amounted to approximately $2.7 million at December 31, 2015 (December 31, 2014 - $2.9 million) with a related allowance for loan losses amounting to approximately $330 thousand (December 31, 2014 - $166 thousand).
The following tables present by class, TDRs that were subject to payment default and that had been modified as a TDR during the twelve months preceding the default date. Payment default is defined as a restructured loan becoming 90 days past due after being modified, foreclosed or charged-off, whichever occurs first. The recorded investment at December 31, 2015 is inclusive of all partial paydowns and charge-offs since the modification date. Loans modified as a TDR that were fully paid down, charged-off or foreclosed upon by period end are not reported.
178
| | | | | | | | |
Puerto Rico | |
Defaulted during the year ended December 31, 2015 | |
(Dollars in thousands) | | Loan count | | | Recorded investment as of first default date | |
Commercial real estate non-owner occupied | | | 3 | | | $ | 7,269 | |
Commercial real estate owner occupied | | | 1 | | | | 291 | |
Commercial and industrial | | | 7 | | | | 1,990 | |
Construction | | | 3 | | | | 1,442 | |
Mortgage | | | 187 | | | | 28,007 | |
Consumer: | | | | | | | | |
Credit cards | | | 415 | | | | 4,185 | |
Personal | | | 97 | | | | 3,006 | |
Auto | | | 6 | | | | 97 | |
Other | | | 2 | | | | 1 | |
| | | | | | | | |
Total [1] | | | 721 | | | $ | 46,288 | |
| | | | | | | | |
| [1] | Excludes loans for which the Corporation has entered into liquidation agreements with borrowers and guarantors and is accepting payments which differ from the contractual payment schedule. The Corporation considers these as defaulted loans and does not intent to return them to accrual status. |
| | | | | | | | |
U.S. mainland | |
Defaulted during the year ended December 31, 2015 | |
(Dollars In thousands) | | Loan count | | | Recorded investment as of first default date | |
Mortgage | | | 2 | | | $ | 357 | |
| | | | | | | | |
Total | | | 2 | | | $ | 357 | |
| | | | | | | | |
| | | | | | | | |
Popular, Inc. | |
Defaulted during the year ended December 31, 2015 | |
(Dollars In thousands) | | Loan count | | | Recorded investment as of first default date | |
Commercial real estate non-owner occupied | | | 3 | | | $ | 7,269 | |
Commercial real estate owner occupied | | | 1 | | | | 291 | |
Commercial and industrial | | | 7 | | | | 1,990 | |
Construction | | | 3 | | | | 1,442 | |
Mortgage | | | 189 | | | | 28,364 | |
Consumer: | | | | | | | | |
Credit cards | | | 415 | | | | 4,185 | |
Personal | | | 97 | | | | 3,006 | |
Auto | | | 6 | | | | 97 | |
Other | | | 2 | | | | 1 | |
| | | | | | | | |
Total | | | 723 | | | $ | 46,645 | |
| | | | | | | | |
| | | | | | | | |
Puerto Rico | |
Defaulted during the year ended December 31, 2014 | |
(Dollars In thousands) | | Loan count | | | Recorded investment as of first default date | |
Commercial real estate non-owner occupied | | | 3 | | | $ | 433 | |
Commercial real estate owner occupied | | | 5 | | | | 1,191 | |
Commercial and industrial | | | 5 | | | | 609 | |
Construction | | | 1 | | | | 952 | |
Mortgage | | | 125 | | | | 22,819 | |
Leasing | | | 8 | | | | 72 | |
Consumer: | | | | | | | | |
Credit cards | | | 465 | | | | 4,176 | |
Personal | | | 101 | | | | 1,331 | |
Auto | | | 14 | | | | 255 | |
| | | | | | | | |
Total [1] | | | 727 | | | $ | 31,838 | |
| | | | | | | | |
| [1] | Exclude loans for which the Corporation has entered into liquidation agreements with borrowers and guarantors and is accepting payments which differ from the contractual payment schedule. The Corporation considers these as defaulted loans and does not intent to return them to accrual status. |
179
| | | | | | | | |
U.S. mainland | |
Defaulted during the year ended December 31, 2014 | |
(Dollars In thousands) | | Loan count | | | Recorded investment as of first default date | |
Commercial real estate non-owner occupied | | | 1 | | | $ | 907 | |
Mortgage | | | 1 | | | | 110 | |
| | | | | | | | |
Total | | | 2 | | | $ | 1,017 | |
| | | | | | | | |
| | | | | | | | |
Popular, Inc. | |
Defaulted during the year ended December 31, 2014 | |
(Dollars In thousands) | | Loan count | | | Recorded investment as of first default date | |
Commercial real estate non-owner occupied | | | 4 | | | $ | 1,340 | |
Commercial real estate owner occupied | | | 5 | | | | 1,191 | |
Commercial and industrial | | | 5 | | | | 609 | |
Construction | | | 1 | | | | 952 | |
Mortgage | | | 126 | | | | 22,929 | |
Leasing | | | 8 | | | | 72 | |
Consumer: | | | | | | | | |
Credit cards | | | 465 | | | | 4,176 | |
Personal | | | 101 | | | | 1,331 | |
Auto | | | 14 | | | | 255 | |
| | | | | | | | |
Total | | | 729 | | | $ | 32,855 | |
| | | | | | | | |
Commercial, consumer and mortgage loans modified in a TDR are closely monitored for delinquency as an early indicator of possible future default. If loans modified in a TDR subsequently default, the Corporation evaluates the loan for possible further impairment. The allowance for loan losses may be increased or partial charge-offs may be taken to further write-down the carrying value of the loan.
Credit Quality
The Corporation has defined a risk rating system to assign a rating to all credit exposures, particularly for the commercial and construction loan portfolios. Risk ratings in the aggregate provide the Corporation’s management the asset quality profile for the loan portfolio. The risk rating system provides for the assignment of ratings at the obligor level based on the financial condition of the borrower. The Corporation’s consumer and mortgage loans are not subject to the risk rating system. Consumer and mortgage loans are classified substandard or loss based on their delinquency status. All other consumer and mortgage loans that are not classified as substandard or loss would be considered “unrated”.
The Corporation’s obligor risk rating scales range from rating 1 (Excellent) to rating 14 (Loss). The obligor risk rating reflects the risk of payment default of a borrower in the ordinary course of business.
Pass Credit Classifications:
Pass (Scales 1 through 8) – Loans classified as pass have a well defined primary source of repayment, with no apparent risk, strong financial position, minimal operating risk, profitability, liquidity and strong capitalization.
Watch (Scale 9) – Loans classified as watch have acceptable business credit, but borrower’s operations, cash flow or financial condition evidence more than average risk, requires above average levels of supervision and attention from Loan Officers.
Special Mention (Scale 10) - Loans classified as special mention have potential weaknesses that deserve management’s close attention. If left uncorrected, these potential weaknesses may result in deterioration of the repayment prospects for the loan or of the Corporation’s credit position at some future date.
Adversely Classified Classifications:
Substandard (Scales 11 and 12) - Loans classified as substandard are deemed to be inadequately protected by the current net worth and payment capacity of the obligor or of the collateral pledged, if any. Loans classified as such have well-defined weaknesses that jeopardize the liquidation of the debt. They are characterized by the distinct possibility that the institution will sustain some loss if the deficiencies are not corrected.
180
Doubtful (Scale 13) - Loans classified as doubtful have all the weaknesses inherent in those classified as substandard, with the additional characteristic that the weaknesses make the collection or liquidation in full, on the basis of currently existing facts, conditions, and values, highly questionable and improbable.
Loss (Scale 14) - Uncollectible and of such little value that continuance as a bankable asset is not warranted. This classification does not mean that the asset has absolutely no recovery or salvage value, but rather it is not practical or desirable to defer writing off this asset even though partial recovery may be effected in the future.
Risk ratings scales 10 through 14 conform to regulatory ratings. The assignment of the obligor risk rating is based on relevant information about the ability of borrowers to service their debts such as current financial information, historical payment experience, credit documentation, public information, and current economic trends, among other factors.
The Corporation periodically reviews its loans classification to evaluate if they are properly classified, and to determine impairment, if any. The frequency of these reviews will depend on the amount of the aggregate outstanding debt, and the risk rating classification of the obligor. In addition, during the renewal and annual review process of applicable credit facilities, the Corporation evaluates the corresponding loan grades.
The Corporation has a Loan Review Group that reports directly to the Corporation’s Risk Management Committee and administratively to the Chief Risk Officer, which performs annual comprehensive credit process reviews of all lending groups in BPPR. This group evaluates the credit risk profile of each originating unit along with each unit’s credit administration effectiveness, including the assessment of the risk rating representative of the current credit quality of the loans, and the evaluation of collateral documentation. The monitoring performed by this group contributes to assess compliance with credit policies and underwriting standards, determine the current level of credit risk, evaluate the effectiveness of the credit management process and identify control deficiencies that may arise in the credit-granting process. Based on its findings, the Loan Review Group recommends corrective actions, if necessary, that help in maintaining a sound credit process. The Loan Review Group reports the results of the credit process reviews to the Risk Management Committee of the Corporation’s Board of Directors.
181
The following table presents the outstanding balance, net of unearned income, of non-covered loans held-in-portfolio based on the Corporation’s assignment of obligor risk ratings as defined at December 31, 2015 and 2014.
| | | | | | | | | | | | | | | | | | | | | | | | | | | | | | | | |
December 31, 2015 | |
| | | | | | Special | | | | | | | | | | | | | | | Pass/ | | | | |
(In thousands) | | Watch | | | Mention | | | Substandard | | | Doubtful | | | Loss | | | Sub-total | | | Unrated | | | Total | |
Puerto Rico[1] | | | | | | | | | | | | | | | | | | | | | | | | | | | | | | | | |
Commercial multi-family | | $ | 1,750 | | | $ | 1,280 | | | $ | 8,103 | | | $ | — | | | $ | — | | | $ | 11,133 | | | $ | 121,013 | | | $ | 132,146 | |
Commercial real estate non-owner occupied | | | 319,564 | | | | 423,095 | | | | 399,076 | | | | — | | | | — | | | | 1,141,735 | | | | 1,527,357 | | | | 2,669,092 | |
Commercial real estate owner occupied | | | 316,079 | | | | 162,395 | | | | 436,442 | | | | 1,915 | | | | — | | | | 916,831 | | | | 992,413 | | | | 1,909,244 | |
Commercial and industrial | | | 187,620 | | | | 146,216 | | | | 256,821 | | | | 690 | | | | 29 | | | | 591,376 | | | | 2,066,361 | | | | 2,657,737 | |
| | | | | | | | | | | | | | | | | | | | | | | | | | | | | | | | |
Total Commercial | | | 825,013 | | | | 732,986 | | | | 1,100,442 | | | | 2,605 | | | | 29 | | | | 2,661,075 | | | | 4,707,144 | | | | 7,368,219 | |
Construction | | | 7,269 | | | | 5,522 | | | | 19,806 | | | | — | | | | — | | | | 32,597 | | | | 68,351 | | | | 100,948 | |
Mortgage | | | 4,810 | | | | 2,794 | | | | 238,002 | | | | — | | | | — | | | | 245,606 | | | | 5,881,885 | | | | 6,127,491 | |
Leasing | | | — | | | | — | | | | 3,009 | | | | — | | | | — | | | | 3,009 | | | | 624,641 | | | | 627,650 | |
Consumer: | | | | | | | | | | | | | | | | | | | | | | | | | | | | | | | | |
Credit cards | | | — | | | | — | | | | 19,098 | | | | — | | | | — | | | | 19,098 | | | | 1,109,247 | | | | 1,128,345 | |
HELOCs | | | — | | | | — | | | | 394 | | | | — | | | | — | | | | 394 | | | | 10,294 | | | | 10,688 | |
Personal | | | 1,606 | | | | 1,448 | | | | 23,116 | | | | — | | | | — | | | | 26,170 | | | | 1,176,665 | | | | 1,202,835 | |
Auto | | | — | | | | — | | | | 11,609 | | | | — | | | | 30 | | | | 11,639 | | | | 804,311 | | | | 815,950 | |
Other | | | — | | | | — | | | | 18,656 | | | | — | | | | 575 | | | | 19,231 | | | | 169,253 | | | | 188,484 | |
| | | | | | | | | | | | | | | | | | | | | | | | | | | | | | | | |
Total Consumer | | | 1,606 | | | | 1,448 | | | | 72,873 | | | | — | | | | 605 | | | | 76,532 | | | | 3,269,770 | | | | 3,346,302 | |
| | | | | | | | | | | | | | | | | | | | | | | | | | | | | | | | |
Total Puerto Rico | | $ | 838,698 | | | $ | 742,750 | | | $ | 1,434,132 | | | $ | 2,605 | | | $ | 634 | | | $ | 3,018,819 | | | $ | 14,551,791 | | | $ | 17,570,610 | |
| | | | | | | | | | | | | | | | | | | | | | | | | | | | | | | | |
U.S. mainland | | | | | | | | | | | | | | | | | | | | | | | | | | | | | | | | |
Commercial multi-family | | $ | 14,129 | | | $ | 7,189 | | | $ | 427 | | | $ | — | | | $ | — | | | $ | 21,745 | | | $ | 672,188 | | | $ | 693,933 | |
Commercial real estate non-owner occupied | | | 57,450 | | | | 6,741 | | | | 16,646 | | | | — | | | | — | | | | 80,837 | | | | 882,186 | | | | 963,023 | |
Commercial real estate owner occupied | | | 11,978 | | | | 1,074 | | | | 2,967 | | | | — | | | | — | | | | 16,019 | | | | 186,325 | | | | 202,344 | |
Commercial and industrial | | | 10,827 | | | | 5,344 | | | | 131,933 | | | | — | | | | — | | | | 148,104 | | | | 723,540 | | | | 871,644 | |
| | | | | | | | | | | | | | | | | | | | | | | | | | | | | | | | |
Total Commercial | | | 94,384 | | | | 20,348 | | | | 151,973 | | | | — | | | | — | | | | 266,705 | | | | 2,464,239 | | | | 2,730,944 | |
Construction | | | 15,091 | | | | 16,948 | | | | 18,856 | | | | — | | | | — | | | | 50,895 | | | | 529,263 | | | | 580,158 | |
Mortgage | | | — | | | | — | | | | 13,537 | | | | — | | | | — | | | | 13,537 | | | | 895,053 | | | | 908,590 | |
Legacy | | | 1,823 | | | | 1,973 | | | | 6,134 | | | | — | | | | — | | | | 9,930 | | | | 54,506 | | | | 64,436 | |
Consumer: | | | | | | | | | | | | | | | | | | | | | | | | | | | | | | | | |
Credit cards | | | — | | | | — | | | | — | | | | — | | | | — | | | | — | | | | 13,935 | | | | 13,935 | |
HELOCs | | | — | | | | — | | | | 1,550 | | | | — | | | | 2,626 | | | | 4,176 | | | | 300,308 | | | | 304,484 | |
Personal | | | — | | | | — | | | | 637 | | | | — | | | | 603 | | | | 1,240 | | | | 171,386 | | | | 172,626 | |
Auto | | | — | | | | — | | | | — | | | | — | | | | — | | | | — | | | | 28 | | | | 28 | |
Other | | | — | | | | — | | | | — | | | | — | | | | 5 | | | | 5 | | | | 299 | | | | 304 | |
| | | | | | | | | | | | | | | | | | | | | | | | | | | | | | | | |
Total Consumer | | | — | | | | — | | | | 2,187 | | | | — | | | | 3,234 | | | | 5,421 | | | | 485,956 | | | | 491,377 | |
| | | | | | | | | | | | | | | | | | | | | | | | | | | | | | | | |
Total U.S. mainland | | $ | 111,298 | | | $ | 39,269 | | | $ | 192,687 | | | $ | — | | | $ | 3,234 | | | $ | 346,488 | | | $ | 4,429,017 | | | $ | 4,775,505 | |
| | | | | | | | | | | | | | | | | | | | | | | | | | | | | | | | |
Popular, Inc. | | | | | | | | | | | | | | | | | | | | | | | | | | | | | | | | |
Commercial multi-family | | $ | 15,879 | | | $ | 8,469 | | | $ | 8,530 | | | $ | — | | | $ | — | | | $ | 32,878 | | | $ | 793,201 | | | $ | 826,079 | |
Commercial real estate non-owner occupied | | | 377,014 | | | | 429,836 | | | | 415,722 | | | | — | | | | — | | | | 1,222,572 | | | | 2,409,543 | | | | 3,632,115 | |
Commercial real estate owner occupied | | | 328,057 | | | | 163,469 | | | | 439,409 | | | | 1,915 | | | | — | | | | 932,850 | | | | 1,178,738 | | | | 2,111,588 | |
Commercial and industrial | | | 198,447 | | | | 151,560 | | | | 388,754 | | | | 690 | | | | 29 | | | | 739,480 | | | | 2,789,901 | | | | 3,529,381 | |
| | | | | | | | | | | | | | | | | | | | | | | | | | | | | | | | |
Total Commercial | | | 919,397 | | | | 753,334 | | | | 1,252,415 | | | | 2,605 | | | | 29 | | | | 2,927,780 | | | | 7,171,383 | | | | 10,099,163 | |
Construction | | | 22,360 | | | | 22,470 | | | | 38,662 | | | | — | | | | — | | | | 83,492 | | | | 597,614 | | | | 681,106 | |
Mortgage | | | 4,810 | | | | 2,794 | | | | 251,539 | | | | — | | | | — | | | | 259,143 | | | | 6,776,938 | | | | 7,036,081 | |
Legacy | | | 1,823 | | | | 1,973 | | | | 6,134 | | | | — | | | | — | | | | 9,930 | | | | 54,506 | | | | 64,436 | |
Leasing | | | — | | | | — | | | | 3,009 | | | | — | | | | — | | | | 3,009 | | | | 624,641 | | | | 627,650 | |
Consumer: | | | | | | | | | | | | | | | | | | | | | | | | | | | | | | | | |
Credit cards | | | — | | | | — | | | | 19,098 | | | | — | | | | — | | | | 19,098 | | | | 1,123,182 | | | | 1,142,280 | |
HELOCs | | | — | | | | — | | | | 1,944 | | | | — | | | | 2,626 | | | | 4,570 | | | | 310,602 | | | | 315,172 | |
Personal | | | 1,606 | | | | 1,448 | | | | 23,753 | | | | — | | | | 603 | | | | 27,410 | | | | 1,348,051 | | | | 1,375,461 | |
Auto | | | — | | | | — | | | | 11,609 | | | | — | | | | 30 | | | | 11,639 | | | | 804,339 | | | | 815,978 | |
Other | | | — | | | | — | | | | 18,656 | | | | — | | | | 580 | | | | 19,236 | | | | 169,552 | | | | 188,788 | |
| | | | | | | | | | | | | | | | | | | | | | | | | | | | | | | | |
Total Consumer | | | 1,606 | | | | 1,448 | | | | 75,060 | | | | — | | | | 3,839 | | | | 81,953 | | | | 3,755,726 | | | | 3,837,679 | |
| | | | | | | | | | | | | | | | | | | | | | | | | | | | | | | | |
Total Popular, Inc. | | $ | 949,996 | | | $ | 782,019 | | | $ | 1,626,819 | | | $ | 2,605 | | | $ | 3,868 | | | $ | 3,365,307 | | | $ | 18,980,808 | | | $ | 22,346,115 | |
| | | | | | | | | | | | | | | | | | | | | | | | | | | | | | | | |
182
The following table presents the weighted average obligor risk rating at December 31, 2015 for those classifications that consider a range of rating scales.
| | | | | | | | |
Weighted average obligor risk rating | | (Scales 11 and 12) | | | (Scales 1 through 8) | |
| Puerto Rico:[1] | | Substandard | | | Pass | |
Commercial multi-family | | | 11.13 | | | | 6.04 | |
Commercial real estate non-owner occupied | | | 11.09 | | | | 6.67 | |
Commercial real estate owner occupied | | | 11.23 | | | | 7.08 | |
Commercial and industrial | | | 11.15 | | | | 7.13 | |
| | | | | | | | |
Total Commercial | | | 11.16 | | | | 6.95 | |
| | | | | | | | |
Construction | | | 11.18 | | | | 7.56 | |
| | | | | | | | |
| | |
| U.S. mainland: | | Substandard | | | Pass | |
Commercial multi-family | | | 11.00 | | �� | | 7.15 | |
Commercial real estate non-owner occupied | | | 11.02 | | | | 6.92 | |
Commercial real estate owner occupied | | | 11.07 | | | | 7.23 | |
Commercial and industrial | | | 11.57 | | | | 6.24 | |
| | | | | | | | |
Total Commercial | | | 11.50 | | | | 6.81 | |
| | | | | | | | |
Construction | | | 11.00 | | | | 7.79 | |
| | | | | | | | |
Legacy | | | 11.11 | | | | 7.78 | |
| | | | | | | | |
| [1] | Excludes covered loans acquired in the Westernbank FDIC-assisted transaction. |
183
| | | | | | | | | | | | | | | | | | | | | | | | | | | | | | | | |
December 31, 2014 | |
| | | | | | Special | | | | | | | | | | | | | | | Pass/ | | | | |
(In thousands) | | Watch | | | Mention | | | Substandard | | | Doubtful | | | Loss | | | Sub-total | | | Unrated | | | Total | |
Puerto Rico[1] | | | | | | | | | | | | | | | | | | | | | | | | | | | | | | | | |
Commercial multi-family | | $ | 2,306 | | | $ | 5,021 | | | $ | 3,186 | | | $ | — | | | $ | — | | | $ | 10,513 | | | $ | 69,564 | | | $ | 80,077 | |
Commercial real estate non-owner occupied | | | 171,771 | | | | 144,104 | | | | 169,900 | | | | — | | | | — | | | | 485,775 | | | | 1,527,804 | | | | 2,013,579 | |
Commercial real estate owner occupied | | | 212,236 | | | | 144,536 | | | | 306,014 | | | | 3,595 | | | | — | | | | 666,381 | | | | 806,981 | | | | 1,473,362 | |
Commercial and industrial | | | 421,332 | | | | 367,834 | | | | 272,880 | | | | 849 | | | | 255 | | | | 1,063,150 | | | | 1,744,635 | | | | 2,807,785 | |
| | | | | | | | | | | | | | | | | | | | | | | | | | | | | | | | |
Total Commercial | | | 807,645 | | | | 661,495 | | | | 751,980 | | | | 4,444 | | | | 255 | | | | 2,225,819 | | | | 4,148,984 | | | | 6,374,803 | |
Construction | | | 4,612 | | | | 6,204 | | | | 16,908 | | | | — | | | | — | | | | 27,724 | | | | 131,660 | | | | 159,384 | |
Mortgage | | | — | | | | — | | | | 218,680 | | | | — | | | | — | | | | 218,680 | | | | 5,231,821 | | | | 5,450,501 | |
Leasing | | | — | | | | — | | | | 3,102 | | | | — | | | | — | | | | 3,102 | | | | 561,287 | | | | 564,389 | |
Consumer: | | | | | | | | | | | | | | | | | | | | | | | | | | | | | | | | |
Credit cards | | | — | | | | — | | | | 21,070 | | | | — | | | | — | | | | 21,070 | | | | 1,119,094 | | | | 1,140,164 | |
HELOCs | | | — | | | | — | | | | 8,186 | | | | — | | | | 7 | | | | 8,193 | | | | 5,207 | | | | 13,400 | |
Personal | | | — | | | | — | | | | 8,380 | | | | — | | | | 77 | | | | 8,457 | | | | 1,254,076 | | | | 1,262,533 | |
Auto | | | — | | | | — | | | | 11,348 | | | | — | | | | 40 | | | | 11,388 | | | | 755,908 | | | | 767,296 | |
Other | | | — | | |
| —
|
| | | 2,130 | | | | — | | | | 1,735 | | | | 3,865 | | | | 201,779 | | | | 205,644 | |
| | | | | | | | | | | | | | | | | | | | | | | | | | | | | | | | |
Total Consumer | | | — | | | | — | | | | 51,114 | | | | — | | | | 1,859 | | | | 52,973 | | | | 3,336,064 | | | | 3,389,037 | |
| | | | | | | | | | | | | | | | | | | | | | | | | | | | | | | | |
Total Puerto Rico | | $ | 812,257 | | | $ | 667,699 | | | $ | 1,041,784 | | | $ | 4,444 | | | $ | 2,114 | | | $ | 2,528,298 | | | $ | 13,409,816 | | | $ | 15,938,114 | |
| | | | | | | | | | | | | | | | | | | | | | | | | | | | | | | | |
U.S. mainland | | | | | | | | | | | | | | | | | | | | | | | | | | | | | | | | |
Commercial multi-family | | $ | 11,283 | | | $ | 6,818 | | | $ | 13,653 | | | $ | — | | | $ | — | | | $ | 31,754 | | | $ | 375,449 | | | $ | 407,203 | |
Commercial real estate non-owner occupied | | | 17,424 | | | | 8,745 | | | | 13,446 | | | | — | | | | — | | | | 39,615 | | | | 472,952 | | | | 512,567 | |
Commercial real estate owner occupied | | | 24,284 | | | | 4,707 | | | | 4,672 | | | | — | | | | — | | | | 33,663 | | | | 160,242 | | | | 193,905 | |
Commercial and industrial | | | 5,357 | | | | 2,548 | | | | 7,988 | | | | — | | | | — | | | | 15,893 | | | | 629,896 | | | | 645,789 | |
| | | | | | | | | | | | | | | | | | | | | | | | | | | | | | | | |
Total Commercial | | | 58,348 | | | | 22,818 | | | | 39,759 | | | | — | | | | — | | | | 120,925 | | | | 1,638,539 | | | | 1,759,464 | |
Construction | | | — | | | | — | | | | — | | | | — | | | | — | | | | — | | | | 92,436 | | | | 92,436 | |
Mortgage | | | — | | | | — | | | | 23,100 | | | | — | | | | — | | | | 23,100 | | | | 1,029,285 | | | | 1,052,385 | |
Legacy | | | 7,902 | | | | 2,491 | | | | 9,204 | | | | — | | | | — | | | | 19,597 | | | | 61,221 | | | | 80,818 | |
Consumer: | | | | | | | | | | | | | | | | | | | | | | | | | | | | | | | | |
Credit cards | | | — | | | | — | | | | — | | | | — | | | | — | | | | — | | | | 15,065 | | | | 15,065 | |
HELOCs | | | — | | | | — | | | | 2,457 | | | | — | | | | 1,632 | | | | 4,089 | | | | 348,673 | | | | 352,762 | |
Personal | | | — | | | | — | | | | 571 | | | | — | | | | 835 | | | | 1,406 | | | | 111,513 | | | | 112,919 | |
Auto | | | — | | | | — | | | | — | | | | — | | | | — | | | | — | | | | 73 | | | | 73 | |
Other | | | — | | | | — | | | | 7 | | | | — | | | | — | | | | 7 | | | | 408 | | | | 415 | |
| | | | | | | | | | | | | | | | | | | | | | | | | | | | | | | | |
Total Consumer | | | — | | | | — | | | | 3,035 | | | | — | | | | 2,467 | | | | 5,502 | | | | 475,732 | | | | 481,234 | |
| | | | | | | | | | | | | | | | | | | | | | | | | | | | | | | | |
Total U.S. mainland | | $ | 66,250 | | | $ | 25,309 | | | $ | 75,098 | | | $ | — | | | $ | 2,467 | | | $ | 169,124 | | | $ | 3,297,213 | | | $ | 3,466,337 | |
| | | | | | | | | | | | | | | | | | | | | | | | | | | | | | | | |
Popular, Inc. | | | | | | | | | | | | | | | | | | | | | | | | | | | | | | | | |
Commercial multi-family | | $ | 13,589 | | | $ | 11,839 | | | $ | 16,839 | | | $ | — | | | $ | — | | | $ | 42,267 | | | $ | 445,013 | | | $ | 487,280 | |
Commercial real estate non-owner occupied | | | 189,195 | | | | 152,849 | | | | 183,346 | | | | — | | | | — | | | | 525,390 | | | | 2,000,756 | | | | 2,526,146 | |
Commercial real estate owner occupied | | | 236,520 | | | | 149,243 | | | | 310,686 | | | | 3,595 | | | | — | | | | 700,044 | | | | 967,223 | | | | 1,667,267 | |
Commercial and industrial | | | 426,689 | | | | 370,382 | | | | 280,868 | | | | 849 | | | | 255 | | | | 1,079,043 | | | | 2,374,531 | | | | 3,453,574 | |
| | | | | | | | | | | | | | | | | | | | | | | | | | | | | | | | |
Total Commercial | | | 865,993 | | | | 684,313 | | | | 791,739 | | | | 4,444 | | | | 255 | | | | 2,346,744 | | | | 5,787,523 | | | | 8,134,267 | |
Construction | | | 4,612 | | | | 6,204 | | | | 16,908 | | | | — | | | | — | | | | 27,724 | | | | 224,096 | | | | 251,820 | |
Mortgage | | | — | | | | — | | | | 241,780 | | | | — | | | | — | | | | 241,780 | | | | 6,261,106 | | | | 6,502,886 | |
Legacy | | | 7,902 | | | | 2,491 | | | | 9,204 | | | | — | | | | — | | | | 19,597 | | | | 61,221 | | | | 80,818 | |
Leasing | | | — | | | | — | | | | 3,102 | | | | — | | | | — | | | | 3,102 | | | | 561,287 | | | | 564,389 | |
Consumer: | | | | | | | | | | | | | | | | | | | | | | | | | | | | | | | | |
Credit cards | | | — | | | | — | | | | 21,070 | | | | — | | | | — | | | | 21,070 | | | | 1,134,159 | | | | 1,155,229 | |
HELOCs | | | — | | | | — | | | | 10,643 | | | | — | | | | 1,639 | | | | 12,282 | | | | 353,880 | | | | 366,162 | |
Personal | | | — | | | | — | | | | 8,951 | | | | — | | | | 912 | | | | 9,863 | | | | 1,365,589 | | | | 1,375,452 | |
Auto | | | — | | | | — | | | | 11,348 | | | | — | | | | 40 | | | | 11,388 | | | | 755,981 | | | | 767,369 | |
Other | | | — | | | | — | | | | 2,137 | | | | — | | | | 1,735 | | | | 3,872 | | | | 202,187 | | | | 206,059 | |
| | | | | | | | | | | | | | | | | | | | | | | | | | | | | | | | |
Total Consumer | | | — | | | | — | | | | 54,149 | | | | — | | | | 4,326 | | | | 58,475 | | | | 3,811,796 | | | | 3,870,271 | |
| | | | | | | | | | | | | | | | | | | | | | | | | | | | | | | | |
Total Popular, Inc. | | $ | 878,507 | | | $ | 693,008 | | | $ | 1,116,882 | | | $ | 4,444 | | | $ | 4,581 | | | $ | 2,697,422 | | | $ | 16,707,029 | | | $ | 19,404,451 | |
| | | | | | | | | | | | | | | | | | | | | | | | | | | | | | | | |
184
The following table presents the weighted average obligor risk rating at December 31, 2014 for those classifications that consider a range of rating scales.
| | | | | | | | |
| Weighted average obligor risk rating | | (Scales 11 and 12) | | | (Scales 1 through 8) | |
| Puerto Rico:[1] | | Substandard | | | Pass | |
Commercial multi-family | | | 11.69 | | | | 5.63 | |
Commercial real estate non-owner occupied | | | 11.20 | | | | 6.83 | |
Commercial real estate owner occupied | | | 11.28 | | | | 6.96 | |
Commercial and industrial | | | 11.48 | | | | 6.89 | |
| | | | | | | | |
Total Commercial | | | 11.33 | | | | 6.87 | |
| | | | | | | | |
Construction | | | 11.82 | | | | 7.43 | |
| | | | | | | | |
| | |
| U.S. mainland: | | Substandard | | | Pass | |
Commercial multi-family | | | 11.00 | | | | 7.24 | |
Commercial real estate non-owner occupied | | | 11.00 | | | | 6.83 | |
Commercial real estate owner occupied | | | 11.17 | | | | 7.04 | |
Commercial and industrial | | | 11.09 | | | | 6.29 | |
| | | | | | | | |
Total Commercial | | | 11.04 | | | | 6.74 | |
| | | | | | | | |
Construction | | | — | | | | 7.76 | |
| | | | | | | | |
Legacy | | | 11.11 | | | | 7.70 | |
| | | | | | | | |
| [1] | Excludes covered loans acquired in the Westernbank FDIC-assisted transaction. |
185
Note 14 – FDIC loss-share asset and true-up payment obligation
In connection with the Westernbank FDIC-assisted transaction, BPPR entered into loss-share arrangements with the FDIC with respect to the covered loans and other real estate owned. Pursuant to the terms of the loss-share arrangements, the FDIC’s obligation to reimburse BPPR for losses with respect to covered assets begins with the first dollar of loss incurred. The FDIC reimburses BPPR for 80% of losses with respect to covered assets, and BPPR reimburses the FDIC for 80% of recoveries with respect to losses for which the FDIC paid 80% reimbursement under loss-share arrangements. The loss-share agreement applicable to single-family residential mortgage loans provides for FDIC loss and recoveries sharing for ten years expiring at the end of the quarter ending June 30, 2020. The loss-share arrangements applicable to commercial (including construction) and consumer loans expired during the quarter ended June 30, 2015 and provide for reimbursement to the FDIC through the quarter ending June 30, 2018.
The following table sets forth the activity in the FDIC loss-share asset for the periods presented.
| | | | | | | | | | | | |
| | | Years ended December 31, | |
(In thousands) | | 2015 | | | 2014 | | | 2013 | |
Balance at beginning of year | | $ | 542,454 | | | $ | 909,414 | | | $ | 1,382,335 | |
Amortization of loss share indemnification asset | | | (66,238 | ) | | | (189,959 | ) | | | (161,635 | ) |
Reversal of accelerated amortization | | | — | | | | 12,492 | | | | — | |
Credit impairment losses to be covered under loss sharing agreements | | | 15,658 | | | | 32,038 | | | | 60,454 | |
Reimbursable expenses | | | 73,205 | | | | 58,117 | | | | 50,985 | |
Decrease due to reciprocal accounting on amortization of contingent liability on unfunded commitments | | | — | | | | — | | | | (473 | ) |
Net payments from FDIC under loss sharing agreements | | | (247,976 | ) | | | (256,498 | ) | | | (396,223 | ) |
Other adjustments attributable to FDIC loss sharing agreements | | | (6,882 | ) | | | (23,150 | ) | | | (26,029 | ) |
| | | | | | | | | | | | |
Balance at end of period | | $ | 310,221 | | | $ | 542,454 | | | $ | 909,414 | |
| | | | | | | | | | | | |
As a result of the expiration of the shared-loss arrangement under the commercial loss-share agreement on June 30, 2015, loans with a carrying amount at June 30, 2015 of approximately $248.7 million, which were reclassified to “non-covered” in the accompanying statement of financial condition, are subject to the resolution of several arbitration proceedings currently ongoing with the FDIC related primarily to (i) the FDIC’s denial of reimbursements for certain charge-offs claimed by BPPR with respect to certain loans and the treatment of those loans as “shared-loss assets” under the commercial loss-share agreement; and (ii) the denial by the FDIC of portfolio sale proposals submitted by BPPR pursuant to the applicable commercial shared-loss agreement provision governing portfolio sales. Until the disputes described above are finally resolved, the terms of the commercial loss-share agreement will remain in effect with respect to any such items under dispute. As of December 31, 2015, losses amounting to $149 million related to these assets are reflected in the FDIC indemnification asset as a receivable from the FDIC. Refer to additional information of these disputes on Note 30, Commitments and Contingencies.
The weighted average life of the single family loan portfolio accounted for under ASC 310-30 subject to the FDIC loss-sharing agreement at December 31, 2015 is 7.61 years.
As part of the loss share agreement, BPPR agreed to make a true-up payment obligation (the “true-up payment”) to the FDIC on the date that is 45 days following the last day (the “true-up measurement date”) of the final shared loss month, or upon the final disposition of all covered assets under the loss sharing agreements in the event losses on the loss sharing agreements fail to reach expected levels. The estimated fair value of such true-up payment obligation is recorded as contingent consideration, which is included in the caption of other liabilities in the consolidated statements of financial condition. Under the loss sharing agreements, BPPR will pay to the FDIC 50% of the excess, if any, of: (i) 20% of the intrinsic loss estimate of $4.6 billion (or $925 million)(as determined by the FDIC) less (ii) the sum of: (A) 25% of the asset discount (per bid) (or ($1.1 billion)); plus (B) 25% of the cumulative shared-loss payments (defined as the aggregate of all of the payments made or payable to BPPR minus the aggregate of all of the payments made or payable to the FDIC); plus (C) the sum of the period servicing amounts for every consecutive twelve-month period prior to and ending on the true-up measurement date in respect of each of the loss sharing agreements during which the loss sharing provisions of the applicable loss sharing agreement is in effect (defined as the product of the simple average of the principal amount of shared loss loans and shared loss assets at the beginning and end of such period times 1%).
186
Of the four components used to estimate the true-up payment obligation (intrinsic loss estimate, asset discount, cumulative shared-loss payments, and period servicing amounts) only the cumulative shared-loss payments and the period servicing amounts will change on a quarterly basis. These two variables are the main drivers of changes in the undiscounted true-up payment obligation. In order to estimate the true-up obligation actual and expected portfolio performance for loans under both the commercial and residential loss sharing agreement are contemplated. The cumulative shared loss payments and cumulative servicing amounts are derived from our quarterly loss reassessment process for covered loans accounted for under ASC310-30.
Once the undiscounted true-up payment obligation is determined, the fair value is estimated based on the contractual remaining term to settle the obligation and a discount rate that is composed of the sum of the interpolated US Treasury Note (“T Note”), defined by the remaining term of the true-up payment obligation, and a risk premium determined by the spread of the Corporation’s outstanding senior unsecured debt over the equivalent T Note.
The following table provides the fair value and the undiscounted amount of the true-up payment obligation at December 31, 2015 and 2014.
| | | | | | | | |
(In thousands) | | December 31, 2015 | | | December 31, 2014 | |
Carrying amount (fair value) | | $ | 119,745 | | | $ | 129,304 | |
Undiscounted amount | | $ | 168,692 | | | $ | 187,238 | |
The reduction in fair value experienced between 2014 and 2015 was mainly driven by an 89 basis points increase in the discount rate being applied, from 6.75% in 2014 to 7.64% in 2015. A higher risk premium was the driver of the increase in the discount rate.
The loss-share agreements contain specific terms and conditions regarding the management of the covered assets that BPPR must follow in order to receive reimbursement on losses from the FDIC. Under the loss-share agreements, BPPR must:
| | • | | manage and administer the covered assets and collect and effect charge-offs and recoveries with respect to such covered assets in a manner consistent with its usual and prudent business and banking practices and, with respect to single family shared-loss loans, the procedures (including collection procedures) customarily employed by BPPR in servicing and administering mortgage loans for its own account and the servicing procedures established by FNMA or the Federal Home Loan Mortgage Corporation (“FHLMC”), as in effect from time to time, and in accordance with accepted mortgage servicing practices of prudent lending institutions; |
| | • | | exercise its best judgment in managing, administering and collecting amounts on covered assets and effecting charge-offs with respect to the covered assets; |
| | • | | use commercially reasonable efforts to maximize recoveries with respect to losses on single family shared-loss assets and best efforts to maximize collections with respect to commercial shared-loss assets; |
| | • | | retain sufficient staff to perform the duties under the loss-share agreements; |
| | • | | adopt and implement accounting, reporting, record-keeping and similar systems with respect to the commercial shared-loss assets; |
| | • | | comply with the terms of the modification guidelines approved by the FDIC or another federal agency for any single-family shared-loss loan; |
| | • | | provide notice with respect to proposed transactions pursuant to which a third party or affiliate will manage, administer or collect any commercial shared-loss assets; |
| | • | | file monthly and quarterly certificates with the FDIC specifying the amount of losses, charge-offs and recoveries; and |
| | • | | maintain books and records sufficient to ensure and document compliance with the terms of the loss-share agreements. |
Refer to Note 30, Commitment and Contingencies, for additional information on the settlement of the arbitration proceedings with the FDIC regarding the commercial loss-share agreement.
187
Note 15 – Mortgage banking activities
Income from mortgage banking activities includes mortgage servicing fees earned in connection with administering residential mortgage loans and valuation adjustments on mortgage servicing rights. It also includes gain on sales and securitizations of residential mortgage loans and trading gains and losses on derivative contracts used to hedge the Corporation’s securitization activities. In addition, lower-of-cost-or-market valuation adjustments to residential mortgage loans held for sale, if any, are recorded as part of the mortgage banking activities.
The following table presents the components of mortgage banking activities:
| | | | | | | | | | | | |
| | | Years ended December 31, | |
(In thousands) | | 2015 | | | 2014 | | | 2013 | |
Mortgage servicing fees, net of fair value adjustments: | | | | | | | | | | | | |
Mortgage servicing fees | | $ | 59,461 | | | $ | 41,761 | | | $ | 45,465 | |
Mortgage servicing rights fair value adjustments | | | (7,904 | ) | | | (24,683 | ) | | | (11,403 | ) |
| | | | | | | | | | | | |
Total mortgage servicing fees, net of fair value adjustments | | | 51,557 | | | | 17,078 | | | | 34,062 | |
| | | | | | | | | | | | |
Net gain on sale of loans, including valuation on loans held for sale | | | 35,336 | | | | 31,213 | | | | 26,719 | |
| | | | | | | | | | | | |
Trading account (loss) profit: | | | | | | | | | | | | |
Unrealized gains (losses) on outstanding derivative positions | | | 17 | | | | (726 | ) | | | 746 | |
Realized (losses) gains on closed derivative positions | | | (5,108 | ) | | | (16,950 | ) | | | 10,130 | |
| | | | | | | | | | | | |
Total trading account (loss) profit | | | (5,091 | ) | | | (17,676 | ) | | | 10,876 | |
| | | | | | | | | | | | |
Total mortgage banking activities | | $ | 81,802 | | | $ | 30,615 | | | $ | 71,657 | |
| | | | | | | | | | | | |
188
Note 16 – Transfers of financial assets and mortgage servicing assets
The Corporation typically transfers conforming residential mortgage loans in conjunction with GNMA and FNMA securitization transactions whereby the loans are exchanged for cash or securities and servicing rights. The securities issued through these transactions are guaranteed by the corresponding agency and, as such, under seller/service agreements the Corporation is required to service the loans in accordance with the agencies’ servicing guidelines and standards. Substantially, all mortgage loans securitized by the Corporation in GNMA and FNMA securities have fixed rates and represent conforming loans. As seller, the Corporation has made certain representations and warranties with respect to the originally transferred loans and, in the past, has sold certain loans with credit recourse to a government-sponsored entity, namely FNMA. Refer to Note 29 to the consolidated financial statements for a description of such arrangements.
No liabilities were incurred as a result of these securitizations during the years ended December 31, 2015 and 2014 because they did not contain any credit recourse arrangements. The Corporation recorded a gain of $32.6 million and $32.8 million, respectively, during the years ended December 31, 2015 and 2014 related to the residential mortgage loan securitized.
The following tables present the initial fair value of the assets obtained as proceeds from residential mortgage loans securitized during the years ended December 31, 2015 and 2014:
| | | | | | | | | | | | | | | | |
| | | Proceeds obtained during the year ended December 31, 2015 | |
(In thousands) | | Level 1 | | | Level 2 | | | Level 3 | | | Initial fair value | |
Assets | | | | | | | | | | | | | | | | |
Trading account securities: | | | | | | | | | | | | | | | | |
Mortgage-backed securities - GNMA | | $ | — | | | $ | 869,210 | | | $ | — | | | $ | 869,210 | |
Mortgage-backed securities - FNMA | | | — | | | | 218,911 | | | | — | | | | 218,911 | |
| | | | | | | | | | | | | | | | |
Total trading account securities | | $ | — | | | $ | 1,088,121 | | | $ | — | | | $ | 1,088,121 | |
| | | | | | | | | | | | | | | | |
Mortgage servicing rights | | $ | — | | | $ | — | | | $ | 12,549 | | | $ | 12,549 | |
| | | | | | | | | | | | | | | | |
Total | | $ | — | | | $ | 1,088,121 | | | $ | 12,549 | | | $ | 1,100,670 | |
| | | | | | | | | | | | | | | | |
| |
| | | Proceeds obtained during the year ended December 31, 2014 | |
(In thousands) | | Level 1 | | | Level 2 | | | Level 3 | | | Initial fair value | |
Assets | | | | | | | | | | | | | | | | |
Trading account securities: | | | | | | | | | | | | | | | | |
Mortgage-backed securities - GNMA | | $ | — | | | $ | 674,557 | | | $ | — | | | $ | 674,557 | |
Mortgage-backed securities - FNMA | | | — | | | | 225,047 | | | | — | | | | 225,047 | |
| | | | | | | | | | | | | | | | |
Total trading account securities | | $ | — | | | $ | 899,604 | | | $ | — | | | $ | 899,604 | |
| | | | | | | | | | | | | | | | |
Mortgage servicing rights | | $ | — | | | $ | — | | | $ | 11,560 | | | $ | 11,560 | |
| | | | | | | | | | | | | | | | |
Total | | $ | — | | | $ | 899,604 | | | $ | 11,560 | | | $ | 911,164 | |
| | | | | | | | | | | | | | | | |
During the year ended December 31, 2015 the Corporation retained servicing rights on whole loan sales involving approximately $69 million in principal balance outstanding (2014 - $86 million), with net realized gains of approximately $2.7 million (2014 - $3.2 million). All loan sales performed during the year ended December 31, 2015 and 2014 were without credit recourse agreements.
The Corporation recognizes as assets the rights to service loans for others, whether these rights are purchased or result from asset transfers such as sales and securitizations. These mortgage servicing rights (“MSR”) are measured at fair value.
The Corporation uses a discounted cash flow model to estimate the fair value of MSRs. The discounted cash flow model incorporates assumptions that market participants would use in estimating future net servicing income, including estimates of prepayment speeds, discount rate, cost to service, escrow account earnings, contractual servicing fee income, prepayment and late fees, among other considerations. Prepayment speeds are adjusted for the Corporation’s loan characteristics and portfolio behavior.
189
The following table presents the changes in MSRs measured using the fair value method for the years ended December 31, 2015 and 2014.
| | | | | | | | |
Residential MSRs | |
(In thousands) | | 2015 | | | 2014 | |
Fair value at beginning of period | | $ | 148,694 | | | $ | 161,099 | |
Additions[1] | | | 76,060 | | | | 12,368 | |
Changes due to payments on loans[2] | | | (17,539 | ) | | | (15,887 | ) |
Reduction due to loan repurchases | | | (1,897 | ) | | | (2,759 | ) |
Changes in fair value due to changes in valuation model inputs or assumptions | | | 6,087 | | | | (6,127 | ) |
| | | | | | | | |
Fair value at end of period | | $ | 211,405 | | | $ | 148,694 | |
| | | | | | | | |
| [1] | Includes $54.9 million from the acquisition of mortgage servicing rights from the FDIC as a receiver for Doral Bank during the second quarter of 2015. |
| [2] | Represents the change due to collection / realization of expected cash flow over time. |
During the second quarter of 2015, BPPR completed the acquisition of mortgage servicing rights on three pools of residence mortgage loans serviced for GNMA, FNMA and FHLMC, with an unpaid principal balance of approximately $5.0 billion, from the FDIC as a receiver for Doral Bank, as part of the Doral Bank Transaction. The aggregate purchase price for the mortgage servicing rights and related servicing advances was approximately $56.2 million.
During the third quarter of 2015, BPPR acquired mortgage servicing rights for a portfolio previously serviced by Doral Bank, with approximately $873 million in unpaid principal balance and a fair value of $4.4 million, in connection with a pre-existing backup servicing agreement. The Corporation also purchased the servicing advances related to this portfolio from the FDIC, as receiver of Doral Bank, for a price of $46.6 million.
Residential mortgage loans serviced for others were $20.6 billion at December 31, 2015 (2014 - $15.6 billion).
Net mortgage servicing fees, a component of mortgage banking activities in the consolidated statements of operations, include the changes from period to period in the fair value of the MSRs, including changes due to collection / realization of expected cash flows. Mortgage servicing fees, excluding fair value adjustments, for the year ended December 31, 2015 amounted to $59.5 million (2014 - $41.8 million; 2013 - $45.5 million). The banking subsidiaries receive servicing fees based on a percentage of the outstanding loan balance. At December 31, 2015, those weighted average mortgage servicing fees were 0.28% (2014 – 0.26%). Under these servicing agreements, the banking subsidiaries do not generally earn significant prepayment penalty fees on the underlying loans serviced.
The section below includes information on assumptions used in the valuation model of the MSRs, originated and purchased.
Key economic assumptions used in measuring the servicing rights derived from loans securitized or sold by the Corporation during the years ended December 31, 2015 and 2014 were as follows:
| | | | | | | | |
| | | Years ended | |
| | | December 31, 2015 | | | December 31, 2014 | |
Prepayment speed | | | 8.6 | % | | | 6.1 | % |
Weighted average life | | | 7.1 years | | | | 16.4 years | |
Discount rate (annual rate) | | | 11.1 | % | | | 10.8 | % |
190
Key economic assumptions used to estimate the fair value of MSRs derived from sales and securitizations of mortgage loans performed by the banking subsidiaries and the sensitivity to immediate changes in those assumptions at December 31, 2015 and 2014 were as follows:
| | | | | | | | |
| Originated MSRs | |
| | | December 31, | |
(In thousands) | | 2015 | | | 2014 | |
Fair value of servicing rights | | $ | 98,648 | | | $ | 110,534 | |
Weighted average life | | | 7.3 years | | | | 11.7 years | |
Weighted average prepayment speed (annual rate) | | | 6.0 | % | | | 8.6 | % |
Impact on fair value of 10% adverse change | | $ | (2,488 | ) | | $ | (4,089 | ) |
Impact on fair value of 20% adverse change | | $ | (5,241 | ) | | $ | (7,995 | ) |
Weighted average discount rate (annual rate) | | | 11.5 | % | | | 11.5 | % |
Impact on fair value of 10% adverse change | | $ | (4,083 | ) | | $ | (4,492 | ) |
Impact on fair value of 20% adverse change | | $ | (8,206 | ) | | $ | (8,701 | ) |
The banking subsidiaries also own servicing rights purchased from other financial institutions. The fair value of purchased MSRs, their related valuation assumptions and the sensitivity to immediate changes in those assumptions at December 31, 2015 and 2014 were as follows:
| | | | | | | | |
| Purchased MSRs | |
| | | December 31, | |
(In thousands) | | 2015 | | | 2014 | |
Fair value of servicing rights | | $ | 112,757 | | | $ | 38,160 | |
Weighted average life | | | 6.2 years | | | | 11.0 years | |
Weighted average prepayment speed (annual rate) | | | 6.9 | % | | | 9.1 | % |
Impact on fair value of 10% adverse change | | $ | (2,871 | ) | | $ | (1,620 | ) |
Impact on fair value of 20% adverse change | | $ | (6,034 | ) | | $ | (2,924 | ) |
Weighted average discount rate (annual rate) | | | 11.0 | % | | | 10.7 | % |
Impact on fair value of 10% adverse change | | $ | (4,211 | ) | | $ | (1,603 | ) |
Impact on fair value of 20% adverse change | | $ | (8,525 | ) | | $ | (2,877 | ) |
The sensitivity analyses presented in the tables above for servicing rights are hypothetical and should be used with caution. As the figures indicate, changes in fair value based on a 10 and 20 percent variation in assumptions generally cannot be extrapolated because the relationship of the change in assumption to the change in fair value may not be linear. Also, in the sensitivity tables included herein, the effect of a variation in a particular assumption on the fair value of the retained interest is calculated without changing any other assumption. In reality, changes in one factor may result in changes in another (for example, increases in market interest rates may result in lower prepayments and increased credit losses), which might magnify or counteract the sensitivities.
At December 31, 2015, the Corporation serviced $1.9 billion (2014 - $2.1 billion) in residential mortgage loans with credit recourse to the Corporation.
Under the GNMA securitizations, the Corporation, as servicer, has the right to repurchase (but not the obligation), at its option and without GNMA’s prior authorization, any loan that is collateral for a GNMA guaranteed mortgage-backed security when certain delinquency criteria are met. At the time that individual loans meet GNMA’s specified delinquency criteria and are eligible for repurchase, the Corporation is deemed to have regained effective control over these loans if the Corporation was the pool issuer. At December 31, 2015, the Corporation had recorded $140 million in mortgage loans on its consolidated statements of financial condition related to this buy-back option program (2014 - $81 million). As long as the Corporation continues to service the loans that continue to be collateral in a GNMA guaranteed mortgage-backed security, the MSR is recognized by the Corporation. During the
191
year ended December 31, 2015, the Corporation repurchased approximately $80 million of mortgage loans under the GNMA buy-back option program (2014 - $145 million). The determination to repurchase these loans was based on the economic benefits of the transaction, which results in a reduction of the servicing costs for these severely delinquent loans, mostly related to principal and interest advances. Furthermore, due to their guaranteed nature, the risk associated with the loans is minimal. The Corporation places these loans under its loss mitigation programs and once brought back to current status, these may be either retained in portfolio or re-sold in the secondary market.
Quantitative information about delinquencies, net credit losses, and components of securitized financial assets and other assets managed together with them by the Corporation, including its own loan portfolio, for the years ended December 31, 2015 and 2014, are disclosed in the following tables. Loans securitized/sold represent loans in which the Corporation has continuing involvement in the form of credit recourse.
| | | | | | | | | | | | |
2015 | |
(In thousands) | | Total principal amount of
loans, net of unearned | | | Principal amount
60 days or more
past due | | | Net credit losses
(recoveries) | |
Loans (owned and managed): | | | | | | | | | | | | |
Commercial | | $ | 10,144,237 | | | $ | 411,291 | | | $ | 107,955 | |
Construction | | | 681,201 | | | | 14,086 | | | | (886 | ) |
Legacy | | | 64,436 | | | | 4,311 | | | | (2,760 | ) |
Lease financing | | | 627,650 | | | | 4,639 | | | | 3,303 | |
Mortgage | | | 9,011,473 | | | | 1,188,290 | | | | 47,552 | |
Consumer | | | 3,837,679 | | | | 106,194 | | | | 92,926 | |
Covered loans | | | 646,115 | | | | 101,451 | | | | 58,880 | |
Less: | | | | | | | | | | | | |
Loans securitized / sold | | | 1,883,561 | | | | 144,568 | | | | 811 | |
Loans held-for-sale | | | 137,000 | | | | 45,719 | | | | 37,602 | |
| | | | | | | | | | | | |
Loans held-in-portfolio | | $ | 22,992,230 | | | $ | 1,639,975 | | | $ | 268,557 | |
| | | | | | | | | | | | |
192
| | | | | | | | | | | | |
2014 | |
(In thousands) | | Total principal amount of
loans, net of unearned | | | Principal amount
60 days or more
past due | | | Net credit losses
(recoveries) | |
Loans (owned and managed): | | | | | | | | | | | | |
Commercial | | $ | 8,134,576 | | | $ | 278,326 | | | $ | 53,990 | |
Construction | | | 251,820 | | | | 13,812 | | | | (3,746 | ) |
Legacy | | | 81,137 | | | | 3,476 | | | | (892 | ) |
Lease financing | | | 564,389 | | | | 4,348 | | | | 3,961 | |
Mortgage | | | 8,741,757 | | | | 1,164,513 | | | | 54,041 | |
Consumer | | | 3,875,581 | | | | 99,595 | | | | 109,737 | |
Covered loans | | | 2,542,662 | | | | 540,369 | | | | 66,154 | |
Less: | | | | | | | | | | | | |
Loans securitized / sold | | | 2,138,705 | | | | 183,876 | | | | 1,314 | |
Loans held-for-sale | | | 106,104 | | | | 19,878 | | | | 35,674 | |
| | | | | | | | | | | | |
Loans held-in-portfolio | | $ | 21,947,113 | | | $ | 1,900,685 | | | $ | 246,257 | |
| | | | | | | | | | | | |
Note 17 -Premises and equipment
The premises and equipment are stated at cost less accumulated depreciation and amortization as follows:
| | | | | | | | | | |
(In thousands) | | Useful life in years | | 2015 | | | 2014 | |
Land | | | | $ | 116,701 | | | $ | 115,176 | |
| | | | | | | | | | |
Buildings | | 10-50 | | | 495,631 | | | | 483,983 | |
Equipment | | 2-10 | | | 302,656 | | | | 290,444 | |
Leasehold improvements | | 3-10 | | | 70,449 | | | | 69,443 | |
| | | | | | | | | | |
| | | | | 868,736 | | | | 843,870 | |
Less - Accumulated depreciation and amortization | | | | | 503,829 | | | | 475,162 | |
| | | | | | | | | | |
Subtotal | | | | | 364,907 | | | | 368,708 | |
| | | | | | | | | | |
Construction in progress | | | | | 21,003 | | | | 10,697 | |
| | | | | | | | | | |
Total premises and equipment, net | | | | $ | 502,611 | | | $ | 494,581 | |
| | | | | | | | | | |
Depreciation and amortization of premises and equipment for the year 2015 was $47.5 million (2014 -$47.1 million; 2013 - $48.2 million), of which $22.9 million (2014 - $23.8 million; 2013 - $24.8 million) was charged to occupancy expense and $24.6 million (2014 - $23.3 million; 2013 - $23.4 million) was charged to equipment, communications and other operating expenses. Occupancy expense is net of rental income of $28.1 million (2014 - $28.1 million; 2013 - $26.6 million).
193
Note 18 – Other real estate owned
The following tables present the activity related to Other Real Estate Owned (“OREO”), for the years ended December 31, 2015, 2014 and 2013. During the second quarter of 2015, the Corporation completed a bulk sale of $37 million of covered OREOs.
| | | | | | | | | | | | | | | | | | | | |
| | | For the year ended December 31, 2015 | |
(In thousands) | | Non-covered
OREO
Commercial/ Construction | | | Non-covered
OREO
Mortgage | | | Covered
OREO
Commercial/ Construction | | | Covered
OREO
Mortgage | | | Total | |
Balance at beginning of period | | $ | 38,983 | | | $ | 96,517 | | | $ | 85,394 | | | $ | 44,872 | | | $ | 265,766 | |
Write-downs in value | | | (13,356 | ) | | | (8,567 | ) | | | (20,350 | ) | | | (3,891 | ) | | | (46,164 | ) |
Additions | | | 17,671 | | | | 86,040 | | | | 9,661 | | | | 25,019 | | | | 138,391 | |
Sales | | | (25,065 | ) | | | (53,782 | ) | | | (59,749 | ) | | | (25,990 | ) | | | (164,586 | ) |
Other adjustments | | | (266 | ) | | | (540 | ) | | | (452 | ) | | | (233 | ) | | | (1,491 | ) |
Transfer to non-covered status[1] | | | 14,504 | | | | 3,092 | | | | (14,504 | ) | | | (3,092 | ) | | | — | |
| | | | | | | | | | | | | | | | | | | | |
Ending balance | | $ | 32,471 | | | $ | 122,760 | | | $ | — | | | $ | 36,685 | | | $ | 191,916 | |
| | | | | | | | | | | | | | | | | | | | |
| [1] | Represents the reclassification of OREOs to the non-covered category, pursuant to the expiration of the commercial and consumer shared-loss arrangement with the FDIC related to loans acquired from Westernbank, on June 30, 2015. |
| | | | | | | | | | | | | | | | | | | | |
| | | For the year ended December 31, 2014 | |
(In thousands) | | Non-covered
OREO
Commercial/ Construction | | | Non-covered
OREO
Mortgage | | | Covered
OREO
Commercial/ Construction | | | Covered
OREO
Mortgage | | | Total | |
Balance at beginning of period | | $ | 48,649 | | | $ | 86,852 | | | $ | 120,215 | | | $ | 47,792 | | | $ | 303,508 | |
Write-downs in value | | | (7,112 | ) | | | (3,628 | ) | | | (26,657 | ) | | | (4,969 | ) | | | (42,366 | ) |
Additions | | | 16,200 | | | | 65,300 | | | | 55,582 | | | | 21,769 | | | | 158,851 | |
Sales | | | (20,042 | ) | | | (49,618 | ) | | | (59,219 | ) | | | (19,028 | ) | | | (147,907 | ) |
Other adjustments | | | 1,288 | | | | (2,389 | ) | | | (4,527 | ) | | | (692 | ) | | | (6,320 | ) |
| | | | | | | | | | | | | | | | | | | | |
Ending balance | | $ | 38,983 | | | $ | 96,517 | | | $ | 85,394 | | | $ | 44,872 | | | $ | 265,766 | |
| | | | | | | | | | | | | | | | | | | | |
| |
| | | For the year ended December 31, 2013 | |
(In thousands) | | Non-covered
OREO
Commercial/ Construction | | | Non-covered
OREO
Mortgage | | | Covered
OREO
Commercial/ Construction | | | Covered
OREO
Mortgage | | | Total | |
Balance at beginning of period | | $ | 135,862 | | | $ | 130,982 | | | $ | 99,398 | | | $ | 39,660 | | | $ | 405,902 | |
Write-downs in value | | | (11,377 | ) | | | (9,525 | ) | | | (18,857 | ) | | | (4,102 | ) | | | (43,861 | ) |
Additions | | | 32,175 | | | | 82,985 | | | | 87,800 | | | | 30,037 | | | | 232,997 | |
Sales | | | (108,254 | ) | | | (118,596 | ) | | | (48,447 | ) | | | (17,720 | ) | | | (293,017 | ) |
Other adjustments | | | 243 | | | | 1,006 | | | | 321 | | | | (83 | ) | | | 1,487 | |
| | | | | | | | | | | | | | | | | | | | |
Ending balance | | $ | 48,649 | | | $ | 86,852 | | | $ | 120,215 | | | $ | 47,792 | | | $ | 303,508 | |
| | | | | | | | | | | | | | | | | | | | |
194
Note 19 – Other assets
The caption of other assets in the consolidated statements of financial condition consists of the following major categories:
| | | | | | | | |
(In thousands) | | 2015 | | | 2014 | |
Net deferred tax assets (net of valuation allowance) | | $ | 1,302,452 | | | $ | 812,819 | |
Investments under the equity method | | | 212,838 | | | | 225,625 | |
Prepaid taxes | | | 180,969 | | | | 198,120 | |
Other prepaid expenses | | | 87,016 | | | | 84,079 | |
Derivative assets | | | 16,959 | | | | 25,362 | |
Trades receivables from brokers and counterparties | | | 78,759 | | | | 66,949 | |
Others | | | 321,970 | | | | 233,489 | |
| | | | | | | | |
Total other assets | | $ | 2,200,963 | | | $ | 1,646,443 | |
| | | | | | | | |
Prepaid taxes at December 31, 2015 and December 31, 2014 includes a payment of $45 million in income taxes in connection with the Closing Agreement signed with the Puerto Rico Department of Treasury on June 30, 2014.
As discussed in Note 42, the corporation recorded during the year ended December 31, 2015 a partial reversal of the valuation allowance on its deferred tax assets from its U.S. operations for approximately $589 million.
195
Note 20 - Investments in equity investees
During the year ended December 31, 2015, the Corporation recorded earnings of $24.4 million, from its equity investments, compared to $39.6 million for the year ended December 31, 2014. The carrying value of the Corporation’s equity method investments was $213 million and $226 million at December 31, 2015 and 2014, respectively.
The following table presents aggregated summarized financial information of the Corporation’s equity method investees:
| | | | | | | | | | | | |
Years ended December 31, | | 2015 | | | 2014 | | | 2013 | |
| (In thousands) | | | | | | | | | |
Operating results: | | | | | | | | | | | | |
Total revenues | | $ | 643,632 | | | $ | 715,966 | | | $ | 1,302,637 | |
Total expenses | | | 414,975 | | | | 343,100 | | | | 1,024,713 | |
Income tax (benefit) expense | | | 33,920 | | | | 43,993 | | | | 39,301 | |
| | | | | | | | | | | | |
Net income | | $ | 194,737 | | | $ | 328,873 | | | $ | 238,623 | |
| | | | | | | | | | | | |
| | | | | | | | |
At December 31, | | 2015 | | | 2014 | |
| (In thousands) | | | | | | |
Balance Sheet: | | | | | | | | |
Total assets | | $ | 7,647,048 | | | $ | 7,421,225 | |
Total liabilities | | $ | 5,388,229 | | | $ | 5,182,478 | |
Summarized financial information for these investees may be presented on a lag, due to the unavailability of information for the investees, at the respective balance sheet dates.
196
Note 21 – Goodwill and other intangible assets
The changes in the carrying amount of goodwill for the years ended December 31, 2015, and 2014, allocated by reportable segments, were as follows (refer to Note 44for the definition of the Corporation’s reportable segments):
| | | | | | | | | | | | | | | | |
2015 | |
(In thousands) | | Balance at
January 1, 2015 | | | Goodwill on
acquisition | | | Purchase
accounting
adjustments | | | Balance at
December 31, 2015 | |
Banco Popular de Puerto Rico | | $ | 250,109 | | | $ | 3,899 | | | $ | 26,213 | | | $ | 280,221 | |
Banco Popular North America | | | 215,567 | | | | 38,735 | | | | 91,865 | | | | 346,167 | |
| | | | | | | | | | | | | | | | |
Total Popular, Inc. | | $ | 465,676 | | | $ | 42,634 | | | $ | 118,078 | | | $ | 626,388 | |
| | | | | | | | | | | | | | | | |
| | | | | | | | | | | | | | | | | | | | |
2014 | |
(In thousands) | | Balance at
January 1, 2014 | | | Goodwill on
acquisition | | | Purchase
accounting
adjustments | | | Goodwill
written-off
related to
discontinued
operations | | | Balance at
December 31, 2014 | |
Banco Popular de Puerto Rico | | $ | 245,679 | | | $ | 4,430 | | | $ | — | | | $ | — | | | $ | 250,109 | |
Banco Popular North America | | | 402,078 | | | | — | | | | — | | | | (186,511 | ) | | | 215,567 | |
| | | | | | | | | | | | | | | | | | | | |
Total Popular, Inc. | | $ | 647,757 | | | $ | 4,430 | | | $ | — | | | $ | (186,511 | ) | | $ | 465,676 | |
| | | | | | | | | | | | | | | | | | | | |
The goodwill acquired during 2015 in the reportable segments of Banco Popular de Puerto Rico and Banco Popular North America of $32.5 million and $130.6 million, respectively, after purchase accounting adjustments, was related to the Doral Bank Transaction. During the year ended December 31, 2015, the Corporation recorded adjustments to its initial fair value estimates resulting in a net increase of the goodwill recorded in connection with the Doral Bank Transaction of approximately $120.5 million. Refer to Note 5, Business Combination, for additional information. In addition, the Corporation recorded purchase accounting adjustments to reduce the goodwill related to the acquisition of an insurance benefits business during the year ended December 31, 2014 by approximately $2.4 million.
The goodwill acquired during 2014 of $4.4 million was related to the acquisition of an insurance benefits business.
At December 31, 2015 and 2014, the Corporation had $ 6.1 million of identifiable intangible assets, with indefinite useful lives, mostly associated with E-LOAN’s trademark.
197
The following table reflects the components of other intangible assets subject to amortization:
| | | | | | | | | | | | |
(In thousands) | | Gross
Carrying
Amount | | | Accumulated
Amortization | | | Net
Carrying
Value | |
December 31, 2015 | | | | | | | | | | | | |
Core deposits | | $ | 63,539 | | | $ | 38,464 | | | $ | 25,075 | |
Other customer relationships | | | 37,665 | | | | 10,745 | | | | 26,920 | |
| | | | | | | | | | | | |
Total other intangible assets | | $ | 101,204 | | | $ | 49,209 | | | $ | 51,995 | |
| | | | | | | | | | | | |
December 31, 2014 | | | | | | | | | | | | |
Core deposits | | $ | 50,679 | | | $ | 32,006 | | | $ | 18,673 | |
Other customer relationships | | | 19,452 | | | | 6,644 | | | | 12,808 | |
| | | | | | | | | | | | |
Total other intangible assets | | $ | 70,131 | | | $ | 38,650 | | | $ | 31,481 | |
| | | | | | | | | | | | |
During the year ended 2015, the Corporation recorded $12.8 million in core deposit intangibles related to the Doral Bank Transaction, net of purchase accounting adjustments of $10.8 million. Also, the Corporation recorded $17.3 million in customer relationship intangibles related to the purchase of the Doral Insurance Agency portfolio which was part of a separate bidding process after Doral Financial Corporation filed for bankruptcy. During the year ended 2014, the Corporation acquired $1.9 million in customer relationship intangibles related to the purchase of the above mentioned insurance benefits business. Core deposits and other intangibles with gross amount of $27 million became fully amortized during 2014.
During the year ended December 31, 2015, the Corporation recognized $ 11.0 million in amortization expense related to other intangible assets with definite useful lives (2014 - $ 8.2 million; 2013 - $ 8.0 million).
The following table presents the estimated amortization of the intangible assets with definite useful lives for each of the following periods:
| | | | |
(In thousands) | | | |
Year 2016 | | $ | 12,338 | |
Year 2017 | | | 9,589 | |
Year 2018 | | | 9,497 | |
Year 2019 | | | 9,253 | |
Year 2020 | | | 5,055 | |
Results of the Goodwill Impairment Test
The Corporation’s goodwill and other identifiable intangible assets having an indefinite useful life are tested for impairment at least annually and on a more frequent basis if events or circumstances indicate impairment could have taken place. Such events could include, among others, a significant adverse change in the business climate, an adverse action by a regulator, an unanticipated change in the competitive environment and a decision to change the operations or dispose of a reporting unit.
Under applicable accounting standards, goodwill impairment analysis is a two-step test. The first step of the goodwill impairment test involves comparing the fair value of the reporting unit with its carrying amount, including goodwill. If the fair value of the reporting unit exceeds its carrying amount, goodwill of the reporting unit is considered not impaired; however, if the carrying amount of the reporting unit exceeds its fair value, the second step must be performed. The second step involves calculating an implied fair value of goodwill for each reporting unit for which the first step indicated possible impairment. The implied fair value of goodwill is determined in the same manner as the amount of goodwill recognized in a business combination, which is the excess of the fair value of the reporting unit, as determined in the first step, over the aggregate fair values of the individual assets, liabilities and identifiable intangibles (including any unrecognized intangible assets, such as unrecognized core deposits and trademark) as if the reporting unit was being acquired in a business combination and the fair value of the reporting unit was the price paid to acquire the reporting unit. The Corporation estimates the fair values of the assets and liabilities of a reporting unit, consistent with the requirements of the fair value measurements accounting standard, which defines fair value as the price that would be received to sell an asset or paid to transfer a liability in an orderly transaction between market participants at the measurement date. The fair
198
value of the assets and liabilities reflects market conditions, thus volatility in prices could have a material impact on the determination of the implied fair value of the reporting unit goodwill at the impairment test date. The adjustments to measure the assets, liabilities and intangibles at fair value are for the purpose of measuring the implied fair value of goodwill and such adjustments are not reflected in the consolidated statement of condition. If the implied fair value of goodwill exceeds the goodwill assigned to the reporting unit, there is no impairment. If the goodwill assigned to a reporting unit exceeds the implied fair value of the goodwill, an impairment charge is recorded for the excess. An impairment loss recognized cannot exceed the amount of goodwill assigned to a reporting unit, and the loss establishes a new basis in the goodwill. Subsequent reversal of goodwill impairment losses is not permitted under applicable accounting standards.
The Corporation performed the annual goodwill impairment evaluation for the entire organization during the third quarter of 2015 using July 31, 2015 as the annual evaluation date. The reporting units utilized for this evaluation were those that are one level below the business segments, which are the legal entities within the reportable segment. The Corporation assigns goodwill to the reporting units when carrying out a business combination.
In determining the fair value of a reporting unit, the Corporation generally uses a combination of methods, including market price multiples of comparable companies and transactions, as well as discounted cash flow analysis. Management evaluates the particular circumstances of each reporting unit in order to determine the most appropriate valuation methodology. The Corporation evaluates the results obtained under each valuation methodology to identify and understand the key value drivers in order to ascertain that the results obtained are reasonable and appropriate under the circumstances. Elements considered include current market and economic conditions, developments in specific lines of business, and any particular features in the individual reporting units.
The computations require management to make estimates and assumptions. Critical assumptions that are used as part of these evaluations include:
| | • | | a selection of comparable publicly traded companies, based on nature of business, location and size; |
| | • | | a selection of comparable acquisition and capital raising transactions; |
| | • | | the discount rate applied to future earnings, based on an estimate of the cost of equity; |
| | • | | the potential future earnings of the reporting unit; and |
| | • | | the market growth and new business assumptions. |
For purposes of the market comparable approach, valuations were determined by calculating average price multiples of relevant value drivers from a group of companies that are comparable to the reporting unit being analyzed and applying those price multiples to the value drivers of the reporting unit. Multiples used are minority based multiples and thus, no control premium adjustment is made to the comparable companies market multiples. While the market price multiple is not an assumption, a presumption that it provides an indicator of the value of the reporting unit is inherent in the valuation. The determination of the market comparables also involves a degree of judgment.
For purposes of the discounted cash flows (“DCF”) approach, the valuation is based on estimated future cash flows. The financial projections used in the DCF valuation analysis for each reporting unit are based on the most recent (as of the valuation date) financial projections presented to the Corporation’s Asset / Liability Management Committee (“ALCO”). The growth assumptions included in these projections are based on management’s expectations for each reporting unit’s financial prospects considering economic and industry conditions as well as particular plans of each entity (i.e. restructuring plans, de-leveraging, etc.). The cost of equity used to discount the cash flows was calculated using the Ibbotson Build-Up Method and ranged from 11.64% to 15.52% for the 2015 analysis. The Ibbotson Build-Up Method builds up a cost of equity starting with the rate of return of a “risk-free” asset (20-year U.S. Treasury note) and adds to it additional risk elements such as equity risk premium, size premium and industry risk premium. The resulting discount rates were analyzed in terms of reasonability given the current market conditions and adjustments were made when necessary.
For BPNA reporting unit, the average estimated fair value calculated in Step 1, using all valuation methodologies exceeded BPNA’s equity value by approximately $92 million in the July 31, 2015 annual test and by $205 million in the July 31, 2014 annual test. Accordingly, there is no indication of impairment of goodwill recorded in BPNA at July 31, 2015 and there is no need for a Step 2 analysis.
199
For the BPPR reporting unit, the average estimated fair value calculated in Step 1 using all valuation methodologies exceeded BPPR’s equity value by approximately $180 million in the July 31, 2015 annual test as compared with approximately $337 million at July 31, 2014. This result indicates there would be no indication of impairment on the goodwill recorded in BPPR at July 31, 2015. The goodwill balance of BPPR and BPNA, as legal entities, represented approximately 96% of the Corporation’s total goodwill balance as of the July 31, 2015 valuation date.
Furthermore, as part of the analyses, management performed a reconciliation of the aggregate fair values determined for the reporting units to the market capitalization of Popular, Inc. concluding that the fair value results determined for the reporting units in the July 31, 2015 annual assessment were reasonable.
The goodwill impairment evaluation process requires the Corporation to make estimates and assumptions with regard to the fair value of the reporting units. Actual values may differ significantly from these estimates. Such differences could result in future impairment of goodwill that would, in turn, negatively impact the Corporation’s results of operations and the reporting units where the goodwill is recorded. Declines in the Corporation’s market capitalization could increase the risk of goodwill impairment in the future.
Management monitors events or changes in circumstances between annual tests to determine if these events or changes in circumstances would more likely than not reduce the fair value of a reporting unit below its carrying amount. There has been a significant decline in the Corporation’s stock price during the fourth quarter of 2015, attributed to macro economic conditions in the global markets as well as the continued weakness in the Puerto Rico economy. This represented a triggering event which required management to conduct a goodwill impairment analysis as of December 31, 2015 for BPPR and BPNA. The Corporation used the same methodology as for the annual impairment test, including a reconciliation of the aggregate fair values determined for the reporting units to the market capitalization of Popular, Inc.
For the BPNA reporting unit, the average estimated fair value calculated in Step 1 using all valuation methodologies was below BPNA’s equity value by approximately $171 million in the December 31, 2015 test. Accordingly, management proceeded to perform the Step 2 analysis. The Corporation performed a valuation of all assets and liabilities of BPNA, including any recognized and unrecognized intangible assets, to determine the fair value of BPNA’s net assets. To complete Step 2, the Corporation subtracted from BPNA’s Step 1 fair value the determined fair value of the net assets to arrive at the implied fair value of goodwill. The results of Step 2 indicated that the implied fair value of goodwill exceeded the goodwill carrying value by $197 million resulting in no goodwill impairment.
For the BPPR reporting unit, the average estimated fair value calculated in Step 1 using all valuation methodologies exceeded BPPR’s equity value by approximately $313 million in the December 31, 2015 test. This result indicates there is no indication of impairment on the goodwill recorded in BPPR at December 31, 2015 and there is no need for a Step 2 analysis.
Further declines in the Corporation’s stock price, related to macroeconomic conditions in the global market as well as the weakness in the Puerto Rico economy may lead to an impairment of goodwill.
The goodwill balance of BPPR and BPNA, as legal entities, represented approximately 96% of the Corporation’s total goodwill balance as of the December 31, 2015 valuation date.
The following table presents the gross amount of goodwill and accumulated impairment losses by reportable segments.
| | | | | | | | | | | | | | | | | | | | | | | | |
December 31, 2015 | |
(In thousands) | | Balance at
January 1,
2015
(gross amounts) | | | Accumulated
impairment
losses | | | Balance at
January 1,
2015
(net amounts) | | | Balance at
December 31,
2015
(gross amounts) | | | Accumulated
impairment
losses | | | Balance at
December 31,
2015
(net amounts) | |
Banco Popular de Puerto Rico | | $ | 250,109 | | | $ | — | | | $ | 250,109 | | | $ | 280,221 | | | $ | — | | | $ | 280,221 | |
Banco Popular North America | | | 379,978 | | | | 164,411 | | | | 215,567 | | | | 510,578 | | | | 164,411 | | | | 346,167 | |
| | | | | | | | | | | | | | | | | | | | | | | | |
Total Popular, Inc. | | $ | 630,087 | | | $ | 164,411 | | | $ | 465,676 | | | $ | 790,799 | | | $ | 164,411 | | | $ | 626,388 | |
| | | | | | | | | | | | | | | | | | | | | | | | |
200
| | | | | | | | | | | | | | | | | | | | | | | | |
December 31, 2014 | |
(In thousands) | | Balance at
January 1,
2014
(gross amounts) | | | Accumulated
impairment
losses | | | Balance at
January 1,
2014
(net amounts) | | | Balance at
December 31,
2014
(gross amounts) | | | Accumulated
impairment
losses | | | Balance at
December 31,
2014
(net amounts) | |
Banco Popular de Puerto Rico | | $ | 245,679 | | | $ | — | | | $ | 245,679 | | | $ | 250,109 | | | $ | — | | | $ | 250,109 | |
Banco Popular North America | | | 566,489 | | | | 164,411 | | | | 402,078 | | | | 379,978 | | | | 164,411 | | | | 215,567 | |
| | | | | | | | | | | | | | | | | | | | | | | | |
Total Popular, Inc. | | $ | 812,168 | | | $ | 164,411 | | | $ | 647,757 | | | $ | 630,087 | | | $ | 164,411 | | | $ | 465,676 | |
| | | | | | | | | | | | | | | | | | | | | | | | |
Goodwill Impairment Test – U.S. Regional Sales
As discussed in Note 4, Discontinued Operations, on April 22, 2014, BPNA entered into definitive agreements to sell its regional operations in California, Illinois and Central Florida to three different buyers. In connection with the transactions, the Corporation has centralized certain back office operations in Puerto Rico and New York. During the second quarter of 2014, the assets and liabilities for those regions were reclassified as held-for-sale in accordance with ASC 360-10-45. As a result of the reclassification, and in accordance with ASC 350-20-40, BPNA allocated a proportionate share of the goodwill balance to the discontinued businesses on a relative fair value basis and performed an impairment test for the goodwill allocated to each of the discontinued operations as well as for retained business, each as a separate reporting unit. This allocation of goodwill and related impairment analysis resulted in an impairment charge of $186.5 million during the second quarter of 2014. The goodwill impairment charge is a non-cash charge that did not have an impact on the Corporation’s tangible capital or regulatory capital ratios. The goodwill impairment analysis of the retained portion of the BPNA operations resulted in no impairment as of June 30, 2014.
The methodology used to determine the relative value of the regions sold and the retained portion of the BPNA reporting unit for purpose of the goodwill allocation among these reporting units takes into consideration the fair value estimates resulting from a combination of: (1) the average price to tangible book multiple based on a regression analysis of the projected return on equity for comparable companies, (2) the average price to revenue multiple based on a regression analysis of the projected revenue margin for comparable companies, and (3) the average price to earnings multiple based on comparable companies. After allocating the carrying amount of goodwill to the regions sold and the retained portion, the Corporation performed the goodwill impairment test of ASC 350-20 to each region sold and to the retained business reporting unit. The fair value of each region was based on the transaction price agreed with the buyers as part of the Step 2 of the goodwill impairment analysis. This fair value was compared to the fair value of the assets and liabilities sold including any unrecognized intangible asset. The goodwill impairment analysis of the regions sold indicated that all the goodwill allocated to each region sold was impaired, and accordingly, the Corporation recorded an impairment charge of $186.5 million during the second quarter of 2014.
201
Note 22 – Deposits
Total interest bearing deposits as of the end of the periods presented consisted of:
| | | | | | | | |
(In thousands) | | December 31, 2015 | | | December 31, 2014 | |
Savings accounts | | $ | 7,010,391 | | | $ | 6,737,370 | |
NOW, money market and other interest bearing demand deposits | | | 5,632,449 | | | | 4,811,972 | |
| | | | | | | | |
Total savings, NOW, money market and other interest bearing demand deposits | | | 12,642,840 | | | | 11,549,342 | |
| | | | | | | | |
Certificates of deposit: | | | | | | | | |
Under $100,000 | | | 4,014,359 | | | | 4,211,180 | |
$100,000 and over | | | 4,151,009 | | | | 3,263,265 | |
| | | | | | | | |
Total certificates of deposit | | | 8,165,368 | | | | 7,474,445 | |
| | | | | | | | |
Total interest bearing deposits | | $ | 20,808,208 | | | $ | 19,023,787 | |
| | | | | | | | |
A summary of certificates of deposit by maturity at December 31, 2015 follows:
| | | | |
(In thousands) | | | |
2016 | | $ | 4,895,697 | |
2017 | | | 1,075,165 | |
2018 | | | 696,467 | |
2019 | | | 424,863 | |
2020 | | | 1,003,422 | |
2021 and thereafter | | | 69,754 | |
| | | | |
Total certificates of deposit | | $ | 8,165,368 | |
| | | | |
At December 31, 2015, the Corporation had brokered deposits amounting to $ 1.3 billion (December 31, 2014 - $ 1.9 billion).
The aggregate amount of overdrafts in demand deposit accounts that were reclassified to loans was $11 million at December 31, 2015 (December 31, 2014 - $9 million).
202
Note 23 – Borrowings
The following table presents the composition of fed funds purchased and assets sold under agreements to repurchase at December 31, 2015 and December 31, 2014.
| | | | | | | | |
(In thousands) | | December 31, 2015 | | | December 31, 2014 | |
| | |
Federal funds purchased | | $ | 50,000 | | | $ | 100,000 | |
| | |
Assets sold under agreements to repurchase | | | 712,145 | | | | 1,171,657 | |
| | | | | | | | |
Total federal funds purchased and assets sold under agreements to repurchase | | $ | 762,145 | | | $ | 1,271,657 | |
| | | | | | | | |
The following table presents information related to the Corporation’s repurchase transactions accounted for as secured borrowings that are collateralized with investment securities available-for-sale, other assets held-for-trading purposes or which have been obtained under agreements to resell. It is the Corporation’s policy to maintain effective control over assets sold under agreements to repurchase; accordingly, such securities continue to be carried on the consolidated statements of financial condition.
Repurchase agreements accounted for as secured borrowings
| | | | | | | | | | | | | | | | |
| | | December 31, 2015 | | | December 31, 2014 | |
(Dollars in thousands) | | Repurchase
liability | | | Repurchase liability
weighted average
interest rate | | | Repurchase
liability | | | Repurchase liability
weighted average
interest rate | |
Obligations of U.S. government sponsored entities | | | | | | | | | | | | | | | | |
Within 30 days | | $ | 243,708 | | | | 0.07 | % | | $ | 289,545 | | | | 0.36 | % |
After 30 to 90 days | | | — | | | | — | | | | 25,761 | | | | 0.34 | |
After 90 days | | | 23,366 | | | | 0.60 | | | | 420,176 | | | | 0.44 | |
| | | | | | | | | | | | | | | | |
Total obligations of U.S. government sponsored entities | | | 267,074 | | | | 0.12 | | | | 735,482 | | | | 0.41 | |
| | | | | | | | | | | | | | | | |
Obligations of Puerto Rico, states and political subdivisions | | | | | | | | | | | | | | | | |
Overnight | | | — | | | | — | | | | 23,397 | | | | 0.85 | |
Within 30 days | | | — | | | | — | | | | 5,199 | | | | 0.77 | |
| | | | | | | | | | | | | | | | |
Total Obligations of Puerto Rico, states and political subdivisions | | | — | | | | — | | | | 28,596 | | | | 0.84 | |
| | | | | | | | | | | | | | | | |
Mortgage-backed securities | | | | | | | | | | | | | | | | |
Overnight | | | — | | | | — | | | | 4,850 | | | | 0.85 | |
Within 30 days | | | 124,878 | | | | 0.72 | | | | 54,311 | | | | 0.43 | |
After 30 to 90 days | | | 154,582 | | | | 0.75 | | | | — | | | | — | |
After 90 days | | | 142,441 | | | | 1.84 | | | | 195,629 | | | | 1.42 | |
| | | | | | | | | | | | | | | | |
Total mortgage-backed securities | | | 421,901 | | | | 1.11 | | | | 254,790 | | | | 1.20 | |
| | | | | | | | | | | | | | | | |
Collateralized mortgage obligations | | | | | | | | | | | | | | | | |
Within 30 days | | | 10,298 | | | | 0.28 | | | | 16,700 | | | | 0.34 | |
After 30 to 90 days | | | 12,872 | | | | 0.75 | | | | 55,338 | | | | 0.56 | |
After 90 days | | | — | | | | — | | | | 71,281 | | | | 0.60 | |
| | | | | | | | | | | | | | | | |
Total collateralized mortgage obligations | | | 23,170 | | | | 0.54 | | | | 143,319 | | | | 0.55 | |
| | | | | | | | | | | | | | | | |
Other | | | | | | | | | | | | | | | | |
Overnight | | | — | | | | — | | | | 1,353 | | | | 0.85 | |
Within 30 days | | | — | | | | — | | | | 8,117 | | | | 0.85 | |
| | | | | | | | | | | | | | | | |
Total other | | | — | | | | — | | | | 9,470 | | | | 0.85 | |
| | | | | | | | | | | | | | | | |
Total | | $ | 712,145 | | | | 0.72 | % | | $ | 1,171,657 | | | | 0.61 | % |
| | | | | | | | | | | | | | | | |
Repurchase agreements in portfolio are generally short-term, often overnight and Popular acts as borrowers transferring assets to the counterparty. As such our risk is very limited. We manage the liquidity risks arising from secured funding by sourcing funding globally from a diverse group of counterparties, providing a range of securities collateral and pursuing longer durations, when appropriate.
203
Federal funds purchased and assets sold under agreements to repurchase:
| | | | | | | | |
(Dollars in thousands) | | 2015 | | | 2014 | |
Maximum aggregate balance outstanding at any month-end | | $ | 1,224,064 | | | $ | 2,208,213 | |
| | | | | | | | |
Average monthly aggregate balance outstanding | | $ | 1,023,905 | | | $ | 1,732,199 | |
| | | | | | | | |
Weighted average interest rate: | | | | | | | | |
For the year | | | 0.73 | % | | | 3.85 | % |
At December 31 | | | 0.88 | % | | | 0.62 | % |
The following table presents the composition of other short-term borrowings at December 31, 2015 and December 31, 2014.
| | | | | | | | |
(In thousands) | | December 31, 2015 | | | December 31, 2014 | |
Advances with the FHLB paying interest at maturity | | $ | — | | | $ | 20,000 | |
Others | | | 1,200 | | | | 1,200 | |
| | | | | | | | |
Total other short-term borrowings | | $ | 1,200 | | | $ | 21,200 | |
| | | | | | | | |
Other short-term borrowings:
| | | | | | | | |
(Dollars in thousands) | | 2015 | | | 2014 | |
Maximum aggregate balance outstanding at any month-end | | $ | 128,200 | | | $ | 801,200 | |
| | | | | | | | |
Average monthly aggregate balance outstanding | | $ | 4,501 | | | $ | 154,462 | |
| | | | | | | | |
Weighted average interest rate: | | | | | | | | |
For the year | | | 2.69 | % | | | 0.44 | % |
At December 31 | | | 9.00 | % | | | 0.36 | % |
The following table presents the composition of notes payable at December 31, 2015 and December 31, 2014.
| | | | | | | | |
(In thousands) | | December 31, 2015 | | | December 31, 2014 | |
Advances with the FHLB with maturities ranging from 2016 through 2029 paying interest at monthly fixed rates ranging from 0.41% to 4.19% (2014 - 0.45% to 4.19%) | | $ | 747,072 | | | $ | 802,198 | |
Advances with the FHLB maturing on 2019 paying interest quarterly at a floating rate of 0.24% over the 3 month LIBOR | | | 14,429 | | | | — | |
| | |
Unsecured senior debt securities maturing on 2019 paying interest semiannually at a fixed rate of 7.00% | | | 450,000 | | | | 450,000 | |
Junior subordinated deferrable interest debentures (related to trust preferred securities) with maturities ranging from 2027 to 2034 with fixed interest rates ranging from 6.125% to 8.327% (Refer to Note 25) | | | 439,800 | | | | 439,800 | |
Others | | | 19,008 | | | | 19,830 | |
| | | | | | | | |
Total notes payable | | $ | 1,670,309 | | | $ | 1,711,828 | |
| | | | | | | | |
204
A breakdown of borrowings by contractual maturities at December 31, 2015 is included in the table below.
| | | | | | | | | | | | | | | | |
(In thousands) | | Fed funds purchased
and assets sold under
agreements to repurchase | | | Short-term
borrowings | | | Notes payable | | | Total | |
Year | | | | | | | | | | | | | | | | |
2016 | | $ | 762,145 | | | $ | 1,200 | | | $ | 253,534 | | | $ | 1,016,879 | |
2017 | | | — | | | | — | | | | 85,644 | | | | 85,644 | |
2018 | | | — | | | | — | | | | 139,305 | | | | 139,305 | |
2019 | | | — | | | | — | | | | 539,945 | | | | 539,945 | |
2020 | | | — | | | | — | | | | 92,603 | | | | 92,603 | |
Later years | | | — | | | | — | | | | 559,278 | | | | 559,278 | |
| | | | | | | | | | | | | | | | |
Total borrowings | | $ | 762,145 | | | $ | 1,200 | | | $ | 1,670,309 | | | $ | 2,433,654 | |
| | | | | | | | | | | | | | | | |
At December 31, 2015, the Corporation had borrowing facilities available with the FHLB whereby the Corporation could borrow up to $3.9 billion based on the assets pledged with the FHLB at that date (2014 - $3.7 billion). The FHLB advances at December 31, 2015 are collateralized with mortgage and commercial loans, and do not have restrictive covenants or callable features. The maximum borrowing capacity is dependent on certain computations as determined by the FHLB, which consider the amount and type of assets available for collateral.
Also, the Corporation has a borrowing facility at the discount window of the Federal Reserve Bank of New York. At December 31, 2015, the borrowing capacity at the discount window approximated $1.3 billion (2014 - $2.1 billion), which remained unused at December 31, 2015 and 2014. The facility is a collateralized source of credit that is highly reliable even under difficult market conditions.
205
Note 24 – Offsetting of financial assets and liabilities
The following tables present the potential effect of rights of setoff associated with the Corporation’s recognized financial assets and liabilities at December 31, 2015 and December 31, 2014.
| | | | | | | | | | | | | | | | | | | | | | | | | | | | |
As of December 31, 2015 | |
| | | | Gross Amounts Not Offset in the Statement of
Financial Position | |
(In thousands) | | Gross Amount
of Recognized
Assets | | | Gross Amounts
Offset in the
Statement of
Financial
Position | | | Net Amounts of
Assets
Presented in the
Statement of
Financial
Position | | | Financial
Instruments | | | Securities
Collateral
Received | | | Cash
Collateral
Received | | | Net Amount | |
Derivatives | | $ | 16,959 | | | $ | — | | | $ | 16,959 | | | $ | 114 | | | $ | — | | | $ | — | | | $ | 16,845 | |
Reverse repurchase agreements | | | 96,338 | | | | — | | | | 96,338 | | | | — | | | | 96,338 | | | | — | | | | — | |
| | | | | | | | | | | | | | | | | | | | | | | | | | | | |
Total | | $ | 113,297 | | | $ | — | | | $ | 113,297 | | | $ | 114 | | | $ | 96,338 | | | $ | — | | | $ | 16,845 | |
| | | | | | | | | | | | | | | | | | | | | | | | | | | | |
|
As of December 31, 2015 | |
| | | | Gross Amounts Not Offset in the Statement of
Financial Position | |
(In thousands) | | Gross Amount
of Recognized
Liabilities | | | Gross Amounts
Offset in the
Statement of
Financial
Position | | | Net Amounts of
Liabilities
Presented in the
Statement of
Financial
Position | | | Financial
Instruments | | | Securities
Collateral
Pledged | | | Cash
Collateral
Pledged | | | Net Amount | |
Derivatives | | $ | 14,343 | | | $ | — | | | $ | 14,343 | | | $ | 114 | | | $ | 4,050 | | | $ | — | | | $ | 10,179 | |
Repurchase agreements | | | 712,145 | | | | — | | | | 712,145 | | | | — | | | | 712,145 | | | | — | | | | — | |
| | | | | | | | | | | | | | | | | | | | | | | | | | | | |
Total | | $ | 726,488 | | | $ | — | | | $ | 726,488 | | | $ | 114 | | | $ | 716,195 | | | $ | — | | | $ | 10,179 | |
| | | | | | | | | | | | | | | | | | | | | | | | | | | | |
|
As of December 31, 2014 | |
| | | | Gross Amounts Not Offset in the Statement of
Financial Position | |
(In thousands) | | Gross Amount
of Recognized
Assets | | | Gross Amounts
Offset in the
Statement of
Financial
Position | | | Net Amounts of
Assets
Presented in the
Statement of
Financial
Position | | | Financial
Instruments | | | Securities
Collateral
Received | | | Cash
Collateral
Received | | | Net Amount | |
Derivatives | | $ | 25,362 | | | $ | — | | | $ | 25,362 | | | $ | 320 | | | $ | — | | | $ | — | | | $ | 25,042 | |
Reverse repurchase agreements | | | 151,134 | | | | — | | | | 151,134 | | | | — | | | | 151,134 | | | | — | | | | — | |
| | | | | | | | | | | | | | | | | | | | | | | | | | | | |
Total | | $ | 176,496 | | | $ | — | | | $ | 176,496 | | | $ | 320 | | | $ | 151,134 | | | $ | — | | | $ | 25,042 | |
| | | | | | | | | | | | | | | | | | | | | | | | | | | | |
206
| | | | | | | | | | | | | | | | | | | | | | | | | | | | |
As of December 31, 2014 | |
| | | | Gross Amounts Not Offset in the Statement of Financial
Position | |
(In thousands) | | Gross Amount
of Recognized
Liabilities | | | Gross Amounts
Offset in the
Statement of
Financial
Position | | | Net Amounts of
Liabilities
Presented in the
Statement of
Financial
Position | | | Financial
Instruments | | | Securities
Collateral
Pledged | | | Cash
Collateral
Received | | | Net Amount | |
Derivatives | | $ | 23,032 | | | $ | — | | | $ | 23,032 | | | $ | 320 | | | $ | 8,781 | | | $ | — | | | $ | 13,931 | |
Repurchase agreements | | | 1,171,657 | | | | — | | | | 1,171,657 | | | | — | | | | 1,171,657 | | | | — | | | | — | |
| | | | | | | | | | | | | | | | | | | | | | | | | | | | |
Total | | $ | 1,194,689 | | | $ | — | | | $ | 1,194,689 | | | $ | 320 | | | $ | 1,180,438 | | | $ | — | | | $ | 13,931 | |
| | | | | | | | | | | | | | | | | | | | | | | | | | | | |
The Corporation’s derivatives are subject to agreements which allow a right of set-off with each respective counterparty. In addition, the Corporation’s Repurchase Agreements and Reverse Repurchase Agreements have a right of set-off with the respective counterparty under the supplemental terms of the Master Repurchase Agreements. In an event of default each party has a right of set-off against the other party for amounts owed in the related agreement and any other amount or obligation owed in respect of any other agreement or transaction between them.
207
Note 25 – Trust preferred securities
At December 31, 2015 and December 31, 2014, statutory trusts established by the Corporation (BanPonce Trust I, Popular Capital Trust I, Popular North America Capital Trust I and Popular Capital Trust II) had issued trust preferred securities (also referred to as “capital securities”) to the public. The proceeds from such issuances, together with the proceeds of the related issuances of common securities of the trusts (the “common securities”), were used by the trusts to purchase junior subordinated deferrable interest debentures (the “junior subordinated debentures”) issued by the Corporation.
The sole assets of the trusts consisted of the junior subordinated debentures of the Corporation and the related accrued interest receivable. These trusts are not consolidated by the Corporation pursuant to accounting principles generally accepted in the United States of America.
The junior subordinated debentures are included by the Corporation as notes payable in the consolidated statements of financial condition, while the common securities issued by the issuer trusts are included as other investment securities. The common securities of each trust are wholly-owned, or indirectly wholly-owned, by the Corporation.
The following table presents financial data pertaining to the different trusts at December 31, 2015 and December 31, 2014.
| | | | | | | | | | | | | | | | |
(Dollars in thousands) | |
Issuer | | BanPonce
Trust I | | | Popular
Capital Trust I | | | Popular
North America
Capital Trust I | | | Popular
Capital Trust Il | |
| | | | |
Capital securities | | $ | 52,865 | | | $ | 181,063 | | | $ | 91,651 | | | $ | 101,023 | |
Distribution rate | | | 8.327 | % | | | 6.700 | % | | | 6.564 | % | | | 6.125 | % |
| | | | |
Common securities | | $ | 1,637 | | | $ | 5,601 | | | $ | 2,835 | | | $ | 3,125 | |
Junior subordinated debentures aggregate liquidation amount | | $ | 54,502 | | | $ | 186,664 | | | $ | 94,486 | | | $ | 104,148 | |
Stated maturity date | |
| February
2027 |
| |
| November
2033 |
| |
| September
2034 |
| |
| December
2034 |
|
Reference notes | | | [1],[3],[6] | | | | [2],[4],[5] | | | | [1],[3],[5] | | | | [2],[4],[5] | |
| [1] | Statutory business trust that is wholly-owned by Popular North America and indirectly wholly-owned by the Corporation. |
| [2] | Statutory business trust that is wholly-owned by the Corporation. |
| [3] | The obligations of PNA under the junior subordinated debentures and its guarantees of the capital securities under the trust are fully and unconditionally guaranteed on a subordinated basis by the Corporation to the extent set forth in the applicable guarantee agreement. |
| [4] | These capital securities are fully and unconditionally guaranteed on a subordinated basis by the Corporation to the extent set forth in the applicable guarantee agreement. |
| [5] | The Corporation has the right, subject to any required prior approval from the Federal Reserve, to redeem after certain dates or upon the occurrence of certain events mentioned below, the junior subordinated debentures at a redemption price equal to 100% of the principal amount, plus accrued and unpaid interest to the date of redemption. The maturity of the junior subordinated debentures may be shortened at the option of the Corporation prior to their stated maturity dates (i) on or after the stated optional redemption dates stipulated in the agreements, in whole at any time or in part from time to time, or (ii) in whole, but not in part, at any time within 90 days following the occurrence and during the continuation of a tax event, an investment company event or a capital treatment event as set forth in the indentures relating to the capital securities, in each case subject to regulatory approval. |
| [6] | Same as [5] above, except that the investment company event does not apply for early redemption. |
The Basel III Capital Rules require that capital instruments such as trust preferred securities be phased-out of Tier 1 capital. The Corporation’s capital components at December 31, 2015 included $ 427 million of trust preferred securities that are subject to the phase-out provisions of the Basel III Capital Rules. The Corporation is allowed to include only 25% of such trust preferred securities in Tier I capital as of January 1, 2015 and would be allowed 0% as of January 1, 2016 and thereafter. The Basel III Capital Rules also permanently grandfathers as Tier 2 capital such trust preferred securities.
208
Note 26 – Stockholders’ equity
The Corporation has 30,000,000 shares of authorized preferred stock that may be issued in one or more series, and the shares of each series shall have such rights and preferences as shall be fixed by the Board of Directors when authorizing the issuance of that particular series. The Corporation’s shares of preferred stock issued and outstanding at December 31, 2015 and 2014 consisted of:
| | • | | 6.375% non-cumulative monthly income preferred stock, 2003 Series A, no par value, liquidation preference value of $25 per share. Holders on record of the 2003 Series A Preferred Stock are entitled to receive, when, as and if declared by the Board of Directors of the Corporation or an authorized committee thereof, out of funds legally available, non-cumulative cash dividends at the annual rate per share of 6.375% of their liquidation preference value, or $0.1328125 per share per month. These shares of preferred stock are perpetual, nonconvertible, have no preferential rights to purchase any securities of the Corporation and are redeemable solely at the option of the Corporation with the consent of the Board of Governors of the Federal Reserve System. The redemption price per share is $25.00. The shares of 2003 Series A Preferred Stock have no voting rights, except for certain rights in instances when the Corporation does not pay dividends for a defined period. These shares are not subject to any sinking fund requirement. Cash dividends declared and paid on the 2003 Series A Preferred Stock amounted to $ 1.4 million for the year ended December 31, 2015, 2014 and 2013. Outstanding shares of 2003 Series A Preferred Stock amounted to 885,726 at December 31, 2015, 2014 and 2013. |
| | • | | 8.25% non-cumulative monthly income preferred stock, 2008 Series B, no par value, liquidation preference value of $25 per share. The shares of 2008 Series B Preferred Stock were issued in May 2008. Holders of record of the 2008 Series B Preferred Stock are entitled to receive, when, as and if declared by the Board of Directors of the Corporation or an authorized committee thereof, out of funds legally available, non-cumulative cash dividends at the annual rate per share of 8.25% of their liquidation preferences, or $0.171875 per share per month. These shares of preferred stock are perpetual, nonconvertible, have no preferential rights to purchase any securities of the Corporation and are redeemable solely at the option of the Corporation with the consent of the Board of Governors of the Federal Reserve System beginning on May 28, 2013. The redemption price per share is $25.00. Cash dividends declared and paid on the 2008 Series B Preferred Stock amounted to $ 2.3 million for the year ended December 31, 2015, 2014 and 2013. Outstanding shares of 2008 Series B Preferred Stock amounted to 1,120,665 at December 31, 2015, 2014 and 2013. |
As part of the Series C Preferred Stock transaction with the U.S. Treasury effected on December 5, 2008, the Corporation issued to the U.S. Treasury a warrant to purchase 2,093,284 shares of the Corporation’s common stock at an exercise price of $67 per share. On July 23, 2014, the Corporation completed the repurchase of the outstanding warrant at a repurchase price of $3.0 million. With the completion of this transaction, the Corporation completed its exit from the TARP Capital Purchase Program.
The Corporation’s common stock trades on the NASDAQ Stock Market LLC (the “NASDAQ”) under the symbol BPOP. The Corporation voluntarily delisted its 2003 Series A and 2008 Series B Preferred Stock from the NASDAQ effective October 8, 2009.
On May 29, 2012, the Corporation effected a 1-for-10 reverse split of its common stock previously approved by the Corporation’s stockholders on April 27, 2012. Upon the effectiveness of the reverse split, each 10 shares of authorized and outstanding common stock were reclassified and combined into one new share of common stock. Popular, Inc.’s common stock began trading on a split-adjusted basis on May 30, 2012. All share and per share information in the consolidated financial statements and accompanying notes have been retroactively adjusted to reflect the 1-for-10 reverse stock split.
In connection with the reverse stock split, the Corporation amended its Restated Certificate of Incorporation to reduce the number of shares of its authorized common stock from 1,700,000,000 to 170,000,000.
The reverse stock split did not affect the par value of a share of the Corporation’s common stock.
At the effective date of the reverse stock split, the stated capital attributable to common stock on the Corporation’s consolidated statement of financial condition was reduced by dividing the amount of the stated capital prior to the reverse stock split by 10, and the additional paid-in capital (surplus) was credited with the amount by which the stated capital was reduced. This was also reflected retroactively for prior periods presented in the financial statements.
The Corporation’s common stock ranks junior to all series of preferred stock as to dividend rights and / or as to rights on liquidation, dissolution or winding up of the Corporation. Dividends on each series of preferred stocks are payable if declared. The Corporation’s ability to declare or pay dividends on, or purchase, redeem or otherwise acquire, its common stock is subject to certain restrictions in the event that the Corporation fails to pay or set aside full dividends on the preferred stock for the latest dividend period. The ability of the Corporation to pay dividends in the future is limited by regulatory requirements, legal availability of funds, recent and projected financial results, capital levels and liquidity of the Corporation, general business conditions and other factors deemed relevant by the Corporation’s Board of Directors.
209
During the year 2015 the Corporation reinstated the payment of dividends to shareholders of common stock. Cash dividends of $ 0.30 per common share outstanding were declared during 2015 (no dividends were declared in 2014 and 2013). The dividends declared during 2015 amounted to $ 31.1 million, of which $15.5 million were payable to shareholders of common stock at December 31, 2015 ($0 as of December 31, 2014 and 2013).
The Banking Act of the Commonwealth of Puerto Rico requires that a minimum of 10% of BPPR’s net income for the year be transferred to a statutory reserve account until such statutory reserve equals the total of paid-in capital on common and preferred stock. Any losses incurred by a bank must first be charged to retained earnings and then to the reserve fund. Amounts credited to the reserve fund may not be used to pay dividends without the prior consent of the Puerto Rico Commissioner of Financial Institutions. The failure to maintain sufficient statutory reserves would preclude BPPR from paying dividends. BPPR’s statutory reserve fund amounted to $ 495 million at December 31, 2015 (2014 - $ 469 million; 2013 - $ 445 million). During 2015, $ 26 million was transferred to the statutory reserve account (2014 - $ 24 million, 2013 - $ 13 million). BPPR was in compliance with the statutory reserve requirement in 2015, 2014 and 2013.
Note 27 – Regulatory capital requirements
The Corporation and its banking subsidiaries are subject to various regulatory capital requirements imposed by the federal banking agencies. Failure to meet minimum capital requirements can lead to certain mandatory and additional discretionary actions by regulators that, if undertaken, could have a direct material effect on the Corporation’s consolidated financial statements. On January 1, 2015, the Corporation, BPPR and BPNA became subject to Basel III capital requirements, including also revised minimum and well capitalized regulatory capital ratios and compliance with the standardized approach for determining risk-weighted assets.
The Basel III Capital Rules introduced a new capital measure known as Common Equity Tier I (“CET1”) and related regulatory capital ratio CET1 to risk-weighted assets.
The Basel III Capital Rules provide that a depository institution will be deemed to be well capitalized if it maintained a leverage ratio of at least 5%, a CET1 ratio of at least 6.5%, a Tier 1 risk-based capital ratio of at least 8% and a total risk-based ratio of at least 10%. Management has determined that at December 31, 2015 and 2014, the Corporation exceeded all capital adequacy requirements to which it is subject.
At December 31, 2015 BPPR and BPNA were well-capitalized under the regulatory framework for Basel III. Additionally, at December 31, 2014, the Corporation, BPPR and BPNA were well-capitalized under the applicable capital adequacy guideline of Basel I and the regulatory framework for prompt corrective action.
The Corporation has been designated by the Federal Reserve Board as a Financial Holding Company (“FHC”) and is eligible to engage in certain financial activities permitted under the Gramm-Leach-Bliley Act of 1999.
210
The following tables present the Corporation’s risk-based capital and leverage ratios at December 31, 2015 and 2014 under the regulatory guidance applicable during those years.
| | | | | | | | | | | | | | | | |
| | | Actual | | | Capital adequacy minimum
requirement | |
(Dollars in thousands) | | Amount | | | Ratio | | | Amount | | | Ratio | |
| | | 2015 | |
Total Capital (to Risk-Weighted Assets): | | | | | | | | | | | | | | | | |
Corporation | | $ | 4,692,409 | | | | 18.78 | % | | $ | 1,998,971 | | | | 8 | % |
BPPR | | | 3,591,547 | | | | 18.27 | | | | 1,572,988 | | | | 8 | |
BPNA | | | 945,132 | | | | 19.02 | | | | 397,519 | | | | 8 | |
| | | | |
Common Equity Tier I Capital (to Risk-Weighted Assets): | | | | | | | | | | | | | | | | |
Corporation | | $ | 4,049,576 | | | | 16.21 | % | | $ | 1,124,421 | | | | 4.5 | % |
BPPR | | | 3,339,165 | | | | 16.98 | | | | 884,806 | | | | 4.5 | |
BPNA | | | 908,722 | | | | 18.29 | | | | 223,604 | | | | 4.5 | |
| | | | |
Tier I Capital (to Risk-Weighted Assets): | | | | | | | | | | | | | | | | |
Corporation | | $ | 4,049,576 | | | | 16.21 | % | | $ | 1,499,229 | | | | 6 | % |
BPPR | | | 3,339,165 | | | | 16.98 | | | | 1,179,741 | | | | 6 | |
BPNA | | | 908,722 | | | | 18.29 | | | | 298,139 | | | | 6 | |
| | | | |
Tier I Capital (to Average Assets): | | | | | | | | | | | | | | | | |
Corporation | | $ | 4,049,576 | | | | 11.82 | % | | $ | 1,370,145 | | | | 4 | % |
BPPR | | | 3,339,165 | | | | 12.21 | | | | 1,094,291 | | | | 4 | |
BPNA | | | 908,722 | | | | 13.74 | | | | 264,547 | | | | 4 | |
211
| | | | | | | | | | | | | | | | |
| | | Actual | | | Capital adequacy minimum
requirement | |
(Dollars in thousands) | | Amount | | | Ratio | | | Amount | | | Ratio | |
| | | 2014 | |
Total Capital (to Risk-Weighted Assets): | | | | | | | | | | | | | | | | |
Corporation | | $ | 4,122,238 | | | | 19.41 | % | | $ | 1,698,712 | | | | 8 | % |
BPPR | | | 2,973,500 | | | | 17.00 | | | | 1,399,664 | | | | 8 | |
BPNA | | | 1,216,065 | | | | 35.77 | | | | 271,952 | | | | 8 | |
| | | | |
Tier I Capital (to Risk-Weighted Assets): | | | | | | | | | | | | | | | | |
Corporation | | $ | 3,849,891 | | | | 18.13 | % | | $ | 849,356 | | | | 4 | % |
BPPR | | | 2,749,051 | | | | 15.71 | | | | 699,832 | | | | 4 | |
BPNA | | | 1,182,899 | | | | 34.80 | | | | 135,976 | | | | 4 | |
| | | | |
Tier I Capital (to Average Assets): | | | | | | | | | | | | | | | | |
Corporation | | $ | 3,849,891 | | | | 11.94 | % | | $ | 967,505 | | | | 3 | % |
| | | | | | | | | | | 1,290,007 | | | | 4 | |
BPPR | | | 2,749,051 | | | | 10.63 | | | | 775,566 | | | | 3 | |
| | | | | | | | | | | 1,034,089 | | | | 4 | |
BPNA | | | 1,182,899 | | | | 20.01 | | | | 177,376 | | | | 3 | |
| | | | | | | | | | | 236,502 | | | | 4 | |
The following table presents the minimum amounts and ratios for the Corporation’s banks to be categorized as well-capitalized.
| | | | | | | | | | | | | | | | |
| | | 2015 | | | 2014 | |
(Dollars in thousands) | | Amount | | | Ratio | | | Amount | | | Ratio | |
Total Capital (to Risk-Weighted Assets): | | | | | | | | | | | | | | | | |
BPPR | | $ | 1,966,236 | | | | 10 | % | | $ | 1,749,580 | | | | 10 | % |
BPNA | | | 496,899 | | | | 10 | | | | 339,939 | | | | 10 | |
| | | | |
Common Equity Tier I Capital (to Risk-Weighted Assets): | | | | | | | | | | | | | | | | |
BPPR | | $ | 1,278,053 | | | | 6.5 | % | | | (A | ) | | | (A | ) |
BPNA | | | 322,984 | | | | 6.5 | | | | (A | ) | | | (A | ) |
| | | | |
Tier I Capital (to Risk-Weighted Assets): | | | | | | | | | | | | | | | | |
BPPR | | $ | 1,572,988 | | | | 8 | % | | $ | 1,049,748 | | | | 6 | % |
BPNA | | | 397,519 | | | | 8 | | | | 203,964 | | | | 6 | |
| | | | |
Tier I Capital (to Average Assets): | | | | | | | | | | | | | | | | |
BPPR | | $ | 1,367,864 | | | | 5 | % | | $ | 1,292,611 | | | | 5 | % |
BPNA | | | 330,683 | | | | 5 | | | | 295,627 | | | | 5 | |
(A) - Basel III Capital Rules introduced the Common Equity Tier I ratio which became effective on January 1, 2015.
212
The final Basel III capital rules require the phase out of non-qualifying Tier 1 capital instruments such as trust preferred securities. At December 31, 2015, the Corporation had $427 million in trust preferred securities outstanding. Beginning on January 1, 2015, approximately $320 million in principal amount of the trust preferred securities no longer qualified for Tier 1 capital treatment, but instead qualified for Tier 2 capital treatment. On January 1, 2016, all $427 million of its outstanding trust preferred securities will lose Tier 1 capital treatment, and will be reclassified to Tier 2 capital.
Beginning January 1, 2016, the Basel III final rules introduce a phase-in capital conservation buffer of 2.5% of risk-weighted assets that is effectively layered on top of the minimum capital risk-based ratios, which places restrictions on the amount of retained earnings that may be used for distributions or discretionary bonus payments as risk-based capital ratios approach their respective “adequately capitalized minimums.”
The following table presents the capital requirements for a standardized approach banking organization under Basel III final rules.
| | | | | | | | | | | | | | | | | | | | | | | | |
| | | | | | | | | Minimum Capital Plus Capital Conservation Buffer | |
| | | Minimum Capital | | | Well-Capitalized | | | 2016 | | | 2017 | | | 2018 | | | 2019 | |
Common Equity Tier 1 to Risk-Weighted Assets | | | 4.5 | % | | | 6.5 | % | | | 5.125 | % | | | 5.750 | % | | | 6.375 | % | | | 7.000 | % |
Tier 1 Capital to Risk-Weighted Assets | | | 6.0 | | | | 8.0 | | | | 6.625 | | | | 7.250 | | | | 7.875 | | | | 8.500 | |
Total Capital to Risk-Weighted Assets | | | 8.0 | | | | 10.0 | | | | 8.625 | | | | 9.250 | | | | 9.875 | | | | 10.500 | |
Leverage Ratio | | | 4.0 | | | | 5.0 | | | | N/A | | | | N/A | | | | N/A | | | | N/A | |
213
Note 28 – Other comprehensive loss
The following table presents changes in accumulated other comprehensive loss by component for the years ended December 31, 2015, 2014 and 2013.
| | | | | | | | | | | | | | |
| | | Changes in Accumulated Other Comprehensive Loss by Component [1] | |
| | | | | Years ended December 31, | |
(In thousands) | | | | 2015 | | | 2014 | | | 2013 | |
Foreign currency translation | | Beginning Balance | | $ | (32,832 | ) | | $ | (36,099 | ) | | $ | (31,277 | ) |
| | | | | | | | | | | | | | |
| | Other comprehensive loss before reclassifications | | | (3,098 | ) | | | (4,451 | ) | | | (4,822 | ) |
| | Amounts reclassified from accumulated other comprehensive loss | | | — | | | | 7,718 | | | | — | |
| | | | | | | | | | | | | | |
| | Net change | | | (3,098 | ) | | | 3,267 | | | | (4,822 | ) |
| | | | | | | | | | | | | | |
| | Ending balance | | $ | (35,930 | ) | | $ | (32,832 | ) | | $ | (36,099 | ) |
| | | | | | | | | | | | | | |
Adjustment of pension and postretirement benefit plans | | Beginning Balance | | $ | (205,187 | ) | | $ | (104,302 | ) | | $ | (225,846 | ) |
| | | | | | | | | | | | | | |
| | Other comprehensive income (loss) before reclassifications | | | (16,032 | ) | | | (98,015 | ) | | | 104,272 | |
| | Amounts reclassified from accumulated other comprehensive income (loss) for amortization of net losses | | | 12,261 | | | | (5,188 | ) | | | 17,272 | |
| | Amounts reclassified from accumulated other comprehensive income (loss) for amortization of prior service cost | | | (2,318 | ) | | | 2,318 | | | | — | |
| | | | | | | | | | | | | | |
| | Net change | | | (6,089 | ) | | | (100,885 | ) | | | 121,544 | |
| | | | | | | | | | | | | | |
| | Ending balance | | $ | (211,276 | ) | | $ | (205,187 | ) | | $ | (104,302 | ) |
| | | | | | | | | | | | | | |
| | | | | | | | | | | | | | |
Unrealized net holding (losses) gains on investments | | Beginning Balance | | $ | 8,465 | | | $ | (48,344 | ) | | $ | 154,568 | |
| | | | | | | | | | | | | | |
| | Other comprehensive (loss) income before reclassifications | | | (29,871 | ) | | | 55,987 | | | | (201,119 | ) |
| | Other-than-temporary impairment amounts reclassified from accumulated other comprehensive (loss) income | | | 11,959 | | | | — | | | | — | |
| | Amounts reclassified from accumulated other comprehensive (loss) income | | | (113 | ) | | | 822 | | | | (1,793 | ) |
| | | | | | | | | | | | | | |
| | Net change | | | (18,025 | ) | | | 56,809 | | | | (202,912 | ) |
| | | | | | | | | | | | | | |
| | Ending balance | | $ | (9,560 | ) | | $ | 8,465 | | | $ | (48,344 | ) |
| | | | | | | | | | | | | | |
Unrealized net (losses) gains on cash flow hedges | | Beginning Balance | | $ | (318 | ) | | $ | — | | | $ | (313 | ) |
| | | | | | | | | | | | | | |
| | Other comprehensive (loss) income before reclassifications | | | (2,669 | ) | | | (4,034 | ) | | | 1,436 | |
| | Amounts reclassified from other accumulated other comprehensive (loss) income | | | 2,867 | | | | 3,716 | | | | (1,123 | ) |
| | | | | | | | | | | | | | |
| | Net change | | | 198 | | | | (318 | ) | | | 313 | |
| | | | | | | | | | | | | | |
| | Ending balance | | $ | (120 | ) | | $ | (318 | ) | | $ | — | |
| | | | | | | | | | | | | | |
| | Total | | $ | (256,886 | ) | | $ | (229,872 | ) | | $ | (188,745 | ) |
| | | | | | | | | | | | | | |
| [1] | All amounts presented are net of tax. |
214
The following table presents the amounts reclassified out of each component of accumulated other comprehensive loss for the years ended December 31, 2015, 2014, and 2013.
| | | | | | | | | | | | | | |
| | | Reclassifications Out of Accumulated Other Comprehensive Loss | |
| | | Affected Line Item in the | | Years ended December 31, | |
(In thousands) | | Consolidated Statements of Operations | | 2015 | | | 2014 | | | 2013 | |
Foreign currency translation | | | | | | | | | | | | | | |
Cumulative translation adjustment reclassified into earnings | | Other operating income | | $ | — | | | $ | (7,718 | ) | | $ | — | |
| | | | | | | | | | | | | | |
| | Total before tax | | | — | | | | (7,718 | ) | | | — | |
| | | | | | | | | | | | | | |
| | Income tax (expense) benefit | | | — | | | | — | | | | — | |
| | | | | | | | | | | | | | |
| | Total net of tax | | $ | — | | | $ | (7,718 | ) | | $ | — | |
| | | | | | | | | | | | | | |
| | | | |
Adjustment of pension and postretirement benefit plans | | | | | | | | | | | | | | |
Amortization of net losses | | Personnel costs | | $ | (20,100 | ) | | $ | 8,505 | | | $ | (24,674 | ) |
Amortization of prior service cost | | Personnel costs | | | 3,800 | | | | (3,800 | ) | | | — | |
| | | | | | | | | | | | | | |
| | Total before tax | | | (16,300 | ) | | | 4,705 | | | | (24,674 | ) |
| | | | | | | | | | | | | | |
| | Income tax (expense) benefit | | | 6,357 | | | | (1,835 | ) | | | 7,402 | |
| | | | | | | | | | | | | | |
| | Total net of tax | | $ | (9,943 | ) | | $ | 2,870 | | | $ | (17,272 | ) |
| | | | | | | | | | | | | | |
Unrealized holding (losses) gains on investments | | | | | | | | | | | | | | |
Realized gain (loss) on sale of securities | | Net (loss) gain on sale and valuation adjustments of investment securities | | $ | 141 | | | $ | (870 | ) | | $ | 2,110 | |
| | Other-than-temporary impairment losses on available-for-sale debt securities | | | (14,445 | ) | | | — | | | | — | |
| | | | | | | | | | | | | | |
| | Total before tax | | | (14,304 | ) | | | (870 | ) | | | 2,110 | |
| | | | | | | | | | | | | | |
| | Income tax benefit (expense) | | | 2,458 | | | | 48 | | | | (317 | ) |
| | | | | | | | | | | | | | |
| | Total net of tax | | $ | (11,846 | ) | | $ | (822 | ) | | $ | 1,793 | |
| | | | | | | | | | | | | | |
Unrealized net (losses) gains on cash flow hedges | | | | | | | | | | | | | | |
Forward contracts | | Mortgage banking activities | | $ | (4,702 | ) | | $ | (6,091 | ) | | $ | 1,839 | |
| | | | | | | | | | | | | | |
| | Total before tax | | | (4,702 | ) | | | (6,091 | ) | | | 1,839 | |
| | | | | | | | | | | | | | |
| | Income tax benefit (expense) | | | 1,835 | | | | 2,375 | | | | (716 | ) |
| | | | | | | | | | | | | | |
| | Total net of tax | | $ | (2,867 | ) | | $ | (3,716 | ) | | $ | 1,123 | |
| | | | | | | | | | | | | | |
| | Total reclassification adjustments, net of tax | | $ | (24,656 | ) | | $ | (9,386 | ) | | $ | (14,356 | ) |
| | | | | | | | | | | | | | |
215
Note 29 – Guarantees
The Corporation has obligations upon the occurrence of certain events under financial guarantees provided in certain contractual agreements as summarized below.
The Corporation issues financial standby letters of credit and has risk participation in standby letters of credit issued by other financial institutions, in each case to guarantee the performance of various customers to third parties. If the customers failed to meet its financial or performance obligation to the third party under the terms of the contract, then, upon their request, the Corporation would be obligated to make the payment to the guaranteed party. At December 31, 2015, the Corporation recorded a liability of $0.5 million (December 31, 2014 - $0.4 million), which represents the unamortized balance of the obligations undertaken in issuing the guarantees under the standby letters of credit. In accordance with the provisions of ASC Topic 460, the Corporation recognizes at fair value the obligation at inception of the standby letters of credit. The fair value approximates the fee received from the customer for issuing such commitments. These fees are deferred and are recognized over the commitment period. The contracts amount in standby letters of credit outstanding at December 31, 2015 and 2014, shown in Note 30, represent the maximum potential amount of future payments that the Corporation could be required to make under the guarantees in the event of nonperformance by the customers. These standby letters of credit are used by the customers as a credit enhancement and typically expire without being drawn upon. The Corporation’s standby letters of credit are generally secured, and in the event of nonperformance by the customers, the Corporation has rights to the underlying collateral provided, which normally includes cash, marketable securities, real estate, receivables, and others. Management does not anticipate any material losses related to these instruments.
Also, from time to time, the Corporation securitized mortgage loans into guaranteed mortgage-backed securities subject in certain instances, to lifetime credit recourse on the loans that serve as collateral for the mortgage-backed securities. The Corporation has not sold any mortgage loans subject to credit recourse since 2009. Also, from time to time, the Corporation may sell, in bulk sale transactions, residential mortgage loans and Small Business Administration (“SBA”) commercial loans subject to credit recourse or to certain representations and warranties from the Corporation to the purchaser. These representations and warranties may relate, for example, to borrower creditworthiness, loan documentation, collateral, prepayment and early payment defaults. The Corporation may be required to repurchase the loans under the credit recourse agreements or representation and warranties.
At December 31, 2015, the Corporation serviced $1.9 billion (December 31, 2014 - $2.1 billion) in residential mortgage loans subject to credit recourse provisions, principally loans associated with FNMA and FHLMC residential mortgage loan securitization programs. In the event of any customer default, pursuant to the credit recourse provided, the Corporation is required to repurchase the loan or reimburse the third party investor for the incurred loss. The maximum potential amount of future payments that the Corporation would be required to make under the recourse arrangements in the event of nonperformance by the borrowers is equivalent to the total outstanding balance of the residential mortgage loans serviced with recourse and interest, if applicable. During 2015, the Corporation repurchased approximately $ 59 million of unpaid principal balance in mortgage loans subject to the credit recourse provisions (2014 - $ 89 million). In the event of nonperformance by the borrower, the Corporation has rights to the underlying collateral securing the mortgage loan. The Corporation suffers losses on these loans when the proceeds from a foreclosure sale of the property underlying a defaulted mortgage loan are less than the outstanding principal balance of the loan plus any uncollected interest advanced and the costs of holding and disposing the related property. At December 31, 2015, the Corporation’s liability established to cover the estimated credit loss exposure related to loans sold or serviced with credit recourse amounted to $ 59 million (December 31, 2014 - $ 59 million). The following table shows the changes in the Corporation’s liability of estimated losses from these credit recourses agreements, included in the consolidated statements of financial condition during the years ended December 31, 2015 and 2014.
| | | | | | | | |
| | | December 31, | |
(In thousands) | | 2015 | | | 2014 | |
Balance as of beginning of period | | $ | 59,438 | | | $ | 41,463 | |
Provision for recourse liability | | | 22,938 | | | | 41,312 | |
Net charge-offs | | | (23,713 | ) | | | (23,337 | ) |
| | | | | | | | |
Balance as of end of period | | $ | 58,663 | | | $ | 59,438 | |
| | | | | | | | |
216
The estimated losses to be absorbed under the credit recourse arrangements are recorded as a liability when the loans are sold and are updated by accruing or reversing expense (categorized in the line item “Adjustments (expense) to indemnity reserves on loans sold” in the consolidated statements of operations) throughout the life of the loan, as necessary, when additional relevant information becomes available. The methodology used to estimate the recourse liability is a function of the recourse arrangements given and considers a variety of factors, which include actual defaults and historical loss experience, foreclosure rate, estimated future defaults and the probability that a loan would be delinquent. Statistical methods are used to estimate the recourse liability. Expected loss rates are applied to different loan segmentations. The expected loss, which represents the amount expected to be lost on a given loan, considers the probability of default and loss severity. The probability of default represents the probability that a loan in good standing would become 90 days delinquent within the following twelve-month period. Regression analysis quantifies the relationship between the default event and loan-specific characteristics, including credit scores, loan-to-value ratios, and loan aging, among others.
When the Corporation sells or securitizes mortgage loans, it generally makes customary representations and warranties regarding the characteristics of the loans sold. The Corporation’s mortgage operations in Puerto Rico group conforming mortgage loans into pools which are exchanged for FNMA and GNMA mortgage-backed securities, which are generally sold to private investors, or are sold directly to FNMA or other private investors for cash. As required under the government agency programs, quality review procedures are performed by the Corporation to ensure that asset guideline qualifications are met. To the extent the loans do not meet specified characteristics, the Corporation may be required to repurchase such loans or indemnify for losses and bear any subsequent loss related to the loans. Repurchases under BPPR’s representation and warranty arrangements in which the Corporation is obligated to repurchase the loans amounted to approximately $175 thousand in unpaid principal balance with losses amounting to $24 thousand for the year ended December 31, 2015 ($ 2.2 million and $1.7 million, respectively, during the year ended December 31, 2014). A substantial amount of these loans reinstate to performing status or have mortgage insurance, and thus the ultimate losses on the loans are not deemed significant.
As discussed on Note 4 – Discontinued Operations, on November 8, 2014, the Corporation completed the sale of the California regional operations. In connection with this transaction, the Corporation agreed to provide, subject to certain limitations, customary indemnification to the purchaser, including with respect to certain pre-closing liabilities and violations of representations and warranties. The Corporation also agreed to indemnify the purchaser for up to 1.5% of credit losses on transferred loans for a period of two years after the closing. Pursuant to this indemnification provision, the Corporation’s maximum exposure is approximately $16.0 million. The Corporation recognized a reserve of approximately $2.2 million, representing its best estimate of the loss that would be incurred in connection with this indemnification. This reserve is included within the liabilities from discontinued operations. At December 31, 2015, the Corporation has a reserve balance of $2.2 million.
During the quarter ended June 30, 2013, the Corporation established a reserve for certain specific representation and warranties made in connection with BPPR’s sale of non-performing mortgage loans. The purchaser’s sole remedy under the indemnity clause is to seek monetary damages from BPPR, for a maximum of $16.3 million. BPPR recognized a reserve of approximately $3.0 million, representing its best estimate of the loss that would be incurred in connection with this indemnification. BPPR’s obligations under this clause end one year after the closing except to any claim asserted prior to such termination date. At December 31, 2015, the Corporation has a reserve balance of $3.4 million to cover claims received from the purchaser, which are currently being evaluated.
During the quarter ended March 31, 2013, the Corporation established a reserve for certain specific representation and warranties made in connection with BPPR’s sale of commercial and construction loans, and commercial and single family real estate owned. The purchaser’s sole remedy under the indemnity clause is to seek monetary damages from BPPR, for a maximum of $18.0 million. BPPR is not required to repurchase any of the assets. BPPR recognized a reserve of approximately $10.7 million, representing its best estimate of the loss that would be incurred in connection with this indemnification. At December 31, 2015, the Corporation has a reserve balance of $0.1 million to cover claims received from the purchaser.
217
The following table presents the changes in the Corporation’s liability for estimated losses associated with the indemnifications and representations and warranties related to loans sold by BPPR for during the years ended December 31, 2015 and 2014.
| | | | | | | | |
(In thousands) | | 2015 | | | 2014 | |
Balance as of beginning of period | | $ | 15,959 | | | $ | 19,277 | |
Provision (reversal) for representation and warranties | | | (5,446 | ) | | | (712 | ) |
Net charge-offs | | | (176 | ) | | | (2,606 | ) |
Settlements paid | | | (2,250 | ) | | | — | |
| | | | | | | | |
Balance as of end of period | | $ | 8,087 | | | $ | 15,959 | |
| | | | | | | | |
In addition, at December 31, 2015, the Corporation has reserves for customary representation and warranties related to loans sold by its U.S. subsidiary E-LOAN prior to 2009. These loans had been sold to investors on a servicing released basis subject to certain representation and warranties. Although the risk of loss or default was generally assumed by the investors, the Corporation made certain representations relating to borrower creditworthiness, loan documentation and collateral, which if not correct, may result in requiring the Corporation to repurchase the loans or indemnify investors for any related losses associated to these loans. At December 31, 2015, the Corporation’s reserve for estimated losses from such representation and warranty arrangements amounted to $ 4 million, which was included as part of other liabilities in the consolidated statement of financial condition (December 31, 2014 - $ 5 million). E-LOAN is no longer originating and selling loans since the subsidiary ceased these activities in 2008 and most of the outstanding agreements with major counterparties were settled during 2010 and 2011.
Servicing agreements relating to the mortgage-backed securities programs of FNMA and GNMA, and to mortgage loans sold or serviced to certain other investors, including FHLMC, require the Corporation to advance funds to make scheduled payments of principal, interest, taxes and insurance, if such payments have not been received from the borrowers. At December 31, 2015, the Corporation serviced $20.6 billion in mortgage loans for third-parties, including the loans serviced with credit recourse (December 31, 2014 - $15.6 billion). The Corporation generally recovers funds advanced pursuant to these arrangements from the mortgage owner, from liquidation proceeds when the mortgage loan is foreclosed or, in the case of FHA/VA loans, under the applicable FHA and VA insurance and guarantees programs. However, in the meantime, the Corporation must absorb the cost of the funds it advances during the time the advance is outstanding. The Corporation must also bear the costs of attempting to collect on delinquent and defaulted mortgage loans. In addition, if a defaulted loan is not cured, the mortgage loan would be canceled as part of the foreclosure proceedings and the Corporation would not receive any future servicing income with respect to that loan. At December 31, 2015, the outstanding balance of funds advanced by the Corporation under such mortgage loan servicing agreements was approximately $80 million, including advances on the portfolio acquired from Doral Bank (December 31, 2014 - $36 million). To the extent the mortgage loans underlying the Corporation’s servicing portfolio experience increased delinquencies, the Corporation would be required to dedicate additional cash resources to comply with its obligation to advance funds as well as incur additional administrative costs related to increases in collection efforts.
Popular, Inc. Holding Company (“PIHC”) fully and unconditionally guarantees certain borrowing obligations issued by certain of its wholly-owned consolidated subsidiaries amounting to $ 0.1 billion at December 31, 2015 (December 31, 2014 - $ 0.2 billion). In addition, at December 31, 2015 and December 31, 2014, PIHC fully and unconditionally guaranteed on a subordinated basis $ 0.4 billion, respectively, of capital securities (trust preferred securities) issued by wholly-owned issuing trust entities to the extent set forth in the applicable guarantee agreement. Refer to Note 25 to the consolidated financial statements for further information on the trust preferred securities.
218
Note 30 – Commitments and contingencies
Off-balance sheet risk
The Corporation is a party to financial instruments with off-balance sheet credit risk in the normal course of business to meet the financial needs of its customers. These financial instruments include loan commitments, letters of credit, and standby letters of credit. These instruments involve, to varying degrees, elements of credit and interest rate risk in excess of the amount recognized in the consolidated statements of financial condition.
The Corporation’s exposure to credit loss in the event of nonperformance by the other party to the financial instrument for commitments to extend credit, standby letters of credit and financial guarantees written is represented by the contractual notional amounts of those instruments. The Corporation uses the same credit policies in making these commitments and conditional obligations as it does for those reflected on the consolidated statements of financial condition.
Financial instruments with off-balance sheet credit risk, whose contract amounts represent potential credit risk as of the end of the periods presented were as follows:
| | | | | | | | |
(In thousands) | | December 31, 2015 | | | December 31, 2014 | |
Commitments to extend credit: | | | | | | | | |
Credit card lines | | $ | 4,552,331 | | | $ | 4,450,284 | |
Commercial and construction lines of credit | | | 2,619,092 | | | | 2,415,843 | |
Other consumer unused credit commitments | | | 262,685 | | | | 269,225 | |
Commercial letters of credit | | | 2,040 | | | | 2,820 | |
Standby letters of credit | | | 49,670 | | | | 46,362 | |
Commitments to originate or fund mortgage loans | | | 21,311 | | | | 25,919 | |
At December 31, 2015, the Corporation maintained a reserve of approximately $10 million for potential losses associated with unfunded loan commitments related to commercial and consumer lines of credit, as compared to $13 million at December 31, 2014.
Other commitments
At December 31, 2015 and December 31, 2014, the Corporation also maintained other non-credit commitments for approximately $9 million, primarily for the acquisition of other investments.
Business concentration
Since the Corporation’s business activities are currently concentrated primarily in Puerto Rico, its results of operations and financial condition are dependent upon the general trends of the Puerto Rico economy and, in particular, the residential and commercial real estate markets. The concentration of the Corporation’s operations in Puerto Rico exposes it to greater risk than other banking companies with a wider geographic base. Its asset and revenue composition by geographical area is presented in Note 44 to the consolidated financial statements.
At December 31, 2015, the Corporation’s direct exposure to the Puerto Rico government and its instrumentalities and municipalities amounted to $ 669 million, of which approximately $ 578 million is outstanding ($ 1.0 billion and $ 811 million, respectively, at December 31, 2014). Of the amount outstanding, $ 502 million consists of loans and $ 76 million are securities ($ 689 million and $ 122 million at December 31, 2014). Also, of the amount outstanding, $ 76 million represents obligations from the Government of Puerto Rico and public corporations that have a specific source of income or revenues identified for their repayment ($ 336 million at December 31, 2014). Some of these obligations consist of senior and subordinated loans to public corporations that obtain revenues from rates charged for services or products, such as public utilities. Public corporations have varying degrees of independence from the central Government and many receive appropriations or other payments from it. The remaining $ 502 million outstanding represents obligations from various municipalities in Puerto Rico for which, in most cases, the good faith, credit and unlimited taxing power of the applicable municipality has been pledged to their repayment ($ 475 million at December 31, 2014). These municipalities are required by law to levy special property taxes in such amounts as shall be required for the payment of all of its general obligation bonds and loans. These loans have seniority to the payment of operating cost and expenses of the municipality. If the Government of Puerto Rico and its instrumentalities are unable to manage their fiscal crisis and refinance their debt in an orderly manner, there could be further downgrades of the ratings of these obligations and the value of these obligations
219
could be adversely affected, resulting in losses to us. During the quarter ended June 30, 2015, the Corporation agreed to sell a $75 million non-accrual public sector credit at BPPR, subject among other conditions, to the approval of the syndicate’s agent bank, and accordingly transferred it to held-for-sale. The sale agreement was terminated on July 29, 2015 pursuant to its terms after the parties were not able to obtain the approval of the agent bank on terms acceptable to the assignee. However, at December 31, 2015, the loan remains classified as held-for-sale as the Corporation maintains its ability and intent to sell the loan.
The following table details the loans and investments representing the Corporation’s direct exposure to the Puerto Rico government according to their maturities:
| | | | | | | | | | | | | | | | |
(In thousands) | | Investment Portfolio | | | Loans | | | Total Outstanding | | | Total Exposure | |
Central Government | | | | | | | | | | | | | | | | |
Within 1 year | | $ | — | | | $ | — | | | $ | — | | | $ | 50,794 | |
After 1 to 5 years | | | 883 | | | | — | | | | 883 | | | | 883 | |
After 5 to 10 years | | | 2,842 | | | | — | | | | 2,842 | | | | 2,842 | |
After 10 years | | | 12,731 | | | | — | | | | 12,731 | | | | 12,731 | |
| | | | | | | | | | | | | | | | |
Total Central Government | | | 16,456 | | | | — | | | | 16,456 | | | | 67,250 | |
| | | | | | | | | | | | | | | | |
Government Development Bank (GDB) | | | | | | | | | | | | | | | | |
Within 1 year | | | 4 | | | | — | | | | 4 | | | | 4 | |
After 1 to 5 years | | | 1,579 | | | | — | | | | 1,579 | | | | 1,579 | |
After 5 to 10 years | | | 44 | | | | — | | | | 44 | | | | 44 | |
| | | | | | | | | | | | | | | | |
Total Government Development Bank (GDB) | | | 1,627 | | | | — | | | | 1,627 | | | | 1,627 | |
| | | | | | | | | | | | | | | | |
Public Corporations: | | | | | | | | | | | | | | | | |
Puerto Rico Aqueduct and Sewer Authority | | | | | | | | | | | | | | | | |
Within 1 year | | | — | | | | 15,000 | | | | 15,000 | | | | 42,186 | |
After 10 years | | | 479 | | | | — | | | | 479 | | | | 479 | |
| | | | | | | | | | | | | | | | |
Total Puerto Rico Aqueduct and Sewer Authority | | | 479 | | | | 15,000 | | | | 15,479 | | | | 42,665 | |
| | | | | | | | | | | | | | | | |
Puerto Rico Electric Power Authority | | | | | | | | | | | | | | | | |
Within 1 year | | | — | | | | 42,270 | | | | 42,270 | | | | 42,270 | |
After 10 years | | | 22 | | | | — | | | | 22 | | | | 22 | |
| | | | | | | | | | | | | | | | |
Total Puerto Rico Electric Power Authority | | | 22 | | | | 42,270 | | | | 42,292 | | | | 42,292 | |
| | | | | | | | | | | | | | | | |
Puerto Rico Highways and Transportation Authority | | | | | | | | | | | | | | | | |
After 5 to 10 years | | | 4 | | | | — | | | | 4 | | | | 4 | |
| | | | | | | | | | | | | | | | |
Total Puerto Rico Highways and Transportation Authority | | | 4 | | | | — | | | | 4 | | | | 4 | |
| | | | | | | | | | | | | | | | |
Municipalities | | | | | | | | | | | | | | | | |
Within 1 year | | | 2,920 | | | | 52,488 | | | | 55,408 | | | | 69,006 | |
After 1 to 5 years | | | 13,655 | | | | 130,935 | | | | 144,590 | | | | 144,590 | |
After 5 to 10 years | | | 20,020 | | | | 138,187 | | | | 158,207 | | | | 158,207 | |
After 10 years | | | 20,325 | | | | 123,371 | | | | 143,696 | | | | 143,696 | |
| | | | | | | | | | | | | | | | |
Total Municipalities | | | 56,920 | | | | 444,981 | | | | 501,901 | | | | 515,499 | |
| | | | | | | | | | | | | | | | |
Total Direct Government Exposure | | $ | 75,508 | | | $ | 502,251 | | | $ | 577,759 | | | $ | 669,337 | |
| | | | | | | | | | | | | | | | |
In addition, at December 31, 2015, the Corporation had $394 million in indirect exposure to loans or securities that are payable by non-governmental entities, but which carry a government guarantee to cover any shortfall in collateral in the event of borrower default ($370 million at December 31, 2014). These included $316 million in residential mortgage loans that are guaranteed by the Puerto Rico Housing Finance Authority (December 31, 2014 - $289 million). These mortgage loans are secured by the underlying properties and the guarantees serve to cover shortfalls in collateral in the event of a borrower default. Also, the Corporation had $50 million in Puerto Rico pass-through housing bonds backed by FNMA, GNMA or residential loans CMO’s, and $28 million of commercial real estate notes ($49 million and $32 million at December 31, 2014, respectively).
220
Since February 2014, the three principal rating agencies (Moody’s, S&P and Fitch) have lowered their ratings on the General Obligation bonds of the Commonwealth and the bonds of several other Commonwealth instrumentalities to non-investment grade ratings. In connection with their rating actions, the rating agencies noted various factors, including high levels of public debt, the lack of a clear economic growth catalyst, recurring fiscal budget deficits, the financial condition of the public sector employee pension plans and, more recently, liquidity concerns regarding the Commonwealth and the GDB and their ability to access the capital markets. Currently, the Commonwealth’s general obligation ratings are as follows: S&P, ‘CC’, Moody’s, ‘Caa3’, and Fitch, ‘CC’.
During the second quarter of 2015, the Corporation recognized an other-than-temporary impairment charge of $14.4 million on its portfolio of investment securities available-for-sale classified as obligations from the Puerto Rico government and its political subdivisions. These securities were sold during the third quarter of 2015.
Other contingencies
As indicated in Note 14 to the consolidated financial statements, as part of the loss sharing agreements related to the Westernbank FDIC-assisted transaction, the Corporation agreed to make a true-up payment to the FDIC on the date that is 45 days following the last day of the final shared loss month, or upon the final disposition of all covered assets under the loss sharing agreements in the event losses on the loss sharing agreements fail to reach expected levels. The fair value of the true-up payment obligation was estimated at $ 120 million at December 31, 2015 (December 31, 2014 - $ 129 million). For additional information refer to Note 14.
Legal Proceedings
The nature of Popular’s business ordinarily results in a certain number of claims, litigation, investigations, and legal and administrative cases and proceedings. When the Corporation determines it has meritorious defenses to the claims asserted, it vigorously defends itself. The Corporation will consider the settlement of cases (including cases where it has meritorious defenses) when, in management’s judgment, it is in the best interest of both the Corporation and its shareholders to do so.
On at least a quarterly basis, Popular assesses its liabilities and contingencies in connection with outstanding legal proceedings utilizing the latest information available. For matters where it is probable that the Corporation will incur a material loss and the amount can be reasonably estimated, the Corporation establishes an accrual for the loss. Once established, the accrual is adjusted on at least a quarterly basis as appropriate to reflect any relevant developments. For matters where a material loss is not probable or the amount of the loss cannot be estimated, no accrual is established.
In certain cases, exposure to loss exists in excess of the accrual to the extent such loss is reasonably possible, but not probable. Management believes and estimates that the aggregate range of reasonably possible losses (with respect to those matters where such limits may be determined, in excess of amounts accrued), for current legal proceedings ranges from $0 to approximately $27 million as of December 31, 2015. For certain other cases, management cannot reasonably estimate the possible loss at this time. Any estimate involves significant judgment, given the varying stages of the proceedings (including the fact that many of them are currently in preliminary stages), the existence of multiple defendants in several of the current proceedings whose share of liability has yet to be determined, the numerous unresolved issues in many of the proceedings, and the inherent uncertainty of the various potential outcomes of such proceedings. Accordingly, management’s estimate will change from time-to-time, and actual losses may be more or less than the current estimate.
While the final outcome of legal proceedings is inherently uncertain, based on information currently available, advice of counsel, and available insurance coverage, management believes that the amount it has already accrued is adequate and any incremental liability arising from the Corporation’s legal proceedings will not have a material adverse effect on the Corporation’s consolidated financial position as a whole. However, in the event of unexpected future developments, it is possible that the ultimate resolution of these matters, if unfavorable, may be material to the Corporation’s consolidated financial position in a particular period.
Set forth below are descriptions of the Corporation’s material legal proceedings.
PCB has been named a defendant in a putative class action complaint captionedJosefina Valle, et al. v. Popular Community Bank,filed in November 2012 in the New York State Supreme Court (New York County). Plaintiffs, PCB customers, allege
221
among other things that PCB has engaged in unfair and deceptive acts and trade practices in connection with the assessment of overdraft fees and payment processing on consumer deposit accounts. The complaint further alleges that PCB improperly disclosed its consumer overdraft policies and, additionally, that the overdraft rates and fees assessed by PCB violate New York’s usury laws. The complaint seeks unspecified damages, including punitive damages, interest, disbursements, and attorneys’ fees and costs.
PCB removed the case to federal court (SDNY) and plaintiffs subsequently filed a motion to remand the action to state court, which the Court granted on August 6, 2013. A motion to dismiss was filed on September 9, 2013. On October 25, 2013, plaintiffs filed an amended complaint seeking to limit the putative class to New York account holders. A motion to dismiss the amended complaint was filed in February 2014. In August 2014, the Court entered an order granting in part PCB’s motion to dismiss. The sole surviving claim relates to PCB’s item processing policy. On September 10, 2014, plaintiffs filed a motion for leave to file a second amended complaint to correct certain deficiencies noted in the court’s decision and order. PCB subsequently filed a motion in opposition to plaintiff’s motion for leave to amend and further sought to compel arbitration. In June 2015, this matter was reassigned to a new judge and on July 22, 2015, such Court denied PCB’s motion to compel arbitration and granted plaintiffs’ motion for leave to amend the complaint to replead certain claims based on item processing reordering, misstatement of balance information and failure to notify customers in advance of potential overdrafts. The Court did not, however, allow plaintiffs to replead their claim for the alleged breach of the implied covenant of good faith and fair dealing. On August 12, 2015, the Plaintiffs filed a second amended complaint. On August 24, 2015, PCB filed a Notice of Appeal as to the order granting leave to file the second amended complaint and on September 17, 2015, it filed a motion to dismiss the second amended complaint. On October 7, 2015, PCB renewed its motion to compel arbitration. Both the motion to compel arbitration and the motion to bifurcate discovery were subsequently denied. At the January 21, 2016 hearing on BPNA’s Motion to Dismiss, however, the Court ordered that all discovery remain stayed pending a ruling on the Motion to Dismiss.
BPPR has been named a defendant in a putative class action complaint captionedNeysha Quiles et al. v. Banco Popular de Puerto Rico et al., filed in December 2013 in the United States District Court for the District of Puerto Rico (USDC-PR).Plaintiffs essentially allege that they and others, who have been employed by the Defendants as “bank tellers” and other similarly titled positions, have been paid only for scheduled work time, rather than time actually worked. The complaint seeks to maintain a collective action under the Fair Labor Standards Act (“FLSA”) on behalf of all individuals formerly or currently employed by BPPR in Puerto Rico and the Virgin Islands as hourly paid, non-exempt, bank tellers or other similarly titled positions at any time during the past three years. Specifically, the complaint alleges that BPPR violated FLSA by willfully failing to pay overtime premiums. Similar claims were brought under Puerto Rico law. On January 31, 2014, the Popular defendants filed an answer to the complaint. On January 9, 2015, plaintiffs submitted a motion for conditional class certification, which BPPR opposed. On February 18, 2015, the Court entered an order whereby it granted plaintiffs’ request for conditional certification of the FLSA action. Following the Court’s order, plaintiffs sent out notices to all purported class members with instructions for opting into the class. Approximately sixty potential class members opted into the class prior to the expiration of the opt-in period. On June 25, 2015, the Court denied with prejudice plaintiffs’ motion for class certification under Rule 23 of the Federal Rules of Civil Procedure. On October 20, 2015, the parties reached an agreement in principle to resolve the referenced action for an immaterial amount, subject to their reaching an agreement on the payment of reasonable attorneys’ fees. The parties have submitted briefing on this subject, and the matter is now ripe for adjudication.
BPPR and Popular Securities have also been named defendants in a putative class action complaint captionedNora Fernandez, et al. v. UBS, et al., filed in the United States District Court for the Southern District of New York (SDNY) on May 5, 2014 on behalf of investors in 23 Puerto Rico closed-end investment companies. UBS Financial Services Incorporated of Puerto Rico, another named defendant, is the sponsor and co-sponsor of all 23 funds, while BPPR was co-sponsor, together with UBS, of nine (9) of those funds. Plaintiffs allege breach of fiduciary duty and breach of contract against Popular Securities, aiding and abetting breach of fiduciary duty against BPPR, and similar claims against the UBS entities. The complaint seeks unspecified damages, including disgorgement of fees and attorneys’ fees. On May 30, 2014, plaintiffs voluntarily dismissed their class action in the SDNY and on that same date, they filed a virtually identical complaint in the USDC-PR and requested that the case be consolidated with the matter ofIn re: UBS Financial Services Securities Litigation, a class action currently pending before the USDC-PR in which neither BPPR nor Popular Securities are parties. The UBS defendants filed an opposition to the consolidation request and moved to transfer the case back to the SDNY on the ground that the relevant agreements between the parties contain a choice of forum clause, with New York as the selected forum. The Popular defendants joined this opposition and motion. By order dated January 30, 2015, the court denied the plaintiffs’ motion to consolidate. By order dated March 30, 2015, the court granted defendants’ motion to transfer. On May 8, 2015, plaintiffs filed an amended complaint in the SDNY containing virtually identical allegations with respect to Popular Securities and BPPR. Defendants filed motions to dismiss the amended complaint on June 18, 2015. Those motions remain pending to date.
222
BPPR has been named a defendant in a putative class action complaint titledIn re 2014 RadioShack ERISA Litigation, filed in U.S. District Court for the Northern District of Texas. The complaint alleges that certain employees of RadioShack incurred losses in their 401(k) plans because various fiduciaries elected to retain RadioShack’s company stock in the portfolio of potential investment options. The complaint further asserts that once RadioShack’s financial situation began to deteriorate in 2011, the fiduciaries of the RadioShack 401(k) Plan and the RadioShack Puerto Rico 1165(e) Plan (collectively, “the Plans”) should have removed RadioShack company stock from the portfolio of potential investment options.
Popular was a directed trustee, and therefore a fiduciary, of the RadioShack Puerto Rico 1165(e) Plan (“P.R. Plan”). Even though the PR Plan directed BPPR to retain RadioShack company stock within the portfolio of investment options, the complaint alleges that a trustee’s duty of prudence requires it to disregard plan documents or directives that it knows or reasonably should know would lead to an imprudent result or would otherwise harm plan participants or beneficiaries. It further alleges that BPPR breached its fiduciary duties by (i) failing to take any meaningful steps to protect plan participants from losses that it knew would occur; (ii) failing to divest the PR Plan of company stock; and (iii) participating in the decisions of another trustee (Wells Fargo) to protect the Plans from inevitable losses.
On November 23, 2015, the parties attended a mediation session, as a result of which the parties agreed to settle this matter for an immaterial amount, with BPPR contributing approximately $45,000. On February 22, 2016, the RadioShack defendants submitted an opposition to the bar provisions of BPPR’s proposed settlement whereby they conditioned such settlement to BPPR’s agreement to a proportional methodology to any subsequent settlement. Under this scenario, BPPR could remain potentially liable for an additional proportional amount, should plaintiffs appeal the dismissal of their claim and win on appeal.
Other Matters
The volatility in prices and declines in value that Puerto Rico municipal bonds and closed-end investment companies that invest primarily in Puerto Rico municipal bonds have experienced since August 2013 have led to regulatory inquiries, customer complaints and arbitrations for most broker-dealers in Puerto Rico, including Popular Securities, a wholly owned subsidiary of the Corporation. Popular Securities has received customer complaints and is named as a respondent (among other broker-dealers) in 52 arbitration proceedings with aggregate claimed damages of approximately $125 million, including one arbitration with claimed damages of $78 million in which two other Puerto Rico broker-dealers are co-defendants. The proceedings are in their early stages and it is the view of the Corporation that Popular Securities has meritorious defenses to the claims asserted. The Government’s announcements regarding its ability to pay its debt and intention to pursue a comprehensive debt restructuring, together with the market reaction to it, may increase the number of customer complaints (and claimed damages) against Popular Securities concerning Puerto Rico municipal bonds and closed-end investment companies that invest primarily in Puerto Rico municipal bonds. An adverse result in the matters described above or a significant increase in customer complaints could have a material and adverse effect on Popular.
As mortgage lenders, the Corporation and its subsidiaries from time to time receive requests for information from departments of the U.S. government that investigate mortgage-related conduct. In particular, BPPR has received subpoenas and other requests for information from the Federal Housing Finance Agency’s Office of the Inspector General, the Civil Division of the Department of Justice and the Special Inspector General for the Troubled Asset Relief Program concerning mortgages and real estate appraisals in Puerto Rico. The Corporation is cooperating with these requests.
Other Significant Proceedings
As described under “Note 14 – FDIC loss share asset and true-up payment obligation”, in connection with the Westernbank FDIC-assisted transaction, on April 30, 2010, BPPR entered into loss share agreements with the FDIC with respect to the covered loans and other real estate owned “(OREO”) that it acquired in the transaction. Pursuant to the terms of the loss share agreements, the FDIC’s obligation to reimburse BPPR for losses with respect to covered assets begins with the first dollar of loss incurred. The FDIC reimburses BPPR for 80% of losses with respect to covered assets, and BPPR reimburses the FDIC for 80% of recoveries with respect to losses for which the FDIC paid 80% reimbursement under those loss share agreements. The loss share agreements contain specific terms and conditions regarding the management of the covered assets that BPPR must follow in order to receive reimbursement for losses from the FDIC. BPPR believes that it has complied with such terms and conditions. The loss share agreement applicable to the covered commercial and OREO described below provides for loss sharing by the FDIC through the quarter ending June 30, 2015 and for reimbursement to the FDIC for recoveries through the quarter ending June 30, 2018.
For the quarters ended June 30, 2010 through March 31, 2012, BPPR received reimbursement for loss-share claims submitted to the FDIC, including charge-offs for certain commercial late stage real-estate-collateral-dependent loans and OREO calculated in
223
accordance with BPPR’s charge-off policy for non-covered assets. When BPPR submitted its shared-loss claim in connection with the June 30, 2012 quarter, however, the FDIC refused to reimburse BPPR for a portion of the claim because of a difference related to the methodology for the computation of charge-offs for certain commercial late stage real-estate-collateral-dependent loans and OREO. In accordance with the terms of the commercial loss share agreement, BPPR applied a methodology for charge-offs for late stage real-estate-collateral-dependent loans that conforms to its regulatory supervisory criteria and is calculated in accordance with BPPR’s charge-off policy for non-covered assets. The FDIC stated that it believed that BPPR should use a different methodology for those charge-offs. Notwithstanding the FDIC’s refusal to reimburse BPPR for certain shared-loss claims, BPPR had continued to calculate shared-loss claims for quarters subsequent to June 30, 2012 in accordance with its charge-off policy for non-covered assets.
BPPR’s loss share agreements with the FDIC specify that disputes can be submitted to arbitration before a review board under the commercial arbitration rules of the American Arbitration Association. On July 31, 2013, BPPR filed a statement of claim with the American Arbitration Association requesting that a review board determine certain matters relating to the loss-share claims under its commercial loss share agreement with the FDIC, including that the review board award BPPR the amounts owed under its unpaid quarterly certificates. The statement of claim also included requests for reimbursement of certain valuation adjustments for discounts to appraised values, costs to sell troubled assets and other items. The review board was comprised of one arbitrator appointed by BPPR, one arbitrator appointed by the FDIC and a third arbitrator selected by agreement of those arbitrators.
On October 17, 2014, BPPR and the FDIC settled all claims and counterclaims that had been submitted to the review board. The settlement provides for an agreed valuation methodology for reimbursement of charge-offs for late stage real-estate-collateral-dependent loans and resulting OREO. BPPR applied this valuation methodology to charge-offs claimed on late stage real-estate-collateral-dependent loans and resulting OREO during the remaining term of the commercial loss-sharing agreement which expired on June 30, 2015.
On November 25, 2014, the FDIC notified BPPR that it (a) would not reimburse BPPR under the commercial loss share agreement for a $66.6 million loss claim on eight related real estate loans that BPPR restructured and consolidated (collectively, the “Disputed Asset”), and (b) would no longer treat the Disputed Asset as a “Shared-Loss Asset” under the commercial loss share agreement. The FDIC alleged that BPPR’s restructure and modification of the underlying loans did not constitute a “Permitted Amendment” under the commercial loss share agreement, thereby causing the bank to breach Article III of the commercial loss share agreement. BPPR disagrees with the FDIC’s determinations relating to the Disputed Asset, and accordingly, on December 19, 2014, delivered to the FDIC a notice of dispute under the commercial loss share agreement.
On March 19, 2015, BPPR filed a statement of claim with the American Arbitration Association requesting that a review board determine BPPR and the FDIC’s disputes concerning the Disputed Asset. The statement of claim requests a declaration that the Disputed Asset is a “Shared-Loss Asset” under the commercial loss share agreement, a declaration that the restructuring is a “Permitted Amendment” under the commercial loss share agreement, and an order that the FDIC reimburse the bank for approximately $53.3 million for the Charge-Off of the Disputed Asset, plus interest at the applicable rate. On April 1, 2015, the FDIC notified BPPR that it was clawing back approximately $1.7 million in reimbursable expenses relating to the Disputed Asset that the FDIC had previously paid to BPPR. Thus, on April 13, 2015, BPPR notified the American Arbitration Association and the FDIC of an increase in the amount of its damages by approximately $1.7 million. The review board in the arbitration concerning the Disputed Asset is comprised of one arbitrator appointed by BPPR, one arbitrator appointed by the FDIC and a third arbitrator selected by agreement of those arbitrators. The arbitration hearing has been scheduled for August 2016.
In addition, in November and December 2014, BPPR proposed separate portfolio sales of Shared-Loss Assets to the FDIC. The FDIC refused to consent to either sale, stating that those sales did not represent best efforts to maximize collections on Shared-Loss Assets under the commercial loss share agreement. In March 2015, BPPR proposed a third portfolio sale to the FDIC, and in May 2015, BPPR proposed a fourth portfolio sale to the FDIC.
BPPR disagrees with the FDIC’s characterization of the November and December 2014 portfolio sale proposals and with the FDIC’s interpretation of the commercial loss share agreement provision governing portfolio sales. Accordingly, on March 13, 2015, BPPR delivered to the FDIC a notice of dispute under the commercial loss share agreement. On June 8, 2015, BPPR filed a statement of claim with the American Arbitration Association requesting that a review board resolve the disputes concerning those proposed portfolio sales. On June 15, 2015, BPPR amended its statement of claim to include a claim for the FDIC-R’s refusal to timely concur in the third sale proposed in March 2015. On June 29, 2015, the FDIC informed BPPR that it would reimburse the bank for losses
224
arising from the primary portfolio of the third proposed sale, but only subject to conditions to which BPPR objected. The FDIC also informed BPPR that it would not concur in the sale of the remainder (the “secondary portfolio”) of the third proposed sale or in the fourth proposed sale. On September 4, 2015, BPPR filed a second amended statement of claim concerning the FDIC’s refusal to concur in the third and fourth portfolio sales as proposed by BPPR. On November 25, 2015, BPPR conducted an auction sale of the loans in the primary portfolio of the third proposed sale and intends to submit a claim for reimbursement of the losses arising from that sale. The review board in the arbitration concerning the proposed portfolio sales is comprised of one arbitrator appointed by BPPR, one arbitrator appointed by the FDIC and a third arbitrator selected by agreement of those arbitrators. The arbitration hearing is scheduled to be held in the fall of 2016.
On November 12, 2015, the FDIC notified BPPR that it (a) would deny certain claims included in BPPR’s Second Quarter 2015 Quarterly Certificate and (b) withhold payment of approximately $5.5 million attributed to the $6.9 million in losses claimed under the denied claims. In support of its denial, the FDIC alleged that BPPR did not comply with its obligation under the commercial loss share agreement, including compliance with certain provisions of GAAP, acting in accordance with prudent banking practices, managing Shared-Loss Assets in the same manner as BPPR’s non-Shared-Loss Assets, and using best efforts to maximize collections on the Shared-Loss Assets. BPPR disagrees with the FDIC’s allegations relating to the denied claims included in BPPR’s Second Quarter 2015 Quarterly Certificate, and accordingly, on January 27, 2016 delivered to the FDIC a notice of dispute under the commercial loss share agreement.
The shared-loss arrangement described above expired on June 30, 2015. As of December 31, 2015, BPPR had unreimbursed loss claims related to the commercial loss-sharing arrangement amounting to $234 million, reflected in the FDIC indemnification asset as a receivable from the FDIC, which include approximately $85 million related to losses claimed during the second quarter of 2015 as described above and approximately $149 million which are subject to the arbitration proceedings described above. This last figure may continue to increase to the extent that the assets that are the subject of the portfolio sales arbitration further decline in value. Until these disputes are finally resolved, the terms of the commercial loss share agreement will remain in effect with respect to any such items under dispute. No assurance can be given that we will receive reimbursement from the FDIC with respect to the foregoing items, which could require us to make a material adjustment to the value of our loss share asset and the related true up payment obligation to the FDIC and could have a material adverse effect on our financial results for the period in which such adjustment is taken.
The loss sharing agreement applicable to single-family residential mortgage loans provides for FDIC loss sharing and BPPR reimbursement to the FDIC for ten years (ending on June 30, 2020), and the loss sharing agreement applicable to commercial and other assets provides for FDIC loss sharing and BPPR reimbursement to the FDIC for five years (ending on June 30, 2015), with additional recovery sharing for three years thereafter. As of December 31, 2015, the carrying value of covered loans approximated $646 million, mainly comprised of single-family residential mortgage loans. To the extent that estimated losses on covered loans are not realized before the expiration of the applicable loss sharing agreement, such losses would not be subject to reimbursement from the FDIC and, accordingly, would require us to make a material adjustment in the value of our loss share asset and the related true up payment obligation to the FDIC and could have a material adverse effect on our financial results for the period in which such adjustment is taken.
225
Note 31 – Non-consolidated variable interest entities
The Corporation is involved with four statutory trusts which it established to issue trust preferred securities to the public. These trusts are deemed to be variable interest entities (“VIEs”) since the equity investors at risk have no substantial decision-making rights. The Corporation does not hold any variable interest in the trusts, and therefore, cannot be the trusts’ primary beneficiary. Furthermore, the Corporation concluded that it did not hold a controlling financial interest in these trusts since the decisions of the trusts are predetermined through the trust documents and the guarantee of the trust preferred securities is irrelevant since in substance the sponsor is guaranteeing its own debt.
Also, the Corporation is involved with various special purpose entities mainly in guaranteed mortgage securitization transactions, including GNMA and FNMA. These special purpose entities are deemed to be VIEs since they lack equity investments at risk. The Corporation’s continuing involvement in these guaranteed loan securitizations includes owning certain beneficial interests in the form of securities as well as the servicing rights retained. The Corporation is not required to provide additional financial support to any of the variable interest entities to which it has transferred the financial assets. The mortgage-backed securities, to the extent retained, are classified in the Corporation’s consolidated statements of financial condition as available-for-sale or trading securities. The Corporation concluded that, essentially, these entities (FNMA and GNMA,) control the design of their respective VIEs, dictate the quality and nature of the collateral, require the underlying insurance, set the servicing standards via the servicing guides and can change them at will, and can remove a primary servicer with cause, and without cause in the case of FNMA. Moreover, through their guarantee obligations, agencies (FNMA and GNMA) have the obligation to absorb losses that could be potentially significant to the VIE.
ASU 2009-17 requires that an ongoing primary beneficiary assessment should be made to determine whether the Corporation is the primary beneficiary of any of the VIEs it is involved with. The conclusion on the assessment of these trusts and guaranteed mortgage securitization transactions has not changed since their initial evaluation. The Corporation concluded that it is still not the primary beneficiary of these VIEs, and therefore, these VIEs are not required to be consolidated in the Corporation’s financial statements at December 31, 2015.
The Corporation holds variable interests in these VIEs in the form of agency mortgage-backed securities and collateralized mortgage obligations, including those securities originated by the Corporation and those acquired from third parties. Additionally, the Corporation holds agency mortgage-backed securities, agency collateralized mortgage obligations and private label collateralized mortgage obligations issued by third party VIEs in which it has no other form of continuing involvement. Refer to Note 34 to the consolidated financial statements for additional information on the debt securities outstanding at December 31, 2015 and 2014, which are classified as available-for-sale and trading securities in the Corporation’s consolidated statement of financial condition. In addition, the Corporation may retain the right to service the transferred loans in those government-sponsored special purpose entities (“SPEs”) and may also purchase the right to service loans in other government-sponsored SPEs that were transferred to those SPEs by a third-party. Pursuant to ASC Subtopic 810-10, the servicing fees that the Corporation receives for its servicing role are considered variable interests in the VIEs since the servicing fees are subordinated to the principal and interest that first needs to be paid to the mortgage-backed securities’ investors and to the guaranty fees that need to be paid to the federal agencies.
226
The following table presents the carrying amount and classification of the assets related to the Corporation’s variable interests in non-consolidated VIEs and the maximum exposure to loss as a result of the Corporation’s involvement as servicer with non-consolidated VIEs at December 31, 2015 and 2014.
| | | | | | | | |
(In thousands) | | 2015 | | | 2014 | |
Assets | | | | | | | | |
Servicing assets: | | | | | | | | |
Mortgage servicing rights | | $ | 163,224 | | | $ | 103,828 | |
| | | | | | | | |
Total servicing assets | | $ | 163,224 | | | $ | 103,828 | |
| | | | | | | | |
Other assets: | | | | | | | | |
Servicing advances | | $ | 24,431 | | | $ | 8,974 | |
| | | | | | | | |
Total other assets | | $ | 24,431 | | | $ | 8,974 | |
| | | | | | | | |
Total assets | | $ | 187,655 | | | $ | 112,802 | |
| | | | | | | | |
Maximum exposure to loss | | $ | 187,655 | | | $ | 112,802 | |
| | | | | | | | |
The size of the non-consolidated VIEs, in which the Corporation has a variable interest in the form of servicing fees, measured as the total unpaid principal balance of the loans, amounted to $12.8 billion at December 31, 2015 ($9.0 billion at December 31, 2014).
Maximum exposure to loss represents the maximum loss, under a worst case scenario, that would be incurred by the Corporation, as servicer for the VIEs, assuming all loans serviced are delinquent and that the value of the Corporation’s interests and any associated collateral declines to zero, without any consideration of recovery. The Corporation determined that the maximum exposure to loss includes the fair value of the MSRs and the assumption that the servicing advances at December 31, 2015 and 2014 will not be recovered. The agency debt securities are not included as part of the maximum exposure to loss since they are guaranteed by the related agencies.
In September of 2011, BPPR sold construction and commercial real estate loans with a fair value of $148 million, and most of which were non-performing, to a newly created joint venture, PRLP 2011 Holdings, LLC. The joint venture was created for the limited purpose of acquiring the loans from BPPR; servicing the loans through a third-party servicer; ultimately working out, resolving and/or foreclosing the loans; and indirectly owning, operating, constructing, developing, leasing and selling any real properties acquired by the joint venture through deed in lieu of foreclosure, foreclosure, or by resolution of any loan.
BPPR provided financing to the joint venture for the acquisition of the loans in an amount equal to the sum of 57 % of the purchase price of the loans, or $84 million, and $2 million of closing costs, for a total acquisition loan of $86 million (the “acquisition loan”). The acquisition loan has a 5-year maturity and bears a variable interest at 30-day LIBOR plus 300 basis points and is secured by a pledge of all of the acquiring entity’s assets. In addition, BPPR provided the joint venture with a non-revolving advance facility (the “advance facility”) of $68.5 million to cover unfunded commitments and costs-to-complete related to certain construction projects, and a revolving working capital line (the “working capital line”) of $20 million to fund certain operating expenses of the joint venture. Cash proceeds received by the joint venture are first used to cover debt service payments for the acquisition loan, advance facility, and the working capital line described above which must be paid in full before proceeds can be used for other purposes. The distributable cash proceeds are determined based on a pro-rata basis in accordance with the respective equity ownership percentages. BPPR’s equity interest in the joint venture ranks pari-passu with those of other parties involved. As part of the transaction executed in September 2011, BPPR received $ 48 million in cash and a 24.9 % equity interest in the joint venture. The Corporation is not required to provide any other financial support to the joint venture.
BPPR accounted for this transaction as a true sale pursuant to ASC Subtopic 860-10 and thus recognized the cash received, its equity investment in the joint venture, and the acquisition loan provided to the joint venture and derecognized the loans sold.
The Corporation has determined that PRLP 2011 Holdings, LLC is a VIE but it is not the primary beneficiary. All decisions are made by Caribbean Property Group (“CPG”) (or an affiliate thereof) (the “Manager”), except for certain limited material decisions which would require the unanimous consent of all members. The Manager is authorized to execute and deliver on behalf of the joint venture any and all documents, contracts, certificates, agreements and instruments, and to take any action deemed necessary in the benefit of the joint venture. Also, the Manager delegates the day-to-day management and servicing of the loans to CPG Island Servicing, LLC, an affiliate of CPG, which contracted a sub-servicer, but has the responsibility to oversee such servicing responsibilities.
The Corporation holds variable interests in this VIE in the form of the 24.9 % equity interest and the financing provided to the joint venture. The equity interest is accounted for using the equity method of accounting pursuant to ASC Subtopic 323-10.
227
The initial fair value of the Corporation’s equity interest in the joint venture was determined based on the fair value of the loans and real estate owned transferred to the joint venture of $148 million which represented the purchase price of the loans agreed by the parties and was an arm’s-length transaction between market participants in accordance with ASC Topic 820, reduced by the acquisition loan provided by BPPR to the joint venture, for a total net equity of $63 million. Accordingly, the 24.9% equity interest held by the Corporation was valued at $16 million. Thus, the fair value of the equity interest is considered a Level 2 fair value measurement since the inputs were based on observable market inputs.
The following table presents the carrying amount and classification of the assets related to the Corporation’s variable interests in the non-consolidated VIE, PRLP 2011 Holdings, LLC and its maximum exposure to loss at December 31:
| | | | | | | | |
(In thousands) | | 2015 | | | 2014 | |
Assets | | | | | | | | |
Loans held-in-portfolio: | | | | | | | | |
Working capital line advances | | $ | 579 | | | $ | 426 | |
Advance facility advances | | | 401 | | | | 4,226 | |
| | | | | | | | |
Total loans held-in-portfolio | | $ | 980 | | | $ | 4,652 | |
| | | | | | | | |
Accrued interest receivable | | $ | 10 | | | $ | 22 | |
Other assets: | | | | | | | | |
Investment in PRLP 2011 Holdings LLC | | $ | 13,069 | | | $ | 23,650 | |
| | | | | | | | |
Total assets | | $ | 14,059 | | | $ | 28,324 | |
| | | | | | | | |
Deposits | | $ | (18,808 | ) | | $ | (2,685 | ) |
| | | | | | | | |
Total liabilities | | $ | (18,808 | ) | | $ | (2,685 | ) |
| | | | | | | | |
Total net (liabilities) assets | | $ | (4,749 | ) | | $ | 25,639 | |
| | | | | | | | |
Maximum exposure to loss | | $ | — | | | $ | 25,639 | |
| | | | | | | | |
The Corporation determined that the maximum exposure to loss under a worst case scenario at December 31, 2015 would be not recovering the carrying amount of the acquisition loan, the advances on the advance facility and working capital line, if any, and the equity interest held by the Corporation, net of the deposits.
On March 25, 2013, BPPR completed a sale of assets with a book value of $509.0 million, of which $500.6 million were in non-performing status, comprised of commercial and construction loans, and commercial and single family real estate owned, with a combined unpaid principal balance on loans and appraised value of other real estate owned of approximately $987.0 million to a newly created joint venture, PR Asset Portfolio 2013-1. The joint venture was created for the limited purpose of acquiring the loans from BPPR; servicing the loans through a third-party servicer; ultimately working out, resolving and/or foreclosing the loans; and indirectly owning, operating, constructing, developing, leasing and selling any real properties acquired by the joint venture through deed in lieu of foreclosure, foreclosure, or by resolution of any loan.
BPPR provided financing to the joint venture for the acquisition of the assets in an amount equal to the sum of 57 % of the purchase price of the assets, and closing costs, for a total acquisition loan of $182.4 million (the “acquisition loan”). The acquisition loan has a 5-year maturity and bears a variable interest at 30-day LIBOR plus 300 basis points and is secured by a pledge of all of the acquiring entity’s assets. In addition, BPPR provided the joint venture with a non-revolving advance facility (the “advance facility”) of $35.0 million to cover unfunded commitments and costs-to-complete related to certain construction projects, and a revolving working capital line (the “working capital line”) of $30.0 million to fund certain operating expenses of the joint venture. Cash proceeds received by the joint venture are first used to cover debt service payments for the acquisition loan, advance facility, and the working capital line described above which must be paid in full before proceeds can be used for other purposes. The distributable cash proceeds are determined based on a pro-rata basis in accordance with the respective equity ownership percentages. BPPR’s equity interest in the joint venture ranks pari-passu with those of other parties involved. As part of the transaction executed in March 2013, BPPR received $92.3 million in cash and a 24.9 % equity interest in the joint venture. The Corporation is not required to provide any other financial support to the joint venture.
228
BPPR accounted for this transaction as a true sale pursuant to ASC Subtopic 860-10 and thus recognized the cash received, its equity investment in the joint venture, and the acquisition loan provided to the joint venture and derecognized the loans and real estate owned sold.
The Corporation has determined that PR Asset Portfolio 2013-1 International, LLC is a VIE but the Corporation is not the primary beneficiary. All decisions are made by CPG (or an affiliate thereof) (the “Manager”), except for certain limited material decisions which would require the unanimous consent of all members. The Manager is authorized to execute and deliver on behalf of the joint venture any and all documents, contracts, certificates, agreements and instruments, and to take any action deemed necessary in the benefit of the joint venture. Also, the Manager delegates the day-to-day management and servicing of the loans to PR Asset Portfolio Servicing International, LLC, an affiliate of CPG.
The initial fair value of the Corporation’s equity interest in the joint venture was determined based on the fair value of the loans and real estate owned transferred to the joint venture of $306 million which represented the purchase price of the loans agreed by the parties and was an arm’s-length transaction between market participants in accordance with ASC Topic 820, reduced by the acquisition loan provided by BPPR to the joint venture, for a total net equity of $124 million. Accordingly, the 24.9% equity interest held by the Corporation was valued at $31 million. Thus, the fair value of the equity interest is considered a Level 2 fair value measurement since the inputs were based on observable market inputs.
The Corporation holds variable interests in this VIE in the form of the 24.9 % equity interest (the “Investment in PR Asset Portfolio 2013-1 International, LLC”) and the financing provided to the joint venture. The equity interest is accounted for under the equity method of accounting pursuant to ASC Subtopic 323-10.
The following table presents the carrying amount and classification of the assets and liabilities related to the Corporation’s variable interests in the non-consolidated VIE, PR Asset Portfolio 2013-1 International, LLC, and its maximum exposure to loss at December 31, 2015 and December 31, 2014.
| | | | | | | | |
(In thousands) | | 2015 | | | 2014 | |
Assets | | | | | | | | |
Loans held-in-portfolio: | | | | | | | | |
Acquisition loan | | $ | 35,121 | | | $ | 97,193 | |
Advances under the working capital line | | | 885 | | | | 990 | |
Advances under the advance facility | | | 22,296 | | | | 12,460 | |
| | | | | | | | |
Total loans held-in-portfolio | | $ | 58,302 | | | $ | 110,643 | |
| | | | | | | | |
Accrued interest receivable | | $ | 169 | | | $ | 314 | |
Other assets: | | | | | | | | |
Investment in PR Asset Portfolio 2013-1 International, LLC | | $ | 25,094 | | | $ | 31,374 | |
| | | | | | | | |
Total assets | | $ | 83,565 | | | $ | 142,331 | |
| | | | | | | | |
Deposits | | $ | (11,772 | ) | | $ | (12,960 | ) |
| | | | | | | | |
Total liabilities | | $ | (11,772 | ) | | $ | (12,960 | ) |
| | | | | | | | |
Total net assets | | $ | 71,793 | | | $ | 129,371 | |
| | | | | | | | |
Maximum exposure to loss | | $ | 71,793 | | | $ | 129,371 | |
| | | | | | | | |
The Corporation determined that the maximum exposure to loss under a worst case scenario at December 31, 2015 would be not recovering the carrying amount of the acquisition loan, the advances on the advance facility and working capital line, if any, and the equity interest held by the Corporation, net of deposits.
Note 32 – Derivative instruments and hedging activities
The use of derivatives is incorporated as part of the Corporation’s overall interest rate risk management strategy to minimize significant unplanned fluctuations in earnings and cash flows that are caused by interest rate volatility. The Corporation’s goal is to manage interest rate sensitivity by modifying the repricing or maturity characteristics of certain balance sheet assets and liabilities so that the net interest income is not materially affected by movements in interest rates. The Corporation uses derivatives in its
229
trading activities to facilitate customer transactions, and as a means of risk management. As a result of interest rate fluctuations, hedged fixed and variable interest rate assets and liabilities will appreciate or depreciate in fair value. The effect of this unrealized appreciation or depreciation is expected to be substantially offset by the Corporation’s gains or losses on the derivative instruments that are linked to these hedged assets and liabilities. As a matter of policy, the Corporation does not use highly leveraged derivative instruments for interest rate risk management.
By using derivative instruments, the Corporation exposes itself to credit and market risk. If a counterparty fails to fulfill its performance obligations under a derivative contract, the Corporation’s credit risk will equal the fair value of the derivative asset. Generally, when the fair value of a derivative contract is positive, this indicates that the counterparty owes the Corporation, thus creating a repayment risk for the Corporation. To manage the level of credit risk, the Corporation deals with counterparties of good credit standing, enters into master netting agreements whenever possible and, when appropriate, obtains collateral. On the other hand, when the fair value of a derivative contract is negative, the Corporation owes the counterparty and, therefore, the fair value of derivatives liabilities incorporates nonperformance risk or the risk that the obligation will not be fulfilled.
The credit risk attributed to the counterparty’s nonperformance risk is incorporated in the fair value of the derivatives. Additionally, as required by the fair value measurements guidance, the fair value of the Corporation’s own credit standing is considered in the fair value of the derivative liabilities. During the year ended December 31, 2015, inclusion of the credit risk in the fair value of the derivatives resulted in loss of $0.8 million (2014 –loss of $ 0.1 million; 2013 –gain of $ 0.5 million) from the Corporation’s credit standing adjustment and a gain of $0.3 million (2014 – gain of $ 1.2 million; 2013 – gain of $1.0 million) from the assessment of the counterparties’ credit risk.
Market risk is the adverse effect that a change in interest rates, currency exchange rates, or implied volatility rates might have on the value of a financial instrument. The Corporation manages the market risk associated with interest rates and, to a limited extent, with fluctuations in foreign currency exchange rates by establishing and monitoring limits for the types and degree of risk that may be undertaken.
Pursuant to the Corporation’s accounting policy, the fair value of derivatives is not offset with the amounts for the right to reclaim cash collateral or the obligation to return cash collateral. At December 31, 2015, the amount recognized for the right to reclaim cash collateral under master netting agreements was $10 million and no amount was recognized for the obligation to return cash collateral (December 31, 2014 - $ 15 million and no amount, respectively).
Certain of the Corporation’s derivative instruments include financial covenants tied to the corresponding banking subsidiary’s well-capitalized status and credit rating. These agreements could require exposure collateralization, early termination or both. The aggregate fair value of all derivative instruments with contingent features that were in a liability position at December 31, 2015 was $4 million (December 31, 2014 - $ 9 million). Based on the contractual obligations established on these derivative instruments, the Corporation has fully collateralized these positions by pledging collateral of $10 million at December 31, 2015 (December 31, 2014 - $ 15 million).
230
Financial instruments designated as cash flow hedges or non-hedging derivatives outstanding at December 31, 2015 and December 31, 2014 were as follows:
| | | | | | | | | | | | | | | | | | | | | | | | | | | | | | | | |
| | | Notional amount | | | Derivative assets | | | Derivative liabilities | |
| | | At December 31, | | | Statement of
condition | | | Fair value at December 31, | | | Statement of
condition | | | Fair value at December 31, | |
(In thousands) | | 2015 | | | 2014 | | | classification | | | 2015 | | | 2014 | | | classification | | | 2015 | | | 2014 | |
Derivatives designated as hedging instruments: | | | | | | | | | | | | | | | | | | | | | | | | | | | | | | | | |
| | | | | | | | |
Forward contracts | | $ | 109,900 | | | $ | 92,850 | | | | Other assets | | | $ | 24 | | | $ | — | | | | Other liabilities | | | $ | 232 | | | $ | 551 | |
| | | | | | | | | | | | | | | | | | | | | | | | | | | | | | | | |
Total derivatives designated as hedging instruments | | $ | 109,900 | | | $ | 92,850 | | | | | | | $ | 24 | | | $ | — | | | | | | | $ | 232 | | | $ | 551 | |
| | | | | | | | | | | | | | | | | | | | | | | | | | | | | | | | |
Derivatives not designated as hedging instruments: | | | | | | | | | | | | | | | | | | | | | | | | | | | | | | | | |
| | | | | | | | |
Interest rate swaps | | $ | 189,152 | | | $ | 237,576 | | | | Other assets | | | $ | 3,760 | | | $ | 8,418 | | | | Other liabilities | | | $ | 4,144 | | | $ | 9,102 | |
| | | | | | | | |
Foreign currency forward contracts | | | 140 | | | | 745 | | | | Other assets | | | | 1 | | | | 16 | | | | Other liabilities | | | | — | | | | 11 | |
| | | | | | | | |
Interest rate caps | | | 94,680 | | | | 96,046 | | | | Other assets | | | | 94 | | | | 320 | | | | Other liabilities | | | | 94 | | | | 320 | |
Indexed options on deposits | | | 90,409 | | | | 86,712 | | | | Other assets | | | | 13,080 | | | | 16,608 | | | | — | | | | — | | | | — | |
Bifurcated embedded options | | | 86,283 | | | | 83,244 | | | | — | | | | — | | | | — | | |
| Interest bearing
deposits |
| | | 9,873 | | | | 13,048 | |
| | | | | | | | | | | | | | | | | | | | | | | | | | | | | | | | |
Total derivatives not designated as hedging instruments: | | $ | 460,664 | | | $ | 504,323 | | | | | | | $ | 16,935 | | | $ | 25,362 | | | | | | | $ | 14,111 | | | $ | 22,481 | |
| | | | | | | | | | | | | | | | | | | | | | | | | | | | | | | | |
Total derivative assets and liabilities | | $ | 570,564 | | | $ | 597,173 | | | | | | | $ | 16,959 | | | $ | 25,362 | | | | | | | $ | 14,343 | | | $ | 23,032 | |
| | | | | | | | | | | | | | | | | | | | | | | | | | | | | | | | |
Cash Flow Hedges
The Corporation utilizes forward contracts to hedge the sale of mortgage-backed securities with duration terms over one month. Interest rate forwards are contracts for the delayed delivery of securities, which the seller agrees to deliver on a specified future date at a specified price or yield. These forward contracts are hedging a forecasted transaction and thus qualify for cash flow hedge accounting. Changes in the fair value of the derivatives are recorded in other comprehensive income (loss). The amount included in accumulated other comprehensive income (loss) corresponding to these forward contracts is expected to be reclassified to earnings in the next twelve months. These contracts have a maximum remaining maturity of 82 days at December 31, 2015.
231
For cash flow hedges, net gains (losses) on derivative contracts that are reclassified from accumulated other comprehensive income (loss) to current period earnings are included in the line item in which the hedged item is recorded and during the period in which the forecasted transaction impacts earnings, as presented in the tables below.
| | | | | | | | | | | | | | | | |
Year ended December 31, 2015 | |
(In thousands) | | Amount of net gain (loss)
recognized in OCI on
derivatives (effective
portion) | | | Classification in the statement of
operations of the net gain (loss)
reclassified from AOCI into income
(effective portion, ineffective portion,
and amount excluded from
effectiveness testing) | | | Amount of net gain (loss)
reclassified from AOCI into
income (effective portion) | | | Amount of net gain (loss)
recognized in income on
derivatives (ineffective
portion and amount
excluded from
effectiveness testing) | |
Forward contracts | | $ | (4,376 | ) | | | Mortgage banking activities | | | $ | (4,719 | ) | | $ | 17 | |
| | | | | | | | | | | | | | | | |
Total | | $ | (4,376 | ) | | | | | | $ | (4,719 | ) | | $ | 17 | |
| | | | | | | | | | | | | | | | |
|
Year ended December 31, 2014 | |
(In thousands) | | Amount of net gain (loss)
recognized in OCI on
derivatives (effective
portion) | | | Classification in the statement of
operations of the net gain (loss)
reclassified from AOCI into income
(effective portion, ineffective portion,
and amount excluded from
effectiveness testing) | | | Amount of net gain (loss)
reclassified from AOCI into
income (effective portion) | | | Amount of net gain (loss)
recognized in income on
derivatives (ineffective
portion and amount
excluded from
effectiveness testing) | |
Forward contracts | | $ | (6,613 | ) | | | Mortgage banking activities | | | $ | (6,091 | ) | | $ | (109 | ) |
| | | | | | | | | | | | | | | | |
Total | | $ | (6,613 | ) | | | | | | $ | (6,091 | ) | | $ | (109 | ) |
| | | | | | | | | | | | | | | | |
|
Year ended December 31, 2013 | |
(In thousands) | | Amount of net gain (loss)
recognized in OCI on
derivatives (effective
portion) | | | Classification in the statement of
operations of the net gain (loss)
reclassified from AOCI into income
(effective portion, ineffective portion,
and amount excluded from
effectiveness testing) | | | Amount of net gain (loss)
reclassified from AOCI into
income (effective portion) | | | Amount of net gain (loss)
recognized in income on
derivatives (ineffective
portion and amount
excluded from
effectiveness testing) | |
Forward contracts | | $ | 2,286 | | | | Mortgage banking activities | | | $ | 1,839 | | | $ | 577 | |
| | | | | | | | | | | | | | | | |
Total | | $ | 2,286 | | | | | | | $ | 1,839 | | | $ | 577 | |
| | | | | | | | | | | | | | | | |
Fair Value Hedges
At December 31, 2015 and 2014, there were no derivatives designated as fair value hedges.
232
Non-Hedging Activities
For the year ended December 31, 2015, the Corporation recognized a loss of $ 0.3 million (2014 – loss of $ 8.5 million; 2013 – gain of $ 11.1 million) related to its non-hedging derivatives, as detailed in the table below.
| | | | | | | | | | | | | | |
| | | Amount of Net Gain (Loss) Recognized in Income on Derivatives | |
(In thousands) | | Classification of Net Gain (Loss)
Recognized in Income on Derivatives | | Year ended
December 31,
2015 | | | Year ended
December 31,
2014 | | | Year ended
December 31,
2013 | |
Forward contracts | | Mortgage banking activities | | $ | (389 | ) | | $ | (10,876 | ) | | $ | 9,039 | |
Interest rate swaps | | Other operating income | | | 300 | | | | 1,223 | | | | 965 | |
Foreign currency forward contracts | | Other operating income | | | 49 | | | | 8 | | | | 18 | |
Foreign currency forward contracts | | Interest expense | | | (4 | ) | | | 5 | | | | (1 | ) |
Indexed options on deposits | | Interest expense | | | (334 | ) | | | 2,815 | | | | 5,296 | |
Bifurcated embedded options | | Interest expense | | | 73 | | | | (1,666 | ) | | | (4,230 | ) |
| | | | | | | | | | | | | | |
| Total | | | | $ | (305 | ) | | $ | (8,491 | ) | | $ | 11,087 | |
| | | | | | | | | | | | | | |
Forward Contracts
The Corporation has forward contracts to sell mortgage-backed securities, which are accounted for as trading derivatives. Changes in their fair value are recognized in mortgage banking activities.
Interest Rates Swaps and Foreign Currency and Exchange Rate Commitments
In addition to using derivative instruments as part of its interest rate risk management strategy, the Corporation also utilizes derivatives, such as interest rate swaps and foreign exchange forward contracts, in its capacity as an intermediary on behalf of its customers. The Corporation minimizes its market risk and credit risk by taking offsetting positions under the same terms and conditions with credit limit approvals and monitoring procedures. Market value changes on these swaps and other derivatives are recognized in earnings in the period of change.
Interest Rate Caps
The Corporation enters into interest rate caps as an intermediary on behalf of its customers and simultaneously takes offsetting positions under the same terms and conditions, thus minimizing its market and credit risks.
Indexed and Embedded Options
The Corporation offers certain customers’ deposits whose return are tied to the performance of the Standard and Poor’s (“S&P 500”) stock market indexes, and other deposits whose returns are tied to other stock market indexes or other equity securities performance. The Corporation bifurcated the related options embedded within these customers’ deposits from the host contract in accordance with ASC Subtopic 815-15. In order to limit the Corporation’s exposure to changes in these indexes, the Corporation purchases indexed options which returns are tied to the same indexes from major broker dealer companies in the over the counter market. Accordingly, the embedded options and the related indexed options are marked-to-market through earnings.
233
Note 33 – Related party transactions
The Corporation grants loans to its directors, executive officers and certain related individuals or organizations in the ordinary course of business. The activity and balance of these loans were as follows:
| | | | | | | | | | | | |
(In thousands) | | Executive
Officers | | | Directors | | | Total | |
Balance at December 31, 2013 | | $ | 29,713 | | | $ | 66,841 | | | $ | 96,554 | |
New loans | | | 1,163 | | | | 74,327 | | | | 75,490 | |
Payments | | | (1,318 | ) | | | (17,161 | ) | | | (18,479 | ) |
Other changes | | | 4,529 | | | | — | | | | 4,529 | |
| | | | | | | | | | | | |
Balance at December 31, 2014 | | $ | 34,087 | | | $ | 124,007 | | | $ | 158,094 | |
New loans | | | 2,062 | | | | 27,426 | | | | 29,488 | |
Payments | | | (1,239 | ) | | | (44,712 | ) | | | (45,951 | ) |
Other changes | | | 23,607 | | | | — | | | | 23,607 | |
| | | | | | | | | | | | |
Balance at December 31, 2015 | | $ | 58,517 | | | $ | 106,721 | | | $ | 165,238 | |
| | | | | | | | | | | | |
New loans and payments includes disbursements and collections from existing lines of credit.
At December 31, 2015, the Corporation’s banking subsidiaries held deposits from related parties, excluding EVERTEC, Inc. (“EVERTEC”) amounting to $234 million (2014 - $ 24 million).
From time to time, the Corporation, in the ordinary course of business, obtains services from related parties that have some association with the Corporation. Management believes the terms of such arrangements are consistent with arrangements entered into with independent third parties.
During 2014, the Corporation engaged, in the ordinary course of business, the legal services of a law firm in Puerto Rico, in which the Secretary of the Board of Directors of Popular, Inc. acted as senior counsel or as partner. The fees paid to this law firm for the year 2014 amounted to approximately $0.7 million. During 2014, the Corporation also engaged, in the ordinary course of business, the legal services of a law firm in Puerto Rico, of which the Corporation’s Executive Vice President and Chief Legal Officer and Secretary of the Board of Directors was a member until September 2014. The fees paid to this law firm for fiscal year 2014 amounted to approximately $3.8 million, which include $0.6 million paid by the Corporation’s clients in connection with commercial loan transactions. In addition, this law firm leased office space in the Corporation’s headquarters building, which is owned by BPPR, and engaged BPPR as custodian of its retirement plan. During 2014, this law firm made lease payments to BPPR of approximately $0.7 million and paid BPPR approximately $0.1 million for its services as custodian. The rent and trustee fees paid by this law firm were at market rates.
For the year ended December 31, 2015, the Corporation made contributions of approximately $0.7 million to Banco Popular Foundations, which are not-for-profit corporations dedicated to philanthropic work (2014 - $0.7 million).
In June 2006, family members of a director of the Corporation, obtained a $0.8 million mortgage loan from Popular Mortgage, Inc., secured by a residential property. The director was not a director of the Corporation at the time the loan was made. In March, 2012 the loan was restructured under the Corporation’s loss mitigation program. The balance due on the loan at December 31, 2015 was approximately $0.7 million.
The brother-in-law of an Executive Vice President of the Corporation, became delinquent on a series of commercial loans granted to him by BPPR. The aggregate amount of principal owed on such loans as of December 31, 2015 was approximately $0.7 million. Certain of the loans are secured by real estate and BPPR commenced collection and foreclosure proceedings in February 2014. The Bank has charged-off an aggregate amount of approximately $0.5 million in connection with these loans. The book value of these loans at December 31, 2015 was of $0.2 million. The same brother-in law of the Executive Vice President of the Corporation, also has a participation in two entities, each of which has a real estate development loan with BPPR. The first loan is to an entity in which he owns a 50% equity interest. The loan is payable from the proceeds of the sale of residential units. The outstanding balance on the loan as of December 31, 2015 was approximately $0.1 million. The second loan is to an entity in which this individual owns a 33% equity interest and which is secured with undeveloped land. The outstanding balance on the loan as of December 31, 2015 was $0.4 million. The brother of this same Executive Vice President of the Corporation was granted a commercial loan in 2008. During 2015, this loan was modified under a payment plan. The outstanding balance of the loan as of December 31, 2015 was of approximately $0.2 million.
On April 10, 2014, BPPR sold two undeveloped parcels of land, which had been foreclosed by BPPR, for the aggregate price of $2.7 million to an entity controlled by a shareholder of the Corporation. On June 30, 2014, BPPR sold a parcel of land, which had been foreclosed by BPPR, to an entity controlled by this same shareholder of the Corporation for $5.3 million. These sales was made on terms and conditions similar to the sale to unaffiliated parties of other real estate assets that have been foreclosed by BPPR and are held for sale. On June 5, 2014, certain borrowers of BPPR sold five real estate properties to affiliates of this same shareholder of the Corporation, as part of a settlement agreement that was executed by said borrowers with BPPR. As part of this settlement, BPPR received payments amounting to $16.7 million from the borrowers and guarantors of the loans that were settled.
234
The settlement of these loans was made on terms and conditions similar to the settlement of other non-performing loans previously settled by BPPR in transactions where only unaffiliated parties were involved.
The Corporation has had loan transactions with the Corporation’s directors and officers, and with their associates, and proposes to continue such transactions in the ordinary course of its business, on substantially the same terms, including interest rates and collateral, as those prevailing for comparable loan transactions with third parties, except as disclosed above. Except as discussed above, the extensions of credit have not involved and do not currently involve more than normal risks of collection or present other unfavorable features.
235
Related party transactions with EVERTEC, as an affiliate
The Corporation has an investment in EVERTEC, Inc. (“EVERTEC”), which provides various processing and information technology services to the Corporation and its subsidiaries and gives BPPR access to the ATH network owned and operated by EVERTEC. As of December 31, 2015, the Corporation’s stake in EVERTEC was 15.54%.The Corporation continues to have significant influence over EVERTEC. Accordingly, the investment in EVERTEC is accounted for under the equity method and is evaluated for impairment if events or circumstances indicate that a decrease in value of the investment has occurred that is other than temporary.
The Corporation received $4.7 million in dividend distributions during the year ended December 31, 2015 from its investments in EVERTEC’s holding company (December 31, 2014 - $4.7 million). The Corporation’s equity in EVERTEC is presented in the table which follows and is included as part of “other assets” in the consolidated statement of financial condition.
| | | | | | | | |
(In thousands) | | December 31, 2015 | | | December 31, 2014 | |
Equity investment in EVERTEC | | $ | 33,590 | | | $ | 25,146 | |
The Corporation had the following financial condition balances outstanding with EVERTEC at December 31, 2015 and December 31, 2014. Items that represent liabilities to the Corporation are presented with parenthesis.
| | | | | | | | |
(In thousands) | | December 31, 2015 | | | December 31, 2014 | |
Accounts receivable (Other assets) | | $ | 3,148 | | | $ | 5,065 | |
Deposits | | | (23,973 | ) | | | (15,481 | ) |
Accounts payable (Other liabilities) | | | (16,192 | ) | | | (15,511 | ) |
| | | | | | | | |
Net total | | $ | (37,017 | ) | | $ | (25,927 | ) |
| | | | | | | | |
The Corporation’s proportionate share of income or loss from EVERTEC is included in other operating income in the consolidated statements of operations. The following table presents the Corporation’s proportionate share of EVERTEC’s income (loss) and changes in stockholders’ equity for the years ended 2015, 2014 and 2013.
| | | | | | | | | | | | |
| | | Years ended December 31, | |
(In thousands) | | 2015 | | | 2014 | | | 2013 | |
Share of income (loss) from investment in EVERTEC | | $ | 11,593 | | | $ | 10,536 | | | $ | (3,762 | ) |
Share of other changes in EVERTEC’s stockholders’ equity | | | 1,636 | | | | 381 | | | | 18,965 | |
| | | | | | | | | | | | |
Share of EVERTEC’s changes in equity recognized in income | | $ | 13,229 | | | $ | 10,917 | | | $ | 15,203 | |
| | | | | | | | | | | | |
236
The following tables present the impact of transactions and service payments between the Corporation and EVERTEC (as an affiliate) and their impact on the results of operations for the years ended December 31, 2015, 2014 and 2013. Items that represent expenses to the Corporation are presented with parenthesis.
| | | | | | | | | | | | | | | | |
| | | Years ended December 31, | | | | |
| | | | |
(In thousands) | | 2015 | | | 2014 | | | 2013 | | | Category | |
| | | | |
Interest income on loan to EVERTEC | | $ | — | | | $ | — | | | $ | 2,490 | | | | Interest income | |
| | | | |
Interest income on investment securities issued by EVERTEC | | | — | | | | — | | | | 1,269 | | | | Interest income | |
| | | | |
Interest expense on deposits | | | (58 | ) | | | (67 | ) | | | (128 | ) | | | Interest expense | |
ATH and credit cards interchange income from services to EVERTEC | | | 27,816 | | | | 26,646 | | | | 25,571 | | | | Other service fees | |
| | | | |
Debt prepayment penalty paid by EVERTEC | | | — | | | | — | | | | 5,856 | | |
| Net gain (loss) and valuation
adjustments on investment
securities |
|
| | | | |
Consulting fee paid by EVERTEC | | | — | | | | — | | | | 9,854 | | | | Other operating income | |
| | | | |
Rental income charged to EVERTEC | | | 6,898 | | | | 6,874 | | | | 6,560 | | | | Net occupancy | |
| | | | |
Processing fees on services provided by EVERTEC | | | (164,809 | ) | | | (154,839 | ) | | | (155,521 | ) | | | Professional fees | |
| | | | |
Other services provided to EVERTEC | | | 1,311 | | | | 1,012 | | | | 843 | | | | Other operating expenses | |
| | | | | | | | | | | | | | | | |
| | | | |
Total | | $ | (128,842 | ) | | $ | (120,374 | ) | | $ | (103,206 | ) | | | | |
| | | | | | | | | | | | | | | | |
EVERTEC has a letter of credit issued by BPPR, for an amount of $4.2 million at December 31, 2015 (2014 - $3.6 million). The Corporation also agreed to maintain outstanding this letter of credit for a 5-year period that originally expired on September 30, 2015 and was subsequently extended through February 10, 2016. EVERTEC and the Corporation entered into a Reimbursement Agreement, in which EVERTEC will reimburse the Corporation for any losses incurred by the Corporation in connection with the performance bonds and the letter of credit. Possible losses resulting from these agreements are considered insignificant.
PRLP 2011 Holdings, LLC
As indicated in Note 31 to the consolidated financial statements, the Corporation holds a 24.9 % equity interest in PRLP 2011 Holdings, LLC and currently provides certain financing to the joint venture as well as holds certain deposits from the entity.
The Corporation’s equity in PRLP 2011 Holdings, LLC is presented in the table which follows and is included as part of “other assets” in the consolidated statements of financial condition.
| | | | | | | | |
(In thousands) | | December 31, 2015 | | | December 31, 2014 | |
Equity investment in PRLP 2011 Holdings, LLC | | $ | 13,069 | | | $ | 23,650 | |
The Corporation had the following financial condition balances outstanding with PRLP 2011 Holdings, LLC at December 31, 2015 and December 31, 2014.
| | | | | | | | |
(In thousands) | | December 31, 2015 | | | December 31, 2014 | |
Loans | | $ | 980 | | | $ | 4,652 | |
Accrued interest receivable | | | 10 | | | | 22 | |
Deposits (non-interest bearing) | | | (18,808 | ) | | | (2,685 | ) |
| | | | | | | | |
Net total | | $ | (17,818 | ) | | $ | 1,989 | |
| | | | | | | | |
The Corporation’s proportionate share of income or loss from PRLP 2011 Holdings, LLC is included in other operating income in the consolidated statements of operations. The following table presents the Corporation’s proportionate share of income (loss) from PRLP 2011 Holdings, LLC for the years ended December 31, 2015, 2014 and 2013.
| | | | | | | | | | | | |
| | | Years ended December 31, | |
(In thousands) | | 2015 | | | 2014 | | | 2013 | |
Share of (loss) income from the equity investment in PRLP 2011 Holdings, LLC | | $ | (4,021 | ) | | $ | (2,947 | ) | | $ | 3,347 | |
237
During the year ended December 31, 2015 the Corporation received $6.6 million in capital distributions from its investment in PRLP 2011 Holdings, LLC. The following table presents transactions between the Corporation and PRLP 2011 Holdings, LLC and their impact on the Corporation’s results of operations for the years ended December 31, 2015, 2014 and 2013.
| | | | | | | | | | | | | | | | |
| | | For the years ended December 31, | | | | |
(In thousands) | | 2015 | | | 2014 | | | 2013 | | | Category | |
| | | | |
Interest income on loan to PRLP 2011 Holdings, LLC | | $ | 189 | | | $ | 425 | | | $ | 1,162 | | | | Interest income | |
PR Asset Portfolio 2013-1 International, LLC
As indicated in Note 31 to the consolidated financial statements, effective March 2013 the Corporation holds a 24.9 % equity interest in PR Asset Portfolio 2013-1 International, LLC and currently provides certain financing to the joint venture as well as holds certain deposits from the entity.
The Corporation’s equity in PR Asset Portfolio 2013-1 International, LLC is presented in the table which follows and is included as part of “other assets” in the consolidated statements of financial condition.
| | | | | | | | |
(In thousands) | | December 31, 2015 | | | December 31, 2014 | |
Equity investment in PR Asset Portfolio 2013-1 International, LLC | | $ | 25,094 | | | $ | 31,374 | |
The Corporation had the following financial condition balances outstanding with PR Asset Portfolio 2013-1 International, LLC, at December 31, 2015 and December 31, 2014.
| | | | | | | | |
(In thousands) | | December 31, 2015 | | | December 31, 2014 | |
Loans | | $ | 58,302 | | | $ | 110,643 | |
Accrued interest receivable | | | 169 | | | | 314 | |
Deposits | | | (11,772 | ) | | | (12,960 | ) |
| | | | | | | | |
Net total | | $ | 46,699 | | | $ | 97,997 | |
| | | | | | | | |
The Corporation’s proportionate share of income or loss from PR Asset Portfolio 2013-1 International, LLC is included in other operating income in the consolidated statements of operations. The following table presents the Corporation’s proportionate share of income (loss) from PR Asset Portfolio 2013-1 International, LLC for years ended December 31, 2015, 2014 and 2013.
| | | | | | | | | | | | |
| | | Years ended December 31, | |
(In thousands) | | 2015 | | | 2014 | | | 2013 | |
Share of (loss) income from the equity investment in PR Asset Portfolio 2013-1 International, LLC | | $ | (6,280 | ) | | $ | 745 | | | $ | (1,979 | ) |
238
The following table presents transactions between the Corporation and PR Asset Portfolio 2013-1 International, LLC and their impact on the Corporation’s results of operations for the years ended December 31, 2015, 2014 and 2013.
| | | | | | | | | | | | | | | | |
| | | Years ended December 31, | | | | |
(In thousands) | | 2015 | | | 2014 | | | 2013 | | | Category | |
Interest income on loan to PR Asset Portfolio 2013-1 International, LLC | | $ | 2,805 | | | $ | 4,340 | | | $ | 2,966 | | | | Interest income | |
Interest expense on deposits | | | (4 | ) | | | — | | | | — | | | | Interest expense | |
Servicing fee paid by PR Asset Portfolio 2013-1 International, LLC | | | — | | | | 70 | | | | 150 | | | | Other service fees | |
| | | | | | | | | | | | | | | | |
Total | | $ | 2,801 | | | $ | 4,410 | | | | 3,116 | | | | | |
| | | | | | | | | | | | | | | | |
239
Note 34 – Fair value measurement
ASC Subtopic 820-10 “Fair Value Measurements and Disclosures” establishes a fair value hierarchy that prioritizes the inputs to valuation techniques used to measure fair value into three levels in order to increase consistency and comparability in fair value measurements and disclosures. The hierarchy is broken down into three levels based on the reliability of inputs as follows:
| | • | | Level 1- Unadjusted quoted prices in active markets for identical assets or liabilities that the Corporation has the ability to access at the measurement date. Valuation on these instruments does not necessitate a significant degree of judgment since valuations are based on quoted prices that are readily available in an active market. |
| | • | | Level 2- Quoted prices other than those included in Level 1 that are observable either directly or indirectly. Level 2 inputs include quoted prices for similar assets or liabilities in active markets, quoted prices for identical or similar assets or liabilities in markets that are not active, or other inputs that are observable or that can be corroborated by observable market data for substantially the full term of the financial instrument. |
| | • | | Level 3- Inputs are unobservable and significant to the fair value measurement. Unobservable inputs reflect the Corporation’s own assumptions about assumptions that market participants would use in pricing the asset or liability. |
The Corporation maximizes the use of observable inputs and minimizes the use of unobservable inputs by requiring that the observable inputs be used when available. Fair value is based upon quoted market prices when available. If listed prices or quotes are not available, the Corporation employs internally-developed models that primarily use market-based inputs including yield curves, interest rates, volatilities, and credit curves, among others. Valuation adjustments are limited to those necessary to ensure that the financial instrument’s fair value is adequately representative of the price that would be received or paid in the marketplace. These adjustments include amounts that reflect counterparty credit quality, the Corporation’s credit standing, constraints on liquidity and unobservable parameters that are applied consistently.
The estimated fair value may be subjective in nature and may involve uncertainties and matters of significant judgment for certain financial instruments. Changes in the underlying assumptions used in calculating fair value could significantly affect the results.
240
Fair Value on a Recurring and Nonrecurring Basis
The following fair value hierarchy tables present information about the Corporation’s assets and liabilities measured at fair value on a recurring basis at December 31, 2015 and 2014 and on a nonrecurring basis in periods subsequent to initial recognition for the years ended December 31, 2015, 2014, and 2013:
| | | | | | | | | | | | | | | | |
At December 31, 2015 | |
(In thousands) | | Level 1 | | | Level 2 | | | Level 3 | | | Total | |
| | | | |
RECURRING FAIR VALUE MEASUREMENTS | | | | | | | | | | | | | | | | |
| | | | |
Assets | | | | | | | | | | | | | | | | |
Investment securities available-for-sale: | | | | | | | | | | | | | | | | |
U.S. Treasury securities | | $ | — | | | $ | 1,183,328 | | | $ | — | | | $ | 1,183,328 | |
Obligations of U.S. Government sponsored entities | | | — | | | | 939,641 | | | | — | | | | 939,641 | |
Obligations of Puerto Rico, States and political subdivisions | | | — | | | | 22,359 | | | | — | | | | 22,359 | |
Collateralized mortgage obligations - federal agencies | | | — | | | | 1,560,837 | | | | — | | | | 1,560,837 | |
Mortgage-backed securities | | | — | | | | 2,342,762 | | | | 1,434 | | | | 2,344,196 | |
Equity securities | | | 276 | | | | 2,122 | | | | — | | | | 2,398 | |
Other | | | — | | | | 10,233 | | | | — | | | | 10,233 | |
| | | | | | | | | | | | | | | | |
Total investment securities available-for-sale | | $ | 276 | | | $ | 6,061,282 | | | $ | 1,434 | | | $ | 6,062,992 | |
| | | | | | | | | | | | | | | | |
Trading account securities, excluding derivatives: | | | | | | | | | | | | | | | | |
Obligations of Puerto Rico, States and political subdivisions | | $ | — | | | $ | 4,590 | | | $ | — | | | $ | 4,590 | |
Collateralized mortgage obligations | | | — | | | | 223 | | | | 1,831 | | | | 2,054 | |
Mortgage-backed securities - federal agencies | | | — | | | | 44,701 | | | | 6,454 | | | | 51,155 | |
Other | | | — | | | | 13,173 | | | | 687 | | | | 13,860 | |
| | | | | | | | | | | | | | | | |
Total trading account securities | | $ | — | | | $ | 62,687 | | | $ | 8,972 | | | $ | 71,659 | |
| | | | | | | | | | | | | | | | |
Mortgage servicing rights | | $ | — | | | $ | — | | | $ | 211,405 | | | $ | 211,405 | |
Derivatives | | | — | | | | 16,959 | | | | — | | | | 16,959 | |
| | | | | | | | | | | | | | | | |
Total assets measured at fair value on a recurring basis | | $ | 276 | | | $ | 6,140,928 | | | $ | 221,811 | | | $ | 6,363,015 | |
| | | | | | | | | | | | | | | | |
Liabilities | | | | | | | | | | | | | | | | |
Derivatives | | $ | — | | | $ | (14,343 | ) | | $ | — | | | $ | (14,343 | ) |
Contingent consideration | | | — | | | | — | | | | (120,380 | ) | | | (120,380 | ) |
| | | | | | | | | | | | | | | | |
Total liabilities measured at fair value on a recurring basis | | $ | — | | | $ | (14,343 | ) | | $ | (120,380 | ) | | $ | (134,723 | ) |
| | | | | | | | | | | | | | | | |
241
| | | | | | | | | | | | | | | | |
At December 31, 2014 | |
(In thousands) | | Level 1 | | | Level 2 | | | Level 3 | | | Total | |
| | | | |
RECURRING FAIR VALUE MEASUREMENTS | | | | | | | | | | | | | | | | |
| | | | |
Assets | | | | | | | | | | | | | | | | |
Investment securities available-for-sale: | | | | | | | | | | | | | | | | |
U.S. Treasury securities | | $ | — | | | $ | 700,154 | | | $ | — | | | $ | 700,154 | |
Obligations of U.S. Government sponsored entities | | | — | | | | 1,724,973 | | | | — | | | | 1,724,973 | |
Obligations of Puerto Rico, States and political subdivisions | | | — | | | | 61,712 | | | | — | | | | 61,712 | |
Collateralized mortgage obligations - federal agencies | | | — | | | | 1,910,030 | | | | — | | | | 1,910,030 | |
Mortgage-backed securities | | | — | | | | 903,037 | | | | 1,325 | | | | 904,362 | |
Equity securities | | | 323 | | | | 2,299 | | | | — | | | | 2,622 | |
Other | | | — | | | | 11,306 | | | | — | | | | 11,306 | |
| | | | | | | | | | | | | | | | |
Total investment securities available-for-sale | | $ | 323 | | | $ | 5,313,511 | | | $ | 1,325 | | | $ | 5,315,159 | |
| | | | | | | | | | | | | | | | |
Trading account securities, excluding derivatives: | | | | | | | | | | | | | | | | |
Obligations of Puerto Rico, States and political subdivisions | | $ | — | | | $ | 7,954 | | | $ | — | | | $ | 7,954 | |
Collateralized mortgage obligations | | | — | | | | 261 | | | | 1,375 | | | | 1,636 | |
Mortgage-backed securities - federal agencies | | | — | | | | 104,463 | | | | 6,229 | | | | 110,692 | |
Other | | | — | | | | 16,682 | | | | 1,563 | | | | 18,245 | |
| | | | | | | | | | | | | | | | |
Total trading account securities | | $ | — | | | $ | 129,360 | | | $ | 9,167 | | | $ | 138,527 | |
| | | | | | | | | | | | | | | | |
Mortgage servicing rights | | $ | — | | | $ | — | | | $ | 148,694 | | | $ | 148,694 | |
Derivatives | | | — | | | | 25,362 | | | | — | | | | 25,362 | |
| | | | | | | | | | | | | | | | |
Total assets measured at fair value on a recurring basis | | $ | 323 | | | $ | 5,468,233 | | | $ | 159,186 | | | $ | 5,627,742 | |
| | | | | | | | | | | | | | | | |
Liabilities | | | | | | | | | | | | | | | | |
Derivatives | | $ | — | | | $ | (23,032 | ) | | $ | — | | | $ | (23,032 | ) |
Contingent consideration | | | — | | | | — | | | | (133,634 | ) | | | (133,634 | ) |
| | | | | | | | | | | | | | | | |
Total liabilities measured at fair value on a recurring basis | | $ | — | | | $ | (23,032 | ) | | $ | (133,634 | ) | | $ | (156,666 | ) |
| | | | | | | | | | | | | | | | |
The fair value information included in the following table is not as of period end, but as of the date that the fair value measurement was recorded during the year ended December 31, 2015 and excludes nonrecurring fair value measurements of assets no longer held by the Corporation.
| | | | | | | | | | | | | | | | | | | | |
Year ended December 31, 2015 | |
(In thousands) | | Level 1 | | | Level 2 | | | Level 3 | | | Total | | | | |
| | | | | |
NONRECURRING FAIR VALUE MEASUREMENTS | | | | | | | | | | | | | | | | | | | | |
| | | | | |
Assets | | | | | | | | | | | | | | | | | |
| Write-
downs |
|
Loans[1] | | $ | — | | | $ | — | | | $ | 67,915 | | | $ | 67,915 | | | $ | (63,002 | ) |
Loans held-for-sale[2] | | | — | | | | — | | | | 44,923 | | | | 44,923 | | | | (66 | ) |
Other real estate owned[3] | | | — | | | | 574 | | | | 66,694 | | | | 67,268 | | | | (46,164 | ) |
Other foreclosed assets[3] | | | — | | | | — | | | | 75 | | | | 75 | | | | (847 | ) |
| | | | | | | | | | | | | | | | | | | | |
Total assets measured at fair value on a nonrecurring basis | | $ | — | | | $ | 574 | | | $ | 179,607 | | | $ | 180,181 | | | $ | (110,079 | ) |
| | | | | | | | | | | | | | | | | | | | |
| [1] | Relates mostly to certain impaired collateral dependent loans. The impairment was measured based on the fair value of the collateral, which is derived from appraisals that take into consideration prices in observed transactions involving similar assets in similar locations, in accordance with the provisions of ASC Section 310-10-35. Costs to sell are excluded from the reported fair value amount. |
| [2] | Relates to lower of cost or fair value adjustments on loans held-for-sale and loans transferred from loans held-in-portfolio to loans held-for-sale. Costs to sell are excluded from the reported fair value amount. |
| [3] | Represents the fair value of foreclosed real estate and other collateral owned that were written down to their fair value. Costs to sell are excluded from the reported fair value amount. |
242
| | | | | | | | | | | | | | | | | | | | |
Year ended December 31, 2014 | |
(In thousands) | | Level 1 | | | Level 2 | | | Level 3 | | | Total | | | | |
| | | | | |
NONRECURRING FAIR VALUE MEASUREMENTS | | | | | | | | | | | | | | | | | | | | |
Assets | | | | | | | | | | | | | | | | | |
| Write-
downs |
|
Loans[1] | | $ | — | | | $ | — | | | $ | 71,750 | | | $ | 71,750 | | | $ | (15,405 | ) |
Loans held-for-sale[2] | | | — | | | | — | | | | 21,609 | | | | 21,609 | | | | (38 | ) |
Other real estate owned[3] | | | — | | | | 6,610 | | | | 86,520 | | | | 93,130 | | | | (42,366 | ) |
Other foreclosed assets[3] | | | — | | | | — | | | | 1,368 | | | | 1,368 | | | | (1,622 | ) |
| | | | | | | | | | | | | | | | | | | | |
Total assets measured at fair value on a nonrecurring basis | | $ | — | | | $ | 6,610 | | | $ | 181,247 | | | $ | 187,857 | | | $ | (59,431 | ) |
| | | | | | | | | | | | | | | | | | | | |
| [1] | Relates mostly to certain impaired collateral dependent loans. The impairment was measured based on the fair value of the collateral, which is derived from appraisals that take into consideration prices in observed transactions involving similar assets in similar locations, in accordance with the provisions of ASC Section 310-10-35.Costs to sell are excluded from the reported fair value amount. |
| [2] | Relates to lower of cost or fair value adjustments on loans held-for-sale and loans transferred from loans held-in-portfolio to loans held-for-sale. Costs to sell are excluded from the reported fair value amount. |
| [3] | Represents the fair value of foreclosed real estate and other collateral owned that were written down to their fair value. Costs to sell are excluded from the reported fair value amount. |
| | | | | | | | | | | | | | | | | | | | |
Year ended December 31, 2013 | |
(In thousands) | | Level 1 | | | Level 2 | | | Level 3 | | | Total | | | | |
| | | | | |
NONRECURRING FAIR VALUE MEASUREMENTS | | | | | | | | | | | | | | | | | | | | |
| | | | | |
Assets | | | | | | | | | | | | | | | | | |
| Write-
downs |
|
Loans[1] | | $ | — | | | $ | — | | | $ | 25,673 | | | $ | 25,673 | | | $ | (21,348 | ) |
Loans held-for-sale[2] | | | — | | | | — | | | | — | | | | — | | | | (364,820 | ) |
Other real estate owned[3] | | | — | | | | 2,849 | | | | 84,732 | | | | 87,581 | | | | (43,861 | ) |
Other foreclosed assets[3] | | | — | | | | — | | | | 638 | | | | 638 | | | | (617 | ) |
| | | | | | | | | | | | | | | | | | | | |
Total assets measured at fair value on a nonrecurring basis | | $ | — | | | $ | 2,849 | | | $ | 111,043 | | | $ | 113,892 | | | $ | (430,646 | ) |
| | | | | | | | | | | | | | | | | | | | |
| [1] | Relates mostly to certain impaired collateral dependent loans. The impairment was measured based on the fair value of the collateral, which is derived from appraisals that take into consideration prices in observed transactions involving similar assets in similar locations, in accordance with the provisions of ASC Section 310-10-35. Costs to sell are excluded from the reported fair value amount. |
| [2] | Relates to lower of cost or fair value adjustments on loans held-for-sale and loans transferred from loans held-in-portfolio to loans held-for-sale. Costs to sell are excluded from the reported fair value amount. |
| [3] | Represents the fair value of foreclosed real estate and other collateral owned that were written down to their fair value. Costs to sell are excluded from the reported fair value amount. |
243
The following tables present the changes in Level 3 assets and liabilities measured at fair value on a recurring basis for the years ended December 31, 2015, 2014, and 2013.
| | | | | | | | | | | | | | | | | | | | | | | | | | | | | | | | |
Year ended December 31, 2015 | |
(In thousands) | | MBS
classified
as investment
securities
available-
for-sale | | | CMOs
classified
as trading
account
securities | | | MBS
classified as
trading account
securities | | | Other
securities
classified
as trading
account
securities | | | Mortgage
servicing
rights | | | Total
assets | | | Contingent
consideration | | | Total
liabilities | |
Balance at January 1, 2015 | | $ | 1,325 | | | $ | 1,375 | | | $ | 6,229 | | | $ | 1,563 | | | $ | 148,694 | | | $ | 159,186 | | | $ | (133,634 | ) | | $ | (133,634 | ) |
Gains (losses) included in earnings | | | (2 | ) | | | (2 | ) | | | (42 | ) | | | 94 | | | | (13,349 | ) | | | (13,301 | ) | | | 12,292 | | | | 12,292 | |
Gains (losses) included in OCI | | | (7 | ) | | | — | | | | — | | | | — | | | | — | | | | (7 | ) | | | — | | | | — | |
Additions | | | 118 | | | | 808 | | | | 1,126 | | | | — | | | | 76,060 | | | | 78,112 | | | | — | | | | — | |
Sales | | | — | | | | (43 | ) | | | (187 | ) | | | — | | | | — | | | | (230 | ) | | | — | | | | — | |
Settlements | | | — | | | | (307 | ) | | | (672 | ) | | | (970 | ) | | | — | | | | (1,949 | ) | | | — | | | | — | |
Adjustments | | | — | | | | — | | | | — | | | | — | | | | — | | | | — | | | | 962 | | | | 962 | |
| | | | | | | | | | | | | | | | | | | | | | | | | | | | | | | | |
Balance at December 31, 2015 | | $ | 1,434 | | | $ | 1,831 | | | $ | 6,454 | | | $ | 687 | | | $ | 211,405 | | | $ | 221,811 | | | $ | (120,380 | ) | | $ | (120,380 | ) |
| | | | | | | | | | | | | | | | | | | | | | | | | | | | | | | | |
Changes in unrealized gains (losses) included in earnings relating to assets still held at December 31, 2015 | | $ | — | | | $ | 2 | | | $ | (21 | ) | | $ | 38 | | | $ | 6,087 | | | $ | 6,106 | | | $ | 12,292 | | | $ | 12,292 | |
|
Year ended December 31, 2014 | |
(In thousands) | | MBS
classified
as investment
securities
available-
for-sale | | | CMOs
classified
as trading
account
securities | | | MBS
classified as
trading account
securities | | | Other
securities
classified
as trading
account
securities | | | Mortgage
servicing
rights | | | Total
assets | | | Contingent
consideration | | | Total
liabilities | |
Balance at January 1, 2014 | | $ | 6,523 | | | $ | 1,423 | | | $ | 9,799 | | | $ | 1,929 | | | $ | 161,099 | | | $ | 180,773 | | | $ | (128,299 | ) | | $ | (128,299 | ) |
Gains (losses) included in earnings | | | (31 | ) | | | (11 | ) | | | (165 | ) | | | (366 | ) | | | (24,773 | ) | | | (25,346 | ) | | | (1,791 | ) | | | (1,791 | ) |
Gains (losses) included in OCI | | | (249 | ) | | | — | | | | — | | | | — | | | | — | | | | (249 | ) | | | — | | | | — | |
Additions | | | — | | | | 270 | | | | 805 | | | | — | | | | 12,583 | | | | 13,658 | | | | (4,330 | ) | | | (4,330 | ) |
Sales | | | (4,350 | ) | | | — | | | | (2,110 | ) | | | — | | | | — | | | | (6,460 | ) | | | — | | | | — | |
Settlements | | | (568 | ) | | | (307 | ) | | | (2,100 | ) | | | — | | | | (215 | ) | | | (3,190 | ) | | | 786 | | | | 786 | |
| | | | | | | | | | | | | | | | | | | | | | | | | | | | | | | | |
Balance at December 31, 2014 | | $ | 1,325 | | | $ | 1,375 | | | $ | 6,229 | | | $ | 1,563 | | | $ | 148,694 | | | $ | 159,186 | | | $ | (133,634 | ) | | $ | (133,634 | ) |
| | | | | | | | | | | | | | | | | | | | | | | | | | | | | | | | |
| | | | | | | | |
Changes in unrealized gains (losses) included in earnings relating to assets still held at December 31, 2014 | | $ | — | | | $ | (7 | ) | | $ | (72 | ) | | $ | (144 | ) | | $ | (6,120 | ) | | $ | (6,343 | ) | | $ | (1,791 | ) | | $ | (1,791 | ) |
|
Year ended December 31, 2013 | |
(In thousands) | | MBS
classified
as investment
securities
available-
for-sale | | | CMOs
classified
as trading
account
securities | | | MBS
classified as
trading account
securities | | | Other
securities
classified
as trading
account
securities | | | Mortgage
servicing
rights | | | Total
assets | | | Contingent
consideration | | | Total
liabilities | |
Balance at January 1, 2013 | | $ | 7,070 | | | $ | 2,499 | | | $ | 11,817 | | | $ | 2,240 | | | $ | 154,430 | | | $ | 178,056 | | | $ | (112,002 | ) | | $ | (112,002 | ) |
Gains (losses) included in earnings | | | (7 | ) | | | (18 | ) | | | (39 | ) | | | (311 | ) | | | (11,403 | ) | | | (11,778 | ) | | | (16,297 | ) | | | (16,297 | ) |
Gains (losses) included in OCI | | | (40 | ) | | | — | | | | — | | | | — | | | | — | | | | (40 | ) | | | — | | | | — | |
Additions | | | — | | | | 25 | | | | 859 | | | | — | | | | 19,307 | | | | 20,191 | | | | — | | | | — | |
Sales | | | — | | | | (802 | ) | | | (100 | ) | | | — | | | | — | | | | (902 | ) | | | — | | | | — | |
Settlements | | | (500 | ) | | | (281 | ) | | | (2,738 | ) | | | — | | | | (1,235 | ) | | | (4,754 | ) | | | — | | | | — | |
| | | | | | | | | | | | | | | | | | | | | | | | | | | | | | | | |
Balance at December 31, 2013 | | $ | 6,523 | | | $ | 1,423 | | | $ | 9,799 | | | $ | 1,929 | | | $ | 161,099 | | | $ | 180,773 | | | $ | (128,299 | ) | | $ | (128,299 | ) |
| | | | | | | | | | | | | | | | | | | | | | | | | | | | | | | | |
Changes in unrealized gains (losses) included in earnings relating to assets still held at December 31, 2013 | | $ | — | | | $ | (4 | ) | | $ | 159 | | | $ | 14 | | | $ | 15,024 | | | $ | 15,193 | | | $ | (16,297 | ) | | $ | (16,297 | ) |
There were no transfers in and/or out of Level 1, Level 2, or Level 3 for financial instruments measured at fair value on a recurring basis during the years ended December 31, 2015, 2014 and 2013.
244
Gains and losses (realized and unrealized) included in earnings for the years ended December 31, 2015, 2014, and 2013 for Level 3 assets and liabilities included in the previous tables are reported in the consolidated statement of operations as follows:
| | | | | | | | | | | | | | | | | | | | | | | | |
| | | 2015 | | | 2014 | | | 2013 | |
(In thousands) | | Total
gains (losses)
included
in earnings | | | Changes in unrealized
gains (losses)
relating to assets still
held at reporting date | | | Total
gains (losses)
included
in earnings | | | Changes in unrealized
gains (losses)
relating to assets still
held at reporting date | | | Total
gains (losses)
included
in earnings | | | Changes in
unrealized
gains (losses)
relating to assets
still
held at reporting
date | |
Interest income | | $ | (2 | ) | | $ | — | | | $ | (31 | ) | | $ | — | | | $ | (7 | ) | | $ | — | |
FDIC loss share (expense) income | | | 9,559 | | | | 9,559 | | | | (1,791 | ) | | | (1,791 | ) | | | (15,994 | ) | | | (15,994 | ) |
Mortgage banking activities | | | (13,349 | ) | | | 6,087 | | | | (24,773 | ) | | | (6,120 | ) | | | (11,403 | ) | | | 15,024 | |
Trading account (loss) profit | | | 50 | | | | 19 | | | | (542 | ) | | | (223 | ) | | | (368 | ) | | | 169 | |
Other operating income | | | 2,733 | | | | 2,733 | | | | — | | | | — | | | | (303 | ) | | | (303 | ) |
| | | | | | | | | | | | | | | | | | | | | | | | |
Total | | $ | (1,009 | ) | | $ | 18,398 | | | $ | (27,137 | ) | | $ | (8,134 | ) | | $ | (28,075 | ) | | $ | (1,104 | ) |
| | | | | | | | | | | | | | | | | | | | | | | | |
The following table includes quantitative information about significant unobservable inputs used to derive the fair value of Level 3 instruments, excluding those instruments for which the unobservable inputs were not developed by the Corporation such as prices of prior transactions and/or unadjusted third-party pricing sources.
| | | | | | | | | | | | |
(In thousands) | | Fair value
at December 31,
2015 | | | Valuation technique | | Unobservable inputs | | Weighted average (range) | |
CMO’s - trading | | $ | 1,831 | | | Discounted cash flow model | | Weighted average life | | | 2.9 years (0.4 - 4.7 years | ) |
| | | | | | | | Yield | | | 3.8% (1.1% - 4.7% | ) |
| | | | | | | | Constant prepayment rate | | | 20.9% (18.0% - 23.8% | ) |
Other - trading | | $ | 687 | | | Discounted cash flow model | | Weighted average life | | | 5.4 years | |
| | | | | | | | Yield | | | 12.1 | % |
| | | | | | | | Constant prepayment rate | | | 10.8 | % |
Mortgage servicing rights | | $ | 211,405 | | | Discounted cash flow model | | Prepayment speed | | | 6.5% (0.2% - 22.1% | ) |
| | | | | | | | Weighted average life | | | 6.7 years (0.1 - 17.4 years | ) |
| | | | | | | | Discount rate | | | 11.3% (9.5% - 15.0% | ) |
Contingent consideration | | $ | (119,745 | ) | | Discounted cash flow model | | Credit loss rate on covered loans | | | 3.4% (0.0% - 100.0% | ) |
| | | | | | | | Risk premium component of discount rate | | | 6.0 | % |
Loans held-in-portfolio | | $ | 67,870 | [1] | | External appraisal | | Haircut applied on external appraisals | | | 40.0% (38.5% - 40.0% | ) |
Other real estate owned | | $ | 61,576 | [2] | | External appraisal | | Haircut applied on external appraisals | | | 23.3% (15.0% - 50.0% | ) |
Other foreclosed assets | | $ | 75 | [3] | | External appraisal | | Haircut applied on external appraisals | | | 1.0 | % |
| [1] | Loans held-in-portfolio in which haircuts were not applied to external appraisals were excluded from this table. |
| [2] | Other real estate owned in which haircuts were not applied to external appraisals were excluded from this table. |
| [3] | Other foreclosed assets in which haircuts were not applied to external appraisals were excluded from this table. |
The significant unobservable inputs used in the fair value measurement of the Corporation’s collateralized mortgage obligations and interest-only collateralized mortgage obligation (reported as “other”), which are classified in the “trading” category, are yield, constant prepayment rate, and weighted average life. Significant increases (decreases) in any of those inputs in isolation would result in significantly lower (higher) fair value measurement. Generally, a change in the assumption used for the constant prepayment rate will generate a directionally opposite change in the weighted average life. For example, as the average life is reduced by a higher constant prepayment rate, a lower yield will be realized, and when there is a reduction in the constant prepayment rate, the average life of these collateralized mortgage obligations will extend, thus resulting in a higher yield. These particular financial instruments are valued internally by the Corporation’s investment banking and broker-dealer unit utilizing internal valuation techniques. The unobservable inputs incorporated into the internal discounted cash flow models used to derive the fair value of collateralized mortgage obligations and interest-only collateralized mortgage obligation (reported as “other”), which are classified in the “trading” category, are reviewed by the Corporation’s Corporate Treasury unit on a quarterly basis. In the case of Level 3 financial instruments which fair value is based on broker quotes, the Corporation’s Corporate Treasury unit reviews the inputs used by the broker-dealers for reasonableness utilizing information available from other published sources and validates that the fair value measurements were developed in accordance with ASC Topic 820. The Corporate Treasury unit also substantiates the inputs used by validating the prices with other broker-dealers, whenever possible.
245
The significant unobservable inputs used in the fair value measurement of the Corporation’s mortgage servicing rights are constant prepayment rates and discount rates. Increases in interest rates may result in lower prepayments. Discount rates vary according to products and / or portfolios depending on the perceived risk. Increases in discount rates result in a lower fair value measurement. The Corporation’s Corporate Comptroller’s unit is responsible for determining the fair value of MSRs, which is based on discounted cash flow methods based on assumptions developed by an external service provider, except for prepayment speeds, which are adjusted internally for the local market based on historical experience. The Corporation’s Corporate Treasury unit validates the economic assumptions developed by the external service provider on a quarterly basis. In addition, an analytical review of prepayment speeds is performed quarterly by the Corporate Comptroller’s unit. The Corporation’s MSR Committee analyzes changes in fair value measurements of MSRs and approves the valuation assumptions at each reporting period. Changes in valuation assumptions must also be approved by the MSR Committee. The fair value of MSRs are compared with those of the external service provider on a quarterly basis in order to validate if the fair values are within the materiality thresholds established by management to monitor and investigate material deviations. Back-testing is performed to compare projected cash flows with actual historical data to ascertain the reasonability of the projected net cash flow results.
Following is a description of the Corporation’s valuation methodologies used for assets and liabilities measured at fair value. The disclosure requirements exclude certain financial instruments and all non-financial instruments. Accordingly, the aggregate fair value amounts of the financial instruments disclosed do not represent management’s estimate of the underlying value of the Corporation.
Trading Account Securities and Investment Securities Available-for-Sale
| | • | | U.S. Treasury securities: The fair value of U.S. Treasury securities is based on yields that are interpolated from the constant maturity treasury curve. These securities are classified as Level 2. |
| | • | | Obligations of U.S. Government sponsored entities: The Obligations of U.S. Government sponsored entities include U.S. agency securities, which fair value is based on an active exchange market and on quoted market prices for similar securities. The U.S. agency securities are classified as Level 2. |
| | • | | Obligations of Puerto Rico, States and political subdivisions: Obligations of Puerto Rico, States and political subdivisions include municipal bonds. The bonds are segregated and the like characteristics divided into specific sectors. Market inputs used in the evaluation process include all or some of the following: trades, bid price or spread, two sided markets, quotes, benchmark curves including but not limited to Treasury benchmarks, LIBOR and swap curves, market data feeds such as those obtained from municipal market sources, discount and capital rates, and trustee reports. The municipal bonds are classified as Level 2. |
| | • | | Mortgage-backed securities: Certain agency mortgage-backed securities (“MBS”) are priced based on a bond’s theoretical value derived from similar bonds defined by credit quality and market sector. Their fair value incorporates an option adjusted spread. The agency MBS are classified as Level 2. Other agency MBS such as GNMA Puerto Rico Serials are priced using an internally-prepared pricing matrix with quoted prices from local brokers dealers. These particular MBS are classified as Level 3. |
| | • | | Collateralized mortgage obligations: Agency and private-label collateralized mortgage obligations (“CMOs”) are priced based on a bond’s theoretical value derived from similar bonds defined by credit quality and market sector and for which fair value incorporates an option adjusted spread. The option adjusted spread model includes prepayment and volatility assumptions, ratings (whole loans collateral) and spread adjustments. These CMOs are classified as Level 2. Other CMOs, due to their limited liquidity, are classified as Level 3 due to the insufficiency of inputs such as broker quotes, executed trades, credit information and cash flows. |
| | • | | Equity securities: Equity securities with quoted market prices obtained from an active exchange market are classified as Level 1. Other equity securities that do not trade in highly liquid markets are classified as Level 2. |
| | • | | Corporate securities (included as “other” in the “available-for-sale” category): Given that the quoted prices are for similar instruments, these securities are classified as Level 2. |
| | • | | Corporate securities and mutual funds (included as “other” in the “trading account securities” category): Quoted prices for these security types are obtained from broker dealers. Given that the quoted prices are for similar instruments or do not trade in highly liquid markets, these securities are classified as Level 2. The important variables in determining the prices |
246
| | of Puerto Rico tax-exempt mutual fund shares are net asset value, dividend yield and type of assets in the fund. All funds trade based on a relevant dividend yield taking into consideration the aforementioned variables. In addition, demand and supply also affect the price. |
Mortgage servicing rights
Mortgage servicing rights (“MSRs”) do not trade in an active market with readily observable prices. MSRs are priced internally using a discounted cash flow model. The discounted cash flow model incorporates assumptions that market participants would use in estimating future net servicing income, including portfolio characteristics, prepayments assumptions, discount rates, delinquency and foreclosure rates, late charges, other ancillary revenues, cost to service and other economic factors. Prepayment speeds are adjusted for the Corporation’s loan characteristics and portfolio behavior. Due to the unobservable nature of certain valuation inputs, the MSRs are classified as Level 3.
Derivatives
Interest rate swaps, interest rate caps and indexed options are traded in over-the-counter active markets. These derivatives are indexed to an observable interest rate benchmark, such as LIBOR or equity indexes, and are priced using an income approach based on present value and option pricing models using observable inputs. Other derivatives are liquid and have quoted prices, such as forward contracts or “to be announced securities” (“TBAs”). All of these derivatives are classified as Level 2. The non-performance risk is determined using internally-developed models that consider the collateral held, the remaining term, and the creditworthiness of the entity that bears the risk, and uses available public data or internally-developed data related to current spreads that denote their probability of default.
Contingent consideration liability
The fair value of the true-up payment obligation (contingent consideration) to the FDIC as it relates to the Westernbank FDIC-assisted transaction was estimated using projected cash flows related to the loss sharing agreements at the true-up measurement date. It took into consideration the intrinsic loss estimate, asset premium/discount, cumulative shared loss payments, and the cumulative servicing amount related to the loan portfolio. Refer to Note 14 to the consolidated financial statements for a description of the formula established in the loss share agreements for determining the true-up payment.
On a quarterly basis, management evaluates and revises the estimated credit loss rates that are used to determine expected cash flows on the covered loan pools. The expected credit losses on the loan pools are used to determine the loss share cash flows expected to be paid to the FDIC when the true-up payment is due.
The true-up payment obligation was discounted using a term rate consistent with the time remaining until the payment is due. The discount rate was an estimate of the sum of the risk-free benchmark rate for the term remaining before the true-up payment is due and a risk premium to account for the credit risk profile of BPPR. The risk premium was calculated based on a 12-month trailing average spread of the yields on corporate bonds with credit ratings similar to BPPR.
Loans held-in-portfolio considered impaired under ASC Section 310-10-35 that are collateral dependent
The impairment is measured based on the fair value of the collateral, which is derived from appraisals that take into consideration prices in observed transactions involving similar assets in similar locations, in accordance with the provisions of ASC Section 310-10-35, and which could be subject to internal adjustments based on the age of the appraisal. Currently, the associated loans considered impaired are classified as Level 3.
Loans measured at fair value pursuant to lower of cost or fair value adjustments
Loans measured at fair value on a nonrecurring basis pursuant to lower of cost or fair value were priced based on secondary market prices and discounted cash flow models which incorporate internally-developed assumptions for prepayments and credit loss estimates. These loans are classified as Level 3.
Other real estate owned and other foreclosed assets
Other real estate owned includes real estate properties securing mortgage, consumer, and commercial loans. Other foreclosed assets include primarily automobiles securing auto loans. The fair value of foreclosed assets may be determined using an external appraisal, broker price opinion, internal valuation or binding offer. The majority of these foreclosed assets are classified as Level 3 since they are subject to internal adjustments. Certain foreclosed assets which are measured based on binding offers are classified as Level 2.
247
Note 35 – Fair value of financial instruments
The fair value of financial instruments is the amount at which an asset or obligation could be exchanged in a current transaction between willing parties, other than in a forced or liquidation sale. Fair value estimates are made at a specific point in time based on the type of financial instrument and relevant market information. Many of these estimates involve various assumptions and may vary significantly from amounts that could be realized in actual transactions.
The information about the estimated fair values of financial instruments presented hereunder excludes all nonfinancial instruments and certain other specific items.
For those financial instruments with no quoted market prices available, fair values have been estimated using present value calculations or other valuation techniques, as well as management’s best judgment with respect to current economic conditions, including discount rates, estimates of future cash flows, and prepayment assumptions.
The fair values reflected herein have been determined based on the prevailing interest rate environment at December 31, 2015 and December 31, 2014, as applicable. In different interest rate environments, fair value estimates can differ significantly, especially for certain fixed rate financial instruments. In addition, the fair values presented do not attempt to estimate the value of the Corporation’s fee generating businesses and anticipated future business activities, that is, they do not represent the Corporation’s value as a going concern. Accordingly, the aggregate fair value amounts presented do not represent the underlying value of the Corporation.
Following is a description of the Corporation’s valuation methodologies and inputs used to estimate the fair values for each class of financial assets and liabilities not measured at fair value, but for which the fair value is disclosed. The disclosure requirements exclude certain financial instruments and all non-financial instruments. Accordingly, the aggregate fair value amounts of the financial instruments disclosed do not represent management’s estimate of the underlying value of the Corporation. For a description of the valuation methodologies and inputs used to estimate the fair value for each class of financial assets and liabilities measured at fair value, refer to Note 34.
Cash and due from banks
Cash and due from banks include cash on hand, cash items in process of collection, and non-interest bearing deposits due from other financial institutions. The carrying amount of cash and due from banks is a reasonable estimate of its fair value. Cash and due from banks are classified as Level 1.
Money market investments
Investments in money market instruments include highly liquid instruments with an average maturity of three months or less. For this reason, they carry a low risk of changes in value as a result of changes in interest rates, and the carrying amount approximates their fair value. Money market investments include federal funds sold, securities purchased under agreements to resell, time deposits with other banks, and cash balances, including those held at the Federal Reserve. These money market investments are classified as Level 2, except for cash balances which generate interest, including those held at the Federal Reserve, which are classified as Level 1.
Investment securities held-to-maturity
| | • | | Obligations of Puerto Rico, States and political subdivisions: Municipal bonds include Puerto Rico public municipalities debt and bonds collateralized by second mortgages under the Home Purchase Stimulus Program. Puerto Rico public municipalities debt was valued internally based on benchmark treasury notes and a credit spread derived from comparable Puerto Rico government trades and recent issuances. Puerto Rico public municipalities debt is classified as Level 3. Given that the fair value of municipal bonds collateralized by second mortgages was based on internal yield and prepayment speed assumptions, these municipal bonds are classified as Level 3. |
| | • | | Agency collateralized mortgage obligation: The fair value of the agency collateralized mortgage obligation (“CMO”), which is guaranteed by GNMA, was based on internal yield and prepayment speed assumptions. This agency CMO is classified as Level 3. |
| | • | | Other: Other securities include foreign debt and a private non-profit institution security. Given that the fair value was based on quoted prices for similar instruments, foreign debt is classified as Level 2. Since the fair value of the private non-profit institution security was internally derived using a price/yield methodology, in which the spread was defined based on the obligor risk rating and the corresponding transfer price, this security is classified as Level 3. |
248
Other investment securities
| | • | | Federal Home Loan Bank capital stock: Federal Home Loan Bank (FHLB) capital stock represents an equity interest in the FHLB of New York. It does not have a readily determinable fair value because its ownership is restricted and it lacks a market. Since the excess stock is repurchased by the FHLB at its par value, the carrying amount of FHLB capital stock approximates fair value. Thus, these stocks are classified as Level 2. |
| | • | | Federal Reserve Bank capital stock: Federal Reserve Bank (FRB) capital stock represents an equity interest in the FRB of New York. It does not have a readily determinable fair value because its ownership is restricted and it lacks a market. Since the canceled stock is repurchased by the FRB for the amount of the cash subscription paid, the carrying amount of FRB capital stock approximates fair value. Thus, these stocks are classified as Level 2. |
| | • | | Trust preferred securities: These securities represent the equity-method investment in the common stock of these trusts. Book value is the same as fair value for these securities since the fair value of the junior subordinated debentures is the same amount as the fair value of the trust preferred securities issued to the public. The equity-method investment in the common stock of these trusts is classified as Level 2. Refer to Note 25 for additional information on these trust preferred securities. |
| | • | | Other investments: Other investments include private equity method investments and Visa Class B common stock held by the Corporation. Since there are no observable market values, private equity method investments are classified as Level 3. The Visa Class B common stock was priced by applying the quoted price of Visa Class A common stock, net of a liquidity adjustment, to the as converted number of Class A common shares since these Class B common shares are restricted and not convertible to Class A common shares until pending litigation is resolved. Thus, these stocks are classified as Level 3. |
Loans held-for-sale
For loans held-for-sale originated with the intent to sell in the secondary market, its fair value was determined using similar characteristics of loans and secondary market prices assuming the conversion to mortgage-backed securities. Given that the valuation methodology uses internal assumptions based on loan level data, these loans are classified as Level 3. The fair value of certain other loans held-for-sale is based on bids received from potential buyers; binding offers; or external appraisals, net of internal adjustments and estimated costs to sell. Loans held-for-sale based on binding offers are classified as Level 2. Loans held-for-sale based on indicative offers and/or external appraisals are classified as Level 3.
Loans held-in-portfolio
The fair values of the loans held-in-portfolio have been determined for groups of loans with similar characteristics. Loans were segregated by type such as commercial, construction, residential mortgage, consumer, and credit cards. Each loan category was further segmented based on loan characteristics, including interest rate terms, credit quality and vintage. Generally, fair values were estimated based on an exit price by discounting expected cash flows for the segmented groups of loans using a discount rate that considers interest, credit and expected return by market participant under current market conditions. Additionally, prepayment, default and recovery assumptions have been applied in the mortgage loan portfolio valuations. Generally accepted accounting principles do not require a fair valuation of the lease financing portfolio, therefore it is included in the loans total at its carrying amount. Loans held-in-portfolio are classified as Level 3.
FDIC loss share asset
Fair value of the FDIC loss share asset was estimated using projected net losses related to the loss sharing agreements, which are expected to be reimbursed by the FDIC. The projected net losses were discounted using the U.S. Government agency curve. The loss share asset is classified as Level 3.
249
Deposits
| | • | | Demand deposits: The fair value of demand deposits, which have no stated maturity, was calculated based on the amount payable on demand as of the respective dates. These demand deposits include non-interest bearing demand deposits, savings, NOW, and money market accounts. Thus, these deposits are classified as Level 2. |
| | • | | Time deposits: The fair value of time deposits was calculated based on the discounted value of contractual cash flows using interest rates being offered on time deposits with similar maturities. The non-performance risk was determined using internally-developed models that consider, where applicable, the collateral held, amounts insured, the remaining term, and the credit premium of the institution. For certain 5-year certificates of deposit in which customers may withdraw their money anytime with no penalties or charges, the fair value of these certificates of deposit incorporate an early cancellation estimate based on historical experience. Time deposits are classified as Level 2. |
Assets sold under agreements to repurchase
| | • | | Securities sold under agreements to repurchase: Securities sold under agreements to repurchase with short-term maturities approximate fair value because of the short-term nature of those instruments. Resell and repurchase agreements with long-term maturities were valued using discounted cash flows based on the three-month LIBOR. In determining the non-performance credit risk valuation adjustment, the collateralization levels of these long-term securities sold under agreements to repurchase were considered. Securities sold under agreements to repurchase are classified as Level 2. |
Other short-term borrowings
The carrying amount of other short-term borrowings approximate fair value because of the short-term maturity of those instruments or because they carry interest rates which approximate market. Thus, these other short-term borrowings are classified as Level 2.
Notes payable
| | • | | FHLB advances: The fair value of FHLB advances was based on the discounted value of contractual cash flows over their contractual term. In determining the non-performance credit risk valuation adjustment, the collateralization levels of these advances were considered. These advances are classified as Level 2. |
| | • | | Unsecured senior debt securities: The fair value of publicly-traded unsecured senior debt securities was determined using recent trades of similar transactions. Publicly-traded unsecured senior debt securities are classified as Level 2. |
| | • | | Junior subordinated deferrable interest debentures (related to trust preferred securities): The fair value of junior subordinated interest debentures was determined using recent trades of similar transactions. Thus, these junior subordinated deferrable interest debentures are classified as Level 2. |
| | • | | Others: The other category includes capital lease obligations. Generally accepted accounting principles do not require a fair valuation of capital lease obligations, therefore; it is included at its carrying amount. Capital lease obligations are classified as Level 3. |
Commitments to extend credit and letters of credit
Commitments to extend credit were valued using the fees currently charged to enter into similar agreements. For those commitments where a future stream of fees is charged, the fair value was estimated by discounting the projected cash flows of fees on commitments. Since the fair value of commitments to extend credit varies depending on the undrawn amount of the credit facility, fees are subject to constant change, and cash flows are dependent on the creditworthiness of borrowers, commitments to extend credit are classified as Level 3. The fair value of letters of credit was based on fees currently charged on similar agreements. Given that the fair value of letters of credit constantly vary due to fees being subject to constant change and whether the fees are received depends on the creditworthiness of the account parties, letters of credit are classified as Level 3.
250
The following tables present the carrying or notional amounts, as applicable, and estimated fair values for financial instruments with their corresponding level in the fair value hierarchy.
| | | | | | | | | | | | | | | | | | | | |
| | | December 31, 2015 | |
(In thousands) | | Carrying
amount | | | Level 1 | | | Level 2 | | | Level 3 | | | Fair value | |
Financial Assets: | | | | | | | | | | | | | | | | | | | | |
Cash and due from banks | | $ | 363,674 | | | $ | 363,674 | | | $ | — | | | $ | — | | | $ | 363,674 | |
Money market investments | | | 2,180,092 | | | | 2,083,839 | | | | 96,253 | | | | — | | | | 2,180,092 | |
Trading account securities, excluding derivatives[1] | | | 71,659 | | | | — | | | | 62,687 | | | | 8,972 | | | | 71,659 | |
Investment securities available-for-sale[1] | | | 6,062,992 | | | | 276 | | | | 6,061,282 | | | | 1,434 | | | | 6,062,992 | |
Investment securities held-to-maturity: | | | | | | | | | | | | | | | | | | | | |
Obligations of Puerto Rico, States and political subdivisions | | $ | 98,817 | | | $ | — | | | $ | — | | | $ | 80,815 | | | $ | 80,815 | |
Collateralized mortgage obligation-federal agency | | | 86 | | | | — | | | | — | | | | 91 | | | | 91 | |
Other | | | 2,000 | | | | — | | | | 1,740 | | | | 243 | | | | 1,983 | |
| | | | | | | | | | | | | | | | | | | | |
Total investment securities held-to-maturity | | $ | 100,903 | | | $ | — | | | $ | 1,740 | | | $ | 81,149 | | | $ | 82,889 | |
| | | | | | | | | | | | | | | | | | | | |
Other investment securities: | | | | | | | | | | | | | | | | | | | | |
FHLB stock | | $ | 59,387 | | | $ | — | | | $ | 59,387 | | | $ | — | | | $ | 59,387 | |
FRB stock | | | 97,740 | | | | — | | | | 97,740 | | | | — | | | | 97,740 | |
Trust preferred securities | | | 13,198 | | | | — | | | | 13,198 | | | | — | | | | 13,198 | |
Other investments | | | 1,923 | | | | — | | | | — | | | | 4,966 | | | | 4,966 | |
| | | | | | | | | | | | | | | | | | | | |
Total other investment securities | | $ | 172,248 | | | $ | — | | | $ | 170,325 | | | $ | 4,966 | | | $ | 175,291 | |
| | | | | | | | | | | | | | | | | | | | |
Loans held-for-sale | | $ | 137,000 | | | $ | — | | | $ | 1,364 | | | $ | 138,031 | | | $ | 139,395 | |
Loans not covered under loss sharing agreement with the FDIC | | | 21,843,180 | | | | — | | | | — | | | | 20,849,150 | | | | 20,849,150 | |
Loans covered under loss sharing agreements with the FDIC | | | 611,939 | | | | — | | | | — | | | | 593,002 | | | | 593,002 | |
FDIC loss share asset | | | 310,221 | | | | — | | | | — | | | | 313,224 | | | | 313,224 | |
Mortgage servicing rights | | | 211,405 | | | | — | | | | — | | | | 211,405 | | | | 211,405 | |
Derivatives | | | 16,959 | | | | — | | | | 16,959 | | | | — | | | | 16,959 | |
| |
| | | December 31, 2015 | |
(In thousands) | | Carrying
amount | | | Level 1 | | | Level 2 | | | Level 3 | | | Fair value | |
Financial Liabilities: | | | | | | | | | | | | | | | | | | | | |
Deposits: | | | | | | | | | | | | | | | | | | | | |
Demand deposits | | $ | 19,044,355 | | | $ | — | | | $ | 19,044,355 | | | $ | — | | | $ | 19,044,355 | |
Time deposits | | | 8,165,368 | | | | — | | | | 8,134,029 | | | | — | | | | 8,134,029 | |
| | | | | | | | | | | | | | | | | | | | |
Total deposits | | $ | 27,209,723 | | | $ | — | | | $ | 27,178,384 | | | $ | — | | | $ | 27,178,384 | |
| | | | | | | | | | | | | | | | | | | | |
Federal funds purchased and assets sold under agreements to repurchase | | $ | 762,145 | | | $ | — | | | $ | 764,599 | | | $ | — | | | $ | 764,599 | |
Other short-term borrowings[2] | | $ | 1,200 | | | $ | — | | | $ | 1,200 | | | $ | — | | | $ | 1,200 | |
Notes payable: | | | | | | | | | | | | | | | | | | | | |
FHLB advances | | $ | 761,501 | | | $ | — | | | $ | 780,411 | | | $ | — | | | $ | 780,411 | |
Unsecured senior debt securities | | | 450,000 | | | | — | | | | 435,186 | | | | — | | | | 435,186 | |
Junior subordinated deferrable interest debentures (related to trust preferred securities) | | | 439,800 | | | | — | | | | 352,673 | | | | — | | | | 352,673 | |
Others | | | 19,008 | | | | — | | | | — | | | | 19,008 | | | | 19,008 | |
| | | | | | | | | | | | | | | | | | | | |
Total notes payable | | $ | 1,670,309 | | | $ | — | | | $ | 1,568,270 | | | $ | 19,008 | | | $ | 1,587,278 | |
| | | | | | | | | | | | | | | | | | | | |
Derivatives | | $ | 14,343 | | | $ | — | | | $ | 14,343 | | | $ | — | | | $ | 14,343 | |
| | | | | | | | | | | | | | | | | | | | |
Contingent consideration | | $ | 120,380 | | | $ | — | | | $ | — | | | $ | 120,380 | | | $ | 120,380 | |
| | | | | | | | | | | | | | | | | | | | |
251
| | | | | | | | | | | | | | | | | | | | |
(In thousands) | | Notional
amount | | | Level 1 | | | Level 2 | | | Level 3 | | | Fair value | |
Commitments to extend credit | | $ | 7,434,108 | | | $ | — | | | $ | — | | | $ | 1,080 | | | $ | 1,080 | |
Letters of credit | | | 51,710 | | | | — | | | | — | | | | 572 | | | | 572 | |
| [1] | Refer to Note 34 to the consolidated financial statements for the fair value by class of financial asset and its hierarchy level. |
| [2] | Refer to Note 23 to the consolidated financial statements for the composition of short-term borrowings. |
252
| | | | | | | | | | | | | | | | | | | | |
| | | December 31, 2014 | |
(In thousands) | | Carrying
amount | | | Level 1 | | | Level 2 | | | Level 3 | | | Fair value | |
Financial Assets: | | | | | | | | | | | | | | | | | | | | |
Cash and due from banks | | $ | 381,095 | | | $ | 381,095 | | | $ | — | | | $ | — | | | $ | 381,095 | |
Money market investments | | | 1,822,386 | | | | 1,671,477 | | | | 150,909 | | | | — | | | | 1,822,386 | |
Trading account securities, excluding derivatives[1] | | | 138,527 | | | | — | | | | 129,360 | | | | 9,167 | | | | 138,527 | |
Investment securities available-for-sale[1] | | | 5,315,159 | | | | 323 | | | | 5,313,511 | | | | 1,325 | | | | 5,315,159 | |
Investment securities held-to-maturity: | | | | | | | | | | | | | | | | | | | | |
Obligations of Puerto Rico, States and political subdivisions | | | 101,573 | | | | — | | | | — | | | | 92,597 | | | | 92,597 | |
Collateralized mortgage obligation-federal agency | | | 97 | | | | — | | | | — | | | | 102 | | | | 102 | |
Other | | | 1,500 | | | | — | | | | 1,500 | | | | — | | | | 1,500 | |
| | | | | | | | | | | | | | | | | | | | |
Total investment securities held-to-maturity | | $ | 103,170 | | | $ | — | | | $ | 1,500 | | | $ | 92,699 | | | $ | 94,199 | |
| | | | | | | | | | | | | | | | | | | | |
Other investment securities: | | | | | | | | | | | | | | | | | | | | |
FHLB stock | | $ | 66,773 | | | $ | — | | | $ | 66,773 | | | $ | — | | | $ | 66,773 | |
FRB stock | | | 80,025 | | | | — | | | | 80,025 | | | | — | | | | 80,025 | |
Trust preferred securities | | | 13,197 | | | | — | | | | 12,197 | | | | 1,000 | | | | 13,197 | |
Other investments | | | 1,911 | | | | — | | | | — | | | | 5,028 | | | | 5,028 | |
| | | | | | | | | | | | | | | | | | | | |
Total other investment securities | | $ | 161,906 | | | $ | — | | | $ | 158,995 | | | $ | 6,028 | | | $ | 165,023 | |
| | | | | | | | | | | | | | | | | | | | |
Loans held-for-sale | | $ | 106,104 | | | $ | — | | | $ | 27,074 | | | $ | 87,862 | | | $ | 114,936 | |
Loans not covered under loss sharing agreement with the FDIC | | | 18,884,732 | | | | — | | | | — | | | | 18,079,609 | | | | 18,079,609 | |
Loans covered under loss sharing agreements with the FDIC | | | 2,460,589 | | | | — | | | | — | | | | 2,947,909 | | | | 2,947,909 | |
FDIC loss share asset | | | 542,454 | | | | — | | | | — | | | | 481,420 | | | | 481,420 | |
Mortgage servicing rights | | | 148,694 | | | | — | | | | — | | | | 148,694 | | | | 148,694 | |
Derivatives | | | 25,362 | | | | — | | | | 25,362 | | | | — | | | | 25,362 | |
| |
| | | December 31, 2014 | |
(In thousands) | | Carrying
amount | | | Level 1 | | | Level 2 | | | Level 3 | | | Fair value | |
Financial Liabilities: | | | | | | | | | | | | | | | | | | | | |
Deposits: | | | | | | | | | | | | | | | | | | | | |
Demand deposits | | $ | 17,333,090 | | | $ | — | | | $ | 17,333,090 | | | $ | — | | | $ | 17,333,090 | |
Time deposits | | | 7,474,445 | | | | — | | | | 7,512,683 | | | | — | | | | 7,512,683 | |
| | | | | | | | | | | | | | | | | | | | |
Total deposits | | $ | 24,807,535 | | | $ | — | | | $ | 24,845,773 | | | $ | — | | | $ | 24,845,773 | |
| | | | | | | | | | | | | | | | | | | | |
Federal funds purchased and assets sold under agreements to repurchase | | $ | 1,271,657 | | | $ | — | | | $ | 1,269,398 | | | $ | — | | | $ | 1,269,398 | |
Other short-term borrowings[2] | | $ | 21,200 | | | $ | — | | | $ | 20,200 | | | $ | 1,000 | | | $ | 21,200 | |
Notes payable: | | | | | | | | | | | | | | | | | | | | |
FHLB advances | | | 802,198 | | | | — | | | | 814,877 | | | | — | | | | 814,877 | |
Unsecured senior debt | | | 450,000 | | | | — | | | | 460,530 | | | | — | | | | 460,530 | |
Junior subordinated deferrable interest debentures (related to trust preferred securities) | | | 439,800 | | | | — | | | | 379,400 | | | | — | | | | 379,400 | |
Others | | | 19,830 | | | | — | | | | — | | | | 19,830 | | | | 19,830 | |
| | | | | | | | | | | | | | | | | | | | |
Total notes payable | | $ | 1,711,828 | | | $ | — | | | $ | 1,654,807 | | | $ | 19,830 | | | $ | 1,674,637 | |
| | | | | | | | | | | | | | | | | | | | |
Derivatives | | $ | 23,032 | | | $ | — | | | $ | 23,032 | | | $ | — | | | $ | 23,032 | |
| | | | | | | | | | | | | | | | | | | | |
Contingent consideration | | $ | 133,634 | | | $ | — | | | $ | — | | | $ | 133,634 | | | $ | 133,634 | |
| | | | | | | | | | | | | | | | | | | | |
253
| | | | | | | | | | | | | | | | | | | | |
(In thousands) | | Notional
amount | | | Level 1 | | | Level 2 | | | Level 3 | | | Fair value | |
Commitments to extend credit | | $ | 7,135,352 | | | $ | — | | | $ | — | | | $ | 1,716 | | | $ | 1,716 | |
Letters of credit | | | 49,182 | | | | — | | | | — | | | | 486 | | | | 486 | |
| [1] | Refer to Note 34 to the consolidated financial statements for the fair value by class of financial asset and its hierarchy level. |
| [2] | Refer to Note 23 to the consolidated financial statements for the composition of short-term borrowings. |
Note 36 – Employee benefits
Pension and benefit restoration plans
Certain employees of BPPR are covered by non-contributory defined benefit pension plans. Pension benefits are based on age, years of credited service, and final average compensation.
BPPR’s non-contributory, defined benefit retirement plan are currently closed to new hires and the accrual of benefits are frozen to all participants. The retirement plan’s benefit formula is based on a percentage of average final compensation and years of service as of the plan freeze date. Normal retirement age under the retirement plans is age 65 with 5 years of service. Pension costs are funded in accordance with minimum funding standards under the Employee Retirement Income Security Act of 1974 (“ERISA”). Benefits under the BPPR retirement plan are subject to the U.S. and PR Internal Revenue Code limits on compensation and benefits. Benefits under restoration plans restore benefits to selected employees that are limited under the retirement plan due to U.S. and PR Internal Revenue Code limits and a compensation definition that excludes amounts deferred pursuant to nonqualified arrangements. The freeze applied to the restoration plan as well.
The Corporation’s funding policy is to make annual contributions to the plans, when necessary, in amounts which fully provide for all benefits as they become due under the plans.
The Corporation’s pension fund investment strategy is to invest in a prudent manner for the exclusive purpose of providing benefits to participants. A well defined internal structure has been established to develop and implement a risk-controlled investment strategy that is targeted to produce a total return that, when combined with the bank’s contributions to the fund, will maintain the fund’s ability to meet all required benefit obligations. Risk is controlled through diversification of asset types, such as investments in domestic and international equities and fixed income.
Equity investments include various types of stock and index funds. Also, this category includes Popular, Inc.’s common stock. Fixed income investments include U.S. Government securities and other U.S. agencies’ obligations, corporate bonds, mortgage loans, mortgage-backed securities and index funds, among others. A designated committee periodically reviews the performance of the pension plans’ investments and assets allocation. The Trustee and the money managers are allowed to exercise investment discretion, subject to limitations established by the pension plans’ investment policies. The plans forbid money managers to enter into derivative transactions, unless approved by the Trustee.
The overall expected long-term rate-of-return-on-assets assumption reflects the average rate of earnings expected on the funds invested or to be invested to provide for the benefits included in the benefit obligation. The assumption has been determined by reflecting expectations regarding future rates of return for the plan assets, with consideration given to the distribution of the investments by asset class and historical rates of return for each individual asset class. This process is reevaluated at least on an annual basis and if market, actuarial and economic conditions change, adjustments to the rate of return may come into place.
254
The plans’ target allocation based on market value for years 2015 and 2014, by asset category, is summarized in the table below.
| | | | | | | | |
| | | Minimum
allotment | | | Maximum
allotment | |
Equity | | | 0 | % | | | 70 | % |
Debt securities | | | 0 | % | | | 100 | % |
Cash and cash equivalents | | | 0 | % | | | 100 | % |
The following table presents the composition of the assets of the pension and benefit restoration plans.
| | | | | | | | |
(In thousands) | | 2015 | | | 2014 | |
Obligations of the U.S. Government and its agencies | | $ | 165,960 | | | $ | 210,549 | |
Corporate bonds and debentures | | | 79,175 | | | | 50,708 | |
Equity securities | | | 218,894 | | | | 241,458 | |
Index fund - equity | | | 32,540 | | | | 27,888 | |
Foreign commingled trust fund | | | 79,046 | | | | 89,664 | |
Foreign index fund | | | 26,835 | | | | 29,643 | |
Commodity fund | | | 10,016 | | | | 13,480 | |
Mortgage-backed securities | | | 16,315 | | | | 12,913 | |
Private equity investments | | | 400 | | | | 546 | |
Cash and cash equivalents | | | 13,540 | | | | 18,834 | |
Accrued investment income | | | 1,693 | | | | 1,557 | |
| | | | | | | | |
Total assets | | $ | 644,414 | | | $ | 697,240 | |
| | | | | | | | |
The following table sets forth by level, within the fair value hierarchy, the plans’ assets at fair value at December 31, 2015 and 2014.
| | | | | | | | | | | | | | | | | | | | | | | | | | | | | | | | |
| | | 2015 | | | 2014 | |
(In thousands) | | Level 1 | | | Level 2 | | | Level 3 | | | Total | | | Level 1 | | | Level 2 | | | Level 3 | | | Total | |
Obligations of the U.S. Government and its agencies | | $ | — | | | $ | 165,960 | | | $ | — | | | $ | 165,960 | | | $ | — | | | $ | 210,549 | | | $ | — | | | $ | 210,549 | |
Corporate bonds and debentures | | | — | | | | 79,175 | | | | — | | | | 79,175 | | | | — | | | | 50,708 | | | | — | | | | 50,708 | |
Equity securities | | | 218,894 | | | | — | | | | — | | | | 218,894 | | | | 241,458 | | | | — | | | | — | | | | 241,458 | |
Index fund - equity | | | 32,540 | | | | — | | | | — | | | | 32,540 | | | | 27,888 | | | | — | | | | — | | | | 27,888 | |
Foreign commingled trust fund | | | — | | | | 79,046 | | | | — | | | | 79,046 | | | | — | | | | 89,664 | | | | — | | | | 89,664 | |
Foreign index fund | | | — | | | | 26,835 | | | | — | | | | 26,835 | | | | — | | | | 29,643 | | | | — | | | | 29,643 | |
Commodity fund | | | — | | | | 10,016 | | | | — | | | | 10,016 | | | | — | | | | 13,480 | | | | — | | | | 13,480 | |
Mortgage-backed securities | | | — | | | | 16,315 | | | | — | | | | 16,315 | | | | — | | | | 12,913 | | | | — | | | | 12,913 | |
Private equity investments | | | — | | | | — | | | | 400 | | | | 400 | | | | — | | | | — | | | | 546 | | | | 546 | |
Cash and cash equivalents | | | 13,540 | | | | — | | | | — | | | | 13,540 | | | | 18,834 | | | | — | | | | — | | | | 18,834 | |
Accrued investment income | | | — | | | | — | | | | 1,693 | | | | 1,693 | | | | — | | | | — | | | | 1,557 | | | | 1,557 | |
| | | | | | | | | | | | | | | | | | | | | | | | | | | | | | | | |
Total assets | | $ | 264,974 | | | $ | 377,347 | | | $ | 2,093 | | | $ | 644,414 | | | $ | 288,180 | | | $ | 406,957 | | | $ | 2,103 | | | $ | 697,240 | |
| | | | | | | | | | | | | | | | | | | | | | | | | | | | | | | | |
The closing prices reported in the active markets in which the securities are traded are used to value the investments.
Following is a description of the valuation methodologies used for investments measured at fair value:
| | • | | Obligations of U.S. Government and its agencies - The fair value of Obligations of U.S. Government and agencies obligations is based on an active exchange market and is based on quoted market prices for similar securities. These securities are classified as Level 2. U.S. agency structured notes are priced based on a bond’s theoretical value from similar bonds defined by credit quality and market sector and for which the fair value incorporates an option adjusted spread in deriving their fair value. These securities are classified as Level 2. |
255
| | • | | Corporate bonds and debentures - Corporate bonds and debentures are valued at fair value at the closing price reported in the active market in which the bond is traded. These securities are classified as Level 2. |
| | • | | Equity securities - Equity securities with quoted market prices obtained from an active exchange market and high liquidity are classified as Level 1. |
| | • | | Equity index funds - Equity with quoted market prices obtained from an active exchange market and high liquidity are classified as Level 1. |
| | • | | Foreign commingled trust fund- are collective investment funds that are valued at the net asset value (NAV) of shares held by the plan at year end. These securities are classified as Level 2. |
| | • | | Index funds – Fixed income, foreign equity, foreign index and commodity funds are valued at the net asset value (NAV) of shares held by the plan at year end. These securities are classified as Level 2. |
| | • | | Mortgage-backed securities - Certain agency mortgage and other asset backed securities (“MBS”) are priced based on a bond’s theoretical value from similar bonds defined by credit quality and market sector. Their fair value incorporates an option adjusted spread. The agency MBS are classified as Level 2. |
| | • | | Private equity investments - Private equity investments include an investment in a private equity fund. The fund value is recorded at its net asset value (NAV) which is affected by the changes in the fair market value of the investments held in the fund. This fund is classified as Level 3. |
| | • | | Cash and cash equivalents - The carrying amount of cash and cash equivalents is a reasonable estimate of the fair value since it is available on demand or due to their short-term maturity. |
| | • | | Accrued investment income – Given the short-term nature of these assets, their carrying amount approximates fair value. Since there is a lack of observable inputs related to instrument specific attributes, these are reported as Level 3. |
The preceding valuation methods may produce a fair value calculation that may not be indicative of net realizable value or reflective of future fair values. Furthermore, although the plan believes its valuation methods are appropriate and consistent with other market participants, the use of different methodologies or assumptions to determine the fair value of certain financial instruments could result in a different fair value measurement at the reporting date.
The following table presents the change in Level 3 assets measured at fair value.
| | | | | | | | |
(In thousands) | | 2015 | | | 2014 | |
Balance at beginning of year | | $ | 2,103 | | | $ | 2,562 | |
Actual return on plan assets: | | | | | | | | |
Change in unrealized (loss) gain relating to instruments still held at the reporting date | | | — | | | | (459 | ) |
Purchases, sales, issuance, settlements, paydowns and maturities (net) | | | (10 | ) | | | — | |
| | | | | | | | |
Balance at end of year | | $ | 2,093 | | | $ | 2,103 | |
| | | | | | | | |
There were no transfers in and/or out of Level 3 for financial instruments measured at fair value on a recurring basis during the years ended December 31, 2015 and 2014. There were no transfers in and/or out of Level 1 and Level 2 during the years ended December 31, 2015 and 2014.
256
Information on the shares of common stock held by the pension and restoration plans is provided in the table that follows.
| | | | | | | | |
| | | 2015 | | | 2014 | |
Shares of Popular, Inc. common stock | | | 275,996 | | | | 274,572 | |
Fair value of shares of Popular, Inc. common stock | | $ | 7,821,713 | | | $ | 9,349,177 | |
Dividends paid on shares of Popular, Inc. common stock held by the plan | | $ | 41,399 | | | $ | — | |
The following table sets forth the aggregate status of the plans and the amounts recognized in the consolidated financial statements at December 31, 2015 and 2014.
| | | | | | | | | | | | | | | | |
| | | Pension plan | | | Benefit restoration plans | |
(In thousands) | | 2015 | | | 2014 | | | 2015 | | | 2014 | |
Change in benefit obligation: | | | | | | | | | | | | | | | | |
Benefit obligation at beginning of year | | $ | 777,815 | | | $ | 653,396 | | | $ | 42,664 | | | $ | 36,096 | |
Interest cost | | | 29,613 | | | | 29,844 | | | | 1,630 | | | | 1,659 | |
Actuarial (gain) loss | | | (34,538 | ) | | | 131,610 | | | | (1,738 | ) | | | 6,238 | |
Benefits paid | | | (36,750 | ) | | | (37,035 | ) | | | (1,783 | ) | | | (1,329 | ) |
| | | | | | | | | | | | | | | | |
Benefit obligation at end of year | | $ | 736,140 | | | $ | 777,815 | | | $ | 40,773 | | | $ | 42,664 | |
| | | | | | | | | | | | | | | | |
Change in fair value of plan assets: | | | | | | | | | | | | | | | | |
Fair value of plan assets at beginning of year | | $ | 662,765 | | | $ | 671,299 | | | $ | 34,475 | | | $ | 34,183 | |
Actual return on plan assets | | | (13,732 | ) | | | 28,501 | | | | (734 | ) | | | 1,570 | |
Employer contributions | | | — | | | | — | | | | 173 | | | | 51 | |
Benefits paid | | | (36,750 | ) | | | (37,035 | ) | | | (1,783 | ) | | | (1,329 | ) |
| | | | | | | | | | | | | | | | |
Fair value of plan assets at end of year | | $ | 612,283 | | | $ | 662,765 | | | $ | 32,131 | | | $ | 34,475 | |
| | | | | | | | | | | | | | | | |
Amounts recognized in accumulated other comprehensive loss: | | | | | | | | | | | | | | | | |
Net loss | | $ | 294,792 | | | $ | 289,233 | | | $ | 13,699 | | | $ | 13,588 | |
| | | | | | | | | | | | | | | | |
Accumulated other comprehensive loss (AOCL) | | $ | 294,792 | | | $ | 289,233 | | | $ | 13,699 | | | $ | 13,588 | |
| | | | | | | | | | | | | | | | |
Reconciliation of net (liabilities) assets: | | | | | | | | | | | | | | | | |
Net (liabilities) assets at beginning of year | | $ | (115,050 | ) | | $ | 17,903 | | | $ | (8,189 | ) | | $ | (1,912 | ) |
Amount recognized in AOCL at beginning of year, pre-tax | | | 289,233 | | | | 147,677 | | | | 13,588 | | | | 6,928 | |
| | | | | | | | | | | | | | | | |
Amount prepaid at beginning of year | | | 174,183 | | | | 165,580 | | | | 5,399 | | | | 5,016 | |
Net periodic benefit income (cost) | | | (3,248 | ) | | | 8,603 | | | | (515 | ) | | | 332 | |
Contributions | | | — | | | | — | | | | 173 | | | | 51 | |
| | | | | | | | | | | | | | | | |
Amount prepaid at end of year | | | 170,935 | | | | 174,183 | | | | 5,057 | | | | 5,399 | |
Amount recognized in AOCL | | | (294,792 | ) | | | (289,233 | ) | | | (13,699 | ) | | | (13,588 | ) |
| | | | | | | | | | | | | | | | |
Net (liabilities) assets at end of year | | $ | (123,857 | ) | | $ | (115,050 | ) | | $ | (8,642 | ) | | $ | (8,189 | ) |
| | | | | | | | | | | | | | | | |
257
The table below presents a breakdown of the plans’ assets and liabilities at December 31, 2015 and 2014.
| | | | | | | | | | | | | | | | |
| | | Pension plan | | | Benefit restoration plans | |
(In thousands) | | 2015 | | | 2014 | | | 2015 | | | 2014 | |
Current liabilities | | $ | — | | | $ | — | | | $ | 173 | | | $ | 173 | |
Non-current liabilities | | | 123,857 | | | | 115,050 | | | | 8,469 | | | | 8,016 | |
The following table presents the funded status of the plans at December 31, 2015 and 2014.
| | | | | | | | | | | | | | | | |
| | | Pension Plan | | | Benefit Restoration Plan | |
(In thousands) | | 2015 | | | 2014 | | | 2015 | | | 2014 | |
Benefit obligation at end of year | | $ | (736,140 | ) | | $ | (777,815 | ) | | $ | (40,773 | ) | | $ | (42,664 | ) |
Fair value of plan assets at end of year | | | 612,283 | | | | 662,765 | | | | 32,131 | | | | 34,475 | |
| | | | | | | | | | | | | | | | |
Funded status at year end | | $ | (123,857 | ) | | $ | (115,050 | ) | | $ | (8,642 | ) | | $ | (8,189 | ) |
| | | | | | | | | | | | | | | | |
The following table presents the change in accumulated other comprehensive loss (“AOCL”), pre-tax, for the years ended December 31, 2015 and 2014.
| | | | | | | | | | | | | | | | |
(In thousands) | | Pension plan | | | Benefit restoration plans | |
| | | 2015 | | | 2014 | | | 2015 | | | 2014 | |
Accumulated other comprehensive loss at beginning of year | | $ | 289,233 | | | $ | 147,677 | | | $ | 13,588 | | | $ | 6,928 | |
| | | | | | | | | | | | | | | | |
Increase (decrease) in AOCL: | | | | | | | | | | | | | | | | |
Recognized during the year: | | | | | | | | | | | | | | | | |
Amortization of actuarial losses | | | (17,860 | ) | | | (8,074 | ) | | | (1,244 | ) | | | (431 | ) |
Occurring during the year: | | | | | | | | | | | | | | | | |
Net actuarial (gains) losses | | | 23,419 | | | | 149,630 | | | | 1,355 | | | | 7,091 | |
| | | | | | | | | | | | | | | | |
Total (decrease) increase in AOCL | | | 5,559 | | | | 141,556 | | | | 111 | | | | 6,660 | |
| | | | | | | | | | | | | | | | |
Accumulated other comprehensive loss at end of year | | $ | 294,792 | | | $ | 289,233 | | | $ | 13,699 | | | $ | 13,588 | |
| | | | | | | | | | | | | | | | |
The following table presents the amounts in accumulated other comprehensive loss that are expected to be recognized as components of net periodic benefit cost during 2016.
| | | | | | | | |
(In thousands) | | Pension plan | | | Benefit restoration plans | |
Net actuarial loss | | $ | 19,520 | | | $ | 1,327 | |
The following table presents information for plans with a projected benefit obligation in excess of plan assets for the years ended December 31, 2015 and 2014.
| | | | | | | | | | | | | | | | |
| | | Pension plan | | | Benefit restoration plans | |
(In thousands) | | 2015 | | | 2014 | | | 2015 | | | 2014 | |
Projected benefit obligation | | $ | 736,140 | | | $ | 777,815 | | | $ | 40,773 | | | $ | 42,664 | |
Accumulated benefit obligation | | | 736,140 | | | | 777,815 | | | | 40,773 | | | | 42,664 | |
Fair value of plan assets | | | 612,283 | | | | 662,765 | | | | 32,131 | | | | 34,475 | |
258
Effective December 31, 2015 the Corporation changed its estimate of the service and interest cost components of net periodic benefit cost for its pension and postretirement benefits plans. Previously, the Corporation estimated the service and interest cost components utilizing a single weighted-average discount rate derived from the yield curve used to measure the benefit obligation. The new estimate utilizes a full yield curve approach in the estimation of these components by applying the specific spot rates along the yield curve used in the determination of the benefit obligation to their underlying projected cash flows. The new estimate provides a more precise measurement of service and interest costs by improving the correlation between projected benefit cash flows and their corresponding spot rates. The change does not affect the measurement of the Corporation’s pension and postretirement benefit obligations and it is accounted for as a change in accounting estimate, which is applied prospectively. For year 2016, the change in estimate is expected to reduce the pension and postretirement net periodic benefit plan cost by approximately $6.9 million.
To determine benefit obligation at year end, the Corporation used a weighted average of annual spot rates applied to future expected cash flows for year ended December 31, 2015 and a single discount rate applied to all future expected cash flows for year ended December 31, 2014.
The following table presents weighted - average actuarial assumptions used to determine the benefit obligations at December 31, 2015 and 2014:
| | | | | | | | | | | | | | | | | | | | | | | | |
| | | Pension plan | | | Tax qualified restoration plans | | | Benefit restoration plans | |
| | | 2015 | | | 2014 | | | 2015 | | | 2014 | | | 2015 | | | 2014 | |
Discount rate | | | 4.27 | % | | | 3.90 | % | | | 4.23 | % | | | 3.90 | % | | | 4.20 | % | | | 3.90 | % |
The following table presents the actuarial assumptions used to determine the components of net periodic benefit cost for the years ended December 31, 2015, 2014 and 2013.
| | | | | | | | | | | | | | | | | | | | | | | | |
| | | Pension plan | | | Benefit restoration plans | |
| | | 2015 | | | 2014 | | | 2013 | | | 2015 | | | 2014 | | | 2013 | |
Discount rate | | | 3.90 | % | | | 4.70 | % | | | 3.80 | % | | | 3.90 | % | | | 4.70 | % | | | 3.80 | % |
Expected return on plan assets | | | 7.00 | % | | | 7.25 | % | | | 7.25 | % | | | 7.00 | % | | | 7.25 | % | | | 7.25 | % |
The following table presents the components of net periodic benefit cost for the years ended December 31, 2015 and 2014.
| | | | | | | | | | | | | | | | | | | | | | | | |
| | | Pension plan | | | Benefit restoration plans | |
(In thousands) | | 2015 | | | 2014 | | | 2013 | | | 2015 | | | 2014 | | | 2013 | |
Interest cost | | $ | 29,613 | | | $ | 29,844 | | | $ | 27,863 | | | $ | 1,630 | | | $ | 1,659 | | | $ | 1,493 | |
Expected return on plan assets | | | (44,225 | ) | | | (46,521 | ) | | | (43,216 | ) | | | (2,359 | ) | | | (2,422 | ) | | | (2,167 | ) |
Recognized net actuarial loss | | | 17,860 | | | | 8,074 | | | | 21,452 | | | | 1,244 | | | | 431 | | | | 1,330 | |
| | | | | | | | | | | | | | | | | | | | | | | | |
Net periodic benefit (credit) cost | | $ | 3,248 | | | $ | (8,603 | ) | | $ | 6,099 | | | $ | 515 | | | $ | (332 | ) | | $ | 656 | |
| | | | | | | | | | | | | | | | | | | | | | | | |
The Corporation expects to pay the following contributions to the benefit plans during the year ended December 31, 2016.
| | | | |
(In thousands) | | 2016 | |
Pension plan | | $ | — | |
Benefit restoration plans | | $ | 173 | |
259
Benefit payments projected to be made from the pension and benefit restoration plans during the next ten years are presented in the table below.
| | | | | | | | |
(In thousands) | | Pension plan | | | Benefit restoration plans | |
2016 | | $ | 37,797 | | | $ | 1,838 | |
2017 | | | 38,467 | | | | 2,014 | |
2018 | | | 39,114 | | | | 2,131 | |
2019 | | | 39,803 | | | | 2,309 | |
2020 | | | 40,410 | | | | 2,357 | |
2021 - 2025 | | | 208,919 | | | | 12,350 | |
Postretirement health care benefits
In addition to providing pension benefits, BPPR provides certain health care benefits for certain retired employees. Regular employees of BPPR, hired before February 1, 2000, may become eligible for health care benefits, provided they reach retirement age while working for BPPR.
The following table presents the status of the Corporation’s unfunded postretirement health care benefit plan and the related amounts recognized in the consolidated financial statements at December 31, 2015 and 2014.
| | | | | | | | |
(In thousands) | | 2015 | | | 2014 | |
Change in benefit obligation: | | | | | | | | |
Benefit obligation at beginning of the year | | $ | 161,818 | | | $ | 145,732 | |
Service cost | | | 1,470 | | | | 1,457 | |
Interest cost | | | 6,356 | | | | 6,846 | |
Benefits paid | | | (5,360 | ) | | | (5,688 | ) |
Actuarial loss | | | 1,715 | | | $ | 13,471 | |
| | | | | | | | |
Benefit obligation end of year | | $ | 165,999 | | | | 161,818 | |
| | | | | | | | |
Amounts recognized in accumulated other comprehensive loss: | | | | | | | | |
Net prior service cost | | $ | (11,070 | ) | | $ | (14,870 | ) |
Net loss | | | 26,536 | | | | 25,817 | |
| | | | | | | | |
Accumulated other comprehensive loss | | $ | 15,466 | | | $ | 10,947 | |
| | | | | | | | |
Reconciliation of net liability: | | | | | | | | |
Net liability at beginning of year | | $ | (161,818 | ) | | $ | (145,732 | ) |
Amount recognized in accumulated other comprehensive loss at beginning of year, pre-tax | | | 10,947 | | | | (6,324 | ) |
| | | | | | | | |
Amount accrued at beginning of year | | | (150,871 | ) | | | (152,056 | ) |
Net periodic benefit cost | | | (5,022 | ) | | | (4,503 | ) |
Contributions | | | 5,360 | | | | 5,688 | |
| | | | | | | | |
Amount accrued at end of year | | | (150,533 | ) | | | (150,871 | ) |
Amount recognized in accumulated other comprehensive loss | | | (15,466 | ) | | | (10,947 | ) |
| | | | | | | | |
Net liability at end of year | | $ | (165,999 | ) | | $ | (161,818 | ) |
| | | | | | | | |
260
The table below presents a breakdown of the liability associated with the postretirement health care benefit plan.
| | | | | | | | |
(In thousands) | | 2015 | | | 2014 | |
Current liabilities | | $ | 6,417 | | | $ | 5,820 | |
Non-current liabilities | | | 159,582 | | | | 155,998 | |
The following table presents the funded status of the postretirement health care benefit plan at year end December 31, 2015 and 2014.
| | | | | | | | |
(In thousands) | | 2015 | | | 2014 | |
Benefit obligation at end of year | | $ | (165,999 | ) | | $ | (161,818 | ) |
Fair value of plan assets at end of year | | | — | | | | — | |
| | | | | | | | |
Funded status at year end | | | (165,999 | ) | | | (161,818 | ) |
| | | | | | | | |
The following table presents the changes in accumulated other comprehensive loss (income), pre-tax, for the postretirement health care benefit plan.
| | | | | | | | |
(In thousands) | | 2015 | | | 2014 | |
Accumulated other comprehensive (income) loss at beginning of year | | $ | 10,947 | | | $ | (6,324 | ) |
| | | | | | | | |
Increase (decrease) in accumulated other comprehensive loss : | | | | | | | | |
Recognized during the year: | | | | | | | | |
Prior service credit | | | 3,800 | | | | 3,800 | |
Amortization of actuarial losses | | | (996 | ) | | | — | |
Occurring during the year: | | | | | | | | |
Net actuarial (gains) losses | | | 1,715 | | | | 13,471 | |
| | | | | | | | |
Total increase (decrease) in accumulated other comprehensive loss | | | 4,519 | | | | 17,271 | |
| | | | | | | | |
Accumulated other comprehensive (income) loss at end of year | | $ | 15,466 | | | $ | 10,947 | |
| | | | | | | | |
The following table presents the amounts in accumulated other comprehensive loss that are expected to be recognized as components of net periodic benefit cost for the postretirement health care benefit plan during the year ended December 31, 2016.
| | | | |
(In thousands) | | 2016 | |
Net prior service credit | | $ | (3,800 | ) |
| | | | |
Net actuarial loss | | $ | 1,099 | |
| | | | |
261
The following table presents the components of net periodic postretirement health care benefit cost.
| | | | | | | | | | | | |
(In thousands) | | 2015 | | | 2014 | | | 2013 | |
Service cost | | $ | 1,470 | | | $ | 1,457 | | | $ | 2,257 | |
Interest cost | | | 6,356 | | | | 6,846 | | | | 6,848 | |
Amortization of prior service credit | | | (3,800 | ) | | | (3,800 | ) | | | — | |
Recognized net actuarial loss (gain) | | | 996 | | | | — | | | | 1,892 | |
| | | | | | | | | | | | |
Net periodic benefit cost | | $ | 5,022 | | | $ | 4,503 | | | $ | 10,997 | |
| | | | | | | | | | | | |
To determine benefit obligation at year end, the Corporation used a weighted average of annual spot rates applied to future expected cash flows for year ended December 31, 2015 and a single discount rate applied to all future expected cash flows for year ended December 31, 2014.
The following tables present the discount rate and assumed health care cost trend rates used to determine the benefit obligation and the net periodic benefit cost for the postretirement health care benefit plan.
| | | | | | | | | | | | |
To determine benefit obligation at year ended December 31: | | 2015 | | | 2014 | | | | |
Discount rate | | | 4.37 | % | | | 4.00 | % | | | | |
Initial health care cost trend rate | | | 6.50 | % | | | 7.00 | % | | | | |
Ultimate health care cost trend rate | | | 5.00 | % | | | 5.00 | % | | | | |
Year that the ultimate trend rate is reached | | | 2019 | | | | 2019 | | | | | |
| | | |
To determine net periodic benefit cost for the year ended December 31: | | 2015 | | | 2014 | | | 2013 | |
Discount rate | | | 4.00 | % | | | 4.80 | % | | | 3.80 | % |
Initial health care cost trend rate | | | 7.00 | % | | | 7.50 | % | | | 6.50 | % |
Ultimate health care cost trend rate | | | 5.00 | % | | | 5.00 | % | | | 5.00 | % |
Year that the ultimate trend rate is reached | | | 2019 | | | | 2019 | | | | 2016 | |
Assumed health care trend rates generally have a significant effect on the amounts reported for a health care plan. The following table presents the effects of changes in the assumed health care cost trend rates.
| | | | | | | | |
| | | December 31, 2015 | |
(In thousands) | | 1-percentage point
increase | | | 1-percentage point
decrease | |
Effect on total service cost and interest cost components for the year ended | | $ | 369 | | | $ | (474 | ) |
Effect on accumulated postretirement benefit obligation at year end | | $ | 5,307 | | | $ | (5,760 | ) |
262
The following table presents information for the postretirement health care benefit plan with an accumulated post retirement benefit obligation in excess of plan assets.
| | | | | | | | |
(In thousands) | | 2015 | | | 2014 | |
Projected benefit obligation | | $ | 165,999 | | | $ | 161,818 | |
Accumulated benefit obligation | | | 165,999 | | | | 161,818 | |
Fair value of plan assets | | | — | | | | — | |
The Corporation expects to contribute $6.4 million to the postretirement benefit plan in 2016 to fund current benefit payment requirements.
Benefit payments projected to be made on the postretirement health care benefit plan during the next ten years are presented in the following table.
| | | | |
(In thousands) | | | |
2016 | | $ | 6,417 | |
2017 | | | 6,739 | |
2018 | | | 7,054 | |
2019 | | | 7,357 | |
2020 | | | 7,632 | |
2021 - 2025 | | | 42,234 | |
Savings plans
The Corporation also provides defined contribution savings plans pursuant to Section 1081.01(d) of the Puerto Rico Internal Revenue Code and Section 401(k) of the U.S. Internal Revenue Code, as applicable, for substantially all the employees of the Corporation. Investments in the plans are participant-directed, and employer matching contributions are determined based on the specific provisions of each plan. Employees are fully vested in the employer’s contribution after five years of service. Effective March 20, 2009, the savings plans were amended to suspend the employer matching contribution to the plan. This matching contribution was restored on April 2013. The cost of providing these benefits in the year ended December 31, 2015 was $6.4 million (2014 - $5.0 million).
The plans held 1,979,558 (2014 – 1,820,318) shares of common stock of the Corporation with a market value of approximately $56.1 million at December 31, 2015 (2014 - $62.0 million).
263
Note 37 – Net income (loss) per common share
The following table sets forth the computation of net income (loss) per common share (“EPS”), basic and diluted, for the years ended December 31, 2015, 2014 and 2013:
| | | | | | | | | | | | |
(In thousands, except per share information) | | 2015 | | | 2014 | | | 2013 | |
Net income (loss) from continuing operations | | $ | 893,997 | | | $ | (190,510 | ) | | $ | 558,818 | |
Net income (loss) from discontinued operations | | | 1,347 | | | | (122,980 | ) | | | 40,509 | |
Preferred stock dividends | | | (3,723 | ) | | | (3,723 | ) | | | (3,723 | ) |
| | | | | | | | | | | | |
Net income (loss) applicable to common stock | | $ | 891,621 | | | $ | (317,213 | ) | | $ | 595,604 | |
| | | | | | | | | | | | |
Average common shares outstanding | | | 102,967,186 | | | | 102,848,792 | | | | 102,693,685 | |
Average potential dilutive common shares | | | 157,123 | | | | — | | | | 367,790 | |
| | | | | | | | | | | | |
Average common shares outstanding - assuming dilution | | | 103,124,309 | | | | 102,848,792 | | | | 103,061,475 | |
| | | | | | | | | | | | |
Basic EPS from continuing operations | | $ | 8.65 | | | $ | (1.88 | ) | | $ | 5.41 | |
| | | | | | | | | | | | |
Basic EPS from discontinued operations | | $ | 0.01 | | | $ | (1.20 | ) | | $ | 0.39 | |
| | | | | | | | | | | | |
Total Basic EPS | | $ | 8.66 | | | $ | (3.08 | ) | | $ | 5.80 | |
| | | | | | | | | | | | |
Diluted EPS from continuing operations | | $ | 8.64 | | | $ | (1.88 | ) | | $ | 5.39 | |
| | | | | | | | | | | | |
Diluted EPS from discontinued operations | | $ | 0.01 | | | $ | (1.20 | ) | | $ | 0.39 | |
| | | | | | | | | | | | |
Total Diluted EPS | | $ | 8.65 | | | $ | (3.08 | ) | | $ | 5.78 | |
| | | | | | | | | | | | |
Potential common shares consist of common stock issuable under the assumed exercise of stock options, restricted stock and performance shares awards using the treasury stock method. This method assumes that the potential common shares are issued and the proceeds from exercise, in addition to the amount of compensation cost attributed to future services, are used to purchase common stock at the exercise date. The difference between the number of potential shares issued and the shares purchased is added as incremental shares to the actual number of shares outstanding to compute diluted earnings per share. Warrants, stock options, restricted stock and performance shares awards that result in lower potential shares issued than shares purchased under the treasury stock method are not included in the computation of dilutive earnings per share since their inclusion would have an antidilutive effect in earnings per common share.
For the year ended December 31, 2015, there were no stock options outstanding. There were 45,205 and 102,389 weighted average antidilutive stock options outstanding for the years ended December 31, 2014 and 2013, respectively.
Note 38 – Rental expense and commitments
At December 31, 2015, the Corporation was obligated under a number of non-cancelable leases for land, buildings, and equipment which require rentals as follows:
| | | | |
Year | | Minimum
payments[1] | |
| | | (In thousands) | |
2016 | | $ | 36,405 | |
2017 | | | 29,866 | |
2018 | | | 26,962 | |
2019 | | | 25,236 | |
2020 | | | 23,481 | |
Later years | | | 140,230 | |
| | | | |
| | $ | 282,180 | |
| | | | |
| [1] | Minimum payments have not been reduced by minimum non-cancelable sublease rentals due in the future of $ 2.4 million at December 31, 2015. |
264
Total rental expense for all operating leases, except those with terms of a month or less that were not renewed, for the year ended December 31, 2015 was $ 35.9 million (2014 - $ 35.0 million; 2013 - $ 40.3 million), which is included in net occupancy, equipment and communication expenses, according to their nature.
Note 39 – Other service fees
The following table presents the major categories of other service fees for the years ended December 31, 2015, 2014 and 2013.
| | | | | | | | | | | | |
(In thousands) | | 2015 | | | 2014 | | | 2013 | |
Debit card fees | | $ | 46,176 | | | $ | 43,146 | | | $ | 41,912 | |
Insurance fees | | | 63,976 | | | | 54,158 | | | | 52,309 | |
Credit card fees | | | 68,166 | | | | 67,639 | | | | 65,727 | |
Sale and administration of investment products | | | 23,846 | | | | 27,711 | | | | 35,272 | |
Trust fees | | | 18,866 | | | | 18,209 | | | | 17,285 | |
Other fees | | | 15,060 | | | | 14,402 | | | | 16,846 | |
| | | | | | | | | | | | |
Total other service fees | | $ | 236,090 | | | $ | 225,265 | | | $ | 229,351 | |
| | | | | | | | | | | | |
265
Note 40 – FDIC loss share income (expense)
The caption of FDIC loss-share income (expense) in the consolidated statements of operations consists of the following major categories:
| | | | | | | | | | | | |
| | | Years ended December 31, | |
(In thousands) | | 2015 | | | 2014 | | | 2013 | |
Amortization of loss share indemnification asset | | $ | (66,238 | ) | | $ | (189,959 | ) | | $ | (161,635 | ) |
Reversal of accelerated amortization in prior periods | | | — | | | | 12,492 | | | | — | |
80% mirror accounting on credit impairment losses[1] | | | 15,658 | | | | 32,038 | | | | 60,454 | |
80% mirror accounting on reimbursable expenses | | | 73,205 | | | | 58,117 | | | | 50,985 | |
80% mirror accounting on recoveries on covered assets, including rental income on OREOs, subject to reimbursement to the FDIC | | | (13,836 | ) | | | (13,124 | ) | | | (16,057 | ) |
80% mirror accounting on amortization of contingent liability on unfunded commitments | | | — | | | | — | | | | (473 | ) |
Change in true-up payment obligation | | | 9,559 | | | | (1,791 | ) | | | (15,993 | ) |
Other | | | 1,714 | | | | (797 | ) | | | 668 | |
| | | | | | | | | | | | |
Total FDIC loss share income (expense) | | $ | 20,062 | | | $ | (103,024 | ) | | $ | (82,051 | ) |
| | | | | | | | | | | | |
| [1] | Reductions in expected cash flows for ASC 310-30 loans, which may impact the provision for loan losses, may consider reductions in both principal and interest cash flow expectations. The amount covered under the FDIC loss sharing agreements for interest not collected from borrowers is limited under the agreements (approximately 90 days); accordingly, these amounts are not subject fully to the 80% mirror accounting. |
The negative amortization of the FDIC’s Indemnification Asset for the year ended December 31, 2015 includes a $10.9 million expense related to losses incurred by the corporation that were not claimed to the FDIC before the expiration of the loss-share portion of the agreement on June 30, 2015, and that are not subject to the ongoing arbitrations.
266
Note 41 - Stock-based compensation
The Corporation maintained a Stock Option Plan (the “Stock Option Plan”), which permitted the granting of incentive awards in the form of qualified stock options, incentive stock options, or non-statutory stock options of the Corporation. In April 2004, the Corporation’s shareholders adopted the Popular, Inc. 2004 Omnibus Incentive Plan (the “Incentive Plan”), which replaced and superseded the Stock Option Plan. The adoption of the Incentive Plan did not alter the original terms of the grants made under the Stock Option Plan prior to the adoption of the Incentive Plan.
Stock Option Plan
Employees and directors of the Corporation or any of its subsidiaries were eligible to participate in the Stock Option Plan. The Board of Directors or the Compensation Committee of the Board had the absolute discretion to determine the individuals that were eligible to participate in the Stock Option Plan. This plan provided for the issuance of Popular, Inc.’s common stock at a price equal to its fair market value at the grant date, subject to certain plan provisions. The shares are to be made available from authorized but unissued shares of common stock or treasury stock. The Corporation’s policy has been to use authorized but unissued shares of common stock to cover each grant. The maximum option term is ten years from the date of grant. Unless an option agreement provides otherwise, all options granted are 20% exercisable after the first year and an additional 20% is exercisable after each subsequent year, subject to an acceleration clause at termination of employment due to retirement.
As of 2015, all options outstanding expired. There was no intrinsic value of options outstanding and exercisable at December 31, 2014 and 2013.
The following table summarizes the stock option activity and related information:
| | | | | | | | |
(Not in thousands) | | Options outstanding | | | Weighted-average
exercise price | |
Outstanding at January 1, 2013 | | | 160,986 | | | $ | 222.71 | |
Granted | | | — | | | | — | |
Exercised | | | — | | | | — | |
Forfeited | | | — | | | | — | |
Expired | | | (60,549 | ) | | | 171.42 | |
| | | | | | | | |
Outstanding at December 31, 2013 | | | 100,437 | | | $ | 253.64 | |
Granted | | | — | | | | — | |
Exercised | | | — | | | | — | |
Forfeited | | | — | | | | — | |
Expired | | | (55,640 | ) | | | 238.85 | |
| | | | | | | | |
Outstanding at December 31, 2014 | | | 44,797 | | | $ | 272.00 | |
Granted | | | — | | | | — | |
Exercised | | | — | | | | — | |
Forfeited | | | — | | | | — | |
Expired | | | (44,797 | ) | | | 272.00 | |
| | | | | | | | |
Outstanding at December 31, 2015 | | | — | | | $ | — | |
| | | | | | | | |
There was no stock option expense recognized for the years ended December 31, 2015, 2014 and 2013.
Incentive Plan
The Incentive Plan permits the granting of incentive awards in the form of Annual Incentive Awards, Long-term Performance Unit Awards, Stock Options, Stock Appreciation Rights, Restricted Stock, Restricted Units or Performance Shares. Participants in the Incentive Plan are designated by the Compensation Committee of the Board of Directors (or its delegate as determined by the Board). Employees and directors of the Corporation and/or any of its subsidiaries are eligible to participate in the Incentive Plan.
267
Under the Incentive Plan, the Corporation has issued restricted shares, which become vested based on the employees’ continued service with Popular. Unless otherwise stated in an agreement, the compensation cost associated with the shares of restricted stock is determined based on a two-prong vesting schedule. The first part is vested ratably over five years commencing at the date of grant and the second part is vested at termination of employment after attainment of 55 years of age and 10 years of service. The five-year vesting part is accelerated at termination of employment after attaining 55 years of age and 10 years of service. The vesting schedule for restricted shares granted on 2014 and thereafter was modified as follows, the first part ratably over four years commencing at the date of the grant and the second part is vested at termination of employment after attainment the earlier of 55 years of age and 10 years of service or 60 years of age and 5 years of service. The four year vesting part is accelerated at termination of employment after attaining the earlier of 55 years of age and 10 years of service or 60 years of age and 5 years of service. The restricted shares granted, consistent with the requirements of the Troubled Asset Relief Program (“TARP”) Interim Final Rule, vest in two years from grant date.
The following table summarizes the restricted stock activity under the Incentive Plan for members of management.
| | | | | | | | |
(Not in thousands) | | Shares | | | Weighted-average
grant date fair value | |
Non-vested at January 1, 2013 | | | 491,223 | | | $ | 20.59 | |
Granted | | | 229,131 | | | | 28.20 | |
Vested | | | (131,324 | ) | | | 31.23 | |
Forfeited | | | (3,783 | ) | | | 24.63 | |
| | | | | | | | |
Non-vested at December 31, 2013 | | | 585,247 | | | $ | 21.16 | |
Granted | | | 365,831 | | | | 29.86 | |
Vested | | | (311,078 | ) | | | 19.02 | |
Forfeited | | | (11,991 | ) | | | 29.33 | |
| | | | | | | | |
Non-vested at December 31, 2014 | | | 628,009 | | | $ | 27.13 | |
Granted | | | 323,814 | | | | 33.37 | |
Vested | | | (430,646 | ) | | | 30.45 | |
Forfeited | | | (25,446 | ) | | | 28.65 | |
| | | | | | | | |
Non-vested at December 31, 2015 | | | 495,731 | | | $ | 28.25 | |
| | | | | | | | |
During the year ended December 31, 2015, 231,830 shares of restricted stock (2014 - 365,831; 2013 - 229,131 ) were awarded to management under the Incentive Plan. No shares were awarded to management under the requirements of the TARP Interim Final Rule during 2015 (2014 - 162,332; 2013 - 165,304).
Beginning in 2015, the Corporation authorized the issuance of performance shares, in addition to restricted shares, under the Incentive Plan. The performance share awards consist of the opportunity to receive shares of Popular, Inc.’s common stock provided that the Corporation achieves certain goals during a three-year performance cycle. The goals will be based on two metrics weighted equally: the Relative Total Shareholder Return (“TSR”) and the Absolute Earnings per Share (“EPS”) goals. The TSR metric is considered to be a market condition under ASC 718. For equity settled awards based on a market condition, the fair value is determined as of the grant date and is not subsequently revised based on actual performance. The EPS performance metric is considered to be a performance condition under ASC 718. The fair value is determined based on the probability of achieving the EPS goal as of each reporting period. The TSR and EPS metrics are equally weighted and work independently. The performance shares vest at the end of the three-year performance cycle. The vesting is accelerated at termination of employment after attaining the earlier of 55 years of age and 10 years of service or 60 years of age and 5 years of service. For the year ended December 31, 2015, 91,984 performance shares were granted under this plan.
During the year ended December 31, 2015, the Corporation recognized $ 10.7 million of restricted stock expense related to management incentive awards, with a tax benefit of $ 1.6 million (2014 - $ 6.8 million, with a tax benefit of $ 1.1 million; 2013 - $ 5.3 million, with a tax benefit of $ 1.7 million). During the year ended December 31, 2015, the fair market value of the restricted
268
stock vested was $7.4 million at grant date and $8.4 million at vesting date. This triggers a windfall, net of shortfalls, of $0.4 million of which $0.2 million was recorded as a windfall pool in additional paid in capital. No windfall pool was recorded for the remaining $0.2 million due to the valuation allowance of the deferred tax asset. During the year ended December 31, 2015 the Corporation recognized $2.2 million of performance shares expense, with a tax benefit of $0.2 million. The total unrecognized compensation cost related to non-vested restricted stock awards to members of management at December 31, 2015 was $ 7.5 million and is expected to be recognized over a weighted-average period of 2.3 years.
The following table summarizes the restricted stock activity under the Incentive Plan for members of the Board of Directors:
| | | | | | | | |
(Not in thousands) | | Restricted stock | | | Weighted-average
grant date fair value | |
Nonvested at January 1, 2013 | | | — | | | | — | |
Granted | | | 20,930 | | | $ | 29.43 | |
Vested | | | (20,930 | ) | | | 29.43 | |
Forfeited | | | — | | | | — | |
| | | | | | | | |
Non-vested at December 31, 2013 | | | — | | | | — | |
Granted | | | 23,135 | | | $ | 30.43 | |
Vested | | | (23,135 | ) | | | 30.43 | |
Forfeited | | | — | | | | — | |
| | | | | | | | |
Non-vested at December 31, 2014 | | | — | | | | — | |
Granted | | | 22,119 | | | $ | 32.29 | |
Vested | | | (22,119 | ) | | | 32.29 | |
Forfeited | | | — | | | | — | |
| | | | | | | | |
Non-vested at December 31, 2015 | | | — | | | | — | |
| | | | | | | | |
During the year ended December 31, 2015, the Corporation granted 22,119 shares of restricted stock to members of the Board of Directors of Popular, Inc., which became vested at grant date (2014 - 23,135; 2013 – 20,930). During this period, the Corporation recognized $0.5 million of restricted stock expense related to these restricted stock grants, with a tax benefit of $77 thousand (2014 - $0.5 million, with a tax benefit of $57 thousand; 2013 - $0.5 million, with a tax benefit of $0.2 million). The fair value at vesting date of the restricted stock vested during the year ended December 31, 2015 for directors was $0.7 million.
269
Note 42 – Income taxes
The components of income tax (benefit) expense for the years ended December 31, are summarized in the following table.
| | | | | | | | | | | | |
(In thousands) | | 2015 | | | 2014 | | | 2013 | |
Current income tax expense: | | | | | | | | | | | | |
Puerto Rico | | $ | 16,675 | | | $ | 7,814 | | | $ | 27,118 | |
Federal and States | | | 7,281 | | | | 6,953 | | | | 10,309 | |
| | | | | | | | | | | | |
Subtotal | | | 23,956 | | | | 14,767 | | | | 37,427 | |
| | | | | | | | | | | | |
Deferred income tax expense (benefit): | | | | | | | | | | | | |
Puerto Rico | | | 63,808 | | | | 12,569 | | | | (90,796 | ) |
Federal and States | | | (582,936 | ) | | | 2,861 | | | | (491 | ) |
Valuation allowance - Initial recognition | | | — | | | | 8,034 | | | | — | |
Adjustment for enacted changes in income tax laws | | | — | | | | 20,048 | | | | (197,467 | ) |
| | | | | | | | | | | | |
Subtotal | | | (519,128 | ) | | | 43,512 | | | | (288,754 | ) |
| | | | | | | | | | | | |
Total income tax expense (benefit) | | $ | (495,172 | ) | | $ | 58,279 | | | $ | (251,327 | ) |
| | | | | | | | | | | | |
The reasons for the difference between the income tax (benefit) expense applicable to income before provision for income taxes and the amount computed by applying the statutory tax rate in Puerto Rico were as follows:
| | | | | | | | | | | | | | | | | | | | | | | | |
| | | 2015 | | | 2014 | | | 2013 | |
(In thousands) | | Amount | | | % of pre-tax
income | | | Amount | | | % of pre-tax
income | | | Amount | | | % of pre-tax
income | |
Computed income tax at statutory rates | | $ | 155,542 | | | | 39 | % | | $ | (51,570 | ) | | | 39 | % | | | 135,720 | | | | 39 | % |
Benefit of net tax exempt interest income | | | (51,812 | ) | | | (13 | ) | | | (55,862 | ) | | | 43 | | | | (36,993 | ) | | | (11 | ) |
Effect of income subject to preferential tax rate [1] | | | (10,010 | ) | | | (3 | ) | | | (21,909 | ) | | | 18 | | | | (137,793 | ) | | | (40 | ) |
Deferred tax asset valuation allowance | | | (586,159 | ) | | | (147 | ) | | | (4,281 | ) | | | 3 | | | | (32,990 | ) | | | (9 | ) |
Non-deductible expenses [2] | | | — | | | | — | | | | 178,219 | | | | (135 | ) | | | 32,115 | | | | 9 | |
Difference in tax rates due to multiple jurisdictions | | | (11,244 | ) | | | (3 | ) | | | (14,178 | ) | | | 10 | | | | (12,029 | ) | | | (3 | ) |
Initial adjustment in deferred tax due to change in tax rate | | | — | | | | — | | | | 20,048 | | | | (16 | ) | | | (197,467 | ) | | | (57 | ) |
Unrecognized tax benefits | | | — | | | | — | | | | (3,601 | ) | | | 3 | | | | (7,727 | ) | | | (2 | ) |
Others | | | 8,511 | | | | 2 | | | | 11,413 | | | | (9 | ) | | | 5,837 | | | | 2 | |
| | | | | | | | | | | | | | | | | | | | | | | | |
Income tax (benefit) expense | | $ | (495,172 | ) | | | (125 | )% | | $ | 58,279 | | | | (44 | )% | | $ | (251,327 | ) | | | (72 | )% |
| | | | | | | | | | | | | | | | | | | | | | | | |
| [1] | Includes the impact of the Closing Agreement with the P.R. Treasury signed in June 2014. |
| [2] | For the year ended December 31, 2014, includes approximately $161.5 million of amortization of the discount and deferred cost associated with the TARP funds, which are not deductible. |
The results for the year ended December 31, 2015, reflect a tax benefit of $589.0 million as a result of the partial reversal of the valuation allowance on the Corporation’s deferred tax asset from the U.S. operation as further explain below.
During the year ended December 31, 2014 the Corporation recognized an income tax expense of $20.0 million mainly related to the deferred tax liability associated with the portfolio acquired from Westernbank, as a result of the increase in the income tax for capital gains from 15% to 20%. Additionally, during the second quarter of 2014 the Corporation entered into a Closing Agreement with the Puerto Rico Department of the Treasury. The Agreement, among other matters, was related to the income tax treatment of certain
270
charge-offs related to the loans acquired from Westernbank as part of the FDIC assisted transaction in the year 2010. As a result of the Agreement, the Corporation recorded a tax benefit of $23.4 million due to a reduction in the deferred tax liability associated with Westernbank loan portfolio.
The results for the year ended December 31, 2013 reflect a tax benefit of $197.5 million and a corresponding increase in the net deferred tax asset of the Puerto Rico operations as a result of the increase in the statutory corporate income tax rate from 30% to 39% introduced as part of the amendments to the Puerto Rico Internal Revenue Code effective for taxable years beginning after December 31, 2012. In addition, during 2013 the Corporation recorded an income tax benefit due to the loss generated on the Puerto Rico operations by the sales of non-performing assets net of the gain realized on the sale of a portion of EVERTEC’s shares which was taxable at a preferential tax rate according to Act Number 73 of May 28, 2008 known as “Economic Incentives Act for the Development of Puerto Rico”
Deferred income taxes reflect the net tax effects of temporary differences between the carrying amounts of assets and liabilities for financial reporting purposes and their tax bases. Significant components of the Corporation’s deferred tax assets and liabilities at December 31 were as follows:
| | | | | | | | |
(In thousands) | | December 31, 2015 | | | December 31, 2014 | |
Deferred tax assets: | | | | | | | | |
Tax credits available for carryforward | | $ | 13,651 | | | $ | 12,056 | |
Net operating loss and other carryforward available | | | 1,262,197 | | | | 1,261,413 | |
Postretirement and pension benefits | | | 116,036 | | | | 110,794 | |
Deferred loan origination fees | | | 6,420 | | | | 7,720 | |
Allowance for loan losses | | | 670,592 | | | | 710,666 | |
Deferred gains | | | 5,966 | | | | 7,500 | |
Accelerated depreciation | | | 8,335 | | | | 7,915 | |
Intercompany deferred gains | | | 2,743 | | | | 2,988 | |
Difference in outside basis from pass-through entities | | | 12,684 | | | | 16,094 | |
Other temporary differences | | | 29,208 | | | | 30,667 | |
| | | | | | | | |
Total gross deferred tax assets | | | 2,127,832 | | | | 2,167,813 | |
| | | | | | | | |
Deferred tax liabilities: | | | | | | | | |
FDIC-assisted transaction | | | 90,778 | | | | 81,335 | |
Indefinite-lived intangibles | | | 63,573 | | | | 53,797 | |
Unrealized net gain on trading and available-for-sale securities | | | 22,281 | | | | 20,817 | |
Other temporary differences | | | 6,670 | | | | 20,223 | |
| | | | | | | | |
Total gross deferred tax liabilities | | | 183,302 | | | | 176,172 | |
| | | | | | | | |
Valuation allowance | | | 642,727 | | | | 1,212,748 | |
| | | | | | | | |
Net deferred tax asset | | $ | 1,301,803 | | | $ | 778,893 | |
| | | | | | | | |
The net deferred tax asset shown in the table above at December 31, 2015 is reflected in the consolidated statements of financial condition as $1.3 billion in net deferred tax assets (in the “other assets” caption) (2014 - $ 813 million in deferred tax asset in the “other assets” caption) and $649 thousand in deferred tax liabilities (in the “other liabilities” caption) (2014 - $34 million in deferred tax liabilities in the “other liabilities” caption), reflecting the aggregate deferred tax assets or liabilities of individual tax-paying subsidiaries of the Corporation.
271
Included as part of the other carryforwards available are $47.2 million related to contributions to Banco Popular de Puerto Rico qualified pension plan and $44.2 million of other net operating loss carryforwards (“NOLs”) primarily related to the loss on sale of non-performing assets that have no expiration date since they were realize through a single member limited liability company with partnership election. Additionally, the deferred tax asset related to the NOLs outstanding at December 31, 2015 expires as follows:
| | | | |
(In thousands) | | | |
2018 | | $ | 1,369 | |
2019 | | | 259 | |
2021 | | | 76 | |
2022 | | | 2,853 | |
2023 | | | 1,248 | |
2024 | | | 9,547 | |
2025 | | | 14,021 | |
2027 | | | 63,163 | |
2028 | | | 504,976 | |
2029 | | | 174,338 | |
2030 | | | 171,897 | |
2031 | | | 133,908 | |
2032 | | | 25,043 | |
2033 | | | 1,757 | |
2034 | | | 66,268 | |
| | | | |
| | $ | 1,170,723 | |
| | | | |
A deferred tax asset should be reduced by a valuation allowance if based on the weight of all available evidence, it is more likely than not (a likelihood of more than 50%) that some portion or the entire deferred tax asset will not be realized. The valuation allowance should be sufficient to reduce the deferred tax asset to the amount that is more likely than not to be realized. The determination of whether a deferred tax asset is realizable is based on weighting all available evidence, including both positive and negative evidence. The realization of deferred tax assets, including carryforwards and deductible temporary differences, depends upon the existence of sufficient taxable income of the same character during the carryback or carryforward period. The analysis considers all sources of taxable income available to realize the deferred tax asset, including the future reversal of existing taxable temporary differences, future taxable income exclusive of reversing temporary differences and carryforwards, taxable income in prior carryback years and tax-planning strategies.
During the year ended December 31, 2015, after weighting all positive and negative evidence, the Corporation concluded that it is more likely than not that a portion of the total deferred tax asset from the U.S. operations, amounting to $1.2 billion and comprised mainly of net operating losses, will be realized. The Corporation based this determination on its estimated earnings for the remaining carryforward period of eighteen years beginning with the 2016 fiscal year, available to utilize the deferred tax asset, to reduce its income tax obligations. The recent historical level of book income adjusted by permanent differences, together with the estimated earnings after the reorganization of the U.S. operations and additional estimated earnings from the Doral Bank Transaction were objective positive evidence considered by the Corporation. As of December 31, 2015 the U.S. operations are not in a three year loss cumulative position, taking into account taxable income exclusive of reversing temporary differences. All of these factor led management to conclude that it is more likely than not that a portion of the deferred tax asset from its U.S. operations will be realized. Accordingly, the Corporation recorded a partial reversal of the valuation allowance on the deferred tax asset from the U.S. operations amounting to $589.0 million. Management will continue to evaluate the realization of the deferred tax asset each quarter and adjust as any changes arises.
At December 31, 2015, the Corporation’s net deferred tax assets related to its Puerto Rico operations amounted to $752 million.
The Corporation’s Puerto Rico Banking operation is not in a cumulative loss position and has sustained profitability for the three year period ended December 31, 2015. This is considered a strong piece of objectively verifiable positive evidence that out weights any negative evidence considered by management in the evaluation of the realization of the deferred tax asset. Based on this evidence and management’s estimate of future taxable income, the Corporation has concluded that it is more likely than not that such net deferred tax asset of the Puerto Rico Banking operations will be realized.
272
After the payment of TARP, the interest expense that is paid on the newly issued $450 million subordinated notes which partially funded the repayment of TARP funds in 2014, bearing interest at 7%, is tax deductible contrary to the interest expense payable on the note issued to the U.S. Treasury under TARP. Based on this new fact pattern the Holding Company is expecting to have losses for income tax purposes exclusive of reversing temporary differences. Since as required by ASC 740 the historical information should be supplemented by all currently available information about future years, the expected losses in future years is considered by management a strong negative evidence that will suggest that income in future years will be insufficient to support the realization of all deferred tax asset. After weighting of all positive and negative evidence management concluded, as of the reporting date, that it is more likely than not that the Holding Company will not be able to realize any portion of the deferred tax assets, considering the criteria of ASC Topic 740. Accordingly, the Corporation has established a full a valuation allowance on the deferred tax asset of $30 million as of December 2015.
Under the Puerto Rico Internal Revenue Code, the Corporation and its subsidiaries are treated as separate taxable entities and are not entitled to file consolidated tax returns. The Code provides a dividends-received deduction of 100% on dividends received from “controlled” subsidiaries subject to taxation in Puerto Rico and 85% on dividends received from other taxable domestic corporations.
The Corporation’s subsidiaries in the United States file a consolidated federal income tax return. The intercompany settlement of taxes paid is based on tax sharing agreements which generally allocate taxes to each entity based on a separate return basis.
The following table presents a reconciliation of unrecognized tax benefits.
| | | | |
(In millions) | | | |
Balance at January 1, 2014 | | $ | 9.8 | |
Additions for tax positions related to 2014 | | | 1.1 | |
Reduction as a result of lapse of statute of limitations | | | (2.5 | ) |
Reduction for tax positions of prior years | | | (0.4 | ) |
| | | | |
Balance at December 31, 2014 | | $ | 8.0 | |
Additions for tax positions related to 2015 | | | 1.5 | |
Reduction as a result of settlements | | | (0.5 | ) |
| | | | |
Balance at December 31, 2015 | | $ | 9.0 | |
| | | | |
At December 31, 2015, the total amount of interest recognized in the statement of financial condition approximated $3.2 million (2014 - $3.1 million). The total interest expense recognized during 2015 was $57 thousand (2014 - $540 thousand). Management determined that, as of December 31, 2015 and 2014, there was no need to accrue for the payment of penalties. The Corporation’s policy is to report interest related to unrecognized tax benefits in income tax expense, while the penalties, if any, are reported in other operating expenses in the consolidated statements of operations.
After consideration of the effect on U.S. federal tax of unrecognized U.S. state tax benefits, the total amount of unrecognized tax benefits, including U.S. and Puerto Rico that, if recognized, would affect the Corporation’s effective tax rate, was approximately $11.2 million at December 31, 2015 (2014 - $9.8 million).
The amount of unrecognized tax benefits may increase or decrease in the future for various reasons including adding amounts for current tax year positions, expiration of open income tax returns due to the statute of limitations, changes in management’s judgment about the level of uncertainty, status of examinations, litigation and legislative activity, and the addition or elimination of uncertain tax positions.
The Corporation and its subsidiaries file income tax returns in Puerto Rico, the U.S. federal jurisdiction, various U.S. states and political subdivisions, and foreign jurisdictions. As of December 31, 2015, the following years remain subject to examination: U.S. Federal jurisdiction – 2012 through 2015 and Puerto Rico – 2010 through 2015. The Corporation anticipates a reduction in the total amount of unrecognized tax benefits within the next 12 months, which could amount to approximately $2.8 million.
273
Note 43 – Supplemental disclosure on the consolidated statements of cash flows
Additional disclosures on cash flow information and non-cash activities for the years ended December 31, 2015, 2014 and 2013 are listed in the following table:
| | | | | | | | | | | | |
(In thousands) | | 2015 | | | 2014 | | | 2013 | |
| | | |
Income taxes paid | | $ | 7,152 | | | $ | 54,520 | | | $ | 51,047 | |
Interest paid | | | 193,503 | | | | 696,631 | | | | 318,342 | |
Non-cash activities: | | | | | | | | | | | | |
Loans transferred to other real estate | | $ | 136,368 | | | $ | 154,358 | | | $ | 228,009 | |
Loans transferred to other property | | | 36,106 | | | | 38,958 | | | | 33,997 | |
| | | | | | | | | | | | |
Total loans transferred to foreclosed assets | | | 172,474 | | | | 193,316 | | | | 262,006 | |
Transfers from loans held-in-portfolio to loans held-for-sale | | | 65,063 | | | | 2,161,669 | | | | 448,143 | |
Transfers from loans held-for-sale to loans held-in-portfolio | | | 17,065 | | | | 41,293 | | | | 27,016 | |
Transfers from trading securities to available-for-sale securities | | | 63,645 | | | | — | | | | — | |
Loans securitized into investment securities[1] | | | 1,088,121 | | | | 899,604 | | | | 1,391,594 | |
Trades receivables from brokers and counterparties | | | 78,759 | | | | 66,949 | | | | 71,680 | |
Trades payable to brokers and counterparties | | | 6,150 | | | | 2,000 | | | | 3,576 | |
Recognition of mortgage servicing rights on securitizations or asset transfers | | | 13,460 | | | | 12,583 | | | | 19,262 | |
Loans sold to a joint venture in exchange for an acquisition loan and an equity interest in the joint venture | | | — | | | | — | | | | 194,514 | |
| [1] | Includes loans securitized into trading securities and subsequently sold before year end. |
As previously disclosed in Note 5, Business Combination, on February 27, 2015, the Corporation’s Puerto Rico banking subsidiary, BPPR, in an alliance with co-bidders, including the Corporation’s U.S. mainland banking subsidiary, BPNA, acquired certain assets and all deposits (other than certain brokered deposits) of Doral Bank from the FDIC as receiver. As part of this transaction, BPPR received net cash proceeds of approximately $ 731 million for consideration of the assets and liabilities acquired.
During the year ended December 31, 2014 BPNA completed the sale of its Illinois, Central Florida and California regional operations. As part of these transactions, BPNA made a net cash disbursement of $206.0 million for consideration of the assets and liabilities sold, as follows:
| | | | |
(In thousands) | | December 31, 2014 | |
Loans held-for-sale | | $ | 1,739,101 | |
Premises and equipment, net | | | 16,223 | |
Other assets | | | 16,853 | |
Deposits | | | (2,009,816 | ) |
Other liabilities | | | (6,611 | ) |
| | | | |
Net liabilities sold | | $ | (244,250 | ) |
| | | | |
274
Note 44 – Segment reporting
The Corporation’s corporate structure consists of two reportable segments – Banco Popular de Puerto Rico and Banco Popular North America. These reportable segments pertain only to the continuing operations of Popular, Inc. As previously indicated in Note 4 to the consolidated financial statements, the regional operations in California, Illinois and Central Florida were classified as discontinued operations and sold during 2014.
As indicated in Note 5 to the consolidated financial statements, Business Combination, on February 27, 2015, Banco Popular de Puerto Rico, in an alliance with co-bidders, including BPNA, acquired certain assets and all deposits of Doral Bank from the FDIC as receiver. The financial results for the year ended on December 31, 2015 of both reportable segments include the results from the operations acquired as part of the Doral Bank Transaction.
Management determined the reportable segments based on the internal reporting used to evaluate performance and to assess where to allocate resources. The segments were determined based on the organizational structure, which focuses primarily on the markets the segments serve, as well as on the products and services offered by the segments.
Banco Popular de Puerto Rico:
Given that Banco Popular de Puerto Rico constitutes a significant portion of the Corporation’s results of operations and total assets at December 31, 2015, additional disclosures are provided for the business areas included in this reportable segment, as described below:
| | • | | Commercial banking represents the Corporation’s banking operations conducted at BPPR, which are targeted mainly to corporate, small and middle size businesses. It includes aspects of the lending and depository businesses, as well as other finance and advisory services. BPPR allocates funds across business areas based on duration matched transfer pricing at market rates. This area also incorporates income related with the investment of excess funds, as well as a proportionate share of the investment function of BPPR. |
| | • | | Consumer and retail banking represents the branch banking operations of BPPR which focus on retail clients. It includes the consumer lending business operations of BPPR, as well as the lending operations of Popular Auto and Popular Mortgage. Popular Auto focuses on auto and lease financing, while Popular Mortgage focuses principally on residential mortgage loan originations. The consumer and retail banking area also incorporates income related with the investment of excess funds from the branch network, as well as a proportionate share of the investment function of BPPR. |
| | • | | Other financial services include the trust and asset management service units of BPPR, the brokerage and investment banking operations of Popular Securities, and the insurance agency and reinsurance businesses of Popular Insurance, Popular Insurance V.I., Popular Risk Services, and Popular Life Re. Most of the services that are provided by these subsidiaries generate profits based on fee income. |
Banco Popular North America:
Banco Popular North America’s reportable segment consists of the banking operations of BPNA, E-LOAN, Popular Equipment Finance, Inc. and Popular Insurance Agency, U.S.A. BPNA operates through a retail branch network in the U.S. mainland under the name of Popular Community Bank, while E-LOAN supports BPNA’s deposit gathering through its online platform. All direct lending activities at E-LOAN were ceased during the fourth quarter of 2008. During the third quarter of 2015, BPNA and E-LOAN completed an asset purchase and sale transaction in which E-LOAN sold to BPNA all of its outstanding loan portfolio, including residential mortgage loans and home equity lines of credit, which had a carrying value of approximately $213 million. Prior to this transaction, the Corporation provided additional disclosures for the BPNA reportable segment related to E-LOAN. After the close of the above mentioned asset purchase and sale transaction, additional disclosures with respect to E-LOAN are no longer considered relevant to the financial statements and accordingly are not presented. Popular Equipment Finance, Inc. also holds a running-off loan portfolio as this subsidiary ceased originating loans during 2009. Popular Insurance Agency, U.S.A. offers investment and insurance services across the BPNA branch network.
The Corporate group consists primarily of the holding companies: Popular, Inc., Popular North America, Popular International Bank and certain of the Corporation’s investments accounted for under the equity method, including EVERTEC and Centro Financiero BHD, S.A. The Corporate group also includes the expenses of certain corporate areas that are identified as critical to the organization: Finance, Risk Management and Legal.
275
The accounting policies of the individual operating segments are the same as those of the Corporation. Transactions between reportable segments are primarily conducted at market rates, resulting in profits that are eliminated for reporting consolidated results of operations.
The tables that follow present the results of operations and total assets by reportable segments:
| | | | | | | | | | | | |
December 31, 2015 | |
(In thousands) | | Banco Popular
de Puerto Rico | | | Banco Popular
North America | | | Intersegment
Eliminations | |
Net interest income | | $ | 1,231,585 | | | $ | 239,379 | | | $ | — | |
Provision for loan losses | | | 240,817 | | | | 626 | | | | — | |
Non-interest income | | | 464,786 | | | | 22,667 | | | | 125 | |
Amortization of intangibles | | | 10,465 | | | | 554 | | | | — | |
Depreciation expense | | | 40,440 | | | | 6,272 | | | | — | |
Other operating expenses | | | 970,201 | | | | 188,102 | | | | — | |
Income tax expense (benefit) | | | 116,058 | | | | (580,738 | ) | | | — | |
| | | | | | | | | | | | |
Net income | | $ | 318,390 | | | $ | 647,230 | | | $ | 125 | |
| | | | | | | | | | | | |
Segment assets | | $ | 27,907,350 | | | $ | 7,780,002 | | | $ | (129,038 | ) |
| | | | | | | | | | | | |
| | | | | | | | | | | | |
| | | | | | | | | | | | | | | | |
December 31, 2015 | |
(In thousands) | | Reportable
Segments | | | Corporate | | | Eliminations | | | Total Popular, Inc. | |
Net interest income (expense) | | $ | 1,470,964 | | | $ | (61,981 | ) | | $ | — | | | $ | 1,408,983 | |
Provision for loan losses | | | 241,443 | | | | 35 | | | | — | | | | 241,478 | |
Non-interest income | | | 487,578 | | | | 34,486 | | | | (2,523 | ) | | | 519,541 | |
Amortization of intangibles | | | 11,019 | | | | — | | | | — | | | | 11,019 | |
Depreciation expense | | | 46,712 | | | | 762 | | | | — | | | | 47,474 | |
Other operating expenses | | | 1,158,303 | | | | 74,212 | | | | (2,787 | ) | | | 1,229,728 | |
Income tax benefit | | | (464,680 | ) | | | (30,595 | ) | | | 103 | | | | (495,172 | ) |
| | | | | | | | | | | | | | | | |
Net income (loss) | | $ | 965,745 | | | $ | (71,909 | ) | | $ | 161 | | | $ | 893,997 | |
| | | | | | | | | | | | | | | | |
Segment assets | | $ | 35,558,314 | | | $ | 4,953,505 | | | | (4,742,285 | ) | | $ | 35,769,534 | |
| | | | | | | | | | | | | | | | |
| | | | | | | | | | | | |
December 31, 2014 | |
(In thousands) | | Banco Popular
de Puerto Rico | | | Banco Popular
North America | | | Intersegment
Eliminations | |
Net interest income | | $ | 1,288,889 | | | $ | 157,701 | | | $ | — | |
Provision (reversal of provision) for loan losses | | | 289,184 | | | | (18,850 | ) | | | — | |
Non-interest income | | | 283,251 | | | | 64,319 | | | | — | |
Amortization of intangibles | | | 7,351 | | | | 809 | | | | — | |
Depreciation expense | | | 39,062 | | | | 6,617 | | | | — | |
Loss on early extinguishment of debt | | | — | | | | 532 | | | | — | |
Other operating expenses | | | 884,289 | | | | 184,369 | | | | — | |
Income tax expense | | | 77,973 | | | | 3,101 | | | | — | |
| | | | | | | | | | | | |
Net income | | $ | 274,281 | | | $ | 45,442 | | | $ | — | |
| | | | | | | | | | | | |
Segment assets | | | 27,384,169 | | | | 5,503,433 | | | | (17,972 | ) |
| | | | | | | | | | | | |
276
| | | | | | | | | | | | | | | | |
December 31, 2014 | |
(In thousands) | | Reportable
Segments | | | Corporate | | | Eliminations | | | Total Popular,
Inc. | |
Net interest income (expense) | | $ | 1,446,590 | | | $ | (501,518 | ) | | $ | — | | | $ | 945,072 | |
Provision (reversal of provision) for loan losses | | | 270,334 | | | | (200 | ) | | | — | | | | 270,134 | |
Non-interest income | | | 347,570 | | | | 41,695 | | | | (2,750 | ) | | | 386,515 | |
Amortization of intangibles | | | 8,160 | | | | — | | | | — | | | | 8,160 | |
Depreciation expense | | | 45,679 | | | | 648 | | | | — | | | | 46,327 | |
Loss on early extinguishment of debt | | | 532 | | | | — | | | | — | | | | 532 | |
Other operating expenses | | | 1,068,658 | | | | 72,759 | | | | (2,752 | ) | | | 1,138,665 | |
Income tax expense (benefit) | | | 81,074 | | | | (22,796 | ) | | | 1 | | | | 58,279 | |
| | | | | | | | | | | | | | | | |
Net income (loss) | | $ | 319,723 | | | $ | (510,234 | ) | | $ | 1 | | | $ | (190,510 | ) |
| | | | | | | | | | | | | | | | |
Segment assets | | | 32,869,630 | | | | 4,937,372 | | | | (4,710,307 | ) | | | 33,096,695 | |
| | | | | | | | | | | | | | | | |
| | | | | | | | | | | | |
December 31, 2013 | |
(In thousands) | | Banco Popular
de Puerto Rico | | | Banco Popular
North America | | | Intersegment
Eliminations | |
Net interest income | | $ | 1,260,537 | | | $ | 192,265 | | | $ | — | |
Provision (reversal of provision) for loan losses | | | 616,883 | | | | (11,175 | ) | | | — | |
Non-interest income | | | 281,894 | | | | 36,252 | | | | — | |
Amortization of intangibles | | | 7,162 | | | | 809 | | | | — | |
Depreciation expense | | | 38,282 | | | | 6,839 | | | | — | |
Other operating expenses | | | 943,444 | | | | 153,207 | | | | — | |
Income tax (benefit) expense | | | (236,898 | ) | | | 2,795 | | | | — | |
| | | | | | | | | | | | |
Net income | | $ | 173,558 | | | $ | 76,042 | | | $ | — | |
| | | | | | | | | | | | |
Segment assets | | $ | 26,883,073 | | | $ | 8,724,784 | | | $ | (24,609 | ) |
| | | | | | | | | | | | |
| | | | | | | | | | | | |
| | | | | | | | | | | | | | | | |
December 31, 2013 | |
(In thousands) | | Reportable
Segments | | | Corporate | | | Eliminations | | | Total Popular, Inc. | |
Net interest income (expense) | | $ | 1,452,802 | | | $ | (108,228 | ) | | $ | — | | | $ | 1,344,574 | |
Provision for loan losses | | | 605,708 | | | | 398 | | | | — | | | | 606,106 | |
Non-interest income | | | 318,146 | | | | 475,663 | | | | (2,796 | ) | | | 791,013 | |
Amortization of intangibles | | | 7,971 | | | | — | | | | — | | | | 7,971 | |
Depreciation expense | | | 45,121 | | | | 643 | | | | — | | | | 45,764 | |
Loss on early extinguishment of debt | | | — | | | | 3,388 | | | | — | | | | 3,388 | |
Other operating expenses | | | 1,096,651 | | | | 70,997 | | | | (2,781 | ) | | | 1,164,867 | |
Income tax benefit | | | (234,103 | ) | | | (17,082 | ) | | | (142 | ) | | | (251,327 | ) |
| | | | | | | | | | | | | | | | |
Net income | | $ | 249,600 | | | $ | 309,091 | | | $ | 127 | | | $ | 558,818 | |
| | | | | | | | | | | | | | | | |
Segment assets | | $ | 35,583,248 | | | $ | 5,495,498 | | | $ | (5,329,413 | ) | | $ | 35,749,333 | |
| | | | | | | | | | | | | | | | |
277
Additional disclosures with respect to the Banco Popular de Puerto Rico reportable segment are as follows:
| | | | | | | | | | | | | | | | | | | | |
| | | December 31, 2015 | | | | | | | |
| | | Banco Popular de Puerto Rico | | | | | | | |
| | | | | | Consumer | | | Other | | | | | | Total Banco | |
| | | Commercial | | | and Retail | | | Financial | | | | | | Popular de | |
(In thousands) | | Banking | | | Banking | | | Services | | | Eliminations | | | Puerto Rico | |
Net interest income | | $ | 463,681 | | | $ | 753,595 | | | $ | 7,793 | | | $ | 6,516 | | | $ | 1,231,585 | |
Provision for loan losses | | | 101,826 | | | | 138,991 | | | | — | | | | — | | | | 240,817 | |
Non-interest income | | | 110,684 | | | | 251,037 | | | | 103,464 | | | | (399 | ) | | | 464,786 | |
Amortization of intangibles | | | 7 | | | | 7,330 | | | | 3,128 | | | | — | | | | 10,465 | |
Depreciation expense | | | 16,936 | | | | 22,433 | | | | 1,071 | | | | — | | | | 40,440 | |
Other operating expenses | | | 278,847 | | | | 621,121 | | | | 70,632 | | | | (399 | ) | | | 970,201 | |
Income tax expense | | | 48,793 | | | | 55,429 | | | | 11,836 | | | | — | | | | 116,058 | |
| | | | | | | | | | | | | | | | | | | | |
Net income | | $ | 127,956 | | | $ | 159,328 | | | $ | 24,590 | | | $ | 6,516 | | | $ | 318,390 | |
| | | | | | | | | | | | | | | | | | | | |
Segment assets | | $ | 9,235,675 | | | $ | 18,595,789 | | | $ | 392,658 | | | $ | (316,772 | ) | | $ | 27,907,350 | |
| | | | | | | | | | | | | | | | | | | | |
| | | |
| | | December 31, 2014 | | | | | | | |
| | | Banco Popular de Puerto Rico | | | | | | | |
| | | | | | Consumer | | | Other | | | | | | Total Banco | |
| | | Commercial | | | and Retail | | | Financial | | | | | | Popular de | |
(In thousands) | | Banking | | | Banking | | | Services | | | Eliminations | | | Puerto Rico | |
Net interest income | | $ | 521,957 | | | $ | 757,721 | | | $ | 9,207 | | | $ | 4 | | | $ | 1,288,889 | |
Provision for loan losses | | | 138,213 | | | | 150,971 | | | | — | | | | — | | | | 289,184 | |
Non-interest income | | | 3,534 | | | | 181,117 | | | | 98,794 | | | | (194 | ) | | | 283,251 | |
Amortization of intangibles | | | 4 | | | | 6,836 | | | | 511 | | | | — | | | | 7,351 | |
Depreciation expense | | | 16,407 | | | | 21,551 | | | | 1,104 | | | | — | | | | 39,062 | |
Other operating expenses | | | 254,146 | | | | 562,345 | | | | 67,992 | | | | (194 | ) | | | 884,289 | |
Income tax expense | | | 22,899 | | | | 38,825 | | | | 16,249 | | | | — | | | | 77,973 | |
| | | | | | | | | | | | | | | | | | | | |
Net income | | $ | 93,822 | | | $ | 158,310 | | | $ | 22,145 | | | $ | 4 | | | $ | 274,281 | |
| | | | | | | | | | | | | | | | | | | | |
Segment assets | | $ | 10,267,633 | | | $ | 18,895,974 | | | $ | 591,955 | | | $ | (2,371,393 | ) | | $ | 27,384,169 | |
| | | | | | | | | | | | | | | | | | | | |
| | | |
| | | December 31, 2013 | | | | | | | |
| | | Banco Popular de Puerto Rico | | | | | | | |
| | | | | | Consumer | | | Other | | | | | | Total Banco | |
| | | Commercial | | | and Retail | | | Financial | | | | | | Popular de | |
(In thousands) | | Banking | | | Banking | | | Services | | | Eliminations | | | Puerto Rico | |
Net interest income | | $ | 493,836 | | | $ | 757,039 | | | $ | 9,662 | | | $ | — | | | $ | 1,260,537 | |
Provision for loan losses | | | 180,228 | | | | 436,655 | | | | — | | | | — | | | | 616,883 | |
Non-interest (expense) income | | | (41,362 | ) | | | 224,080 | | | | 99,243 | | | | (67 | ) | | | 281,894 | |
Amortization of intangibles | | | 4 | | | | 6,837 | | | | 321 | | | | — | | | | 7,162 | |
Depreciation expense | | | 16,083 | | | | 20,981 | | | | 1,218 | | | | — | | | | 38,282 | |
Other operating expenses | | | 296,319 | | | | 578,903 | | | | 68,289 | | | | (67 | ) | | | 943,444 | |
Income tax (benefit) expense | | | (66,747 | ) | | | (182,471 | ) | | | 12,320 | | | | — | | | | (236,898 | ) |
| | | | | | | | | | | | | | | | | | | | |
Net income | | $ | 26,587 | | | $ | 120,214 | | | $ | 26,757 | | | $ | — | | | $ | 173,558 | |
| | | | | | | | | | | | | | | | | | | | |
Segment assets | | $ | 10,803,992 | | | $ | 18,083,293 | | | $ | 576,299 | | | $ | (2,580,511 | ) | | $ | 26,883,073 | |
| | | | | | | | | | | | | | | | | | | | |
278
Geographic Information
| | | | | | | | | | | | |
(In thousands) | | 2015 | | | 2014 | | | 2013 | |
Revenues:[1] | | | | | | | | | | | | |
Puerto Rico | | $ | 1,598,066 | | | $ | 1,024,416 | | | $ | 1,838,657 | |
United States | | | 255,714 | | | | 223,264 | | | | 218,295 | |
Other | | | 74,744 | | | | 83,907 | | | | 78,635 | |
| | | | | | | | | | | | |
Total consolidated revenues | | $ | 1,928,524 | | | $ | 1,331,587 | | | $ | 2,135,587 | |
| | | | | | | | | | | | |
| [1] | Total revenues include net interest income (expense), service charges on deposit accounts, other service fees, mortgage banking activities, net gain (loss) and valuation adjustments on investment securities, trading account (loss) profit, net (loss) gain on sale of loans and valuation adjustments on loans held-for-sale, adjustments to indemnity reserves on loans sold, FDIC loss share (expense) income and other operating income. |
Selected Balance Sheet Information
| | | | | | | | | | | | |
(In thousands) | | 2015 | | | 2014 | | | 2013 | |
Puerto Rico | | | | | | | | | | | | |
Total assets | | $ | 26,771,985 | | | $ | 26,276,561 | | | $ | 25,714,758 | |
Loans | | | 17,477,070 | | | | 17,704,170 | | | | 18,107,764 | |
Deposits | | | 20,893,232 | | | | 20,365,445 | | | | 19,730,408 | |
United States | | | | | | | | | | | | |
Total assets | | $ | 7,859,217 | | | $ | 5,689,604 | | | $ | 8,897,535 | |
Loans | | | 4,873,504 | | | | 3,568,564 | | | | 5,839,115 | |
Deposits | | | 5,288,886 | | | | 3,442,084 | | | | 6,007,159 | |
Other | | | | | | | | | | | | |
Total assets | | $ | 1,138,332 | | | $ | 1,130,530 | | | $ | 1,137,040 | |
Loans | | | 778,656 | | | | 780,483 | | | | 759,840 | |
Deposits[1] | | | 1,027,605 | | | | 1,000,006 | | | | 973,578 | |
| [1] | Represents deposits from BPPR operations located in the U.S. and British Virgin Islands. |
Note 45 - Popular, Inc. (holding company only) financial information
The following condensed financial information presents the financial position of Popular, Inc. Holding Company only at December 31, 2015 and 2014, and the results of its operations and cash flows for each of the three years in the period ended December 31, 2015.
279
Condensed Statements of Condition
| | | | | | | | |
| | | December 31, | |
(In thousands) | | 2015 | | | 2014 | |
ASSETS | | | | | | | | |
Cash and due from banks (includes $24,124 due from bank subsidiary (2014 - $20,269)) | | $ | 24,298 | | | $ | 20,448 | |
Money market investments | | | 262,204 | | | | 19,747 | |
Trading account securities | | | 2,020 | | | | 1,640 | |
Investment securities available-for-sale, at fair value | | | 216 | | | | 231 | |
Other investment securities, at lower of cost or realizable value (includes $8,725 in common securities from statutory trusts (2014 - $8,725))[1] | | | 9,850 | | | | 9,850 | |
Investment in BPPR and subsidiaries, at equity | | | 3,598,393 | | | | 3,389,529 | |
Investment in Popular North America and subsidiaries, at equity | | | 1,687,104 | | | | 1,221,670 | |
Investment in other non-bank subsidiaries, at equity | | | 253,828 | | | | 267,667 | |
Advances to subsidiaries | | | — | | | | 53,769 | |
Other loans | | | 1,176 | | | | 1,717 | |
Less - Allowance for loan losses | | | 3 | | | | 41 | |
Premises and equipment | | | 2,823 | | | | 2,512 | |
Investment in equity method investees | | | 45,262 | | | | 47,837 | |
Other assets (includes $1,667 due from subsidiaries and affiliate (2014 - $867)) | | | 18,113 | | | | 20,845 | |
| | | | | | | | |
Total assets | | $ | 5,905,284 | | | $ | 5,057,421 | |
| | | | | | | | |
| | |
LIABILITIES AND STOCKHOLDERS’ EQUITY | | | | | | | | |
Notes payable | | $ | 740,812 | | | $ | 740,812 | |
Other liabilities (includes $1,133 due to subsidiaries and affiliate (2014 - $4,583)) | | | 59,148 | | | | 49,226 | |
Stockholders’ equity | | | 5,105,324 | | | | 4,267,383 | |
| | | | | | | | |
Total liabilities and stockholders’ equity | | $ | 5,905,284 | | | $ | 5,057,421 | |
| | | | | | | | |
| [1] | Refer to Note 25 to the consolidated financial statements for information on the statutory trusts. |
280
Condensed Statements of Operations
| | | | | | | | | | | | |
| | | Years ended December 31, | |
(In thousands) | | 2015 | | | 2014 | | | 2013 | |
Income: | | | | | | | | | | | | |
Dividends from subsidiaries | | $ | 41,350 | | | $ | — | | | $ | 37,000 | |
Interest income (includes $1,188 due from subsidiaries and affiliates (2014 - $1,829; 2013 - $17,551)) | | | 1,332 | | | | 1,931 | | | | 17,793 | |
Earnings from investments in equity method investees | | | 13,710 | | | | 12,291 | | | | 17,308 | |
Other operating income | | | — | | | | — | | | | 425,968 | |
Gain on sale and valuation adjustment of investment securities | | | — | | | | — | | | | 7,966 | |
Trading account (loss) profit | | | (187 | ) | | | (40 | ) | | | 161 | |
| | | | | | | | | | | | |
Total income | | | 56,205 | | | | 14,182 | | | | 506,196 | |
| | | | | | | | | | | | |
Expenses: | | | | | | | | | | | | |
Interest expense | | | 52,470 | | | | 492,657 | | | | 101,245 | |
Provision (reversal of provision) for loan losses | | | 35 | | | | (200 | ) | | | 398 | |
Operating expenses (includes expenses for services provided by subsidiaries and affiliate of $7,309 (2014 - $6,882 ; 2013 - $8,412)), net of reimbursement by subsidiaries for services provided by parent of $74,799 (2014 - $67,021 ; 2013 - $60,402) | | | (1,293 | ) | | | 1,633 | | | | 700 | |
| | | | | | | | | | | | |
Total expenses | | | 51,212 | | | | 494,090 | | | | 102,343 | |
| | | | | | | | | | | | |
Income (loss) before income taxes and equity in undistributed earnings of subsidiaries | | | 4,993 | | | | (479,908 | ) | | | 403,853 | |
Income tax (benefit) expense | | | (186 | ) | | | 5,580 | | | | 1,412 | |
| | | | | | | | | | | | |
Income (loss) before equity in undistributed earnings of subsidiaries | | | 5,179 | | | | (485,488 | ) | | | 402,441 | |
Equity in undistributed earnings of subsidiaries | | | 888,818 | | | | 294,978 | | | | 156,377 | |
| | | | | | | | | | | | |
Income (loss) from continuing operations | | | 893,997 | | | | (190,510 | ) | | | 558,818 | |
Equity in undistributed earnings (losses) of discontinued operations | | | 1,347 | | | | (122,980 | ) | | | 40,509 | |
| | | | | | | | | | | | |
Net income (loss) | | $ | 895,344 | | | $ | (313,490 | ) | | $ | 599,327 | |
| | | | | | | | | | | | |
Comprehensive income (loss), net of tax | | $ | 868,330 | | | $ | (354,617 | ) | | $ | 513,450 | |
| | | | | | | | | | | | |
281
Condensed Statements of Cash Flows
| | | | | | | | | | | | |
| | | Years ended December 31, | |
(In thousands) | | 2015 | | | 2014 | | | 2013 | |
Cash flows from operating activities: | | | | | | | | | | | | |
Net income (loss) | | $ | 895,344 | | | $ | (313,490 | ) | | $ | 599,327 | |
| | | | | | | | | | | | |
Adjustments to reconcile net income (loss) to net cash used in operating activities: | | | | | | | | | | | | |
Equity in undistributed earnings of subsidiaries and dividends from subsidiaries | | | (890,165 | ) | | | (171,998 | ) | | | (196,886 | ) |
Provision (reversal) for loan losses | | | 35 | | | | (200 | ) | | | 398 | |
Net accretion of discounts and amortization of premiums and deferred fees | | | 2 | | | | 404,461 | | | | 30,467 | |
Earnings from investments under the equity method | | | (13,710 | ) | | | (12,291 | ) | | | (17,308 | ) |
Deferred income tax (benefit) expense | | | (186 | ) | | | 8,203 | | | | (10,937 | ) |
(Gain) loss on: | | | | | | | | | | | | |
Sale and valuation adjustments of investment securities | | | — | | | | — | | | | (2,110 | ) |
Sale of stock in equity method investee | | | — | | | | — | | | | (416,113 | ) |
Net (increase) decrease in: | | | | | | | | | | | | |
Trading securities | | | (380 | ) | | | (288 | ) | | | (94 | ) |
Other assets | | | 8,781 | | | | 4,736 | | | | 7,747 | |
Net increase (decrease) in: | | | | | | | | | | | | |
Interest payable | | | — | | | | 7,066 | | | | 2,704 | |
Other liabilities | | | (5,622 | ) | | | (180 | ) | | | (5,507 | ) |
| | | | | | | | | | | | |
Total adjustments | | | (901,245 | ) | | | 239,509 | | | | (607,639 | ) |
| | | | | | | | | | | | |
Net cash used in operating activities | | | (5,901 | ) | | | (73,981 | ) | | | (8,312 | ) |
| | | | | | | | | | | | |
Cash flows from investing activities: | | | | | | | | | | | | |
Net increase in money market investments | | | (242,457 | ) | | | (1,026 | ) | | | (147 | ) |
Proceeds from calls, paydowns, maturities and redemptions of investment securities: | | | | | | | | | | | | |
Available-for-sale | | | — | | | | — | | | | 35,000 | |
Other | | | — | | | | 1,000 | | | | — | |
Proceeds from sale of investment securities: | | | | | | | | | | | | |
Available-for-sale | | | — | | | | — | | | | 5,438 | |
Capital contribution to subsidiaries | | | — | | | | (100,000 | ) | | | (272,500 | ) |
Net decrease (increase) in advances to subsidiaries and affiliates | | | 53,769 | | | | 465,731 | | | | (234,014 | ) |
Net (originations) repayments on other loans | | | 24 | | | | (279 | ) | | | 269 | |
Return of capital from equity method investments | | | 11,500 | | | | — | | | | — | |
Return of capital from wholly owned subsidiaries | | | 203,000 | | | | 210,000 | | | | — | |
Proceeds from sale of stock in equity method investee | | | — | | | | — | | | | 481,377 | |
Acquisition of premises and equipment | | | (1,079 | ) | | | (1,075 | ) | | | (352 | ) |
Proceeds from sale of: | | | | | | | | | | | | |
Premises and equipment | | | 9 | | | | 48 | | | | 33 | |
| | | | | | | | | | | | |
Net cash provided by investing activities | | | 24,766 | | | | 574,399 | | | | 15,104 | |
| | | | | | | | | | | | |
Cash flows from financing activities: | | | | | | | | | | | | |
Payments of notes payable and subordinated notes | | | — | | | | (936,000 | ) | | | — | |
Proceeds from issuance of notes payable | | | — | | | | 450,000 | | | | — | |
Proceeds from issuance of common stock | | | 6,226 | | | | 5,394 | | | | 6,860 | |
Dividends paid | | | (19,257 | ) | | | (3,723 | ) | | | (3,723 | ) |
Repurchase of TARP-related warrants | | | — | | | | (3,000 | ) | | | — | |
Net payments for repurchase of common stock | | | (1,984 | ) | | | (3,236 | ) | | | (437 | ) |
| | | | | | | | | | | | |
Net cash (used in) provided by financing activities | | | (15,015 | ) | | | (490,565 | ) | | | 2,700 | |
| | | | | | | | | | | | |
Net increase in cash and due from banks | | | 3,850 | | | | 9,853 | | | | 9,492 | |
Cash and due from banks at beginning of period | | | 20,448 | | | | 10,595 | | | | 1,103 | |
| | | | | | | | | | | | |
Cash and due from banks at end of period | | $ | 24,298 | | | $ | 20,448 | | | $ | 10,595 | |
| | | | | | | | | | | | |
Popular, Inc. (parent company only) received dividend distributions from its direct equity method investees amounting to $4.7 million for the year ended December 31, 2015 (2014 - $4.7 million).
282
Notes payable include junior subordinated debentures issued by the Corporation that are associated to capital securities issued by the Popular Capital Trust I, Popular Capital Trust II and Popular Capital Trust III and medium-term notes. Refer to Note 25 for a description of significant provisions related to these junior subordinated debentures. The following table presents the aggregate amounts by contractual maturities of notes payable at December 31, 2015:
| | | | |
Year | | (In thousands) | |
2016 | | $ | — | |
2017 | | | — | |
2018 | | | — | |
2019 | | | 450,000 | |
2020 | | | — | |
Later years | | | 290,812 | |
No stated maturity | | | — | |
| | | | |
Total | | $ | 740,812 | |
| | | | |
283
Note 46 – Condensed consolidating financial information of guarantor and issuers of registered guaranteed securities
The following condensed consolidating financial information presents the financial position of Popular, Inc. Holding Company (“PIHC”) (parent only), Popular North America, Inc. (“PNA”) and all other subsidiaries of the Corporation at December 31, 2015 and 2014, and the results of their operations and cash flows for periods ended December 31, 2015, 2014 and 2013.
PNA is an operating, wholly-owned subsidiary of PIHC and is the holding company of its wholly-owned subsidiaries: Equity One, Inc. and Banco Popular North America (“BPNA”), including BPNA’s wholly-owned subsidiaries Popular Equipment Finance, Inc., Popular Insurance Agency, U.S.A., and E-LOAN, Inc.
PIHC fully and unconditionally guarantees all registered debt securities issued by PNA.
On October 20, 2014, the Memorandum of Understanding (the “FRB-NY MOU”) entered into on July 20, 2011 among Popular, BPPR, the Federal Reserve Bank of New York (the ”FRB-NY”) and the Office of the Commissioner of Financial Institutions of Puerto Rico was terminated. The FRB-NY MOU provided, among other things, for the Corporation to take steps to improve its credit risk management practices and asset quality, and for the Corporation to develop strategic plans to improve earnings and to develop capital plans. The FRB-NY MOU also required the Corporation to obtain approval from the applicable FRB-NY MOU counterparties prior to, among other things, declaring or paying dividends, purchasing or redeeming any shares of its stock, consummating acquisitions or mergers, or making any distributions on its trust preferred securities or subordinated debentures. At December 31, 2015, BPPR could have declared a dividend of approximately $525 million (December 31, 2014 - $542 million).
On January 9, 2015, another Memorandum of Understanding entered into in July 2011 among BPNA, the FRB-NY and the NYSDFS, was also terminated. This Memorandum of Understanding provided that BPNA could not declare dividends without the approval of the FRB-NY and the NYSDFS. During the year ended December 31, 2015, BPNA paid dividends of $200 million to PNA with prior approval from the FRB-NY.
284
Condensed Consolidating Statement of Financial Condition
| | | | | | | | | | | | | | | | | | | | |
| | | At December 31, 2015 | |
| | | | | | | | | All other | | | | | | | |
| | | Popular Inc. | | | PNA | | | subsidiaries and | | | Elimination | | | Popular, Inc. | |
(In thousands) | | Holding Co. | | | Holding Co. | | | eliminations | | | entries | | | Consolidated | |
Assets: | | | | | | | | | | | | | | | | | | | | |
Cash and due from banks | | $ | 24,298 | | | $ | 600 | | | $ | 363,620 | | | $ | (24,844 | ) | | $ | 363,674 | |
Money market investments | | | 262,204 | | | | 23,931 | | | | 2,179,887 | | | | (285,930 | ) | | | 2,180,092 | |
Trading account securities, at fair value | | | 2,020 | | | | — | | | | 69,639 | | | | — | | | | 71,659 | |
Investment securities available-for-sale, at fair value | | | 216 | | | | — | | | | 6,062,776 | | | | — | | | | 6,062,992 | |
Investment securities held-to-maturity, at amortized cost | | | — | | | | — | | | | 100,903 | | | | — | | | | 100,903 | |
Other investment securities, at lower of cost or realizable value | | | 9,850 | | | | 4,492 | | | | 157,906 | | | | — | | | | 172,248 | |
Investment in subsidiaries | | | 5,539,325 | | | | 1,789,512 | | | | — | | | | (7,328,837 | ) | | | — | |
Loans held-for-sale, at lower of cost or fair value | | | — | | | | — | | | | 137,000 | | | | — | | | | 137,000 | |
| | | | | | | | | | | | | | | | | | | | |
Loans held-in-portfolio: | | | | | | | | | | | | | | | | | | | | |
Loans not covered under loss-sharing agreements with the FDIC | | | 1,176 | | | | — | | | | 22,452,637 | | | | — | | | | 22,453,813 | |
Loans covered under loss-sharing agreements with the FDIC | | | — | | | | — | | | | 646,115 | | | | — | | | | 646,115 | |
Less - Unearned income | | | — | | | | — | | | | 107,698 | | | | — | | | | 107,698 | |
Allowance for loan losses | | | 3 | | | | — | | | | 537,108 | | | | — | | | | 537,111 | |
| | | | | | | | | | | | | | | | | | | | |
Total loans held-in-portfolio, net | | | 1,173 | | | | — | | | | 22,453,946 | | | | — | | | | 22,455,119 | |
| | | | | | | | | | | | | | | | | | | | |
FDIC loss share-asset | | | — | | | | — | | | | 310,221 | | | | — | | | | 310,221 | |
Premises and equipment, net | | | 2,823 | | | | — | | | | 499,788 | | | | — | | | | 502,611 | |
Other real estate not covered under loss-sharing agreements with the FDIC | | | 532 | | | | — | | | | 154,699 | | | | — | | | | 155,231 | |
Other real estate covered under loss-sharing agreements with the FDIC | | | — | | | | — | | | | 36,685 | | | | — | | | | 36,685 | |
Accrued income receivable | | | 85 | | | | 115 | | | | 124,070 | | | | (36 | ) | | | 124,234 | |
Mortgage servicing assets, at fair value | | | — | | | | — | | | | 211,405 | | | | — | | | | 211,405 | |
Other assets | | | 62,204 | | | | 24,101 | | | | 2,132,616 | | | | (17,958 | ) | | | 2,200,963 | |
Goodwill | | | — | | | | — | | | | 626,388 | | | | — | | | | 626,388 | |
Other intangible assets | | | 554 | | | | — | | | | 57,555 | | | | — | | | | 58,109 | |
| | | | | | | | | | | | | | | | | | | | |
Total assets | | $ | 5,905,284 | | | $ | 1,842,751 | | | $ | 35,679,104 | | | $ | (7,657,605 | ) | | $ | 35,769,534 | |
| | | | | | | | | | | | | | | | | | | | |
Liabilities and Stockholders’ Equity | | | | | | | | | | | | | | | | | |
Liabilities: | | | | | | | | | | | | | | | | | | | | |
Deposits: | | | | | | | | | | | | | | | | | | | | |
Non-interest bearing | | $ | — | | | $ | — | | | $ | 6,426,359 | | | $ | (24,844 | ) | | $ | 6,401,515 | |
Interest bearing | | | — | | | | — | | | | 21,094,138 | | | | (285,930 | ) | | | 20,808,208 | |
| | | | | | | | | | | | | | | | | | | | |
Total deposits | | | — | | | | — | | | | 27,520,497 | | | | (310,774 | ) | | | 27,209,723 | |
| | | | | | | | | | | | | | | | | | | | |
Federal funds purchased and assets sold under agreements to repurchase | | | — | | | | — | | | | 762,145 | | | | — | | | | 762,145 | |
Other short-term borrowings | | | — | | | | — | | | | 1,200 | | | | — | | | | 1,200 | |
Notes payable | | | 740,812 | | | | 148,988 | | | | 780,509 | | | | — | | | | 1,670,309 | |
Other liabilities | | | 59,148 | | | | 6,659 | | | | 971,429 | | | | (18,218 | ) | | | 1,019,018 | |
Liabilities from discontinued operations | | | — | | | | — | | | | 1,815 | | | | — | | | | 1,815 | |
| | | | | | | | | | | | | | | | | | | | |
Total liabilities | | | 799,960 | | | | 155,647 | | | | 30,037,595 | | | | (328,992 | ) | | | 30,664,210 | |
| | | | | | | | | | | | | | | | | | | | |
Stockholders’ equity: | | | | | | | | | | | | | | | | | | | | |
Preferred stock | | | 50,160 | | | | — | | | | — | | | | — | | | | 50,160 | |
Common stock | | | 1,038 | | | | 2 | | | | 56,307 | | | | (56,309 | ) | | | 1,038 | |
Surplus | | | 4,220,629 | | | | 4,111,208 | | | | 5,712,635 | | | | (9,815,316 | ) | | | 4,229,156 | |
Retained earnings (accumulated deficit) | | | 1,096,484 | | | | (2,416,251 | ) | | | 128,459 | | | | 2,279,265 | | | | 1,087,957 | |
Treasury stock, at cost | | | (6,101 | ) | | | — | | | | — | | | | — | | | | (6,101 | ) |
Accumulated other comprehensive loss, net of tax | | | (256,886 | ) | | | (7,855 | ) | | | (255,892 | ) | | | 263,747 | | | | (256,886 | ) |
| | | | | | | | | | | | | | | | | | | | |
Total stockholders’ equity | | | 5,105,324 | | | | 1,687,104 | | | | 5,641,509 | | | | (7,328,613 | ) | | | 5,105,324 | |
| | | | | | | | | | | | | | | | | | | | |
Total liabilities and stockholders’ equity | | $ | 5,905,284 | | | $ | 1,842,751 | | | $ | 35,679,104 | | | $ | (7,657,605 | ) | | $ | 35,769,534 | |
| | | | | | | | | | | | | | | | | | | | |
285
Condensed Consolidating Statement of Financial Condition
| | | | | | | | | | | | | | | | | | | | |
| | | At December 31, 2014 | |
| | | | | | | | | All other | | | | | | | |
| | | Popular, Inc. | | | PNA | | | subsidiaries and | | | Elimination | | | Popular, Inc. | |
(In thousands) | | Holding Co. | | | Holding Co. | | | eliminations | | | entries | | | Consolidated | |
Assets: | | | | | | | | | | | | | | | | | | | | |
Cash and due from banks | | $ | 20,448 | | | $ | 608 | | | $ | 380,890 | | | $ | (20,851 | ) | | $ | 381,095 | |
Money market investments | | | 19,747 | | | | 357 | | | | 1,803,639 | | | | (1,357 | ) | | | 1,822,386 | |
Trading account securities, at fair value | | | 1,640 | | | | — | | | | 136,887 | | | | — | | | | 138,527 | |
Investment securities available-for-sale, at fair value | | | 231 | | | | — | | | | 5,314,928 | | | | — | | | | 5,315,159 | |
Investment securities held-to-maturity, at amortized cost | | | — | | | | — | | | | 103,170 | | | | — | | | | 103,170 | |
Other investment securities, at lower of cost or realizable value | | | 9,850 | | | | 4,492 | | | | 147,564 | | | | — | | | | 161,906 | |
Investment in subsidiaries | | | 4,878,866 | | | | 1,353,616 | | | | — | | | | (6,232,482 | ) | | | — | |
Loans held-for-sale, at lower of cost or fair value | | | — | | | | — | | | | 106,104 | | | | — | | | | 106,104 | |
| | | | | | | | | | | | | | | | | | | | |
Loans held-in-portfolio: | | | | | | | | | | | | | | | | | | | | |
Loans not covered under loss-sharing agreements with the FDIC | | | 55,486 | | | | — | | | | 19,496,569 | | | | (53,769 | ) | | | 19,498,286 | |
Loans covered under loss-sharing agreements with the FDIC | | | — | | | | — | | | | 2,542,662 | | | | — | | | | 2,542,662 | |
Less - Unearned income | | | — | | | | — | | | | 93,835 | | | | — | | | | 93,835 | |
Allowance for loan losses | | | 41 | | | | — | | | | 601,751 | | | | — | | | | 601,792 | |
| | | | | | | | | | | | | | | | | | | | |
Total loans held-in-portfolio, net | | | 55,445 | | | | — | | | | 21,343,645 | | | | (53,769 | ) | | | 21,345,321 | |
| | | | | | | | | | | | | | | | | | | | |
FDIC loss-share asset | | | — | | | | — | | | | 542,454 | | | | — | | | | 542,454 | |
Premises and equipment, net | | | 2,512 | | | | — | | | | 492,069 | | | | — | | | | 494,581 | |
Other real estate not covered under loss-sharing agreements with the FDIC | | | 90 | | | | — | | | | 135,410 | | | | — | | | | 135,500 | |
Other real estate covered under loss-sharing agreements with the FDIC | | | — | | | | — | | | | 130,266 | | | | — | | | | 130,266 | |
Accrued income receivable | | | 75 | | | | 112 | | | | 121,657 | | | | (26 | ) | | | 121,818 | |
Mortgage servicing assets, at fair value | | | — | | | | — | | | | 148,694 | | | | — | | | | 148,694 | |
Other assets | | | 67,962 | | | | 26,514 | | | | 1,570,094 | | | | (18,127 | ) | | | 1,646,443 | |
Goodwill | | | — | | | | — | | | | 465,677 | | | | (1 | ) | | | 465,676 | |
Other intangible assets | | | 555 | | | | — | | | | 37,040 | | | | — | | | | 37,595 | |
| | | | | | | | | | | | | | | | | | | | |
Total assets | | $ | 5,057,421 | | | $ | 1,385,699 | | | $ | 32,980,188 | | | $ | (6,326,613 | ) | | $ | 33,096,695 | |
| | | | | | | | | | | | | | | | | | | | |
Liabilities and Stockholders’ Equity | | | | | | | | | | | | | | | | | |
Liabilities: | | | | | | | | | | | | | | | | | | | | |
Deposits: | | | | | | | | | | | | | | | | | | | | |
Non-interest bearing | | $ | — | | | $ | — | | | $ | 5,804,599 | | | $ | (20,851 | ) | | $ | 5,783,748 | |
Interest bearing | | | — | | | | — | | | | 19,025,144 | | | | (1,357 | ) | | | 19,023,787 | |
| | | | | | | | | | | | | | | | | | | | |
Total deposits | | | — | | | | — | | | | 24,829,743 | | | | (22,208 | ) | | | 24,807,535 | |
| | | | | | | | | | | | | | | | | | | | |
Federal funds purchased and assets sold under agreements to repurchase | | | — | | | | — | | | | 1,271,657 | | | | — | | | | 1,271,657 | |
Other short-term borrowings | | | — | | | | 8,169 | | | | 66,800 | | | | (53,769 | ) | | | 21,200 | |
Notes payable | | | 740,812 | | | | 148,988 | | | | 822,028 | | | | — | | | | 1,711,828 | |
Other liabilities | | | 49,226 | | | | 6,872 | | | | 974,147 | | | | (18,216 | ) | | | 1,012,029 | |
Liabilities from discontinued operations | | | — | | | | — | | | | 5,064 | | | | — | | | | 5,064 | |
| | | | | | | | | | | | | | | | | | | | |
Total liabilities | | | 790,038 | | | | 164,029 | | | | 27,969,439 | | | | (94,193 | ) | | | 28,829,313 | |
| | | | | | | | | | | | | | | | | | | | |
Stockholders’ equity: | | | | | | | | | | | | | | | | | | | | |
Preferred stock | | | 50,160 | | | | — | | | | — | | | | — | | | | 50,160 | |
Common stock | | | 1,036 | | | | 2 | | | | 56,307 | | | | (56,309 | ) | | | 1,036 | |
Surplus | | | 4,187,931 | | | | 4,269,208 | | | | 5,931,161 | | | | (10,191,842 | ) | | | 4,196,458 | |
Retained earnings (accumulated deficit) | | | 262,244 | | | | (3,043,476 | ) | | | (747,702 | ) | | | 3,782,651 | | | | 253,717 | |
Treasury stock, at cost | | | (4,116 | ) | | | — | | | | (1 | ) | | | — | | | | (4,117 | ) |
Accumulated other comprehensive loss, net of tax | | | (229,872 | ) | | | (4,064 | ) | | | (229,016 | ) | | | 233,080 | | | | (229,872 | ) |
| | | | | | | | | | | | | | | | | | | | |
Total stockholders’ equity | | | 4,267,383 | | | | 1,221,670 | | | | 5,010,749 | | | | (6,232,420 | ) | | | 4,267,382 | |
| | | | | | | | | | | | | | | | | | | | |
Total liabilities and stockholders’ equity | | $ | 5,057,421 | | | $ | 1,385,699 | | | $ | 32,980,188 | | | $ | (6,326,613 | ) | | $ | 33,096,695 | |
| | | | | | | | | | | | | | | | | | | | |
286
Condensed Consolidating Statement of Operations
| | | | | | | | | | | | | | | | | | | | |
| | | Year ended December 31, 2015 | |
| | | | | | | | | All other | | | | | | | |
| | | Popular, Inc. | | | PNA | | | subsidiaries and | | | Elimination | | | Popular, Inc. | |
(In thousands) | | Holding Co. | | | Holding Co. | | | eliminations | | | entries | | | Consolidated | |
Interest and dividend income: | | | | | | | | | | | | | | | | | | | | |
Dividend income from subsidiaries | | $ | 41,350 | | | $ | — | | | $ | — | | | $ | (41,350 | ) | | $ | — | |
Loans | | | 673 | | | | 3 | | | | 1,458,613 | | | | (583 | ) | | | 1,458,706 | |
Money market investments | | | 40 | | | | 8 | | | | 7,245 | | | | (50 | ) | | | 7,243 | |
Investment securities | | | 619 | | | | 322 | | | | 125,123 | | | | — | | | | 126,064 | |
Trading account securities | | | — | | | | — | | | | 11,001 | | | | — | | | | 11,001 | |
| | | | | | | | | | | | | | | | | | | | |
Total interest and dividend income | | | 42,682 | | | | 333 | | | | 1,601,982 | | | | (41,983 | ) | | | 1,603,014 | |
| | | | | | | | | | | | | | | | | | | | |
Interest expense: | | | | | | | | | | | | | | | | | | | | |
Deposits | | | — | | | | — | | | | 107,583 | | | | (50 | ) | | | 107,533 | |
Short-term borrowings | | | — | | | | 502 | | | | 7,593 | | | | (583 | ) | | | 7,512 | |
Long-term debt | | | 52,470 | | | | 10,779 | | | | 15,737 | | | | — | | | | 78,986 | |
| | | | | | | | | | | | | | | | | | | | |
Total interest expense | | | 52,470 | | | | 11,281 | | | | 130,913 | | | | (633 | ) | | | 194,031 | |
| | | | | | | | | | | | | | | | | | | | |
Net interest (expense) income | | | (9,788 | ) | | | (10,948 | ) | | | 1,471,069 | | | | (41,350 | ) | | | 1,408,983 | |
Provision for loan losses- non-covered loans | | | 35 | | | | — | | | | 217,423 | | | | — | | | | 217,458 | |
Provision for loan losses- covered loans | | | — | | | | — | | | | 24,020 | | | | — | | | | 24,020 | |
| | | | | | | | | | | | | | | | | | | | |
Net interest (expense) income after provision for loan losses | | | (9,823 | ) | | | (10,948 | ) | | | 1,229,626 | | | | (41,350 | ) | | | 1,167,505 | |
| | | | | | | | | | | | | | | | | | | | |
Service charges on deposit accounts | | | — | | | | — | | | | 160,108 | | | | — | | | | 160,108 | |
Other service fees | | | — | | | | — | | | | 238,566 | | | | (2,476 | ) | | | 236,090 | |
Mortgage banking activities | | | — | | | | — | | | | 81,802 | | | | — | | | | 81,802 | |
Net loss and valuation adjustments on investment securities | | | — | | | | — | | | | 141 | | | | — | | | | 141 | |
Other-than-temporary impairment losses on investment securities | | | — | | | | — | | | | (14,445 | ) | | | — | | | | (14,445 | ) |
Trading account loss | | | (187 | ) | | | — | | | | (4,536 | ) | | | — | | | | (4,723 | ) |
Net gain on sale of loans, including valuation adjustments on loans held-for-sale | | | — | | | | — | | | | 542 | | | | — | | | | 542 | |
Adjustments (expense) to indemnity reserves on loans sold | | | — | | | | — | | | | (18,628 | ) | | | — | | | | (18,628 | ) |
FDIC loss-share income | | | — | | | | — | | | | 20,062 | | | | — | | | | 20,062 | |
Other operating income | | | 13,710 | | | | (244 | ) | | | 45,173 | | | | (47 | ) | | | 58,592 | |
| | | | | | | | | | | | | | | | | | | | |
Total non-interest income | | | 13,523 | | | | (244 | ) | | | 508,785 | | | | (2,523 | ) | | | 519,541 | |
| | | | | | | | | | | | | | | | | | | | |
Operating expenses: | | | | | | | | | | | | | | | | | | | | |
Personnel costs | | | 49,112 | | | | — | | | | 428,407 | | | | — | | | | 477,519 | |
Net occupancy expenses | | | 3,591 | | | | — | | | | 83,297 | | | | — | | | | 86,888 | |
Equipment expenses | | | 2,240 | | | | — | | | | 57,870 | | | | — | | | | 60,110 | |
Other taxes | | | (822 | ) | | | — | | | | 40,619 | | | | — | | | | 39,797 | |
Professional fees | | | 11,384 | | | | 504 | | | | 297,392 | | | | (295 | ) | | | 308,985 | |
Communications | | | 519 | | | | — | | | | 24,627 | | | | — | | | | 25,146 | |
Business promotion | | | 1,868 | | | | — | | | | 50,208 | | | | — | | | | 52,076 | |
FDIC deposit insurance | | | — | | | | — | | | | 27,626 | | | | — | | | | 27,626 | |
Other real estate owned (OREO) expenses | | | — | | | | — | | | | 85,568 | | | | — | | | | 85,568 | |
Other operating expenses | | | (69,185 | ) | | | 463 | | | | 166,289 | | | | (2,492 | ) | | | 95,075 | |
Amortization of intangibles | | | — | | | | — | | | | 11,019 | | | | — | | | | 11,019 | |
Restructuring costs | | | — | | | | — | | | | 18,412 | | | | — | | | | 18,412 | |
| | | | | | | | | | | | | | | | | | | | |
Total operating expenses | | | (1,293 | ) | | | 967 | | | | 1,291,334 | | | | (2,787 | ) | | | 1,288,221 | |
| | | | | | | | | | | | | | | | | | | | |
Income (loss) before income tax and equity in earnings of subsidiaries | | | 4,993 | | | | (12,159 | ) | | | 447,077 | | | | (41,086 | ) | | | 398,825 | |
Income tax (benefit) expense | | | (186 | ) | | | 305 | | | | (495,394 | ) | | | 103 | | | | (495,172 | ) |
| | | | | | | | | | | | | | | | | | | | |
Income (loss) before equity in earnings of subsidiaries | | | 5,179 | | | | (12,464 | ) | | | 942,471 | | | | (41,189 | ) | | | 893,997 | |
Equity in undistributed earnings of subsidiaries | | | 888,818 | | | | 638,341 | | | | — | | | | (1,527,159 | ) | | | — | |
| | | | | | | | | | | | | | | | | | | | |
Income from continuing operations | | | 893,997 | | | | 625,877 | | | | 942,471 | | | | (1,568,348 | ) | | | 893,997 | |
Income from discontinued operations, net of tax | | | — | | | | — | | | | 1,347 | | | | — | | | | 1,347 | |
Equity in undistributed earnings of discontinued operations | | | 1,347 | | | | 1,347 | | | | — | | | | (2,694 | ) | | | — | |
| | | | | | | | | | | | | | | | | | | | |
Net Income | | $ | 895,344 | | | $ | 627,224 | | | $ | 943,818 | | | $ | (1,571,042 | ) | | $ | 895,344 | |
| | | | | | | | | | | | | | | | | | | | |
Comprehensive income, net of tax | | $ | 868,330 | | | $ | 623,433 | | | $ | 916,942 | | | $ | (1,540,375 | ) | | $ | 868,330 | |
| | | | | | | | | | | | | | | | | | | | |
287
Condensed Consolidating Statement of Operations
| | | | | | | | | | | | | | | | | | | | |
| | | Year ended December 31, 2014 | |
| | | | | | | | | All other | | | | | | | |
| | | Popular, Inc. | | | PNA | | | subsidiaries and | | | Elimination | | | Popular, Inc. | |
(In thousands) | | Holding Co. | | | Holding Co. | | | eliminations | | | entries | | | Consolidated | |
Interest income: | | | | | | | | | | | | | | | | | | | | |
Loans | | $ | 1,294 | | | $ | — | | | $ | 1,478,658 | | | $ | (1,202 | ) | | $ | 1,478,750 | |
Money market investments | | | 20 | | | | 7 | | | | 4,219 | | | | (22 | ) | | | 4,224 | |
Investment securities | | | 617 | | | | 322 | | | | 131,692 | | | | — | | | | 132,631 | |
Trading account securities | | | — | | | | — | | | | 17,938 | | | | — | | | | 17,938 | |
| | | | | | | | | | | | | | | | | | | | |
Total interest income | | | 1,931 | | | | 329 | | | | 1,632,507 | | | | (1,224 | ) | | | 1,633,543 | |
| | | | | | | | | | | | | | | | | | | | |
Interest expense: | | | | | | | | | | | | | | | | | | | | |
Deposits | | | — | | | | — | | | | 105,095 | | | | (8 | ) | | | 105,087 | |
Short-term borrowings | | | — | | | | 405 | | | | 68,187 | | | | (1,216 | ) | | | 67,376 | |
Long-term debt | | | 492,657 | | | | 10,826 | | | | 12,525 | | | | — | | | | 516,008 | |
| | | | | | | | | | | | | | | | | | | | |
Total interest expense | | | 492,657 | | | | 11,231 | | | | 185,807 | | | | (1,224 | ) | | | 688,471 | |
| | | | | | | | | | | | | | | | | | | | |
Net interest (expense) income | | | (490,726 | ) | | | (10,902 | ) | | | 1,446,700 | | | | — | | | | 945,072 | |
Provision (reversal) for loan losses- non-covered loans | | | (200 | ) | | | — | | | | 224,199 | | | | — | | | | 223,999 | |
Provision for loan losses- covered loans | | | — | | | | — | | | | 46,135 | | | | — | | | | 46,135 | |
| | | | | | | | | | | | | | | | | | | | |
Net interest (expense) income after provision for loan losses | | | (490,526 | ) | | | (10,902 | ) | | | 1,176,366 | | | | — | | | | 674,938 | |
| | | | | | | | | | | | | | | | | | | | |
Service charges on deposit accounts | | | — | | | | — | | | | 158,637 | | | | — | | | | 158,637 | |
Other service fees | | | — | | | | — | | | | 228,006 | | | | (2,741 | ) | | | 225,265 | |
Mortgage banking activities | | | — | | | | — | | | | 30,615 | | | | — | | | | 30,615 | |
Net loss and valuation adjustments on investment securities | | | — | | | | — | | | | (870 | ) | | | — | | | | (870 | ) |
Trading account (loss) profit | | | (40 | ) | | | — | | | | 4,398 | | | | — | | | | 4,358 | |
Net gain on sale of loans, including valuation adjustments on loans held-for-sale | | | — | | | | — | | | | 40,591 | | | | — | | | | 40,591 | |
Adjustments (expense) to indemnity reserves on loans sold | | | — | | | | — | | | | (40,629 | ) | | | — | | | | (40,629 | ) |
FDIC loss-share expense | | | — | | | | — | | | | (103,024 | ) | | | — | | | | (103,024 | ) |
Other operating income (loss) | | | 12,291 | | | | (16 | ) | | | 59,306 | | | | (9 | ) | | | 71,572 | |
| | | | | | | | | | | | | | | | | | | | |
Total non-interest income (loss) | | | 12,251 | | | | (16 | ) | | | 377,030 | | | | (2,750 | ) | | | 386,515 | |
| | | | | | | | | | | | | | | | | | | | |
Operating expenses: | | | | | | | | | | | | | | | | | | | | |
Personnel costs | | | 39,457 | | | | — | | | | 379,222 | | | | — | | | | 418,679 | |
Net occupancy expenses | | | 3,952 | | | | — | | | | 82,755 | | | | — | | | | 86,707 | |
Equipment expenses | | | 3,764 | | | | — | | | | 45,153 | | | | — | | | | 48,917 | |
Other taxes | | | 1,019 | | | | — | | | | 55,899 | | | | — | | | | 56,918 | |
Professional fees | | | 14,963 | | | | 1,119 | | | | 266,202 | | | | (229 | ) | | | 282,055 | |
Communications | | | 496 | | | | — | | | | 25,188 | | | | — | | | | 25,684 | |
Business promotion | | | 1,731 | | | | — | | | | 52,285 | | | | — | | | | 54,016 | |
FDIC deposit insurance | | | — | | | | — | | | | 40,307 | | | | — | | | | 40,307 | |
Loss on early extinguishment of debt | | | — | | | | — | | | | 532 | | | | — | | | | 532 | |
Other real estate owned (OREO) expenses | | | 6 | | | | — | | | | 49,605 | | | | — | | | | 49,611 | |
Other operating expenses | | | (63,755 | ) | | | 435 | | | | 161,216 | | | | (2,523 | ) | | | 95,373 | |
Amortization of intangibles | | | — | | | | — | | | | 8,160 | | | | — | | | | 8,160 | |
Restructuring costs | | | — | | | | — | | | | 26,725 | | | | — | | | | 26,725 | |
| | | | | | | | | | | | | | | | | | | | |
Total operating expenses | | | 1,633 | | | | 1,554 | | | | 1,193,249 | | | | (2,752 | ) | | | 1,193,684 | |
| | | | | | | | | | | | | | | | | | | | |
(Loss) income before income tax and equity in earnings of subsidiaries | | | (479,908 | ) | | | (12,472 | ) | | | 360,147 | | | | 2 | | | | (132,231 | ) |
Income tax expense | | | 5,580 | | | | — | | | | 52,698 | | | | 1 | | | | 58,279 | |
| | | | | | | | | | | | | | | | | | | | |
(Loss) income before equity in earnings of subsidiaries | | | (485,488 | ) | | | (12,472 | ) | | | 307,449 | | | | 1 | | | | (190,510 | ) |
Equity in undistributed earnings of subsidiaries | | | 294,978 | | | | 32,484 | | | | — | | | | (327,462 | ) | | | — | |
| | | | | | | | | | | | | | | | | | | | |
(Loss) income from continuing operations | | | (190,510 | ) | | | 20,012 | | | | 307,449 | | | | (327,461 | ) | | | (190,510 | ) |
Loss from discontinued operations, net of tax | | | — | | | | — | | | | (122,980 | ) | | | — | | | | (122,980 | ) |
Equity in undistributed losses of discontinued operations | | | (122,980 | ) | | | (122,980 | ) | | | — | | | | 245,960 | | | | — | |
| | | | | | | | | | | | | | | | | | | | |
Net (Loss) Income | | $ | (313,490 | ) | | $ | (102,968 | ) | | $ | 184,469 | | | $ | (81,501 | ) | | $ | (313,490 | ) |
| | | | | | | | | | | | | | | | | | | | |
Comprehensive (loss) income, net of tax | | $ | (354,617 | ) | | $ | (79,665 | ) | | | 144,355 | | | $ | (64,690 | ) | | $ | (354,617 | ) |
| | | | | | | | | | | | | | | | | | | | |
288
Condensed Consolidating Statement of Operations
| | | | | | | | | | | | | | | | | | | | |
| | | Year ended December 31, 2013 | |
| | | | | | | | | All other | | | | | | | |
| | | Popular, Inc. | | | PNA | | | subsidiaries and | | | Elimination | | | Popular, Inc. | |
(In thousands) | | Holding Co. | | | Holding Co. | | | eliminations | | | entries | | | Consolidated | |
Interest and Dividend Income: | | | | | | | | | | | | | | | | | | | | |
Dividend income from subsidiaries | | $ | 37,000 | | | $ | — | | | $ | — | | | $ | (37,000 | ) | | $ | — | |
Loans | | | 4,543 | | | | — | | | | 1,478,526 | | | | (1,973 | ) | | | 1,481,096 | |
Money market investments | | | 127 | | | | 5 | | | | 3,462 | | | | (130 | ) | | | 3,464 | |
Investment securities | | | 13,123 | | | | 322 | | | | 139,427 | | | | (11,065 | ) | | | 141,807 | |
Trading account securities | | | — | | | | — | | | | 21,573 | | | | — | | | | 21,573 | |
| | | | | | | | | | | | | | | | | | | | |
Total interest and dividend income | | | 54,793 | | | | 327 | | | | 1,642,988 | | | | (50,168 | ) | | | 1,647,940 | |
| | | | | | | | | | | | | | | | | | | | |
Interest Expense: | | | | | | | | | | | | | | | | | | | | |
Deposits | | | — | | | | — | | | | 124,862 | | | | (5 | ) | | | 124,857 | |
Short-term borrowings | | | — | | | | 974 | | | | 39,555 | | | | (2,099 | ) | | | 38,430 | |
Long-term debt | | | 101,245 | | | | 24,249 | | | | 25,650 | | | | (11,065 | ) | | | 140,079 | |
| | | | | | | | | | | | | | | | | | | | |
Total interest expense | | | 101,245 | | | | 25,223 | | | | 190,067 | | | | (13,169 | ) | | | 303,366 | |
| | | | | | | | | | | | | | | | | | | | |
Net interest (expense) income | | | (46,452 | ) | | | (24,896 | ) | | | 1,452,921 | | | | (36,999 | ) | | | 1,344,574 | |
Provision for loan losses- non-covered loans | | | 398 | | | | — | | | | 536,312 | | | | — | | | | 536,710 | |
Provision for loan losses- covered loans | | | — | | | | — | | | | 69,396 | | | | — | | | | 69,396 | |
| | | | | | | | | | | | | | | | | | | | |
Net interest (expense) income after provision for loan losses | | | (46,850 | ) | | | (24,896 | ) | | | 847,213 | | | | (36,999 | ) | | | 738,468 | |
| | | | | | | | | | | | | | | | | | | | |
Service charges on deposit accounts | | | — | | | | — | | | | 162,870 | | | | — | | | | 162,870 | |
Other service fees | | | — | | | | — | | | | 232,148 | | | | (2,797 | ) | | | 229,351 | |
Mortgage banking activities | | | — | | | | — | | | | 71,657 | | | | — | | | | 71,657 | |
Net gain and valuation adjustments on investment securities | | | 7,966 | | | | — | | | | — | | | | — | | | | 7,966 | |
Trading account profit (loss) | | | 161 | | | | — | | | | (13,644 | ) | | | — | | | | (13,483 | ) |
Net loss on sale of loans, including valuation adjustments on loans held-for-sale | | | — | | | | — | | | | (52,708 | ) | | | — | | | | (52,708 | ) |
Adjustments (expense) to indemnity reserves on loans sold | | | — | | | | — | | | | (37,054 | ) | | | — | | | | (37,054 | ) |
FDIC loss-share expense | | | — | | | | — | | | | (82,051 | ) | | | — | | | | (82,051 | ) |
Other operating income | | | 443,276 | | | | 4,012 | | | | 57,177 | | | | — | | | | 504,465 | |
| | | | | | | | | | | | | | | | | | | | |
Total non-interest income | | | 451,403 | | | | 4,012 | | | | 338,395 | | | | (2,797 | ) | | | 791,013 | |
| | | | | | | | | | | | | | | | | | | | |
Operating expenses: | | | | | | | | | | | | | | | | | | | | |
Personnel costs | | | 31,086 | | | | — | | | | 397,611 | | | | — | | | | 428,697 | |
Net occupancy expenses | | | 3,685 | | | | 2 | | | | 82,964 | | | | — | | | | 86,651 | |
Equipment expenses | | | 4,084 | | | | — | | | | 41,944 | | | | — | | | | 46,028 | |
Other taxes | | | 413 | | | | — | | | | 57,615 | | | | — | | | | 58,028 | |
Professional fees | | | 13,099 | | | | 72 | | | | 265,181 | | | | (225 | ) | | | 278,127 | |
Communications | | | 421 | | | | — | | | | 24,964 | | | | — | | | | 25,385 | |
Business promotion | | | 1,838 | | | | — | | | | 57,615 | | | | — | | | | 59,453 | |
FDIC deposit insurance | | | — | | | | — | | | | 56,728 | | | | — | | | | 56,728 | |
Loss on early extinguishment of debt | | | — | | | | 3,388 | | | | — | | | | — | | | | 3,388 | |
Other real estate owned (OREO) expenses | | | — | | | | — | | | | 79,658 | | | | — | | | | 79,658 | |
Other operating expenses | | | (53,926 | ) | | | 434 | | | | 147,923 | | | | (2,555 | ) | | | 91,876 | |
Amortization of intangibles | | | — | | | | — | | | | 7,971 | | | | — | | | | 7,971 | |
| | | | | | | | | | | | | | | | | | | | |
Total operating expenses | | | 700 | | | | 3,896 | | | | 1,220,174 | | | | (2,780 | ) | | | 1,221,990 | |
| | | | | | | | | | | | | | | | | | | | |
Income (loss) before income tax and equity in earnings of subsidiaries | | | 403,853 | | | | (24,780 | ) | | | (34,566 | ) | | | (37,016 | ) | | | 307,491 | |
Income tax expense (benefit) | | | 1,412 | | | | (1,710 | ) | | | (250,887 | ) | | | (142 | ) | | | (251,327 | ) |
| | | | | | | | | | | | | | | | | | | | |
Income (loss) before equity in earnings of subsidiaries | | | 402,441 | | | | (23,070 | ) | | | 216,321 | | | | (36,874 | ) | | | 558,818 | |
Equity in undistributed earnings of subsidiaries | | | 156,377 | | | | 54,417 | | | | — | | | | (210,794 | ) | | | — | |
| | | | | | | | | | | | | | | | | | | | |
Income from continuing operations | | $ | 558,818 | | | $ | 31,347 | | | $ | 216,321 | | | $ | (247,668 | ) | | $ | 558,818 | |
| | | | | | | | | | | | | | | | | | | | |
Income from discontinued operations, net of tax | | | — | | | | — | | | | 40,509 | | | | — | | | | 40,509 | |
| | | | | | | | | | | | | | | | | | | | |
Equity in undistributed earnings of discontinued operations | | | 40,509 | | | | 40,509 | | | | — | | | | (81,018 | ) | | | — | |
| | | | | | | | | | | | | | | | | | | | |
Net income | | | 599,327 | | | | 71,856 | | | | 256,830 | | | | (328,686 | ) | | | 599,327 | |
| | | | | | | | | | | | | | | | | | | | |
Comprehensive income (loss), net of tax | | $ | 513,450 | | | $ | (5,897 | ) | | $ | 173,754 | | | $ | (167,857 | ) | | $ | 513,450 | |
| | | | | | | | | | | | | | | | | | | | |
289
Condensed Consolidating Statement of Cash Flows
| | | | | | | | | | | | | | | | | | | | |
| | | Year ended December 31, 2015 | |
| | | | | | | | | All other | | | | | | | |
| | | Popular, Inc. | | | PNA | | | subsidiaries | | | Elimination | | | Popular, Inc. | |
(In thousands) | | Holding Co. | | | Holding Co. | | | and eliminations | | | entries | | | Consolidated | |
| | | | | |
Cash flows from operating activities: | | | | | | | | | | | | | | | | | | | | |
| | | | | |
Net income | | $ | 895,344 | | | $ | 627,224 | | | $ | 943,818 | | | $ | (1,571,042 | ) | | $ | 895,344 | |
| | | | | | | | | | | | | | | | | | | | |
| | | | | |
Adjustments to reconcile net income to net cash (used in) provided by operating activities: | | | | | | | | | | | | | | | | | | | | |
Equity in undistributed earnings of subsidiaries | | | (890,165 | ) | | | (639,688 | ) | | | — | | | | 1,529,853 | | | | — | |
Provision for loan losses | | | 35 | | | | — | | | | 241,443 | | | | — | | | | 241,478 | |
Amortization of intangibles | | | — | | | | — | | | | 11,019 | | | | — | | | | 11,019 | |
Depreciation and amortization of premises and equipment | | | 761 | | | | — | | | | 46,713 | | | | — | | | | 47,474 | |
Net accretion of discounts and amortization of premiums and deferred fees | | | 2 | | | | — | | | | (73,498 | ) | | | — | | | | (73,496 | ) |
Other-than-temporary impairment on investment securities | | | — | | | | — | | | | 14,445 | | | | — | | | | 14,445 | |
Fair value adjustments on mortgage servicing rights | | | — | | | | — | | | | 7,904 | | | | — | | | | 7,904 | |
FDIC loss share income | | | — | | | | — | | | | (20,062 | ) | | | — | | | | (20,062 | ) |
Adjustments (expense) to indemnity reserves on loans sold | | | — | | | | — | | | | 18,628 | | | | — | | | | 18,628 | |
Earnings from investments under the equity method | | | (13,710 | ) | | | 244 | | | | (10,907 | ) | | | — | | | | (24,373 | ) |
Deferred income tax benefit | | | (186 | ) | | | — | | | | (519,045 | ) | | | 103 | | | | (519,128 | ) |
(Gain) loss on: | | | | | | | | | | | | | | | | | | | | |
Disposition of premises and equipment | | | (2 | ) | | | — | | | | (3,627 | ) | | | — | | | | (3,629 | ) |
Sale and valuation adjustments of investment securities | | | — | | | | — | | | | (141 | ) | | | — | | | | (141 | ) |
Sale of loans, including valuation adjustments on loans held for sale and mortgage banking activities | | | — | | | | — | | | | (35,013 | ) | | | — | | | | (35,013 | ) |
Sale of foreclosed assets, including write-downs | | | — | | | | — | | | | 60,378 | | | | — | | | | 60,378 | |
Acquisitions of loans held-for-sale | | | — | | | | — | | | | (401,991 | ) | | | — | | | | (401,991 | ) |
Proceeds from sale of loans held-for-sale | | | — | | | | — | | | | 124,111 | | | | — | | | | 124,111 | |
Net originations on loans held-for-sale | | | — | | | | — | | | | (792,821 | ) | | | — | | | | (792,821 | ) |
Net (increase) decrease in: | | | | | | | | | | | | | | | | | | | | |
Trading securities | | | (380 | ) | | | — | | | | 1,084,063 | | | | — | | | | 1,083,683 | |
Accrued income receivable | | | (10 | ) | | | (3 | ) | | | 5,395 | | | | 10 | | | | 5,392 | |
Other assets | | | 8,032 | | | | 342 | | | | 92,032 | | | | (273 | ) | | | 100,133 | |
Net (decrease) increase in: | | | | | | | | | | | | | | | | | | | | |
Interest payable | | | — | | | | (26 | ) | | | 564 | | | | (10 | ) | | | 528 | |
Pension and other postretirement benefits obligations | | | — | | | | — | | | | 3,252 | | | | — | | | | 3,252 | |
Other liabilities | | | (5,622 | ) | | | (187 | ) | | | (67,180 | ) | | | 9 | | | | (72,980 | ) |
| | | | | | | | | | | | | | | | | | | | |
Total adjustments | | | (901,245 | ) | | | (639,318 | ) | | | (214,338 | ) | | | 1,529,692 | | | | (225,209 | ) |
| | | | | | | | | | | | | | | | | | | | |
Net cash (used in) provided by operating activities | | | (5,901 | ) | | | (12,094 | ) | | | 729,480 | | | | (41,350 | ) | | | 670,135 | |
| | | | | | | | | | | | | | | | | | | | |
| | | | | |
Cash flows from investing activities: | | | | | | | | | | | | | | | | | | | | |
Net increase in money market investments | | | (242,457 | ) | | | (23,574 | ) | | | (376,248 | ) | | | 284,573 | | | | (357,706 | ) |
Purchases of investment securities: | | | | | | | | | | | | | | | | | | | | |
Available-for-sale | | | — | | | | — | | | | (2,014,315 | ) | | | — | | | | (2,014,315 | ) |
Held-to-maturity | | | — | | | | — | | | | (750 | ) | | | — | | | | (750 | ) |
Other | | | — | | | | — | | | | (40,847 | ) | | | — | | | | (40,847 | ) |
Proceeds from calls, paydowns, maturities and redemptions of investment securities: | | | | | | | | | | | | | | | | | | | | |
Available-for-sale | | | — | | | | — | | | | 1,362,712 | | | | — | | | | 1,362,712 | |
Held-to-maturity | | | — | | | | — | | | | 4,856 | | | | — | | | | 4,856 | |
Other | | | — | | | | — | | | | 46,341 | | | | — | | | | 46,341 | |
Proceeds from sale of investment securities: | | | | | | | | | | | | | | | | | | | | |
Available for sale | | | — | | | | — | | | | 96,760 | | | | — | | | | 96,760 | |
Other | | | — | | | | — | | | | 14,950 | | | | — | | | | 14,950 | |
Net repayments on loans | | | 53,793 | | | | 350 | | | | 431,302 | | | | (53,769 | ) | | | 431,676 | |
Proceeds from sale of loans | | | — | | | | — | | | | 30,160 | | | | — | | | | 30,160 | |
Acquisition of loan portfolios | | | — | | | | (350 | ) | | | (338,097 | ) | | | — | | | | (338,447 | ) |
Acquisition of trademark | | | — | | | | — | | | | (50 | ) | | | — | | | | (50 | ) |
Net payments from FDIC under loss-sharing agreements | | | — | | | | — | | | | 247,976 | | | | — | | | | 247,976 | |
Net cash received and acquired from business combination | | | — | | | | — | | | | 731,279 | | | | — | | | | 731,279 | |
Acquisition of servicing assets | | | — | | | | — | | | | (61,304 | ) | | | — | | | | (61,304 | ) |
Cash paid related to business acquisitions | | | — | | | | — | | | | (17,250 | ) | | | — | | | | (17,250 | ) |
Return of capital from equity method investments | | | 11,500 | | | | 1,829 | | | | — | | | | — | | | | 13,329 | |
Return of capital from wholly-owned subsidiaries | | | 203,000 | | | | 200,000 | | | | — | | | | (403,000 | ) | | | — | |
Mortgage servicing rights purchased | | | — | | | | — | | | | (2,400 | ) | | | — | | | | (2,400 | ) |
Acquisition of premises and equipment | | | (1,079 | ) | | | — | | | | (61,577 | ) | | | — | | | | (62,656 | ) |
Proceeds from sale of: | | | | | | | | | | | | | | | | | | | | |
Premises and equipment | | | 9 | | | | — | | | | 12,871 | | | | — | | | | 12,880 | |
Foreclosed assets | | | — | | | | — | | | | 141,145 | | | | — | | | | 141,145 | |
| | | | | | | | | | | | | | | | | | | | |
Net cash provided by investing activities | | | 24,766 | | | | 178,255 | | | | 207,514 | | | | (172,196 | ) | | | 238,339 | |
| | | | | | | | | | | | | | | | | | | | |
| | | | | |
Cash flows from financing activities: | | | | | | | | | | | | | | | | | | | | |
Net (decrease) increase in: | | | | | | | | | | | | | | | | | | | | |
Deposits | | | — | | | | — | | | | 495,904 | | | | (288,566 | ) | | | 207,338 | |
Federal funds purchased and assets sold under agreements to repurchase | | | — | | | | — | | | | (509,512 | ) | | | — | | | | (509,512 | ) |
Other short-term borrowings | | | — | | | | — | | | | (201,984 | ) | | | 53,769 | | | | (148,215 | ) |
Payments of notes payable | | | — | | | | (8,169 | ) | | | (729,720 | ) | | | — | | | | (737,889 | ) |
Proceeds from issuance of notes payable | | | — | | | | — | | | | 277,398 | | | | — | | | | 277,398 | |
Proceeds from issuance of common stock | | | 6,226 | | | | — | | | | — | | | | — | | | | 6,226 | |
Dividends paid to parent company | | | — | | | | — | | | | (41,350 | ) | | | 41,350 | | | | — | |
Dividends paid | | | (19,257 | ) | | | — | | | | — | | | | — | | | | (19,257 | ) |
Net payments for repurchase of common stock | | | (1,984 | ) | | | — | | | | — | | | | — | | | | (1,984 | ) |
Return of capital to parent company | | | — | | | | (158,000 | ) | | | (245,000 | ) | | | 403,000 | | | | — | |
| | | | | | | | | | | | | | | | | | | | |
Net cash (used in) provided by financing activities | | | (15,015 | ) | | | (166,169 | ) | | | (954,264 | ) | | | 209,553 | | | | (925,895 | ) |
| | | | | | | | | | | | | | | | | | | | |
Net increase (decrease) in cash and due from banks | | | 3,850 | | | | (8 | ) | | | (17,270 | ) | | | (3,993 | ) | | | (17,421 | ) |
Cash and due from banks at beginning of period | | | 20,448 | | | | 608 | | | | 380,890 | | | | (20,851 | ) | | | 381,095 | |
| | | | | | | | | | | | | | | | | | | | |
Cash and due from banks at end of period | | $ | 24,298 | | | $ | 600 | | | $ | 363,620 | | | $ | (24,844 | ) | | $ | 363,674 | |
| | | | | | | | | | | | | | | | | | | | |
The Condensed Consolidating Statements of Cash Flows include the cash flows from operating, investing and financing activities associated with discontinued operations.
290
Condensed Consolidating Statement of Cash Flows
| | | | | | | | | | | | | | | | | | | | |
| | | Year ended December 31, 2014 | |
| | | | | | | | | All other | | | | | | | |
| | | Popular, Inc. | | | PNA | | | subsidiaries | | | Elimination | | | Popular, Inc. | |
(In thousands) | | Holding Co. | | | Holding Co. | | | and eliminations | | | entries | | | Consolidated | |
| | | | | |
Cash flows from operating activities: | | | | | | | | | | | | | | | | | | | | |
| | | | | |
Net (loss) income | | $ | (313,490 | ) | | $ | (102,968 | ) | | $ | 184,469 | | | $ | (81,501 | ) | | $ | (313,490 | ) |
| | | | | | | | | | | | | | | | | | | | |
| | | | | |
Adjustments to reconcile net (loss) income to net cash (used in) provided by operating activities: | | | | | | | | | | | | | | | | | | | | |
Equity in undistributed (earnings) losses of subsidiaries | | | (171,998 | ) | | | 90,496 | | | | — | | | | 81,502 | | | | — | |
Provision (reversal) for loan losses | | | (200 | ) | | | — | | | | 263,569 | | | | — | | | | 263,369 | |
Goodwill impairment losses | | | — | | | | — | | | | 186,511 | | | | — | | | | 186,511 | |
Amortization of intangibles | | | — | | | | — | | | | 9,434 | | | | — | | | | 9,434 | |
Depreciation and amortization of premises and equipment | | | 648 | | | | — | | | | 46,489 | | | | — | | | | 47,137 | |
Net accretion of discounts and amortization of premiums and deferred fees | | | 404,461 | | | | — | | | | (125,885 | ) | | | — | | | | 278,576 | |
Fair value adjustments on mortgage servicing rights | | | — | | | | — | | | | 24,683 | | | | — | | | | 24,683 | |
FDIC loss-share expense | | | — | | | | — | | | | 103,024 | | | | — | | | | 103,024 | |
Adjustments (expense) to indemnity reserves on loans sold | | | — | | | | — | | | | 40,629 | | | | — | | | | 40,629 | |
Earnings from investments under the equity method | | | (12,291 | ) | | | 16 | | | | (27,303 | ) | | | — | | | | (39,578 | ) |
Deferred income tax expense | | | 8,203 | | | | — | | | | 35,308 | | | | 1 | | | | 43,512 | |
Loss (gain) on: | | | | | | | | | | | | | | | | | | | | |
Disposition of premises and equipment | | | 1 | | | | — | | | | (1,717 | ) | | | — | | | | (1,716 | ) |
Sale and valuation adjustments of investment securities | | | — | | | | — | | | | 870 | | | | — | | | | 870 | |
Sale of loans, including valuation adjustments on loans held for sale and mortgage banking activities | | | — | | | | — | | | | (88,724 | ) | | | — | | | | (88,724 | ) |
Sale of foreclosed assets, including write-downs | | | — | | | | — | | | | 28,005 | | | | — | | | | 28,005 | |
Disposal of discontinued business | | | — | | | | — | | | | (38,355 | ) | | | — | | | | (38,355 | ) |
Acquisitions of loans held-for-sale | | | — | | | | — | | | | (308,600 | ) | | | — | | | | (308,600 | ) |
Proceeds from sale of loans held-for-sale | | | — | | | | — | | | | 123,375 | | | | — | | | | 123,375 | |
Net originations on loans held-for-sale | | | — | | | | — | | | | (753,312 | ) | | | — | | | | (753,312 | ) |
Net (increase) decrease in: | | | | | | | | | | | | | | | | | | | | |
Trading securities | | | (288 | ) | | | — | | | | 1,105,662 | | | | — | | | | 1,105,374 | |
Accrued income receivable | | | (12 | ) | | | 2 | | | | 9,712 | | | | 17 | | | | 9,719 | |
Other assets | | | 4,099 | | | | (7,124 | ) | | | 158,585 | | | | (23,060 | ) | | | 132,500 | |
Net increase (decrease) in: | | | | | | | | | | | | | | | | | | | | |
Interest payable | | | 7,066 | | | | 20 | | | | (7,776 | ) | | | (17 | ) | | | (707 | ) |
Pension and other postretirement benefits obligations | | | — | | | | — | | | | (10,171 | ) | | | — | | | | (10,171 | ) |
Other liabilities | | | (180 | ) | | | (32,391 | ) | | | 40,449 | | | | 23,059 | | | | 30,937 | |
| | | | | | | | | | | | | | | | | | | | |
Total adjustments | | | 239,509 | | | | 51,019 | | | | 814,462 | | | | 81,502 | | | | 1,186,492 | |
| | | | | | | | | | | | | | | | | | | | |
Net cash (used in) provided by operating activities | | | (73,981 | ) | | | (51,949 | ) | | | 998,931 | | | | 1 | | | | 873,002 | |
| | | | | | | | | | | | | | | | | | | | |
| | | | | |
Cash flows from investing activities: | | | | | | | | | | | | | | | | | | | | |
Net (increase) decrease in money market investments | | | (1,026 | ) | | | 4,447 | | | | (963,907 | ) | | | (3,447 | ) | | | (963,933 | ) |
Purchases of investment securities: | | | | | | | | | | | | | | | | | | | | |
Available-for-sale | | | — | | | | — | | | | (2,001,940 | ) | | | — | | | | (2,001,940 | ) |
Held-to-maturity | | | — | | | | — | | | | (1,000 | ) | | | — | | | | (1,000 | ) |
Other | | | — | | | | — | | | | (110,010 | ) | | | — | | | | (110,010 | ) |
Proceeds from calls, paydowns, maturities and redemptions of investment securities: | | | | | | | | | | | | | | | | | | | | |
Available-for-sale | | | — | | | | — | | | | 1,722,650 | | | | — | | | | 1,722,650 | |
Held-to-maturity | | | — | | | | — | | | | 39,962 | | | | — | | | | 39,962 | |
Other | | | 1,000 | | | | — | | | | 91,752 | | | | — | | | | 92,752 | |
Proceeds from sale of investment securities: | | | | | | | | | | | | | | | | | | | | |
Available for sale | | | — | | | | — | | | | 310,210 | | | | — | | | | 310,210 | |
Other | | | — | | | | — | | | | 37,104 | | | | — | | | | 37,104 | |
Net repayments on loans | | | 465,452 | | | | — | | | | 776,179 | | | | (465,731 | ) | | | 775,900 | |
Proceeds from sale of loans | | | — | | | | — | | | | 355,145 | | | | — | | | | 355,145 | |
Acquisition of loan portfolios | | | — | | | | — | | | | (389,067 | ) | | | — | | | | (389,067 | ) |
Net payments from FDIC under loss-sharing agreements | | | — | | | | — | | | | 256,498 | | | | — | | | | 256,498 | |
Cash paid related to business acquisitions | | | — | | | | — | | | | (6,330 | ) | | | — | | | | (6,330 | ) |
Capital contribution to subsidiary | | | (100,000 | ) | | | — | | | | — | | | | 100,000 | | | | — | |
Return of capital from wholly-owned subsidiaries | | | 210,000 | | | | 250,000 | | | | — | | | | (460,000 | ) | | | — | |
Net cash disbursed from disposal of discontinued business | | | — | | | | — | | | | (205,895 | ) | | | — | | | | (205,895 | ) |
Acquisition of premises and equipment | | | (1,075 | ) | | | — | | | | (49,971 | ) | | | — | | | | (51,046 | ) |
Proceeds from sale of: | | | | | | | | | | | | | | | | | | | | |
Premises and equipment | | | 48 | | | | — | | | | 14,289 | | | | — | | | | 14,337 | |
Foreclosed assets | | | — | | | | — | | | | 150,115 | | | | — | | | | 150,115 | |
| | | | | | | | | | | | | | | | | | | | |
Net cash provided by investing activities | | | 574,399 | | | | 254,447 | | | | 25,784 | | | | (829,178 | ) | | | 25,452 | |
| | | | | | | | | | | | | | | | | | | | |
| | | | | |
Cash flows from financing activities: | | | | | | | | | | | | | | | | | | | | |
Net increase (decrease) in: | | | | | | | | | | | | | | | | | | | | |
Deposits | | | — | | | | — | | | | 115,453 | | | | (6,438 | ) | | | 109,015 | |
Federal funds purchased and assets sold under agreements to repurchase | | | — | | | | — | | | | (387,635 | ) | | | — | | | | (387,635 | ) |
Other short-term borrowings | | | — | | | | 8,169 | | | | (853,900 | ) | | | 465,731 | | | | (380,000 | ) |
Payments of notes payable | | | (936,000 | ) | | | (675 | ) | | | (122,615 | ) | | | — | | | | (1,059,290 | ) |
Proceeds from issuance of notes payable | | | 450,000 | | | | — | | | | 331,905 | | | | — | | | | 781,905 | |
Proceeds from issuance of common stock | | | 5,394 | | | | — | | | | — | | | | — | | | | 5,394 | |
Dividends paid | | | (3,723 | ) | | | — | | | | — | | | | — | | | | (3,723 | ) |
Repurchase of TARP-related warrants | | | (3,000 | ) | | | — | | | | — | | | | — | | | | (3,000 | ) |
Net payments for repurchase of common stock | | | (3,236 | ) | | | — | | | | — | | | | — | | | | (3,236 | ) |
Return of capital to parent company | | | — | | | | (210,000 | ) | | | (250,000 | ) | | | 460,000 | | | | — | |
Capital contribution from parent | | | — | | | | — | | | | 100,000 | | | | (100,000 | ) | | | — | |
| | | | | | | | | | | | | | | | | | | | |
Net cash used in financing activities | | | (490,565 | ) | | | (202,506 | ) | | | (1,066,792 | ) | | | 819,293 | | | | (940,570 | ) |
| | | | | | | | | | | | | | | | | | | | |
Net increase (decrease) in cash and due from banks | | | 9,853 | | | | (8 | ) | | | (42,077 | ) | | | (9,884 | ) | | | (42,116 | ) |
Cash and due from banks at beginning of period | | | 10,595 | | | | 616 | | | | 422,967 | | | | (10,967 | ) | | | 423,211 | |
| | | | | | | | | | | | | | | | | | | | |
Cash and due from banks at end of period | | $ | 20,448 | | | $ | 608 | | | $ | 380,890 | | | $ | (20,851 | ) | | $ | 381,095 | |
| | | | | | | | | | | | | | | | | | | | |
The Condensed Consolidating Statements of Cash Flows include the cash flows from operating, investing and financing activities associated with discontinued operations.
291
Condensed Consolidating Statement of Cash Flows
| | | | | | | | | | | | | | | | | | | | |
| | | Year ended December 31, 2013 | |
| | | | | | | | | All other | | | | | | | |
| | | Popular, Inc. | | | PNA | | | subsidiaries | | | Elimination | | | Popular, Inc. | |
(In thousands) | | Holding Co. | | | Holding Co. | | | and eliminations | | | entries | | | Consolidated | |
| | | | | |
Cash flows from operating activities: | | | | | | | | | | | | | | | | | | | | |
| | | | | |
Net income | | $ | 599,327 | | | $ | 71,856 | | | $ | 256,830 | | | $ | (328,686 | ) | | $ | 599,327 | |
| | | | | | | | | | | | | | | | | | | | |
| | | | | |
Adjustments to reconcile net income to net cash (used in) provided by operating activities: | | | | | | | | | | | | | | | | | | | | |
Equity in undistributed earnings of subsidiaries | | | (196,886 | ) | | | (94,926 | ) | | | — | | | | 291,812 | | | | — | |
Provision for loan losses | | | 398 | | | | — | | | | 602,165 | | | | — | | | | 602,563 | |
Amortization of intangibles | | | — | | | | — | | | | 9,883 | | | | — | | | | 9,883 | |
Depreciation and amortization of premises and equipment | | | 641 | | | | 2 | | | | 47,519 | | | | — | | | | 48,162 | |
Net accretion of discounts and amortization of premiums and deferred fees | | | 30,467 | | | | 444 | | | | (109,915 | ) | | | — | | | | (79,004 | ) |
Fair value adjustments on mortgage servicing rights | | | — | | | | — | | | | 11,403 | | | | — | | | | 11,403 | |
FDIC loss share expense | | | — | | | | — | | | | 82,051 | | | | — | | | | 82,051 | |
Adjustments (expense) to indemnity reserves on loans sold | | | — | | | | — | | | | 37,054 | | | | — | | | | 37,054 | |
Earnings from investments under the equity method | | | (17,308 | ) | | | (3,946 | ) | | | (21,619 | ) | | | — | | | | (42,873 | ) |
Deferred income tax benefit | | | (10,937 | ) | | | (1,710 | ) | | | (275,965 | ) | | | (142 | ) | | | (288,754 | ) |
Loss (gain) on: | | | | | | | | | | | | | | | | | | | | |
Disposition of premises and equipment | | | 49 | | | | (66 | ) | | | (3,375 | ) | | | — | | | | (3,392 | ) |
Sale and valuation adjustments of investment securities | | | (2,110 | ) | | | — | | | | — | | | | — | | | | (2,110 | ) |
Sale of loans, including valuation adjustments on loans held for sale and mortgage banking activities | | | — | | | | — | | | | 22,411 | | | | — | | | | 22,411 | |
Sale of stock in equity method investee | | | (416,113 | ) | | | — | | | | — | | | | — | | | | (416,113 | ) |
Sale of foreclosed assets, including write-downs | | | — | | | | — | | | | 50,740 | | | | — | | | | 50,740 | |
Acquisitions of loans held-for-sale | | | — | | | | — | | | | (390,018 | ) | | | — | | | | (390,018 | ) |
Proceeds from sale of loans held-for-sale | | | — | | | | — | | | | 218,379 | | | | — | | | | 218,379 | |
Net originations on loans held-for-sale | | | — | | | | — | | | | (1,049,474 | ) | | | — | | | | (1,049,474 | ) |
Net (increase) decrease in: | | | | | | | | | | | | | | | | | | | | |
Trading securities | | | (94 | ) | | | — | | | | 1,430,929 | | | | — | | | | 1,430,835 | |
Accrued income receivable | | | 1,612 | | | | (2 | ) | | | (7,104 | ) | | | (315 | ) | | | (5,809 | ) |
Other assets | | | 5,445 | | | | (1,818 | ) | | | (3,027 | ) | | | 2,227 | | | | 2,827 | |
Net increase (decrease) in: | | | | | | | | | | | | | | | | | | | | |
Interest payable | | | 2,704 | | | | (506 | ) | | | (4,663 | ) | | | (1 | ) | | | (2,466 | ) |
Pension and other postretirement benefits obligations | | | — | | | | — | | | | 10,635 | | | | — | | | | 10,635 | |
Other liabilities | | | (5,507 | ) | | | (2,370 | ) | | | (17,179 | ) | | | (1,896 | ) | | | (26,952 | ) |
| | | | | | | | | | | | | | | | | | | | |
Total adjustments | | | (607,639 | ) | | | (104,898 | ) | | | 640,830 | | | | 291,685 | | | | 219,978 | |
| | | | | | | | | | | | | | | | | | | | |
Net cash (used in) provided by operating activities | | | (8,312 | ) | | | (33,042 | ) | | | 897,660 | | | | (37,001 | ) | | | 819,305 | |
| | | | | | | | | | | | | | | | | | | | |
| | | | | |
Cash flows from investing activities: | | | | | | | | | | | | | | | | | | | | |
Net (increase) decrease in money market investments | | | (147 | ) | | | (3,937 | ) | | | 227,274 | | | | 3,937 | | | | 227,127 | |
Purchases of investment securities: | | | | | | | | | | | | | | | | | | | | |
Available-for-sale | | | — | | | | — | | | | (2,257,976 | ) | | | — | | | | (2,257,976 | ) |
Held-to-maturity | | | — | | | | — | | | | (250 | ) | | | — | | | | (250 | ) |
Other | | | — | | | | — | | | | (178,093 | ) | | | — | | | | (178,093 | ) |
Proceeds from calls, paydowns, maturities and redemptions of investment securities: | | | | | | | | | | | | | | | | | | | | |
Available-for-sale | | | 35,000 | | | | — | | | | 1,788,474 | | | | — | | | | 1,823,474 | |
Held-to-maturity | | | — | | | | — | | | | 4,632 | | | | — | | | | 4,632 | |
Other | | | — | | | | — | | | | 181,784 | | | | — | | | | 181,784 | |
Proceeds from sale of investment securities: | | | | | | | | | | | | | | | | | | | | |
Available for sale | | | 5,438 | | | | — | | | | — | | | | — | | | | 5,438 | |
Net (originations) repayments on loans | | | (233,745 | ) | | | — | | | | 625,364 | | | | 289,200 | | | | 680,819 | |
Proceeds from sale of loans | | | — | | | | — | | | | 333,021 | | | | — | | | | 333,021 | |
Acquisition of loan portfolios | | | — | | | | — | | | | (1,592,603 | ) | | | — | | | | (1,592,603 | ) |
Net payments from FDIC under loss-sharing agreements | | | — | | | | — | | | | 396,223 | | | | — | | | | 396,223 | |
Return of capital from equity method investments | | | — | | | | 491 | | | | — | | | | — | | | | 491 | |
Proceeds from sale of stock in equity method investee | | | 481,377 | | | | — | | | | — | | | | — | | | | 481,377 | |
Capital contribution to subsidiary | | | (272,500 | ) | | | — | | | | — | | | | 272,500 | | | | — | |
Mortgage servicing rights purchased | | | — | | | | — | | | | (45 | ) | | | — | | | | (45 | ) |
Acquisition of premises and equipment | | | (352 | ) | | | — | | | | (38,221 | ) | | | — | | | | (38,573 | ) |
Proceeds from sale of: | | | | | | | | | | | | | | | | | | | | |
Premises and equipment | | | 33 | | | | 180 | | | | 9,877 | | | | — | | | | 10,090 | |
Foreclosed assets | | | — | | | | — | | | | 226,063 | | | | — | | | | 226,063 | |
| | | | | | | | | | | | | | | | | | | | |
Net cash provided by (used in) investing activities | | | 15,104 | | | | (3,266 | ) | | | (274,476 | ) | | | 565,637 | | | | 302,999 | |
| | | | | | | | | | | | | | | | | | | | |
| | | | | |
Cash flows from financing activities: | | | | | | | | | | | | | | | | | | | | |
Net (decrease) increase in: | | | | | | | | | | | | | | | | | | | | |
Deposits | | | — | | | | — | | | | (310,417 | ) | | | (12,987 | ) | | | (323,404 | ) |
Federal funds purchased and assets sold under agreements to repurchase | | | — | | | | — | | | | (357,460 | ) | | | — | | | | (357,460 | ) |
Other short-term borrowings | | | — | | | | — | | | | 54,200 | | | | (289,200 | ) | | | (235,000 | ) |
Payments of notes payable | | | — | | | | (236,200 | ) | | | (95,831 | ) | | | — | | | | (332,031 | ) |
Proceeds from issuance of notes payable | | | — | | | | — | | | | 106,739 | | | | — | | | | 106,739 | |
Proceeds from issuance of common stock | | | 6,860 | | | | — | | | | — | | | | — | | | | 6,860 | |
Dividends paid to parent company | | | — | | | | — | | | | (37,000 | ) | | | 37,000 | | | | — | |
Dividends paid | | | (3,723 | ) | | | — | | | | — | | | | — | | | | (3,723 | ) |
Net payments for repurchase of common stock | | | (437 | ) | | | — | | | | — | | | | — | | | | (437 | ) |
Capital contribution from parent | | | — | | | | 272,500 | | | | — | | | | (272,500 | ) | | | — | |
| | | | | | | | | | | | | | | | | | | | |
Net cash provided by (used in) financing activities | | | 2,700 | | | | 36,300 | | | | (639,769 | ) | | | (537,687 | ) | | | (1,138,456 | ) |
| | | | | | | | | | | | | | | | | | | | |
Net increase (decrease) in cash and due from banks | | | 9,492 | | | | (8 | ) | | | (16,585 | ) | | | (9,051 | ) | | | (16,152 | ) |
Cash and due from banks at beginning of period | | | 1,103 | | | | 624 | | | | 439,552 | | | | (1,916 | ) | | | 439,363 | |
| | | | | | | | | | | | | | | | | | | | |
Cash and due from banks at end of period | | $ | 10,595 | | | $ | 616 | | | $ | 422,967 | | | $ | (10,967 | ) | | $ | 423,211 | |
| | | | | | | | | | | | | | | | | | | | |
The Condensed Consolidating Statements of Cash Flows include the cash flows from operating, investing and financing activities associated with discontinued operations.
292