Exhibit 99.1
Investor Presentation
Second Quarter 2016
Forward Looking Statements
This presentation contains forward-looking statements within the meaning of the Private Securities Litigation Reform Act of 1995. These forward-looking statements are based on management’s current expectations and are subject to risks and uncertainties. Please refer to our Annual Report on Form 10-K for the year ended December 31, 2015, the Quarterly Report on Form 10-Q for the quarter ended March 31, 2016 and our other filings with the Securities and Exchange Commission for a discussion of factors that may cause the Corporation’s actual results to differ materially from any future results expressed or implied by such forward-looking statements. Those filings are available on the Corporation’s website (www.popular.com) and on the Securities and Exchange Commission website (www.SEC.gov). The Corporation does not undertake to update or revise any forward-looking statement to reflect events or circumstances that may arise after the date of such statements.
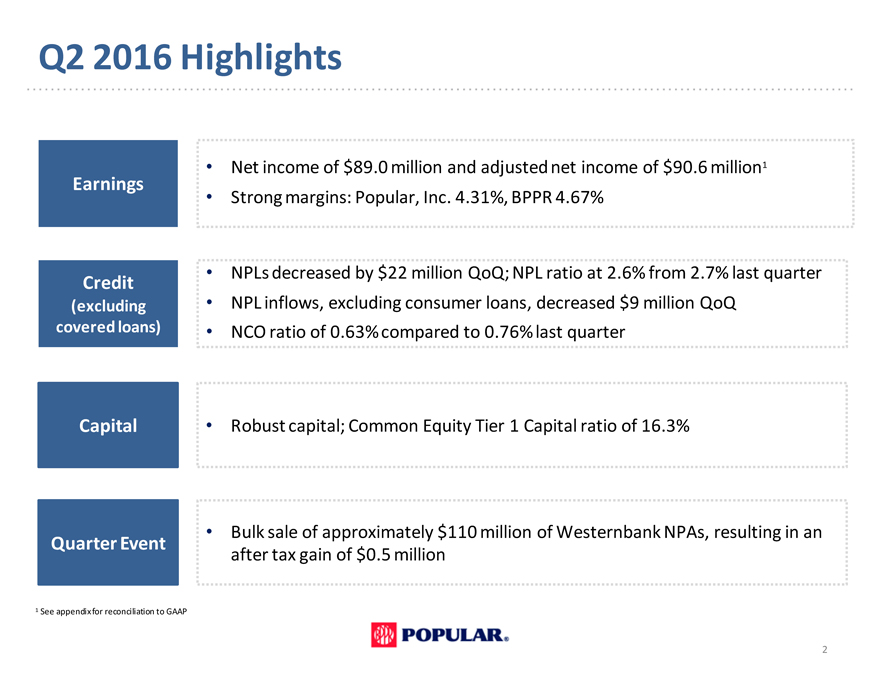
Q2 2016 Highlights
Net income of $89.0 million and adjusted net income of $90.6 million1
Earnings
Strong margins: Popular, Inc. 4.31%, BPPR 4.67%
NPLs decreased by $22 million QoQ; NPL ratio at 2.6% from 2.7% last quarter
Credit
(excluding NPL inflows, excluding consumer loans, decreased $9 million QoQ covered loans) NCO ratio of 0.63% compared to 0.76% last quarter
Capital • Robust capital; Common Equity Tier 1 Capital ratio of 16.3%
Bulk sale of approximately $110 million of Westernbank NPAs, resulting in an
Quarter Event after tax gain of $0.5 million
1 | | See appendix for reconciliation to GAAP |
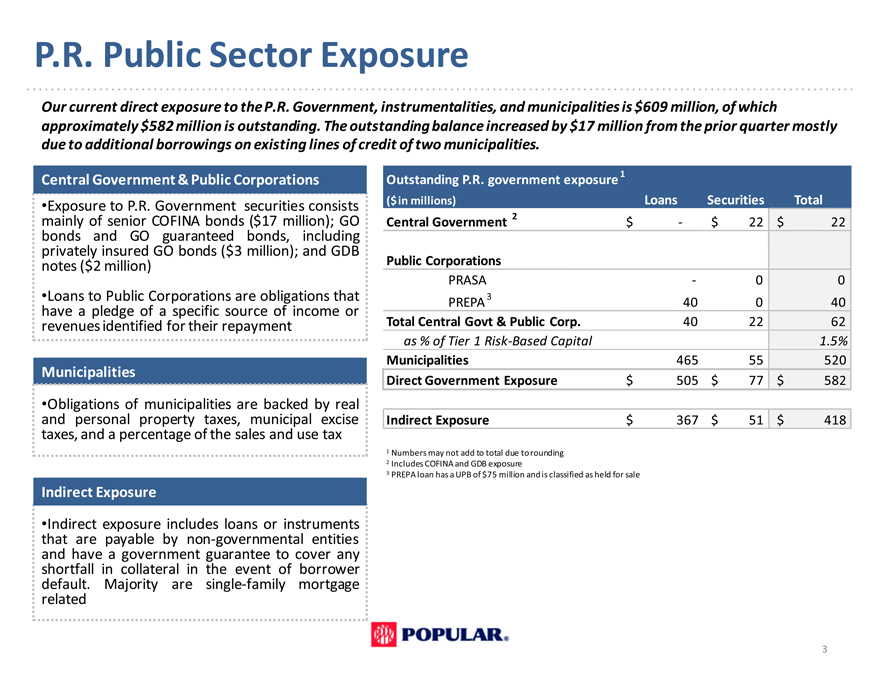
P.R. Public Sector Exposure
Our current direct exposure to the P.R. Government, instrumentalities, and municipalities is $609 million, of which approximately $582 million is outstanding. The outstanding balance increased by $17 million from the prior quarter mostly due to additional borrowings on existing lines of credit of two municipalities.
Central Government & Public Corporations
Exposure to P.R. Government securities consists mainly of senior COFINA bonds ($17 million); GO bonds and GO guaranteed bonds, including privately insured GO bonds ($3 million); and GDB notes ($2 million)
Loans to Public Corporations are obligations that have a pledge of a specific source of income or revenues identified for their repayment
Municipalities
Obligations of municipalities are backed by real and personal property taxes, municipal excise taxes, and a percentage of the sales and use tax
Indirect Exposure
Indirect exposure includes loans or instruments that are payable by non-governmental entities and have a government guarantee to cover any shortfall in collateral in the event of borrower default. Majority are single-family mortgage related
Outstanding P.R. government exposure1
($ in millions) Loans Securities Total
Central Government 2 $ —$ 22 $ 22
Public Corporations
PRASA — 0 0 PREPA 3 40 0 40 Total Central Govt & Public Corp. 40 22 62 as % of Tier 1 Risk-Based Capital 1.5%
Municipalities 465 55 520 Direct Government Exposure $ 505 $ 77 $ 582
Indirect Exposure $ 367 $ 51 $ 418
1 | | Numbers may not add to total due to rounding |
2 | | Includes COFINA and GDB exposure |
3 | | PREPA loan has a UPB of $75 million and is classified as held for sale |
Outstanding PR government exposure1
($ in millions) Loans Securities Total
Central Government 2 $ —$ 22 $ 22
Public Corporations
PRASA — 0 0 PREPA 3 40 0 40 Total Central Govt & Public Corp. 40 22 62 as % of Tier 1 Risk-Based Capital 1.5%
Municipalities 465 55 520 Direct Government Exposure $ 505 $ 77 $ 582
Indirect Exposure $ 367 $ 51 $ 418
1 | | Numbers may not add to total due to rounding |
2 | | Includes COFINA and GDB exposure |
3 | | PREPA loan has a UPB of $75 million and is classified as held for sale |
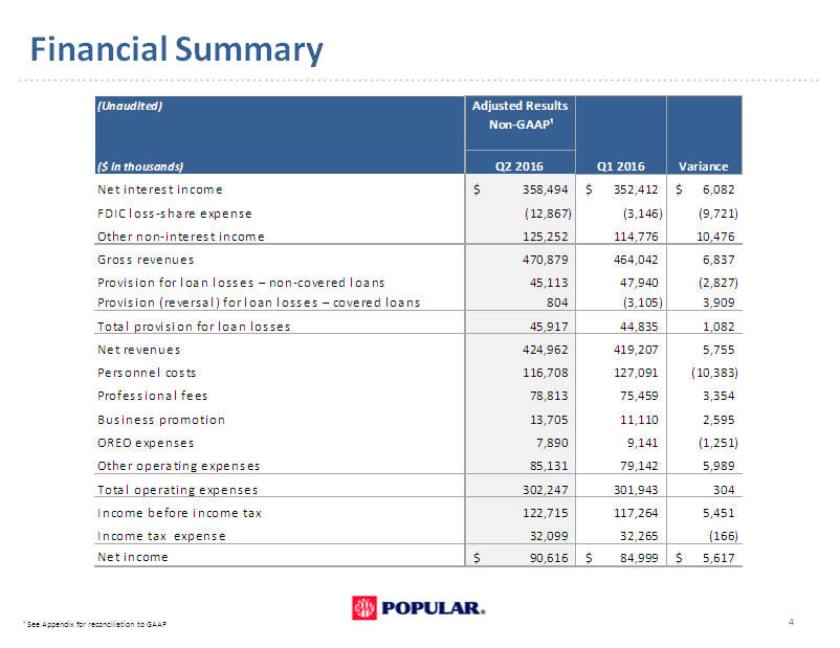
Financial Summary
(Unaudited) Adjusted Results
Non-GAAP¹
($ in thousands) Q2 2016 Q1 2016 Variance
Net interest income $ 358,494 $ 352,412 $ 6,082
FDIC loss -share expense(12,867)(3,146)(9,721)
Other non -interest income 125,252 114,776 10,476
Gross revenues 470,879 464,042 6,837
Provision for loan losses – non -covered loans 45,113 47,940(2,827)
Provision (reversal) for loan losses – covered loans 804(3,105) 3,909
Total provision for loan losses 45,917 44,835 1,082
Net revenues 424,962 419,207 5,755
Personnel costs 116,708 127,091(10,383)
Professional fees 78,813 75,459 3,354
Business promotion 13,705 11,110 2,595
OREO expenses 7,890 9,141(1,251)
Other operating expenses 85,131 79,142 5,989
Total operating expenses 302,247 301,943 304
Income before income tax 122,715 117,264 5,451
Income tax expense 32,099 32,265(166)
Net income $ 90,616 $ 84,999 $ 5,617
¹ See Appendix for reconciliation to GAAP 4
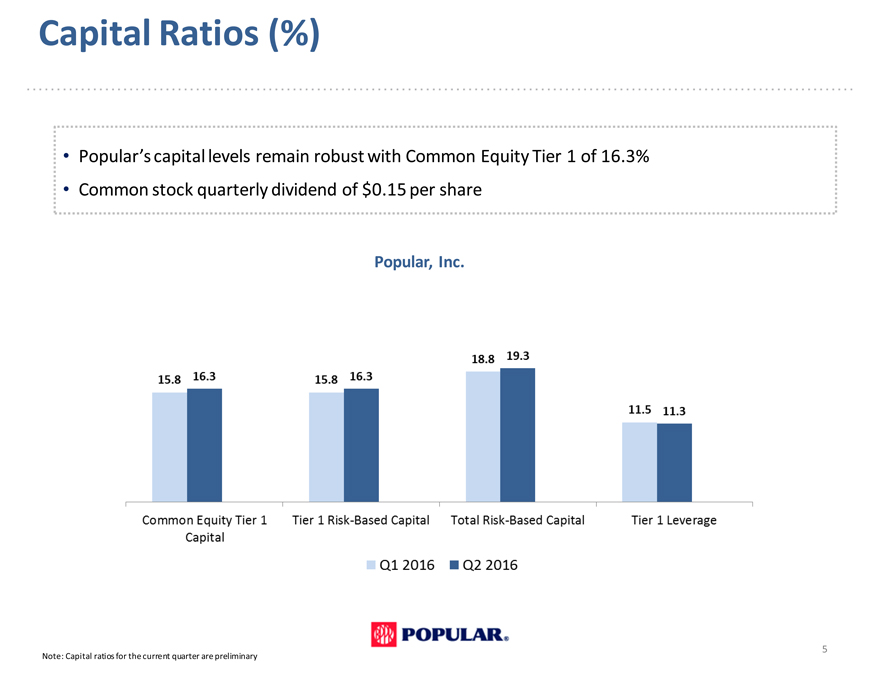
Capital Ratios (%)
Popular’s capital levels remain robust with Common Equity Tier 1 of 16.3%
Common stock quarterly dividend of $0.15 per share
Popular, Inc.
Note: Capital ratios for the current quarter are preliminary 5
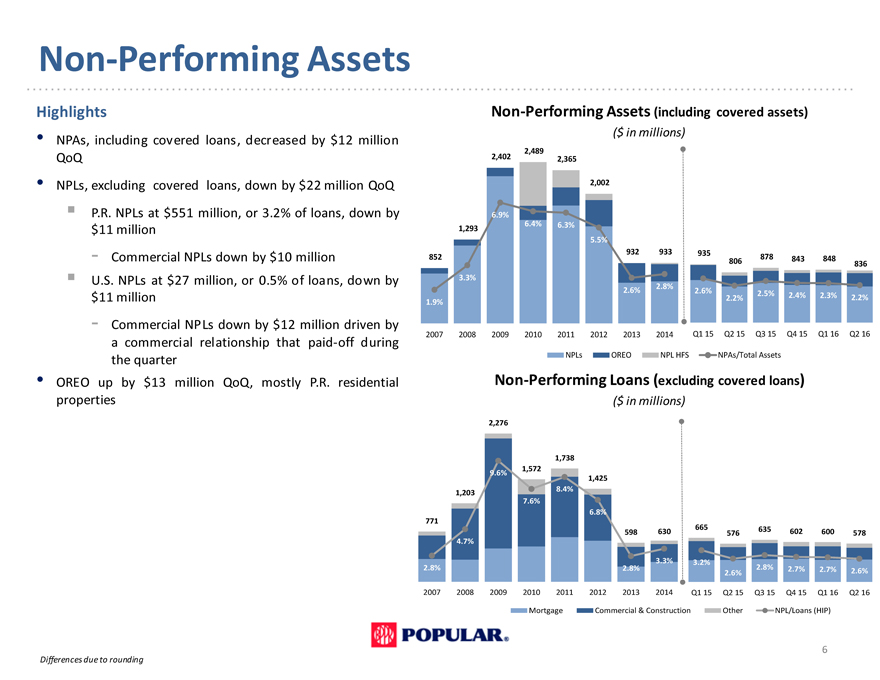
Non-Performing Assets
Highlights Non-Performing Assets (including covered assets)
NPAs, including covered loans, decreased by $12 million($ in millions)
2,489
QoQ 2,402 2,365
NPLs, excluding covered loans, down by $22 million QoQ 2,002
P.R. NPLs at $551 million, or 3.2% of loans, down by 6.9%
$11 million 1,293 6.4% 6.3%
5.5%
—Commercial NPLs down by $10 million 852 932 933 935 878 843 848
806 836
U.S. NPLs at $27 million, or 0.5% of loans, down by 3.3%
2.8%
$11 million 2.6% 2.6% 2.2% 2.5% 2.4% 2.3% 2.2%
1.9%
—Commercial NPLs down by $12 million driven by
2007 2008 2009 2010 2011 2012 2013 2014 Q1 15 Q2 15 Q3 15 Q4 15 Q1 16 Q2 16
a commercial relationship that paid-off during
the quarter NPLs OREO NPL HFS NPAs/Total Assets
OREO up by $13 million QoQ, mostly P.R. residential Non-Performing Loans (excluding covered loans)
properties($ in millions) 14.0%
2,276 12.0%
1,738 10.0%
1,425 8.0%
1,203 8.4%
7.6%
771
598 630 665 576 635 602 600 578
2.8% | | 2.8% 2.6% 2.8% 2.7% 2. 2.7% 0% 2.6% |
2007 2008 2009 2010 2011 2012 2013 2014 Q1 15 Q2 15 Q3 15 Q4 15 Q1 0.0% 16 Q2 16
Mortgage Commercial & Construction Other NPL/Loans (HIP)
Differences due to rounding
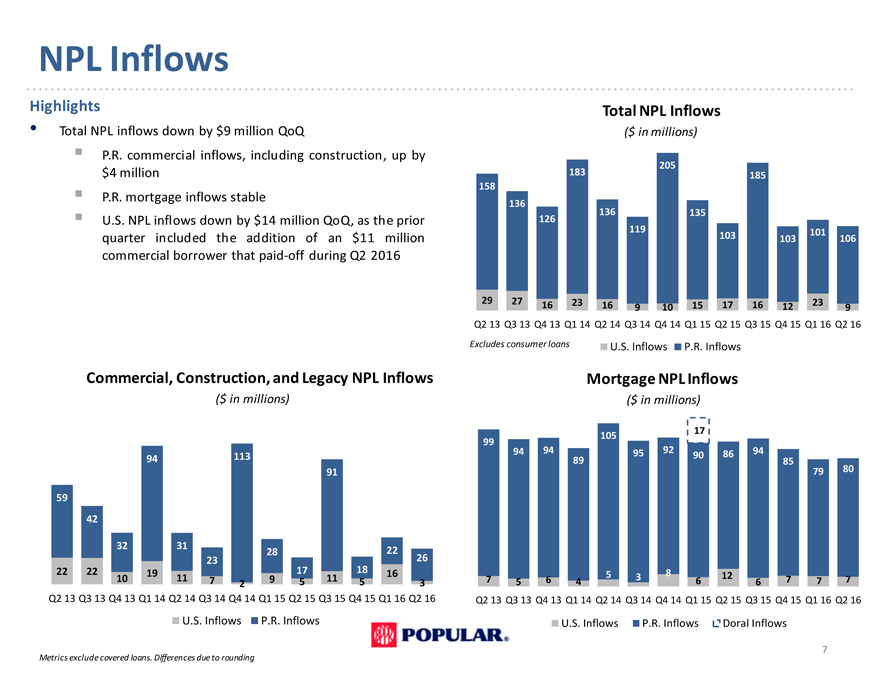
NPL Inflows
Highlights Total NPL Inflows
Total NPL inflows down by $9 million QoQ ($ in millions) ??P.R. commercial inflows, including construction, up by
205
$4 million 183 185
158
??P.R. mortgage inflows stable
136 136
135
U.S. NPL inflows down by $14 million QoQ, as the prior 126
119 101
quarter included the addition of an $11 million 103 103 106 commercial borrower that paid-off during Q2 2016
29 27 23 23
16 16 9 10 15 17 16 12 9
Q2 13 Q3 13 Q4 13 Q1 14 Q2 14 Q3 14 Q4 14 Q1 15 Q2 15 Q3 15 Q4 15 Q1 16 Q2 16
Excludes consumer loans U.S. Inflows P.R. Inflows
Commercial, Construction, and Legacy NPL Inflows Mortgage NPL Inflows ($ in millions) ($ in millions)
17 105
99 94 92
94 95 86 94
94 113 90
89 85 80
91 79 59 42
32 31
28 22
23 26
22 22 19 17 18 16 8
10 11 11 5 3 12
7 | | 9 5 5 3 7 5 6 4 6 6 7 7 7 |
Q2 13 Q3 13 Q4 13 Q1 14 Q2 14 Q3 14 Q4 14 Q1 15 Q2 15 Q3 15 Q4 15 Q1 16 Q2 16 Q2 13 Q3 13 Q4 13 Q1 14 Q2 14 Q3 14 Q4 14 Q1 15 Q2 15 Q3 15 Q4 15 Q1 16 Q2 16
U.S. Inflows P.R. Inflows U.S. Inflows P.R. Inflows Doral Inflows
Metrics exclude covered loans. Differences due to rounding
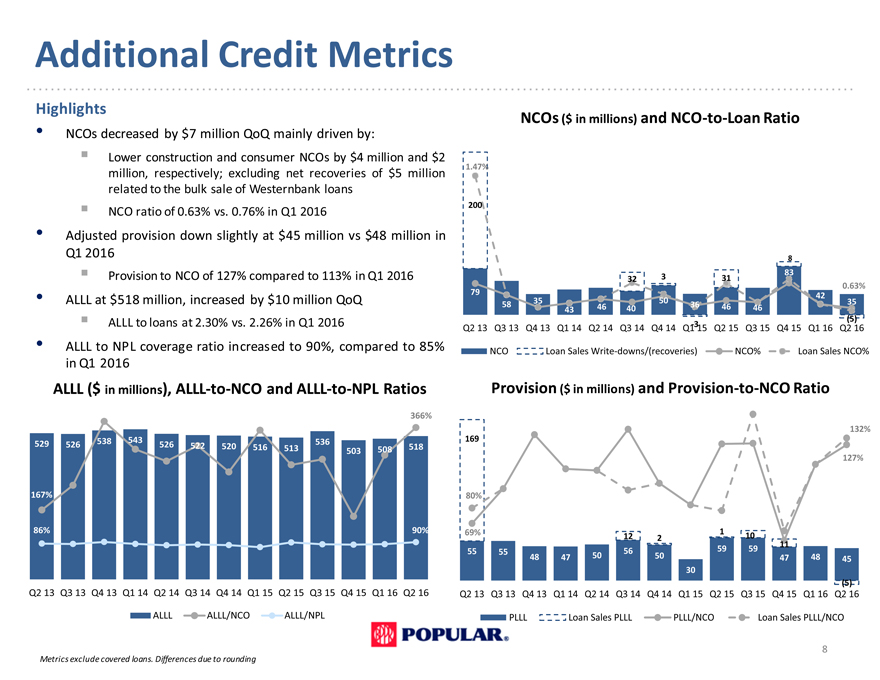
Additional Credit Metrics
Highlights
NCOs decreased by $7 million QoQ mainly driven by : NCOs ($ in millions) and NCO-to-Loan Ratio
Lower construction and consumer NCOs by $4 million and $2
1.47%
million, respectively; excluding net recoveries of $5 million
related to the bulk sale of Westernbank loans
NCO ratio of 0.63% vs. 0.76% in Q1 2016 200
Adjusted provision down slightly at $45 million vs $48 million in
Q1 2016 8
Provision to NCO of 127% compared to 113% in Q1 2016 83
0.63%
ALLL at $518 million, increased by $10 million QoQ 79 42
58 | | 35 46 40 50 36 46 46 35 |
? ALLL to loans at 2.30% vs. 2.26% in Q1 2016(5)
Q2 13 Q3 13 Q4 13 Q1 14 Q2 14 Q3 14 Q4 14 Q1-3 15 Q2 15 Q3 15 Q4 15 Q1 16 Q2 16
ALLL to NPL coverage ratio increased to 90%, compared to 85% NCO Loan Sales Write-downs/(recoveries) NCO% Loan Sales NCO%
in Q1 2016
ALLL ($ in millions), ALLL-to-NCO and ALLL-to-NPL Ratios Provision ($ in millions) and Provision-to-NCO Ratio
366%
132%
538 543 536 169
529 526 526 522 520 516 513 503 508 518
127%
167% 80%
86% 90% 69% 1
Q2 13 Q3 13 Q4 13 Q1 14 Q2 14 Q3 14 Q4 14 Q1 15 Q2 15 Q3 15 Q4 15 Q1 16 Q2 16 Q2 13 Q3 13 Q4 13 Q1 14 Q2 14 Q3 14 Q4 14 Q1 15 Q2 15 Q3 15 Q4 15 Q1 16 Q2 16
ALLL ALLL/NCO ALLL/NPL PLLL Loan Sales PLLL PLLL/NCO Loan Sales PLLL/NCO
Metrics exclude covered loans. Differences due to rounding
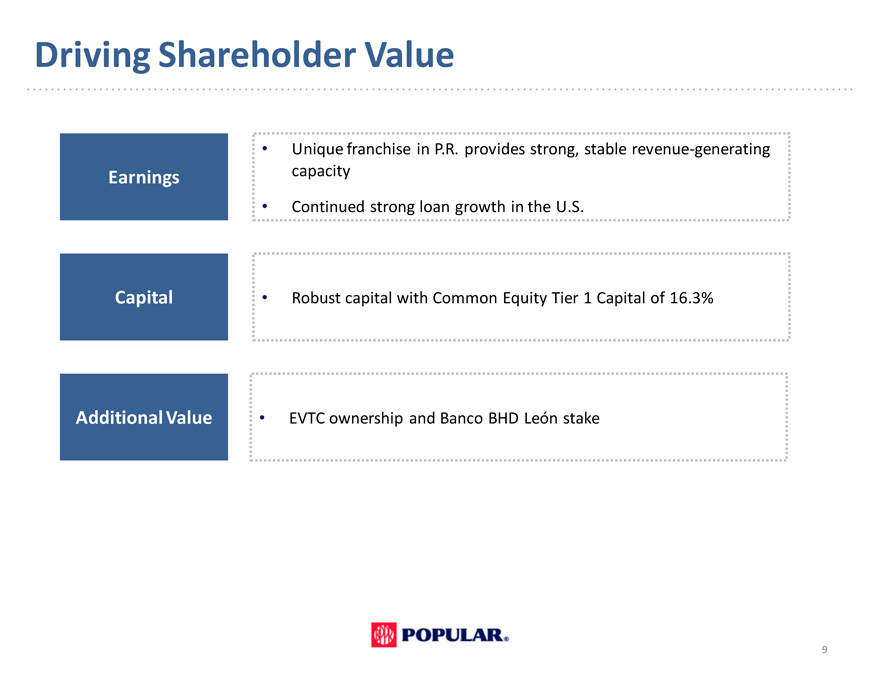
Driving Shareholder Value
Unique franchise in P.R. provides strong, stable revenue-generating
Earnings capacity
Continued strong loan growth in the U.S.
Capital Robust capital with Common Equity Tier 1 Capital of 16.3%
Additional Value • EVTC ownership and Banco BHD León stake
9
Investor Presentation
Second Quarter 2016
APPENDIX
Who We Are – Popular, Inc.
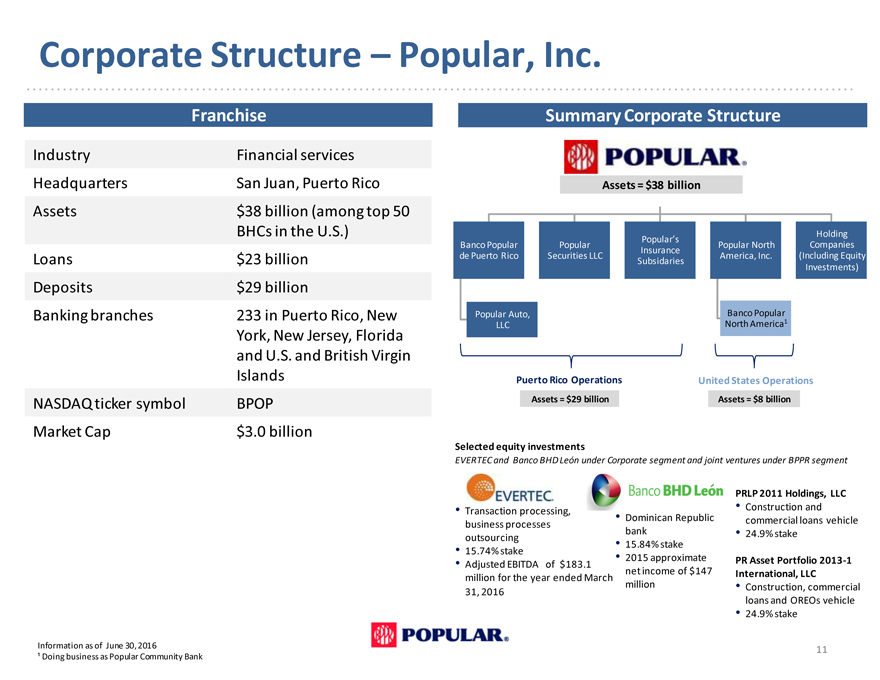
Corporate Structure – Popular, Inc.
Franchise Summary Corporate Structure
Industry Financial services
Headquarters San Juan, Puerto Rico Assets = $38 billion Assets $38 billion (among top 50
BHCs in the U.S.) Holding
Popular’s
Banco Popular Popular Popular North Companies Insurance de Puerto Rico Securities LLC America, Inc. (Including Equity
Loans $23 billion Subsidaries
Investments)
Deposits $29 billion
Banking branches 233 in Puerto Rico, New Popular Auto, Banco Popular
LLC North America1
York, New Jersey, Florida and U.S. and British Virgin
Islands Puerto Rico Operations United States Operations
NASDAQ ticker symbol BPOP Assets = $29 billion Assets = $8 billion Market Cap $3.0 billion
Selected equity investments
EVERTEC and Banco BHD León under Corporate segment and joint ventures under BPPR segment
PRLP 2011 Holdings, LLC
Transaction processing, Construction and
Dominican Republic commercial loans vehicle business processes bank 24.9% stake outsourcing
15.84% stake
15.74% stake
2015 approximate PR Asset Portfolio 2013-1
Adjusted EBITDA of $183.1 net income of $147 International, LLC million for the year ended March million Construction, commercial 31, 2016 loans and OREOs vehicle
24.9% stake
Information as of June 30, 2016 11
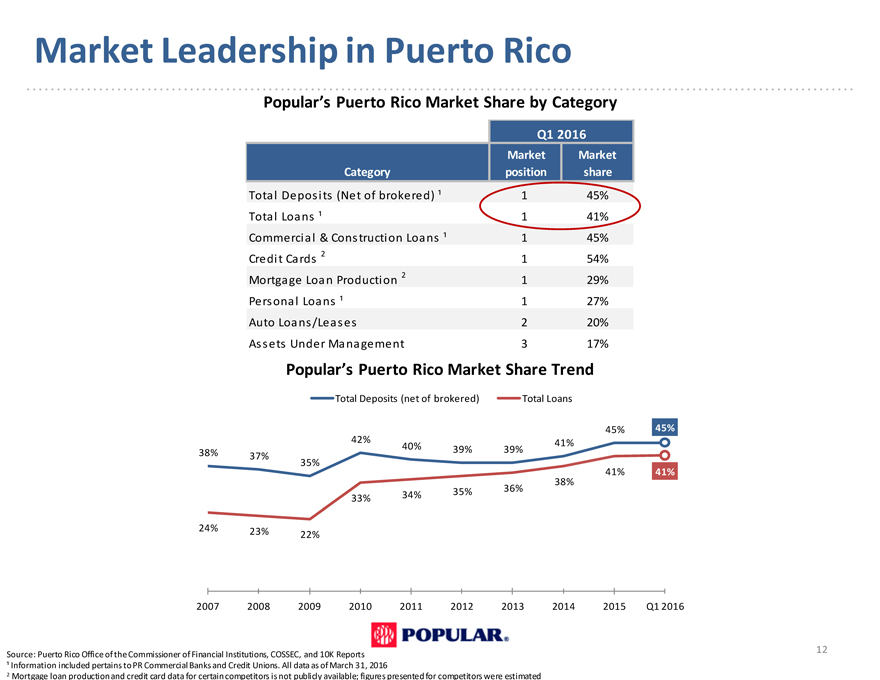
Market Leadership in Puerto Rico
Popular’s Puerto Rico Market Share by Category
Q1 2016
Market Market Category position share
Total Deposits (Net of brokered) ¹ 1 45% Total Loans ¹ 1 41% Commercial & Construction Loans ¹ 1 45% Credit Cards 2 1 54% Mortgage Loan Production 2 1 29% Personal Loans ¹ 1 27% Auto Loans/Leases 2 20% Assets Under Management 3 17%
Popular’s Puerto Rico Market Share Trend
Total Deposits (net of brokered) Total Loans
45% 45%
42% 41%
40% 39% 39%
38% 37%
35%
41% 41% 38% 35% 36% 33% 34%
24% 23%
22%
2007 2008 2009 2010 2011 2012 2013 2014 2015 Q1 2016
12
Source: Puerto Rico Office of the Commissioner of Financial Institutions, COSSEC, and 10K Reports
Information included pertains to PR Commercial Banks and Credit Unions. All data as of March 31, 2016
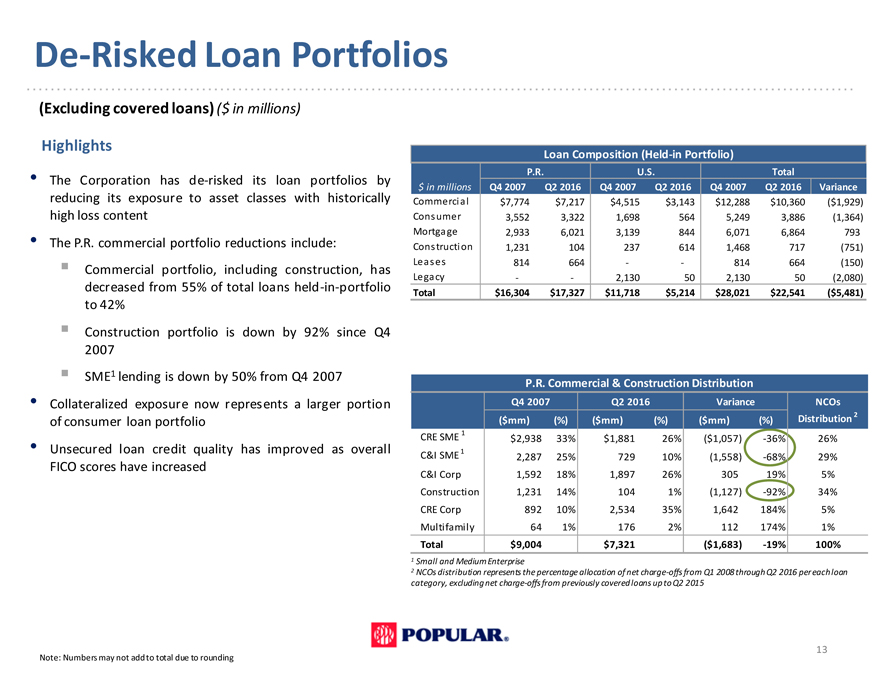
De-Risked Loan Portfolios
(Excluding covered loans) ($ in millions)
Highlights
The Corporation has de-risked its loan portfolios by reducing its exposure to asset classes with historically high loss content
The P.R. commercial portfolio reductions include: ??Commercial portfolio, including construction, has decreased from 55% of total loans held-in-portfolio to 42% ??Construction portfolio is down by 92% since Q4 2007 ??SME1 lending is down by 50% from Q4 2007
Collateralized exposure now represents a larger portion of consumer loan portfolio
Unsecured loan credit quality has improved as overall FICO scores have increased
Loan Composition (Held-in Portfolio)
P.R. U.S. Total
$ in millions Q4 2007 Q2 2016 Q4 2007 Q2 2016 Q4 2007 Q2 2016 Variance
Commercial $7,774 $7,217 $4,515 $3,143 $12,288 $10,360($1,929)
Consumer 3,552 3,322 1,698 564 5,249 3,886(1,364)
Mortgage 2,933 6,021 3,139 844 6,071 6,864 793
Construction 1,231 104 237 614 1,468 717(751)
Leases 814 664 — 814 664(150)
Legacy — 2,130 50 2,130 50(2,080)
Total $16,304 $17,327 $11,718 $5,214 $28,021 $22,541($5,481)
P.R. Commercial & Construction Distribution
Q4 2007 Q2 2016 Variance NCOs
($mm)(%)($mm)(%)($mm)(%) Distribution 2
CRE SME 1 $2,938 33% $1,881 26%($1,057) -36% 26%
C&I SME 1 2,287 25% 729 10%(1,558) -68% 29%
C&I Corp 1,592 18% 1,897 26% 305 19% 5%
Construction 1,231 14% 104 1%(1,127) -92% 34%
CRE Corp 892 10% 2,534 35% 1,642 184% 5%
Multifamily 64 1% 176 2% 112 174% 1%
Total $9,004 $7,321($1,683) -19% 100%
1 Small and Medium Enterprise
2 NCOs distribution represents the percentage allocation of net charge-offs from Q1 2008 through Q2 2016 per each loan
category, excluding net charge-offs from previously covered loans up to Q2 2015
13
Note: Numbers may not add to total due to rounding
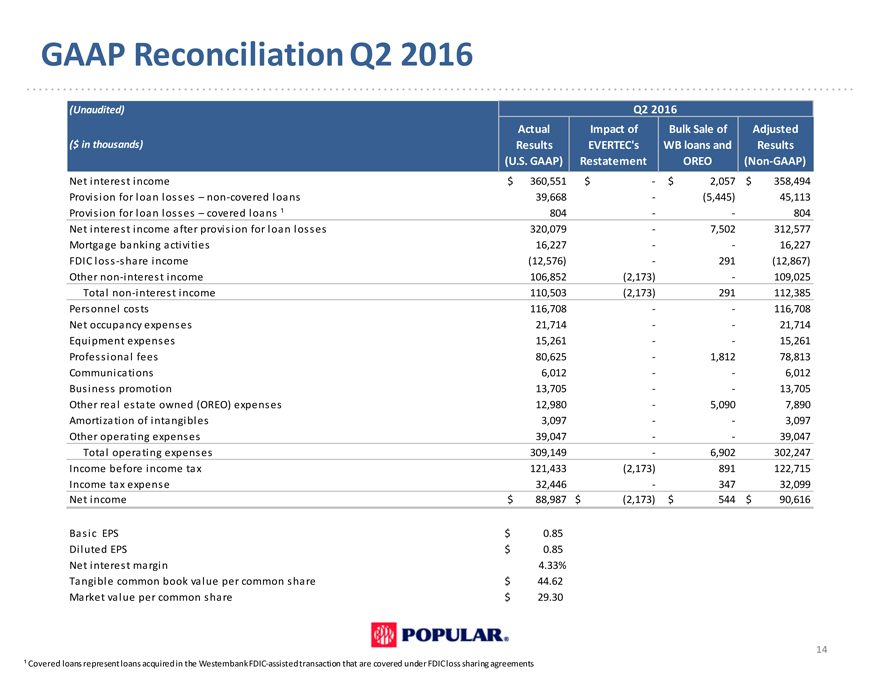
GAAP Reconciliation Q2 2016
(Unaudited) Q2 2016
Actual Impact of Bulk Sale of Adjusted
($ in thousands) Results EVERTEC’s WB loans and Results
(U.S. GAAP) Restatement OREO(Non-GAAP)
Net interest income $ 360,551 $—$ 2,057 $ 358,494
Provision for loan losses – non-covered loans 39,668 -(5,445) 45,113
Provision for loan losses – covered loans ą 804 — 804
Net interest income after provision for loan losses 320,079—7,502 312,577
Mortgage banking activities 16,227 — 16,227
FDIC loss -share income(12,576)—291(12,867)
Other non-interest income 106,852(2,173)—109,025
Total non-interest income 110,503(2,173) 291 112,385
Personnel costs 116,708 — 116,708
Net occupancy expenses 21,714 — 21,714
Equipment expenses 15,261 — 15,261
Professional fees 80,625—1,812 78,813
Communications 6,012 — 6,012
Business promotion 13,705 — 13,705
Other real estate owned (OREO) expenses 12,980—5,090 7,890
Amortization of intangibles 3,097 — 3,097
Other operating expenses 39,047 — 39,047
Total operating expenses 309,149—6,902 302,247
Income before income tax 121,433(2,173) 891 122,715
Income tax expense 32,446—347 32,099
Net income $ 88,987 $(2,173) $ 544 $ 90,616
Basic EPS $ 0.85
Diluted EPS $ 0.85
Net interest margin 4.33%
Tangible common book value per common share $ 44.62
Market value per common share $ 29.30
14
¹ Covered loans represent loans acquired in the Westernbank FDIC-assisted transaction that are covered under FDIC loss sharing agreements
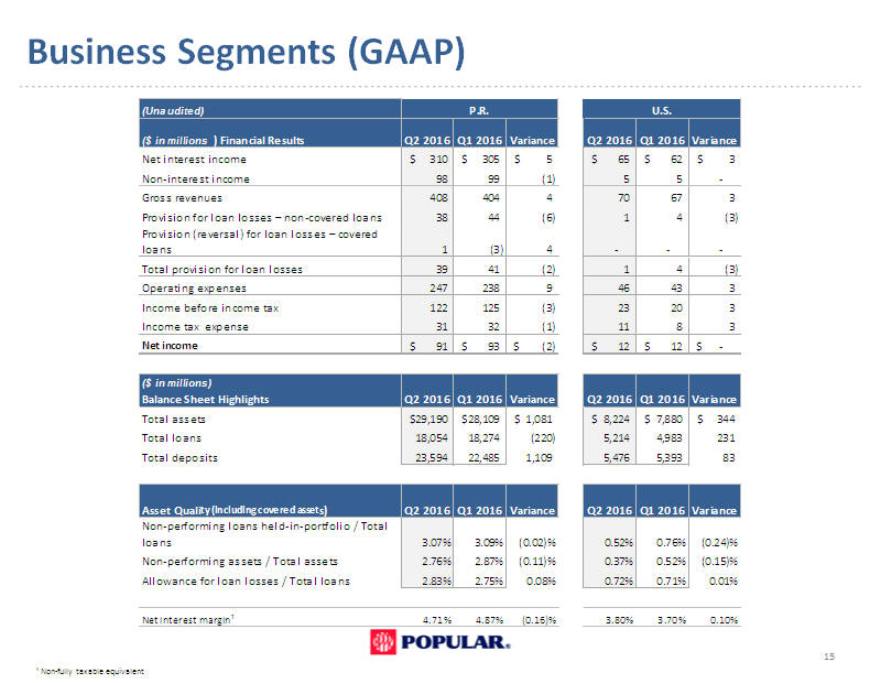
Business Segments (GAAP)
(Una udite d) P.R. U.S.
($ in millions ) Financial Results Q2 2016 Q1 2016 Variance Q2 2016 Q1 2016 Variance
Net interest income $ 310 $ 305 $ 5 $ 65 $ 62 $ 3
Non-interest income 98 99(1) 5 5 -
Gross revenues 408 404 4 70 67 3
Provision for loan losses – non-covered loans 38 44(6) 1 4(3)
Provision (reversal) for loan losses – covered
loans 1(3) 4 — -
Total provision for loan losses 39 41(2) 1 4(3)
Operating expenses 247 238 9 46 43 3
Income before income tax 122 125(3) 23 20 3
Income tax expense 31 32(1) 11 8 3
Net income $ 91 $ 93 $(2) $ 12 $ 12 $ -
($ in millions)
Balance Sheet Highlights Q2 2016 Q1 2016 Variance Q2 2016 Q1 2016 Variance
Total assets $29,190 $28,109 $ 1,081 $ 8,224 $ 7,880 $ 344
Total loans 18,054 18,274(220) 5,214 4,983 231
Total deposits 23,594 22,485 1,109 5,476 5,393 83
Asset Quality (including covered assets) Q2 2016 Q1 2016 Variance Q2 2016 Q1 2016 Variance
Non-performing loans held-in-portfolio / Total
loans 3.07% 3.09%(0.02)% 0.52% 0.76%(0.24)%
Non-performing assets / Total assets 2.76% 2.87%(0.11)% 0.37% 0.52%(0.15)%
Allowance for loan losses / Total loans 2.83% 2.75% 0.08% 0.72% 0.71% 0.01%
Net interest margin¹ 4.71% 4.87%(0.16)% 3.80% 3.70% 0.10%
15
¹ Non-fully taxable equivalent
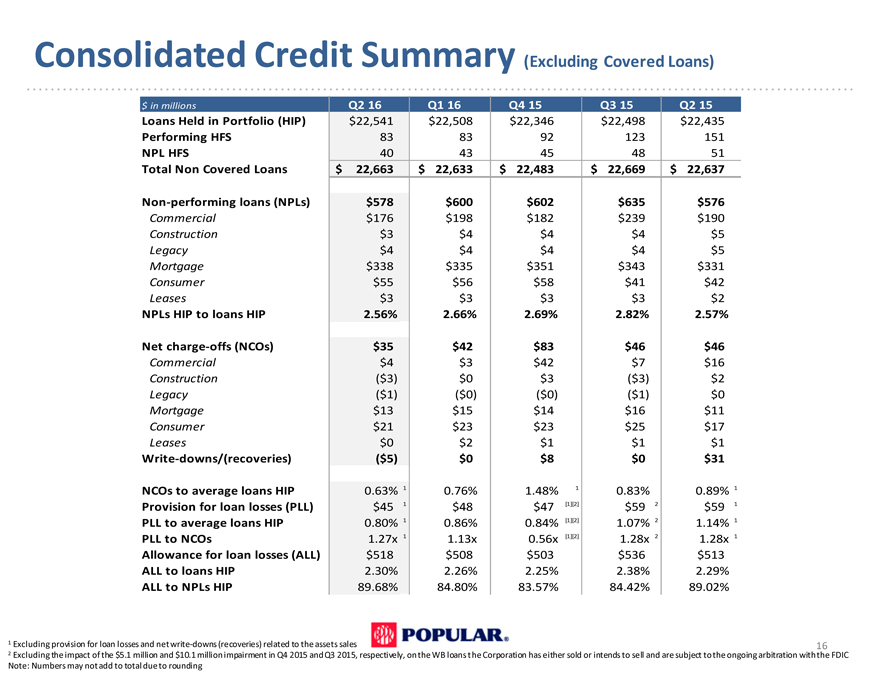
Consolidated Credit Summary (Excluding Covered Loans)
$ in millions Q2 16 Q1 16 Q4 15 Q3 15 Q2 15
Loans Held in Portfolio (HIP) $22,541 $22,508 $22,346 $22,498 $22,435
Performing HFS 83 83 92 123 151
NPL HFS 40 43 45 48 51
Total Non Covered Loans $ 22,663 $ 22,633 $ 22,483 $ 22,669 $ 22,637
Non-performing loans (NPLs) $578 $600 $602 $635 $576
Commercial $176 $198 $182 $239 $190
Construction $3 $4 $4 $4 $5
Legacy $4 $4 $4 $4 $5
Mortgage $338 $335 $351 $343 $331
Consumer $55 $56 $58 $41 $42
Leases $3 $3 $3 $3 $2
NPLs HIP to loans HIP 2.56% 2.66% 2.69% 2.82% 2.57%
Net charge-offs (NCOs) $35 $42 $83 $46 $46
Commercial $4 $3 $42 $7 $16
Construction($3) $0 $3($3) $2
Legacy($1)($0)($0)($1) $0
Mortgage $13 $15 $14 $16 $11
Consumer $21 $23 $23 $25 $17
Leases $0 $2 $1 $1 $1
Write-downs/(recoveries)($5) $0 $8 $0 $31
NCOs to average loans HIP 0.63% 1 0.76% 1.48% 1 0.83% 0.89% 1
Provision for loan losses (PLL) $45 1 $48 $47 [1][2] $59 2 $59 1
PLL to average loans HIP 0.80% 1 0.86% 0.84% [1][2] 1.07% 2 1.14% 1
PLL to NCOs 1.27x 1 1.13x 0.56x [1][2] 1.28x 2 1.28x 1
Allowance for loan losses (ALL) $518 $508 $503 $536 $513
ALL to loans HIP 2.30% 2.26% 2.25% 2.38% 2.29%
ALL to NPLs HIP 89.68% 84.80% 83.57% 84.42% 89.02%
Average Loans $22,432,172 $22,253,748 $22,323,766 $22,300,441 $20,929,434
1 Excluding provision for loan losses and net write-downs (recoveries) related to the assets sales 16
2 Excluding the impact of the $5.1 million and $10.1 million impairment in Q4 2015 and Q3 2015, respectively, on the WB loans the Corporation has either sold or intends to sell and are subject to the ongoing arbitration with the FDIC
Note: Numbers may not add to total due to rounding
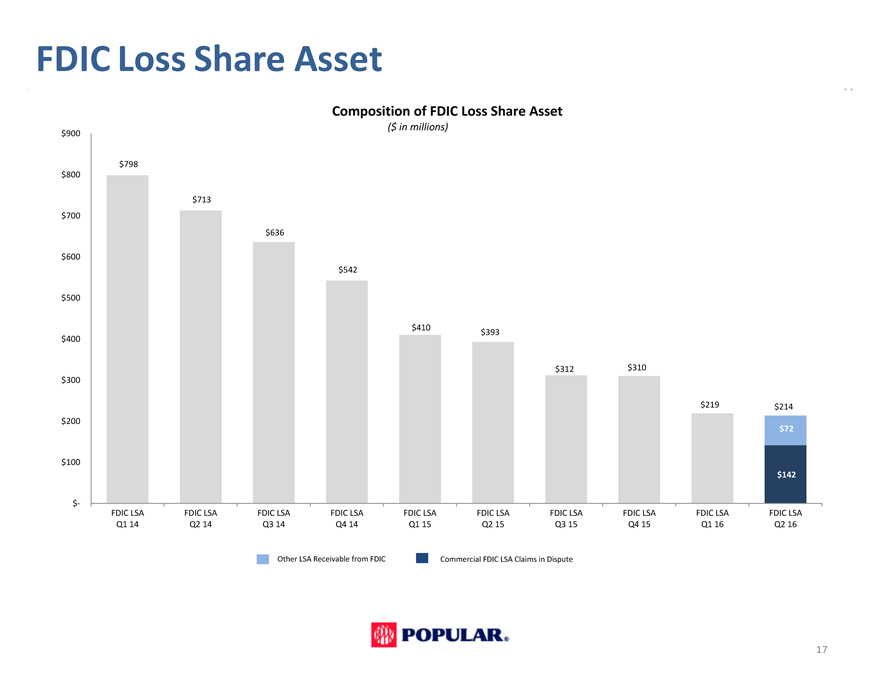
FDIC Loss Share Asset
Composition of FDIC Loss Share Asset
($ in millions)
$900
$798
$800
$713
$700
$636
$600
$542
$500
$410 $393
$400
$312 $310
$300
$219 $214
$200
$72
$100
$142
$-
FDIC LSA FDIC LSA FDIC LSA FDIC LSA FDIC LSA FDIC LSA FDIC LSA FDIC LSA FDIC LSA FDIC LSA
Q1 14 Q2 14 Q3 14 Q4 14 Q1 15 Q2 15 Q3 15 Q4 15 Q1 16 Q2 16
Other LSA Receivable from FDIC Commercial FDIC LSA Claims in Dispute
17
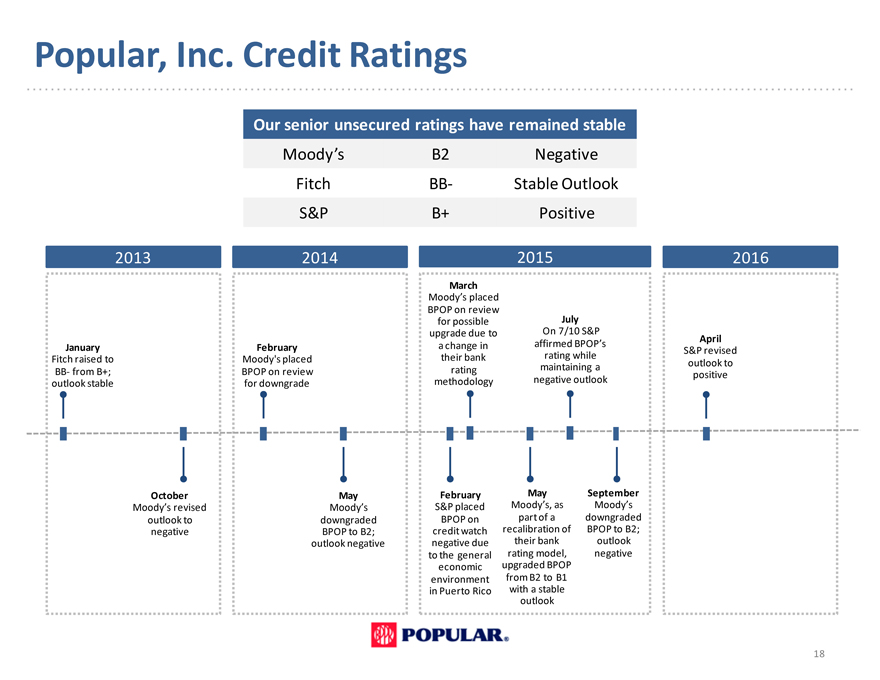
Popular, Inc. Credit Ratings
Our senior unsecured ratings have remained stable
Moody’s B2 Negative
Fitch BB- Stable Outlook
S&P B+ Positive
2013 2014 2015 2016
March
Moody’s placed
BPOP on review
for possible July
upgrade due to On 7/10 S&P
January February a change in affirmed BPOP’s April
S&P revised
Fitch raised to Moody’s placed their bank rating while outlook to
BB- from B+; BPOP on review rating maintaining a
positive
outlook stable for downgrade methodology negative outlook
October May February May September
Moody’s revised Moody’s S&P placed Moody’s, as Moody’s
outlook to downgraded BPOP on part of a downgraded
negative BPOP to B2; credit watch recalibration of BPOP to B2;
outlook negative negative due their bank outlook
to the general rating model, negative
economic upgraded BPOP
environment from B2 to B1
in Puerto Rico with a stable
outlook
18
Investor Presentation
Second Quarter 2016
Investor Presentation
Second Quarter 2016