
INVESTOR PRESENTATION Second Quarter 2022 Exhibit 99.2
Cautionary Note Regarding Forward-Looking Statements This presentation contains “forward-looking statements” within the meaning of the U.S. Private Securities Litigation Reform Act of 1995, including without limitation those about Popular, Inc.’s (“Popular” or the “Corporation”) acquisition of certain assets and assumption of certain liabilities from Evertec, Inc. and the transactions described in this presentation (the “Transaction”), as well as the financial effects and business opportunities from the Transaction. These statements are not guarantees of future performance, are based on the current expectations of Popular’s management and, by their nature, involve risks, uncertainties, estimates and assumptions. Potential factors, some of which are beyond the Corporation’s control, could cause actual results to differ materially from those expressed in, or implied by, such forward-looking statements. More information on the risks and important factors that could affect the Corporation’s future results and financial condition is included in our Annual Report on Form 10-K for the year ended December 31, 2021 and our Quarterly Reports on Form 10-Q for the quarters ended March 31, 2022 and June 30, 2022 as filed with the Securities and Exchange Commission. Our filings are available on the Corporation’s website (www.popular.com) and on the Securities and Exchange Commission website (www.sec.gov). The Corporation assumes no obligation to update or revise any forward-looking statements which speak as of their respective dates.
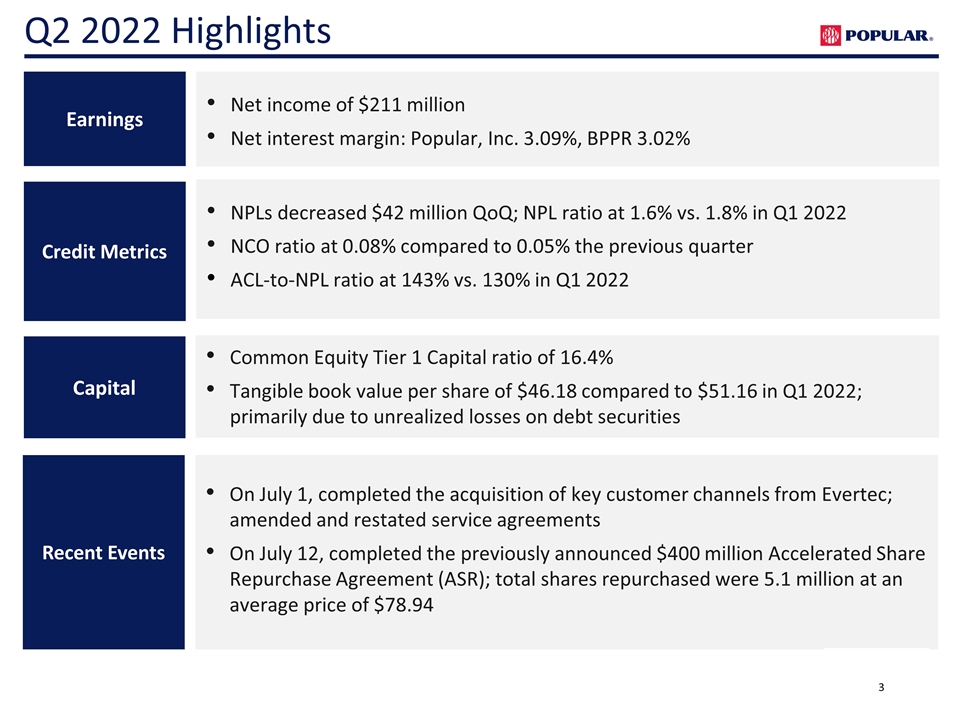
NPLs decreased $42 million QoQ; NPL ratio at 1.6% vs. 1.8% in Q1 2022 NCO ratio at 0.08% compared to 0.05% the previous quarter ACL-to-NPL ratio at 143% vs. 130% in Q1 2022 Credit Metrics Net income of $211 million Net interest margin: Popular, Inc. 3.09%, BPPR 3.02% Earnings On July 1, completed the acquisition of key customer channels from Evertec; amended and restated service agreements On July 12, completed the previously announced $400 million Accelerated Share Repurchase Agreement (ASR); total shares repurchased were 5.1 million at an average price of $78.94 Recent Events Capital Common Equity Tier 1 Capital ratio of 16.4% Tangible book value per share of $46.18 compared to $51.16 in Q1 2022; primarily due to unrealized losses on debt securities Q2 2022 Highlights

Business Metrics BPPR: Commercial loans, excluding PPP, increased $327 million or 4% from Q1 2022 Auto and lease financing portfolio increased $114 million or 2% from Q1 2022 Mortgage originations were 42% lower than Q2 2021 Credit and debit card sales (in dollars) were 1% lower than Q2 2021 P.R. public funds at $17 billion as of June 2022, an increase of $2 billion from Q1 2022 Deposits, excluding P.R. public funds, flat QoQ Total deposit cost increased two basis points QoQ to 0.14% Popular Bank: Commercial loans, excluding PPP, increased $275 million or 4% from Q1 2022 Total deposit cost increased six basis points QoQ to 0.42% 1 Customers who have logged on to Popular’s web and/or mobile platform in the past 30 days BPPR Customer Engagement Total customers reached 1.96 million, an increase of 6,000 from Q1 2022 and 26,000 higher than Q2 2021 1.1 million customers or 57% of our total customers are active online users1 Deposits captured through digital channels were 64% in Q2 2022, compared to 68% in Q2 2021 Business Highlights
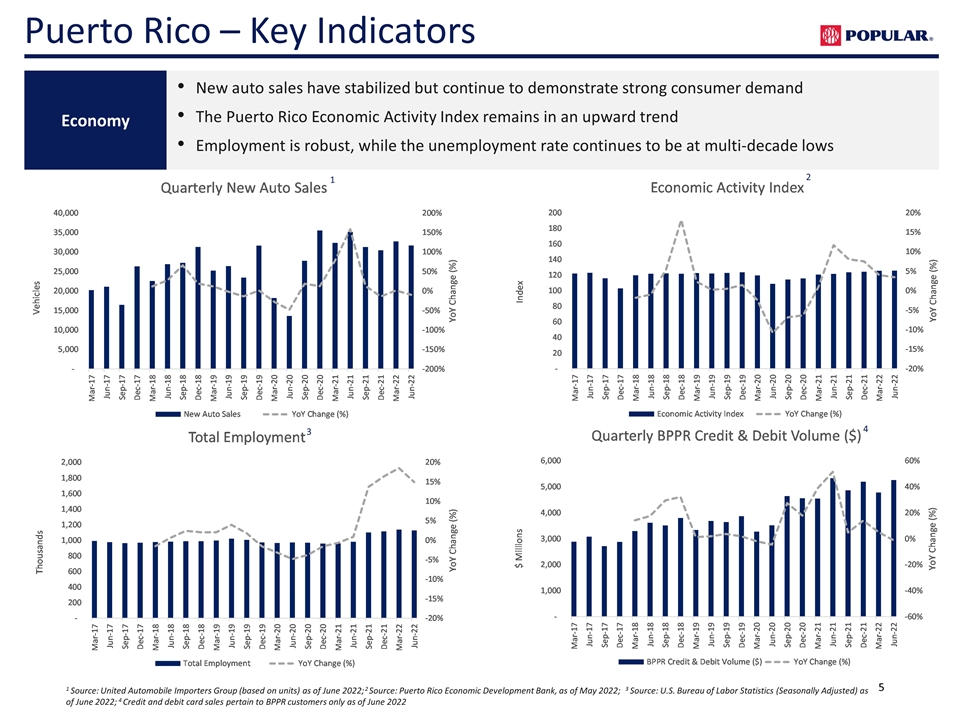
Economy 1 Source: United Automobile Importers Group (based on units) as of June 2022; 2 Source: Puerto Rico Economic Development Bank, as of May 2022; 3 Source: U.S. Bureau of Labor Statistics (Seasonally Adjusted) as of June 2022; 4 Credit and debit card sales pertain to BPPR customers only as of June 2022 New auto sales have stabilized but continue to demonstrate strong consumer demand The Puerto Rico Economic Activity Index remains in an upward trend Employment is robust, while the unemployment rate continues to be at multi-decade lows 1 2 3 4 Puerto Rico – Key Indicators
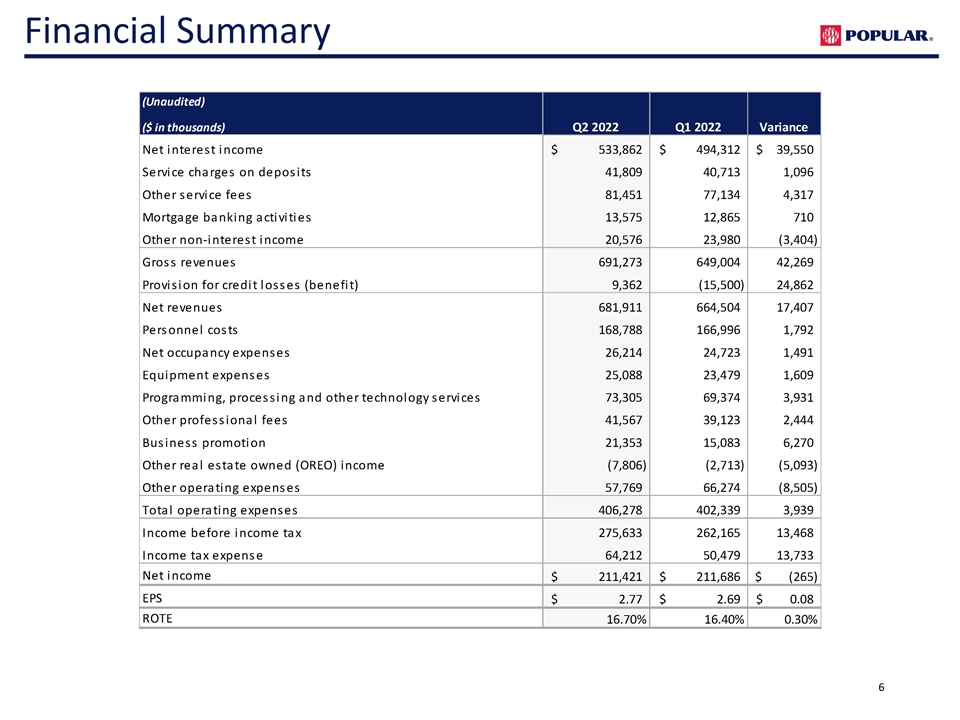
6 Financial Summary
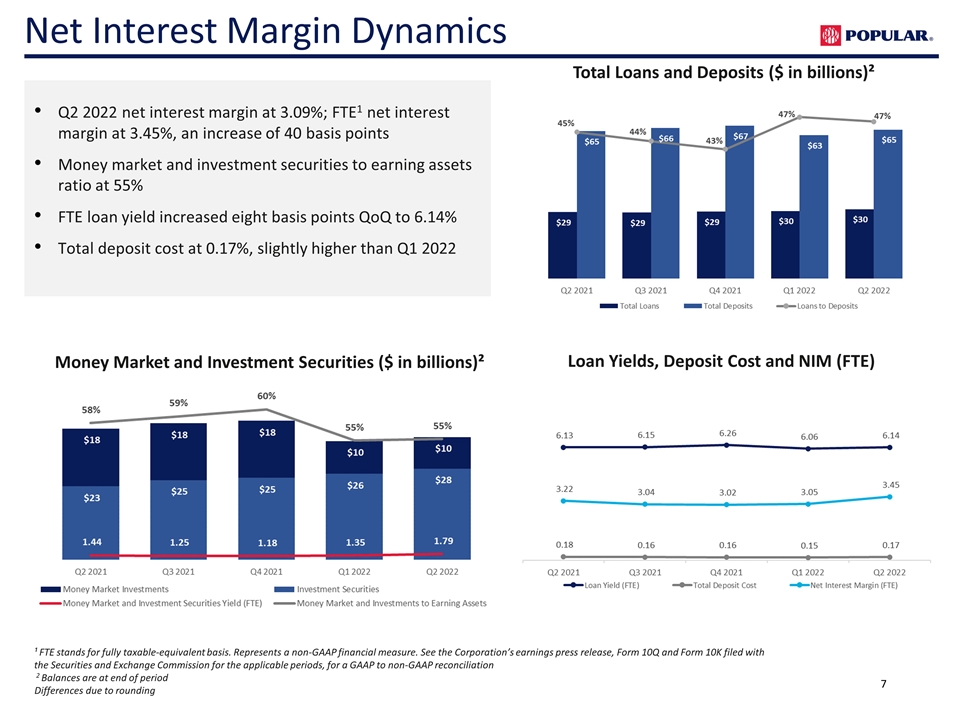
¹ FTE stands for fully taxable-equivalent basis. Represents a non-GAAP financial measure. See the Corporation’s earnings press release, Form 10Q and Form 10K filed with the Securities and Exchange Commission for the applicable periods, for a GAAP to non-GAAP reconciliation 2 Balances are at end of period Differences due to rounding Total Loans and Deposits ($ in billions)² Loan Yields, Deposit Cost and NIM (FTE) Money Market and Investment Securities ($ in billions)² Net Interest Margin Dynamics Q2 2022 net interest margin at 3.09%; FTE1 net interest margin at 3.45%, an increase of 40 basis points Money market and investment securities to earning assets ratio at 55% FTE loan yield increased eight basis points QoQ to 6.14% Total deposit cost at 0.17%, slightly higher than Q1 2022
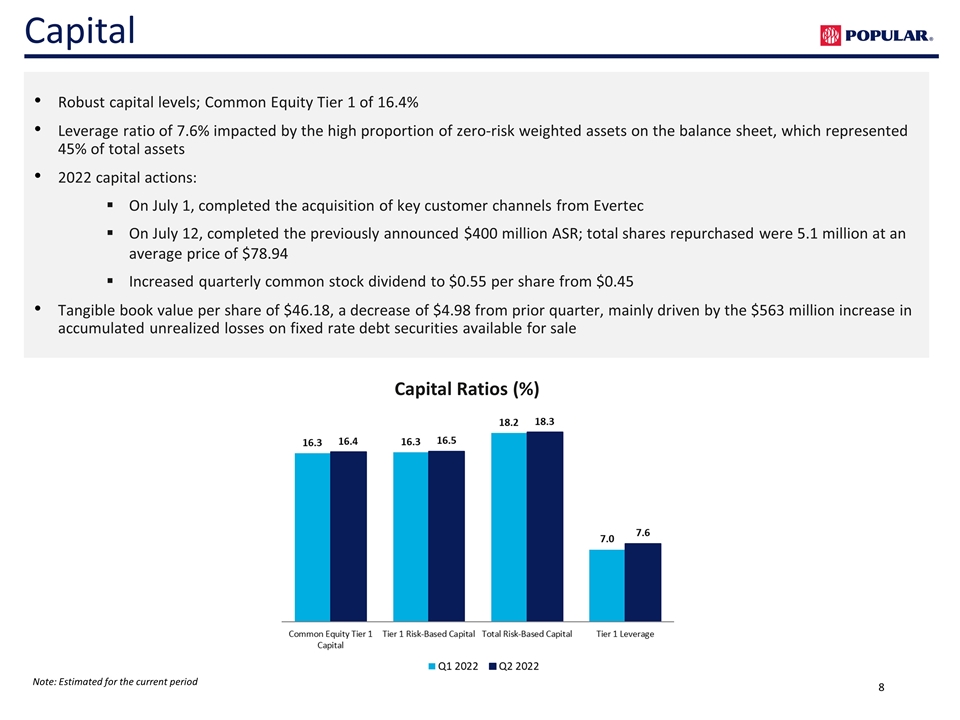
Robust capital levels; Common Equity Tier 1 of 16.4% Leverage ratio of 7.6% impacted by the high proportion of zero-risk weighted assets on the balance sheet, which represented 45% of total assets 2022 capital actions: On July 1, completed the acquisition of key customer channels from Evertec On July 12, completed the previously announced $400 million ASR; total shares repurchased were 5.1 million at an average price of $78.94 Increased quarterly common stock dividend to $0.55 per share from $0.45 Tangible book value per share of $46.18, a decrease of $4.98 from prior quarter, mainly driven by the $563 million increase in accumulated unrealized losses on fixed rate debt securities available for sale Capital Ratios (%) Note: Estimated for the current period Capital
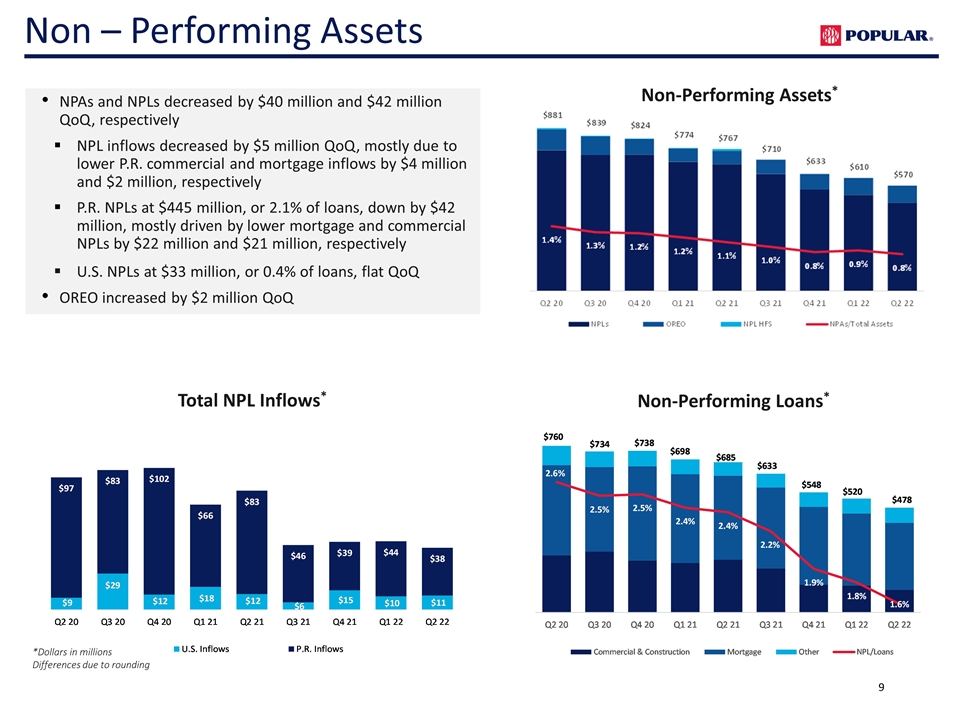
Non-Performing Assets* NPAs and NPLs decreased by $40 million and $42 million QoQ, respectively NPL inflows decreased by $5 million QoQ, mostly due to lower P.R. commercial and mortgage inflows by $4 million and $2 million, respectively P.R. NPLs at $445 million, or 2.1% of loans, down by $42 million, mostly driven by lower mortgage and commercial NPLs by $22 million and $21 million, respectively U.S. NPLs at $33 million, or 0.4% of loans, flat QoQ OREO increased by $2 million QoQ *Dollars in millions Differences due to rounding Non-Performing Loans* Total NPL Inflows* Non – Performing Assets
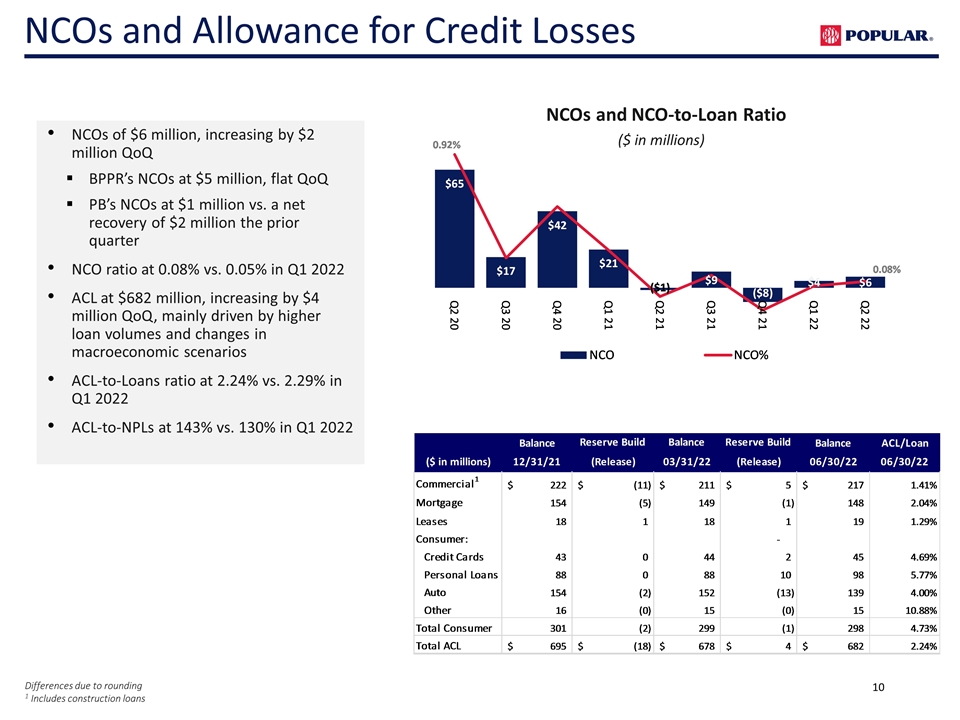
NCOs and NCO-to-Loan Ratio ($ in millions) Differences due to rounding 1 Includes construction loans NCOs of $6 million, increasing by $2 million QoQ BPPR’s NCOs at $5 million, flat QoQ PB’s NCOs at $1 million vs. a net recovery of $2 million the prior quarter NCO ratio at 0.08% vs. 0.05% in Q1 2022 ACL at $682 million, increasing by $4 million QoQ, mainly driven by higher loan volumes and changes in macroeconomic scenarios ACL-to-Loans ratio at 2.24% vs. 2.29% in Q1 2022 ACL-to-NPLs at 143% vs. 130% in Q1 2022 1 NCOs and Allowance for Credit Losses
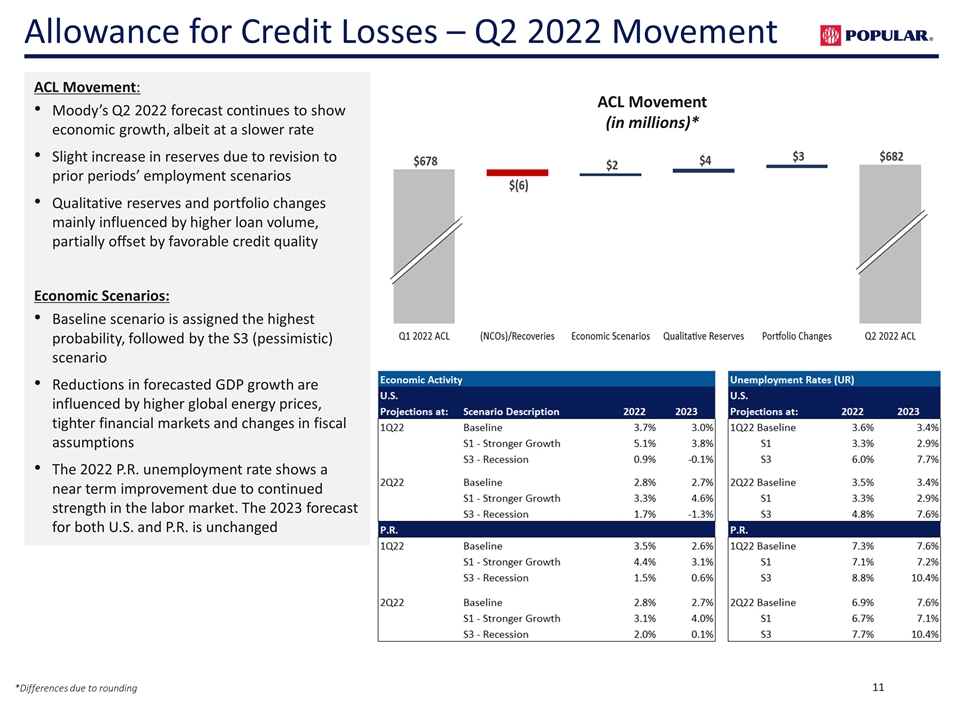
*Differences due to rounding ACL Movement: Moody’s Q2 2022 forecast continues to show economic growth, albeit at a slower rate Slight increase in reserves due to revision to prior periods’ employment scenarios Qualitative reserves and portfolio changes mainly influenced by higher loan volume, partially offset by favorable credit quality Economic Scenarios: Baseline scenario is assigned the highest probability, followed by the S3 (pessimistic) scenario Reductions in forecasted GDP growth are influenced by higher global energy prices, tighter financial markets and changes in fiscal assumptions The 2022 P.R. unemployment rate shows a near term improvement due to continued strength in the labor market. The 2023 forecast for both U.S. and P.R. is unchanged Allowance for Credit Losses – Q2 2022 Movement ACL Movement (in millions)*
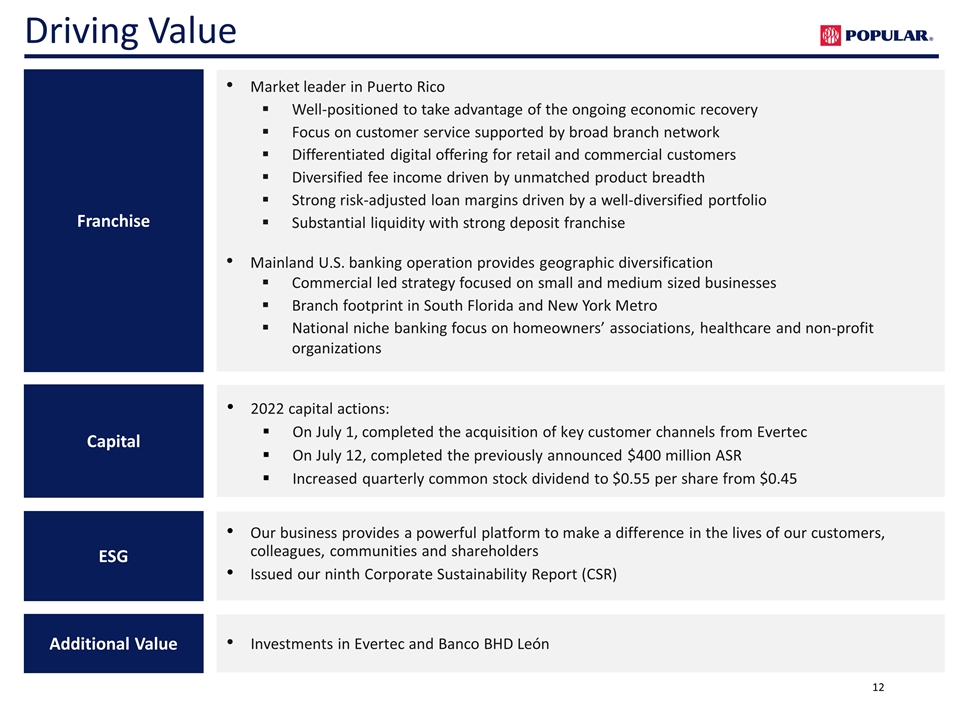
Capital 2022 capital actions: On July 1, completed the acquisition of key customer channels from Evertec On July 12, completed the previously announced $400 million ASR Increased quarterly common stock dividend to $0.55 per share from $0.45 Franchise Additional Value Investments in Evertec and Banco BHD León Market leader in Puerto Rico Well-positioned to take advantage of the ongoing economic recovery Focus on customer service supported by broad branch network Differentiated digital offering for retail and commercial customers Diversified fee income driven by unmatched product breadth Strong risk-adjusted loan margins driven by a well-diversified portfolio Substantial liquidity with strong deposit franchise Mainland U.S. banking operation provides geographic diversification Commercial led strategy focused on small and medium sized businesses Branch footprint in South Florida and New York Metro National niche banking focus on homeowners’ associations, healthcare and non-profit organizations Driving Value ESG Our business provides a powerful platform to make a difference in the lives of our customers, colleagues, communities and shareholders Issued our ninth Corporate Sustainability Report (CSR)
INVESTOR PRESENTATION Second Quarter Appendix 2022
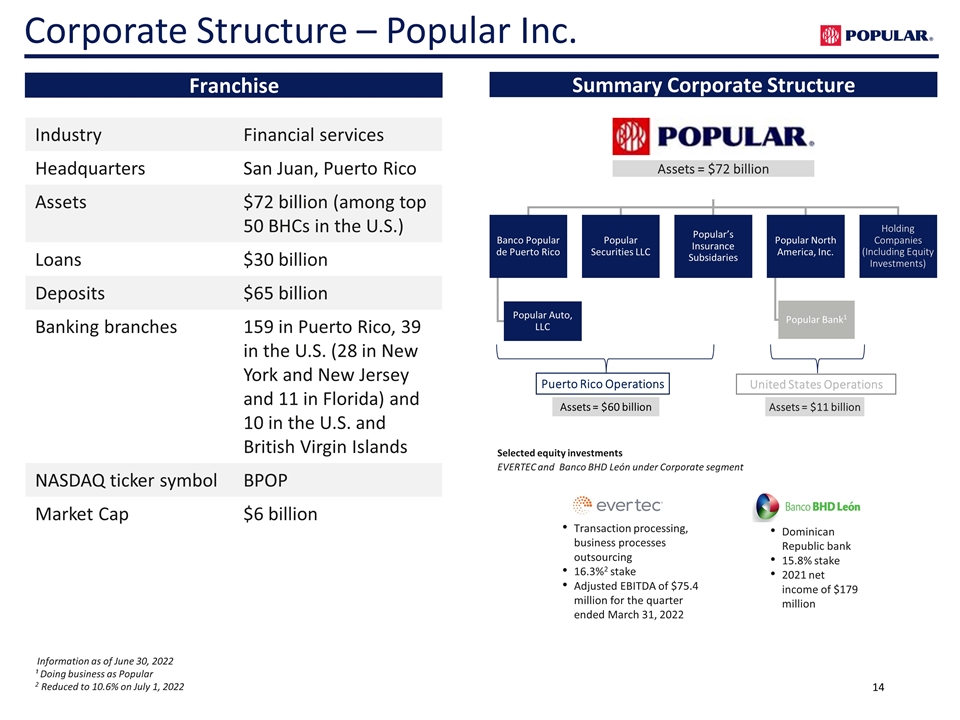
Franchise Summary Corporate Structure Assets = $60 billion Assets = $11 billion Puerto Rico Operations United States Operations Assets = $72 billion Information as of June 30, 2022 ¹ Doing business as Popular 2 Reduced to 10.6% on July 1, 2022 Selected equity investments EVERTEC and Banco BHD León under Corporate segment Transaction processing, business processes outsourcing 16.3%2 stake Adjusted EBITDA of $75.4 million for the quarter ended March 31, 2022 Dominican Republic bank 15.8% stake 2021 net income of $179 million Industry Financial services Headquarters San Juan, Puerto Rico Assets $72 billion (among top 50 BHCs in the U.S.) Loans $30 billion Deposits $65 billion Banking branches 159 in Puerto Rico, 39 in the U.S. (28 in New York and New Jersey and 11 in Florida) and 10 in the U.S. and British Virgin Islands NASDAQ ticker symbol BPOP Market Cap $6 billion Corporate Structure – Popular Inc. Banco Popular de Puerto Rico Popular’s Insurance Subsidaries Popular North America, Inc. Popular Securities LLC Holding Companies (Including Equity Investments) Popular Bank 1 Popular Auto, LLC
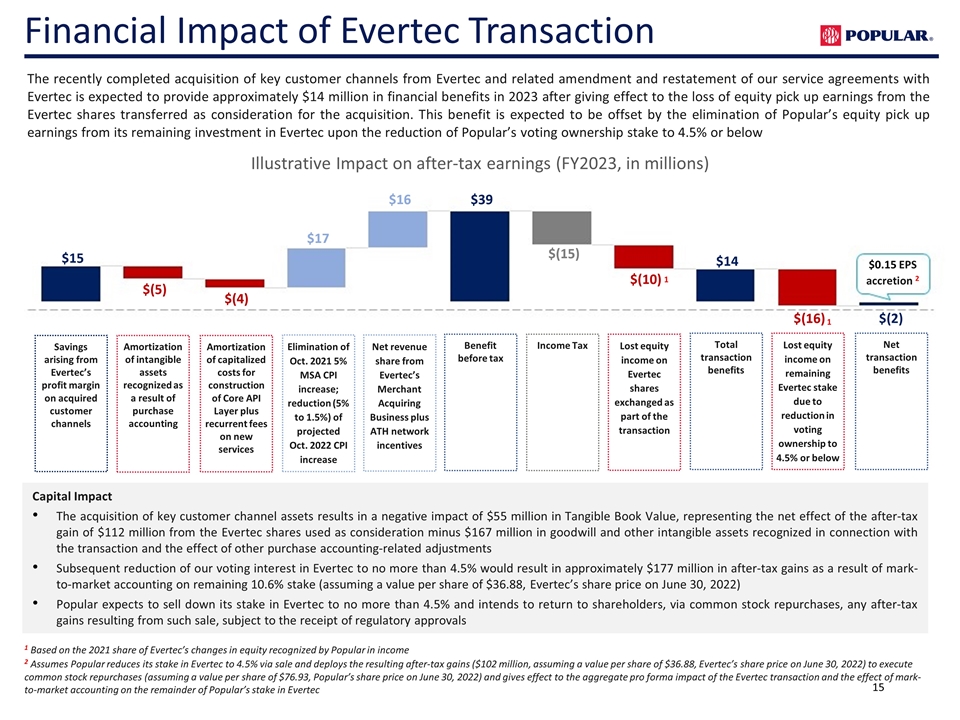
Financial Impact of Evertec Transaction The recently completed acquisition of key customer channels from Evertec and related amendment and restatement of our service agreements with Evertec is expected to provide approximately $14 million in financial benefits in 2023 after giving effect to the loss of equity pick up earnings from the Evertec shares transferred as consideration for the acquisition. This benefit is expected to be offset by the elimination of Popular’s equity pick up earnings from its remaining investment in Evertec upon the reduction of Popular’s voting ownership stake to 4.5% or below Savings arising from Evertec’s profit margin on acquired customer channels Net revenue share from Evertec’s Merchant Acquiring Business plus ATH network incentives Elimination of Oct. 2021 5% MSA CPI increase; reduction (5% to 1.5%) of projected Oct. 2022 CPI increase Lost equity income on Evertec shares exchanged as part of the transaction Lost equity income on remaining Evertec stake due to reduction in voting ownership to 4.5% or below Amortization of intangible assets recognized as a result of purchase accounting Amortization of capitalized costs for construction of Core API Layer plus recurrent fees on new services Capital Impact The acquisition of key customer channel assets results in a negative impact of $55 million in Tangible Book Value, representing the net effect of the after-tax gain of $112 million from the Evertec shares used as consideration minus $167 million in goodwill and other intangible assets recognized in connection with the transaction and the effect of other purchase accounting-related adjustments Subsequent reduction of our voting interest in Evertec to no more than 4.5% would result in approximately $177 million in after-tax gains as a result of mark-to-market accounting on remaining 10.6% stake (assuming a value per share of $36.88, Evertec’s share price on June 30, 2022) Popular expects to sell down its stake in Evertec to no more than 4.5% and intends to return to shareholders, via common stock repurchases, any after-tax gains resulting from such sale, subject to the receipt of regulatory approvals 1 Based on the 2021 share of Evertec’s changes in equity recognized by Popular in income 2 Assumes Popular reduces its stake in Evertec to 4.5% via sale and deploys the resulting after-tax gains ($102 million, assuming a value per share of $36.88, Evertec’s share price on June 30, 2022) to execute common stock repurchases (assuming a value per share of $76.93, Popular’s share price on June 30, 2022) and gives effect to the aggregate pro forma impact of the Evertec transaction and the effect of mark-to-market accounting on the remainder of Popular’s stake in Evertec $0.15 EPS accretion 2 1 1 Income Tax
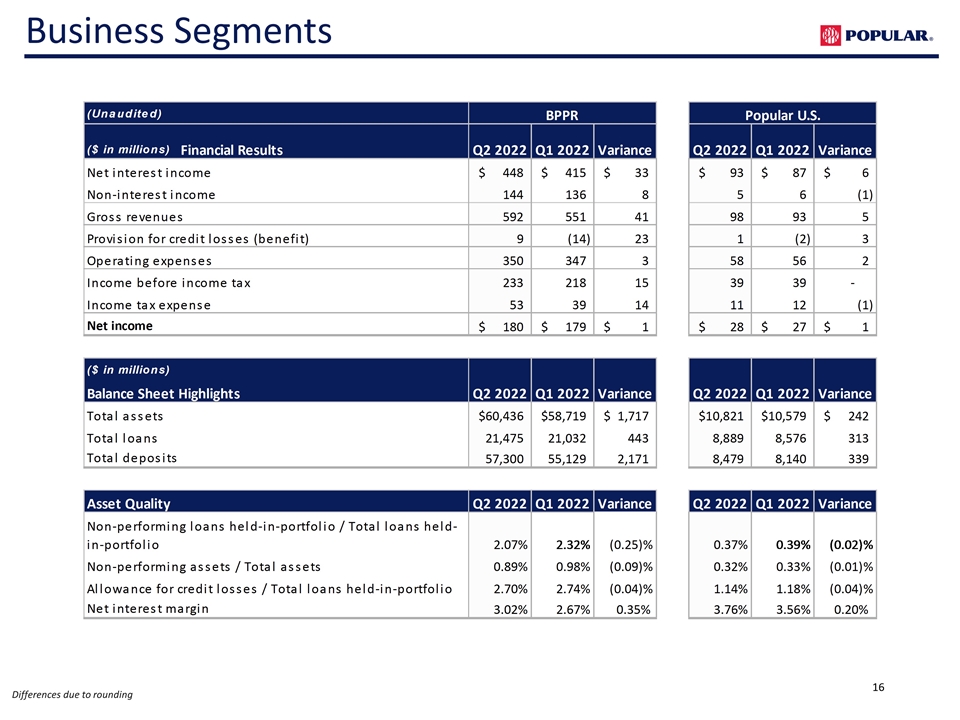
Differences due to rounding Business Segments

Municipalities Obligations of municipalities are backed by real and personal property taxes, municipal excise taxes, and/or a percentage of the sales and use tax Indirect exposure includes loans or securities that are payable by non-governmental sources of repayment, but which carry a government guarantee to cover any shortfall in collateral in the event of borrower default. The majority are single-family mortgage related Indirect Exposure The Corporation does not own any loans to the P.R. central government or its public corporations. As of June 30, 2022, our direct exposure to P.R. municipalities was $352 million, up by $6 million QoQ P.R. Public Sector Exposure Activity Since June 30, 2022 On July 1, 2022 we received $28 million in principal payments, reducing the direct exposure to municipalities to $324 million
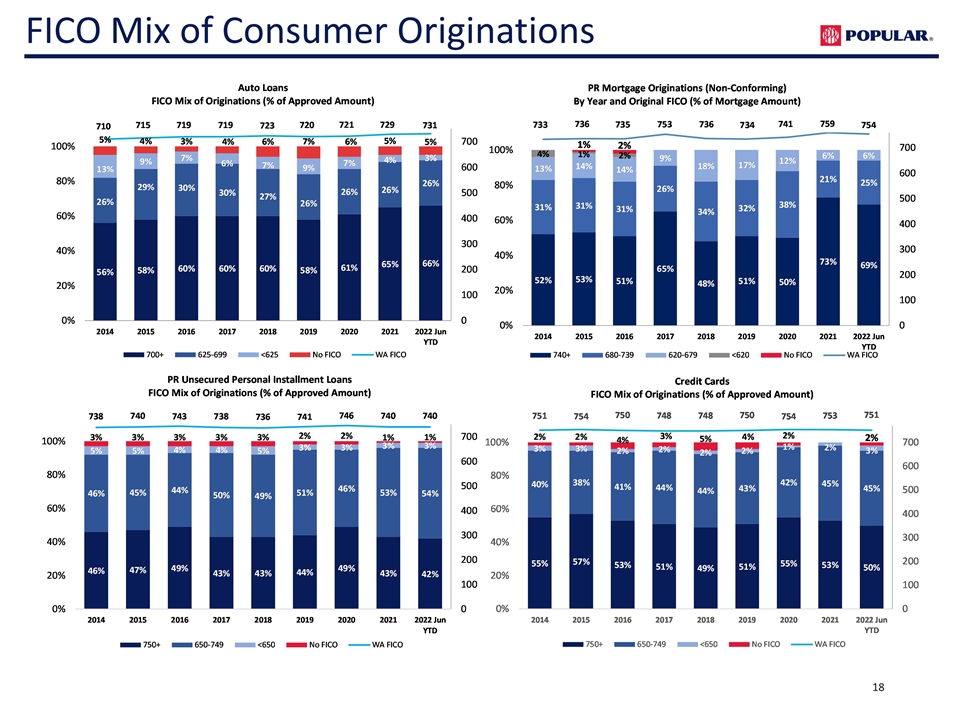
FICO Mix of Consumer Originations
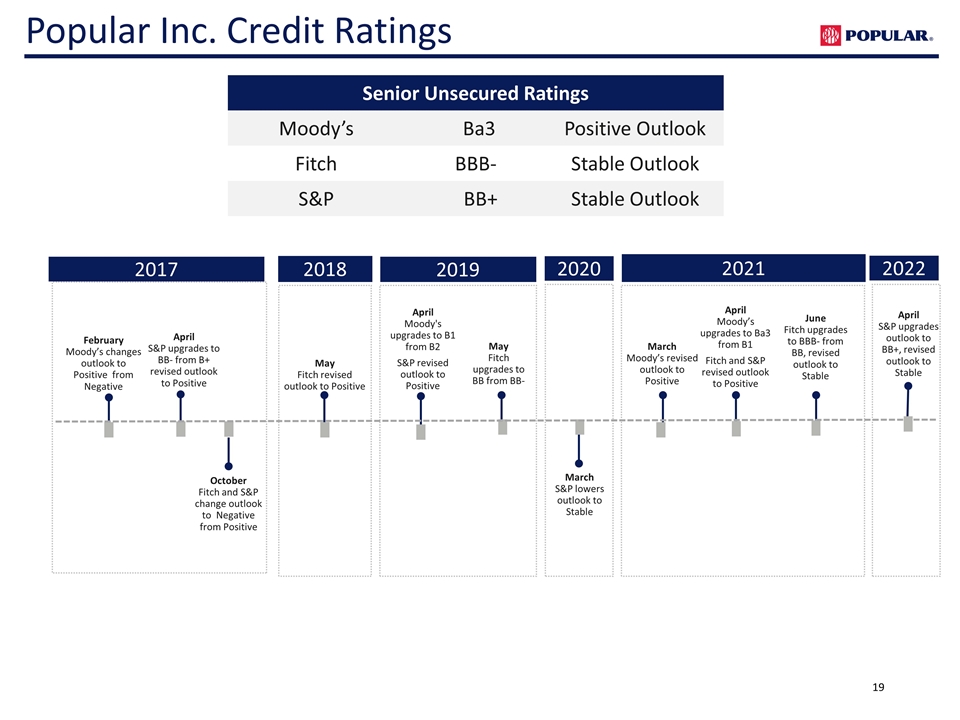
Senior Unsecured Ratings Moody’s Ba3 Positive Outlook Fitch BBB- Stable Outlook S&P BB+ Stable Outlook February Moody’s changes outlook to Positive from Negative April S&P upgrades to BB- from B+ revised outlook to Positive 2017 October Fitch and S&P change outlook to Negative from Positive 2018 May Fitch revised outlook to Positive 2019 April Moody's upgrades to B1 from B2 S&P revised outlook to Positive May Fitch upgrades to BB from BB- 2020 March S&P lowers outlook to Stable 2021 March Moody’s revised outlook to Positive April Moody’s upgrades to Ba3 from B1 Fitch and S&P revised outlook to Positive June Fitch upgrades to BBB- from BB, revised outlook to Stable Popular Inc. Credit Ratings 2022 April S&P upgrades outlook to BB+, revised outlook to Stable

INVESTOR PRESENTATION Second Quarter 2022


