
Exhibit 99.2 Investor Presentation Fourth Quarter 2024

Cautionary Note Regarding Forward-Looking Statements This presentation contains “forward-looking statements” within the meaning of the U.S. Private Securities Litigation Reform Act of 1995, including without limitation those regarding Popular’s business, financial condition, results of operations and future plans, objectives, performance, earnings and expenses. These statements are not guarantees of future performance, are based on the current expectations of Popular, Inc.’s (the “Corporation”) management and, by their nature, involve risks, uncertainties, estimates and assumptions. Potential factors, some of which are beyond the Corporation’s control, could cause actual results to differ materially from those expressed in, or implied by, such forward-looking statements. More information on the risks and important factors that could affect the Corporation’s future results and financial condition is included in our Form 10-K for the year ended December 31, 2023, our Form 10-Q for the quarters ended March 31, 2024, June 30, 2024, and September 30, 2024, and in our Annual Report on Form 10-K for the year ended December 31, 2024 to be filed with the Securities and Exchange Commission. Our filings are available on the Corporation’s website (www.popular.com) and on the Securities and Exchange Commission website (www.sec.gov). The Corporation assumes no obligation to update or revise any forward-looking statements which speak as of their respective dates. 2
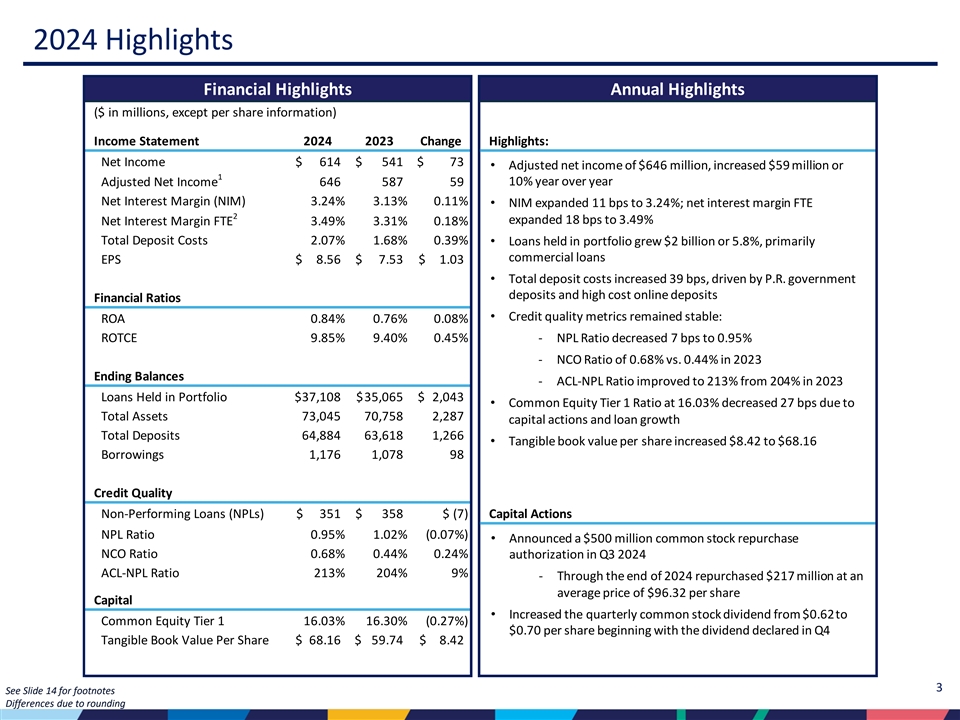
2024 Highlights Financial Highlights Annual Highlights ($ in millions, except per share information) Income Statement 2024 2023 Change Highlights: Net Income $ 614 $ 541 $ 73 • Adjusted net income of $646 million, increased $59 million or 1 10% year over year Adjusted Net Income 646 587 59 Net Interest Margin (NIM) 3.24% 3.13% 0.11% • NIM expanded 11 bps to 3.24%; net interest margin FTE 2 expanded 18 bps to 3.49% Net Interest Margin FTE 3.49% 3.31% 0.18% Total Deposit Costs 2.07% 1.68% 0.39%• Loans held in portfolio grew $2 billion or 5.8%, primarily commercial loans EPS $ 8.56 $ 7 .53 $ 1.03 • Total deposit costs increased 39 bps, driven by P.R. government deposits and high cost online deposits Financial Ratios • Credit quality metrics remained stable: ROA 0.84% 0.76% 0.08% ROTCE 9.85% 9.40% 0.45% ‐ NPL Ratio decreased 7 bps to 0.95% ‐ NCO Ratio of 0.68% vs. 0.44% in 2023 Ending Balances ‐ ACL-NPL Ratio improved to 213% from 204% in 2023 Loans Held in Portfolio $3 7,108 $ 35,065 $ 2,043 • Common Equity Tier 1 Ratio at 16.03% decreased 27 bps due to Total Assets 73,045 70,758 2 ,287 capital actions and loan growth Total Deposits 6 4,884 63,618 1 ,266 • Tangible book value per share increased $8.42 to $68.16 Borrowings 1 ,176 1 ,078 98 Credit Quality Non-Performing Loans (NPLs) $ 351 $ 358 $ (7) Capital Actions NPL Ratio 0.95% 1.02% (0.07%) • Announced a $500 million common stock repurchase NCO Ratio 0.68% 0.44% 0.24% authorization in Q3 2024 ACL-NPL Ratio 213% 204% 9% ‐ Through the end of 2024 repurchased $217 million at an average price of $96.32 per share Capital • Increased the quarterly common stock dividend from $0.62to Common Equity Tier 1 16.03% 16.30% (0.27%) $0.70 per share beginning with the dividend declared in Q4 Tangible Book Value Per Share $ 68.16 $ 5 9.74 $ 8 .42 3 See Slide 14 for footnotes Differences due to rounding

Q4 2024 Highlights Financial Highlights Quarter Highlights ($ in millions, except per share information) Income Statement Q4 2024 Q3 2024 Change Q4 2023 Highlights: Net Income $ 178 $ 155 $ 23 $ 95 • Net income increased $23 million, to $178 million, driven by an Net Interest Margin (NIM) 3.35% 3.24% 0.11% 3.08% increase in net interest income and a lower provision 1 Net Interest Margin FTE 3.62% 3.47% 0.15% 3.26% • NIM at 3.35% expanded 11 bps; net interest margin FTE expanded Total Deposit Costs 1.96% 2.16% (0.20%) 2.00% 15 bps to 3.62% EPS $ 2.51 $ 2.16 $ 0 .35 $ 1.31 • Total deposit costs down 20 bps due to lower cost of P.R. government deposits Financial Ratios • Loans held in portfolio grew $913 million or 2.5% ROA 0.97% 0.84% 0.13% 0.52% • Total deposits increased $1.2 billion or 1.9% ROTCE 11.22% 9.98% 1.24% 6.32% • Credit quality metrics remained stable: ‐ NPLs decreased $10 million to $351 million; NPL Ratio at Ending Balances 0.95% vs. 1.00% in Q3 Loans Held in Portfolio $ 37,108 $3 6,195 $ 913 $ 35,065 ‐ NCO Ratio of 0.74% vs. 0.65% in Q3 Total Assets 73,045 7 1,323 1,722 7 0,758 ‐ ACL-NPL Ratio of 213% vs. 206% in Q3 Total Deposits 64,884 63,669 1,215 63,618 • Tangible book value per share decreased $0.88 to $68.16 Borrowings 1 ,176 974 202 1,078 • Common Equity Tier 1 Ratio decreased 39 bps to 16.03% due to capital actions and loan growth in Q4 Credit Quality Non-Performing Loans (NPLs) $ 351 $ 361 $ ( 10) $ 358 NPL Ratio 0.95% 1.00% (0.05%) 1.02% Capital Actions NCO Ratio 0.74% 0.65% 0.09% 0.66% • Repurchased $159 million of common stock at an average price of ACL-NPL Ratio 213% 206% 7% 204% $95.68 • Increased the quarterly common stock dividend from $0.62 to $0.70 per share. Capital Common Equity Tier 1 16.03% 16.42% (0.39%) 16.30% Tangible Book Value Per Share $ 68.16 $ 69.04 (0.88) $ 59.74 See Slide 14 for footnotes 4 Differences due to rounding

Business Highlights BPPR Popular U.S. ($ in millions) Q4 2024 Q3 2024 Change Q4 2023 ($ in millions) Q4 2024 Q3 2024 Change Q4 2023 Loans Held in Portfolio $ 26,147 $ 25,694 $ 453 $2 4,478 Loans Held in Portfolio $ 10,929 $ 10,469 $ 460 $ 10,554 P.R. Government Deposits 19,463 1 8,716 747 18,068 Total Deposits 11,704 11,891 ( 187) 11,271 Total Deposits 5 4,054 5 2,701 1,353 53,133 Borrowings 480 276 204 381 Borrowings 103 105 (2) 105 Net Interest Margin 2.71% 2.73% (0.02%) 2.72% Net Interest Margin 3.56% 3.41% 0.15% 3.19% Total Deposit Costs 3.20% 3.35% (0.15%) 3.17% Total Deposit Costs 1.67% 1.89% (0.22%) 1.79% Highlights: Highlights: • Loans held in portfolio grew $453 million:• Loans held in portfolio grew $460 million: ‐ commercial and construction loans increased $265 million ‐ commercial and construction loans increased $464 million ‐ mortgage loans increased $114 million • NIM decreased 2 bps to 2.71%, driven by a lower yield on total ‐ auto loans and leases increased $43 million earning assets by 15 bps, offset by lower total cost of funds by 13 ‐ credit card balances increased $31 million bps • NIM increased 15 bps to 3.56%, driven by lower cost of interest • Asset yields and deposit costs: bearing deposits by 29 bps ‐ loan yields decreased 7 bps to 5.91% • Asset yields and deposit costs: ‐ investment securities yields decreased 51 bps to 4.28% ‐ loan yields decreased 6 bps to 7.93% ‐ total deposit costs decreased 15 bps to 3.20%, due to ‐ investment securities yields decreased 19 bps to 2.79% repricing of deposits and lower volume of high cost ‐ total deposit costs decreased 22 bps; P.R. government online deposits deposits decreased by 56 bps • Broker dealer's assets under management increased $2.6 billion to $10.8 billion or 32% in 2024 5 Differences due to rounding
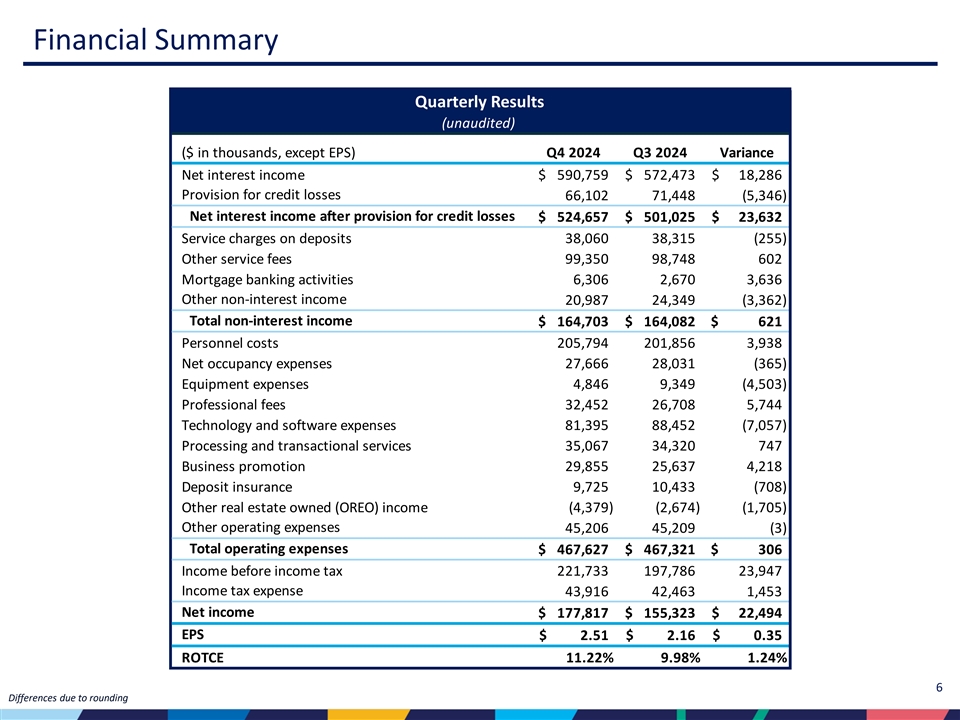
Financial Summary Quarterly Results (unaudited) ($ in thousands, except EPS) Q4 2024 Q3 2024 Variance Net interest income $ 5 90,759 $ 5 72,473 $ 18,286 Provision for credit losses 66,102 71,448 (5,346) Net interest income after provision for credit losses $ 524,657 $ 5 01,025 $ 23,632 Service charges on deposits 38,060 38,315 (255) Other service fees 99,350 98,748 602 Mortgage banking activities 6,306 2,670 3 ,636 Other non-interest income 20,987 24,349 (3,362) Total non-interest income $ 1 64,703 $ 1 64,082 $ 621 Personnel costs 205,794 201,856 3 ,938 Net occupancy expenses 27,666 28,031 (365) Equipment expenses 4,846 9 ,349 (4,503) Professional fees 32,452 26,708 5 ,744 Technology and software expenses 81,395 88,452 (7,057) Processing and transactional services 35,067 34,320 747 Business promotion 29,855 25,637 4,218 Deposit insurance 9,725 10,433 ( 708) Other real estate owned (OREO) income (4,379) (2,674) (1,705) Other operating expenses 45,206 45,209 (3) Total operating expenses $ 467,627 $ 467,321 $ 306 Income before income tax 221,733 197,786 23,947 Income tax expense 43,916 42,463 1 ,453 Net income $ 177,817 $ 1 55,323 $ 22,494 EPS $ 2.51 $ 2.16 $ 0.35 ROTCE 11.22% 9.98% 1.24% 6 Differences due to rounding
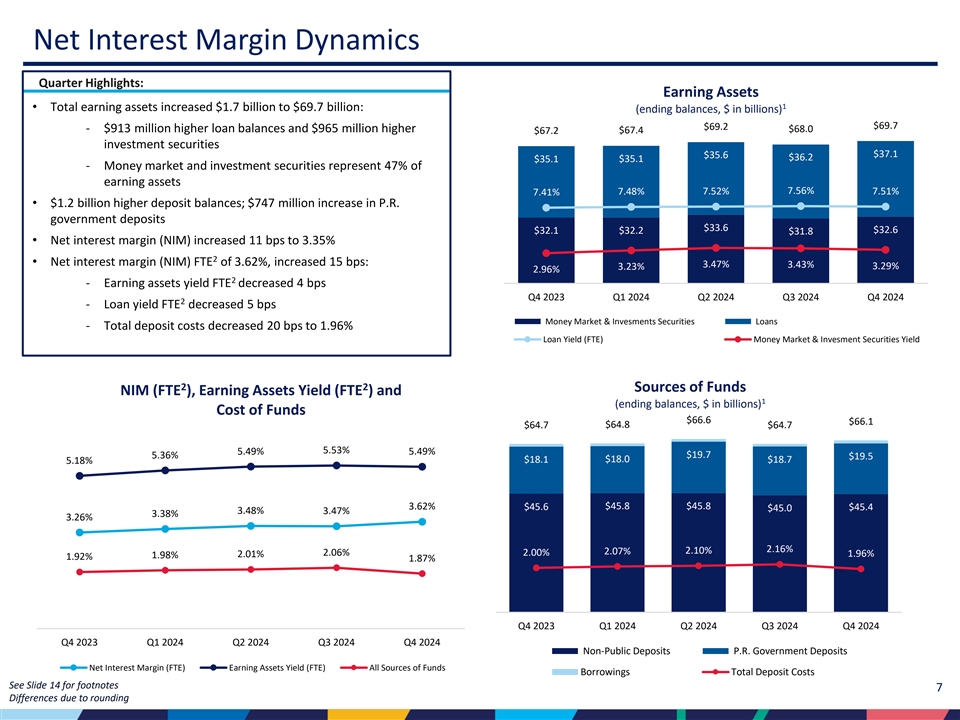
Net Interest Margin Dynamics Quarter Highlights: Earning Assets 1 • Total earning assets increased $1.7 billion to $69.7 billion: (ending balances, $ in billions) $69.7 $69.2 ‐ $913 million higher loan balances and $965 million higher $68.0 $67.4 $67.2 70.0 0 0.1 4 investment securities $37.1 $35.6 60.0 0 $36.2 0.1 2 $35.1 $35.1 ‐ Money market and investment securities represent 47% of 50.0 0 0.1 earning assets 7.48% 7.52% 7.56% 7.51% 7.41% 40.0 0 0.0 8 • $1.2 billion higher deposit balances; $747 million increase in P.R. government deposits 30.0 0 0.0 6 $33.6 $32.2 $32.6 $32.1 $31.8 20.0 0 0.0 4 • Net interest margin (NIM) increased 11 bps to 3.35% 2 10.0 0 0.0 2 • Net interest margin (NIM) FTE of 3.62%, increased 15 bps: 3.47% 3.43% 3.29% 3.23% 2.96% 2 - 0 ‐ Earning assets yield FTE decreased 4 bps Q4 2023 Q1 2024 Q2 2024 Q3 2024 Q4 2024 2 ‐ Loan yield FTE decreased 5 bps Money Market & Invesments Securities Loans ‐ Total deposit costs decreased 20 bps to 1.96% Loan Yield (FTE) Money Market & Invesment Securities Yield 2 2 Sources of Funds NIM (FTE ), Earning Assets Yield (FTE ) and 1 (ending balances, $ in billions) Cost of Funds $66.6 $66.1 $64.7 $64.8 $64.7 0.08 00 6.50% 5.53% 5.49% 5.49% 60.0 0 5.36% $19.7 0.07 00 $19.5 $18.1 $18.0 $18.7 5.18% 5.50% 0.06 00 50.0 0 4.50% 0.05 00 3.62% 40.0 0 $45.8 $45.8 $45.6 $45.4 $45.0 3.48% 3.47% 3.38% 3.26% 0.04 00 3.50% 30.0 0 0.03 00 2.16% 2.10% 2.07% 2.50% 2.06% 2.00% 2.01% 1.96% 1.98% 1.92% 1.87% 20.0 0 0.02 00 1.50% 10.0 0 0.01 00 - - 0.50% Q4 2023 Q1 2024 Q2 2024 Q3 2024 Q4 2024 -0.50% Q4 2023 Q1 2024 Q2 2024 Q3 2024 Q4 2024 Non-Public Deposits P.R. Government Deposits Net Interest Margin (FTE) Earning Assets Yield (FTE) All Sources of Funds Borrowings Total Deposit Costs See Slide 14 for footnotes 7 Differences due to rounding
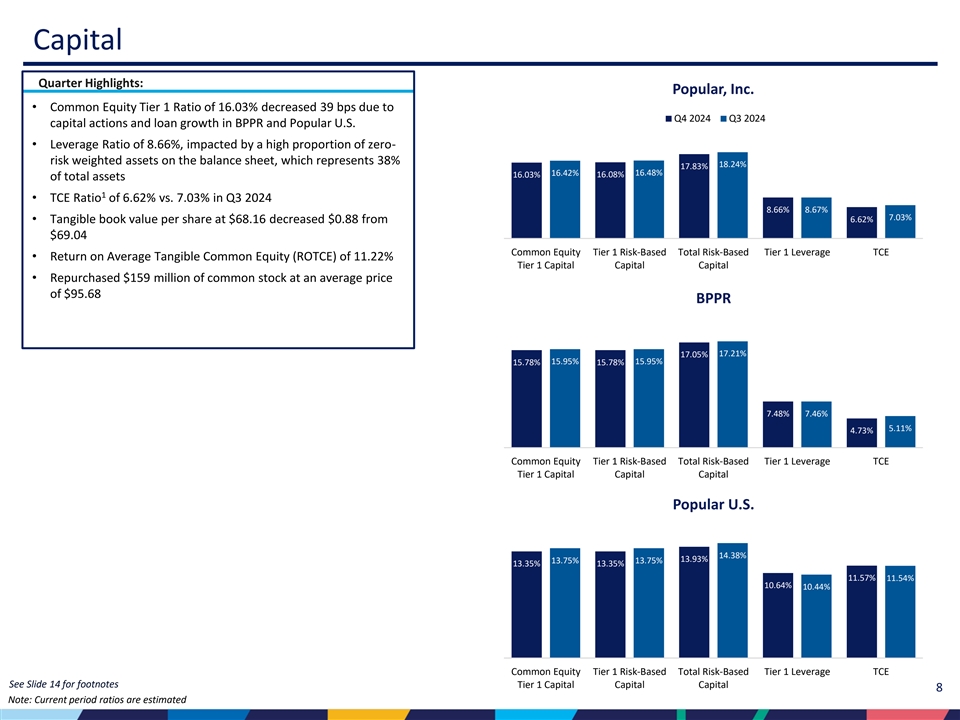
Capital Quarter Highlights: Popular, Inc. • Common Equity Tier 1 Ratio of 16.03% decreased 39 bps due to Q4 2024 Q3 2024 capital actions and loan growth in BPPR and Popular U.S. 0.2 • Leverage Ratio of 8.66%, impacted by a high proportion of zero- 0.1 8 0.1 6 risk weighted assets on the balance sheet, which represents 38% 18.24% 17.83% 0.1 4 16.42% 16.48% 16.03% 16.08% of total assets 0.1 2 0.1 1 0.0 8 • TCE Ratio of 6.62% vs. 7.03% in Q3 2024 0.0 6 8.66% 8.67% 0.0 4 7.03% 6.62% • Tangible book value per share at $68.16 decreased $0.88 from 0.0 2 0 $69.04 Common Equity Tier 1 Risk-Based Total Risk-Based Tier 1 Leverage TCE • Return on Average Tangible Common Equity (ROTCE) of 11.22% Tier 1 Capital Capital Capital • Repurchased $159 million of common stock at an average price of $95.68 BPPR 0.2 0.1 8 0.1 6 17.05% 17.21% 0.1 4 15.95% 15.95% 15.78% 15.78% 0.1 2 0.1 0.0 8 0.0 6 7.48% 7.46% 0.0 4 5.11% 4.73% 0.0 2 0 Common Equity Tier 1 Risk-Based Total Risk-Based Tier 1 Leverage TCE Tier 1 Capital Capital Capital Popular U.S. 0.1 6 0.1 4 14.38% 0.1 2 13.93% 13.75% 13.75% 13.35% 13.35% 0.1 11.57% 11.54% 10.64% 10.44% 0.0 8 0.0 6 0.0 4 0.0 2 0 Common Equity Tier 1 Risk-Based Total Risk-Based Tier 1 Leverage TCE See Slide 14 for footnotes Tier 1 Capital Capital Capital 8 Note: Current period ratios are estimated
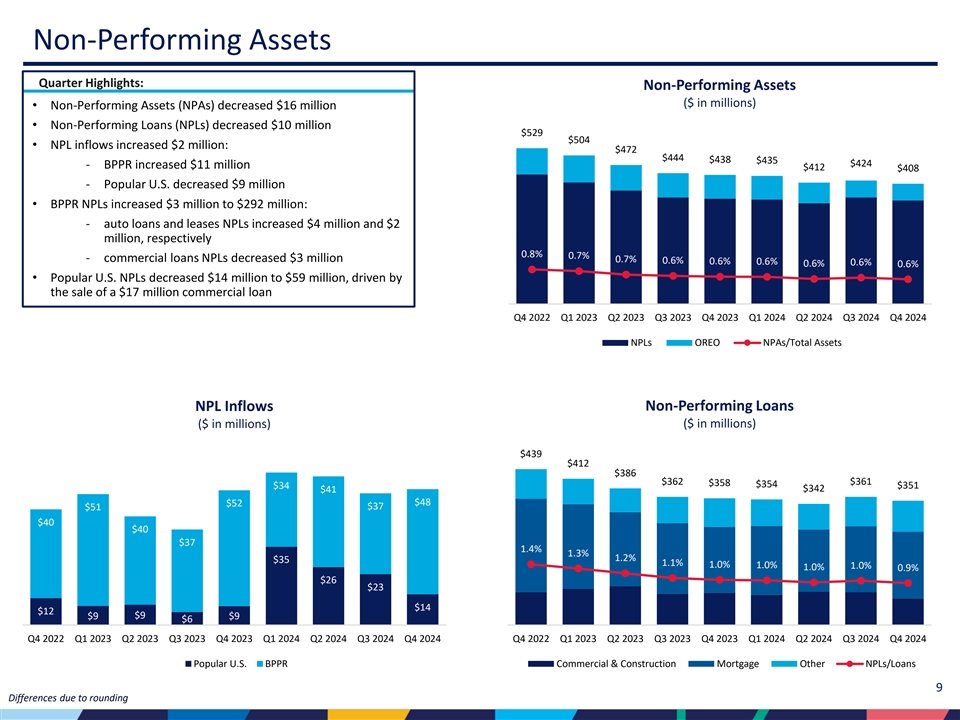
Non-Performing Assets Quarter Highlights: Non-Performing Assets ($ in millions) • Non-Performing Assets (NPAs) decreased $16 million 600 0.04 • Non-Performing Loans (NPLs) decreased $10 million $529 $504 • NPL inflows increased $2 million: 0.035 $472 500 $444 $438 $435 $424 ‐ BPPR increased $11 million $412 $408 0.03 400 ‐ Popular U.S. decreased $9 million 0.025 • BPPR NPLs increased $3 million to $292 million: 0.02 300 ‐ auto loans and leases NPLs increased $4 million and $2 0.015 million, respectively 200 0.8% 0.7% 0.01 ‐ commercial loans NPLs decreased $3 million 0.7% 0.6% 0.6% 0.6% 0.6% 0.6% 0.6% 100 • Popular U.S. NPLs decreased $14 million to $59 million, driven by 0.005 the sale of a $17 million commercial loan 0 0 Q4 2022 Q1 2023 Q2 2023 Q3 2023 Q4 2023 Q1 2024 Q2 2024 Q3 2024 Q4 2024 NPLs OREO NPAs/Total Assets NPL Inflows Non-Performing Loans ($ in millions) ($ in millions) 500 0.04 80 $439 450 $412 70 0.035 $386 400 $362 $361 $358 $354 $34 $351 $342 60 $41 0.03 350 $48 $52 $37 $51 50 0.025 300 $40 $40 40 250 0.02 $37 1.4% 200 1.3% 0.015 30 1.2% $35 1.1% 1.0% 1.0% 1.0% 1.0% 0.9% 150 20 0.01 $26 $23 100 10 0.005 50 $14 $12 $9 $9 $9 $6 0 0 0 Q4 2022 Q1 2023 Q2 2023 Q3 2023 Q4 2023 Q1 2024 Q2 2024 Q3 2024 Q4 2024 Q4 2022 Q1 2023 Q2 2023 Q3 2023 Q4 2023 Q1 2024 Q2 2024 Q3 2024 Q4 2024 Popular U.S. BPPR Commercial & Construction Mortgage Other NPLs/Loans 9 Differences due to rounding

NCOs and Allowance for Credit Losses Quarter Highlights: Allowance for Credit Losses ($ in millions) • NCO Ratio increased 9 bps to 0.74% • NCOs increased $8 million to $67 million Reserve Reserve Build Balance Balance Build Balance ACL/Loan • BPPR NCOs increased $8 million to $63 million: Portfolios Q4 2023 (Release) Q3 2024 (Release) Q4 2024 Q4 2024 ‐ Consumer increased $6 million Commercial $ 271 $ 8 $ 279 $ ( 8) $ 271 1.36% ‐ Mortgage increased $2 million Mortgage 83 (1) 82 0 82 1.02% ‐ Commercial decreased $2 million Leases 10 6 16 0 16 0.85% Consumer: 365 2 367 9 376 5.27% • Popular U.S. NCOs remained flat QoQ Credit Cards 80 13 93 6 99 8.14% • ACL at $746 million, increased $2 million Personal Loans 120 (14) 106 (2) 104 5.40% Auto 158 3 161 5 166 4.34% • ACL-to-Loans Ratio at 2.01% vs. 2.06% Other 7 - 7 0 7 4.08% Total ACL $ 729 $ 15 $ 744 $ 2 $ 746 2.01% Consumer NCOs by Loan Portfolio NCOs and NCO-to-Loans Ratio ($ in millions) ($ in millions) $67 70 $63 $62 70 $59 4.00% $58 $57 60 $55 5.00% $54 60 $52 $49 50 50 3.00% $41 $33 $40 4.00% $33 3.56% 40 $31 40 3.26% 3.16% 3.01% $29 2.00% $24 30 $25 2.80% 30 3.00% 2.43% 2.41% 20 20 0.74% 0.71% 0.66% 0.65% 1.00% 0.61% 1.77% 2.00% 0.39% 0.41% 0.39% 10 10 1.52% 0.29% - - 0.00% 1.00% (10) (10) Q4 2022 Q1 2023 Q2 2023 Q3 2023 Q4 2023 Q1 2024 Q2 2024 Q3 2024 Q4 2024 Q4 2022 Q1 2023 Q2 2023 Q3 2023 Q4 2023 Q1 2024 Q2 2024 Q3 2024 Q4 2024 (20) -1.00% (20) 0.00% Credit Cards Personal Loans Auto Other NCO% Commercial & Construction Mortgage Leases Consumer NCO% 10 Differences due to rounding
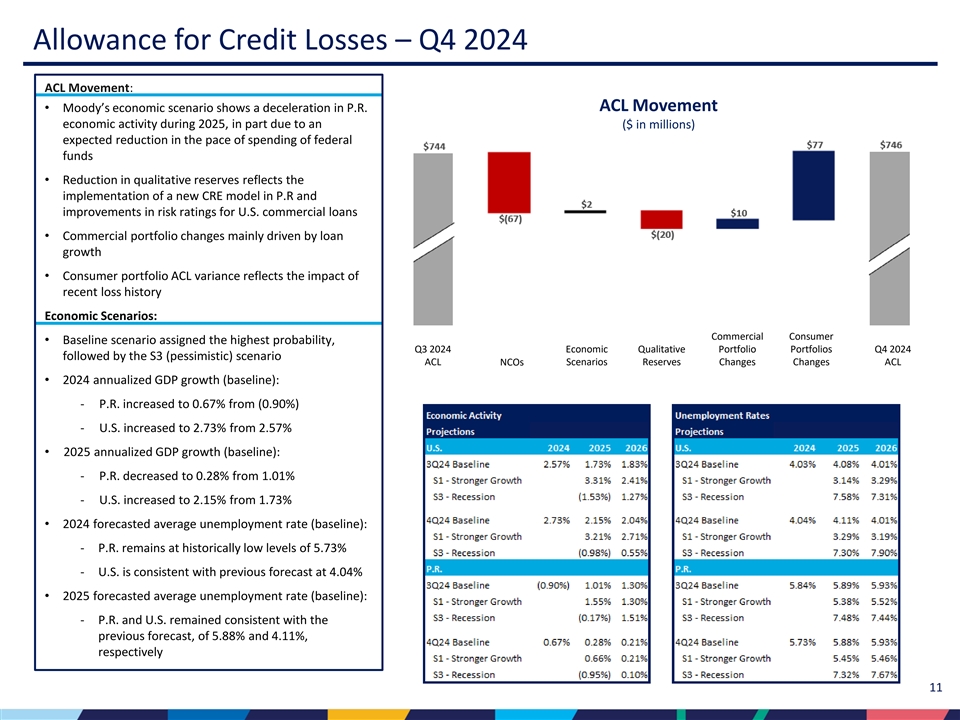
Allowance for Credit Losses – Q4 2024 ACL Movement: • Moody’s economic scenario shows a deceleration in P.R. ACL Movement economic activity during 2025, in part due to an ($ in millions) expected reduction in the pace of spending of federal funds • Reduction in qualitative reserves reflects the implementation of a new CRE model in P.R and improvements in risk ratings for U.S. commercial loans • Commercial portfolio changes mainly driven by loan growth • Consumer portfolio ACL variance reflects the impact of recent loss history Economic Scenarios: Commercial Consumer • Baseline scenario assigned the highest probability, Q3 2024 Economic Qualitative Portfolio Portfolios Q4 2024 followed by the S3 (pessimistic) scenario ACL NCOs Scenarios Reserves Changes Changes ACL • 2024 annualized GDP growth (baseline): ‐ P.R. increased to 0.67% from (0.90%) ‐ U.S. increased to 2.73% from 2.57% • 2025 annualized GDP growth (baseline): ‐ P.R. decreased to 0.28% from 1.01% ‐ U.S. increased to 2.15% from 1.73% • 2024 forecasted average unemployment rate (baseline): ‐ P.R. remains at historically low levels of 5.73% ‐ U.S. is consistent with previous forecast at 4.04% • 2025 forecasted average unemployment rate (baseline): ‐ P.R. and U.S. remained consistent with the previous forecast, of 5.88% and 4.11%, respectively 11

Driving Value Market leader in Puerto Rico • Substantial liquidity with diversified deposit base • Well-positioned to take advantage of ongoing economic growth • Focused on customer service supported by broad branch network • Differentiated omnichannel experience • Diversified fee income Franchise • Strong risk-adjusted loan margins driven by a well-diversified portfolio Mainland U.S. banking operation provides geographic diversification • Commercial led strategy directed at small and medium sized businesses • National niche banking focused on homeowners’ associations, healthcare and non-profit organizations • Branch footprint in South Florida and New York Metro • Beginning in 2022 Popular embarked on a Transformation focused on our company results, customer opportunities and enterprise culture with the objective of delivering sustainable profitable growth • In 2024 we made significant progress across four workstreams: ‐ Customer Centric Growth: to enhance the overall value proposition with clients Transformation ‐ Front-to-back Customer Journeys and Solutions: to deliver a modern omnichannel banking experience ‐ Technology Modernization: to sustain a strong IT infrastructure and accelerate our digital development ‐ Purpose, Culture and People: to embed and reinforce the values and behaviors of an agile, collaborative and high performing workforce • Announced a common stock repurchase authorization in Q3 2024 of up to $500 million: ‐ Repurchased $217 million of common stock at an average price of $96.32 per share Capital Actions • Increased the quarterly common stock dividend from $0.62 to $0.70 per share with dividend declared in Q4 • In 2024, Fundación Banco Popular celebrated 45 years of dedication to providing opportunities of excellence in education Milestones for children and youth, while also supporting the communities we serve 12

2025 Results Guidance 2025 Guidance Net Interest Driven by repricing of investments at higher rates, loan originations and 7%-9% increase for the year lower deposit costs Income Non-Interest $5 million per quarter lower than FY24 trend due to impact of sale of the $155 million - $160 million each quarter car rental business Income NCOs 70-90 bps annualized Based on current loss trends and macroeconomic environment Operating 4% increase for the year Increase driven by personnel and technology expenses Expenses Higher proportion of tax-exempt income and income from subsidiaries Effective Tax Rate 19%-21% with lower statutory rates Loan Growth 3%-5% accelerating as the year progresses Both banks contributing to loan growth; higher rate of growth in 2H2025 13

Footnotes Slide 3: (1) Refer to Non-GAAP Reconciliation on slide 17 of the appendix section of this presentation. (2) Fully taxable equivalent (“FTE”) net interest margin represents a non-GAAP financial measure. See the Corporation's earnings press release, Form 10-Q and Form 10-K filed with the U.S. Securities and Exchange Commission for the applicable periods for a GAAP to non-GAAP reconciliation. Slide 4: (1) Fully taxable equivalent (“FTE”) net interest margin represents a non-GAAP financial measure. See the Corporation's earnings press release, Form 10-Q and Form 10-K filed with the U.S. Securities and Exchange Commission for the applicable periods for a GAAP to non-GAAP reconciliation. Slide 7: (1) Balances are as of end of period. (2) Fully taxable equivalent (“FTE”) net interest margin represents a non-GAAP financial measure. See the Corporation's earnings press release, Form 10-Q and Form 10-K filed with the U.S. Securities and Exchange Commission for the applicable periods for a GAAP to non-GAAP reconciliation. Slide 8: (1) TCE ratio is defined as the ratio of tangible common equity to tangible assets. 14

Investor Presentation Fourth Quarter 2024 Appendix 15

Corporate Structure Franchise Summary Corporate Structure Industry Financial Services Headquarters San Juan, Puerto Rico Assets = $73 billion Assets $73 billion (among top 50 BHCs in the U.S.) Holding Co. Banco Popular Popular’s Popular North (Including Popular de Securities Insurance America, Inc. Equity Puerto Rico LLC Subsidiaries Loans $37 billion Investments) Deposits $65 billion Popular Popular Auto, 1 Bank LLC Banking branches 153 in Puerto Rico, 40 in the Earnings Earnings U.S. (28 in New York and New Jersey and 12 in Florida) and 9 in the U.S. and British Virgin Puerto Rico Operations United States Operations Islands Assets = $59 billion Assets = $14 billion NASDAQ ticker symbol BPOP Selected equity investments: Banco BHD León under Corporate segment Market Cap $6.6 billion • Dominican Republic bank • 15.63% stake • 2023 net income of $227 million Information as of December 31, 2024 16 ¹ Doing business as Popular

Non-GAAP Reconciliation The following table presents the reconciliation of the net income to the Adjusted net income (Non-GAAP) for the period ended December 31, 2024. There were no adjustments to net income for the quarter ended December 31, 2024. Adjusted Net Income for the Year ended December 31, 2024 (Non-GAAP) (Unaudited) Income Income tax Impact on before expense Net Income (In thousands) income tax (benefit) U.S. GAAP Net income $ 796,618 $ 182,406 $ 614,212 Non-GAAP Adjustments: [1] FDIC Special Assessment 14,287 (5,234) 9,053 [2] Adjustments related to intercompany distributions 6,400 16,483 22,883 Adjusted net income (Non-GAAP) $ 817,305 $ 171,157 $ 646,148 [1] Expense recorded in the first quarter of 2024 related to the Special Assessment imposed by the FDIC to recover the losses in connection with the receivership of several failed banks [2] Expense recorded in the first quarter of 2024 related to tax withholdings on prior period distributions from U.S. subsidiaries Adjusted Net Income for the Year ended December 31, 2023 (Non-GAAP) (Unaudited) Income Income tax Impact on before expense Net Income (In thousands) income tax (benefit) U.S. GAAP Net income $ 675,539 $ 134,197 $ 541,342 Non-GAAP Adjustments: [1] FDIC Special Assessment 71,435 (26,170) 45,265 Adjusted net income (Non-GAAP) $ 746,974 $ 160,367 $ 586,607 [1] Expense recorded in the fourth quarter of 2023 related to the Special Assessment imposed by the FDIC to recover losses in connection with the receivership of several failed banks 17

2024 Financial Summary Annual Results (unaudited) ($ in thousands, except EPS) 2024 2023 Variance Net interest income $ 2,282,288 $ 2,131,524 $ 150,764 Provision for credit losses 256,942 208,609 48,333 Net interest income after provision for credit losses $2 ,025,346 $ 1,922,915 $ 1 02,431 Service charges on deposits 151,343 147,476 3,867 Other service fees 389,233 374,440 14,793 Mortgage banking activities 19,059 21,497 (2,438) Other non-interest income 99,274 107,311 (8,037) Total non-interest income $ 6 58,909 $ 6 50,724 $ 8,185 Personnel costs 820,451 778,045 42,406 Net occupancy expenses 111,430 111,586 (156) Equipment expenses 33,424 37,057 (3,633) Professional fees 125,822 161,142 (35,320) Technology and software expenses 329,061 290,615 38,446 Processing and transactional services 142,677 138,070 4,607 Business promotion 101,930 94,926 7,004 Deposit insurance 54,626 105,985 (51,359) Other real estate owned (OREO) income (18,124) (15,375) (2,749) Other operating expenses 186,340 173,049 13,291 Goodwill impairment - 23,000 (23,000) Total operating expenses $1 ,887,637 $ 1,898,100 $ ( 10,463) Income before income tax 796,618 675,539 121,079 Income tax expense 182,406 134,197 48,209 Net income $ 6 14,212 $ 5 41,342 $ 72,870 EPS $ 8.56 $ 7.53 $ 1.03 ROTCE 9.85% 9.40% 0.45% 18 Differences due to rounding

Q4 2024 vs. Q3 2024 Financial Results BPPR Popular U.S. (Unaudited) ($ in millions) Q4 2024 Q3 2024 Variance Q4 2024 Q3 2024 Variance Net interest income $ 507 $ 488 $ 19 $ 92 $ 93 $ (1) Provision for credit losses 66 78 (12) ( 1) (6) 5 Net interest income after provision for credit losses 441 410 31 93 99 (6) Non-interest income 149 149 - 6 7 ( 1) Operating expenses 403 403 - 65 65 - Income before income tax 187 156 31 34 41 (7) Income tax expense 36 30 6 10 12 (2) Net income $ 151 $ 126 $ 25 $ 24 $ 29 $ (5) Balance Sheet Highlights BPPR Popular U.S. (Unaudited) ($ in millions) Q4 2024 Q3 2024 Variance Q4 2024 Q3 2024 Variance Total assets $ 58,602 $ 56,907 $ 1,695 $1 4,333 $ 14,306 $ 27 Total loans HIP 26,147 25,694 453 10,929 10,469 460 Total deposits 54,054 52,701 1,353 11,704 11,891 (187) Asset Quality BPPR Popular U.S. Q4 2024 Q3 2024 Variance Q4 2024 Q3 2024 Variance Non-performing loans held-in-portfolio (HIP) / Total loans (HIP) 1.12% 1.12% 0.00% 0.54% 0.69% (0.15%) Non-performing assets / Total assets 0.60% 0.62% (0.02%) 0.41% 0.51% (0.10%) Allowance for credit losses / Total loans (HIP) 2.56% 2.59% (0.03%) 0.69% 0.75% (0.06%) Net Interest Margin (NIM) 3.56% 3.41% 0.15% 2.71% 2.73% (0.02%) 19

2024 vs. 2023 Business Segments Financial Results BPPR Popular U.S. (Unaudited) ($ in millions) 2024 2023 Variance 2024 2023 Variance Net interest income $ 1,957 $ 1,812 $ 145 $ 356 $ 351 $ 5 Provision for credit losses 255 195 60 1 15 (14) Net interest income after provision for credit losses 1,702 1,617 85 355 336 19 Non-interest income 596 587 9 26 25 1 Operating expenses 1,614 1,615 (1) 270 286 (16) Income before income tax 684 589 95 111 75 36 Income tax expense 128 117 11 33 19 14 Net income $ 556 $ 472 $ 84 $ 78 $ 56 $ 22 Balance Sheet Highlights BPPR Popular U.S. (Unaudited) ($ in millions) 2024 2023 Variance 2024 2023 Variance Total assets $ 58,602 $ 57,023 $ 1,579 $1 4,333 $ 13,812 $ 521 Total loans HIP 26,147 24,478 1,669 10,929 10,554 375 Total deposits 54,054 53,133 921 1 1,704 11,271 433 Asset Quality BPPR Popular U.S. 2024 2023 Variance 2024 2023 Variance Non-performing loans held-in-portfolio (HIP) / Total loans (HIP) 1.12% 1.34% (0.22%) 0.54% 0.27% 0.27% Non-performing assets / Total assets 0.60% 0.72% (0.12%) 0.41% 0.21% 0.20% Allowance for credit losses / Total loans (HIP) 2.56% 2.61% (0.05%) 0.69% 0.85% (0.16%) Net Interest Margin (NIM) 3.43% 3.20% 0.23% 2.66% 2.98% (0.32%) 20 Differences due to rounding
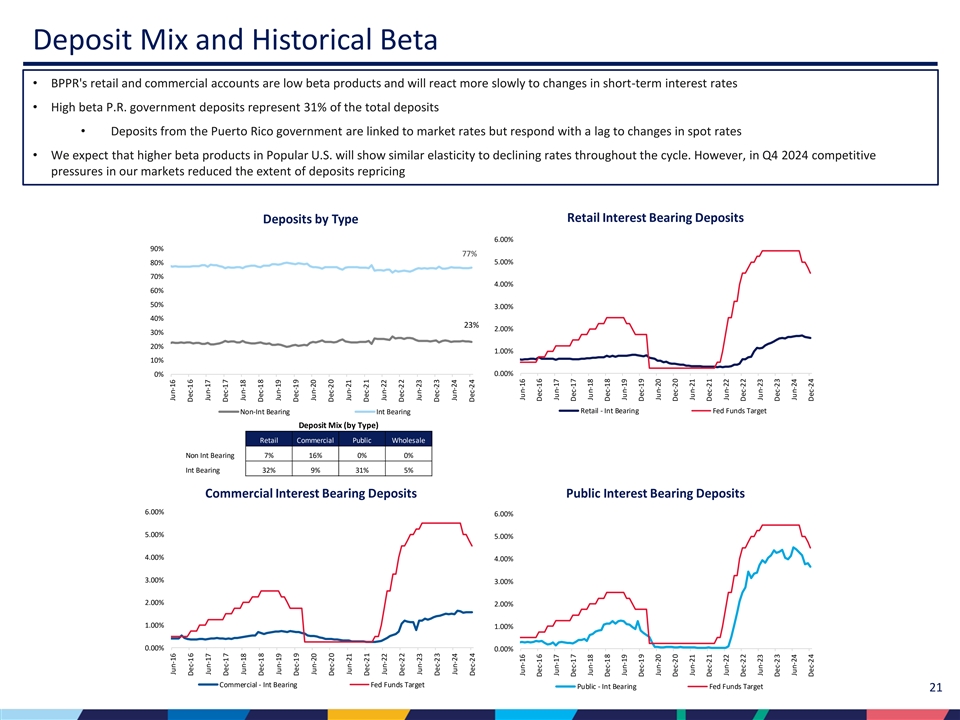
Deposit Mix and Historical Beta • BPPR's retail and commercial accounts are low beta products and will react more slowly to changes in short-term interest rates • High beta P.R. government deposits represent 31% of the total deposits • Deposits from the Puerto Rico government are linked to market rates but respond with a lag to changes in spot rates • We expect that higher beta products in Popular U.S. will show similar elasticity to declining rates throughout the cycle. However, in Q4 2024 competitive pressures in our markets reduced the extent of deposits repricing Retail Interest Bearing Deposits Deposits by Type 6.00% 90% 77% 5.00% 80% 70% 4.00% 60% 50% 3.00% 40% 23% 2.00% 30% 20% 1.00% 10% 0.00% 0% Retail - Int Bearing Fed Funds Target Non-Int Bearing Int Bearing Deposit Mix (by Type) Retail Commercial Public Wholesale Non Int Bearing 7% 16% 0% 0% Int Bearing 32% 9% 31% 5% Commercial Interest Bearing Deposits Public Interest Bearing Deposits 6.00% 6.00% 5.00% 5.00% 4.00% 4.00% 3.00% 3.00% 2.00% 2.00% 1.00% 1.00% 0.00% 0.00% Commercial - Int Bearing Fed Funds Target Public - Int Bearing Fed Funds Target 21 Jun-16 Jun-16 Dec-16 Dec-16 Jun-17 Jun-17 Dec-17 Dec-17 Jun-18 Jun-18 Dec-18 Dec-18 Jun-19 Jun-19 Dec-19 Dec-19 Jun-20 Jun-20 Dec-20 Dec-20 Jun-21 Jun-21 Dec-21 Dec-21 Jun-22 Jun-22 Dec-22 Dec-22 Jun-23 Jun-23 Dec-23 Dec-23 Jun-24 Jun-24 Dec-24 Dec-24 Jun-16 Jun-16 Dec-16 Dec-16 Jun-17 Jun-17 Dec-17 Dec-17 Jun-18 Jun-18 Dec-18 Dec-18 Jun-19 Jun-19 Dec-19 Dec-19 Jun-20 Jun-20 Dec-20 Dec-20 Jun-21 Jun-21 Dec-21 Dec-21 Jun-22 Jun-22 Dec-22 Dec-22 Jun-23 Jun-23 Dec-23 Dec-23 Jun-24 Jun-24 Dec-24 Dec-24

Investments Portfolio Highlights: $ in millions Q4 2024 Variance to Q3 2024 Q3 2024 Maturity / • Conservative investment portfolio, with the majority Amortized % of Book Gain / Amortized Gain / 1 Description Cost Portfolio Value (Loss) Yield WAL Cost (Loss) invested in short to intermediate U.S. Treasuries, which 1 are tax exempt for P.R. corporations Money Markets (Cash at Federal Reserve) $6,371 19.7% $6,371 $0 4.4% - ($152) $0 • Investment portfolio duration 2.2 years; including cash, U.S. T-bills 7,511 23.2% 7,511 - 4.3% 0.1 1,632 - 1.8 years AFS U.S. Treasuries 5,592 16.9% 5,484 (108) 2.2% 1.3 ( 160) (2) Agency MBS/CMO 6,412 16.2% 5,249 (1,163) 1.8% 7.2 ( 185) (226) • Unrealized loss in the AFS portfolio increased by $183 Total AFS 19,515 56.3% 18,244 (1,271) 2.9% 2.5 1,287 (228) million 2 U.S. Treasuries 8,172 23.7% 7,693 (479) 1.4% 2.4 (153) 46 • Market value of the HTM U.S. Treasuries portfolio stood HTM Other 65 0.2% 65 - 2.0% 13.9 (1) - at $7.62 billion, $70 million lower than the book value Total HTM 8,237 23.9% 7,759 (479) 1.4% 2.5 (154) 46 • Invested approx. $1.7 billion in short-duration U.S. Total Trading 33 0.1% 33 0 5.3% 8.2 2 (0) Treasury notes during the second half of 2024, with an average yield of approximately 4% Total Portfolio $34,156 100.0% $32,406 ($1,750) 2.9% 2.0 $983 ($183) Maturities: US Treasury Notes (AFS & HTM) 1,200 Maturity Profile 35% 1,000 30% 29% 800 24% 25% 20% 600 20% 15% 400 12% 10% 200 5% 5% 4% 3% 1% 1% 0% 0% 0% 0% 0% 0% 0% 0% 0% 0% 0% 0% - 0 - 3 yrs 4 - 5 yrs 6 - 7 yrs 8 - 10 yrs UST Legacy (Pre 2024) UST New (Program restarted in 2024) U.S. T-bills U.S. Treasuries - AFS U.S. Treasuries - HTM Agency MBS/CMO 1 Maturity expressed in years; In the case of mortgage-backed securities and CMO’s, it represents the weighted average life of the bonds assuming market consensus prepayment speeds 2 The Book value includes $383 million of net unrealized loss in AOCI related to the securities transferred from available-for-sale securities portfolio to the held-to-maturity with an unrealized loss of $873 million at the time of transfer, which will be amortized (back into capital) throughout their remaining life at a rate of approximately 5% per quarter through 2026. 22 Differen ces due to rounding $ Millions

P.R. Public Sector Exposure The Corporation does not own any loans issued by the P.R. central government or its public corporations. As of December 31, 2024, our direct exposure to P.R. municipalities was $336 million, flat QoQ. Municipalities Outstanding P.R. Government Exposure ($ in millions) Loans Securities Total Obligations of municipalities are backed by real and personal property taxes, municipal excise taxes, and/or a percentage of the sales and use tax Municipalities $ 323 $ 13 $ 336 Indirect Exposure $ 176 $ 45 $ 221 Indirect Exposure Indirect exposure includes loans or securities that are payable by non-governmental entities, but which carry a government guarantee to cover any shortfall in collateral in the event of borrower default. Majority are single-family mortgage related 23 Differences due to rounding

Non-Owner Occupied CRE Portfolio Quarter Highlights: Non-Owner Occupied CRE • Non-Owner Occupied CRE (CRE NOO) mainly in retail, hotels and office ($ in millions) space $5,363 $5,185 $5,087 $5,057 $5,005 2.5% • Office exposure limited to 1.9% of total loan portfolio and 13% of CRE 5,000 $2,117 NOO: $2,037 $2,082 $2,061 $2,025 2.0% 4,000 ‐ Office space mainly in mid-rise properties with diversified tenants 1.30% 1.30% 1.30% 1.30% 1.02% 1.5% across both regions 3,000 $3,148 $3,247 $3,005 $2,996 $2,980 ‐ Average loan size at $2.4 million 1.0% 2,000 • Favorable credit risk profile with low level of NCOs, NPLs, criticized and 0.27% 0.5% 1,000 0.20% 0.20% 0.20% 0.20% classified loans 0 0.0% • Non-Performing loans flat QoQ at 0.27% of loans Q4 2023 Q1 2024 Q2 2024 Q3 2024 Q4 2024 • Allowance for credit losses to loans held-in-portfolio at 1.02%, driven by a BPPR Popular U.S. NPL/Loans ACL/Loans reduction in the qualitative reserve due to the implementation of a new CECL model for CRE NOO loans in P.R. Non-Owner Occupied CRE Credit Metrics Balance by property type Metric Q4 2023 Q1 2024 Q2 2024 Q3 2024 Q4 2024 Other 30-89 DPD/Loans 0.14% 0.15% 0.14% 0.26% 0.20% Health Facility 7% 4% NPL/Loans 0.19% 0.20% 0.17% 0.19% 0.27% Mixed use Retail NCO Ratio (0.02%) (0.03%) (0.01%) 0.00% (0.06%) 33% 5% ACL/Loans 1.29% 1.30% 1.28% 1.30% 1.02% Industrial ACL/NPL 663.73% 635.31% 754.88% 691.89% 377.29% 8% Classified Loans/Loans 1.75% 2.08% 2.47% 1.34% 3.01% Shelters 11% Office Space 13% Hotels 19% 24 Differences due to rounding

Multifamily Loans Portfolios Quarter Highlights: Multifamily Loans • 87% of the portfolio concentrated in Popular U.S. ($ in millions) • Strong credit risk profile with low levels of delinquency, NCOs and $2,416 $2,406 $2,400 $2,385 $2,385 classified loans: 2,500 1.4% $2,124 $2,100 ‐ 30-89 DPD/Loans at 0.29% $2,081 $2,080 $2,092 2,000 1.2% ‐ Classified loans at 1.10% 0.50% 0.50% 1.0% 0.40% 1,500 0.38% ‐ NCO Ratio 0.0% 0.60% 0.8% • Allowance for credit losses (“ACL”) to loans held-in-portfolio at 0.38% 1,000 0.6% 0.40% 0.40% 0.40% 0.37% • New York portfolio: 0.4% 500 0.10% ‐ $1.5 billion or 4.0% of our total loan portfolio 0.2% $304 $305 $306 $308 $292 0 0.0% ‐ Underwritten based on current rental income at origination Q4 2023 Q1 2024 Q2 2024 Q3 2024 Q4 2024 ‐ No exposure to rent controlled buildings BPPR Popular U.S. NPL/Loans ACL/Loans ‐ Rent stabilized units represent less than 40% of the total units in the loan portfolio with the majority originated after 2019 Multifamily Loans Credit Metrics Balance by state Metric Q4 2023 Q1 2024 Q2 2024 Q3 2024 Q4 2024 Other PR 2% 30-89 DPD/Loans 0.48% 1.04% 0.13% 0.12% 0.29% 9% NPL/Loans 0.08% 0.37% 0.38% 0.37% 0.37% NCO Ratio 0.00% 0.07% 0.00% 0.00% 0.00% ACL/Loans 0.57% 0.53% 0.47% 0.40% 0.38% ACL/NPL 690.20% 144.72% 122.28% 109.72% 105.20% Classified Loans/Loans 1.18% 1.57% 1.12% 1.30% 1.10% FL 28% NY 61% 25 Differences due to rounding

Auto Loans Portfolio Quarter Highlights: Delinquency Avg. 2011-2019 12/31/2024 ($in millions) • Auto balances have steadily increased since the pandemic 6.17% 5.00% • Delinquency and NCOs have gradually increased, but continue to 4500 0.06 $3,819 $3,821 remain below pre-pandemic levels $3,773 $3,707 4000 $3,633 $3,661 $3,566 $3,518 $3,513 0.05 3500 • FICO mix of originations have remained robust, with weighted- $2,918 5.00% 4.73% average FICO scores of approximately 737 3000 0.04 4.67% 4.46% 4.20% 4.64% 2500 3.86% • YTD originations were approximately 68%/32% split between 0.03 3.68% 3.66% 2000 new/used auto loans 3.20% 1500 0.02 1000 0.01 500 $135 $129 $113 $131 $153 $173 $143 $168 $178 $191 0 0 Q4 2019 Q4 2022 Q1 2023 Q2 2023 Q3 2023 Q4 2023 Q1 2024 Q2 2024 Q3 2024 Q4 2024 30+ DPD Portfolio 30+ DPD/Portfolio FICO Mix of Originations (% of approved amount) NCOs and NCO-to-Loan Ratio 737 729 732 731 723 720 721 719 719 ($ in millions) Avg. 2011-2019 YTD 700 100% 1.88% 1.60% 3% 4% 5% 6% 6% 6% 7% 7% 8% 7% 6% 4% 4% 3% 2% 600 7% 7% 9% 20 0.03 80% 18 23% 26% 24% 24% 500 30% 30% 27% 26% 0.025 26% 16 14 2.44% 60% 400 0.02 12 1.99% 300 10 0.015 40% 8 67% 66% 66% 65% 200 0.01 61% 60% 60% 60% 58% 6 20% 4 0.005 100 2 $18 $11 $7 $2 $10 $16 $14 $10 $17 $19 0 0 0% 0 Q4 2019 Q4 2022 Q1 2023 Q2 2023 Q3 2023 Q4 2023 Q1 2024 Q2 2024 Q3 2024 Q4 2024 2016 2017 2018 2019 2020 2021 2022 2023 2024 Auto NCOs NCOs % 700+ 625-699 <625 No FICO WA FICO 26 Differences due to rounding
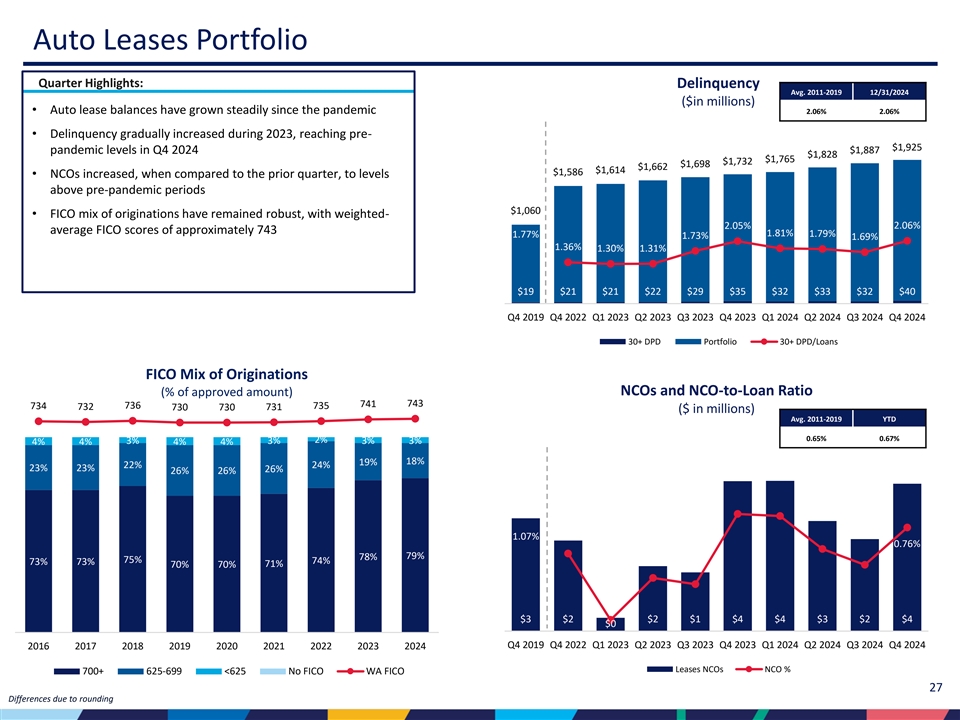
Auto Leases Portfolio Quarter Highlights: Delinquency Avg. 2011-2019 12/31/2024 ($in millions) • Auto lease balances have grown steadily since the pandemic 2.06% 2.06% 2500 0.06 • Delinquency gradually increased during 2023, reaching pre- $1,925 0.05 $1,887 pandemic levels in Q4 2024 2000 $1,828 $1,765 $1,732 $1,698 $1,662 $1,614 $1,586 • NCOs increased, when compared to the prior quarter, to levels 0.04 above pre-pandemic periods 1500 0.03 $1,060 • FICO mix of originations have remained robust, with weighted- 2.05% 2.06% 1000 average FICO scores of approximately 743 1.81% 1.77% 1.79% 1.73% 1.69% 0.02 1.36% 1.30% 1.31% 500 0.01 $19 $21 $21 $22 $29 $35 $32 $33 $32 $40 0 0 Q4 2019 Q4 2022 Q1 2023 Q2 2023 Q3 2023 Q4 2023 Q1 2024 Q2 2024 Q3 2024 Q4 2024 30+ DPD Portfolio 30+ DPD/Loans FICO Mix of Originations (% of approved amount) NCOs and NCO-to-Loan Ratio 743 741 734 736 735 732 730 730 731 ($ in millions) Avg. 2011-2019 YTD 700 100% 0.65% 0.67% 2% 3% 3% 3% 3% 4% 4% 4% 4% 600 18% 19% 22% 24% 4 0.012 23% 23% 26% 26% 26% 80% 500 3.5 0.01 3 60% 400 0.008 2.5 1.07% 300 0.76% 2 0.006 40% 79% 78% 75% 74% 73% 73% 71% 70% 70% 1.5 200 0.004 1 20% 100 0.002 0.5 $3 $2 $2 $1 $4 $4 $3 $2 $4 $0 0 0 0% 0 Q4 2019 Q4 2022 Q1 2023 Q2 2023 Q3 2023 Q4 2023 Q1 2024 Q2 2024 Q3 2024 Q4 2024 2016 2017 2018 2019 2020 2021 2022 2023 2024 Leases NCOs NCO % 700+ 625-699 <625 No FICO WA FICO 27 Differences due to rounding
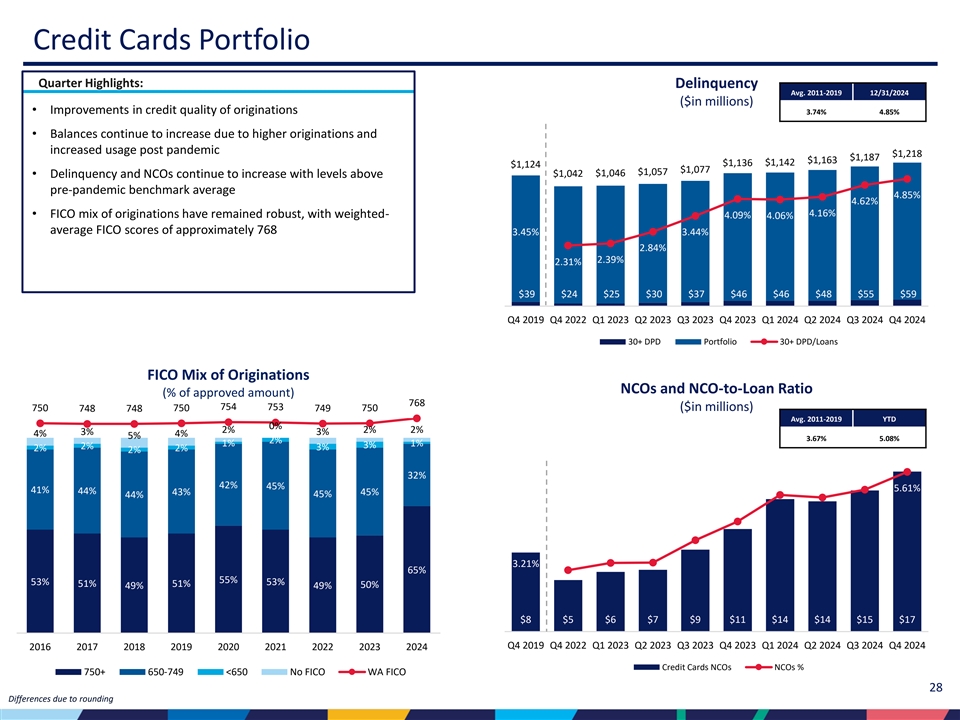
Credit Cards Portfolio Quarter Highlights: Delinquency Avg. 2011-2019 12/31/2024 ($in millions) • Improvements in credit quality of originations 3.74% 4.85% • Balances continue to increase due to higher originations and 1400 0.06 increased usage post pandemic $1,218 $1,187 0.055 $1,163 $1,142 $1,136 $1,124 1200 $1,077 $1,057 $1,046 0.05 $1,042 • Delinquency and NCOs continue to increase with levels above 0.045 pre-pandemic benchmark average 1000 4.85% 0.04 4.62% 0.035 4.16% 800 • FICO mix of originations have remained robust, with weighted- 4.09% 4.06% 0.03 average FICO scores of approximately 768 3.45% 3.44% 600 0.025 2.84% 0.02 400 2.39% 2.31% 0.015 0.01 200 0.005 $39 $24 $25 $30 $37 $46 $46 $48 $55 $59 0 0 Q4 2019 Q4 2022 Q1 2023 Q2 2023 Q3 2023 Q4 2023 Q1 2024 Q2 2024 Q3 2024 Q4 2024 30+ DPD Portfolio 30+ DPD/Loans FICO Mix of Originations NCOs and NCO-to-Loan Ratio (% of approved amount) 768 754 753 ($in millions) 750 748 748 750 749 750 Avg. 2011-2019 YTD 0% 2% 2% 2% 3% 3% 4% 4% 100% 5% 700 3.67% 5.08% 2% 1% 1% 3% 2% 3% 2% 2% 2% 18 0.06 600 80% 32% 16 42% 45% 0.05 5.61% 41% 44% 500 43% 45% 45% 44% 14 60% 12 0.04 400 10 0.03 300 40% 8 3.21% 65% 6 0.02 200 55% 53% 53% 51% 51% 50% 49% 49% 20% 4 0.01 100 2 $8 $5 $6 $7 $9 $11 $14 $14 $15 $17 0 0 0% 0 Q4 2019 Q4 2022 Q1 2023 Q2 2023 Q3 2023 Q4 2023 Q1 2024 Q2 2024 Q3 2024 Q4 2024 2016 2017 2018 2019 2020 2021 2022 2023 2024 Credit Cards NCOs NCOs % 750+ 650-749 <650 No FICO WA FICO 28 Differences due to rounding

P.R. Personal Loans Portfolio Quarter Highlights: Delinquency Avg. 2011-2019 12/31/2024 ($ in millions) • Improvements in credit quality of originations 3.61% 3.01% 200 0 0.06 • Portfolio balances have been increasing since the pandemic, but $1,776 $1,763 $1,746 $1,745 $1,754 $1,754 $1,686 180 0 at a slower pace in 2024 due to tightening measures $1,613 $1,586 0.05 160 0 $1,368 • Delinquency has been gradually increasing but remains below the 140 0 0.04 pre-pandemic average benchmark. 120 0 • NCO rate trending up, surpassing Q4 2019 level, but showing 100 0 0.03 signs of stabilization 3.15% 3.19% 800 3.09% 3.01% 2.97% 2.92% 2.87% 0.02 2.61% 2.53% 2.51% 600 • FICO mix of originations robust, with weighted-average FICO 400 scores of 748 in recent vintages, approximating pre-pandemic 0.01 200 levels $43 $40 $41 $44 $51 $53 $51 $54 $56 $53 0 0 Q4 2019 Q4 2022 Q1 2023 Q2 2023 Q3 2023 Q4 2023 Q1 2024 Q2 2024 Q3 2024 Q4 2024 30+ DPD Portfolio 30+ DPD/Loans FICO Mix of Originations (% of approved amount) NCOs and NCO- to Loan Ratio 746 748 743 741 738 736 740 738 738 ($ in millions) Avg. 2011-2019 YTD 0% 0% 1% 1% 2% 2% 700 3% 3% 3% 100% 2.53% 5.04% 3% 2% 3% 3% 3% 3% 4% 4% 5% 25 0.07 600 80% 0.06 500 49% 20 46% 44% 51% 53% 56% 50% 56% 49% 0.05 60% 400 5.32% 15 0.04 300 4.19% 40% 0.03 10 200 0.02 49% 49% 49% 44% 20% 43% 43% 43% 40% 41% 5 100 0.01 $14 $10 $12 $13 $17 $20 $22 $21 $22 $23 0 0 0% 0 Q4 2019 Q4 2022 Q1 2023 Q2 2023 Q3 2023 Q4 2023 Q1 2024 Q2 2024 Q3 2024 Q4 2024 2016 2017 2018 2019 2020 2021 2022 2023 2024 Personal Loans NCOs NCO % 750+ 650-749 <650 No FICO WA FICO 29 Differences due to rounding

Popular, Inc. Credit Ratings Senior Unsecured Ratings Senior Unsecured Ratings Fitch BBB- Stable Outlook S&P BB+ Stable Outlook Moody’s Ba1 Stable Outlook 2018 2019 2020 2021 2022 April April June Moody’s Moody's September April Fitch upgrades upgrades to upgrades to B1 Moody’s upgrades S&P upgrades to to BBB- from Ba3 from B1 from B2 May March to Ba1 from Ba3, BB+ from BB-, BB, revised Fitch Moody’s revised outlook to Fitch and S&P revised outlook May S&P revised outlook to upgrades to revised outlook Stable revised outlook to Stable Fitch revised outlook to Stable BB from BB- to Positive to Positive Positive outlook to Positive March S&P lowers outlook to Stable 30

Investor Presentation Fourth Quarter 2024