Exhibit 99.2
Investor Presentation Second Quarter 2021 July 29, 2021
2 2 Forward looking statements This presentation contains forward - looking statements as defined by the Private Securities Litigation Reform Act of 1995. Forward - looking statements do not represent historical facts, but are statements about management's beliefs, plans and objectives about the future, as well as its assumptions and judgments concerning such beliefs, plans and objectives. These statements are evidenced by terms such as "anticipate," "estimate," "should," "expect," "believe," "intend," and similar expressions. Although these statements reflect management's good faith beliefs and projections, they are not guarantees of future performance and they may not prove true. The beliefs, plans and objectives on which forward - looking statements are based involve risks and uncertainties that could cause actual results to differ materially from those addressed in the forward - looking statements. For a discussion of these risks and uncertainties, see the section of the periodic reports that First United Corporation files with the Securities and Exchange Commission entitled "Risk Factors", including the risk factor set forth in First United Corporation’s Annual Report on Form 10 - K, as amended, for the year ended December 31, 2020 entitled, “The outbreak of the recent coronavirus (“COVID - 19”), or an outbreak of another highly infectious or contagious disease, could adversely affect First United Corporation’s business, financial condition and results of operations.” and any updates thereto that might be contained in subsequent reports filed by First United Corporation. The risks and uncertainties associated with the COVID - 19 pandemic and its impact on First United Corporation will depend on, among other things, the length of time that the pandemic continues; the potential imposition of further restrictions on travel in the future; the effect of the pandemic on the global, national, and local economies and on the businesses of our borrowers and their ability to make payments on their obligations; the remedial actions and stimulus measures adopted by federal, state, and local governments; and the inability of employees to work due to illness, quarantine, or government mandates. Whether actual results will conform to expectations and predictions is subject to known and unknown risks and uncertainties. Actual results could be materially different from management’s expectations. This presentation should be read in conjunction with our Annual Report on Form 10 - K, as amended, for the year ended December 31, 2020, including the sections of the report entitled “Risk Factors”, as well as the reports and other documents that we subsequently file with the Securities and Exchange Commission (“SEC”), which are available on the SEC’s website at www.sec.gov or at our website at www.mybank.com . Except as required by law, we do not intend to publish updates or revisions of any forward - looking statements we make to reflect new information, future events or otherwise.
3 3 Table of Contents I. Executive Summary Pg. 4 II. Operating and Financial Performance Pg. 13 III. Our Commitment To ESG Pg. 30 IV. Appendix Pg. 34

4 4 I. Executive Summary

5 5 Executive Summary Robust enterprise risk management protocol Execution of our strategy is producing steady profitable growth Our Board is continuing to strengthen its ESG profile ▪ Disciplined credit culture and strong allowance for loan loss ratio of 1.59% (excluding PPP balances) ▪ Capital and liquidity remain strong ▪ Well - positioned for rising rate environment with an asset - sensitive balance sheet ▪ Highly rated fraud monitoring and information technology programs ▪ Ongoing board refreshment, including formal adoption of diversity and inclusion policies ▪ Declassified board of directors following the 2021 annual shareholder meeting ▪ Named an internal Director of Diversity and Engagement to increase focus on diversity, equity and inclusion for associates and customers ▪ Enhanced shareholder engagement and communication ▪ In 2Q21 we grew earnings per share compared to 2Q20 by 81% (GAAP) ▪ Pre - provision net revenue (*) for 2Q21increased 19% compared to 2Q20 ▪ Pre - provision net revenue (*) YTD, adjusted for litigation settlement expense, increased 39% compared to the first six months of 2020 ▪ Dividend on common stock increased from $0.13 per share to $0.15 per share; a 15% increase (*) See Appendix for a reconciliation of this non - GAAP financial measure
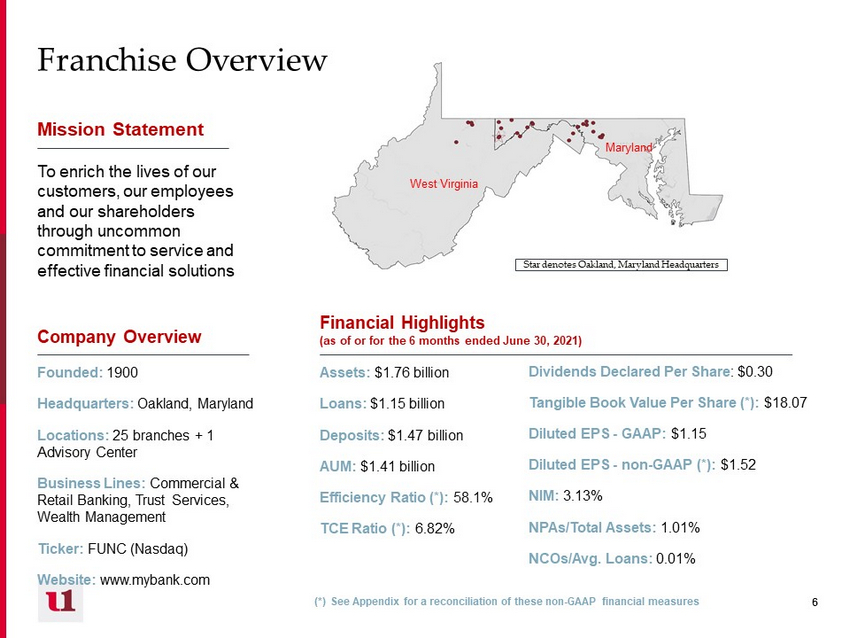
6 6 Mission Statement To enrich the lives of our customers, our employees and our shareholders through uncommon commitment to service and effective financial solutions Company Overview Founded: 1900 Headquarters: Oakland, Maryland Locations: 25 branches + 1 Advisory Center Business Lines: Commercial & Retail Banking, Trust Services, Wealth Management Ticker: FUNC (Nasdaq) Website: www.mybank.com Financial Highlights (as of or for the 6 months ended June 30, 2021) Assets: $1.76 billion Loans: $1.15 billion Deposits: $1.47 billion AUM: $1.41 billion Efficiency Ratio (*): 58.1 % TCE Ratio (*): 6.82% Dividends Declared Per Share : $0.30 Tangible Book Value Per Share (*): $18.07 Diluted EPS - GAAP: $1.15 Diluted EPS - non - GAAP (*): $1.52 NIM: 3.13% NPAs/Total Assets: 1.01% NCOs/Avg. Loans: 0.01% West Virginia Maryland Star denotes Oakland, Maryland Headquarters Franchise Overview (*) See Appendix for a reconciliation of these non - GAAP financial measures
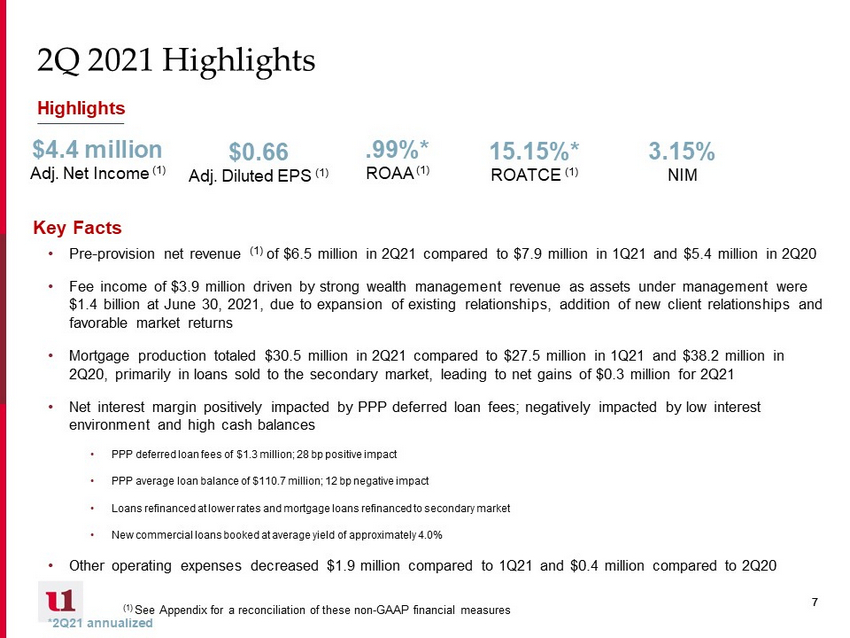
7 7 2Q 2021 Highlights Highlights • Pre - provision net revenue (1) of $6.5 million in 2Q21 compared to $7.9 million in 1Q21 and $5.4 million in 2Q20 • Fee income of $3.9 million driven by strong wealth management revenue as assets under management were $1.4 billion at June 30, 2021, due to expansion of existing relationships, addition of new client relationships and favorable market returns • Mortgage production totaled $30.5 million in 2Q21 compared to $27.5 million in 1Q21 and $38.2 million in 2Q20, primarily in loans sold to the secondary market, leading to net gains of $0.3 million for 2Q21 • Net interest margin positively impacted by PPP deferred loan fees; negatively impacted by low interest environment and high cash balances • PPP deferred loan fees of $1.3 million; 28 bp positive impact • PPP average loan balance of $110.7 million; 12 bp negative impact • Loans refinanced at lower rates and mortgage loans refinanced to secondary market • New commercial loans booked at average yield of approximately 4.0% • Other operating expenses decreased $1.9 million compared to 1Q21 and $0.4 million compared to 2Q20 *2Q21 annualized $4.4 million Adj. Net Income (1) $0.66 Adj. Diluted EPS (1) .99%* ROAA (1) 15.15%* ROATCE (1) 3.15% NIM Key Facts (1) See Appendix for a reconciliation of these non - GAAP financial measures

8 8 YTD Highlights Highlights • Increased pre - provision net revenue (1) to $14.4 million in YTD 2021 from $10.4 million in YTD 2020 • Fee income of $7.9 million driven by strong wealth management revenue as assets under management were $1.4 billion at June 30, 2021, due to expansion of existing relationships, addition of new client relationships and favorable market returns • Paycheck Protection Program (“PPP”) 2020 production of $149 million and YTD 2021 production of $66 million, with $141 million forgiven for both programs at the end of June 2021 • Mortgage production totaled $57.9 million YTD 2021 compared to $62.5 million in YTD 2020, primarily in loans sold to the secondary market, leading to strong net gains of $0.9 million YTD • Allowance for Loan Losses to gross loans 1.49% including PPP loans; 1.60% excluding guaranteed PPP loans. No release of provision in 2020 or YTD 2021. Asset quality remained strong, with low delinquency and most loans returning to full principal and interest payments • Net interest margin reduced due to PPP loans, low interest rate environment and high cash balances • Opened a new Advisory Center in Cheat Lake, Monongalia County, WV *YTD 2Q21 annualized $10.4 million Adj. Net Income (1) $1.52 Adj. Diluted EPS (1) 1.17%* ROAA (1) 17.56%* ROATCE (1) 3.13% NIM Key Facts (1) See Appendix for a reconciliation of these non - GAAP financial measures

9 9 Our Core Markets (As of June 30, 2021) Note: Out of market loans and trust deposits represent $69 million and $49 million, respectively, and are not reflected in th e a bove table (1) Source: FDIC Market Share Data, most current. Deposit market share for each region includes the following counties liste d b elow: West: Harrison, WV; Monongalia, WV Central: Garrett, MD; Allegany, MD; Mineral, WV East: Washington, MD; Frederick, MD; Berkeley, WV (2) Includes 1 Advisory Center opened in the West Region in 1Q21 West Region Central Region East Region Loans (000s) $281,643 $374,093 $420,722 Deposits (000s) $129,460 $778,427 $509,085 Deposit Market Share (1) (at June 30, 2020) 2% 43% 4% Branches / Advisory Centers (2) 5 10 11

10 10 Our Core Strengths Engaged and Diverse Board & Management • Our diverse and experienced Board has the skills to oversee key business risks and strategic initiatives. A robust refreshment plan has been underway since 2014, and our Board continues to adopt governance best practices Core Deposit Franchise Diversified Revenue Stream Forward - Thinking Approach Robust Enterprise Risk Management Expense Structure • Reflects stable legacy markets, produces steady low - cost funding • Growing via utilization of technology and deepening of business relationships • Diversified revenue stream (29% of operating revenue) driven by trust and brokerage fee income provides protection during times of low interest rates • Innovative and dynamic approach to attracting and retaining clients, leading to future growth and efficiencies • Enhanced underwriting guidelines and risk management framework • Focus on risk mitigation and managing loan concentrations • Well established operational infrastructure will support future growth • Cost Cutting initiatives underway and hybrid work environment and technology adoption are providing new opportunities for savings Community Engagement • Supporting local businesses, schools and non - profits with financial education, participation in stimulus programs and ongoing consultation • Knowledgeable associates committed to helping clients and the communities we serve

11 11 Transitioning to Post - COVID Environment • Customization of Experience • Blend of technology and in - person service and solutions • Delivery of updated technology to our clients through enhanced delivery channels, including virtual closing options, mobile deposits, ATMS, cash recyclers • Enhanced communication and outreach to shareholders , clients and associates • Keen Community Focus • Supported local communities through 2,046 PPP loans totaling $215 million and 650 COVID loan modifications totaling $261 million • Supported our communities through continued support of non - profit groups and special banking accommodations • More Efficient and Flexible Employer • During COVID, assisted our associates through work - at - home accommodations, pandemic pay policies, Financial First Responder bonuses, and flexible schedules. Post COVID, we are migrating to a hybrid environment and continuing these best practices which empower our workforce and make First United an attractive place to build a career • Better Prepared for Future Business Disruption • State of the art Business Continuity Plan protecting shareholders, clients and associates
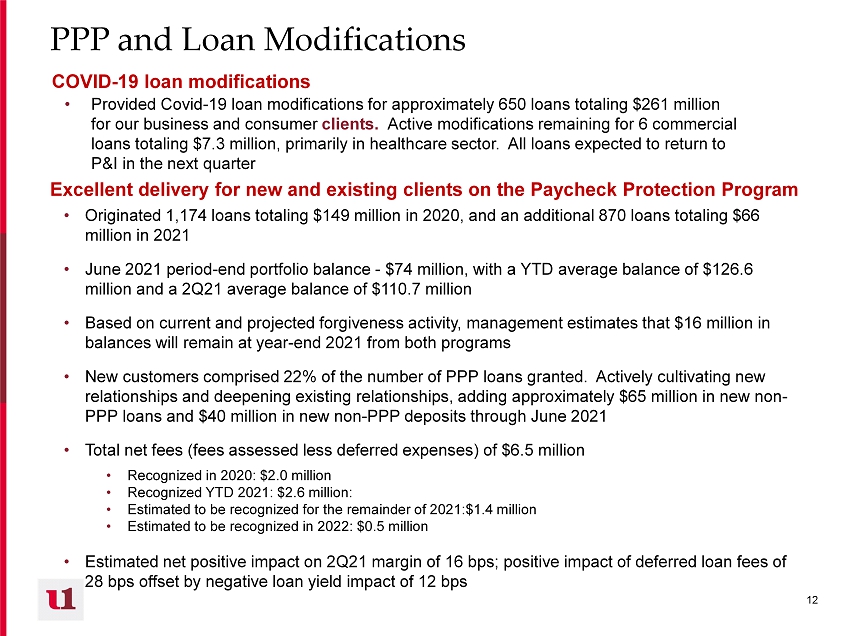
12 12 PPP and Loan Modifications • Originated 1,174 loans totaling $149 million in 2020, and an additional 870 loans totaling $66 million in 2021 • June 2021 period - end portfolio balance - $74 million, with a YTD average balance of $126.6 million and a 2Q21 average balance of $110.7 million • Based on current and projected forgiveness activity, management estimates that $16 million in balances will remain at year - end 2021 from both programs • New customers comprised 22% of the number of PPP loans granted. Actively cultivating new relationships and deepening existing relationships, adding approximately $65 million in new non - PPP loans and $40 million in new non - PPP deposits through June 2021 • Total net fees (fees assessed less deferred expenses) of $6.5 million • Recognized in 2020: $2.0 million • Recognized YTD 2021: $2.6 million: • Estimated to be recognized for the remainder of 2021:$1.4 million • Estimated to be recognized in 2022: $0.5 million • Estimated net positive impact on 2Q21 margin of 16 bps; positive impact of deferred loan fees of 28 bps offset by negative loan yield impact of 12 bps • Provided Covid - 19 loan modifications for approximately 650 loans totaling $261 million for our business and consumer clients. Active modifications remaining for 6 commercial loans totaling $3.4 million, primarily in healthcare sector. All loans expected to return to P&I in the next quarter COVID - 19 loan modifications Excellent delivery for new and existing clients on the Paycheck Protection Program
13 13 II. Operating and Financial Performance
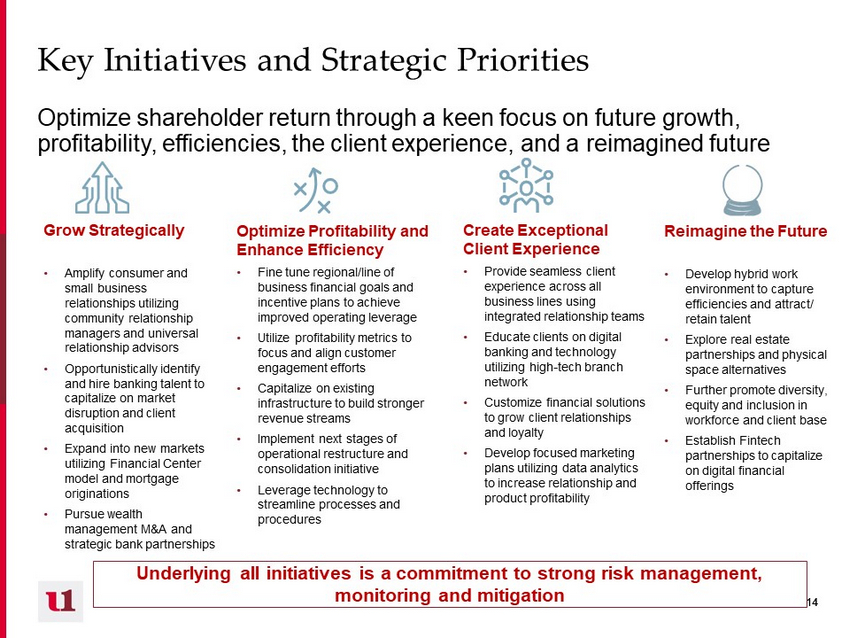
14 14 Key Initiatives and Strategic Priorities Optimize shareholder return through a keen focus on future growth, profitability, efficiencies, the client experience, and a reimagined future Create Exceptional Client Experience • Provide seamless client experience across all business lines using integrated relationship teams • Educate clients on digital banking and technology utilizing high - tech branch network • Customize financial solutions to grow client relationships and loyalty • Develop focused marketing plans utilizing data analytics to increase relationship and product profitability Grow Strategically • Amplify consumer and small business relationships utilizing community relationship managers and universal relationship advisors • Opportunistically identify and hire banking talent to capitalize on market disruption and client acquisition • Expand into new markets utilizing Financial Center model and mortgage originations • Pursue wealth management M&A and strategic bank partnerships Optimize Profitability and Enhance Efficiency • Fine tune regional/line of business financial goals and incentive plans to achieve improved operating leverage • Utilize profitability metrics to focus and align customer engagement efforts • Capitalize on existing infrastructure to build stronger revenue streams • Implement next stages of operational restructure and consolidation initiative • Leverage technology to streamline processes and procedures Underlying all initiatives is a commitment to strong risk management, monitoring and mitigation Reimagine the Future • Develop hybrid work environment to capture efficiencies and attract/ retain talent • Explore real estate partnerships and physical space alternatives • Further promote diversity, equity and inclusion in workforce and client base • Establish Fintech partnerships to capitalize on digital financial offerings
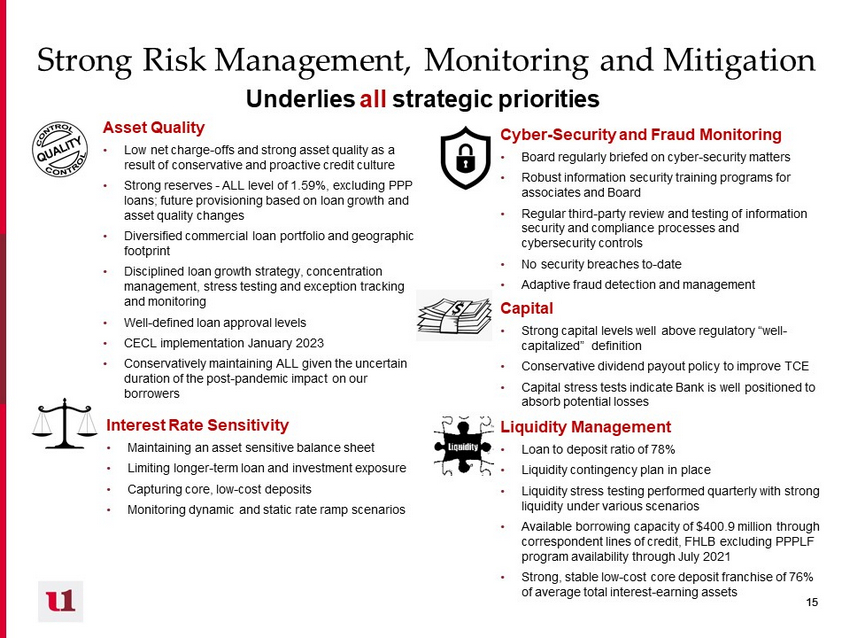
15 15 Strong Risk Management, Monitoring and Mitigation Underlies all strategic priorities Asset Quality • Low net charge - offs and strong asset quality as a result of conservative and proactive credit culture • Strong reserves - ALL level of 1.59%, excluding PPP loans; future provisioning based on loan growth and asset quality changes • Diversified commercial loan portfolio and geographic footprint • Disciplined loan growth strategy, concentration management, stress testing and exception tracking and monitoring • Well - defined loan approval levels • CECL implementation January 2023 • Conservatively maintaining ALL given the uncertain duration of the post - pandemic impact on our borrowers Liquidity Management • Loan to deposit ratio of 78% • Liquidity contingency plan in place • Liquidity stress testing performed quarterly with strong liquidity under various scenarios • Available borrowing capacity of $400.9 million through correspondent lines of credit, FHLB excluding PPPLF program availability through July 2021 • Strong, stable low - cost core deposit franchise of 76% of average total interest - earning assets Capital • Strong capital levels well above regulatory “well - capitalized” definition • Conservative dividend payout policy to improve TCE • Capital stress tests indicate Bank is well positioned to absorb potential losses Cyber - Security and Fraud Monitoring • Board regularly briefed on cyber - security matters • Robust information security training programs for associates and Board • Regular third - party review and testing of information security and compliance processes and cybersecurity controls • No security breaches to - date • Adaptive fraud detection and management Interest Rate Sensitivity • Maintaining an asset sensitive balance sheet • Limiting longer - term loan and investment exposure • Capturing core, low - cost deposits • Monitoring dynamic and static rate ramp scenarios

16 16 $14.7 $15.5 $17.8 $23.2 $14.4 2017 2018 2019 2020 YTD 2Q21 $1,039 $1,068 $1,142 $1,422 $1,466 2017 2018 2019 2020 Jun-21 $882 $996 $1,039 $1,168 $1,145 2017 2018 2019 2020 Jun-21 $1,071 Our Strategic Plan is Generating Reliable Growth… Pre - Provision Net Revenue ($ in millions) (*) Diluted Earnings per Share (*) Total Deposits ($ in millions) Total Net Loans, including PPP ($ in millions) First United is delivering consistent growth, increasing profits and tangible book value / share which should translate into increased long - term shareholder return $1.05 $1.51 $1.85 $1.97 $1.52 2017 2018 2019 2020 YTD 2Q21 +30.4% YoY +6.5% YOY - 1.97% vs. 2020 +3.1% vs. 2020 $74 PPP $114 (*) See Appendix for a reconciliation of these non - GAAP financial measures
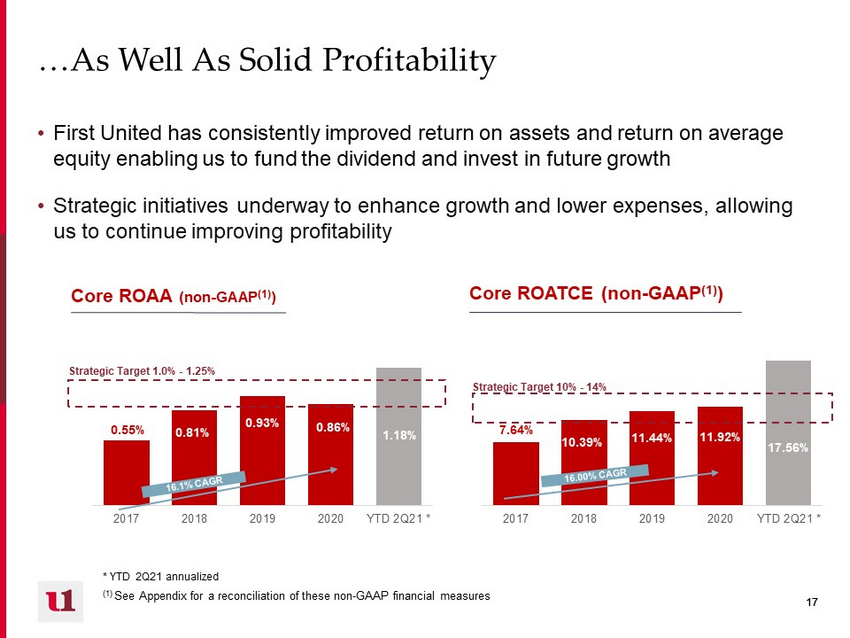
17 17 7.64% 10.39% 11.44% 11.92% 17.56% 2017 2018 2019 2020 YTD 2Q21 * 0.55% 0.81% 0.93% 0.86% 1.18% 2017 2018 2019 2020 YTD 2Q21 * …As Well As Solid Profitability • First United has consistently improved return on assets and return on average equity enabling us to fund the dividend and invest in future growth • Strategic initiatives underway to enhance growth and lower expenses, allowing us to continue improving profitability Core ROATCE (non - GAAP (1) ) Core ROAA (non - GAAP (1) ) Strategic Target 1.0% - 1.25% Strategic Target 10% - 14% * YTD 2Q21 annualized (1) See Appendix for a reconciliation of these non - GAAP financial measures
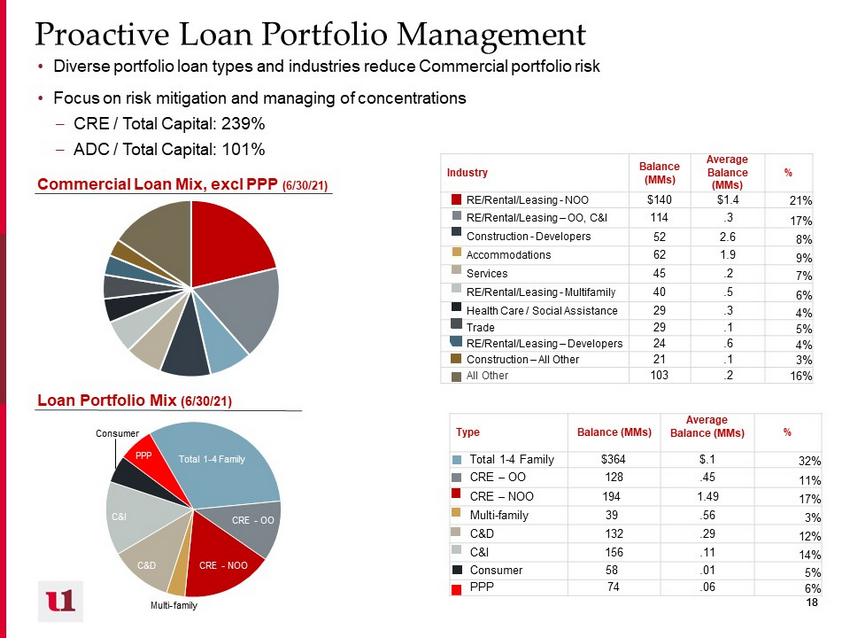
18 18 Total 1 - 4 Family CRE - OO CRE - NOO Multi - family C&D C&I Consumer PPP Proactive Loan Portfolio Management • Diverse portfolio loan types and industries reduce Commercial portfolio risk • Focus on risk mitigation and managing of concentrations – CRE / Total Capital: 239% – ADC / Total Capital: 101% Loan Portfolio Mix (6/30/21) Commercial Loan Mix, excl PPP (6/30/21) Industry Balance (MMs) Average Balance (MMs) % RE/Rental/Leasing - NOO $140 $1.4 21% RE/Rental/Leasing – OO, C&I 114 .3 17% Construction - Developers 52 2.6 8% Accommodations 62 1.9 9% Services 45 .2 7% RE/Rental/Leasing - Multifamily 40 .5 6% Health Care / Social Assistance 29 .3 4% Trade 29 .1 5% RE/Rental/Leasing – Developers 24 .6 4% Construction – All Other 21 .1 3% All Other 103 .2 16% Type Balance (MMs) Average Balance (MMs) % Total 1 - 4 Family $364 $.1 32% CRE – OO 128 .45 11% CRE – NOO 194 1.49 17% Multi - family 39 .56 3% C&D 132 .29 12% C&I 156 .11 14% Consumer 58 .01 5% PPP 74 .06 6%

19 19 Central East West Commercial Acquisition and Development Commercial Construction 1 - 4 Family Commercial Construction Amortizing Consumer Lot Loans 1 - 4 Family Residential Construction Construction and Development Portfolio • Geographically diverse construction and development portfolio mitigates risk to portfolio • Construction portfolio has been reduced from 22% of portfolio in 2007 to 12% in June 2021 By Region (6/30/21) Geography Balance (MMs) Average Balance (MMs) % Central 28 $.10 21% East 60 .47 45% West 44 1.0 34% By Purpose (6/30/21) Purpose Balance (MMs) Average Balance (MMs) % Commercial A&D $64 $1.06 49% Commercial Construction 29 3.65 22% 1 - 4 Family Commercial Construction 4 .41 3% Amortizing Consumer Lot Loans 19 .06 14% 1 - 4 Family Residential Construction 16 .27 12%

20 20 YTD Activity in Loan Portfolio • Production levels remain high YTD • Net loan production being offset by PPP payoffs • Fixed rate, longer - term mortgages being sold to secondary market (data in thousands) Production Payoffs/ Amortization 2021 Net Activity Commercial, excluding PPP 89,200.0 (69,700.0) 19,500.0 Mortgage portfolio 57,900.0 (79,353.0) (21,453.0) Consumer (*) 39,448.0 (20,130.0) 19,318.0 Total, before PPP 186,548.0 (169,183.0) 17,365.0 PPP 66,100.0 (106,000.0) (39,900.0) Total , including PPP 252,648.0 (275,183.0) (22,535.0) Mortgages sold in secondary market 22,071.0 (*) Including $20.1 million pool purchase in 2Q
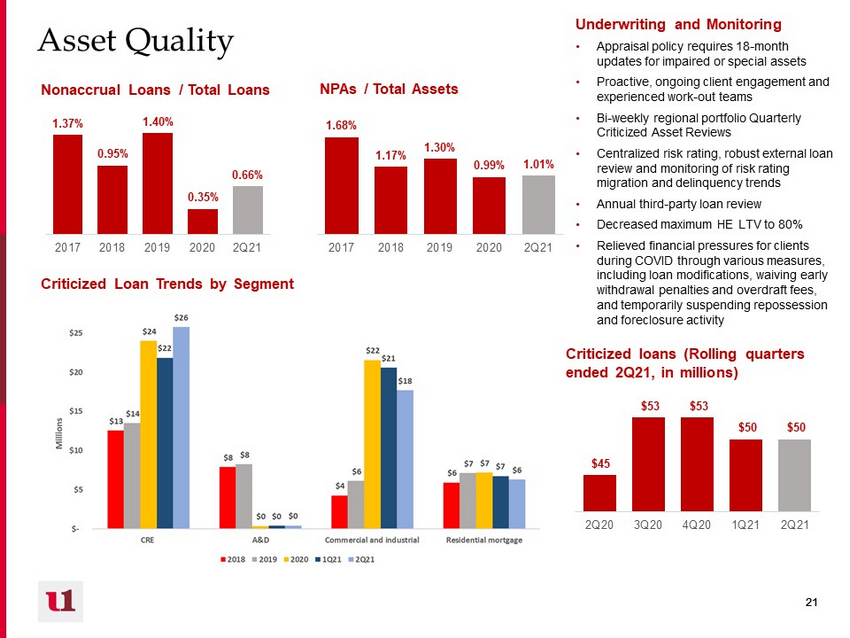
21 21 $45 $53 $53 $50 $50 2Q20 3Q20 4Q20 1Q21 2Q21 Asset Quality NPAs / Total Assets Criticized Loan Trends by Segment Criticized loans (Rolling quarters ended 2Q21, in millions) Nonaccrual Loans / Total Loans 1.37% 0.95% 1.40% 0.35% 0.66% 2017 2018 2019 2020 2Q21 Underwriting and Monitoring • Appraisal policy requires 18 - month updates for impaired or special assets • Proactive, ongoing client engagement and experienced work - out teams • Bi - weekly regional portfolio Quarterly Criticized Asset Reviews • Centralized risk rating, robust external loan review and monitoring of risk rating migration and delinquency trends • Annual third - party loan review • Decreased maximum HE LTV to 80% • Relieved financial pressures for clients during COVID through various measures, including loan modifications, waiving early withdrawal penalties and overdraft fees, and temporarily suspending repossession and foreclosure activity 1.68% 1.17% 1.30% 0.99% 1.01% 2017 2018 2019 2020 2Q21

22 22 Loan Loss Allowance (“ALL”) ALL TRENDS ALL % by Segment (Rolling Quarters ending 2Q21, excluding PPP loans) 0.28% 0.11% - 0.02% 0.13% 0.01% 2017 2018 2019 2020 2Q21 Net Charge - Offs / Average Loans In 2020, due to the unknown impact of the pandemic on credit quality, we increased the provision expense by $4.1 million primarily through qualitative factor adjustments, resulting in an increase in the ALL from 1.19% in 2019 to 1.59% (excluding guaranteed PPP loans) in 2020. We had no provision release through June 2021, as we are continuing to monitor the underlying businesses cash flow and financial data as the economy improves. Excluding PPP loans, which are guaranteed ALL = 1.60% Excluding PPP loans, which are guaranteed ALL = 1.57%
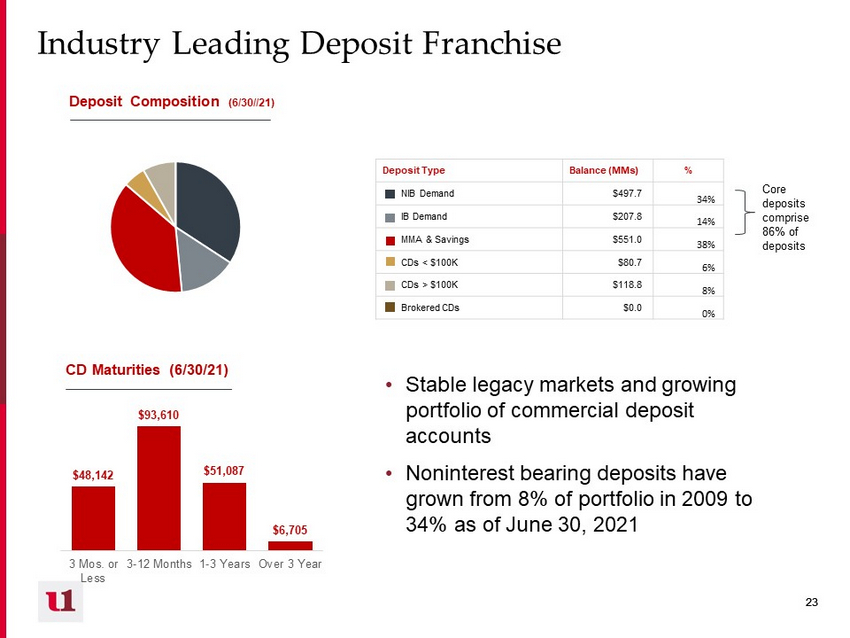
23 23 Industry Leading Deposit Franchise • Stable legacy markets and growing portfolio of commercial deposit accounts • Noninterest bearing deposits have grown from 8% of portfolio in 2009 to 34% as of June 30, 2021 Deposit Composition (6/30//21) Deposit Type Balance (MMs) % NIB Demand $497.7 34% IB Demand $207.8 14% MMA & Savings $551.0 38% CDs < $100K $80.7 6% CDs > $100K $118.8 8% Brokered CDs $0.0 0% Core deposits comprise 86% of deposits $48,142 $93,610 $51,087 $6,705 3 Mos. or Less 3-12 Months 1-3 Years Over 3 Year CD Maturities (6/30/21)

24 24 Net Interest Margin • Disciplined loan and deposit pricing has produced a strong margin that is in line with our peers • Margin contraction was primarily due to core loans adjusting down and new loan volume, including PPP, at lower rates due to the current rate environment. • The lower interest income was partially offset by lower cost of funds on the long - term borrowings and interest - bearing deposits and from recognition of deferred PPP loan fees. • Our team approach to full client relationships, our focus on community - oriented business owners and our high - tech branch network provide continued access to low - cost deposits, treasury management and commercial loans Components (*) (*) See Appendix for a reconciliation of this non - GAAP financial measure 3.99% 4.41% 4.57% 3.99% 3.56% 3.57% 0.78% 0.86% 1.18% 0.91% 0.65% 0.59% 3.37% 3.74% 3.68% 3.34% 3.11% 3.15% 0.32% 0.42% 0.70% 0.49% 0.32% 0.27% 0.0% 0.5% 1.0% 1.5% 2.0% 2.5% 3.0% 3.5% 4.0% 4.5% 5.0% 2017 2018 2019 2020 1Q21 2Q21 Yield on Earning Assets Cost of Interest-bearing Liabilities Net Interest Margin Cost of Deposits

25 25 Excess Cash Balances Impact Margin and Loan/Deposits • Purchasing consumer and residential mortgage portfolios to diversify more quickly (high quality, individual loan reviews) • Relationship management - blending new loan balances with existing balances to retain current clients • Adding high quality, short to moderate duration securities to the investment portfolio • Investing in tax advantaged investments, loans, and tax credits • Allowing non - relationship high - cost deposits to run off • Shifted Wealth money market off - balance sheet • Utilizing one - way sales for select customer deposits Employing Strategies to Profitably Deploy Excess Cash $50 $117 $149 $172 $194 Dec-19 Jun-20 Dec-20 Mar-21 Jun-21 Cash Balances (MMs) Excess Cash due to volatility of economy: • Government stimulus funds • Conservative savings rates • PPP forgiveness funds • New core customers • Existing mortgage portfolio customers re - financing through the secondary market 85.8% 94.3% 92.1% 82.1% 78.1% 2017 2018 2019 2020 2Q21 Loans / Deposits

26 26 Diversified Fee Income an Advantage to First United • First United’s fee income comprised 29% of operating revenue for YTD 2Q21 • Fee - based business provides stable growth and a diversified revenue stream not directly tied to interest rates, as well as opportunities to build client relationships • First United’s diverse array of products provides opportunities to fully engage with customers and produce stable increases to earnings Trust and Brokerage Assets Under Management (MMs) Non - Interest Income Mix – YTD 2Q21 75% $1,104 $1,084 $1,212 $1,377 $1,412 2017 2018 2019 2020 Jun-21 Composition Trust and Brokerage 48% Service Charges 12% Net Gain on Loan Sales 9% Debit Card Income 17% Bank - owned Life Insurance 6% Other Noninterest Income 8%

27 27 71.8% 72.8% 70.9% 64.6% 58.1% 2017 2018 2019 2020 YTD 2Q21 Expense Discipline Significant portion of earnings improvement can be attributed to expense reductions • First United’s investment in its wealth management business line generates additional expenses; even so, efficiency ratio has decreased ~14 points since 2017 • We have implemented several initiatives to reduce expenses and to be more competitive versus our peers – Successful contract negotiation with core processor resulting in savings of $0.9 million in 2021 and $0.5 million ongoing ann ual ly; inclusive of over 30 new products and services – Restructuring and consolidation of regional operating structure – Existing operational infrastructure and technology investments positioned for continued growth – Initiatives implemented as a result of the COVID - 19 environment are expected to provide on - going efficiencies and savings ( Docusign , virtual meetings, digital account openings and loan documentation, reduced printing, hybrid remote work options, etc.) • We have identified several initiatives to continue lowering expenses – Exploring outsourcing options for operational functions (internal audit outsourced 1Q21) – Analyzing real estate partnerships and physical space alternatives – Reviewing benefits structure and tax - saving strategies Efficiency Ratio (*) Strategic Target 58% - 63% (*) See Appendix for a reconciliation of this non - GAAP financial measure Leverage Ratio, excluding settlement (*) 2.3% 1.4% 3.4% 5.9% 11.7% 2017 2018 2019 2020 YTD 2Q21

28 28 Prudent Capital Management $13.78 $14.97 $16.17 $17.17 $18.07 2017 2018 2019 2020 Jun-21 Tangible Book Value / Share • Management has consistently grown tangible book value per share (8.0% CAGR) while simultaneously taking decisive action to benefit shareholders • Reintroduction and subsequent increase of dividend has improved shareholders’ return • Proactive share repurchases have supported the Company’s stock price while benefiting tangible book value per share – 2020 – repurchased 145,291 shares – April 2021 - repurchased 400,000 shares • Regulatory capital ratios significantly above regulatory requirements • Actively exploring other investments of capital Regulatory Capital 4% 6% 8% 10% 12% 14% 16% 18% Dec-17 Dec-20 Jun-21 Leverage CET1 Tier 1 Total Regulatory Well - Capitalized Regulatory Minimum plus fully phased - in Capital Conservation Buffer Total 10.5% Tier1 RB 8.5% CET1 7.0% Leverage 5.0%

29 29 Strategic Targets Post - COVID - 19 Metric Actual 12/31/2019 Actual 12/31/2020 Long Term Strategic Target Range Strong Shareholder Return EPS Growth (YoY) 23% 7% 2% - 15% Dividend Payout Ratio 21.7% 26.3% 20% - 25% ROAA 0.93% 0.86% 1.00% - 1.25% ROAE 10.44% 10.89% 10% - 14% TCE Ratio 8.03% 6.97% 8% - 10% High Quality, Diversified Revenue Stream Revenue Growth (YoY) 6.3% 5.8% 2% - 7% NII / Revenue 26.5% 27.4% 24% - 28% N IM 3.68% 3.34% 3.3% - 3.7% Balance Sheet Growth % Loan Growth 4.4% 11.3% incl PPP 6% - 11% Loans / Assets 73% 67% 71% - 76% Loans / Deposits 92% 82% 87% - 90% Highly Efficient Operations Efficiency Ratio (adjusted for non - core items) 68.4% 64.3% 58% - 63% Positive Operating Leverage Operating Leverage Ratio 3.4% 5.9% 1% - 5% Robust Risk Enterprise Management NPLs / Loans 1.2% 0.35% 0.50% - 1.00% NCOs / Avg. Total Loans (0.02%) 0.13% 0.10% - 0.50%

30 30 III. Our Commitment to ESG

31 31 • LED lighting installed throughout branch network and operations center • Recycling, focus on reduced printing (65% reduction since pre - COVID) • Reduced travel due to shift to video meetings and calls ESG Enhancements To Date • Plan to achieve best - in - class governance practices • Recent Enhancements – Board refreshment, Board Declassification, • Future Enhancements under consideration - Majority Voting Standard, Proxy Access Governance • Formal workforce Diversity and Inclusion Policy • Formalized a policy requiring that a diverse slate of candidates be considered for each future open board seat • Named an internal Director of diversity and engagement Social Environmental
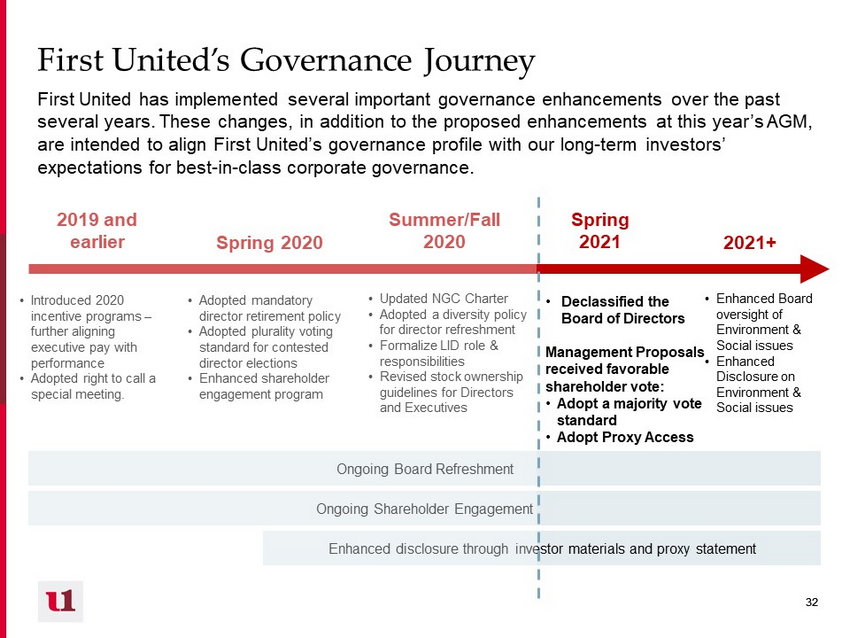
32 32 Ongoing Shareholder Engagement • Declassified the Board of Directors Management Proposals received favorable shareholder vote: • Adopt a majority vote standard • Adopt Proxy Access • Updated NGC Charter • Adopted a diversity policy for director refreshment • Formalize LID role & responsibilities • Revised stock ownership guidelines for Directors and Executives • Enhanced Board oversight of Environment & Social issues • Enhanced Disclosure on Environment & Social issues Ongoing Board Refreshment Enhanced disclosure through investor materials and proxy statement • Introduced 2020 incentive programs – further aligning executive pay with performance • Adopted right to call a special meeting. • Adopted mandatory director retirement policy • Adopted plurality voting standard for contested director elections • Enhanced shareholder engagement program Spring 2021 2021+ Summer/Fall 2020 Spring 2020 2019 and earlier First United’s Governance Journey First United has implemented several important governance enhancements over the past several years. These changes, in addition to the proposed enhancements at this year’s AGM, are intended to align First United’s governance profile with our long - term investors’ expectations for best - in - class corporate governance.
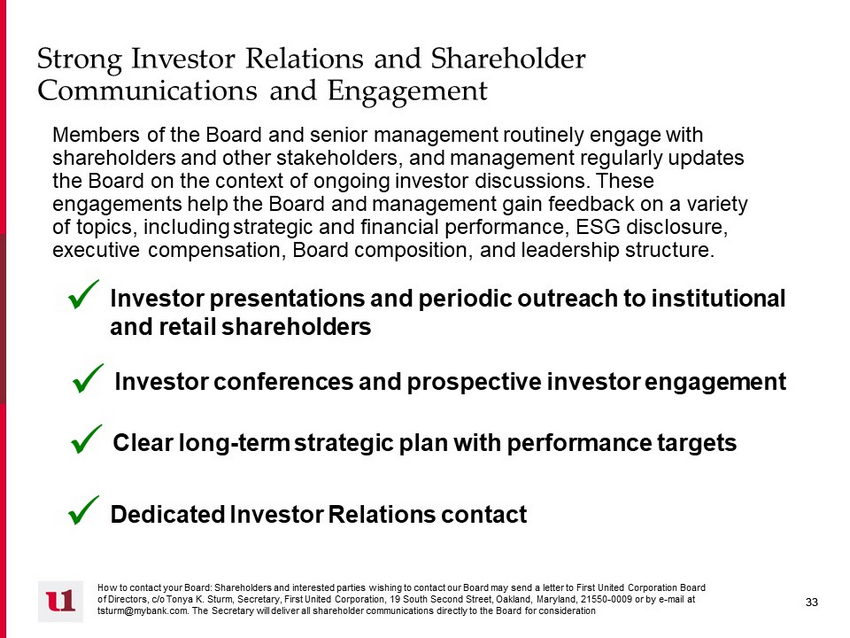
33 33 Strong Investor Relations and Shareholder Communications and Engagement Clear long - term strategic plan with performance targets x Dedicated Investor Relations contact x Investor conferences and prospective investor engagement x Members of the Board and senior management routinely engage with shareholders and other stakeholders, and management regularly updates the Board on the context of ongoing investor discussions. These engagements help the Board and management gain feedback on a variety of topics, including strategic and financial performance, ESG disclosure, executive compensation, Board composition, and leadership structure. Investor presentations and periodic outreach to institutional and retail shareholders x How to contact your Board: Shareholders and interested parties wishing to contact our Board may send a letter to First United Co rporation Board of Directors, c/o Tonya K. Sturm, Secretary, First United Corporation, 19 South Second Street, Oakland, Maryland, 21550 - 0009 or by e - mail at tsturm@mybank.com. The Secretary will deliver all shareholder communications directly to the Board for consideration

34 34 IV. Appendix
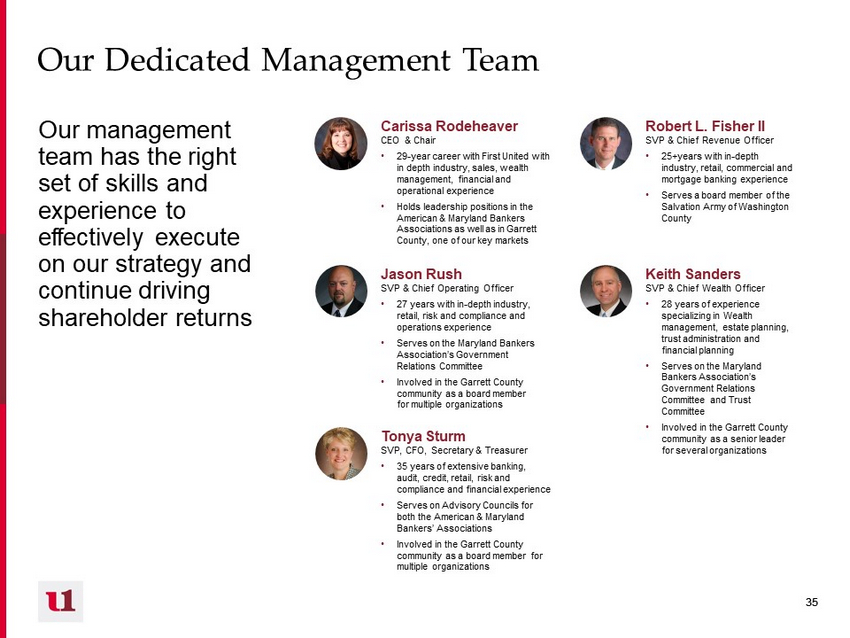
35 35 Our Dedicated Management Team Our management team has the right set of skills and experience to effectively execute on our strategy and continue driving shareholder returns Carissa Rodeheaver CEO & Chair • 29 - year career with First United with in depth industry, sales, wealth management, financial and operational experience • Holds leadership positions in the American & Maryland Bankers Associations as well as in Garrett County, one of our key markets Robert L. Fisher II SVP & Chief Revenue Officer • 25+years with in - depth industry, retail, commercial and mortgage banking experience • Serves a board member of the Salvation Army of Washington County Jason Rush SVP & Chief Operating Officer • 27 years with in - depth industry, retail, risk and compliance and operations experience • Serves on the Maryland Bankers Association’s Government Relations Committee • Involved in the Garrett County community as a board member for multiple organizations Keith Sanders SVP & Chief Wealth Officer • 28 years of experience specializing in Wealth management, estate planning, trust administration and financial planning • Serves on the Maryland Bankers Association’s Government Relations Committee and Trust Committee • Involved in the Garrett County community as a senior leader for several organizations Tonya Sturm SVP, CFO, Secretary & Treasurer • 35 years of extensive banking, audit, credit, retail, risk and compliance and financial experience • Serves on Advisory Councils for both the American & Maryland Bankers’ Associations • Involved in the Garrett County community as a board member for multiple organizations

36 36 Board of Directors (May 2021) Our directors know our markets and customers and are leaders in the communities we serve Name / Affiliation Unique Expertise Carissa Rodeheaver CEO & Chair • Certified Public Accountant, ABA and MBA with 29 - year career at First United and in - depth industry, company, and operational experience • Involvement in community activities, including board seats at Garrett College Foundation and Garrett Development Corporation John McCullough Lead Director ( Nom/Gov Chair) • Certified Public Accountant and retired partner of Ernst & Young, LLP with extensive audit and accounting experience • Public company M&A advisory experience, particularly with financial companies John Barr Independent Director • Business ownership and operational experience in Maryland and the surrounding area • Involvement in Washington County, Maryland and is a former 3 - term Washington County Commissioner Brian Boal Independent Director (Audit Chair) • Certified public accountant and previous tax manager at PwC with extensive ownership, accounting, public company, M&A and business advisory experience, most recently in Garrett County • Serves as the treasurer of several organizations in Garrett County Sanu Chadha Independent Director • Certified Project Management Professional • Business and ownership experience in Monongalia County WV in a management and solutions company that provides consulting services to enterprise organizations across the United States and abroad for strategic process and technology solutions, project management, process improvement, data analytics, and cloud solutions Name / Affiliation Unique Expertise Christy DiPietro Independent Director • Chartered Financial Analyst • Private investor who provides wealth management services for a diverse portfolio of assets, including investment analysis and strategy, asset allocation, tax matters, insurance matters, estate planning, property management, and charitable giving. • Operational experience in a large public investment firm where she managed $2.3 billion in high - quality taxable fixed income assets for numerous institutional clients Patricia Milon Independent Director • Accomplished regulatory expert • Enterprise risk management and corporate governance experience with expertise in compliance, legal and regulatory risk for public companies • Consulting roles for fintech and regtech companies Irvin Robert Rudy Independent Director • Business ownership and operational experience in Garrett County • Board and committee experience as a trustee of The Ohio University Foundation, past first prevention Commissioner, retired chief of local fire department Marisa Shockley Independent Director • Business ownership and operational experience in Frederick County • Chairman for the Maryland Auto Dealers’ Association, past President of Maryland School for the Deaf; TIME Quality Award regional finalist Hoye Andrew Walls III Independent Director • Business ownership and operational experience in Monongalia County, WV in a large printing company • Director experience at various community organizations such as United Way, Public Theatre, Red Cross and the Salvation Army
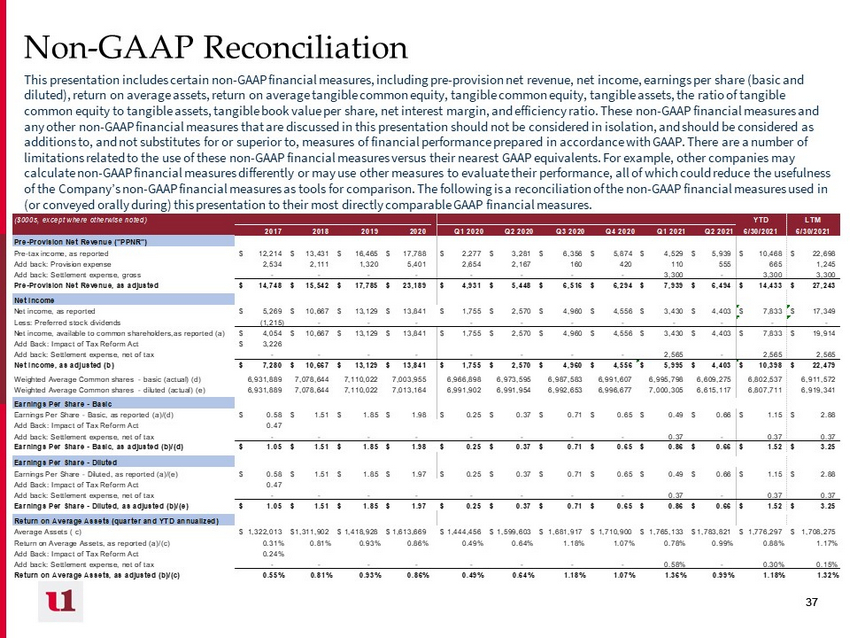
37 37 Non - GAAP Reconciliation This presentation includes certain non - GAAP financial measures, including pre - provision net revenue, net income, earnings per share (basic and diluted), return on average assets, return on average tangible common equity, tangible common equity, tangible assets, the ratio of tangible common equity to tangible assets, tangible book value per share, net interest margin, and efficiency ratio. These non - GAAP finan cial measures and any other non - GAAP financial measures that are discussed in this presentation should not be considered in isolation, and should be considered as additions to, and not substitutes for or superior to, measures of financial performance prepared in accordance with GAAP. The re are a number of limitations related to the use of these non - GAAP financial measures versus their nearest GAAP equivalents. For example, other co mpanies may calculate non - GAAP financial measures differently or may use other measures to evaluate their performance, all of which could re duce the usefulness of the Company’s non - GAAP financial measures as tools for comparison. The following is a reconciliation of the non - GAAP financia l measures used in (or conveyed orally during) this presentation to their most directly comparable GAAP financial measures. ($000s, except where otherwise noted) YTD LTM 2017 2018 2019 2020 Q1 2020 Q2 2020 Q3 2020 Q4 2020 Q1 2021 Q2 2021 6/30/2021 6/30/2021 Pre-Provision Net Revenue ("PPNR") Pre-tax income, as reported 12,214$ 13,431$ 16,465$ 17,788$ 2,277$ 3,281$ 6,356$ 5,874$ 4,529$ 5,939$ 10,468$ 22,698$ Add back: Provision expense 2,534 2,111 1,320 5,401 2,654 2,167 160 420 110 555 665 1,245 Add back: Settlement expense, gross - - - - - - - - 3,300 - 3,300 3,300 Pre-Provision Net Revenue, as adjusted 14,748$ 15,542$ 17,785$ 23,189$ 4,931$ 5,448$ 6,516$ 6,294$ 7,939$ 6,494$ 14,433$ 27,243$ Net Income Net income, as reported 5,269$ 10,667$ 13,129$ 13,841$ 1,755$ 2,570$ 4,960$ 4,556$ 3,430$ 4,403$ 7,833$ 17,349$ Less: Preferred stock dividends (1,215) - - - - - - - - - - - Net income, available to common shareholders,as reported (a) 4,054$ 10,667$ 13,129$ 13,841$ 1,755$ 2,570$ 4,960$ 4,556$ 3,430$ 4,403$ 7,833$ 19,914$ Add Back: Impact of Tax Reform Act 3,226$ Add back: Settlement expense, net of tax - - - - - - - - 2,565 - 2,565 2,565 Net income, as adjusted (b) 7,280$ 10,667$ 13,129$ 13,841$ 1,755$ 2,570$ 4,960$ 4,556$ 5,995$ 4,403$ 10,398$ 22,479$ Weighted Average Common shares - basic (actual) (d) 6,931,889 7,078,644 7,110,022 7,003,955 6,966,898 6,973,595 6,987,583 6,991,607 6,995,798 6,609,275 6,802,537 6,911,572 Weighted Average Common shares - diluted (actual) (e) 6,931,889 7,078,644 7,110,022 7,013,164 6,991,902 6,991,954 6,992,653 6,996,677 7,000,305 6,615,117 6,807,711 6,919,341 Earnings Per Share - Basic Earnings Per Share - Basic, as reported (a)/(d) 0.58$ 1.51$ 1.85$ 1.98$ 0.25$ 0.37$ 0.71$ 0.65$ 0.49$ 0.66$ 1.15$ 2.88$ Add Back: Impact of Tax Reform Act 0.47 Add back: Settlement expense, net of tax - - - - - - - - 0.37 - 0.37 0.37 Earnings Per Share - Basic, as adjusted (b)/(d) 1.05$ 1.51$ 1.85$ 1.98$ 0.25$ 0.37$ 0.71$ 0.65$ 0.86$ 0.66$ 1.52$ 3.25$ Earnings Per Share - Diluted Earnings Per Share - Diluted, as reported (a)/(e) 0.58$ 1.51$ 1.85$ 1.97$ 0.25$ 0.37$ 0.71$ 0.65$ 0.49$ 0.66$ 1.15$ 2.88$ Add Back: Impact of Tax Reform Act 0.47 Add back: Settlement expense, net of tax - - - - - - - - 0.37 - 0.37 0.37 Earnings Per Share - Diluted, as adjusted (b)/(e) 1.05$ 1.51$ 1.85$ 1.97$ 0.25$ 0.37$ 0.71$ 0.65$ 0.86$ 0.66$ 1.52$ 3.25$ Return on Average Assets (quarter and YTD annualized) Average Assets ( c) 1,322,013$ 1,311,902$ 1,418,928$ 1,613,669$ 1,444,456$ 1,599,603$ 1,681,917$ 1,710,900$ 1,765,133$ 1,783,821$ 1,776,297$ 1,708,275$ Return on Average Assets, as reported (a)/(c) 0.31% 0.81% 0.93% 0.86% 0.49% 0.64% 1.18% 1.07% 0.78% 0.99% 0.88% 1.17% Add Back: Impact of Tax Reform Act 0.24% Add back: Settlement expense, net of tax - - - - - - - - 0.58% - 0.30% 0.15% Return on Average Assets, as adjusted (b)/(c) 0.55% 0.81% 0.93% 0.86% 0.49% 0.64% 1.18% 1.07% 1.36% 0.99% 1.18% 1.32%

38 38 Non - GAAP Reconciliation, continued ($000s, except where otherwise noted) YTD LTM 2017 2018 2019 2020 Q1 2020 Q2 2020 Q3 2020 Q4 2020 Q1 2021 Q2 2021 6/30/2021 6/30/2021 Return on Average Tangible Common Stockholders' Equity Average common stockholders' equity (f) 106,332$ 113,659$ 125,774$ 127,101$ 125,517$ 122,697$ 128,103$ 132,087$ 131,541$ 127,269$ 129,405$ 128,339$ Less: Average goodwill 11,004 11,004 11,004 11,004 11,004 11,004 11,004 11,004 11,004 11,004 11,004 11,004 Average tangible common equity (g) 95,328$ 102,655$ 114,770$ 116,097$ 114,513$ 111,693$ 117,099$ 121,083$ 120,537$ 116,265$ 118,401$ 117,335$ Return on average tangible common equity, as reported (a)/(g) 4.25% 10.39% 11.44% 11.92% 6.13% 9.20% 16.94% 15.05% 11.38% 15.15% 13.23% 16.97% Add Back: Impact of Tax Reform Act 3.38% Add back: Settlement expense, net of tax - - - - - - - 8.51% - 4.33% 2.19% Return on average tangible common equity, as adj (b)/(g) 7.64% 10.39% 11.44% 11.92% 6.13% 9.20% 16.94% 15.05% 19.89% 15.15% 17.56% 19.16% Tangible Book Value per Common Share Total common equity, as reported (h) 108,390$ 117,066$ 125,940$ 131,047$ 118,549$ 124,453$ 130,237$ 131,047$ 129,189$ 130,556$ 130,556$ 130,556$ Less: Goodwill 11,004 11,004 11,004 11,004 11,004 11,004 11,004 11,004 11,004 11,004 11,004 11,004 Total tangible common equity (i) 97,386$ 106,062$ 114,936$ 120,043$ 107,545$ 113,449$ 119,233$ 120,043$ 118,185$ 119,552$ 119,552$ 119,552$ Common shares outstanding - basic (actual) (j) 7,067,425 7,086,632 7,110,022 6,992,911 6,966,898 6,983,523 6,988,998 6,992,911 6,998,617 6,614,604 6,614,604 6,614,604 Tangible book value per basic common share (i)/(j) 14.05$ 14.98$ 16.17$ 17.17$ 15.44$ 16.25$ 17.06$ 17.17$ 16.89$ 18.07$ 18.07$ 18.07$ Tangible common equity to tangible assets ("TCE Ratio") Total assets, as reported (k) 1,336,470 1,384,516 1,442,966 1,733,414 1,461,513 1,639,636 1,685,907 1,733,414 1,781,833 1,763,806 1,763,806 1,763,806 Less: Goodwill 11,004 11,004 11,004 11,004 11,004 11,004 11,004 11,004 11,004 11,004 11,004 11,004 Total tangible assets (l) 1,325,466$ 1,373,512$ 1,431,962$ 1,722,410$ 1,450,509$ 1,628,632$ 1,674,903$ 1,722,410$ 1,770,829$ 1,752,802$ 1,752,802$ 1,752,802$ Tangible common equity to tangible assets (k)/(l) 7.35% 7.72% 8.03% 6.97% 7.41% 6.97% 7.12% 6.97% 6.67% 6.82% 6.82% 6.82% Net interest margin (tax equivalent) Net interest income 39,578$ 44,182$ 46,391$ 48,546$ 11,887$ 12,656$ 11,902$ 12,101$ 12,236$ 12,762$ 24,998$ 49,001$ Tax equivalent adjustment 637 796 868 917 223 226 228 239 239 234 473 940 Tax equivalent net interest income (m) 40,215$ 44,978$ 47,259$ 49,463$ 12,110$ 12,882$ 12,130$ 12,340$ 12,475$ 12,996$ 25,471$ 49,941$ Average earning assets (n) 1,193,949$ 1,203,813$ 1,285,019$ 1,480,165$ 1,318,529$ 1,468,694$ 1,545,323$ 1,586,360$ 1,627,190$ 1,652,816$ 1,640,026$ 1,576,077$ Net interest margin (tax equivalent) (m)/(n) 3.37% 3.74% 3.68% 3.34% 3.69% 3.53% 3.12% 3.09% 3.11% 3.15% 3.13% 3.17% Efficiency Ratio Noninterest expense, as reported 39,170$ 43,808$ 45,389$ 43,934$ 11,005$ 11,427$ 10,540$ 10,962$ 12,927$ 11,033$ 23,960$ 45,856$ Add back: Settlement expense - - - - - - - - 3,300 - 3,300 3,300 Noninterest expense, adjusted (o) 39,170$ 43,808$ 45,389$ 43,934$ 11,005$ 11,427$ 10,540$ 10,962$ 9,627$ 11,033$ 20,660$ 42,556$ Net interest income 39,578$ 44,182$ 46,391$ 48,546$ 11,887$ 12,656$ 11,902$ 12,101$ 12,236$ 12,762$ 24,998$ 49,001$ Noninterest income 14,340 15,168 16,783 18,577 4,049 4,219 5,154 5,155 5,330 4,764 10,094 20,403 Tax equivalent adjustment 637 796 868 917 223 226 228 239 239 234 473 940 Total tax equivalent revenue (p) 54,555$ 60,146$ 64,042$ 68,040$ 16,159$ 17,101$ 17,284$ 17,495$ 17,805$ 17,760$ 35,565$ 70,344$ Efficiency ratio, as adjusted (o)/(p) 71.80% 72.84% 70.87% 64.57% 68.10% 66.82% 60.98% 62.66% 54.07% 62.12% 58.09% 60.50%