Exhibit 99.1
FIRST UNITED CORPORATION INVESTOR PRESENTATION Fourth Quarter 2022
2 Forward looking statements This presentation contains forward - looking statements as defined by the Private Securities Litigation Reform Act of 1995 . Forward - looking statements do not represent historical facts, but are statements about management's beliefs, plans and objectives about the future, as well as its assumptions and judgments concerning such beliefs, plans and objectives . These statements are evidenced by terms such as "anticipate," "estimate," "should," "expect," "believe," "intend," and similar expressions . Although these statements reflect management's good faith beliefs and projections, they are not guarantees of future performance and they may not prove true . The beliefs, plans and objectives on which forward - looking statements are based involve risks and uncertainties that could cause actual results to differ materially from those addressed in the forward - looking statements . For a discussion of these risks and uncertainties, see the section of the periodic reports that First United Corporation files with the Securities and Exchange Commission entitled "Risk Factors . Whether actual results will conform to expectations and predictions is subject to known and unknown risks and uncertainties . Actual results could be materially different from management’s expectations . This presentation should be read in conjunction with our Annual Report on Form 10 - K, as amended, for the year ended December 31 , 2021 , including the sections of the report entitled “Risk Factors”, as well as the reports and other documents that we subsequently file with the Securities and Exchange Commission (“SEC”), which are available on the SEC’s website at www . sec . gov or at our website at www . mybank . com . Except as required by law, we do not intend to publish updates or revisions of any forward - looking statements we make to reflect new information, future events or otherwise .
Table of Contents 3 I. II. II. III. Corporate Profile Strategy & Strengths Financial Performance Appendices Pg. 4 Pg. 6 Pg. 10 Pg. 23

4 Mission Statement To enrich the lives of our customers, our employees and our shareholders through uncommon commitment to service and effective financial solutions Company Overview Founded: 1900 Headquarters: Oakland, MD Locations: 27 branches Business Lines: Commercial & Retail Banking, Trust Services, Wealth Management Ticker: FUNC (Nasdaq) Website: www.MyBank.com Financial Highlights (as of December 31, 2022) Assets: $1.85 billion Loans: $1.28 billion Deposits: $1.57 billion AUM: $1.36 billion Efficiency Ratio (1) : 56.40% TCE Ratio (1) : 7.59 % YTD Dividends Declared/Share: $0.63 Tangible Book Value Per Share (1) : $20.90 Diluted EPS - GAAP: $3.76 Diluted EPS - non - GAAP (1) : $3.76 NIM: 3.56% NPAs/Total Assets: 0.46 % Net Charge - offs/Avg. Loans: 0.06% (1) See Appendix for a reconciliation of these non - GAAP financial measures West Virginia Maryland Star denotes Oakland, Maryland Headquarters Franchise Overview
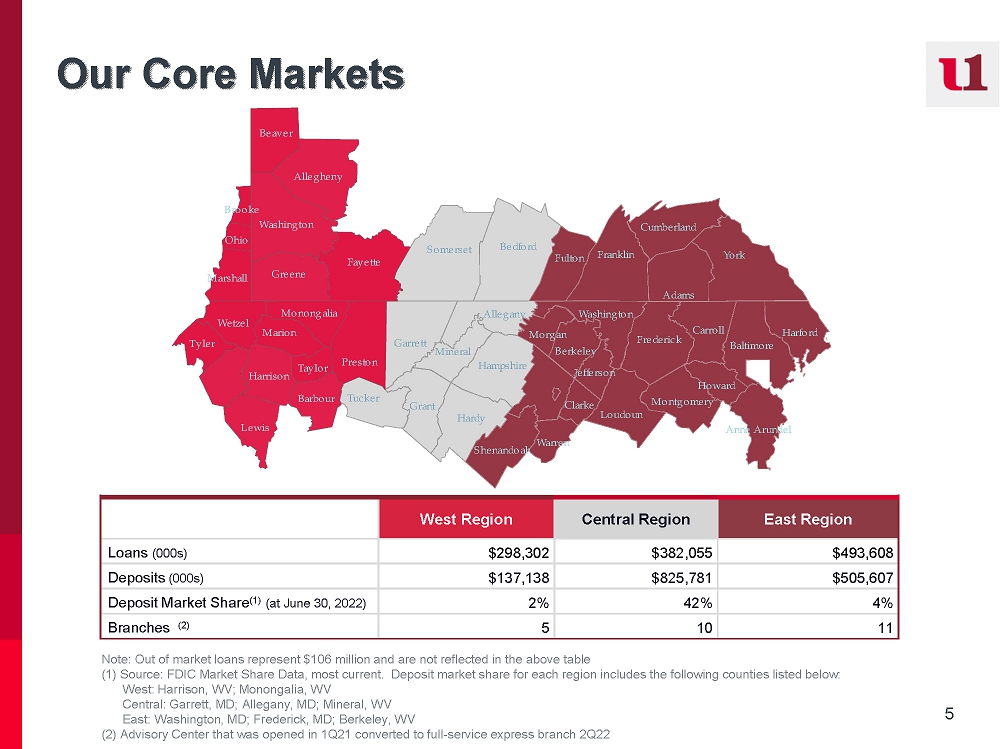
5 Our Core Markets West Region Central Region East Region Loans (000s) $298,302 $382,055 $493,608 Deposits (000s) $137,138 $825,781 $505,607 Deposit Market Share (1) (at June 30, 2022) 2% 42% 4% Branches (2) 6 10 11 Note: Out of market loans represent $106 million and are not reflected in the above table (1) Source: FDIC Market Share Data, most current. Deposit market share for each region includes the following counties liste d b elow: West: Harrison, WV; Monongalia, WV Central: Garrett, MD; Allegany, MD; Mineral, WV East: Washington, MD; Frederick, MD; Berkeley, WV (2) Advisory Center that was opened in 1Q21 converted to full - service express branch 2Q22 6 3;*OREDO;0DUNHW ,QWHOOLJHQFH $OO ULJKWV UHVHUYHG
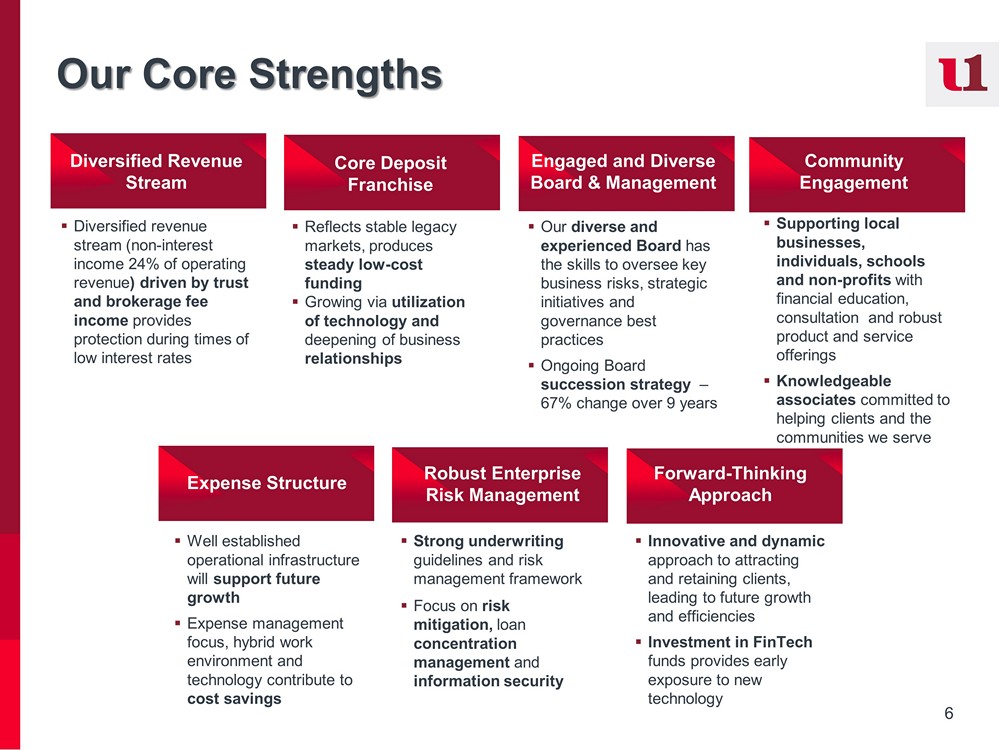
??????? ??????? ??????? 6 Our Core Strengths Diversified Revenue Stream Core Deposit Franchise Engaged and Diverse Board & Management Robust Enterprise Risk Management Expense Structure Forward - Thinking Approach Community Engagement ▪ Diversified revenue stream (non - interest income 24% of operating revenue ) driven by trust and brokerage fee income provides protection during times of low interest rates ▪ Reflects stable legacy markets, produces steady low - cost funding ▪ Growing via utilization of technology and deepening of business relationships ▪ Our diverse and experienced Board has the skills to oversee key business risks, strategic initiatives and governance best practices ▪ Ongoing Board succession strategy – 67% change over 9 years ▪ Strong underwriting guidelines and risk management framework ▪ Focus on risk mitigation, loan concentration management and information security ▪ Well established operational infrastructure will support future growth ▪ Expense management focus, hybrid work environment and technology contribute to cost savings ▪ Innovative and dynamic approach to attracting and retaining clients, leading to future growth and efficiencies ▪ Investment in FinTech funds provides early exposure to new technology ▪ Supporting local businesses, individuals, schools and non - profits with financial education, consultation and robust product and service offerings ▪ Knowledgeable associates committed to helping clients and the communities we serve
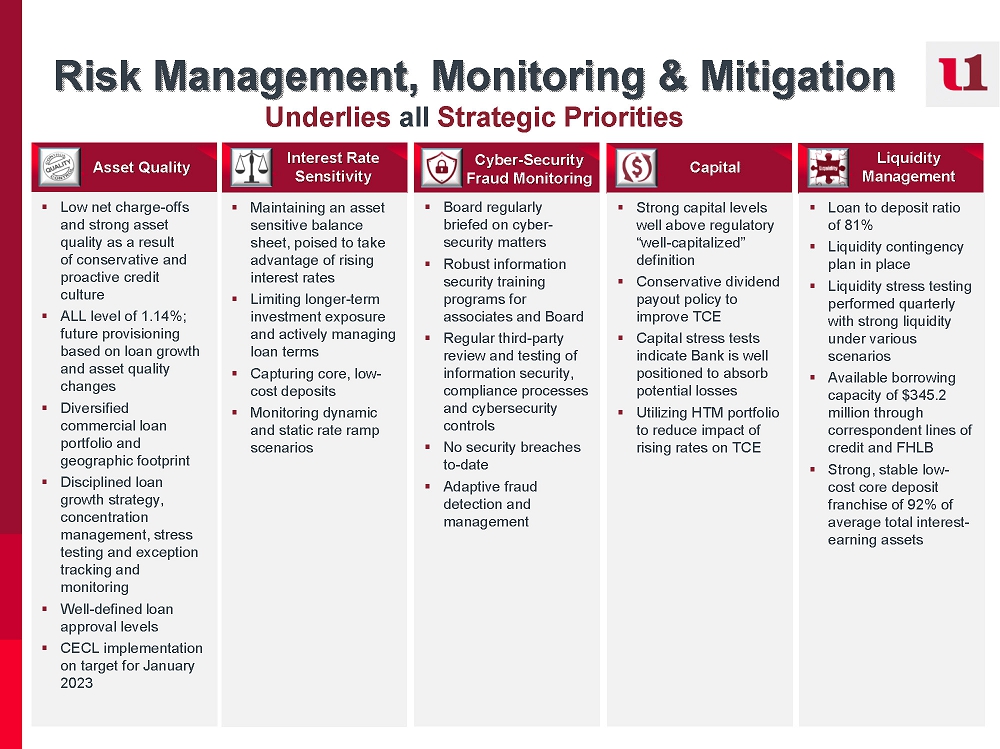
7 ▪ Low net charge - offs and strong asset quality as a result of conservative and proactive credit culture ▪ ALL level of 1.14%; future provisioning based on loan growth and asset quality changes ▪ Diversified commercial loan portfolio and geographic footprint ▪ Disciplined loan growth strategy, concentration management, stress testing and exception tracking and monitoring ▪ Well - defined loan approval levels ▪ CECL implementation on target f or January 2023 Asset Quality Risk Management, Monitoring & Mitigation Underlies all Strategic Priorities ▪ Maintaining an asset sensitive balance sheet, poised to take advantage of rising interest rates ▪ Limiting longer - term investment exposure and actively managing loan terms ▪ Capturing core, low - cost deposits ▪ Monitoring dynamic and static rate ramp scenarios ▪ Board regularly briefed on cyber - security matters ▪ Robust information security training programs for associates and Board ▪ Regular third - party review and testing of information security, compliance processes and cybersecurity controls ▪ No security breaches to - date ▪ Adaptive fraud detection and management ▪ Strong capital levels well above regulatory “well - capitalized” definition ▪ Conservative dividend payout policy to improve TCE ▪ Capital stress tests indicate Bank is well positioned to absorb potential losses ▪ Utilizing HTM portfolio to reduce impact of rising rates on TCE ▪ Loan to deposit ratio of 81% ▪ Liquidity contingency plan in place ▪ Liquidity stress testing performed quarterly with strong liquidity under various scenarios ▪ Available borrowing capacity of $544.0 million through correspondent lines of credit and FHLB ▪ Strong, stable low - cost core deposit franchise of 92% of average total interest - earning assets Interest Rate Sensitivity Cyber - Security Fraud Monitoring Capital Liquidity Management
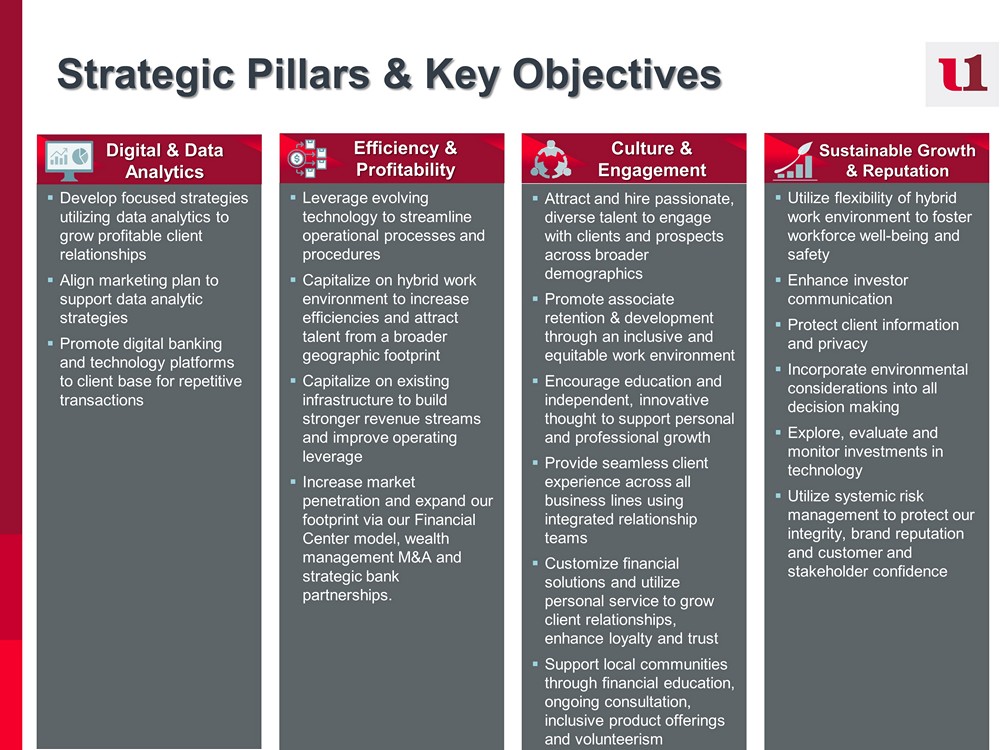
8 ▪ Develop focused strategies utilizing data analytics to grow profitable client relationships ▪ Align marketing plan to support data analytic strategies ▪ Promote digital banking and technology platforms to client base for repetitive transactions ▪ Leverage evolving technology to streamline operational processes and procedures ▪ Capitalize on hybrid work environment to increase efficiencies and attract talent from a broader geographic footprint ▪ Capitalize on existing infrastructure to build stronger revenue streams and improve operating leverage ▪ Increase market penetration and expand our footprint via our Financial Center model, wealth management M&A and strategic bank partnerships. ▪ Attract and hire passionate, diverse talent to engage with clients and prospects across broader demographics ▪ Promote associate retention & development through an inclusive and equitable work environment ▪ Encourage education and independent, innovative thought to support personal and professional growth ▪ Provide seamless client experience across all business lines using integrated relationship teams ▪ Customize financial solutions and utilize personal service to grow client relationships, enhance loyalty and trust ▪ Support local communities through financial education, ongoing consultation, inclusive product offerings and volunteerism ▪ Utilize flexibility of hybrid work environment to foster workforce well - being and safety ▪ Enhance investor communication ▪ Protect client information and privacy ▪ Incorporate environmental considerations into all decision making ▪ Explore, evaluate and monitor investments in technology ▪ Utilize systemic risk management to protect our integrity, brand reputation and customer and stakeholder confidence Strategic Pillars & Key Objectives Digital & Data Analytics Efficiency & Profitability Culture & Engagement Sustainable Growth & Reputation
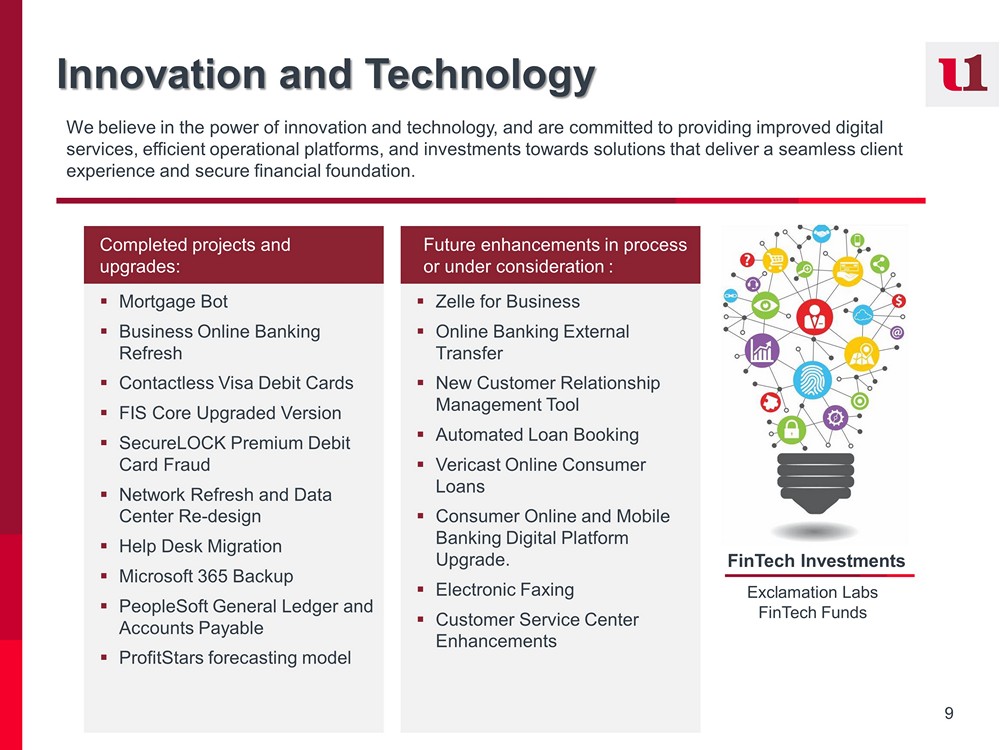
9 Innovation and Technology We believe in the power of innovation and technology, and are committed to providing improved digital services, efficient operational platforms, and investments towards solutions that deliver a seamless client experience and secure financial foundation. Completed projects and upgrades: Future enhancements in process or under consideration : FinTech Investments Exclamation Labs FinTech Funds ▪ Mortgage Bot ▪ Business Online Banking Refresh ▪ Contactless Visa Debit Cards ▪ FIS Core Upgraded Version ▪ SecureLOCK Premium Debit Card Fraud ▪ Network Refresh and Data Center Re - design ▪ Help Desk Migration ▪ Microsoft 365 Backup ▪ PeopleSoft General Ledger and Accounts Payable ▪ ProfitStars forecasting model ▪ Zelle for Business ▪ Online Banking External Transfer ▪ New Customer Relationship Management Tool ▪ Automated Loan Booking ▪ Vericast Online Consumer Loans ▪ Consumer Online and Mobile Banking Digital Platform Upgrade. ▪ Electronic Faxing ▪ Customer Service Center Enhancements
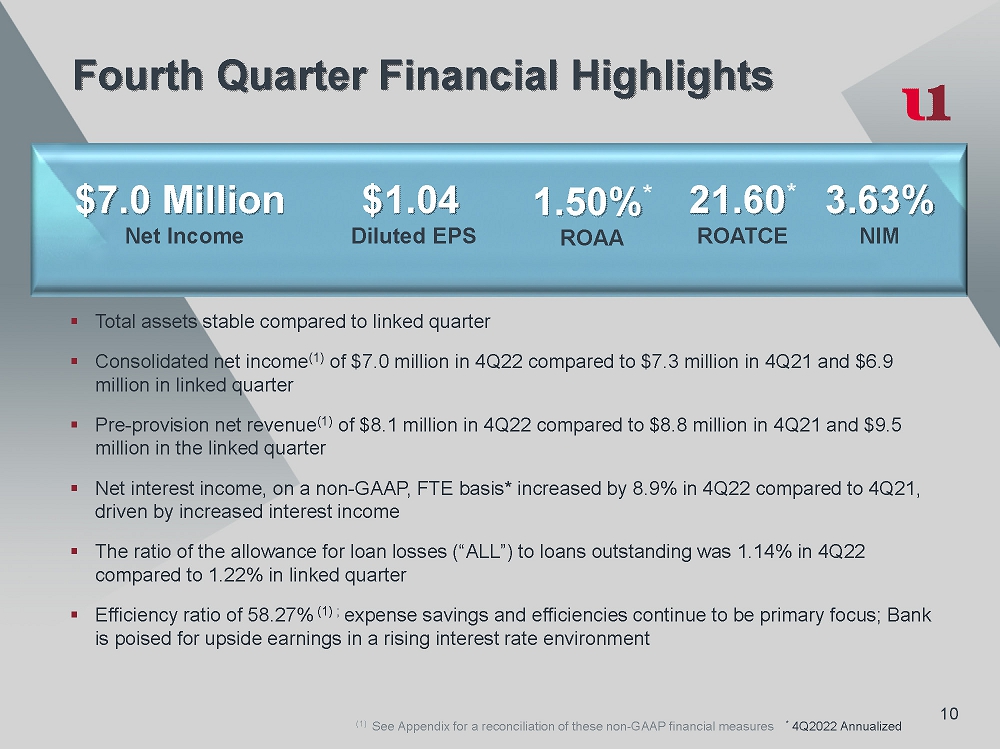
10 10 Fourth Quarter Financial Highlights $7.0 Million Net Income $1.04 Diluted EPS 1.50% * ROAA 21.60 * ROATCE 3.63% NIM ▪ Total assets stable compared to linked quarter ▪ Consolidated net income (1) of $7.0 million in 4Q22 compared to $7.3 million in 4Q21 and $6.9 million in linked quarter ▪ Pre - provision net revenue of $8.1 million in 4Q22 compared to $8.8 million in 4Q21 and $9.5 million in the linked quarter ▪ Net interest income, on a non - GAAP, FTE basis* increased by 8.9% in 4Q22 compared to 4Q21, driven by increased interest income ▪ The ratio of the allowance for loan losses (“ALL”) to loans outstanding was 1.14% in 4Q22 compared to 1.22% in linked quarter ▪ Efficiency ratio of 58.27% (1) ; expense savings and efficiencies continue to be primary focus; Bank is poised for upside earnings in a rising interest rate environment * 4Q2022 Annualized (1) See Appendix for a reconciliation of these non - GAAP financial measures
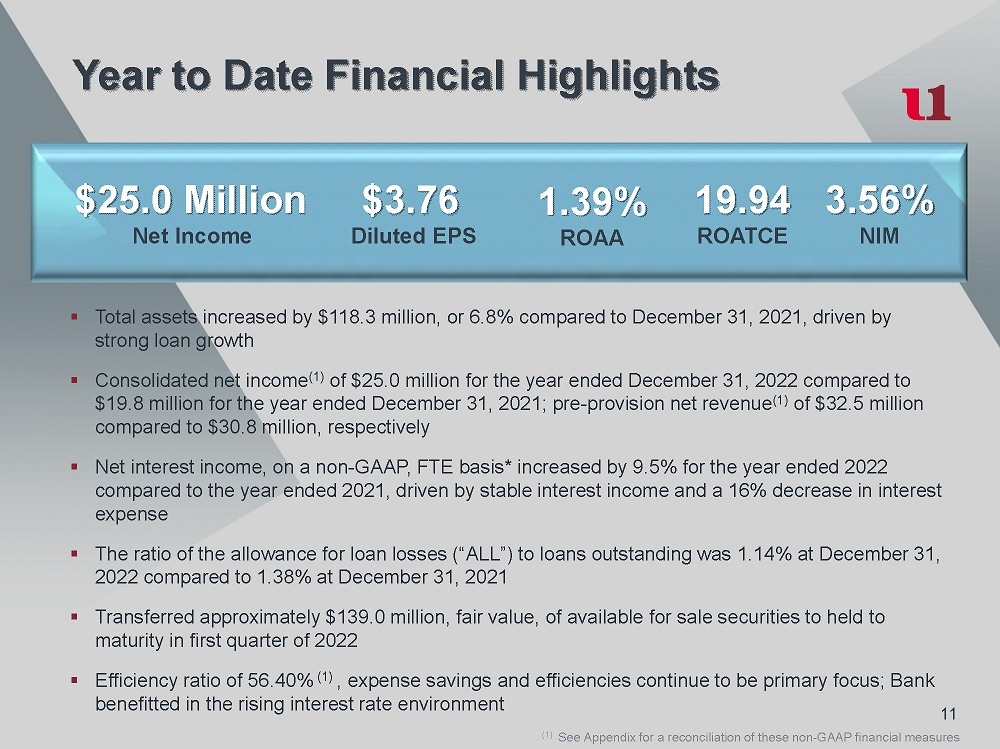
11 11 Year to Date Financial Highlights $25.0 Million Net Income $3.76 Diluted EPS 1.39% ROAA 19.94 ROATCE 3.56% NIM ▪ Total assets increased by $73.8 million, or 4.3% compared to December 31, 2021, driven by strong loan growth ▪ Consolidated net income (1) of $25.0 million for the year ended December 31, 2022 compared to $12.2 million for the year ended September 30, 2021; pre - provision net revenue of $32.5 million compared to $30.8 million, respectively ▪ Net interest income, on a non - GAAP, FTE basis* increased by 9.5% for the year ended 2022 compared to the year ended 2021, driven by stable interest income and a 16% decrease in interest expense ▪ The ratio of the allowance for loan losses (“ALL”) to loans outstanding was 1.14% at December 31, 2022 compared to 1.38% at December 31, 2021 ▪ Transferred approximately $139.0 million, fair value, of available for sale securities to held to maturity in first quarter of 2022 ▪ Efficiency ratio of 56.40% (1) , expense savings and efficiencies continue to be primary focus; Bank benefitted in the rising interest rate environment (1) See Appendix for a reconciliation of these non - GAAP financial measures
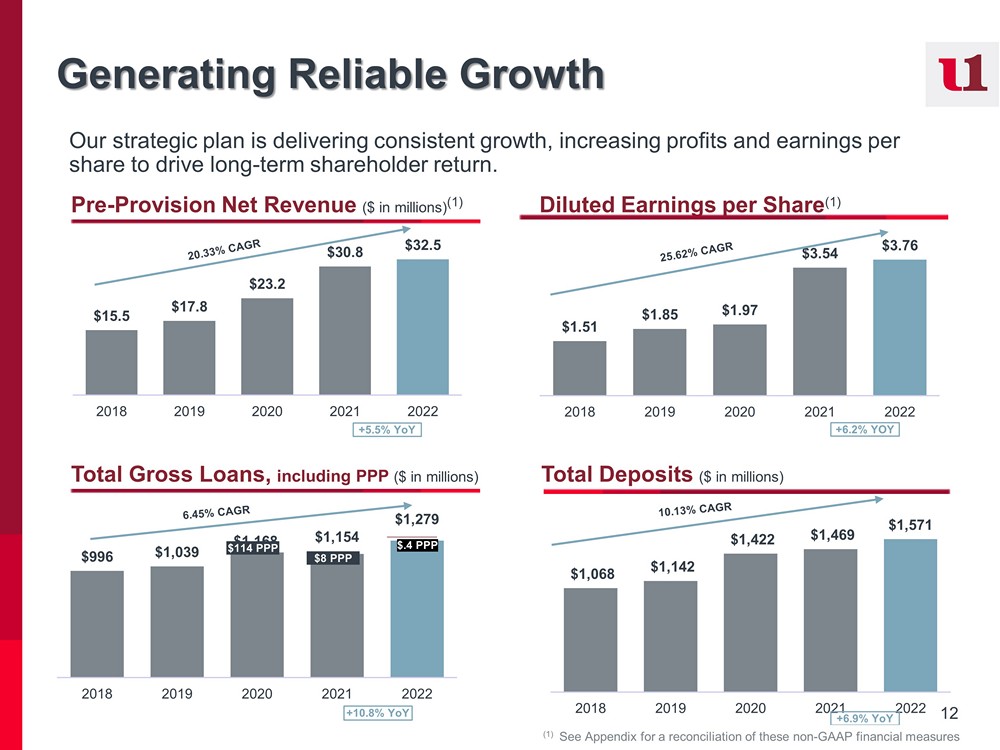
12 Generating Reliable Growth Our strategic plan is delivering consistent growth, increasing profits and earnings per share to drive long - term shareholder return. $15.5 $17.8 $23.2 $30.8 $32.5 2018 2019 2020 2021 2022 Pre - Provision Net Revenue ($ in millions) (1) Diluted Earnings per Share (1) $1.51 $1.85 $1.97 $3.54 $3.76 2018 2019 2020 2021 2022 +5.5% YoY +6.2% YOY Total Gross Loans, including PPP ($ in millions) $996 $1,039 $1,168 $1,154 $1,279 2018 2019 2020 2021 2022 +10.8% YoY $114 PPP $8 PPP Total Deposits ($ in millions) $1,068 $1,142 $1,422 $1,469 $1,571 2018 2019 2020 2021 2022 +6.9% YoY (1) See Appendix for a reconciliation of these non - GAAP financial measures $.4 PPP

13 Solid Profitability ▪ Consistently improved return on assets and return on average tangible common equity enable us to fund the dividend and invest in future growth. ▪ Strategic initiatives are underway to enhance growth, maintain margin, and continue improving profitability. Core ROAA (non - GAPP (1) ) Core ROATCE (non - GAPP (1) ) (1) See Appendix for a reconciliation of these non - GAAP financial measures 0.81% 0.93% 0.86% 1.35% 1.39% 2018 2019 2020 2021 2022 Strategic Target 1.0% - 1.25% 10.39% 11.44% 11.92% 19.61% 19.94% 2018 2019 2020 2021 2022 Strategic Target 14% - 15%

14 Proactive Loan Portfolio Management Commercial Loan Mix (12/31/2022) Loan Portfolio Mix (12/31/2022) Loan Type Balance (MMs) % Total 1 - 4 Family $444 35% CRE – OO $144 11% CRE – NOO $270 21% Multi - family $45 4% C&D $71 5% C&I $245 19% Consumer $60 5% PPP $0 0% Diverse portfolio loan types and industries reduce Commercial portfolio risk Focus on risk mitigation and managing of concentrations ▪ CRE / Total Capital: 211% ▪ ADC / Total Capital: 36% Industry Balance (MMs) Average Balance (MMs) % RE/Rental/Leasing – NOO $190 $1.8 25% RE/Rental/Leasing – OO, C&I $170 $0.8 22% Construction – Developers $8 $.6 1% Accommodations $86 $1.0 11% Services $67 $0.2 9% RE/Rental/Leasing – Multifamily $45 $0.5 6% Health Care/Social Assistance $31 $0.3 4% Trade $19 $0.1 2% RE/Rental/Leasing – Developers $25 $0.6 3% Construction – All Other $31 $0.1 4% All Other $103 $0.2 13%
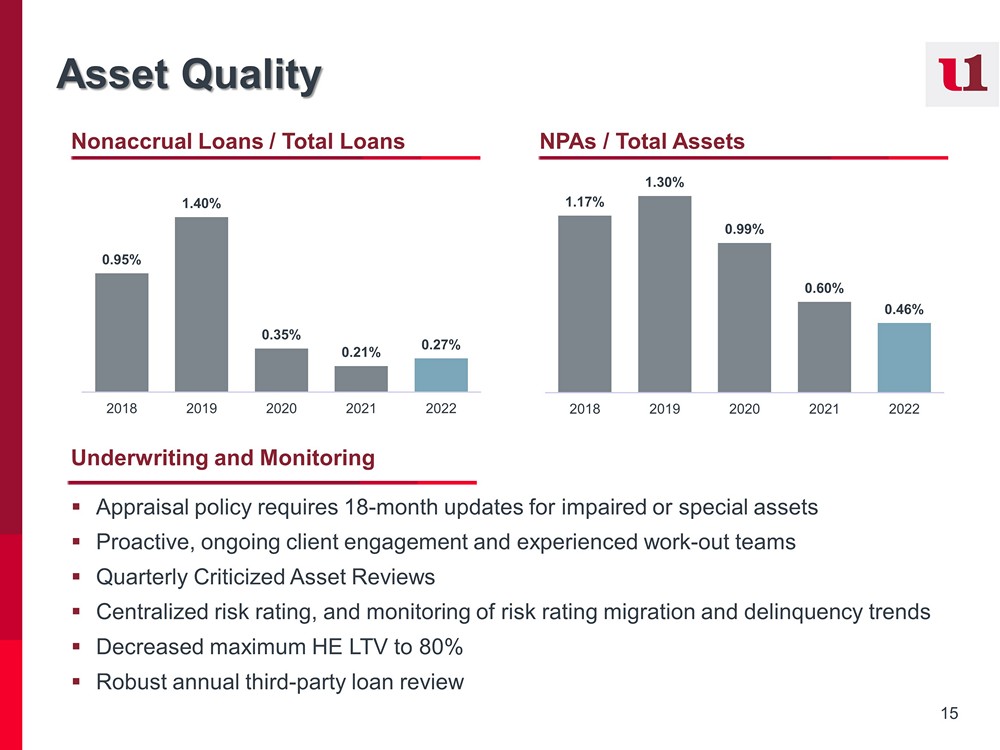
15 Asset Quality ▪ Appraisal policy requires 18 - month updates for impaired or special assets ▪ Proactive, ongoing client engagement and experienced work - out teams ▪ Quarterly Criticized Asset Reviews ▪ Centralized risk rating, and monitoring of risk rating migration and delinquency trends ▪ Decreased maximum HE LTV to 80% ▪ Robust annual third - party loan review Nonaccrual Loans / Total Loans NPAs / Total Assets 0.95% 1.40% 0.35% 0.21% 0.27% 2018 2019 2020 2021 2022 1.17% 1.30% 0.99% 0.60% 0.46% 2018 2019 2020 2021 2022 Underwriting and Monitoring
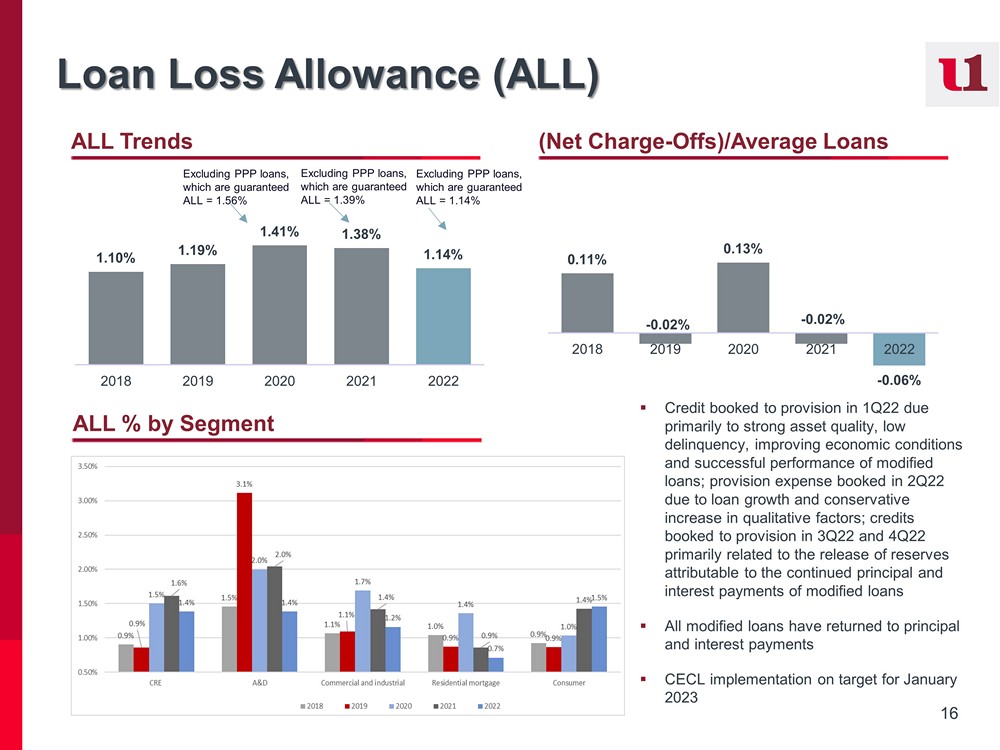
16 Loan Loss Allowance (ALL) ALL Trends (Net Charge - Offs)/Average Loans ALL % by Segment Excluding PPP loans, which are guaranteed ALL = 1.39% Excluding PPP loans, which are guaranteed ALL = 1.56% 1.10% 1.19% 1.41% 1.38% 1.14% 2018 2019 2020 2021 2022 0.11% - 0.02% 0.13% - 0.02% - 0.06% 2018 2019 2020 2021 2022 ▪ Credit booked to provision in 1Q22 due primarily to strong asset quality, low delinquency, improving economic conditions and successful performance of modified loans; provision expense booked in 2Q22 due to loan growth and conservative increase in qualitative factors; credits booked to provision in 3Q22 and 4Q22 primarily related to the release of reserves attributable to the continued principal and interest payments of modified loans ▪ All modified loans have returned to principal and interest payments ▪ CECL implementation on target for January 2023 Excluding PPP loans, which are guaranteed ALL = 1.14%
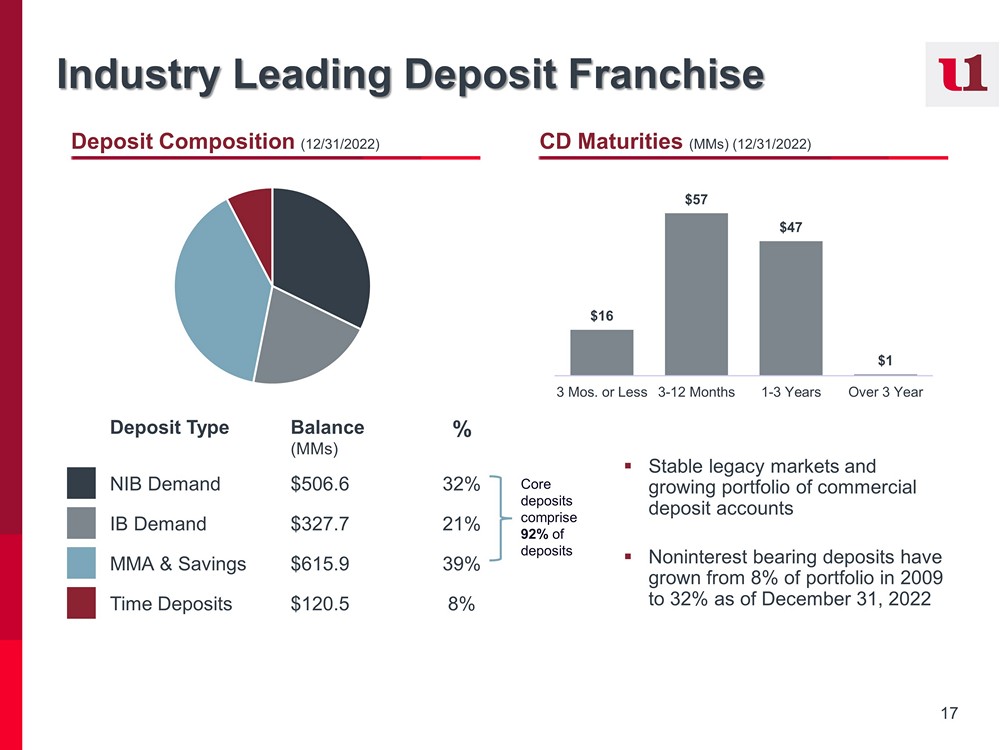
17 Industry Leading Deposit Franchise Deposit Composition (12/31/2022) CD Maturities (MMs) (12/31/2022) ▪ Stable legacy markets and growing portfolio of commercial deposit accounts ▪ Noninterest bearing deposits have grown from 8% of portfolio in 2009 to 32% as of December 31, 2022 $16 $57 $47 $1 3 Mos. or Less 3-12 Months 1-3 Years Over 3 Year Core deposits comprise 92% of deposits Deposit Type Balance (MMs) % NIB Demand $506.6 32% IB Demand $327.7 21% MMA & Savings $615.9 39% Time Deposits $120.5 8%

18 Net Interest Margin ▪ Disciplined loan and deposit pricing has produced a strong margin that is in line with our peers ▪ Margin expansion in the latter half of 2021 and into 2022 primarily due to new loan volume, existing loans pricing at higher rates and reduced cost of interest - bearing liabilities ▪ Net interest income was aided by increasing loan yields, lower cost of funds on interest - bearing deposits and the reduced interest expense related to the prepayment of FHLB long - term borrowings in 2021 ▪ Our team approach to full client relationships, our focus on community - oriented business owners and our high - tech branch network provide continued access to low - cost deposits, treasury management and commercial loans Components (1) (1) See Appendix for a reconciliation of these non - GAAP financial measures 4.41% 4.57% 3.99% 3.63% 3.85% 0.86% 1.18% 0.91% 0.51% 0.44% 3.74% 3.68% 3.34% 3.28% 3.56% 0.42% 0.70% 0.49% 0.24% 0.21% -0.5% 0.5% 1.5% 2.5% 3.5% 4.5% 2018 2019 2020 2021 2022 Yield on Earning Assets Cost of Interest-bearing Liabilities Net Interest Margin Cost of Deposits

19 Diversified Fee Income ▪ First United’s non - interest income (1) comprised 24% of operating revenue for 2022 ▪ Fee - based business provides stable growth and a diversified revenue stream not directly tied to interest rates, as well as opportunities to build client relationships ▪ First United’s diverse array of products provides opportunities to fully engage with customers and produce stable increases to earnings ▪ Wealth acquisition strategy in place to grow assets under management; fees impacted 2022 due to reduction in asset market value resulting from volatile stock market and declining bond values due to increasing interest rates Non - Interest Income Mix – 2022 Trust & Brokerage Assets Under Management (MMs) (1) See Appendix for a reconciliation of these non - GAAP financial measures Composition Trust and Brokerage 52% Service Charges 16% Net Gain on Loan Sales 0% Debit Card Income 22% Bank - owned Life Insurance 7% Other Noninterest Income 3% $1,084 $1,212 $1,377 $1,482 $1,359 2018 2019 2020 2021 2022
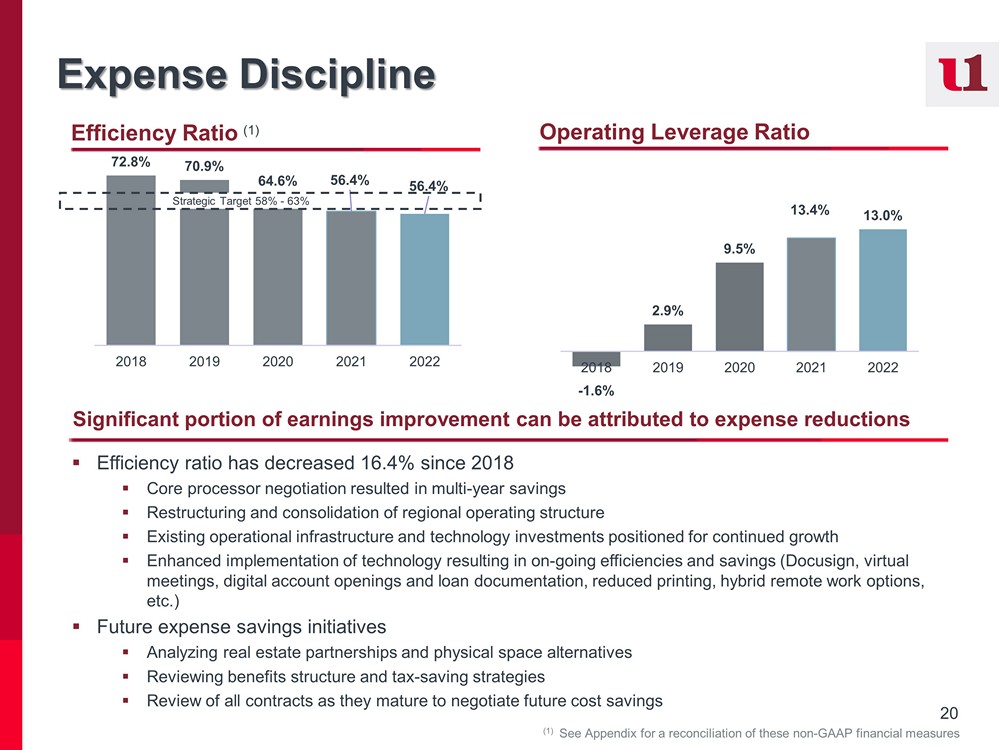
20 Expense Discipline ▪ Efficiency ratio has decreased 16.4% since 2018 ▪ Core processor negotiation resulted in multi - year savings ▪ Restructuring and consolidation of regional operating structure ▪ Existing operational infrastructure and technology investments positioned for continued growth ▪ Enhanced implementation of technology resulting in on - going efficiencies and savings ( Docusign , virtual meetings, digital account openings and loan documentation, reduced printing, hybrid remote work options, etc.) ▪ Future expense savings initiatives ▪ Analyzing real estate partnerships and physical space alternatives ▪ Reviewing benefits structure and tax - saving strategies ▪ Review of all contracts as they mature to negotiate future cost savings Efficiency Ratio (1) Operating Leverage Ratio Significant portion of earnings improvement can be attributed to expense reductions 72.8% 70.9% 64.6% 56.4% 56.4% 2018 2019 2020 2021 2022 Strategic Target 58% - 63% - 1.6% 2.9% 9.5% 13.4% 13.0% 2018 2019 2020 2021 2022 (1) See Appendix for a reconciliation of these non - GAAP financial measures
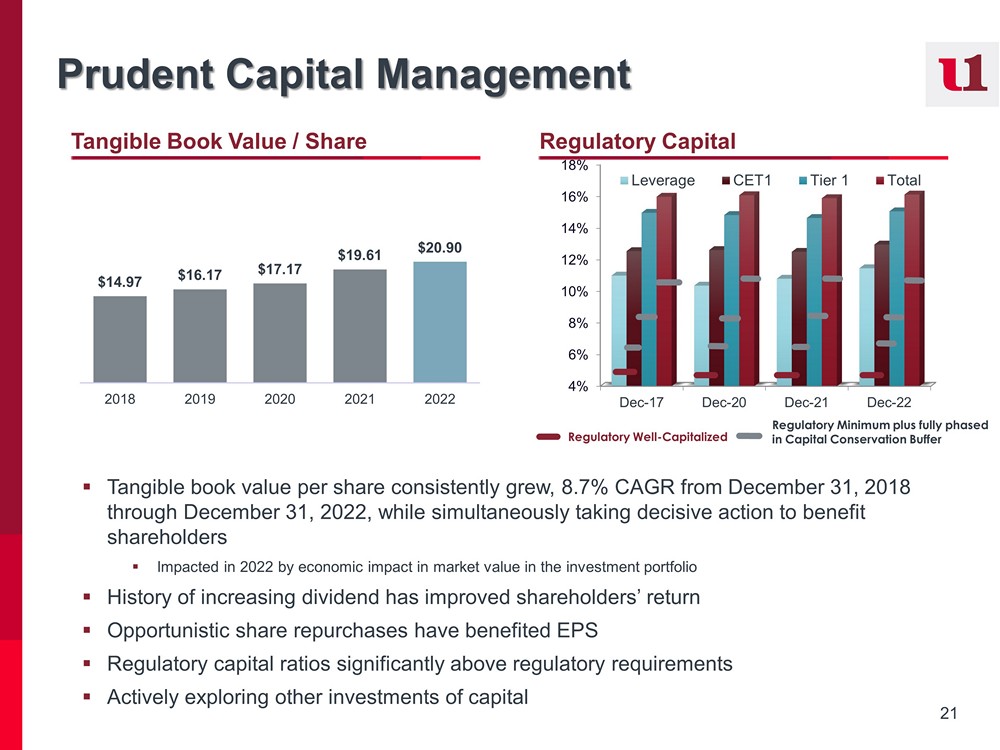
21 Prudent Capital Management ▪ Tangible book value per share consistently grew, 8.7% CAGR from December 31, 2018 through December 31, 2022, while simultaneously taking decisive action to benefit shareholders ▪ Impacted in 2022 by economic impact in market value in the investment portfolio ▪ History of increasing dividend has improved shareholders’ return ▪ Opportunistic share repurchases have benefited EPS ▪ Regulatory capital ratios significantly above regulatory requirements ▪ Actively exploring other investments of capital Regulatory Capital Tangible Book Value / Share $14.97 $16.17 $17.17 $19.61 $20.90 2018 2019 2020 2021 2022 4% 6% 8% 10% 12% 14% 16% 18% Dec-17 Dec-20 Dec-21 Dec-22 Leverage CET1 Tier 1 Total Regulatory Well - Capitalized Regulatory Minimum plus fully phased in Capital Conservation Buffer
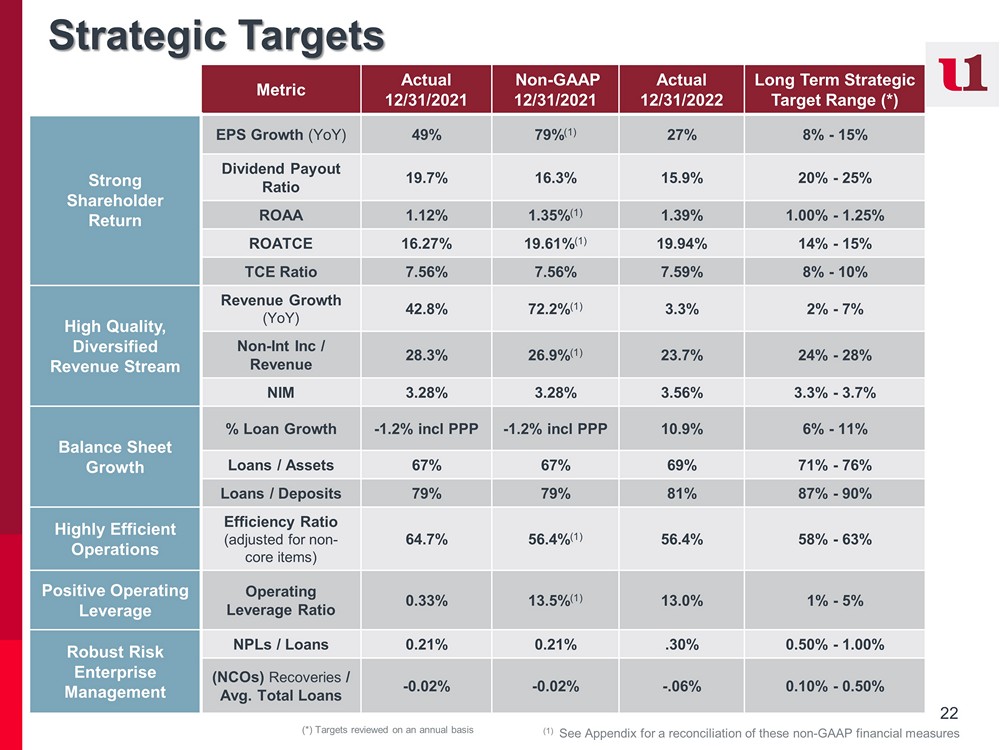
22 Strategic Targets Metric Actual 12/31/2021 Non - GAAP 12/31/2021 Actual 12/31/2022 Long Term Strategic Target Range (*) Strong Shareholder Return EPS Growth (YoY) 49% 79% (1) 27% 8% - 15% Dividend Payout Ratio 19.7% 16.3% 15.9% 20% - 25% ROAA 1.12% 1.35% (1) 1.39% 1.00% - 1.25% ROATCE 16.27% 19.61% (1) 19.94% 14% - 15% TCE Ratio 7.56% 7.56% 7.59% 8% - 10% High Quality, Diversified Revenue Stream Revenue Growth (YoY) 42.8% 72.2% (1) 3.3% 2% - 7% Non - Int Inc / Revenue 28.3% 26.9% (1) 23.7% 24% - 28% N IM 3.28% 3.28% 3.56% 3.3% - 3.7% Balance Sheet Growth % Loan Growth - 1.2% incl PPP - 1.2% incl PPP 10.9% 6% - 11% Loans / Assets 67% 67% 69% 71% - 76% Loans / Deposits 79% 79% 81% 87% - 90% Highly Efficient Operations Efficiency Ratio (adjusted for non - core items) 64.7% 56.4% (1) 56.4% 58% - 63% Positive Operating Leverage Operating Leverage Ratio 0.33% 13.5% (1) 13.0% 1% - 5% Robust Risk Enterprise Management NPLs / Loans 0.21% 0.21% .30% 0.50% - 1.00% (NCOs) Recoveries / Avg. Total Loans - 0.02% - 0.02% - .06% 0.10% - 0.50% (*) Targets reviewed on an annual basis (1) See Appendix for a reconciliation of these non - GAAP financial measures
23 Strong Investor Relations and Shareholder Engagement Members of the Board and senior management routinely engage with shareholders and other stakeholders, and management regularly updates the Board in the context of ongoing investor discussions . These engagements help the Board and management gather feedback on a variety of topics, including strategic and financial performance, ESG disclosure, executive compensation, Board composition, and leadership structure . How to contact your Board: Shareholders and interested parties wishing to contact our Board may send a letter to First United Co rporation Board of Directors, c/o Tonya K. Sturm, Secretary, First United Corporation, 19 South Second Street, Oakland, Maryland, 21550 - 00 09 or by e - mail at tsturm@mybank.com. The Secretary will deliver all shareholder communications directly to the Board for consideratio n. Clear long - term strategic plan with performance targets x Dedicated Investor Relations contact x Investor conferences and prospective investor engagement x Investor presentations and periodic outreach to institutional and retail shareholders x
24 I. II. III. IV. Management Team Board of Directors ESG Journey & Statistics Non - GAAP Reconciliation Pg. 25 Pg. 26 Pg. 27 Pg. 29 Appendices

25 Our leadership team reflects the diversity of thought from the communities we serve, executes on our strategy and drives shareholder returns. Our Dedicated Management Team Carissa L. Rodeheaver Chairman of the Board, President & CEO 30 - year career with First United with in - depth industry, sales, wealth management, financial and operational experience Jason B. Rush SVP & Chief Operating Officer 28 years with in - depth industry, retail, risk and compliance and operations experience Tonya K. Sturm SVP & Chief Financial Officer, Corporate Secretary & Treasurer 35+ years of extensive banking, audit, credit, retail, risk and compliance and financial experience R.L. Fisher SVP & Chief Revenue Officer 25+years with in - depth industry, retail, commercial and mortgage banking experience Keith R. Sanders SVP & Chief Wealth Officer 30 years of experience specializing in Wealth management, estate planning, trust administration and financial planning

26 Board of Directors Carissa L. Rodeheaver Chairman of the Board, President & CEO First United Corporation and First United Bank & Trust John F. Barr Independent Director Owner, Ellsworth Electric, Inc. John W. McCullough Lead Director, Nomination & Governance Chair Retired as Partner of Ernst & Young, LLP Brian Boal Independent Director, Audit Chair Boal & Associates, PC Sanu Chadha Independent Director Managing Partner, M&S Consulting Christy DiPietro Independent Director Chartered Financial Analyst, Hidden Cove Advisory Patricia Milon Independent Director Principal, Milford Advisory Group, LLC I. Robert Rudy Independent Director President, I.R. Rudy’s, Inc. Marisa Shockley Independent Director, Compensation Chair Owner, Shockley, Inc. H. Andrew Walls, III Independent Director President, MPB Print & Sign Superstore Member, MEGBA, LLC

27 ESG Journey Ongoing Shareholder Engagement ▪ Enhance Board oversight of Environment & Social issues ▪ Enhance Disclosure on Environment & Social issues ▪ Continue progress on FUNC ESG strategy Ongoing Board Refreshment Enhanced disclosure through investor materials, proxy statement, and website. 2022+ ▪ Declassified the Board of Directors (phased - in by 2024) ▪ Adopt Proxy Access ▪ Shareholder access to change By - laws ▪ Management majority vote proposal received favorable shareholder vote ▪ Updated NGC Charter ▪ Adopted a diversity policy for director refreshment ▪ Formalize LID role & responsibilities ▪ Revised stock ownership guidelines for Directors and Executives ▪ Introduced 2020 incentive programs – further aligning executive pay with performance ▪ Adopted right to call a special meeting. ▪ Adopted mandatory director retirement policy ▪ Adopted plurality voting standard for contested director elections ▪ Enhanced shareholder engagement program Spring/Fall 2021 Summer/Fall 2020 Spring 2020 2019 & earlier Over the past few years, we have implemented several important governance enhancements. These changes align our governance profile with our long - term investors’ expectations for best - in - class corporate governance. We continue to advance our ESG profile over time, recognizing the importance of our key stakeholders – including our customers and our communities – to our business.
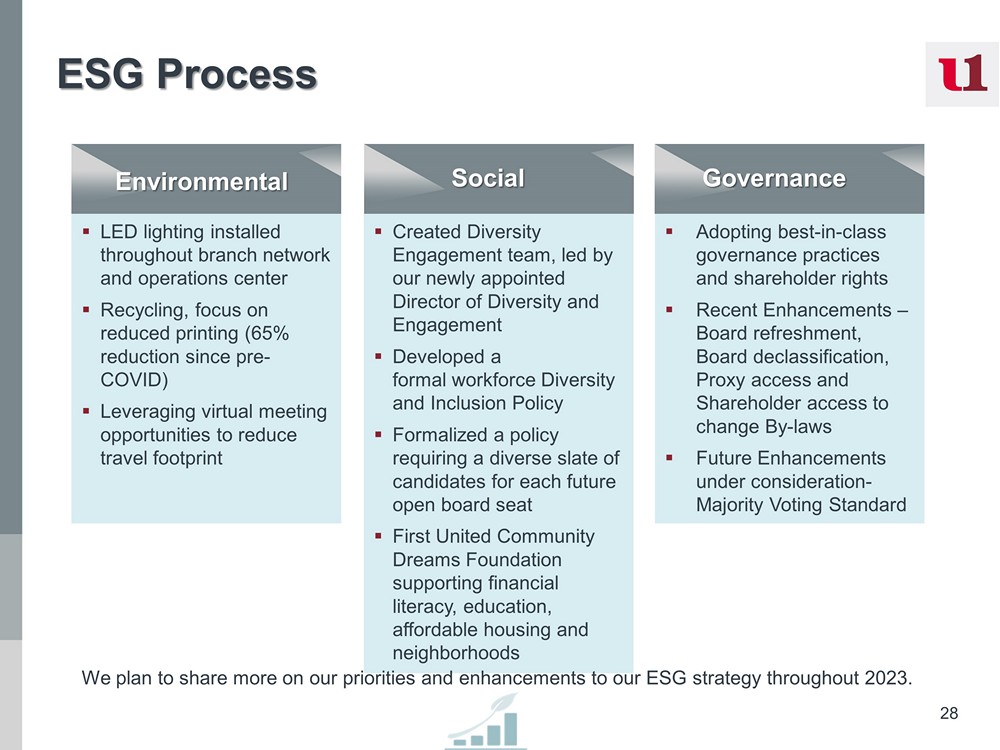
28 ▪ LED lighting installed throughout branch network and operations center ▪ Recycling, focus on reduced printing (65% reduction since pre - COVID) ▪ Leveraging virtual meeting opportunities to reduce travel footprint ▪ Created Diversity Engagement team, led by our newly appointed Director of Diversity and Engagement ▪ Developed a formal workforce Diversity and Inclusion Policy ▪ Formalized a policy requiring a diverse slate of candidates for each future open board seat ▪ First United Community Dreams Foundation supporting financial literacy, education, affordable housing and neighborhoods ▪ Adopting best - in - class governance practices and shareholder rights ▪ Recent Enhancements – Board refreshment, Board declassification, Proxy access and Shareholder access to change By - laws ▪ Future Enhancements under consideration - Majority Voting Standard Environmental Social Governance ESG Process We plan to share more on our priorities and enhancements to our ESG strategy throughout 2023.

29 This presentation includes certain non - GAAP financial measures, including pre - provision net revenue, net income, earnings per share (basic and diluted), return on average assets, return on average tangible common equity, tangible common equity, tangible assets, the ratio of tangible common equity to tangible assets, tangible book value per share, net interest margin, and efficiency ratio . These non - GAAP financial measures and any other non - GAAP financial measures that are discussed in this presentation should not be considered in isolation, and should be considered as additions to, and not substitutes for or superior to, measures of financial performance prepared in accordance with GAAP . There are a number of limitations related to the use of these non - GAAP financial measures versus their nearest GAAP equivalents . For example, other companies may calculate non - GAAP financial measures differently or may use other measures to evaluate their performance, all of which could reduce the usefulness of the Company’s non - GAAP financial measures as tools for comparison . The following is a reconciliation of the non - GAAP financial measures used in (or conveyed orally during) this presentation to their most directly comparable GAAP financial measures . Non - GAAP Reconciliation ($000s, except where otherwise noted) YTD 2018 2019 2020 2021 Q1 2021 Q2 2021 Q3 2021 Q4 2021 Q1 2022 Q2 2022 Q3 2022 Q4 2022 12/31/2022 Pre-Provision Net Revenue ("PPNR") Pre-tax income, as reported 13,431$ 16,465$ 17,788$ 26,309$ 4,529$ 5,939$ 5,800$ 10,041$ 7,616$ 7,136$ 9,613$ 8,816$ 33,181$ Add back: Provision expense 2,111 1,320 5,401 (817) 110 555 (597) (885) (419) 624 (108) (740) (643) Add back: FHLB penalty, gross - - - 2,368 - - 2,368 - - - - - - Add back: Contribution 1,000 1,000 - - - - - Add back: Insurance reimbursement (1,375) (1,375) - - - - - Add back: Settlement expense, gross - - - 3,300 3,300 - - - - - - - - Pre-Provision Net Revenue, as adjusted 15,542$ 17,785$ 23,189$ 30,785$ 7,939$ 6,494$ 7,571$ 8,781$ 7,197$ 7,760$ 9,505$ 8,076$ 32,538$ Net Income Net income, as reported 10,667$ 13,129$ 13,841$ 19,770$ 3,430$ 4,403$ 4,388$ 7,549$ 5,715$ 5,428$ 6,936$ 6,969$ 25,048$ Less: Preferred stock dividends - - - - - - - - - - - Net income, available to common shareholders,as reported (a) 10,667$ 13,129$ 13,841$ 19,770$ 3,430$ 4,403$ 4,388$ 7,549$ 5,715$ 5,428$ 6,936$ 6,969$ 25,048$ Add Back: Impact of Tax Reform Act Add back: FHLB penalty, net of tax - - - 1,790 - 1,790 - - - - - - Add back: Contribution, net of tax 770 770 - - - - - Add back: Insurance reimbursement, net of tax (1,059) (1,059) - - - - - Add back: Settlement expense, net of tax - - - 2,565 2,565 - - - - - - - - Net income, as adjusted (b) 10,667$ 13,129$ 13,841$ 23,836$ 5,995$ 4,403$ 6,178$ 7,260$ 5,715$ 5,428$ 6,936$ 6,969$ 25,048$
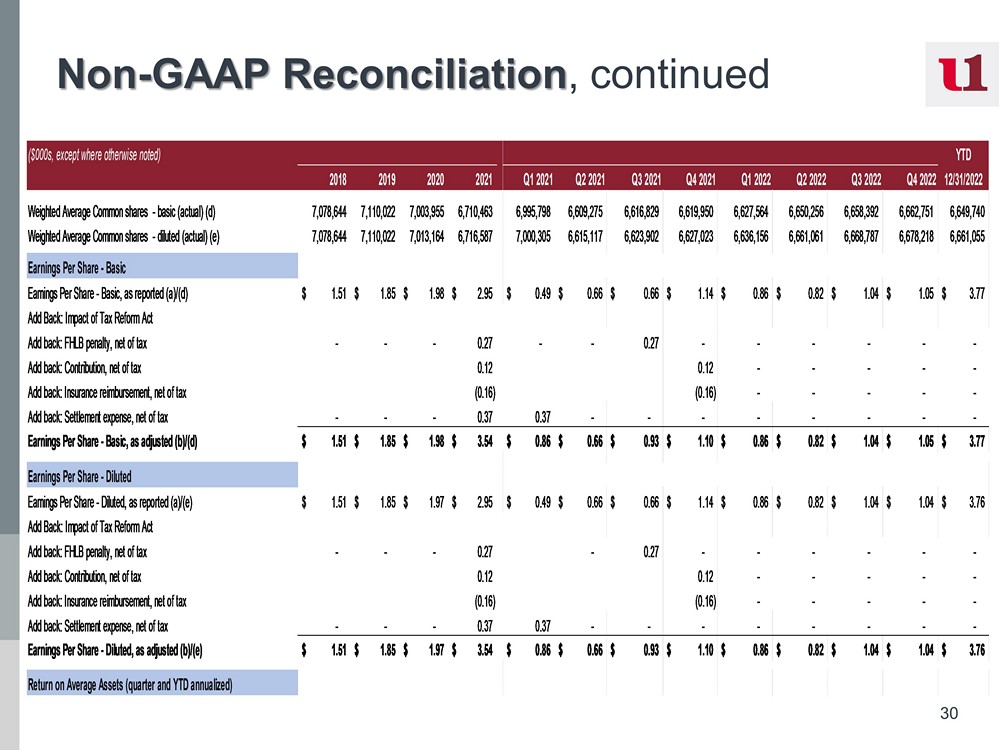
30 Non - GAAP Reconciliation , continued ($000s, except where otherwise noted) YTD 2018 2019 2020 2021 Q1 2021 Q2 2021 Q3 2021 Q4 2021 Q1 2022 Q2 2022 Q3 2022 Q4 2022 12/31/2022 Weighted Average Common shares - basic (actual) (d) 7,078,644 7,110,022 7,003,955 6,710,463 6,995,798 6,609,275 6,616,829 6,619,950 6,627,564 6,650,256 6,658,392 6,662,751 6,649,740 Weighted Average Common shares - diluted (actual) (e) 7,078,644 7,110,022 7,013,164 6,716,587 7,000,305 6,615,117 6,623,902 6,627,023 6,636,156 6,661,061 6,668,787 6,678,218 6,661,055 Earnings Per Share - Basic Earnings Per Share - Basic, as reported (a)/(d) 1.51$ 1.85$ 1.98$ 2.95$ 0.49$ 0.66$ 0.66$ 1.14$ 0.86$ 0.82$ 1.04$ 1.05$ 3.77$ Add Back: Impact of Tax Reform Act Add back: FHLB penalty, net of tax - - - 0.27 - - 0.27 - - - - - - Add back: Contribution, net of tax 0.12 0.12 - - - - - Add back: Insurance reimbursement, net of tax (0.16) (0.16) - - - - - Add back: Settlement expense, net of tax - - - 0.37 0.37 - - - - - - - - Earnings Per Share - Basic, as adjusted (b)/(d) 1.51$ 1.85$ 1.98$ 3.54$ 0.86$ 0.66$ 0.93$ 1.10$ 0.86$ 0.82$ 1.04$ 1.05$ 3.77$ Earnings Per Share - Diluted Earnings Per Share - Diluted, as reported (a)/(e) 1.51$ 1.85$ 1.97$ 2.95$ 0.49$ 0.66$ 0.66$ 1.14$ 0.86$ 0.82$ 1.04$ 1.04$ 3.76$ Add Back: Impact of Tax Reform Act Add back: FHLB penalty, net of tax - - - 0.27 - 0.27 - - - - - - Add back: Contribution, net of tax 0.12 0.12 - - - - - Add back: Insurance reimbursement, net of tax (0.16) (0.16) - - - - - Add back: Settlement expense, net of tax - - - 0.37 0.37 - - - - - - - - Earnings Per Share - Diluted, as adjusted (b)/(e) 1.51$ 1.85$ 1.97$ 3.54$ 0.86$ 0.66$ 0.93$ 1.10$ 0.86$ 0.82$ 1.04$ 1.04$ 3.76$ Return on Average Assets (quarter and YTD annualized)

31 Non - GAAP Reconciliation , continued ($000s, except where otherwise noted) YTD 2018 2019 2020 2021 Q1 2021 Q2 2021 Q3 2021 Q4 2021 Q1 2022 Q2 2022 Q3 2022 Q4 2022 12/31/2022 Average Assets ( c) 1,311,902$ 1,418,928$ 1,613,669$ 1,765,148$ 1,765,133$ 1,783,821$ 1,768,803$ 1,750,614$ 1,769,234$ 1,770,601$ 1,819,732$ 1,845,275$ 1,801,711$ Return on Average Assets, as reported (a)/(c) 0.81% 0.93% 0.86% 1.12% 0.78% 0.99% 0.99% 1.72% 1.31% 1.23% 1.51% 1.50% 1.39% Add Back: Impact of Tax Reform Act Add back: FHLB penalty, net of tax - - - 0.10% - - 0.40% - - - - - - Add back: Contribution, net of tax 0.04% 0.18% - - - - - Add back: Insurance reimbursement, net of tax -0.06% -0.24% - - - - - Add back: Settlement expense, net of tax - - - 0.15% 0.58% - - - - - - - - Return on Average Assets, as adjusted (b)/(c) 0.81% 0.93% 0.86% 1.35% 1.36% 0.99% 1.40% 1.66% 1.31% 1.23% 1.51% 1.50% 1.39% Return on Average Common Stockholders' Equity Return on Average Tangible Common Stockholders' Equity Average common stockholders' equity (f) 113,659$ 125,774$ 127,101$ 132,550$ 131,541$ 127,269$ 133,952$ 137,436$ 140,517$ 136,039$ 135,186$ 140,224$ 137,685$ Average common stockholders' equity, as adjusted 113,659 125,774 127,101 132,550 131,541 127,269 133,952 137,436 140,517 136,039 135,186 140,224 137,685 Less: Average goodwill and intangibles 11,004 11,004 11,004 11,004 11,004 11,004 11,004 11,004 12,034 11,965 11,913 12,225 12,043 Average tangible common equity (g) 102,655$ 114,770$ 116,097$ 121,546$ 120,537$ 116,265$ 122,948$ 126,432$ 128,483$ 124,074$ 123,273$ 127,999$ 125,642$ Return on average common stockholders' equity, as reported (a)/(f) 9.39% 10.44% 10.89% 14.92% 10.43% 13.84% 13.10% 21.97% 16.27% 15.96% 20.52% 19.88% 18.19% Add back: FHLB penalty, net of tax - - - 1.47% - 5.35% - - - - - Add back: Contribution 0.63% -0.84% - - - - Add back: Insurance reimbursement -1.15% 7.80% - - - - Add back: Settlement expense, net of tax 2.11% - - - - Return on average common stockholders' equity, as adjusted (b)/(f) 9.39% 10.44% 10.89% 17.98% 18.23% 13.84% 18.45% 21.13% 16.27% 15.96% 20.52% 19.88% 18.19% Return on average tangible common equity, as reported (a)/(g) 10.39% 11.44% 11.92% 16.27% 11.38% 15.15% 14.28% 23.88% 17.79% 17.55% 22.32% 21.60% 19.94% Add Back: Impact of Tax Reform Act - - - - - Add back: FHLB penalty, net of tax - - - 1.47% - - 5.82% - - - - - Add back: Contribution 0.63% 2.44% - - - - - Add back: Insurance reimbursement -0.87% -3.35% - - - - - Add back: Settlement expense, net of tax - - - 2.11% 8.51% - - - - - - - - Return on average tangible common equity, as adj (b)/(g) 10.39% 11.44% 11.92% 19.61% 19.89% 15.15% 20.10% 22.97% 17.79% 17.55% 22.32% 21.60% 19.94% Tangible Book Value per Common Share Total common equity, as reported (h) 117,066$ 125,940$ 131,047$ 141,900$ 129,189$ 130,556$ 133,787$ 141,900$ 137,078$ 132,892$ 132,044$ 151,793$ 151,793$ Less: Goodwill and intangibles 11,004 11,004 11,004 12,052 11,004 11,004 11,004 12,052 12,000 11,947 11,895 12,433 12,433 Total tangible common equity (i) 106,062$ 114,936$ 120,043$ 129,848$ 118,185$ 119,552$ 122,783$ 129,848$ 125,078$ 120,945$ 120,149$ 139,360$ 139,360$ Common shares outstanding - basic (actual) (j) 7,086,632 7,110,022 6,992,911 6,620,955 6,998,617 6,614,604 6,617,941 6,620,955 6,637,979 6,656,395 6,659,390 6,666,428 6,666,428 Tangible book value per basic common share (i)/(j) 14.98$ 16.17$ 17.17$ 19.61$ 16.89$ 18.07$ 18.55$ 19.61$ 18.84$ 18.17$ 18.04$ 20.90$ 20.90$
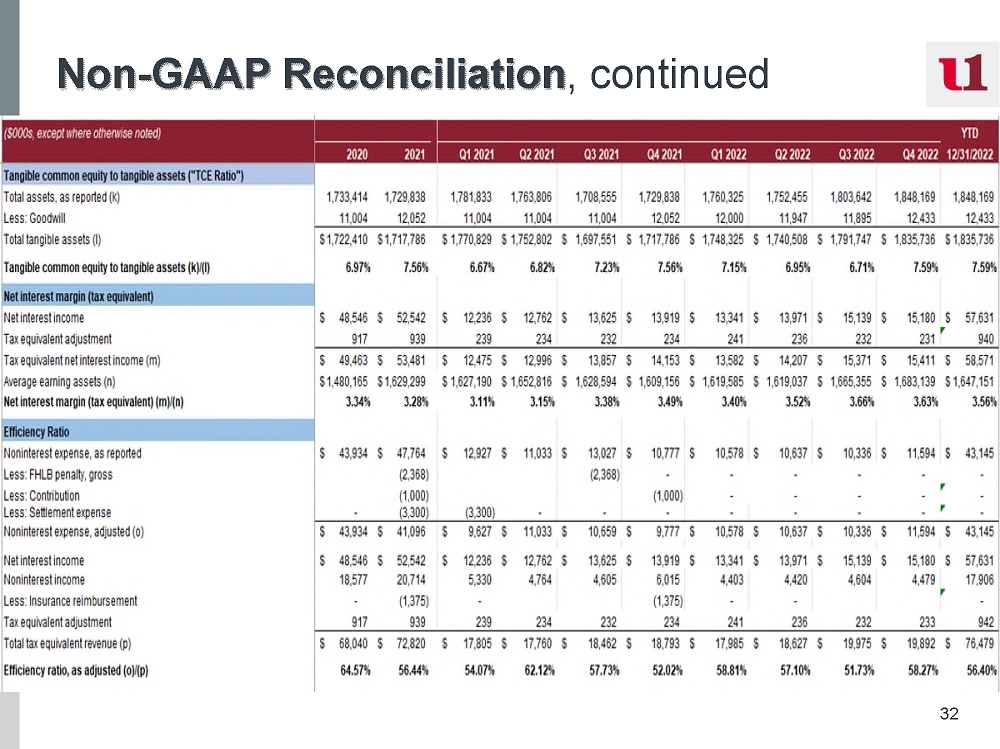
32 Non - GAAP Reconciliation , continued ($000s, except where otherwise noted) YTD 2018 2019 2020 2021 Q1 2021 Q2 2021 Q3 2021 Q4 2021 Q1 2022 Q2 2022 Q3 2022 Q4 2022 12/31/2022 Tangible common equity to tangible assets ("TCE Ratio") Total assets, as reported (k) 1,384,516 1,442,966 1,733,414 1,729,838 1,781,833 1,763,806 1,708,555 1,729,838 1,760,325 1,752,455 1,803,642 1,848,169 1,848,169 Less: Goodwill 11,004 11,004 11,004 12,052 11,004 11,004 11,004 12,052 12,000 11,947 11,895 12,433 12,433 Total tangible assets (l) 1,373,512$ 1,431,962$ 1,722,410$ 1,717,786$ 1,770,829$ 1,752,802$ 1,697,551$ 1,717,786$ 1,748,325$ 1,740,508$ 1,791,747$ 1,835,736$ 1,835,736$ Tangible common equity to tangible assets (k)/(l) 7.72% 8.03% 6.97% 7.56% 6.67% 6.82% 7.23% 7.56% 7.15% 6.95% 6.71% 7.59% 7.59% Net interest margin (tax equivalent) Net interest income 44,182$ 46,391$ 48,546$ 52,542$ 12,236$ 12,762$ 13,625$ 13,919$ 13,341$ 13,971$ 15,139$ 15,180$ 57,631$ Tax equivalent adjustment 796 868 917 939 239 234 232 234 241 236 232 233 942 Tax equivalent net interest income (m) 44,978$ 47,259$ 49,463$ 53,481$ 12,475$ 12,996$ 13,857$ 14,153$ 13,582$ 14,207$ 15,371$ 15,413$ 58,573$ Average earning assets (n) 1,203,813$ 1,285,019$ 1,480,165$ 1,629,299$ 1,627,190$ 1,652,816$ 1,628,594$ 1,609,156$ 1,619,585$ 1,619,037$ 1,665,355$ 1,683,139$ 1,647,151$ Net interest margin (tax equivalent) (m)/(n) 3.74% 3.68% 3.34% 3.28% 3.11% 3.15% 3.38% 3.49% 3.40% 3.52% 3.66% 3.63% 3.56% Efficiency Ratio Noninterest expense, as reported 43,808$ 45,389$ 43,934$ 47,764$ 12,927$ 11,033$ 13,027$ 10,777$ 10,578$ 10,637$ 10,336$ 11,594$ 43,145$ Less: FHLB penalty, gross (2,368) (2,368) - - - - - - Less: Contribution (1,000) (1,000) - - - - - Less: Settlement expense - - - (3,300) (3,300) - - - - - - - - Noninterest expense, adjusted (o) 43,808$ 45,389$ 43,934$ 41,096$ 9,627$ 11,033$ 10,659$ 9,777$ 10,578$ 10,637$ 10,336$ 11,594$ 43,145$ Net interest income 44,182$ 46,391$ 48,546$ 52,542$ 12,236$ 12,762$ 13,625$ 13,919$ 13,341$ 13,971$ 15,139$ 15,180$ 57,631$ Noninterest income 15,168 16,783 18,577 20,714 5,330 4,764 4,605 6,015 4,403 4,420 4,604 4,479 17,906 Less: Insurance reimbursement - - - (1,375) - (1,375) - - - Tax equivalent adjustment 796 868 917 939 239 234 232 234 241 236 232 233 942 Total tax equivalent revenue (p) 60,146$ 64,042$ 68,040$ 72,820$ 17,805$ 17,760$ 18,462$ 18,793$ 17,985$ 18,627$ 19,975$ 19,892$ 76,479$ Efficiency ratio, as adjusted (o)/(p) 72.84% 70.87% 64.57% 56.44% 54.07% 62.12% 57.73% 52.02% 58.81% 57.10% 51.73% 58.27% 56.40%