Exhibit 99.1
2005 Annual Meeting of Shareholders Presentation
William B. Grant
Chief Executive Officer
Good afternoon, fellow shareholders and special guests. Welcome to your 2005 Shareholders’ Meeting. While our financial results were not strong in 2004, I can tell you that a number of good and strategic things occurred at your Company. As we have done over the past several years, your management group will review with you the events, challenges and accomplishments of the year just ended from their vantage point. We may as well get started with the numbers, and for that I would like to call on Bob Kurtz, President and CFO.
Before we deliver our reports, however, I call your attention to the fact that our reports contain forward-looking statements. Forward-looking statements are not historical in nature and are evidenced by words such as “anticipate,” “estimate,” “should,” “expect,” “believe,” “intend,” and similar expressions. While these statements reflect the Company's good faith beliefs, expectations, estimates and projections about, among other things, the industry and the markets in which the Company operates, they are not guarantees of future performance and they involve risk and uncertainties that could cause actual results to differ materially. For a discussion of these risks and uncertainties, see the Risk Factors contained in Exhibit 99.1 to the Company’s Form 10-K for the last fiscal year.
Robert W. Kurtz
President and
Chief Financial Officer
Good Afternoon.
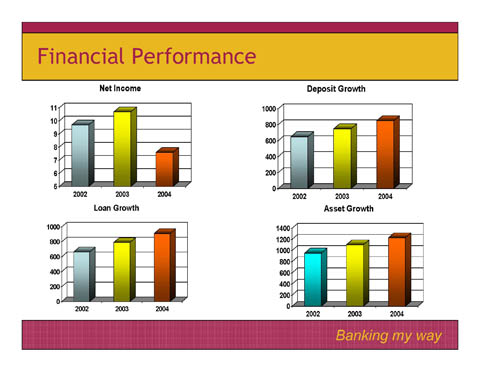
After seeing short term interest rates decreasing five and a quarter percent from 2001 to mid year 2003, the Federal Reserve began to increase those rates over the past twelve months, increasing seven times at a quarter of a percent each time. This has been good for the saver, due to the increase in deposit rates. Contrary to the increase in short term rates, we have seen very little increase in long term rates, which directly affects the borrower. So, the average customer faired well during this twelve month period - deposit rates are up, and loan rates are still at historical low levels. The benefits to our customers were not generally mirrored as a benefit to First United. As I go through my presentation you will see the impact that these rates have had on our financials.
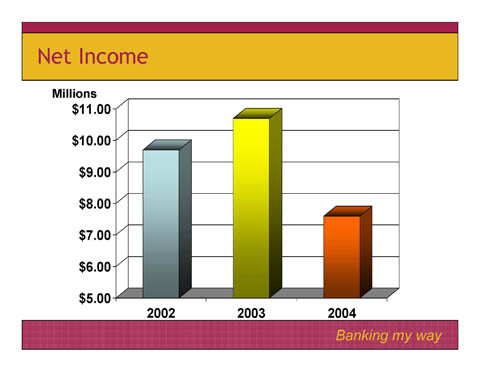
Net Income
As Bill alluded to, net income of $7.6 million for 2004, was down $3.1 million or 29% from 2003. There were several factors that contributed to this downturn, some strategic in nature, some one-time expenses and others that reflect the interest rate environment affecting us. Most of these issues I will briefly touch on, but for a more detailed explanation, I encourage you to read the Management’s Discussion and Analysis of Financial Condition and Results of Operations in the Form 10K, that was mailed to each of you.
Two significant issues that negatively impacted net income were the issuance and redemption of Junior Subordinated Debentures, or what we referred to as Trust Preferred issues, and the early redemption of two Federal Home Loan borrowings. Just as many of you have refinanced your home in this low rate environment, your Management made the strategic decision to do some refinancing of our own. These decisions brought a significant amount of expense to our bottom line in 2004, due to a redemption penalty assessed on the early redemption of our borrowings with Federal Home Loan Bank and an acceleration of unamortized expenses with the redemption of the debentures, but we are confident that these actions will lower our interest expense going forward.
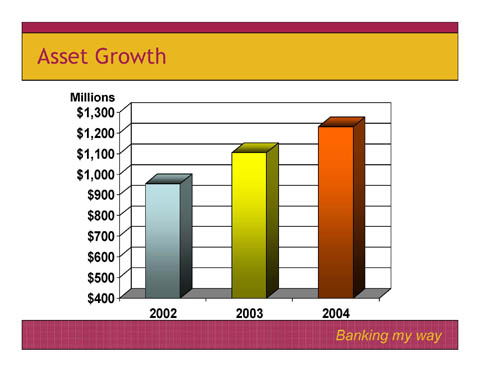
Asset Growth
During 2004, assets grew $123 million or 11%, to $1.23 billion, with loan growth representing most of that increase.
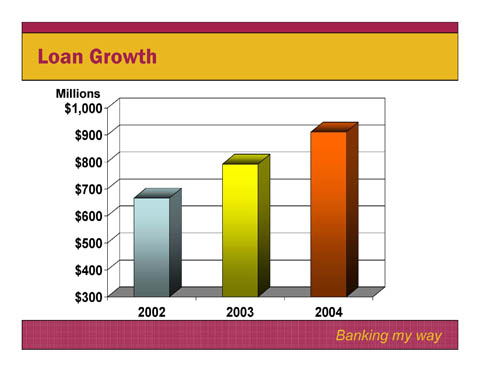
Loan Growth
In 2004, total loans grew $119 million or 15%. Unlike 2003, we had a more balanced growth between our different loan sectors. Steve will discuss more of the details during his presentation.
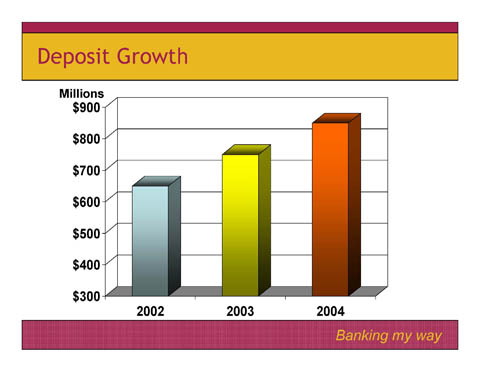
Deposit Growth
On this slide we see deposits growing $100 million or 13%. With the attempt to lower our cost of funds, while emphasizing growth in our lower cost demand deposit accounts versus the higher costs associated with certificates of deposits, we were unable to generate the amount of retail deposits to fund our loan growth, so we found the need to go out into the wholesale market for funding. Deposits from the wholesale market are at a higher cost, which negatively impacts net interest income and the net interest margin as you will see on the next two slides.
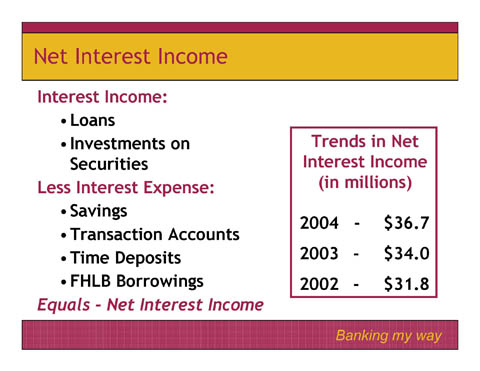
Net Interest Income
Net interest income is basically the difference between what we earn on loans and investments, less the interest expense that is incurred on deposits and other borrowings. This chart shows a $2.6 million increase over 2003, which is slightly more than the increase experienced the previous year.
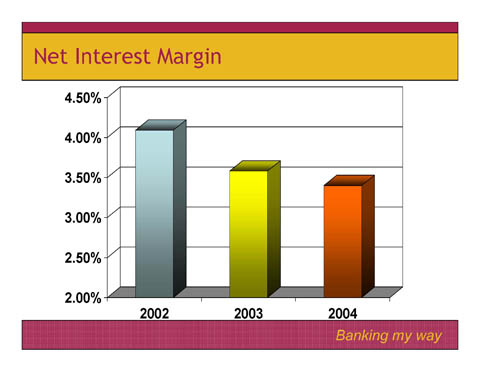
Net Interest Margin
Net interest margin is the result of taking net interest income and converting that spread to a percent of earning assets. During 2004, we continued to see this margin decrease from 3.6% to 3.4%. This 20 basis point compression in the margin was considerably less than what was seen in 2003 compared to 2002. Management made a strategic decision to minimize the exposure of reduced earnings in a rising rate environment, by principally underwriting lower yielding adjustable rate loans and loans tied to the Prime rate, versus the long term higher yielding fixed rate loans. This strategy along with our higher cost of funds, due to having to fund loan growth through higher cost wholesale deposits, caused the net interest margin to decrease in 2004.
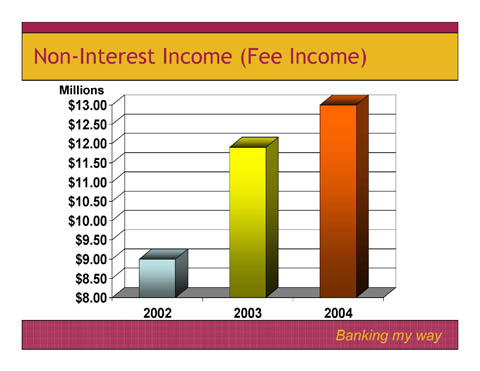
Non-Interest Income (fee income)
In addition to income earned from loans and investments, non-interest income is our other source of income. Non-interest income grew $1.1 million or 9% in 2004.
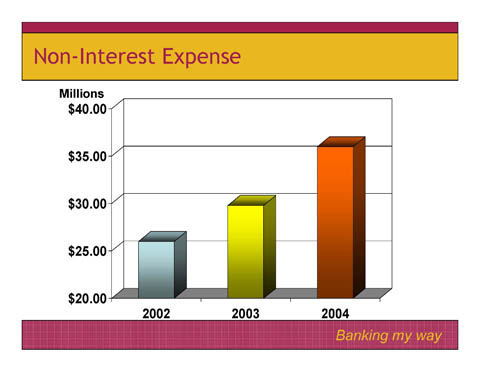
Non-Interest Expense
Non-interest expense grew $6.1 million or 20% in 2004. Forty-five percent of that increase, or $2.7 million was a one-time cost of expenses related to the early redemption of long-term borrowings. This was discussed earlier in my presentation. Excluding this $2.7 million one-time charge, non-interest expense increased $3.4 million. A large portion of this increase was attributed to a $1 million increase in salaries and benefit expense, reflecting general salary increases, staffing additions in key areas, and a full year of compensation costs related to the Huntington branches acquired in mid-2003. The Company also incurred additional professional fees in 2004 related to compliance with the Sarbanes-Oxley Act, and additional costs for conversion of its network lines associated with branch expansion and modernization.
The remaining slides show the results of three key ratios that we watch very closely. Each of these ratios will show a decrease from 2003, caused by the decrease in net income.
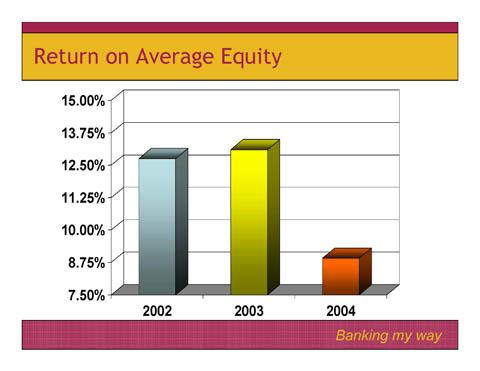
Return on Average Equity
The return on average equity or the amount of earnings as a percent of average equity, decreased to 8.91% from the 2003 ratio of 13.1%.
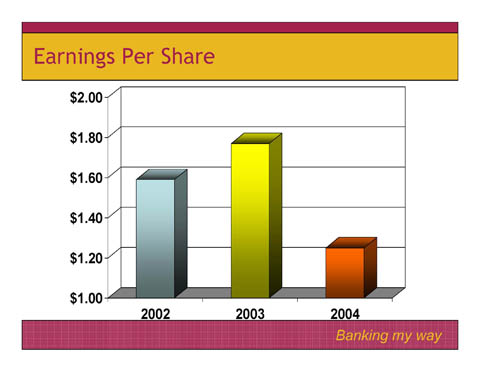
Earnings Per Share
Earnings per share or the amount of income that each share earned, ended the year at $1.25 versus $1.77 as of December 2003.
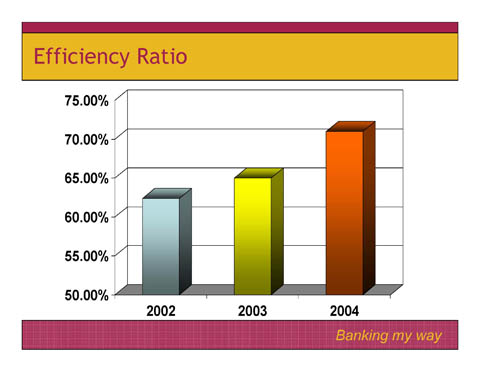
Efficiency Ratio
The third and final ratio, the efficiency ratio, represents the percent of net revenue required to cover our overhead expenses. With the compression of our interest margin, along with the increase in non-interest expense, we saw this ratio increase from 63% to 71%. This means that $.71 out of every revenue dollar goes toward covering non-interest expenses.
What do we anticipate for 2005? Your Management team is very confident that 2004 will not be a year that will set a new benchmark in financial performance at First United, but rather was one of those years where we took advantage of a few strategic initiatives and some one-time expenses that negatively impacted 2004 earnings. Each of these decisions was made with the intent to enhance your Company’s financial performance going forward.
Thank you!
Steven M. Lantz
Senior Vice President and
Senior Lending Officer
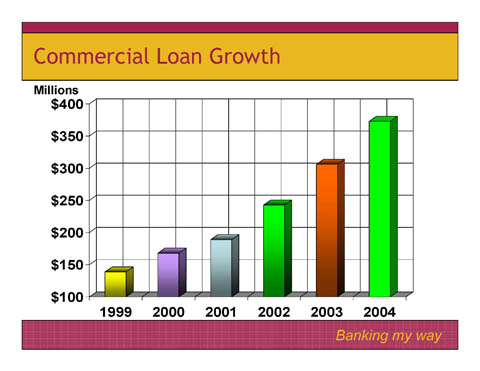
Welcome—Loan activity was balanced throughout the company last year. Our total loan growth was 119 million which compares favorably with 2003 growth of $78 million core growth net of branch acquisitions and 2002 growth of $56 million.
The main driver of loan growth continues to be our commercial lending division which grew $66 million last year. As can be seen by the graph our growth trend in this division continues to be a very important revenue engine for the company. We think building full relationships with business customers continues to be a great market for us and no doubt will continue to be in the future.
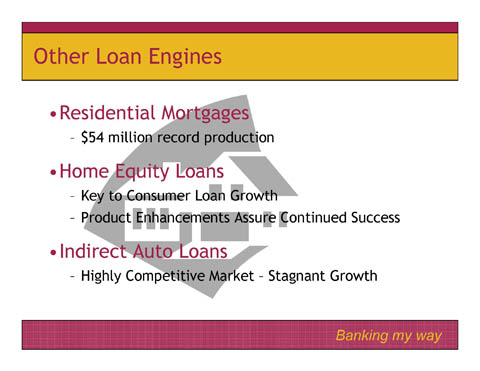
The residential mortgage area also had very good growth in 2004 accounting for $54 million growth. This far exceeds our growth of $30 million in 2003. Although our internal growth was better than expected last year we actually had 14 million dollars less loan originations than we experienced in 2003. We found last year that because of rising interest rates our portfolio adjustable rate mortgage products gained favor over the securitized fixed rate loans in the market. In addition, mortgage payoffs fueled by very low fixed rates were much curtailed last year, thus we retained more of the business we produced. Our group was very satisfied with the outcome of production last year.
Our other main production area in loans is our consumer loan division. Our Home equity product was key for us in 2004 and we specifically enhanced this product by making it more attractive for the consumer by offering a 100% loan to value product, offered various closing cost options, and we provided a competitive tiered rate pricing system. We found these enhancements continued to solidify the home equity as the consumer product of choice for a loan. While our indirect auto financing group continued to produce over 6 million dollars a month in originations the prevalence of low captive factory financing and other factory incentives proved this line of business had narrow profit margins, so your company elected to generate only business where a satisfactory profit could be obtained.
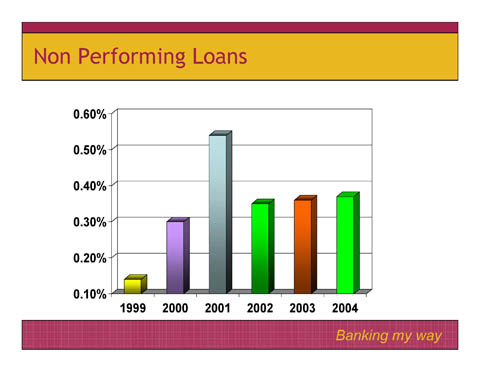
On the topic of credit quality 2004 was a challenge for us. While our consumer loans experienced lower charge-offs than expected, we did have a higher than expected commercial loan problems. The main culprit for this slight increase over 2003 was management’s proactive collection effort on 3 commercial loans which included a $600,000.00 specific allocation to our reserve. Management continues to aggressively pursue full collection on these accounts as we work through the liquidation phase of these loans.
As can be seen by the slide our non performing loans (those more than 90 days past due plus non accruals) as a percent of total assets increased to .37 from .36 in 2003. This slight increase is primarily a consequence of the 3 distressed commercial loans currently in the process of being liquidated.
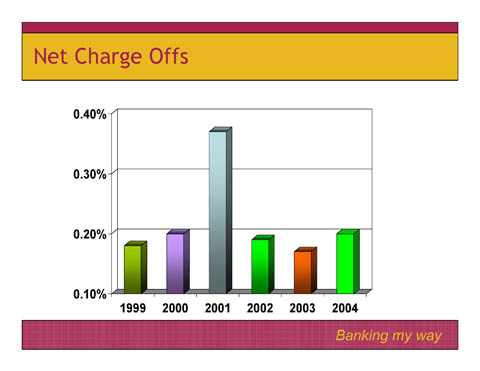
The next slide represents our net charge-offs to average loans. As you can see we also had a slight increase in this category from .17 basis points in 2003 to .20 basis points in 2004.
To help mitigate this trend management is proactively pursing collections on these problem loans and as we can continue to expect growth in this business line, management has elected to dedicate significant resources for analyzing, reviewing, and monitoring our commercial loans and appraisals to provide yet another safeguard to assure sound credit extension. As we look forward we see an abundance of growth opportunities for profitable sound loan growth, and we are excited about our prospects for opportunities for all loan products from our new Morgantown office.
As we expand our franchise we plan to continue our prudent lending practices and we will add resources when necessary to support this function. On behalf of our entire team thank you for your support.
Frederick A. Thayer, IV
Senior Vice President and
Director of Sales
Good afternoon ladies and gentlemen. I would like to take a few moments to review our 2004 performance in the branch network and to comment briefly on our plans for 2005.
In terms of deposit growth, 2004 was a disappointing year for the branches. We generated approximately $15.8MM in total new deposits in 2004, far short of what was necessary to fund our loan growth. While core deposits grew strongly, run-off in our Certificates of Deposit limited overall growth.
Despite this disappointment, we did have some very bright spots. Our referral performance to other lines of business within the company continued to be very strong. For example, we referred $32MM of new residential mortgages to our loan area. On the non-traditional products side, we referred $23.5MM in new business to our Trust department and $11.8MM in new investments to PrimeVest. All of these mean either new customers to our bank or deeper and broader relationships with existing customers.
Customer service is one of our points of difference relative to our competition. We test ourselves monthly through mystery shopping and through telephone surveys of actual customers to measure how we perform. In 2004, we achieved a yearlong, bank wide average score of 95%, up incrementally from the 93% level achieved in 2003.
Finally, in 2004 we chose to exit the Romney, WV market by closing or branch office. We were a distant third in deposit share in Romney, with the two largest competitors holding some 95% market share.
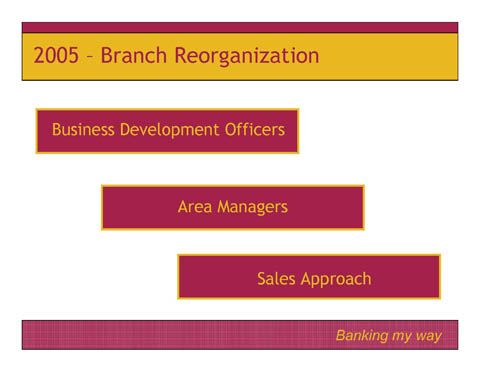
For 2005, we have reorganized our staff to better position ourselves to grow. A new function, the Business Development Officer was added in late 2004. We now have two individuals serving in this capacity. They are responsible for driving new clients into the Bank, whether it is for deposits, insurance, Trust or any other product offered by First United.
One position is based in Morgantown, WV and the other is based in Hagerstown, MD. As we proceed through 2005, we will look for individuals to serve in this capacity in Frederick, MD and Martinsburg, WV.
We also named three Area Managers in late 2004 to assist in oversight of the branch offices. These individuals will enable us to provide more oversight of branch activities, providing sales and operational support to branch managers.
Along with these changes, we have modified our sales approach to focus on higher opportunity prospects. We are accomplishing this by asking branch staff to contact clients to come to the Bank for a “financial review or check-up”. During this meeting, we work to understand the financial needs of the client and then offer the appropriate products and services based on those needs. The early indications are very encouraging based on the number and quality of appointments that have been held.
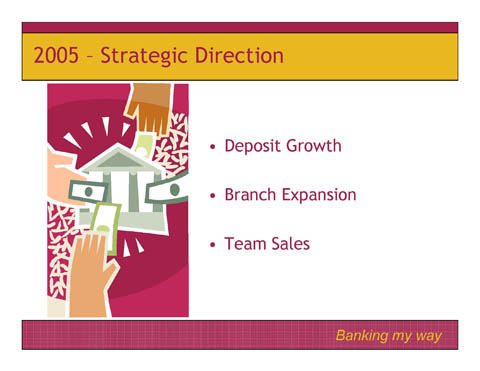
Our strategic direction in 2005 is three-fold: A focus on deposit growth, branch expansion and Team Sales.
Deposit growth is the single most important objective for the branch network in 2005. We hope to grow deposits by $65MM this year, which is no small task.
Branch expansion is an integral part of our growth plan. In February we opened our new Morgantown, WV regional hub office in Sabraton after operating from a temporary, mobile branch for 90 days. Efforts are underway to open our second office in Morgantown at Star City. We anticipate we will open a mobile facility there in the late third quarter while the permanent office is under construction. In addition to Morgantown, we are pursuing several sites in the Hagerstown, MD area and we continue to be interested in expanding in Frederick, MD.
Finally, team sales continue to be a priority for the branches. We want to build on the referral success we have had in the past few years to ensure that we broaden and deepen our customer relationships to the fullest extent possible.
2005 promises to be an exciting and challenging year for us. We believe we have the products and processes to meet these challenges. Thank you.
Val Teagarden
President and
Chief Executive Officer of
First United Insurance Group, LLC
Good afternoon,
The insurance division of First United continued to grow and evolve during 2004. The success of team work and the desire to increase our contribution to First United have been the driving goals throughout the past year.
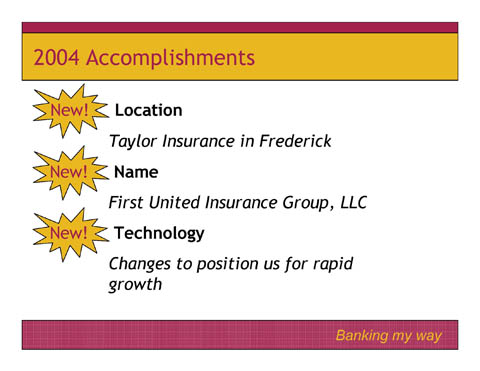
New Location:
First United has expanded its insurance operations into the Frederick County area. The insurance group acquired the book of business previously owned by Taylor Insurance. We hope that this will give us a customer base to build and deepen relationships throughout the coming years.
New Name:
As we move forward, the insurance division is operating under a new name. Although there is no guaranty, we hope that First United Insurance Group will be able to acquire additional agencies when opportunities arise and place them under one umbrella. This should allow us to expand our book of business and leverage our relationships with companies.
New Technology:
First United Insurance Group was busy in 2004 integrating new technology. The group has moved to an on-line agency management system. We hope that this new technology will position us for rapid growth and create a network environment.
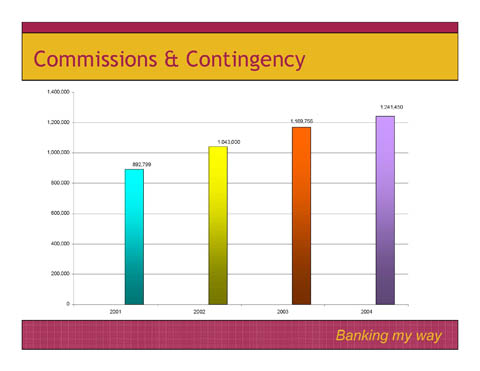
The growth of your insurance group is measured in several ways. Annual Revenue growth is one measurement. It is our goal that the divisions consistently produce core growth. During 2004, we were able to increase core revenue by 7%.
We also track the Annual Return on Revenue or ROR. This is referred to as the annual agency pre-tax income margin. During 2004, the division had an ROR of 17.67%.
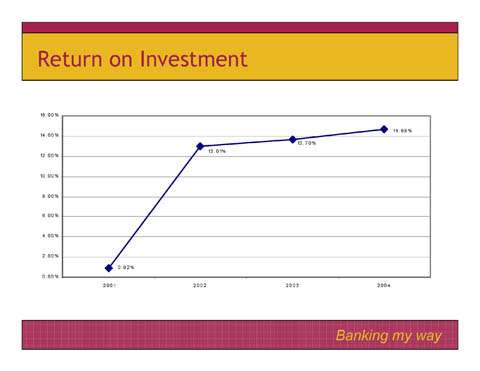
In addition to the previous measurements, we utilize Return on Investment or ROI. Over the past years, the ROI has increased to 14.68%. First United Insurance Group’s goal is continued ROI growth through a combination of increased revenue and expense control.
Thank you for allowing our team to grow your insurance business and we look forward to many successful years in the future.
Eugene D. Helbig, Jr.
Senior Vice President and
Senior Trust Officer
A very pleasant good afternoon.
I am proud to be here today representing First United’s Trust and Brokerage Departments. Let’s first take a look at our Trust Department.
As you can see from this first slide 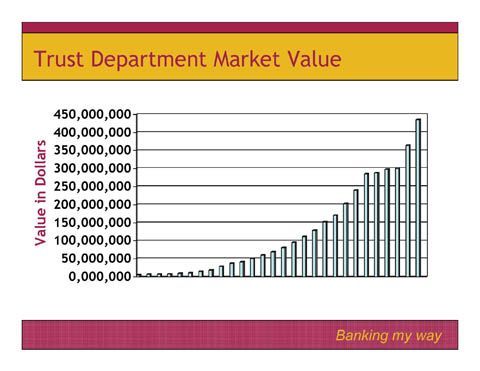 , the market value of the Trust Department grew to $435 million. This amounts to an increase of 19.5% over 2003 Market values. I am proud to report we now have nearly $100 million of assets under management in regions 4 and 5. These regions encompass Hagerstown, Frederick and Martinsburg areas.
 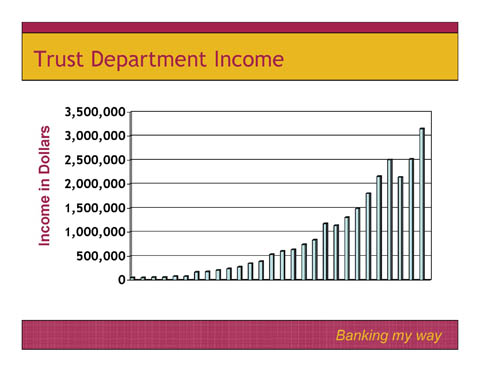 Fees generated by the Trust Department grew to $3.1 million, a 25.09% increase from 2003. This growth would not have been achieved without team effort.
This effort is evidenced by the number of New Revenue sales and contacts. In 2004 our team generated New Revenues of $903 thousand. Although $350 thousand of these fees are non-recurring, this was still a record year.
We continue to monitor the frequency of our customer contacts. This follow-up and retention program has been extremely successful. Proof of that success can be seen by these results from a recent customer survey.
This next slide 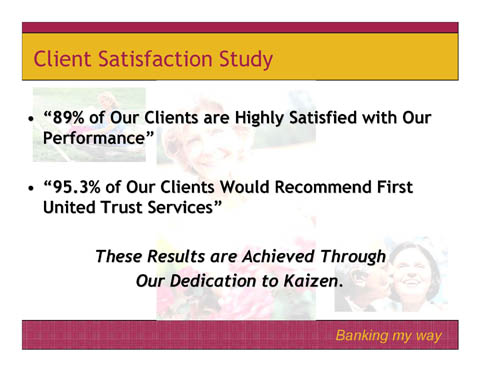 shows that, overall, 89% of our clients are highly satisfied with our performance. Similarly, 95.3% of our clients would recommend First United Trust Services. These results are not achieved by accident. We spend a great deal of time and energy on Kaizen or Continuous Improvement.
We are very proud of our Investment Team. This next slide  shows the returns of our Managed Asset Portfolios or MAP. This disciplined investment approach has consistently proven successful.
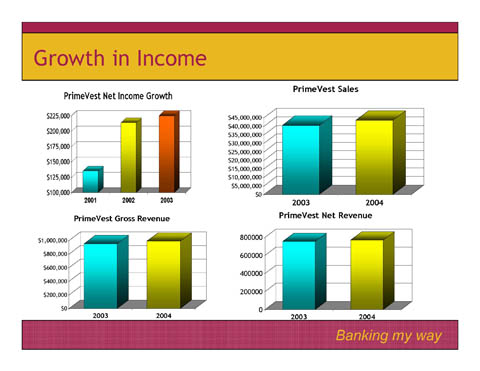
Prime Vest, our Brokerage division, continues to grow. Last year we sold $43 million of product including $8 million of fixed annuities. The year started off very strong until about August when the rates on annuities began to slide. Fortunately, the rates are starting to climb.
Both Gross and Net Revenue continue to grow as we approach gross revenues of $1 million. Net Revenue increased by 22%.
My last slide  illustrates the contribution that Trust and Prime Vest make to the income of the Corporation. Again, a healthy increase to that of 2003.
In closing, I want to acknowledge First United’s Trust and Brokerage Staff. Our focus and our strengths are in solving financial problems, very minor and very major ones. If you have a problem or just a question, I urge you to seek out our Trust and Brokerage Associates as we are eager and willing to help!
Thanks very much!
Philip D. Frantz
Senior Vice President and
Director of Operations and Support
Good afternoon fellow shareholders:
As my fellow associates have discussed, 2004 has been a year of growth and regulatory challenges. Our job in Operations and Support is to facilitate and support this growth.
First United Corporation is like a home. The foundation must be solid and well maintained to support the additions. Any contractor will tell you that a crack in a foundation would result in an unstable building.
Various changes were made to the corporate foundation in 2004 in recognition of our need to firm up the foundation. We implemented a new Wide Area Network telecommunication design. This conversion to Qwest for our data networks took most of last year. However, it has provided higher speed bandwidth to the branches that need it. It also has given us the flexibility to quickly adjust to the changing environments in our branch network. Should a Trust Officer, Insurance Agent, or other non-retail associate be assigned to a smaller speed branch, we can quickly adjust the line speed to accommodate the new requirements.
The Sarbanes-Oxley legislation last year placed additional burden on the foundation of First United. The documentation and procedural reviews required to comply with this law required considerable time from Operations and has resulted in increased administrative functions.
As we moved westward to Morgantown, West Virginia, our Support Services and Technology area dealt with contractors, municipality challenges, and telecommunication issues. We placed a Mobile Banking unit at the site while the branch was being completed to facilitate an earlier opening date. The new branch is now fully operational, and I hope you get a chance to stop and see your newest community office. It is a beautiful and highly visible facility.
For 2005, we plan to review and firm up our technology foundations to prepare for new systems on the horizon. We also plan on supporting the corporate growth by beginning construction on a new branch and supporting our other retail initiatives.
As always, it is our job to make sure that foundation of the First United Corporation building is solid, well structured, and able to handle the growth, changes, and challenges ahead.
Thank you.
Jeannette R. Fitzwater
Senior Vice President and
Director of Human Resources
We all realize that selling financial services is an ever increasing competition. Our primary point of difference is truly the people behind the product. For the next few moments I plan to focus on three aspects of our “people” successes.

It all starts when you first recruit your staff. Just recently we had a fabulous learning experience with the recruitment of our Morgantown professionals. As we have with our banking services, we have identified our “niche” in recruiting experienced associates. The majority of our new Morgantown associates came to us from much larger organizations. They told us that they were frustrated that they could no longer serve their customers in unique ways. There was no sense of teamwork. Decisions were made in large metropolitan areas, where they struggled to understand or respond to their local needs. They felt as if they were no longer able to use the entrepreneurial spirit that had once enhanced their careers.These competent specialists had simply gotten lost in the shuffle.
To see these same associates at work today is very gratifying. They tell us, as do some of their spouses that they now enjoy coming to work each day. They are having “fun.” Together as a team they are building relationships, feeling appreciated, and are excited about being enabled to serve their customers.
So what havewe learned? We have learned that our “t’weener” size—not a start up bank but not one of the big guys—offers a ideal atmosphere for associates who care about serving their customers, take pride in their work, and enjoy working in an entrepreneurial team atmosphere. Now we too have something to sell to prospective customers or associates in this case. We are currently taking this same strategy to some of our other newer market areas.
Our Management team members are not the only ones learning in our company. 
Our second component of success is our customized training program. It includes new hire orientation, certification programs for our branch and call center staff, compliance training, classroom training and a host of other training opportunities. In a learning organization we are always searching for ways to gain greater knowledge.
Greater knowledge can help our associates to move forward in their careers. This year, at our associates’ suggestion, we introduced a formalized job shadowing program, whereby our team members may spend a day or two observing someone doing a job that they may wish to have someday. This third area of success has opened the eyes of several participants. Best of all, it helps put their First United career path in the proper set of hands—their own. It is a perfect example of employee enablement.
Like proud parents, we sometimes brag about our successes. We are pleased with the three successes I have highlighted: Developing more effective recruitment strategies, building on a learning culture, and enhancing career paths. However, most of all, we are proud of each and every one of our First United associates. 
They live our vision each day, of providing an uncommon commitment to service and solutions. Please take a moment this afternoon to meet some of our associates who are with us today. (  I’m sure you’ll agree that they truly are our point of difference.
Robin E. Murray
Senior Vice President and
Director of Marketing
Good afternoon, at this time, I am pleased to share with you our vital marketing strategies for your Company, as well as to review the success of our Customer Service Center.
Our recent marketing initiatives continue to foster personal relationships with our customers and remain dedicated to our team concept. Your Company’s marketing tactics are focused on our customer-centric strategy.
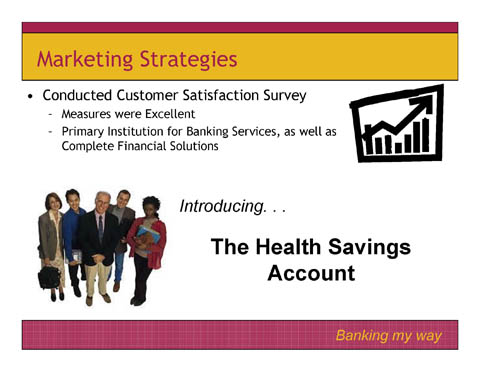
An excellent measurement of our progress in our client relationship and customer-focused initiatives is the strong level of customer satisfaction, as evident in our recent customer survey conducted by an outside, independent firm. Our customer satisfaction measures were excellent, well above industry standards, and our ratings continue to climb with customers naming us as their primary institution for banking services, as well as satisfaction in providing complete financial solutions with our team of specialists.
It’s important for your Company to stay on top of the industry and identify specific products that further enhance our relationship building tactics. This year, the Marketing team developed and introduced a new product, The Health Savings Account. We believe that this product is an ideal product and hope that it will fill specific niches within all our markets and integrate with our Insurance Agency. This type of account should also assist us in our efforts to generate future deposit growth.
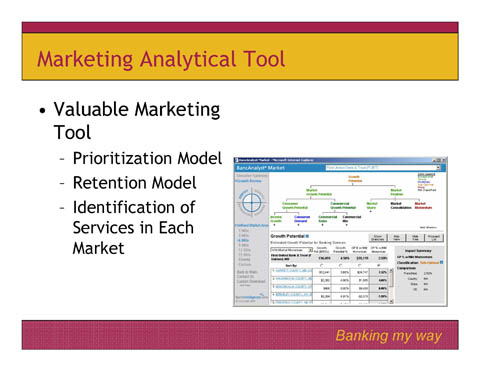
Our marketing analytical tool, BancIntelligence continues to be a valuable instrument for our marketing team. This tool has assisted us in building models, such as our market prioritization model, and most recently, our retention model, so that we can better allocate our resources, to maximize our return on investment. BancIntelligence also enables us to identify specific product and service penetration within each of our markets we serve.
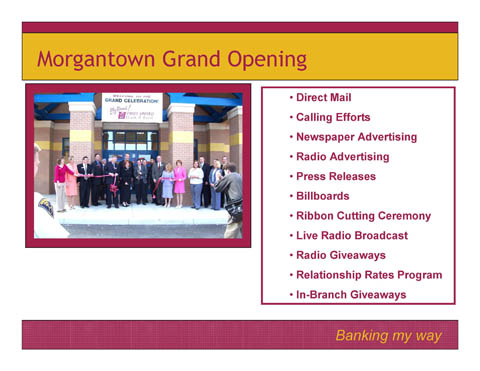
We have just completed our Grand Opening marketing initiatives for our entry into Morgantown. The Morgantown team, in conjunction with the marketing department, created an extremely successful kick-off to facilitate this experienced staff in engaging the customer one-on-one and providing the financial solutions that prospective customers need and want most in that market. Our goal is to build customer relationships by providing personalized service and we believe that our team concept will continue to be our competitive advantage.
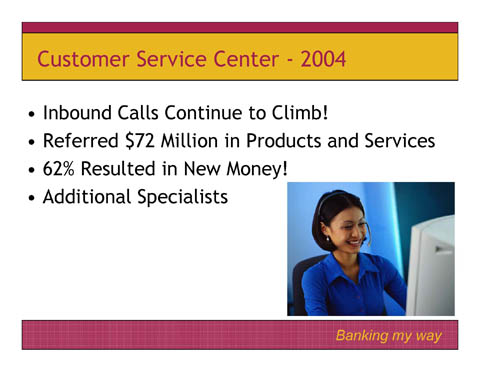
Our Call Center continues to be an exceptionally valuable delivery channel for our customers and your Company. Each year, the number of inbound and outbound calls continues to climb. This team referred over $71 million dollars in sales, with 62 % resulting in new money to the bank, across all lines of business. We believe that these results were driven by our team of experienced staff, as well as our specialists within the call center. We currently have an IRA specialist, a mortgage specialist, a licensed banker that can sell Annuity products and our newest specialist for the Health Savings Account product. Our Call Center specialists offer greater availability and convenience for our customers.
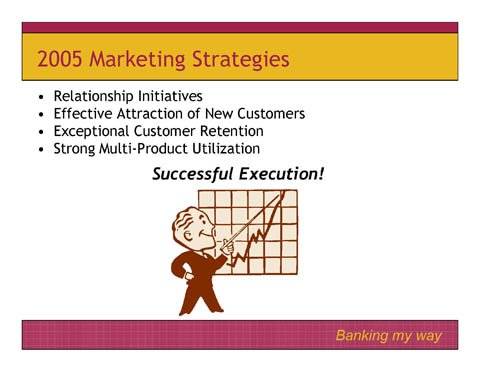
In conclusion, we are excited about the many opportunities that will be presented to us this year through our franchise expansion and our growth markets. Our marketing strategies in 2005 will be focused on our relationship initiatives, effective attraction of new customers, exceptional customer retention and strong multi-product utilization. We will tailor these initiatives around expanding revenue opportunities for a well-defined and targeted customer base. We anticipate that successful execution of these strategies will continue to enhance shareholder value and position us for greater success in years ahead. Thank you.
William B. Grant
Chief Executive Officer
As Bob mentioned during his remarks, our earnings slipped substantially last year, due, in large part to some strategic repositioning. As in the past, we want to share with you our comparative performance with the universe of small cap banks throughout the Country. By small cap, I imply those with total market capitalization of 500 million or less. Our market capitalization at year-end was 122 million.
On the universe of small cap banks we were ----
| | ROE | 275 | of | 441 |
| | EFF | 373 | of | 441 |
| | NPA | 175 | of | 441 |
Overall 317 out of 441 29%
It goes without saying that we expect significant improvement in these numbers for 2005. As we planned for this year, and into the future, we benchmarked ourselves from the strength of position we had in 2003. Under current regulations, I can not lay out for you all of our projections for this year, but our plan is to grow earnings strongly from those 2003 levels.
Behind the numbers, it is important for you to know who is working for you on your Board of Directors. I know that Meeting Chairman, Bob Rudy, will introduce all of them in a few moments, but I would like to recognize a few of them for you - ----
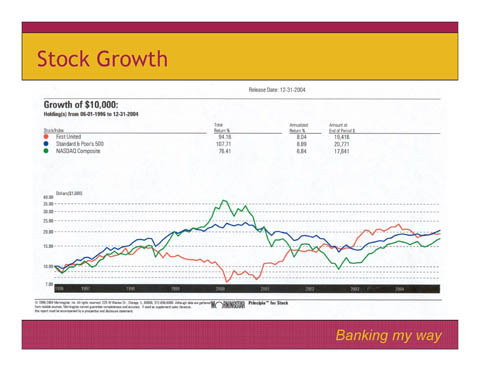
In closing, I would like to say something about our stock performance. One of the things I like to do is to go out on the internet and see what investors are saying about us. Well, as you might imagine, it is not always flattering. One of my favorite comments was “Watching our stock was like watching paint dry”. Well, we decided to do a little bit of research on this. I asked our trust investment officers to go back to June 1996 - the beginning of our watch - and see what kind of total return we have provided to you, our shareholders. Well, the news was pretty good. Over that period of time - just over 8 l/2 years - you have had a total annualized return of 8.04%. This combines both the dividend and capital appreciation. This is better than the NASDAQ composite of 6.84%, and close to the S&P 500 of 8.89%. So, I agree with that investor. First United has not historically been a super-exciting stock. It has, however, provided good and steady returns to investors with long term goals.
The steadiness and long term performance of your Company would never be possible without the dedicated team which serves you. You are most immediately served by a Board that understands the complex business of financial services and executes their fiduciary duty to you, our investors. They are supported by a team of dedicated associates who understand fully the importance of our Mission Statement, and work hard every day to build value for your investment. We thank you for your support, and look forward to serving you in the years to come.
Thank You!