Good afternoon fellow shareholders and special guests, and welcome to your 2006 Shareholders’ Meeting. As I noted in my letter to you, we are back. I am pleased to report to you that the state of your Company is strong. The strategic moves made in 2004 have, as expected, propelled the earnings of First United to new heights. Over the next half hour or so, your management team will review our progress in 2005, and how we believe it positions us for future success. Before getting on with the story, I want to recognize this year’s meeting Chairman, Fred Thayer. Fred has had a long and distinguished relationship with First United Bank going back to its day when it was the First National Bank of Oakland. After several years of dedicated service, during which the bank grew from a very small one-town bank to a regional presence in Garrett County, he stepped down from the Board in order to become Circuit Court Judge. Following several years as a distinguished jurist, he retired about ten years ago. It is incredible to note that during his tenure on the bench, none of his decisions were ever overturned on appeal. Fred was again elected to the Board following his retirement, and since that time we have benefited tremendously from his wisdom and guidance. After today, Fred retires again, and I would ask you to join me in wishing him all the best.
Moving on with our Agenda, I would like to call on Bob Kurtz, President of the Company and Chief Risk Officer. This is a new role for Bob, which he will explain further, and reflects both the times we live in, and your Company’s commitment to properly manage the multitude of risks, which we face in a manner that protects your investment.
Before Bob takes the stage, however, I call your attention to the fact that our reports contain forward-looking statements. Forward-looking statements do not represent historical facts, but statements about our beliefs about and intentions for the future. These statements are evidenced by terms such as “anticipate,” “estimate,” “should,” “expect,” “believe,” “intend,” and similar expressions. While these statements reflect the Company's good faith beliefs, expectations, estimates and projections about, among other things, the industry and the markets in which the Company operates, they are not guarantees of future performance and they may not prove true. These projections involve risk and uncertainties that could cause actual results to differ materially. For a discussion of these risks and uncertainties, see the Risk Factors contained in Item 1A of Part I of the Company’s 2005 Annual Report on Form 10-K that was distributed to you with your proxy statement.
Bob …….
BOB KURTZ
Slide #3: Bob Kurtz
Good Afternoon,
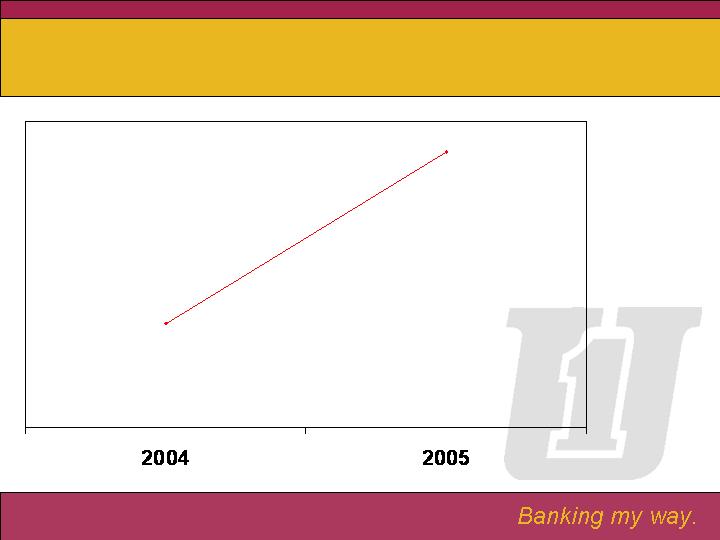
Slide #4: Net Income
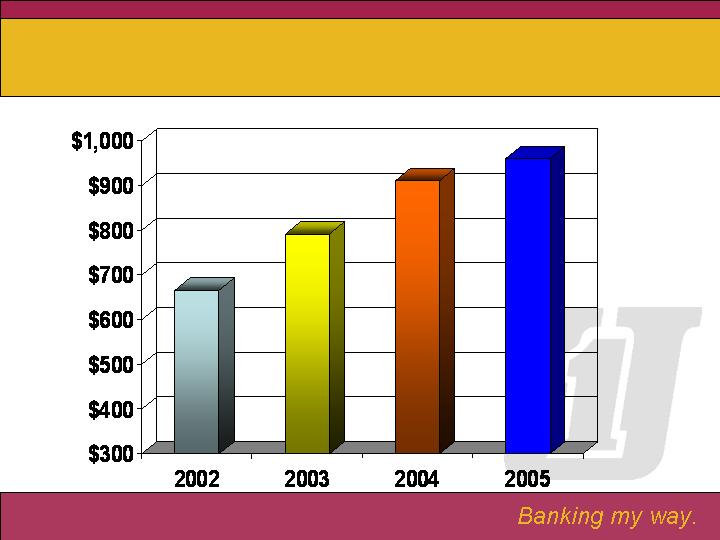
As Bill stated in his opening remarks, net income for 2005 was $12.2 million, an increase of $4.5 million or 59% over 2004. In 2004, management of your Company implemented a number of strategic initiatives intended to position the Company for future growth and performance. Although these decisions caused the Company to experience some one-time expenses and led to downturn in financial performance in 2004, they proved to be the right decisions for strong financial performance in 2005.
-1-
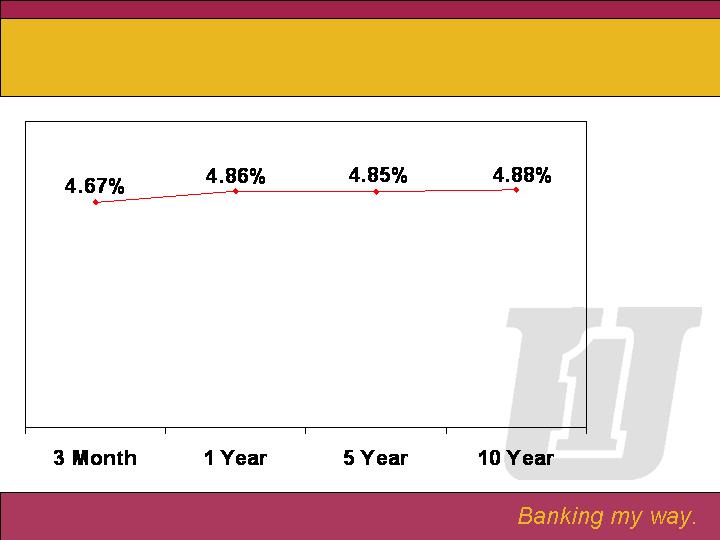
Slide #5: Treasury Rates
The interest rate environment continues to be a challenge for not only First United, but the financial industry as a whole. Throughout 2005, and thus far in 2006, the industry has experienced a continued upward movement in short term interest rates. These rates have increase 15 times since 2003, from a low of 1% to the current rate of 4.75%. Banking strategies and the pricing of assets and liabilities work fairly efficiently with a change in interest rates, if we experience the movement of rates both on the short term as well as the long term. Challenges arise when one end of the interest rate curve moves and the other does not, such as what we are experiencing at this time. Over the past fifteen months, short term interest rates, rates that affect the pricing of our deposits, have increased dramatically, but long term rates, rates that affect adjustable and fixed rate residential and commercial real estate loans, have shown very little movement. The upward movement at the short end, with literally no movement at the long end of the interest rate curve, causes a flattening in the yield curve, which causes a compression in the net interest margin, the difference between what we earn on our investments and what we pay out to our depositors. Carissa Rodeheaver will address the results of this compression, as she reviews the income and balance sheet performance for 2005.
Slide #6: Sarbanes-Oxley Act of 2002
For those of you who routinely read the financial periodicals, you may be familiar with the Sarbanes-Oxley Act of 2002, which came about following the collapse of Enron, WorldCom and others, due to inaccurate and fraudulent financial reporting. Section 404 of that law requires all but the smallest public companies, including First United Corporation, to document and evaluate the effectiveness of internal controls and procedures for financial reporting. These words may not mean a lot to you, but I can assure you that it took tremendous organization, effort and resources on the part of each public company—and First United is no exception—to comply with these requirements. I am pleased to report that First United did not have any reportable deficiencies in 2005 or 2004, the first two years that these requirements were in place. Even though your Company is what I would call a very clean company and is managed by very capable and knowledgeable associates, compliance was a major accomplishment.
Slide #7: Bank Secrecy Act
For many years, financial institutions have been charged with responsibilities under the Bank Secrecy Act, to monitor and report suspicious activities dealing with money laundering and drug trafficking. In October 2001, following 9/11, the USA Patriot Act was passed by Congress. This act added a further burden to the financial industry, where we are now required to have procedures and policies in place that monitor terrorist activities and the flow of money for those activities. Compliance with these regulations takes a tremendous amount of commitment, both in monetary and staffing resources. Since your Board of Directors and Management take these responsibilities very seriously, I can report that First United has been recognized by the regulators as having a very strong and effective program of complying with these regulations.
Slide #8: Enterprise Risk Management
What was once just for the “big” banks, the appointment of “risk officers” and the adoption of “enterprise risk management” programs to oversee the many risks that present themselves in today’s environment, we now find that these programs are working their way down to the larger community banks. Historically, we have always looked at credit and market risks, but as banks have become more complex, along with more threats from the outside, “operational” risk has become critical. Identifying those “operational” risks and putting in place monitoring systems to reduce that risk has become a real challenge for companies today. Operational risks can take the form of internal and external fraud, damage to physical premises, business disruption and system failures, and workplace safety issues for associates and customers, just to name a few. Where credit and market risk generally involved a smaller part of the organization, operational risk is spread across the entire organization. Throughout this year, we will be involved in formalizing and enhancing procedures and programs to mitigate or eliminate the many risks that may adversely impact your Company. This program will continue to evolve and strengthen as risks and their respective level of impact to the Organization are identified.
Thank you.
-2-
CARISSA RODEHEAVER
Slide 9: Carissa Rodeheaver
Good Afternoon!
I am very pleased to be here this afternoon to report on yet another banner year for First United Corporation. Our company continues to be very focused on transitioning from a good company to a great company. How do we become great? We just keep getting better. We have focused on getting better in providing high quality customer service, in attracting and retaining the best employees and through our financial performance. Today, I would like to share with you some of the financial areas where we have gotten better as well as areas where we will continue to concentrate in the future.
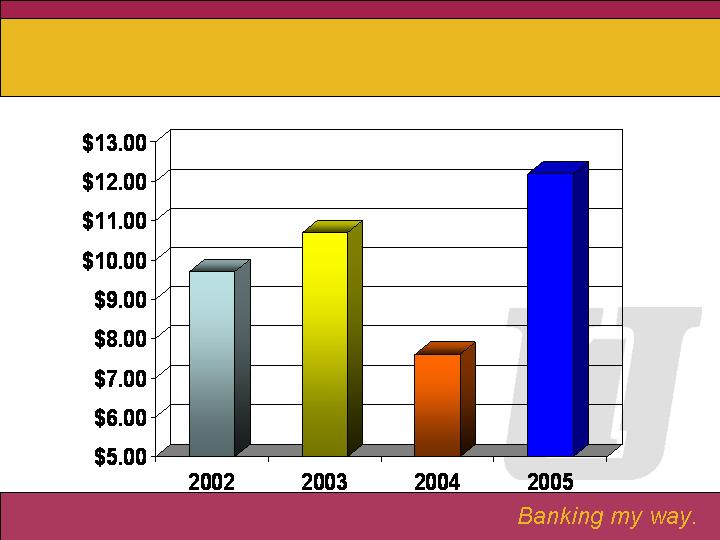
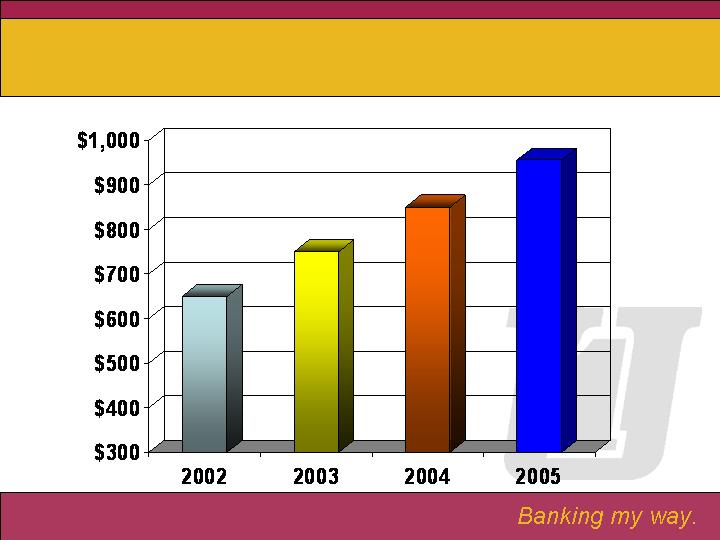
Slide 10:Net Income
Let’s begin with Net Income. As the saying goes, “no pain, no gain” and during 2004, we took this saying to heart. Several strategies were implemented to better position our company for the future. As you will note on this slide, our strategy paid off and we did get better. Net income for 2005 was $12.2 million, an increase of $4.5 million over 2004. As you can see from the chart, we are right back on target, showing steady growth over prior years. We continued to focus on better asset-liability management and as a result, implemented several balance sheet restructuring strategies to improve our 2005 position as well as to better position us for financial strength in the future. I will cover several of these strategies in my presentation today, but I encourage you to read Management’s Discussion and Analysis of Financial Condition and Results of Operation that is contained in the Company’s 2005 Annual Report on Form 10-K.
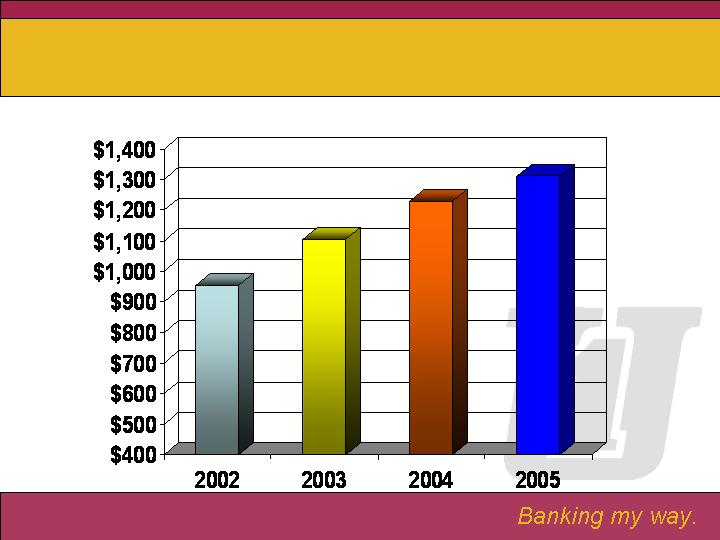
Slide 11:Asset Growth
Our total assets reached $1.3 billion at December 31, 2005, representing an increase of $77 million, or 6.2%. Our investment portfolio grew $19 million while our loan portfolio grew $51 million.
Slide 12:Loan Growth
Total loan growth during 2005 totaled $82 million. However, this growth was offset by a $31 million mortgage loan sale in December 2005. We believe that this sale better positioned our adjustable rate mortgage portfolio. The proceeds were invested primarily in municipal bonds, giving us what we hope will produce a better tax equivalent yield on our investment portfolio. Steve Lantz will provide more detail on the loan portfolio in his presentation.
Slide 13: Deposit Growth
During 2005, we also improved at gathering retail deposits. Total deposits increased $105 million, or 12%, when compared to 2004. Approximately 80% of this growth came in the form of retail deposits as we continued to grow and deepen our customer relationships.
Slide 14: Net Interest Income
Net interest income is our largest source of operating revenue. It is the difference between the interest we earn on loans and investments and the interest that we pay for deposits and other borrowings. As Bob indicated earlier, this has been a challenging environment for financial institutions as short-term interest rates have continued to rise and long-term rates have remained relatively level. The result is a flat to inverted yield curve. Total net interest income for 2005 was $40.3 million, an increase of $3.6 million over the prior year. During the year, our treasury team implemented better pricing strategies for both loans and deposits, better matching between durations of assets and liabilities, and a prepayment of long-term debt. In addition, as mentioned earlier, the loan sale allowed us to increase our interest income by achieving a higher yield on our investment portfolio.
-3-
Slide 15: Net Interest Margin
All of these strategies, coupled with less reliance on wholesale funding, led to an increase in our net interest margin from 3.43% to 3.49% in 2005. This increase happened despite the pressure caused by the flat yield curve. This happened during a year when many financial institutions saw compression in their margins.
Slide 16:Non-Interest Income
As indicated on this chart, other operating income has continued to increase steadily during the past several years. 2005 showed a $1.1 million increase over the prior year, as we got better at charging and collecting service charges and growing our trust and insurance income. In addition, our company recognized an $860,000 gain on the prepayment of long-term borrowings.
Slide 17: Non-Interest Expense
Other operating expense for 2005 declined $1.3 million, or 3.7% from 2004. The primary reason for the decline was the decrease in the one-time charges related to the early redemption of long-term borrowings. In addition, we experienced reduced professional fees and our new purchasing department created better opportunities for cost savings and contract negotiations. The decreases were offset by an increase in salaries and benefits to support our growth objectives and increases in performance based pay.
The following ratios are monitored by our Company’s management team as well as by the investment community as a measure of financial performance. They are all dependent upon the profits of our Company. Our increase in net income over prior years has resulted in better performance in all ratios.
Slide 18: Return on Average Equity
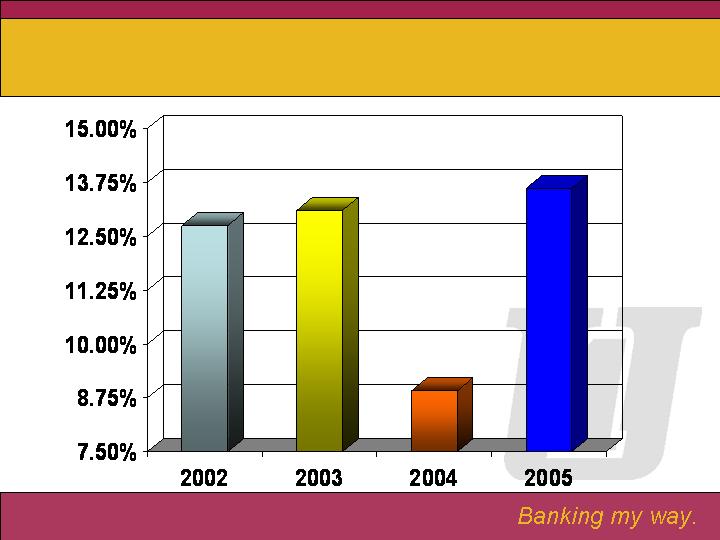
The return on average equity, or ROE, compares the profit earned by the Company to the total amount of shareholders’ equity found on the balance sheet. 2005 shows an increase in this ratio from 8.91% in 2004 to 13.61%.
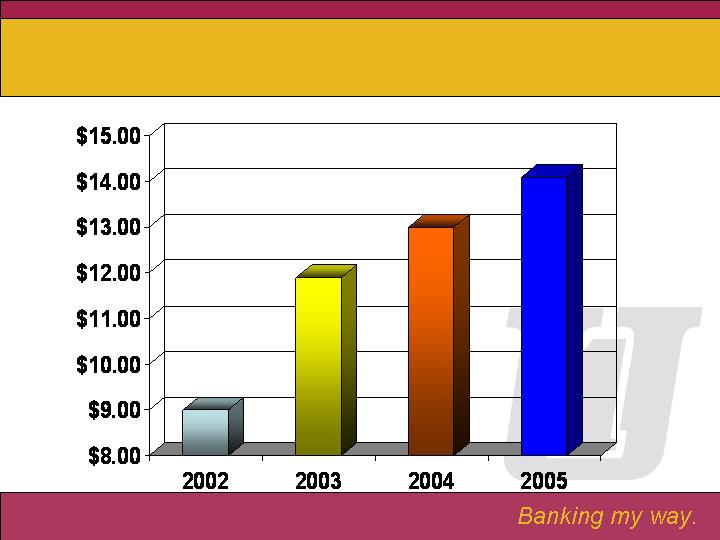
Slide 19: Earnings per Share
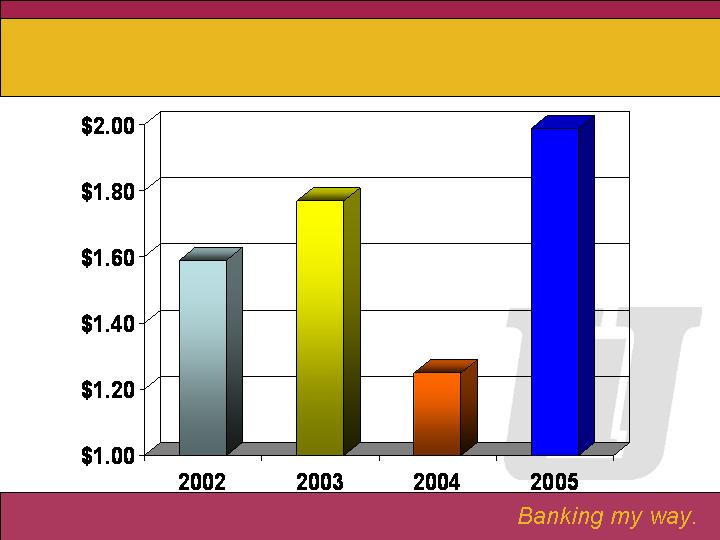
As I discussed earlier, many strategies were implemented during 2004 to set the stage for better performance in future years. As this chart demonstrates, your company is right back on target as earnings per share increased to $1.99 from $1.25 in 2004 and $1.77 in 2003. This is an average annual growth rate of 6.2% from 2003 to 2005.
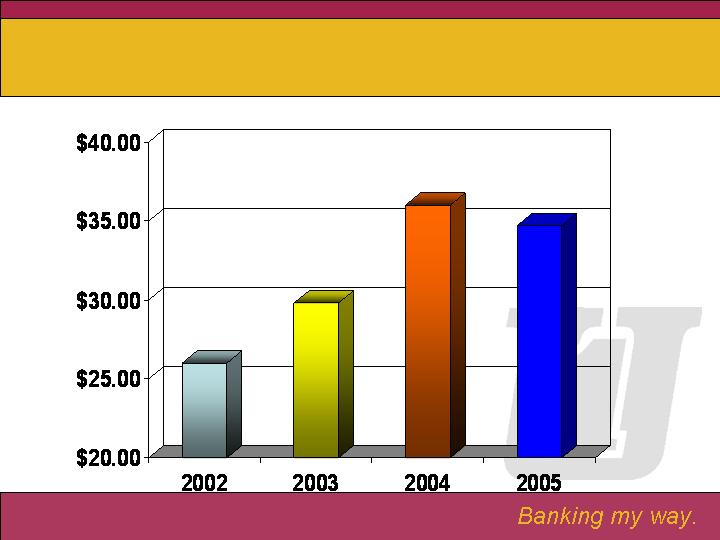
Slide 20: Efficiency Ratio
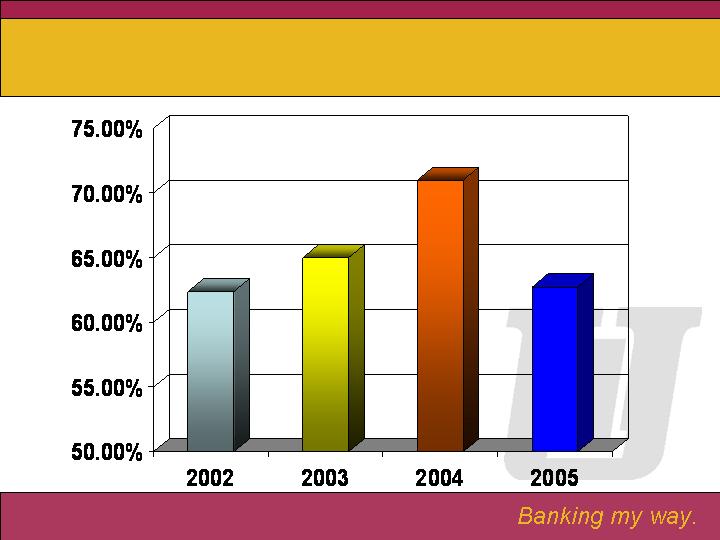
The final ratio we will review is the efficiency ratio, which represents how efficiently the company manages its overhead expenses. In this case, a lower number indicates better performance. We saw our efficiency ratio decrease to 62.73% in 2005. Better cost control, the increase in net interest margin and the successful implementation of asset-liability strategies over the past few years have helped to drive this ratio down.
-4-
Slide 21: 2006?
How do we move from good to great? We just keep getting better. In 2006, we intend to continue our focus on better pricing of loans and deposits, a better mix between core, low-cost deposits and higher cost certificates of deposit, better tax planning and better control of our overhead expenses. We are excited with the results of our strategic efforts through the end of 2005 and intend to work very hard to continue laying the groundwork for a strong financial future. How do we move from good to great? We just keep getting better!
Thank you!
STEVE LANTZ
Slide 22: Steve Lantz
Welcome—Loan activity was focused last year on our commercial and residential customers which remains consistent with management’s objectives over the past couple years. Our total loan growth in 2005 was $51 million, or 5% over 2004. Last year, we focused on increasing our net interest margin which leads to slower loan growth in some market areas.
Slide 23: Commercial Loan Growth
Commercial loans increased $31 million in 2005, an 8% increase over 2004. As can be seen by the graph, our growth trend in this division continues to be a very important revenue engine for the company. Although high levels of repayments and intense competition stifled our double digit growth compared to prior years, we continue to believe that building relationships with business customers is a great market for us that will continue for the foreseeable future.
Slide 24: Other Loan Engines
The residential loans increased $19 million in 2005, a 6% increase over 2004. This follows a 20% increase in 2004 over 2003. This slower growth trend does not necessarily indicate much lower originations or faster payoffs. Most of the shortfall over growth in 2004 was based on a loan sale strategy. As Carissa mentioned, we sold $31 million in mortgage loans in the 4th quarter of 2005 as a strategy to improve our yields and margin. These loans had characteristics that we believed would limit opportunities for improved yield over the next few years. Without this sale of loans, we believe that the environment for year-to-year growth would have been less favorable.
Consumer installment loans in 2005 decreased by $6.6 million. This decrease reflects management’s continued shift toward more commercial loans with less emphasis on the highly competitive consumer loan market. Specifically, less focus was placed on growing the indirect auto finance business. We continue to value our current dealer relationships but growth in this sector has not been our priority. We also continue to try our best to increase our presence in the home equity market. Although modest growth occurred in this sector, many of these loans were paid off in full because of high short term interest rates when compared with longer residential loan rates. In other words many borrowers combined their home equity loans and 1st mortgage loans into one loan and one payment in 2005.
On the topic of credit quality, a tremendous improvement has been made in our loan portfolio over 2004. As I spoke with you last year, I indicated that our charge-offs were higher than expected primarily due to commercial problem loans. We are still aggressively pursuing full collection on these accounts. Actually, some of these accounts have been brought current through the efforts of our associates and are paying as agreed. As of the end of 2005, our consumer delinquency on residential and personal loans is the lowest I have seen since I joined the bank in 1987.
-5-
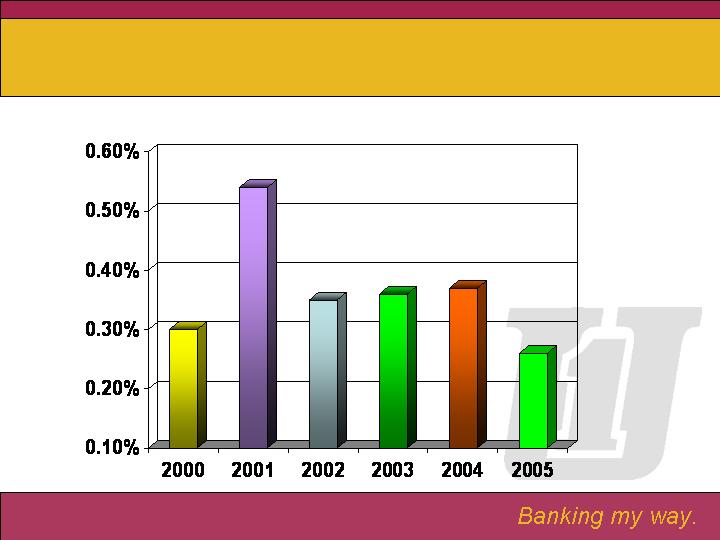
Slide 25: Non-Performing Loans
As can be seen by the slide, our non-performing loans (those more than 90 days past due plus non-accruing loans) as a percent of total assets decreased to .26 in 2005 from .37 in 2004. As you can see, this ratio is better than the last six years we have graphed which indicates the Bank has far fewer problem loan accounts than in prior years. This is a very good thing for our shareholders and our associates.
-6-
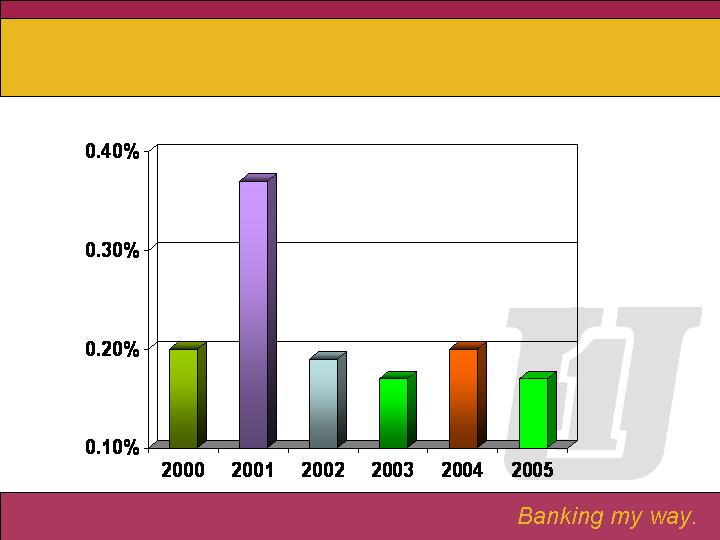
Slide 26: Net Charge-Offs
The next slide represents our net charge-offs to average loans. As you can see, the favorable trend continued in 2005. Our net charge-offs were .17% in 2005, which decreased from .20 in 2004. Comparing the last six years, net charge-offs in 2005 tied 2003 as the lowest ratio we have experienced. Again, we believe this reflects the wonderful performance of our lending division associates.
As we look forward, we intend to continue the pursuit of profitable and sound loan growth. I anticipate that our main driver of growth will continue to be our commercial loan area and that secondary market fees generated in our residential area will become more important than traditional portfolio growth. We believe that consumer loans will continue to be a significant source of loan originations, but our expectation is that this area will not grow at the same pace as that expected for our commercial business. Consistent with 2005, we will strive to do our best to increase our margin which may temper some growth opportunities, but profitability is paramount for us when pricing loan rates. On behalf of our entire team, thank you for your support.
RICK THAYER
Slide 27: Rick Thayer
Good afternoon. It is my pleasure to discuss with you the performance of our branch offices during 2005.
Slide 28: 2005 Performance
2005 represented a sharp turnaround in our primary line of business - deposit generation. With a goal of growing deposits by $65,000,000 in 2005, we had a huge task ahead of us, especially considering the disappointing results we had in 2004. I am happy to report that our associates in the branches took this goal as a challenge and by year-end had delivered $74,394,000 in new deposits to the Bank.
This growth came from several factors in addition to the hard work of the Retail Team. Through the Treasury Team, we were able to offer several product specials that not only were very attractive in the market, but that improved our net interest margin. Through the work of Team Sales, our internal business partners provided valuable referrals that resulted in significant deposit sales. All three areas combined to produce a very good outcome.
Despite the sharp focus on deposit growth, the Retail Team continued to deliver strong referrals to our partners in Residential Mortgages, Trust and PrimeVest. In 2005, retail referrals to these areas generated $29,474,000 in new residential mortgage loans, $13,342,000 in new Trust assets, and $8,799,000 in new PrimeVest investments. We believe that one of our points of difference from the competition is our emphasis on teamwork, and I believe our results bear this out.
Slide 29: Branch Expansion
In 2005, we continued with our branch expansion plans opening our Morgantown, West Virginia hub office in Sabraton, opening a second Morgantown office in temporary quarters in Star City, and signing a land lease for our second office in Hagerstown, Maryland. The Sabraton office posted the best start ever for a branch, growing deposits by $8,785,000 and loans by $1,157,000 in 2005. The Star City temporary office, which opened in September, gathered $540,000 in deposits in 2005. Our site in Hagerstown is located on Wesel Boulevard in from of the Martin’s Supermarket. This is a high traffic site with excellent access and visibility.
Slide 30: Processes & Products
Last year I spoke with you about two organizational changes that we made in the branch system: the addition of Business Development Offices and the use of Area Managers. After a year’s worth of experience, both changes proved positive in 2005. With our Area Managers, we have been able to provide timely coaching and feedback to our branch staff on their business development and customer service performance. These individuals work closely with a small group of branch managers to ensure that our sales and service efforts deliver the best outcomes possible for the Bank and for our clients. By doing a better job of uncovering and understanding the financial needs of our customers, we can do a better job of delivering the right products and services. This effort is a process, not an event. And, while we have made good progress in the past year, we must continue to improve in this critical skill area.
-7-
The use of Business Development Officers, or BDOs, in our growth markets was designed to drive more new customers into the Bank. Our experience in Morgantown certainly validated our expectation. The Morgantown BDO generated successful deposit referrals of $7,900,000, successful loan referrals of $7,700,000 and successful Trust and PrimeVest referrals of $586,000 in 2005.
Finally, we revised and expanded our small business product line in 2005 in anticipation of future demands. To that end, we developed a free checking product for small businesses, enhanced our cash management product line, entered into a merchant services arrangement with First Data, and introduced Business Custom Capital, an unsecured line of credit for the small business customer. All of these improvements are designed to make First United more attractive to the small business, and the small business owner.
Thank you very much.
VAL TEAGARDEN
Slide 31: Val Teagarden
First United Insurance Group:
Good afternoon,
The First United insurance group continued to grow and evolve during 2005. The insurance market has started to transition from a hard market to a soft market during 2005. This means that companies are more willing to look at various classes of risk and that some companies have taken rate decreases on certain types of risk. Through this market shift, we still were able to meet our growth goals without decreasing our profit margin.
Slide 32: 2005 Strategic Initiatives
Additional Resources:
During 2005, we increased our resources in Washington and Frederick Counties of Maryland. We hope that by positioning additional producers and support staff in this area going forward, we will see an increase in our revenue growth.
Potential Growth Opportunities:
We also continue to research opportunities to expand the insurance business throughout the Bank’s various market areas. Specifically, we are constantly on the look-out for profitable agencies that may be interested in a strategic alliance with the insurance group.
Slide 33: Commissions and Contingency
The growth of the insurance group is measured in several ways. Annual revenue growth is one measure. It is our goal that the insurance group will continue to increase its production growth. During 2005, we were able to increase revenue by 24%. This included 9% core growth and 15% acquisition growth.
-8-
Slide 34: Return on Revenues
We also track the margin between revenue and expense. This is referred to as the annual Return on Revenues, or ROR. During 2005, the division had an ROR of 14%. As illustrated in the graph, our ROR was achieved while monitoring the expense associated with growth.
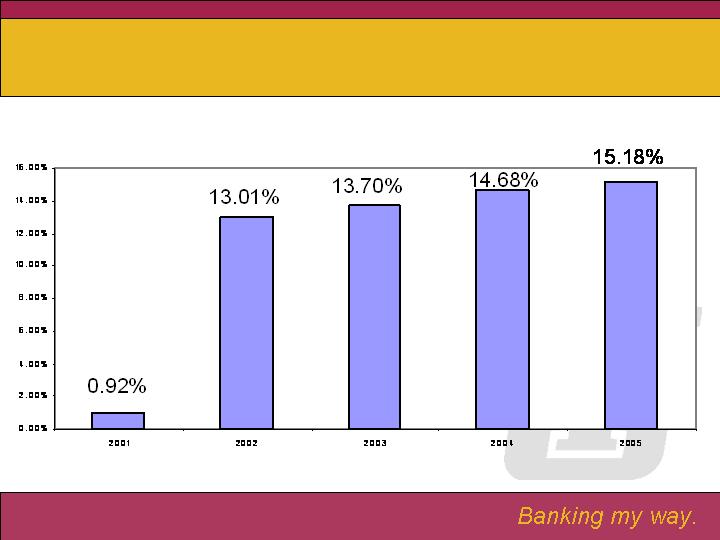
Slide 35: Return on Investment
In addition to the previous measurements, we utilize Return on Investment or ROI. Over the past five years, the ROI has increased from 0.92% in 2001 to 15.18% in 2005. First United Insurance Group’s goal is continued ROI growth through a combination of increased revenue and expense control.
Thank you for allowing our team to grow your insurance business and we look forward to many successful years in the future.
GENE HELBIG
Slide 36: Gene Helbig
A very pleasant good afternoon. As in past years, I am here to discuss with you a few financial results from 2005 for the Trust and Brokerage Departments.
Slide 37: Trust Department Market Value
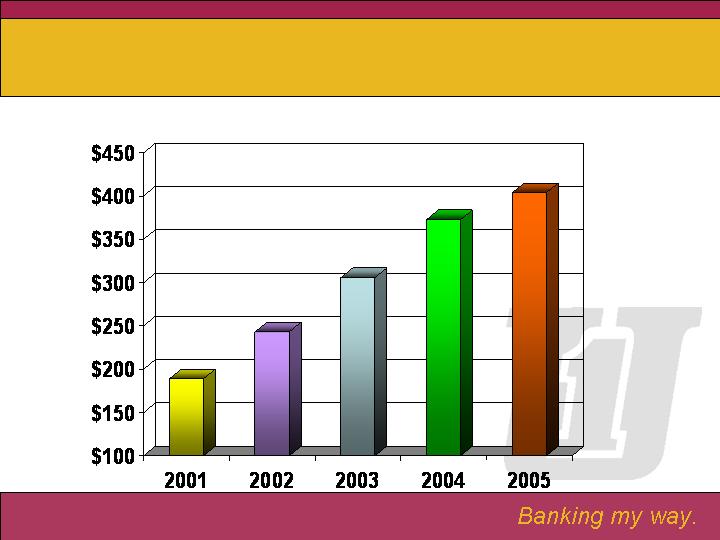
As you can see from the chart behind me, your Trust Department continues to grow in assets. As of the end of 2005, we had assets under management of almost $500,000,000.
Slide 38: Trust Department Income
After great revenue growth in 2004, I am pleased to report that revenue continues to grow and has increased 31% over the past five years.
Slade 39: Trust Sales of New Revenue
Sales of new Revenue totaled over $583,000 for 2005. Again after a spectacular year in 2004, we have increased new revenue by over 39% since 2001.
Our expansion of the Trust Department now includes seven (7) branches strategically located within all market regions.
Slide 40: Managed Asset Portfolio Results
The centerpiece of the Trust Investment Department, MAP or Managed Asset Portfolio, continues to provide excellent results. As you can see from the chart behind me, all models have beat or matched relative indices.
Our Brokerage Department, PrimeVest posted lower revenues in 2005. Although disappointing, this decrease was shared by most bank brokerage departments across the nation.
Slide 41: Contribution of Trust & PrimeVest to Corporate Income
This next chart shows that the impact that your Trust and Brokerage Departments have towards the bottom line of the total institution. 2005 reflects that the two departments added approximately 15% to the income of the institution.
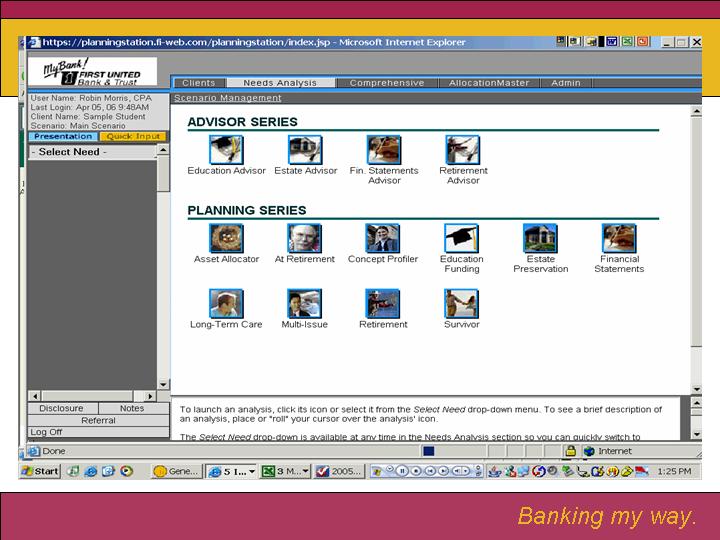
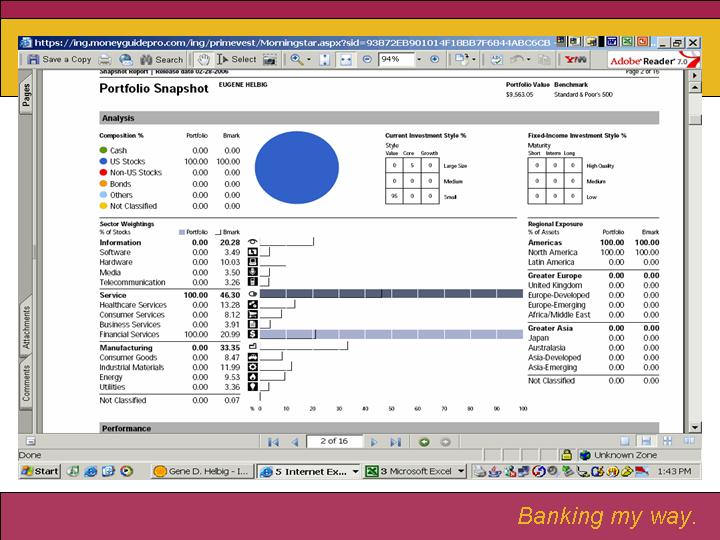
The success of these departments is not accidental but is the direct result of the dedicated and knowledgeable staff. Although the investment results of an account are very important, we continually prove to ourselves that the personal relationship with our client is even more important. One tool that does set out staff apart from others is the ability to provide financial planning. Both Trust and Brokerage have state of art Financial Planning processes available. Trust uses Planning Station, a sample report is behind me, and Brokerage uses Money Guide Broker, again a sample is behind me.
The best marketing to continue the success of these departments is word of mouth. Please share these results with your friends that you think would benefit from our services.
Thank you and enjoy the rest of the afternoon.
JASON RUSH
Slide 44: Jason Rush
Good afternoon,
As you have heard my fellow associates discuss, 2005 was a year of growth which brought about new challenges for each of our areas. The role of the Operation Departments is to support this growth and help make these challenges manageable for all members of the team.
The Support Services, Management Information Systems and Security Departments have been busy with our expansion efforts in the Morgantown, WV and Hagerstown, MD areas.
Slide 45: Branch Image
Construction of our first office in Morgantown, at the Sabraton exit, was completed in the spring of 2005. As Mr. Thayer reported, this new market holds great promise and has already shown outstanding growth for First United. Construction is just getting under way on our second permanent branch in the Morgantown market to be located in the Star City area.
Our second office in Hagerstown is also beginning to take shape. This office, which is located on Wesel Boulevard in Hagerstown, will be a nice addition to our current hub office located on Edgewood Drive. The construction of these two offices will keep our operation and support areas busy throughout 2006.
Last year we reported that our Technology Department was going to spend 2005 reviewing and firming up our technology platforms for future growth. I am pleased to report that key upgrades to our retail and operational systems were completed. These upgrades provide our fellow associates with the tools they need to best serve our customers while providing the greatest return to you, our shareholders.
Slide 46: Cash Management - Number of Customers
Our Commercial Cash Management Area had another banner year in 2005 as our customer base grew over 25% from 281 to 352 commercial and municipal customers.
-10-
Slide 47: Cash Management - Dollar Range
Our total managed deposits within the Cash Management Department grew 22% in 2005, from $115 million in 2004 to just under $141 million. In addition, several new products were added within the Cash Management area to help attract and retain the lower cost deposits we seek.
Together, the operations and support staff will continue to meet the challenges and changes of your growing Company. We look forward to the upcoming year and the
opportunities that come with it.
JEANNETTE FITZWATER
Slide 48: Jeannette Fitzwater
Your First United stock provides one component of your overall investment plan. We would like to believe it is an important component.
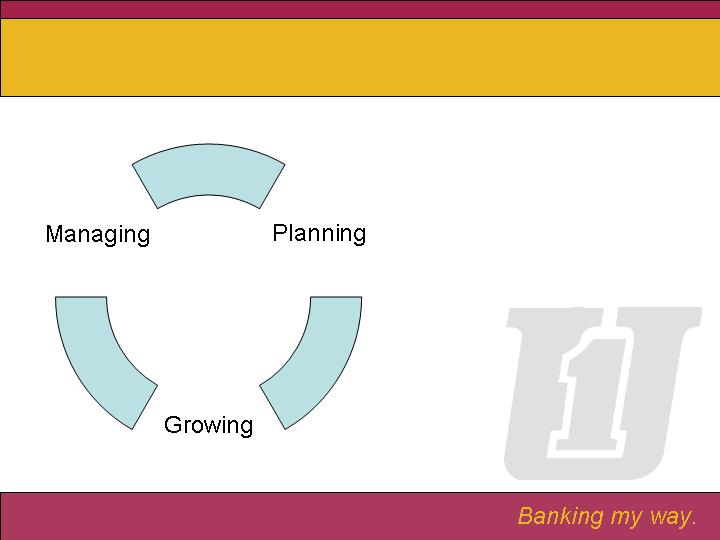
As part of your company’s overall investment plan, we consider an integral component to be the investment we make in our associates—the Human Resource portion of the plan. Just as you have with your own investments, we have a consistent cycle in managing these resources.
Slide 49: Planning for Your Investment
We begin by evaluating our short-term and long-term plans. There are everyday decisions that need to be made to help us work through various projects and initiatives. However, we are always mindful of keeping our primary focus on meeting longer-term goals. As the Company focuses more on its newer market areas and our fee based services, we invest to a greater level in these areas. During 2005, we partnered with an executive recruiter to acquire experienced talent in the roles of Business Development Officers, Community Office Managers and a Mortgage Loan Originator. We are learning that it pays to be patient, in order to place the right person in the most appropriate role. As we strategically place these resources throughout our growth markets, we are continually pleased with their rapid trend of positive performance.
At the same time, we evaluate all lines of business to provide for proactive succession planning. Technology has afforded us opportunities to gain efficiencies in some areas, which in turn gives us resources to invest in areas which we believe we may have the greatest long-term return.
Slide 50: Growing Your Investment
As an individual investor, you anxiously watch for growth in your investments. Typically this growth comes through proper monitoring and managing your portfolio. It is the same with associates. When we hire these key players, we need to continue to manage and grow our investment. This is initiated through a strong orientation, mentoring and training process. In 2006, we intend to invest in a training professional who will be charged with focusing on this effort, as directly related to these key hires. On an ongoing basis, our supervisors provide consistent coaching and mentoring of associates. This process grows careers for associates and assists in retention of our most valued professionals.
Slide 51: Managing Your Investment
Periodically you need to evaluate your investment strategy, and make some minor changes. It is truly kaizen—the approach of getting better each day. The role of efficiency and effectiveness plays into this concept. We may need to re-focus the emphasis of certain lines of business or re-assess the role of certain offices. Throughout this effort, we strategically align our human resources toward their most beneficial impact for the company. For the individual associate it provides for cross-training and career growth opportunities. For the company, it strengthens our competitive position.
-11-
Your investment return is also impacted by any expenses associated with your investment. Your Company’s assets grew at a pace of 6 percent in 2005, while the full-time equivalents of the Company actually decreased slightly. While other companies are experiencing double-digit increases in health insurance premiums, we’ve held our rates flat through two annual renewal periods. In addition, we have a launched a company-wide wellness program aimed at maintaining this positive trend. At First United, expense management is simply a case of day-to-day monitoring and getting a little better with each decision.
Slide 52: Human Resource Investment Strategy
The cycle begins once again as you re-evaluate your short-term and long-term needs. Therefore, we view our associates as a key investment toward meeting our financial goals, just as you view your investments as being key to meeting your financial needs. You may rest assured that your investment in First United’s associate team is constantly being evaluated, grown and managed in order to bring the best return for you the shareholder, our customers and our valued associates.
Slide 53: Primary Point of Difference
ROBIN MURRAY
Slide 54: Robin Murray
Good Afternoon,
At this time, I am pleased to share with you the essential marketing strategies for your Company. Our marketing initiatives are still mission-driven toward enriching the lives of our customers and continue to be committed to our long-term strategy of relationship building.
Slide 55: Customer Research
We believe that our customer centric model enables us to engage our customers so that we can better understand the markets we serve. Recently, we conducted a series of customer focus groups to truly understand what is important to our customers and how well our organization is performing in these areas. From this research, we have defined customer satisfaction attributes based on our customer’s rating of importance. We have revamped our customer satisfaction survey and our mystery shopping survey, so that cohesively, we can measure the impact of satisfaction ratings against our customer experience ratings. This will provide us opportunities to improve our sales and service initiatives going forward based on what our customer tells us they need and want in a financial institution as well as what is important to them.
Slide 56: New Product Development
One of your Company’s greatest strengths is the team of specialists that serve our customers and our different lines of business we can offer. Last year, we pulled together First United Insurance Group and My Bank’s Customer Service Center to test the market for a new solution, My Health Savings Account for small business owners. This solution was a perfect match for our insurance group to offer a lower cost health insurance plan; however, the deductible was higher. To offer assistance with the savings for the higher deductibles, My Bank offered a tax-deferred savings account. I am pleased to announce this has been a successful joint venture with the opening of several new accounts. We intend to execute this small business initiative on a Bank-wide basis starting next month. We believe that we can be the “best” at providing total financial solutions to our customers, even with niche products such as our Health Savings Accounts. Our hope is that the end result of our efforts will be growth in not only our core products, but also across other lines of business for our organization.
Slide 57: Competitive Research
It’s important for your Company to stay on top of the industry and identify ways to enhance our product offerings that add value for our customer and income opportunities for your company. Earlier this year, we engaged an independent research firm to conduct an in-depth study of our deposit products, services and fee income initiatives. This analysis further cemented our relationship efforts by confirming that My Bank’s relationship packages for both our consumer and business customers are unique and still continue to be a competitive advantage for us within each of our markets. We intend to continue the enhancement of our acquisition and penetration efforts by utilizing our packages as a point of difference for our institution. These packages of services provide our customers an incentive for banking with us, as well as enable our staff to engage the customer one on one to better serve their financial needs and grow the relationship with us.
-12-
Slide 58: Database Marketing
We continuously seek and employ initiatives to broaden profitability and deepen customer relationships, as well as hone our skills in our direct marketing techniques. We are in the process of executing a predictive modeling system that enables us to actually predict the next service individual customers may need, as well as predict which customers may be at risk for leaving our Company. This model will then trigger a personalized direct mail campaign and will be followed by a personal phone call from us. Each year, our direct mail efforts become more proactive and targeted, by focusing on the core needs of the different stages of a customer’s life. This type of direct marketing continues to be more effective than mass marketing for your Company.
In conclusion, we are extremely excited about the many opportunities that will be presented to us this year through our franchise expansion efforts. We look forward to executing yet another successful grand opening event in Morgantown, as well as our new office in Hagerstown.
Slide 59: 2006 Marketing Strategies
Our marketing strategies for 2006 have not changed from our past strategies. We intend to continue our focus on the attraction of targeted prospects, retention of our key customers, growth of our existing priority relationships and small business relationships through our team sales efforts. We believe that successful execution of these strategies will enhance shareholder value and will continue to transform your Company into a great financial services provider. Thank you.
BILL GRANT
Slide 60: Bill Grant
I think you will agree with me that 2005 was a very successful year accentuated with strong earnings, significant growth, strategic expansion and superior credit quality. But how, you might ask, does this compare with other banks. Each year we compare our performance with that of other “small cap” banks throughout the United States. By small cap, I am referring to those banks or holding companies with a total market capitalization of $500 million or less.
Slide 61: Relative Performance vs Small Cap Banks
We examine three key ratios:
Return on Equity - which reflects the true return on your investment
Non-Performing Assets as a percentage of assets and
Efficiency Ratio - which reflects how efficiently your Company is operating.
ROE 211 out of 777
NPA 355 out of 777
Efficiency 338 out of 777
-13-
When these scores are aggregated your Company ranks 249 out of 777, which places us in the top 32% of all U.S. small cap banks.
Are we satisfied with being in the top 32%? No, we are not. As Carissa mentioned earlier, we want to move your Company from good to great, and this will be accomplished by simply doing things better. It is worthwhile, however, to look up once in a while to see how we are doing when compared to our peers.
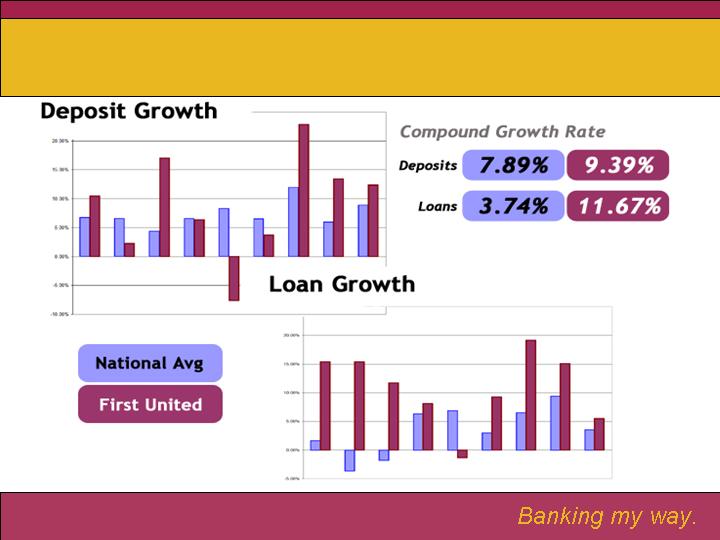
Slide 62: 10 Years of Deposits & Loans
There are some other things I would like to share with you about our Company. One of our challenges is to continue to grow the bank in a way which enhances profits and promotes future success. Profitable growth is a challenge for all within the banking industry. We decided to check around and see how our growth over the last ten years compares with the industry. As this chart reflects, we stack up pretty well. Compound growth of deposits for the industry has been 7.89%. Ours is 9%. For loans, the rate for the industry has only been 3.74%, while ours has been 12%.
This record of strong growth clearly indicates your Company’s ability to successfully enter new and dynamic markets, such as Morgantown, Martinsburg, Frederick and Hagerstown.
Slide 63: Stock Growth
We have one more chart I think you will be pleased to see. You have already seen in our proxy the relative performance of your stock over the last five years. This chart reflects our total performance since June 1, 1996 - the beginning of our watch - and tracks it through the end of 2005. By total return I mean both appreciation and dividends. I am reminded by our Trust Investment Officer that “dividends are real money” and should be included in total return. As you can see, we continue to outperform the NASDAQ Composite Index and nearly equal the return of the S&P 500.
Since the beginning of 2006, our return through March 31, 2006 is 7.3%. As I have mentioned in previous meetings, our shareholders tell us they want long-term value for their investment and that is what has been clearly provided.
In closing, I would like to share with you some views regarding shareholder value. This is a term that gets bandied about on the news networks and by so-called industry experts. I recently had the opportunity to speak with a CEO of a Fortune 500 company and he shared his views on shareholder value. Despite the size difference between our two companies, I found in his thoughts common ground as to what shareholders want and expect from their investment. He began by saying that consistency of earnings is at the top of the list. And, that the expansion of earnings is built upon the company’s ability to grow. I could not agree more. Our track record, as shown in your Annual Report, reflects a steady, and nearly unbroken, rise in earnings year in and year out. It is coupled with a steadily expanding market base. As we look to the future, we intend to continue that growth of earnings as we build out more market share in the new markets Rick mentioned earlier.
A second factor was to possess a difference which sets you apart from your competitors. I believe your Company has this, both in its relative size, and its unique focus on providing uncommon service and tailor-made financial solutions for the customers we serve. As I mentioned in this year’s letter to you, our unique size, once viewed as a disadvantage, actually sets us apart. Within all our markets we are confronted by much larger financial institutions. While they do have some pricing advantages due to their economies of scale, they cannot for the most part, be nimble enough to craft solutions unique to their customers. Nor, can they provide a full team of professionals to serve customers as they strive, together, to attain their financial goals. This, as you know, is at the core of First United’s mission. Our team approach also allows us to bring a broad array of services to our customers that are beyond the capabilities of the smaller banks within our markets.
-14-
We will continue to build on this advantage for our customers as we build value for your investment.
Credit for this performance and our future success extends well beyond those seated before you on this stage. It starts with your Board of Directors who remained focused on building long-term value for you, the shareholder, and constantly challenged your management team to do better.
You know I shared with you a few years ago that we are engaged in a process of moving from good to great - an evolution predicted in the best selling book by Jim Collins “Good to Great”. I think some of our directors could have written that book. They provide guidance and direction to us to make improvements in all that we do.
Slide 65: The Team
None of our successes would have been possible were it not for the team of dedicated financial professionals who serve you and our customers. They are listed for you on the back of your Annual Report. They understand fully the importance of our Mission Statement - found on the inside cover of your Report - and they work hard every day to build value for your investment. We thank you for your support and look forward to serving you in the year to come.
Thank You!
Slide 66: Our Mission
-15-
Shareholders’ Meeting 2006 First United Corporation
Our Vision
Uncommon commitment to service and solutions.
Our Mission
To enrich the lives of our customers, our employees and our shareholders through uncommon service and effective financial solutions.
Our Critical Success Factors
Effective Communication
Employee Enablement
Kaizen (Continuous Improvement)
Retail Orientation
Bill Grant
Chairman of the Board &
Chief Executive Officer
Bob Kurtz
President &
Chief Risk Officer
Net Income
$7.7 Million
$12.2 Million
Treasury Rates (Flat Yield Curve)
As of 4/3/06
Sarbanes-Oxley Act of 2002 (SOX)
Section 404
Financial Controls
Bank Secrecy Act (BSA)
Enterprise Risk Management (ERM)
Credit
Market
OPERATIONAL
Carissa Rodeheaver
Chief Financial Officer
Net Income
Millions
Asset Growth
Millions
Loan Growth
Millions
Deposit Growth
Millions
Net Interest Income
Interest Income:
Loans
Investments on Securities
Less Interest Expense:
Savings
Transaction Accounts
Time Deposits
FHLB Borrowings
Equals - Net Interest Income
Trends in Net Interest Income
(in millions)
2005 - $40.3
2004 -$36.7 2003-$34.0
2002-$31.8
Net Interest Margin
Non-Interest Income (Fee Income)
Millions
Non-Interest Expense
Millions
Return on Average Equity
Earnings Per Share
Efficiency Ratio
2006?
Steve M. Lantz
Senior Vice President
&
Senior Lending Officer
Commercial Loan Growth
Millions
Other Loan Engines
Residential Mortgages
Grew $19 million
Sold $31 million to improve yield and margin
Home Equity Loans
Modest Growth
Indirect Auto Loans
$6.6 million planned portfolio loss
Non-Performing Loans
Net Charge-Offs
Rick Thayer
Senior Vice President &
Director of Retail Banking
2005 Performance
Deposit Growth $74,394,000
Mortgage Referrals $29,474,000
Trust Referrals $13,342,000
PrimeVest Referrals $ 8,799,000
Branch Expansion
Sabraton
Opened March 3, 2005
Deposit Growth $8,785,000
Loan Growth $1,157,000
Star City
Opened September 6, 2005
Deposit Growth $540,000
Wesel Boulevard
Land lease signed
Processes & Products
Area Managers
Business Development Officers
Enhanced Small Business Product Line
Free Checking
Cash Management
Merchant Services
Business Custom Capital
Val Teagarden
First United Insurance Group
CEO
2005 Strategic Objectives
Additional Resources
Growth Opportunities
Commissions & Contingency
Return on Revenue
Return on Investment
Eugene D. Helbig, Jr.
Senior Vice President
&
Senior Trust Officer
Trust Department Market Value
1977
$468,500,000
2005
Trust Department Income
$3,283,487
1977
2005
Trust Sales of New Revenue
* $348,853 Non-Recurring
5,153
$583,269
2005
3,284
$555,376
2003
4,113
*$902,575
2004
3,051
$437,115
2002
2,886
$419,808
2001
# of Contacts
Sales
Managed Asset Portfolio Results
8.95%
31.05%
15.52%
8.83%
Aggressive
7.63%
23.63%
11.97%
6.39%
Balanced
7.49%
16.82%
9.45%
4.39%
Growth/Income
6.48%
9.64%
5.54%
3.15%
Fixed Income
5.01%
5.12%
4.69%
2.86%
Bond Income
8 Year
Average
Annual
Return
2003
Annual
Return
2004
Annual
Return
2005
Annual
Return
Investment
Objective
2005 Index Performance:
S&P 500: 4.91% Int. Gov’t Bond: 1.68%
Contribution of Trust & PrimeVest to Corporate Income
1999
13.34%
2000
13.77%
2001
16.08%
2002
11.64%
2003
13.79%
2004
26.24%
2005
15.56%
Jason Rush
Director of Operations &
Cash Management Services
Cash Management – Number of Customers
84
152
192
239
281
352
0
50
100
150
200
250
300
350
400
2000
2001
2002
2003
2004
2005
Cash Management – Dollar Range
$16,423,984
$32,291,279
$48,569,847
$85,705,265
$115,440,050
$140,931,514
$0
$20,000,000
$40,000,000
$60,000,000
$80,000,000
$100,000,000
$120,000,000
$140,000,000
$160,000,000
2000
2001
2002
2003
2004
2005
Jeannette R. Fitzwater
Senior Vice President &
Director of Human Resources
Planning for Your Investment
Short-Term Planning
Long-Term Planning
Succession Planning
Growing Your Investment
Orientation
Training
Coaching & Mentoring
Managing Your Investment
Realignment of Resources
Expense Management
Human Resource Investment Strategy
Goal: Maximize your Investment!
At First United...
People Truly are
Our Primary
Point of Difference!
Robin Murray
Senior Vice President &
Director of Marketing
Customer Research
Revamped Customer Satisfaction Survey
Realigned Mystery Shopping Program
Compare Satisfaction Survey Results to Mystery Shopping Results
Improve Sales and Service Initiatives
New Product Development
Health Savings Account
Team of Specialists Approach
Enhanced Existing Products
New Business Checking Account
Total Financial Solutions!
Competitive Research
Engaged Research Firm
Study of Deposit Products
Analysis of Fees
Database Marketing
Predictive Modeling System
Penetration Efforts - Next Financial Service
Retention Efforts – Risk of Leaving
Personalized Direct Mail/Telephone Call
2006 Marketing Strategies
Attraction of Targeted Prospects
Retention of Key Customers
Growth in Existing Relationships
Small Business Initiatives
Great Financial
Services Provider!
Bill Grant
Chairman of the Board &
Chief Executive Officer
Relative Performance VS Small Cap Banks
Return on Equity 211 out of 777
Non-Performing Assets 355 out of 777
Efficiency Ratio 338 out of 777
Overall:249 out of 777
Top 32%!
10 Years of Deposits & Loans
Stock Growth
We use cookies on this site to provide a more responsive and personalized service. Continuing to browse, clicking I Agree, or closing this banner indicates agreement. See our Cookie Policy for more information.