Exhibit 99.1
FIRST UNITED CORPORATION
2007 Annual Meeting of Shareholders Presentation
April 24, 2007
Slide 1: Shareholders’ Meeting - Overview
BILL GRANT
Slide 2: Bill Grant
Good afternoon, fellow shareholders and special guests, and welcome to your 2007 Shareholders’ Meeting. I am delighted to report to you that First United achieved record earnings in 2006 of $2.05 per share. It took us 96 years to make our first $1.00 per share, and in the space of 10 years, we have doubled that. Many of you have told me that you appreciate the format of our meeting and enjoy hearing from each of your management teams. Well, because of those comments, we are going to continue with that format. I am going to turn the meeting over to Bob Kurtz, our President and Chief Risk Officer, and will be back with you after you hear from our other officers.
Before I turn the stage over to Bob, I want to call your attention to the fact that our reports contain forward-looking statements. Forward-looking statements do not represent historical facts, but statements about our beliefs and intentions for the future. These statements are evidenced by terms such as “anticipate,” “estimate,” “should,” “expect,” “believe,” “intend,” and similar expressions. While these statements reflect the Company’s good faith beliefs, expectations, estimates and projections about, among other things, the industry and the markets in which the Company operates, they are not guarantees of future performance and they may not prove true. These projections involve risk and uncertainties that could cause actual results to differ materially. For a discussion of these risks and uncertainties, see the Risk Factors contained the Company’s 2006 Annual Report on Form 10-K that was distributed along with your proxy materials.
Bob…….
BOB KURTZ
Slide 3: Bob Kurtz
Good Afternoon!
During the latter part of 2006, Management and your Board of Directors made the decision to separate the supervision of the credit quality function of the Bank from the production side. Prior to this separation, both production and credit quality was under the supervision of Steve Lantz. As evidenced by historical figures and Shareholder presentations, Steve was credited with posting significant annual loan growth numbers to the balance sheet, while maintaining excellent credit quality results. The reorganization left loan production reporting to Steve with credit quality reporting to the risk management area of the Bank.
Early in 2007, First United appointed Beverly Sines as the Bank’s Chief Credit Officer. Beverly has in excess of thirty-one years with First United, serving in retail and credit support areas of the Bank. With Beverly’s extensive experience in credit quality, I am confident that the credit quality standards and results that Steve was responsible for, will continue.
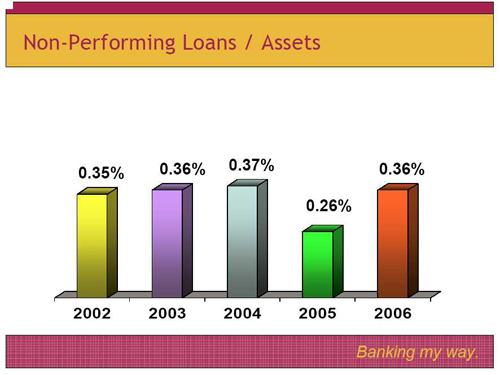
Slide 4: Non-Performing Loans/Assets
As can be seen by this first slide, non-performing loans (those that are 90 days or more past due, plus non-accruing loans) as a percent of total assets, averaged .36% for 2006. This represents a slight increase from 2005, but is on parity with the years 2002 through 2004.
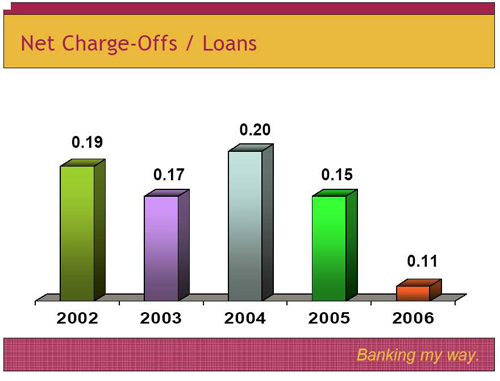
Slide 5: Net Charge-Offs/Loans
The next slide, net charge-offs to total loans shows, a five-year low of .11%.
Slide 6: Loan Trends
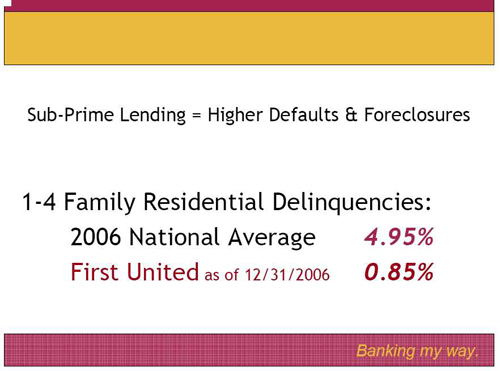
Recently, there has been a lot of national media attention about “sub-prime” lending and the resulting increase in bankruptcies. A sub-prime loan is a loan made to borrowers with weak credit records or a high debt to income ratio. These borrowers usually pose a higher risk of default and foreclosure. As a matter of policy, First United does not make sub-prime loans. That is not to say that we do not have a sub-prime loan in our portfolio, but if so, there would most likely be mitigating factors that would warrant the booking of such a loan.
In a recent article published in one our recent newspapers, it was noted that the national delinquency rate on 1-4 family residential properties was 4.95%, an increase of 25 basis points from one year earlier. As of December 31, 2006, First United’s total delinquency rate for all loans stood at 1.11%, with 1-4 family residential delinquencies at only .85% of total loans, substantially less than the national average.
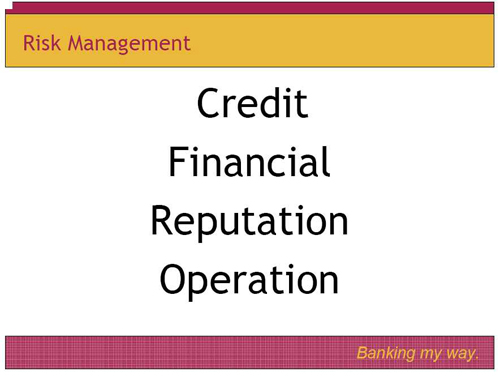
Slide 7: Risk Management
First United has a very active program in identifying, monitoring and mitigating risks that present themselves to our Company. The majority of these risks usually fall under the categories of credit, financial, reputation or operation risk. There is the potential of a new operational risk, that according to the professionals, is not “if” it occurs, but “when” it occurs. I am speaking about the Avian or Bird Flu and the potential of a pandemic. I am not going into details about the flu, but I want to assure you that First United is working on plans in coordination with the Corporation’s Disaster Recovery Committee to safeguard our associates and their families and to provide assurance to you, as our shareholders and customers, that you will continue to have access to your financial services and more importantly, your money. I encourage each of you to take seriously what you read about the flu, and to do your part in taking appropriate safeguards for you and your family. Thank you.
CARISSA RODEHEAVER
Slide 8: Carissa Rodeheaver
Good Afternoon!
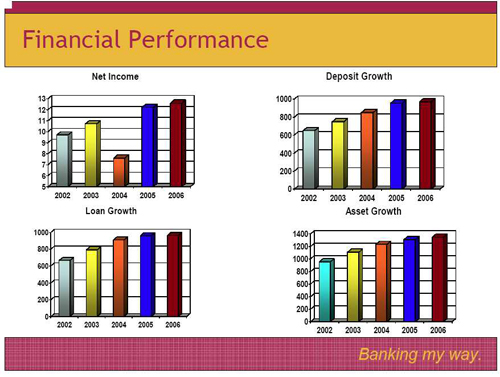
Slide 9: Financial Performance
I am very pleased to be with you this afternoon to discuss another profitable year for First United Corporation. Our company continues to provide its shareholders with a solid, steady return on their investment. In order to deliver this type of financial performance, it is absolutely necessary for us to build a foundation of strong, profitable relationships with our customers. Profitable relationships became a strong focus for us in 2006, as we determined our pricing, enhanced our product packages, expanded our banking franchise and grew our trust and insurance lines of business. A good relationship is a win-win for all parties involved. Successfully managing those relationships translates into profit for our company. Today, I would like to share with you our financial performance for 2006 and the areas in which we intend to concentrate in the future. For more detail, I encourage you to read the section of the 2006 Annual Report on Form 10-K entitled “Management’s Discussion and Analysis of Financial Condition and Results of Operation”.
Slide 10: Net Income
Let’s begin with Net Income. Our net income continued to show a positive growth trend as we profited $12.6 million in 2006, a $426,000, or 4%, increase over 2005. This increase was due to strategic decisions implemented by management over the past few years, the Bank’s ability to increase its net interest margin, a focus on controlling our operating costs and effective tax planning. 2006 proved to be a challenging year with an inverted yield curve, a slow economy and intense competition for retail and commercial deposits.
Slide 11: Asset Growth
Our total assets reached $1.35 billion at December 31, 2006, representing an increase of $38 million, or 3%. Our investment portfolio grew $33 million, or 14%, over 2005 as a result of an investment leverage strategy implemented during the later half of 2006. However, we experienced only slight growth of $3 million in our loan portfolio.
Slide 12: Loan Growth
Total loans reached $964 million at year end. We continue to focus our attention on commercial loan growth, as consumer loans have become more of a commodity over the past few years. Origination of new commercial loans remained high in 2006, similar to 2005, as our commercial lenders continued to identify new customer opportunities and to expand existing customer relationships in all of our market areas. However, new loan volume was offset by high levels of repayment, stifling growth as compared to prior years. Steve will provide more detail on the loan portfolio in his presentation.
Slide 13: Deposit Growth
Total deposits increased by $15.5 million in 2006, or 2%, when compared to 2005. The successful promotion of a 9-month certificate of deposit and the use of brokered certificates to fund our investment leverage strategy contributed to this growth. In keeping with our relationship strategy, the Bank chose to allow high-priced, volatile customer deposits to decline in order to allocate these resources to customers with full banking relationships.
Slide 14: Net Interest Income
Net interest income continues to be our largest source of operating revenue, accounting for 73% of our total revenue stream. It is the difference between the interest we earn on loans and investments and the interest that we pay for deposits and other borrowings. 2006 continued to be a challenging environment for financial institutions as short-term rates increased 125 basis points and long-term rates remained relatively level. The result was an inverted yield curve. Total net interest income for 2006 was $40.9 million, an increase of approximately $600,000 over 2005. Although we experienced minimal loan growth, interest income exceeded income generated in prior years due to upward re-pricing of loans. This increase was partially offset by increased interest expense resulting from the intense competition for deposits.
Slide 15: Net Interest Margin
Our emphasis on adjustable rate loans during a rising interest rate environment protected our margin as intense competition for deposits drove our costs of funding higher during the year. Our net interest margin increased from 3.49% to 3.52% during a period when many financial institutions experienced a shrinking margin. This increase was fueled by the interest spread on our core lines of business. While the investment leverage strategy drove earnings to the bottom line, it did have a negative impact on our margin.
Slide 16: Other Operating Income
As indicated on this chart, other operating income decreased slightly in 2006. This decline is due to a gain of $860,000 recognized on the prepayment of long-term debt during 2005. Excluding this 2005 gain, core other operating income would have shown admirable growth of $821,000 primarily attributable to 13% growth in our trust department income and 15% growth in service charge income
Slide 17: Other Operating Expense
Other operating expense for 2006 increased by $800,000, or 2.4%, over 2005. This slight increase was the result of a focus by all employees on expense control. Salaries and employee benefits represent approximately 54% of this category. Our uncommon commitment to providing quality service and high-level financial solutions requires that we hire and retain well-trained, competent associates. We believe that the cultivation of strong relationships with our associates translates into more profitable relationships with our customers.
The following ratios are monitored by our internal management as well as the investment community as a measure of financial performance. They are all dependent upon the profits of our company.
Slide 18: Efficiency Ratio
The first ratio we will review is the efficiency ratio, which represents how efficiently the company manages its overhead expenses. In this case, a lower number indicates better performance. We saw our efficiency ratio decrease to 62.23% in 2006. Better cost control, the increase in net interest margin and the successful implementation of asset-liability strategies over the past few years have helped to drive this ratio down.
Slide 19: Return on Average Equity
The return on average equity represents how well the management of our company invests our capital. 2006 shows a slight decline in this ratio from 13.61% in 2005 to 13.07% in 2006 as our capital grew faster than our net income.
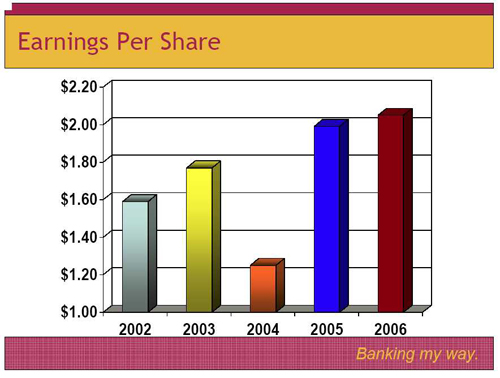
Slide 20: Earnings per Share
This chart demonstrates a solid, steady growth in earnings per share as we grew to $2.05 per share, or 3% over 2005. Over a five-year period, your company has achieved approximately 7% average annualized growth.
Slide 21: 2007?
Last year I told you that your management team would continue to lay the groundwork in 2006 for a strong financial future. We believe that our 2006 financial results have added another layer of strength and stability towards achieving this goal. Our mission to enrich the lives of our customers, employees and shareholders extends to our uncommon commitment to attaining better financial performance year after year. In 2007, we will work towards improving our use of shareholder capital, implementing investment strategies to protect against a flat yield curve and a compressing margin, focusing on attracting and retaining low-cost deposits, and building strong, profitable customer relationships. Thank you!
ROBIN MURRAY
Slide 22: Robin Murray
Good afternoon. At this time, I am pleased to share with you our Retail Initiatives and Strategies for your Company.
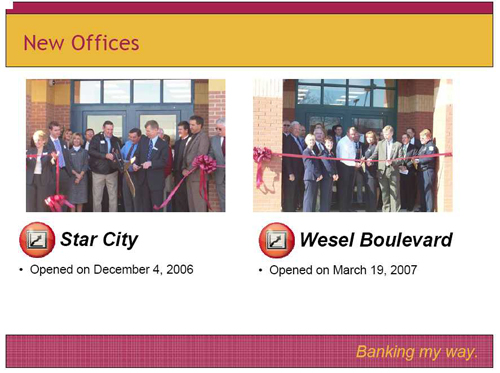
Slide 23: New Offices
We are extremely excited about our recent franchise expansions, with the opening of two new retail offices. Our Star City Office in Morgantown officially opened in December. This will be our second office for the Morgantown community.
Our third Washington County Office just opened in March of this year. My Bank’s positioning strategy and well trained staff should afford us many opportunities for continued growth in this market.
Both offices are excellent locations and should provide our customers with yet another convenient site to conduct their financial relationships and additional income for our Company. These teams of professionals are excited and ready to assist customers in these excellent new markets.
Last year was a challenging year for our retail Staff to grow core deposits. Our deposit growth did not meet our expectations in 2006. In Banks cry give us your cash! published in the January 12, 2007 edition of the Wall Street Journal, author Clint Riley stated,“The nation’s banks and saving institutions are facing a deposit crunch. Total deposit as a percentage of assets on hand at the end of September 2006 at the country’s more than 8700 insured banks and thrifts reached the lowest level since 1933. All banks are scrambling to sign up new customers for savings, checking and other accounts.”
We are not alone with this deposit challenge and have made several changes to our retail performance initiatives to assist us with our deposit growth.
Slide 24: Retail Key Initiatives to Improve Performance
Aligning our goals, metrics and incentives was imperative for our organization to measure and reward our staff for growing customer relationships and measuring our performance against industry peers. We now have in place specific measurements and incentive programs to assist our retail staff in performing key initiatives and to remain focused on strategies that should enhance their abilities to grow deposits, loans and fee income.
In addition, we have provided consultative sales and service training to our staff in an on-going effort to facilitate building relationships and interacting with our customers. We will practice and practice our relationship building efforts until we do it better than any of our competitors. Executing our training efforts should enable us to proactively identify needs now and in the future for our targeted segments.
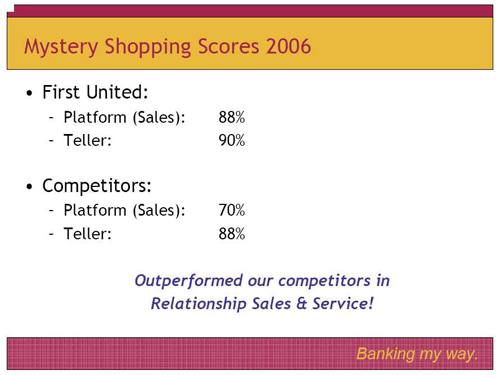
Slide 25: Mystery Shopping Scores 2006
To assist us in the measurement of relationship sales and service, we are also diligent in continuing our mystery shopping program which is performed for us by an outside consultant.
Every Retail office is shopped several times a year by surprise. This consultant provides scores for each office to enable us to provide coaching in specific areas based on customer experiences.
Last year, we also shopped our competition in each of our market areas to bench mark our sales and service efforts as compared to our peers. As you can see, our data shows that our platform, which is our sales people who engage the customer and open accounts, outperformed our competitors by 18% in the relationship sales process.
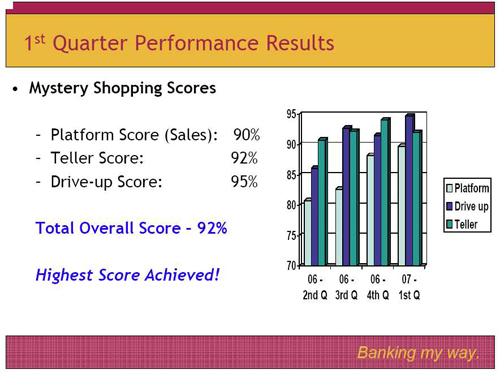
Slide 26: 1st Quarter Performance Results
I am elated with our first quarter scoring results this year as well! This team experienced an overall score in sales and service performance of 92%! This was the highest score achieved since the shopping program was revamped in early 2006. These results greatly exceeded industry standards and are an excellent indicator that our execution efforts are definitely moving in the right direction!
Slide 27: 1st Quarter Achievements
Our retail team is working diligently to keep our growth momentum moving forward and to improve our market share within our footprint.
Lastly, we have restructured our retail line of business and added a Market President position in four of our high growth market areas. This position should enhance our visibility in each of these communities and should allow decisions to be made at the market level, which should serve our customers more effectively and efficiently. We have been successful in recruiting three Market President’s, Dave Kelley for our Morgantown Market, Patti Young for our Washington County Market, and Tom Cummings for our Berkeley County Market. Our goal is to have our last position filled by September of this year for our Frederick County Market.
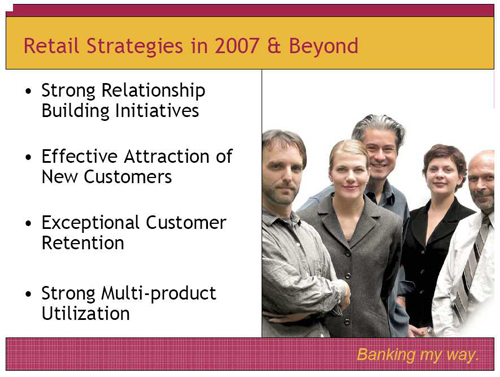
Slide 28: Retail Strategies in 2007 & Beyond
My Bank’s retail strategies now and in the future will be focused on our relationship building initiatives, effective attraction of new customers, exceptional customer retention and strong multi-product utilization.
Successful execution of these strategies should position us for greater success in a future filled with My Bank’s dedication to exceed shareholder value in the years ahead. Thank you.
STEVE LANTZ
Slide 29: Steve Lantz
Welcome—During 2006, gross loans increased by $3 million over 2005. The growth was focused in our commercial area with $4 million growth and residential mortgage loans with $22 million growth. These were offset by a $12 million decline in consumer installment loans and an $11 million decline in residential construction loans. This realignment of our loan portfolio is consistent with management’s objectives to grow higher yielding commercial loans.
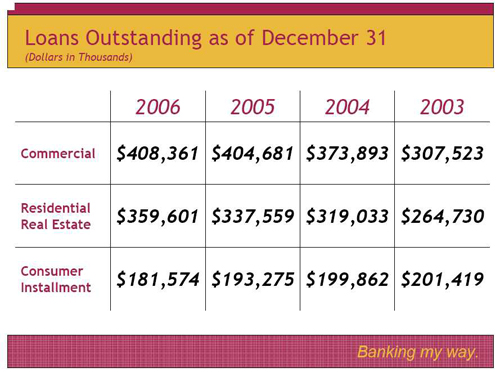
Slide 30: Loans Outstanding as of December 31
Commercial loans increased 1% in 2006. Origination of commercial loans remained high in 2006, much like 2005, however new loan portfolio gains were offset by high levels of repayment throughout the year. Most new commercial loans were priced on a variable rate basis, resetting monthly. Commercial loans secured by real estate continued to be our main source of originations and represents 82% of all business loans.
Residential mortgage loans increased 7% in 2006. Growth in the mortgage portfolio during 2006 was primarily fixed rate loans due to the flat interest rate yield curve. In addition, the home refinance market was very slow in 2006. Thus, our repayments were very low which underpinned growth in this sector. Much of this new origination volume was fueled by first-time home buyer programs and Low/Moderate Income programs to satisfy the requirements of the Community Reinvestment Act.
Consumer installment loans decreased 6% in 2006. This decrease reflects management’s shift towards commercial loans and less emphasis on the highly competitive consumer loan market. Specifically, less focus was placed on growing our automobile indirect loan business. We continue to value our current dealer relationships but growth in this sector has not been our priority.
As we look forward, we intend to continue the pursuit of profitable and sound loan growth. We anticipate the main driver of growth will be in business loans, and we expect continued flat growth in our consumer business. Consistent with 2006, we will continue to do our best to increase net interest margin. On behalf of our entire production team thank you for your support.
RICK THAYER
Slide 31: Rick Thayer
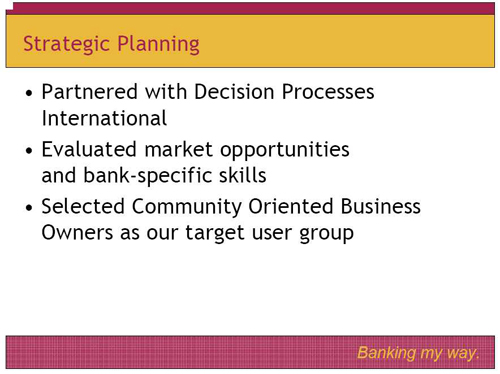
Slide 32: Strategic Planning
Good afternoon. In June of 2006, we partnered with Decision Processes International to review the strategic focus of your company and to develop plans that will carry us forward over the next several years.
We convened a group of 30 key associates from throughout the Bank to accomplish this goal. The process has been vigorous with open discussion on our unique skills, our shortcomings, and changes in our industry, our market areas and in the economy.
The results of these conversations were severalfold. We identified and validated a specific customer segment on which to focus, we identified specific items that we must accomplish to be prepared to best serve this segment, and we developed a mission statement to capture our strategic focus.
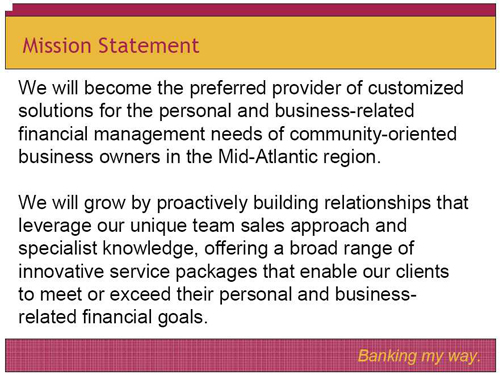
Slide 33: Mission Statement
Our mission is to become the preferred provider of customized solutions for the personal and business-related financial management needs of community-oriented business owners in the Mid-Atlantic region. We will grow by pro-actively building relationships that leverage our unique team sales approach and specialist knowledge, offering a broad range of innovative service packages that enable our clients to meet or exceed their personal and business related financial goals.
We believe, and our research verifies, that community-oriented business owners value the team based, relationship driven sales approach utilized by First United. Further, our research shows that these business owners are invested in their communities and prefer to do business with companies that offer convenience, high quality service and local decision making.
By addressing the personal and professional financial needs of this customer segment, we hope to ensure that we continue to serve our traditional consumer customer base with quality products and services.
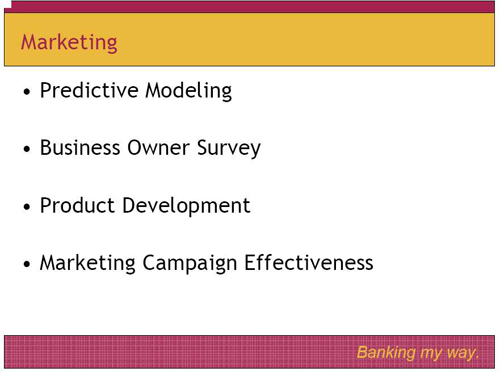
Slide 34: Marketing
In the Marketing area in 2006, we undertook several initiatives to better position ourselves to serve this new market segment and to ensure that we continue to reach out to our traditional consumer base.
On the consumer side, we began the use of predictive modeling to identify those customers and prospects most likely to purchase specific bank products. Using this software, we conducted several successful campaigns, including a money market account campaign and a pre-approved installment loan campaign.
On the business side, we conducted primary research with business owners in our market area to identify their core needs and banking service preferences. Starting with several focus groups, we then developed a comprehensive survey that was sent to both customers and non-customers. The results of these surveys will be used to guide us in refining our strategic focus on the community-oriented business owner.
The first of these efforts in 2007 is a money market account campaign aimed at select business owners and their businesses through which we offer a competitive rate on a money market account but require a checking account.
Other initiatives for 2007 include expanding the use of predictive modeling to assist in the retention of customers, the use of our research to ensure our products meet the needs of the community oriented-business owner and developing methods to better measure the effectiveness of our marketing efforts. Thank you very much.
VAL TEAGARDEN
Slide 35: Val Teagarden
Welcome,
The insurance division of First United faced several challenges during 2006. This included a continuing soft market along with acquisition growth. The insurance market started to transition from a hard market to a soft market during 2005. This means that companies were more willing to look at various classes of risk and underwrite them in standard markets. This created a reduction in premiums. We also experienced a reduction in premiums from several companies which created lower agency revenues. Through this market shift, we still were able to continue our growth and acquisition objectives and not decrease our profitability margin.
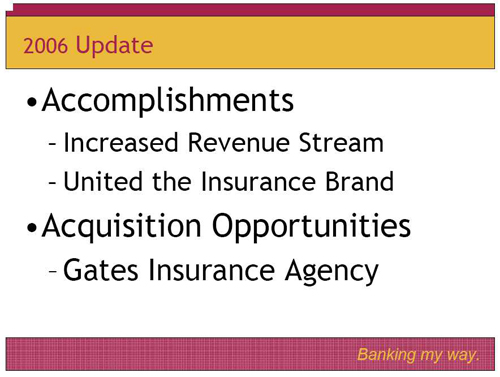
Slide 36: 2006 Update
The insurance division has been through many transitions which resulted in several accomplishments. The annual revenue stream of First United Insurance Group has grown from $500,000 in 1999 to over $1,600,000 in 2006. We have united several agencies and locations under the umbrella of First United Insurance Group. This is very beneficial in growing relationships with companies as well as efficiencies within our processes.
Acquisition Opportunities: In August 2006, we completed the acquisition of the Gates Insurance Agency in Fairmont, West Virginia. The Gates Agency is a full service agency offering property and casualty insurance as well as meeting life and health insurance needs. The agency also operates a vehicle licensing business in the state of West Virginia, providing customers the opportunity to purchase temporary tags, titles and plates at this location.
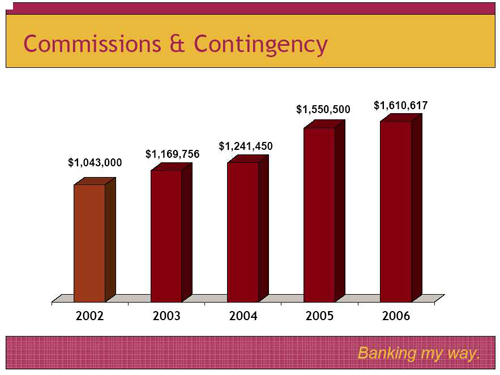
Slide 37: Commissions & Contingency
The growth of the insurance group is measured in several ways. Annual Revenue growth is one measurement. It is our goal that the division consistently increases production growth. During 2006, we were able to stabilize our premium shift resulting from the soft market and increase revenue close to 4%. This included core growth and one quarter of acquisition growth.
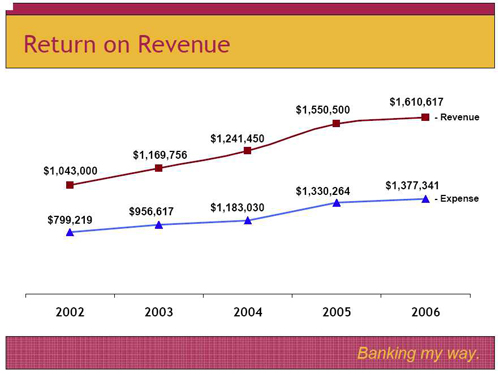
Slide 38: Return on Revenue
We also track the margin between revenue and expense. This is referred to as the annual ROR or Return on Revenue. During 2006, the division produced an ROR of 14.5%. As illustrated in the graph, we were able to increase our revenue while controlling the expense associated with growth. First United Insurance Group’s objective is to see an increase in the ROR while expanding and growing the division.
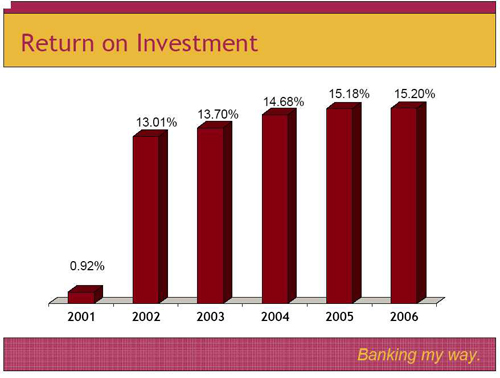
Slide 39: Return on Investment
In addition to the previous measurements, we utilize Return on Investment or ROI. Over the past years, the ROI has increased to 15.20% in 2006. First United Insurance Group’s goal is to continue ROI growth through a combination of increased revenue and expense control.
Thank you for allowing our team to grow your insurance business and we look forward to many successful years in the future.
GENE HELBIG
Slide 40: Gene Helbig
A very pleasant good afternoon. As in years before, I am here to discuss with you a few financial results from 2006 for the Trust and Investments Departments.
Slide 41: Trust Department Market Value
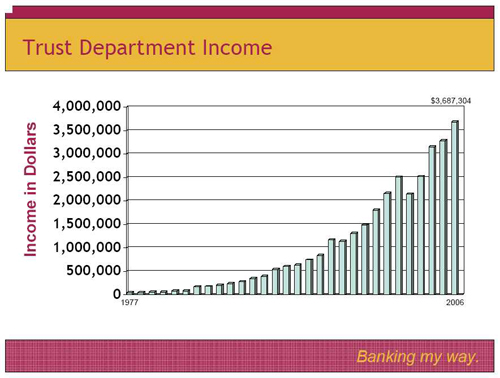
As you can see from the chart behind me, your Trust Department continues to grow in assets. As of December 31, 2006, the market value of Assets under management tallied $502,000,000. Our 2006 revenue from Trust Fees totaled $3.7 million, an increase of 12.3% over 2005. This includes sales of new revenue which totaled over $532,000 for 2006.
Beginning in 2007, we have merged the Trust and “Brokerage” into one entity, First United Trust and Investments. Our Trust and Investments Department now includes seven (7) branches strategically located within all market regions with individual and professional officers that can deliver either Trust or Investment services.
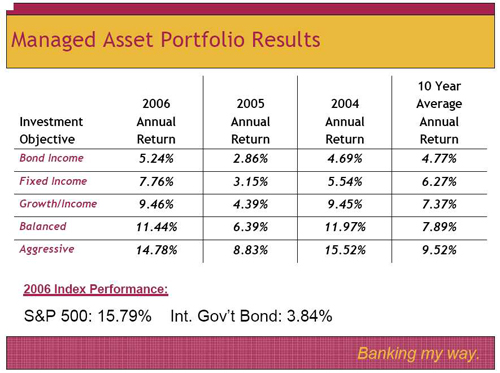
The centerpiece of the Trust Investment Department, MAP or Managed Asset Portfolio, continues to provide excellent results. As you can see from the chart behind me, all models have beat or matched relative indices.
Slide 42: Trust Department Income
Slide 43: Managed Asset Portfolio Results
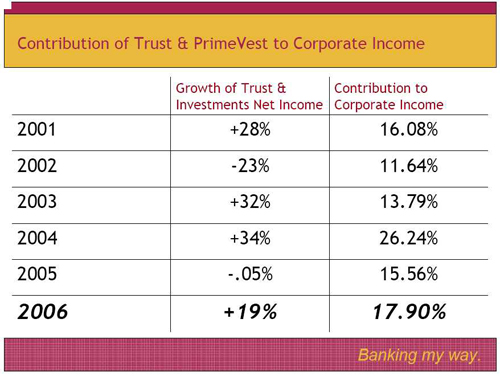
Slide 44: Contribution of Trust & PrimeVest to Corporate Income
This next chart shows that the impact that your Trust and Investment Departments have towards the bottom line of the total institution. 2006 reflects that the two departments added approximately 18% to the income of the institution. The combined net income of Trust and Investments grew over 19% in 2006.
The success of these departments is not accidental but is the direct result of the dedicated and knowledgeable staff. Just recently, the American Banker Magazine ranked the First United Trust Department among the top 150 Trust Departments in the United States.
Although the investment results of an account are very important, we continually prove to ourselves that the personal relationship with our client is even more important. The best marketing to continue the success of these departments is word of mouth. Please share these results with your friends that you think would benefit from our services. Thank you and enjoy the rest of the afternoon.
JASON RUSH
Slide 45: Jason Rush
Good afternoon,
The Operations area is made up of several different departments working independently, but also as a group, to provide support to the front line or sales areas so the Company can meet their challenges on a daily basis. These departments are Deposit and Item Processing, Information Technology, Facilities Management, Security and Disaster Recovery.
Slide 46: [picture of branch]
The past year has been an exciting one for our group. We have been involved in the construction of our new branch locations in the Morgantown and Hagerstown areas. Each of these branches complement existing offices in these growing markets and are located in areas that should be very effective in attracting and servicing the needs of the community oriented business owners.
In addition, our IT area has been busy upgrading both our wide area network and local area network. These upgrades are being completed to provide faster line speed and better line quality between our branches and the Operations Center. These upgrades will prepare us to offer technology in the near future that should lower our cost of doing business while providing better service to our customers.
Slide 47 [picture of equipment]
Another area of my responsibility is our Treasury Management area, formerly the Commercial Cash Management area. The number of customers taking advantage of the services provided by our Treasury Management area continues to grow. 2006 saw an increase in new customers of 26% over 2005. In addition, the Bank rolled out an exciting new product to our Treasury Management suite called Deposit Anytime. Deposit Anytime allows customers to make deposits electronically to their account with First United from their home or office. This product allows us to expand our market area without incurring the expense of building new branches.
We look forward to the opportunities that this year will bring while building on the successes of 2006.
JEANNETTE FITZWATER
Slide 48: Jeannette Fitzwater
You have heard that we are in the middle of a war. However, the war that I am referencing is the “War for Talent.”
Slide 49: Attracting & Retaining Top Talent
Every organization is struggling to keep their edge for attracting and then retaining top talent. We all realize that our people are the key to providing our competitive edge in business.
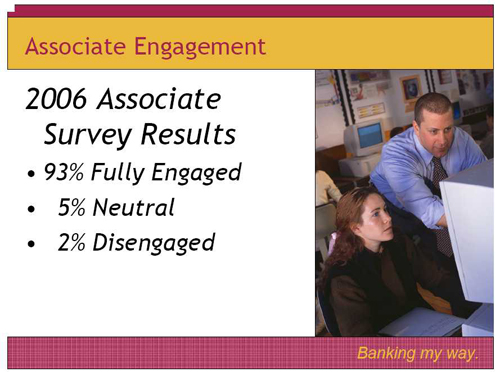
Slide 50: Associate Engagement
For First United, we felt that the best way to build our strategy was to first review where we stand with our current associates. Last Fall, we engaged an outside firm to conduct our bi-annual associate survey. To recap the results that you see on the screen, 93 percent of our associates are considered engaged. (The engaged associate is one who comes to work each day, ready to serve and to help drive the company forward.) And, you’ll note that only 5 percent were neutral, with 2 percent in some level of disengagement—or would consider leaving. We were told by our consultant that this is highest level of engagement that he has ever seen with a client.
So why are the vast majority of our associates staying on our team….They tell us it is truly a result of our corporate culture.
Slide 51: Effective Brand
Thinking in terms of marketing language, we have a very distinct brand. Our associates stay because they are helping people through teamwork. They have a strong level of self-worth and satisfaction in what they do. And, they like serving in a team environment. As a matter of fact, our best work is done in teams, ranging from sales teams, ad hoc teams, and ongoing teams such as our wellness committee. Our challenge is to continue to identify potential associates who find value in this brand. Just like the military, we need to recruit a few good associates who will thrive in this environment.
Slide 52: Attraction
Specifically we are in the process of making several key hires in our growth market areas. Robin mentioned our market presidents and that we have successfully recruited 3 out of 4 of these positions. The other new positions you see listed are for specialists in Washington and Frederick Counties. We realize that with relationship banking, we need to not only grow our branch franchise, but also to provide the full complement of specialist services. We are close to filling all three of positions.
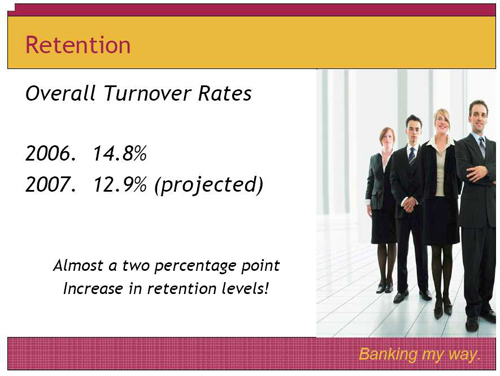
Slide 53: Retention (1)
While attracting the best is the first challenge, perhaps the greater one is to then establish an environment whereby they will stay. As you review our 2006 turnover results, you’ll see that we really were about average within the industry. The good news is that our turnover has decreased significantly over the last 8-9 months. Currently we are on target to have approximately a 12 percent turnover rate for 2007. This places us well above our peers.
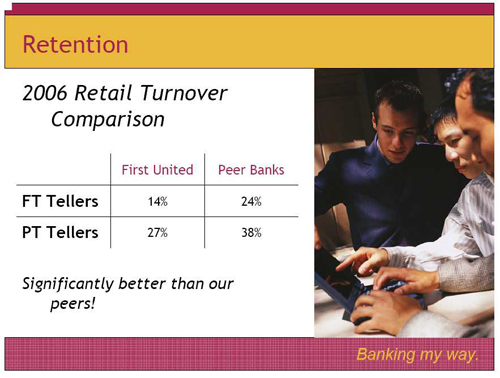
Slide 54: Retention (2)
Most likely as you think of people leaving the Bank, you visualize your favorite teller who is no longer with us. The banking industry typically experiences the highest level of turnover in this entry level position. You’ll see from our statistics that when we compared ourselves to a peer group of banks, we performed well above the pack during 2006, and that is even getting better!
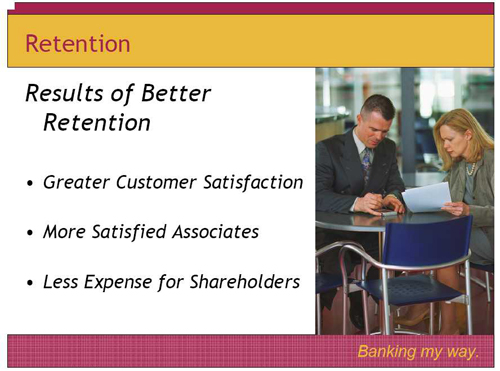
Slide 55: Retention (3)
Why is retention of associates important? You know what it feels like when you are customer. You have a greater level of customer satisfaction because your favorite teller is well experienced and you can count on him or her to be there to meet your needs. Higher retention makes for more satisfied associates. And, the obvious benefit for the shareholder is the reduction of expense. Retention clearly adds to our bottom line results!
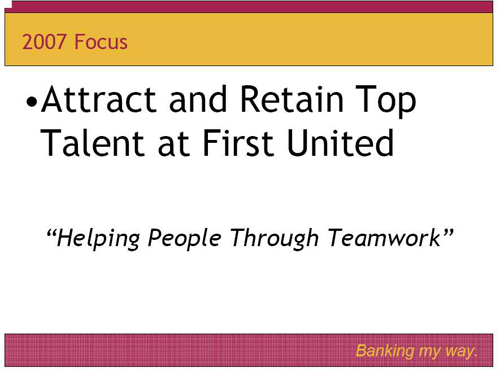
Slide 56: 2007 Focus
As we move forward throughout 2007, our human resource mission remains the same. It’s all about attracting and retaining top talent. And, we know we know we will be successful if we attract and retain associates who find value in “helping people through teamwork.” We encourage you to refer your friends and family to us, if you find that they too may enjoy working in our rewarding environment!
BILL GRANT
Slide 57: Bill Grant
I hope that you were able to get a strong sense of the direction your Company is pursuing. I thank each of the members of your management team for their reports.
Slide 58: Market Comparison
As we have done in the past, we compare our performance with the other publicly traded banking companies with a market capitalization of $500 million or less. We compare ourselves based on three key indicators.
Return on Equity - which shows the true return on your investment
Non Performing Assets as a percentage of assets - which reflects the quality of our primary assets - our loans.
Efficiency Ratio - which indicates how efficiently your Company is being managed.
Based on the 711 small cap banks that released year-end earnings by April 10, 2007, we stood at 237, or in the top third.
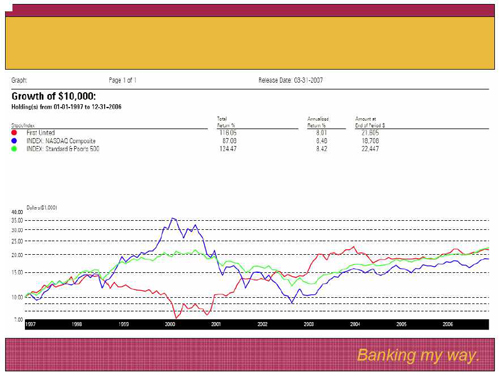
Well, how does this financial performance translate into the performance of your stock? As we have mentioned several times over the past years, we certainly do not control the market for our stock, and we sometimes believe there is a disconnect between our performance and the movement of our stock. We have nevertheless enjoyed good, consistent, long term performance over the years. Our annualized return for the last ten years is 8.01%. This easily surpasses the 6.46% return for the NASDAQ Composite over the same period of time. When one considers the risk parameters associated with your investment in First United compared to the overall NASDAQ, our performance looks even better. As you review this year’s Annual Report, you will see a consistent trend of asset growth and earnings improvement. You will see a dividend that has been increased every year. It is our goal to continue this trend, and further improve our financial performance.
We will do this by continuing to sharpen our focus on building long term relationships with customers who value our service and solutions approach to financial solutions. We will be paying particular attention to business owners within our markets who are oriented to the communities in which they live and work. These community oriented business owners, regardless of their size, have needs that can be best addressed by a bank with First United’s profile: small enough to customize the solutions they need to be successful, personal enough to know both their business goals and their individual dreams. Yet, large enough to offer the full array of financial services required to meet their needs.
As we grow, we want to stay close to our communities. This is essential if we are to be successful in achieving the goals. To help us with this, we have our Board members, which in addition to broad expertise in a variety of fields, also have their roots in several of the communities we serve. Supplementing this is our Advisory Council, which is made up of several prominent business people throughout our market area. They are invaluable in helping us understand our diverse markets and how we can best capitalize on the opportunities each one possesses. This year, we have taken a further step to help us strongly connect to our growth markets of Morgantown, Hagerstown, Frederick and Martinsburg. Each will be lead by a market president that both knows the market well, and is well known within that market. Each will have wide latitude to help us become better in understanding the needs and wishes of our communities and customers. I welcome Dave Kelley, Patti Young and Tom Cummings into their new roles, and look forward to working with them.
Our success is the result of the strong and strategic direction we receive from your Board of Directors. They continue to both challenge and support us in our efforts to bring our Company to even higher levels of financial performance. Since our last meeting, Andy Walls has joined the Board. He brings with him a wealth of knowledge as the successful owner of Morgantown Printing & Binding. On a sadder note, we bid a fond farewell to Rex Burton who will be leaving the Board as an honorary director under the Company’s retirement policy. Through the years, Rex has been a great director, and his counsel will be missed.
At the core of our success are the efforts of a dedicated staff of associates committed to making First United the most outstanding financial institution in our market. On behalf of these fine associates, I thank you for your support and look forward to serving you in the years to come.
Thank You!
[slides follow]