FIRST UNITED CORPORATION
2008 Annual Meeting of Shareholders Presentation
May 8, 2008
BILL GRANT
Slide 1: Bill Grant
Good morning, fellow shareholders, and welcome to your 2008 Shareholders’ Meeting. As we all know, 2007 turned out to be a very challenging year for the economy in general, and financial institutions in particular. I am very pleased to tell you that your Company again posted record earnings for 2007 at $2.08 per share. While we were somewhat disappointed that the percentage of growth had not been more, we have since learned that many of our peers actually went backwards in 2007. Later on, Carissa Rodeheaver will provide you with an in-depth view of our performance, and I will report to you on how our performance stacks up with our peers. I would like to turn the podium over to Bob Kurtz, our President and Chief Risk Officer who has done a great job in keeping us mindful of the shoals and risks that confront us.
Before I turn the stage over to Bob, I want to call your attention to the fact that our reports contain forward-looking statements. Forward-looking statements do not represent historical facts, but statements about our beliefs and intentions for the future. These statements are evidenced by terms such as “anticipate,” “estimate,” “should,” “expect,” “believe,” “intend,” and similar expressions. While these statements reflect the Company’s good faith beliefs, expectations, estimates and projections about, among other things, the industry and markets in which the Company operates, they are not guarantees of future performance and they may not prove true. These projections involve risk and uncertainties that could cause actual results to differ materially. For a discussion of these risks and uncertainties, see the Risk Factors contained in the Company’s 2007 Annual Report on Form 10-K that was distributed along with your proxy materials.
Bob…….
BOB KURTZ
Slide 2: Bob Kurtz
Good Morning!
Slide 3: Subprime Lending/Foreclosures
What a difference a year makes! As I reported to you this time last year, we were starting to see a slow down in the economy along with a lot of media attention to the “sub prime” lending markets. Throughout 2007 and most likely for the rest of 2008, the sub prime market has had and will continue to have devastating affects on the financial industry, with those effects spilling over into other industries. In many parts of the Country, we have seen the housing market come to an almost standstill, with housing values plummeting, foreclosures going through the roof and loss of jobs seen in various pockets of the Country.
Currently the headlines are filled with reports of a recession, banks having liquidity and capital problems and editorials that the financial industry is in trouble. It is probably a fact that the current economic problems have impacted every bank in the Country one way or another, but as a whole, the banking industry is a very healthy industry today. For the few bank failures that have occurred since 2006, healthier financial institutions have come to the rescue, purchasing the deposits of those institutions. Some of the larger institutions that were involved in underwriting large volumes of sub-prime loans had to find other sources of liquidity and capital, but those sources were found, reinstating the capital ratios required by regulation.
A sub-prime loan is a loan made to borrowers with weak credit records or high debt to income ratios. These borrowers usually pose a higher risk of default and foreclosure. As a matter of policy, First United Bank & Trust does not underwrite sub-prime loans, nor do we purchase that type of loan or security from the secondary market. That is not to say that we do not have a sub-prime loan in our portfolio, but the few that we have, they were underwritten with mitigating circumstances that warranted the loan.
First United is very fortunate to be located in the area in which we are. Although not fully protected from the economic perils of many areas of the Country, Maryland and the bordering states are somewhat insulated from the economic affects that we read so prominently in the media. We believe our close proximity to Washington DC has a positive effect on our economies.
First United has not escaped the downturn in the economy. As you will hear from Carissa, we had an excellent year in Balance Sheet and Income Statement returns. But, aside from that, 2007 was a challenging year to maintain the credit quality standards that we have enjoyed for years. Throughout our market area we have a concentration of what we call A&D loans or “acquisition and development” loans. We lend money to developers who purchase large tracks of raw land and as they build out the infrastructure, such as roads, water, sewage and certain other amenities, these developers sell the unimproved lots for future housing. As we have seen the inventory of built homes for sale increase measurably over the past year or two, the A&D market has slowed considerably, but is not at a standstill. Fortunately for First United many of these developers have strong balance sheets and sufficient equity in their properties to have the ability to reduce the price of their lots before taking a loss. Due to historical low interest rates and a strong demand coming out of the Baltimore, Washington and northern Virginia corridor, we are optimistic about an up turn in the housing market throughout our market area.
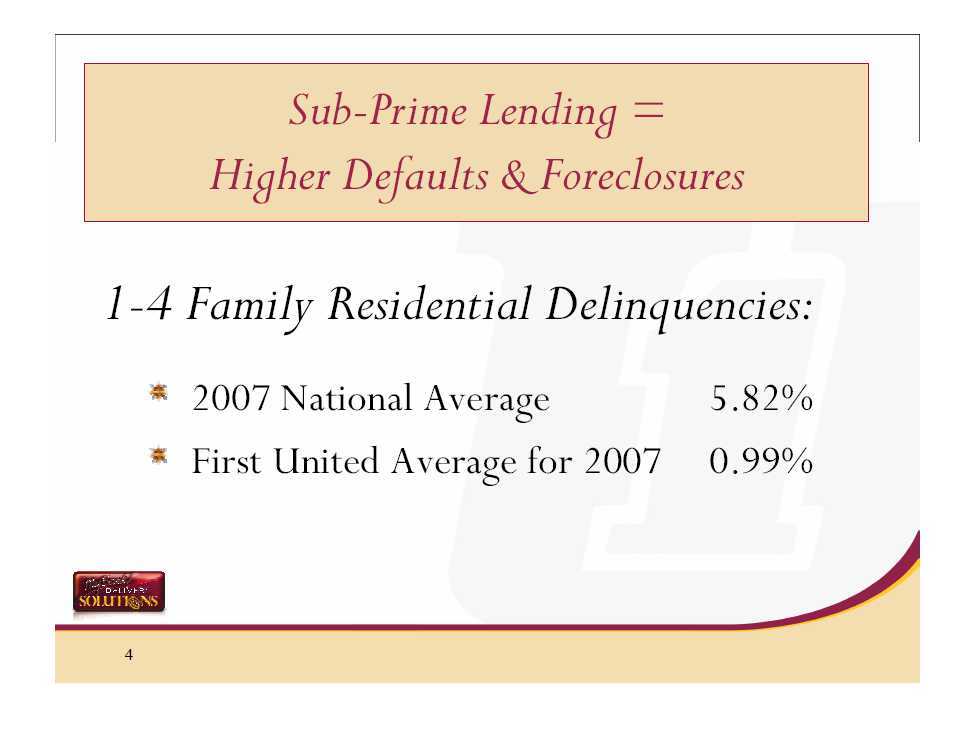
Slide 4: Subprime Lending
Let me share with you some of First United’s credit quality ratios for 2007. Your Bank experienced only eight foreclosures in 2007, compared to four that we experienced in 2006. None of those foreclosures was a result of an increase in the interest rates on the underlying loans due to an adjustable rate mortgage loan, which appears be the problem in many parts of the Country. With a national average delinquency rate of 5.82% for 2007, First United ended the year with an average loan delinquency rate of just .99% for 2007, less than 20% of the national average. First United’s 1-4 family residential mortgage portfolio ended the year at .73%, while commercial loans had also an impressive ratio at .84%, each well below national averages.
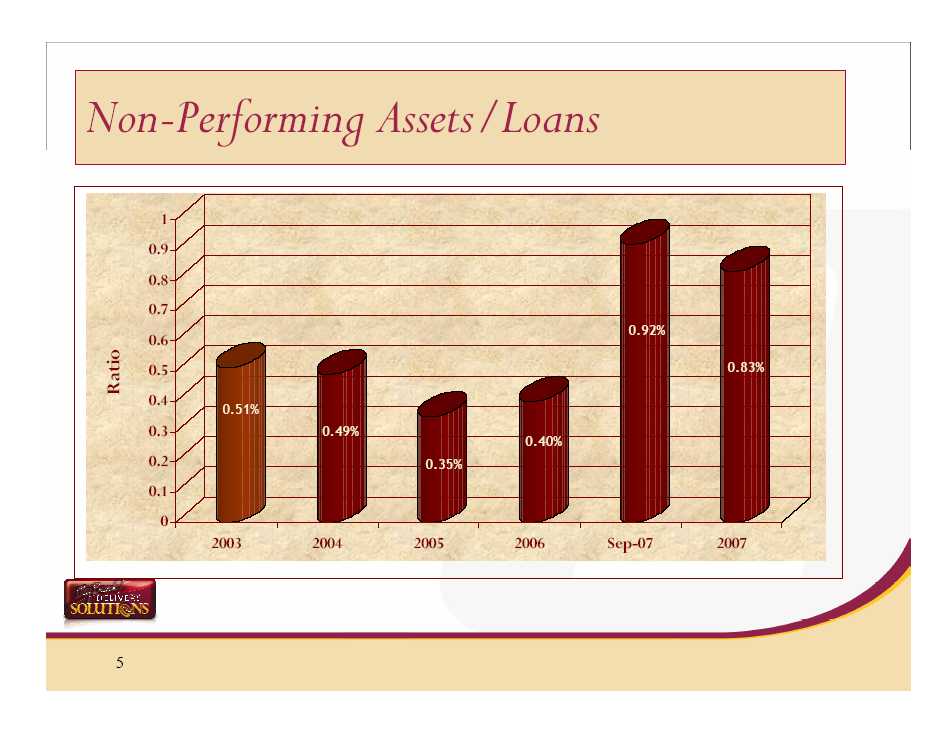
Slide 5: Non Performing Assets
Non-performing assets, those loans 90-days or more past due plus non-accrual loans, increased considerably in 2007 from $3.8 million at the end of 2006 to a high water mark of $9.4 million in September. Since then, through the efforts of many of our Associates within our Organization, we have seen the dollar amount of non-performing loans decrease, as we continue to work through some challenging times.
The times are challenging, but your Management team is optimistic that we will work through these issues while maintaining the high quality standards that are traditional at First United.
Thank you!
CARISSA RODEHEAVER
Slide 6: Carissa Rodeheaver
Good Morning!
Slide 7: Pollyanna Principle
One of my favorite movies when I was growing up was the children’s classic, “Pollyanna”. Of course, when my children were young I bought this movie and hoped that they would enjoy it as much as I did in my youth. Being boys, they weren’t quite as excited about the movie, but I did borrow Pollyanna’s game which she called “the glad game”. The purpose of this game was to formulate a positive, optimistic outlook on life and all of the situations that you encounter. In every situation faced, look for something good that you can be glad about. I played this game with my children as they grew up and often when they complained about a situation, I would remind them of the glad game and ask them to think of something positive about the situation. Well, during 2007, I reminded myself many times to play the glad game. During the year, the banking industry faced compressing margins, intense competition for retail deposits, an economic downturn, a decline of one percent in the Fed Funds rate and a crumbling housing market. Kind of hard to find much good in this picture isn’t it? But, as I thought about what I would present to you today, I couldn’t help but think of all of the things that we as owners of First United Corporation have to be glad about. Aren’t you glad that in spite of all of the financial obstacles, we had yet another profitable year for our company? Aren’t you glad that we continue to see steady, profitable growth in our assets? Because of this profitability, aren’t you glad that we continued to pay a healthy dividend to our shareholders? How about this, aren’t you glad we weren’t part of the sub-prime housing crisis experienced by many banks in 2007?
Today, I would like to share with you our financial performance for 2007 and the areas where we set the stage for future growth and profitability. For more detail, I encourage you to read the Management’s Discussion and Analysis section of the Form 10K which was recently mailed to all shareholders and is available on our website.
Slide 8: Net Income
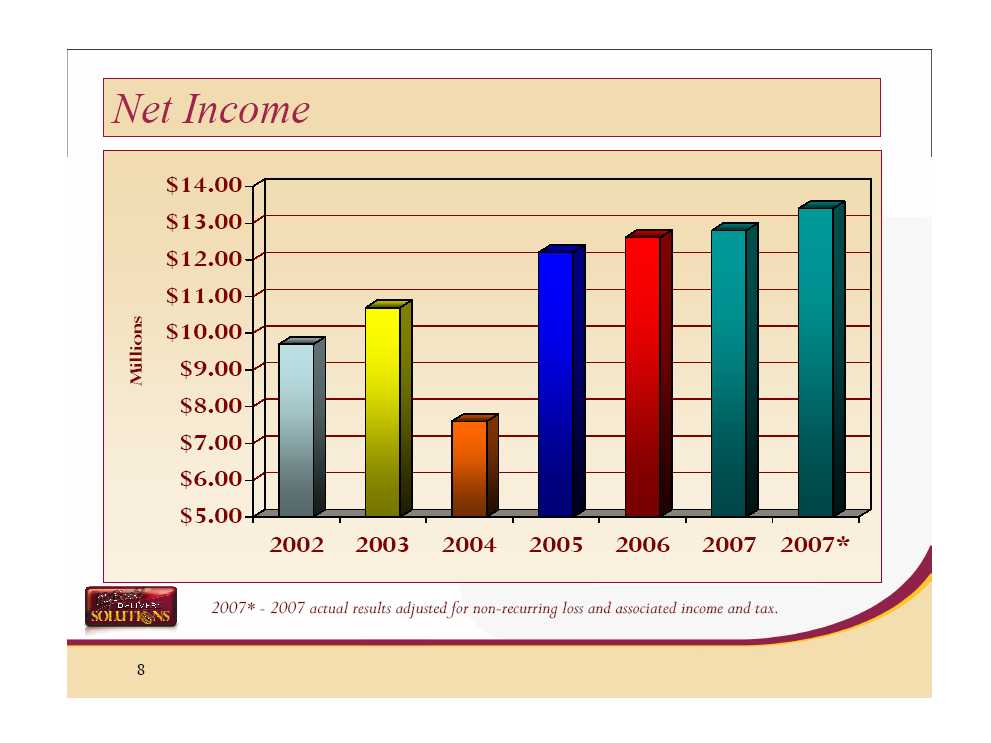
Our net income for 2007 was $12.8 million. This reflects only slight growth over 2006 of $217,000 or 1.7%. The reason for the limited income growth was a $1.6 million pre-tax loss recognized by the company in March and April as a result of a restructure in our investment portfolio. This restructure allowed us to reinvest proceeds from the sale of securities into higher yielding securities that should result in higher income in future years as well as a more laddered cash flow structure in the portfolio. The loss on the securities was offset by higher other operating income, particularly trust department income, insurance commissions, secondary market fees, and debit card income.
This chart shows 2007 actual net income and 2007 net income as adjusted for the non-recurring securities loss adjusted for associated interest income and taxes. This is denoted in the last column showing 2007 with the asterisk.
Slide 9: Asset Growth
Our total assets reached $1.48 billion at December 31, 2007, representing an increase of $130 million, or 9.6%. Our investment portfolio grew $42 million, or 16%, over 2006 as a result of additional investment leverage strategies implemented throughout 2007. In addition, our loan portfolio increased by $80 million, or 8.3%.
Slide 10: Loan Growth
Gross loans reached $1.043 billion at year end driven primarily by commercial and residential loan growth. Origination of new commercial loans and participations with other banks remained high in 2007, as we saw expansion in both our new and existing customer relationships in all of our market areas. However, unlike in 2006, we saw much slower payback in our portfolio resulting in higher growth levels. Most of our residential loan growth came from the purchase of a $25 million mortgage portfolio early in the second quarter of 2007. Consumer loans continued to decline, mostly in the indirect auto portfolio. Steve Lantz will provide more detail on the loan portfolio in his presentation.
Slide 11: Deposit Growth
Total deposits increased by $121 million in 2007, or 12%, when compared to 2006. This growth was attributable to successful retail and brokered growth in money market deposits and our adjustable rate prime saver account.
Slide 12: Net Interest Income
Net interest income continues to be our largest source of operating revenue contributing 75% of our total revenue stream. It is the difference between the interest we earn on loans and investments and the interest that we pay for deposits and other borrowings. The 2007 rate environment painted the opposite picture of 2006. In 2006 short-term rates increased 125 basis points and long-term rates remained relatively level. The result was an inverted yield curve. In 2007, rates turned and declined 100 basis points as we started to see the yield curve show some signs of returning to a positive slope. Total net interest income for 2007 was $44.2 million, an increase of approximately $3.3 million over 2006. First United Bank & Trust was well-positioned for the rate decline with a slightly liability sensitive balance sheet. Essentially, this means that our deposits and borrowings re-priced faster than our loans producing higher net interest income.
Slide 13: Net Interest Margin
Managing our net interest margin has been a high priority for our Treasury team. We saw only a one basis point decline in margin from 3.52% to 3.51% during a period when many financial institutions experienced a much higher decline. Our institution kept our deposit portfolio short in order to properly match our adjustable rate loan portfolio.
Slide 14: Other Operating Income
As indicated on this chart, other operating income showed a healthy increase of $1.1 million, or 7.4% over 2006. Net of the non-recurring loss recognized in March and April of 2007, fee income increased by $2.7 million or 18.9%. This is shown in the second green bar denoted by 2007 with the asterisk. The growth experienced in 2007 is attributable to solid growth in our trust department and insurance lines of business as well as service charge income. Val Teagarden and Gene Helbig will present more detail in their presentations.
Slide 15: Other Operating Expense
Other operating expense for 2007 increased by $3.0 million, or 8%, over 2006. Salaries and employee benefits represent approximately 54% of this category and accounted for half of this increase. The 2007 increase is due to the hiring of market presidents to strengthen our presence in key market areas, expansion of our branch network and normal merit increases. Occupancy and equipment expenses also increased related to expansion as well as the opening of our operations center in 2007.
The following ratios are monitored by our internal management as well as the investment community as a measure of financial performance. They are all dependent upon the profits of our company. All of the ratio charts will show our financial performance for 2007 both before and after the non-recurring loss.
Slide 16: Efficiency Ratio
The first ratio we will review is the efficiency ratio, which represents how efficiently the company manages its overhead expenses. In this case, a lower number indicates better performance. We saw our efficiency ratio increase slightly to 63.02% from 62.77% in 2006. Again, the last green bar on the chart shows the ratio improving to 62.08% exclusive of the non-recurring loss. The improvement was driven by an increase in our other operating income and net interest income resulting from the profitable trust and insurance lines of business and the implementation of successful asset-liability strategies over the past few years.
Slide 17: Return on Average Equity
The return on average equity represents how well the management of our company invests our capital. 2007 shows a slight decline in this ratio from 13.07% in 2006 to 12.70% in 2007 due to the non-recurring loss. Exclusive of this loss, we experienced a slight increase to 13.38%.
Slide 18: Earnings per Share
This chart demonstrates a solid, steady growth in earnings per share as we grew to a reported $2.08 per share and $2.19 per share exclusive of the non-recurring loss. This represents 7% growth over 2006 during a year where many financial institutions reported shrinking margins and negative to minimal earnings.
Slide 19: 2008?
In summary, your management team and the employees of First United Corporation have accomplished yet another impressive year of financial performance. We continue to manage your company not just for today, but for the future. 2008 first quarter results will be announced within the next couple of days. Even in light of the challenging housing market and slowing economy, we continue to be optimistic about the year ahead. We will continue to look for opportunities to enhance shareholder value as we focus on non-interest income, managing our margin and working towards higher efficiencies. The Pollyanna Principle refers to optimistic thinking. We will take this one step further and build that optimism into our actions. In keeping with my opening statements, I recently read an article by Francis Hall entitled Positive Thinking: Pollyanna Syndrome. The message in this article was that while we don’t have to turn into Pollyanna, “positive thinking is the only sensible way forward because thinking creates our reality.”
Thank you!
STEVE LANTZ
Slide 20: Steve Lantz
Welcome—During 2007, gross loans increased by 8% or $80 million over 2006. The growth was primarily focused in our commercial area with $84 million in growth and residential mortgage and construction loans with $24 million in growth. These were offset by a $28 million decline in consumer installment loans. This realignment of our loan portfolio is consistent with management’s objectives to grow higher yielding commercial loans.
Slide 21: Loans Outstanding
Commercial loans increased 20.6% or $84 million in 2007. Origination of commercial loans remained high in 2007, similar to 2006. The growth was underpinned by a blend of internal loan production in our local market areas and the purchase of loan participations with other financial institutions. Most new commercial loans were priced on a variable rate basis, resetting monthly up to 5 years in duration. Commercial loans are collateralized primarily by real estate and to a lesser extent, by equipment and vehicles. Unsecured commercial loans represent an insignificant portion of total commercial loans.
Residential mortgage loans increased 7% or $25 million in 2007. Growth in the mortgage portfolio during 2007 was primarily fueled by the acquisition of a pool of mortgage loans. The $25 million purchase of the mortgage pool was consummated at the end of April, 2007. Management elected to consummate this purchase based on our expectation that residential purchase money mortgages and refinance loan volume would not be heavy in our market areas in 2007. Residential portfolio adjustable rate mortgage loan growth was flat for the year as customer’s preferred locking into a fixed rate mortgage. Our portfolio loans are primarily adjustable rate mortgages. The bank primarily originates fixed rate loans to be sold into the secondary market and not to be held in our portfolio.
Consumer installment loans decreased 15% or $28 million in 2007. This decrease reflects management’s continued shift towards commercial loans with less emphasis on the highly competitive consumer loan market. Specifically, less focus was placed on growing our automobile indirect loan business. We continue to value our current dealer relationships but growth in this sector has not been our priority.
As we look forward, we intend to continue the pursuit of profitable and sound loan growth. We anticipate the main driver of growth will be in business loans, and we expect continued flat to lower growth in our consumer business. Consistent with 2007, we will continue to do our best to increase net interest margin. On behalf of our entire production team thank you for your support.
ROBIN MURRAY
Slide 22: Robin Murray
Good morning, at this time I am pleased to share with you, your company’s essential Retail Banking strategies and provide you a brief overview of this team’s 2007 performance.
Last year, I announced several new initiatives we implemented to improve the performance of our Retail Banking franchise. We realigned their goals, metrics, and incentive programs. In addition, we have successfully recruited a Market President for each market area we serve. I am delighted to inform you that these enhancements are making a difference in our execution efforts. Let’s look at the Retail Banking team’s accomplishments.
Slide 23: 2007 Deposit Growth
One of this group’s most important tasks is to grow core deposits. Deposit growth is truly the soul of the banking franchise and is a key performance ratio for our Retail Banking team. Bank deposits in Maryland grew by only 2.4% last year, the weakest growth since 1997. In spite of the industry trends, First United’s Retail Banking team grew $64 million in deposits last year.
Slide 24: Top Maryland Banks Deposit Growth
As a matter of fact, in a recent article that was published in the Business Gazette, our bank ranked number 2 in deposit growth last year among Maryland banks. This was a tremendous improvement from our Retail Banking deposit growth performance in 2006.
We continue to focus on our strategy of developing relationships with Community Oriented Business Owners. Business owners that are very involved in the community in which they live exhibit a higher perceived value of relationship banking. We can serve not only their business needs but also their personal banking needs. This strategy has enhanced our ability to grow deposits, loans and fee income for your Company.
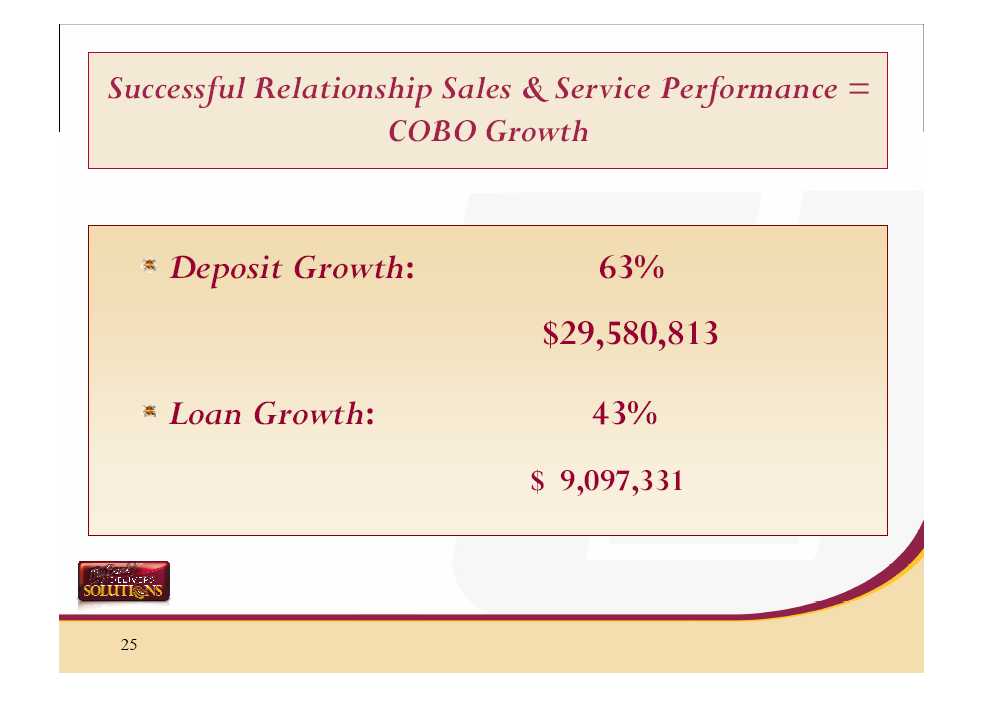
Slide 25: Sales & Service Performance
Another key metric for our Retail staff last year was to measure their effectiveness in growing business owner relationships. Each manager chose 10 business owners and developed a calling strategy for building relationships with each one. With concentrated execution of a strategic plan, targeting a specific user group, our team succeeded in growing deposits among this group by 63% and loans by 43%.
In addition, much of our Retail team completed several courses on consultative sales and service training, as an on-going effort to facilitate delivering solutions and interacting with our prospective and existing business owners. To gauge the effectiveness of our training initiatives, we had an outside research firm measure our mystery shopping scores against our customer satisfaction survey results. Were we seeing an improvement in proactively identifying sales needs and was that reflecting back to a higher customer satisfaction rating? This is where the rubber meets the road with their execution efforts.
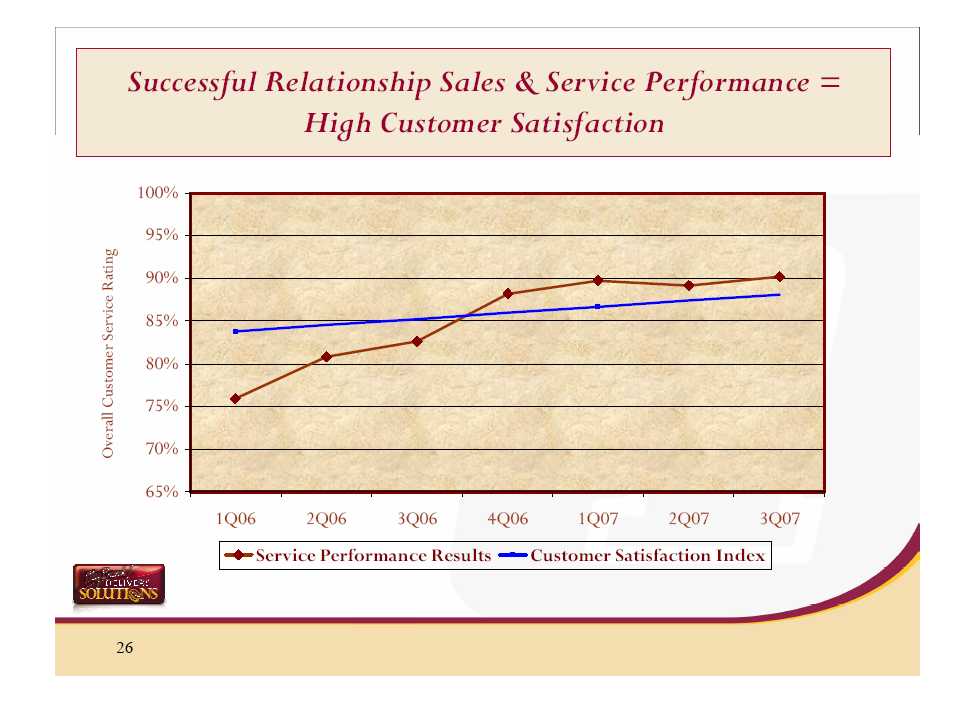
Slide 26: High Customer Satisfaction
I am thrilled to report this is exactly what happened. As you review this chart, you can see that our mystery shopping scores, which is identified by a red line, has continually showed improvement throughout 2006 and 2007. The blue line, which represents our customer satisfaction survey ratings, is also trending upward. This chart pin points as we improved our sales process of delivering solutions, it truly did equate to a higher level of customer satisfaction ratings. We know this is exactly the type of service that Community Oriented Business Owners value and come to expect from their bank. We must execute this strategy better than any of our competitors and continue to hone our sales skills as we move forward.
In the summer of 2008, we will begin construction on our third retail banking office in Morgantown. This location will not only provide retail banking products, but will also house specialists for our non-traditional services. This is yet another convenient site for our Morgantown customers to conduct their financial relationships, and will provide additional income for your Company. We are excited about the many growth opportunities this franchise expansion will offer us as we move forward.
Slide 27: Sales & Service - 2008 Execution
In conclusion, our 2008 initiatives will be focused on continually enhancing our business owner strategy and becoming entrenched in community involvement. We will continue our efforts on becoming more effective at proactively delivering solutions and attracting new customers. We must excel in exceptional customer retention and strong multi-product utilization. We will tailor these initiatives around expanding revenue opportunities for our well-defined and targeted business owner strategy. Effective execution of these strategies should enhance shareholder value and position us for continued success in years ahead. Thank you.
RICK THAYER
Slide 28: Rick Thayer
Slide 29: Strategic Planning
We are now into the second year of our customer driven strategy of focusing on community oriented business owners, or what we call COBOs.
We have taken of number of steps to implement our strategy. For example, we have hired Market Presidents in all market areas. These experienced individuals bring decision making closer to the customer, a trait valued by COBOs. We have worked to increase the number of specialists in Commercial Lending, Trust and Investments and Insurance in our growth markets of Morgantown, Martinsburg, Hagerstown and Frederick to develop local sales teams. And, with our conversion to a new computer platform, our bankers have more and better tools to track and manage customer relationships.
Slide 30: Marketing
In Marketing, we are supporting our strategy in several ways. In 2007, we conducted several surveys to gauge the needs of COBOs, both our customers and those who use other financial institutions. A consistent theme was that COBOs want us to help them solve their financial challenges. That is, they want us to deliver solutions.
We have developed this simple, yet powerful notion into a brand promise, “My Bank Delivers Solutions”. Our new logo forms the face of our promise to our customers and is highlighted on the cover of our annual report. We are promoting our brand through media, community events, bank seminars and branch merchandising.
In addition to our branding activities we are have several other initiatives underway to support the sales staff. For example, we are identifying and contacting customers who are at risk of leaving the bank. We are also contacting new customers to welcome them to the Bank, offering additional products and services. And, as opportunities arise, we conduct product specific campaigns to bring in new customers.
2008 promises to be an exciting year as we move deeper into the implementation of our strategy and as we continue to develop tactics to help us achieve our strategic goals.
JEANNETTE FITZWATER
Slide 31: Jeannette Fitzwater
You’ve heard Rick comment today about our new branding strategy, “We Deliver Solutions.” While this is primarily targeted for customers, it also applies to potential and current associates.
Slide 32: Increase wellness of associates
Almost daily, we all hear messages about how we need to decrease the cost of health care. One obvious way to obtain this solution is for each of us to become healthier. With good health, there is typically less expense, more productivity, and our associates generally enjoy an even better attitude about life.
In helping to deliver this solution, we have an employee team devoted specifically to our wellness initiative. We began this effort two years ago. This year we have enhanced it further to provide a specific program of activities, which if completed, will give our associates an opportunity to waive their insurance deductible next year. As a result, recently we experienced a 37 percent increase in participation of our health screenings, and overall participation in health related programming has increased substantially. Therefore, wellness success provides solutions for both the associates and the Corporation.
Slide 33: More efficient and effective staffing
With recruitment and retention of our staff members, it is a continual effort in fine-tuning. During 2007, we began some baseline tracking for the time it takes to fill our Customer Service Representative (teller) positions. Since our tellers are a key to maintaining service levels in the branch environment, it’s extremely important to fill these positions in a timely manner. The “time to fill” metric essentially measures how efficient you are in your recruitment and selection process.
At the same time, we want to keep these associates once they come on board. So we continually track turnover rates. During 2008, we will further focus our efforts by identifying ways to retain associates during their first year of service, and especially during their first 90 days of service. We, like most companies, find that the greatest challenge for associate retention is during this first year. Therefore, in trending these metrics we hope to improve our overall “on boarding” experience, which will result in better associate retention during this critical time period.
Slide 34: Better communication, while gaining efficiencies
The growth of on-line capabilities has served our associates well. Through migration to better systems, our associates may now receive information at any time 24/7, regarding their payroll, benefits and other basic employment information. This supplements the personal contact that is always available by our staff, during regular business hours.
Our prospective employees are also using more technology to a greater level. All employment applications are taken on-line, allowing for immediate e-mail responses to prospective candidates. Naturally, we follow up with a more personalized approach as the recruitment process continues. Our communication levels have improved. As a matter of fact, we find that our applicant flow has increased 50% since we have focused our efforts to an on-line environment. In addition, CareerBuilder, an on-line job search website has become a primary recruitment source. These technological solutions improve our contact with our prospective employees, and provides cost-effective efficiency at the same time.
Slide 35: Continual learning to support corporate goals
You’ve heard us mention that our targeted customer focus is to grow relationships with Community Oriented Business Owners (COBOs). To be effective, we need to be able to identify these prospects and customers, be versed in understanding and serving their needs and be adept at delivering solutions. During 2007, we fine-tuned all of our primary training programs in order to better focus in these areas.
With the conversion to a new core processor in 2008, these programs are being further enhanced to take advantage of our new system changes. Best of all, we anticipate that the ease of training will be enhanced, and ultimately decrease our training time by a minimum of 25%. So, through continuous learning we will reduce our training expense, return associates to the front line earlier and be able to focus more accurately on meeting the needs of COBOs. It’s a wonderful example of how fitting all the pieces together helps us to strategically meet our goals.
Slide 36: Full logo screen
Delivering solutions has become an everyday way of life. One day it may be focusing on improving the overall health of our team. The next day we work even harder to search for effective staffing solutions. Typically, this includes employing technology improve our communication methods. And, certainly continuous learning supports each and every aspect of the strategic plan.
I’m proud to say that at My Bank we do deliver solutions to customers, associates and shareholders!
GENE HELBIG
Slide 37: Gene Helbig
A very pleasant good morning. As is our custom every spring, I am pleased to be here once again to report to you First United Trust and Investments financial results. First I will share some financial data and continue with some survey findings.
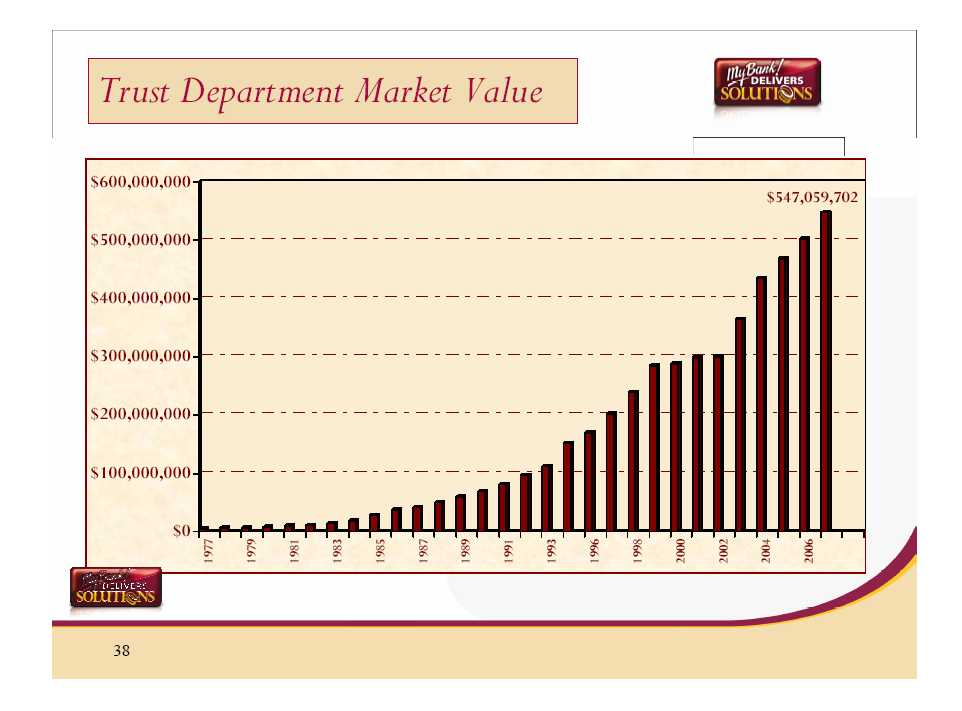
Slide 38: Trust Department Market Value
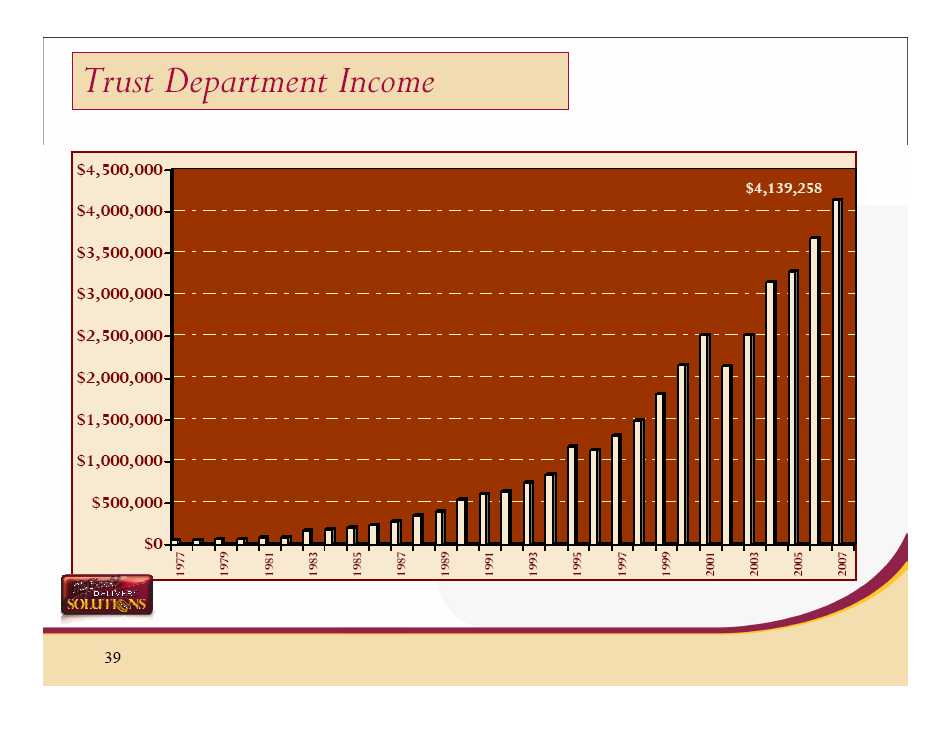
As of December 31, 2007, the market value of assets under management grew to $547,000,000 or 8.9%. This does not include an additional $137,000,000 from the Investments side. The Gross Trust Revenue grew to $4,139,000 or 12.26% while Investment Services Revenue grew to $733,000, an increase of 46%. The net income generated from the Trust and Investments Department continues to be invaluable and represents 13% of the Corporations Earnings per Share.
Slide 39: Trust Department Income
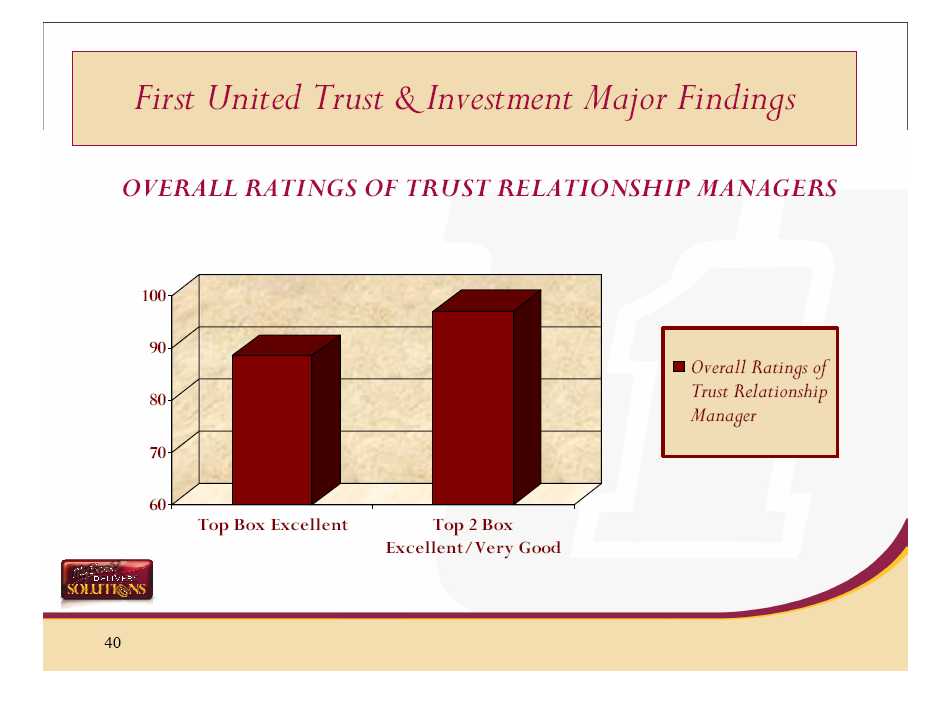
Slide 40: Trust & Investment Major Findings
Slide 41: Survey Results
Although the Investment return is important to the continued growth and success of any wealth management or investment advisory firm, equally important is providing customer service and establishing relationships. This is what sets us apart from the rest of the pack. This slide shows that 88% of surveyed respondents rated our Trust and Investment relationship managers (Trust Officers and Investment Executives) excellent while 96% rated us as either excellent or very good. We’re thrilled with these very high scores. For this next screen, respondents indicate how well they believe we met their expectations; 24% of the time we exceed their expectations, 69% of the time we met expectations and less than 7% of the time they maintain we fell short. We’re pleased with these results and are challenged to maintain high standards.
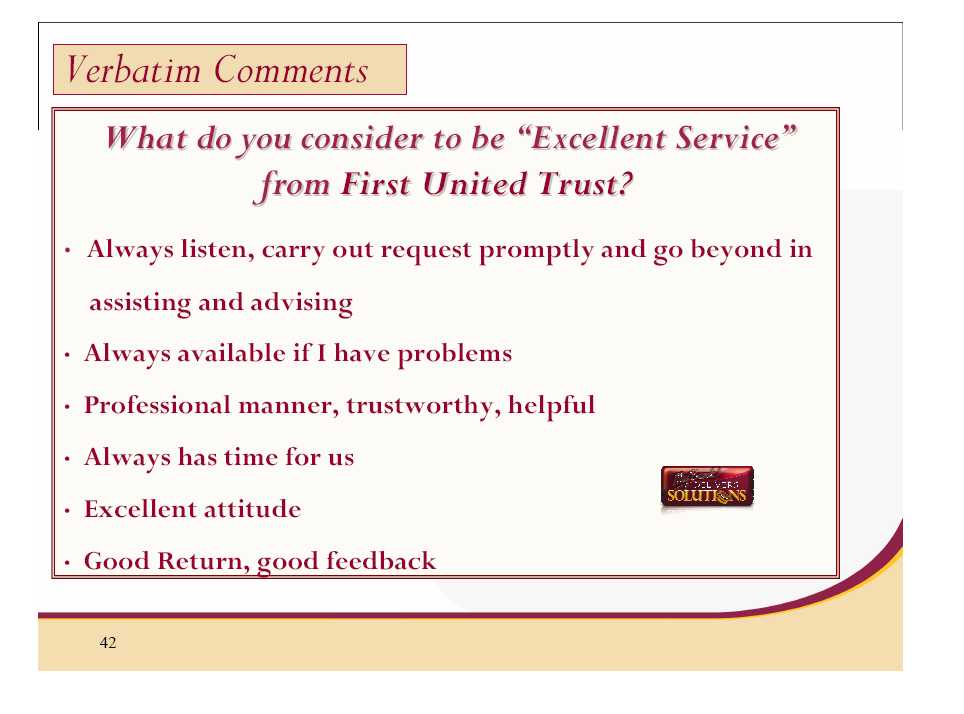
Slide 42: Customer Satisfaction
For reference I am including some quotes written by Trust and Investment customers on their survey forms. The question was “What do we do that you consider to be excellent customer service?”
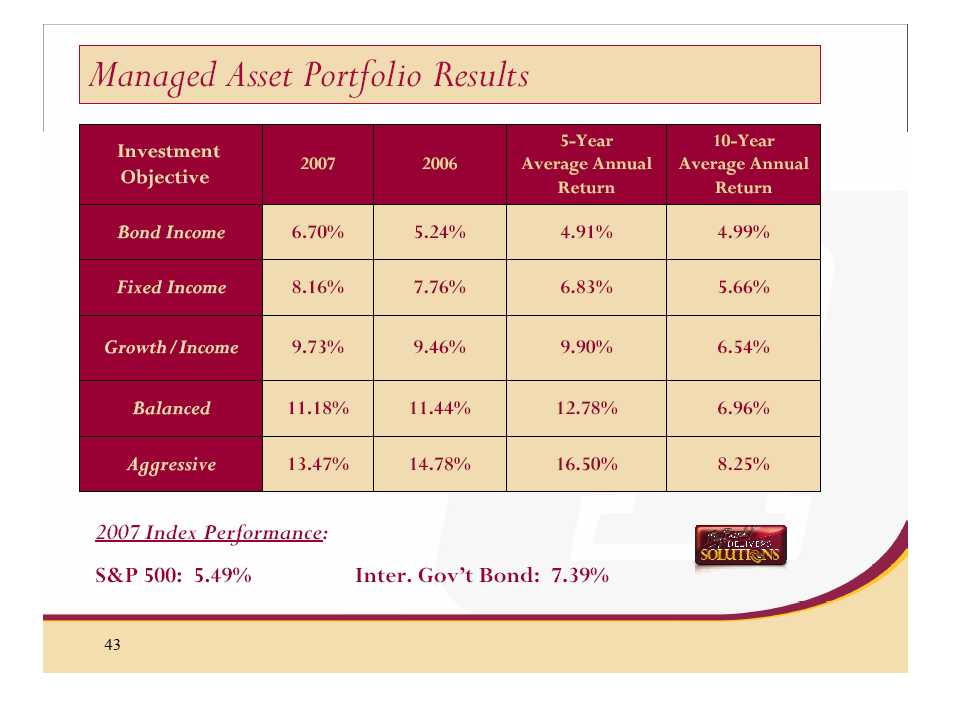
Slide 43: Managed Asset Portfolio Results
Of course customer service in our industry is meaningless unless excellent investment returns are provided. This final slide depicts the returns reported from our core investment product, MAP. Of particular note this year, not only did most of our models beat the S&P index on a risk adjusted basis, they also beat the S&P index head to head. While the S&P index is compiled of a broad base of equities, usually more aggressive in nature, our MAP models also include much more conservative investments such as bonds and cash.
The results I have shared with you today easily convey that both great customer service and competitive returns can be found right here at First United Trust and Investments.
Thank you and enjoy the rest of this pleasant day.
VAL TEAGARDEN
Slide 44: Val Teagarden
Welcome, First United’s insurance division experienced exciting changes during 2007. The soft market continued throughout 2007 and into 2008. This created many challenges and opportunities for us as an organization. Through this market shift, we still were able to continue our growth and acquisition objectives and not decrease our profitability margin.
Slide 45: 2007 Update
Restructuring:
During 2007, we restructured the division in order to position ourselves for growth in the future as well as efficiencies. The new organizational chart consists of a head of sales, operations and life and health. This should allow us to focus more on revenue growth, retention and future acquisitions.
Acquisition Opportunities:
During 2007, we completed two acquisitions. Both acquisitions consisted of life and health business. The larger of the two, M. J. Fisher agency in Cumberland Maryland, provided a solid foundation to build this line of business upon. We were able to transition this book of revenue and utilize the relationship to grow business in other lines of insurance as well as develop the banking relationship. The second acquisition was a small book of revenue which we folded into our current operations.
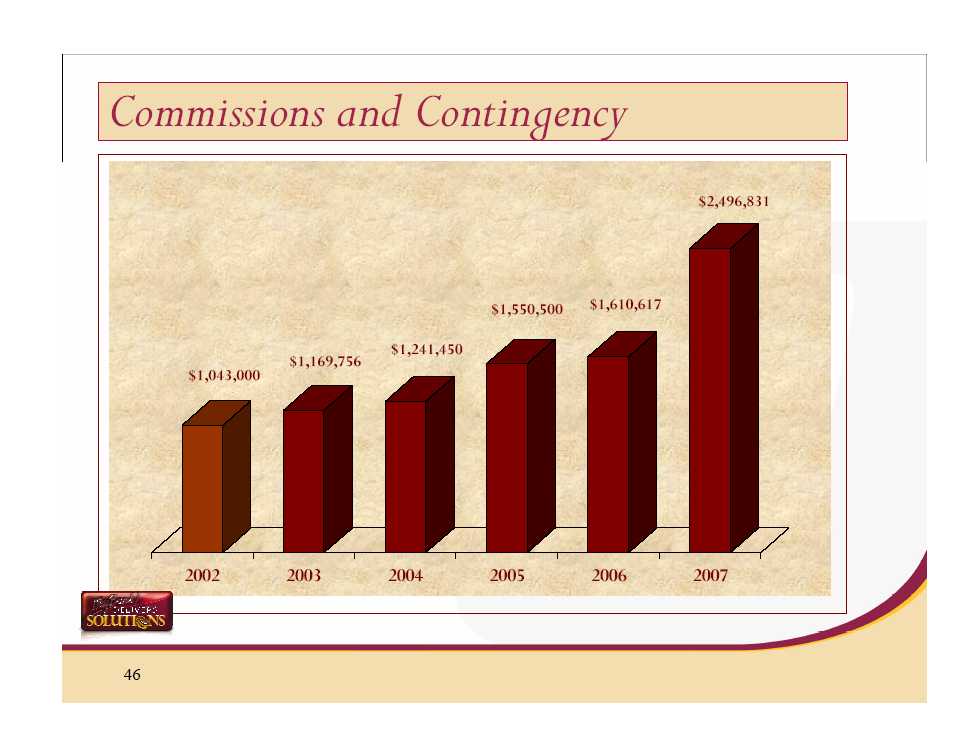
Slide 46: Commissions and Contingency
The Insurance Group has shown growth in revenue since 2001. During 2007, we were able to continue that trend with a combination of organic growth, acquisition growth and accrued contingency revenue. The annual revenue grew from $1,610,617 in 2006 to $2,496,831 in 2007. Of this growth, 16% was organic, 63% acquisition and 21% from accrued contingency. We were able to accrue contingency revenue due to a combination of increased premiums and controlled loss ratios.
Slide 47: Return on Revenue
We also track the margin between revenue and expense. This is referred to as the annual ROR or Return on Revenue. During 2007, the division produced an ROR of 25%. As illustrated in the graph, we were able to increase our revenue while controlling the expense associated with growth. First United Insurance Group’s objective is to see an increase in the ROR while expanding and growing the division.
Slide 48: Return on Investment
In addition to the previous measurements, we utilize Return on Investment or ROI. Over the past years, the ROI has increased and was 18.87% in 2007. First United Insurance Group’s goal is to continue ROI growth through a combination of increased revenue and expense control.
Thank you for allowing our team to grow your insurance business and we look forward to many successful years in the future.
JASON RUSH
Slide 49: Jason Rush
Good morning,
Efficient, according to Webster’s Dictionary, is defined as being productive without waste. For a Bank, production is measured in terms of growth, for example loan growth and deposit growth. Waste within an organization is measured in terms of time and money spent unnecessarily to obtain that production.
Areas within the Bank that generate deposits or loans manage the production side of the equation. The areas that I manage, as the Director of Operations and Support, must work to control the other side of the equation. When production is increasing and waste is decreasing we become a more efficient company. Let’s talk about some of the things your Company is doing on the operational side to become a more efficient company.
Slide 50: Creating Efficiencies
Many of you may have heard the terms six sigma or Lean. These are process improvement programs to cut waste from procedures and help organizations become more efficient. While these efficiency oriented programs are typically spoken of in the manufacturing industry the principles have not been regularly used in the financial services industry. Your company became the first Bank in the State of Maryland to adopt a formalized Lean program and commit to training an in house Lean Facilitator. We held several Lean events in 2007 and have been pleased with the financial results.
Slide 51: Branch capture machine
My Bank has a large geographical footprint with Branches in some cases over a hundred miles from our operational areas. The transporting of our paper items, such as deposits and loan payments, on a daily basis from the Branches to the processing area of the Bank are quite costly. In 2007 we were able to cut our courier costs substantially by taking advantage of a technology called Branch Capture. Branch capture allows us to capture images of those paper items and send them electronically from our Branches to our Operational area. We are then able to send those same items electronically on to the Federal Reserve to be processed. In addition to cutting our courier costs it also allowed us to extend our cut off time at the branches. Prior to this change, any transaction conducted at a branch after 2 pm was not credited to the customers account until the next business day. We are now able to process transactions on the same business day right up until the time the Branch physically closes.
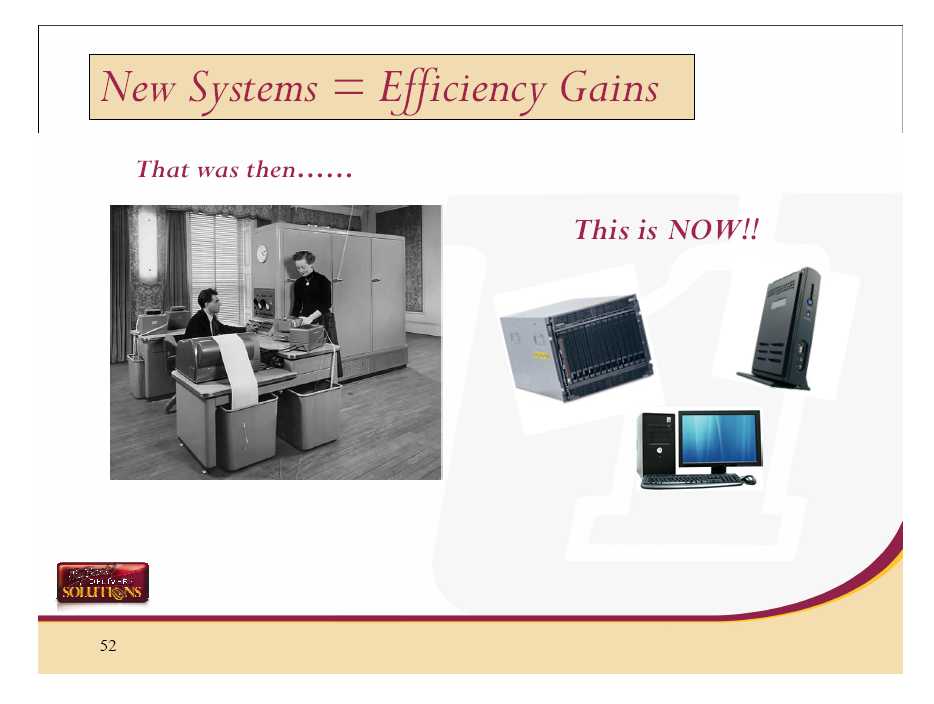
Slide 52: New operating system
Recently we have upgraded our main operating systems. This was done for two primary reasons. The first was to better serve our customers by offering upgrades such as a more robust internet banking platform for both the consumer and business customer including e-statements, retrieval of check images via the internet and on - line account opening. In addition, the new operating system allows our employees the opportunity to better serve their customers with a teller system and account opening system that is more user friendly allowing our employees to spend less time punching keys and more time actively engaged with the customer in front of them.
The second reason for this upgrade was of course efficiency. The new operating system is more tightly integrated. This integration allows us to streamline our operations and grow as a corporation without the need to add additional staff within the operational areas of the Bank.
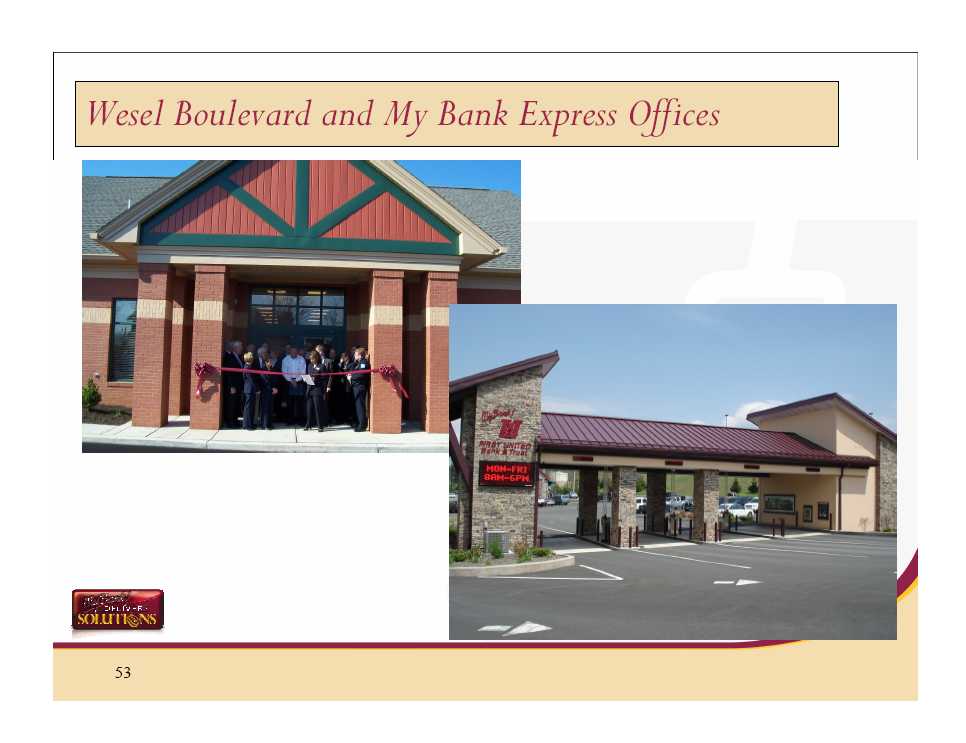
Slide 53: Wesel and My Bank Express
While a large part of 2007 was spent improving our operational processes we did stick with our expansion plan and completed the construction of two new Branch locations. We opened an office on the western side of Hagerstown Md., located on Wesel Boulevard. This location offers strong growth potential for the Bank in a market that has been experiencing significant population and income growth. In addition this site is situated in an area that is surrounded by and convenient to the COBO.
In addition to the Wesel office we have also opened a new drive up facility on the northern end of Oakland Md., the My Bank Express drive up facility. This facility is located on the same property as our Operations Center and offers high visibility and convenience to our customers located in Garrett County.
In closing, the support areas of your company continue to look for opportunities to become a more efficient organization by utilizing proven technology as well as reviewing our current processes and procedures to make sure they best serve the interests of the customer as well as the shareholder of your Company. Thank you.
BILL GRANT
Slide 54: Bill Grant
I thank each member of the management team for these reports. It is through their hard work and leadership that we have the success we are reporting on this morning. In particular, I want to recognize Jason Rush on his leadership on our recent conversion of our core processor. Over the course of the last two years he has lead an effort to assure us that we have the best core processor available to our associates as we serve our customers. He has done this, and together with a lot of hard work by hundreds of associates, we have a data core processor which will move us strongly in to the new century. The shareholder will be pleased to know that our cumulative core processing costs have actually decreased with our new processor.
As you know, we are interested in stressing long-term financial performance at First United. Carissa has already outlined our performance in 2007. I would like to take a few moments and highlight our performance since 1996, the beginning of our watch. To highlight this, I wanted to share some numbers with you.
Slide 55: 13%
The first number is 13%. It may be an unlucky number to some, but for your Company, it represents the compounded annual growth of your Company over these last 11 years, as we grew from $523 million to $1.47 billion. First United is now the third largest publicly traded bank headquartered in Maryland.
Slide 56: 8%
The second number is 8%. This number indicates the compounded annual growth in our earnings per share over those same years. In our first 96 years, we grew to $1.00 per share. Since then, we have more than doubled to $2.08 per share.
Slide 57: 4%
Another number I wanted to share is 4%. This is the compounded annual increase in our regular dividend over the last 11 years. The dividend has gone from $.51 per share to $.76 per share, and has been increased annually for as many years as I can remember.
Slide 58: Ratios
We analyze three key ratios in assessing our performance. We are ranked separately on each of these ratios, and our total performance on all three ratios is compared to the peers.
The first ratio is Non-Performing Assets. This calculates the percentage of our assets that are categorized as non accrual or 90 days or more in delinquency. As you might imagine, this is one of the ratios which caused several in the peer group to falter. Our percentage grew to .64 of 1%, which is higher than we like it, but compares favorable with many in the group.
The second ratio is Return on Equity which reflects the actual return we generated on the capital which you, the Shareholder, has entrusted to us. Here, our return was a strong 12.70%, and compares very favorable with peers.
Finally, we look at our Efficiency Ratio. This is generally viewed as a measurement of the ability to control costs, and reflects how much of our interest income must be devoted to covering non-interest expenses. As Carissa Rodeheaver noted earlier, this is a ratio where the lower it is, the better. Ours stood at 63.02%, and, again, compared favorable with our peer group.
Slide 59: 83rd Percentile
When the results are tabulated, we stand at 128th out of 760 banks - in the top 20%.
This has been the same measurement standard we have presented to you now for a number of years, and we are pleased with our performance in 2007, and hope that you, our shareholders, are pleased as well.
Well, how does this financial performance translate to the performance of your stock? As we have mentioned several times over the past years, we certainly do not control the market for our stock, and we sometimes believe there is a disconnect between our performance and the movement of our stock. We have nevertheless, enjoyed good, consistent, long term performance over the years. Our annualized return for the last eleven years is 6.63%. This is on par with the return for the NASDAQ Composite over the same period of time. When one considers the risk parameters associated with your investment in First United compared to the overall NASDAQ, our performance looks even better. As you review this year’s Annual Report, you will see a consistent trend of asset growth and earnings improvement. You will see a dividend that has been increased every year. It is our goal to continue this trend, and further improve our financial performance.
We will do this by continuing to sharpen our focus on building long term relationships with customers who value our service and solutions approach to financial solutions. We will be paying particular attention to business owners within our markets that are oriented to the communities in which they live and work. These community oriented business owners, regardless of their size, have needs that can be best addressed by a bank with First United’s profile: small enough to customize the solutions they need to be successful. Personal enough to know both their business goals and their individual dreams, yet, large enough to offer the full array of financial services required to meet their needs.
As we grow, we want to stay close to our communities. This is essential if we are to be successful in achieving the goals. To help us with this, we have our Board, which in addition to broad expertise in a variety of fields; also have their roots in several of the communities we serve. Supplementing this is our Advisory Council, which is made up of several prominent business people throughout our market area. They are invaluable in helping us understand our diverse markets and how we can best capitalize on the opportunities each one possesses. This year, we have taken a further step to help us strongly connect to our individual, locally-based markets. Each area will be lead by a market president that both knows the market well, and is well known within that market. Each will have wide latitude to help us become better in understanding the needs and wishes of our communities and customers. Our Market Presidents are, Phil Rodeheaver, Dave Esworthy, Dave Kelley, Patti Young and Tom Cummings.
Our success is the result of the strong and strategic direction we receive from your Board of Directors. They continue to both challenge and support us in our efforts to bring our Company to even higher levels of financial performance.
At the core of our success are the efforts of a dedicated staff of associates committed to making First United the most outstanding financial institution in our market. On behalf of these fine associates, I thank you for your support and look forward to serving you in the years to come. Thank You!
[slides follow]