Exhibit 99.1
Slide 1: Cover Slide
FIRST UNITED CORPORATION
2012 Annual Meeting of Shareholders Presentation
May 10, 2012
BILL GRANT
Slide 2: Bill Grant
Good Morning fellow shareholders, and welcome to the 2012 Shareholders Meeting.
Slide 3: Forward-Looking Statements
Before starting, I do want to direct your attention to the Forward Looking Statement Disclaimer displayed for you.
Slide 4: Bill Grant
2011, and the first quarter of 2012 have seen significant improvement in a number of our metrics of performance. At the same time, the Company has continued to deal with a number of issues left in the wake of the Great Recession of 2008. This morning, we will provide you with an overview of our progress and performance in 2011 and the first quarter of 2012. In these comments, I hope you will gain a sense that the strategies we discussed at last year’s meeting have for the most part been fulfilled. There is still much work before us, but much progress has been made.
We are returning to our previous format in that you will hear from each executive on his or her area of focus. Two members will be reporting to you for the first time. Last fall, Gene Helbig retired after leading our Trust and Investments area for over two decades. He was succeeded by Keith Sanders, who will report to you this morning. In December, Steve Lantz retired after serving as Senior Lender for a number of years. After a search, we selected Tracy Bemiller, who has worked in our credit underwriting area for the past few years. We wish Gene and Steve the best in retirement, and Keith and Tracy will report out to you shortly.
I would now like to turn the podium over to Executive Vice President and CFO, Carissa Rodeheaver, who will provide you with an update on the Company’s financials and credit picture.
CARISSA RODEHEAVER
Slide 5: Carissa Rodeheaver
Good Morning!
Slide 6: Rebuilding and Restructuring
Last year, I ended my presentation with a quote by Khalil Gibran, “Progress lies not in enhancing what is, but in advancing toward what will be.” It seemed very appropriate to start this year with the same quote as my presentation this year is focused on the progress that First United Corporation made in 2011. We established goals and created plans and we executed on those plans.
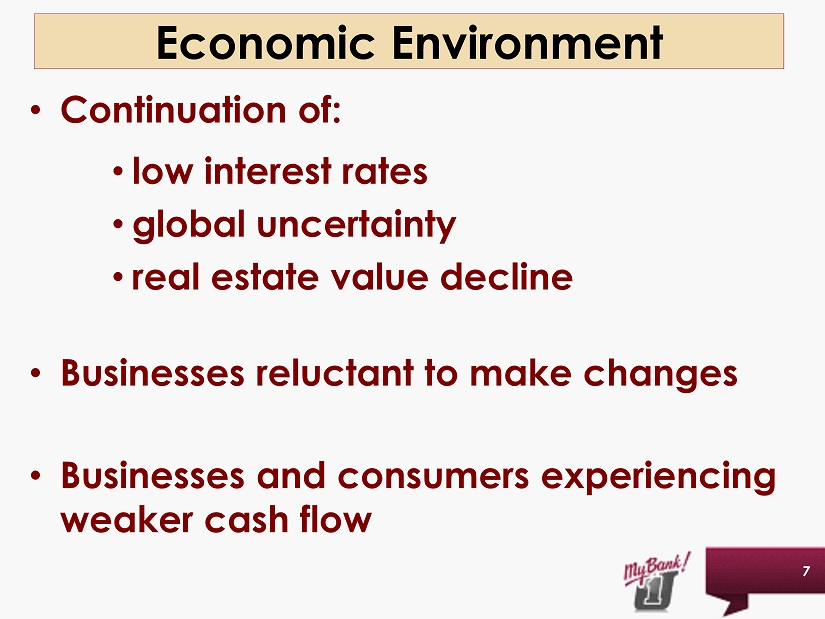
Slide 7: Economic Environment
From an economic perspective, we continued to see a historically low interest rate environment, lower real estate values and very cautious consumer spending. While the stock markets improved, we continued to see reluctance of investors and borrowers due to the continued threat of a double dip recession.
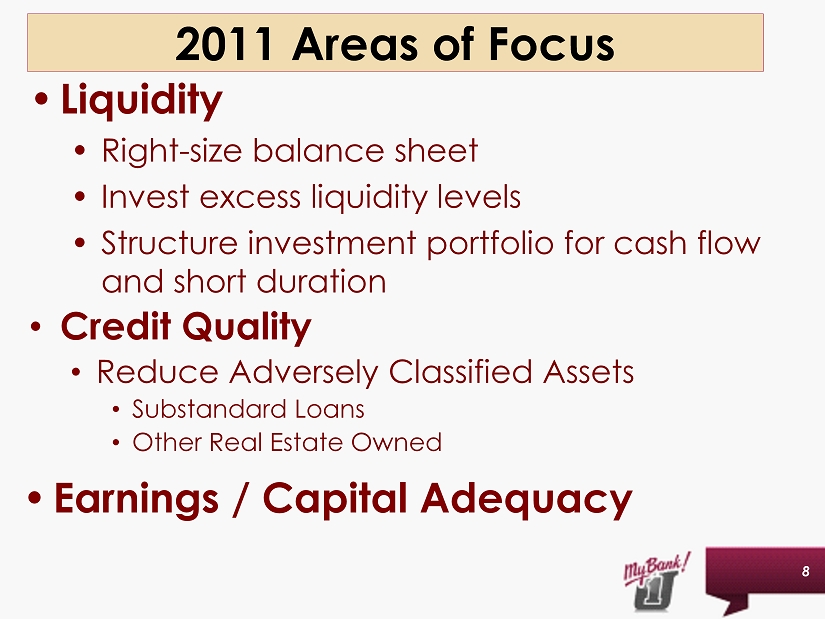
Slide 8: 2011 Areas of Focus
Our plan for 2011 was really very simple – to right-size our balance sheet by repaying wholesale and higher cost borrowings, invest our excess liquidity, improve our credit quality, organically improve capital ratios through enhanced earnings, and adopt new accounting and regulatory guidance. I am pleased to report today that we made great progress on these goals and executed on the plans in place.
Today, I will review our financial performance for 2011 and I will briefly discuss the results of our first quarter in 2012. For more detail, I encourage you to read the discussion of our financial results and condition in our 2011 Annual Report on Form 10-K which is available to all shareholders on our website.
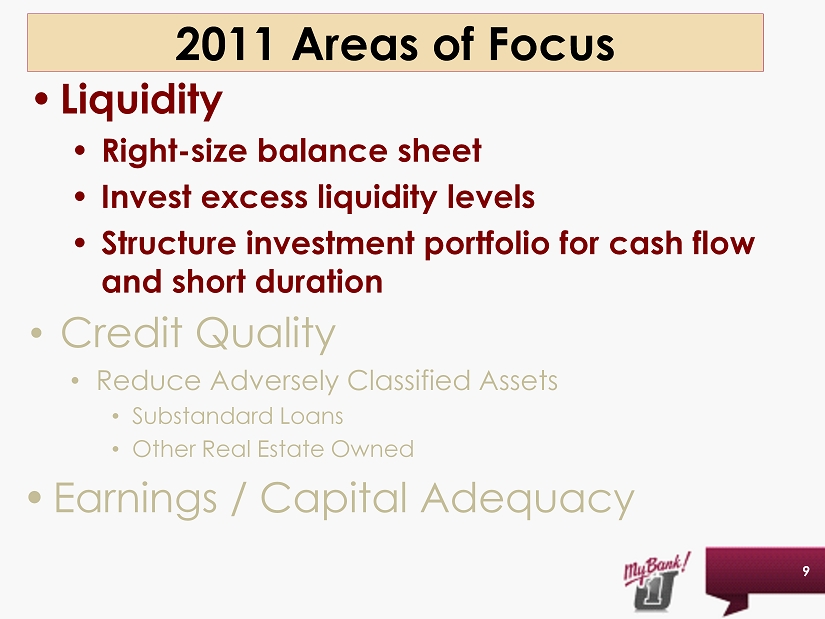
Slide 9: Areas of Focus – Liquidity
To begin looking at these areas, we will review the balance sheet and discuss some of the strategic changes instituted in 2011. As we discussed last year, during 2009 and continued into 2010, we began increasing cash levels through sales of, maturities of, or called investments and through strong growth in our core deposits.
The most notable change when comparing December 31, 2010 to December 31, 2011 was the decrease in total assets. This decrease was a planned decrease, as we used the liquidity that we accumulated in 2010 to de-lever the balance sheet.
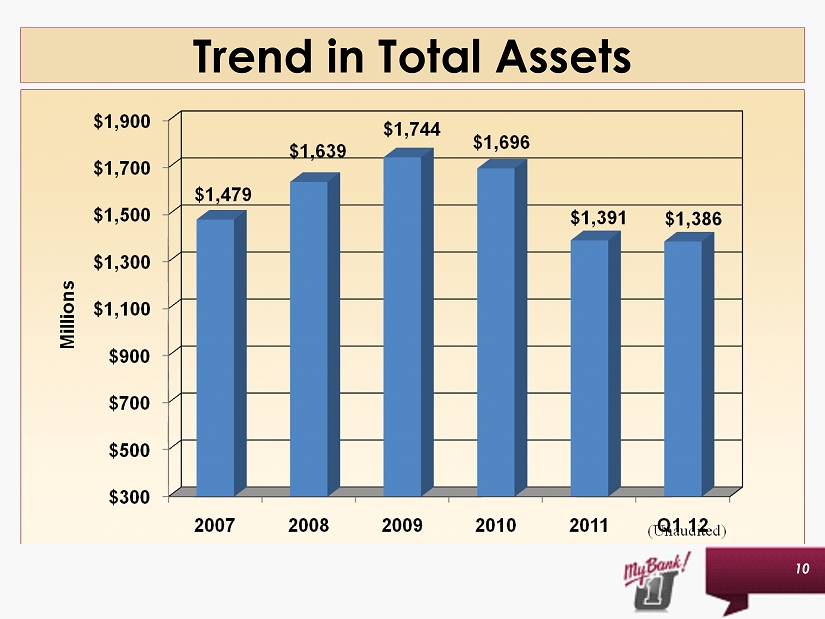
Slide 10: Trend in Total Assets
At December 31, 2011, total assets were just under $1.4 billion representing a decrease of $305 million, or 18%, compared to assets at December 31, 2010. Assets at March 31, 2012 remained relatively stable as compared to year-end. The 2011 decline in total assets was primarily due to a reduction of $234 million in cash and $69 million in net loans.
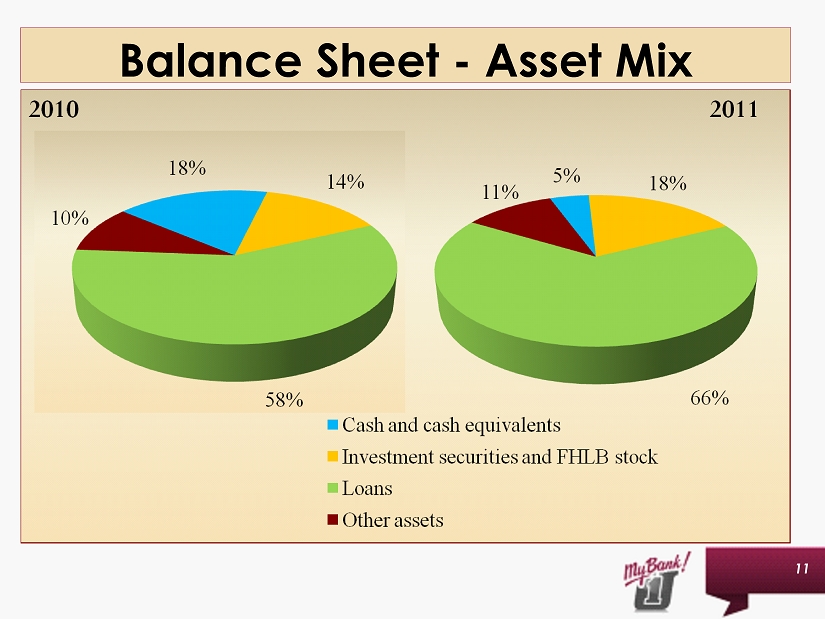
Slide 11: Balance Sheet- Asset Mix
Late in 2010 and throughout 2011 we executed our previously reported strategy to reduce the level of assets to better match our capital levels. As can be seen in the blue section of this chart, during 2011 cash was used to repay approximately $216 million in maturing wholesale and municipal deposits and $36 million in maturing FHLB advances, bringing total cash to $65 million or 5% of total assets at December 31, 2011, as compared to $299 million, or 18% of total assets, at December 31, 2010. In addition, cash was invested in U.S. government agency securities with short duration and cash flow in order to provide continued liquidity and to increase our yield on earning assets while continuing to be poised for rising rates in the future.
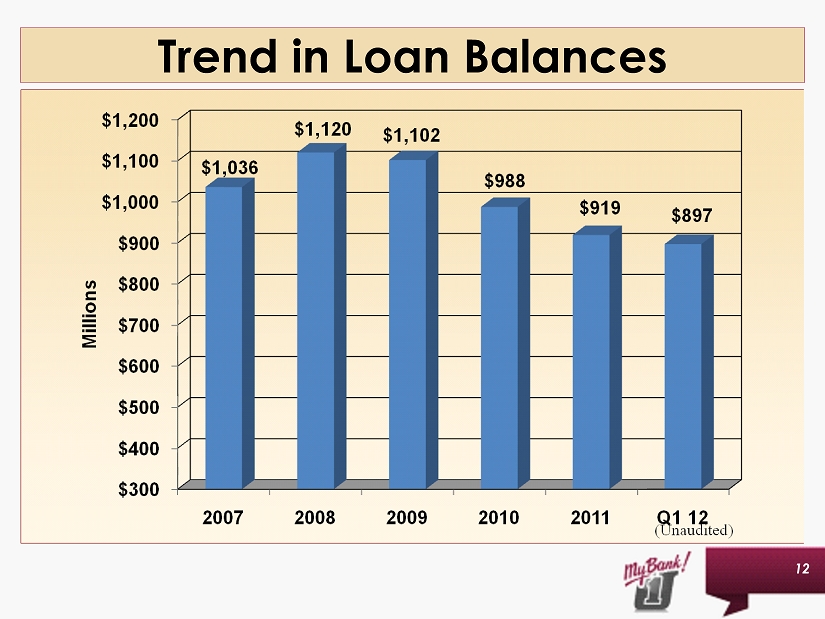
Slide 12: Trend in Loan Balances
During 2011, loan balances continued to decline with a reduction of approximately $69 million in net loans. The decline was attributable to slow production, utilizing secondary market sources for low, fixed-rate mortgages and the sale of a large portion of our indirect loan portfolio. In addition, we continued to aggressively charge-off impaired loan balances as we identified circumstances where we believed we would not collect full principal due on the loans. As we move through 2012, although we are seeing signs of increased loan production, we do not anticipate significantly growing total loans, as much of the new production will be offset as we continue to work out loans through required principal curtailments, charge-offs or foreclosures. Even though significant growth in loan balances is not expected, we believe we will see increasing interest income as we replace non-performing assets with performing loans.
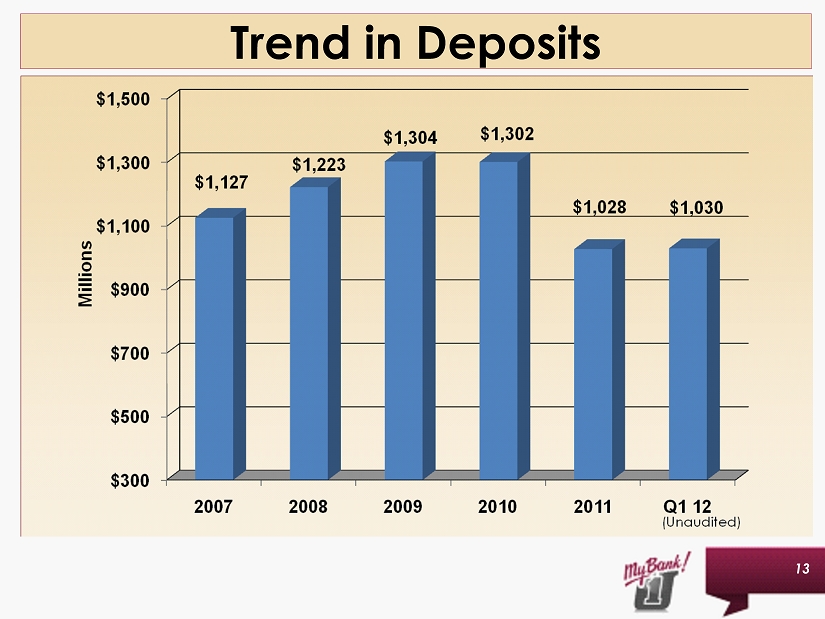
Slide 13: Trend in Deposits
Our plan for 2011 was to right-size the balance sheet by using cash to pay back wholesale deposits and higher cost borrowings. We achieved our goal and this is reflected in the decrease in deposit balances from 2010 to 2011. We intend to control deposit growth in 2012 to match the funding needs for loan production. Our primary focus will be to continue to change the mix of our portfolio. Robin will discuss the changing mix and our success in the retail arena a little later in the presentation.
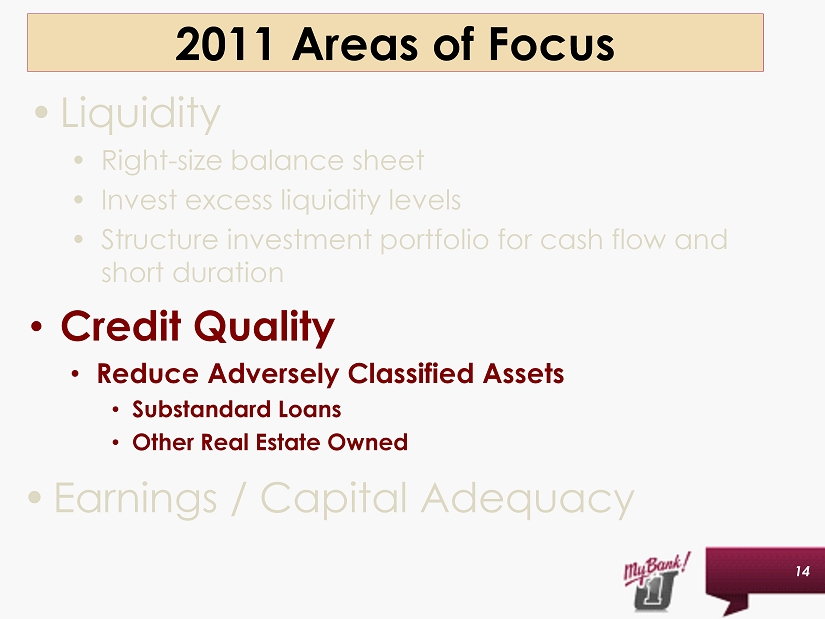
Slide 14: 2011 Areas of Focus – Credit Quality
Improving the credit quality of our asset base continued to be a primary focus during 2011. Our credit quality department has done an excellent job of recognizing deteriorating credits, which are referred to in the industry as substandard loans, and, where possible, working with our borrowers to create a plan for repayment that will work for both the borrower and the Bank. Unfortunately, there are situations where this is just not possible. In those cases, it is necessary for us to move forward with the foreclosure process. Once we foreclose on a piece of collateral, it is booked as part of our other real estate owned portfolio. We then create a plan to allow the Bank the opportunity to recoup our investment through the sale of the collateral. As anticipated, our other real estate owned portfolio will remain at a much higher level over the next couple of years as compared to what we have historically experienced. It is our goal to sell the collateral as quickly as possible. The pace of sales and the interest in these properties quickened during the latter half of 2011.
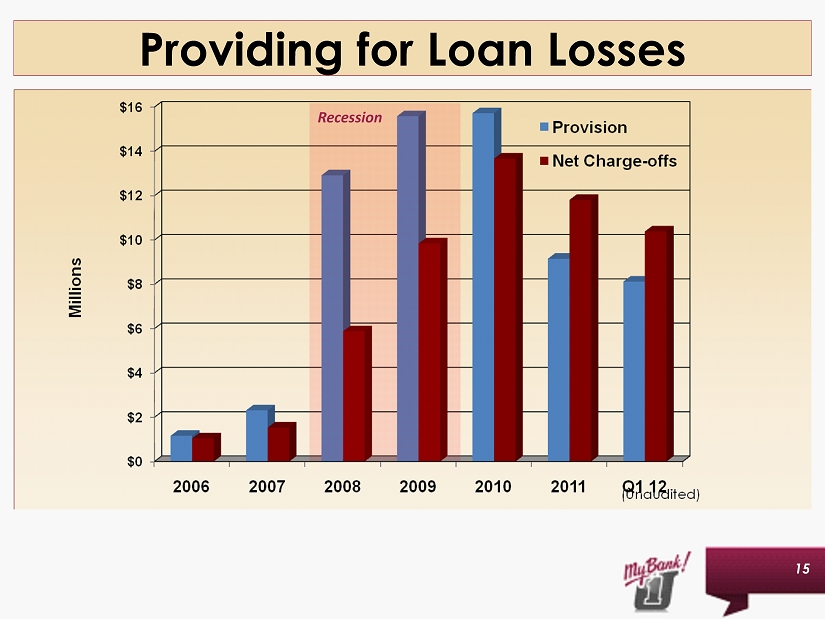
Slide 15: Providing for Loan Losses
As Tracy will discuss later, our loan portfolio continues to be well-diversified in our market areas and within the various industries that we serve. During the recessionary years and through 2010 and 2011, we continued to protect our investors by funding an allowance for loan losses to absorb actual losses as they occur. As you will note on this chart, prior to 2008, provision expense and net charge-offs were relatively low. The shaded area represents the recessionary time period and the blue bars show management’s efforts to provide for future loan losses as we continued to see charge-offs increase. As we moved from 2010 to 2011, we continued to experience higher charge-offs, which are represented by the red bars. A loan is charged-off when management determines that it is probable that we will not be able to collect the full amount of principal owed on the loan. In most cases, this means that the borrower is experiencing financial hardship and we have been unable to work out a remedy for the loan. When a loan is charged-off, the allowance for loan losses is reduced by the charge-off. Provision expense is how we fund the allowance for loan losses. As we began to see stabilization in our recognition of troubled credits, we were able to decrease the amount of provision expense. However, we continue to charge-off impaired loan balances based upon decreased real estate valuations in our current markets. In 2010, we charged-off approximately $13.7 million net of recoveries and provided a total of $15.7 million to maintain our allowance for loan losses. In 2011, we charged-off approximately $11.8 million net of recoveries and provided a total of $9.2 million to maintain our allowance for loan losses. During the first quarter of 2012, we experienced a large charge-off of approximately $9.0 million on one commercial and industrial loan. This loan was a shared national credit for an ethanol plant located in western Pennsylvania. The failure of the ethanol plant, and the borrower’s bankruptcy, resulted from the failure of a third party national petroleum company to perform its contractual obligations to the borrower. This was the primary factor causing the loss reported during the first quarter of 2012.
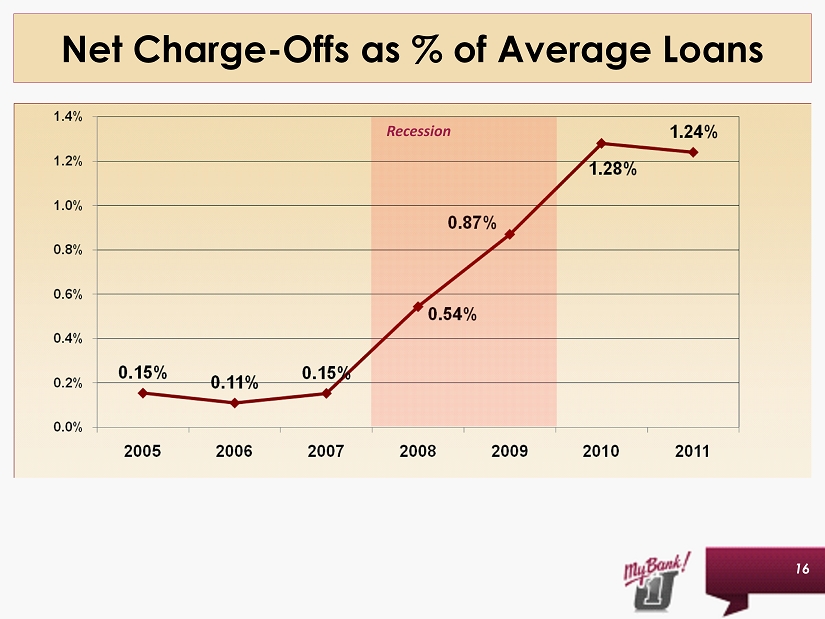
Slide 16: Net Charge-Offs as % of Average Loans
As I mentioned last year, we anticipated that we would continue to see higher levels of charge-offs as we cleanse our balance sheet of troubled credits and based on the lower real estate valuations. The net charge-offs in 2011 of approximately $11.8 million equates to about 1.24% of our total loan portfolio. As this slide demonstrates, the charge-off percentage remained relatively stable from 2010 to 2011. For the first quarter of 2012, exclusive of the previously mentioned commercial and industrial charge-off, all other loan segments showed lower charge-off percentages as compared to 2011. We expect that we will see only moderate charge-offs the remainder of this year. In some cases, we may have the opportunity to recover principal previously charged-off on loans as we sell foreclosed property or we pursue other assets of the guarantor on the loan.
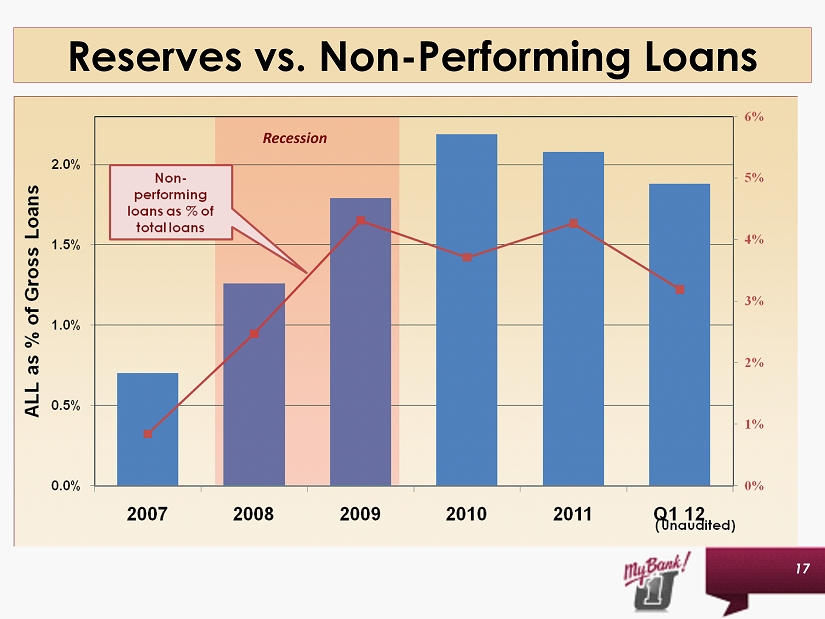
Slide 17: Reserves vs. Non-performing Loans
The next chart shows the level of our allowance for loan losses relative to the amount of non-performing loans in our loan portfolio. The red line represents non-performing loans as a percentage of gross loans and the blue bars show the total allowance for loan losses as a percentage of gross loans. As you will note, the percentage of non-performing loans increased during 2011 as we placed the $9.0 million loan in non-accrual status and declined sharply in the first quarter of 2012 as a result of the charge-off. The level of the allowance remained relatively stable in 2011 and declined as a percentage of gross loans in the first quarter of 2012. This decline is largely due to the charge-off activity in 2011 and 2012. Once the Bank has charged-off the uncollectible portion of a loan, it is no longer necessary to maintain an allowance on that loan. We are pleased with the progress we have made in reducing the level of substandard loans but also recognize that this will continue to be a primary focus in 2012 and 2013.
Last year, we spent a significant amount of time discussing the other-than-temporary impairment on our investment portfolio. I am pleased to report that the CDO portfolio has stabilized and we only reported $19,000 in impairment during the first quarter of 2011 and there was none reported for the remainder of 2011 and the first quarter of 2012.
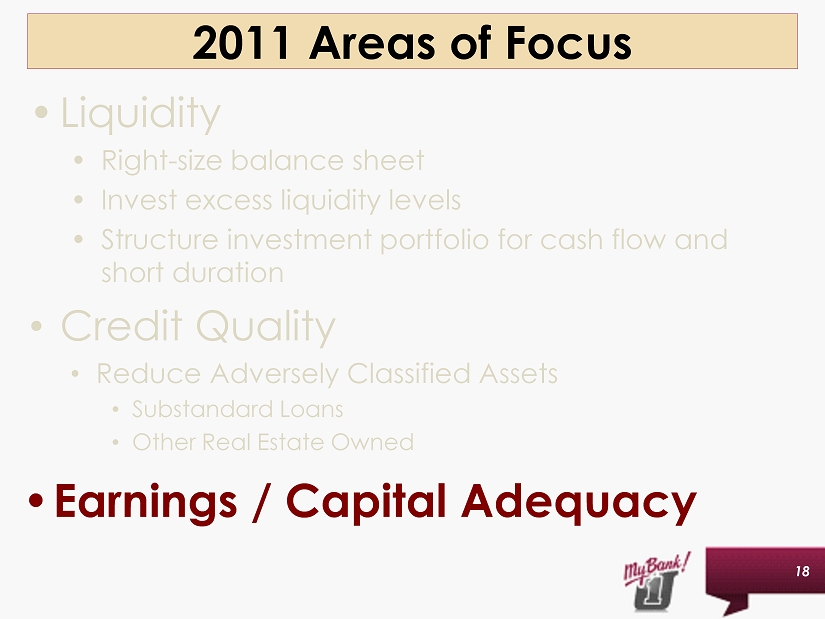
Slide 18: 2011 Areas of Focus - Earnings/Capital Adequacy
Following several quarters of losses in 2009 and 2010, we posted positive earnings during all quarters of 2011. While the earnings continued to be strained by the higher levels of provision expense, we made good progress in increasing our core operating earnings and laying a good foundation for future years.
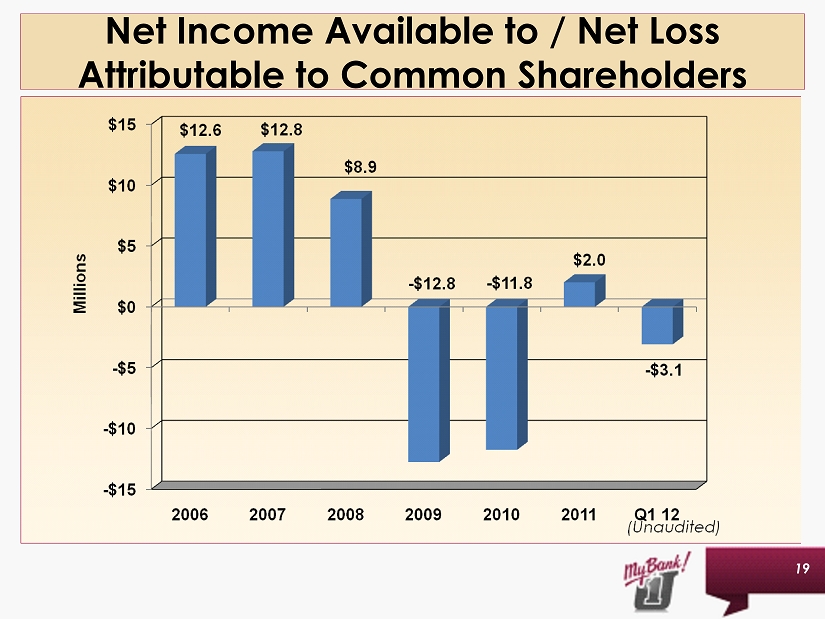
Slide 19: Net Income Available to / Net Loss Attributable to Common Shareholders
Consolidated net income available to common shareholders for the year ended December 31, 2011 was $2.0 million compared to the net loss attributable to common shareholders of $11.8 million in 2010. 2011 net income was a result of reduced provision expense, improved net interest margin and reduced operating expenses.
For the first quarter of 2012, First United Corporation posted a net loss attributable to common shareholders of $3.1 million. The $9 million charge-off was partially offset by $1.3 million in gains recognized on sales of investment securities and other real estate owned and a one-time, tax-free death benefit on a bank owned life insurance policy. Outside of this loss, core earnings were strong, reflected in the increased net interest income and trust department earnings.
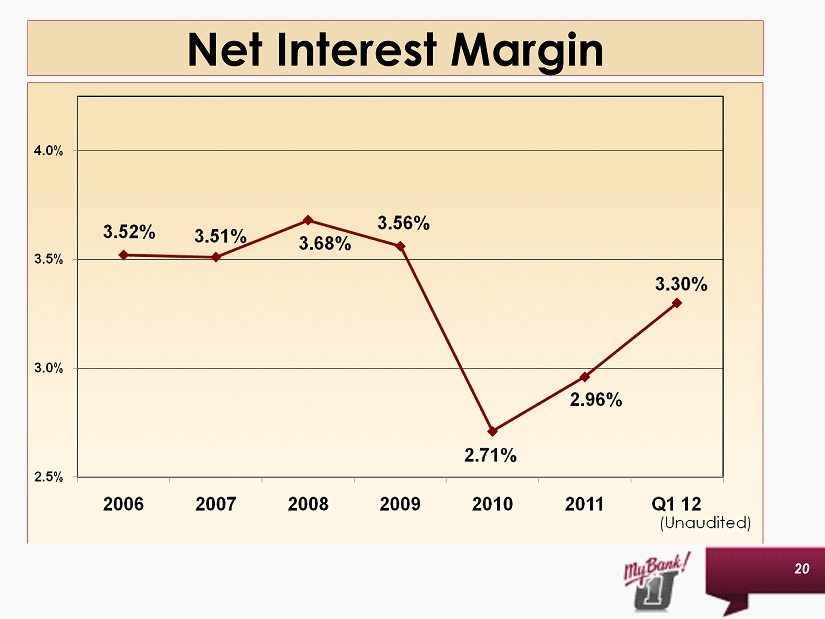
Slide 20: Net Interest Margin
Net interest income is the difference between the interest we earn on loans and investments and the interest that we pay for deposits and other borrowings. Net interest income can be measured by the net interest margin. Our net interest margin was significantly impacted in 2010 as many loans and investments reset at lower interest rates due to the continued flat interest rate environment, we saw a reduction in loan and investment balances, and we experienced increases in non-accrual assets. The historically high levels of cash at very low rates also impacted our interest income as compared to prior years in which we maintained very low levels of cash. Our goal for 2011 was to significantly reduce the high levels of liquidity by paying down wholesale deposits and borrowings and by investing our cash into the investment portfolio.
Traditional banking services, resulting in the generation of net interest income, continue to be our primary source of revenue. Our plan for 2011 was to change the mix of our deposit base to increase our core deposits and lower our cost of funds. We continue to make special pricing available to those customers who choose to have full banking relationships with First United, those who view us as their primary bank and who value the high level of service that we strive to provide. Adherence to our pricing discipline, a change in the composition of our deposit base and reduced levels of low-yielding cash all resulted in positive trends for our cost of funds and contributed to our increasing net interest margin. The increase was slightly offset by decreased yields on our loan and investment portfolios due to the lower interest rate environment and the low loan demand. The margin has continued to show positive improvement in the first quarter of 2012 as it increased to 3.30%, again driven by the reduction in our cost of funds and reduction in our non-earning assets.
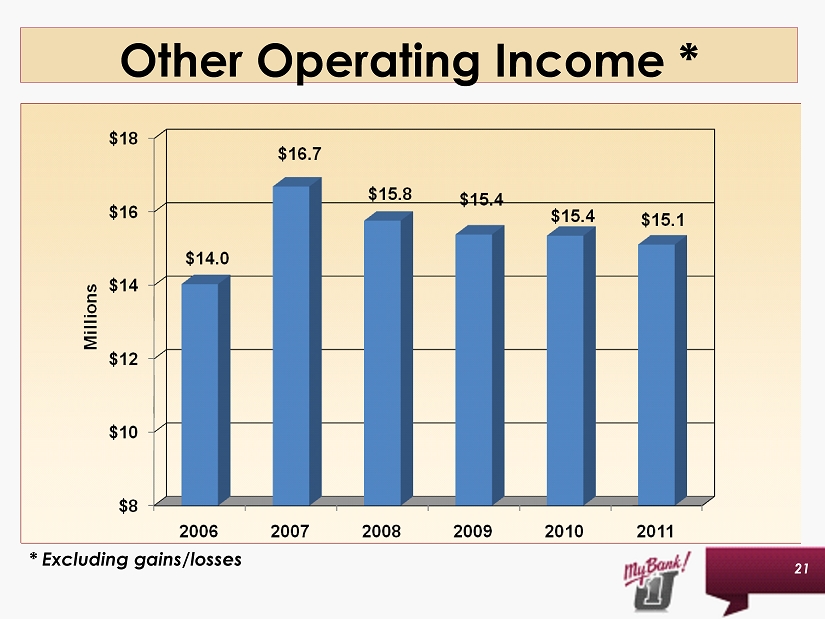
Slide 21: Other Operating Income
Other operating income for 2011 excluding gains and losses remained stable from 2010. We saw decreases in our service charge income and insurance commissions, offset by increased trust and brokerage income and debit card income. As announced in our 2011 Annual Report on Form 10-K, on January 1, 2012, First United Corporation sold the assets of First United Insurance Group. It is our desire to utilize our capital for continued improvement in our banking business. Based on this objective, we sold the agency and retained a referral relationship with the new owners. Sale of the agency resulted in increased capital ratios due to the reduction of the goodwill associated with prior insurance acquisitions.
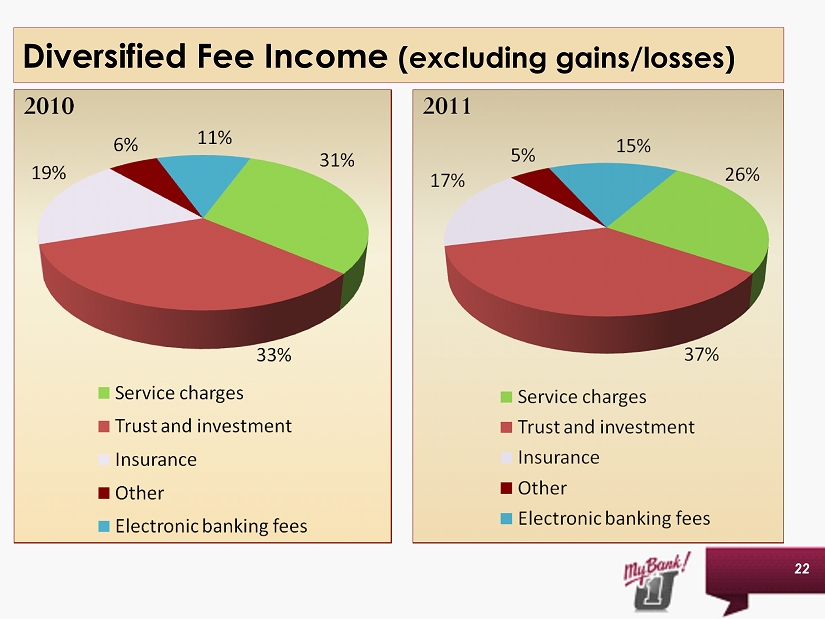
Slide 22: Diversified Fee Income (excluding gains / losses)
Going forward, it is our intention to continue to allocate resources to our very successful trust and investment department. This area represents 37% of fee income in 2011, up from 33% in 2010. As we expect continued strain on non-sufficient funds income due to the continued implementation of government regulation, income from trust and investments and electronic banking will become more and more important. You will hear more about each of these areas in the remainder of the presentation.
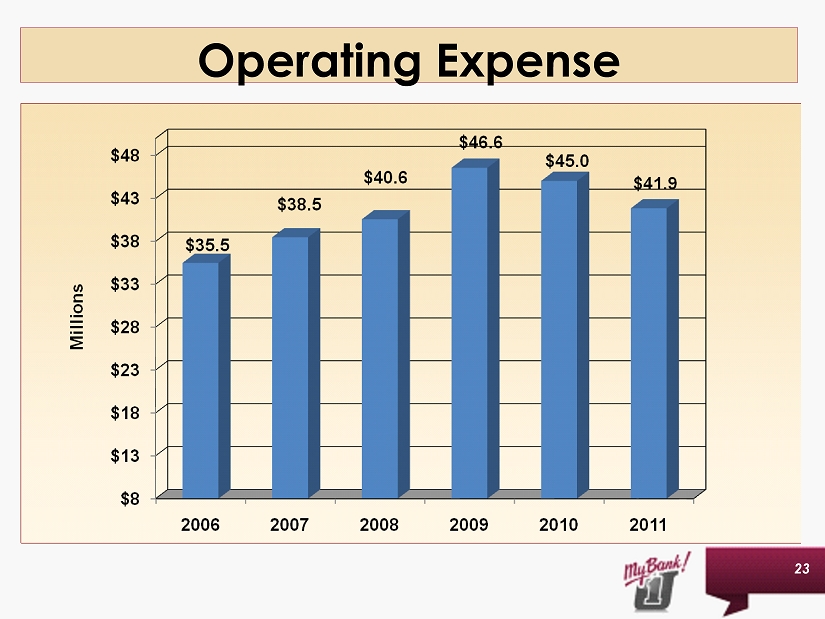
Slide 23: Operating Expenses
As mentioned earlier, we continued to make progress in reducing our other operating expense in 2011 as we decreased by $3.1 million, or 7%, as compared to 2010. While we saw slight increases in expenses related to our other real estate owned portfolio and professional services, we experienced higher reductions in salaries and benefits, FDIC premiums and various other expense line items. We fully understand that monitoring and lowering operating costs continue to be an integral part of our plan going forward.
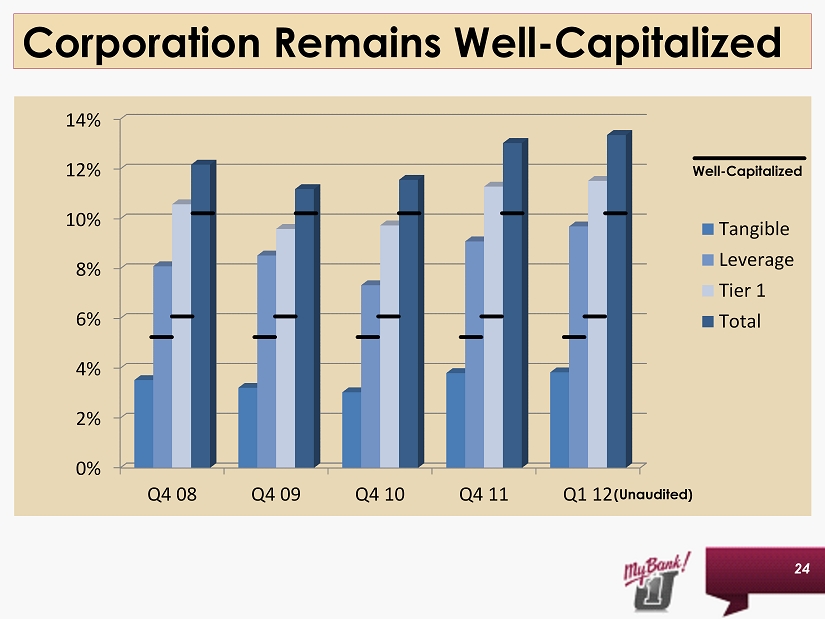
Slide 24: Corporation Remains Well-Capitalized
As we executed our plan to right-size the balance sheet in late 2010 and throughout 2011, our objective was to improve our capital ratios while continuing to improve asset quality and stabilize our earnings stream. This chart shows our success in improving our regulatory ratios throughout 2011 and through the first quarter of 2012. Even with the first quarter loss, all ratios increased. This result was due to a combination of a shift in the composition of risk based assets, the reduction in total assets and the reduced goodwill associated with the sale of the insurance agency. The Corporation remains in payment deferral on its Capital Purchase Program dividend and the interest on its trust preferred securities. However, all capital ratios reflect the accrual of the dividends and interest expense. The Board of Directors will continue to evaluate the payment deferrals quarterly based on the financial performance of the Company.
Slide 25: 2011- A Year of Progress
In conclusion, 2011 was a year full of progress as we laid plans to improve core earnings, to improve our capital ratios and to improve the credit quality of our loan portfolio. During the year, we successfully lowered the cost of funds and improved our net interest margin by shifting our deposit mix and lowering cash levels. We reduced liquidity and de-levered our balance sheet to improve capital ratios. We charged-off uncollectible loan balances, worked with our borrowers and reduced our substandard loans. And, we reduced expenses to better match our asset size. We believe the execution of our 2011 plan has moved First United in the right direction. As we continue on this path, we believe that we will have the opportunity to achieve stronger financial performance in the coming years. Thank you for your attention. At this time, I will turn it over to our Senior Lender, Tracy Bemiller.
TRACY BEMILLER
Slide 26: Tracy Bemiller
Thank you, Carissa. Good morning. I am Tracy Bemiller, the Senior Lending Officer. It is a pleasure to be here today to discuss our Commercial Lending results for 2011, and talk about what’s ahead for 2012. But first, I wanted to take this opportunity to thank Steven Lantz for his many years of service, and wish him all the best in his retirement.
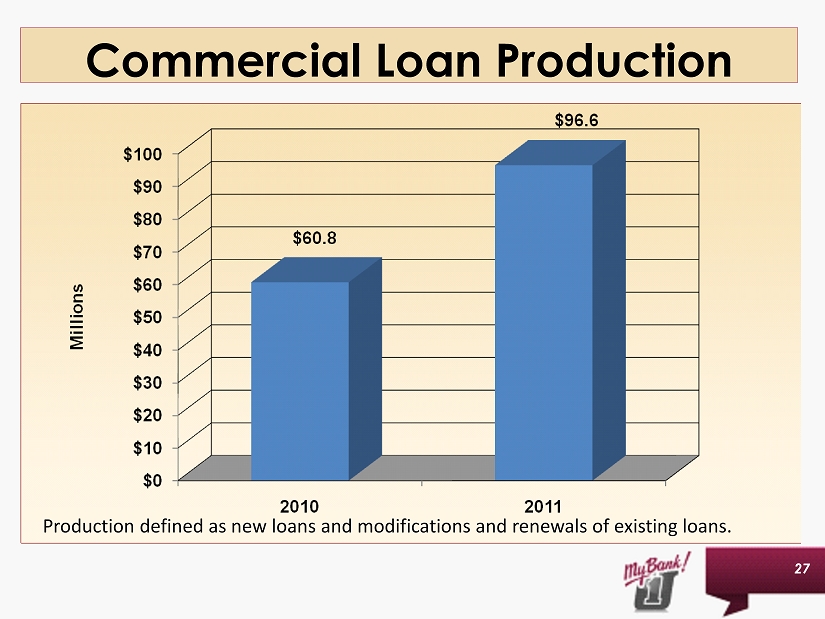
Slide 27: Commercial Loan Production
Commercial Lending finished 2011 with a strong 4th quarter, booking over $47 million in renewals, modifications and new commercial loans, and rounding out 2011 with a total of $96 million in commercial loan production. As can be seen from the chart behind me, this is a $36 million improvement over our 2010 production of $60 million. Our goal for 2012 is consistent with last year’s results. For 2012, we have again set an aggressive production goal for our commercial lending team. First quarter 2012 commercial loan production was $4 million. Our Commercial pipeline is continuing to grow.
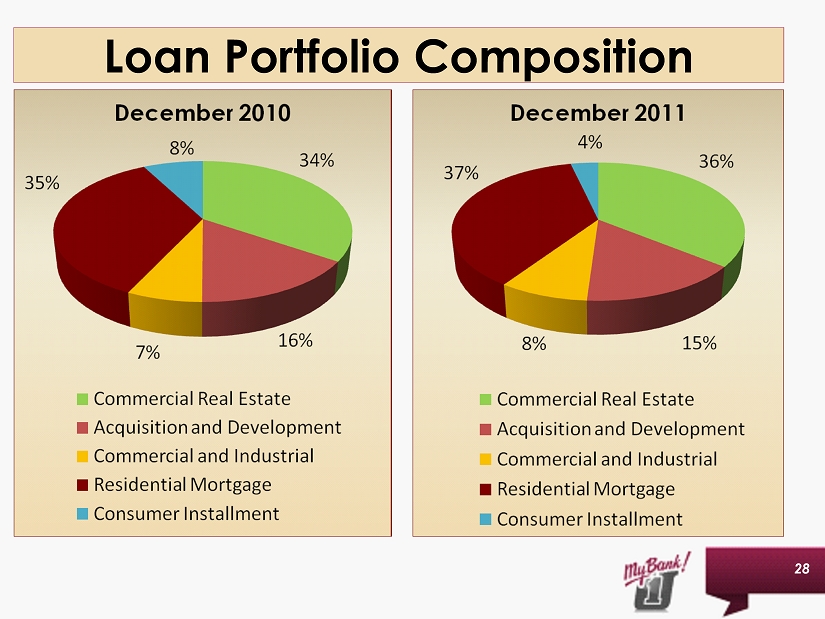
Slide 28: Loan Portfolio Composition
Again, if you look to the chart behind me, you can see that the composition within our loan portfolio from 2010 to 2011 has remained fairly consistent. This chart shows the balanced approach we are taking in order to maintain a diversified and well balanced loan portfolio.
As an additional part of our strategy for 2012, we are devoting a larger percentage of our time toward acquiring new clients at the Bank. The emphasis for 2012 is to win new business by providing exceptional client service, fast response time, and value-added commercial solutions. In order to meet and exceed our goal this year, we must continue to attract new commercial clients to First United Bank & Trust while continuing to serve the needs of our existing clients. This means that our Commercial lending team must reach out to more prospective customers, build more relationships, and work hard to retain the privilege serving our clients’ financial needs.
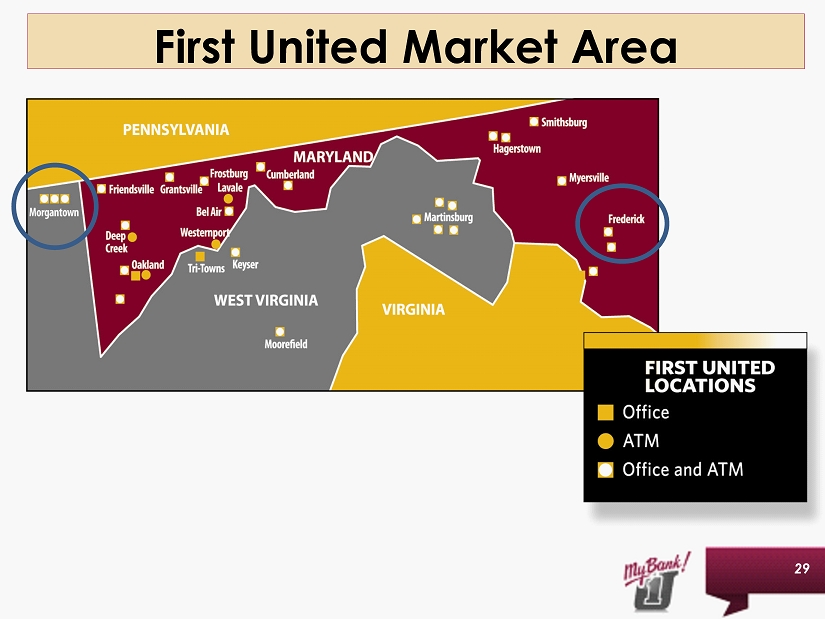
Slide 29: First United Market Area
We have identified two major growth markets for which we plan to continue developing, namely the Frederick County, Maryland market and the Morgantown, West Virginia market.
Frederick County continues to be an active and growing business community. As of February 2012, the unemployment rate in Frederick was 6.3%, which is lower than the national unemployment rate of 8.2%, and lower than Maryland’s unemployment rate of 6.5%. Frederick County continues to enjoy increased economic activity from its vicinity to the Baltimore and D.C. Metropolitan areas. As Frederick County continues to expand economically, we believe that there is excellent opportunity for First United Bank & Trust to continue to grow and expand our commercial client base.
Morgantown, West Virginia continues to benefit from the continued growth of West Virginia University and the private business sector. Morgantown’s unemployment rate is currently low, at 5.4%, which is significantly below the national rate. Morgantown has several development projects currently planned and underway, which we believe will fuel increased demand for commercial loan growth. The Morgantown area is currently home to a rich diversity of small and medium size businesses, many of which are expanding and in need of additional capital. We are excited to be in Morgantown and look forward to expanding our market presence in 2012.
In conclusion, we are excited. We are working hard every day to provide solutions to our Commercial clients; and we are looking forward to a successful 2012. Thank you. I will now turn the podium over to Jason Rush.
JASON RUSH
Slide 30: Jason Rush
Good morning. As Chief Risk Officer and Director of Operations, I serve several different roles within your company. I would like to update you on three areas today in particular; consumer mortgage production which I will be covering with you now and later in the presentation the topics of enterprise risk management and information technology.
Slide 31: Residential Mortgage Production
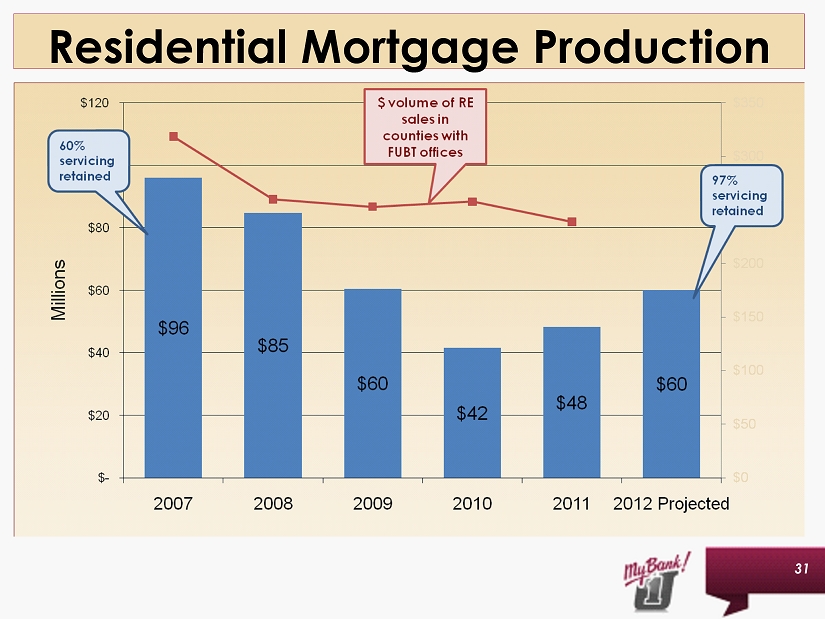
As a community bank, First United prides itself in its commitment to meeting the housing needs of the communities we serve. Over the past five years there has been an enormous amount of discussion around the real estate market; decreasing land values, increased foreclosures and tightening of credit for example. The following bar graph illustrates the total dollars in consumer mortgage loans originated over the past 5 years at First United, along with our projected production for 2012. The red line on this same graph illustrates total real estate closings in the Maryland and West Virginia Counties where we have offices for the same period. As you can see, our production followed the slowing of the overall market from 2007 through 2010. However, since 2010, First United has experienced a rebound in mortgage production where the overall market continues to see a decline in sales volume.
We have been able to accomplish this by evaluating our mortgage product mix, the efficiency of our mortgage processing and by recommitting ourselves to uncommon service to each potential mortgage customer.
In an effort to manage our interest rate risk, we have been in the practice of originating and then selling longer term fixed rate mortgages to other institutions. In doing this, we are able to avoid the risk of having long term lower yielding assets on our balance sheet while still providing solutions to those customers seeking a long term, fixed rate product. The piece we were not capturing in this process was the ability to service these loans internally, which in turn gives us the opportunity to build a stronger overall relationship with the customer.
The slide further illustrates total mortgage loan production and the breakdown of these mortgage loans produced with retained servicing and mortgages produced and then sold to other financial institutions where they provide the servicing. As you can see, in 2007 we produced $96 million in consumer mortgages. We retained 60 percent of the servicing while the remaining 40 percent were serviced by other institutions outside of our market area. In 2012 we are projecting total production of $60 million with almost all of the production being servicing retained. Our servicing of these loans is important and certainly preferred by our customers as we have local offices and familiar faces to serve any needs that might arise over the term of the mortgage loan.
By concentrating our efforts on a smaller number of loan outlets and retaining the servicing of more of our produced loans, we are better positioned to build deeper relationships with our customers.
Slide 32: Principles of LEAN
We continue to use LEAN principles throughout the organization to glean efficiencies. LEAN is an improvement strategy that works to eliminate waste in a process by using the DMAIC principle. DMAIC is an acronym for defining a problem, measuring the current process, analyzing the root cause of the problems in the process, indentifying creative solutions to fix the said problems and then controlling and monitoring the process moving forward to assure continued success.
We recognized that the mortgage process is one area that could use a LEAN review with a goal of shortening the amount of time it takes to go from the application stage to the actual closing of the mortgage loan. In this process, we recognized that we certainly could not sacrifice sound credit underwriting or customer satisfaction levels in the process. By making adjustments to our internal processes and better utilizing the available technology, we have been able to recognize reduced processing time of over 20%. While we have been successful in increasing production while shortening our processing time, we are most happy to report that our customer surveys continue to come back to us showing satisfaction levels of over 90% from mortgage loan applicants.
I would now like to turn the presentation over to Robin Murray to discuss her team’s efforts.
ROBIN MURRAY
Slide 33: Robin Murray
Thank you, Jason. Good morning. At this time I am pleased to share your Company’s core Retail Banking performance in 2011 and our strategies that will position us for future growth.
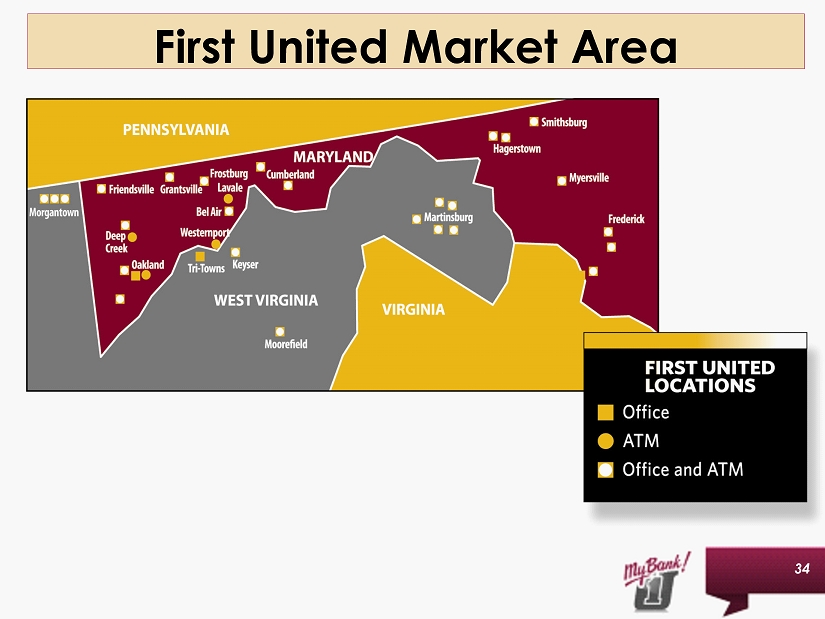
Slide 34: First United Market Area
This first chart provides a summary of our market areas. Our diverse markets enable us to drive franchise value and maximize our earnings growth. Each of the markets we serve present unique opportunities, and our Market Presidents are doing an outstanding job of identifying and executing on these.
They are responsible for preparing regional business plans based on the economic and competitive environment of their geographic areas. Our market leaders are entrenched in each of their communities and have a vast understanding of the unique characteristics of their markets. They each serve on our corporate Treasury Team committee to provide input on regional pricing strategies, marketing objectives, and they have the empowerment to be competitive based on their market conditions for both existing and prospective customer relationships. They each utilize a regional marketing budget to support their local initiatives, and have the authority to designate these funds as they see fit.
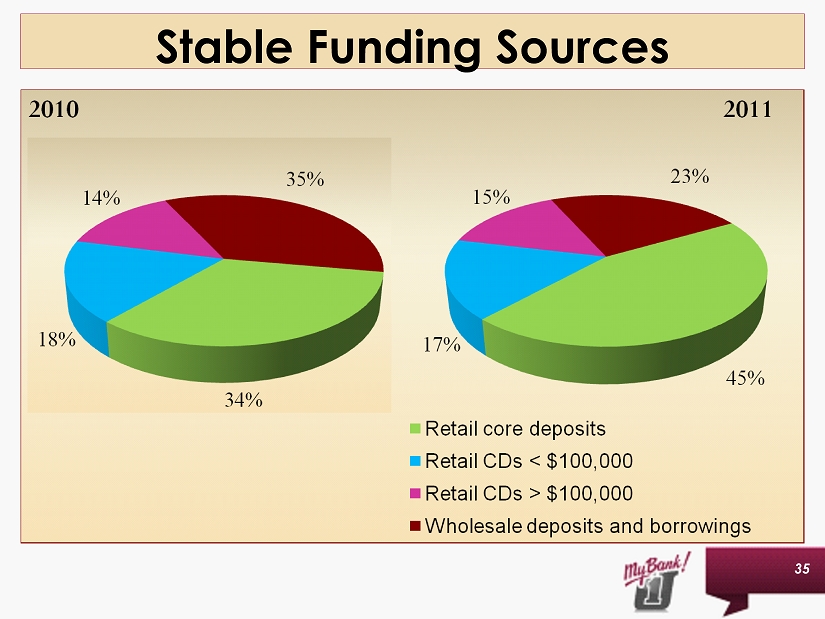
Slide 35: Stable Funding Sources
One of the most important tasks for the Market Presidents team is to grow low cost core deposits. Core deposit growth is the foundation of the banking franchise and is a key performance ratio for this group. We have continued on our path to shift our deposit mix to garner lower cost core deposits, by attracting and growing checking, savings, money markets and certificates of deposit less than $100,000.
As you look at this next chart, you will see a significant improvement in the percentage growth in Retail core deposits, the green section of the chart, as compared to last year. This percentage growth reflects the accomplishment of our goal of reducing wholesale deposits and borrowings, the dark red section of the chart.
Slide 36: Retail Deposit Composition
Focusing our staff on providing primary banking solutions for our customers assisted us in our Retail deposit composition. We are changing our mix and starting to see growth in our demand deposit, money market and savings categories.
Our initiatives were focused on facilitating the retention of our full relationship customers, or customers who have many banking and investment services with us. Their loyalty is extremely important to us and we will continue to serve all their deposit needs, including CD’s or Certificates of Deposit. As a result of this focus, we experienced a decrease in our single service CD customers. In addition to this strategy, our focus on business owners has assisted our growth in core accounts because of our competitive checking and cash management services.
Slide 37: Small Business Loan Production
In order to serve our business owners more efficiently, we have restructured our small business units. We developed a special operational and underwriting team that is working closely with our Retail branch staff on small business loan needs under $150,000. This team has provided additional training for our staff on business acumen and loan structuring. We are seeing great results already from this initiative. We have accomplished a 45% increase in production with business loans under $150,000 throughout our branch system, in just one year.
Because of the early success we are experiencing with this initiative, we are excited to execute the next phase of this COBO strategy. We are finding that many business owners with loan needs under one million dollars may be underserved in many of our markets. Our larger competitors find it difficult to customize these smaller loans and target much larger clients. Because of our strategy, we can attract and serve this client more effectively and have found this to be a niche for us in our growth markets. We are adding two new positions for Business Relationship Bankers. One position will cover our Morgantown area, and the second position will cover our growth markets, Frederick, Hagerstown and Martinsburg. Our Business Relationship Bankers will not only garner the small business loan needs, but will continue to build out the relationship for the deposit, investment and personal financial needs of the business owner. Our business customers will have one single point of contact focused on helping them succeed. We anticipate this initiative to be implemented later this year.
Slide 38: What Our COBO Customers are Saying
We continue to receive letters and now emails from our customers telling us about their banking experiences. We recently received an email from a business owner in the Martinsburg area, telling us about his banking experience with our manager, Dave Hart. This customer is in the RV business. Dave works closely with this business owner on providing solutions for his financial needs. But what really impressed this customer was that Dave cared so much about the success of his business, he went above and beyond to also serve the business owner’s customers. Dave has met with him on several occasions to learn about how his business works. He provides valuable advice and solutions customized for this individual.
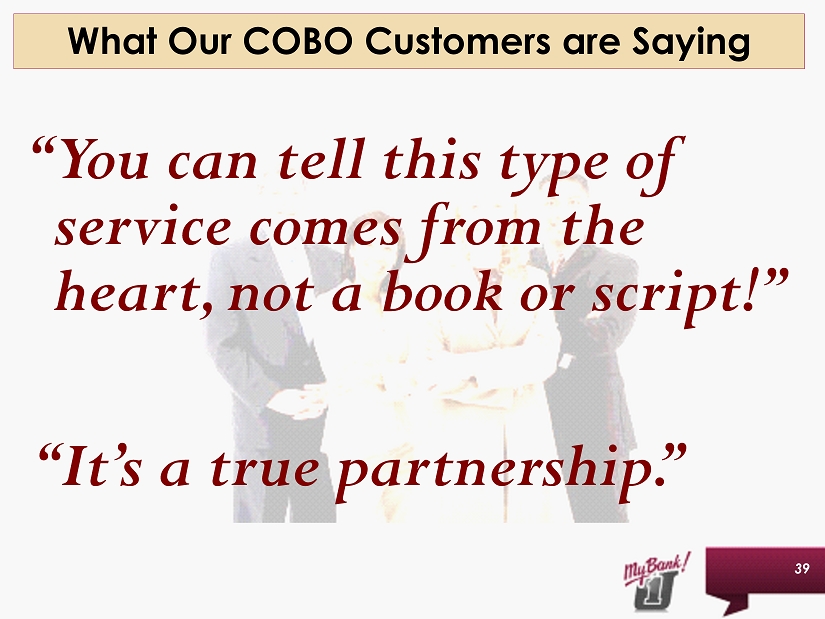
Slide 39: What Our COBO Customers are Saying
This customer told us that he has never had a bank that truly cared about him and his business. This customer quoted that you can tell this type of service comes from the heart, not a book or script!
In our Morgantown market, we had a large non-profit organization tell us why they left a large regional bank to deal with us. Our manager Kim Moyer and our Treasury Management Officer Stacey Evans took great care in providing the financial solutions and assistance with this group. This organization was so impressed because: First, we came to them. They did not have to leave their office. We engaged this group and spent time listening to their needs and learned how their organization functioned. Second, we cared about their cause and asked questions on what they do for our community. Third, we have partnered with them, assisting them with their events, serving on their committees, allowing them to advertise on our signs and assisted in their fundraising campaigns. They made the comment that they never saw anyone from their previous bank and not once did they ask them or care about their cause. In turn, we now have all their accounts and are continuing to work on providing investment solutions for them as well. It’s a true partnership – as they quoted.
By the way, if you had a chance to review our annual report, on the inside cover, you can read more customer testimonials. They describe their banking experience and long term relationships we have built with them over time.
I could go on and on with more customer comments – this is what gets our team really excited! I commend our Market Presidents and all of our associates for enriching the lives of our customers and understanding this will relate to additional business now and in the future.
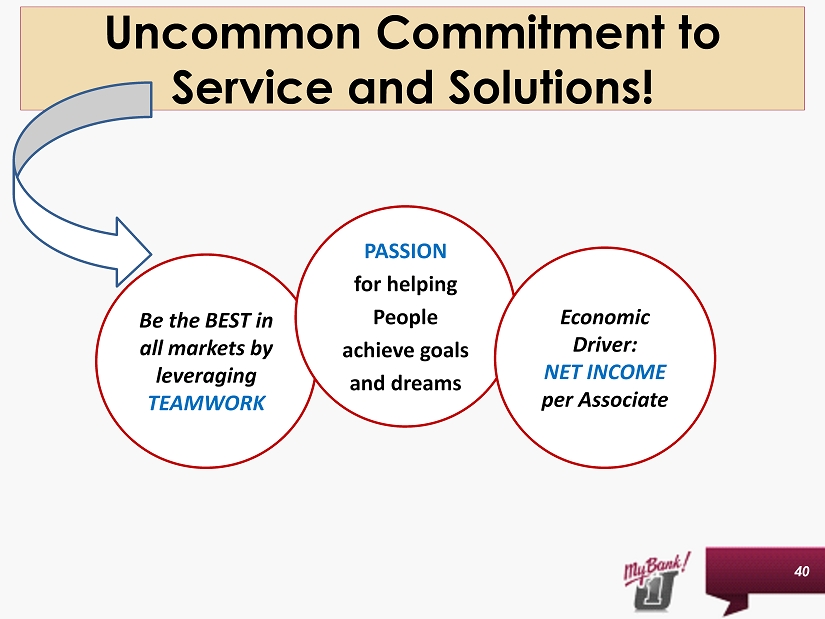
Slide 40: Uncommon Commitment to Service and Solutions!
We continue to further develop the expertise and business knowledge of our Retail staff. This will provide the tools to become more successful in focusing on the customer holistically and to enhance their ability to be a trusted financial advisor. Our team is energized with the recent engagement of a well-respected and nationally known company to assist us in proactively identifying and satisfying customer’s financial needs. Refining our structured outside calling activities, and honing our sales skills, will result in a more effective customer experience. This process will enable us to establish a better understanding of the financial needs of both prospective and existing business owners.
In conclusion, our 2012 initiatives will be focused on enhancing our business owner strategy and continuing our efforts in community involvement. We must excel in exceptional customer retention and build out additional relationships. We will continue our efforts on becoming trusted advisors by delivering customized solutions to attract new customers. We will tailor these initiatives around expanding revenue opportunities for our well-defined and targeted strategy for our Community Oriented Business Owners. Effective execution of these strategies will enhance shareholder value and position us for success in years ahead. Thank you for your attention today. I will now turn this over to Keith Sanders, our Senior Trust Officer.
KEITH SANDERS
Slide 41: Keith Sanders
Friends, Clients, and Shareholders: This year we excitedly celebrate the 50th anniversary of the Trust & Investments department of First United Bank & Trust. Through the years the department has grown into a full service wealth management group focused on the understanding that growing wealth is just as important as protecting wealth.
Our wealth management process lays the foundation for success by creating a comprehensive picture of our client’s unique goals, timeframe and financial situation. Only then can we customize our investment management services to meet the needs of our clients and their families. Once we understand our clients and their goals, we align investments, estate planning, and trust solutions to help achieve what matters most-your trust!
In 2011, we saw natural disasters in Japan, a near financial tragedy in Europe, and political upheaval across the Middle East. We saw the downgrade of U.S. credit and the recognition that China isn’t infallible. It is easy to draw a line between these events and the outcome of the equity and fixed income markets in 2011, which directly affected our efforts in protecting and growing wealth.
The next few charts will show that even with the many challenges faced in 2011; our experienced Trust and Investments team posted positive results and did so in a profitable manner.
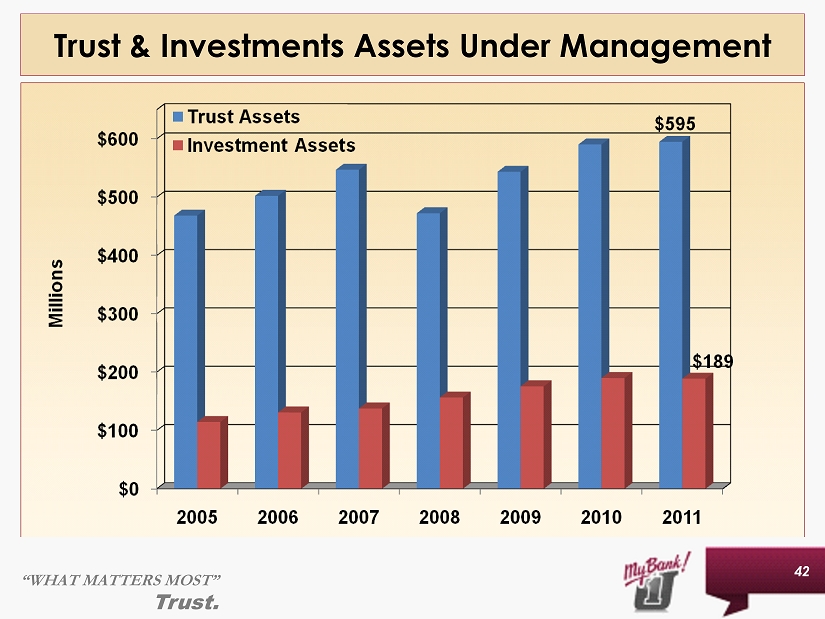
Slide 42: Trust & Investments Assets Under Management
Our first chart shows assets under management with trust assets shown in blue and investment services shown in red. We achieved a modest growth last year as we balanced the intake of new account relationships with the maturity of others. In 2011, we saw markets grow by as much as 10% and then fall as low as negative 7%; with broad based markets ending flat by the end of the year. The volatility in 2011 was reminiscent of what we saw in the financial meltdown of previous years, and although not as severe, it served as a reminder that volatility is part of investing and it does have a direct effect on our income.
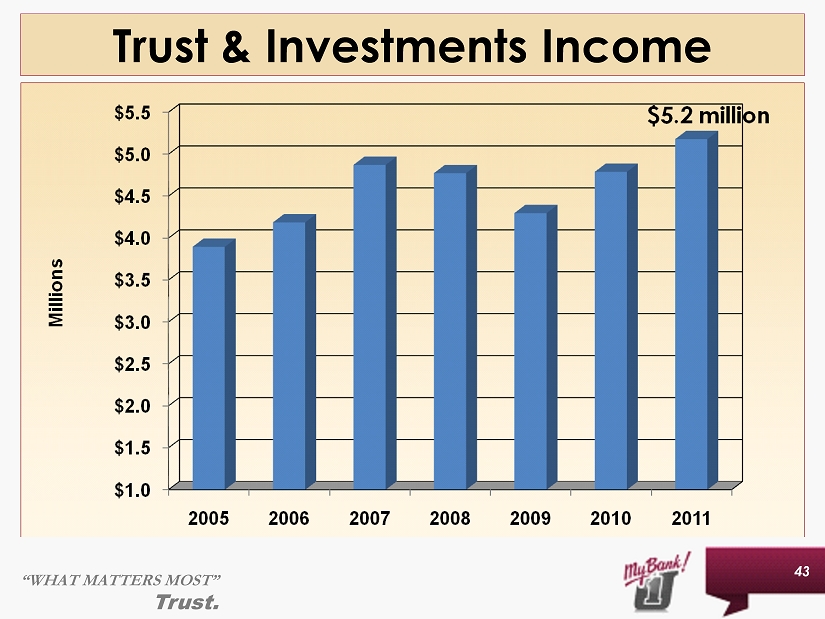
Slide 43: Trust & Investments Income
The majority of our revenue within Trust & Investments is generated from fees collected on assets under management and transaction charges. With flat stock market returns last year and increased volatility, one would expect that revenue would be flat; however, revenues were up by 8.1%. We accomplished modest growth in our net income by achieving good production results and delivering high quality investment returns.
Slide 44: Trust & Investments – Asset Class Returns
Over the past 10 years, our Managed Asset Portfolios continue to beat their relative indices by providing consistent performance levels. From the chart behind me, you can see that the design of our Managed Asset Portfolio is to provide a long term strategy that maximizes returns, but minimizes risk relative to other strategies. We believe that you don’t put all your eggs in one basket and our top down investment strategy helps clients achieve diversification in a well rounded portfolio. Our Managed Asset Portfolios are proof that we can manage money as well as any of our competitors.
Slide 45: Trust & Investments – Balanced MAP Objective
Over the last few years, I’m sure you’ve heard friends, family, and neighbors discuss how “they have seen their investments and savings depleted and are concerned about the future.” Unlike many other investment advisors, First United Trust & Investments has seen our balanced portfolios, represented by chart behind me, reflect consistent long term success.
As an example, you can see how an investor in the balanced asset allocation of our Managed Asset Program, who started with $1,000,000 on December 31, 2001, would have had $1,744,407 on December 31, 2011 - that equates to a 74% increase. Comparing those results with the S&P 500 index, one can see that we provided consistent returns without the comparable volatility and risk. I would like to recognize Scott Rush, Senior Trust Portfolio Manager, for his fine work in guiding us through these markets and keeping our clients on track-thank you Scott.
Slide 46: Trust & Investments Noteworthy Points
Before I move into my closing, let me share some of the more significant points of interest in 2011:
First, Bill Grant mentioned the retirement of Gene Helbig and I want to thank Gene for his 25 years of service and dedication at First United Bank & Trust. I thank him for his leadership and compassion and wish him well in retirement.
During the turbulent times of 2011, our most dedicated and professional sales teams posted in excess of $1,500,000 worth of new fee income. I think this is just fantastic when you consider the environment of a less than enthusiastic investment community combined with the low interest rate environment. We continue to hear from our customers that our service levels exceed their expectations and we consistently deliver on financial results. I thank our sales and service teams for their dedication and commitment to do what is right for the client.
Lastly, we continue to focus on our standards of fiduciary responsibilities. We are fiduciaries and have operated as such since the beginning of the trust department. What this means to our clients is that we have a legal responsibility to do what is right for our client, operate in a confidential manner, and eliminate conflicts of interest.
This high standard of conduct brings our clients peace of mind and confidence in the work we do. This fiduciary status sets our Trust & Investments Department apart from other financial professionals and investment companies who are not held to the same level of expectations. This is an important determining factor in why our clients come to First United for their investment management needs and why they continue to tell their family and friends about our services.
In closing, we will continue to do our best work, going about the business of managing our client’s financial affairs. Our best customers and prospects continue to come to us the old fashion way: by direct introduction from our existing clients. Be assured that we appreciate the trust you have placed in our company and continue to work every day to increase our service levels and effectiveness. Please keep us in mind as you talk with people who might benefit from our good work.
While the celebration of a golden anniversary is a time of reflection and celebration, please know that we come to work every day dedicated to servicing our clients and our community.
Thank you for being here today. I would now like to turn the program over to Jeannette Rudy Fitzwater.
JEANNETTE RUDY FITZWATER
Slide 47: Jeannette Rudy Fitzwater
Like all divisions of your company, the Corporate Services group—Human Resources, Training and Marketing, is constantly balancing the role of maintaining prudent expense reduction, while investing in the areas with the greatest opportunity for shareholder return.
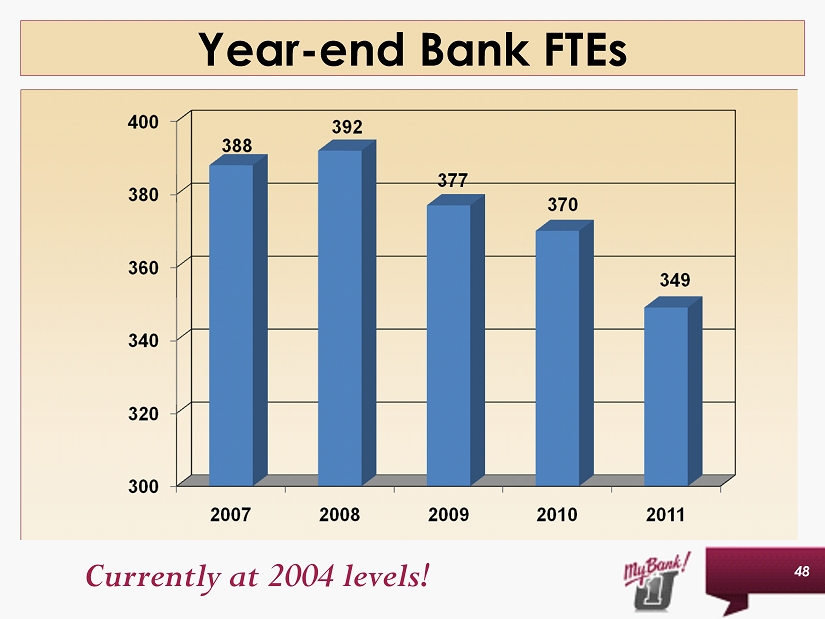
Slide 48: Year-end Bank FTEs
Much of our company focus in 2011 was centered on “right-sizing” our balance sheet. It only made sense then that with fewer assets on our books, we should be able to operate with a leaner staff. Therefore in 2011 we further concentrated our efforts to decrease our full-time equivalent employees. Without incurring layoffs, last year alone we reduced our staff by six percent. We currently stand at the same number of bank staff that we had in 2004, when our assets were at a similar level.
So you may ask how we accomplished this. Did we just not fill any positions? I’m pleased to say that we took a more strategic approach. We knew we had to change the way we conduct business in order to sustain real savings. Therefore, each team evaluated the way they were conducting business today as well as where they anticipated being in the future. You have heard of the impact of a LEAN review in the Mortgage area. Several other LEAN initiatives took place whereby we streamlined our processes, and therefore were better able to re-align staff. As we have moved toward more electronic delivery systems, we are finding that the staffing complement of our branch network must also change. Essentially, all these small changes added up to an annual decrease of 21 FTEs, resulting in a substantial reduction in salaries and benefits expense.
As we move into 2012, we are beginning to re-focus our efforts toward a handful of strategic hires while keeping our overall headcount level. These new team members are primarily being placed in our specialized revenue generating areas, such as Commercial Lending and Trust.
It’s important to recruit the right talent. However, it is probably even more important to retain some of our best associates. One of our strategic goals for 2012 is to re-validate our salary structure, identify some of our key associates and to introduce a leadership development program. As Robin mentioned, we have also invested significant training dollars into building a more structured retail sales management program. We know our future lies in the success of building our leaders today!
Slide 49: Community Oriented Business Owners
Organizations may thrive or only survive based on the success of their communication. During 2011, we focused our marketing strategy on attracting and retaining Community Oriented Business Owners (COBOs.) We supported the effort by growing through our Market President driven, team sales initiative. At the same time, we began to consistently emphasize the use of electronic delivery and communication tools. Most notably, we introduced our Mobile Banking program, while growing our use of e-statements and e-mail communication.
Through our team sales approach, the COBO has his needs served on both the commercial and personal side. For instance, our Community Office Manager may open personal and commercial checking accounts for him, while bringing in a Trust/Investment Officer to assist him with estate planning concerns. Although one banker typically takes the lead, the COBO enjoys the full benefit of always having a strong financial team looking out for his best interests!
Slide 50: COBO Checking Account Balances
So how well is this strategy working? Utilizing a full relationship approach, in 2011 we were able to grow our number of business households by approximately 12%, while growing our core business checking deposits by close to 9% during the same period. Clearly increasing the quantity and quality of our joint sales calls, and providing marketing campaigns to support the strategy, IS having a positive impact on our COBO growth trend!
In 2012 we are further fine-tuning and enhancing this strategy. Our COBOs are busy taking advantage of having cash flow reviews with our individual market based banking teams. These reviews have highlighted varied COBO needs that may be met through the expertise of our experienced team members. In addition, as we look to specific markets, several regions are also planning on focusing more keenly on serving the needs of female entrepreneurs and veterans. Ultimately the combination of these efforts drive toward finding customized solutions for our COBOs so that they may focus on achieving their hopes and dreams.
Slide 51: In-Branch Video
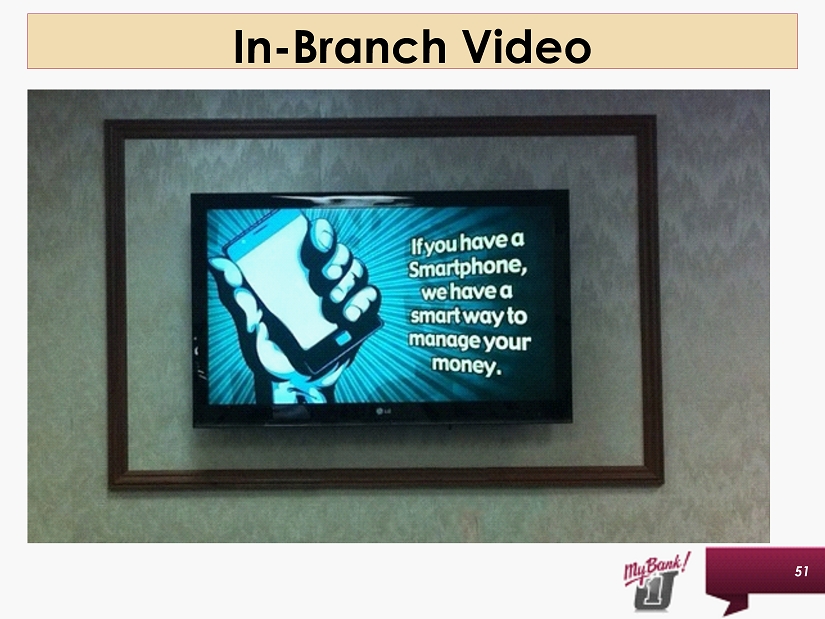
In terms of electronic communication, you may now see us through digital messages in our lobbies. We have added these displays behind our teller lines in select offices. This allows us to communicate continually to our customers, even when they are waiting in line. It also provides us with the opportunity to offer new products and campaigns in a timely and more targeted way.
Slide 52:My Bank on Facebook
For those of you using social media such as Facebook, Twitter and LinkedIn, we are also visible. On the screen is a sample of our Facebook fan page. We are pleased to announce that we now have more than 2,000 fans who follow our posts and add comments daily. In addition to the letters and e-mails that we receive, we are now receiving many positive testimonials via Facebook posts. This is extremely gratifying! We anticipate that we will eclipse 2,500 fans, and thereby further our impact to this targeted audience.
Slide 53: TheMy Bank Blog
Not only may customers join in communicating via social media, they may access valuable financial information. You’ll see behind me a sample of our blog page, located at mybank4.me. This interactive blog is primarily targeted to meeting our COBOs’ needs. For instance, our COBO may view a staff produced video about cash flow today, and read an article about hiring trends tomorrow. Our customers tell us that they truly value this resource. In summary, our outreach today is much different than in the past. Our customers choose to conduct their banking transactions and to communicate when it’s convenient to them! We believe that this combination of initiatives gives us an opportunity to communicate in a more timely manner, while growing and maintaining our important customer base.
As we move forward toward the balance of 2012, we will strive toward positive growth for our associates, our customers—especially COBOs, and ultimately to you our shareholders.
Jason Rush will now further outline for you the operational impact of your company’s electronic banking strategy.
JASON RUSH
Slide 54: Jason Rush
Hello again, as promised I would now like to update you on the topics of enterprise risk management and information technology.
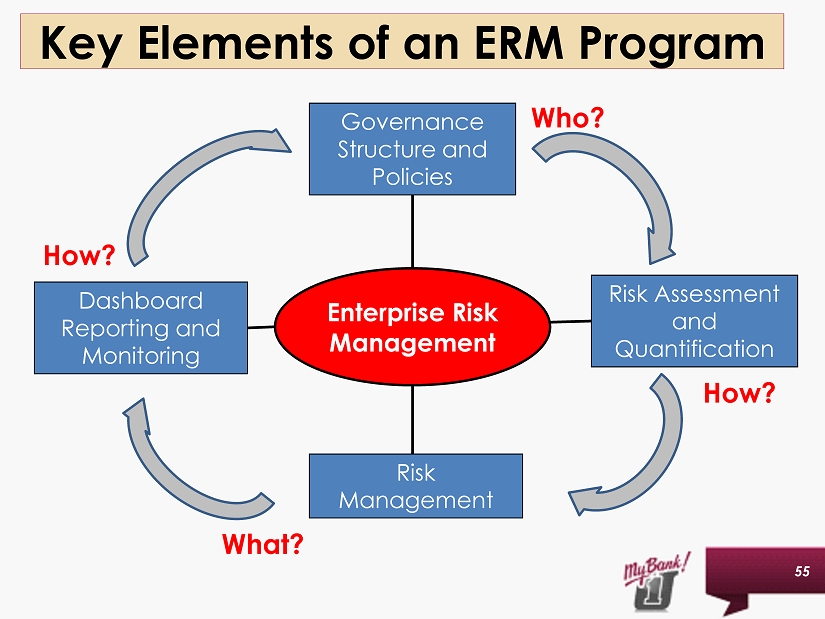
Slide 55: Key Elements of an ERM Program
Risk management should not be confused with risk avoidance. It also should not be thought of as a function of audit, as it is not a look backwards but is applied as a part of the driving of the strategic direction of the company. Enterprise risk management is a value added function and includes integrated framework for managing our credit risk, market risk, operational risk, capital, and risk transfer in order to maximize the company’s value.
The key risk indicators we have identified to monitor as part of our enterprise risk management program are not new measurements. They are familiar terms to all of us; capital ratios, liquidity, asset quality, net interest margin. We are utilizing the data in a more centralized approach as we discuss and implement new products, services or business lines. By implementing the tenets of enterprise risk management we realize less duplication of effort between areas of the company and a more streamlined approach in the monitoring of our overall risk profile as well as our regulatory requirements.
Slide 56: Delivery Channel Usage
The last area I would like to discuss today is technology and our efforts to support our employees and customers in a continually changing environment.
First United, much like the rest of the banking industry, has seen a substantial increase in the number of customers turning from the traditional paper check while taking advantage of our electronic delivery channels. Debit card or point of sale continues to be our transaction leader now making up over 40% of the total transactions that come through our customer accounts. Our business customers continue to utilize our advanced cash management services to easily originate ACH transactions from the comfort of their own offices. In addition, as Jeannette mentioned, in the fall of 2011 we rolled out our mobile banking platform. Since our introduction, we have had over 1,500 customers choose to sign up and start using their phone to check balances, transfer funds and even pay their bills. We are excited by the potential growth this channel has and expect to see rapid growth in volume over the next couple years.
In conclusion, I would like to thank you for your time, your continued support and now turn the presentation back over to Bill. Thank you.
BILL GRANT
Slide 57: Bill Grant
Through these presentations, I hope that you were able to gain a perspective into the progress your Company is making, not only in addressing past issues, but in moving the Bank forward to seize upon opportunities in today’s and tomorrow’s markets.
Slide 58: Frequently Asked Questions
The next part of our presentation is to provide responses to questions posed to us by some who could not be here today, as well as some that have been provided by some of you. We continue to receive input from several that this is a very valuable part of the meeting.
Slide 59: Question 1
Can you provide more information on the loss incurred in the first quarter of this year?
As discussed in our recent public news releases, we recognized a significant credit loss during this past quarter. Approximately 90% was due to one loan. This particular loan was part of a larger participation and resulted in the construction of an ethanol plant in nearby Pennsylvania. Such a notion was consistent with a general move by the country to utilize alternative sources of energy. The underlying strength of this credit request was a contract whereby a well-known international oil company would purchase, at a stipulated price, the entire amount of ethanol produced by the plant.
Our customer performed as expected and production and payment went well for a period of time. The oil company then reneged on its contractual obligation. Despite two findings in arbitration in favor of our client, the oil company sought protection in bankruptcy. As might be expected, this resulted in significant hardship for our client, forcing it into bankruptcy as well. In April, the bankruptcy trustee sold the ethanol plant at an incredibly deep, and unexpected, discount.
First United, and other participants, continue to explore potential legal claims against this oil company, and others. The ultimate outcome, however, cannot be accurately predicted at this time. As such, appropriate regulation and accounting requires us to recognize the loss that has occurred. Any success in the courts in the future would be a recovery against thisloss.
Slide 60: Question 2
How is the Company progressing with its growth in core earnings?
As we have mentioned before, the majority of your Bank’s revenue comes from net interest income. This is essentially the difference between what we earn on loans and investments and what is paid to depositors and other funding sources. For the quarter just ended, net interest income was $9.8 million, compared with $9.4 million for the 1st quarter of last year. What is striking about this is that we achieved this improvement with $132 million less in assets than we had this time last year.
The primary reason for this improvement is the significant improvement in the net interest margin. The margin is the difference, in percentage, between the rate earned on loans and investments and the rate paid for deposits and funding. This percentage improved from 2.73% to 3.30%.
In addition, our Trust & Investment area continues to expand. Its gross income was up nearly 7% over the first quarter of last year. In another category, service charges on deposit accounts are down over 8% this year. This has been an area of increased regulation and congressional mandates. While the decline is difficult to absorb in other areas, I can tell you that, in speaking with many other community banks, our decline is less than many of them are witnessing.
Another factor in improving core earnings has been your Company’s ability to control expenses. Expenses for the quarter ended March 31, 2012 are 10% less than those for the same quarter as last year.
Slide 61: Question 3
What is the current status of the Bank’s participation in the Capital Purchase Program?
By way of a reminder, First United, with the encouragement of its regulators, decided to participate in the Capital Purchase Program, which was part of the Troubled Asset Repurchase Program enacted by Congress. The capital added was helpful to your Company through the difficult years of the Recession. In addition to serving as a buffer, the capital helped the Bank provide loans to small businesses in our markets.
The investment by Treasury continues to accrue a 5% dividend, and we account for this payment on an ongoing basis. As you may remember, we were asked by the Federal Reserve to defer actual payments of the dividend, but we have continued to accrue the dividend which is reflected in income available for shareholders, and in our capital ratios.
The dividend rate of 5% continues for almost two more years. At this rate, it provides very reasonably priced and non-dilutive capital for the Company. In light of this, we will continue to evaluate our options regarding this capital injection.
It is worth noting that while the Capital Purchase Program was defined as permanent capital, many banks have repaid it to the Treasury. In fact, if you look at that portion of TARP injected into the banks of this country, an amount equal to greater than 100% of the investment has already been returned to the taxpayer.
Slide 62: Question 4
What are the thoughts concerning dividends to the shareholders of the common stock?
This is a question that prompts discussion at many of the Board meetings. I can assure you that it weighs heavily on the minds of your Directors. A point in time when the dividends will start again cannot yet be determined. First United has made strides in strengthening its capital, and, with the exception of the credit noted earlier, has restored a core earnings stream. When earnings reach a normalized level, and when our level of troubled loans is within historical levels, I believe that the issue of dividend restoration can be re-evaluated.
Slide 63: Question 5
What is First United doing to prepare itself for the changes brought about by social media?
I can only add a bit to Jeannette’s presentation. Through her work – and the strong and innovative leadership of both Eric Nutter and Matt Growden – First United continues to meet the next generation of consumers and Community Oriented Business Owners where and how they wish to do business and create a financial relationship.
Last year, we introduced mobile banking, and this has been well received. At the outset of the meeting, you may have noticed the screen showing a snippet from our Facebook page. We are delighted with the number of people who have “friended” us. The postings have, on occasion, given us the opportunity to reach out offline to customers, and actually increase their relationship with the Bank.
Slide 64: Question 6
There has been a lot in the news about community banks meeting the loan demand of their customers. How is First United coming along on this?
There has certainly been a lot in the news media about the perceived unwillingness by banks to meet the credit needs of its communities. This notion fails to recognize that the main way that banks earn money is through lending. It is true that credit standards have tightened through the recession. This is attributed to both renewed prudence by lenders and escalating regulatory mandates. This is coupled with the fact that decreasing real estate prices have hampered the ability to use the property as collateral at levels which existed prior to the recession.
These factors have impacted First United as well, but I can assure you that our producers have been out in our communities. Recently, we have seen an increased level in our mortgage area. Commercial lending has been more difficult. Many, many of the stronger commercial businesses within our markets simply are reluctant to borrow, given the myriad of uncertainties that still exist. Many of these businesses continue to hold cash, or are actually using these reserves to pay down debt. I am pleased to report that we are beginning to see the beginnings of some renewed loan demand within some of our markets.
Slide 65: Question 7
There has been a lot of movement in the price of the stock. What is causing this?
There has certainly been strong upward movement of our stock price so far this year. In addition, we have seen trading volume well in excess of historical levels. It is difficult to know what motivates an investor to make a purchase or sell decision at a particular price. Some of the things we believe may be influencing these decisions involve the improvement in our core earnings, as we previously discussed. Another factor might be the improving trends in our loan portfolio that Carissa covered in her presentation. Yet another element could be the significant buying of the stock by directors and officers over the course of the last year or so. This confidence in the Company might be contagious. We are aware that there is a level of short trading that is occurring, and that a significant amount of the trading is occurring in the retail area, as opposed to institutional activity.
Slide 66: Thank you!
As we conclude our comments today, I hope that you are able to gain a sense that your Company is coming back on track. Yes, the past few years have been painful ones, and that has been covered in significant detail in both our past meetings and in our communications. What should be evident is that the core earnings of First United are strong, and are gaining strength. Over time, this will help in bolstering capital, completing the remediation of the loan portfolio, and will allow us to consider resuming the payment of dividends.
I want to personally thank your Board of Directors for their keen leadership. I also want to thank all the associates of First United who have come together and worked incredibly hard and diligently in executing the plans we have presented to you this morning. And, we thank you, our shareholders, for your support, and look forward to serving you in the years to come.
Thank You.
First United Corporation Annual Shareholders’ Meeting May 10, 2012 First United Corporation Annual Shareholders’ Meeting May 10, 2012

First United Corporation Annual Shareholders’ Meeting May 10, 2012 Bill Grant President, Chief Executive Officer and Chairman of the Board
Forward - Looking Statements Forward - looking statements in this presentation relating to First United Corporation’s plans, strategies, objectives, expectations, intentions and adequacy of resources, are made pursuant to the safe harbor provisions of the Private Securities Litigation Reform Act of 1995. The information contained herein should be read in conjunction with First United Corporation’s 2011 Annual Report on Form 10 - K filed with the Securities and Exchange Commission (“SEC”), which is available on the SEC’s website www.sec.gov or at First United Corporation’s website www.mybank4.com . Investors are cautioned that forward - looking statements, which are not historical fact, involve risks and uncertainties, including those detailed in First United Corporation’s 2011 Annual Report on Form 10 - K filed with the SEC under the section, ‘Risk Factors’ in Part 1, Item 1A. Such statements are subject to important factors that could cause actual results to differ materially from those contemplated by such statements. First United Corporation does not assume any duty to update any forward - looking statements. 3
First United Corporation Annual Shareholders’ Meeting May 10, 2012 Bill Grant President, Chief Executive Officer and Chairman of the Board
First United Corporation Annual Shareholders’ Meeting May 10, 2012 Carissa Rodeheaver Executive Vice President & Chief Financial Officer
“Progress lies not in enhancing what is, but in advancing toward what will be.” Khalil Gibran 6 Rebuilding and Restructuring
• Continuation of: • low interest rates • global uncertainty • real estate value decline • Businesses reluctant to make changes • Businesses and consumers experiencing weaker cash flow 7 Economic Environment
2011 Areas of Focus • Credit Quality • Reduce Adversely Classified Assets • Substandard Loans • Other Real Estate Owned 8 • Liquidity • Right - size balance sheet • Invest excess liquidity levels • Structure investment portfolio for cash flow and short duration • Earnings / Capital Adequacy
2011 Areas of Focus • Credit Quality • Reduce Adversely Classified Assets • Substandard Loans • Other Real Estate Owned 9 • Liquidity • Right - size balance sheet • Invest excess liquidity levels • Structure investment portfolio for cash flow and short duration • Earnings / Capital Adequacy
Trend in Total Assets 10
11 Balance Sheet - Asset Mix
Trend in Loan Balances 12
Trend in Deposits 13
2011 Areas of Focus • Credit Quality • Reduce Adversely Classified Assets • Substandard Loans • Other Real Estate Owned 14 • Liquidity • Right - size balance sheet • Invest excess liquidity levels • Structure investment portfolio for cash flow and short duration • Earnings / Capital Adequacy
Providing for Loan Losses 15 Recession
Net Charge - Offs as % of Average Loans 16 Recession
Reserves vs. Non - Performing Loans 17 Recession
2011 Areas of Focus • Credit Quality • Reduce Adversely Classified Assets • Substandard Loans • Other Real Estate Owned 18 • Liquidity • Right - size balance sheet • Invest excess liquidity levels • Structure investment portfolio for cash flow and short duration • Earnings / Capital Adequacy
Net Income Available to / Net Loss Attributable to Common Shareholders 19
Net Interest Margin 20
21 Other Operating Income * * Excluding gains/losses
Diversified Fee Income (excluding gains/losses) 22
23 Operating Expense
Corporation Remains Well - Capitalized 0% 2% 4% 6% 8% 10% 12% 14% Q4 08 Q4 09 Q4 10 Q4 11 Q1 12 Tangible Leverage Tier 1 Total (Unaudited) Well - Capitalized 24
“Progress lies not in enhancing what is, but in advancing toward what will be.” Khalil Gibran 25 2011 – A Year of Progress

First United Corporation Annual Shareholders’ Meeting May 10, 2012 Tracy B emiller Senior Vice President & Senior Lending Officer
27 Commercial Loan Production Production defined as new loans and modifications and renewals of existing loans.
Loan Portfolio Composition 28
29 First United Market Area 29

First United Corporation Annual Shareholders’ Meeting May 10, 2012 Jason Rush Senior Vice President, Chief Risk Officer & Director of Operations
31 Residential Mortgage Production 31
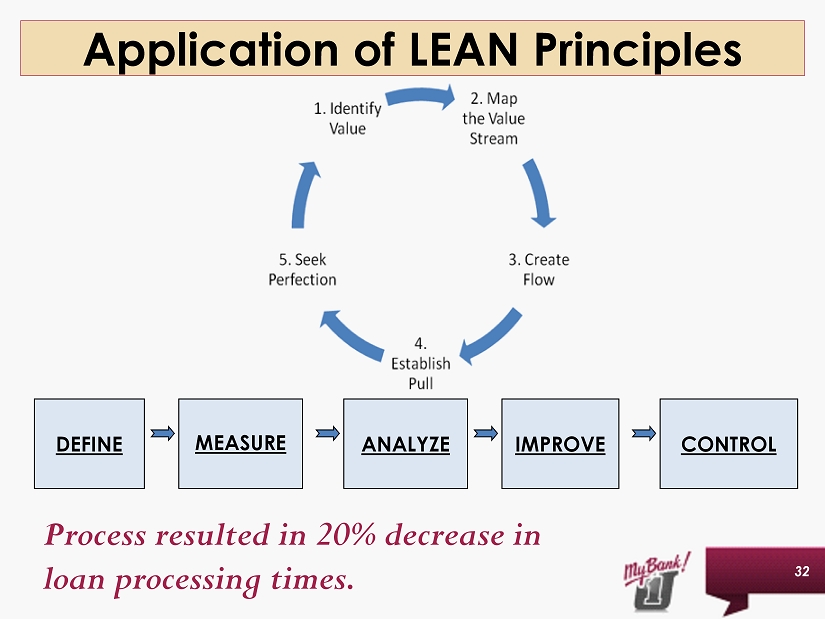
32 Application of LEAN Principles DEFINE MEASURE ANALYZE IMPROVE CONTROL Process resulted in 20% decrease in loan processing times.

First United Corporation Annual Shareholders’ Meeting May 10, 2012 Robin Murray Senior Vice President & Director of Retail Banking
34 First United Market Area 34
35 Stable Funding Sources 35

Retail Deposit Composition 36
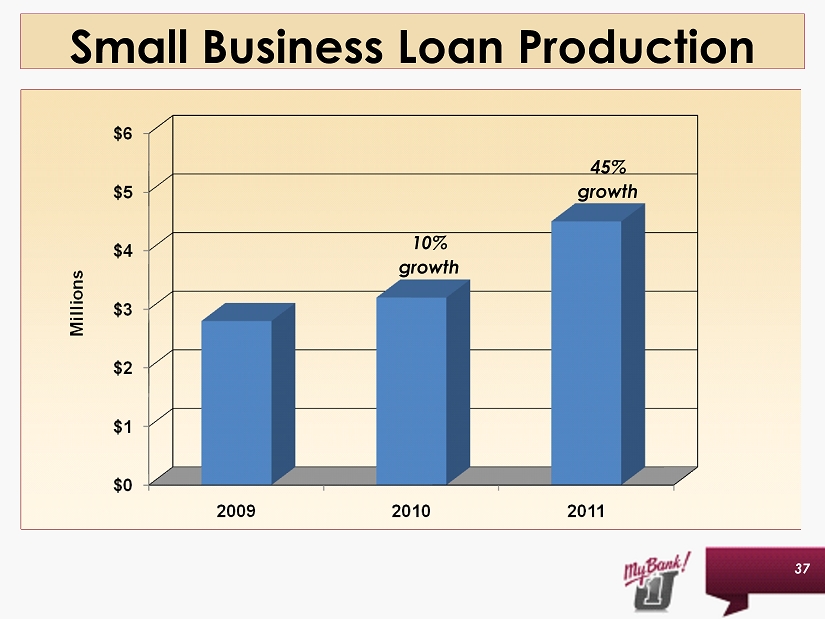
37 Small Business Loan Production 37 10% growth 10% growth 45% growth

38 What Our COBO Customers are Saying 38
39 What Our COBO Customers are Saying 39 “You can tell this type of service comes from the heart, not a book or script!” “It’s a true partnership.”
Be the BEST in all markets by leveraging TEAMWORK PASSION for helping People achieve goals and dreams Economic Driver: NET INCOME per Associate Uncommon Commitment to Service and Solutions! 40

First United Corporation Annual Shareholders’ Meeting May 10, 2012 Keith Sanders First Vice President & Senior Trust Officer
Trust & Investments Assets Under Management 42 “WHAT MATTERS MOST” Trust .
Trust & Investments Income 43 “WHAT MATTERS MOST” Trust .

44 Trust & Investments – Asset Class Returns 2002 2003 2004 2005 2006 2007 2008 2009 2010 2011 10-Year Cum Fixed Income 10.3% Sm Cap 47.3% Int’l 20.2% Int’l 13.5% Int’l 26.3% Lg Cap Growth 11.8% Fixed Income 5.2% Lg Cap Growth 37.2% Sm Cap 26.85% Fixed Income 7.84% Fixed Income 75.18% Cash 1.8% Int’l 38.6% Sm Cap 18.3% Lg Cap Value 7.1% Lg Cap Value 22.3% Int’l 11.2% Cash 2.1% Int’l 31.8% Lg Cap Growth 16.71% Lg Cap Growth 2.64% Lg Cap Value 30.0% Lg Cap Value 16.5% Sm Cap 18.4% Sm Cap 27.2% Lg Cap Value 15.51% Lg Cap Core 2.11% Sm Cap 72.79% Lg Cap Value -15.5% Lg Cap Growth 29.8% Lg Cap Growth 5.3% Lg Cap Core 15.8% Fixed Income 7.0% Sm Cap -33.8% Lg Cap Core 26.5% Lg Cap Core 15.06% Int’l 57.73% Int’l -15.9% Lg Cap Core 28.7% Lg Cap Core 10.9% Lg Cap Core 4.9% Lg Cap Core 5.5% Lg Cap Value -36.9% Lg Cap Value .39% Lg Cap Value 46.52% Sm Cap -20.5% Lg Cap Growth 6.3% Sm Cap 4.6% Lg Cap Growth 9.1% Cash 5.0% Lg Cap Core -37.0% Lg Cap Value 19.7% Int’l 7.75% Cash .10% Lg Cap Core 33.42% Lg Cap Core -22.1% Fixed Income 4.1% Fixed Income 4.3% Cash 3.1% Cash 4.9% Lg Cap Value -0.2% Lg Cap Growth -38.4% Fixed Income 5.9% Fixed Income 6.54% Sm Cap -4.18% Lg Cap Growth 29.36% Lg Cap Growth -27.9% Cash 1.2% Cash 1.3% Fixed Income 2.4% Fixed Income 4.3% Sm Cap -1.6% Int’l -43.4% Cash 0.2% Cash .13% Int’l -12.14% Cash 21.52% Best Returns Worst Returns First United Balanced Managed Asset Portfolio =

“WHAT MATTERS MOST” Trust. 45 Trust & Investments – Balanced MAP Objective $500,000 $1,000,000 $1,500,000 $2,000,000 2001 2003 2005 2007 2009 2011 10 Years Ending 12/31/11 Balanced Map Objective Growth of $1,000,000 Balanced MAP S&P 500 Not a deposit - Not FDIC Insured - Not guaranteed by the bank - May lose value - Not insured by any government agency $1,744,407 $1,333,243
• Our people in Trust & Investments make the difference 46 “WHAT MATTERS MOST” Trust. Trust & Investments – 2011 Noteworthy Points • Focus on applying fiduciary standards • New business development continues to grow by word of mouth

First United Corporation Annual Shareholders’ Meeting May 10, 2012 Jeannette Rudy Fitzwater Senior Vice President & Director of Corporate Services
48 Currently at 2004 levels! Year - end Bank FTEs

The community oriented business owner lives, works and plays here in our various communities. They are invested in their own financial well - being, and in the success of the community as a whole. We believe that we can help them achieve that success. 49 Community Oriented Business Owners

COBO Checking Account Balances 50 8.6% Growth in Balances 12% Growth in New COBO Relationships
51 In - Branch Video

52 - Over 2,000 Fans - Weekly Updates - Frequent Interaction - Fan Contests My Bank on Facebook

53 - Business Articles - Audio Podcasts - Webinars - Updates Daily The My Bank Blog
First United Corporation Annual Shareholders’ Meeting May 10, 2012 Jason Rush Senior Vice President, Chief Risk Officer & Director of Operations
55 Key Elements of an ERM Program Governance Structure and Policies Risk Management Risk Assessment and Quantification Dashboard Reporting and Monitoring Enterprise Risk Management How? How? What? Who?

Delivery Channel Usage 56

First United Corporation Annual Shareholders’ Meeting May 10, 2012 Bill Grant President, Chief Executive Officer and Chairman of the Board

First United Corporation Annual Shareholders’ Meeting May 10, 2012 Frequently Asked Questions
Can you provide more information on the loss incurred in the first quarter of this year? 59 Question 1:
How is the Company progressing with its growth in core earnings? 60 Question 2:

What is the current status of the Bank’s participation in the Capital Purchase Program? 61 Question 3:

What are the thoughts concerning dividends to the shareholders of the common stock? 62 Question 4:

What is First United doing to prepare itself for the changes brought about by social media? 63 Question 5:
There has been a lot in the news about community banks meeting the loan demand of their customers. How is First United coming along on this? 64 Question 6:

There has been a lot of movement in the price of the stock. What is causing this? 65 Question 7:

First United Corporation Annual Shareholders’ Meeting May 10, 2012 Thank you!