Exhibit 99.1
| Robert R. Hill, Jr. - Chief Executive Officer John C. Pollok - Senior Executive Vice President and Chief Operating Officer Donald E. Pickett - Executive Vice President and Chief Financial Officer |
| Forward-Looking Statements Statements contained in this presentation, which are not historical facts, are forward-looking statements. In addition, SCBT Financial Corporation (SCBT) through its senior management or directors may from time to time make forward-looking public statements concerning matters herein. Such forward-looking statements are necessary estimates reflecting the best judgment of SCBT’s senior management or directors based upon current information and involve a number of risks and uncertainties. Certain factors which could affect the accuracy of such forward-looking statements are identified in the public filings made by SCBT with the Securities and Exchange Commission, and forward-looking statements contained in this presentation or in other public statements of SCBT or its senior management or directors should be considered in light of those factors. There can be no assurance that such factors or other factors will not affect the accuracy of such forward-looking statements. 2 |

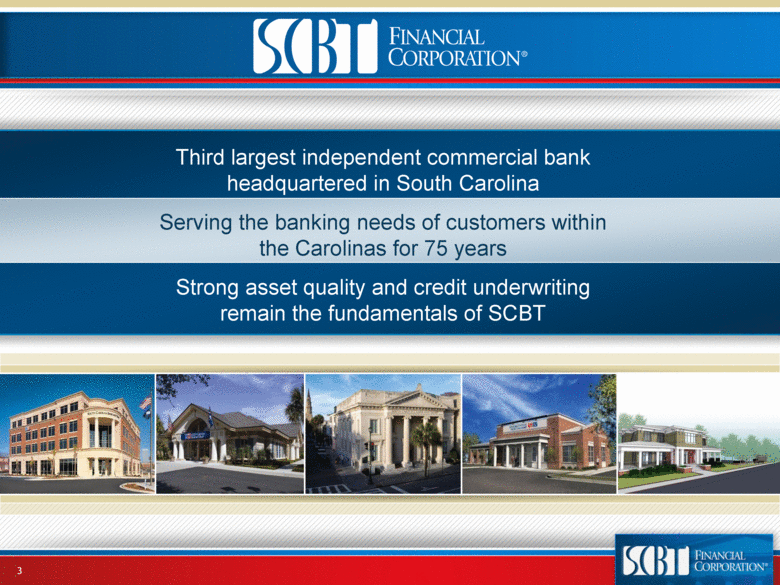
| Third largest independent commercial bank headquartered in South Carolina Serving the banking needs of customers within the Carolinas for 75 years Strong asset quality and credit underwriting remain the fundamentals of SCBT 3 |
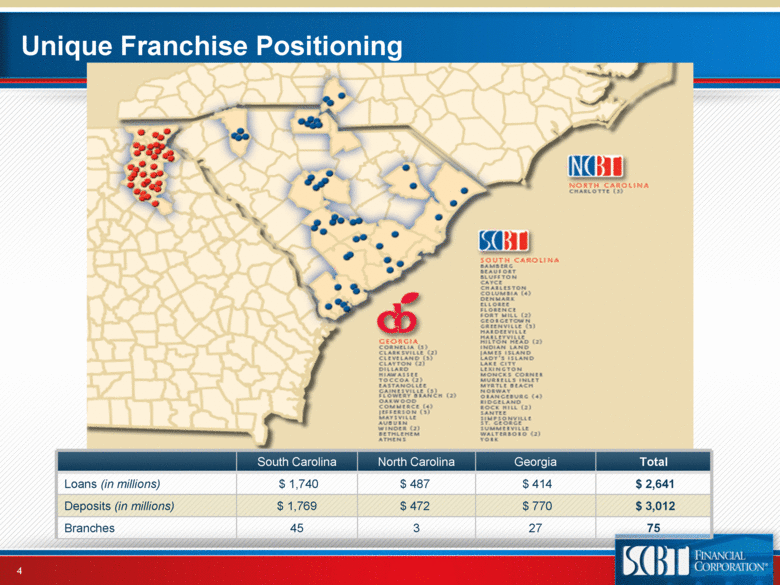
| Unique Franchise Positioning South Carolina North Carolina Georgia Total Loans (in millions) $ 1,740 $ 487 $ 414 $ 2,641 Deposits (in millions) $ 1,769 $ 472 $ 770 $ 3,012 Branches 45 3 27 75 4 |
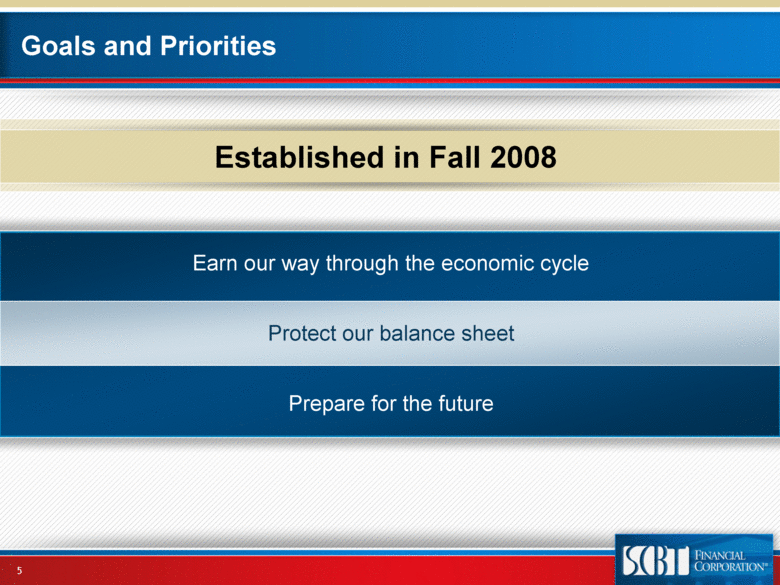
| Earn our way through the economic cycle Protect our balance sheet Prepare for the future Goals and Priorities Established in Fall 2008 5 |
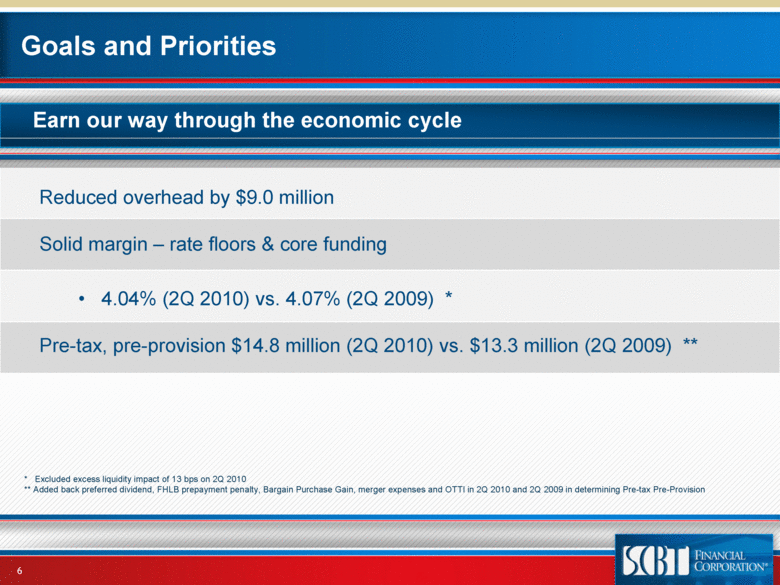
| Goals and Priorities Earn our way through the economic cycle Reduced overhead by $9.0 million Solid margin – rate floors & core funding 4.04% (2Q 2010) vs. 4.07% (2Q 2009) * Pre-tax, pre-provision $14.8 million (2Q 2010) vs. $13.3 million (2Q 2009) ** * Excluded excess liquidity impact of 13 bps on 2Q 2010 ** Added back preferred dividend, FHLB prepayment penalty, Bargain Purchase Gain, merger expenses and OTTI in 2Q 2010 and 2Q 2009 in determining Pre-tax Pre-Provision 6 |
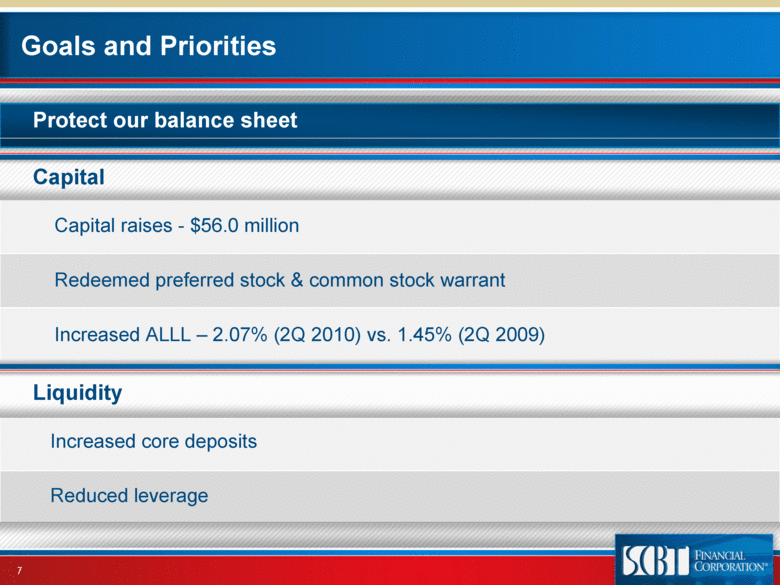
| Goals and Priorities Protect our balance sheet Capital Capital raises - $56.0 million Redeemed preferred stock & common stock warrant Increased ALLL – 2.07% (2Q 2010) vs. 1.45% (2Q 2009) Liquidity Increased core deposits Reduced leverage 7 |
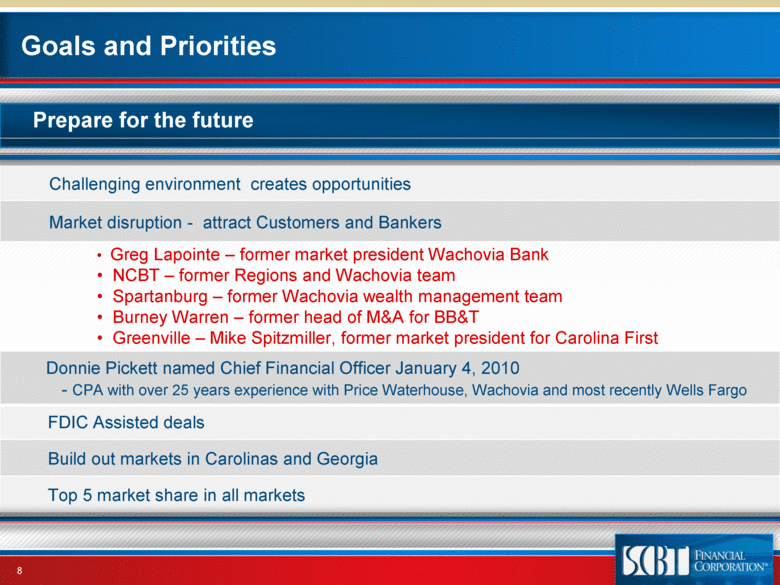
| Goals and Priorities Prepare for the future Challenging environment creates opportunities Market disruption - attract Customers and Bankers Greg Lapointe – former market president Wachovia Bank NCBT – former Regions and Wachovia team Spartanburg – former Wachovia wealth management team Burney Warren – former head of M&A for BB&T Greenville – Mike Spitzmiller, former market president for Carolina First FDIC Assisted deals Build out markets in Carolinas and Georgia Top 5 market share in all markets Donnie Pickett named Chief Financial Officer January 4, 2010 - CPA with over 25 years experience with Price Waterhouse, Wachovia and most recently Wells Fargo 8 |
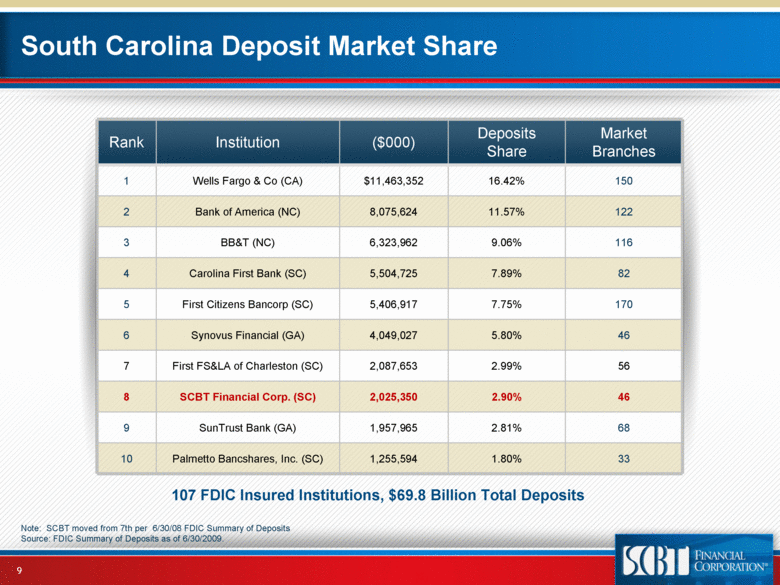
| South Carolina Deposit Market Share Note: SCBT moved from 7th per 6/30/08 FDIC Summary of Deposits Source: FDIC Summary of Deposits as of 6/30/2009. Rank Institution ($000) Deposits Share Market Branches 1 Wells Fargo & Co (CA) $11,463,352 16.42% 150 2 Bank of America (NC) 8,075,624 11.57% 122 3 BB&T (NC) 6,323,962 9.06% 116 4 Carolina First Bank (SC) 5,504,725 7.89% 82 5 First Citizens Bancorp (SC) 5,406,917 7.75% 170 6 Synovus Financial (GA) 4,049,027 5.80% 46 7 First FS&LA of Charleston (SC) 2,087,653 2.99% 56 8 SCBT Financial Corp. (SC) 2,025,350 2.90% 46 9 SunTrust Bank (GA) 1,957,965 2.81% 68 10 Palmetto Bancshares, Inc. (SC) 1,255,594 1.80% 33 107 FDIC Insured Institutions, $69.8 Billion Total Deposits 9 |
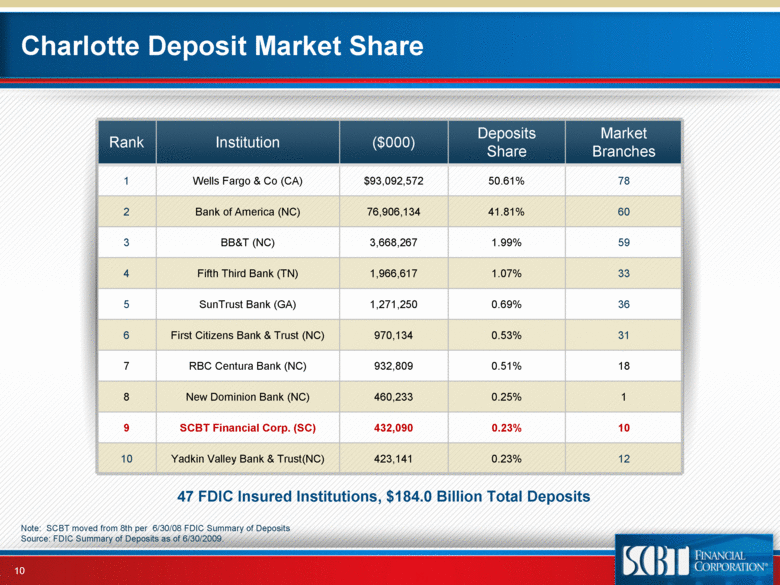
| Charlotte Deposit Market Share Note: SCBT moved from 8th per 6/30/08 FDIC Summary of Deposits Source: FDIC Summary of Deposits as of 6/30/2009. Rank Institution ($000) Deposits Share Market Branches 1 Wells Fargo & Co (CA) $93,092,572 50.61% 78 2 Bank of America (NC) 76,906,134 41.81% 60 3 BB&T (NC) 3,668,267 1.99% 59 4 Fifth Third Bank (TN) 1,966,617 1.07% 33 5 SunTrust Bank (GA) 1,271,250 0.69% 36 6 First Citizens Bank & Trust (NC) 970,134 0.53% 31 7 RBC Centura Bank (NC) 932,809 0.51% 18 8 New Dominion Bank (NC) 460,233 0.25% 1 9 SCBT Financial Corp. (SC) 432,090 0.23% 10 10 Yadkin Valley Bank & Trust(NC) 423,141 0.23% 12 47 FDIC Insured Institutions, $184.0 Billion Total Deposits 10 |
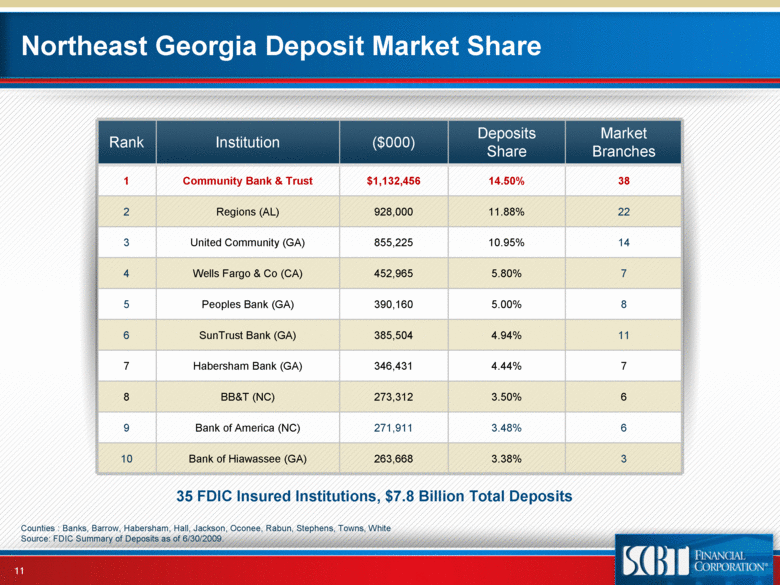
| Northeast Georgia Deposit Market Share Counties : Banks, Barrow, Habersham, Hall, Jackson, Oconee, Rabun, Stephens, Towns, White Source: FDIC Summary of Deposits as of 6/30/2009. Rank Institution ($000) Deposits Share Market Branches 1 Community Bank & Trust $1,132,456 14.50% 38 2 Regions (AL) 928,000 11.88% 22 3 United Community (GA) 855,225 10.95% 14 4 Wells Fargo & Co (CA) 452,965 5.80% 7 5 Peoples Bank (GA) 390,160 5.00% 8 6 SunTrust Bank (GA) 385,504 4.94% 11 7 Habersham Bank (GA) 346,431 4.44% 7 8 BB&T (NC) 273,312 3.50% 6 9 Bank of America (NC) 271,911 3.48% 6 10 Bank of Hiawassee (GA) 263,668 3.38% 3 35 FDIC Insured Institutions, $7.8 Billion Total Deposits 11 |
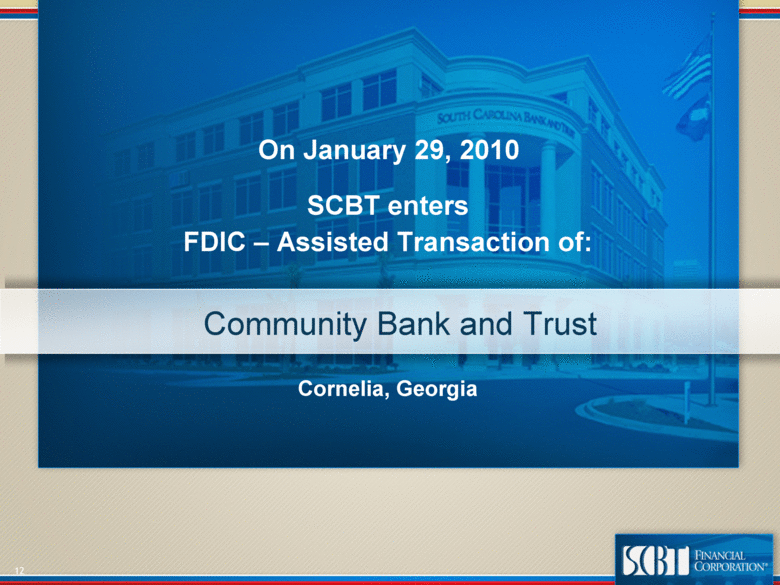
| Community Bank and Trust SCBT enters FDIC – Assisted Transaction of: On January 29, 2010 Cornelia, Georgia 12 |
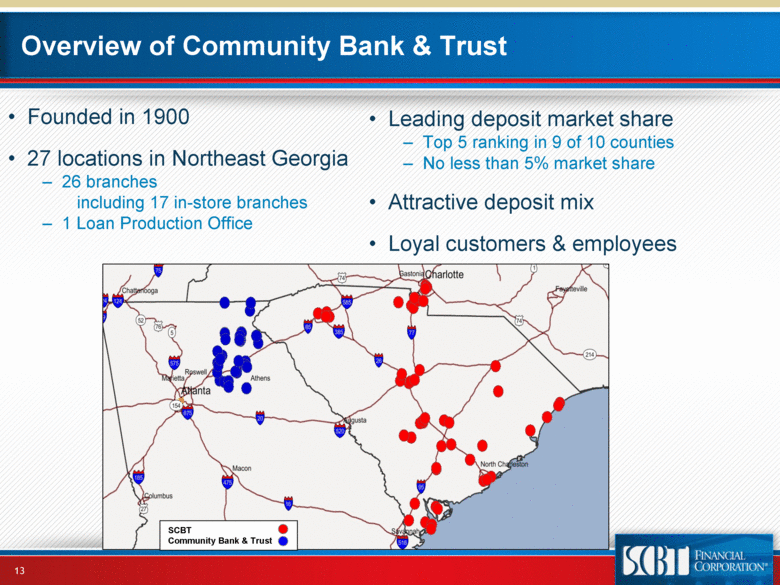
| Overview of Community Bank & Trust Founded in 1900 27 locations in Northeast Georgia 26 branches including 17 in-store branches 1 Loan Production Office SCBT Community Bank & Trust Leading deposit market share Top 5 ranking in 9 of 10 counties No less than 5% market share Attractive deposit mix Loyal customers & employees 13 |
| Transaction Rationale Opportunity to expand and diversify retail deposit franchise Opportunity to build upon Community Bank & Trust’s 110-year operating history Favorable long-term demographics Consistent with SCBT’s operating strategy Attractive financial metrics Initial expansion into Georgia Cost saves - 30% 2010 14 |
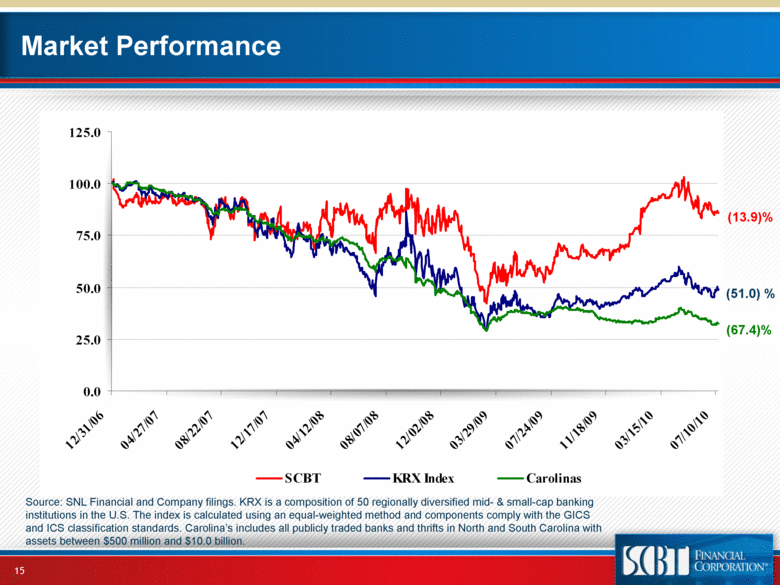
| Market Performance Source: SNL Financial and Company filings. KRX is a composition of 50 regionally diversified mid- & small-cap banking institutions in the U.S. The index is calculated using an equal-weighted method and components comply with the GICS and ICS classification standards. Carolina’s includes all publicly traded banks and thrifts in North and South Carolina with assets between $500 million and $10.0 billion. (51.0) % (13.9)% (67.4)% 15 0.0 25.0 50.0 75.0 100.0 125.0 12/31/06 04/27/07 08/22/07 12/17/07 04/12/08 08/07/08 12/02/08 03/29/09 07/24/09 11/18/09 03/15/10 07/10/10 SCBT KRX Index Carolinas |
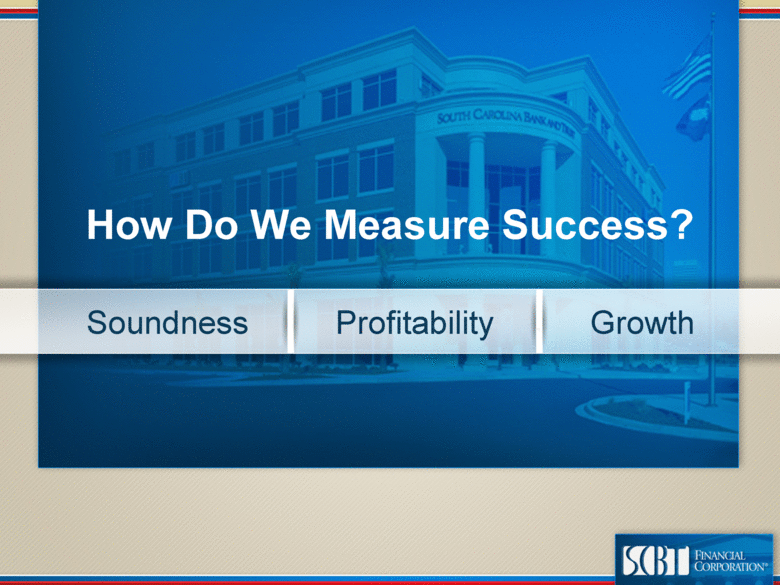
| How Do We Measure Success? Soundness Profitability Growth |
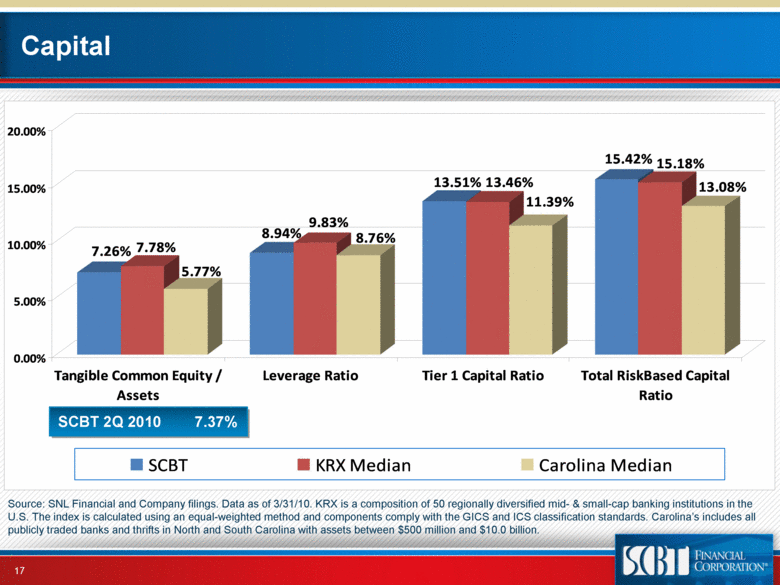
| Capital Source: SNL Financial and Company filings. Data as of 3/31/10. KRX is a composition of 50 regionally diversified mid- & small-cap banking institutions in the U.S. The index is calculated using an equal-weighted method and components comply with the GICS and ICS classification standards. Carolina’s includes all publicly traded banks and thrifts in North and South Carolina with assets between $500 million and $10.0 billion. 17 SCBT 2Q 2010 7.37% 7.26% 7.78% 5.77% 8.94% 9.83% 8.76% 13.51% 13.46% 11.39% 15.42% 15.18% 13.08% 0.00% 5.00% 10.00% 15.00% 20.00% Tangible Common Equity / Assets Leverage Ratio Tier 1 Capital Ratio Total RiskBased Capital Ratio SCBT KRX Median Carolina Median |
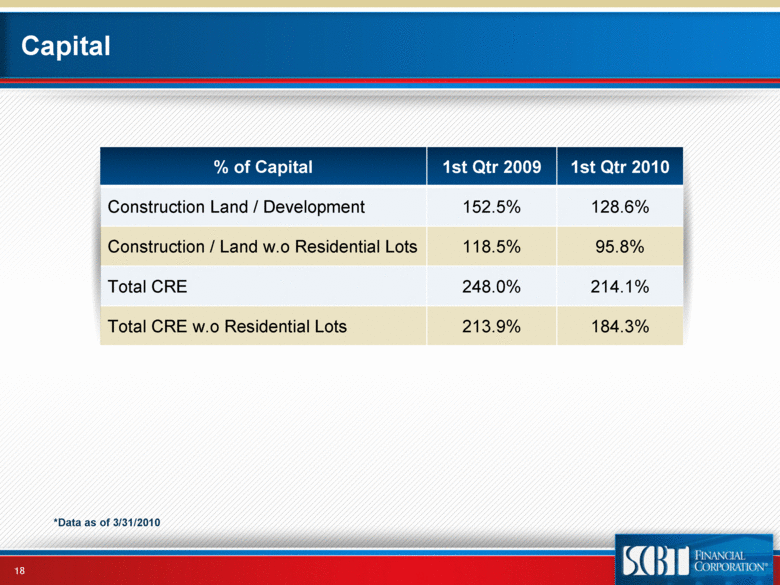
| Capital % of Capital 1st Qtr 2009 1st Qtr 2010 Construction Land / Development 152.5% 128.6% Construction / Land w.o Residential Lots 118.5% 95.8% Total CRE 248.0% 214.1% Total CRE w.o Residential Lots 213.9% 184.3% 18 *Data as of 3/31/2010 |
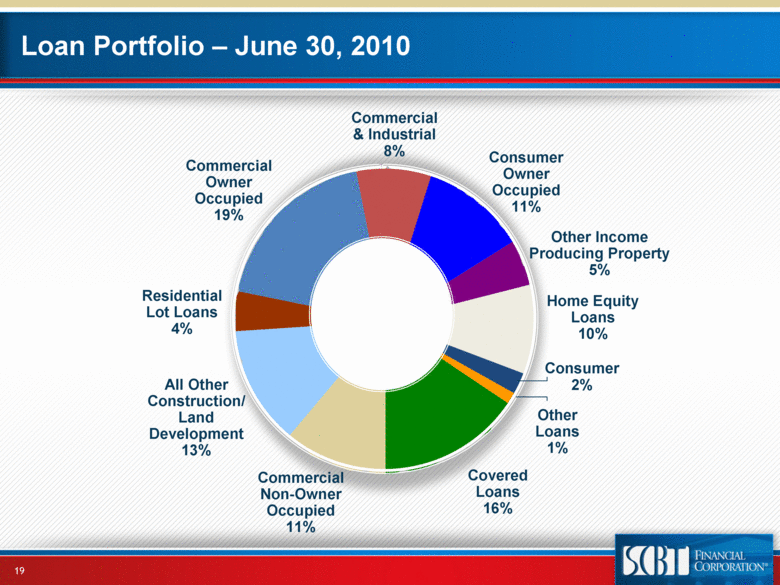
| 19 Loan Portfolio – June 30, 2010 Commercial Owner Occupied 19% Commercial & Industrial 8% Consumer Owner Occupied 11% Other Income Producing Property 5% Home Equity Loans 10% Consumer 2% Other Loans 1% Commercial Non-Owner Occupied 11% All Other Construction/Land Development 13% Residential Lot Loans 4% Covered Loans 16% |
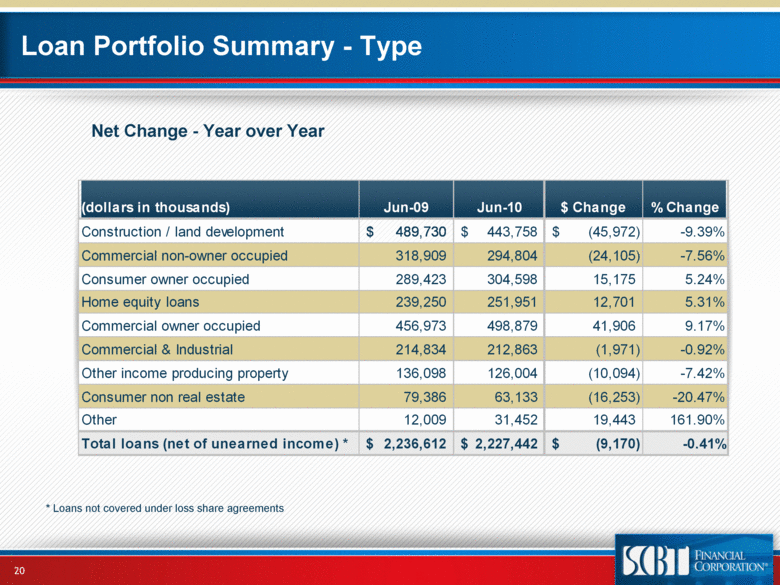
| Loan Portfolio Summary - Type Net Change - Year over Year 20 * Loans not covered under loss share agreements (dollars in thousands) Jun-09 Jun-10 $ Change % Change Construction / land development 489,730 $ 443,758 $ (45,972) $��-9.39% Commercial non-owner occupied 318,909 294,804 (24,105) -7.56% Consumer owner occupied 289,423 304,598 15,175 5.24% Home equity loans 239,250 251,951 12,701 5.31% Commercial owner occupied 456,973 498,879 41,906 9.17% Commercial & Industrial 214,834 212,863 (1,971) -0.92% Other income producing property 136,098 126,004 (10,094) -7.42% Consumer non real estate 79,386 63,133 (16,253) -20.47% Other 12,009 31,452 19,443 161.90% Total loans (net of unearned income) * 2,236,612 $ 2,227,442 $ (9,170) $ -0.41% |
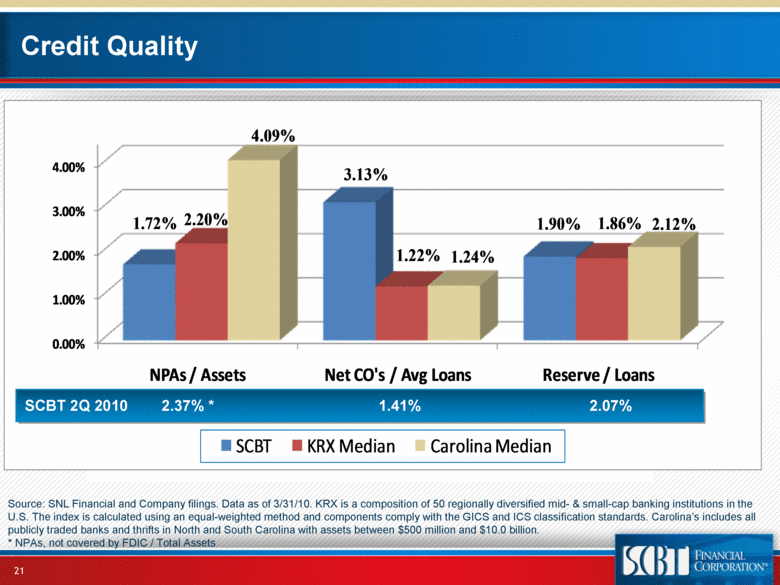
| Credit Quality Source: SNL Financial and Company filings. Data as of 3/31/10. KRX is a composition of 50 regionally diversified mid- & small-cap banking institutions in the U.S. The index is calculated using an equal-weighted method and components comply with the GICS and ICS classification standards. Carolina’s includes all publicly traded banks and thrifts in North and South Carolina with assets between $500 million and $10.0 billion. * NPAs, not covered by FDIC / Total Assets 21 SCBT 2Q 2010 2.37% * 1.41% 2.07% 0.00% 1.00% 2.00% 3.00% 4.00% NPAs / Assets Net CO's / Avg Loans Reserve / Loans 4.09% 1.24% 2.12% 2.20% 1.22% 1.86% 1.72% 3.13% 1.90% SCBT KRX Median Carolina Median |
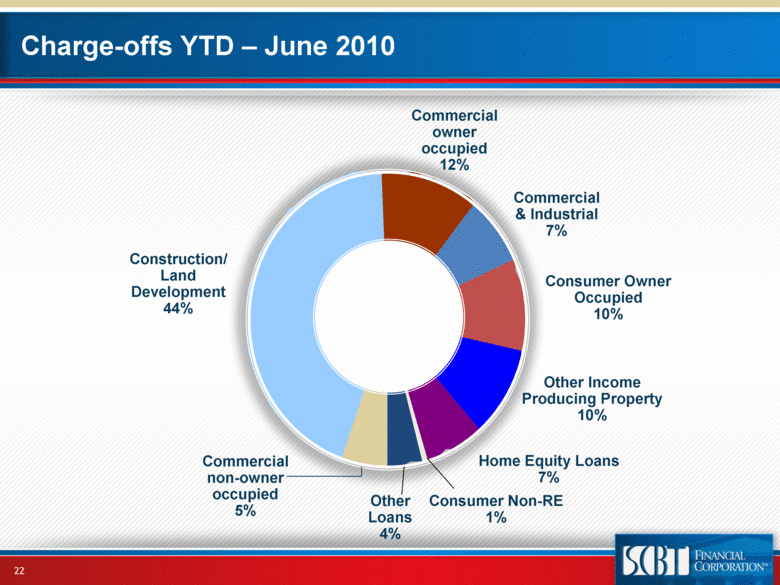
| Consumer Owner Occupied 10% 22 Charge-offs YTD – June 2010 Commercial owner occupied 12% Commercial & Industrial 7% Other Income Producing Property 10% Home Equity Loans 7% Consumer Non-RE 1% Other Loans 4% Commercial non-owner occupied 5% Construction/ Land Development 44% |
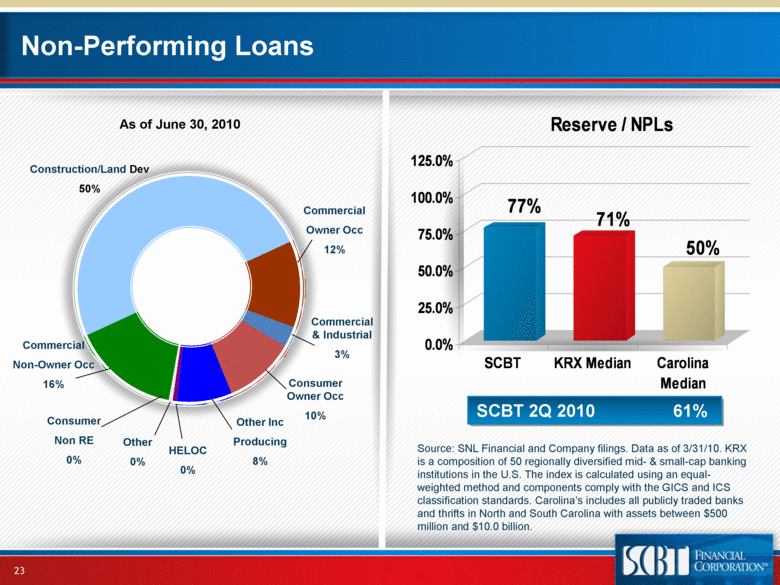
| Non-Performing Loans Source: SNL Financial and Company filings. Data as of 3/31/10. KRX is a composition of 50 regionally diversified mid- & small-cap banking institutions in the U.S. The index is calculated using an equal-weighted method and components comply with the GICS and ICS classification standards. Carolina’s includes all publicly traded banks and thrifts in North and South Carolina with assets between $500 million and $10.0 billion. 23 As of June 30, 2010 SCBT 2Q 2010 61% Construction/Land Dev 50% Commercial Non-Owner Occ 16% Consumer Non RE 0% Other 0% HELOC 0% Other Inc Producing 8% Consumer Owner Occ 10% Commercial & Industrial 3% Commercial Owner Occ 12% 77% 71% 50% 0.0% 25.0% 50.0% 75.0% 100.0% 125.0% SCBT KRX Median Carolina Median Reserve / NPLs |
| How Do We Measure Success? Profitability |

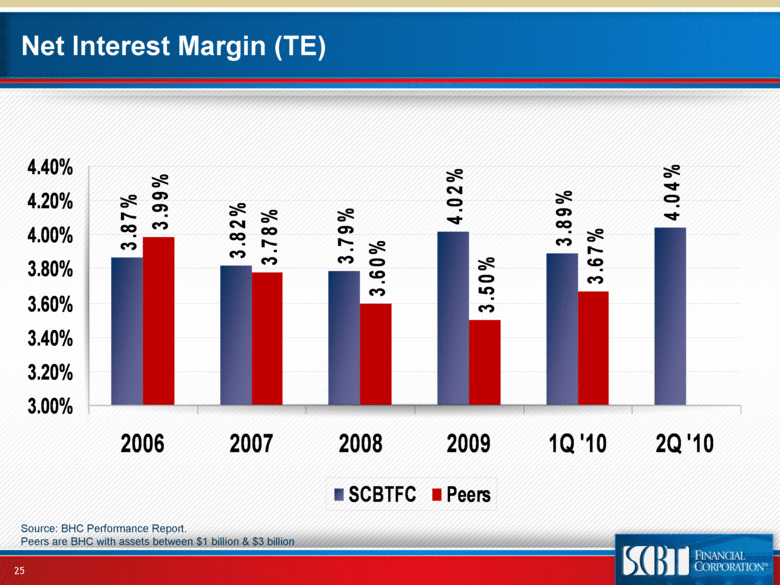
| Net Interest Margin (TE) Source: BHC Performance Report. Peers are BHC with assets between $1 billion & $3 billion 25 3.87% 3.82% 3.79% 4.02% 3.89% 4.04% 3.99% 3.78% 3.60% 3.50% 3.67% 3.00% 3.20% 3.40% 3.60% 3.80% 4.00% 4.20% 4.40% 2006 2007 2008 2009 1Q '10 2Q '10 SCBTFC Peers |
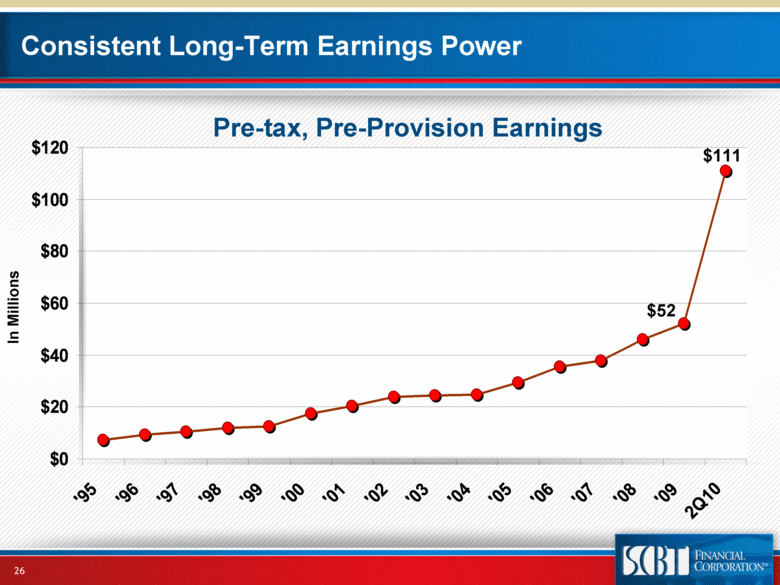
| Consistent Long-Term Earnings Power Pre-tax, Pre-Provision Earnings In Millions $52 $111 26 $0 $20 $40 $60 $80 $100 $120 '95 '96 '97 '98 '99 '00 '01 '02 '03 '04 '05 '06 '07 '08 '09 2Q10 |
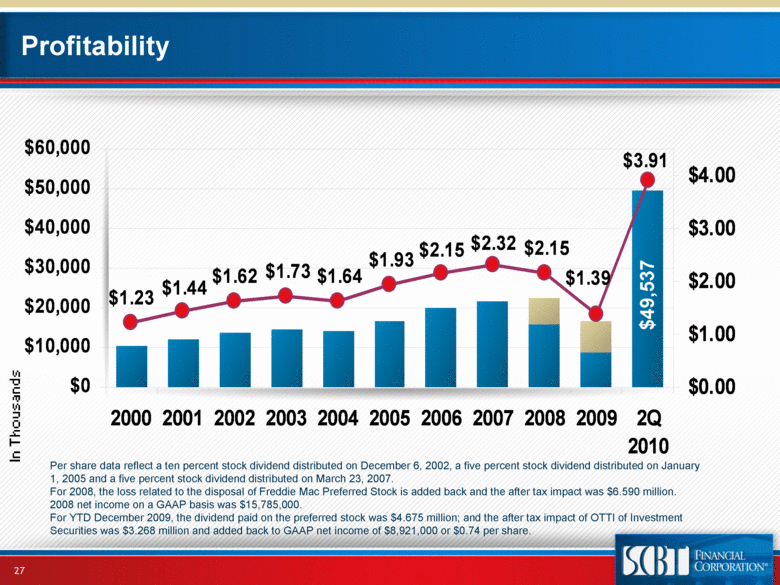
| Profitability 27 Per share data reflect a ten percent stock dividend distributed on December 6, 2002, a five percent stock dividend distributed on January 1, 2005 and a five percent stock dividend distributed on March 23, 2007. For 2008, the loss related to the disposal of Freddie Mac Preferred Stock is added back and the after tax impact was $6.590 million. 2008 net income on a GAAP basis was $15,785,000. For YTD December 2009, the dividend paid on the preferred stock was $4.675 million; and the after tax impact of OTTI of Investment Securities was $3.268 million and added back to GAAP net income of $8,921,000 or $0.74 per share. $49,537 $2.15 $1.93 $1.64 $1.73 $1.62 $1.44 $1.23 $2.32 $2.15 $1.39 $3.91 $0 $10,000 $20,000 $30,000 $40,000 $50,000 $60,000 2000 2001 2002 2003 2004 2005 2006 2007 2008 2009 2Q 2010 $0.00 $1.00 $2.00 $3.00 $4.00 |
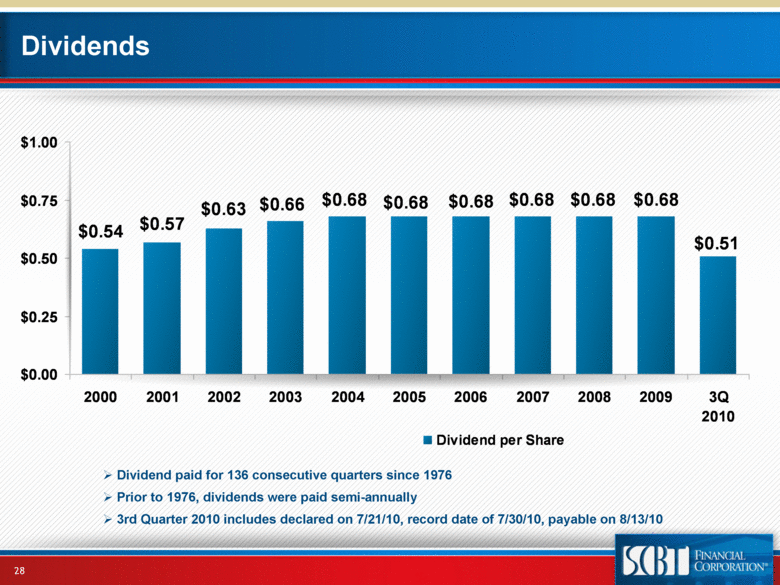
| Dividends Dividend paid for 136 consecutive quarters since 1976 Prior to 1976, dividends were paid semi-annually 3rd Quarter 2010 includes declared on 7/21/10, record date of 7/30/10, payable on 8/13/10 28 $0.54 $0.57 $0.63 $0.66 $0.68 $0.68 $0.68 $0.68 $0.68 $0.68 $0.51 $0.00 $0.25 $0.50 $0.75 $1.00 2000 2001 2002 2003 2004 2005 2006 2007 2008 2009 3Q 2010 Dividend per Share |
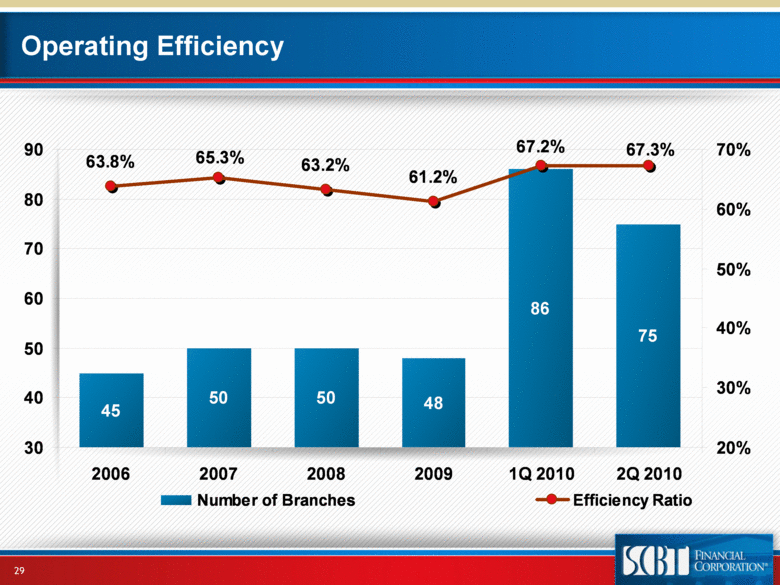
| Operating Efficiency 29 45 50 50 48 86 75 63.8% 63.2% 61.2% 65.3% 67.3% 67.2% 30 40 50 60 70 80 90 2006 2007 2008 2009 1Q 2010 2Q 2010 20% 30% 40% 50% 60% 70% Number of Branches Efficiency Ratio |
| How Do We Measure Success? Growth |
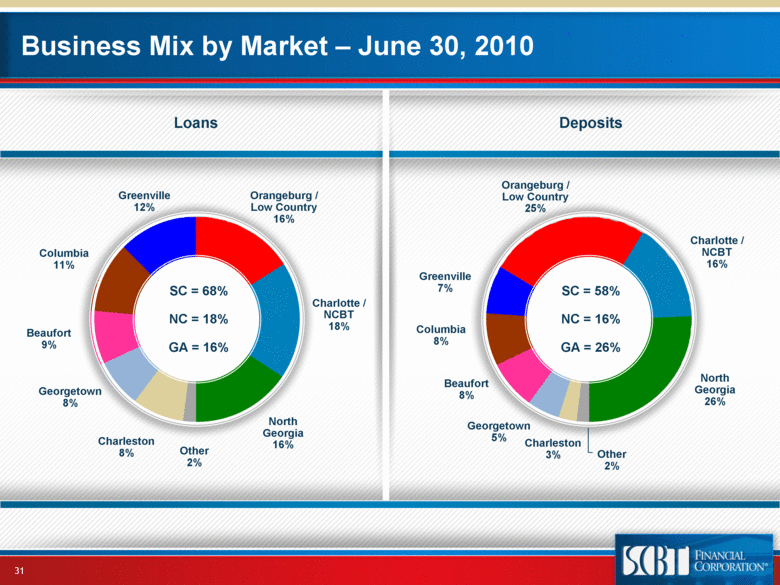
| Business Mix by Market – June 30, 2010 Loans Deposits Greenville 7% Charlotte / NCBT 16% Orangeburg / Low Country 25% Other 2% Georgetown 5% Charleston 3% Beaufort 8% Columbia 8% Greenville 12% Charlotte / NCBT 18% Orangeburg / Low Country 16% Other 2% Georgetown 8% Charleston 8% Columbia 11% Beaufort 9% North Georgia 16% North Georgia 26% SC = 68% NC = 18% GA = 16% SC = 58% NC = 16% GA = 26% 31 |
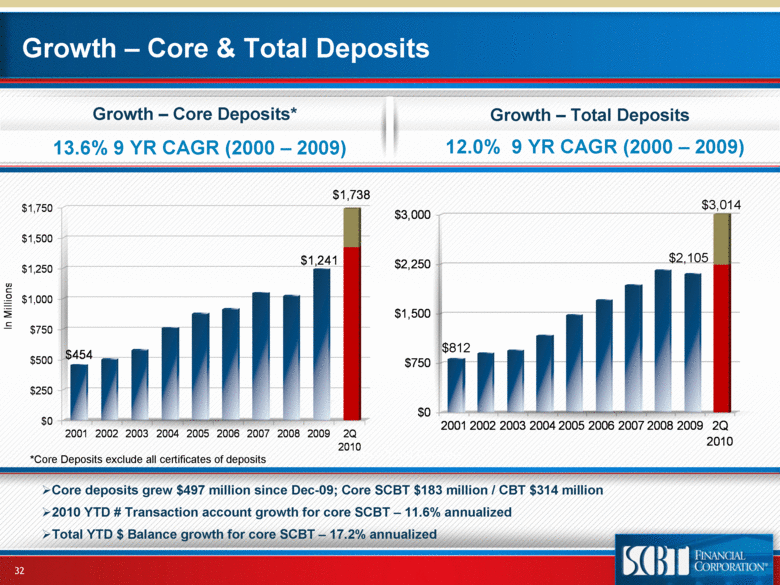
| 12.0% 9 YR CAGR (2000 – 2009) Growth – Total Deposits 13.6% 9 YR CAGR (2000 – 2009) Growth – Core Deposits* Core deposits grew $497 million since Dec-09; Core SCBT $183 million / CBT $314 million 2010 YTD # Transaction account growth for core SCBT – 11.6% annualized Total YTD $ Balance growth for core SCBT – 17.2% annualized Growth – Core & Total Deposits *Core Deposits exclude all certificates of deposits 32 $3,014 $812 $2,105 $454 $1,241 $1,738 $0 $250 $500 $750 $1,000 $1,250 $1,500 $1,750 In Millions 2001 2002 2003 2004 2005 2006 2007 2008 2009 2Q 2010 $0 $750 $1,500 $2,250 $3,000 2001 2002 2003 2004 2005 2006 2007 2008 2009 2Q 2010 |
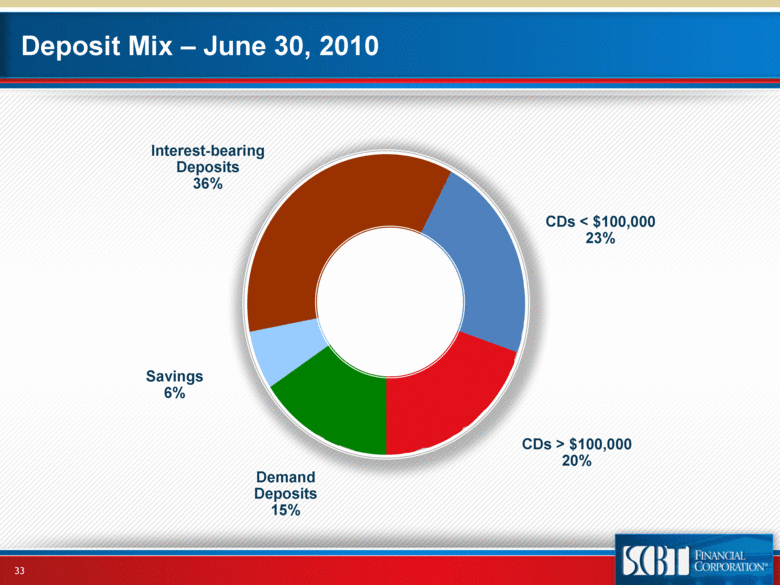
| Deposit Mix – June 30, 2010 CDs < $100,000 23% CDs > $100,000 20% Demand Deposits 15% Savings 6% Interest-bearing Deposits 36% 33 |
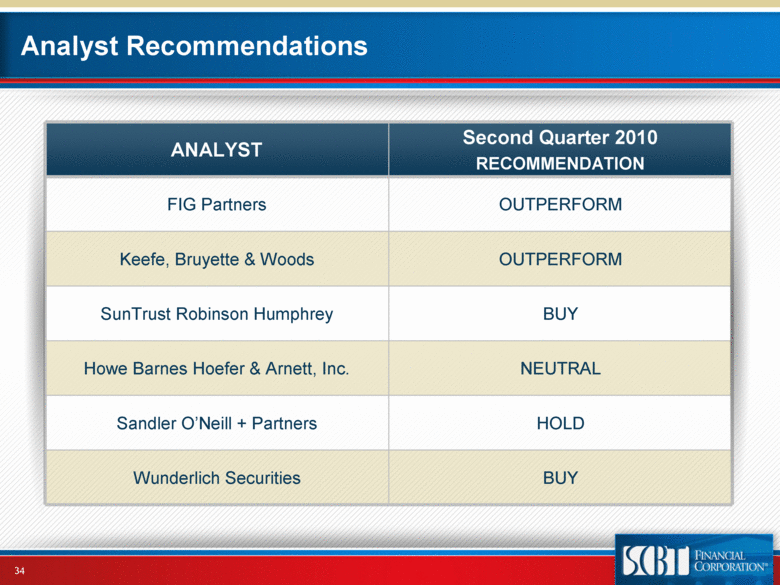
| Analyst Recommendations ANALYST Second Quarter 2010 RECOMMENDATION FIG Partners OUTPERFORM Keefe, Bruyette & Woods OUTPERFORM SunTrust Robinson Humphrey BUY Howe Barnes Hoefer & Arnett, Inc. NEUTRAL Sandler O’Neill + Partners HOLD Wunderlich Securities BUY 34 |
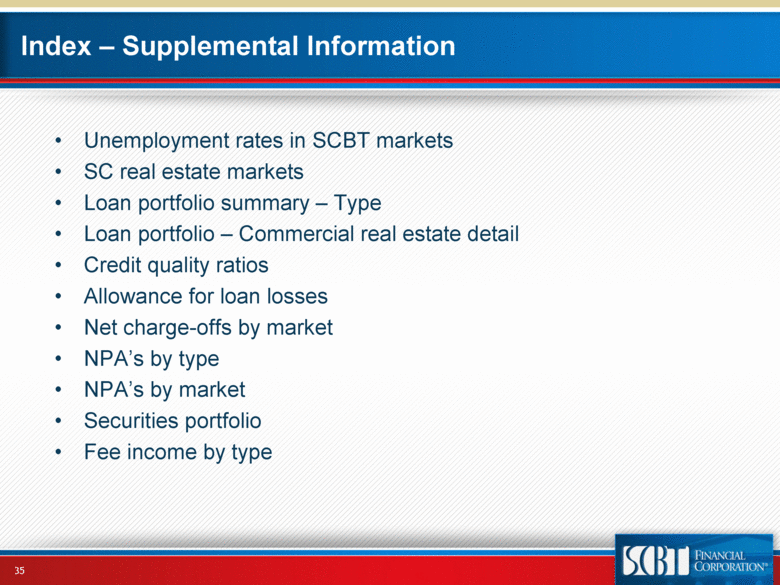
| Index – Supplemental Information Unemployment rates in SCBT markets SC real estate markets Loan portfolio summary – Type Loan portfolio – Commercial real estate detail Credit quality ratios Allowance for loan losses Net charge-offs by market NPA’s by type NPA’s by market Securities portfolio Fee income by type 35 |
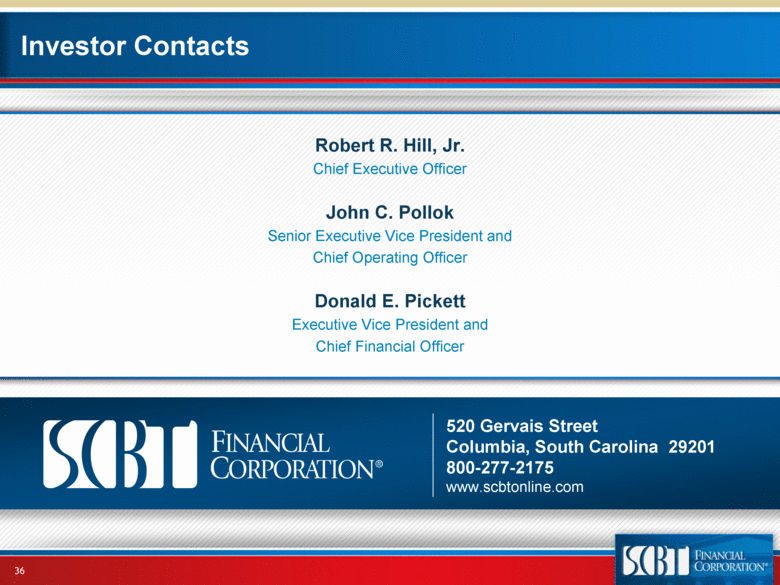
| Investor Contacts Robert R. Hill, Jr. Chief Executive Officer John C. Pollok Senior Executive Vice President and Chief Operating Officer Donald E. Pickett Executive Vice President and Chief Financial Officer 520 Gervais Street Columbia, South Carolina 29201 800-277-2175 www.scbtonline.com 36 |
| Supplemental Information 37 |

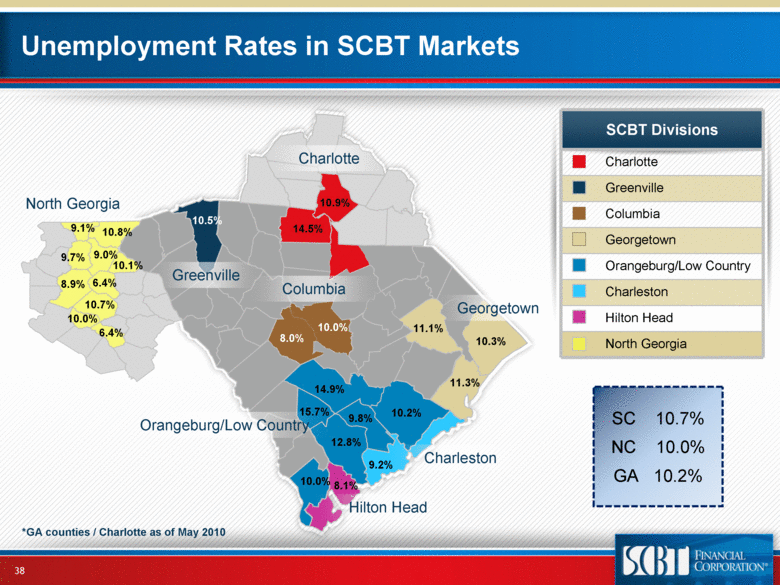
| Unemployment Rates in SCBT Markets Columbia Charlotte Georgetown Hilton Head Charleston Greenville Orangeburg/Low Country North Georgia SCBT Divisions Charlotte Greenville Columbia Georgetown Orangeburg/Low Country Charleston Hilton Head North Georgia 11.1% 10.9% 11.3% 10.3% 14.5% 10.0% 8.0% 14.9% 10.5% 10.8% 10.0% 8.1% 15.7% 12.8% 10.2% 9.2% 9.8% 9.1% 9.0% 8.9% 10.7% 10.0% 6.4% 9.7% 6.4% 10.1% SC 10.7% NC 10.0% GA 10.2% 38 *GA counties / Charlotte as of May 2010 |
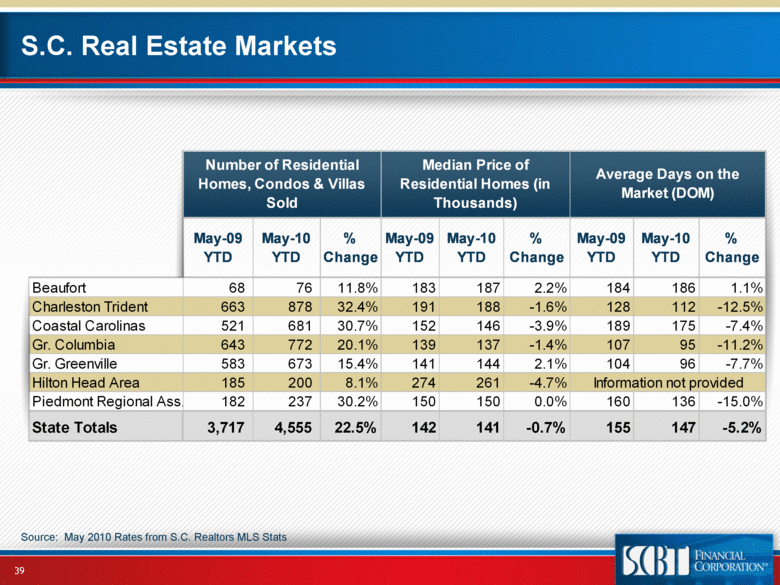
| S.C. Real Estate Markets Source: May 2010 Rates from S.C. Realtors MLS Stats 39 Beaufort 68 76 11.8% 183 187 2.2% 184 186 1.1% Charleston Trident 663 878 32.4% 191 188 -1.6% 128 112 -12.5% Coastal Carolinas 521 681 30.7% 152 146 -3.9% 189 175 -7.4% Gr. Columbia 643 772 20.1% 139 137 -1.4% 107 95 -11.2% Gr. Greenville 583 673 15.4% 141 144 2.1% 104 96 -7.7% Hilton Head Area 185 200 8.1% 274 261 -4.7% Piedmont Regional Ass. 182 237 30.2% 150 150 0.0% 160 136 -15.0% State Totals 3,717 4,555 22.5% 142 141 -0.7% 155 147 -5.2% Median Price of Residential Homes (in Thousands) May-09 YTD May-10 YTD % Change May-09 YTD Information not provided Average Days on the Market (DOM) % Change May-10 YTD Number of Residential Homes, Condos & Villas Sold May-09 YTD May-10 YTD % Change |
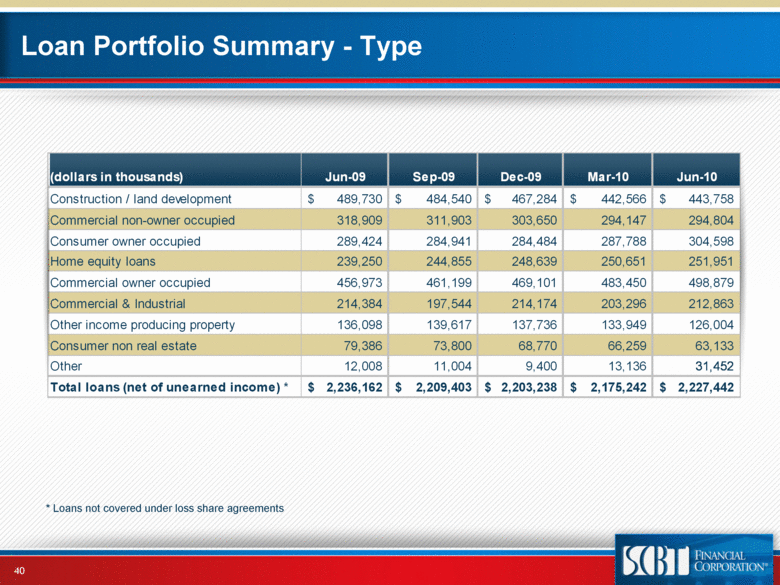
| Loan Portfolio Summary - Type 40 * Loans not covered under loss share agreements (dollars in thousands) Jun-09 Sep-09 Dec-09 Mar-10 Jun-10 Construction / land development 489,730 $ 484,540 $ 467,284 $ 442,566 $ 443,758 $ Commercial non-owner occupied 318,909 311,903 303,650 294,147 294,804 Consumer owner occupied 289,424 284,941 284,484 287,788 304,598 Home equity loans 239,250 244,855 248,639 250,651 251,951 Commercial owner occupied 456,973 461,199 469,101 483,450 498,879 Commercial & Industrial 214,384 197,544 214,174 203,296 212,863 Other income producing property 136,098 139,617 137,736 133,949 126,004 Consumer non real estate 79,386 73,800 68,770 66,259 63,133 Other 12,008 11,004 9,400 13,136 31,452 Total loans (net of unearned income) * 2,236,162 $ 2,209,403 $ 2,203,238 $ 2,175,242 $ 2,227,442 $ |
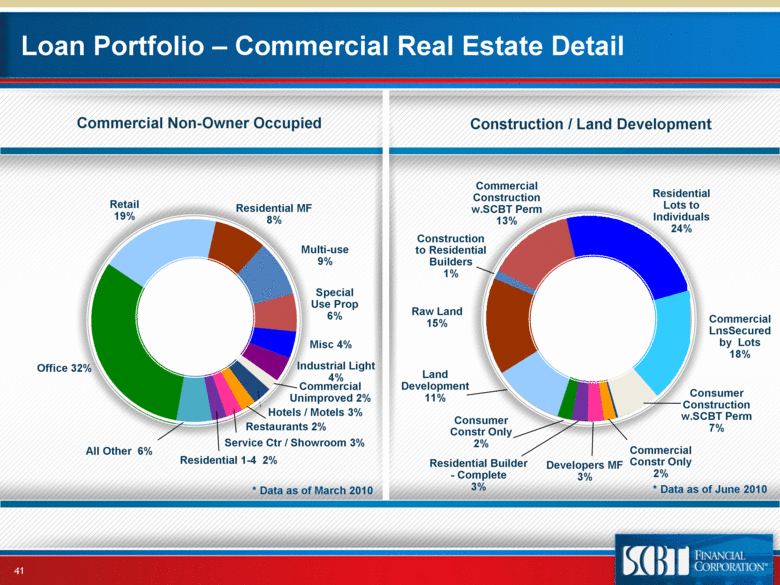
| Loan Portfolio – Commercial Real Estate Detail Commercial Non-Owner Occupied Residential MF 8% Multi-use 9% Special Use Prop 6% Misc 4% Industrial Light 4% Hotels / Motels 3% All Other 6% Office 32% Commercial Unimproved 2% Retail 19% Construction / Land Development Commercial Construction w.SCBT Perm 13% Commercial LnsSecured by Lots 18% Residential Lots to Individuals 24% Land Development 11% Raw Land 15% Construction to Residential Builders 1% Consumer Constr Only 2% Commercial Constr Only 2% Developers MF 3% Residential Builder - Complete 3% Consumer Construction w.SCBT Perm 7% Restaurants 2% Service Ctr / Showroom 3% Residential 1-4 2% 41 * Data as of March 2010 * Data as of June 2010 |
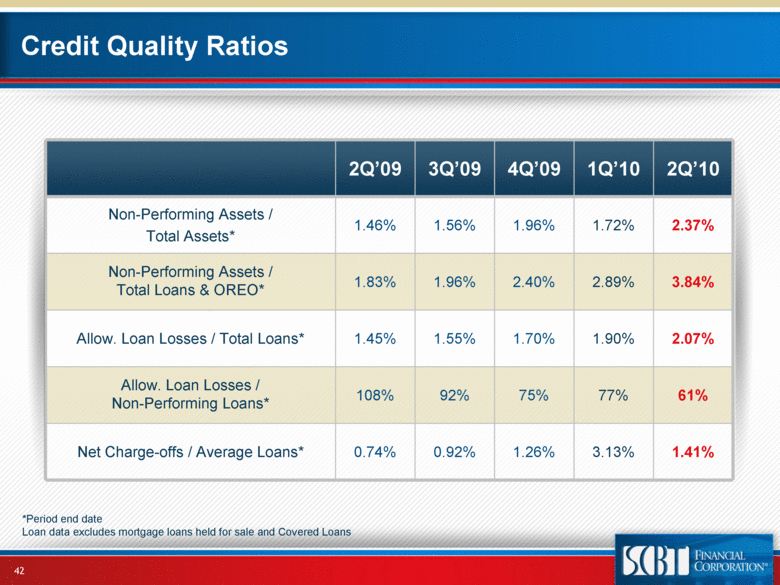
| Credit Quality Ratios 2Q’09 3Q’09 4Q’09 1Q’10 2Q’10 Non-Performing Assets / Total Assets* 1.46% 1.56% 1.96% 1.72% 2.37% Non-Performing Assets / Total Loans & OREO* 1.83% 1.96% 2.40% 2.89% 3.84% Allow. Loan Losses / Total Loans* 1.45% 1.55% 1.70% 1.90% 2.07% Allow. Loan Losses / Non-Performing Loans* 108% 92% 75% 77% 61% Net Charge-offs / Average Loans* 0.74% 0.92% 1.26% 3.13% 1.41% *Period end date Loan data excludes mortgage loans held for sale and Covered Loans 42 |
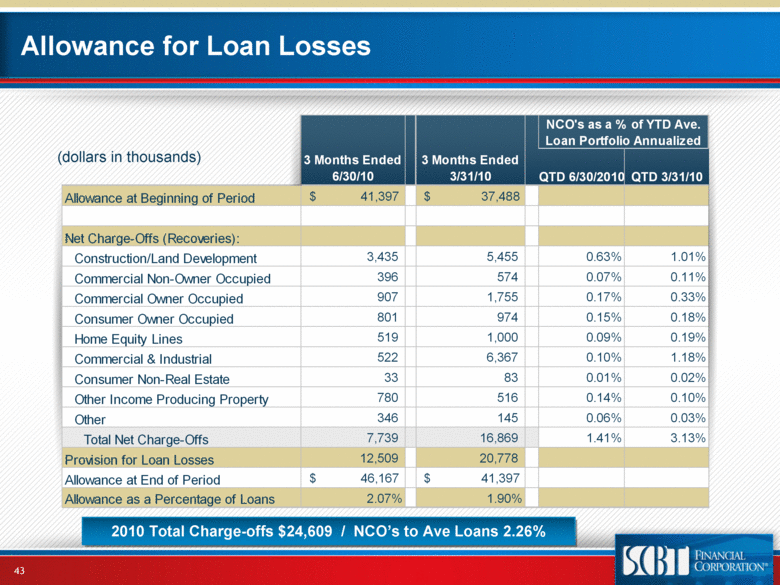
| Allowance for Loan Losses (dollars in thousands) 2010 Total Charge-offs $24,609 / NCO’s to Ave Loans 2.26% 43 3 Months Ended 6/30/10 3 Months Ended 3/31/10 QTD 6/30/2010 QTD 3/31/10 Allowance at Beginning of Period $ 41,397 $ 37,488 Net Charge-Offs (Recoveries): Construction/Land Development 3,435 5,455 0.63% 1.01% Commercial Non-Owner Occupied 396 574 0.07% 0.11% Commercial Owner Occupied 907 1,755 0.17% 0.33% Consumer Owner Occupied 801 974 0.15% 0.18% Home Equity Lines 519 1,000 0.09% 0.19% Commercial & Industrial 522 6,367 0.10% 1.18% Consumer Non-Real Estate 33 83 0.01% 0.02% Other Income Producing Property 780 516 0.14% 0.10% Other 346 145 0.06% 0.03% Total Net Charge-Offs 7,739 16,869 1.41% 3.13% Provision for Loan Losses 12,509 20,778 Allowance at End of Period $ 46,167 $ 41,397 Allowance as a Percentage of Loans 2.07% 1.90% NCO's as a % of YTD Ave. Loan Portfolio Annualized |
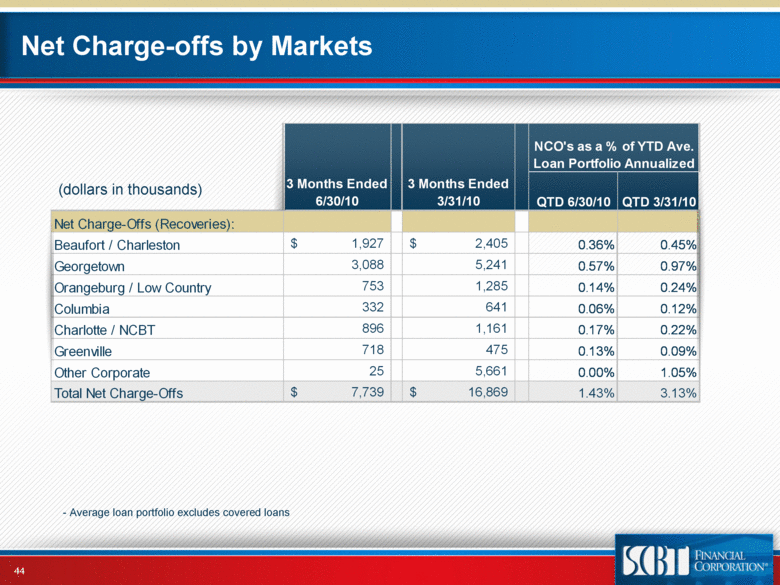
| Net Charge-offs by Markets (dollars in thousands) 44 - Average loan portfolio excludes covered loans 3 Months Ended 6/30/10 3 Months Ended 3/31/10 QTD 6/30/10 QTD 3/31/10 Net Charge-Offs (Recoveries): 1,927 $ 2,405 $ 0.36% 0.45% 3,088 5,241 0.57% 0.97% 753 1,285 0.14% 0.24% 332 641 0.06% 0.12% 896 1,161 0.17% 0.22% 718 475 0.13% 0.09% Other Corporate 25 5,661 0.00% 1.05% 7,739 $ 16,869 $ 1.43% 3.13% NCO's as a % of YTD Ave. Loan Portfolio Annualized Total Net Charge-Offs Greenville Charlotte / NCBT Columbia Orangeburg / Low Country Georgetown Beaufort / Charleston |
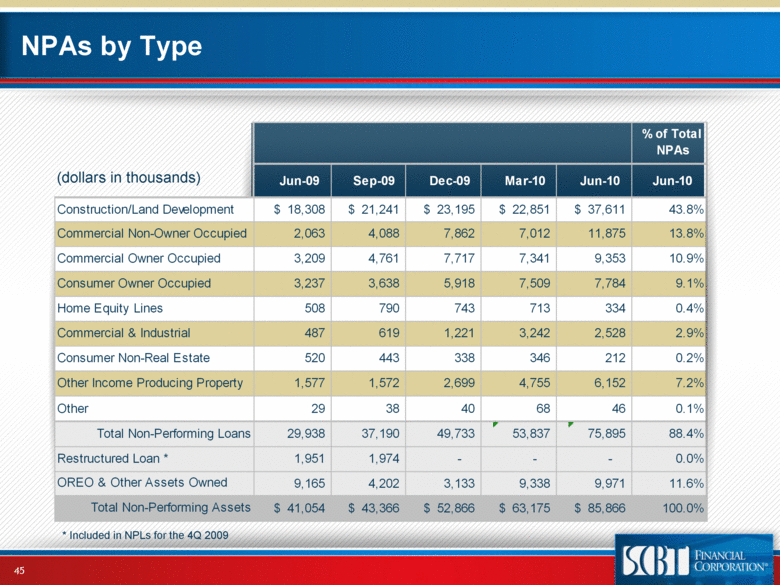
| NPAs by Type (dollars in thousands) * Included in NPLs for the 4Q 2009 45 Jun-09 Sep-09 Dec-09 Mar-10 Jun-10 Jun-10 Construction/Land Development 18,308 $ 21,241 $ 23,195 $ 22,851 $ 37,611 $ 43.8% Commercial Non-Owner Occupied 2,063 4,088 7,862 7,012 11,875 13.8% Commercial Owner Occupied 3,209 4,761 7,717 7,341 9,353 10.9% Consumer Owner Occupied 3,237 3,638 5,918 7,509 7,784 9.1% Home Equity Lines 508 790 743 713 334 0.4% Commercial & Industrial 487 619 1,221 3,242 2,528 2.9% Consumer Non-Real Estate 520 443 338 346 212 0.2% Other Income Producing Property 1,577 1,572 2,699 4,755 6,152 7.2% Other 29 38 40 68 46 0.1% 29,938 37,190 49,733 53,837 75,895 88.4% 1,951 1,974 - - - 0.0% 9,165 4,202 3,133 9,338 9,971 11.6% 41,054 $ 43,366 $ 52,866 $ 63,175 $ 85,866 $ 100.0% % of Total NPAs Total Non-Performing Loans OREO & Other Assets Owned Total Non-Performing Assets Restructured Loan * |
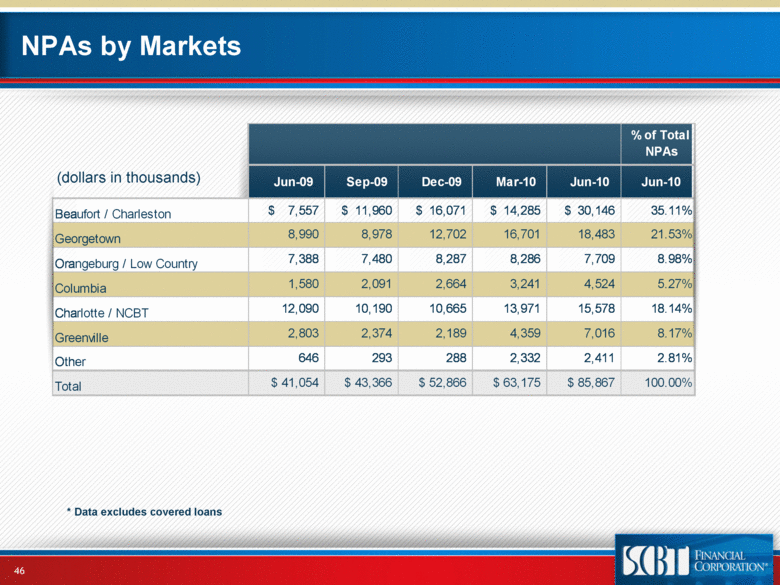
| NPAs by Markets (dollars in thousands) 46 * Data excludes covered loans Jun-09 Sep-09 Dec-09 Mar-10 Jun-10 Jun-10 Beaufort / Charleston 7,557 $ 11,960 $ 16,071 $ 14,285 $ 30,146 $ 35.11% Georgetown 8,990 8,978 12,702 16,701 18,483 21.53% Orangeburg / Low Country 7,388 7,480 8,287 8,286 7,709 8.98% Columbia 1,580 2,091 2,664 3,241 4,524 5.27% Charlotte / NCBT 12,090 10,190 10,665 13,971 15,578 18.14% Greenville 2,803 2,374 2,189 4,359 7,016 8.17% Other 646 293 288 2,332 2,411 2.81% Total $ 41,054 $ 43,366 $ 52,866 $ 63,175 $ 85,867 100.00% % of Total NPAs |
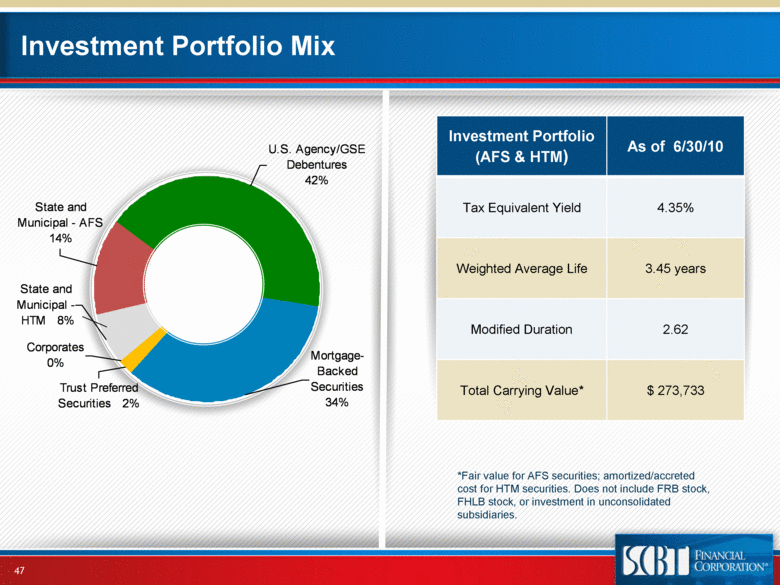
| Investment Portfolio Mix *Fair value for AFS securities; amortized/accreted cost for HTM securities. Does not include FRB stock, FHLB stock, or investment in unconsolidated subsidiaries. Investment Portfolio (AFS & HTM) As of 6/30/10 Tax Equivalent Yield 4.35% Weighted Average Life 3.45 years Modified Duration 2.62 Total Carrying Value* $ 273,733 47 State and Municipal - HTM 8% State and Municipal - AFS 14% U.S. Agency/GSE Debentures 42% Mortgage-Backed Securities 34% Trust Preferred Securities 2% Corporates 0% |
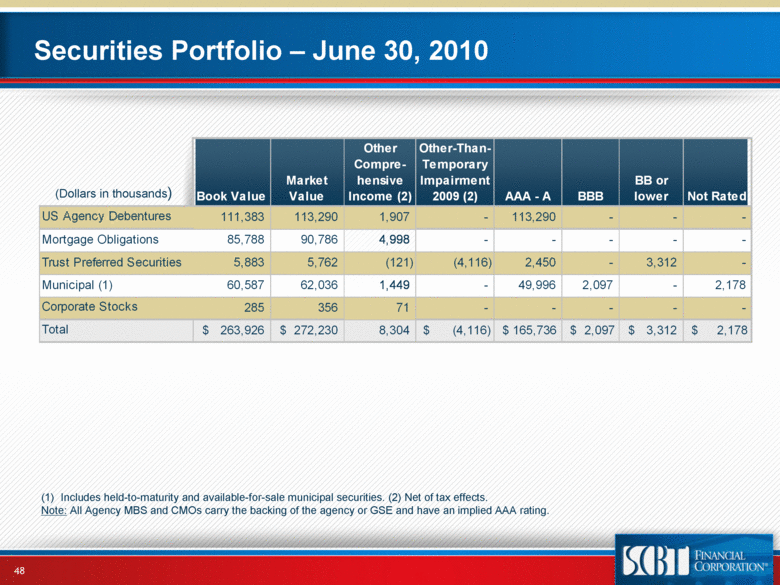
| Securities Portfolio – June 30, 2010 (Dollars in thousands) (1) Includes held-to-maturity and available-for-sale municipal securities. (2) Net of tax effects. Note: All Agency MBS and CMOs carry the backing of the agency or GSE and have an implied AAA rating. 48 Book Value Market Value Other Comprehensive Income (2) Other-Than-Temporary Impairment 2009 (2) AAA - A BBB BB or lower Not Rated 111,383 113,290 1,907 - 113,290 - - - 85,788 90,786 4,998 - - - - - 5,883 5,762 (121) (4,116) 2,450 - 3,312 - 60,587 62,036 1,449 - 49,996 2,097 - 2,178 285 356 71 - - - - - $ 263,926 $ 272,230 8,304 $ (4,116) $ 165,736 $ 2,097 $ 3,312 $ 2,178 US Agency Debentures Total Corporate Stocks Mortgage Obligations Trust Preferred Securities Municipal (1) |
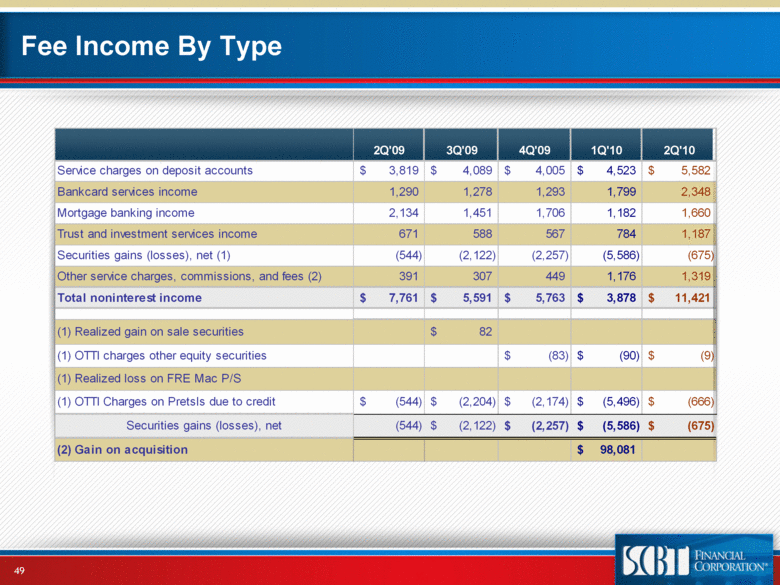
| Fee Income By Type 49 2Q'09 3Q'09 4Q'09 1Q'10 2Q'10 Service charges on deposit accounts 3,819 $ 4,089 $ 4,005 $ 4,523 $ 5,582 $ Bankcard services income 1,290 1,278 1,293 1,799 2,348 Mortgage banking income 2,134 1,451 1,706 1,182 1,660 Trust and investment services income 671 588 567 784 1,187 Securities gains (losses), net (1) (544) (2,122) (2,257) (5,586) (675) Other service charges, commissions, and fees (2) 391 307 449 1,176 1,319 Total noninterest income 7,761 $ 5,591 $ 5,763 $ 3,878 $ 11,421 $ (1) Realized gain on sale securities 82 $ (1) OTTI charges other equity securities (83) $ (90) $ (9) $ (1) Realized loss on FRE Mac P/S (1) OTTI Charges on Pretsls due to credit (544) $ (2,204) $ (2,174) $ (5,496) $ (666) $ Securities gains (losses), net (544) (2,122) $ (2,257) $ (5,586) $ (675) $ (2) Gain on acquisition 98,081 $ |