Exhibit 99.1
| [LOGO] |
| Forward-Looking Statements Statements contained in this presentation, which are not historical facts, are forward-looking statements. In addition, SCBT Financial Corporation (SCBT) through its senior management or directors may from time to time make forward-looking public statements concerning matters herein. Such forward-looking statements are necessary estimates reflecting the best judgment of SCBT’s senior management or directors based upon current information and involve a number of risks and uncertainties. Certain factors which could affect the accuracy of such forward-looking statements are identified in the public filings made by SCBT with the Securities and Exchange Commission, and forward-looking statements contained in this presentation or in other public statements of SCBT or its senior management or directors should be considered in light of those factors. There can be no assurance that such factors or other factors will not affect the accuracy of such forward-looking statements. |
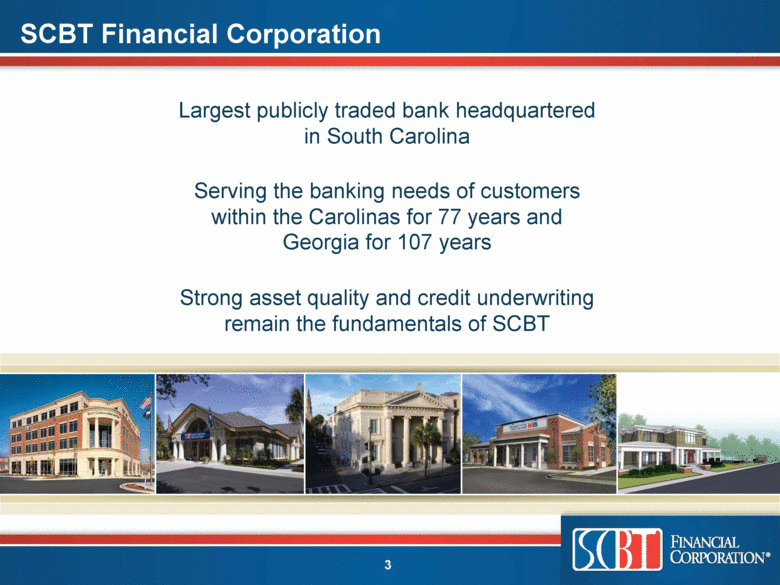
| Largest publicly traded bank headquartered in South Carolina Serving the banking needs of customers within the Carolinas for 77 years and Georgia for 107 years Strong asset quality and credit underwriting remain the fundamentals of SCBT SCBT Financial Corporation |
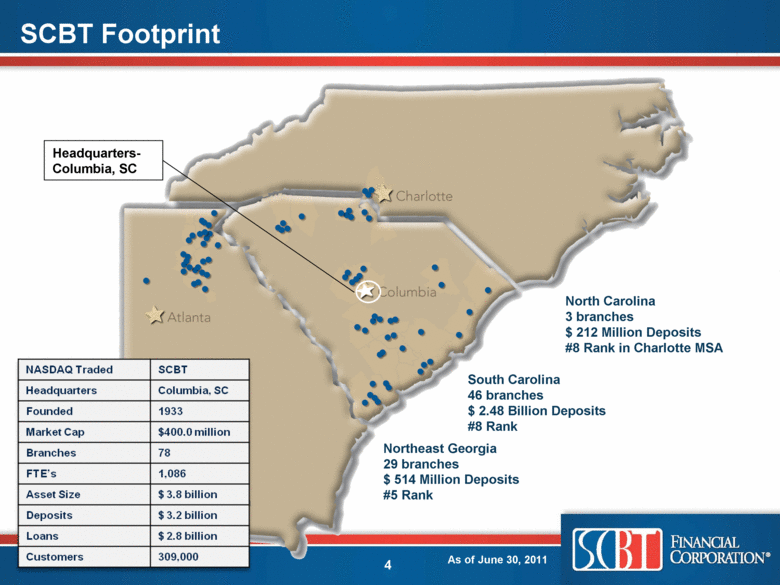
| SCBT Footprint North Carolina 3 branches $ 212 Million Deposits #8 Rank in Charlotte MSA South Carolina 46 branches $ 2.48 Billion Deposits #8 Rank Northeast Georgia 29 branches $ 514 Million Deposits #5 Rank Headquarters- Columbia, SC As of June 30, 2011 |
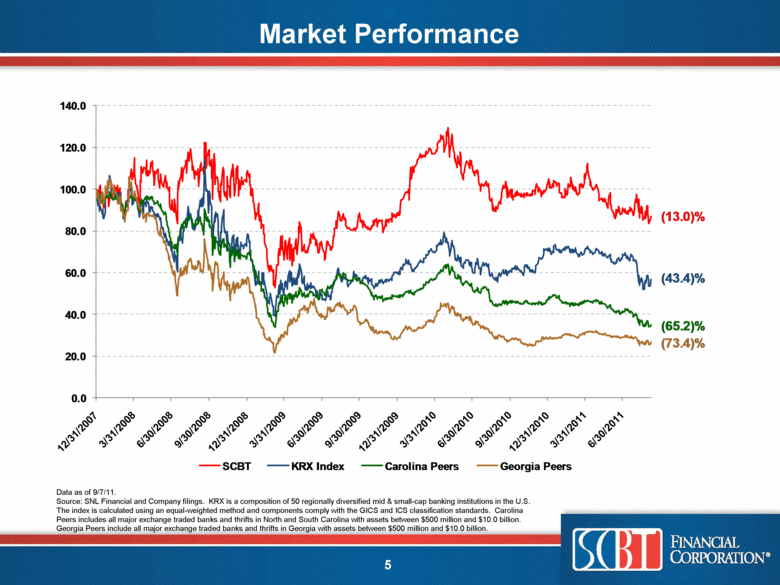
| Market Performance Data as of 9/7/11. Source: SNL Financial and Company filings. KRX is a composition of 50 regionally diversified mid & small-cap banking institutions in the U.S. The index is calculated using an equal-weighted method and components comply with the GICS and ICS classification standards. Carolina Peers includes all major exchange traded banks and thrifts in North and South Carolina with assets between $500 million and $10.0 billion. Georgia Peers include all major exchange traded banks and thrifts in Georgia with assets between $500 million and $10.0 billion. 0.0 20.0 40.0 60.0 80.0 100.0 120.0 140.0 SCBT KRX Index Carolina Peers Georgia Peers (13.0)% (43.4)% (65.2)% (73.4)% |
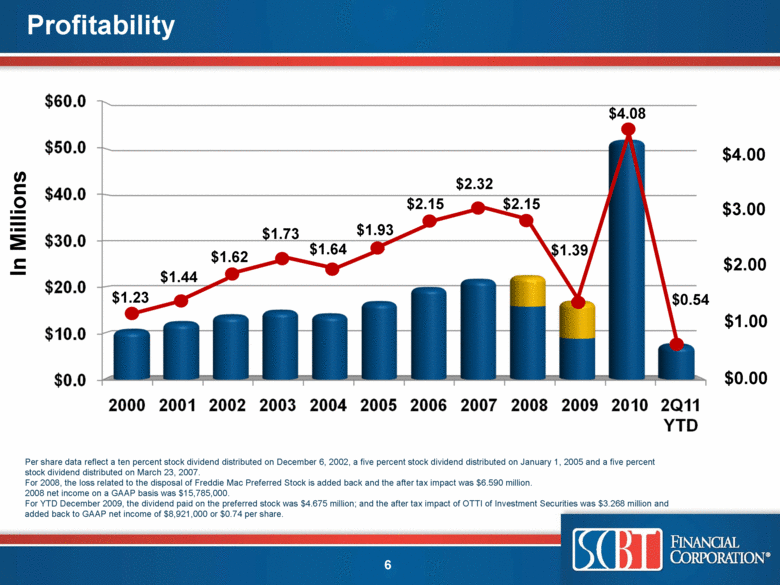
| Profitability Per share data reflect a ten percent stock dividend distributed on December 6, 2002, a five percent stock dividend distributed on January 1, 2005 and a five percent stock dividend distributed on March 23, 2007. For 2008, the loss related to the disposal of Freddie Mac Preferred Stock is added back and the after tax impact was $6.590 million. 2008 net income on a GAAP basis was $15,785,000. For YTD December 2009, the dividend paid on the preferred stock was $4.675 million; and the after tax impact of OTTI of Investment Securities was $3.268 million and added back to GAAP net income of $8,921,000 or $0.74 per share. In Millions $0.00 $1.00 $2.00 $3.00 $4.00 $1.23 $1.44 $1.62 $1.73 $1.64 $1.93 $2.15 $2.32 $2.15 $1.39 $4.08 $0.54 |
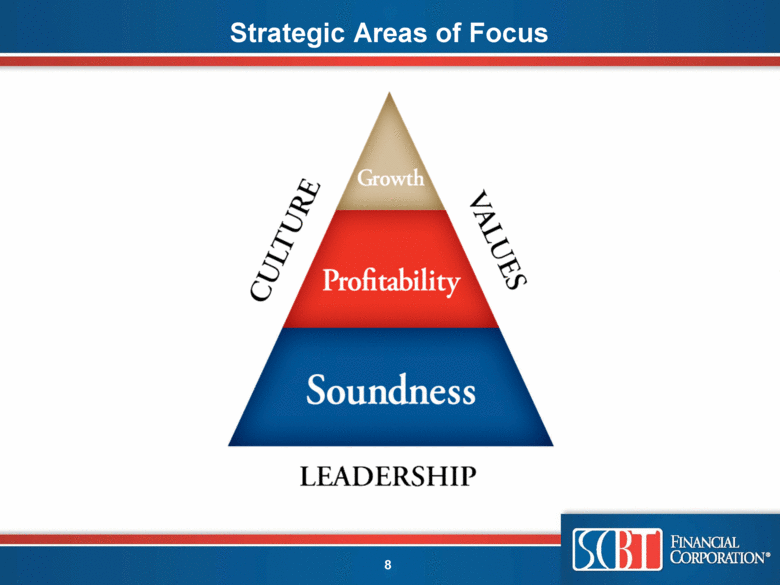
| VISION To be a top-performing Regional Bank in the Southeast. MISSION Our mission is to build a high-performing, Regional Bank based on a balance of soundness, profitability and growth. We will accomplish this through relationship banking, delivered by engaged employees with clear strategic goals, objectives and community banking values. |
| Strategic Areas of Focus |
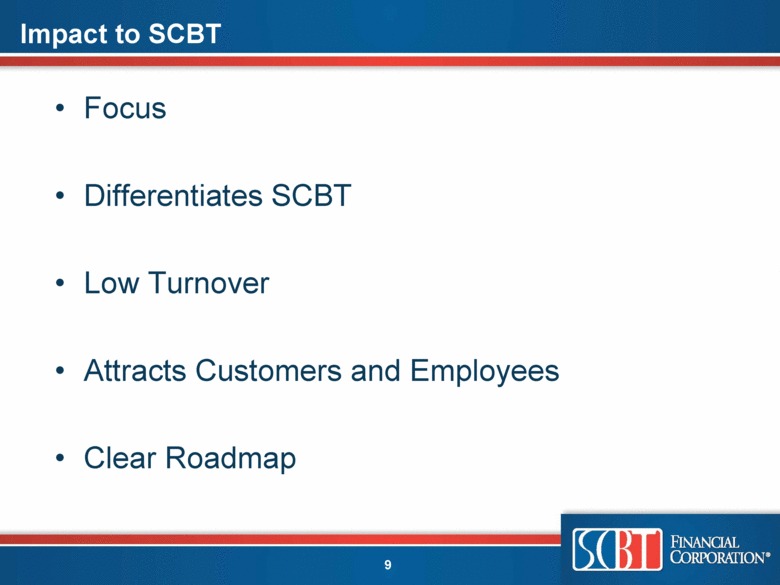
| Impact to SCBT Focus Differentiates SCBT Low Turnover Attracts Customers and Employees Clear Roadmap |
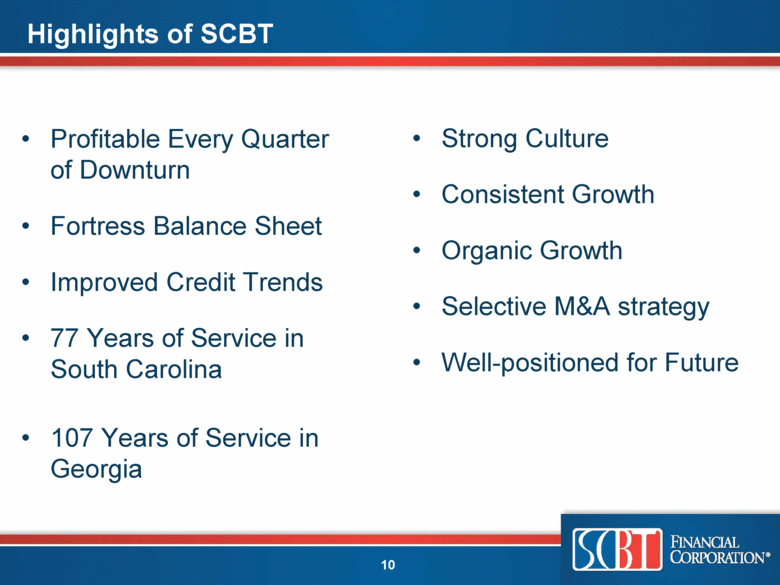
| Highlights of SCBT Profitable Every Quarter of Downturn Fortress Balance Sheet Improved Credit Trends 77 Years of Service in South Carolina 107 Years of Service in Georgia Strong Culture Consistent Growth Organic Growth Selective M&A strategy Well-positioned for Future |
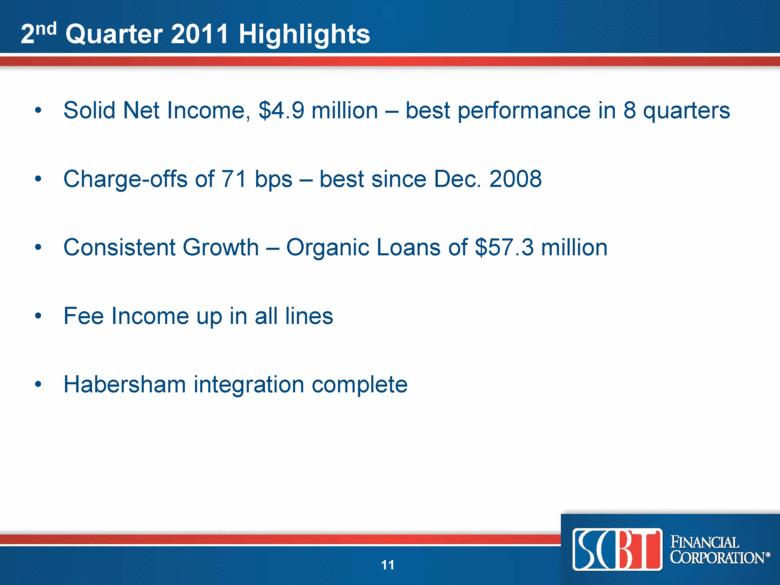
| 2nd Quarter 2011 Highlights Solid Net Income, $4.9 million – best performance in 8 quarters Charge-offs of 71 bps – best since Dec. 2008 Consistent Growth – Organic Loans of $57.3 million Fee Income up in all lines Habersham integration complete |
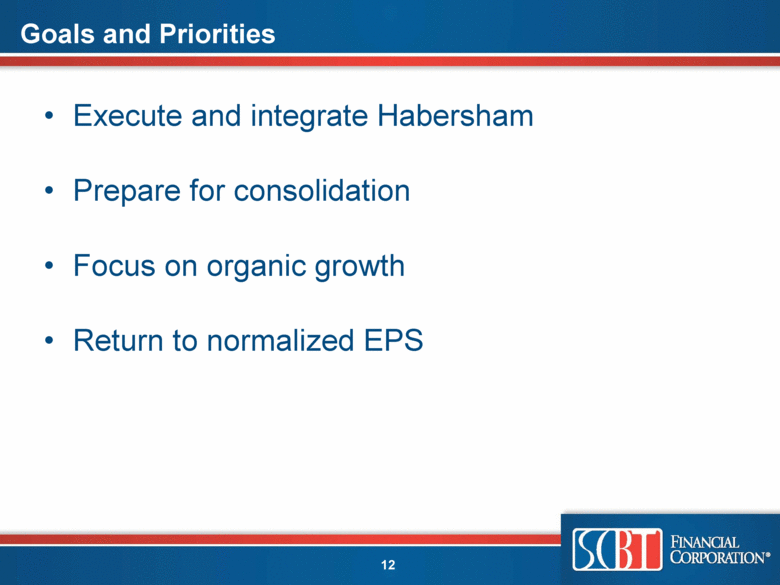
| Goals and Priorities Execute and integrate Habersham Prepare for consolidation Focus on organic growth Return to normalized EPS |
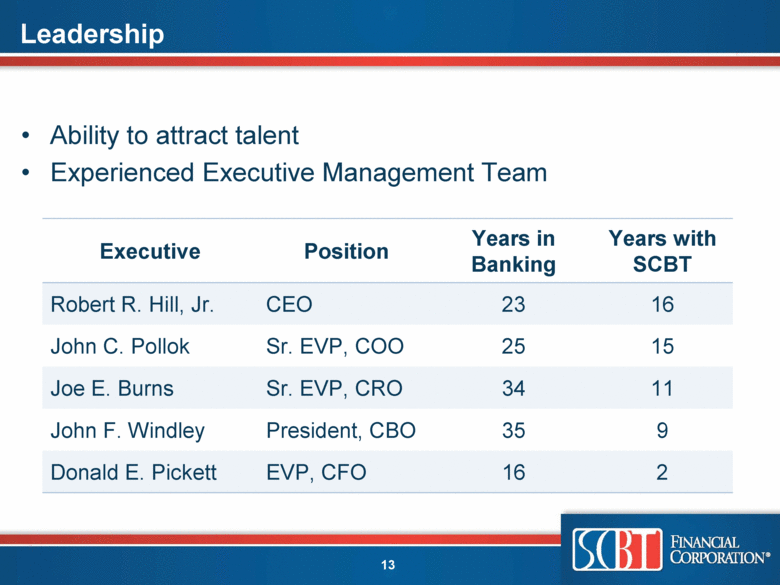
| Leadership Ability to attract talent Experienced Executive Management Team Executive Position Years in Banking Years with SCBT Robert R. Hill, Jr. CEO 23 16 John C. Pollok Sr. EVP, COO 25 15 Joe E. Burns Sr. EVP, CRO 34 11 John F. Windley President, CBO 35 9 Donald E. Pickett EVP, CFO 16 2 |
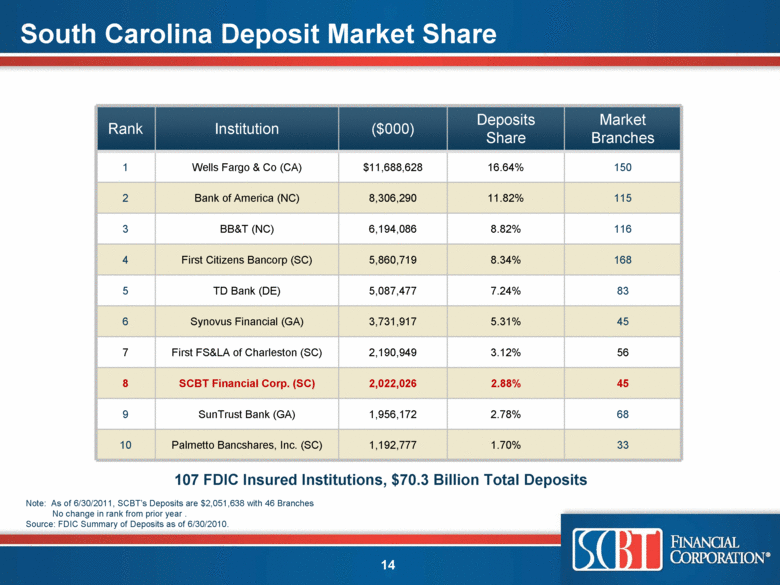
| South Carolina Deposit Market Share Note: As of 6/30/2011, SCBT’s Deposits are $2,051,638 with 46 Branches No change in rank from prior year . Source: FDIC Summary of Deposits as of 6/30/2010. Rank Institution ($000) Deposits Share Market Branches 1 Wells Fargo & Co (CA) $11,688,628 16.64% 150 2 Bank of America (NC) 8,306,290 11.82% 115 3 BB&T (NC) 6,194,086 8.82% 116 4 First Citizens Bancorp (SC) 5,860,719 8.34% 168 5 TD Bank (DE) 5,087,477 7.24% 83 6 Synovus Financial (GA) 3,731,917 5.31% 45 7 First FS&LA of Charleston (SC) 2,190,949 3.12% 56 8 SCBT Financial Corp. (SC) 2,022,026 2.88% 45 9 SunTrust Bank (GA) 1,956,172 2.78% 68 10 Palmetto Bancshares, Inc. (SC) 1,192,777 1.70% 33 107 FDIC Insured Institutions, $70.3 Billion Total Deposits |
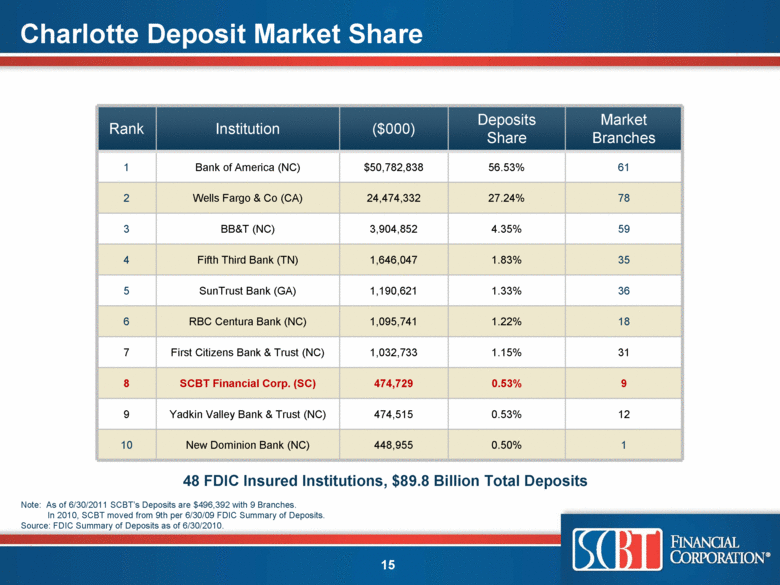
| Charlotte Deposit Market Share Note: As of 6/30/2011 SCBT’s Deposits are $496,392 with 9 Branches. In 2010, SCBT moved from 9th per 6/30/09 FDIC Summary of Deposits. Source: FDIC Summary of Deposits as of 6/30/2010. Rank Institution ($000) Deposits Share Market Branches 1 Bank of America (NC) $50,782,838 56.53% 61 2 Wells Fargo & Co (CA) 24,474,332 27.24% 78 3 BB&T (NC) 3,904,852 4.35% 59 4 Fifth Third Bank (TN) 1,646,047 1.83% 35 5 SunTrust Bank (GA) 1,190,621 1.33% 36 6 RBC Centura Bank (NC) 1,095,741 1.22% 18 7 First Citizens Bank & Trust (NC) 1,032,733 1.15% 31 8 SCBT Financial Corp. (SC) 474,729 0.53% 9 9 Yadkin Valley Bank & Trust (NC) 474,515 0.53% 12 10 New Dominion Bank (NC) 448,955 0.50% 1 48 FDIC Insured Institutions, $89.8 Billion Total Deposits |
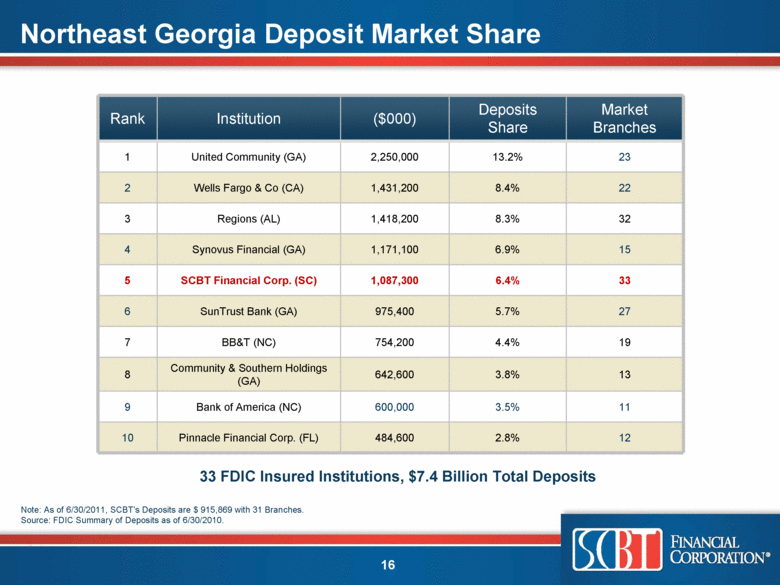
| Northeast Georgia Deposit Market Share Note: As of 6/30/2011, SCBT’s Deposits are $ 915,869 with 31 Branches. Source: FDIC Summary of Deposits as of 6/30/2010. Rank Institution ($000) Deposits Share Market Branches 1 United Community (GA) 2,250,000 13.2% 23 2 Wells Fargo & Co (CA) 1,431,200 8.4% 22 3 Regions (AL) 1,418,200 8.3% 32 4 Synovus Financial (GA) 1,171,100 6.9% 15 5 SCBT Financial Corp. (SC) 1,087,300 6.4% 33 6 SunTrust Bank (GA) 975,400 5.7% 27 7 BB&T (NC) 754,200 4.4% 19 8 Community & Southern Holdings (GA) 642,600 3.8% 13 9 Bank of America (NC) 600,000 3.5% 11 10 Pinnacle Financial Corp. (FL) 484,600 2.8% 12 33 FDIC Insured Institutions, $7.4 Billion Total Deposits |
| Capital Raise Private Placement of $35 million in contingent capital, at $31 per share Investor confidence in SCBT’s strategic plan Positions SCBT to further participate in strategic opportunities and consolidations within the industry |
|
|

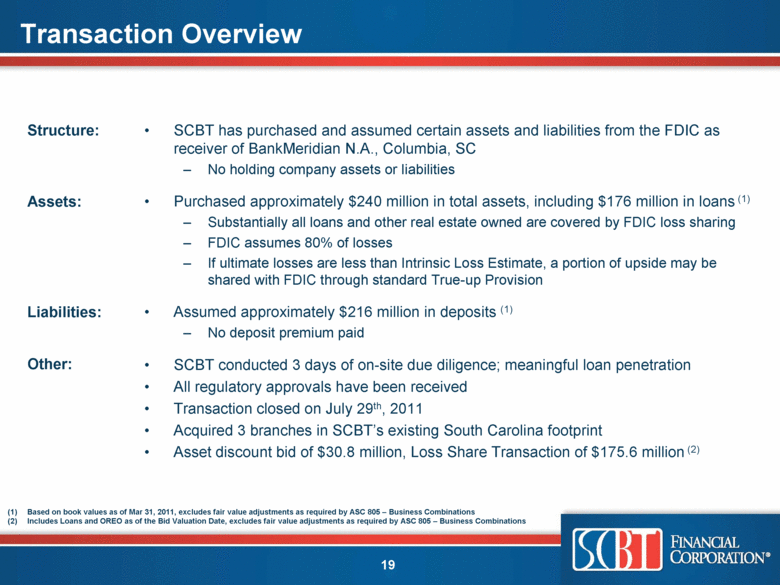
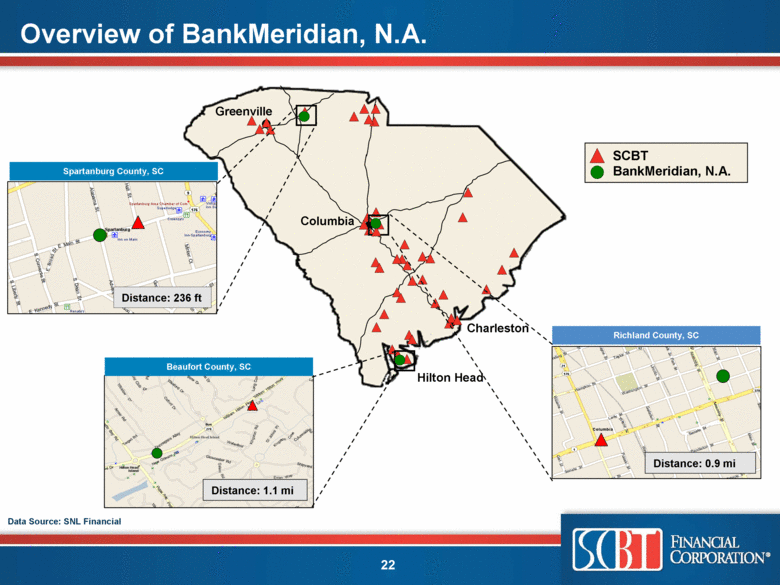
| Transaction Overview SCBT has purchased and assumed certain assets and liabilities from the FDIC as receiver of BankMeridian N.A., Columbia, SC No holding company assets or liabilities Purchased approximately $240 million in total assets, including $176 million in loans (1) Substantially all loans and other real estate owned are covered by FDIC loss sharing FDIC assumes 80% of losses If ultimate losses are less than Intrinsic Loss Estimate, a portion of upside may be shared with FDIC through standard True-up Provision Assumed approximately $216 million in deposits (1) No deposit premium paid SCBT conducted 3 days of on-site due diligence; meaningful loan penetration All regulatory approvals have been received Transaction closed on July 29th, 2011 Acquired 3 branches in SCBT’s existing South Carolina footprint Asset discount bid of $30.8 million, Loss Share Transaction of $175.6 million (2) Structure: Assets: Liabilities: Other: Based on book values as of Mar 31, 2011, excludes fair value adjustments as required by ASC 805 – Business Combinations Includes Loans and OREO as of the Bid Valuation Date, excludes fair value adjustments as required by ASC 805 – Business Combinations 19 (1)(2) |
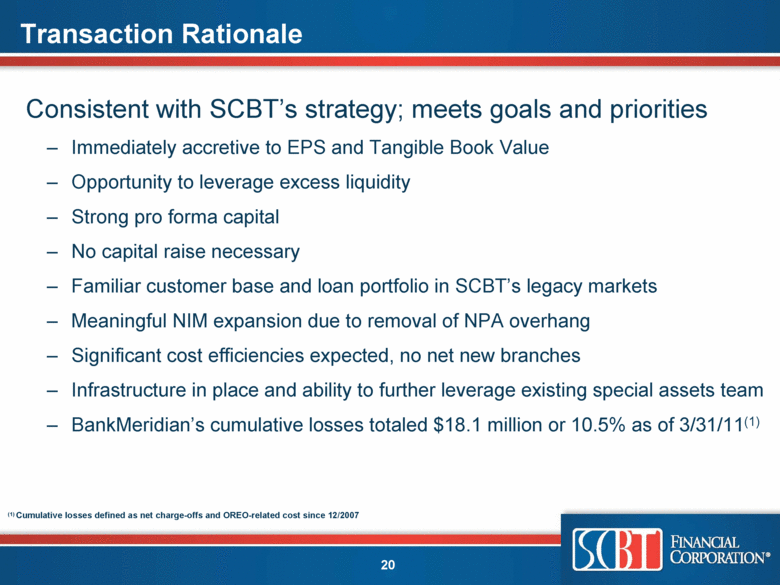
| Transaction Rationale Consistent with SCBT’s strategy; meets goals and priorities Immediately accretive to EPS and Tangible Book Value Opportunity to leverage excess liquidity Strong pro forma capital No capital raise necessary Familiar customer base and loan portfolio in SCBT’s legacy markets Meaningful NIM expansion due to removal of NPA overhang Significant cost efficiencies expected, no net new branches Infrastructure in place and ability to further leverage existing special assets team BankMeridian’s cumulative losses totaled $18.1 million or 10.5% as of 3/31/11(1) 20 (1) Cumulative losses defined as net charge-offs and OREO-related cost since 12/2007 |
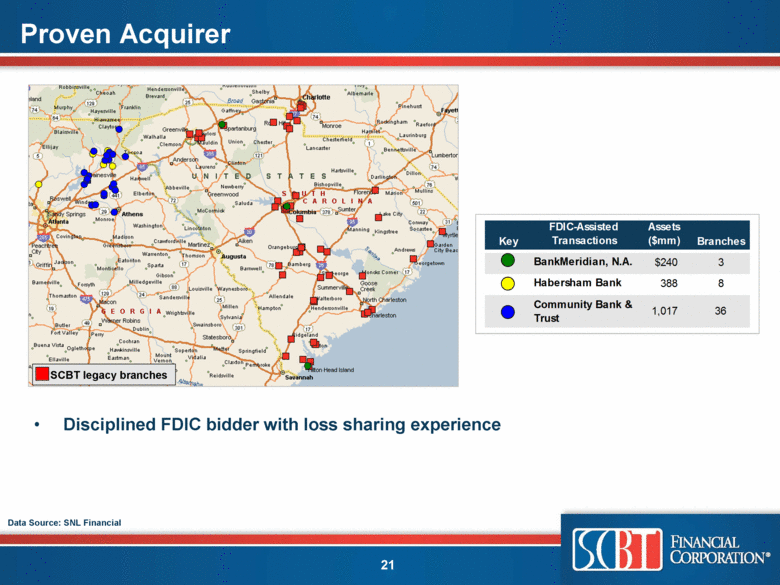
| Proven Acquirer 21 Data Source: SNL Financial SCBT legacy branches Disciplined FDIC bidder with loss sharing experience Key FDIC-Assisted Transactions Assets ($mm) Branches BankMeridian, N.A. $240 3 Habersham Bank 388 8 Community Bank & Trust 1,017 36 |
| Overview of BankMeridian, N.A. 22 Data Source: SNL Financial Charleston Columbia Greenville Spartanburg County, SC Distance: 236 ft Richland County, SC Hilton Head Beaufort County, SC Distance: 1.1 mi Distance: 0.9 mi SCBT BankMeridian, N.A. |
| [LOGO] |

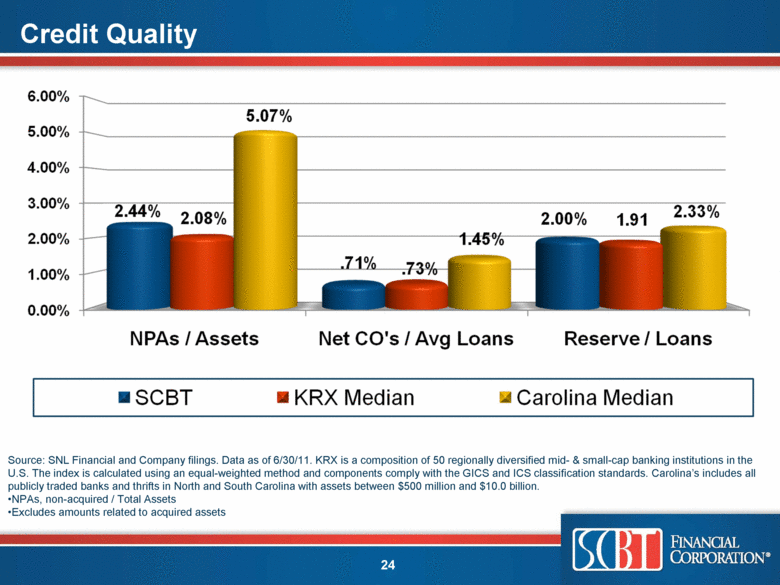
| Credit Quality Source: SNL Financial and Company filings. Data as of 6/30/11. KRX is a composition of 50 regionally diversified mid- & small-cap banking institutions in the U.S. The index is calculated using an equal-weighted method and components comply with the GICS and ICS classification standards. Carolina’s includes all publicly traded banks and thrifts in North and South Carolina with assets between $500 million and $10.0 billion. NPAs, non-acquired / Total Assets Excludes amounts related to acquired assets |
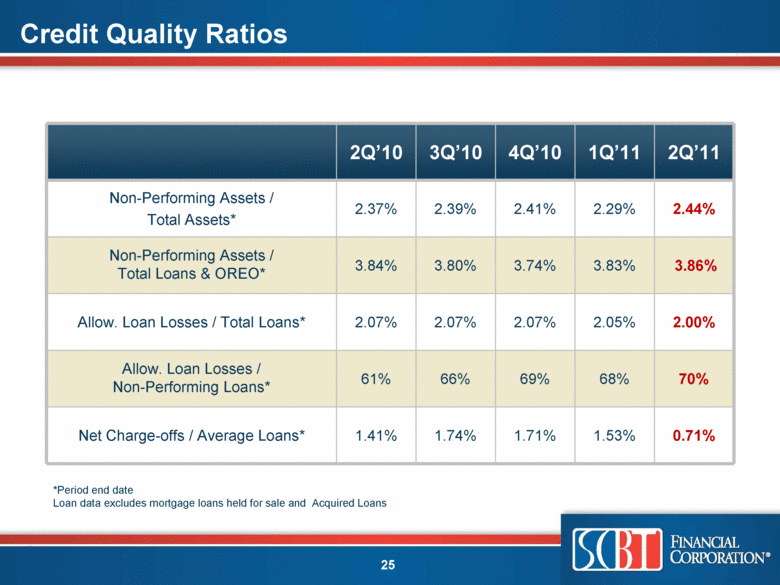
| Credit Quality Ratios 2Q’10 3Q’10 4Q’10 1Q’11 2Q’11 Non-Performing Assets / Total Assets* 2.37% 2.39% 2.41% 2.29% 2.44% Non-Performing Assets / Total Loans & OREO* 3.84% 3.80% 3.74% 3.83% 3.86% Allow. Loan Losses / Total Loans* 2.07% 2.07% 2.07% 2.05% 2.00% Allow. Loan Losses / Non-Performing Loans* 61% 66% 69% 68% 70% Net Charge-offs / Average Loans* 1.41% 1.74% 1.71% 1.53% 0.71% *Period end date Loan data excludes mortgage loans held for sale and Acquired Loans |
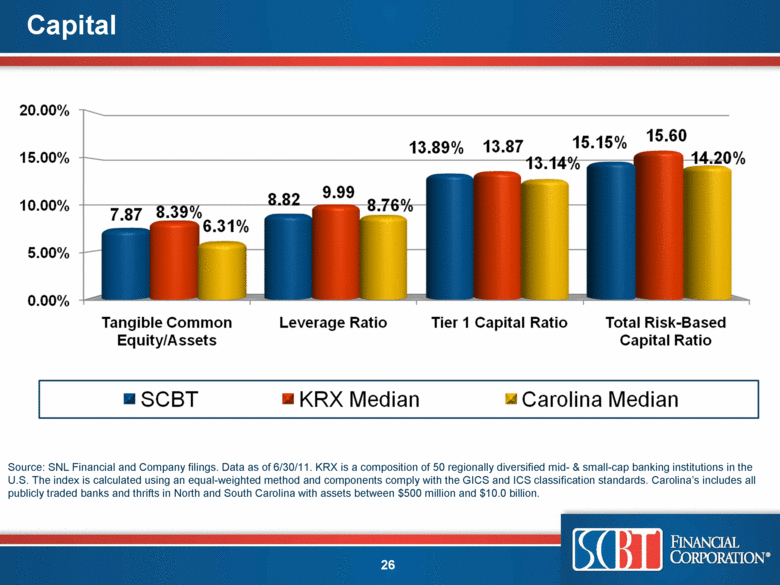
| Capital Source: SNL Financial and Company filings. Data as of 6/30/11. KRX is a composition of 50 regionally diversified mid- & small-cap banking institutions in the U.S. The index is calculated using an equal-weighted method and components comply with the GICS and ICS classification standards. Carolina’s includes all publicly traded banks and thrifts in North and South Carolina with assets between $500 million and $10.0 billion. |
| [LOGO] |

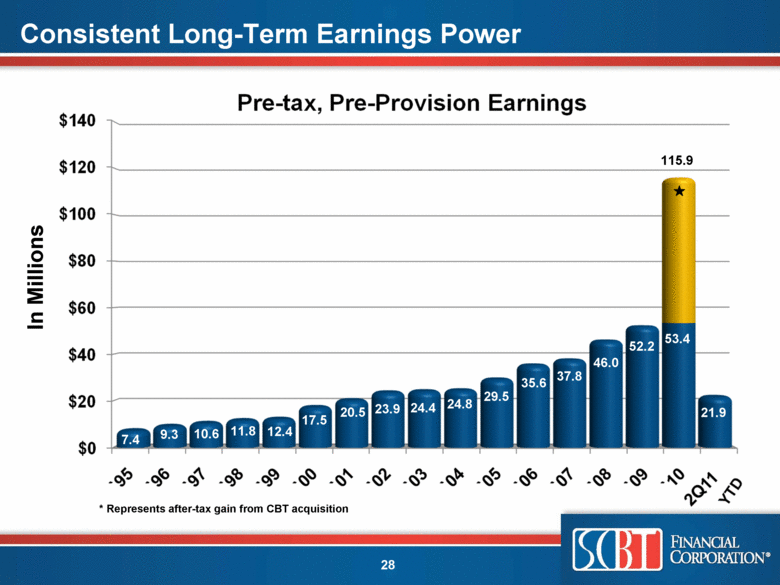
| Consistent Long-Term Earnings Power * Represents after-tax gain from CBT acquisition In Millions 7.4 9.3 10.6 11.8 12.4 17.5 20.5 23.9 24.4 24.8 29.5 35.6 37.8 46.0 52.2 53.4 21.9 115.9 |
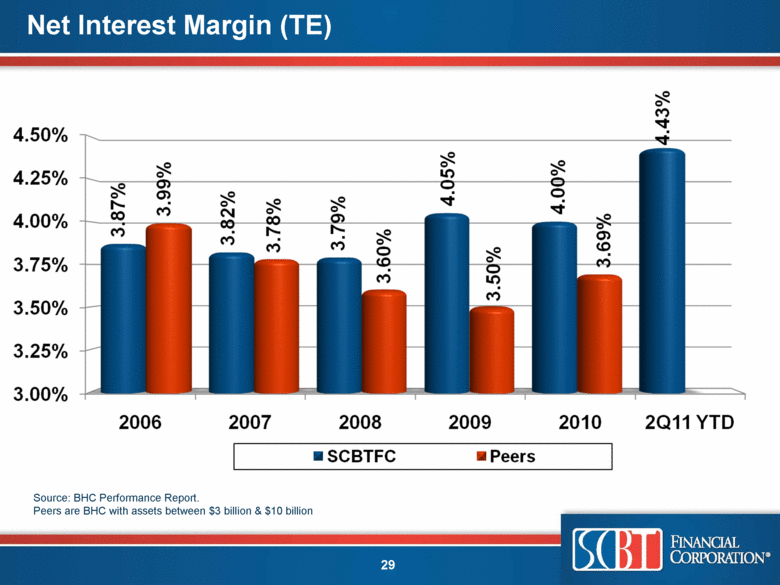
| Net Interest Margin (TE) Source: BHC Performance Report. Peers are BHC with assets between $3 billion & $10 billion |
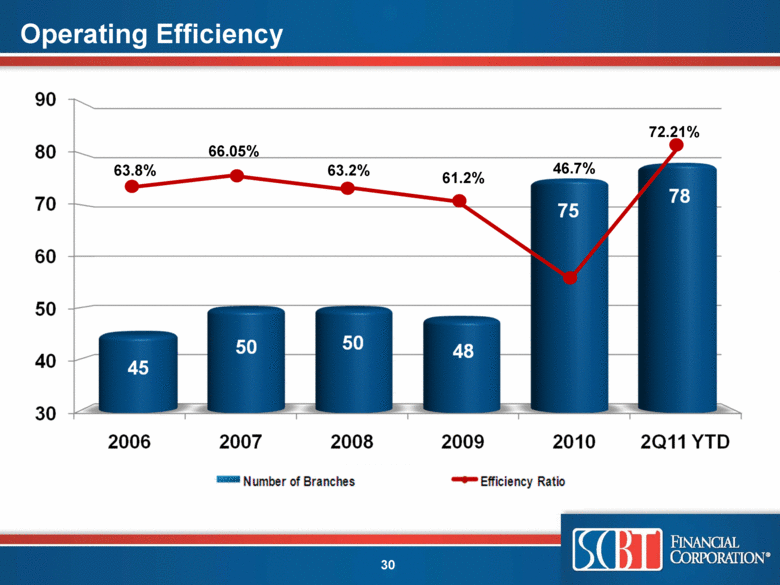
| Operating Efficiency 63.8% 66.05% 63.2% 61.2% 46.7% 72.21% |
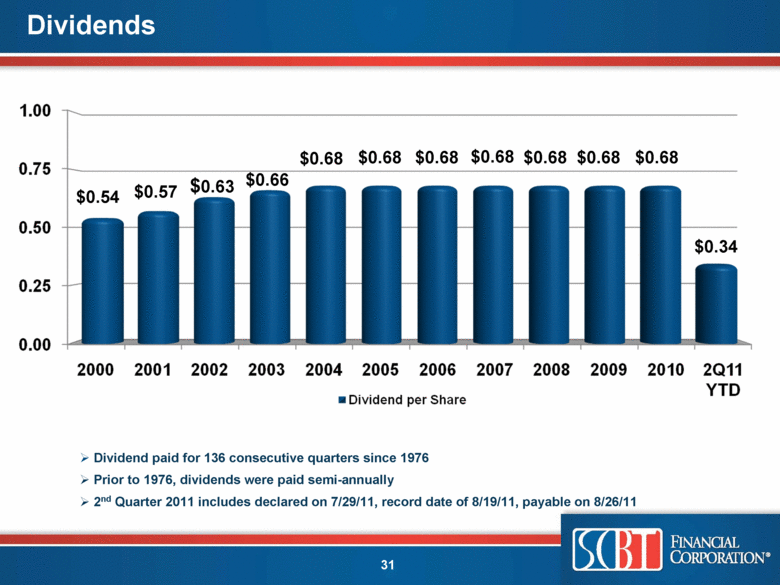
| Dividends Dividend paid for 136 consecutive quarters since 1976 Prior to 1976, dividends were paid semi-annually 2nd Quarter 2011 includes declared on 7/29/11, record date of 8/19/11, payable on 8/26/11 $0.54 $0.57 $0.63 $0.66 $0.68 $0.68 $0.68 $0.68 $0.68 $0.68 $0.68 $0.34 |
| [LOGO] |

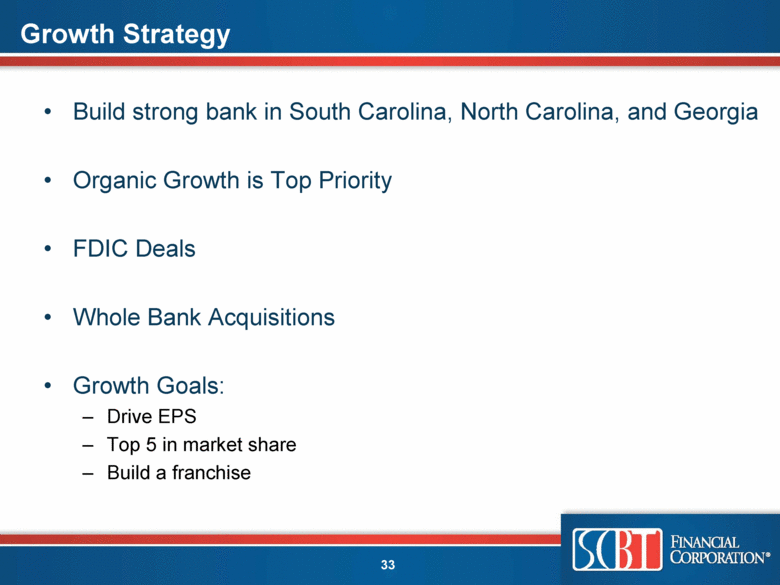
| Growth Strategy Build strong bank in South Carolina, North Carolina, and Georgia Organic Growth is Top Priority FDIC Deals Whole Bank Acquisitions Growth Goals: Drive EPS Top 5 in market share Build a franchise |
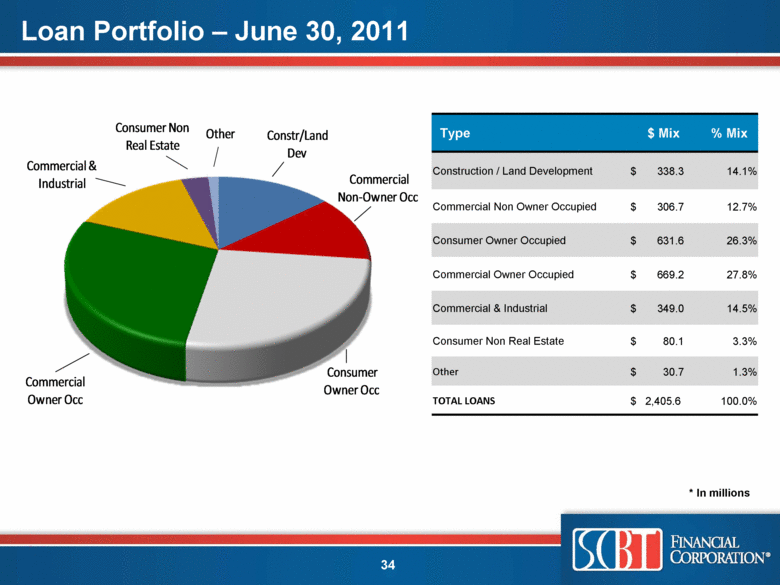
| Loan Portfolio – June 30, 2011 Type $ Mix % Mix Construction / Land Development $ 338.3 14.1% Commercial Non Owner Occupied $ 306.7 12.7% Consumer Owner Occupied $ 631.6 26.3% Commercial Owner Occupied $ 669.2 27.8% Commercial & Industrial $ 349.0 14.5% Consumer Non Real Estate $ 80.1 3.3% Other $ 30.7 1.3% TOTAL LOANS $ 2,405.6 100.0% * In millions Constr/Land Dev Commercial Non - Owner Occ Consumer Owner Occ Commercial Owner Occ Commercial & Industrial Consumer Non Real Estate Other |
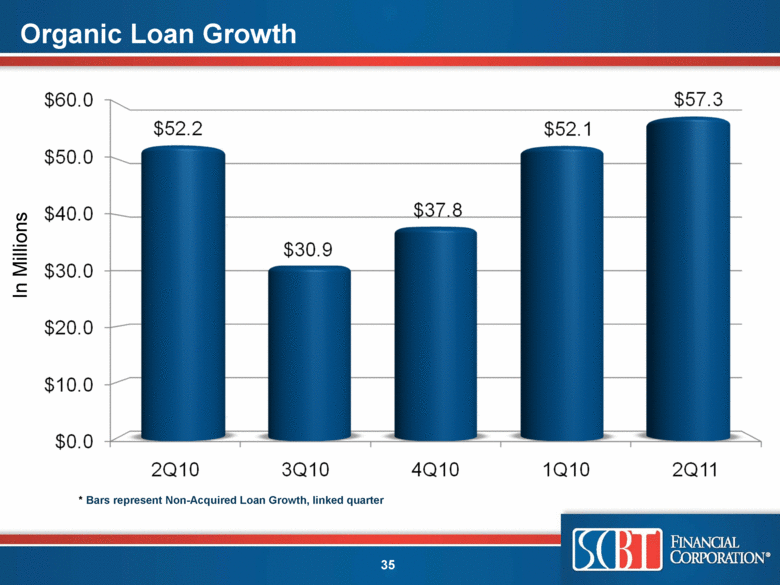
| Organic Loan Growth In Millions * Bars represent Non-Acquired Loan Growth, linked quarter |
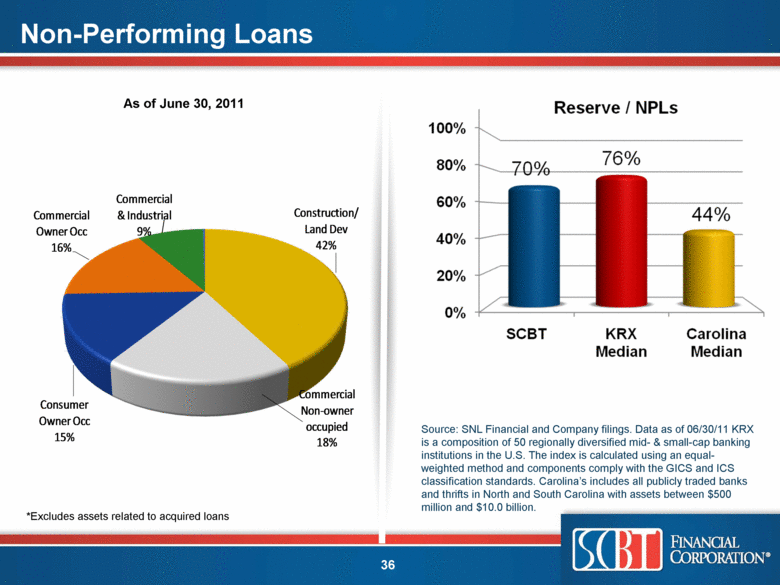
| Non-Performing Loans Source: SNL Financial and Company filings. Data as of 06/30/11 KRX is a composition of 50 regionally diversified mid- & small-cap banking institutions in the U.S. The index is calculated using an equal-weighted method and components comply with the GICS and ICS classification standards. Carolina’s includes all publicly traded banks and thrifts in North and South Carolina with assets between $500 million and $10.0 billion. As of June 30, 2011 *Excludes assets related to acquired loans Construction/ Land Dev 42% Commercial Non - owner occupied 18% Consumer Owner Occ 15% Commercial Owner Occ 16% Commercial & Industrial 9% |
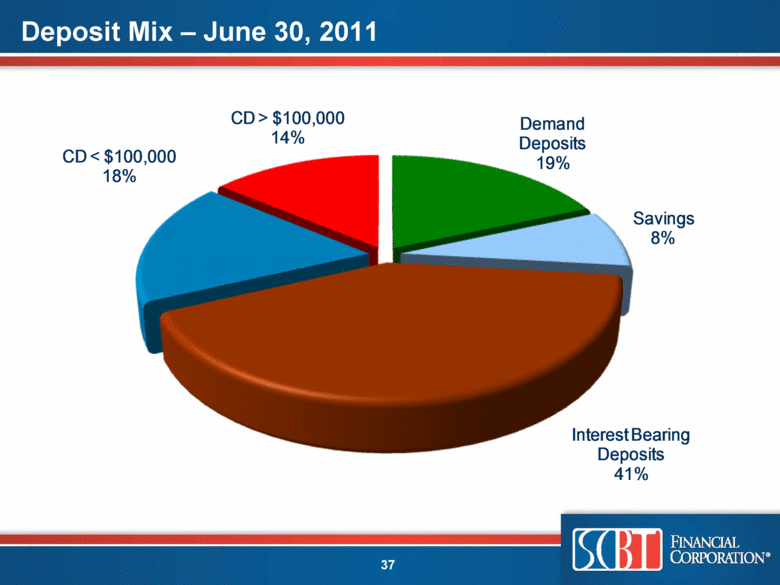
| Deposit Mix – June 30, 2011 Demand Deposits 19% Savings 8% Interest Bearing Deposits 41% CD < $100,000 18% CD > $100,000 14% |
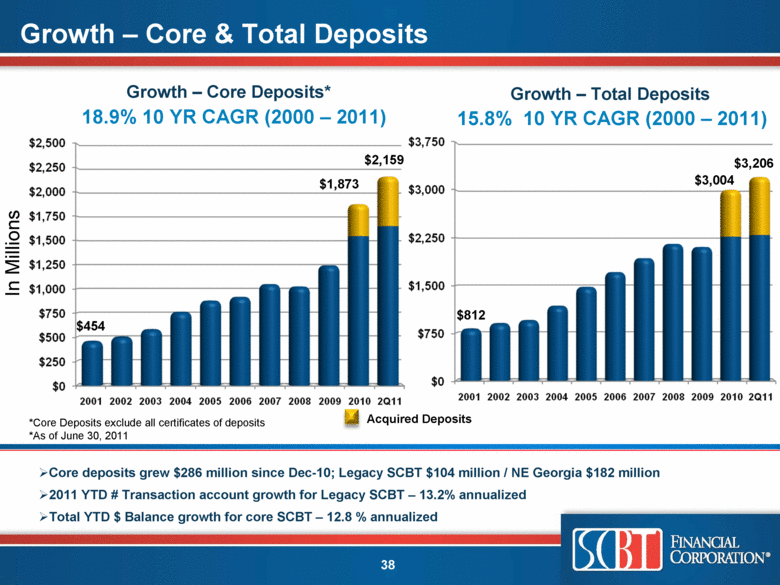
| Growth – Core & Total Deposits In Millions *Core Deposits exclude all certificates of deposits *As of June 30, 2011 Core deposits grew $286 million since Dec-10; Legacy SCBT $104 million / NE Georgia $182 million 2011 YTD # Transaction account growth for Legacy SCBT – 13.2% annualized Total YTD $ Balance growth for core SCBT – 12.8 % annualized Growth – Core Deposits* 18.9% 10 YR CAGR (2000 – 2011) Growth – Total Deposits 15.8% 10 YR CAGR (2000 – 2011) $454 $1,873 $812 $3,004 Acquired Deposits $3,206 $2,159 |
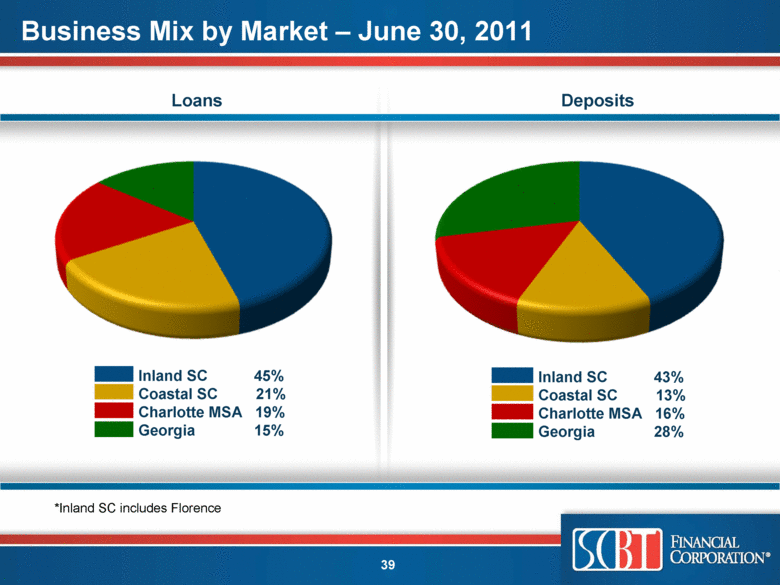
| Business Mix by Market – June 30, 2011 Loans Deposits Inland SC 45% Coastal SC 21% Charlotte MSA 19% Georgia 15% Inland SC 43% Coastal SC 13% Charlotte MSA 16% Georgia 28% *Inland SC includes Florence |
| Habersham Bank SUPPLEMENTAL INFORMATION |

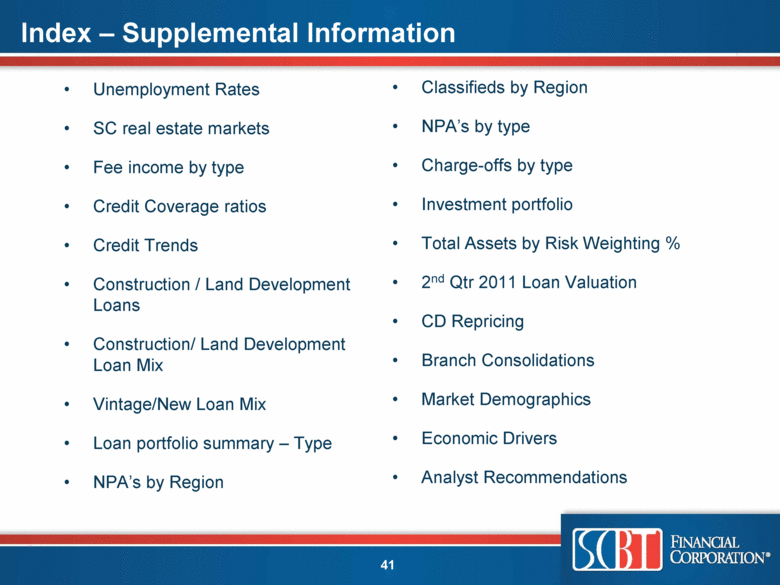
| Index – Supplemental Information Unemployment Rates SC real estate markets Fee income by type Credit Coverage ratios Credit Trends Construction / Land Development Loans Construction/ Land Development Loan Mix Vintage/New Loan Mix Loan portfolio summary – Type NPA’s by Region Classifieds by Region NPA’s by type Charge-offs by type Investment portfolio Total Assets by Risk Weighting % 2nd Qtr 2011 Loan Valuation CD Repricing Branch Consolidations Market Demographics Economic Drivers Analyst Recommendations |
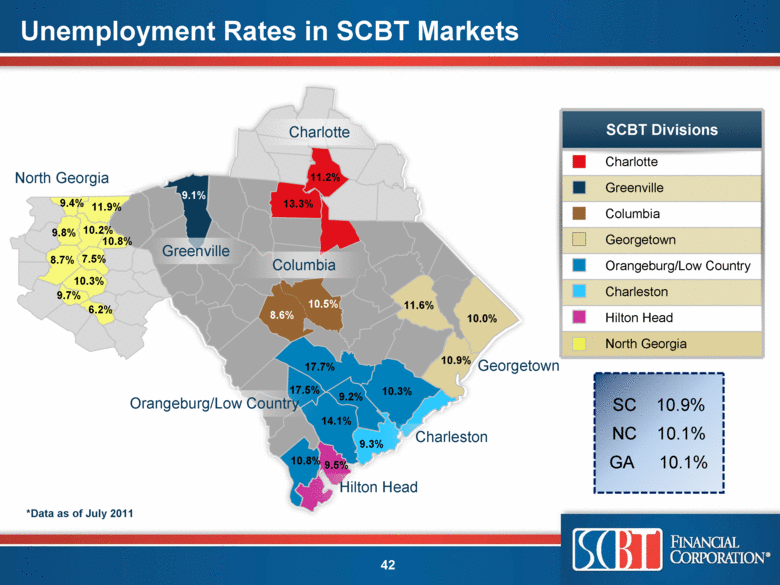
| Unemployment Rates in SCBT Markets Georgetown SCBT Divisions Charlotte Greenville Columbia Georgetown Orangeburg/Low Country Charleston Hilton Head North Georgia SC 10.9% NC 10.1% GA 10.1% Columbia Charlotte Hilton Head Charleston Greenville Orangeburg/Low Country North Georgia 11.6% 11.2% 10.9% 10.0% 13.3% 10.5% 8.6% 17.7% 9.1% 11.9% 10.8% 9.5% 17.5% 14.1% 10.3% 9.3% 9.2% 9.4% 10.2% 8.7% 10.3% 9.7% 7.5% 9.8% 6.2% 10.8% *Data as of July 2011 |
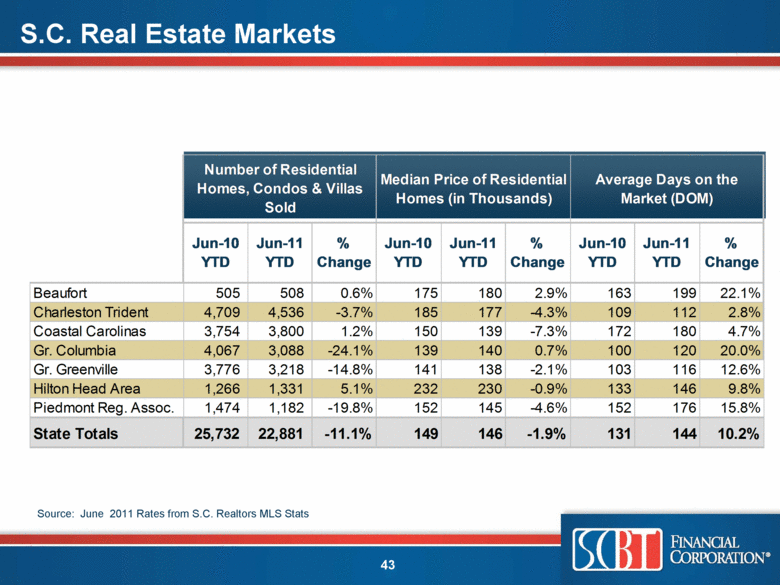
| S.C. Real Estate Markets Source: June 2011 Rates from S.C. Realtors MLS Stats Beaufort 505 508 0.6% 175 180 2.9% 163 199 22.1% Charleston Trident 4,709 4,536 -3.7% 185 177 -4.3% 109 112 2.8% Coastal Carolinas 3,754 3,800 1.2% 150 139 -7.3% 172 180 4.7% Gr. Columbia 4,067 3,088 -24.1% 139 140 0.7% 100 120 20.0% Gr. Greenville 3,776 3,218 -14.8% 141 138 -2.1% 103 116 12.6% Hilton Head Area 1,266 1,331 5.1% 232 230 -0.9% 133 146 9.8% Piedmont Reg. Assoc. 1,474 1,182 -19.8% 152 145 -4.6% 152 176 15.8% State Totals 25,732 22,881 -11.1% 149 146 -1.9% 131 144 10.2% Number of Residential Homes, Condos & Villas Sold Jun-10 YTD Jun-11 YTD % Change Jun-10 YTD Average Days on the Market (DOM) % Change Jun-11 YTD Median Price of Residential Homes (in Thousands) Jun-10 YTD Jun-11 YTD % Change |
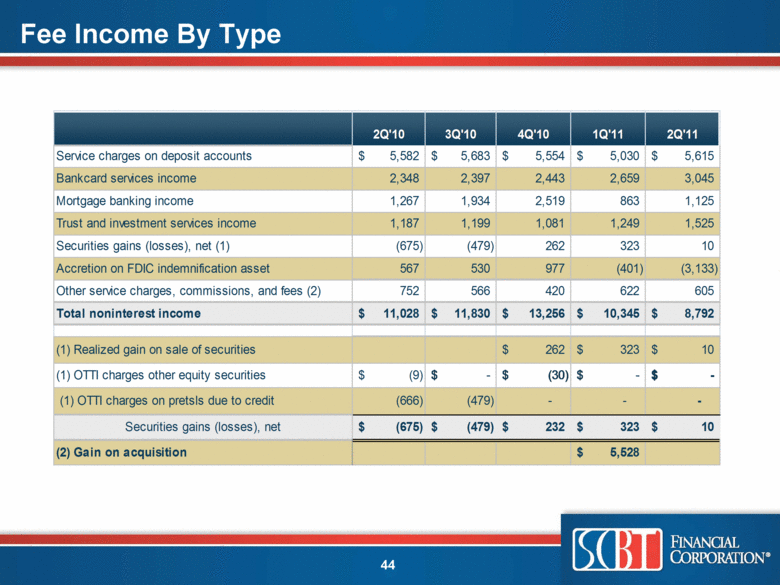
| Fee Income By Type 2Q'10 3Q'10 4Q'10 1Q'11 2Q'11 Service charges on deposit accounts 5,582 $ 5,683 $ 5,554 $ 5,030 $ 5,615 $ Bankcard services income 2,348 2,397 2,443 2,659 3,045 Mortgage banking income 1,267 1,934 2,519 863 1,125 Trust and investment services income 1,187 1,199 1,081 1,249 1,525 Securities gains (losses), net (1) (675) (479) 262 323 10 Accretion on FDIC indemnification asset 567 530 977 (401) (3,133) Other service charges, commissions, and fees (2) 752 566 420 622 605 Total noninterest income 11,028 $ 11,830 $ 13,256 $ 10,345 $ 8,792 $ (1) Realized gain on sale of securities 262 $ 323 $ 10 $ (1) OTTI charges other equity securities (9) $ - $ (30) $ - $ - $ (1) OTTI charges on pretsls due to credit (666) (479) - - - Securities gains (losses), net (675) $ (479) $ 232 $ 323 $ 10 $ (2) Gain on acquisition 5,528 $ |
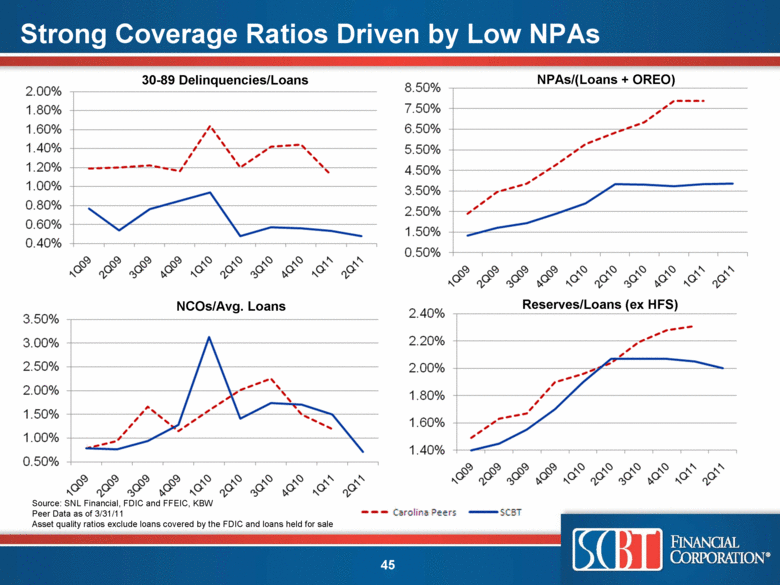
| Strong Coverage Ratios Driven by Low NPAs 30-89 Delinquencies/Loans NPAs/(Loans + OREO) NCOs/Avg. Loans Reserves/Loans (ex HFS) Source: SNL Financial, FDIC and FFEIC, KBW Peer Data as of 3/31/11 Asset quality ratios exclude loans covered by the FDIC and loans held for sale |
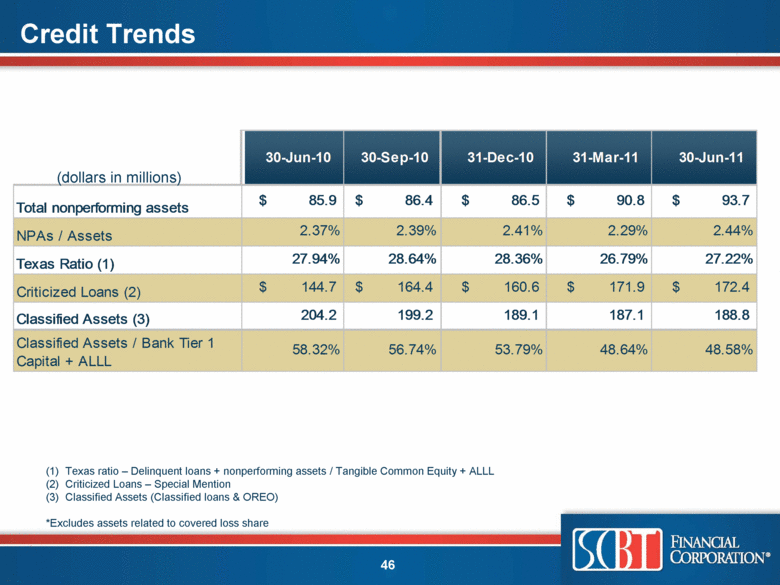
| Credit Trends (dollars in millions) Texas ratio – Delinquent loans + nonperforming assets / Tangible Common Equity + ALLL Criticized Loans – Special Mention Classified Assets (Classified loans & OREO) *Excludes assets related to covered loss share 30-Jun-10 30-Sep-10 31-Dec-10 31-Mar-11 30-Jun-11 85.9 $ 86.4 $ 86.5 $ 90.8 $ 93.7 $ 2.37% 2.39% 2.41% 2.29% 2.44% 27.94% 28.64% 28.36% 26.79% 27.22% 144.7 $ 164.4 $ 160.6 $ 171.9 $ 172.4 $ 204.2 199.2 189.1 187.1 188.8 58.32% 56.74% 53.79% 48.64% 48.58% Classified Assets (3) Total nonperforming assets NPAs / Assets Texas Ratio (1) Criticized Loans (2) Classified Assets / Bank Tier 1 Capital + ALLL (1) (2) (3) |
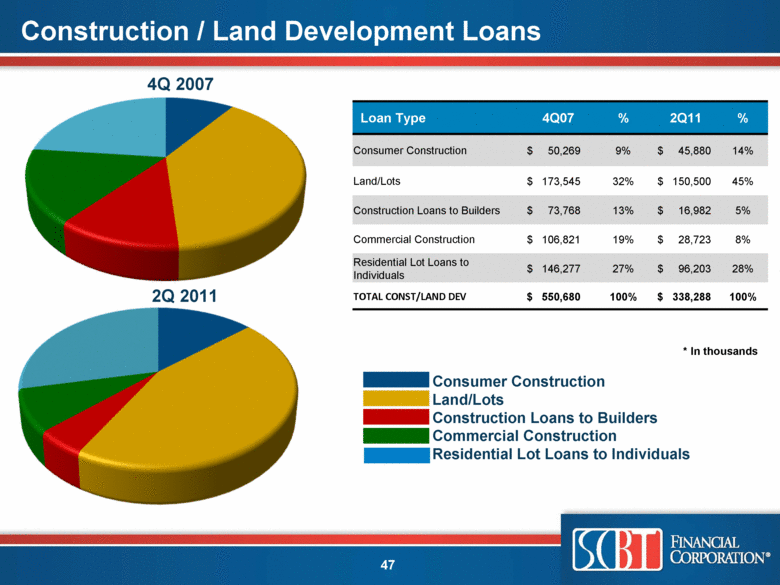
| Construction / Land Development Loans 4Q 2007 2Q 2011 Loan Type 4Q07 % 2Q11 % Consumer Construction $ 50,269 9% $ 45,880 14% Land/Lots $ 173,545 32% $ 150,500 45% Construction Loans to Builders $ 73,768 13% $ 16,982 5% Commercial Construction $ 106,821 19% $ 28,723 8% Residential Lot Loans to Individuals $ 146,277 27% $ 96,203 28% TOTAL CONST/LAND DEV $ 550,680 100% $ 338,288 100% Consumer Construction Land/Lots Construction Loans to Builders Commercial Construction Residential Lot Loans to Individuals * In thousands |
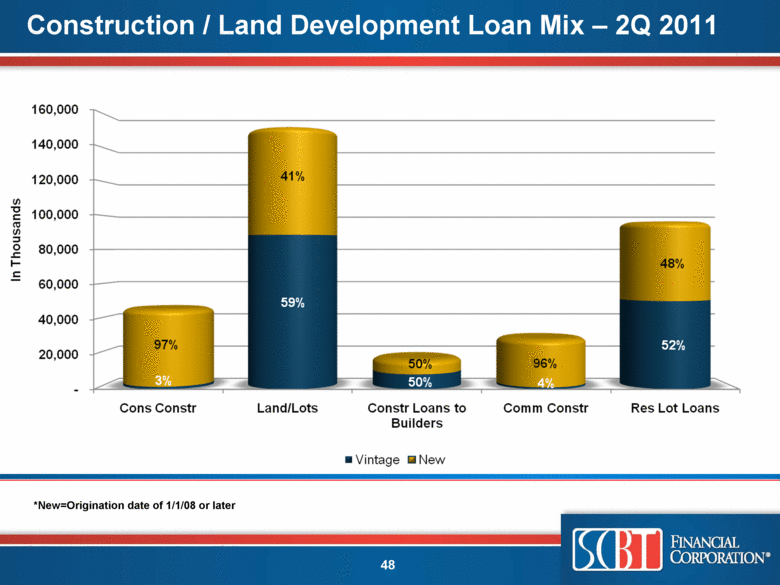
| Construction / Land Development Loan Mix – 2Q 2011 *New=Origination date of 1/1/08 or later 97% 3% 41% 59% 50% 50% 96% 4% 48% 52% |
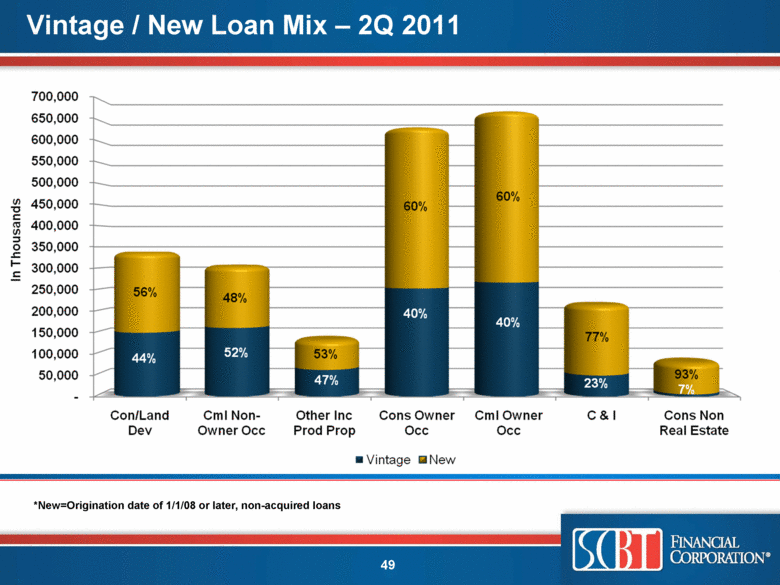
| Vintage / New Loan Mix – 2Q 2011 *New=Origination date of 1/1/08 or later, non-acquired loans |
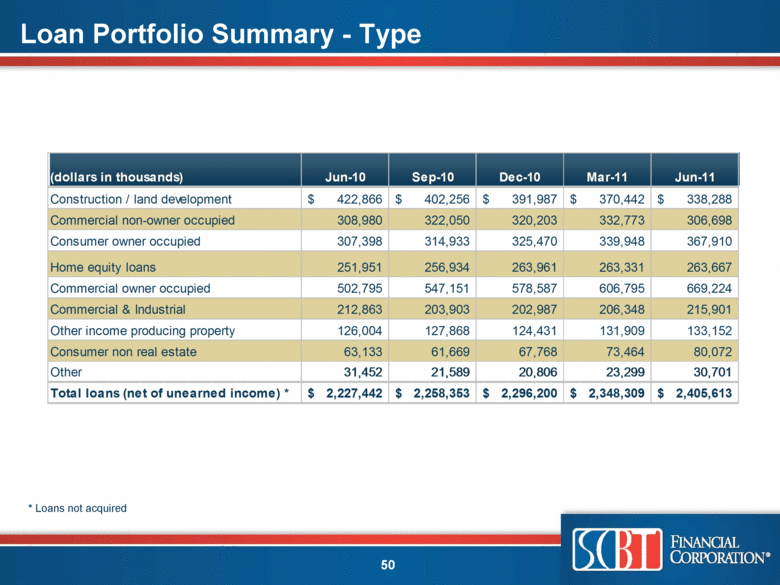
| Loan Portfolio Summary - Type * Loans not acquired (dollars in thousands) Jun-10 Sep-10 Dec-10 Mar-11 Jun-11 Construction / land development 422,866 $ 402,256 $ 391,987 $ 370,442 $ 338,288 $ Commercial non-owner occupied 308,980 322,050 320,203 332,773 306,698 Consumer owner occupied 307,398 314,933 325,470 339,948 367,910 Home equity loans 251,951 256,934 263,961 263,331 263,667 Commercial owner occupied 502,795 547,151 578,587 606,795 669,224 Commercial & Industrial 212,863 203,903 202,987 206,348 215,901 Other income producing property 126,004 127,868 124,431 131,909 133,152 Consumer non real estate 63,133 61,669 67,768 73,464 80,072 Other 31,452 21,589 20,806 23,299 30,701 Total loans (net of unearned income) * 2,227,442 $ 2,258,353 $ 2,296,200 $ 2,348,309 $ 2,405,613 $ |
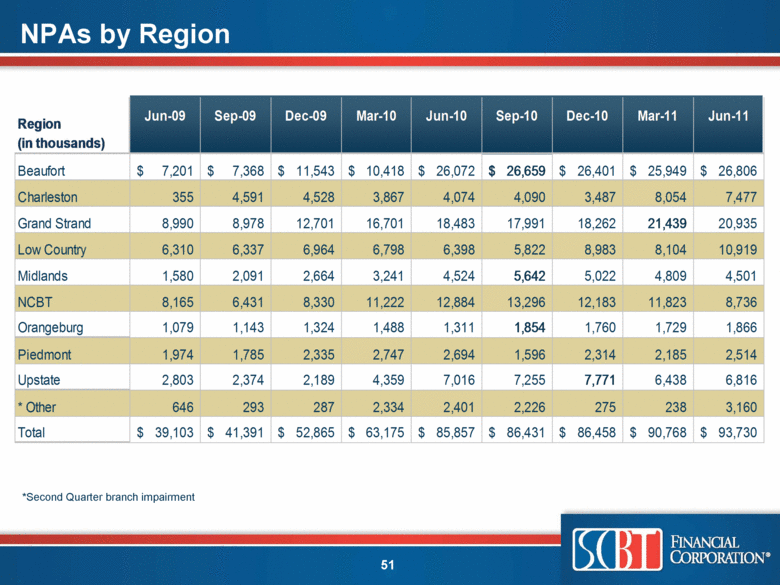
| NPAs by Region *Second Quarter branch impairment Region Jun-09 Sep-09 Dec-09 Mar-10 Jun-10 Sep-10 Dec-10 Mar-11 Jun-11 (in thousands) Beaufort 7,201 $ 7,368 $ 11,543 $ 10,418 $ 26,072 $ 26,659 $ 26,401 $ 25,949 $ 26,806 $ Charleston 355 4,591 4,528 3,867 4,074 4,090 3,487 8,054 7,477 Grand Strand 8,990 8,978 12,701 16,701 18,483 17,991 18,262 21,439 20,935 Low Country 6,310 6,337 6,964 6,798 6,398 5,822 8,983 8,104 10,919 Midlands 1,580 2,091 2,664 3,241 4,524 5,642 5,022 4,809 4,501 NCBT 8,165 6,431 8,330 11,222 12,884 13,296 12,183 11,823 8,736 Orangeburg 1,079 1,143 1,324 1,488 1,311 1,854 1,760 1,729 1,866 Piedmont 1,974 1,785 2,335 2,747 2,694 1,596 2,314 2,185 2,514 Upstate 2,803 2,374 2,189 4,359 7,016 7,255 7,771 6,438 6,816 * Other 646 293 287 2,334 2,401 2,226 275 238 3,160 Total 39,103 $ 41,391 $ 52,865 $ 63,175 $ 85,857 $ 86,431 $ 86,458 $ 90,768 $ 93,730 $ |
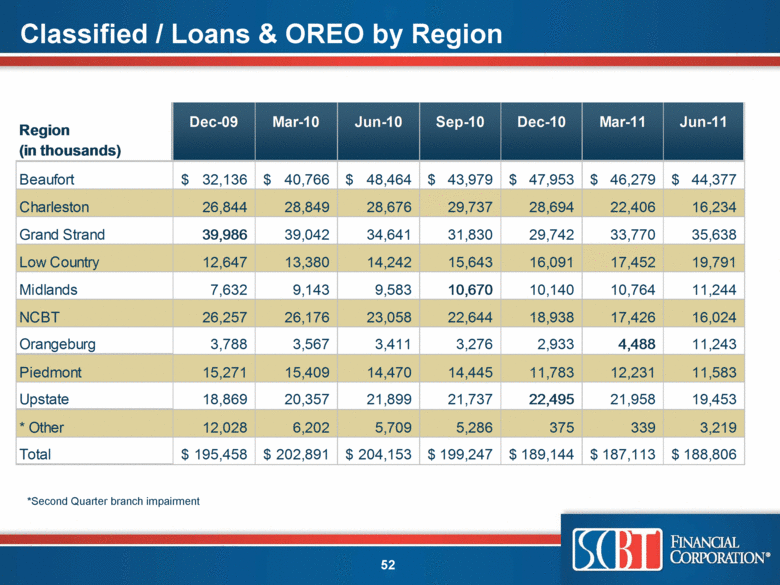
| Classified / Loans & OREO by Region *Second Quarter branch impairment Region Dec-09 Mar-10 Jun-10 Sep-10 Dec-10 Mar-11 Jun-11 (in thousands) Beaufort 32,136 $ 40,766 $ 48,464 $ 43,979 $ 47,953 $ 46,279 $ 44,377 $ Charleston 26,844 28,849 28,676 29,737 28,694 22,406 16,234 Grand Strand 39,986 39,042 34,641 31,830 29,742 33,770 35,638 Low Country 12,647 13,380 14,242 15,643 16,091 17,452 19,791 Midlands 7,632 9,143 9,583 10,670 10,140 10,764 11,244 NCBT 26,257 26,176 23,058 22,644 18,938 17,426 16,024 Orangeburg 3,788 3,567 3,411 3,276 2,933 4,488 11,243 Piedmont 15,271 15,409 14,470 14,445 11,783 12,231 11,583 Upstate 18,869 20,357 21,899 21,737 22,495 21,958 19,453 * Other 12,028 6,202 5,709 5,286 375 339 3,219 Total 195,458 $ 202,891 $ 204,153 $ 199,247 $ 189,144 $ 187,113 $ 188,806 $ |
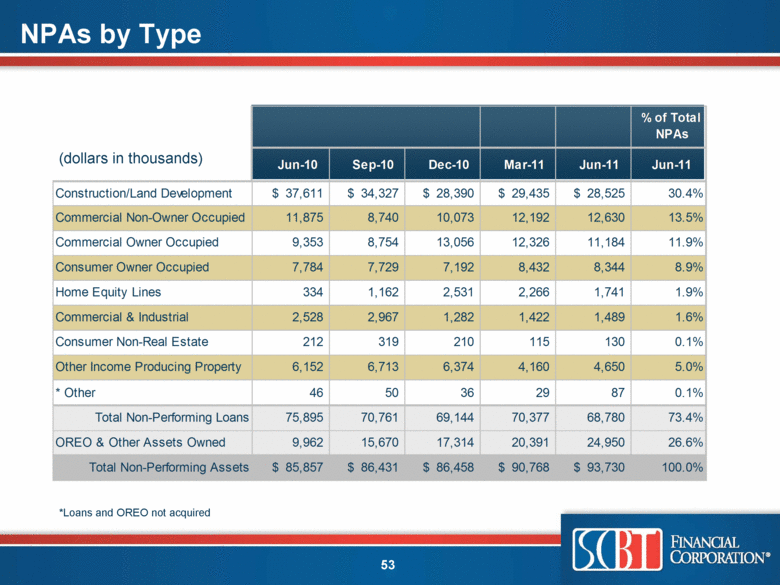
| NPAs by Type (dollars in thousands) *Loans and OREO not acquired Jun-10 Sep-10 Dec-10 Mar-11 Jun-11 Jun-11 Construction/Land Development 37,611 $ 34,327 $ 28,390 $ 29,435 $ 28,525 $ 30.4% Commercial Non-Owner Occupied 11,875 8,740 10,073 12,192 12,630 13.5% Commercial Owner Occupied 9,353 8,754 13,056 12,326 11,184 11.9% Consumer Owner Occupied 7,784 7,729 7,192 8,432 8,344 8.9% Home Equity Lines 334 1,162 2,531 2,266 1,741 1.9% Commercial & Industrial 2,528 2,967 1,282 1,422 1,489 1.6% Consumer Non-Real Estate 212 319 210 115 130 0.1% Other Income Producing Property 6,152 6,713 6,374 4,160 4,650 5.0% * Other 46 50 36 29 87 0.1% 75,895 70,761 69,144 70,377 68,780 73.4% 9,962 15,670 17,314 20,391 24,950 26.6% 85,857 $ 86,431 $ 86,458 $ 90,768 $ 93,730 $ 100.0% % of Total NPAs Total Non-Performing Loans OREO & Other Assets Owned Total Non-Performing Assets |
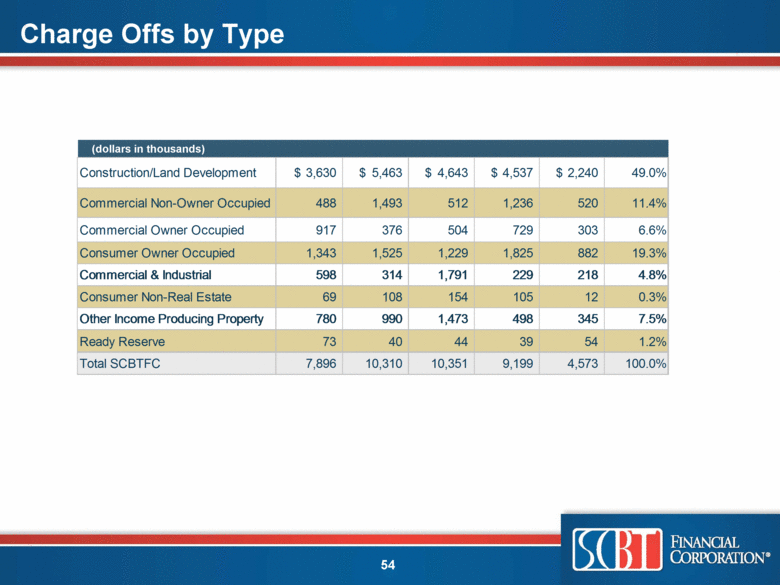
| Charge Offs by Type (dollars in thousands) Construction/Land Development 3,630 $ 5,463 $ 4,643 $ 4,537 $ 2,240 $ 49.0% Commercial Non-Owner Occupied 488 1,493 512 1,236 520 11.4% Commercial Owner Occupied 917 376 504 729 303 6.6% Consumer Owner Occupied 1,343 1,525 1,229 1,825 882 19.3% Commercial & Industrial 598 314 1,791 229 218 4.8% Consumer Non-Real Estate 69 108 154 105 12 0.3% Other Income Producing Property 780 990 1,473 498 345 7.5% Ready Reserve 73 40 44 39 54 1.2% 7,896 10,310 10,351 9,199 4,573 100.0% Total SCBTFC |
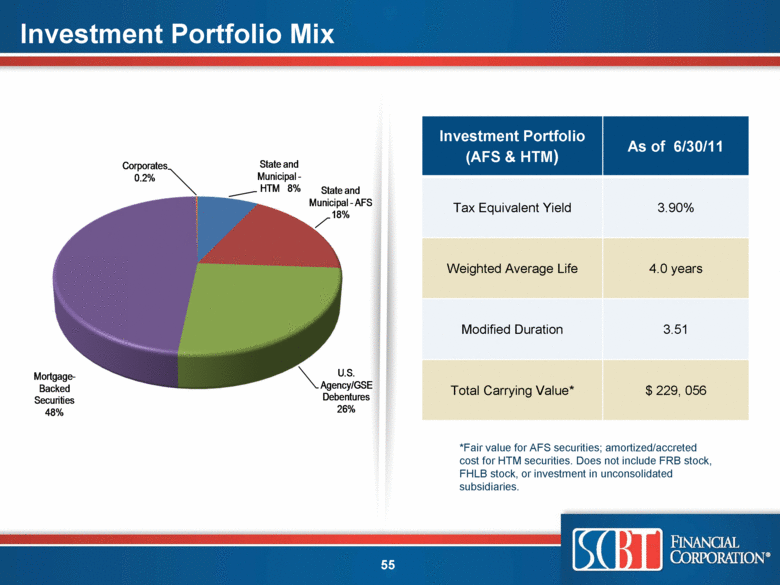
| Investment Portfolio Mix *Fair value for AFS securities; amortized/accreted cost for HTM securities. Does not include FRB stock, FHLB stock, or investment in unconsolidated subsidiaries. Investment Portfolio (AFS & HTM) As of 6/30/11 Tax Equivalent Yield 3.90% Weighted Average Life 4.0 years Modified Duration 3.51 Total Carrying Value* $ 229, 056 State and Municipal - HTM8 % State and Municipal - AFS 18% U.S. Agency/GSE Debentures 26% Mortgage-Backed Securities 48% Corporates 0.2% |
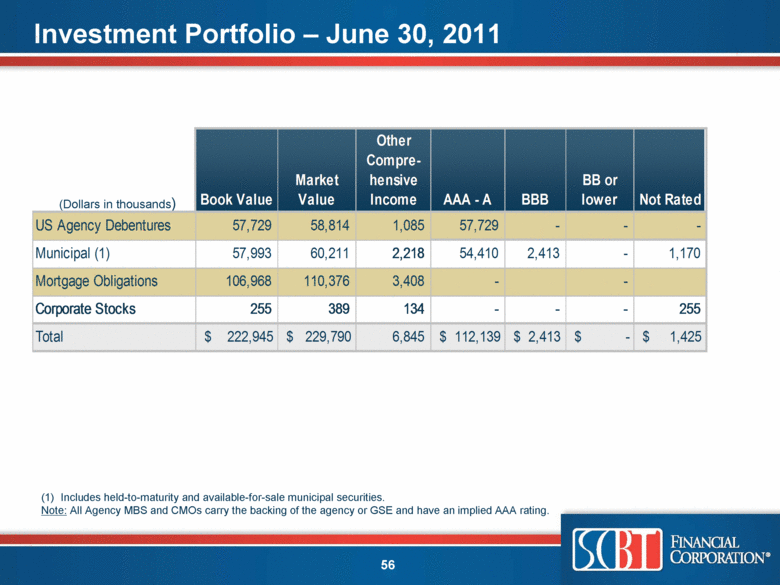
| Investment Portfolio – June 30, 2011 (Dollars in thousands) Includes held-to-maturity and available-for-sale municipal securities. Note: All Agency MBS and CMOs carry the backing of the agency or GSE and have an implied AAA rating. Book Value Market Value Other Comprehensive Income AAA - A BBB BB or lower Not Rated 57,729 58,814 1,085 57,729 - - - 57,993 60,211 2,218 54,410 2,413 - 1,170 106,968 110,376 3,408 - - 255 389 134 - - - 255 $ 222,945 $ 229,790 6,845 $ 112,139 $ 2,413 $ - $ 1,425 US Agency Debentures Total Corporate Stocks Municipal (1) Mortgage Obligations |
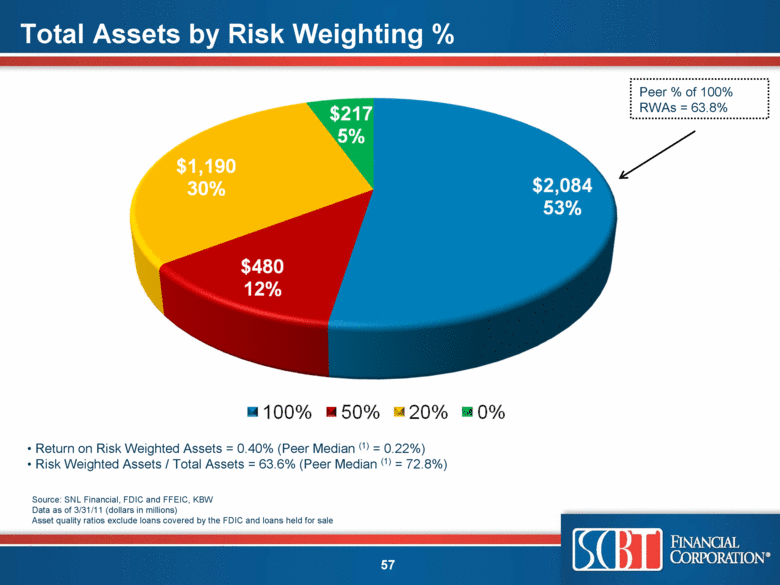
| Return on Risk Weighted Assets = 0.40% (Peer Median (1) = 0.22%) Risk Weighted Assets / Total Assets = 63.6% (Peer Median (1) = 72.8%) Peer % of 100% RWAs = 63.8% Total Assets by Risk Weighting % Source: SNL Financial, FDIC and FFEIC, KBW Data as of 3/31/11 (dollars in millions) Asset quality ratios exclude loans covered by the FDIC and loans held for sale |
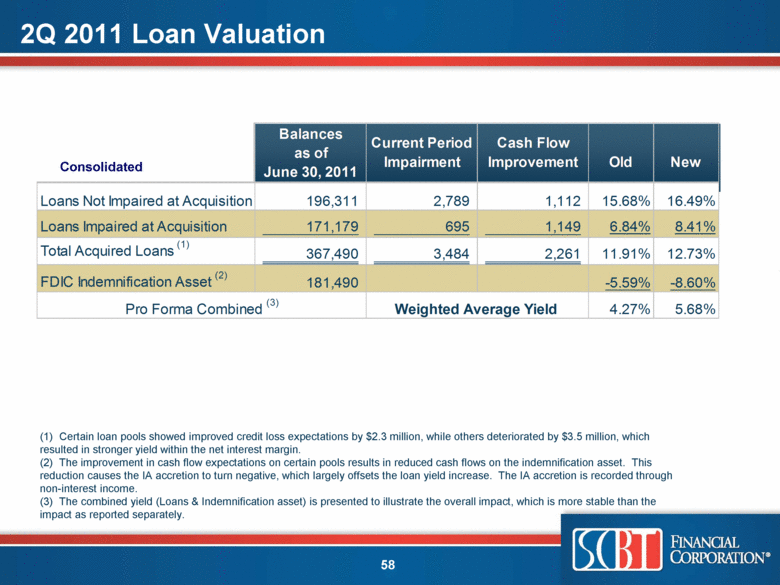
| 2Q 2011 Loan Valuation Consolidated (1) Certain loan pools showed improved credit loss expectations by $2.3 million, while others deteriorated by $3.5 million, which resulted in stronger yield within the net interest margin. (2) The improvement in cash flow expectations on certain pools results in reduced cash flows on the indemnification asset. This reduction causes the IA accretion to turn negative, which largely offsets the loan yield increase. The IA accretion is recorded through non-interest income. (3) The combined yield (Loans & Indemnification asset) is presented to illustrate the overall impact, which is more stable than the impact as reported separately. Loans Not Impaired at Acquisition 196,311 2,789 1,112 15.68% 16.49% Loans Impaired at Acquisition 171,179 695 1,149 6.84% 8.41% Total Acquired Loans (1) 367,490 3,484 2,261 11.91% 12.73% FDIC Indemnification Asset (2) 181,490 -5.59% -8.60% 4.27% 5.68% New Pro Forma Combined (3) Weighted Average Yield Current Period Impairment Cash Flow Improvement Balances as of June 30, 2011 Old |
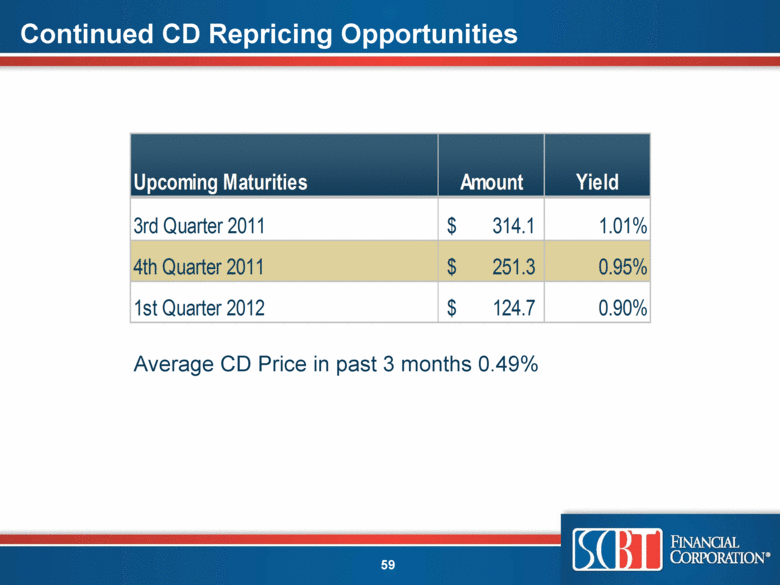
| Continued CD Repricing Opportunities Average CD Price in past 3 months 0.49% Upcoming Maturities Amount Yield 3rd Quarter 2011 314.1 $ 1.01% 4th Quarter 2011 251.3 $ 0.95% 1st Quarter 2012 124.7 $ 0.90% |
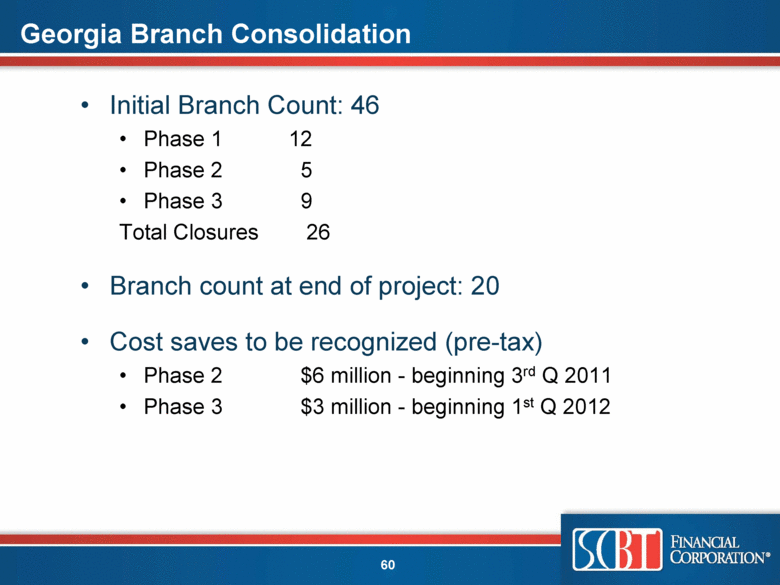
| Georgia Branch Consolidation Initial Branch Count: 46 Phase 1 12 Phase 2 5 Phase 3 9 Total Closures 26 Branch count at end of project: 20 Cost saves to be recognized (pre-tax) Phase 2 $6 million - beginning 3rd Q 2011 Phase 3 $3 million - beginning 1st Q 2012 |
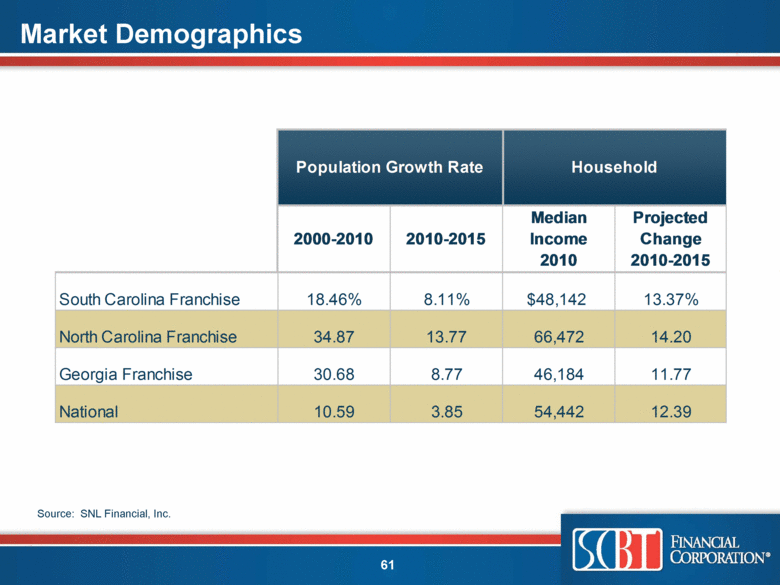
| Market Demographics Source: SNL Financial, Inc. South Carolina Franchise 18.46% 8.11% $48,142 13.37% North Carolina Franchise 34.87 13.77 66,472 14.20 Georgia Franchise 30.68 8.77 46,184 11.77 National 10.59 3.85 54,442 12.39 Population Growth Rate 2000-2010 2010-2015 Household Median Income 2010 Projected Change 2010-2015 |
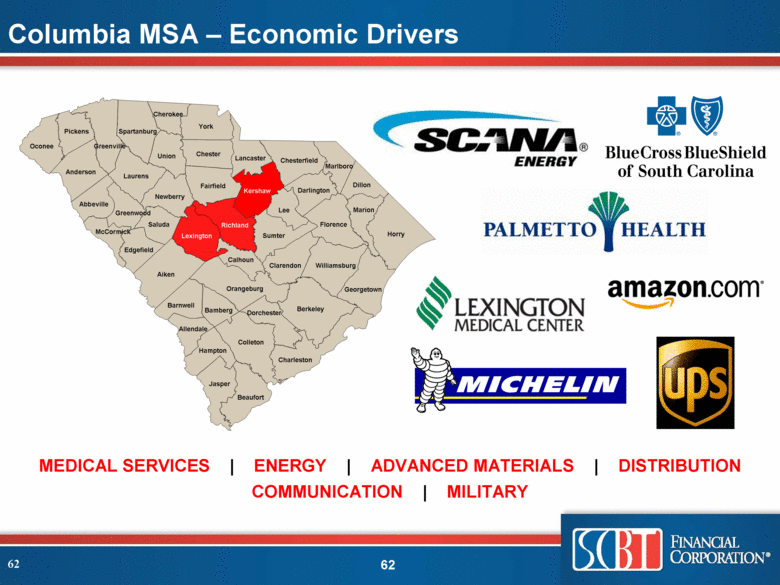
| Oconee Pickens Greenville Anderson Spartanburg Cherokee York Union Chester Laurens Abbeville Newberry Greenwood McCormick Saluda Edgefield Aiken Lancaster Chesterfield Kershaw Fairfield Lexington Richland Marlboro Dillon Darlington Lee Sumter Florence Marion Horry Williamsburg Georgetown Clarendon Berkeley Dorchester Calhoun Orangeburg Barnwell Bamberg Allendale Colleton Hampton Jasper Charleston Beaufort Columbia MSA – Economic Drivers 62 MEDICAL SERVICES | ENERGY | ADVANCED MATERIALS | DISTRIBUTION COMMUNICATION | MILITARY |
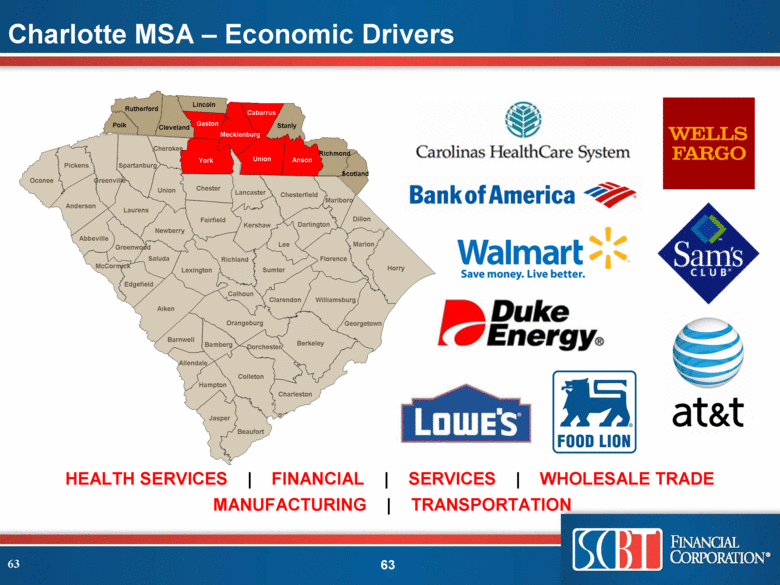
| Charlotte MSA – Economic Drivers 63 HEALTH SERVICES | FINANCIAL | SERVICES | WHOLESALE TRADE MANUFACTURING | TRANSPORTATION Oconee Pickens Greenville Anderson Spartanburg Cherokee York Union Chester Laurens Abbeville Newberry Greenwood McCormick Saluda Edgefield Aiken Lancaster Chesterfield Kershaw Fairfield Lexington Richland Marlboro Dillon Darlington Lee Sumter Florence Marion Horry Williamsburg Georgetown Clarendon Berkeley Dorchester Calhoun Orangeburg Barnwell Bamberg Allendale Colleton Hampton Jasper Charleston Beaufort Mecklenburg Union Anson Richmond Scotland Stanly Cabarrus Gaston Lincoln Cleveland Rutherford Polk |
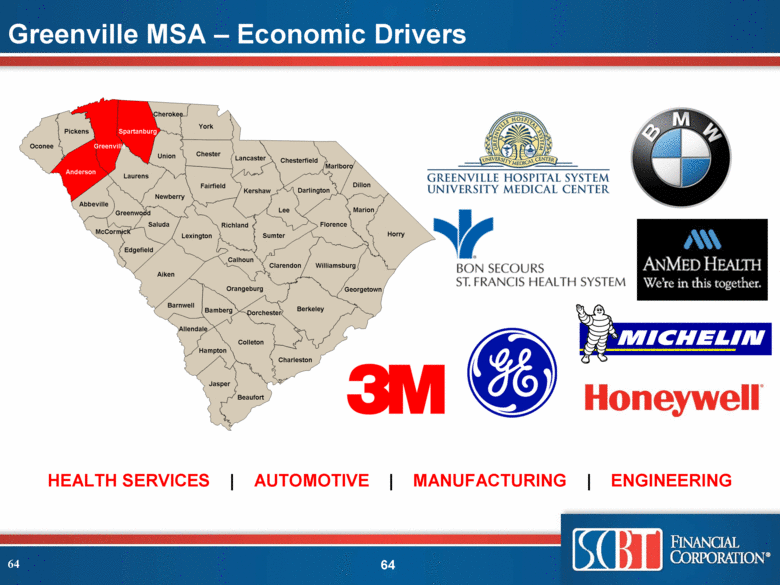
| Oconee Pickens Greenville Anderson Spartanburg Cherokee York Union Chester Laurens Abbeville Newberry Greenwood McCormick Saluda Edgefield Aiken Lancaster Chesterfield Kershaw Fairfield Lexington Richland Marlboro Dillon Darlington Lee Sumter Florence Marion Horry Williamsburg Georgetown Clarendon Berkeley Dorchester Calhoun Orangeburg Barnwell Bamberg Allendale Colleton Hampton Jasper Charleston Beaufort Greenville MSA – Economic Drivers 64 HEALTH SERVICES | AUTOMOTIVE | MANUFACTURING | ENGINEERING |
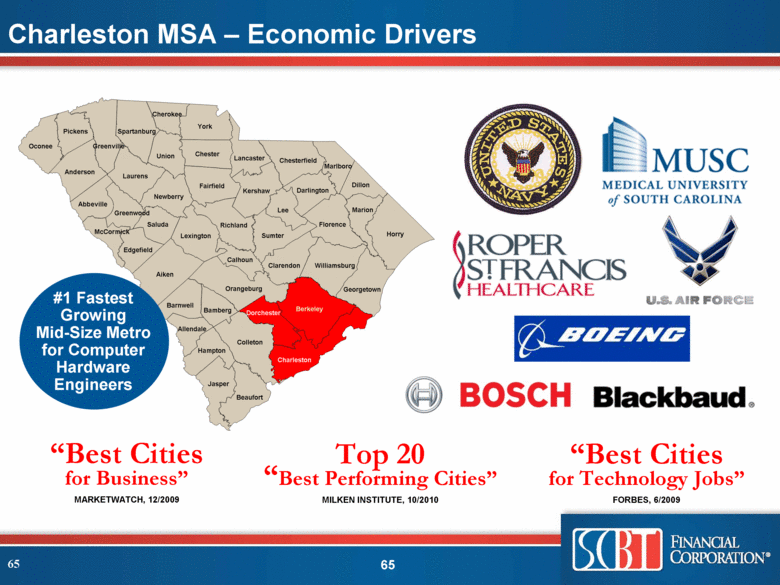
| Oconee Pickens Greenville Anderson Spartanburg Cherokee York Union Chester Laurens Abbeville Newberry Greenwood McCormick Saluda Edgefield Aiken Lancaster Chesterfield Kershaw Fairfield Lexington Richland Marlboro Dillon Darlington Lee Sumter Florence Marion Horry Williamsburg Georgetown Clarendon Berkeley Dorchester Calhoun Orangeburg Barnwell Bamberg Allendale Colleton Hampton Jasper Charleston Beaufort 65 “Best Cities for Business” MARKETWATCH, 12/2009 Top 20 “Best Performing Cities” MILKEN INSTITUTE, 10/2010 “Best Cities for Technology Jobs” FORBES, 6/2009 #1 Fastest Growing Mid-Size Metro for Computer Hardware Engineers Charleston MSA – Economic Drivers |
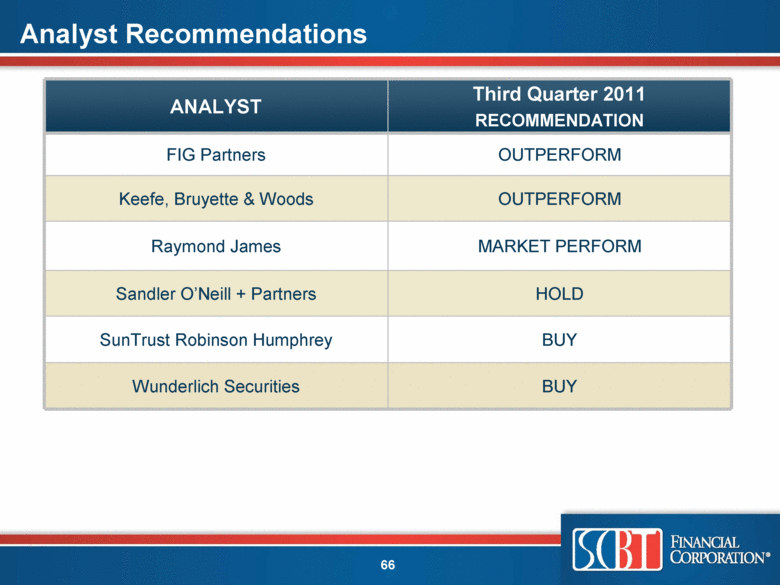
| Analyst Recommendations ANALYST Third Quarter 2011 RECOMMENDATION FIG Partners OUTPERFORM Keefe, Bruyette & Woods OUTPERFORM Raymond James MARKET PERFORM Sandler O’Neill + Partners HOLD SunTrust Robinson Humphrey BUY Wunderlich Securities BUY |
| Investor Contacts Robert R. Hill, Jr. Chief Executive Officer John C. Pollok Senior Executive Vice President and Chief Operating Officer Donald E. Pickett Executive Vice President and Chief Financial Officer 520 Gervais Street Columbia, South Carolina 29201 800-277-2175 www.scbtonline.com |