Exhibit 99.1
| [LOGO] |

| Forward-Looking Statements Statements included in this press release which are not historical in nature are intended to be, and are hereby identified as, forward looking statements for purposes of the safe harbor provided by Section 21E of the Securities Exchange Act of 1934. SCBT Financial Corporation (‘SCBT”) and The Savannah Bancorp, Inc. (SAVB”) cautions readers that forward looking statements are subject to certain risks and uncertainties that could cause actual results to differ materially from forecasted results. Such risks and uncertainties, include, among others, the following possibilities: (1) the occurrence of any event, change or other circumstances that could give rise to the termination of the definitive merger agreement between SCBT and SAVB; (2) the outcome of any legal proceedings that may be instituted against SCBT or SAVB; (3) the inability to complete the transactions contemplated by the definitive merger agreement due to the failure to satisfy each transaction’s respective conditions to completion, including the receipt of regulatory approval; (4) credit risk associated with an obligor's failure to meet the terms of any contract with the bank or otherwise fail to perform as agreed; (5) interest risk involving the effect of a change in interest rates on both the bank's earnings and the market value of the portfolio equity; (6) liquidity risk affecting the bank's ability to meet its obligations when they come due; (7) price risk focusing on changes in market factors that may affect the value of traded instruments in "mark-to-market" portfolios; (8) transaction risk arising from problems with service or product delivery; (9) compliance risk involving risk to earnings or capital resulting from violations of or nonconformance with laws, rules, regulations, prescribed practices, or ethical standards; (10) strategic risk resulting from adverse business decisions or improper implementation of business decisions; (11) reputation risk that adversely affects earnings or capital arising from negative public opinion; (12) terrorist activities risk that results in loss of consumer confidence and economic disruptions; (13) economic downturn risk resulting in deterioration in the credit markets; (14) greater than expected noninterest expenses; (15) excessive loan losses; (16) potential deposit attrition, higher than expected costs, customer loss and business disruption associated with the integration of Peoples Bancorporation and The Savannah Bancorp, Inc., including, without limitation, potential difficulties in maintaining relationships with key personnel and other integration related-matters; (17) the risks of fluctuations in market prices for SCBT stock that may or may not reflect economic condition or performance of SCBT; (18) the payment of dividends on SCBT is subject to regulatory supervision as well as the discretion of the SCBT board of directors; and (19) other factors, which could cause actual results to differ materially from future results expressed or implied by such forward looking statements. 2 |
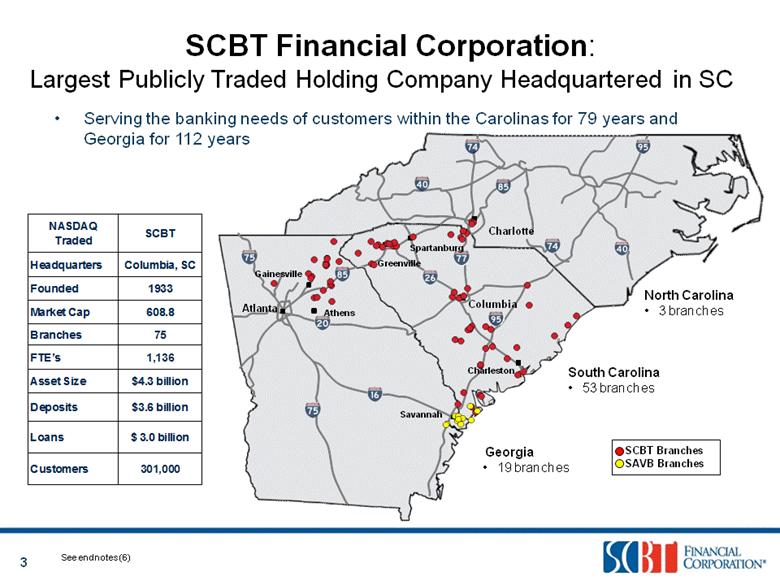
| Atlanta Athens SOUTH CAROLINA Charleston Spartanburg Greenville NORTH CAROLINA Charlotte Savannah GEORGIA North Carolina 3 branches South Carolina 53 branches Georgia 19 branches SCBT Financial Corporation: Largest Publicly Traded Holding Company Headquartered in SC Serving the banking needs of customers within the Carolinas for 79 years and Georgia for 112 years Charlotte Atlanta Columbia Gainesville Athens 3 See endnotes (6) SCBT Branches SAVB Branches NASDAQ Traded SCBT Headquarters Columbia, SC Founded 1933 Market Cap 608.8 Branches 75 FTE’s 1,136 Asset Size $4.3 billion Deposits $3.6 billion Loans $ 3.0 billion Customers 301,000 |
| How We Operate the Company 4 |

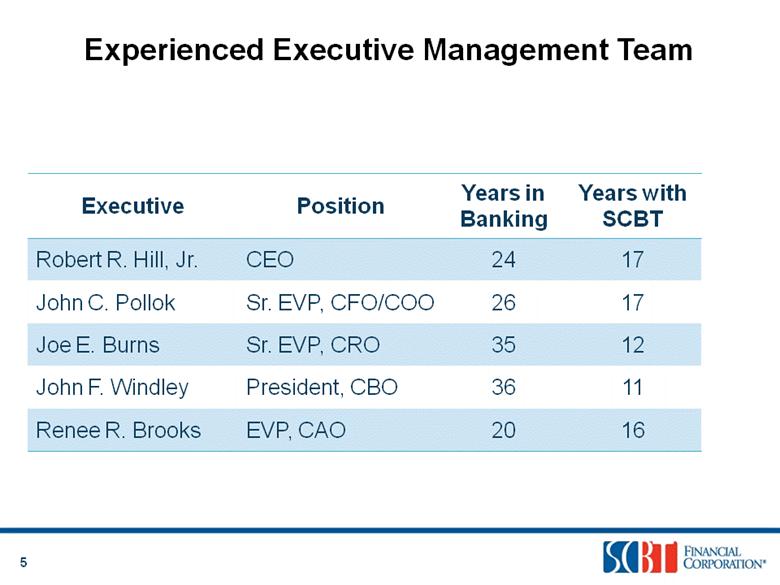
| Experienced Executive Management Team 5 Executive Position Years in Banking Years with SCBT Robert R. Hill, Jr. CEO 24 17 John C. Pollok Sr. EVP, CFO/COO 26 17 Joe E. Burns Sr. EVP, CRO 35 12 John F. Windley President, CBO 36 11 Renee R. Brooks EVP, CAO 20 16 |
| Market Performance 6 See endnotes (1) Price Performance since 12/31/07 39.3% 25.3% (27.8%) (66.6%) (71.1%) |
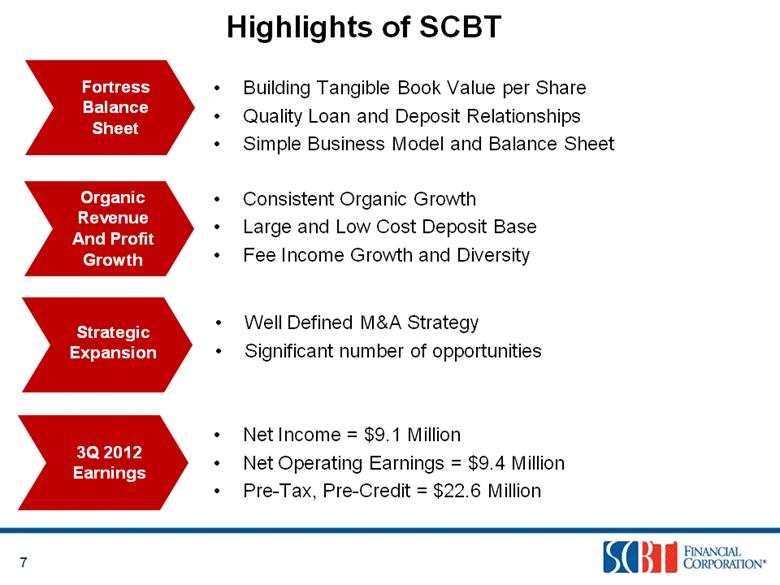
| Highlights of SCBT Consistent Organic Growth Large and Low Cost Deposit Base Fee Income Growth and Diversity 7 Fortress Balance Sheet Organic Revenue And Profit Growth Strategic Expansion Building Tangible Book Value per Share Quality Loan and Deposit Relationships Simple Business Model and Balance Sheet Well Defined M&A Strategy Significant number of opportunities 3Q 2012 Earnings Net Income = $9.1 Million Net Operating Earnings = $9.4 Million Pre-Tax, Pre-Credit = $22.6 Million |
| Habersham Bank Market Opportunities |

| Southeast Banking Landscape Distribution of Banks Distribution of Assets ($bn) Southeast Bank Universe (1) 1,553 Banks across the Southeast 116 84 134 145 218 193 70 81 99 61 176 176 9 See endnotes (24) 1,252 170 109 22 Asset Range < $500 million $500 mm - $1.0 bn $1.0 bn - $5.0 bn > $5.0 bn $222 $117 $221 $1,012 |
| SCBT States of Operation – GA, NC, and SC Distribution of Banks Distribution of Assets ($bn) SCBT States of Operation – GA, NC, SC (1) 369 Banks across GA, NC, and SC 218 70 81 10 See endnotes (25) 301 33 28 7 Asset Range < $500 million $500 mm - $1.0 bn $1.0 bn - $5.0 bn > $5.0 bn |
| Goals and Priorities Evaluate M&A opportunities Take advantage of market turbulence Selective organic growth Focus on market share in South Carolina, North Carolina, and Georgia Historical return levels Continue credit improvement Continue efficiency improvements 11 External Internal Earnings |
| Demographic Highlights in Key Markets 12 See endnotes (20) |

| $84,000-$120,000 $70,001-84,000 $41,000-$70,000 (Median) $27,001-$41,000 $8,889-$27,000 13 Median Household Income See endnotes (20) SCBT & SAVB Branches |
| 14 Projected Population Growth (2011-2016) See endnotes (20) SCBT Branches SAVB Branches 1.5% to 6.6 % 1.0 % to 1.4% 0.1 to 0.9 % (mean 0.2%) -0.2% to 0% -0.7% to -0.3 % -2.5% to -0.8% |
| 15 Charlotte 1 Bank of America 80.1 % 2 Wells Fargo 12.8 % 3 BB&T Corp 2.2 % 4 Fifth Third Bank 0.8 % 5 Sun Trust Banks Inc. 0.6 % 8 SCBT Financial Corp 0.2 % Total $ 201 Billion 100.0 % Columbia 1 Wells Fargo 27.5% 2 Bank of America 26.4% 3 BB&T Corp 12.9% 4 First Citizens 9.78 % 5 Synovus Financial 5.4 % 7 SCBT Financial Corp 2.3 % Total $ 15.3 Billion 100.0 % Greenville-Anderson 1 Wells Fargo 15.3 % 2 Bank of America 12.5% 3 BB&T Corp 12.3 % 4 Toronto Dominion 9.1% 5 SunTrust Banks Inc. 6.8% 8 SCBT Financial Corp 4.7% Total $ 13.5 Billion 100.0% Charleston 1 Wells Fargo 21.4 % 2 First Financial Hldgs 14.5 % 3 Bank of America 13.3 % 4 Synovus Financial 8.2 % 5 First Citizens Bancorp 6.6 % 10 SCBT Financial Corp 2.6 % Total $9.6 Billion 100.0 % Deposit Market Share by MSA Athens- Gainesville 1 Wells Fargo 12.7% 2 Synovus Financial 12.3% 3 SunTrust Banks Inc. 10.8% 4 BB&T Corp 9.7% 5 Bank of America 7.5% 13 SCBT Financial Corp 2.1 % Total $5.6 Billion 100.0 % Savannah 1 Wells Fargo 21.4 % 2 Suntrust Banks Inc. 18.4% 3 SCBT Financial Corp. 13.9% 4 Bank of America Corp. 11.39 % 5 FCB Financial Corp. % * SCBT Rank Includes SAVB Total $5.6 Billion 100.0 % See endnotes (5) |
| SCBT: Positioned for the Future 16 Atlanta Athens Greenville Spartanburg Charlotte Columbia Charleston Savannah Gainesville Solid Population Growth NC & SC top 5 in US for projected population growth (2011-2016) Georgia ranked #14 in US for projected population (2011-2016) Strong Production Georgia # 1 in the US for broiler, peanut, and pecan production South Carolina exports have grown 21% since 2011 SC Top Tire Exporter in the US Excellent Infrastructure Savannah and Charleston Ports Charlotte and Atlanta International Airport Hilton Head Island Raleigh Asheville Charlotte Columbia Greenville Charleston Athens-Gainesville Savannah |
| Savannah’s Economic Drivers Nation’s 4th busiest and fastest growing port Port supports 55,000 jobs in surrounding counties Port provides 350,000 jobs statewide Georgia Ports Authority received final regulatory approval to deepen the port from 42 feet to 47 feet Major military bases- Fort Stewart and Hunter Army Airfield Savannah Port Manufacturing/Distribution facilities Gulf Stream Aerospace Project- $500 million expansion 1,000 new jobs to the area Savannah’s Port Economic Drivers 17 |
| Major Economic Announcements Top Employer Military- 22,000 employees Boeing’s 787 Dreamliner Project- 4,000 jobs Charleston’s port - deepest channels in the south east with more than 260,000 jobs linked to port BMW expansion-300 new jobs Michelin - 270 new jobs Amy’s Kitchen new production facility- 700 new jobs 18 Charleston MSA Greenville-Spartanburg MSA |
| Major Economic Announcements 19 Columbia MSA Charlotte MSA New Amazon distribution center AQT Solar Inc. -1,000 more jobs WNS- a leading provider of global (BPO) services will establish its first North American facility 5,000 new jobs in the past 6 months Duke Energy merger with Progress Energy creates largest electrical utility in the US Cato plans to build new distribution center Ross Stores Inc. new distribution/warehousing facility - 600 new jobs |

| [LOGO] |

| Credit Quality (Non-Acquired) 21 See endnotes (7) SCBT and Peer data as of June 30,2012 |
| Capital 22 See endnotes (7) SCBT and Peer data as of June 30,2012 |
| [LOGO] |

| Profitability 24 In Millions See endnotes (2) |
| Consistent Long-Term Earnings Power In Millions |
| Net Interest Margin 26 |
| Operating Efficiency Ratio - QTD 27 See endnotes (9) |
| Dividends 28 See endnotes (10) |
| [LOGO] |

| Legacy Loan Portfolio Mix 30 10.6 % 5 YR CAGR (2007 – 2011) Organic Loan Growth In Millions See endnotes (28) |
| Organic Loan Growth / Decline 31 In Millions |
| Growth – Core & Total Deposits 32 In Millions Growth – Core Deposits* 25.0% 5 YR CAGR (2007 – 2011) Growth – Total Deposits 21.6% 5 YR CAGR (2007 – 2011) Acquired Deposits $3,254 $2,511 $3,357 See endnotes (11) $3,589 |
| Savannah Bancorporation |
| Kiawah Island Pro Forma Highlights Strategic Market Expansion 34 Ticker: SCBT (NASDAQ) Headquarters: Columbia, SC Founded: 1933 Branches: 87 Assets: $5.3 billion Loans: $3.8 billion Deposits: $4.5 billion Charleston Hilton Head Island Savannah SCBT branch SAVB branch |
| Savannah Bancorp, Inc. 35 Deposit Market Share of Combined Counties Served (27) The Savannah Bancorp, Inc. Headquarters Savannah, GA Bank Subsidiaries Savannah Bank Bryan Bank & Trust Investment Advisor Subsidiary Minis & Co., Inc. Founded 1990 Branches 11 Total Assets $ 952 million Total Loans 725 Total Deposits 818 Net Interest Margin 3.90 Efficiency Ratio 68.67 See endnotes (27) Rank Insitution Deposits ($mm) Market Share Branches 1 Wella Fargo Bank $ 1,755 20.36% 22 2 SunTrust Bank $ 1,256 14.57 20 Proforma $ 1,183 13.73 18 3 Bank of America $ 879 10.2 16 4 The Savannah Bank $ 819 9.51 11 5 BB&T $ 532 6.17 10 6 First Chatham Bank $ 365 4.23 5 7 SCBT $ 364 4.22 7 8 Coastal States Bank $ 310 3.59 4 9 The Coastal Bank $ 281 3.26 5 10 Synovus $ 256 2.96 6 |
| SUPPLEMENTAL INFORMATION |

| Index – Supplemental Information Loan Portfolio Mix (New)38 Margin Analysis (New)39 Largest Relationships40 Vintage/New Loan Mix41 Construction / Land Development Loans43 ALLL Trend44 Credit Trends45 Non Performing Loans47 NPA’s & Classifieds by Market 48 Loss Share Performance49 Business Mix By Market 50 Deposits51 Investment portfolio 52 Fee income by type 53 CD Re-pricing 54 Market Demographics 55 Analyst Recommendations60 37 |
| NonAcquired FDIC Acquired Whole Bank Acquired Loan Portfolio Mix With SAVB - FDIC Acquired includes Indemnification Asset 38 |
| Impact Of Credit Releases (Dollars in Millions) 39 3Q2012 2Q2012 Change Interest Income Yield Interest Income Yield Interest Income Yield IMPACT ON ACQUIRED LOAN YIELD Acquired Loan Yield $ 16.0 12.70% $ 11.9 9.86% $ 4.1 2.84% Adjustment for negative accretion on IA (6.6) -6.95% (4.4) -5.21% (2.2) -1.74% Adjusted Interest Income and Yield $ 9.4 5.75% $ 7.5 4.65% $ 1.9 1.10% IMPACT ON MARGIN Net Interest Income / Margin $ 46.9 5.03% $ 42.5 4.69% $ 4.4 0.34% Adjustment for negative accretion on IA (6.6) -0.86% (4.4) -0.65% (2.2) -0.21% Adjusted Net Interest Income / Margin $ 40.3 4.17% $ 38.1 4.04% $ 2.2 0.13% |
| Largest Credit Relationships (Non-Acquired) 40 See endnotes (26) Loan commitment in Millions $20.0 $20.0 $15.0 $10.0 $5.0 $ 25 50 75 100 125 150 175 $6.7 $4.4 $3.2 $2.0 Total Relationship Commitment Total Relationship Balance Top 25 Top 50 Top 100 Top 200 Total Commitments $ 263.9 8.8% $ 400.2 13.3% $ 583.8 19.4% $ 840.6 27.9% $ 3,013.3 100.0% Top 25 Top 50 Top 100 Top 200 Total Loans Outstanding $ 196.9 $ 311.7 $ 459.4 $ 684.1 $ 2,490.5 7.9% 12.5% 18.4% 27.5% 100.0% |
| Vintage / New Loan Mix – 3 Q 2012 (Non-Acquired Loans) 41 See endnotes (12,22) |
| Construction / Land Development Loan Mix – 3 Q 2012 (Non-Acquired Loans) 42 See endnotes (12,23) |
| 43 Construction / Land Development Loans (Non-Acquired Loans) * In millions $0 $50 $100 $150 $200 $250 Consumer Construction Land/Lots Construction Loans to Builders Commercial Construction Residential Lot Loans to Individuals $50.3 $204.0 $63.2 $83.0 $120.9 $54.8 $117.1 $9.3 $19.9 $72.5 4Q07 3Q12 |
| ALLL Trend Data (Non-Acquired Loans) 44 2.00 % 1.91 % See endnotes (13) 1.84 % |
| 45 See endnotes (14) Credit Trends (Non-Acquired Loans) (in millions) Sep-11 Dec-11 Mar-12 Jun-12 Sep-12 Total nonperforming assets 96.1 $ 94.9 $ 91.4 $ 83.1 $ 81.8 $ Texas Ratio (14) 27.13% 26.88% 25.41% 21.23% 20.43% Criticized Loans (14) 194.3 $ 170.3 $ 162.0 $ 151.0 $ 144.5 $ Classified Assets (14) 180.3 184.4 177.5 160.6 157.5 Classified Assets / Bank Tier 1 Capital + ALLL 45.27% 45.82% 43.72% 36.76% 35.46% |
| Strong Coverage Ratios Driven by Low NPAs 30-89 Delinquencies/Loans NPAs/(Loans + OREO) NCOs/Avg. Loans Reserves/Loans (ex HFS) 46 See endnotes (15) |
| Non-Performing Loans 47 As of September 30, 2012 See endnotes (16) SCBT and Peer data as of June 30,2012 Construction / Land Dev 30% Commercial Non Owner Occ 11% Consumer Owner Occ 19% Commercial Owner Occ 30% Commercial & Industrial 2% Other Income Producing Property 8% Consumer Non Real Estate 0% |
| NPAs & Classified Assets by Market (Non-Acquired) 48 NPA’s Classified Loans & OREO See endnotes (17) 3Q11 4Q11 1Q12 2Q12 3Q12 Inland 27,936 $ 29,522 $ 29,539 $ 28,685 $ 29,838 $ Coastal 52,117 49,279 44,759 39,788 37,985 Charlotte MSA 13,240 13,821 14,835 12,690 13,880 CBT 2,773 2,327 2,258 1,962 54 Total 96,066 $ 94,949 $ 91,391 $ 83,125 $ 81,757 $ 3Q11 4Q11 1Q12 2Q12 3Q12 Inland 63,811 $ 70,240 $ 64,814 $ 65,044 $ 64,262 $ Coastal 90,319 86,541 81,776 69,611 66,116 Charlotte MSA 25,807 25,561 28,964 23,862 24,923 CBT 342 2,087 1,969 2,100 2,218 Total 180,279 $ 184,429 $ 177,523 $ 160,617 $ 157,519 $ |
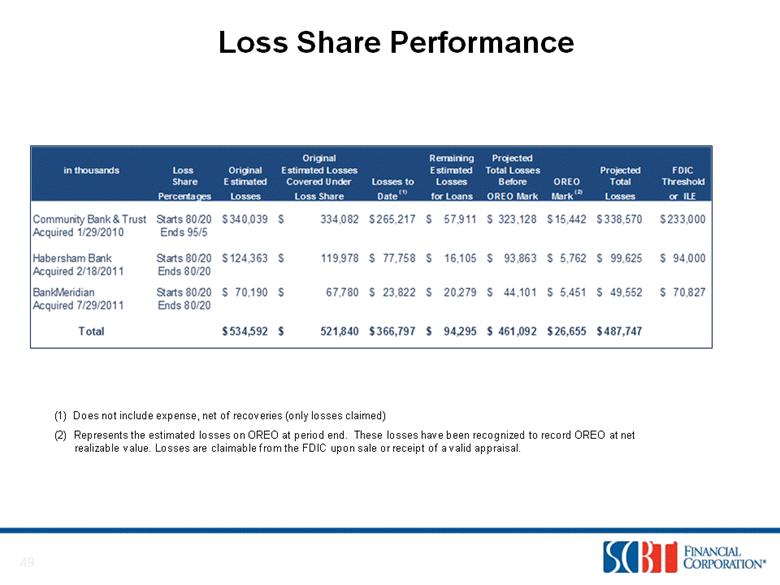
| Loss Share Performance 49 (1) Does not include expense, net of recoveries (only losses claimed) (2) Represents the estimated losses on OREO at period end. These losses have been recognized to record OREO at net realizable value. Losses are claimable from the FDIC upon sale or receipt of a valid appraisal. Original Remaining Projected in thousands Loss Original Estimated Losses Estimated Total Losses Projected FDIC Share Estimated Covered Under Losses to Losses Before OREO Total Threshold Percentages Losses Loss Share Date (1) for Loans OREO Mark Mark (2) Losses or ILE Community Bank & Trust Starts 80/20 340,039 $ 334,082 $ 265,217 $ 57,911 $ 323,128 $ 15,442 $ 338,570 $ 233,000 $ Acquired 1/29/2010 Ends 95/5 Habersham Bank Starts 80/20 124,363 $ 119,978 $ 77,758 $ 16,105 $ 93,863 $ 5,762 $ 99,625 $ 94,000 $ Acquired 2/18/2011 Ends 80/20 BankMeridian Starts 80/20 70,190 $ 67,780 $ 23,822 $ 20,279 $ 44,101 $ 5,451 $ 49,552 $ 70,827 $ Acquired 7/29/2011 Ends 80/20 Total 534,592 $ 521,840 $ 366,797 $ 94,295 $ 461,092 $ 26,655 $ 487,747 $ |
| 50 Business Mix by Market – September 30, 2012 Loans** Deposits Inland SC 47% Coastal SC 27% Charlotte MSA 23% Georgia 3% Inland SC 51% Coastal SC 13% Charlotte MSA 13% Georgia 23% See endnotes (16) |
| Deposit Mix 51 March 31, 2008 September 30, 2012 Total Deposits $2.02 billion Total Deposits $3.6 billion |
| Investment Portfolio Mix 52 Investment Portfolio (AFS & HTM) As of 6/30/12 Tax Equivalent Yield 3.35% Weighted Average Life 4.32 years Modified Duration 3.88 Total Carrying Value* $ 492,226 See endnotes (18) State and Municipal - HTM 3% State and Municipal - AFS 28% U.S. Agency/GSE Debentures 15% Mortgage - Backed Securities 54% |
| Fee Income By Type 53 28% of Operating Income $ 1.0 + Billion in Assets Under Management Focused on growing Wealth Management Bank Card Services Secondary Mortgage 3Q12 YTD: $44.5 Million See endnotes (19) |
| Continued CD Repricing Opportunities 54 Average CD Price in past 30 days ~ 20 BPS Upcoming Maturities (in millions) Amount Yield 4th Quarter 2012 251.1 $ 0.47% 1st Quarter 2013 220.4 $ 0.45% 2nd Quarter 2013 116.1 $ 0.48% |
| Market Demographics 55 See endnotes (20) Franchise South Carolina 1.24% 6.02% 41,607 $ 18.55% North Carolina 1.29% 6.55% 46,924 19.23% Georgia 0.90% 4.79% 42,941 19.09% SCBT Weighted Average 1.16% 5.77% 42,911 18.71% National 0.63% 3.42% 50,227 $ 14.55% Population Growth Rate Household 2010-2011 2011-2016 Median Income 2011 Projected Change 2011-2016 |
| South Carolina Deposit Market Share 56 94 FDIC Insured Institutions, $67.9 Billion Total Deposits Rank Institution (in Millions) Deposit Share 1 Wells Fargo & Co $12,188 18.1% 2 Bank of America Corp 9,114 13.5% 3 BB&T Corp 6,939 10.30% 4 First Citizens Bancorp 6,214 9.22% 5 TD Bank 3,489 5.2% 6 Synovus Financial Corp 2,743 4.1% 7 SCBT Financial Corp 2,643, 3.9% 8 First Financial Holdings 2,489 3.7% 9 SunTrust Banks Inc 1,987 3.0% 10 Palmetto Bancshares 1,023 1.6% See endnotes ( 3,20) |
| Northeast Georgia Deposit Market Share 57 43 FDIC Insured Institutions, $10.6 Billion Total Deposits Rank Institution (in Millions) Deposit Share 1 Wells Fargo 1,315 12.4% 2 Regions Bank 1,152 10.9% 3 SunTrust Bank 893 8.4% 4 United Community Bank 873 8.3% 5 SCBT 842 8.0 % 6 Synovus 818 7.7% 7 BB&T 573 5.4% 8 Bank of America 545 5.2% 9 First American Bank & Trust 351 3.3% 10 Community Southern Bank 347 3.3% See endnotes (4, 20) |
| Unemployment Data 58 |
| S.C. Real Estate Markets 59 See endnotes (21) Beaufort 761 796 4.6% 178.2 175 -1.8% 196 202 3.1% Charleston Trident 7,131 7,842 10.0% 179.9 190 5.6% 109 103 -5.5% Coastal Carolinas 5,859 6,392 9.1% 139.6 139 -0.5% 180 174 -3.3% Gr. Columbia 4,907 5,699 16.1% 140 142 1.4% 118 117 -0.8% Gr. Greenville 5,184 5,700 10.0% 140 148 5.7% 114 103 -9.6% Hilton Head Area 2,033 2,468 21.4% 225 225 0.0% 140 128 -8.6% Piedmont Reg. Assoc. 1,854 1,811 -2.3% 147 150 2.0% 173 158 -8.7% State Totals 36,437 39,813 9.3% 147 150 2.0% 141 136 -3.8% Number of Residential Homes, Condos & Villas Sold Sep-11 YTD sep-12 YTD % Change Sep-11 YTD Average Days on the Market (DOM) % Change Sep-12 YTD Median Price of Residential Homes (in Thousands) Sep-11 YTD Sep-12 YTD % Change |
| Analyst Recommendations 60 ANALYST Third Quarter 2012 RECOMMENDATION FIG Partners OUTPERFORM Keefe, Bruyette & Woods OUTPERFORM SunTrust Robinson Humphrey BUY Wunderlich Securities BUY BB&T Capital Markets HOLD Sandler O’Neill + Partners HOLD |
| Investor Contacts Robert R. Hill, Jr. Chief Executive Officer John C. Pollok Senior Executive Vice President and Chief Financial Officer / Chief Operating Officer 61 520 Gervais Street Columbia, South Carolina 29201 800-277-2175 www.scbtonline.com |
| Endnotes 1. Source: SNL Financial . Pricing data as of 10/31/12.KRX is a composition of 50 regionally diversified mid and small-cap banking institutions in the U.S and is calculated using and equal-weighted method Carolina Peers include all major exchange traded banks and thrifts in North Carolina and South Carolina with assets between $500 million and $10.0 billion; excludes merger targets Georgia Peers include all major exchange traded banks and thrifts in Georgia with assets between $500 million and $10.0 billion; excludes merger targets. (1) Total return includes distribution of dividends. 2. Per share data reflect a five percent stock dividend distributed on January 1, 2005 and on March 23, 2007. For 2008, the loss related to the disposal of Freddie Mac Preferred Stock is added back. For 2009, the dividend paid on the preferred stock is added back. 3. Source: FDIC Summary of Deposits as of 6/30/2012. 4. Note: NE Georgia Deposit Market Share includes the following counties: Barrow, Cherokee, Clarke, Habersham, Hall, Jackson, Rabun, Stephens, White. 5. SNL Financial, Summary of Deposits. Savannah MSA includes The Savannah Bank and Bryan Bank & Trust deposits. 6. Data as of 9/30/12 7. Source: SNL Financial and Company filings. Data as of 6/30/12. KRX is a composition of 50 regionally diversified mid- & small-cap banking institutions in the U.S. The index is calculated using an equal-weighted method and components comply with the GICS and ICS classification standards. Carolina’s includes all publicly traded banks and thrifts in North and South Carolina with assets between $500 million and $10.0 billion. 8. Excludes Merger & OREO / Loan-related expenses 9. Efficiency ratio = NIE / Net Int Inc + Non Int Inc less securities gain/(loss) Operating efficiency ratio (exc’l) = same as above except exc’l merger cost & OREO related cost from NIE 10. Dividend paid for 146 consecutive quarters since 1976, Prior to 1976, dividends were paid semi-annually, 3rd Quarter 2012 includes dividends declared on 10/26/12, record date of 11/16/12, payable on 11/23/12. Dividends paid per share will increase to $0.18 per share in 4th Quarter 2012. 11. Core deposits increased $337 million since Dec-11; Legacy SCBT $97 million / Acquired $240 million. 2012 YTD # Transaction account growth for Legacy SCBT 5.3 % annualized. Total YTD $ Balance growth for core SCBT 7.2 % annualized . *Core Deposits exclude all certificates of deposits. 12. New=Origination date of 1/1/08 or later, non-acquired loans 13. Note: Net charge-offs excludes the impact of loan participations and a BHC loan. 14. Texas ratio – Delinquent loans + nonperforming assets / Tangible Common Equity + ALLL. Criticized Loans – Special Mention. Classified Assets (Classified loans & OREO). Excludes all acquired assets. 15. Source: SNL Financial, FDIC and FFEIC, KBW. Peer Data as of 6/30/12. Asset quality ratios exclude loans covered by the FDIC and loans held for sale. 16. Excludes acquired loans. Inland SC includes Florence. 17. CBT (Non-Acquired) & June11 branch impairment 18. Fair value for AFS securities; amortized/accreted cost for HTM securities. Does not include : FHLB stock, BHC stocks, or investment in unconsolidated subsidiaries. 19. Fees generated from services provided by SCBT. 20. Source: SNL Financial, Inc. 21. Source: Rates from S.C. Realtors MLS Stats. 22. Outstanding contractual balances. 23. Includes unfunded commitments. 24. Source: KBW; SNL Financial Data as of 6/30/12. Includes all top-tier consolidated banks and thrifts headquartered in the Southeast; excludes merger targets and Bank of America. 25. Source: KBW; SNL Financial Data as of 6/30/12. Includes all top-tier consolidated banks and thrifts headquartered in GA, NC, and SC; excludes merger targets and Bank of America. 26. Loans Outstanding does not include loans in transit, non-post items, etc. 27. Source: SNL Financial & FDIC , deposit and financial data as of 6/30/12. Combined counties served include Beaufort and Jasper, SC and Chatham and Bryan, GA 28. Acquired loans are net of purchase accounting adjustments. 62 |